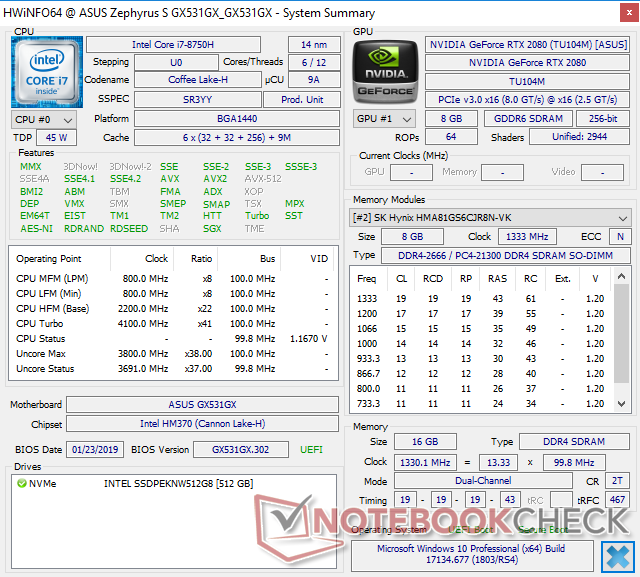
Test: Asus Zephyrus S GX531GX (i7-8750H, RTX 2080 Max-Q) Laptop (Sammanfattning)
| Networking | |
| iperf3 transmit AX12 | |
| Asus Strix GL504GM | |
| Razer Blade 15 RTX 2070 Max-Q | |
| Asus Zephyrus S GX531GX | |
| Aorus 15 X9 | |
| Asus Zephyrus GX501 | |
| iperf3 receive AX12 | |
| Razer Blade 15 RTX 2070 Max-Q | |
| Asus Zephyrus GX501 | |
| Asus Zephyrus S GX531GX | |
| Asus Strix GL504GM | |
| Aorus 15 X9 | |
| |||||||||||||||||||||||||
Distribution av ljusstyrkan: 91 %
Mitt på batteriet: 323.6 cd/m²
Kontrast: 1116:1 (Svärta: 0.29 cd/m²)
ΔE ColorChecker Calman: 3.31 | ∀{0.5-29.43 Ø4.71}
calibrated: 2.73
ΔE Greyscale Calman: 2.9 | ∀{0.09-98 Ø4.96}
91.8% sRGB (Argyll 1.6.3 3D)
59.7% AdobeRGB 1998 (Argyll 1.6.3 3D)
66.9% AdobeRGB 1998 (Argyll 3D)
92.2% sRGB (Argyll 3D)
65.6% Display P3 (Argyll 3D)
Gamma: 2.29
CCT: 6765 K
| Asus Zephyrus S GX531GX AU Optronics B156HAN08.2, IPS, 15.6", 1920x1080 | Aorus 15 X9 LG Philips LP156WFG-SPB2, IPS, 15.6", 1920x1080 | Alienware m15 GTX 1070 Max-Q AU Optronics B156HAN, IPS, 15.6", 1920x1080 | Razer Blade 15 RTX 2070 Max-Q LG Philips LGD05C0, IPS, 15.6", 1920x1080 | Asus Strix GL504GM AU Optronics B156HAN08.2 (AUO82ED), IPS, 15.6", 1920x1080 | Asus Zephyrus GX501 AUO B156HAN04.2 (AUO42ED), IPS, 15.6", 1920x1080 | |
|---|---|---|---|---|---|---|
| Display | 1% | -3% | 1% | 0% | -1% | |
| Display P3 Coverage (%) | 65.6 | 64.9 -1% | 63.5 -3% | 65.3 0% | 65.3 0% | 64.8 -1% |
| sRGB Coverage (%) | 92.2 | 95.6 4% | 89.4 -3% | 94.9 3% | 92.8 1% | 91.8 0% |
| AdobeRGB 1998 Coverage (%) | 66.9 | 66.3 -1% | 64.5 -4% | 66.3 -1% | 66.7 0% | 65.9 -1% |
| Response Times | -73% | -91% | -81% | -10% | -314% | |
| Response Time Grey 50% / Grey 80% * (ms) | 7 ? | 15.2 ? -117% | 18 ? -157% | 16.8 ? -140% | 7.8 ? -11% | 40.4 ? -477% |
| Response Time Black / White * (ms) | 9.6 ? | 12.4 ? -29% | 12 ? -25% | 11.6 ? -21% | 10.4 ? -8% | 24 ? -150% |
| PWM Frequency (Hz) | ||||||
| Screen | 3% | -12% | 0% | -11% | -26% | |
| Brightness middle (cd/m²) | 323.6 | 305.1 -6% | 353.6 9% | 314.7 -3% | 350 8% | 328 1% |
| Brightness (cd/m²) | 315 | 295 -6% | 346 10% | 312 -1% | 338 7% | 305 -3% |
| Brightness Distribution (%) | 91 | 78 -14% | 86 -5% | 90 -1% | 90 -1% | 83 -9% |
| Black Level * (cd/m²) | 0.29 | 0.33 -14% | 0.3 -3% | 0.38 -31% | 0.33 -14% | 0.25 14% |
| Contrast (:1) | 1116 | 925 -17% | 1179 6% | 828 -26% | 1061 -5% | 1312 18% |
| Colorchecker dE 2000 * | 3.31 | 2.58 22% | 4.55 -37% | 2.56 23% | 4.3 -30% | 6.02 -82% |
| Colorchecker dE 2000 max. * | 5.74 | 4.32 25% | 7.91 -38% | 4.89 15% | 7.78 -36% | 10.14 -77% |
| Colorchecker dE 2000 calibrated * | 2.73 | 1.33 51% | 3.37 -23% | 1.71 37% | 2.83 -4% | |
| Greyscale dE 2000 * | 2.9 | 3.4 -17% | 4.1 -41% | 3.4 -17% | 4.4 -52% | 6.32 -118% |
| Gamma | 2.29 96% | 2.28 96% | 2.27 97% | 2.3 96% | 2.26 97% | 2.28 96% |
| CCT | 6765 96% | 6374 102% | 7434 87% | 6435 101% | 7517 86% | 8194 79% |
| Color Space (Percent of AdobeRGB 1998) (%) | 59.7 | 60.7 2% | 57.9 -3% | 60.7 2% | 60 1% | 60 1% |
| Color Space (Percent of sRGB) (%) | 91.8 | 95.2 4% | 88.9 -3% | 94.6 3% | 92.5 1% | 92 0% |
| Totalt genomsnitt (program/inställningar) | -23% /
-7% | -35% /
-20% | -27% /
-10% | -7% /
-9% | -114% /
-59% |
* ... mindre är bättre
Visa svarstider
| ↔ Svarstid svart till vitt | ||
|---|---|---|
| 9.6 ms ... stiga ↗ och falla ↘ kombinerat | ↗ 4.4 ms stiga |  |
| ↘ 5.2 ms hösten | ||
| Skärmen visar snabba svarsfrekvenser i våra tester och bör passa för spel. I jämförelse sträcker sig alla testade enheter från 0.1 (minst) till 240 (maximalt) ms. » 26 % av alla enheter är bättre. Det betyder att den uppmätta svarstiden är bättre än genomsnittet av alla testade enheter (19.8 ms). | ||
| ↔ Svarstid 50 % grått till 80 % grått | ||
| 7 ms ... stiga ↗ och falla ↘ kombinerat | ↗ 3.6 ms stiga | 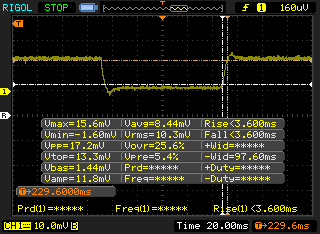 |
| ↘ 3.4 ms hösten | ||
| Skärmen visar väldigt snabba svarsfrekvenser i våra tester och borde vara mycket väl lämpad för fartfyllt spel. I jämförelse sträcker sig alla testade enheter från 0.165 (minst) till 636 (maximalt) ms. » 20 % av alla enheter är bättre. Det betyder att den uppmätta svarstiden är bättre än genomsnittet av alla testade enheter (31 ms). | ||
Skärmflimmer / PWM (Puls-Width Modulation)
| Skärmflimmer / PWM upptäcktes inte | 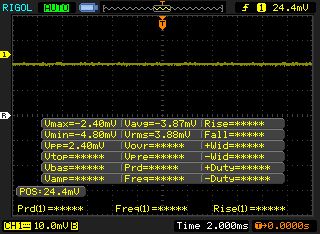 | ||
Som jämförelse: 52 % av alla testade enheter använder inte PWM för att dämpa skärmen. Om PWM upptäcktes mättes ett medelvärde av 7754 (minst: 5 - maximum: 343500) Hz. | |||
| PCMark 8 Home Score Accelerated v2 | 3979 poäng | |
| PCMark 8 Work Score Accelerated v2 | 5289 poäng | |
| PCMark 10 Score | 5492 poäng | |
Hjälp | ||
| Asus Zephyrus S GX531GX Intel SSD 660p SSDPEKNW512G8 | Aorus 15 X9 Intel SSD 760p SSDPEKKW512G8 | Razer Blade 15 RTX 2070 Max-Q Samsung SSD PM981 MZVLB512HAJQ | Asus Strix GL504GM Toshiba NVMe THNSN5256GPU7 | Asus Zephyrus S GX531GS WDC PC SN520 SDAPNUW-512G | |
|---|---|---|---|---|---|
| AS SSD | 40% | 83% | 20% | 50% | |
| Seq Read (MB/s) | 1239 | 1912 54% | 1840 49% | 1433 16% | 903 -27% |
| Seq Write (MB/s) | 920 | 1553 69% | 1822 98% | 1071 16% | 1261 37% |
| 4K Read (MB/s) | 45.74 | 56.5 24% | 52.3 14% | 32 -30% | 40.02 -13% |
| 4K Write (MB/s) | 95.7 | 119.6 25% | 110.7 16% | 96.5 1% | 103.6 8% |
| 4K-64 Read (MB/s) | 322 | 869 170% | 1126 250% | 832 158% | 1030 220% |
| 4K-64 Write (MB/s) | 722 | 584 -19% | 1717 138% | 520 -28% | 1285 78% |
| Access Time Read * (ms) | 0.073 | 0.049 33% | 0.047 36% | 0.072 1% | 0.129 -77% |
| Access Time Write * (ms) | 0.047 | 0.031 34% | 0.033 30% | 0.045 4% | 0.036 23% |
| Score Read (Points) | 492 | 1116 127% | 1362 177% | 1007 105% | 1161 136% |
| Score Write (Points) | 910 | 859 -6% | 2010 121% | 724 -20% | 1515 66% |
| Score Total (Points) | 1654 | 2544 54% | 4079 147% | 2233 35% | 3294 99% |
| Copy ISO MB/s (MB/s) | 1236 | 1329 8% | 1975 60% | 1006 -19% | |
| Copy Program MB/s (MB/s) | 703 | 404.3 -42% | 526 -25% | 752 7% | |
| Copy Game MB/s (MB/s) | 812 | 1071 32% | 1200 48% | 1088 34% |
* ... mindre är bättre

| 3DMark 11 Performance | 21324 poäng | |
| 3DMark Cloud Gate Standard Score | 32978 poäng | |
| 3DMark Fire Strike Score | 17774 poäng | |
| 3DMark Time Spy Score | 7688 poäng | |
Hjälp | ||
| låg | med. | hög | ultra | |
|---|---|---|---|---|
| BioShock Infinite (2013) | 276.8 | 246.7 | 232.3 | 166 |
| The Witcher 3 (2015) | 263.4 | 215.2 | 142 | 80.3 |
| Rise of the Tomb Raider (2016) | 215 | 163.6 | 146.5 | 124 |
| Asus Zephyrus S GX531GX GeForce RTX 2080 Max-Q, i7-8750H, Intel SSD 660p SSDPEKNW512G8 | Aorus 15 X9 GeForce RTX 2070 Mobile, i7-8750H, Intel SSD 760p SSDPEKKW512G8 | Alienware m15 GTX 1070 Max-Q GeForce GTX 1070 Max-Q, i7-8750H, Toshiba XG5 KXG50ZNV512G | Razer Blade 15 RTX 2070 Max-Q GeForce RTX 2070 Max-Q, i7-8750H, Samsung SSD PM981 MZVLB512HAJQ | Asus Strix GL504GM GeForce GTX 1060 Mobile, i7-8750H, Toshiba NVMe THNSN5256GPU7 | Asus Zephyrus GX501 GeForce GTX 1080 Max-Q, i7-7700HQ, Samsung SSD SM961 1TB M.2 MZVKW1T0HMLH | Asus Zephyrus S GX531GS GeForce GTX 1070 Max-Q, i7-8750H, WDC PC SN520 SDAPNUW-512G | |
|---|---|---|---|---|---|---|---|
| Noise | -0% | 8% | 13% | 7% | 5% | -4% | |
| av / miljö * (dB) | 28.7 | 28.2 2% | 28.6 -0% | 28.8 -0% | 28.5 1% | 31 -8% | 29 -1% |
| Idle Minimum * (dB) | 29.8 | 32.6 -9% | 28.6 4% | 28.8 3% | 30 -1% | 32 -7% | 33 -11% |
| Idle Average * (dB) | 32.4 | 32.7 -1% | 28.6 12% | 28.8 11% | 30 7% | 33 -2% | 34 -5% |
| Idle Maximum * (dB) | 38 | 32.7 14% | 28.6 25% | 29.4 23% | 30 21% | 34 11% | 40 -5% |
| Load Average * (dB) | 38.2 | 38.9 -2% | 40.8 -7% | 35.7 7% | 41.8 -9% | 39 -2% | 47 -23% |
| Witcher 3 ultra * (dB) | 56.6 | 51.8 8% | 49.6 12% | 42.5 25% | 47.6 16% | 42 26% | 51 10% |
| Load Maximum * (dB) | 56.6 | 64.1 -13% | 49.6 12% | 45 20% | 50 12% | 46 19% | 53 6% |
* ... mindre är bättre
Ljudnivå
| Låg belastning |
| 29.8 / 32.4 / 38 dB(A) |
| Hög belastning |
| 38.2 / 56.6 dB(A) |
 | ||
30 dB tyst 40 dB(A) hörbar 50 dB(A) högt ljud |
||
min: | ||
(-) Den maximala temperaturen på ovansidan är 47 °C / 117 F, jämfört med genomsnittet av 40.4 °C / 105 F , allt från 21.2 till 68.8 °C för klassen Gaming.
(-) Botten värms upp till maximalt 48.6 °C / 119 F, jämfört med genomsnittet av 43.2 °C / 110 F
(+) Vid tomgångsbruk är medeltemperaturen för ovansidan 27.1 °C / 81 F, jämfört med enhetsgenomsnittet på 33.9 °C / ### class_avg_f### F.
(-) När du spelar The Witcher 3 är medeltemperaturen för ovansidan 38.1 °C / 101 F, jämfört med enhetsgenomsnittet på 33.9 °C / ## #class_avg_f### F.
(+) Handledsstöden och pekplattan når maximal hudtemperatur (33.4 °C / 92.1 F) och är därför inte varma.
(-) Medeltemperaturen för handledsstödsområdet på liknande enheter var 28.8 °C / 83.8 F (-4.6 °C / -8.3 F).
Asus Zephyrus S GX531GX ljudanalys
(±) | högtalarljudstyrkan är genomsnittlig men bra (73 dB)
Bas 100 - 315 Hz
(±) | reducerad bas - i genomsnitt 13.3% lägre än medianen
(±) | linjäriteten för basen är genomsnittlig (14.9% delta till föregående frekvens)
Mellan 400 - 2000 Hz
(+) | balanserad mellan - endast 1.9% från medianen
(+) | mids är linjära (5.2% delta till föregående frekvens)
Högsta 2 - 16 kHz
(±) | högre toppar - i genomsnitt 5.6% högre än medianen
(±) | linjäriteten för toppar är genomsnittlig (10.8% delta till föregående frekvens)
Totalt 100 - 16 000 Hz
(±) | linjäriteten för det totala ljudet är genomsnittlig (18.3% skillnad mot median)
Jämfört med samma klass
» 58% av alla testade enheter i den här klassen var bättre, 9% liknande, 33% sämre
» Den bästa hade ett delta på 6%, genomsnittet var 18%, sämst var 132%
Jämfört med alla testade enheter
» 40% av alla testade enheter var bättre, 8% liknande, 52% sämre
» Den bästa hade ett delta på 4%, genomsnittet var 23%, sämst var 134%
Apple MacBook 12 (Early 2016) 1.1 GHz ljudanalys
(+) | högtalare kan spela relativt högt (83.6 dB)
Bas 100 - 315 Hz
(±) | reducerad bas - i genomsnitt 11.3% lägre än medianen
(±) | linjäriteten för basen är genomsnittlig (14.2% delta till föregående frekvens)
Mellan 400 - 2000 Hz
(+) | balanserad mellan - endast 2.4% från medianen
(+) | mids är linjära (5.5% delta till föregående frekvens)
Högsta 2 - 16 kHz
(+) | balanserade toppar - endast 2% från medianen
(+) | toppar är linjära (4.5% delta till föregående frekvens)
Totalt 100 - 16 000 Hz
(+) | det totala ljudet är linjärt (10.2% skillnad mot median)
Jämfört med samma klass
» 7% av alla testade enheter i den här klassen var bättre, 2% liknande, 90% sämre
» Den bästa hade ett delta på 5%, genomsnittet var 18%, sämst var 53%
Jämfört med alla testade enheter
» 5% av alla testade enheter var bättre, 1% liknande, 94% sämre
» Den bästa hade ett delta på 4%, genomsnittet var 23%, sämst var 134%
| Av/Standby | |
| Låg belastning | |
| Hög belastning |
|
Förklaring:
min: | |
| Asus Zephyrus S GX531GX i7-8750H, GeForce RTX 2080 Max-Q, Intel SSD 660p SSDPEKNW512G8, IPS, 1920x1080, 15.6" | Aorus 15 X9 i7-8750H, GeForce RTX 2070 Mobile, Intel SSD 760p SSDPEKKW512G8, IPS, 1920x1080, 15.6" | Asus Zephyrus S GX531GS i7-8750H, GeForce GTX 1070 Max-Q, WDC PC SN520 SDAPNUW-512G, IPS, 1920x1080, 15.6" | Razer Blade 15 RTX 2070 Max-Q i7-8750H, GeForce RTX 2070 Max-Q, Samsung SSD PM981 MZVLB512HAJQ, IPS, 1920x1080, 15.6" | Asus Strix GL504GM i7-8750H, GeForce GTX 1060 Mobile, Toshiba NVMe THNSN5256GPU7, IPS, 1920x1080, 15.6" | Asus Zephyrus GX501 i7-7700HQ, GeForce GTX 1080 Max-Q, Samsung SSD SM961 1TB M.2 MZVKW1T0HMLH, IPS, 1920x1080, 15.6" | |
|---|---|---|---|---|---|---|
| Power Consumption | -25% | -3% | 22% | 18% | -0% | |
| Idle Minimum * (Watt) | 16.1 | 26 -61% | 17 -6% | 10.4 35% | 10 38% | 18 -12% |
| Idle Average * (Watt) | 20.9 | 30.8 -47% | 20 4% | 14.6 30% | 16.9 19% | 23 -10% |
| Idle Maximum * (Watt) | 27 | 34.9 -29% | 29 -7% | 16.3 40% | 21.1 22% | 31 -15% |
| Load Average * (Watt) | 93.4 | 90.7 3% | 112 -20% | 88.5 5% | 112.4 -20% | 79 15% |
| Witcher 3 ultra * (Watt) | 168.2 | 175 -4% | 152 10% | 155.4 8% | 135.5 19% | 148 12% |
| Load Maximum * (Watt) | 215.3 | 241.2 -12% | 211 2% | 182.4 15% | 157.3 27% | 196 9% |
* ... mindre är bättre
| Asus Zephyrus S GX531GX i7-8750H, GeForce RTX 2080 Max-Q, 50 Wh | Aorus 15 X9 i7-8750H, GeForce RTX 2070 Mobile, 62 Wh | Alienware m15 GTX 1070 Max-Q i7-8750H, GeForce GTX 1070 Max-Q, 90 Wh | Razer Blade 15 RTX 2070 Max-Q i7-8750H, GeForce RTX 2070 Max-Q, 80 Wh | Asus Strix GL504GM i7-8750H, GeForce GTX 1060 Mobile, 66 Wh | Asus Zephyrus GX501 i7-7700HQ, GeForce GTX 1080 Max-Q, 50 Wh | |
|---|---|---|---|---|---|---|
| Batteridrifttid | -47% | 157% | 117% | 97% | -27% | |
| WiFi v1.3 (h) | 3 | 1.6 -47% | 7.7 157% | 6.5 117% | 5.9 97% | 2.2 -27% |
| Reader / Idle (h) | 1.8 | 10.5 | 11.4 | 3.1 | ||
| Load (h) | 1 | 1.7 | 1.5 | 0.7 |
För
Emot

Läs den fullständiga versionen av den här recensionen på engelska här.
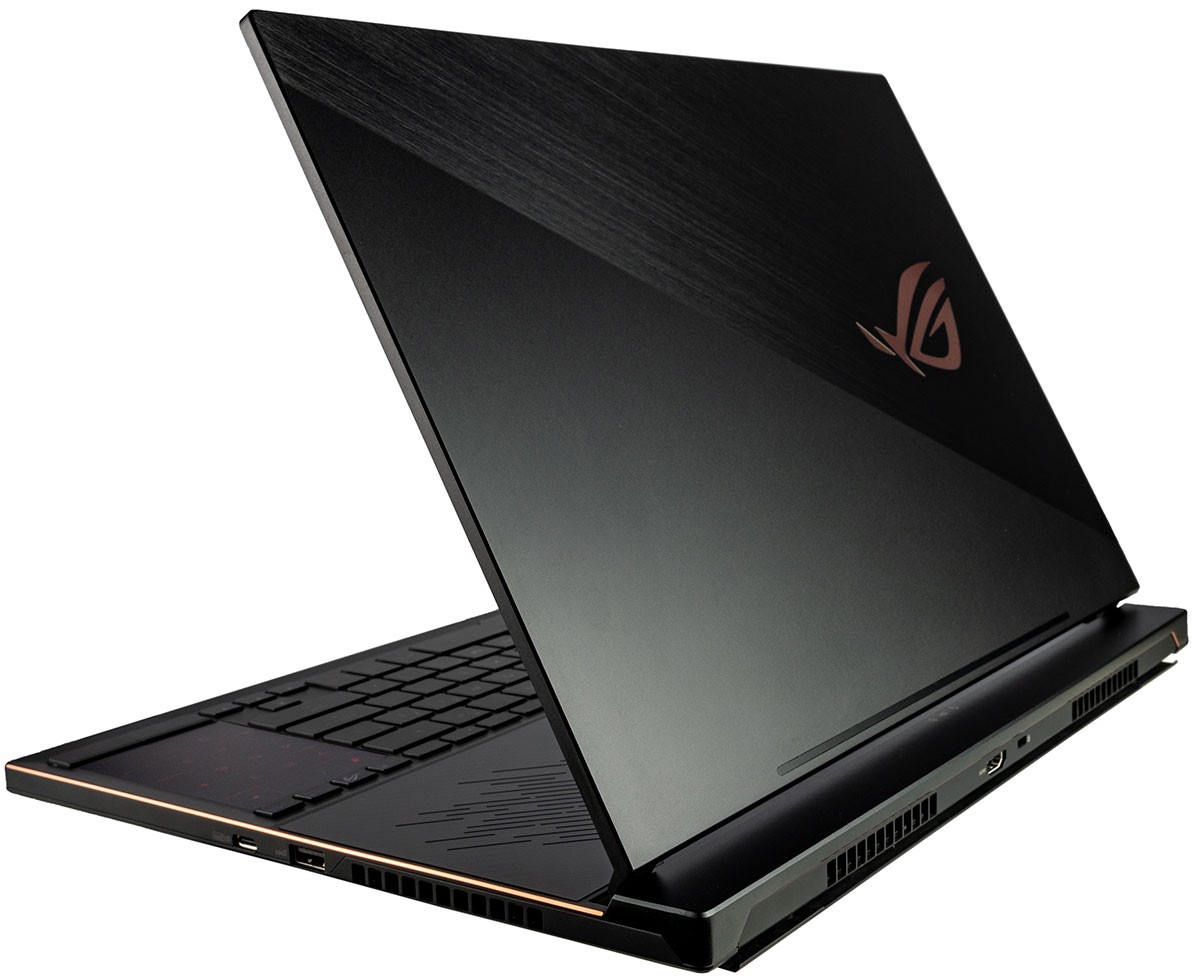
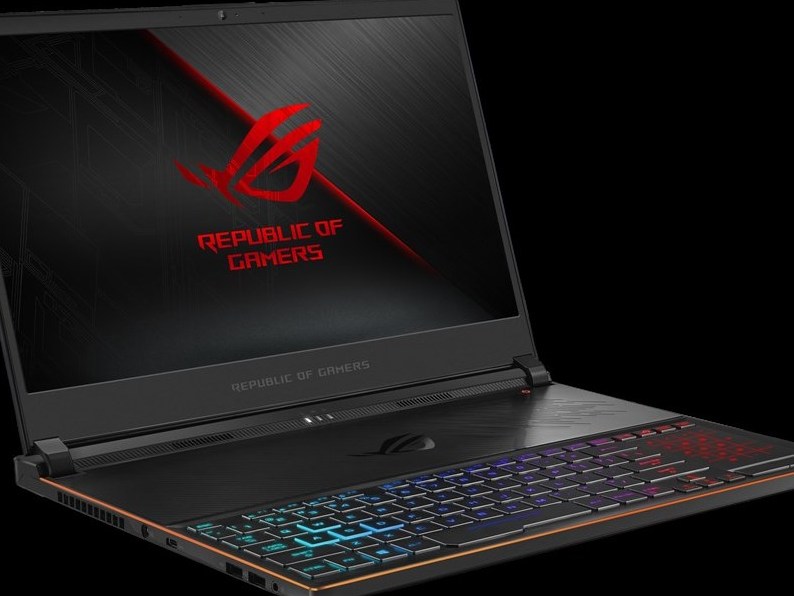
GX531 utmärker sig på ett antal nyckelområden. Utöver att vara tilltalande smal med tunn infattning så var kärntemperaturerna svalare vid spelande än vi hade förväntat oss och själva skärmen är en stor förbättring jämfört med skärmen på GX501, som hade väldigt tydlig ghosting. Höljets unika design innebär förstås att det aldrig uppstår några problem med obekvämt varma knappar. Man kan förvänta sig 17 till 45 procent bättre spelprestanda från RTX 2080 Max-Q jämfört med GTX 1080 Max-Q.
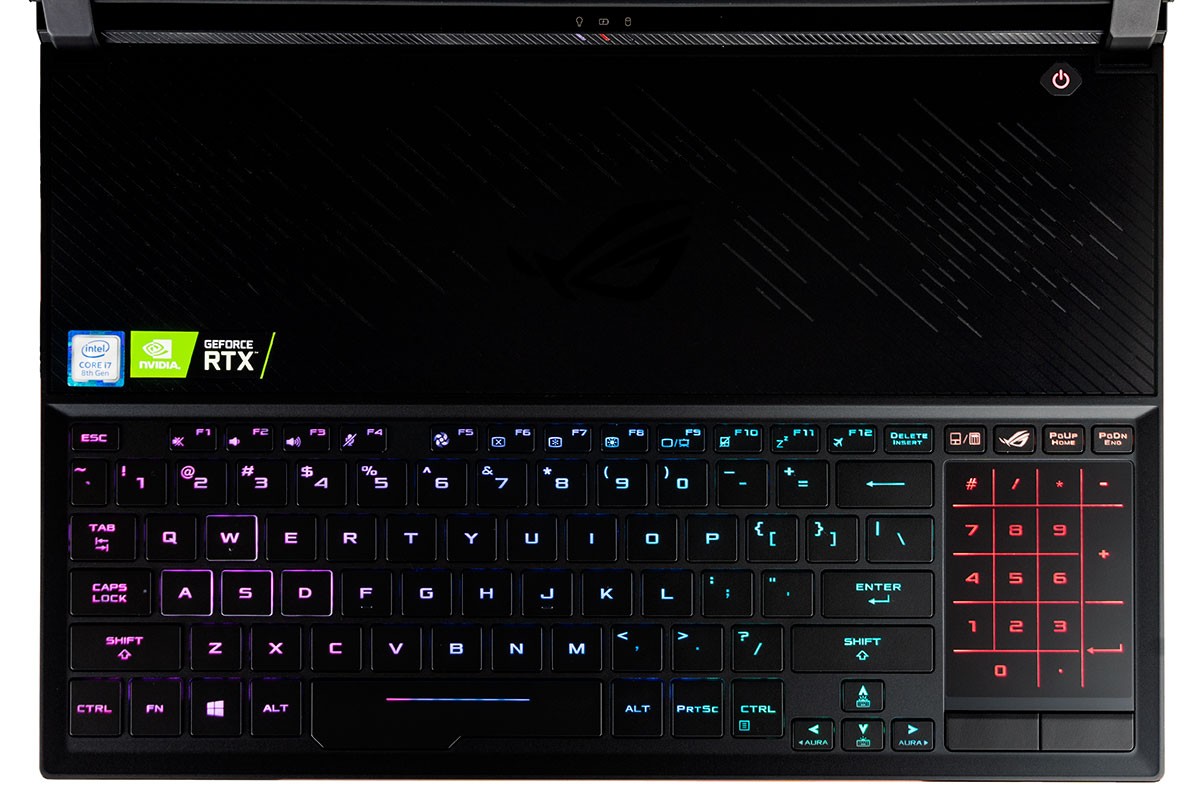
Det finns fortfarande mycket rum för förbättring. Skärmens haka är väldigt stor och fläkten låter mer än på konkurrenter som MSI GS65 eller Razer Blade 15. För att få ut maximal prestanda krävs det att man kör datorn i Turbo-läge med fläktarna på maximal effekt eftersom det balanserade läget resulterar i ett prestandatapp på 10 procent. Dessa energi-inställningar behöver ändras genom Armoury Crate-appen eftersom de är separata från Windows vanliga energiprofiler.
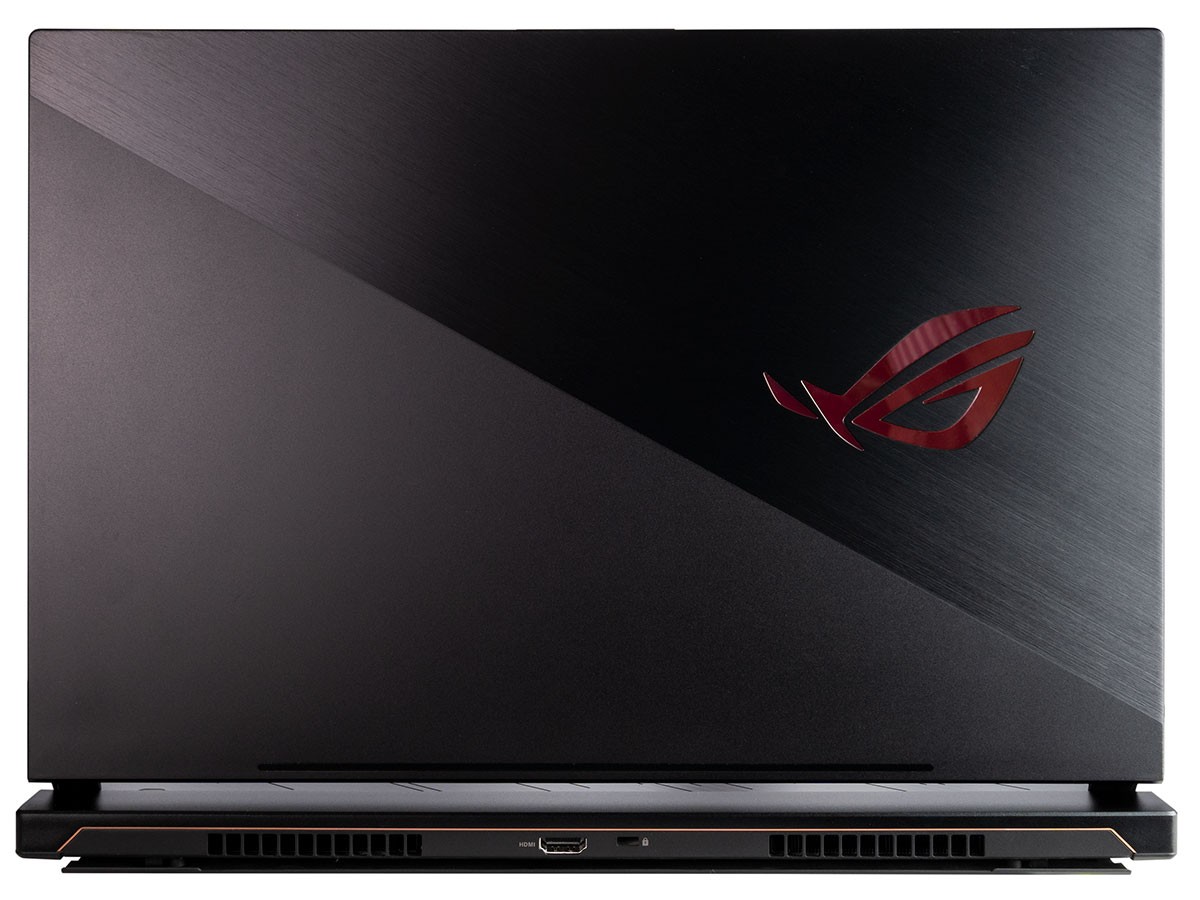
Andra funktioner som saknas är RJ-45, SD-kortläsare, tangentspecifik RGB-belysning och Thunderbolt 3, vilket vi anser bör vara standard på spelinriktade flaggskeppsmodeller som kostar över 25.000 kronor. Spelentusiaster kanske föredrar att ha G-Sync istället för Optimus eftersom batteritiden ändå är medelmåttig som bäst trots att grafikbyte finns tillgängligt. Den tunna profilen exkluderar också sekundära lagringsplatser vilket kan bli ett problem för den som har ett stort spelbibliotek.
På grund av bristerna med GX531 rekommenderar vi att man istället tar en titt på Asus ROG GL504-serie. Vi tycker den är bättre balanserad med fastare tangentbordsknappar, ett starkare lock, fler lagringsalternativ, fler portar och en större styrplatta. Den har till och med exakt samma IPS-skärm som GX531. Det är ett tjockare alternativ, men vi tycker den långa listan över praktiska funktioner är väl värt det.
En betydande uppgradering över den äldre GX501 i fråga om prestanda, vikt, tjocklek och utseende. GX531 är Asus tjusigaste spellaptop på 15.6 tum hittills, men den fick offra en del användbara funktioner för att kunna ha en såpass tunn och lätt formfaktor.
Asus Zephyrus S GX531GX
- 09/20/2019 v7 (old)
Allen Ngo
Price comparison
