Debut för Intel Core i7-12800H - Recension av Razer Blade 15
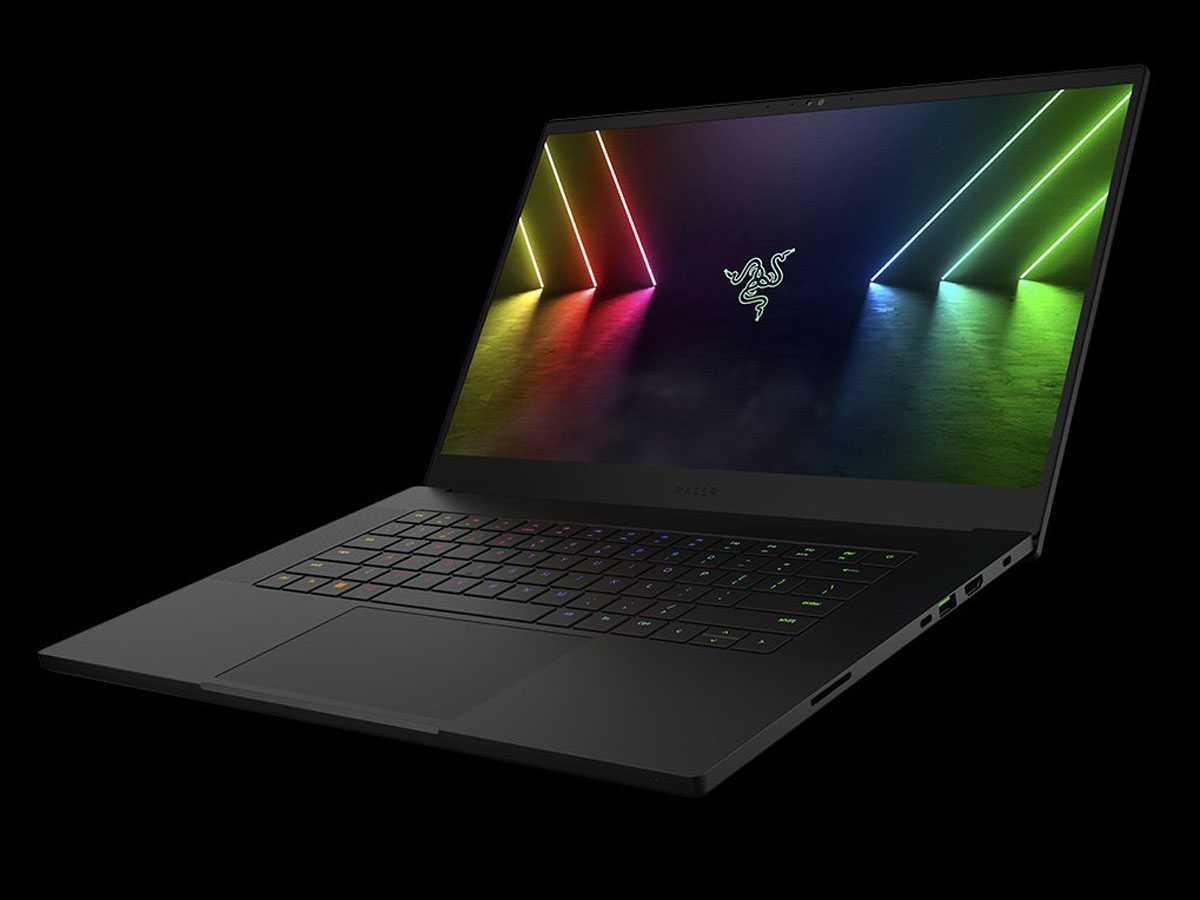
Razer har uppdaterat sin Blade 15-serie i år för att inkludera de senaste Intel CPU:erna och Nvidia GPU:erna. I det här fallet får modellen 12:e generationens Alder Lake-H Core i7-12800H och Core i9-12900H CPU:er tillsammans med GeForce RTX 3070 Ti och 3080 Ti (110 W TGP) för att ersätta de äldre 11:e generationens Core i7-11800H, Core i9-11900H, RTX 3070 och RTX 3080 (105 W TGP) alternativ. Den här recensionen kommer att fokusera på de prestandaskillnader som användare kan förvänta sig när de uppgraderar från en äldre Razer Blade 15 till den senaste 2022-konfigurationen i recensionen.
Alternativ till Blade 15 inkluderar andra ultratunna bärbara 15,6-tums gamingdatorer som t.ex Eurocom RX315, MSI GS66, ADATA XPG Xenia 15eller Asus Zephyrus S-serien
Fler recensioner av Razer:
Jämförelse av potentiella konkurrenter
Gradering | Datum | Modell | Vikt | Höjd | Storlek | Upplösning | Pris |
|---|---|---|---|---|---|---|---|
| 89.1 % v7 (old) | 03/2022 | Razer Blade 15 2022 i7-12800H, GeForce RTX 3080 Ti Laptop GPU | 2.1 kg | 16.99 mm | 15.60" | 2560x1440 | |
| 87.5 % v7 (old) | Razer Blade 15 Advanced Model Early 2021 i7-10875H, GeForce RTX 3080 Laptop GPU | 2 kg | 16.99 mm | 15.60" | 1920x1080 | ||
| 85.9 % v7 (old) | 08/2020 | Razer Blade 15 RTX 2080 Super Max-Q i7-10875H, GeForce RTX 2080 Super Max-Q | 2.2 kg | 17.8 mm | 15.60" | 1920x1080 | |
v (old) | 03/2022 | Schenker XMG Neo 15 E22 (Early 2022, RTX 3080 Ti) i7-12700H, GeForce RTX 3080 Ti Laptop GPU | 2.2 kg | 26.6 mm | 15.60" | 2560x1440 | |
| 87.3 % v7 (old) | 03/2022 | ADATA XPG Xenia 15 i7-11800H, GeForce RTX 3070 Laptop GPU | 1.9 kg | 20.5 mm | 15.60" | 2560x1440 | |
| 83 % v7 (old) | 01/2022 | Eurocom Nightsky ARX315 R9 5900X, GeForce RTX 3070 Laptop GPU | 2.6 kg | 32.5 mm | 15.60" | 1920x1080 |
Hölje
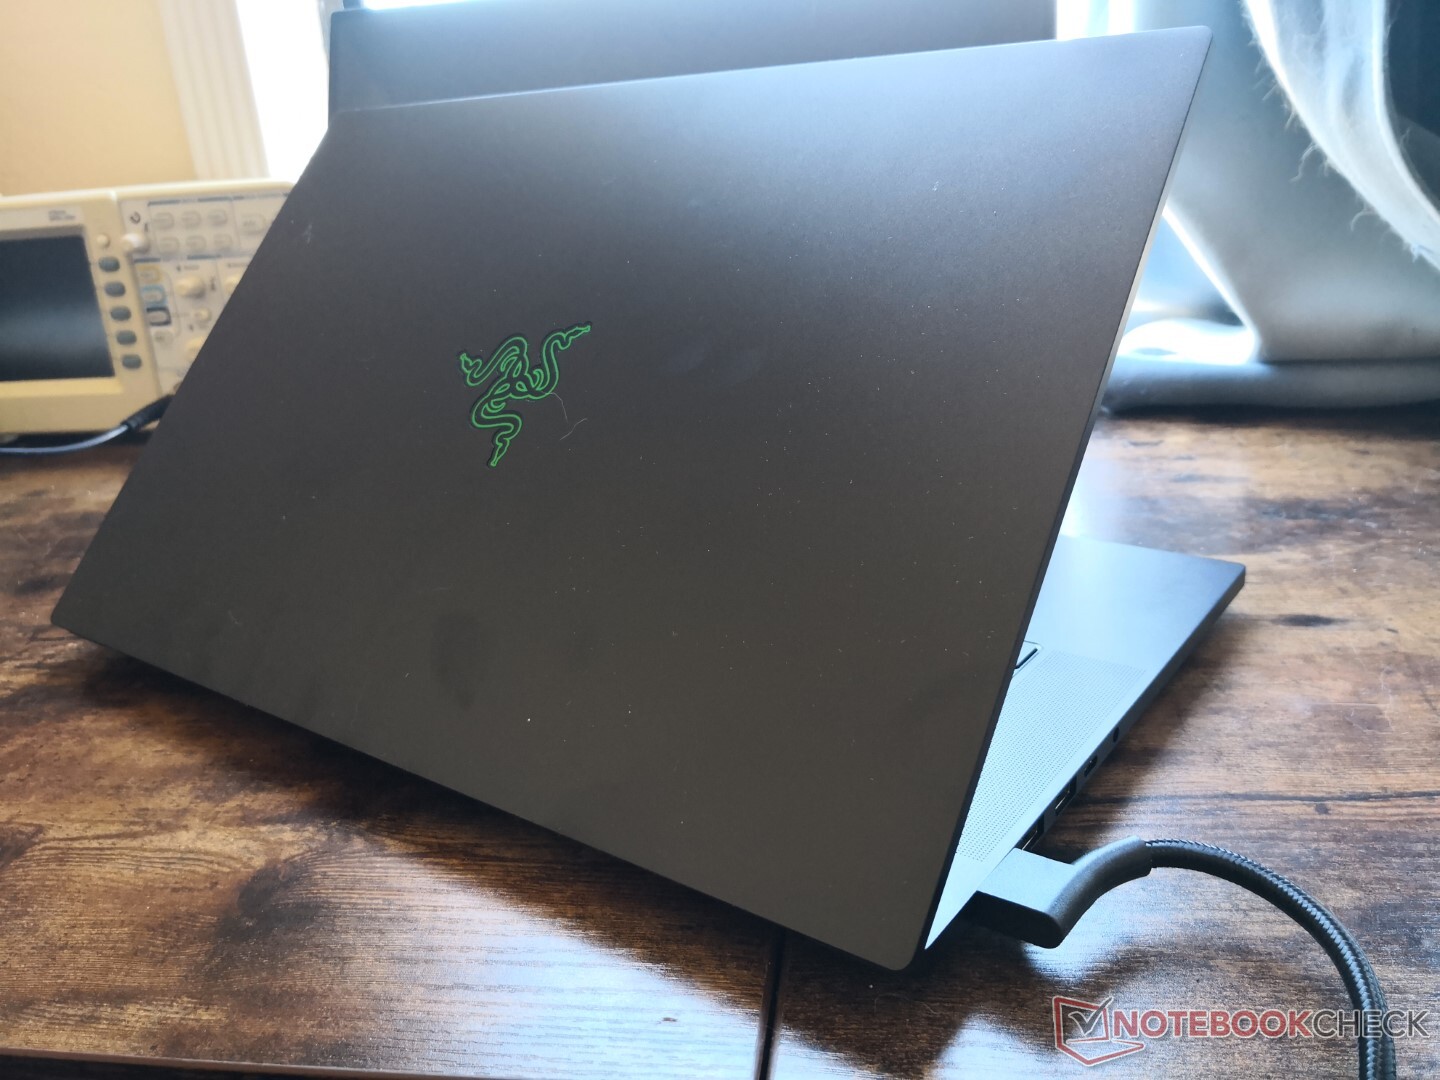
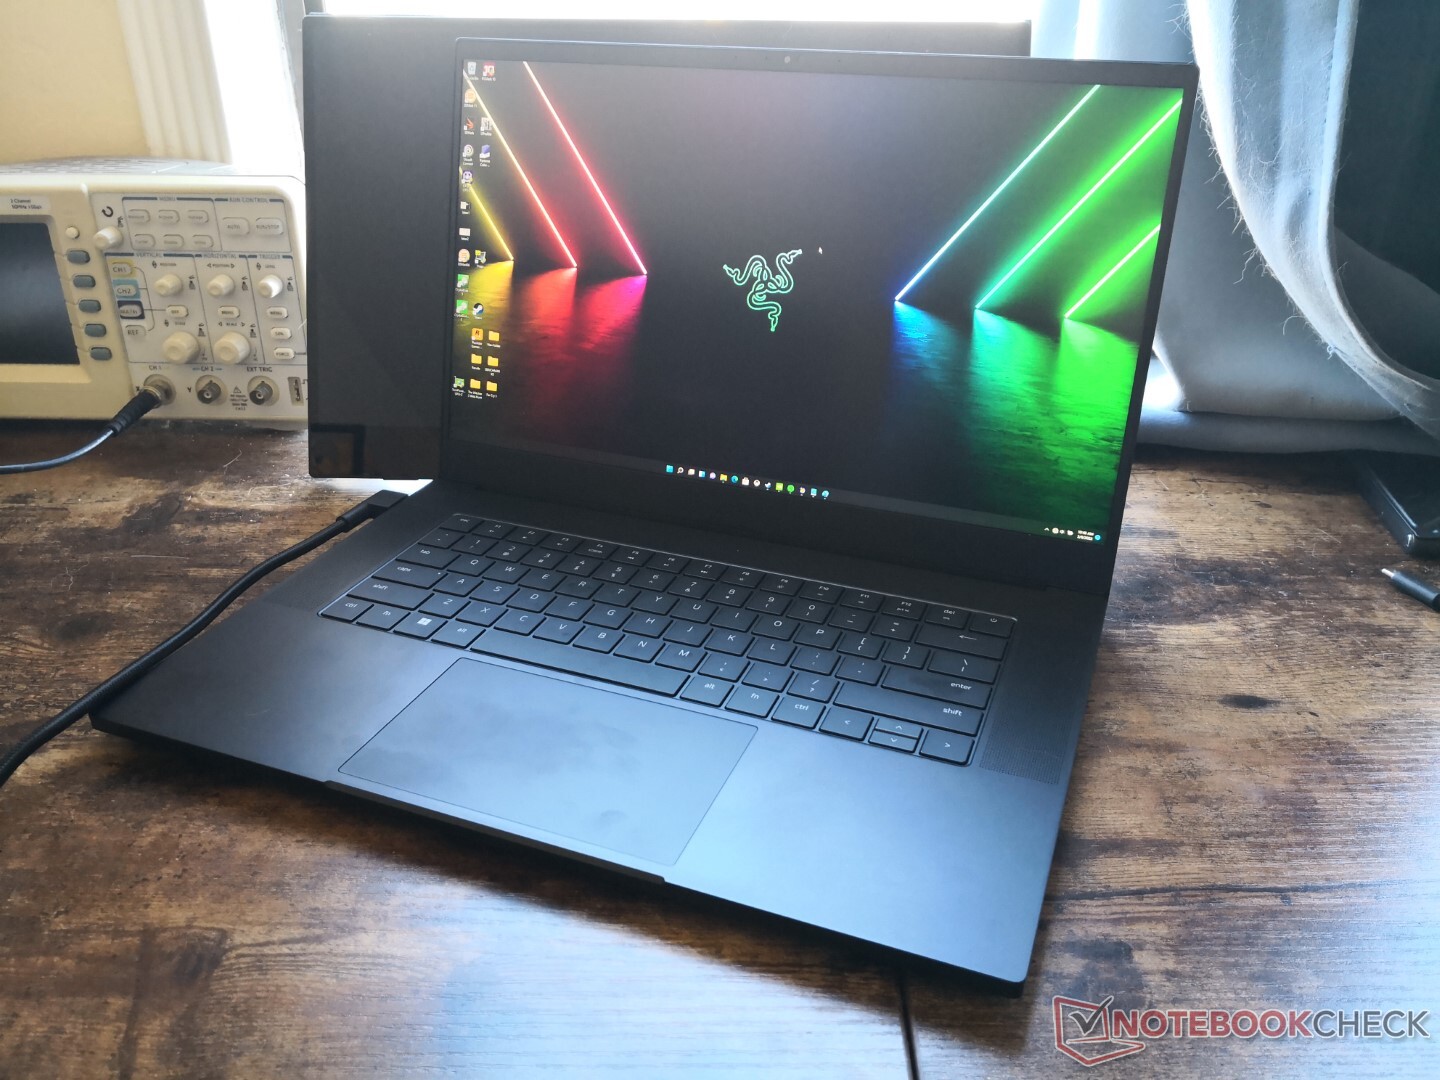
Chassit är i stort sett identiskt med fjolårets Advanced Model, så det finns inga förändringar i systemets dimensioner eller känsla. Om du har hanterat en Blade Stealth, Blade 14, Blade 15, eller Blade Pro 17 tidigare, då kommer den senaste 2022 att kännas bekant.
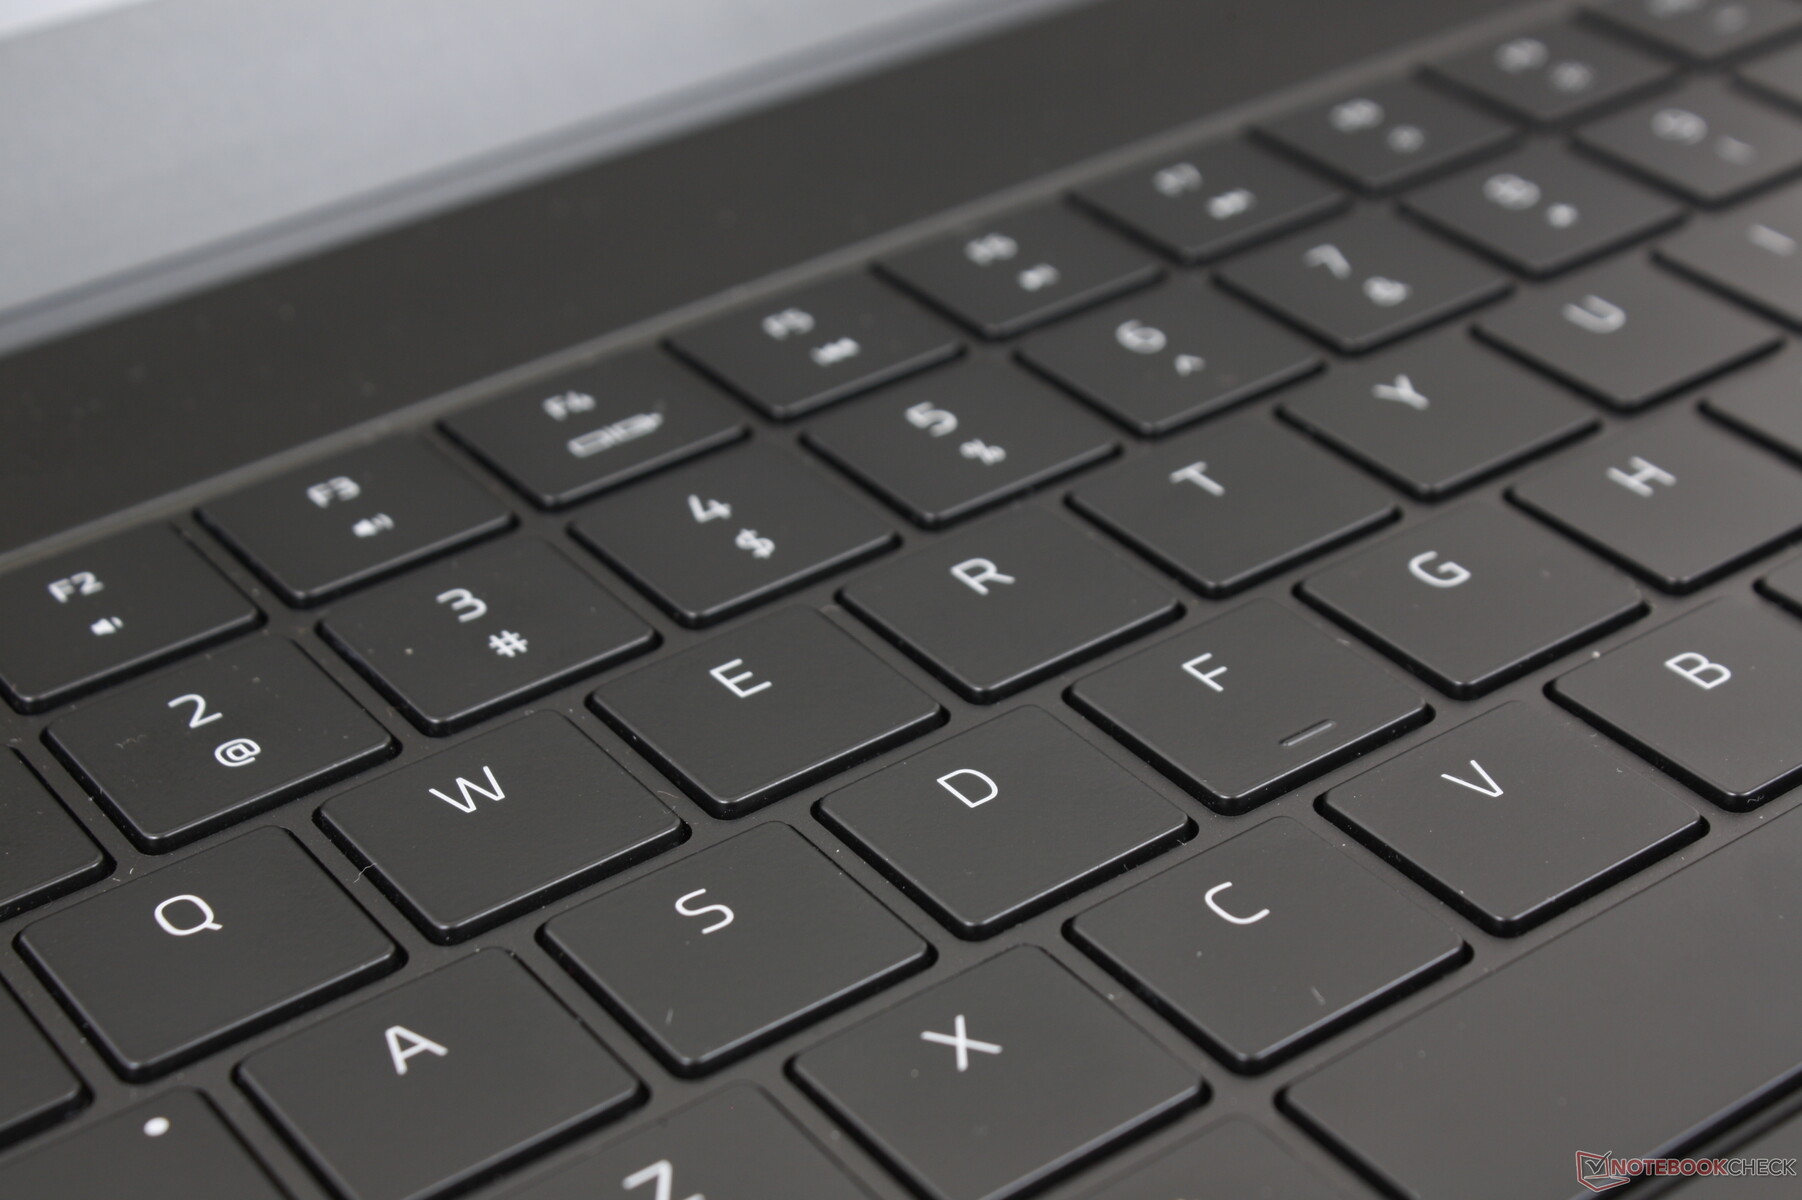
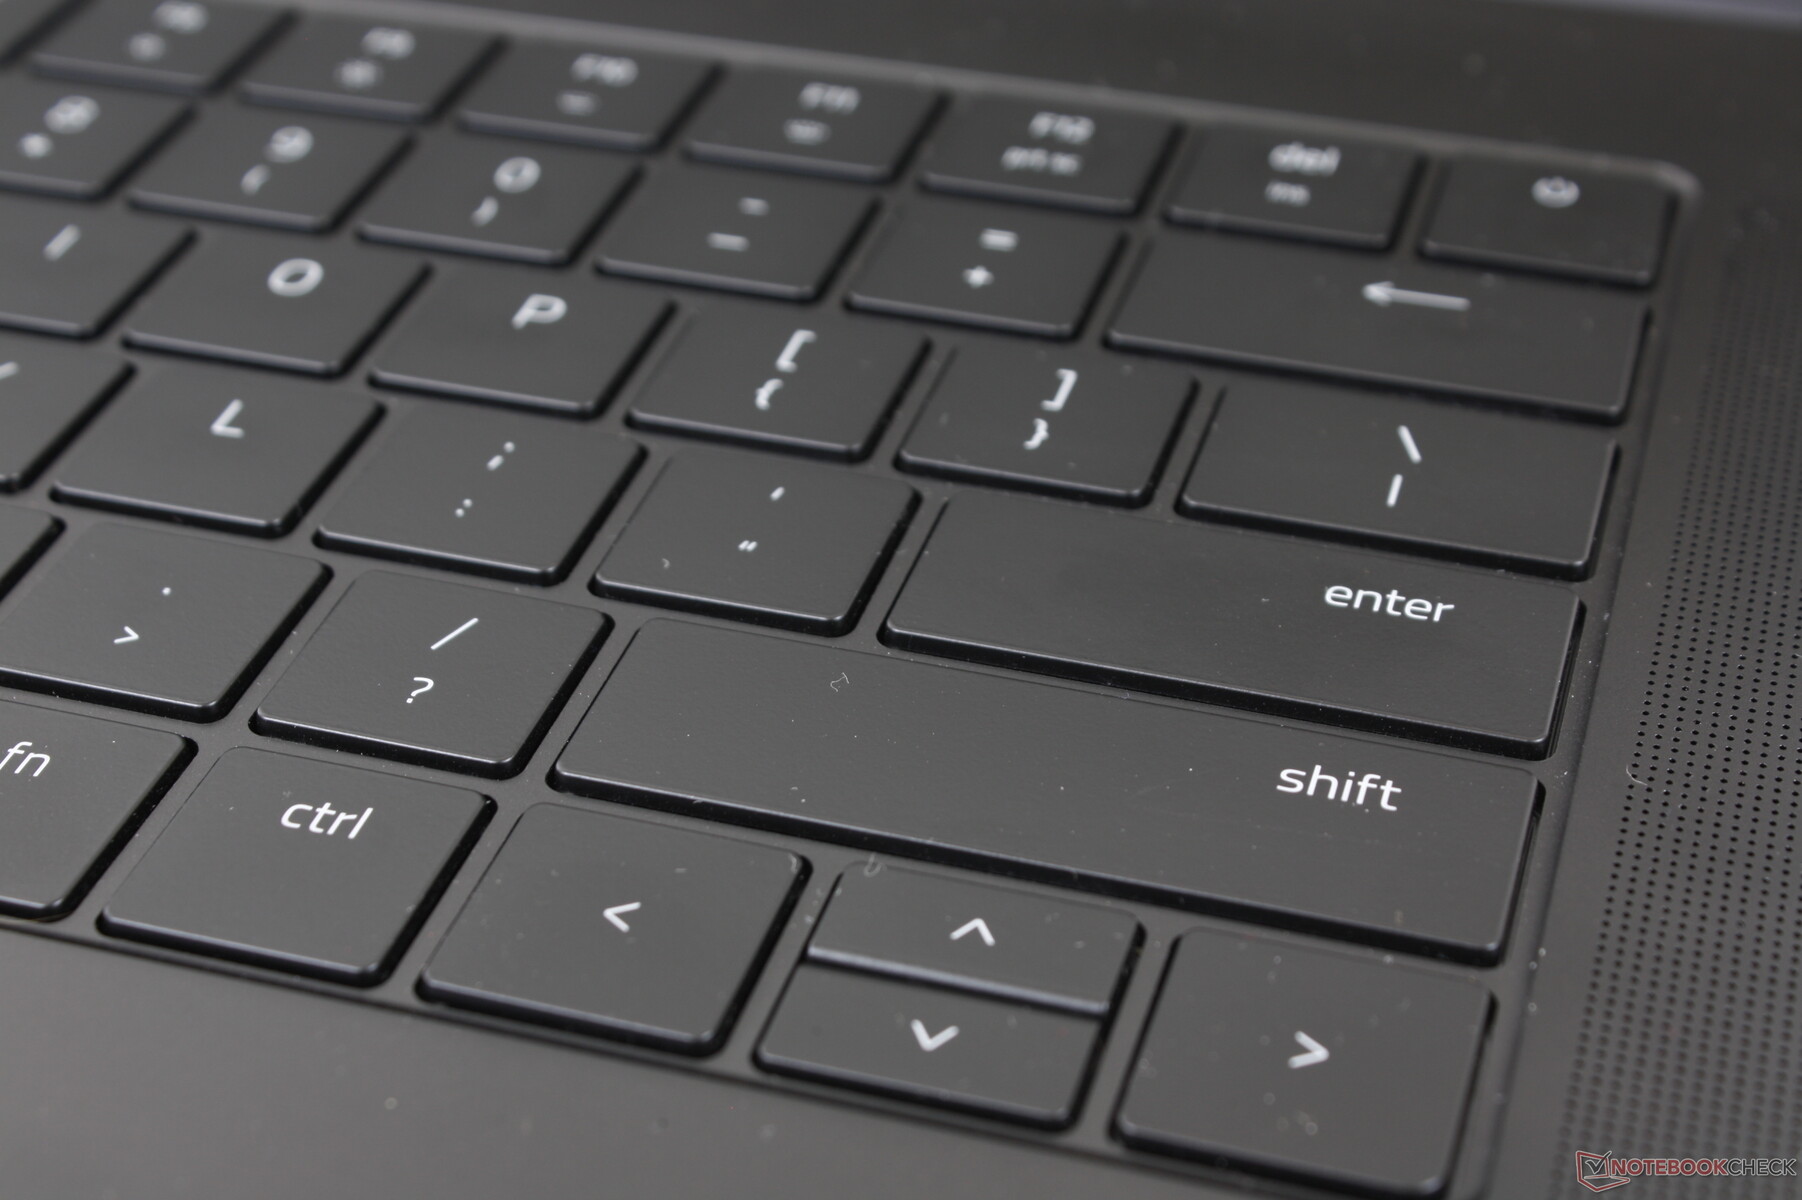
Den enda större fysiska förändringen i år är tangentbordets tangentkapslar som nu är något större än tidigare. Strömknappen har också flyttats vilket fungerar som ett enkelt sätt att visuellt skilja 2022-modellen från tidigare modeller.
SD-kortläsare
| SD Card Reader | |
| average JPG Copy Test (av. of 3 runs) | |
| Razer Blade 15 Advanced Model Early 2021 (AV PRO microSD 128 GB V60) | |
| Razer Blade 15 RTX 2080 Super Max-Q (Toshiba Exceria Pro SDXC 64 GB UHS-II) | |
| Razer Blade 15 2022 (Toshiba Exceria Pro SDXC 64 GB UHS-II) | |
| ADATA XPG Xenia 15 (AV Pro V60) | |
| Schenker XMG Neo 15 E22 (Early 2022, RTX 3080 Ti) | |
| Eurocom Nightsky ARX315 (AV Pro V60) | |
| maximum AS SSD Seq Read Test (1GB) | |
| Razer Blade 15 RTX 2080 Super Max-Q (Toshiba Exceria Pro SDXC 64 GB UHS-II) | |
| Razer Blade 15 Advanced Model Early 2021 (AV PRO microSD 128 GB V60) | |
| Razer Blade 15 2022 (Toshiba Exceria Pro SDXC 64 GB UHS-II) | |
| ADATA XPG Xenia 15 (AV Pro V60) | |
| Eurocom Nightsky ARX315 (AV Pro V60) | |
| Schenker XMG Neo 15 E22 (Early 2022, RTX 3080 Ti) | |
Kommunikation
WLAN-modulen har uppgraderats till Killer AX1690i som i huvudsak är en spelversion av den befintliga Intel Wi-Fi 6E AX210.
| Networking | |
| iperf3 transmit AX12 | |
| Razer Blade 15 2022 | |
| Razer Blade 15 RTX 2080 Super Max-Q | |
| Schenker XMG Neo 15 E22 (Early 2022, RTX 3080 Ti) | |
| ADATA XPG Xenia 15 | |
| Eurocom Nightsky ARX315 | |
| Razer Blade 15 Advanced Model Early 2021 | |
| iperf3 receive AX12 | |
| Razer Blade 15 2022 | |
| Razer Blade 15 RTX 2080 Super Max-Q | |
| Razer Blade 15 Advanced Model Early 2021 | |
| ADATA XPG Xenia 15 | |
| Schenker XMG Neo 15 E22 (Early 2022, RTX 3080 Ti) | |
| Eurocom Nightsky ARX315 | |
Webbkamera


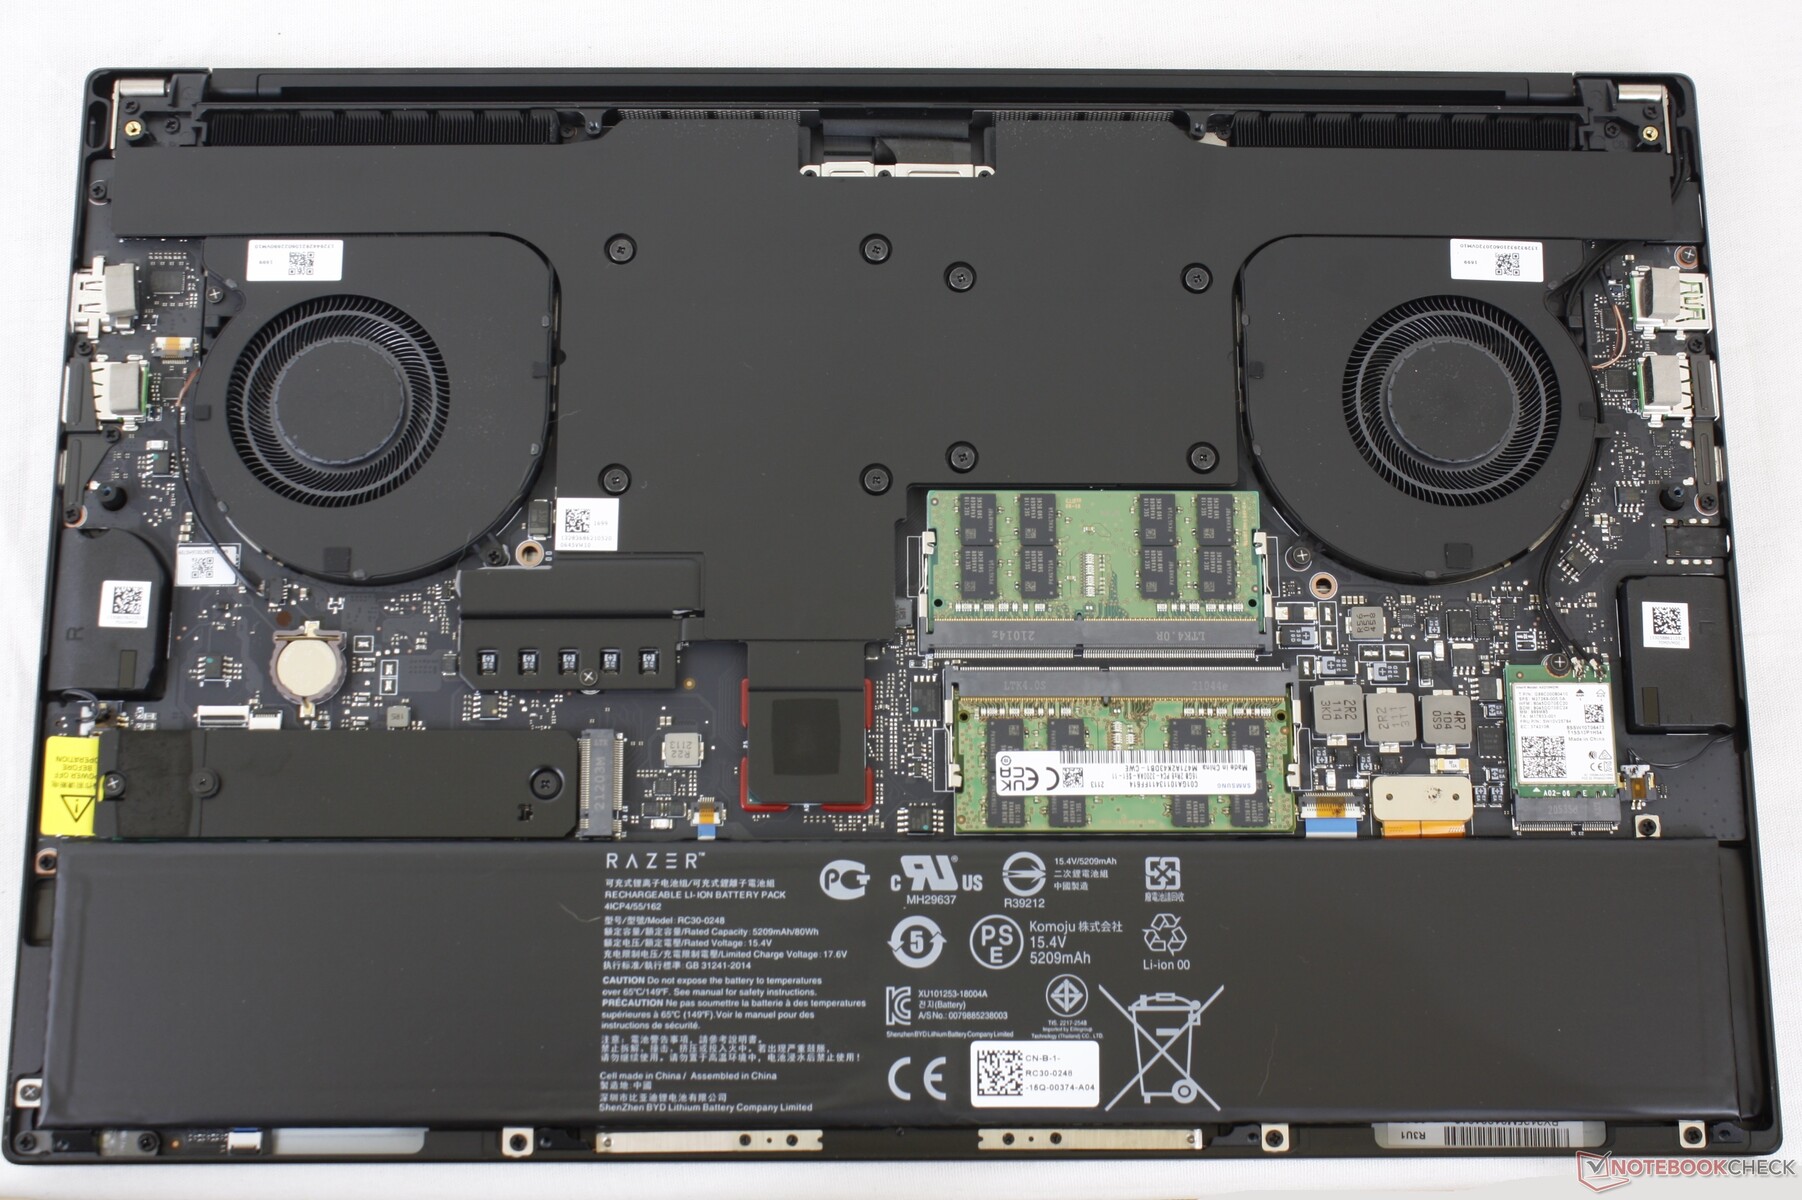
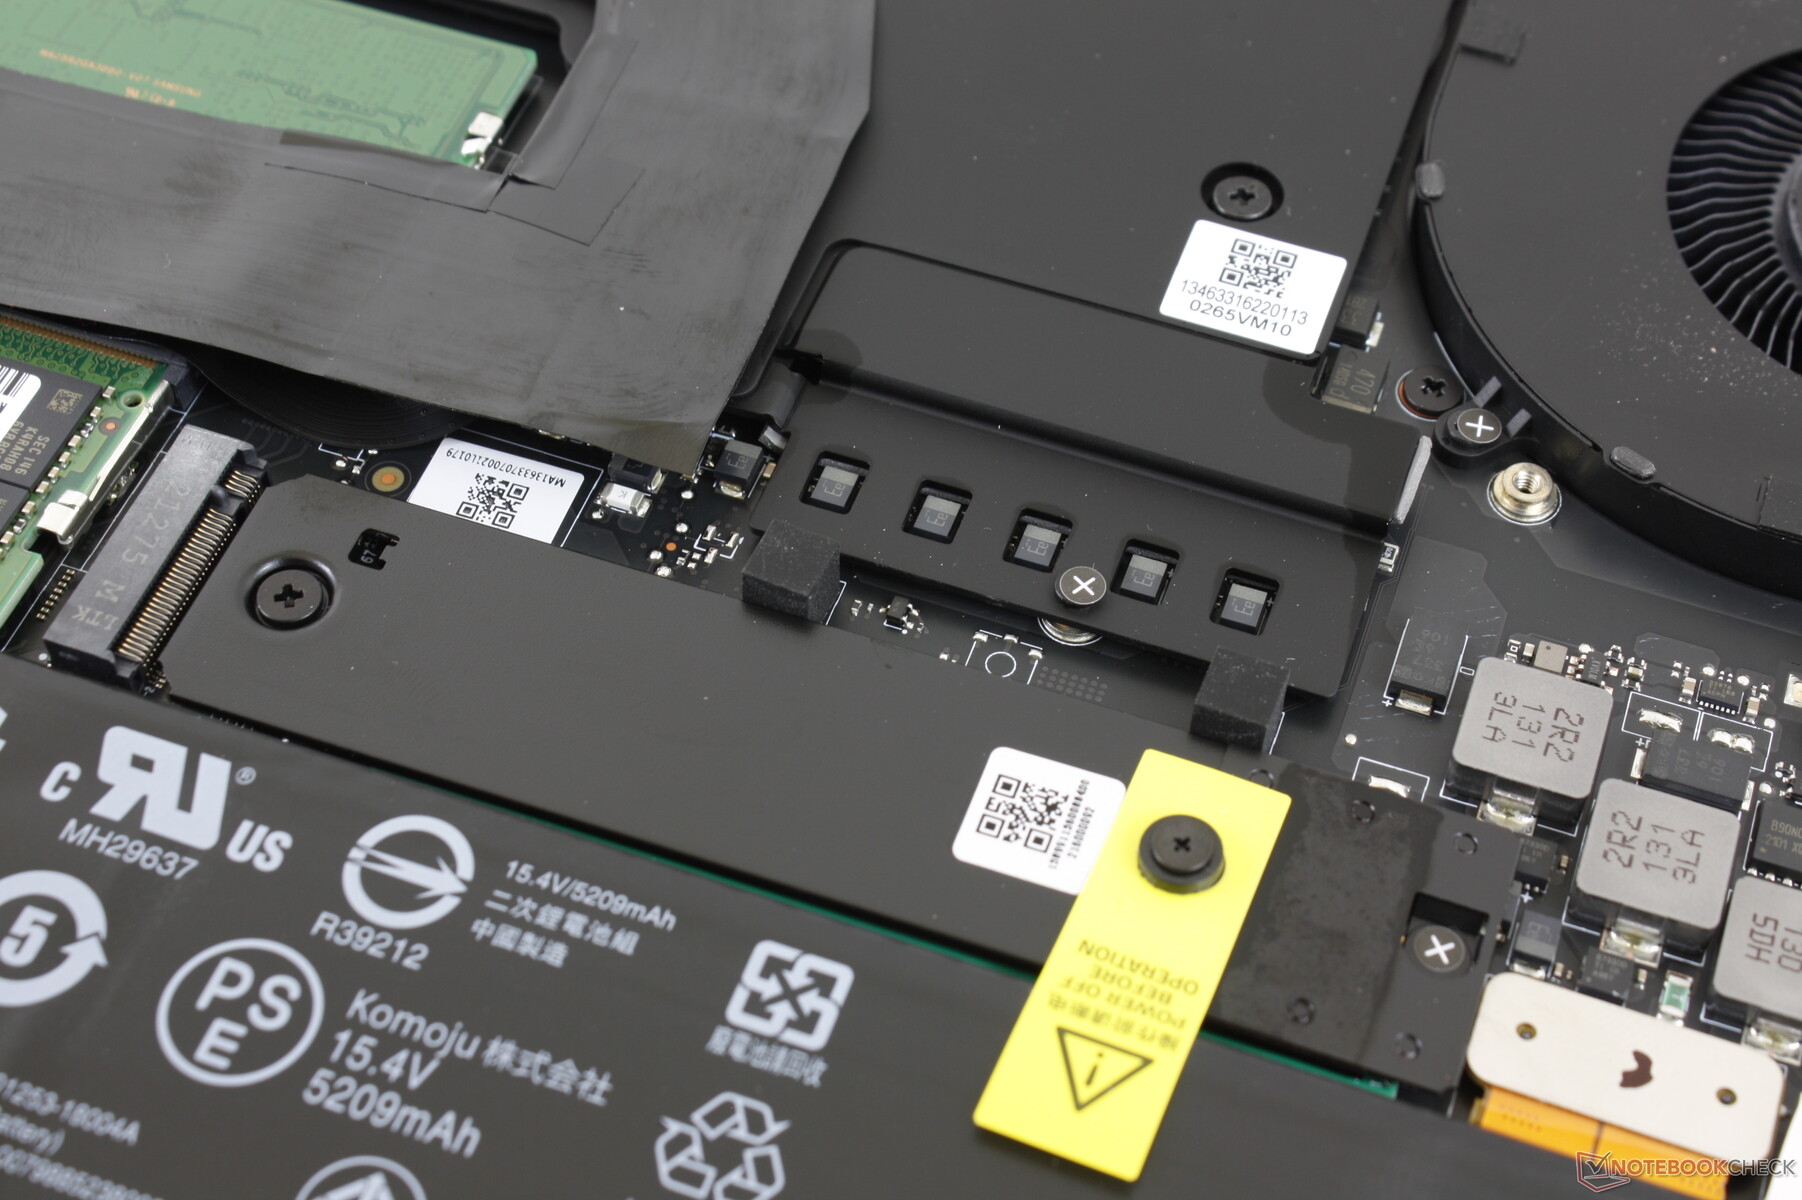
Underhåll
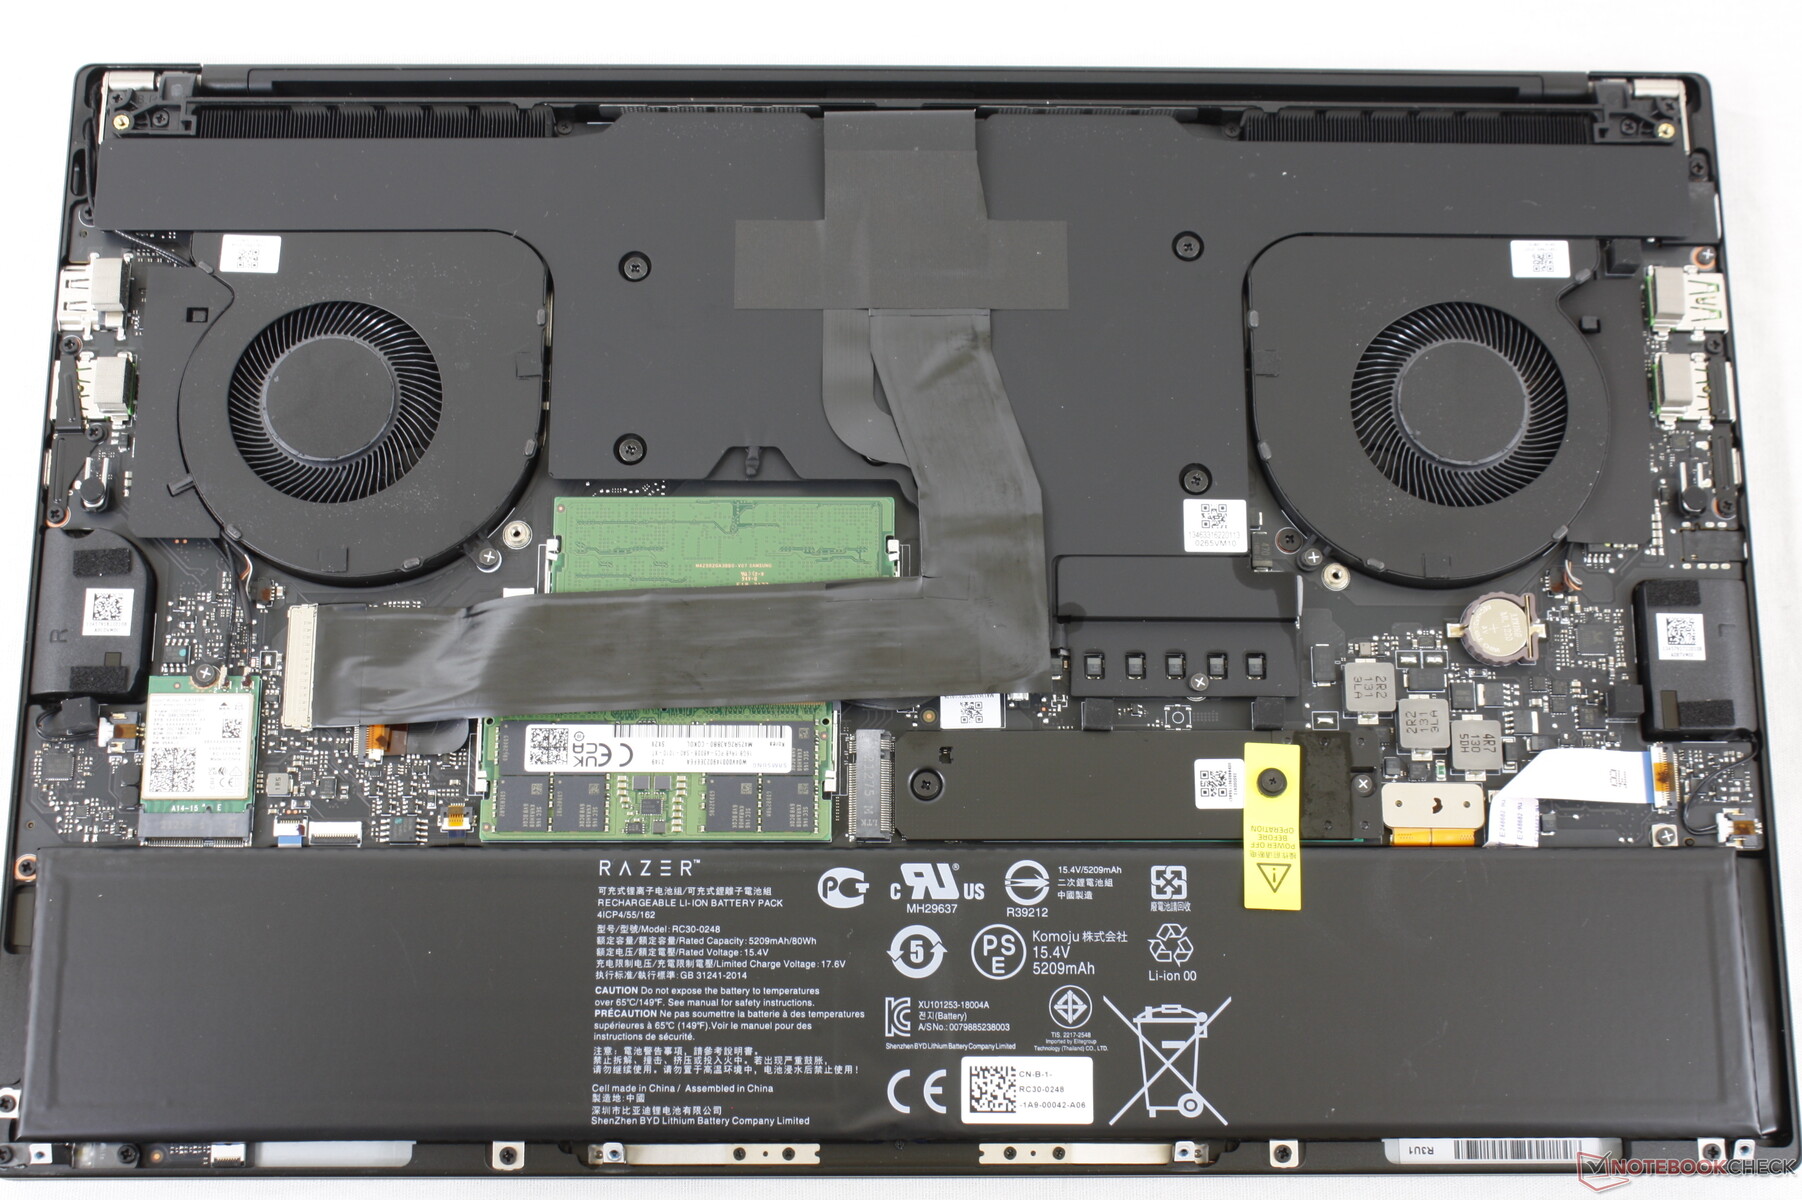
Det finns mindre förändringar i de interna delarna och fläktarna jämfört med förra årets modell, vilket visas nedan. De 2x M.2 2280 PCIe4-platser, 2x SODIMM-platser och den avtagbara WLAN-modulen finns kvar.
Tillbehör och garanti
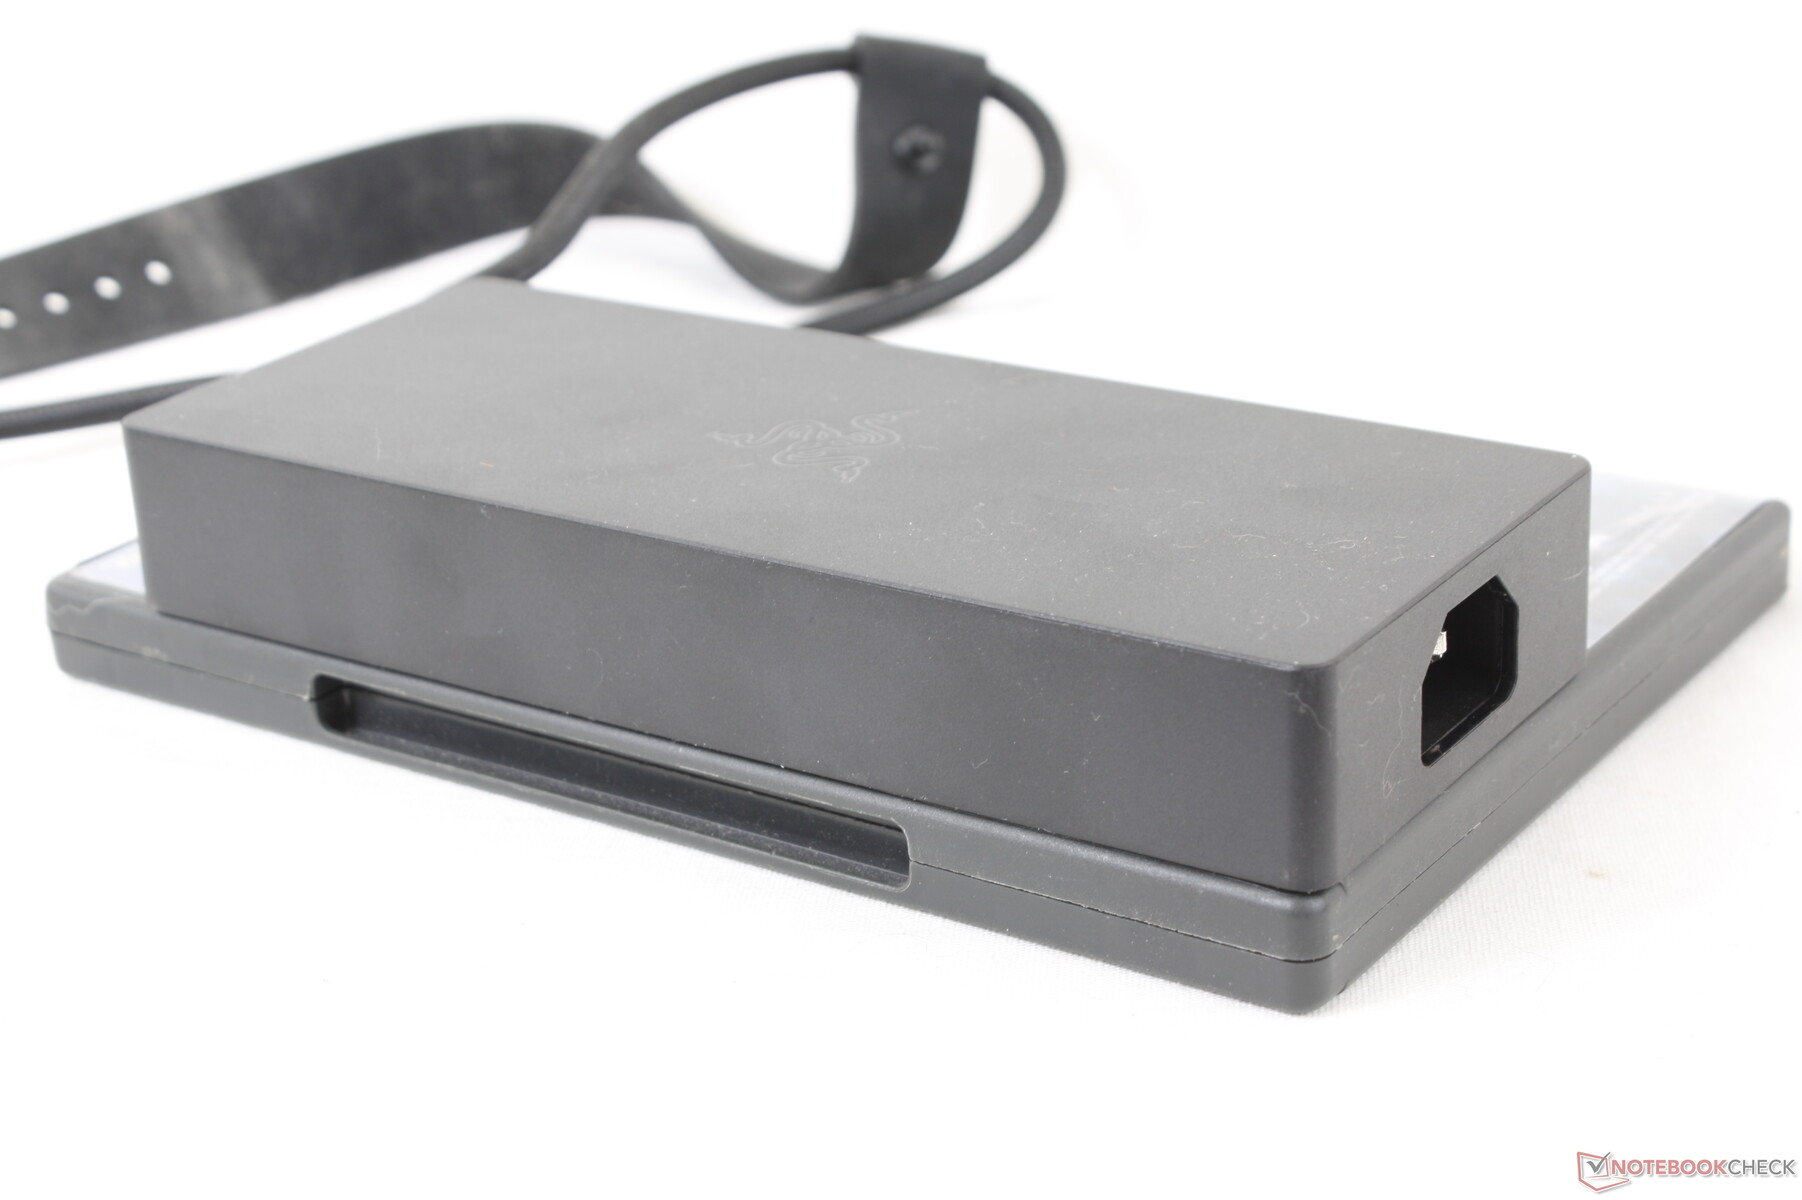
Det finns inget extra i lådan förutom nätadapter och papper.
En basgaranti på ett år och en batterigaranti på två år ingår i varje nytt köp av en 12:e generationens Blade-modell. Observera dock att den tvååriga batterigarantin för närvarande inte gäller för äldre Blade-modeller.
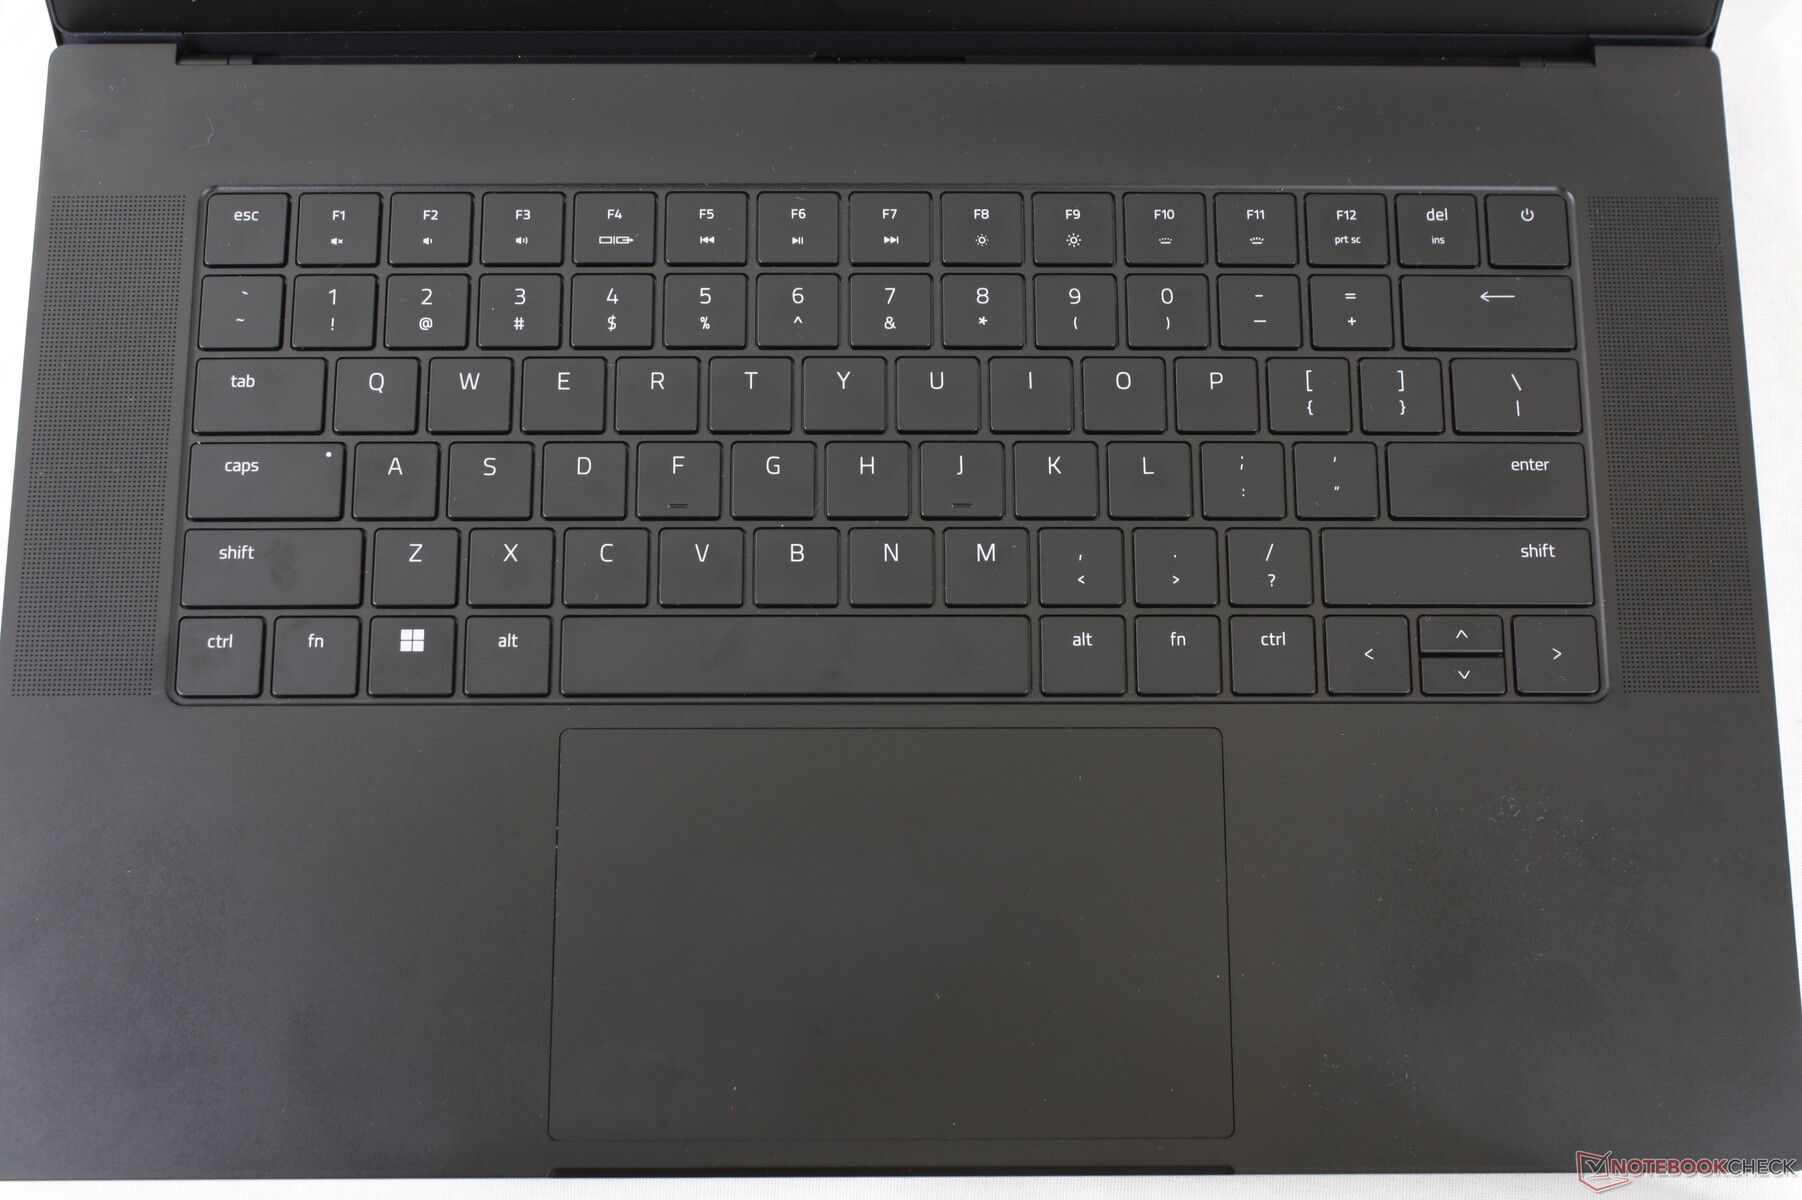
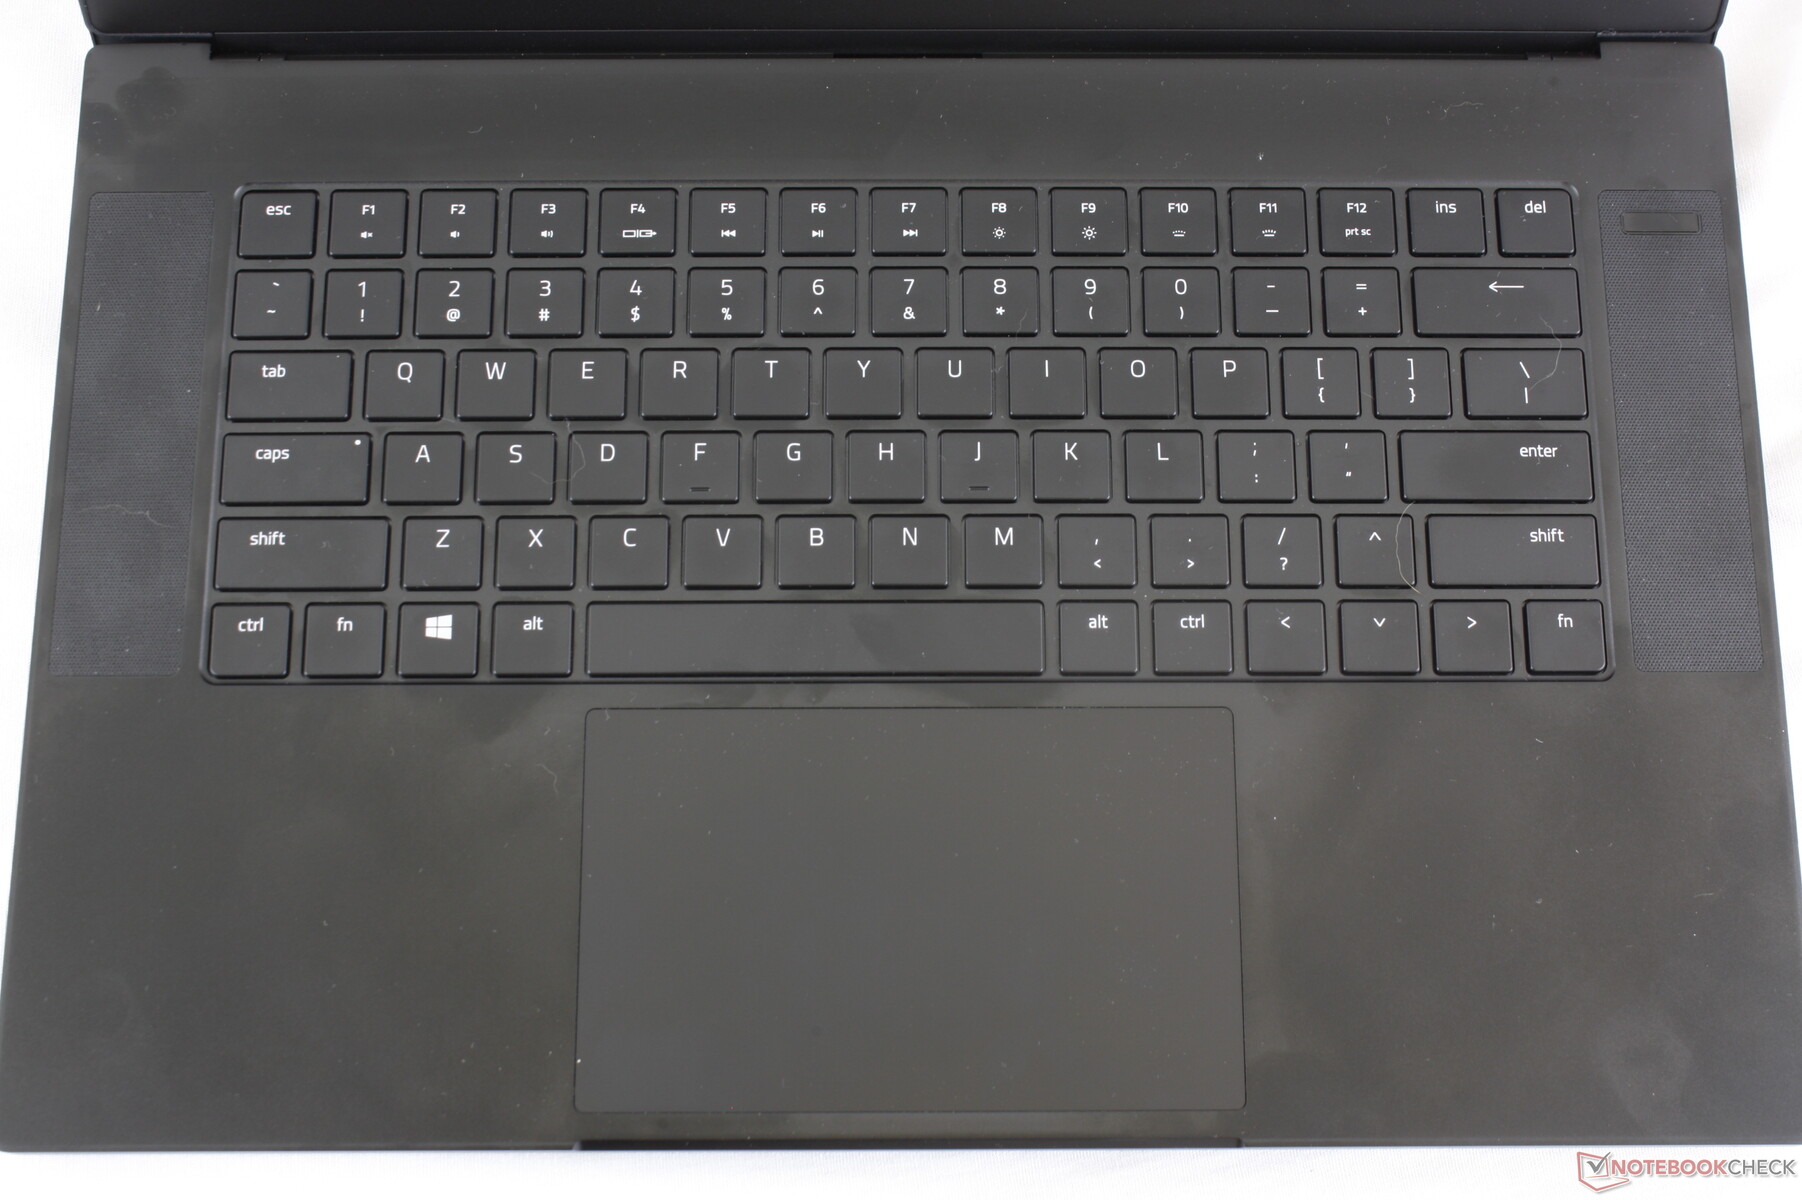
Inmatningsenheter
Även om den stora klickplattan är densamma har Razer uppgraderat tangentbordet på 2022 Blade 15 med något större tangentkapslar än på tidigare generationer av modeller för att minska antalet skrivfel. Följaktligen har utrymmet mellan varje tangent minskats. Rörelser och återkoppling är annars identiska från år till år.
Skärm
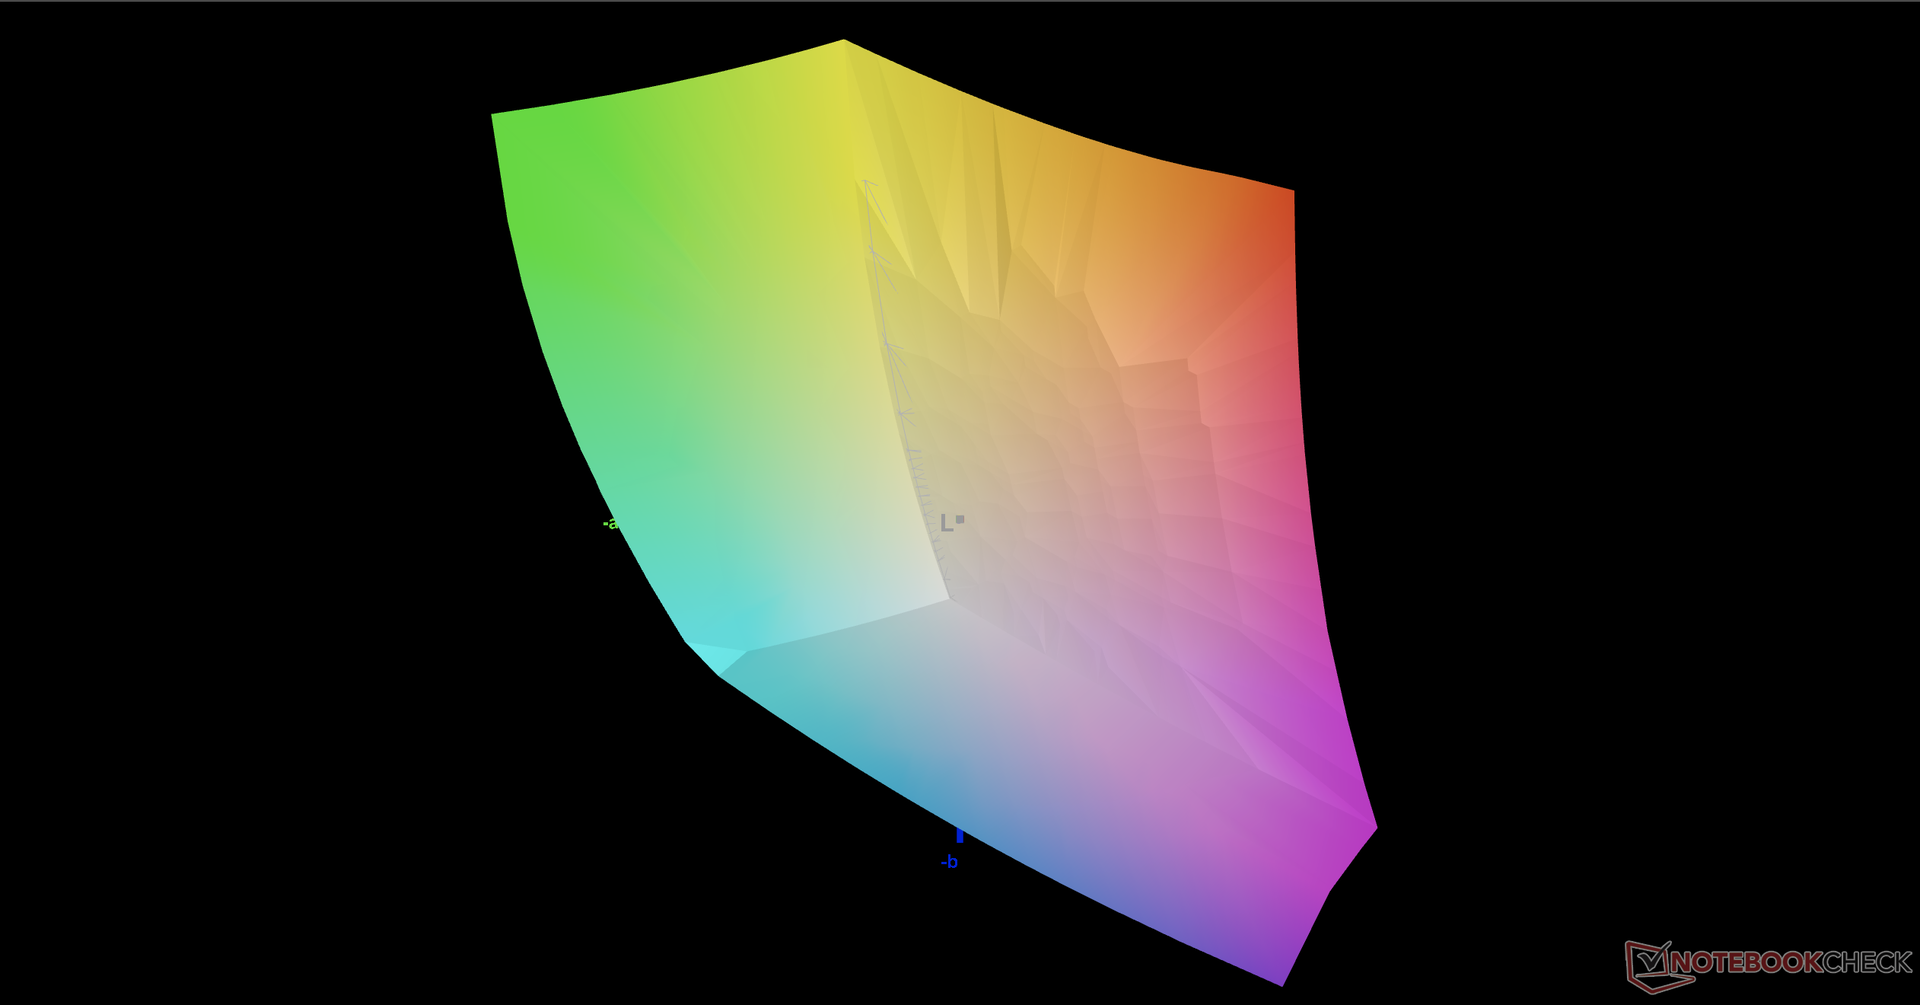
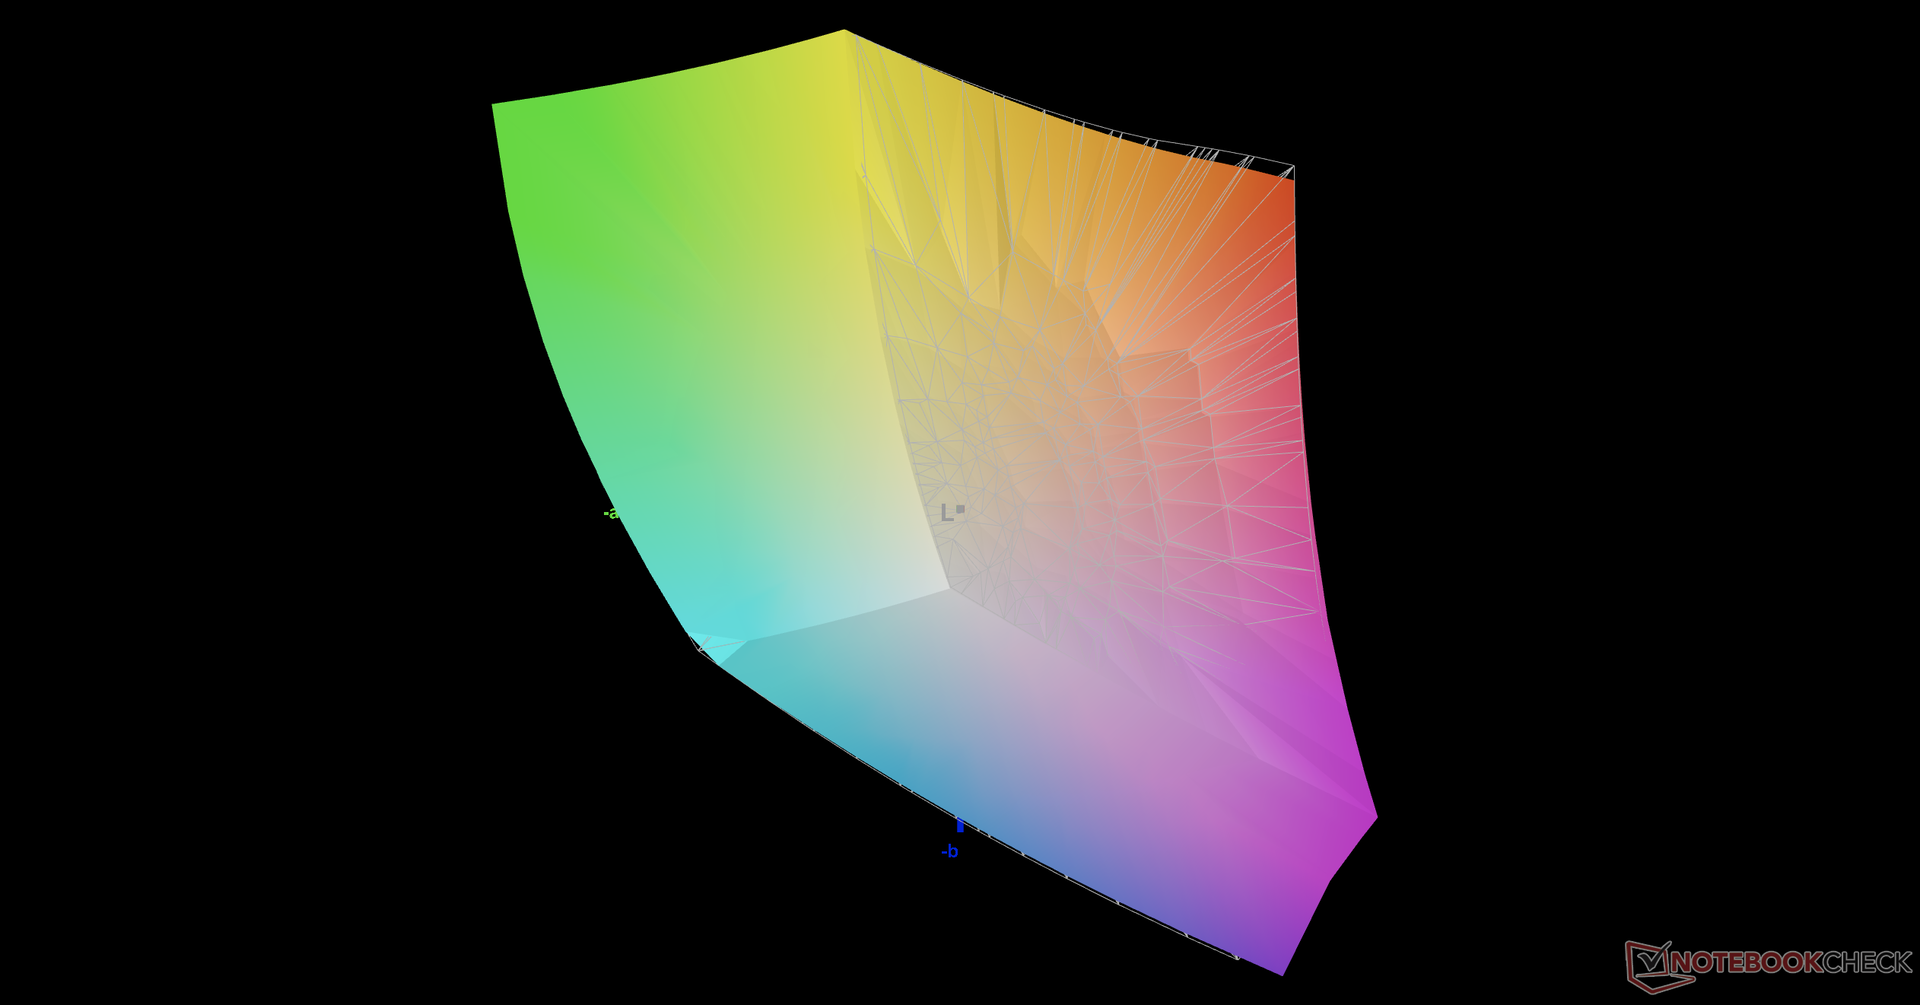
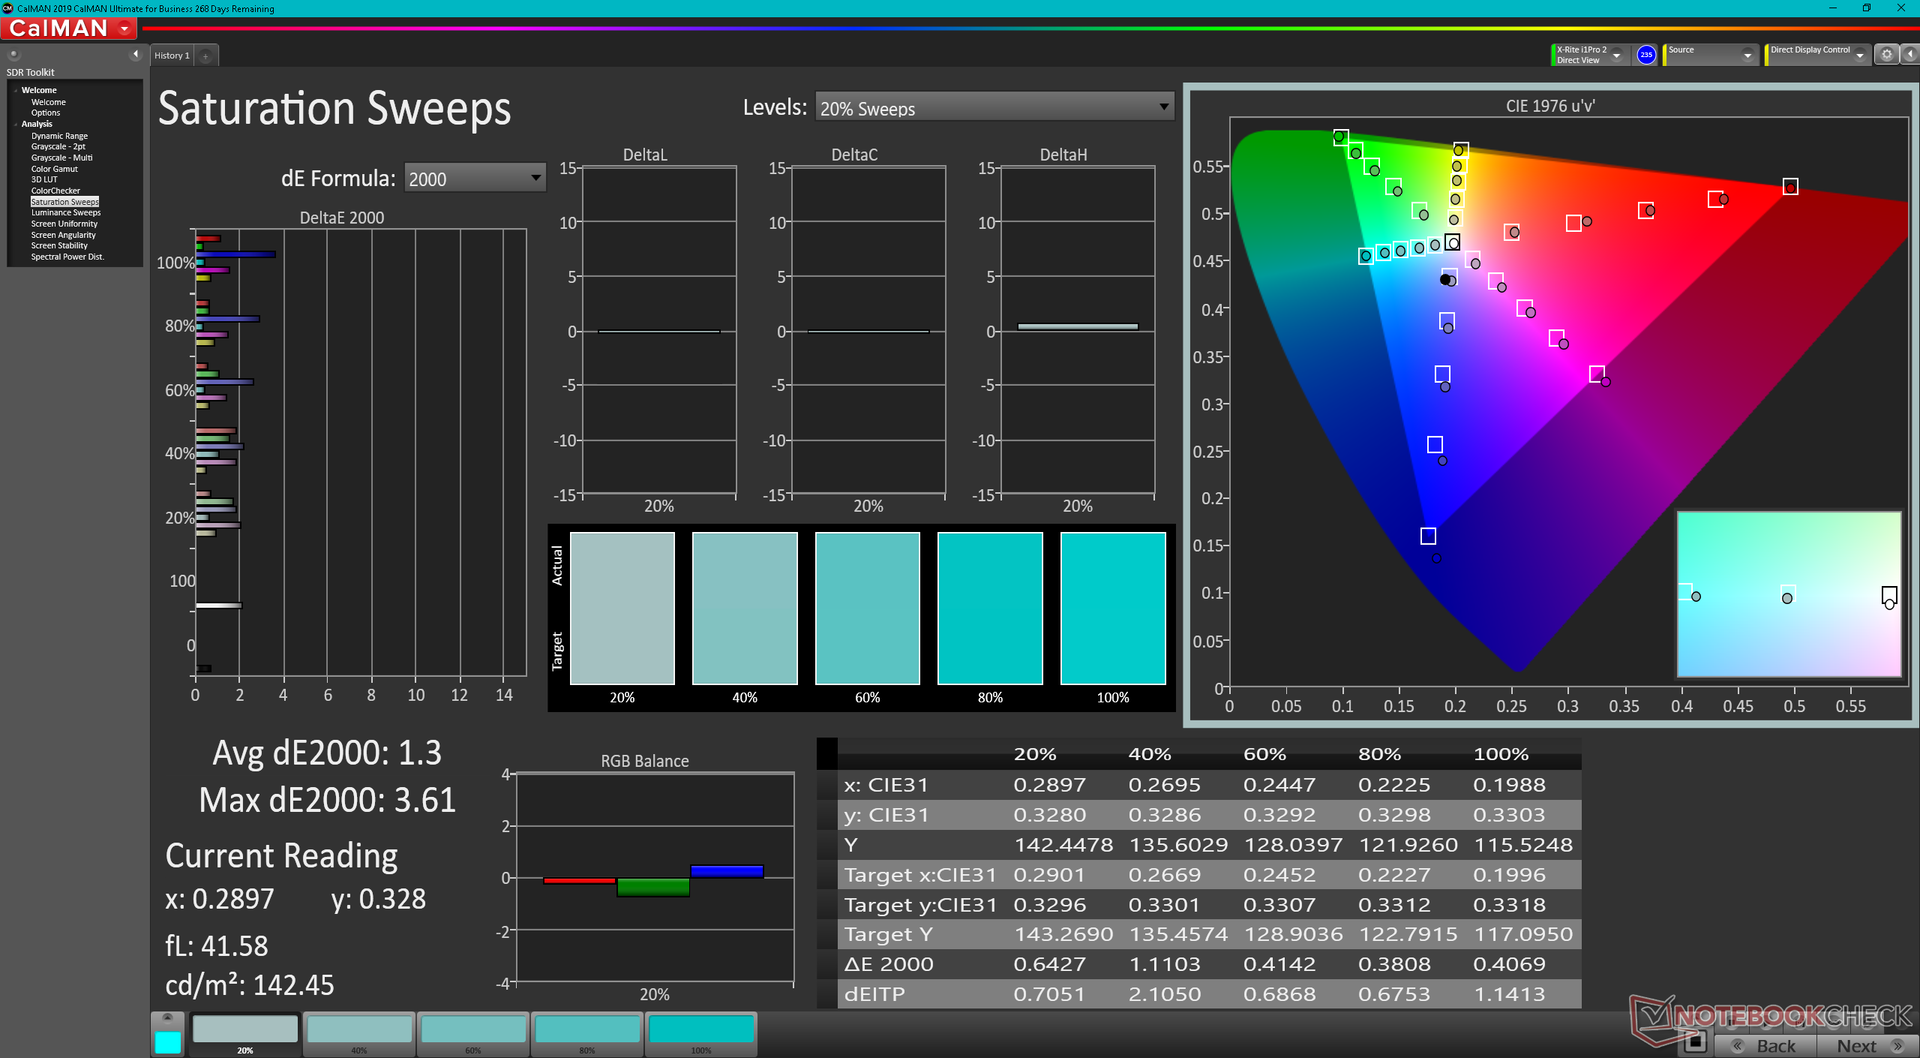
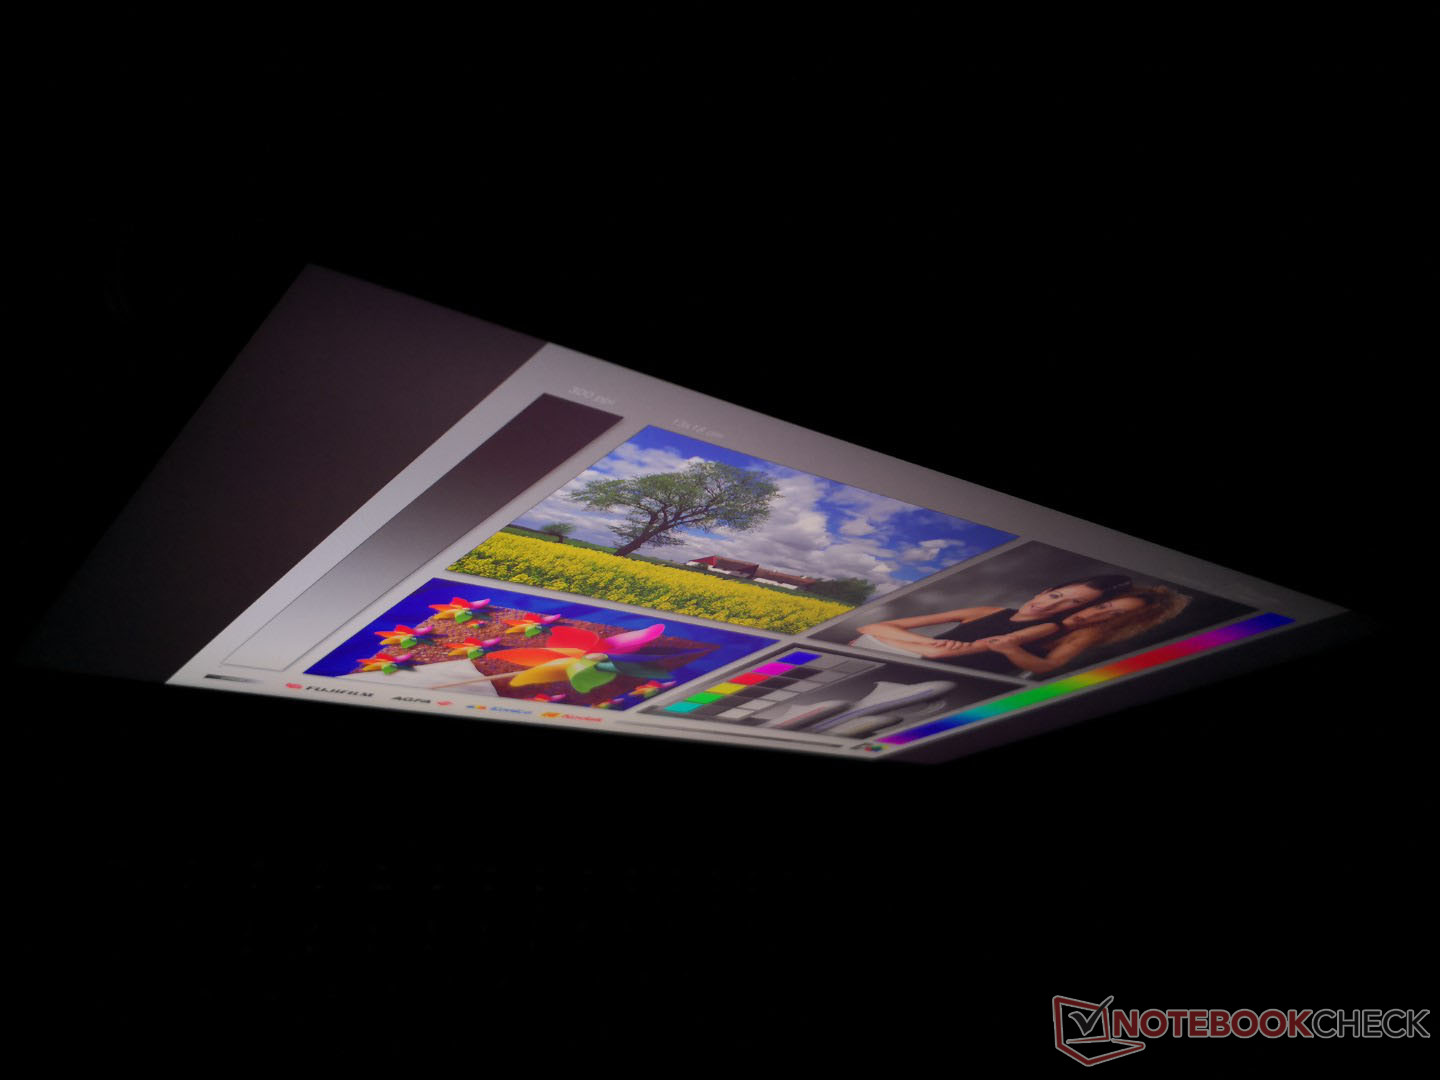
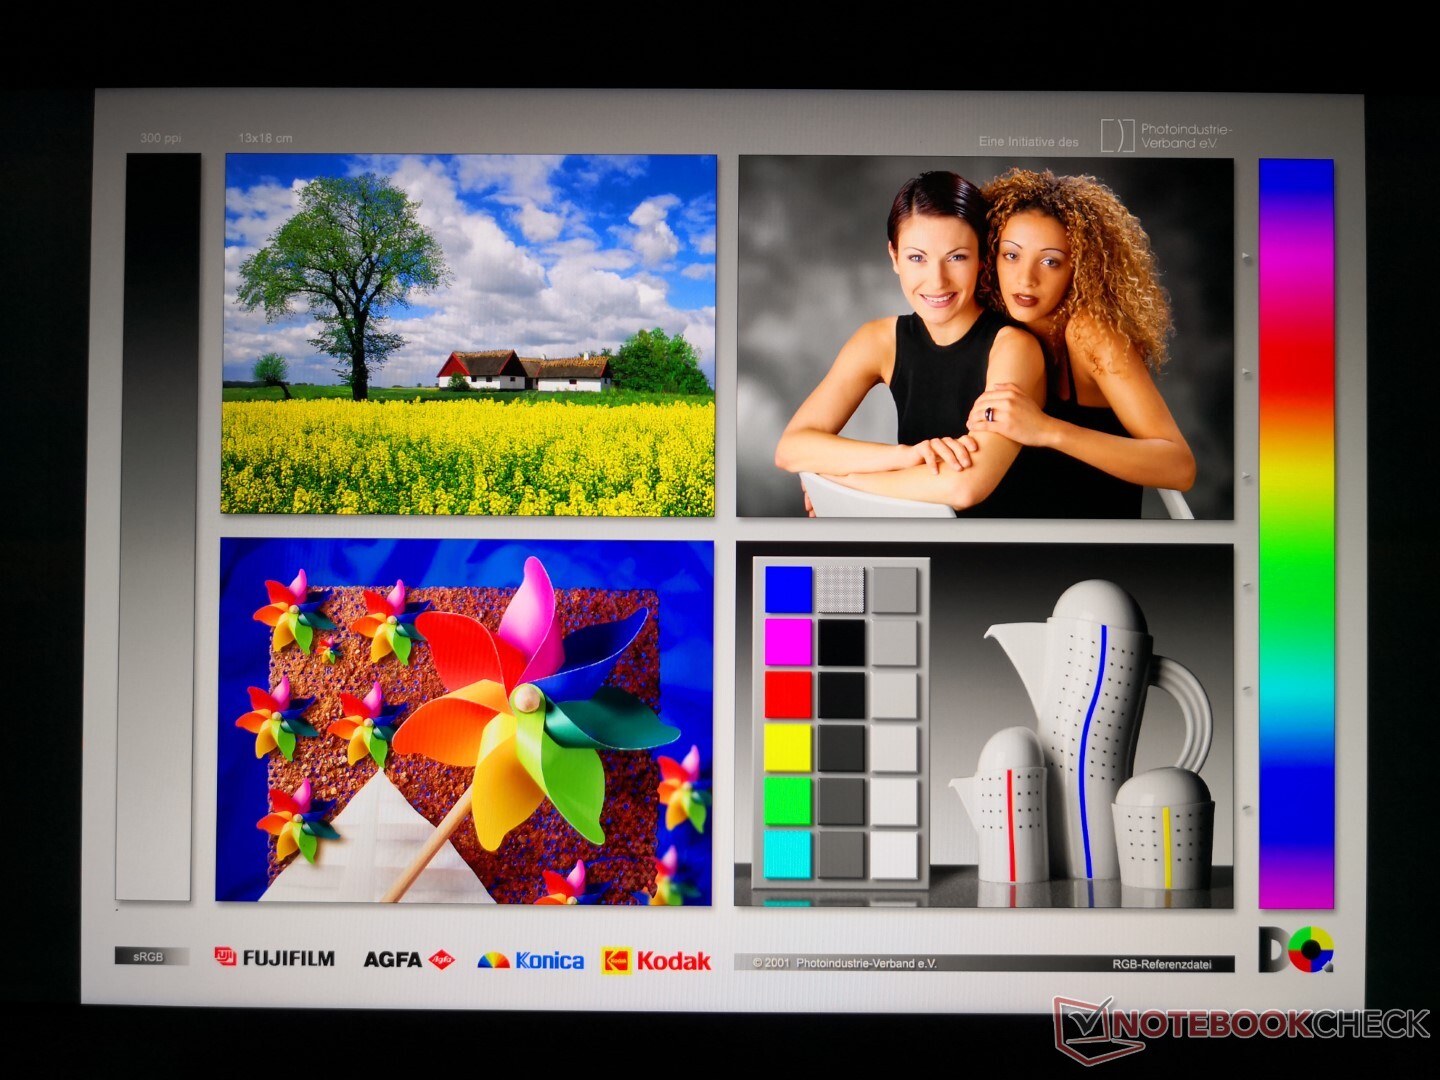
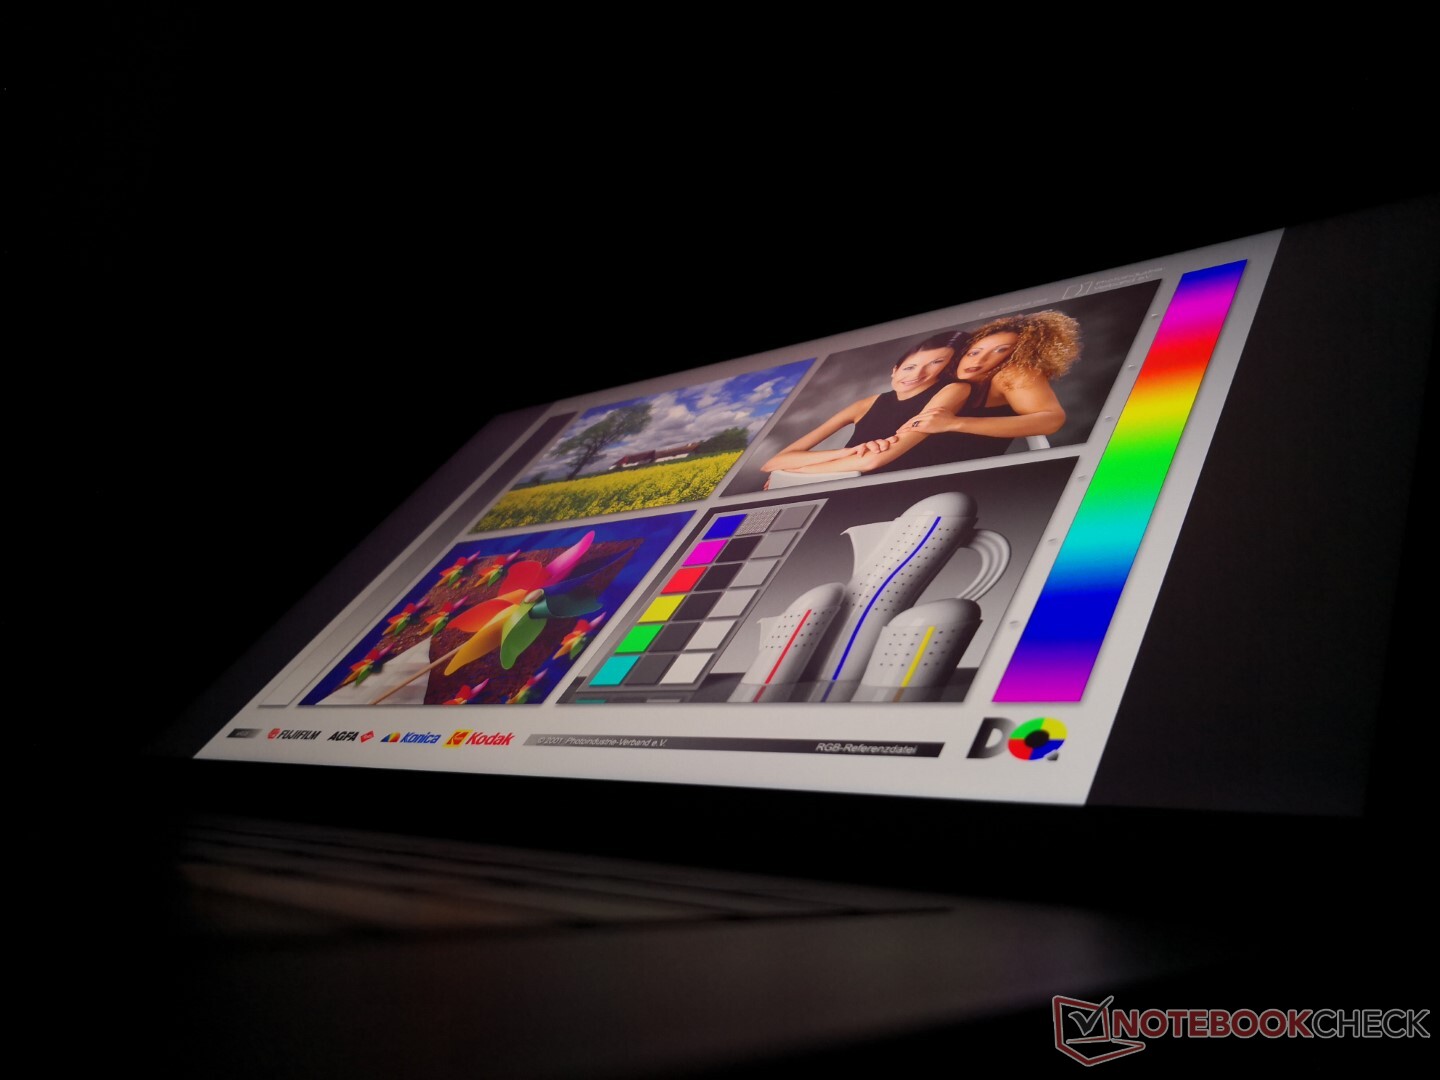
Blade 15 är en av de få bärbara 15,6-tumsdatorer som har en 240 Hz 1440p-panel som täcker hela DCI-P3-standarden. Den 165 Hz 1440p-panelen på Xenia 15täcker till exempel hela sRGB men bara 68 procent av P3. Svarstiderna för svartvitt och grått är också mycket bra vilket innebär att den här panelen kan användas för både spel och digital redigering. Tidigare år hade Blade 15-ägare varit tvungna att nöja sig med 4K UHD-alternativ i stället för att få full DCI-P3-täckning.

| |||||||||||||||||||||||||
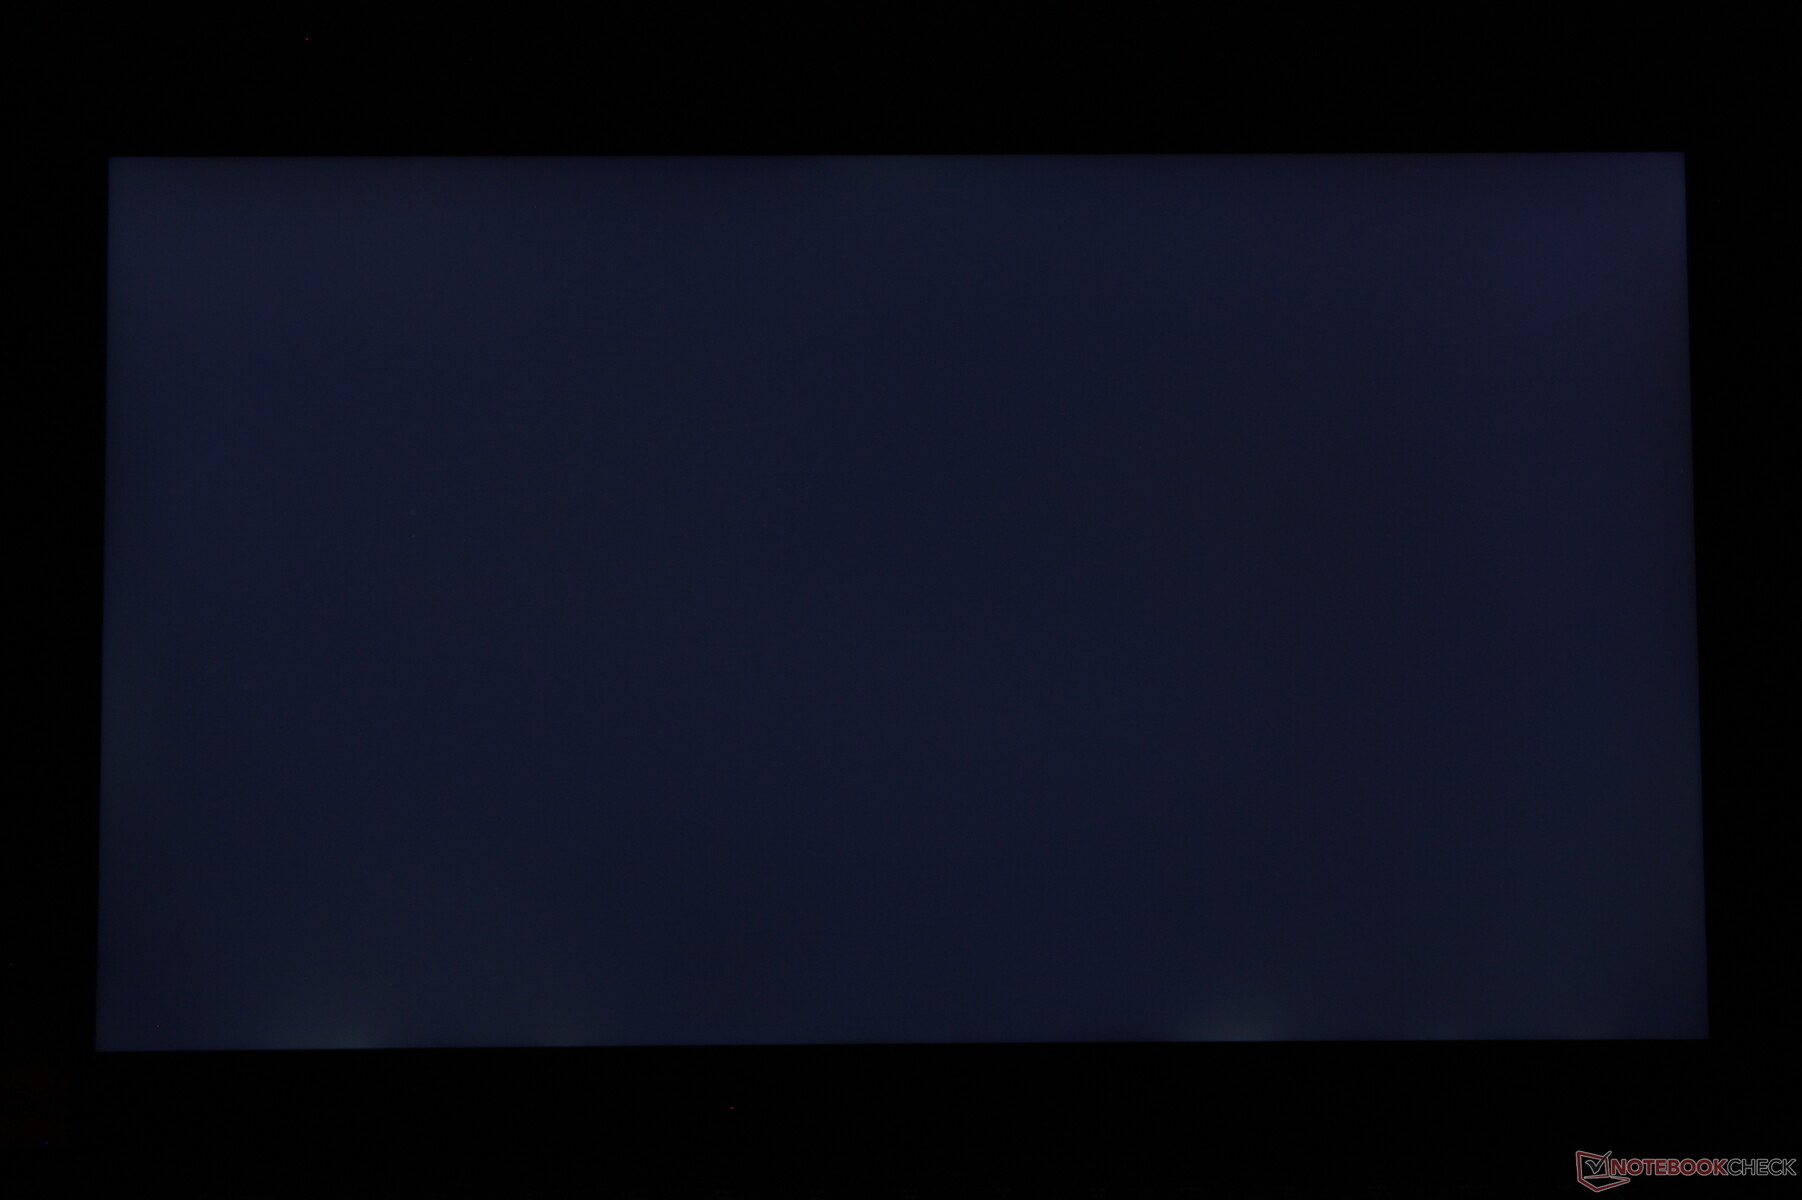
Distribution av ljusstyrkan: 89 %
Mitt på batteriet: 286 cd/m²
Kontrast: 1144:1 (Svärta: 0.25 cd/m²)
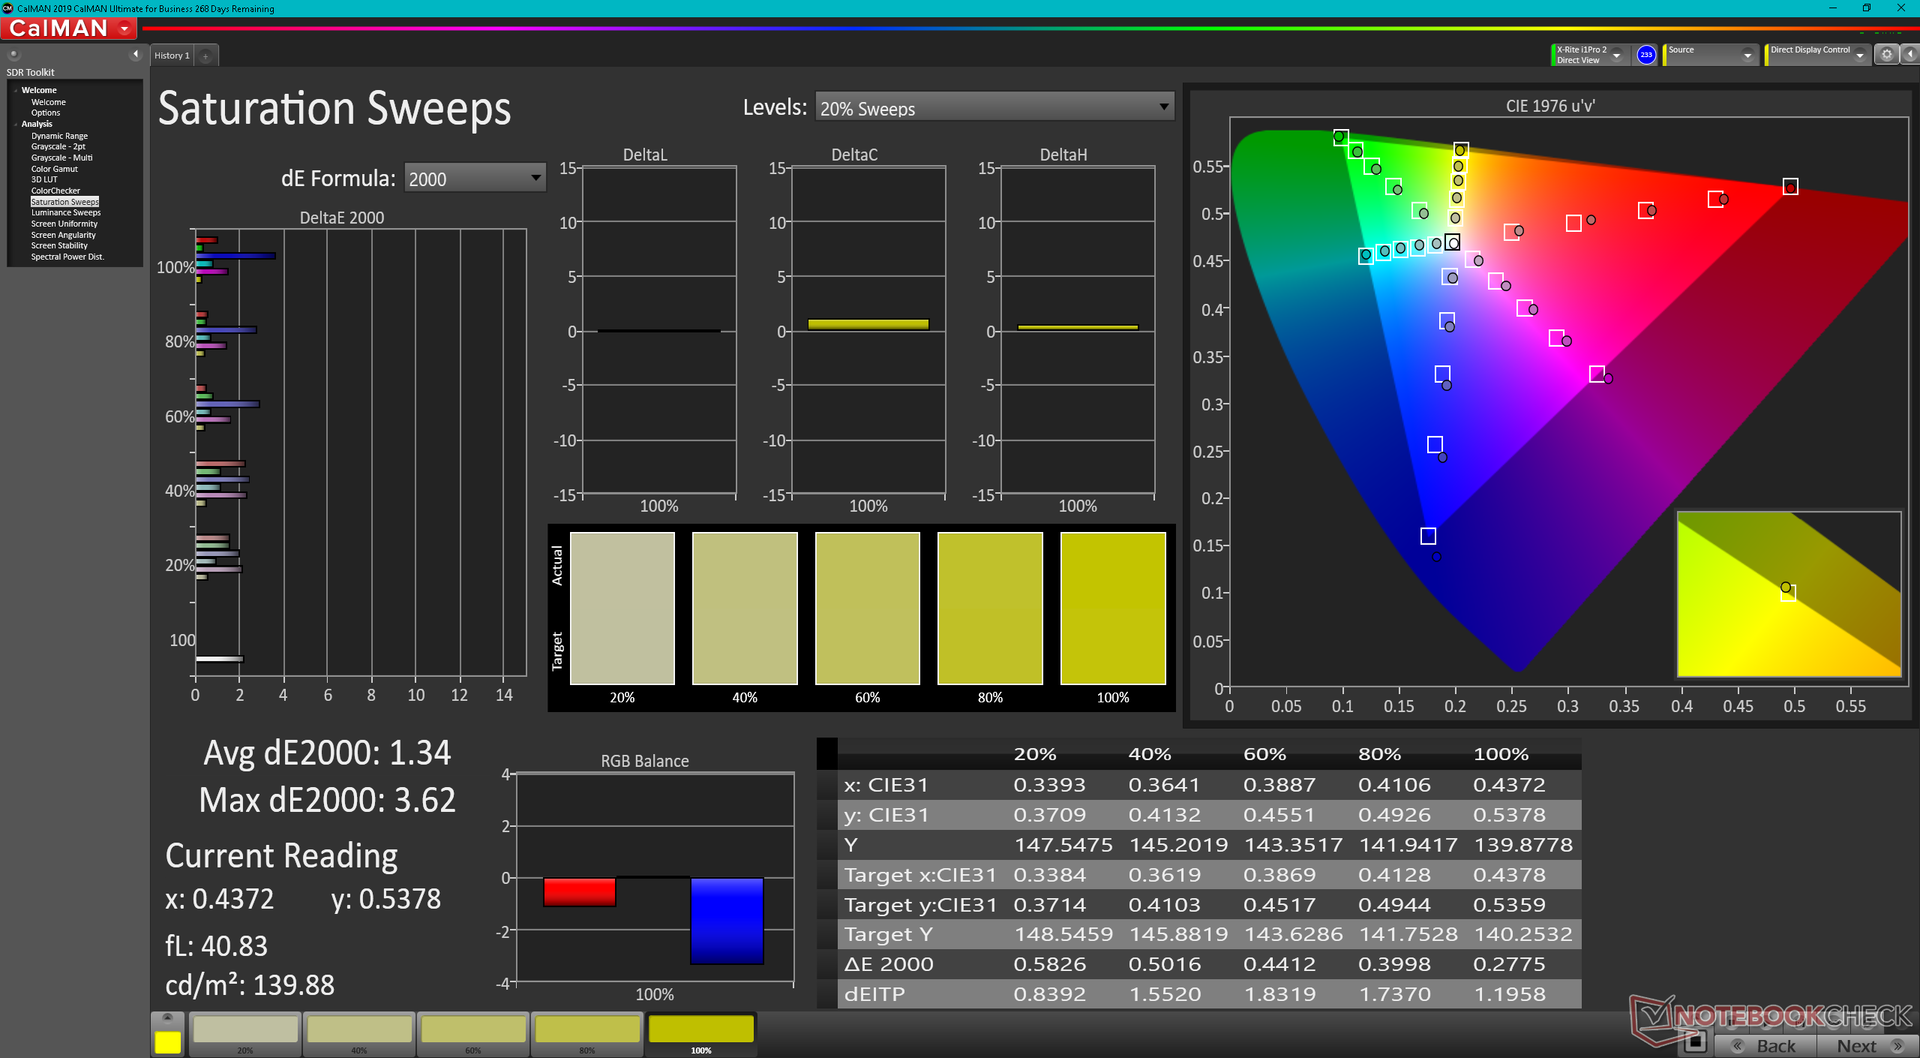
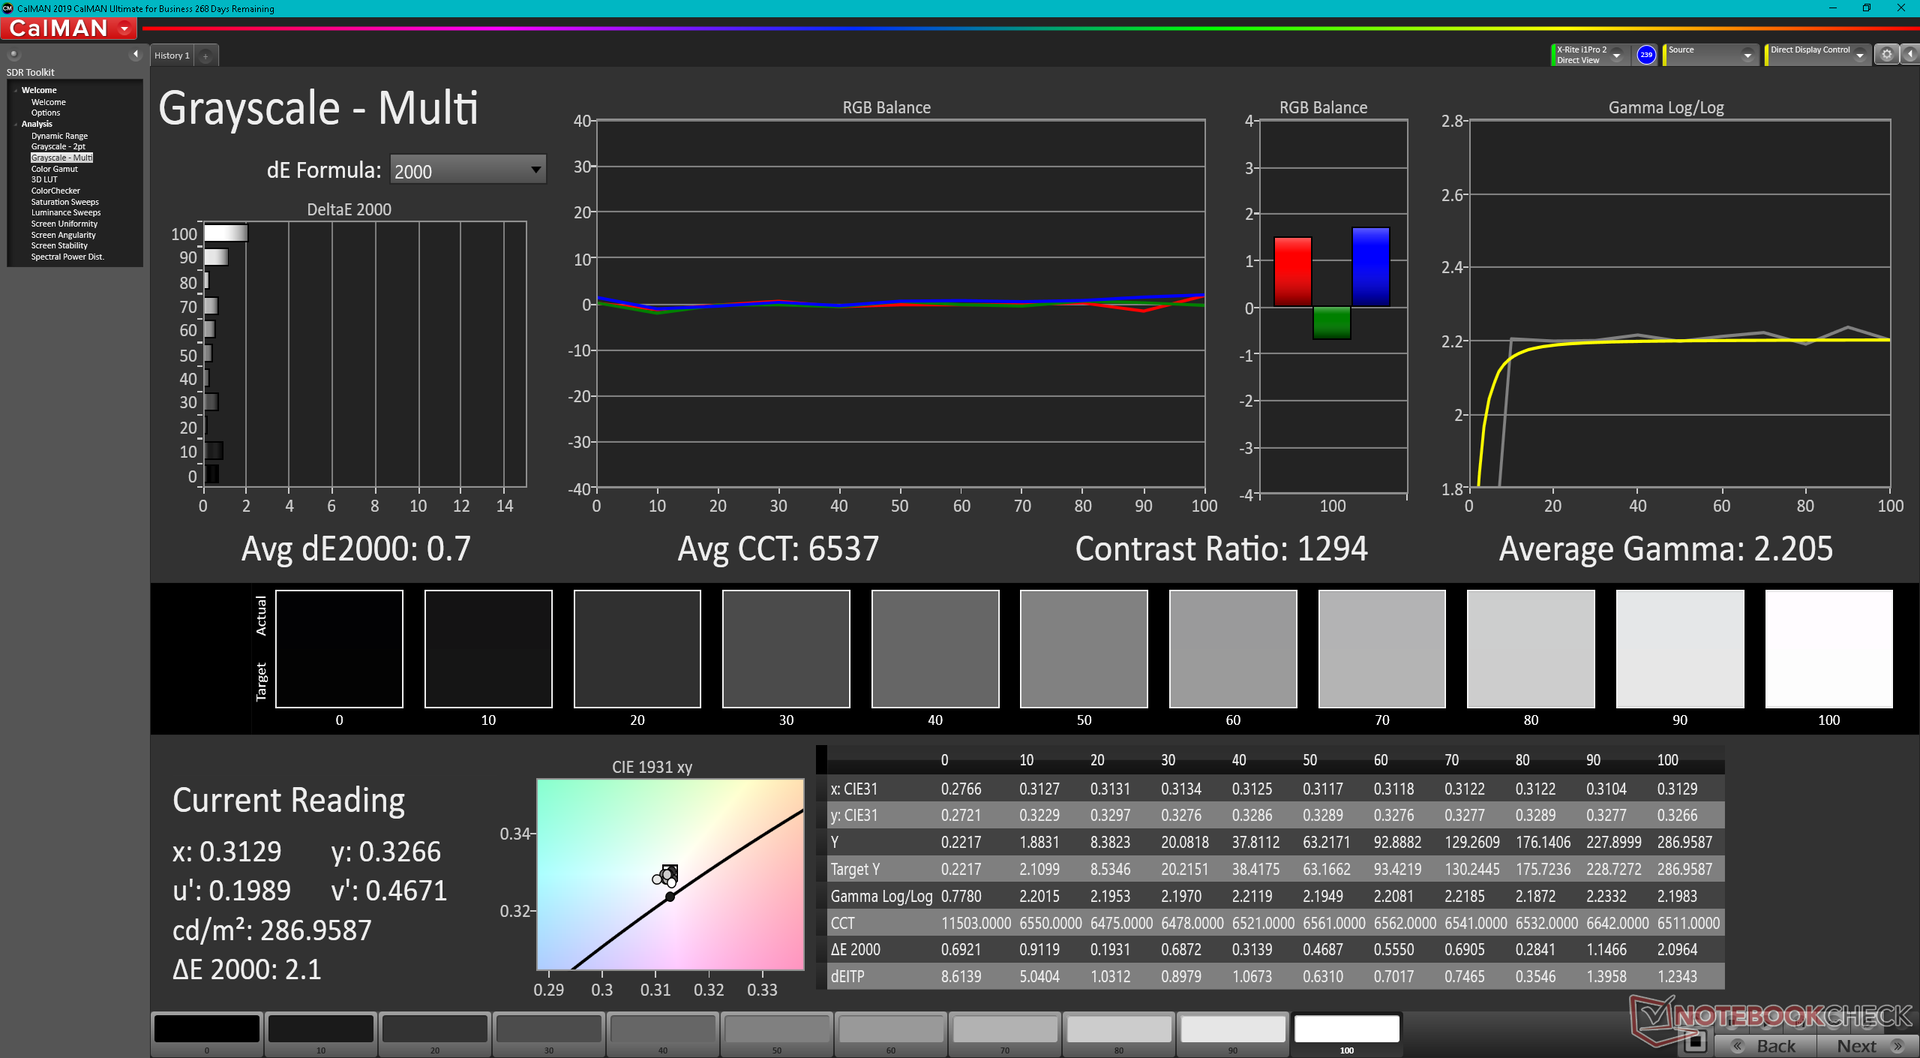
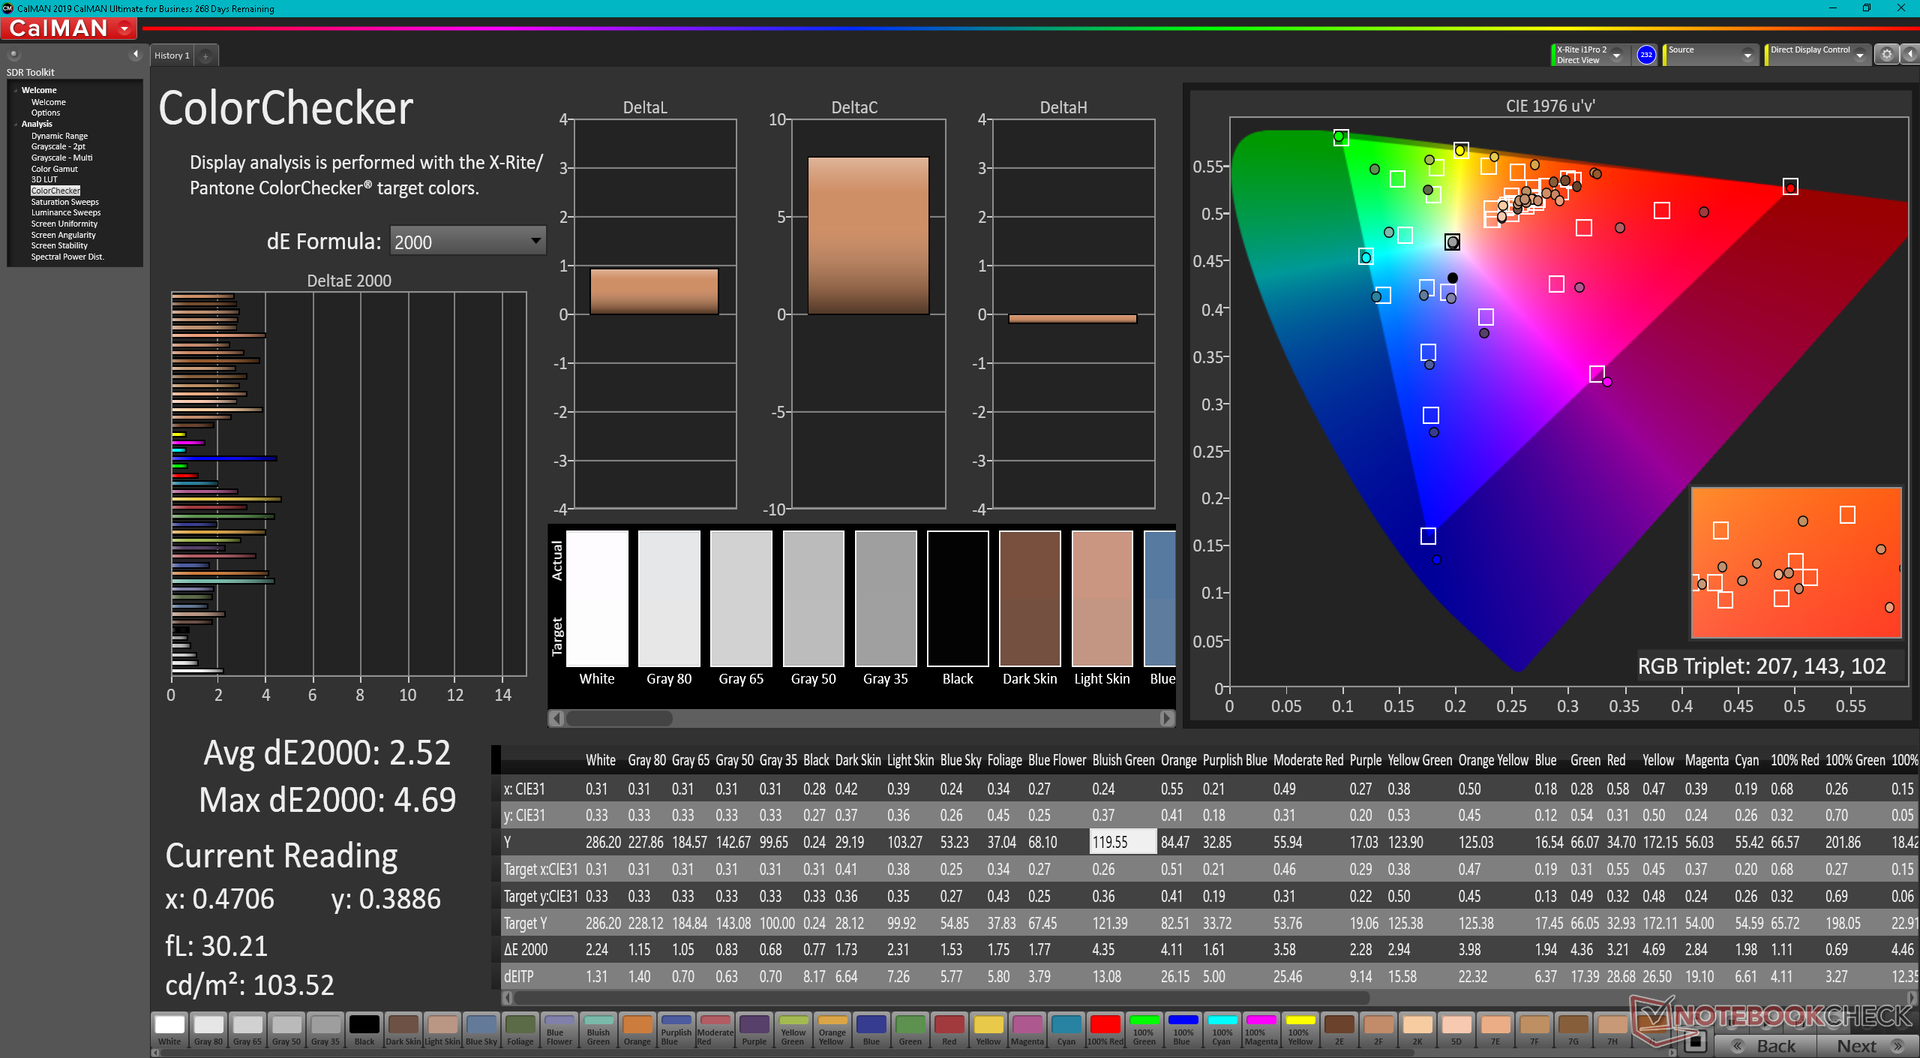
ΔE ColorChecker Calman: 2.74 | ∀{0.5-29.43 Ø4.71}
calibrated: 2.52
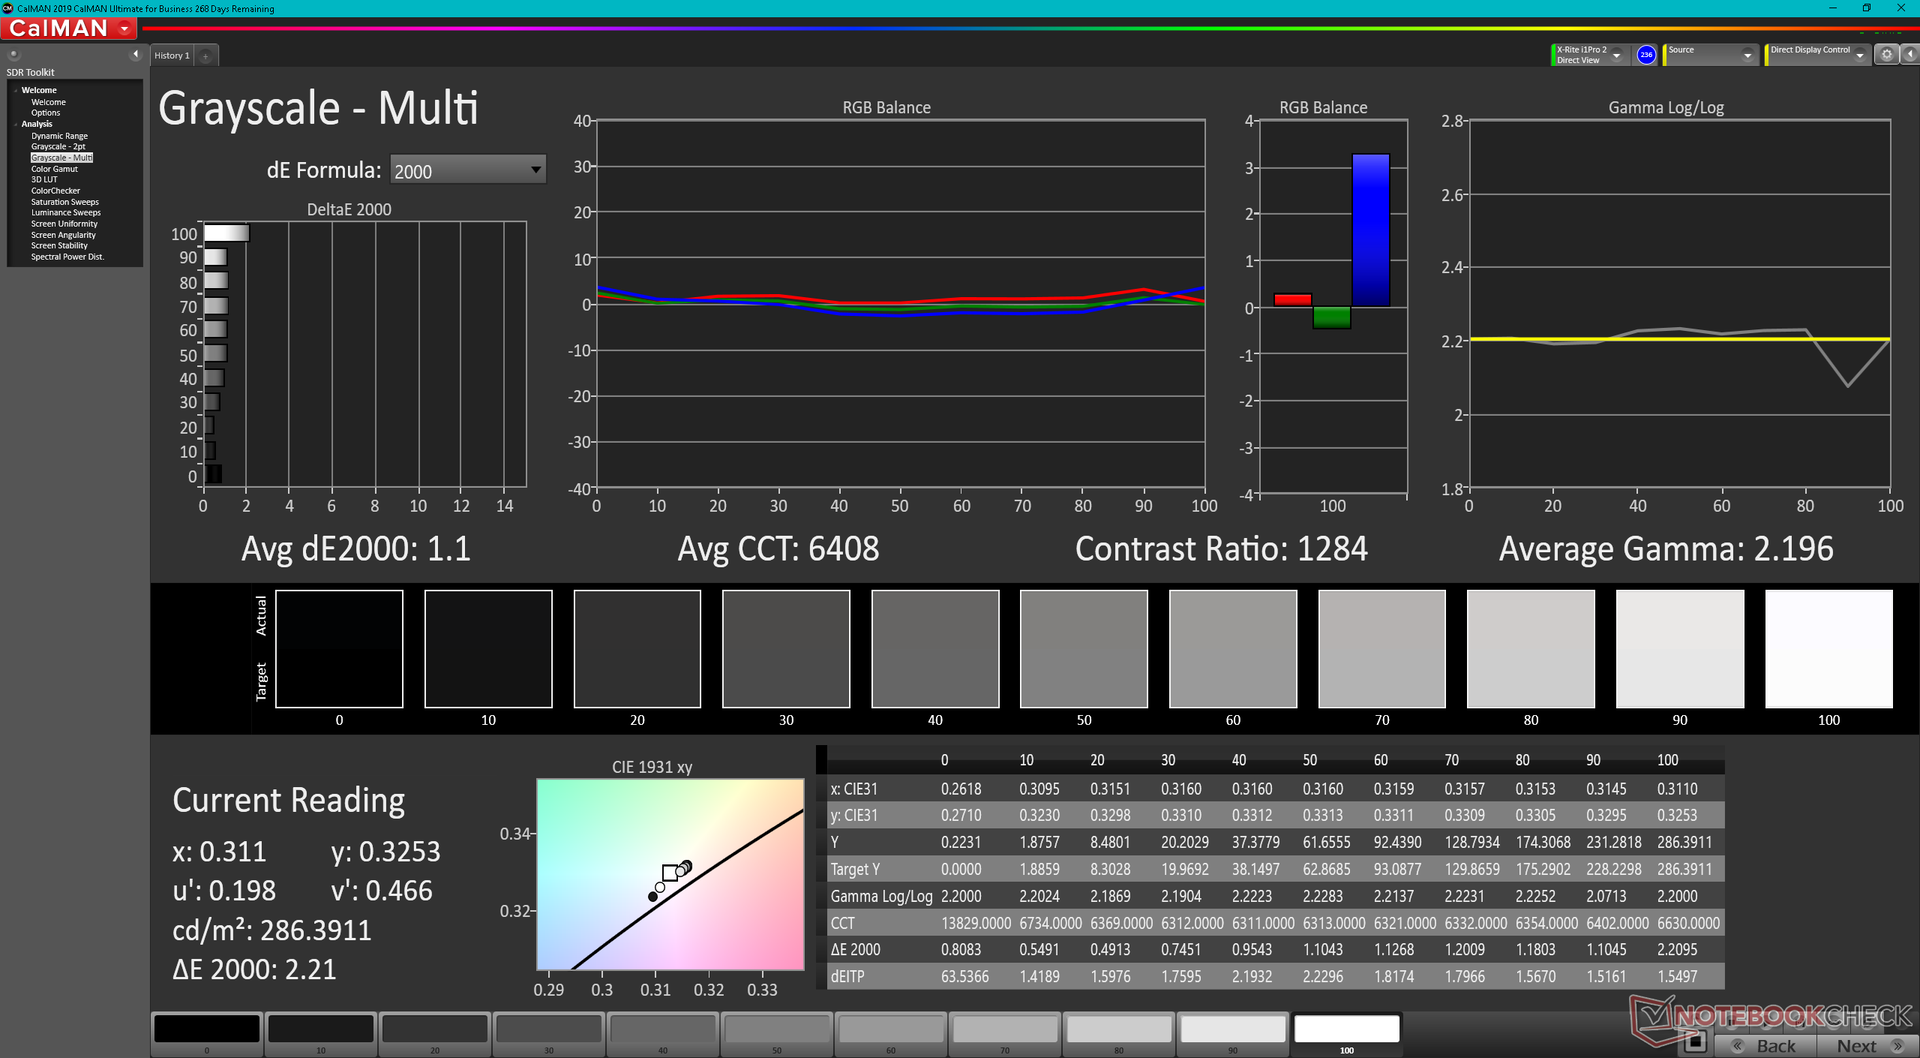
ΔE Greyscale Calman: 1.1 | ∀{0.09-98 Ø4.96}
86.8% AdobeRGB 1998 (Argyll 3D)
99.9% sRGB (Argyll 3D)
99.1% Display P3 (Argyll 3D)
Gamma: 2.2
CCT: 6408 K
| Razer Blade 15 2022 Sharp LQ156T1JW03, IPS, 2560x1440, 15.6" | Razer Blade 15 Advanced Model Early 2021 TL156VDXP02-0, IPS, 1920x1080, 15.6" | Razer Blade 15 RTX 2080 Super Max-Q AU Optronics B156HAN12.0, IPS, 1920x1080, 15.6" | Schenker XMG Neo 15 E22 (Early 2022, RTX 3080 Ti) BOE0A67 (BOE CQ NE156QHM-NZ1), IPS, 2560x1440, 15.6" | ADATA XPG Xenia 15 BOE CQ NE156QHM-NY2, IPS, 2560x1440, 15.6" | Eurocom Nightsky ARX315 Sharp LQ156M1JW03, IPS, 1920x1080, 15.6" | |
|---|---|---|---|---|---|---|
| Display | -20% | -16% | -18% | -15% | ||
| Display P3 Coverage (%) | 99.1 | 65.9 -34% | 70.2 -29% | 68.2 -31% | 67.9 -31% | |
| sRGB Coverage (%) | 99.9 | 96.4 -4% | 99 -1% | 98.1 -2% | 99.7 0% | |
| AdobeRGB 1998 Coverage (%) | 86.8 | 68 -22% | 71.4 -18% | 69.1 -20% | 73.7 -15% | |
| Response Times | -1% | 40% | 4% | 2% | -2% | |
| Response Time Grey 50% / Grey 80% * (ms) | 14.4 ? | 16 ? -11% | 6 ? 58% | 14.4 ? -0% | 13.6 ? 6% | 15.2 ? -6% |
| Response Time Black / White * (ms) | 11.6 ? | 10.4 ? 10% | 9 ? 22% | 10.8 ? 7% | 12 ? -3% | 11.2 ? 3% |
| PWM Frequency (Hz) | 23150 ? | |||||
| Screen | 20% | -6% | -28% | -62% | -38% | |
| Brightness middle (cd/m²) | 286 | 338 18% | 347 21% | 295 3% | 321.1 12% | 312.8 9% |
| Brightness (cd/m²) | 271 | 334 23% | 328 21% | 277 2% | 308 14% | 294 8% |
| Brightness Distribution (%) | 89 | 94 6% | 89 0% | 62 -30% | 82 -8% | 90 1% |
| Black Level * (cd/m²) | 0.25 | 0.24 4% | 0.285 -14% | 0.28 -12% | 0.38 -52% | 0.28 -12% |
| Contrast (:1) | 1144 | 1408 23% | 1218 6% | 1054 -8% | 845 -26% | 1117 -2% |
| Colorchecker dE 2000 * | 2.74 | 1.39 49% | 2.35 14% | 2.36 14% | 3.21 -17% | 2.96 -8% |
| Colorchecker dE 2000 max. * | 5.21 | 3.31 36% | 4.15 20% | 4.24 19% | 10.56 -103% | 6.23 -20% |
| Colorchecker dE 2000 calibrated * | 2.52 | 0.97 62% | 1.16 54% | 1.53 39% | ||
| Greyscale dE 2000 * | 1.1 | 1.6 -45% | 3.04 -176% | 3.43 -212% | 5.7 -418% | 4.2 -282% |
| Gamma | 2.2 100% | 2.291 96% | 2.35 94% | 2.44 90% | 2.09 105% | 2.32 95% |
| CCT | 6408 101% | 6626 98% | 6658 98% | 6266 104% | 7194 90% | 7145 91% |
| Color Space (Percent of AdobeRGB 1998) (%) | 68 | 65 | ||||
| Color Space (Percent of sRGB) (%) | 89 | 99 | ||||
| Totalt genomsnitt (program/inställningar) | -0% /
8% | 6% /
-2% | -12% /
-22% | -26% /
-44% | -18% /
-27% |
* ... mindre är bättre
Skärmen är välkalibrerad direkt från förpackningen med genomsnittliga DeltaE-värden för gråskala och färg på bara 1,1 respektive 2,74 enligt DCI-P3-standarden. Razer säger att de kalibrerar varje panel individuellt på fabriken och våra oberoende mätningar med en X-Rite-kolorimeter kan bekräfta de korrekta färgerna och gråskalan.

Visa svarstider
| ↔ Svarstid svart till vitt | ||
|---|---|---|
| 11.6 ms ... stiga ↗ och falla ↘ kombinerat | ↗ 5.6 ms stiga | 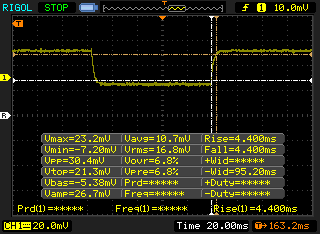 |
| ↘ 6 ms hösten | ||
| Skärmen visar bra svarsfrekvens i våra tester, men kan vara för långsam för konkurrenskraftiga spelare. I jämförelse sträcker sig alla testade enheter från 0.1 (minst) till 240 (maximalt) ms. » 31 % av alla enheter är bättre. Det betyder att den uppmätta svarstiden är bättre än genomsnittet av alla testade enheter (19.8 ms). | ||
| ↔ Svarstid 50 % grått till 80 % grått | ||
| 14.4 ms ... stiga ↗ och falla ↘ kombinerat | ↗ 6.8 ms stiga | 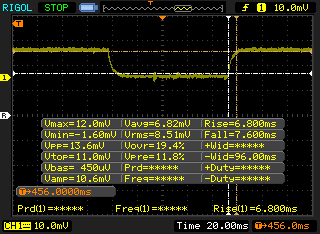 |
| ↘ 7.6 ms hösten | ||
| Skärmen visar bra svarsfrekvens i våra tester, men kan vara för långsam för konkurrenskraftiga spelare. I jämförelse sträcker sig alla testade enheter från 0.165 (minst) till 636 (maximalt) ms. » 28 % av alla enheter är bättre. Det betyder att den uppmätta svarstiden är bättre än genomsnittet av alla testade enheter (31 ms). | ||
Skärmflimmer / PWM (Puls-Width Modulation)
| Skärmflimmer / PWM upptäcktes inte | 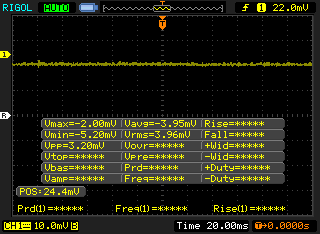 | ||
Som jämförelse: 52 % av alla testade enheter använder inte PWM för att dämpa skärmen. Om PWM upptäcktes mättes ett medelvärde av 7754 (minst: 5 - maximum: 343500) Hz. | |||
Prestanda
Provningsförhållanden
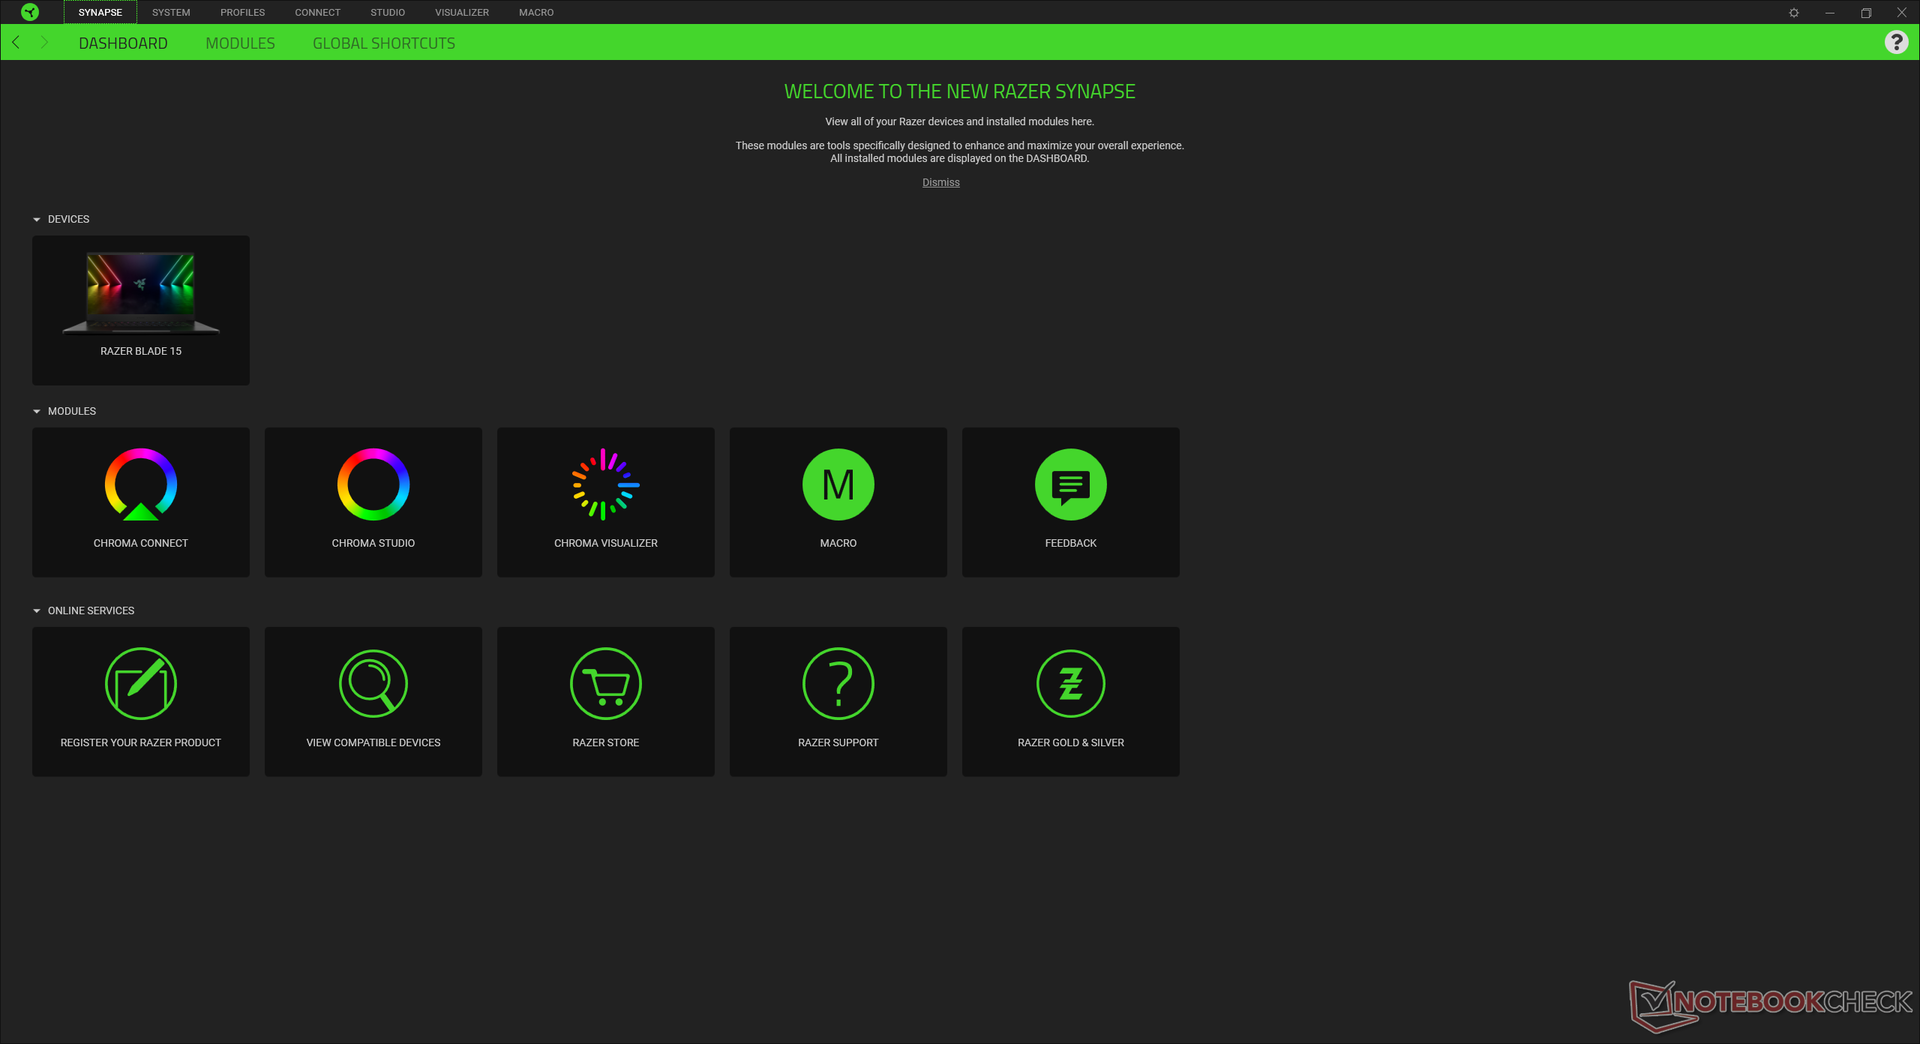
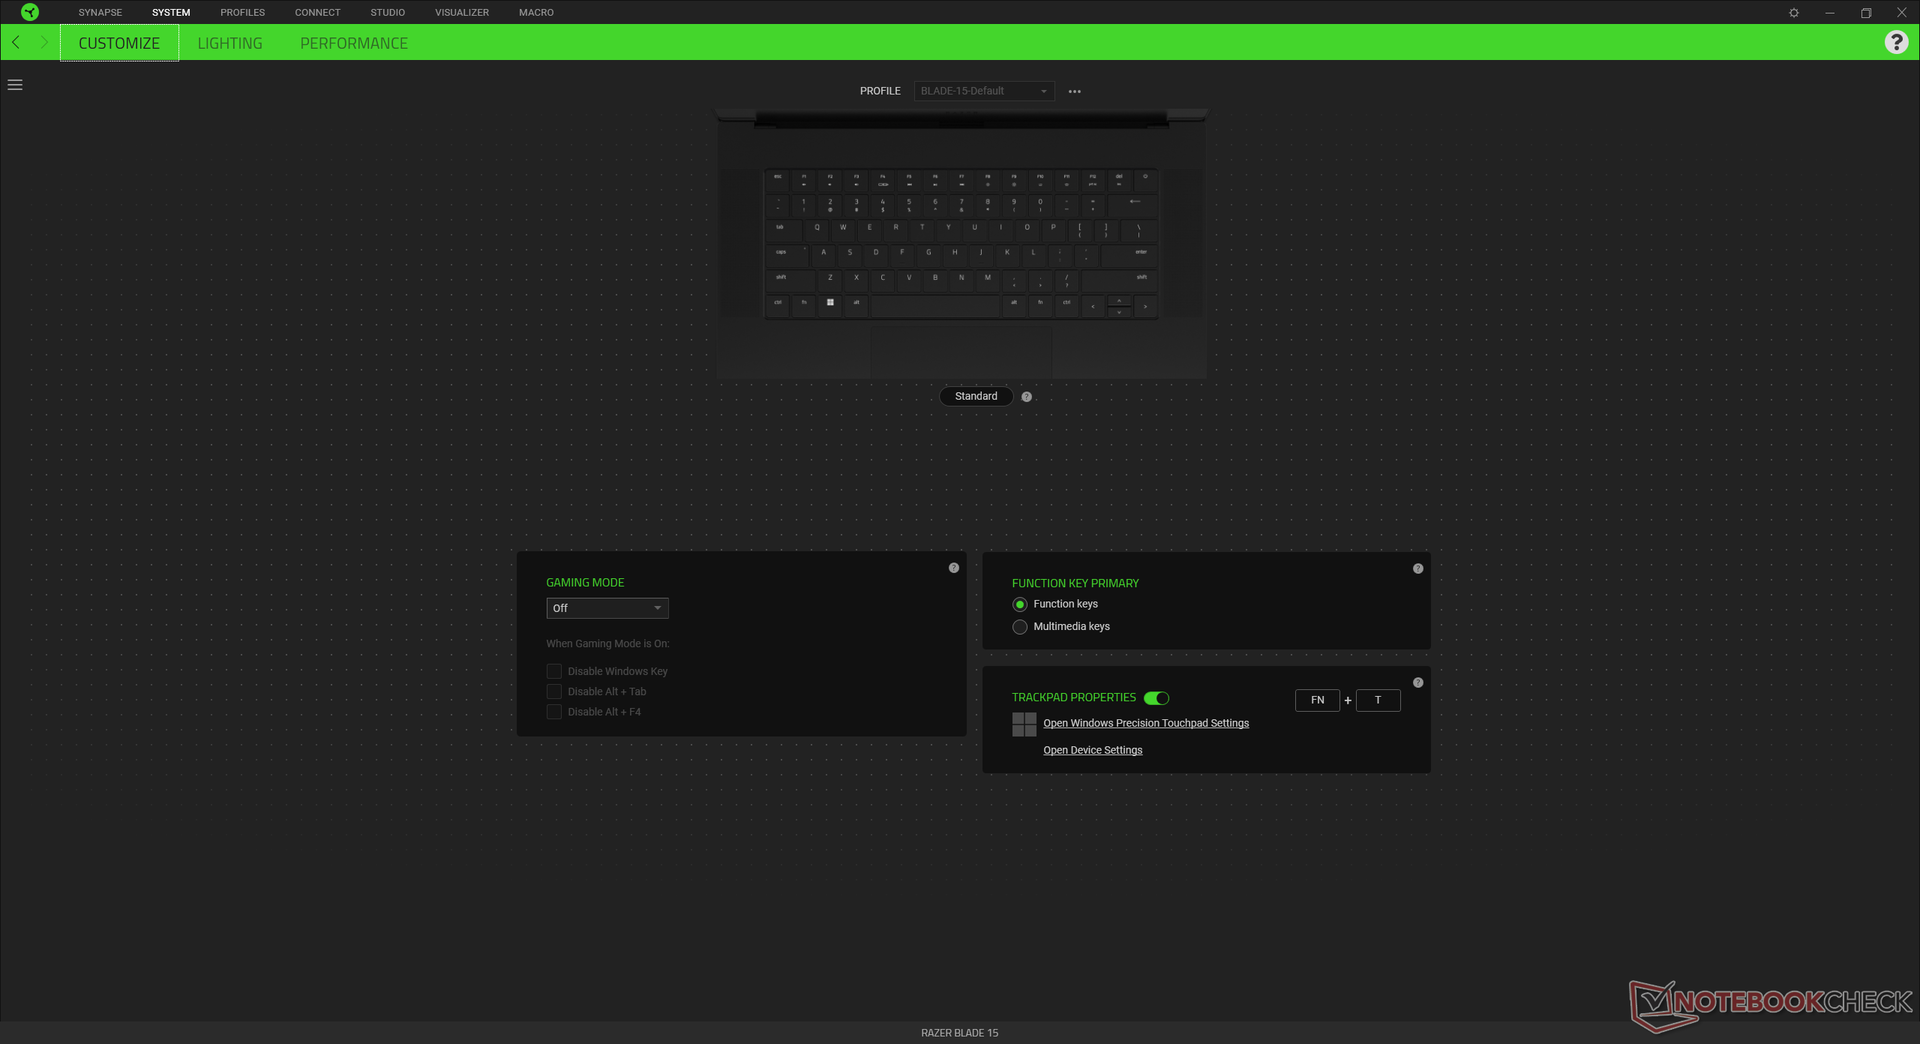
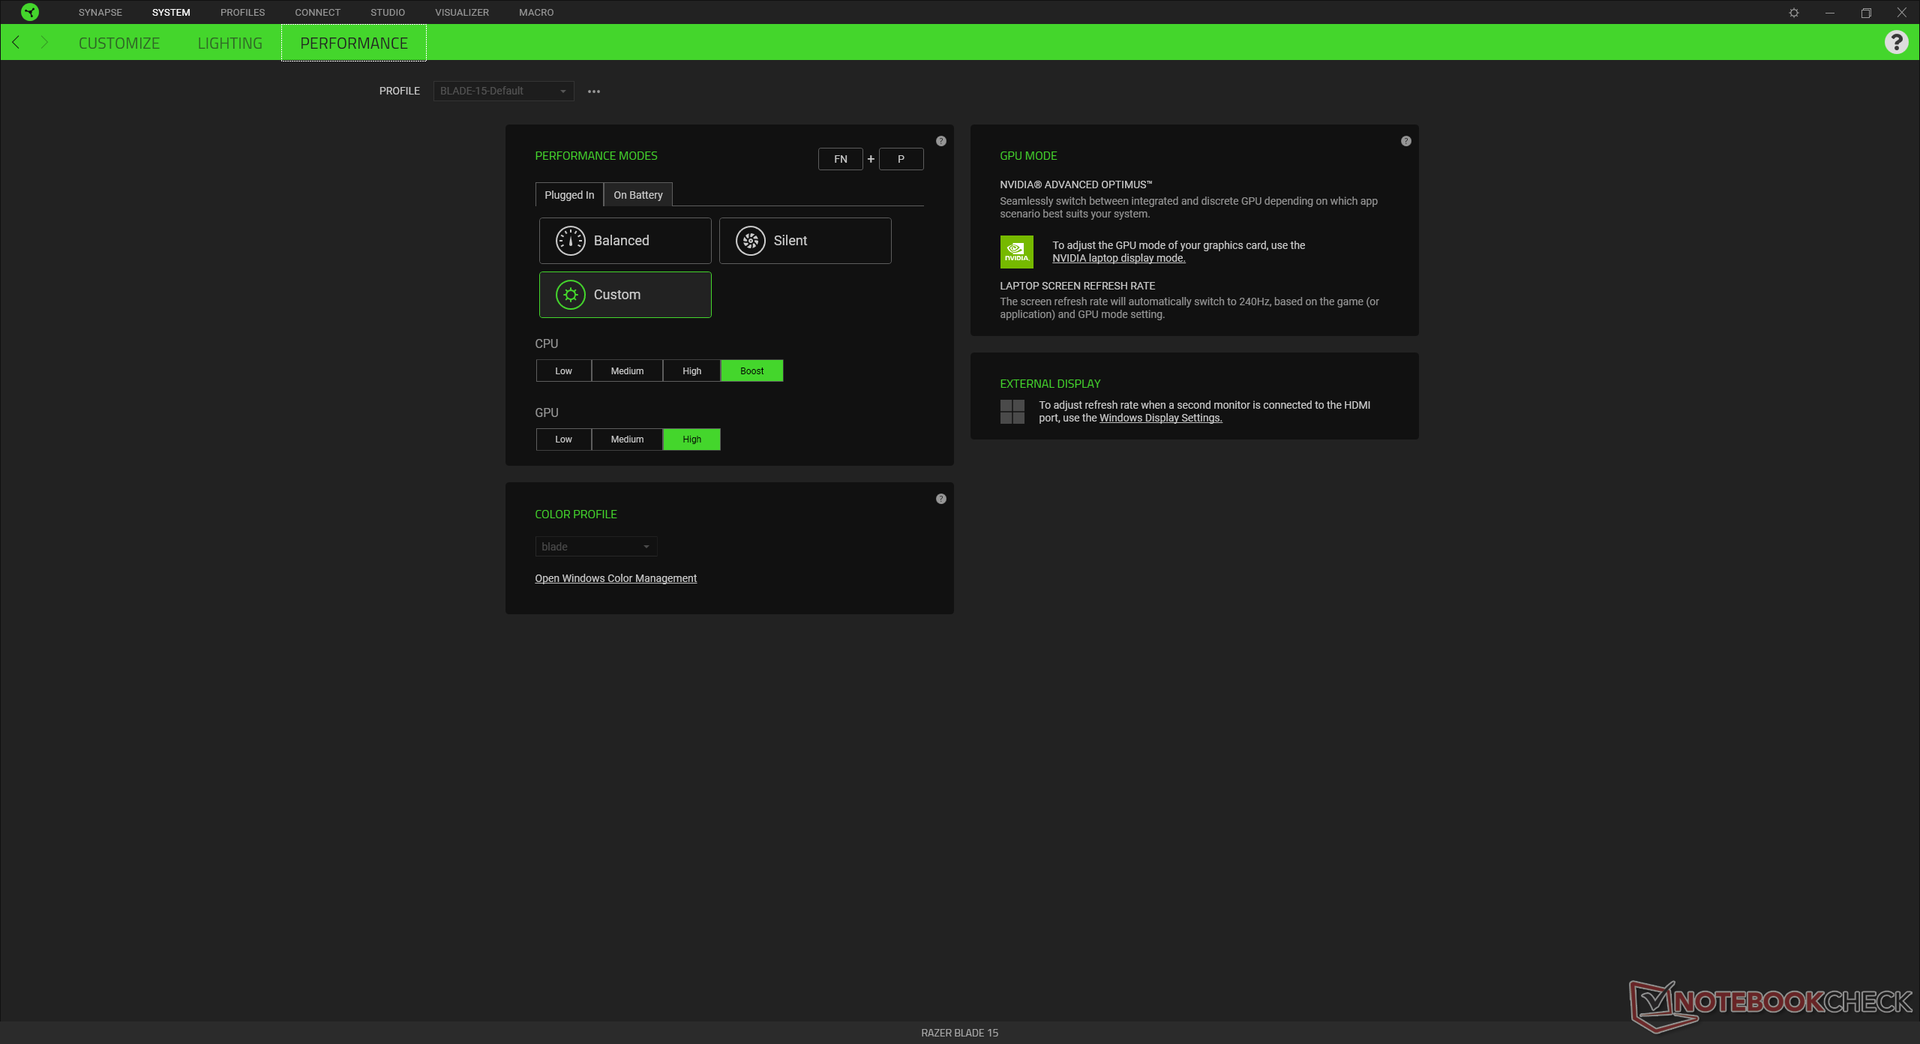
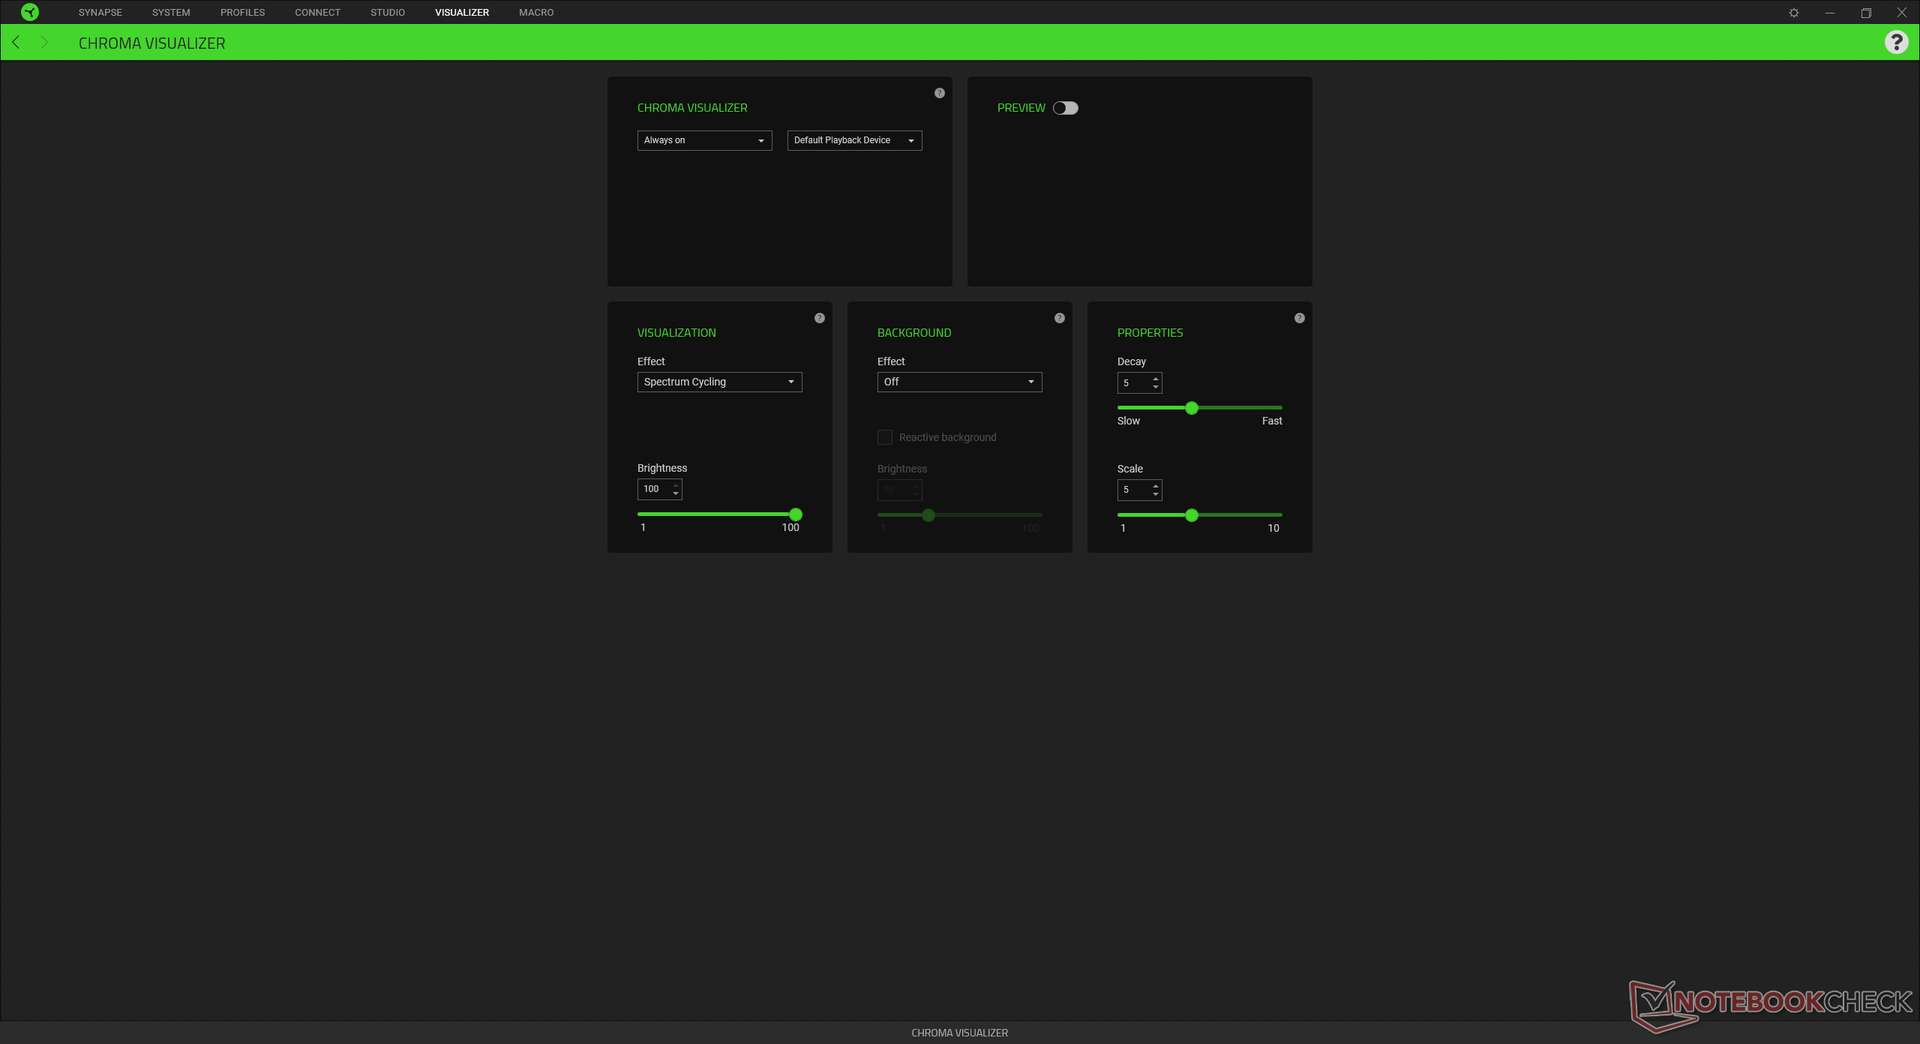
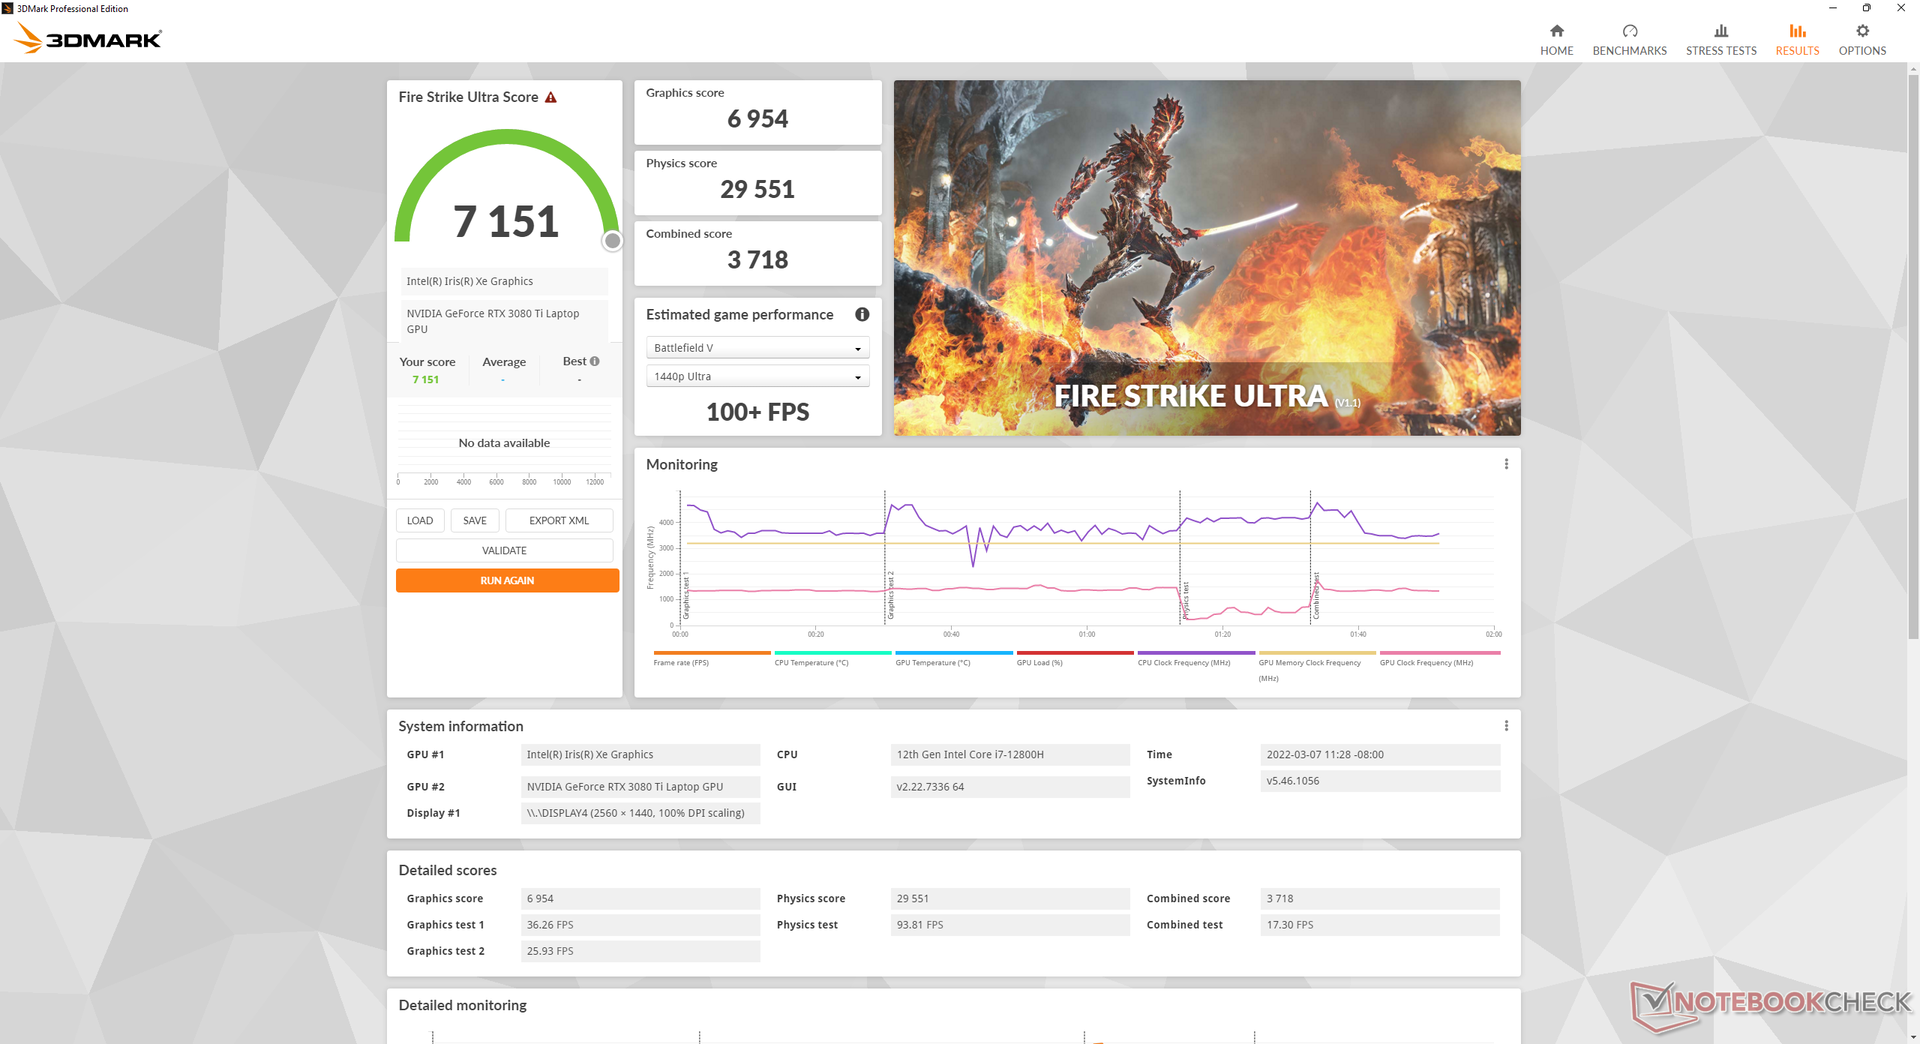
Vår enhet ställdes in på Custom performance mode med CPU till Boost och GPU till High via Razer Synapse-programvaran innan vi körde några av nedanstående prestandabänkmärken för att få högsta möjliga poäng. Vi aktiverade också dGPU genom att inaktivera Optimus. Det rekommenderas starkt att du bekantar dig med Razer Synapse eftersom det är mjukvaruhubben för att styra prestanda och funktioner.
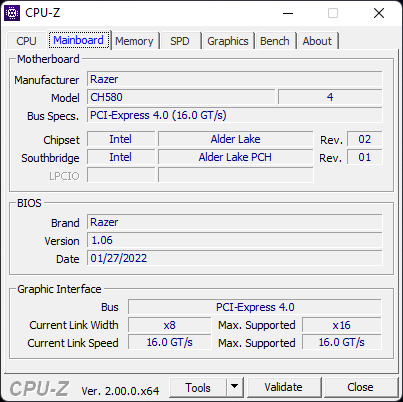
Användare kan växla mellan endast dGPU eller Nvidia Optimus (MUX) utan att behöva starta om systemet eftersom Blade 15 är en av de få bärbara speldatorer som har stöd för Advanced Optimus eller Optimus 2.0. Tänk på att G-Sync för den interna skärmen endast fungerar när den inte är i Optimus-läge. Dessutom kommer Thunderbolt 4-stödet endast att aktiveras när det är i Optimus-läge, precis som på andra bärbara datorer som körs med 12:e generationens Alder Lake-H CPU:er.
Processor
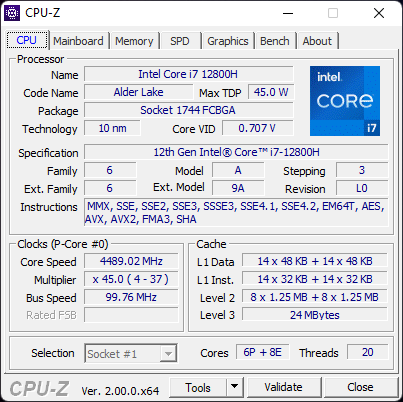
Core i7-12800H erbjuder 20 procent snabbare prestanda för enkel- och flertrådsbehandling jämfört med den senaste generationen Core i7-11800H som den direkt ersätter. Uppgradering till Core i9-12900H SKU förväntas öka CPU-prestandan med ytterligare 5 till 15 procent, baserat på vår erfarenhet med MSI Vector GP66.
Cinebench R15 Multi Loop
Cinebench R23: Multi Core | Single Core
Cinebench R15: CPU Multi 64Bit | CPU Single 64Bit
Blender: v2.79 BMW27 CPU
7-Zip 18.03: 7z b 4 | 7z b 4 -mmt1
Geekbench 5.5: Multi-Core | Single-Core
HWBOT x265 Benchmark v2.2: 4k Preset
LibreOffice : 20 Documents To PDF
R Benchmark 2.5: Overall mean
| Cinebench R20 / CPU (Multi Core) | |
| MSI Vector GP66 12UGS | |
| Razer Blade 15 2022 | |
| Genomsnitt Intel Core i7-12800H (3741 - 6433, n=5) | |
| Asus ROG Zephyrus M16 GU603H | |
| Razer Blade 14 Ryzen 9 RTX 3070 | |
| Razer Blade 15 Advanced (Mid 2021) | |
| MSI Alpha 15 B5EEK-008 | |
| Asus ROG Zephyrus G15 GA502IU-ES76 | |
| Aorus 15P XC | |
| Lenovo Legion C7 15IMH05 82EH0030GE | |
| Razer Blade 15 Advanced Model Early 2021 | |
| Cinebench R20 / CPU (Single Core) | |
| MSI Vector GP66 12UGS | |
| Genomsnitt Intel Core i7-12800H (690 - 714, n=5) | |
| Razer Blade 15 2022 | |
| Asus ROG Zephyrus M16 GU603H | |
| Razer Blade 15 Advanced (Mid 2021) | |
| MSI Alpha 15 B5EEK-008 | |
| Lenovo Legion C7 15IMH05 82EH0030GE | |
| Asus ROG Zephyrus G15 GA502IU-ES76 | |
| Razer Blade 15 Advanced Model Early 2021 | |
| Aorus 15P XC | |
| Razer Blade 14 Ryzen 9 RTX 3070 | |
| Cinebench R23 / Multi Core | |
| MSI Vector GP66 12UGS | |
| Razer Blade 15 2022 | |
| Genomsnitt Intel Core i7-12800H (9777 - 16597, n=5) | |
| Razer Blade 14 Ryzen 9 RTX 3070 | |
| Razer Blade 15 Advanced (Mid 2021) | |
| MSI Alpha 15 B5EEK-008 | |
| Aorus 15P XC | |
| Lenovo Legion C7 15IMH05 82EH0030GE | |
| Razer Blade 15 Advanced Model Early 2021 | |
| Cinebench R23 / Single Core | |
| MSI Vector GP66 12UGS | |
| Genomsnitt Intel Core i7-12800H (1796 - 1859, n=5) | |
| Razer Blade 15 2022 | |
| Razer Blade 15 Advanced (Mid 2021) | |
| MSI Alpha 15 B5EEK-008 | |
| Lenovo Legion C7 15IMH05 82EH0030GE | |
| Aorus 15P XC | |
| Razer Blade 14 Ryzen 9 RTX 3070 | |
| Razer Blade 15 Advanced Model Early 2021 | |
| Cinebench R15 / CPU Multi 64Bit | |
| MSI Vector GP66 12UGS | |
| Genomsnitt Intel Core i7-12800H (1566 - 2697, n=5) | |
| Asus ROG Zephyrus M16 GU603H | |
| Razer Blade 15 2022 | |
| Razer Blade 14 Ryzen 9 RTX 3070 | |
| MSI Alpha 15 B5EEK-008 | |
| Razer Blade 15 Advanced (Mid 2021) | |
| Aorus 15P XC | |
| Lenovo Legion C7 15IMH05 82EH0030GE | |
| Asus ROG Zephyrus G15 GA502IU-ES76 | |
| Razer Blade 15 Advanced Model Early 2021 | |
| Cinebench R15 / CPU Single 64Bit | |
| MSI Vector GP66 12UGS | |
| Genomsnitt Intel Core i7-12800H (242 - 269, n=5) | |
| Razer Blade 15 2022 | |
| Asus ROG Zephyrus M16 GU603H | |
| MSI Alpha 15 B5EEK-008 | |
| Razer Blade 15 Advanced (Mid 2021) | |
| Lenovo Legion C7 15IMH05 82EH0030GE | |
| Aorus 15P XC | |
| Razer Blade 15 Advanced Model Early 2021 | |
| Razer Blade 14 Ryzen 9 RTX 3070 | |
| Asus ROG Zephyrus G15 GA502IU-ES76 | |
| Blender / v2.79 BMW27 CPU | |
| Razer Blade 15 Advanced Model Early 2021 | |
| Lenovo Legion C7 15IMH05 82EH0030GE | |
| Aorus 15P XC | |
| Asus ROG Zephyrus G15 GA502IU-ES76 | |
| Razer Blade 15 Advanced (Mid 2021) | |
| MSI Alpha 15 B5EEK-008 | |
| Razer Blade 14 Ryzen 9 RTX 3070 | |
| Asus ROG Zephyrus M16 GU603H | |
| Genomsnitt Intel Core i7-12800H (192 - 306, n=5) | |
| Razer Blade 15 2022 | |
| MSI Vector GP66 12UGS | |
| 7-Zip 18.03 / 7z b 4 | |
| MSI Vector GP66 12UGS | |
| Razer Blade 15 2022 | |
| Genomsnitt Intel Core i7-12800H (44553 - 68930, n=5) | |
| MSI Alpha 15 B5EEK-008 | |
| Asus ROG Zephyrus M16 GU603H | |
| Razer Blade 15 Advanced (Mid 2021) | |
| Razer Blade 14 Ryzen 9 RTX 3070 | |
| Asus ROG Zephyrus G15 GA502IU-ES76 | |
| Aorus 15P XC | |
| Lenovo Legion C7 15IMH05 82EH0030GE | |
| Razer Blade 15 Advanced Model Early 2021 | |
| 7-Zip 18.03 / 7z b 4 -mmt1 | |
| MSI Vector GP66 12UGS | |
| Genomsnitt Intel Core i7-12800H (5726 - 5976, n=5) | |
| Razer Blade 15 2022 | |
| Asus ROG Zephyrus M16 GU603H | |
| MSI Alpha 15 B5EEK-008 | |
| Razer Blade 15 Advanced (Mid 2021) | |
| Lenovo Legion C7 15IMH05 82EH0030GE | |
| Razer Blade 15 Advanced Model Early 2021 | |
| Aorus 15P XC | |
| Razer Blade 14 Ryzen 9 RTX 3070 | |
| Asus ROG Zephyrus G15 GA502IU-ES76 | |
| Geekbench 5.5 / Multi-Core | |
| Razer Blade 15 2022 | |
| MSI Vector GP66 12UGS | |
| Genomsnitt Intel Core i7-12800H (9607 - 12940, n=5) | |
| Asus ROG Zephyrus M16 GU603H | |
| MSI Alpha 15 B5EEK-008 | |
| Lenovo Legion C7 15IMH05 82EH0030GE | |
| Aorus 15P XC | |
| Asus ROG Zephyrus G15 GA502IU-ES76 | |
| Razer Blade 15 Advanced Model Early 2021 | |
| Geekbench 5.5 / Single-Core | |
| MSI Vector GP66 12UGS | |
| Genomsnitt Intel Core i7-12800H (1739 - 1842, n=5) | |
| Razer Blade 15 2022 | |
| Asus ROG Zephyrus M16 GU603H | |
| MSI Alpha 15 B5EEK-008 | |
| Lenovo Legion C7 15IMH05 82EH0030GE | |
| Razer Blade 15 Advanced Model Early 2021 | |
| Aorus 15P XC | |
| Asus ROG Zephyrus G15 GA502IU-ES76 | |
| HWBOT x265 Benchmark v2.2 / 4k Preset | |
| MSI Vector GP66 12UGS | |
| Razer Blade 15 2022 | |
| Genomsnitt Intel Core i7-12800H (11.7 - 19.4, n=5) | |
| Razer Blade 14 Ryzen 9 RTX 3070 | |
| MSI Alpha 15 B5EEK-008 | |
| Asus ROG Zephyrus M16 GU603H | |
| Razer Blade 15 Advanced (Mid 2021) | |
| Aorus 15P XC | |
| Asus ROG Zephyrus G15 GA502IU-ES76 | |
| Lenovo Legion C7 15IMH05 82EH0030GE | |
| Razer Blade 15 Advanced Model Early 2021 | |
| LibreOffice / 20 Documents To PDF | |
| Razer Blade 14 Ryzen 9 RTX 3070 | |
| Asus ROG Zephyrus G15 GA502IU-ES76 | |
| Lenovo Legion C7 15IMH05 82EH0030GE | |
| MSI Alpha 15 B5EEK-008 | |
| Razer Blade 15 Advanced Model Early 2021 | |
| Aorus 15P XC | |
| Razer Blade 15 2022 | |
| Razer Blade 15 Advanced (Mid 2021) | |
| Genomsnitt Intel Core i7-12800H (41.3 - 51.5, n=5) | |
| Asus ROG Zephyrus M16 GU603H | |
| MSI Vector GP66 12UGS | |
| R Benchmark 2.5 / Overall mean | |
| Razer Blade 14 Ryzen 9 RTX 3070 | |
| Aorus 15P XC | |
| Lenovo Legion C7 15IMH05 82EH0030GE | |
| Asus ROG Zephyrus G15 GA502IU-ES76 | |
| Razer Blade 15 Advanced Model Early 2021 | |
| Razer Blade 15 Advanced (Mid 2021) | |
| Asus ROG Zephyrus M16 GU603H | |
| MSI Alpha 15 B5EEK-008 | |
| Razer Blade 15 2022 | |
| Genomsnitt Intel Core i7-12800H (0.4442 - 0.4715, n=5) | |
| MSI Vector GP66 12UGS | |
* ... mindre är bättre
AIDA64: FP32 Ray-Trace | FPU Julia | CPU SHA3 | CPU Queen | FPU SinJulia | FPU Mandel | CPU AES | CPU ZLib | FP64 Ray-Trace | CPU PhotoWorxx
| Performance rating | |
| Eurocom Nightsky ARX315 | |
| Schenker XMG Neo 15 E22 (Early 2022, RTX 3080 Ti) | |
| Genomsnitt Intel Core i7-12800H | |
| Razer Blade 15 2022 | |
| Razer Blade 15 RTX 2080 Super Max-Q | |
| Razer Blade 15 Advanced Model Early 2021 | |
| ADATA XPG Xenia 15 -9! | |
| AIDA64 / FP32 Ray-Trace | |
| Eurocom Nightsky ARX315 | |
| Schenker XMG Neo 15 E22 (Early 2022, RTX 3080 Ti) | |
| Razer Blade 15 RTX 2080 Super Max-Q | |
| Genomsnitt Intel Core i7-12800H (5839 - 15206, n=5) | |
| Razer Blade 15 Advanced Model Early 2021 | |
| Razer Blade 15 2022 | |
| AIDA64 / FPU Julia | |
| Eurocom Nightsky ARX315 | |
| Razer Blade 15 RTX 2080 Super Max-Q | |
| Razer Blade 15 Advanced Model Early 2021 | |
| Genomsnitt Intel Core i7-12800H (27801 - 80002, n=5) | |
| Schenker XMG Neo 15 E22 (Early 2022, RTX 3080 Ti) | |
| Razer Blade 15 2022 | |
| AIDA64 / CPU SHA3 | |
| Schenker XMG Neo 15 E22 (Early 2022, RTX 3080 Ti) | |
| Eurocom Nightsky ARX315 | |
| Genomsnitt Intel Core i7-12800H (2013 - 3684, n=5) | |
| Razer Blade 15 2022 | |
| Razer Blade 15 RTX 2080 Super Max-Q | |
| Razer Blade 15 Advanced Model Early 2021 | |
| AIDA64 / CPU Queen | |
| Eurocom Nightsky ARX315 | |
| Schenker XMG Neo 15 E22 (Early 2022, RTX 3080 Ti) | |
| Genomsnitt Intel Core i7-12800H (85965 - 108084, n=5) | |
| Razer Blade 15 2022 | |
| Razer Blade 15 RTX 2080 Super Max-Q | |
| Razer Blade 15 Advanced Model Early 2021 | |
| AIDA64 / FPU SinJulia | |
| Eurocom Nightsky ARX315 | |
| Schenker XMG Neo 15 E22 (Early 2022, RTX 3080 Ti) | |
| Razer Blade 15 2022 | |
| Genomsnitt Intel Core i7-12800H (7027 - 9658, n=5) | |
| Razer Blade 15 RTX 2080 Super Max-Q | |
| Razer Blade 15 Advanced Model Early 2021 | |
| AIDA64 / FPU Mandel | |
| Eurocom Nightsky ARX315 | |
| Schenker XMG Neo 15 E22 (Early 2022, RTX 3080 Ti) | |
| Razer Blade 15 RTX 2080 Super Max-Q | |
| Genomsnitt Intel Core i7-12800H (15765 - 38179, n=5) | |
| Razer Blade 15 Advanced Model Early 2021 | |
| Razer Blade 15 2022 | |
| AIDA64 / CPU AES | |
| Eurocom Nightsky ARX315 | |
| Schenker XMG Neo 15 E22 (Early 2022, RTX 3080 Ti) | |
| Genomsnitt Intel Core i7-12800H (55371 - 73928, n=5) | |
| Razer Blade 15 2022 | |
| Razer Blade 15 RTX 2080 Super Max-Q | |
| Razer Blade 15 Advanced Model Early 2021 | |
| AIDA64 / CPU ZLib | |
| Schenker XMG Neo 15 E22 (Early 2022, RTX 3080 Ti) | |
| Eurocom Nightsky ARX315 | |
| Razer Blade 15 2022 | |
| Genomsnitt Intel Core i7-12800H (701 - 1047, n=5) | |
| Razer Blade 15 RTX 2080 Super Max-Q | |
| Razer Blade 15 Advanced Model Early 2021 | |
| ADATA XPG Xenia 15 | |
| AIDA64 / FP64 Ray-Trace | |
| Eurocom Nightsky ARX315 | |
| Schenker XMG Neo 15 E22 (Early 2022, RTX 3080 Ti) | |
| Razer Blade 15 RTX 2080 Super Max-Q | |
| Genomsnitt Intel Core i7-12800H (3257 - 8559, n=5) | |
| Razer Blade 15 Advanced Model Early 2021 | |
| Razer Blade 15 2022 | |
| AIDA64 / CPU PhotoWorxx | |
| Razer Blade 15 2022 | |
| Schenker XMG Neo 15 E22 (Early 2022, RTX 3080 Ti) | |
| Genomsnitt Intel Core i7-12800H (31329 - 40992, n=5) | |
| Razer Blade 15 Advanced Model Early 2021 | |
| Eurocom Nightsky ARX315 | |
| Razer Blade 15 RTX 2080 Super Max-Q | |
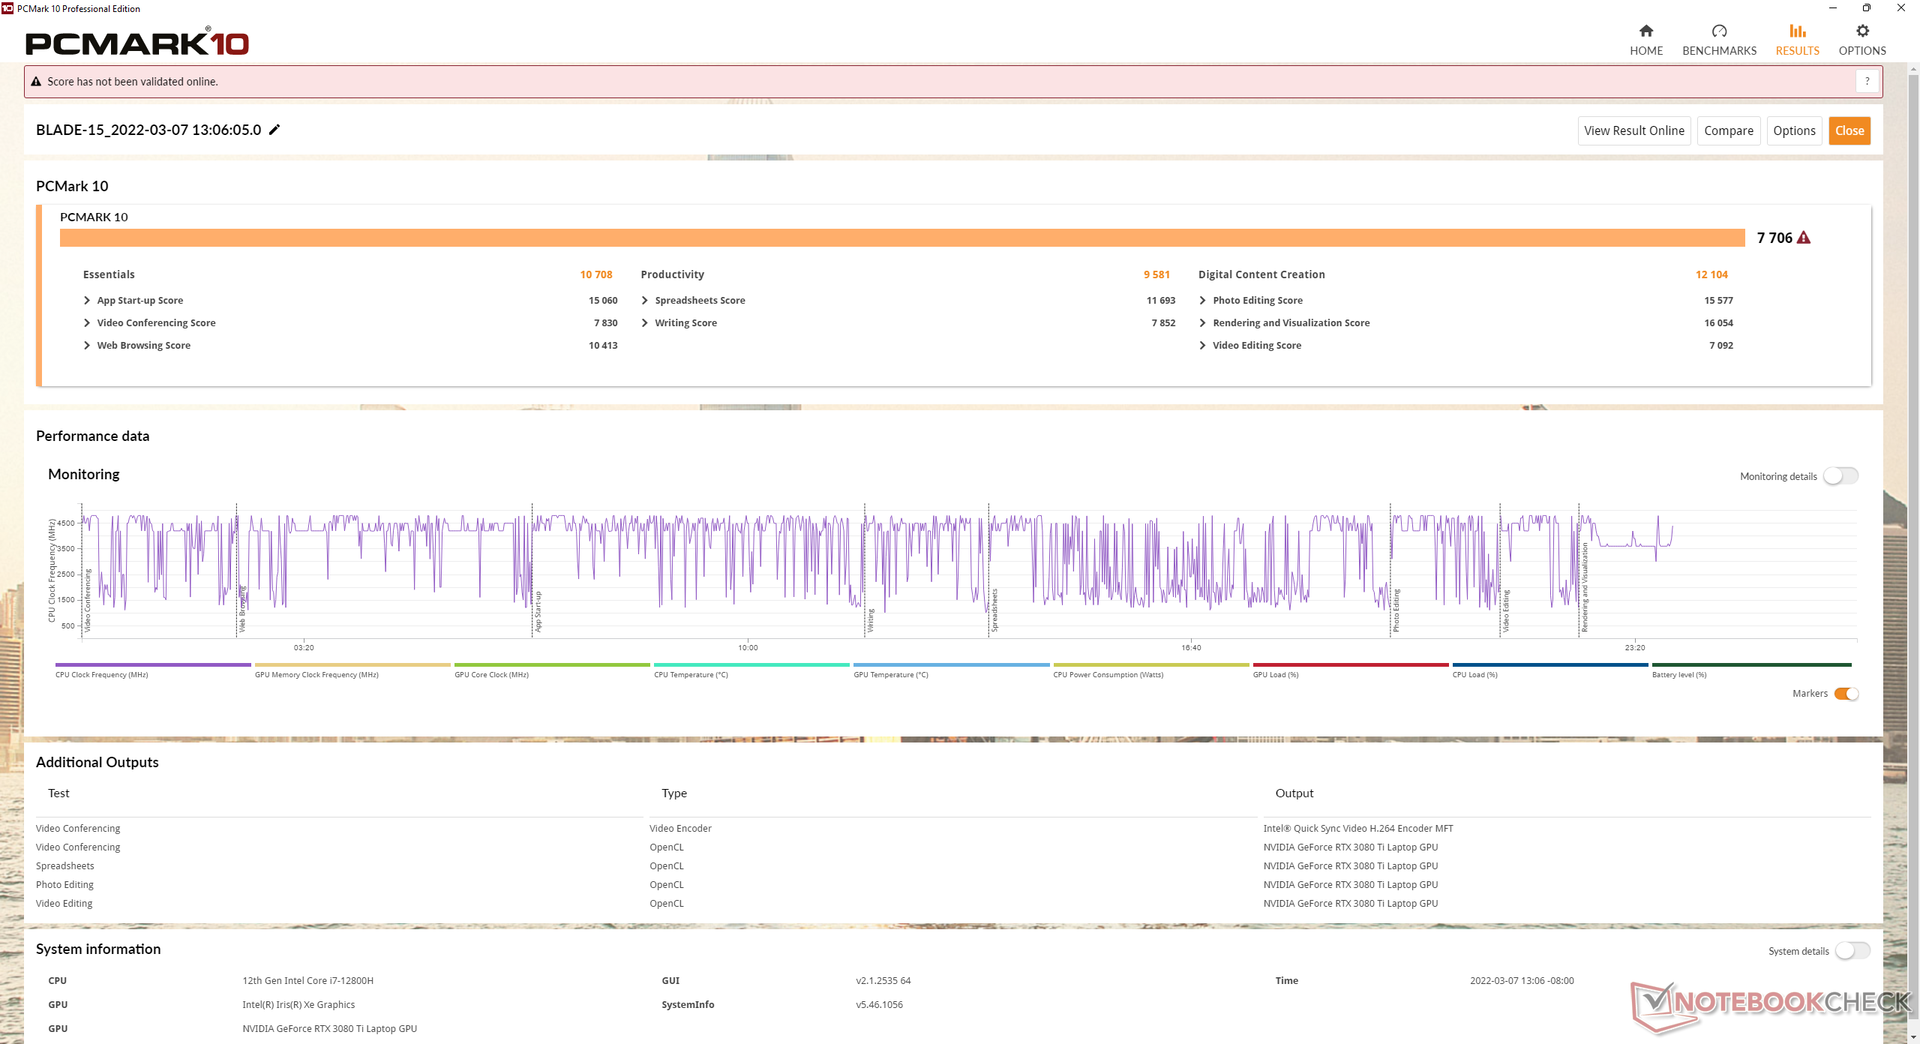
Systemets prestanda
| PCMark 10 / Score | |
| Razer Blade 15 2022 | |
| Genomsnitt Intel Core i7-12800H, NVIDIA GeForce RTX 3080 Ti Laptop GPU (7313 - 7744, n=3) | |
| Razer Blade 15 Advanced (Mid 2021) | |
| Razer Blade 17 RTX 3070 | |
| Razer Blade 14 Ryzen 9 RTX 3070 | |
| Razer Blade 15 RTX 2070 Super Max-Q | |
| Razer Blade Pro 17 2021 (QHD Touch) | |
| Razer Blade 15 Base Edition 2021, i7-10750H RTX 3060 | |
| Razer Blade 15 Advanced Model Early 2021 | |
| PCMark 10 / Essentials | |
| Razer Blade 15 Advanced (Mid 2021) | |
| Razer Blade 17 RTX 3070 | |
| Razer Blade 15 2022 | |
| Genomsnitt Intel Core i7-12800H, NVIDIA GeForce RTX 3080 Ti Laptop GPU (10597 - 10814, n=3) | |
| Razer Blade 14 Ryzen 9 RTX 3070 | |
| Razer Blade 15 RTX 2070 Super Max-Q | |
| Razer Blade 15 Base Edition 2021, i7-10750H RTX 3060 | |
| Razer Blade Pro 17 2021 (QHD Touch) | |
| Razer Blade 15 Advanced Model Early 2021 | |
| PCMark 10 / Productivity | |
| Razer Blade 15 2022 | |
| Genomsnitt Intel Core i7-12800H, NVIDIA GeForce RTX 3080 Ti Laptop GPU (9470 - 9675, n=3) | |
| Razer Blade 14 Ryzen 9 RTX 3070 | |
| Razer Blade 17 RTX 3070 | |
| Razer Blade 15 Advanced (Mid 2021) | |
| Razer Blade 15 RTX 2070 Super Max-Q | |
| Razer Blade Pro 17 2021 (QHD Touch) | |
| Razer Blade 15 Advanced Model Early 2021 | |
| Razer Blade 15 Base Edition 2021, i7-10750H RTX 3060 | |
| PCMark 10 / Digital Content Creation | |
| Razer Blade 15 2022 | |
| Genomsnitt Intel Core i7-12800H, NVIDIA GeForce RTX 3080 Ti Laptop GPU (10351 - 12306, n=3) | |
| Razer Blade 15 Advanced (Mid 2021) | |
| Razer Blade 17 RTX 3070 | |
| Razer Blade 15 RTX 2070 Super Max-Q | |
| Razer Blade 14 Ryzen 9 RTX 3070 | |
| Razer Blade Pro 17 2021 (QHD Touch) | |
| Razer Blade 15 Base Edition 2021, i7-10750H RTX 3060 | |
| Razer Blade 15 Advanced Model Early 2021 | |
| PCMark 10 Score | 7706 poäng | |
Hjälp | ||
| AIDA64 / Memory Copy | |
| Schenker XMG Neo 15 E22 (Early 2022, RTX 3080 Ti) | |
| Razer Blade 15 2022 | |
| Genomsnitt Intel Core i7-12800H (48643 - 62522, n=5) | |
| Eurocom Nightsky ARX315 | |
| Razer Blade 15 Advanced Model Early 2021 | |
| Razer Blade 15 RTX 2080 Super Max-Q | |
| AIDA64 / Memory Read | |
| Schenker XMG Neo 15 E22 (Early 2022, RTX 3080 Ti) | |
| Razer Blade 15 2022 | |
| Genomsnitt Intel Core i7-12800H (56629 - 66199, n=5) | |
| Eurocom Nightsky ARX315 | |
| Razer Blade 15 Advanced Model Early 2021 | |
| Razer Blade 15 RTX 2080 Super Max-Q | |
| AIDA64 / Memory Write | |
| Razer Blade 15 2022 | |
| Schenker XMG Neo 15 E22 (Early 2022, RTX 3080 Ti) | |
| Genomsnitt Intel Core i7-12800H (50923 - 66074, n=5) | |
| Eurocom Nightsky ARX315 | |
| Razer Blade 15 Advanced Model Early 2021 | |
| Razer Blade 15 RTX 2080 Super Max-Q | |
| AIDA64 / Memory Latency | |
| Eurocom Nightsky ARX315 | |
| Razer Blade 15 Advanced Model Early 2021 | |
| Razer Blade 15 RTX 2080 Super Max-Q | |
| Genomsnitt Intel Core i7-12800H (89.3 - 95.2, n=5) | |
| ADATA XPG Xenia 15 | |
| Schenker XMG Neo 15 E22 (Early 2022, RTX 3080 Ti) | |
| Razer Blade 15 2022 | |
* ... mindre är bättre
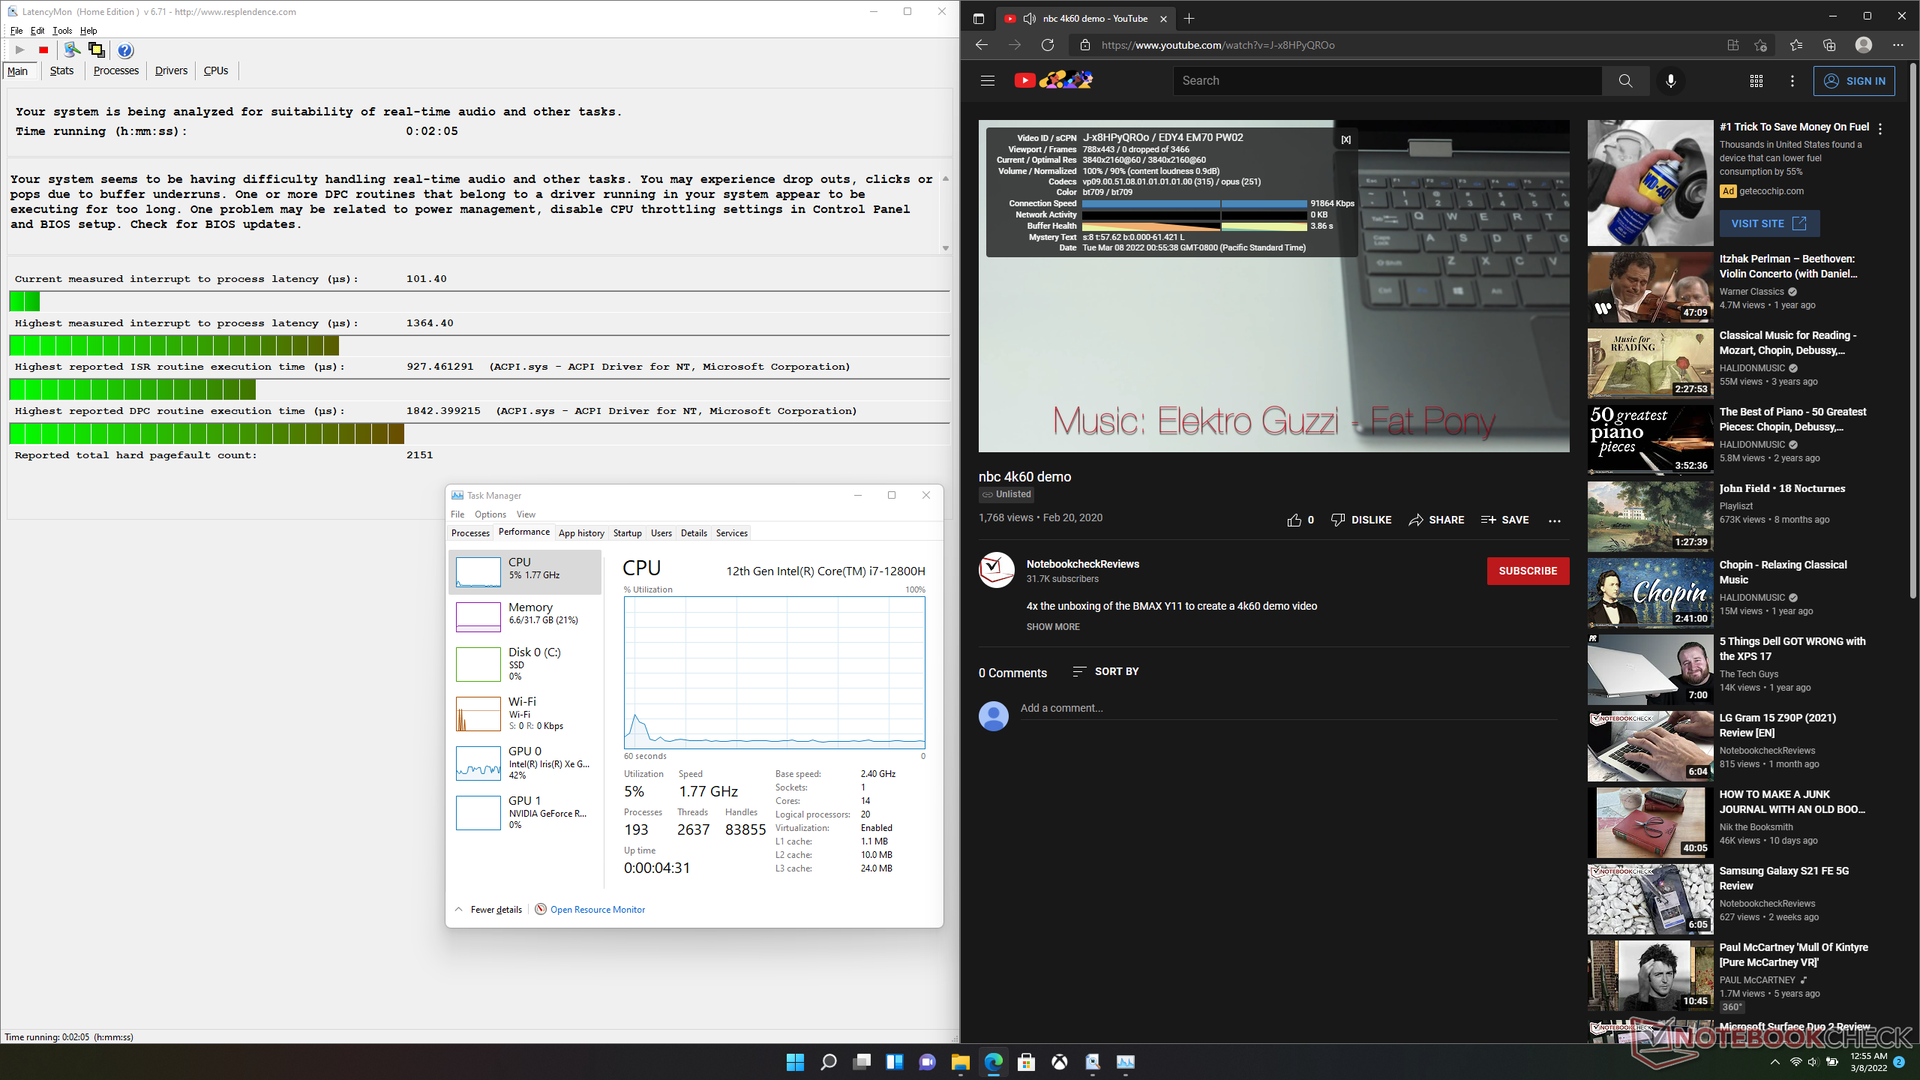
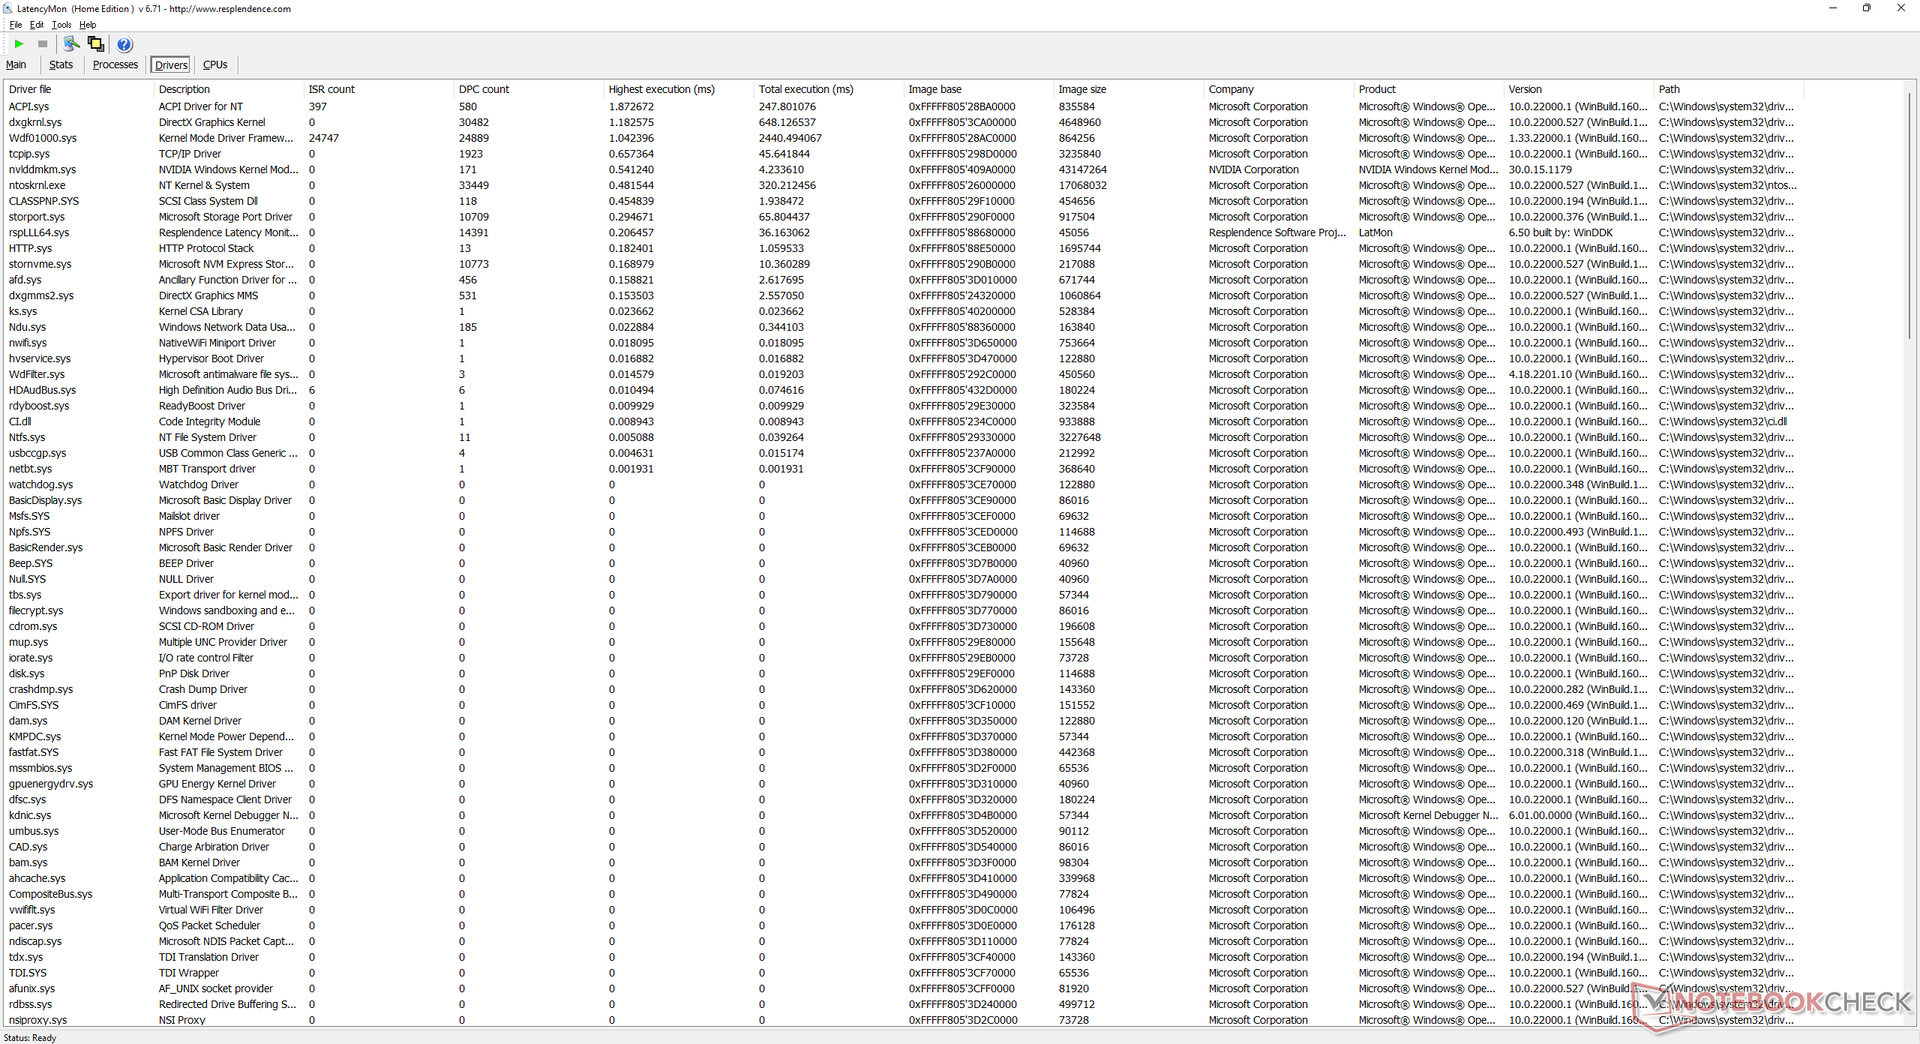
DPC-latenstid
LatencyMon visar DPC-problem när man öppnar flera webbläsarflikar på vår hemsida. uppspelning av 4K-video vid 60 FPS är annars smidig och utan tappade bilder i Optimus-läget.
| DPC Latencies / LatencyMon - interrupt to process latency (max), Web, Youtube, Prime95 | |
| ADATA XPG Xenia 15 | |
| Razer Blade 15 2022 | |
| Schenker XMG Neo 15 E22 (Early 2022, RTX 3080 Ti) | |
| Razer Blade 15 RTX 2080 Super Max-Q | |
| Razer Blade 15 Advanced Model Early 2021 | |
| Eurocom Nightsky ARX315 | |
* ... mindre är bättre
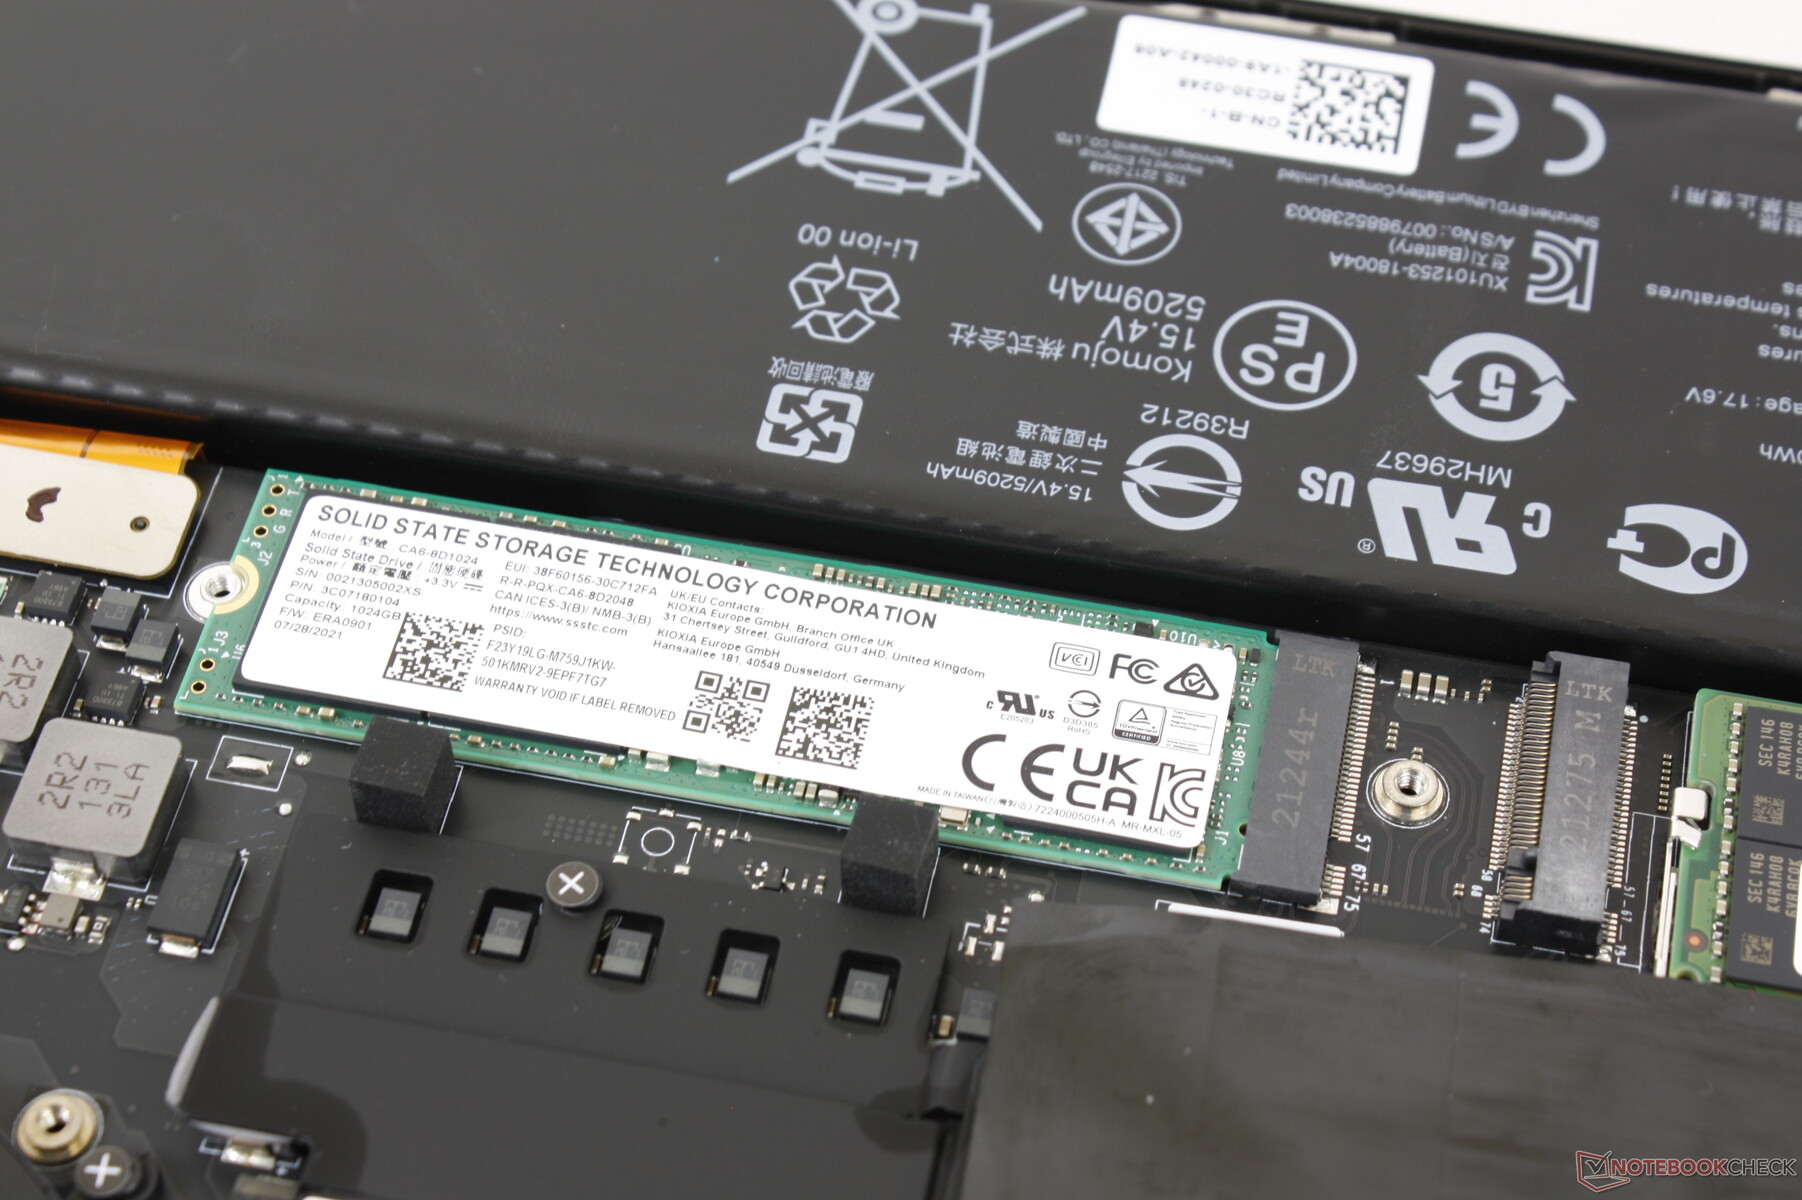
Lagringsenheter
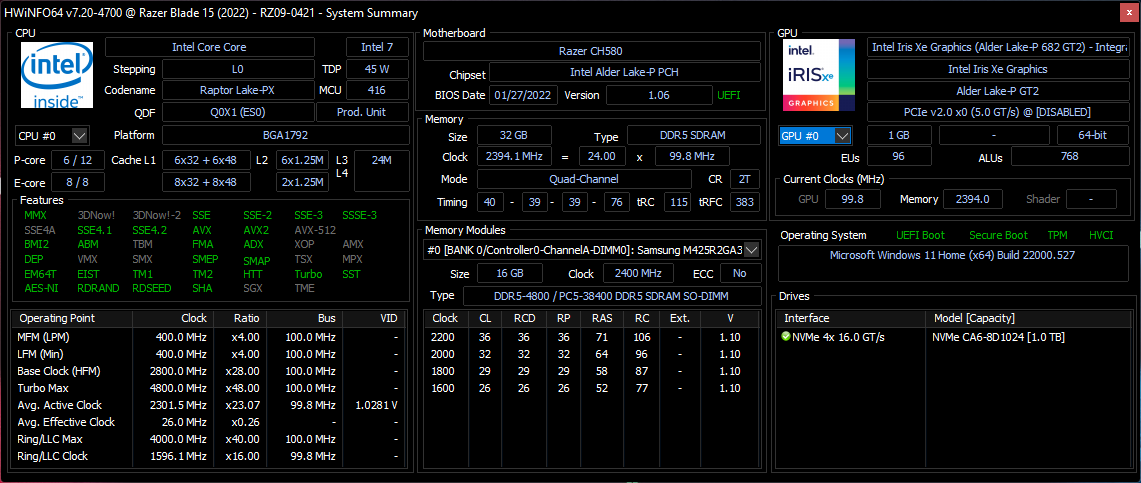
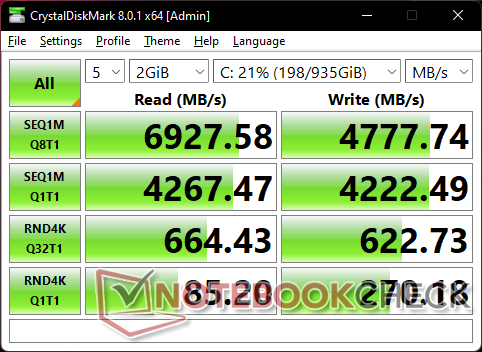
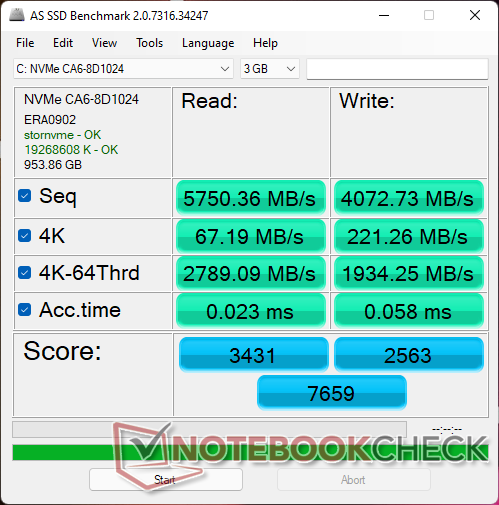
Nästan alla bärbara Razer Blade-datorer använder antingen Lite-On- eller Samsung SSD-diskar och den senaste Blade 15 är inget undantag. Vår testenhet är utrustad med 1 TB Lite-On CA6-8D1024 PCIe4 x4 NVMe SSD för sekventiell läs- och skrivhastighet på upp till 6800 MB/s respektive 4800 MB/s. Vårt DiskSpd Read Loop-test visar att enheten inte har några problem med att bibehålla sina maximala prestandanivåer under längre perioder.

| Drive Performance rating - Percent | |
| Razer Blade 15 2022 | |
| Schenker XMG Neo 15 E22 (Early 2022, RTX 3080 Ti) | |
| ADATA XPG Xenia 15 | |
| Eurocom Nightsky ARX315 | |
| Razer Blade 15 Advanced Model Early 2021 | |
| Razer Blade 15 RTX 2080 Super Max-Q | |
* ... mindre är bättre
Disk Throttling: DiskSpd Read Loop, Queue Depth 8
GPU-prestanda
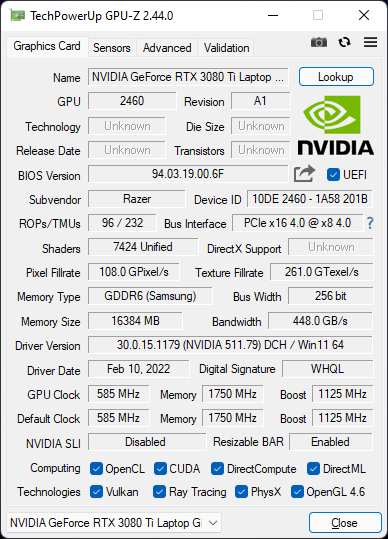
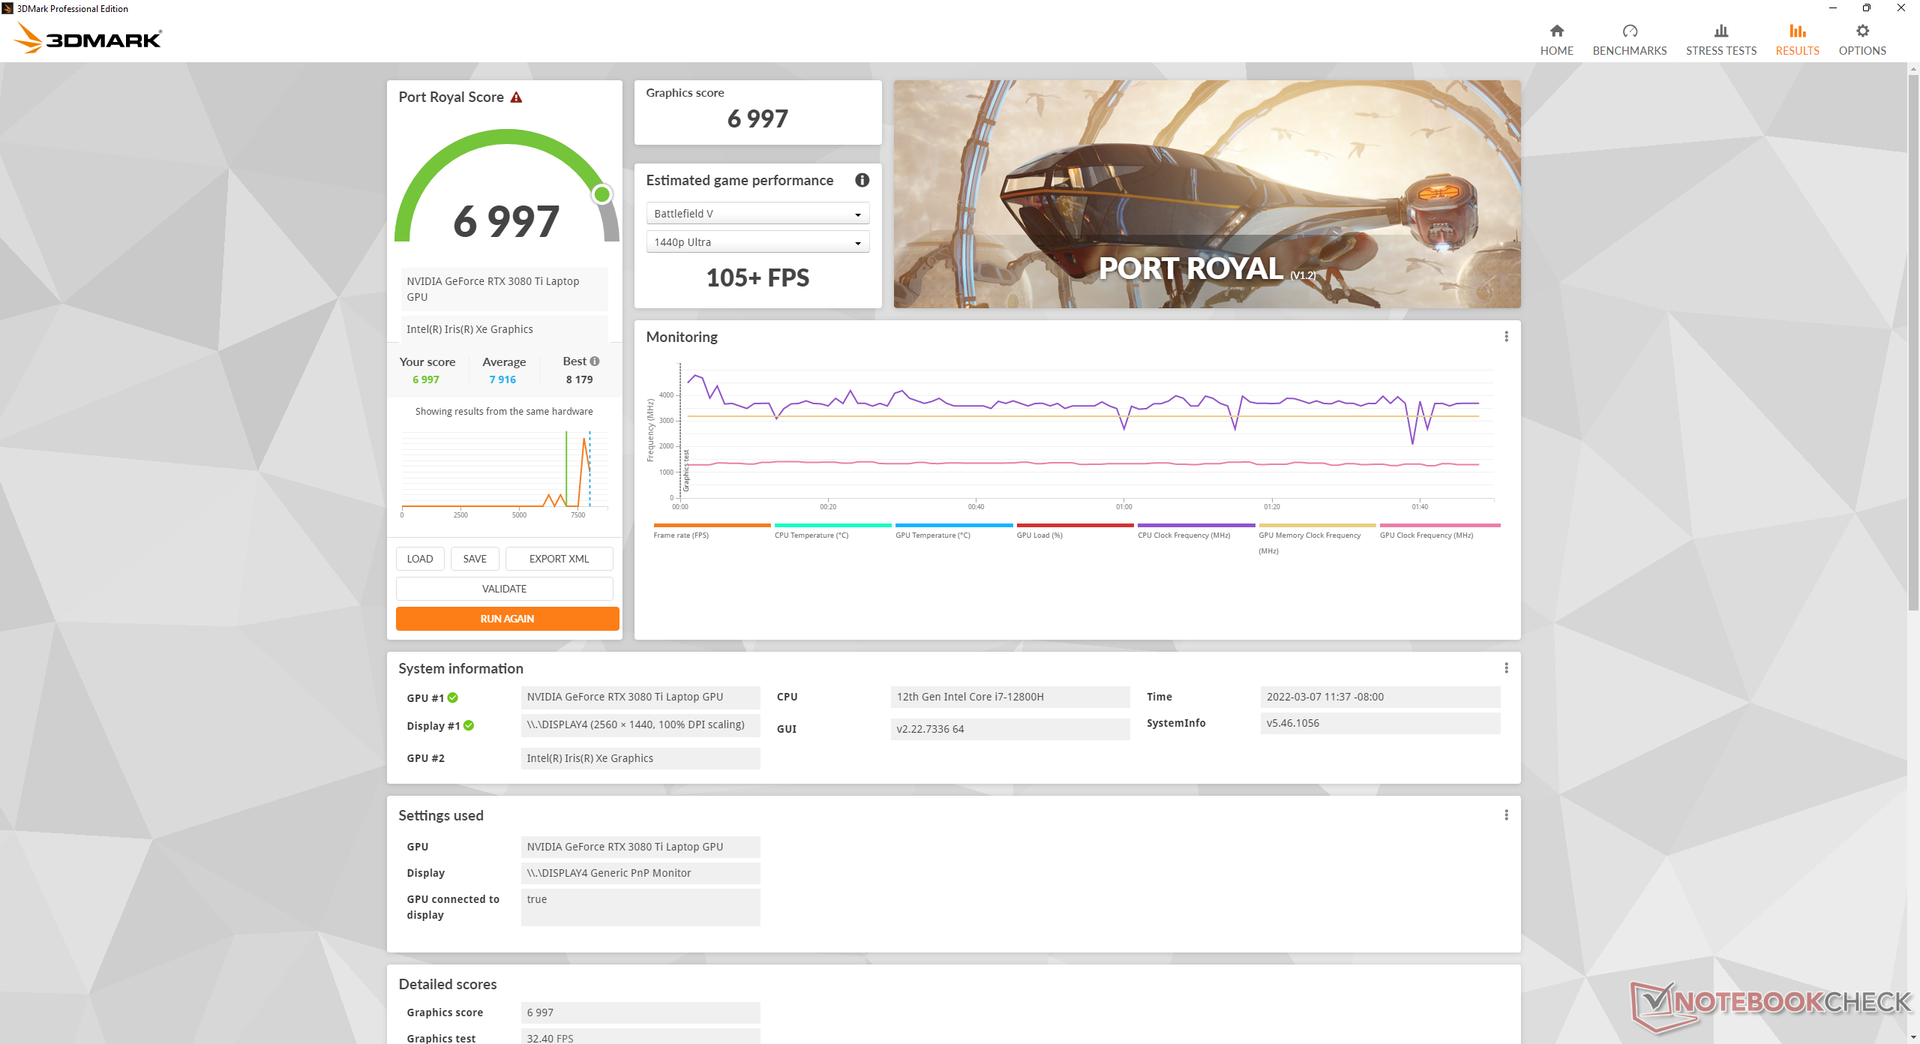
Grafikprestanda är cirka 15-25 procent högre än Blade 15 RTX 3080 eller 30 till 45 procent snabbare än Blade 15 RTX 2080 Max-Q. Vissa alternativ som Schenker XMG Neo 15 E22 ellerSchenker Uniwill Technology GM7AG8P har 150+ W-versioner med högre effekt av samma GeForce RTX 3080 Ti GPU, vilket ger en 10 till 15 procent högre prestanda än vår Blade 15 RTX 3080 Ti.
| 3DMark 11 - 1280x720 Performance GPU | |
| MSI GeForce RTX 3080 Gaming X Trio | |
| Schenker XMG Neo 15 E22 (Early 2022, RTX 3080 Ti) | |
| Genomsnitt NVIDIA GeForce RTX 3080 Ti Laptop GPU (13920 - 45841, n=45) | |
| Razer Blade 15 2022 | |
| Eurocom Nightsky ARX315 | |
| Razer Blade 15 Advanced Model Early 2021 | |
| Razer Blade 15 RTX 2080 Super Max-Q | |
| Asus TUF Gaming F15 FX506HM | |
| Asus ROG Zephyrus M15 GU502LU-BI7N4 | |
| Gigabyte G5 GD | |
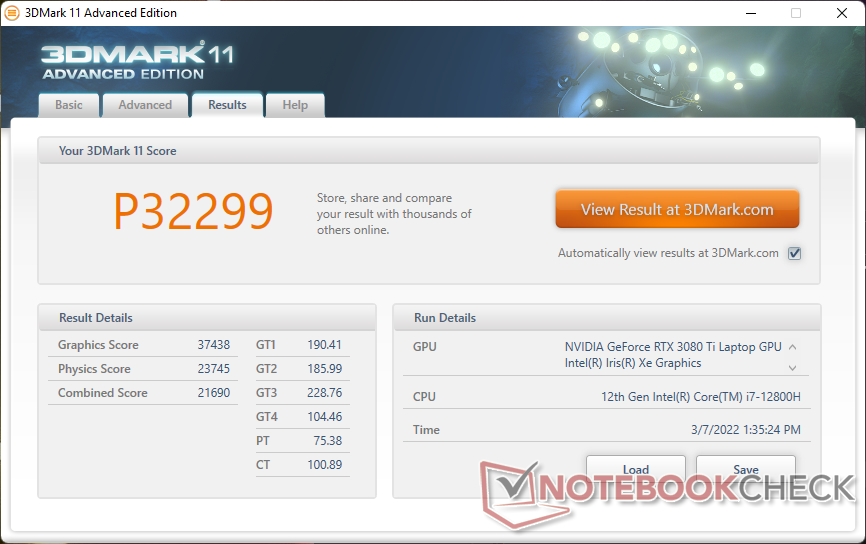
| 3DMark 11 Performance | 32299 poäng | |
| 3DMark Cloud Gate Standard Score | 60579 poäng | |
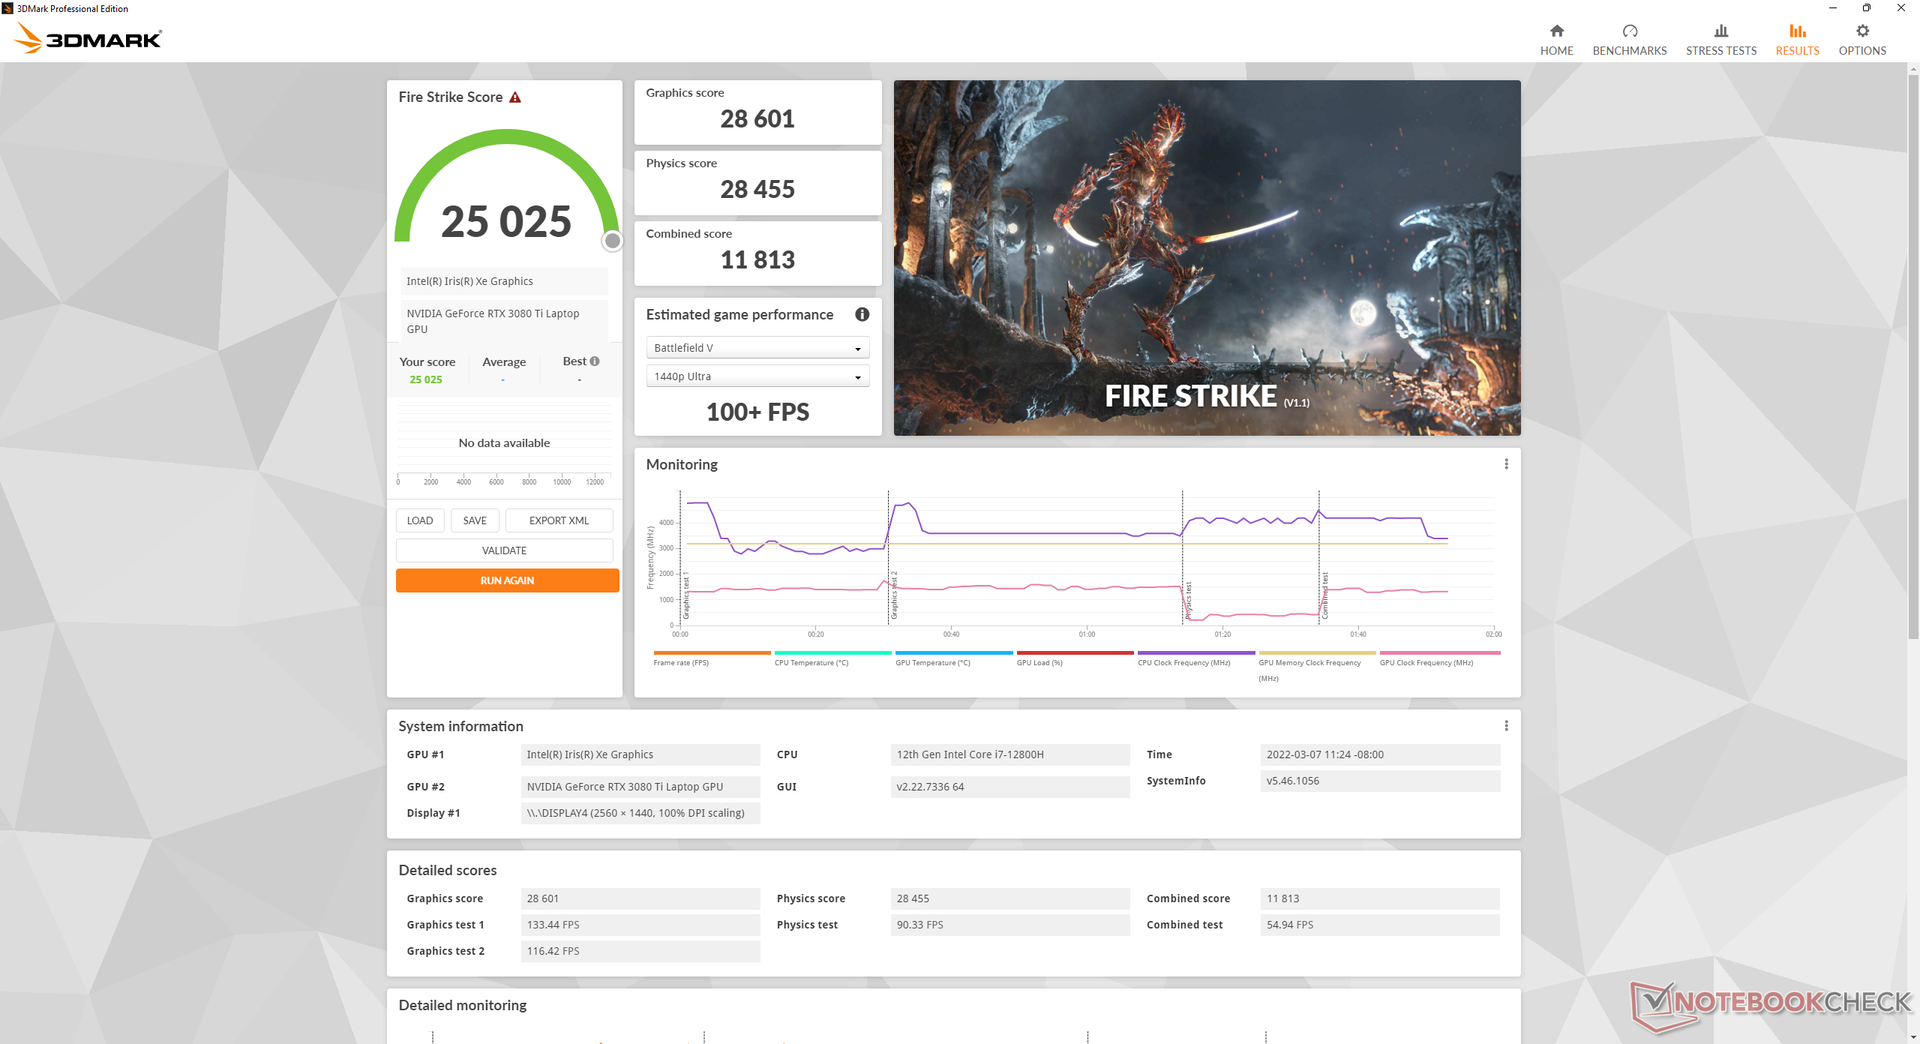
| 3DMark Fire Strike Score | 25025 poäng | |
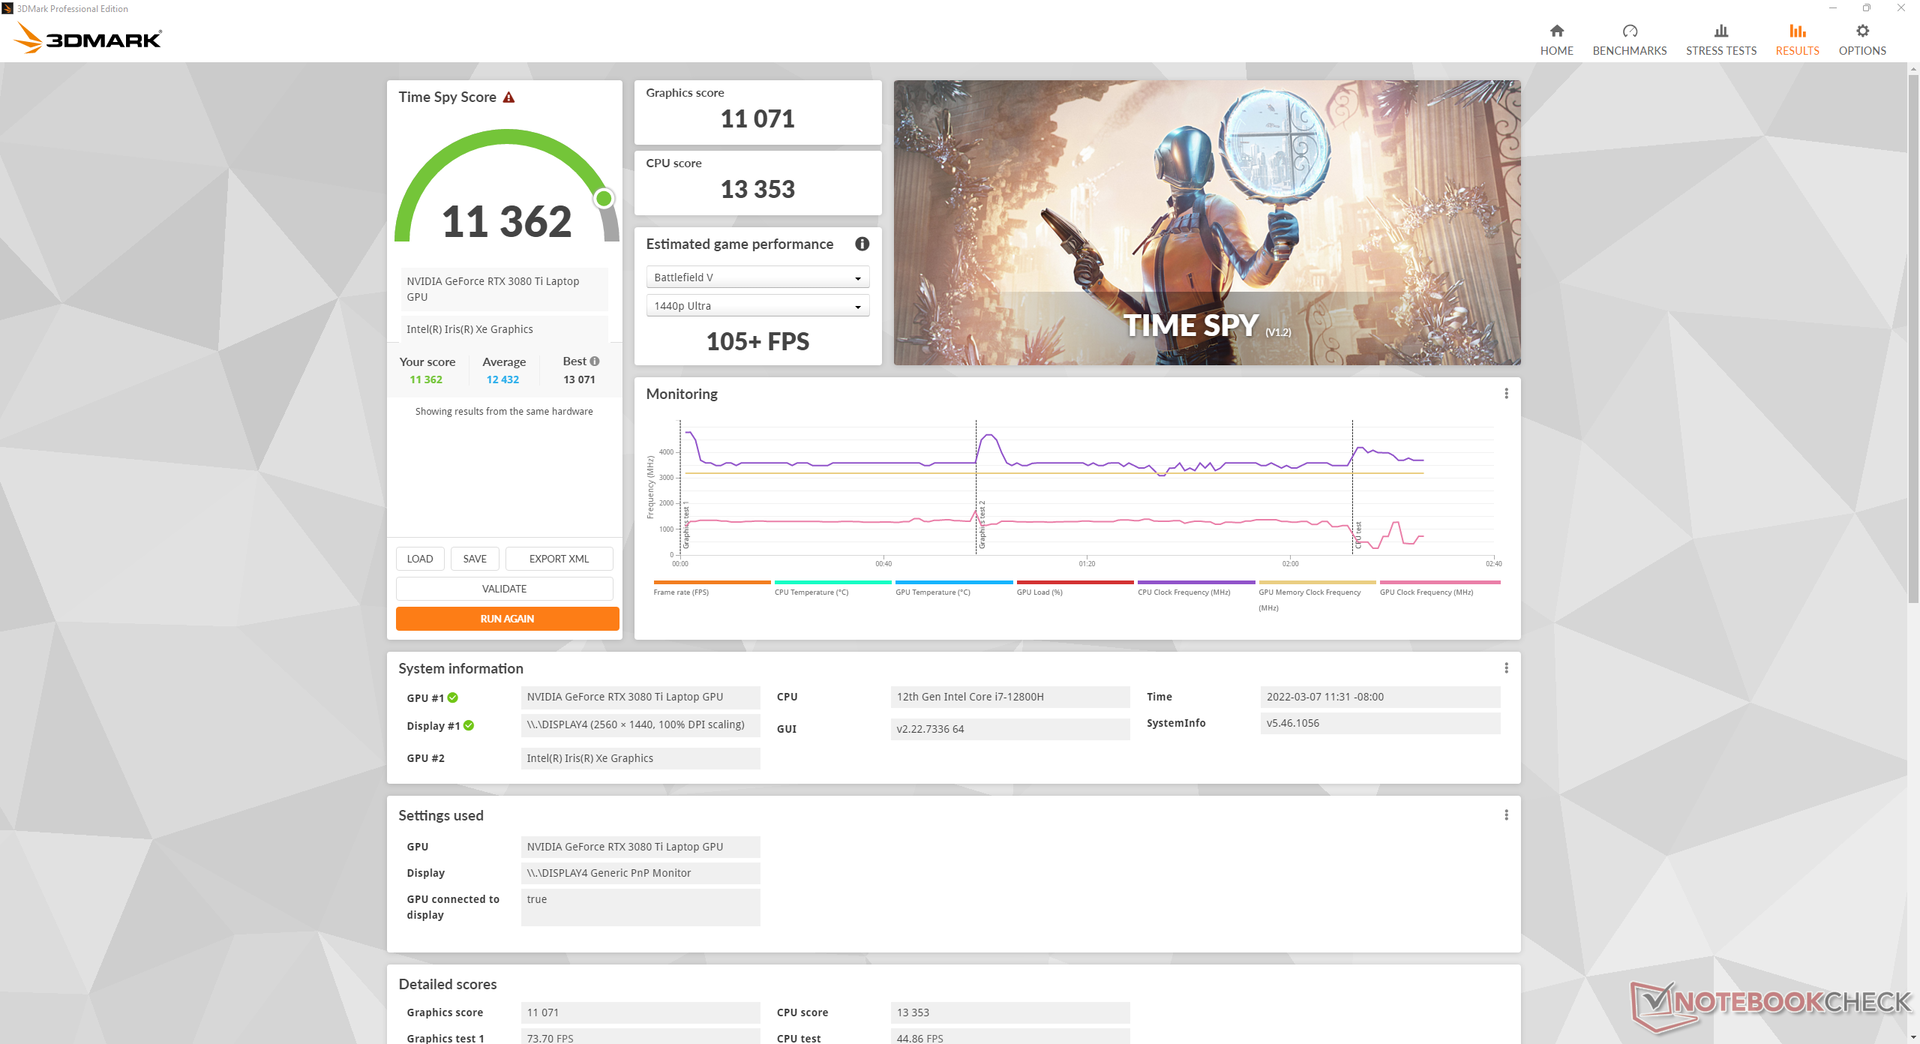
| 3DMark Time Spy Score | 11362 poäng | |
Hjälp | ||
| X-Plane 11.11 | |
| 1280x720 low (fps_test=1) | |
| MSI GeForce RTX 3080 Gaming X Trio | |
| Razer Blade 15 2022 | |
| Eurocom Nightsky ARX315 | |
| Genomsnitt NVIDIA GeForce RTX 3080 Ti Laptop GPU (38.9 - 187.7, n=43) | |
| Asus TUF Gaming F15 FX506HM | |
| Gigabyte G5 GD | |
| Razer Blade 15 RTX 2080 Super Max-Q | |
| Razer Blade 15 Advanced Model Early 2021 | |
| Asus ROG Zephyrus M15 GU502LU-BI7N4 | |
| 1920x1080 med (fps_test=2) | |
| MSI GeForce RTX 3080 Gaming X Trio | |
| Razer Blade 15 2022 | |
| Eurocom Nightsky ARX315 | |
| Genomsnitt NVIDIA GeForce RTX 3080 Ti Laptop GPU (35.2 - 164.7, n=43) | |
| Asus TUF Gaming F15 FX506HM | |
| Razer Blade 15 RTX 2080 Super Max-Q | |
| Gigabyte G5 GD | |
| Razer Blade 15 Advanced Model Early 2021 | |
| Asus ROG Zephyrus M15 GU502LU-BI7N4 | |
| 1920x1080 high (fps_test=3) | |
| MSI GeForce RTX 3080 Gaming X Trio | |
| Razer Blade 15 2022 | |
| Eurocom Nightsky ARX315 | |
| Genomsnitt NVIDIA GeForce RTX 3080 Ti Laptop GPU (32.6 - 127, n=45) | |
| Asus TUF Gaming F15 FX506HM | |
| Razer Blade 15 RTX 2080 Super Max-Q | |
| Gigabyte G5 GD | |
| Razer Blade 15 Advanced Model Early 2021 | |
| Asus ROG Zephyrus M15 GU502LU-BI7N4 | |
Witcher 3 FPS Chart
| låg | med. | hög | ultra | QHD | |
|---|---|---|---|---|---|
| GTA V (2015) | 186 | 181 | 177 | 118 | 97.8 |
| The Witcher 3 (2015) | 457.4 | 320.9 | 213.7 | 107.2 | |
| Dota 2 Reborn (2015) | 181 | 169 | 164 | 156 | |
| Final Fantasy XV Benchmark (2018) | 178 | 141 | 106 | 82.9 | |
| X-Plane 11.11 (2018) | 158 | 140 | 110 | ||
| Far Cry 5 (2018) | 179 | 151 | 144 | 135 | 107 |
| Strange Brigade (2018) | 442 | 252 | 205 | 184 | 132 |
Utsläpp
Systembrus
Fläktljudet beror på Synapses strömprofil. Vi rekommenderar att systemet körs i läget Silent (tyst) när du surfar på webben eller streamar video, eftersom fläktarna annars pulserar oftare om de är i lägena Balanced (balanserad) eller High performance (hög prestanda). Nackdelen med Silent-läget är att handflatorna och botten av den bärbara datorn blir märkbart varmare eftersom fläktarna går mycket långsammare.
Fläktljudet när Witcher 3 körs i läget High Performance liknar det som vi registrerade på äldre Blade 15-modeller med cirka 45 dB(A), vilket fortfarande är mycket tystare än på den konkurrerande XPG Xenia 15 ellerEurocom Nightsky ARX315. Detta kan dock öka till 49-52 dB(A) om processorn belastas mycket mer.
Ljudnivå
| Låg belastning |
| 26.2 / 26.2 / 28.4 dB(A) |
| Hög belastning |
| 44.7 / 51.9 dB(A) |
 | ||
30 dB tyst 40 dB(A) hörbar 50 dB(A) högt ljud |
||
min: | ||
| Razer Blade 15 2022 GeForce RTX 3080 Ti Laptop GPU, i7-12800H, SSSTC CA6-8D1024 | Razer Blade 15 Advanced Model Early 2021 GeForce RTX 3080 Laptop GPU, i7-10875H, Samsung PM981a MZVLB1T0HBLR | Razer Blade 15 RTX 2080 Super Max-Q GeForce RTX 2080 Super Max-Q, i7-10875H, Samsung PM981a MZVLB1T0HBLR | Schenker XMG Neo 15 E22 (Early 2022, RTX 3080 Ti) GeForce RTX 3080 Ti Laptop GPU, i7-12700H, Samsung SSD 980 Pro 250GB MZ-V8P250BW | ADATA XPG Xenia 15 GeForce RTX 3070 Laptop GPU, i7-11800H, ADATA XPG Gammix S70 1TB | Eurocom Nightsky ARX315 GeForce RTX 3070 Laptop GPU, R9 5900X, Samsung SSD 980 Pro 1TB MZ-V8P1T0BW | |
|---|---|---|---|---|---|---|
| Noise | -4% | -8% | 2% | 5% | -15% | |
| av / miljö * (dB) | 25.4 | 24 6% | 30.1 -19% | 24 6% | 24.8 2% | 25.3 -0% |
| Idle Minimum * (dB) | 26.2 | 26 1% | 30.1 -15% | 24 8% | 24.9 5% | 25.9 1% |
| Idle Average * (dB) | 26.2 | 28 -7% | 30.1 -15% | 24 8% | 24.9 5% | 27.9 -6% |
| Idle Maximum * (dB) | 28.4 | 40 -41% | 30.1 -6% | 27.76 2% | 24.9 12% | 40.8 -44% |
| Load Average * (dB) | 44.7 | 45 -1% | 46.8 -5% | 38.81 13% | 28.8 36% | 55.2 -23% |
| Witcher 3 ultra * (dB) | 44.7 | 43 4% | 48.4 -8% | 54.2 -21% | 52.7 -18% | 52.4 -17% |
| Load Maximum * (dB) | 51.9 | 45 13% | 46 11% | 54.18 -4% | 54.9 -6% | 60.3 -16% |
* ... mindre är bättre
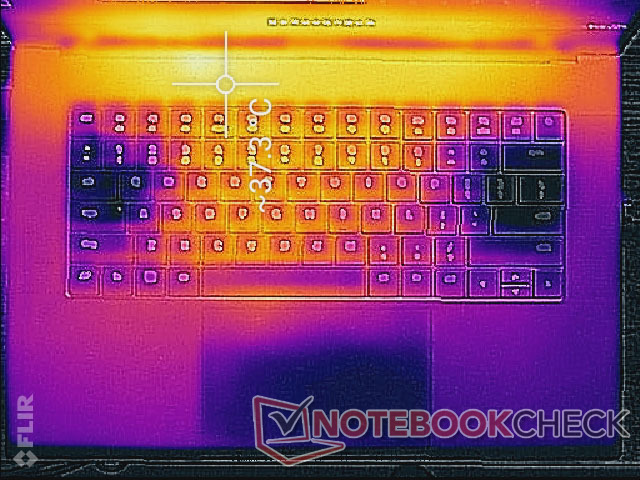
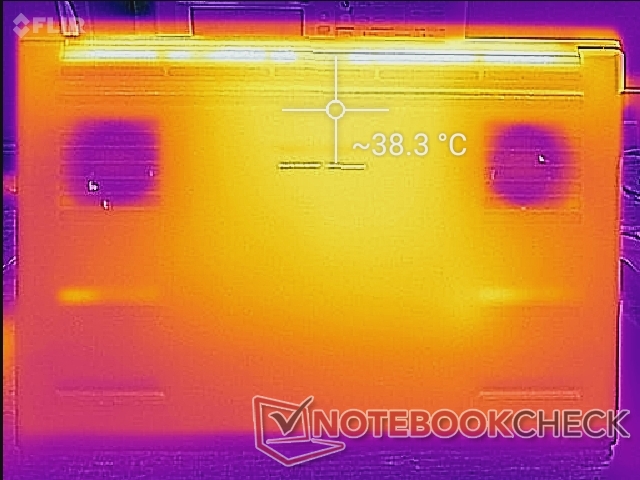
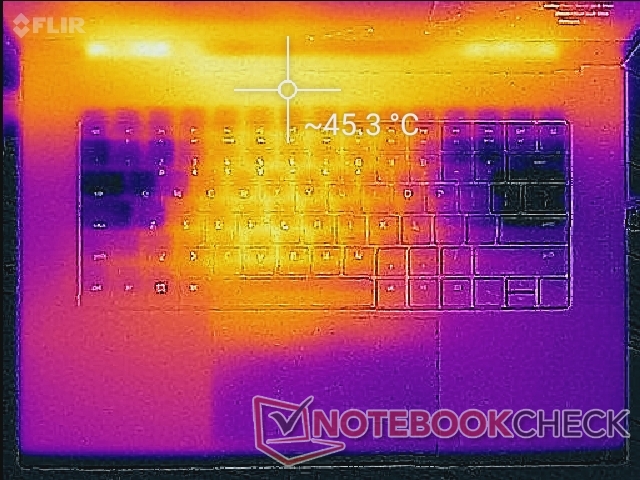
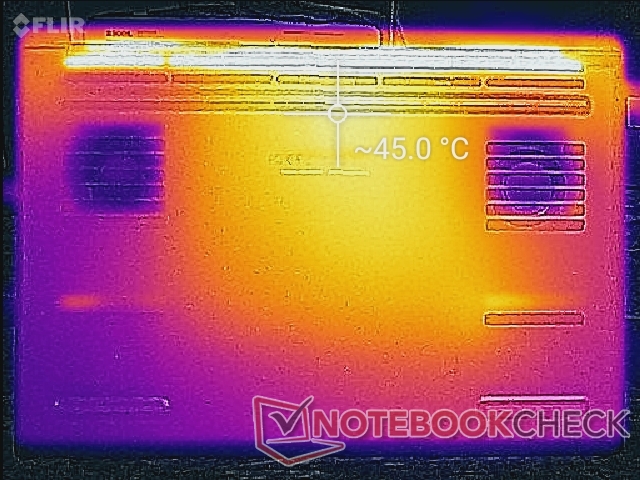
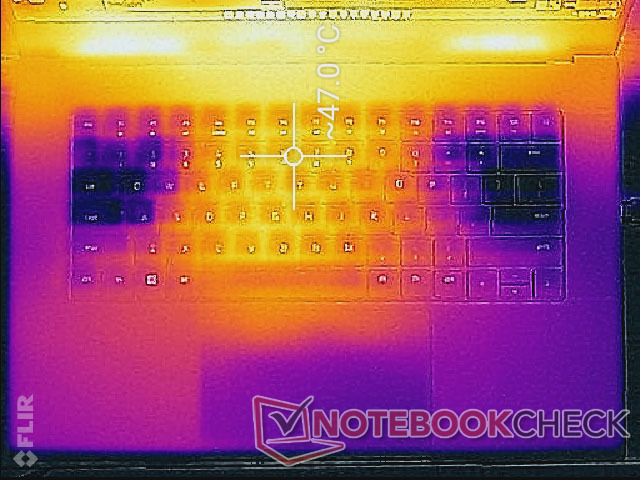
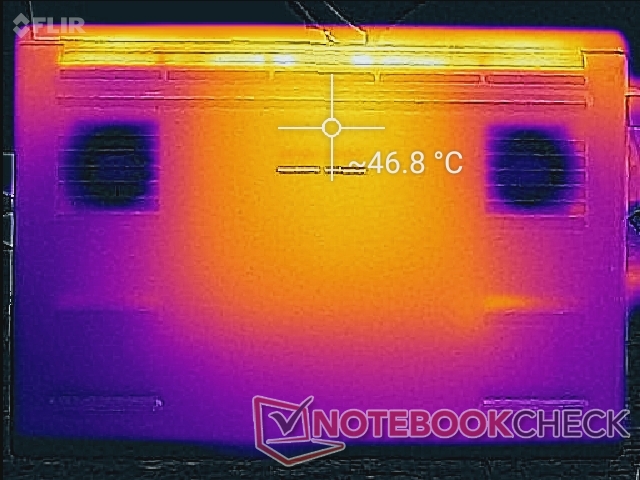
Temperatur
Yttemperaturen är varm även när bilen går på tomgång på skrivbordet. Varma punkter kan nå över 37 C på ovansidan och undersidan, vilket är jämförbara siffror med de ultratunna XPG Xenia 15 eller MSI Vector GP66 under liknande förhållanden. Räkna med att tangentbordets mittpunkt blir en varm 48 C när du spelar.
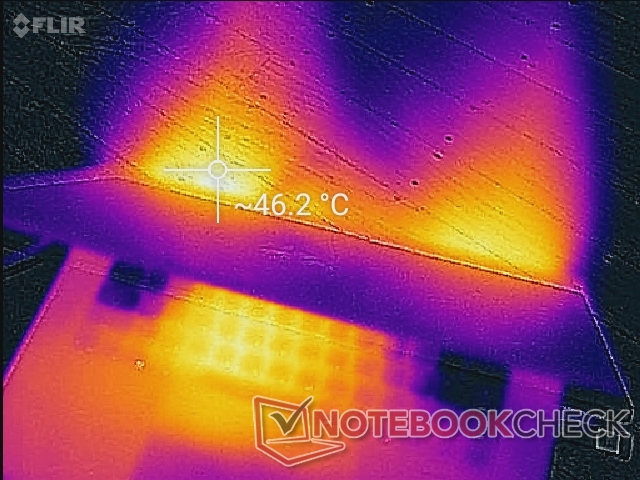
(-) Den maximala temperaturen på ovansidan är 50 °C / 122 F, jämfört med genomsnittet av 40.4 °C / 105 F , allt från 21.2 till 68.8 °C för klassen Gaming.
(-) Botten värms upp till maximalt 47 °C / 117 F, jämfört med genomsnittet av 43.2 °C / 110 F
(±) Vid tomgångsbruk är medeltemperaturen för ovansidan 32.4 °C / 90 F, jämfört med enhetsgenomsnittet på 33.9 °C / ### class_avg_f### F.
(±) När du spelar The Witcher 3 är medeltemperaturen för ovansidan 36 °C / 97 F, jämfört med enhetsgenomsnittet på 33.9 °C / ## #class_avg_f### F.
(+) Handledsstöden och pekplattan når maximal hudtemperatur (34 °C / 93.2 F) och är därför inte varma.
(-) Medeltemperaturen för handledsstödsområdet på liknande enheter var 28.8 °C / 83.8 F (-5.2 °C / -9.4 F).
| Razer Blade 15 2022 Intel Core i7-12800H, NVIDIA GeForce RTX 3080 Ti Laptop GPU | Razer Blade 15 Advanced Model Early 2021 Intel Core i7-10875H, NVIDIA GeForce RTX 3080 Laptop GPU | Razer Blade 15 RTX 2080 Super Max-Q Intel Core i7-10875H, NVIDIA GeForce RTX 2080 Super Max-Q | Schenker XMG Neo 15 E22 (Early 2022, RTX 3080 Ti) Intel Core i7-12700H, NVIDIA GeForce RTX 3080 Ti Laptop GPU | ADATA XPG Xenia 15 Intel Core i7-11800H, NVIDIA GeForce RTX 3070 Laptop GPU | Eurocom Nightsky ARX315 AMD Ryzen 9 5900X, NVIDIA GeForce RTX 3070 Laptop GPU | |
|---|---|---|---|---|---|---|
| Heat | 6% | 7% | -7% | -12% | 6% | |
| Maximum Upper Side * (°C) | 50 | 49 2% | 52 -4% | 52 -4% | 49 2% | 36.2 28% |
| Maximum Bottom * (°C) | 47 | 54 -15% | 53 -13% | 68 -45% | 64.2 -37% | 49.6 -6% |
| Idle Upper Side * (°C) | 37.4 | 30 20% | 29.3 22% | 32 14% | 37.6 -1% | 32.6 13% |
| Idle Bottom * (°C) | 38.4 | 32 17% | 30.2 21% | 36 6% | 42.2 -10% | 43.2 -13% |
* ... mindre är bättre
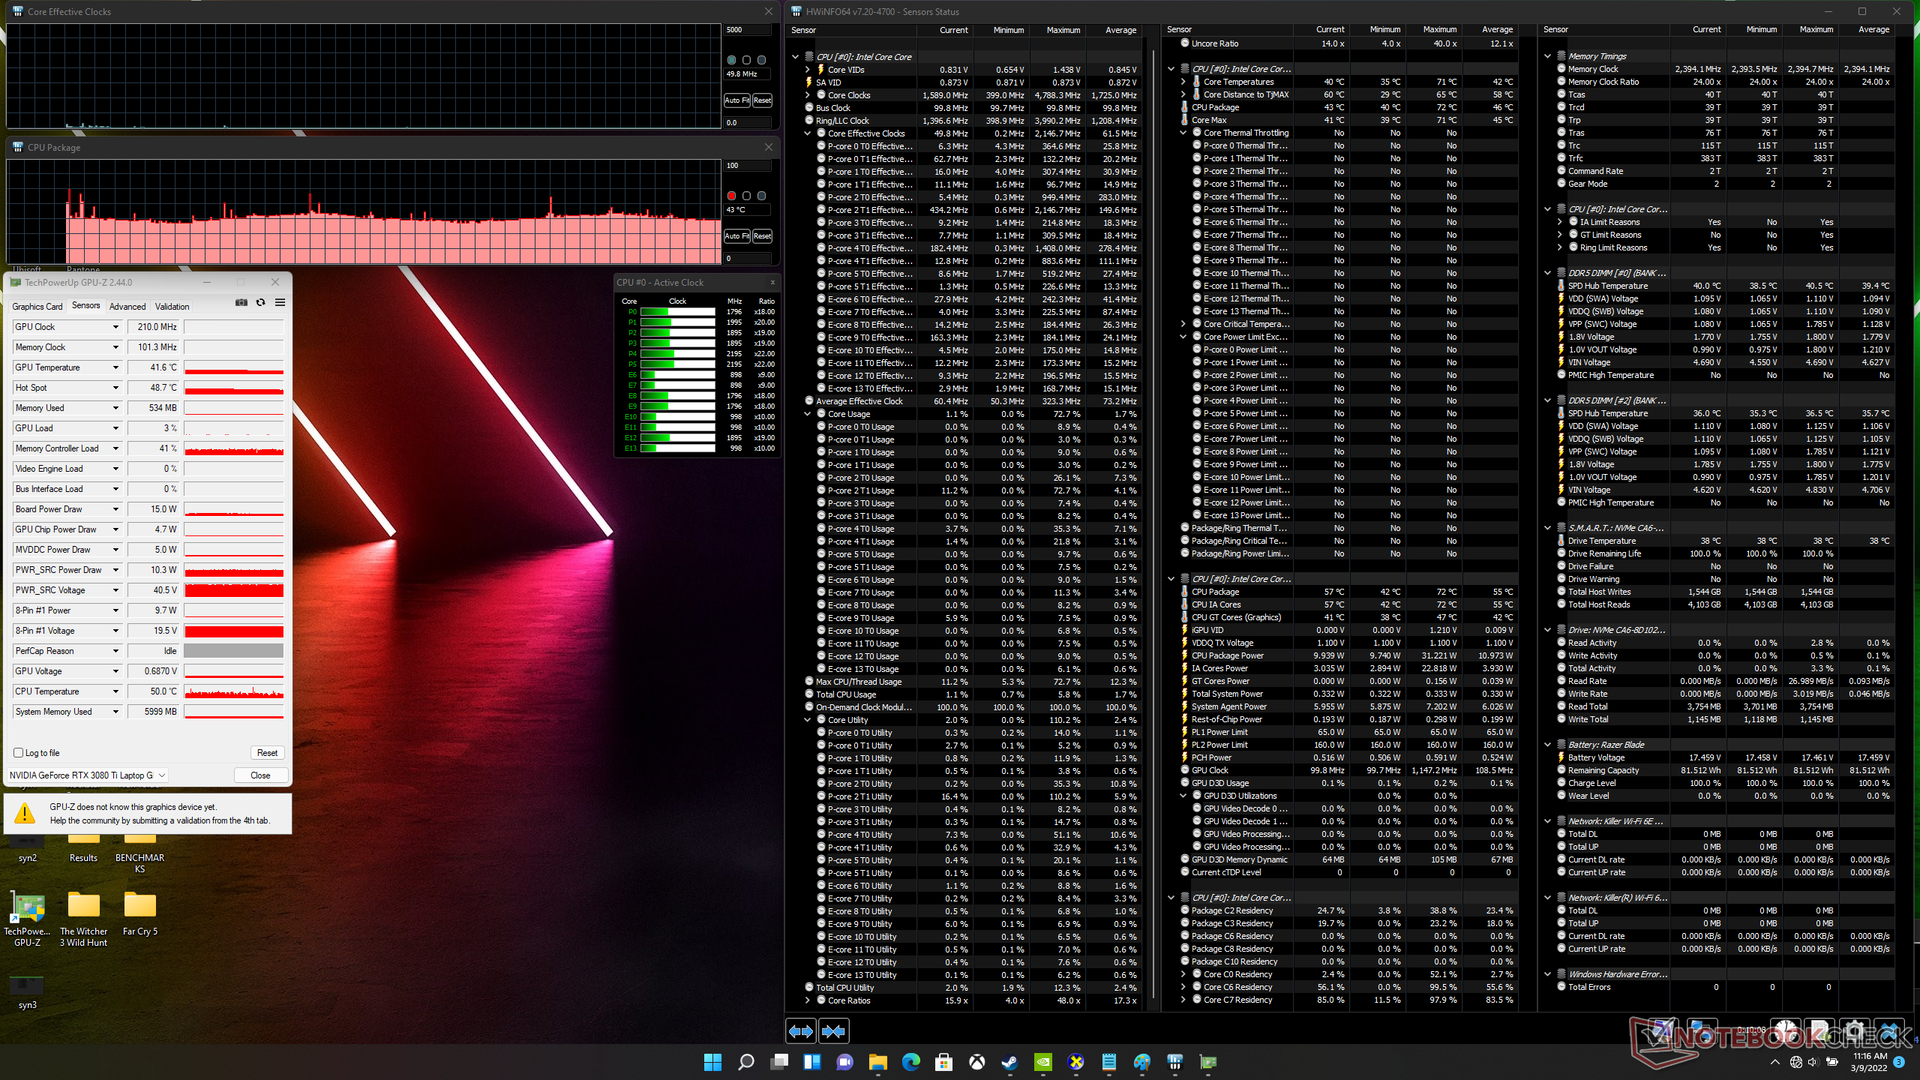
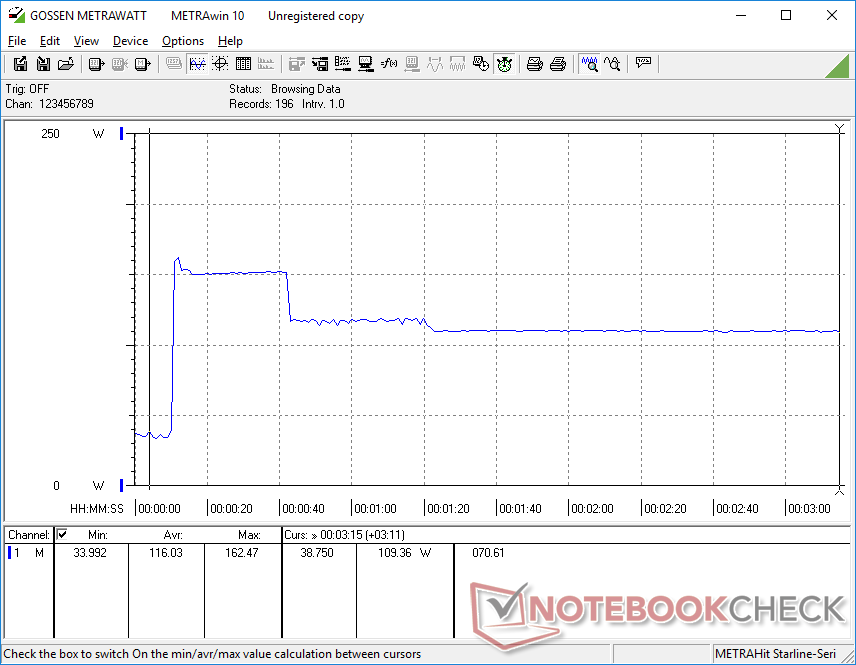
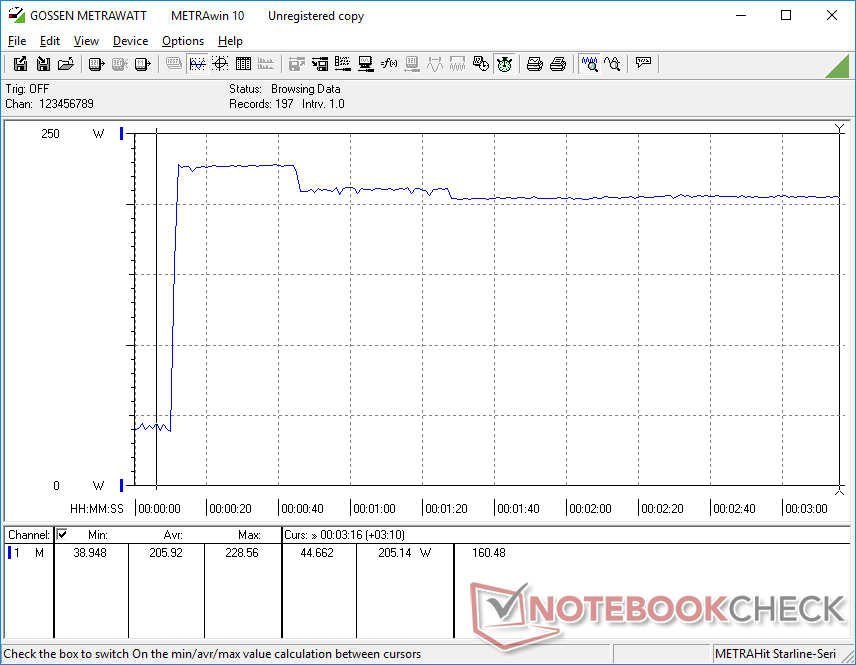
Stresstest
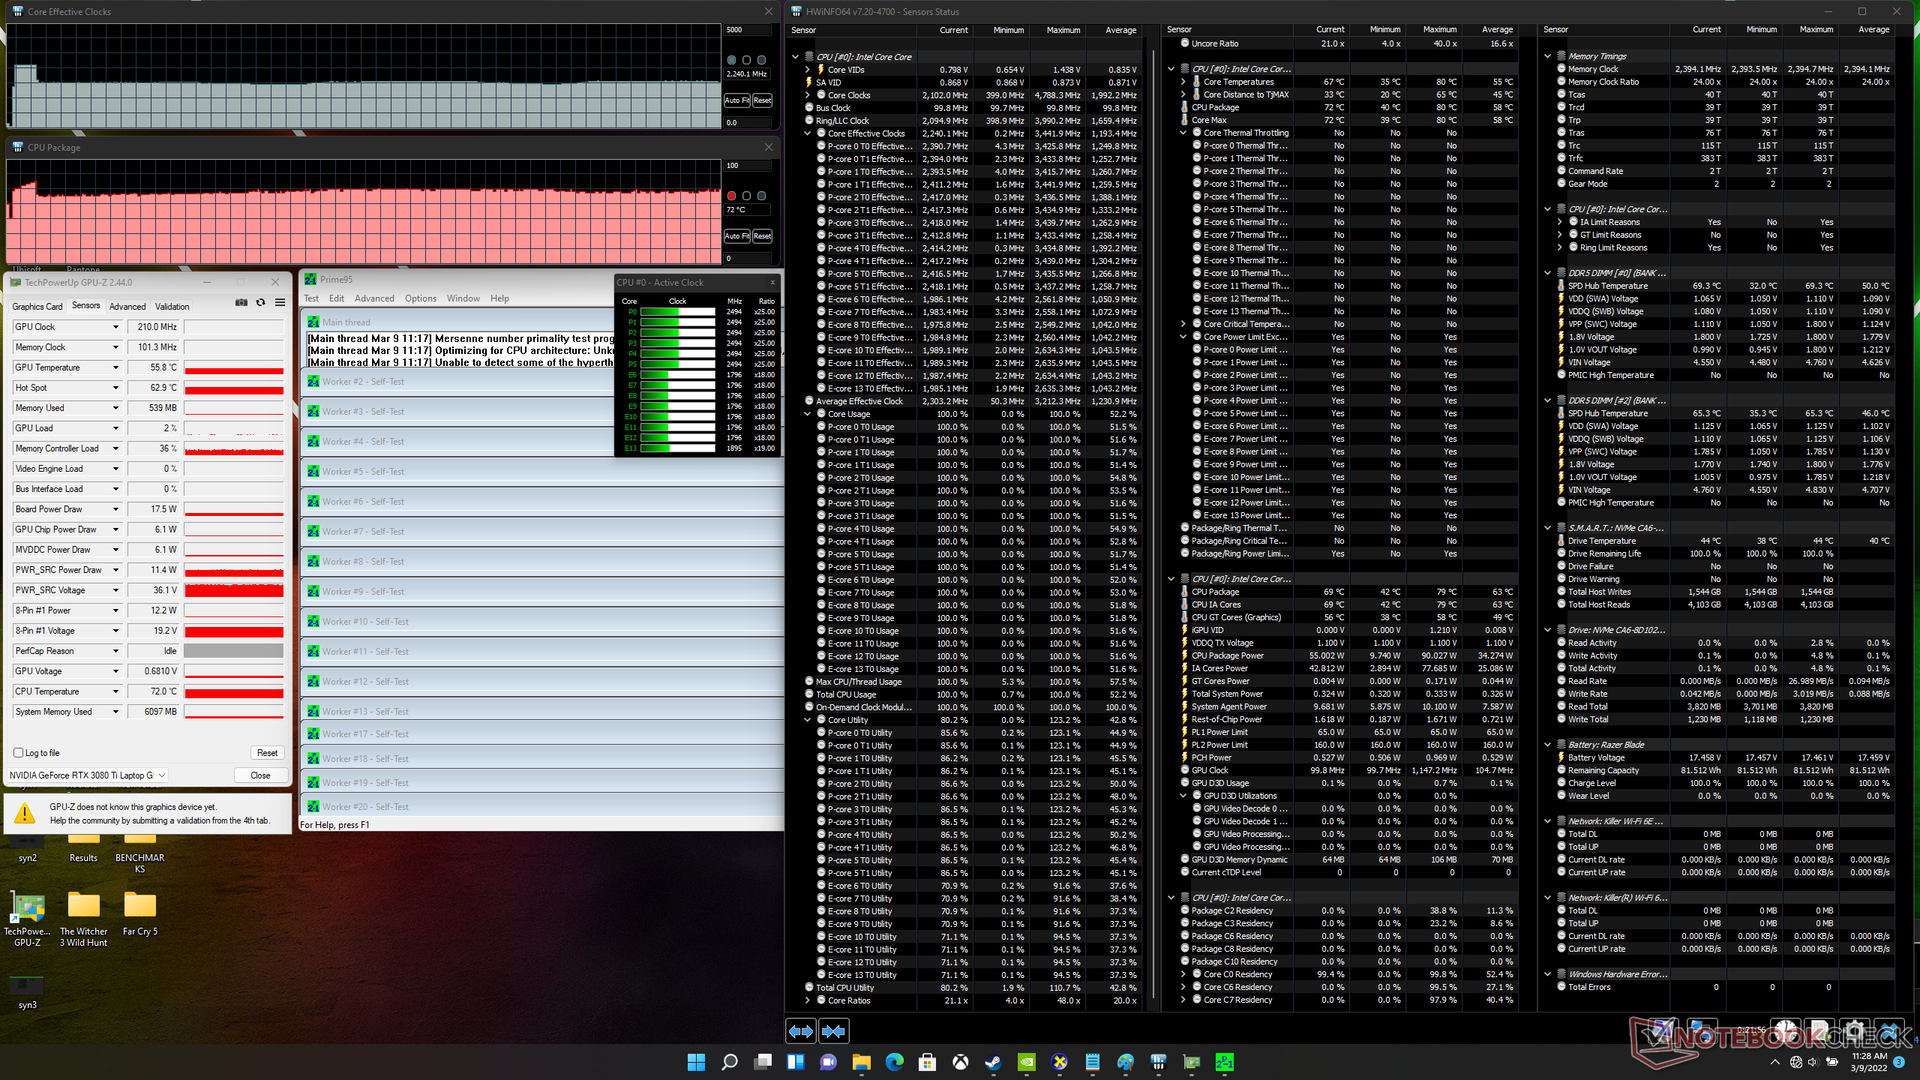
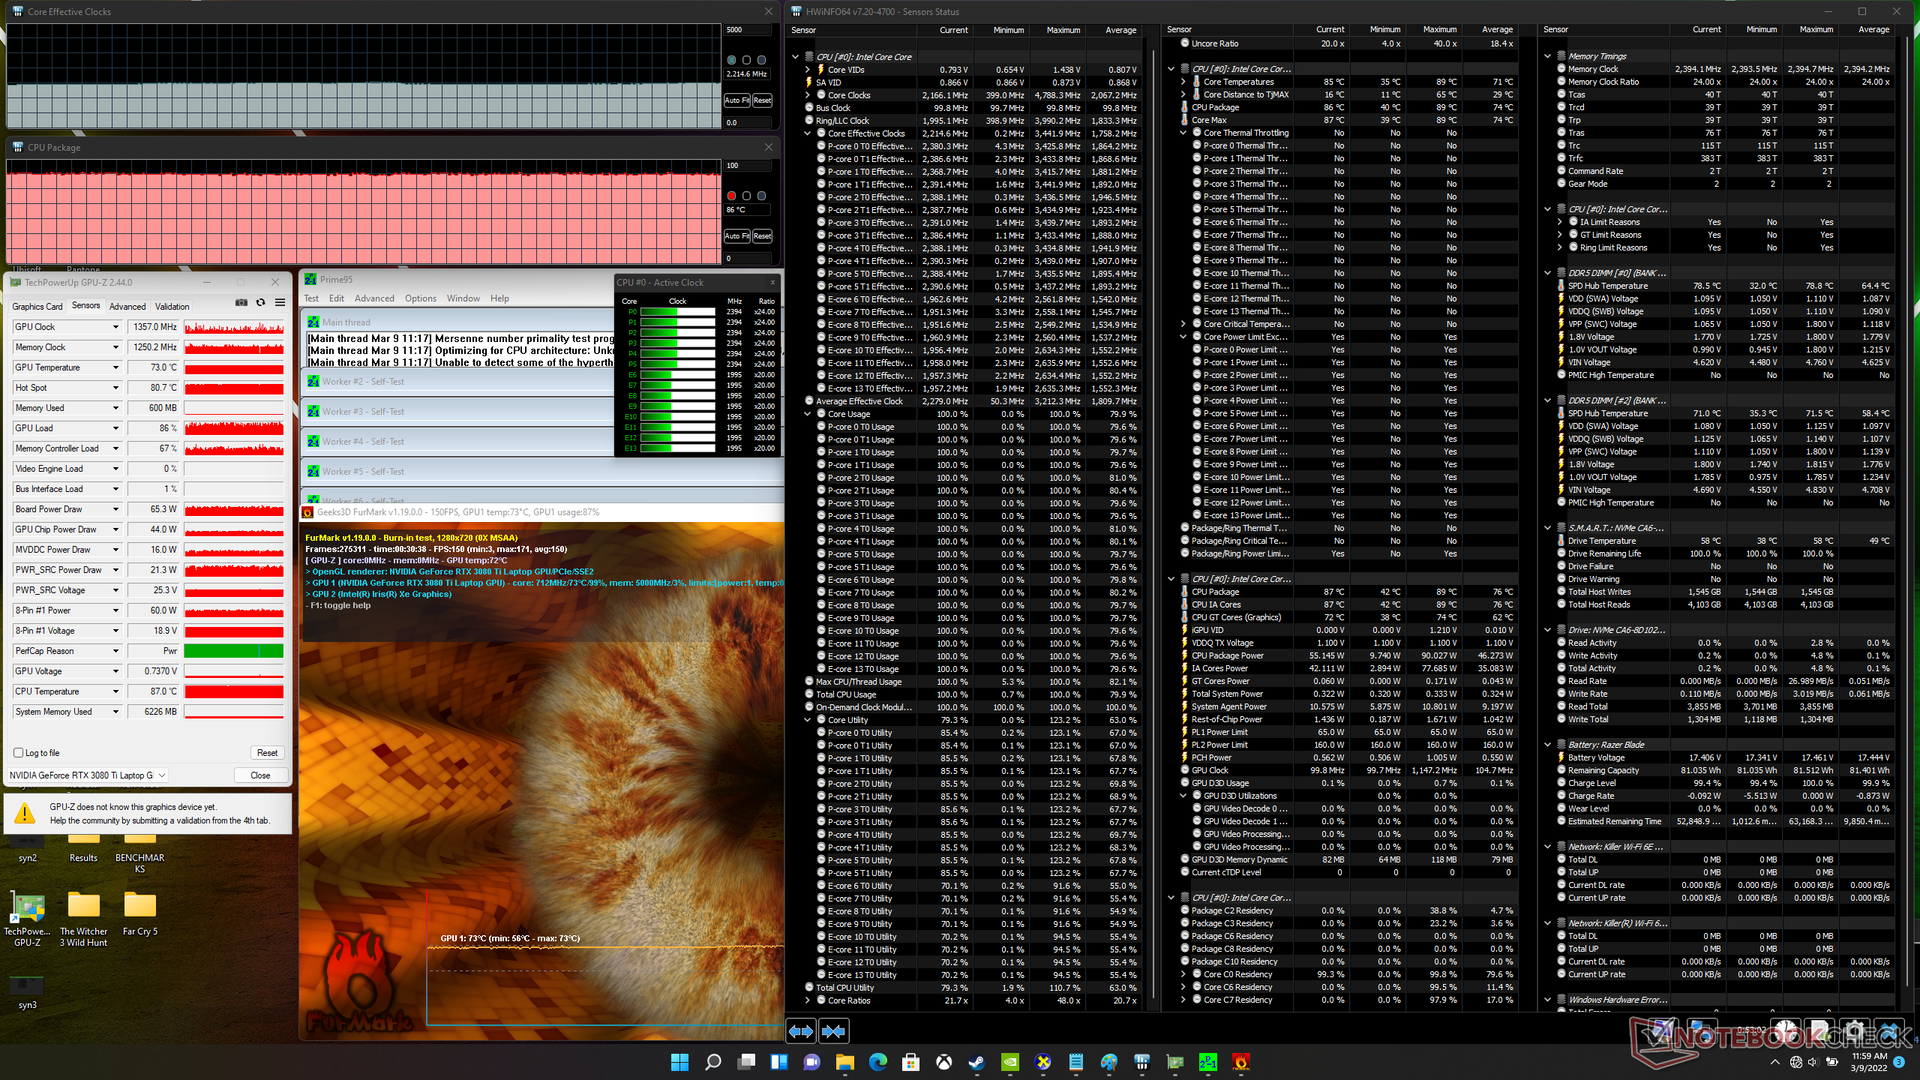
När processorn belastades med Prime95 ökade den till 3,1 GHz under de första sekunderna tills den nådde en kärntemperatur på 80 C. Därefter stabiliserades klockfrekvensen och temperaturen på cirka 2,2 GHz respektive 66 C. CPU-paketförbrukningen skulle också sjunka från den första toppnoteringen på 90 W till mer stabila 55 W.
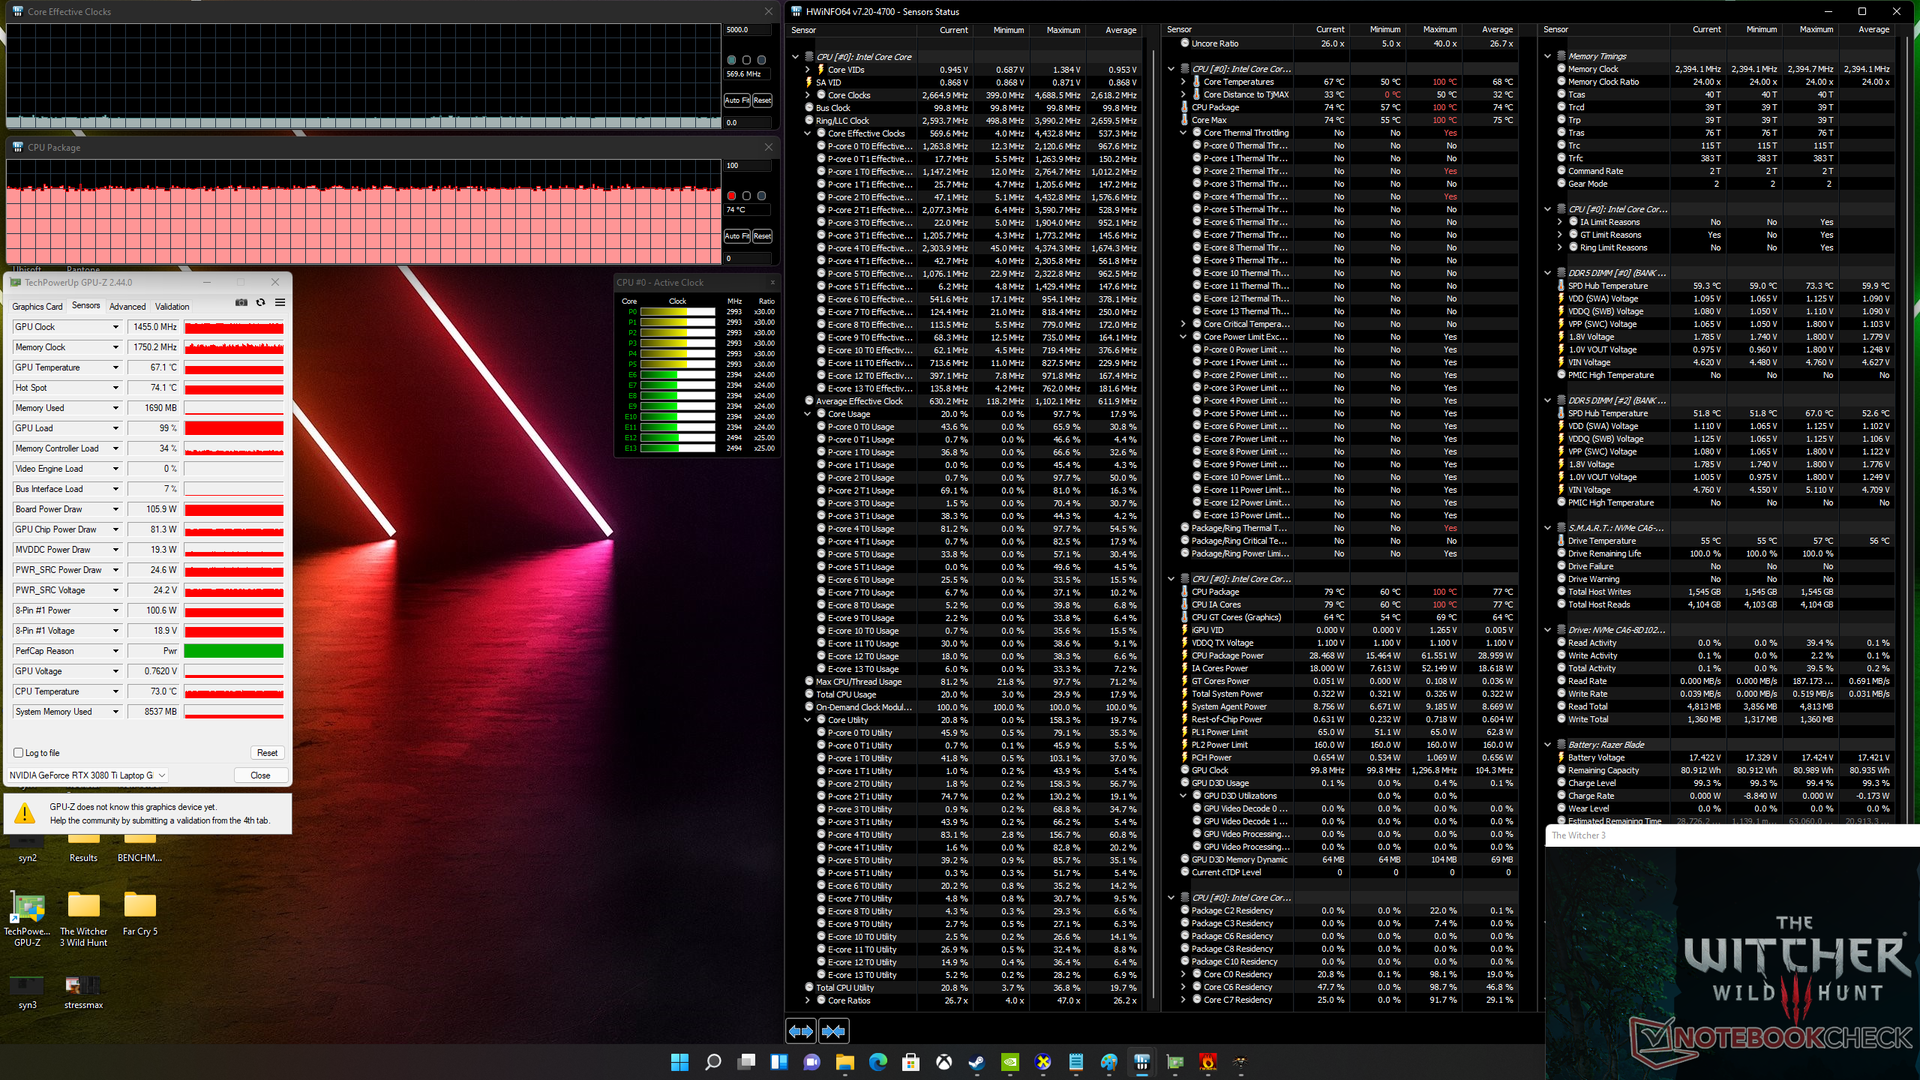
Körning av Witcher 3 skulle leda till att CPU och GPU stabiliseras vid 74 C respektive 67 C, jämfört med 73 C och 71 C på förra årets Blade 15 RTX 3080-modell (eller 67 C och 75 C på Blade 15-basmodellen). Kärntemperaturerna skiljer sig därför inte särskilt mycket från år till år trots ökningarna i CPU- och GPU-prestanda.
Att köra på batteri kommer att begränsa prestandan. Ett Fire Strike -test på batterier skulle ge fysik- och grafikresultat på 10560 respektive 8439 poäng, jämfört med 28455 respektive 28601 poäng när det är på nätet.
| CPU-klocka (GHz) | GPU-klocka (MHz) | Genomsnittlig CPU-temperatur (°C) | Genomsnittlig GPU-temperatur (°C) | |
| System Idle | -- | -- | 43 | 42 |
| Prime95 Stress | 2.2 | -- | 72 | 56 |
| Prime95 + FurMark Stress | 2.2 | ~1357 | 86 | 73 |
| Witcher 3 Stress | 0,6 | 1455 | 74 | 67 |
Högtalare
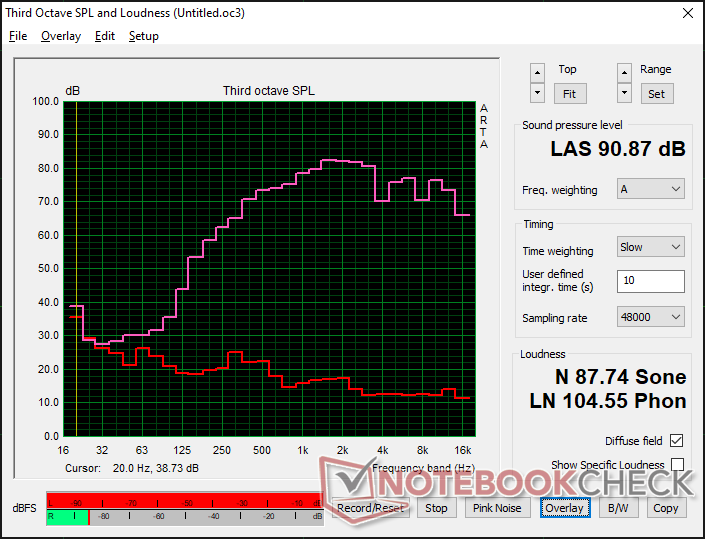
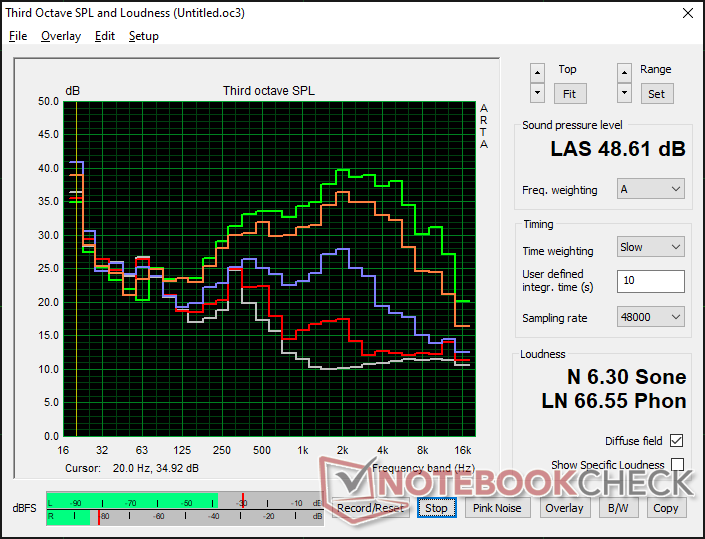
Razer Blade 15 2022 ljudanalys
(+) | högtalare kan spela relativt högt (90.9 dB)
Bas 100 - 315 Hz
(-) | nästan ingen bas - i genomsnitt 21% lägre än medianen
(±) | linjäriteten för basen är genomsnittlig (9.7% delta till föregående frekvens)
Mellan 400 - 2000 Hz
(+) | balanserad mellan - endast 3.9% från medianen
(+) | mids är linjära (3.9% delta till föregående frekvens)
Högsta 2 - 16 kHz
(+) | balanserade toppar - endast 4.2% från medianen
(±) | linjäriteten för toppar är genomsnittlig (7.8% delta till föregående frekvens)
Totalt 100 - 16 000 Hz
(±) | linjäriteten för det totala ljudet är genomsnittlig (15.7% skillnad mot median)
Jämfört med samma klass
» 37% av alla testade enheter i den här klassen var bättre, 7% liknande, 57% sämre
» Den bästa hade ett delta på 6%, genomsnittet var 18%, sämst var 132%
Jämfört med alla testade enheter
» 24% av alla testade enheter var bättre, 5% liknande, 71% sämre
» Den bästa hade ett delta på 4%, genomsnittet var 23%, sämst var 134%
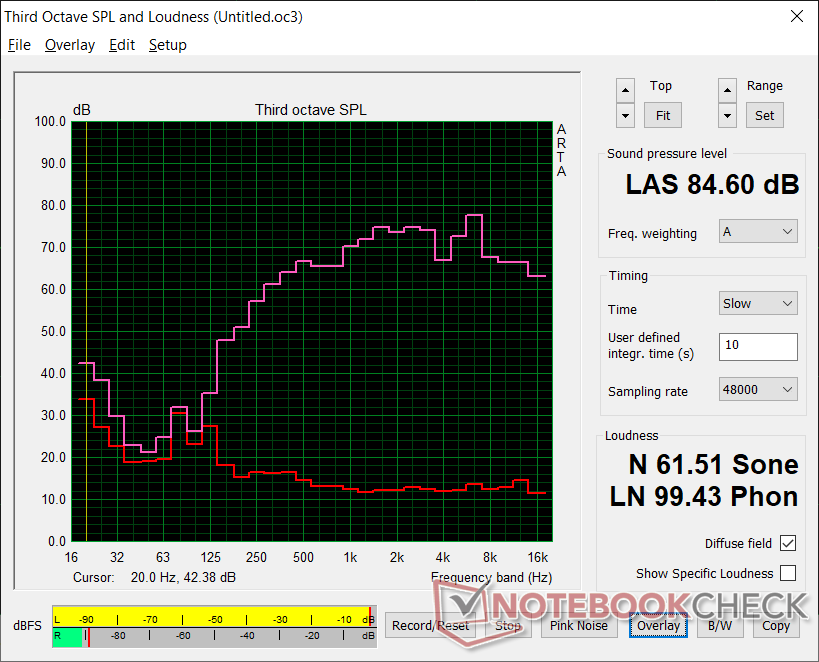
Apple MacBook Pro 16 2021 M1 Pro ljudanalys
(+) | högtalare kan spela relativt högt (84.7 dB)
Bas 100 - 315 Hz
(+) | bra bas - bara 3.8% från medianen
(+) | basen är linjär (5.2% delta till föregående frekvens)
Mellan 400 - 2000 Hz
(+) | balanserad mellan - endast 1.3% från medianen
(+) | mids är linjära (2.1% delta till föregående frekvens)
Högsta 2 - 16 kHz
(+) | balanserade toppar - endast 1.9% från medianen
(+) | toppar är linjära (2.7% delta till föregående frekvens)
Totalt 100 - 16 000 Hz
(+) | det totala ljudet är linjärt (4.6% skillnad mot median)
Jämfört med samma klass
» 0% av alla testade enheter i den här klassen var bättre, 0% liknande, 100% sämre
» Den bästa hade ett delta på 5%, genomsnittet var 17%, sämst var 45%
Jämfört med alla testade enheter
» 0% av alla testade enheter var bättre, 0% liknande, 100% sämre
» Den bästa hade ett delta på 4%, genomsnittet var 23%, sämst var 134%
Energiförvaltning
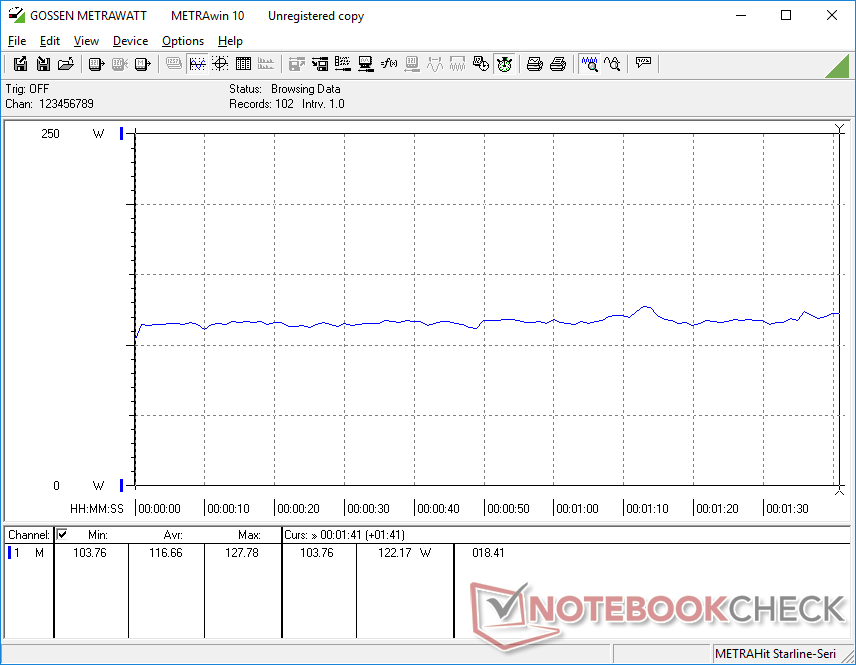
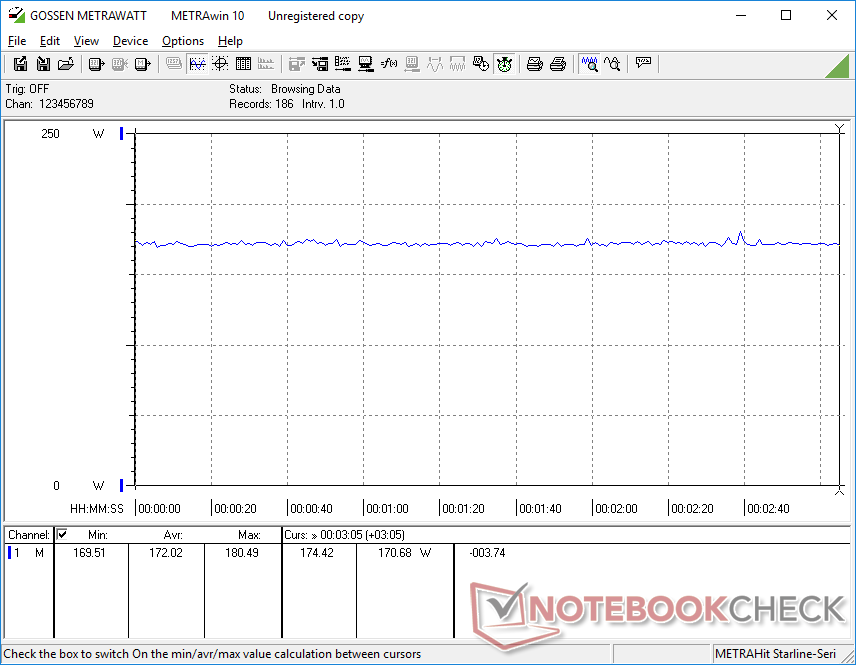
Effektförbrukning
Användarna får mer än dubbelt så hög CPU-prestanda med flera trådar och 15-25 procent bättre grafikprestanda jämfört med Blade 15 från början av 2021. Strömförbrukningen är därefter högre på vår senaste Blade 15-modell med upp till 60 W när den är fullt belastad eller cirka 30 W när den kör spel. Schenker XMG Neo 15 E22 med sin 175 W RTX 3080 Ti kommer att förbruka ännu mer ström än vår Blade 15 och dess 110 W RTX 3080 Ti
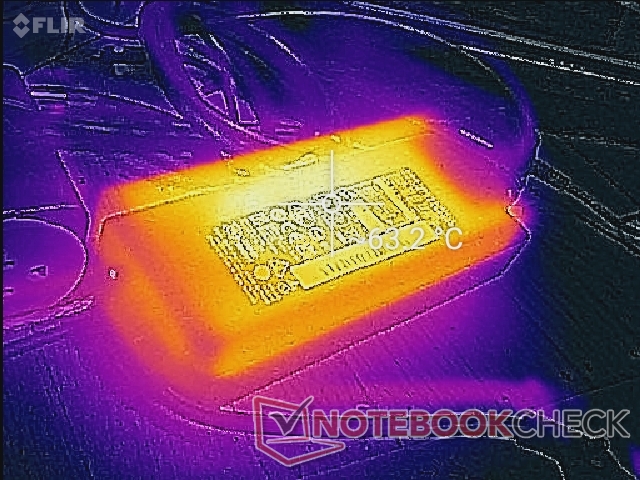
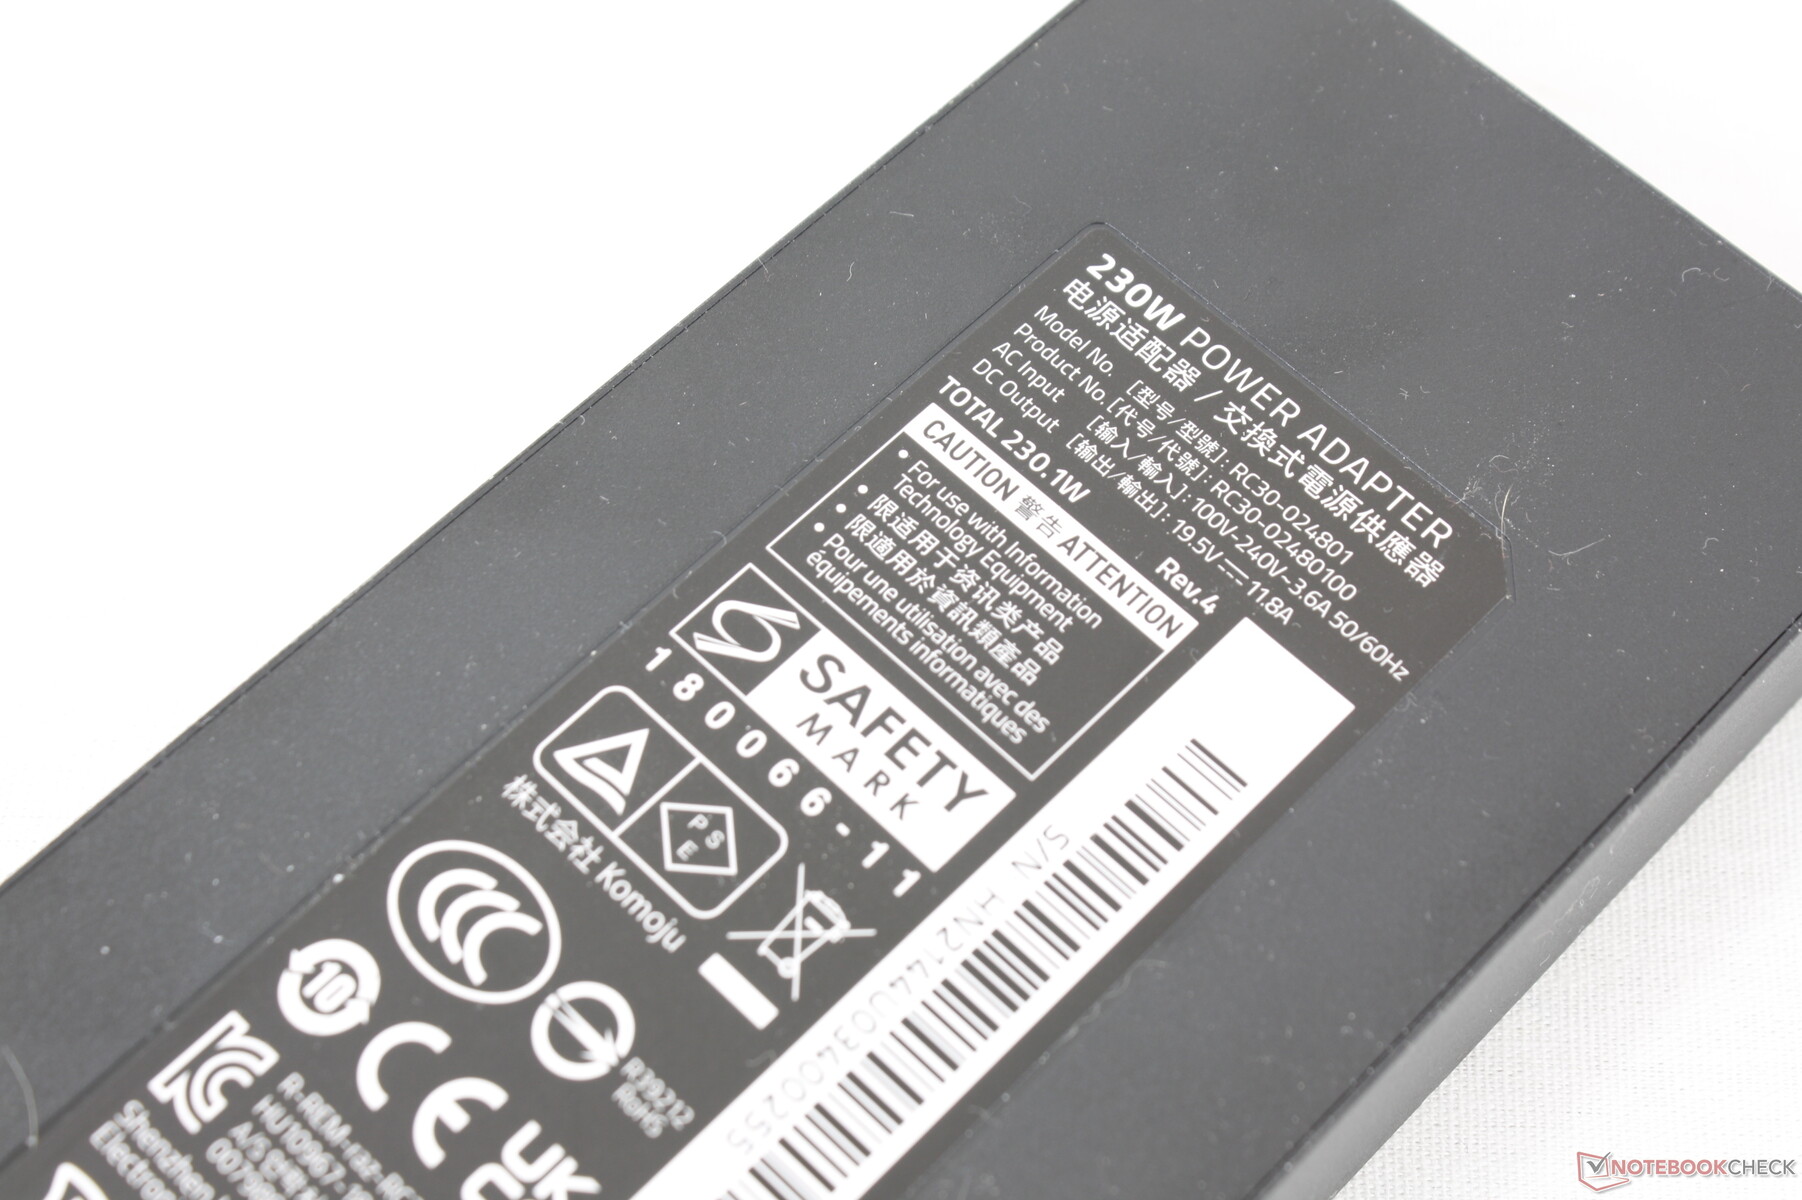
230 W AC-adaptern är relativt liten (~17 x 7 x 2,5 cm) jämfört med de flesta andra adaptrar med motsvarande effekt för att underlätta transporten. Vi kan registrera ett tillfälligt maximalt uttag på 228 W när både CPU och GPU är 100 procent utnyttjade.
| Av/Standby | |
| Låg belastning | |
| Hög belastning |
|
Förklaring:
min: | |
| Razer Blade 15 2022 i7-12800H, GeForce RTX 3080 Ti Laptop GPU, SSSTC CA6-8D1024, IPS, 2560x1440, 15.6" | Razer Blade 15 Advanced Model Early 2021 i7-10875H, GeForce RTX 3080 Laptop GPU, Samsung PM981a MZVLB1T0HBLR, IPS, 1920x1080, 15.6" | Razer Blade 15 RTX 2080 Super Max-Q i7-10875H, GeForce RTX 2080 Super Max-Q, Samsung PM981a MZVLB1T0HBLR, IPS, 1920x1080, 15.6" | Schenker XMG Neo 15 E22 (Early 2022, RTX 3080 Ti) i7-12700H, GeForce RTX 3080 Ti Laptop GPU, Samsung SSD 980 Pro 250GB MZ-V8P250BW, IPS, 2560x1440, 15.6" | ADATA XPG Xenia 15 i7-11800H, GeForce RTX 3070 Laptop GPU, ADATA XPG Gammix S70 1TB, IPS, 2560x1440, 15.6" | Eurocom Nightsky ARX315 R9 5900X, GeForce RTX 3070 Laptop GPU, Samsung SSD 980 Pro 1TB MZ-V8P1T0BW, IPS, 1920x1080, 15.6" | |
|---|---|---|---|---|---|---|
| Power Consumption | 39% | 37% | 15% | 27% | -54% | |
| Idle Minimum * (Watt) | 33.2 | 13 61% | 10.6 68% | 14 58% | 8.9 73% | 55 -66% |
| Idle Average * (Watt) | 36.4 | 15 59% | 13.1 64% | 18 51% | 14.4 60% | 68.2 -87% |
| Idle Maximum * (Watt) | 37.6 | 22 41% | 15.8 58% | 19 49% | 31.1 17% | 72.5 -93% |
| Load Average * (Watt) | 116.7 | 98 16% | 131 -12% | 115 1% | 97 17% | 149.2 -28% |
| Witcher 3 ultra * (Watt) | 172 | 126 27% | 146 15% | 228 -33% | 188 -9% | 233 -35% |
| Load Maximum * (Watt) | 228.6 | 165 28% | 169 26% | 307 -34% | 222.2 3% | 255.8 -12% |
* ... mindre är bättre
Power Consumption Witcher 3 / Stresstest
Power Consumption external Monitor
Batteritid
WLAN-körtiderna är kortare än på tidigare modeller, vilket delvis beror på den mer krävande 1440p 240 Hz-panelen. Vi kan pressa fram nästan 5 timmars verklig WLAN-användning när vi använder den balanserade strömprofilen med Nvidia Optimus inställd på iGPU:n och skärmen inställd på 150 nits. Som jämförelse kan vi pressa fram 6 timmar eller längre på 2021 Blade 15 när vi har liknande testförhållanden
Laddning från tom till full kapacitet med den medföljande nätadaptern tar under 90 minuter. Systemet kan även laddas via USB-C-adaptrar från tredje part.
| Razer Blade 15 2022 i7-12800H, GeForce RTX 3080 Ti Laptop GPU, 80 Wh | Razer Blade 15 Advanced Model Early 2021 i7-10875H, GeForce RTX 3080 Laptop GPU, 80 Wh | Razer Blade 15 RTX 2080 Super Max-Q i7-10875H, GeForce RTX 2080 Super Max-Q, 80 Wh | Schenker XMG Neo 15 E22 (Early 2022, RTX 3080 Ti) i7-12700H, GeForce RTX 3080 Ti Laptop GPU, 93 Wh | ADATA XPG Xenia 15 i7-11800H, GeForce RTX 3070 Laptop GPU, 94 Wh | Eurocom Nightsky ARX315 R9 5900X, GeForce RTX 3070 Laptop GPU, 62 Wh | |
|---|---|---|---|---|---|---|
| Batteridrifttid | 84% | 24% | 37% | 78% | -80% | |
| WiFi v1.3 (h) | 4.9 | 9 84% | 6.1 24% | 6.7 37% | 8.7 78% | 1 -80% |
| Reader / Idle (h) | 14.4 | 8.7 | 14 | |||
| H.264 (h) | 8.9 | 7.3 | 6.9 | |||
| Load (h) | 2 | 1.9 | 3.8 | 1.5 |
För
Emot
Omdöme
2022 Blade 15 erbjuder ungefär 15 till 25 procent snabbare grafikprestanda och 20 procent snabbare CPU-prestanda jämfört med förra årets Core i7-11800H och RTX 3080-modell. Tack och lov behöver systemet inte köras märkbart högre eller varmare för att uppnå snabbare resultat, men både strömförbrukningen och batteritiden tar stryk. Den högre förbrukningen i synnerhet verkar vara en trend bland många bärbara datorer med 12:e generationen Core, inklusive Schenker Uniwill Technology GM7AG8P eller MSI Vector GP66, jämfört med sina motsvarigheter från föregående generation. Vi är också glada över att inte se en CPU-prestanda under genomsnittet, vilket var fallet med 10:e generationens Core i7-10875H-modell.
Blade 15 med 12:e generationens Intel klämmer in ännu mer prestanda i en välbekant design utan att behöva kompromissa med varken ljudnivå eller värme. Räkna dock inte med att batteritiden blir längre.
Med detta i åtanke är den nyaste Blade 15 den iterativa årliga uppdateringen av ett redan utmärkt chassi. De större traditionella tangentbordsskivorna välkomnas särskilt för dem som inte var fans av Razers optiska tangentbords "experiment" på 2019 års Blade 15 medan den relativt lilla AC-adaptern förtjänar ett erkännande för att den är mer portabel än de flesta andra. Kanske kan nästa års modell äntligen lägga till en webbkameraavstängare som många billigare bärbara datorer kommer med numera.
Pris och tillgänglighet
Razer levererar nu 2022 Blade 15 och Blade 17. Vår specifika konfiguration är tillgänglig för 3700 USD.
Razer Blade 15 2022
- 03/12/2022 v7 (old)
Allen Ngo
Price comparison

