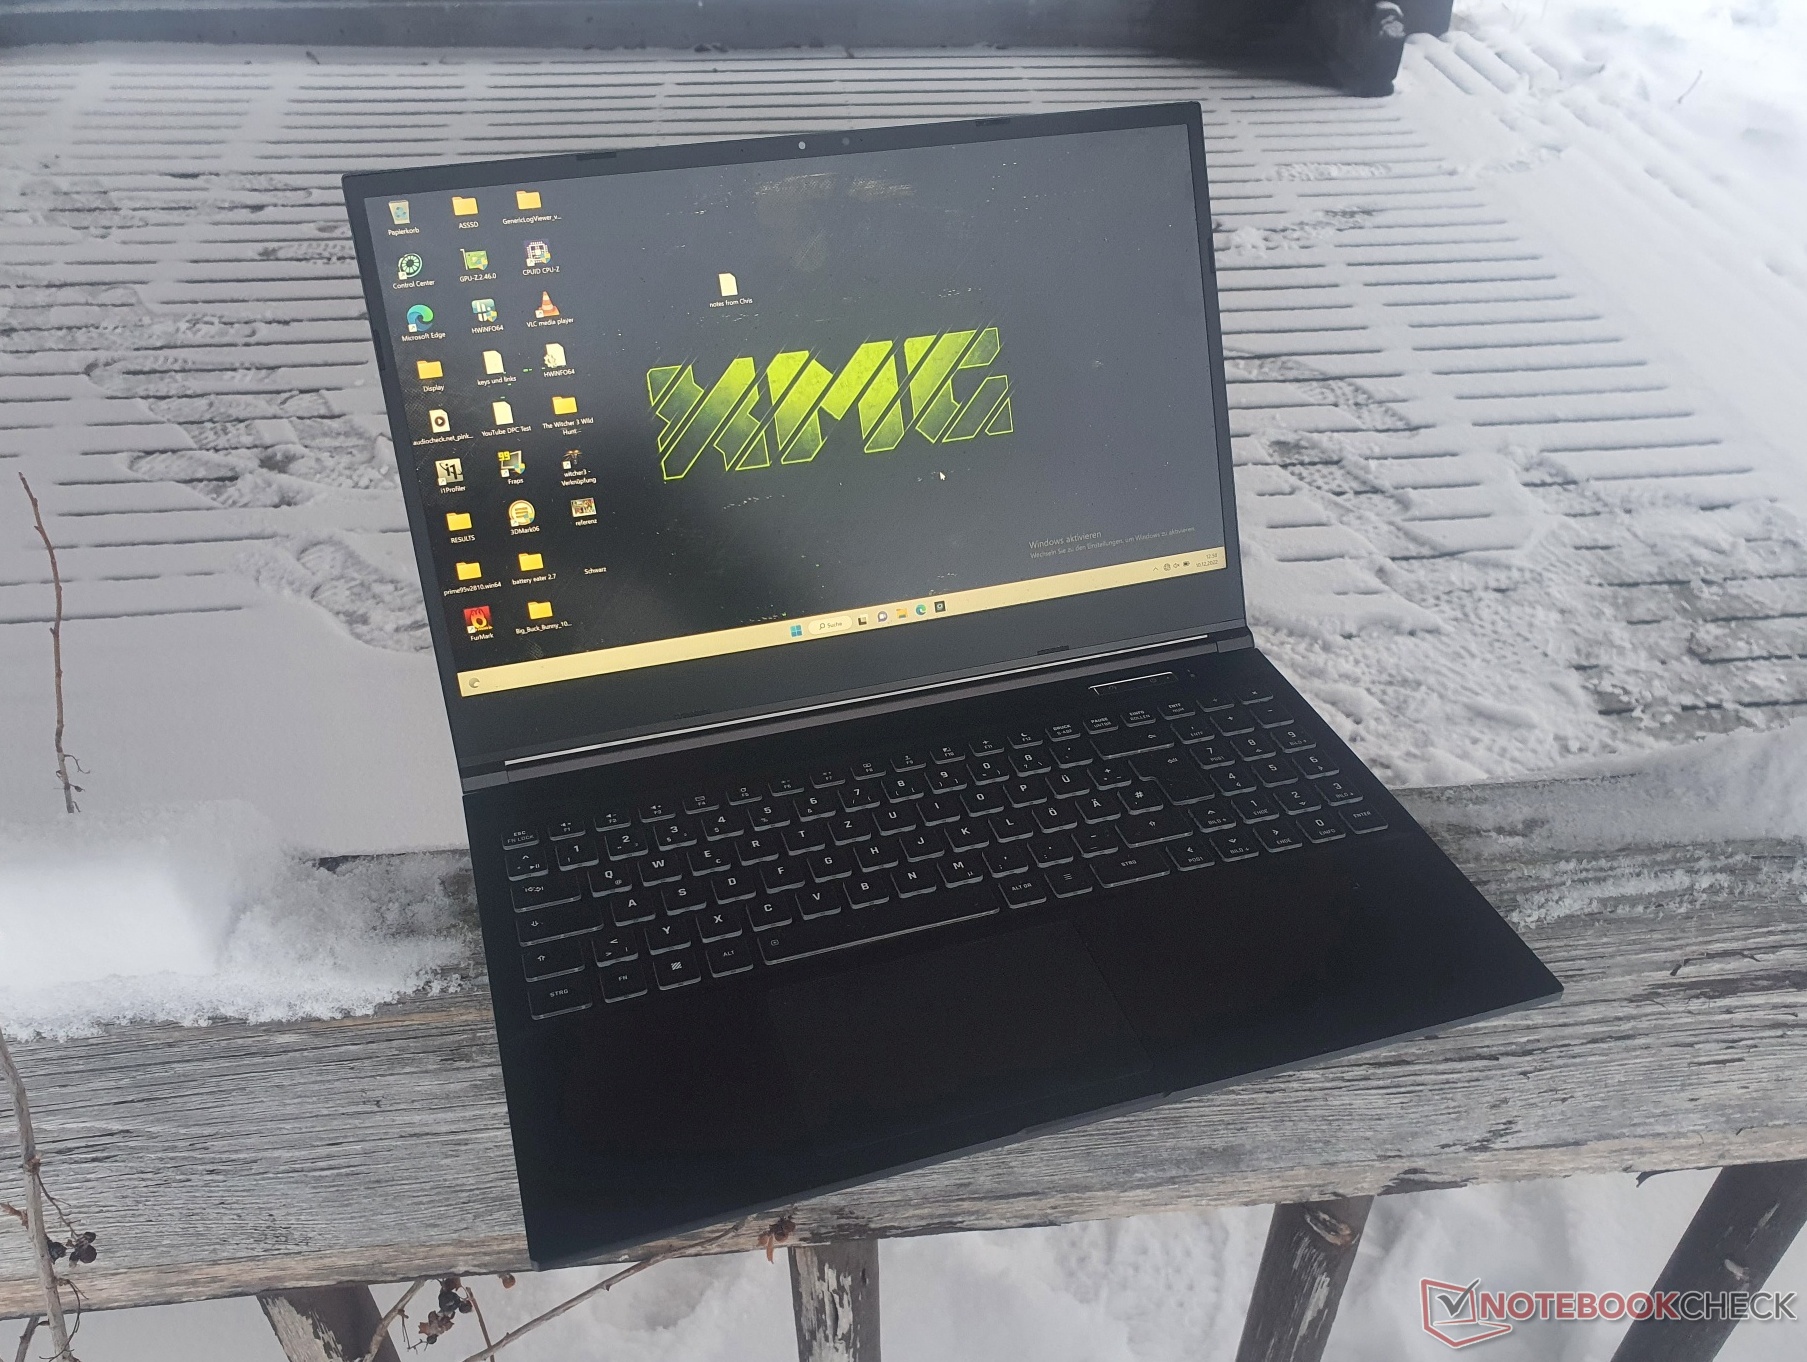
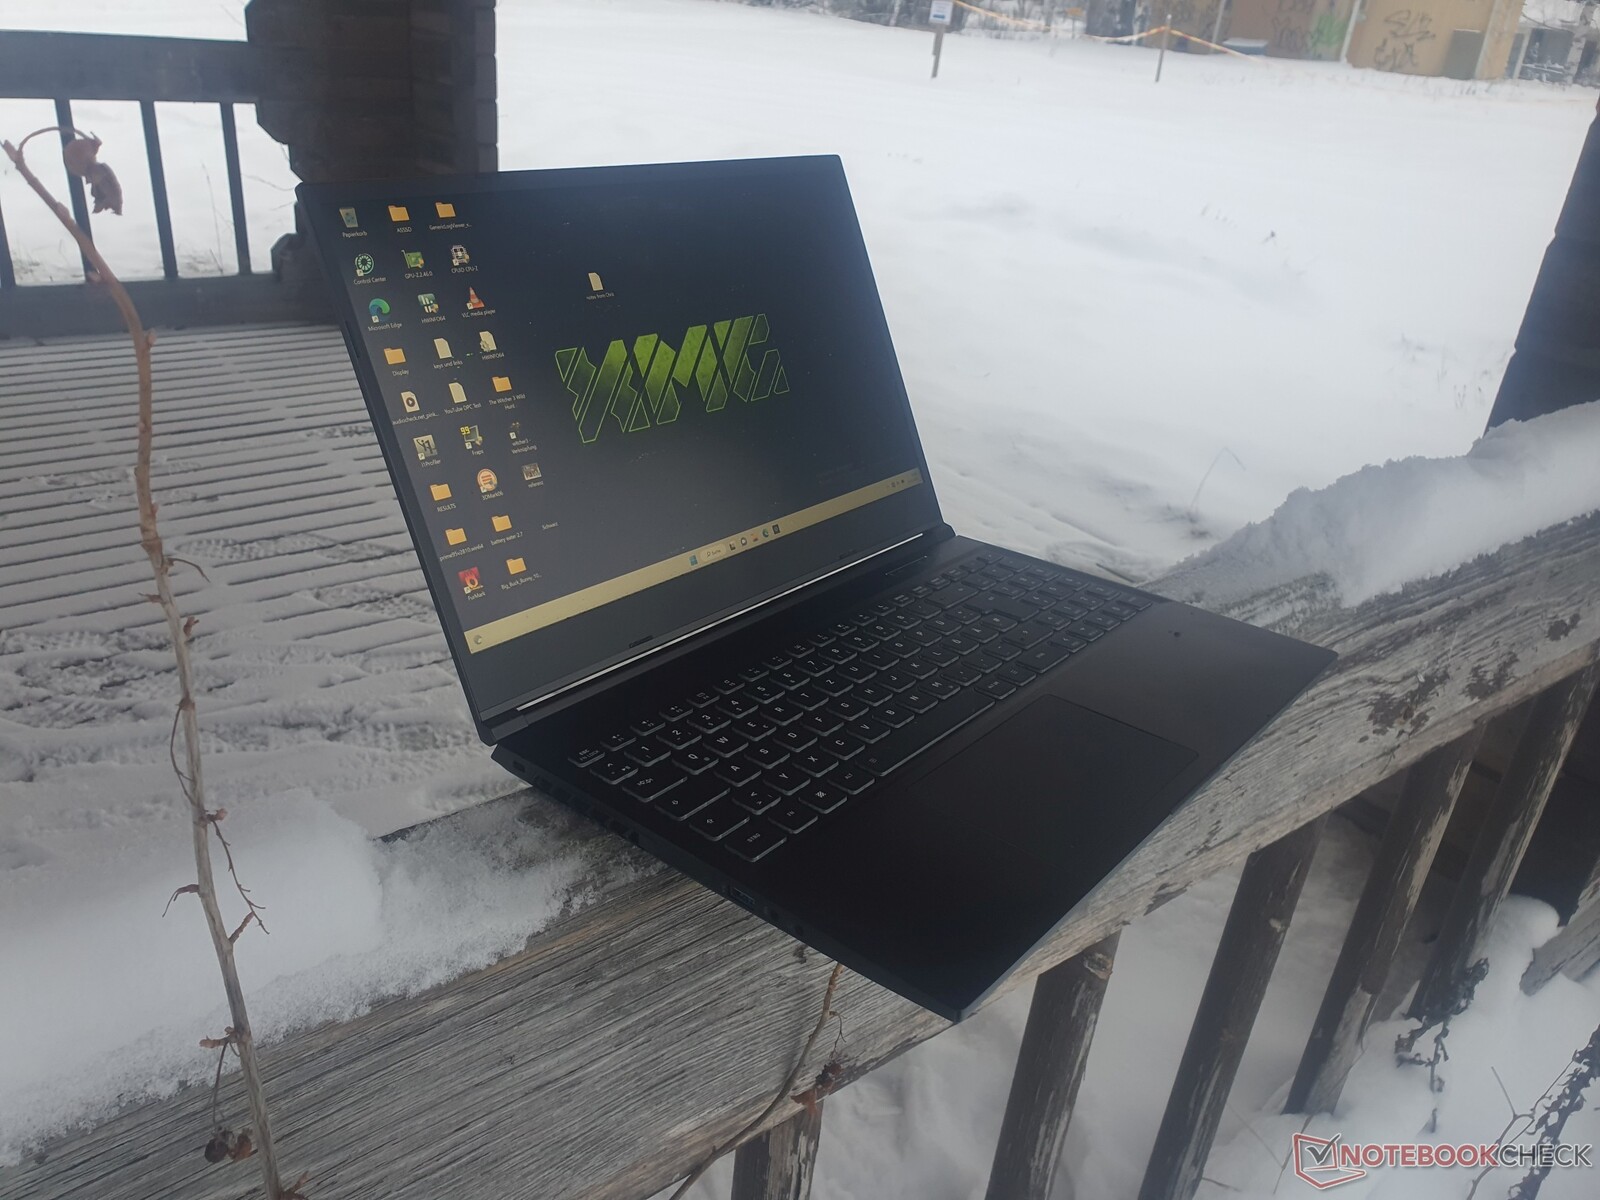
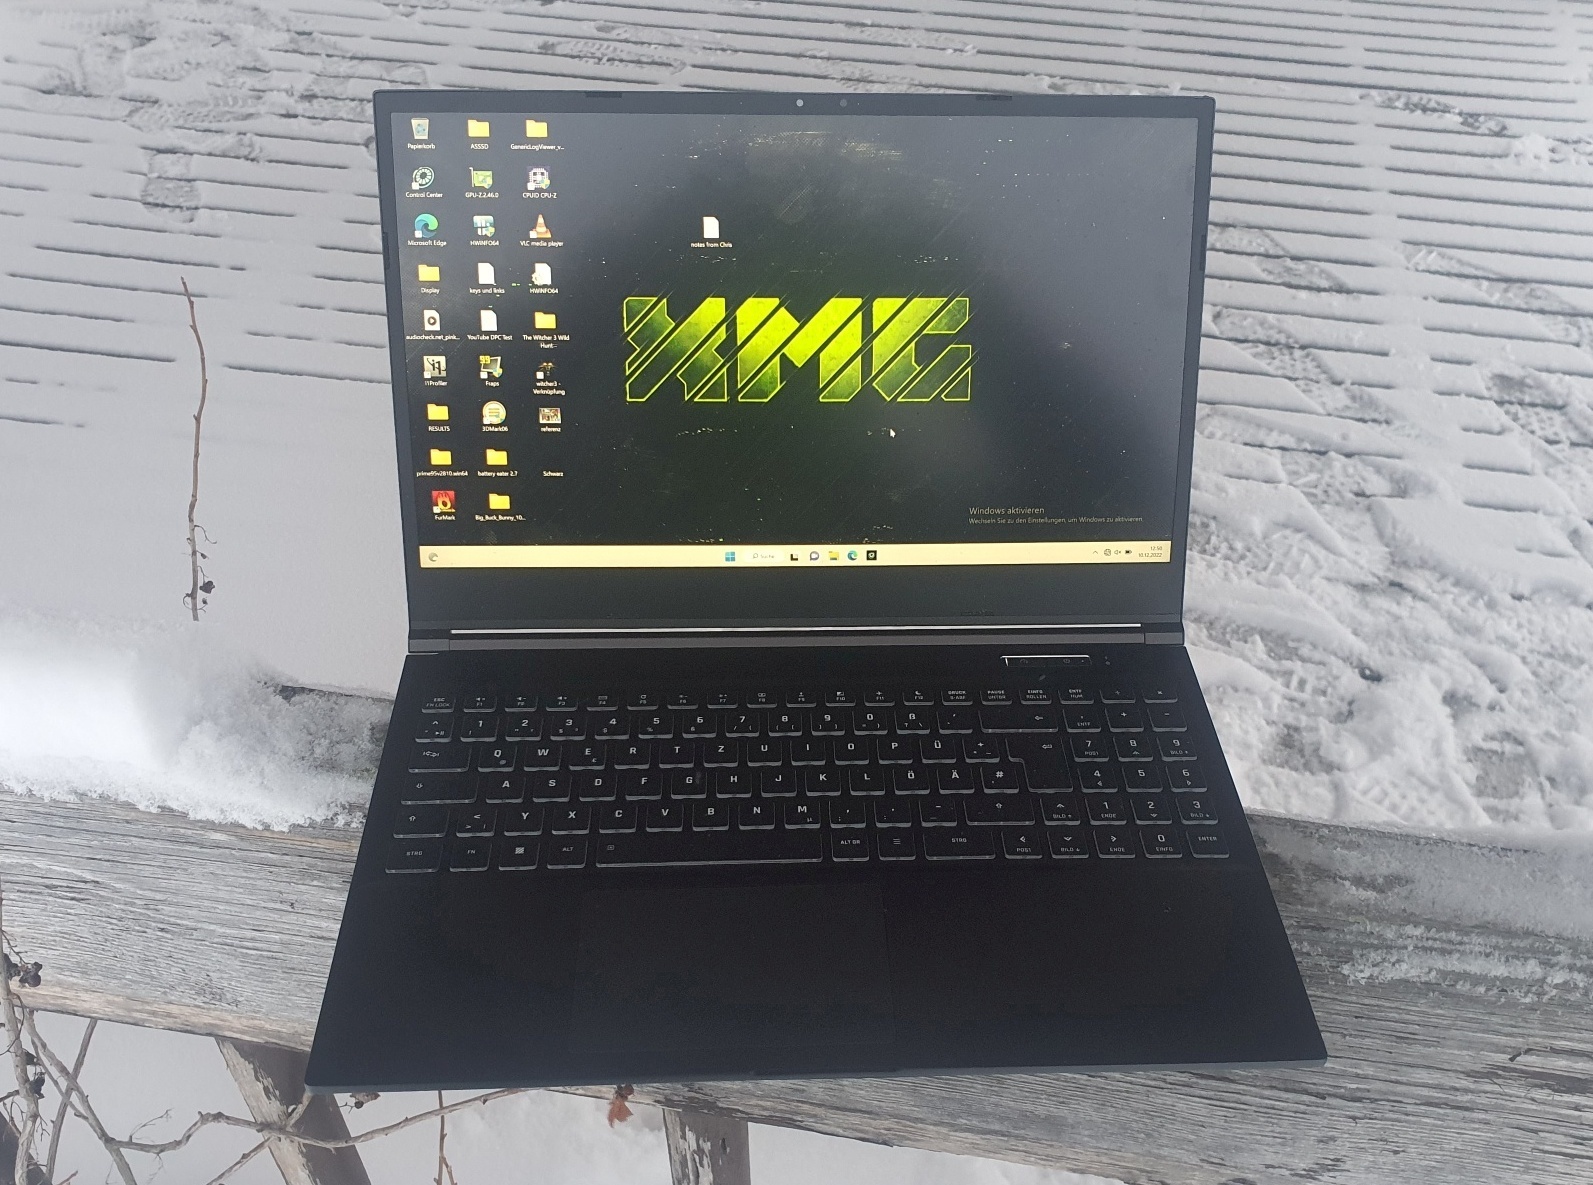
Schenker XMG Core 15 M22 i recension: Gaming midrange med vattenanslutning
Schenker har gjort det till sitt mål att leverera en stark bärbar dator för spel i övre mellanklassen med XMG Core 15 (M22). Detta innebär att den inte bara erbjuder den maximala 140 W TGP för Nvidia GeForce RTX 3060 inklusive MUX-switch, utan även en snabb AMD Ryzen 7 6800H.
Du får en 165 Hz snabb WQHD-panel samt stöd för en extern vattenkylning, som annars bara används i Schenkers absoluta överklass, vilket vi till exempel har sett i den XMG Neo 15, som vi redan har testat i detalj. Allt detta finns tillgängligt för 1 817 euro (~1935 dollar). Core 15 placerar sig mellan Apex 15 och Neo 15.
Det finns gott om konkurrens i mellanklassegmentet, till exempel Asus'TUF Gaming F15, Lenovos Legion 5och Alienware m15. XMG:s egen Fusion 15 är också intressant för vår jämförelse.
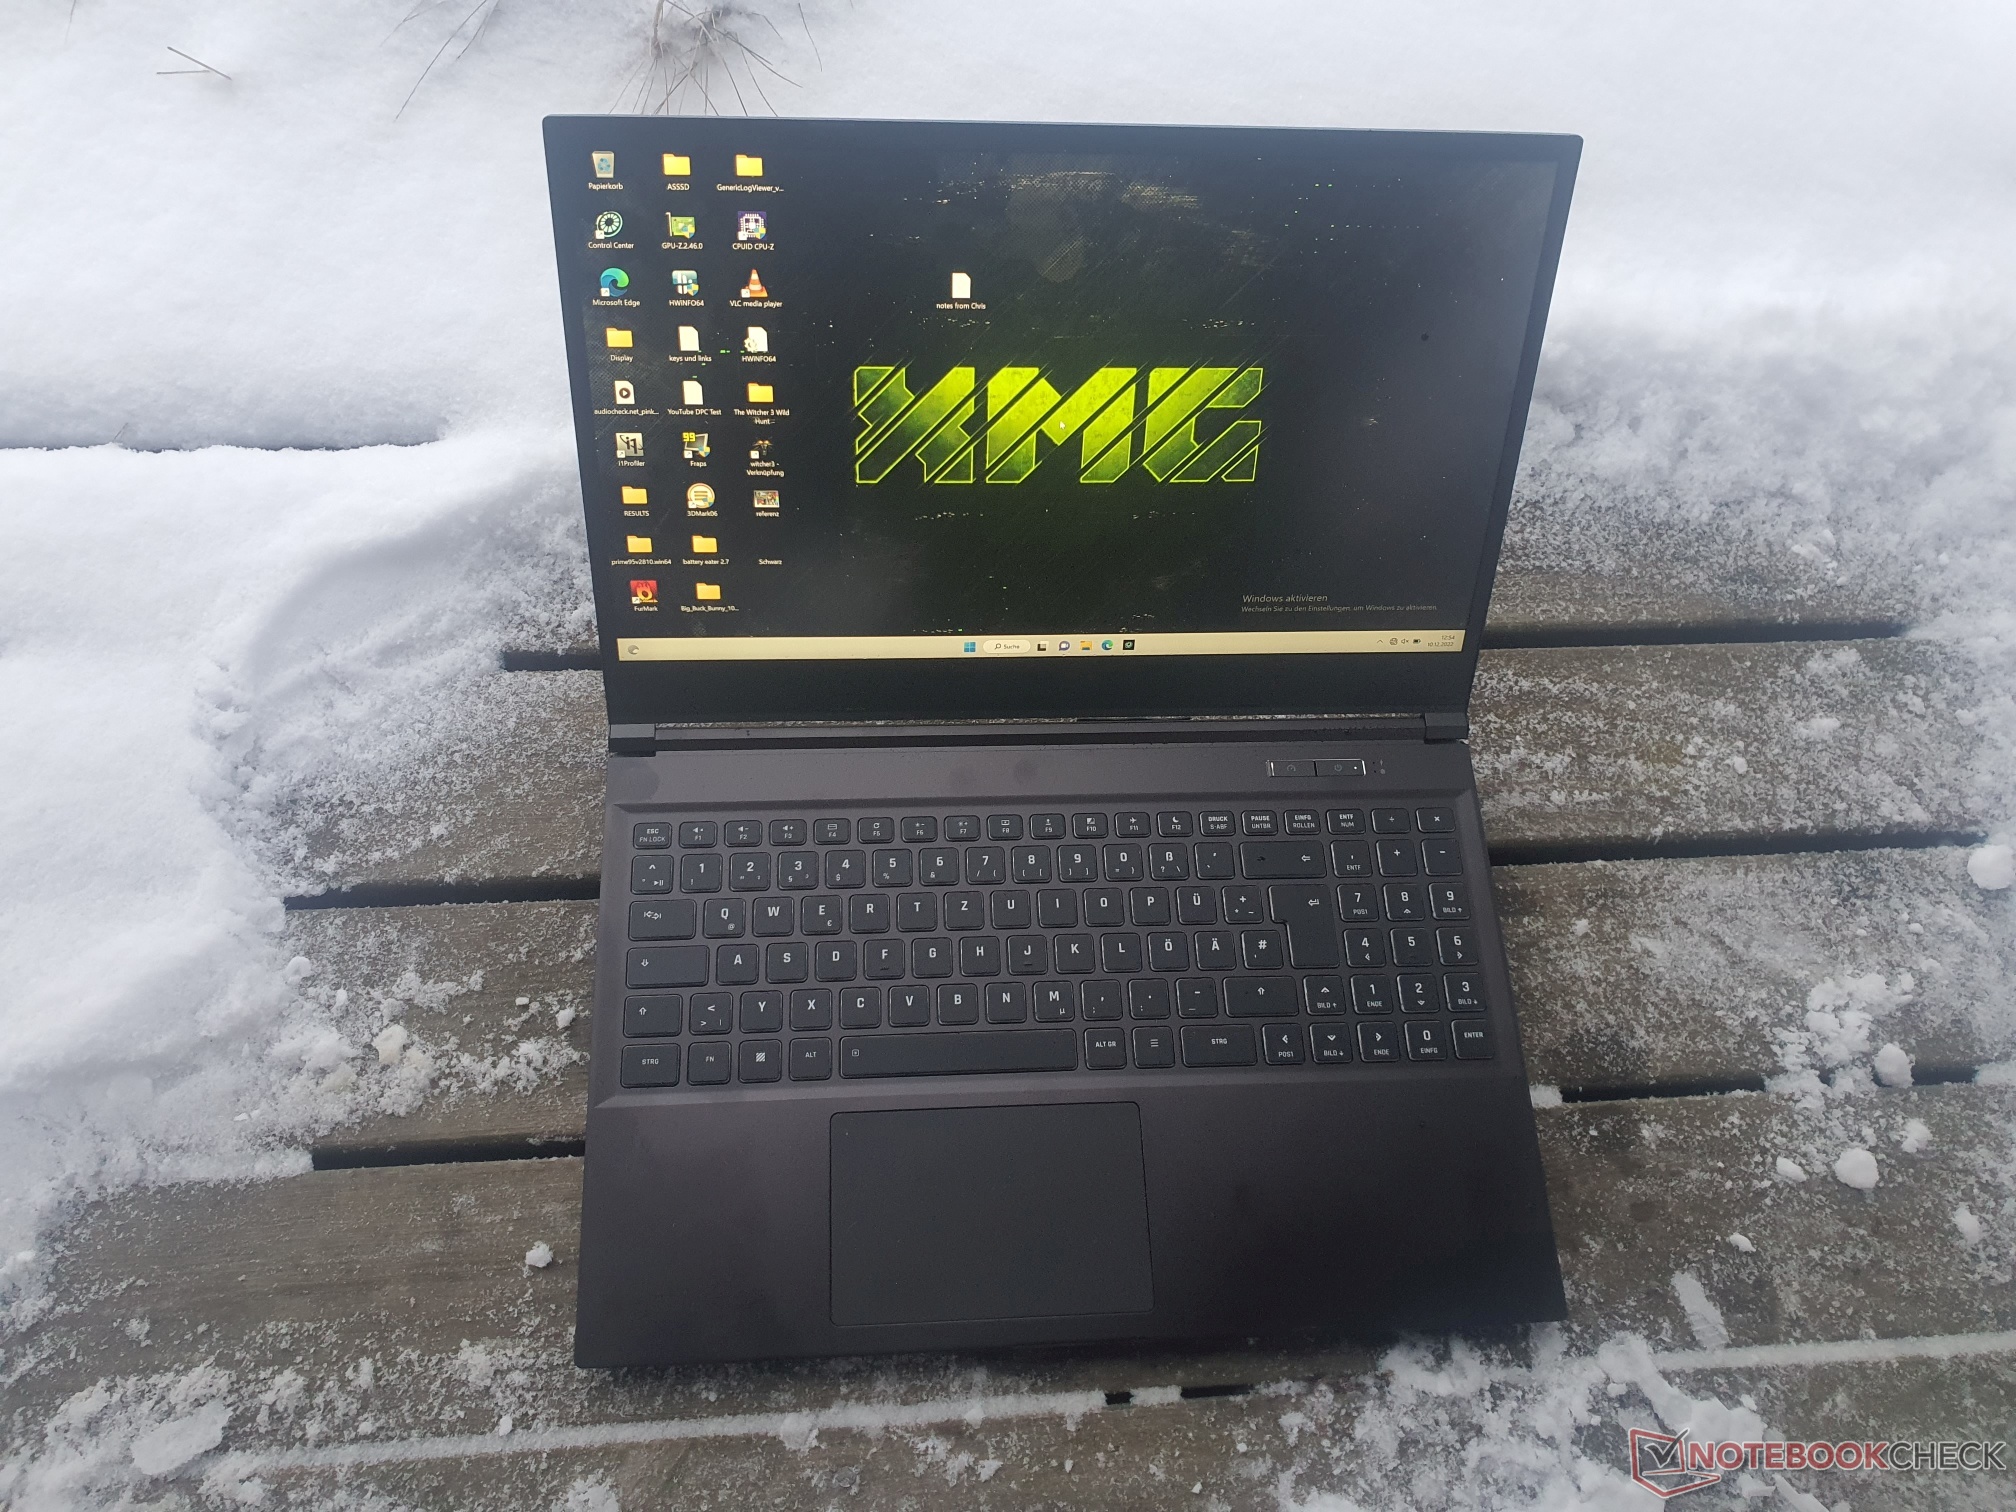
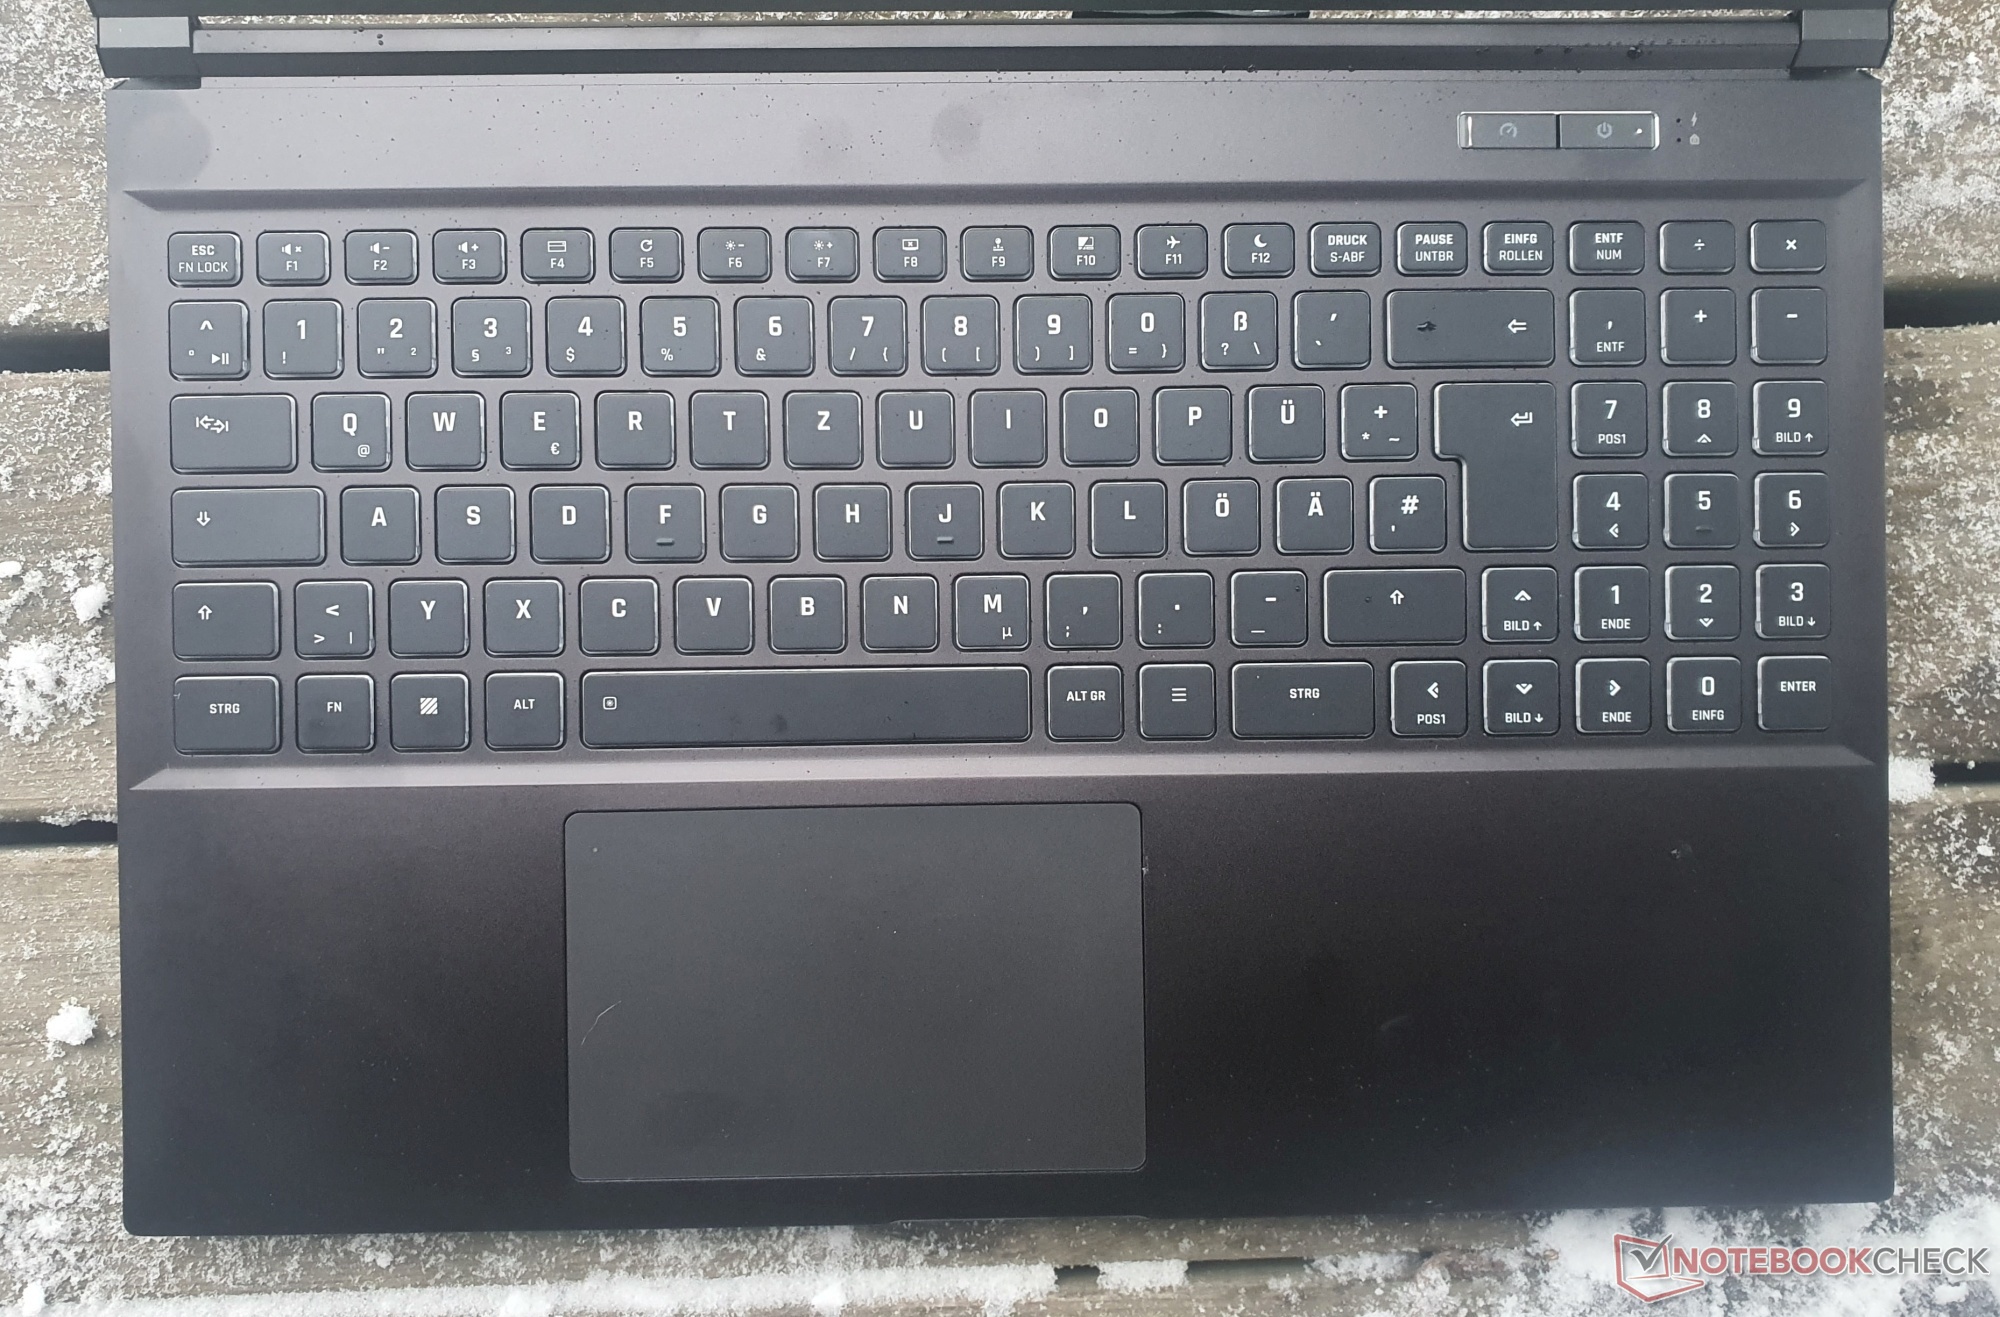
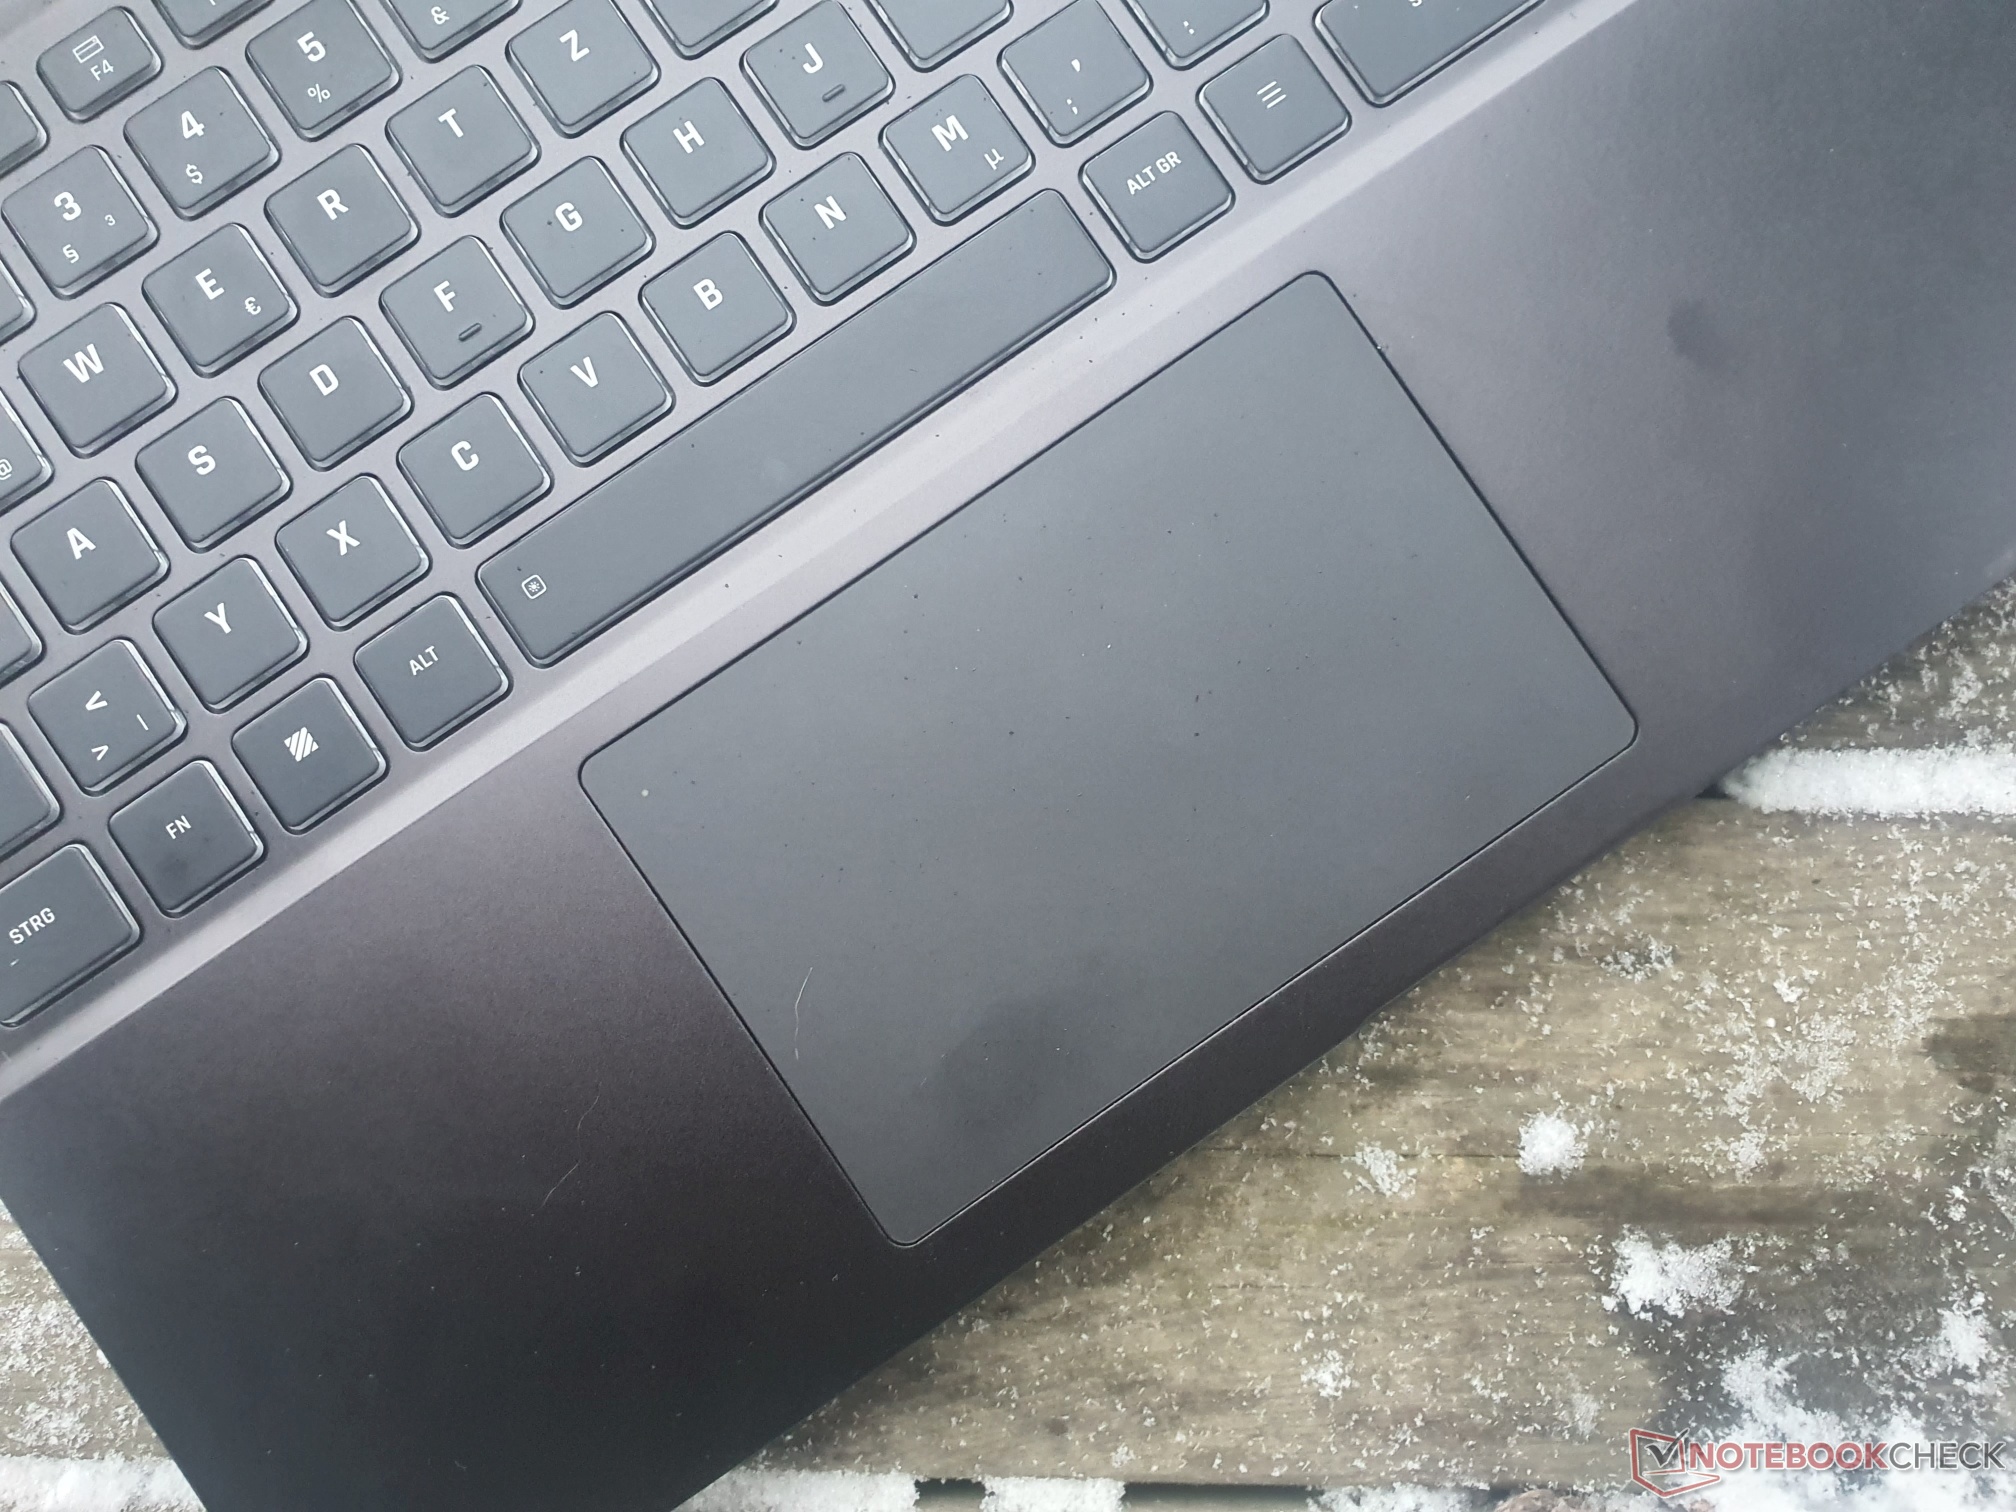
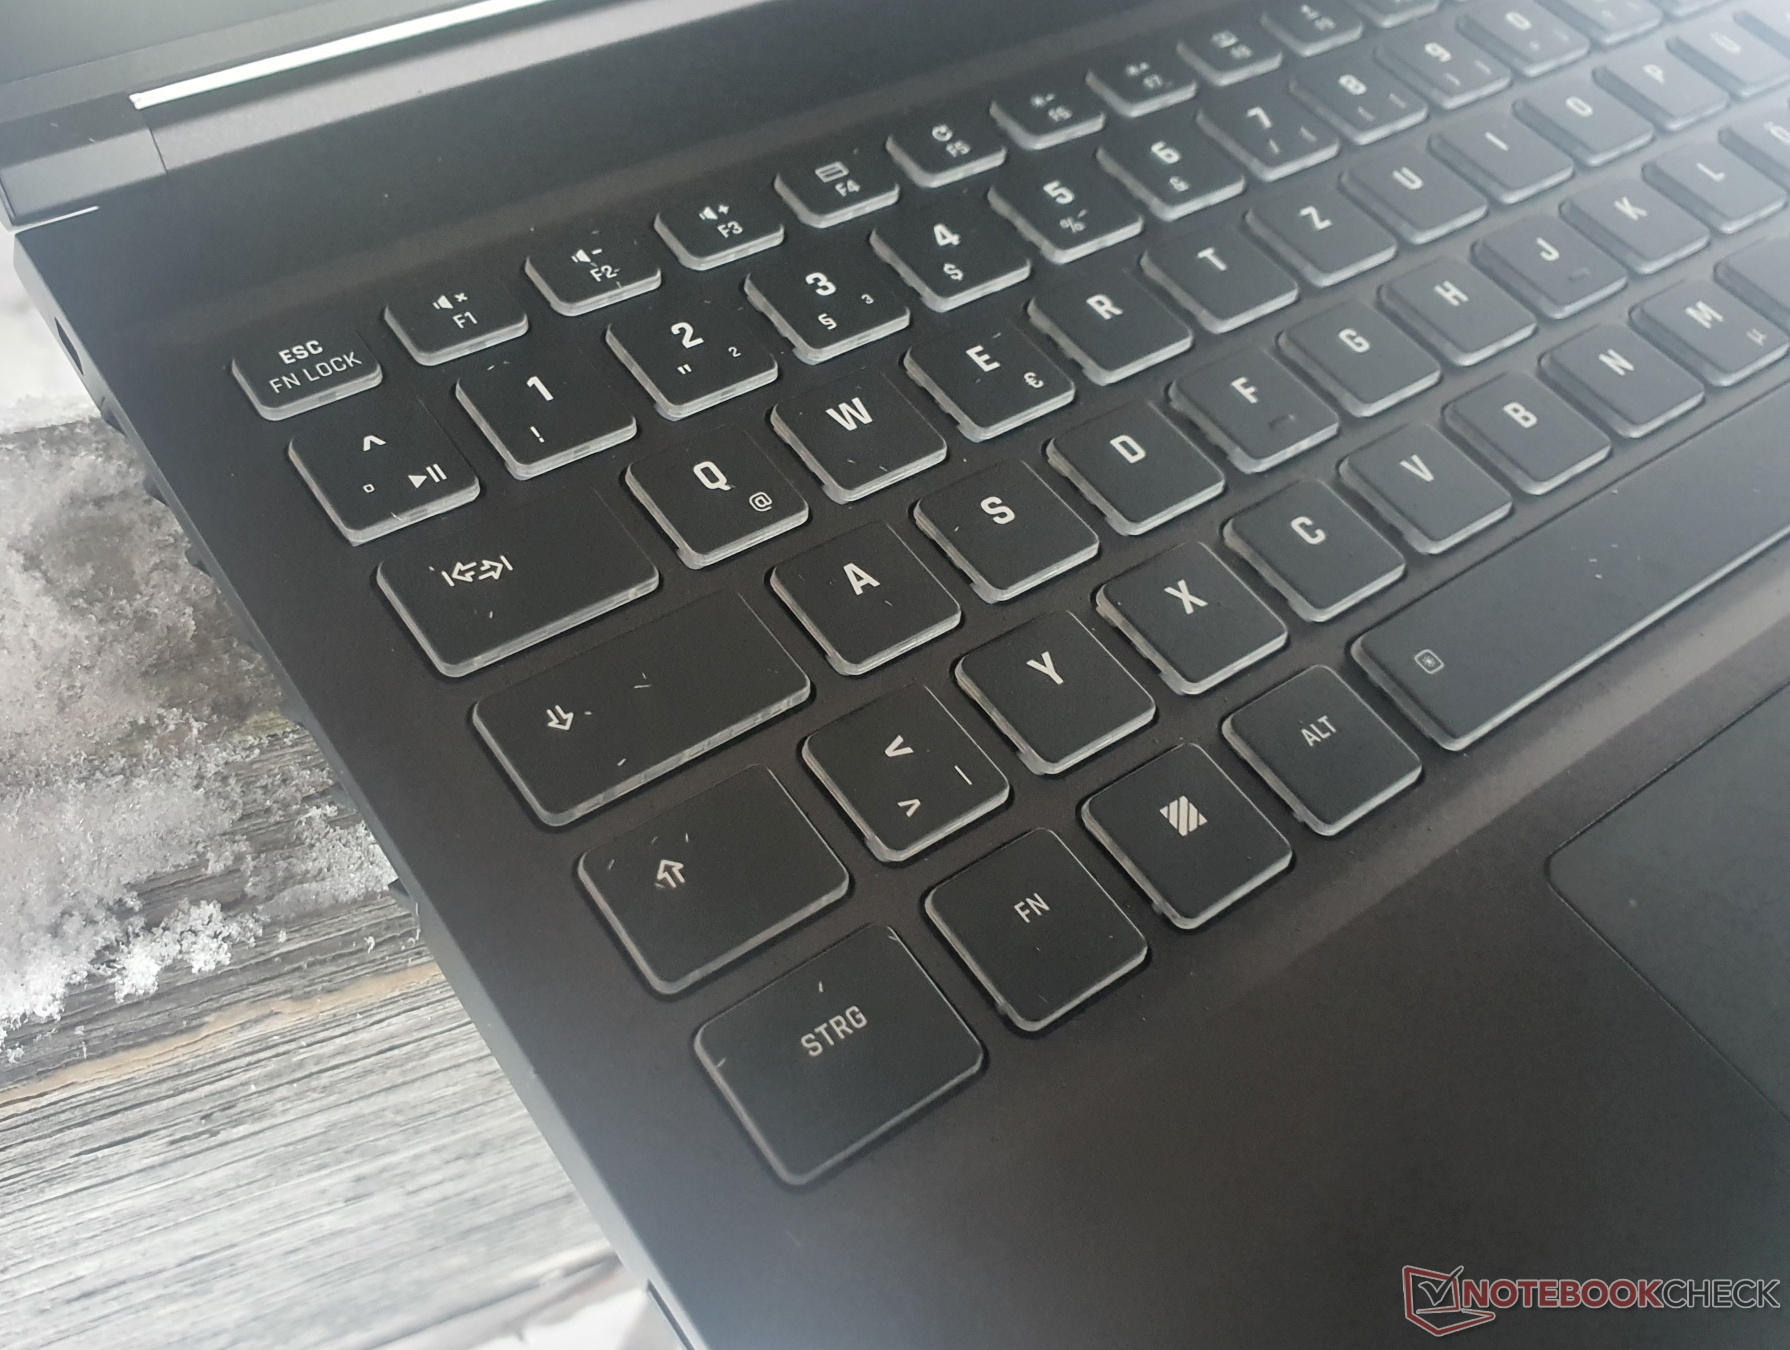
Core 15:s hölje har i princip förblivit detsamma, så du kan läsa om detaljerna och inmatningsenheterna i vår Granskning av föregångarmodellen.
Fler Schenker-recensioner:
XMG Neo 15(Ryzen 9 6900HX, RTX 3070 Ti, mech. tangentbord, XMG Oasis)
XMG Neo 17 (Ryzen 9 6900HX, RTX 3080 Ti, mech. tangentbord, XMG Oasis)
XMG Fusion 15(Core i7-11800H, RTX 3070, mech. tangentbord)
XMG Pro 15(Core i7-12700H, RTX 3080 Ti)
XMG Pro 17(Core i9-12900H, RTX 3080 Ti)
XMG Apex 15 Max(Ryzen 9 5900Xdatorprocessor, RTX 3070)
Potentiella konkurrenter i jämförelse
Gradering | Datum | Modell | Vikt | Höjd | Storlek | Upplösning | Pris |
|---|---|---|---|---|---|---|---|
| 87.9 % v7 (old) | 01/2023 | Schenker XMG Core 15 (M22) R7 6800H, GeForce RTX 3060 Laptop GPU | 2.1 kg | 23 mm | 15.60" | 2560x1440 | |
| 87.5 % v7 (old) | 11/2022 | Lenovo Legion 5 15IAH7H 82RB i7-12700H, GeForce RTX 3060 Laptop GPU | 2.4 kg | 19.99 mm | 15.60" | 1920x1080 | |
| 87.4 % v7 (old) | 08/2022 | Schenker XMG Fusion 15 (Mid 22) i7-11800H, GeForce RTX 3070 Laptop GPU | 1.9 kg | 21.65 mm | 15.60" | 2560x1440 | |
| 87.2 % v7 (old) | 03/2022 | Asus TUF Gaming F15 FX507ZM i7-12700H, GeForce RTX 3060 Laptop GPU | 2.1 kg | 24.95 mm | 15.60" | 1920x1080 | |
| 84.7 % v7 (old) | 08/2025 | Alienware m15 R5 Ryzen Edition R7 5800H, GeForce RTX 3060 Laptop GPU | 2.5 kg | 22.85 mm | 15.60" | 1920x1080 | |
| 84.9 % v7 (old) | Schenker XMG Core 15 Ampere R7 4800H, GeForce RTX 3060 Laptop GPU | 2 kg | 22.9 mm | 15.60" | 2560x1440 |
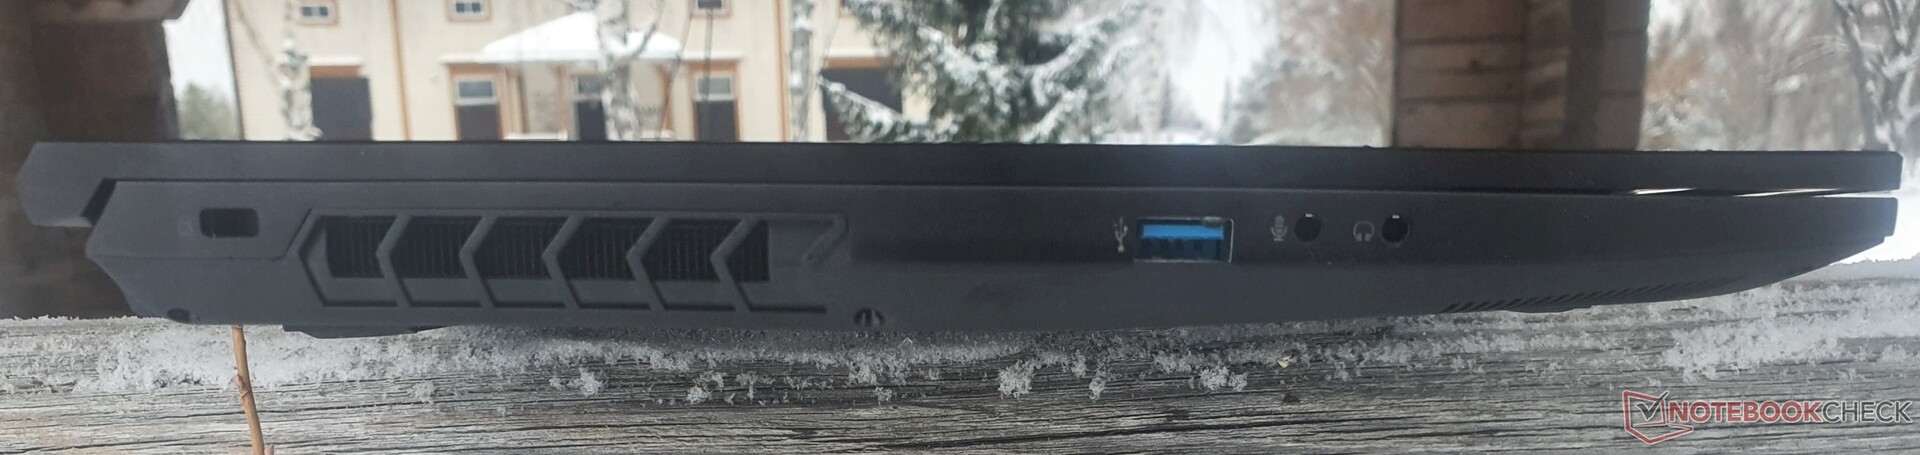
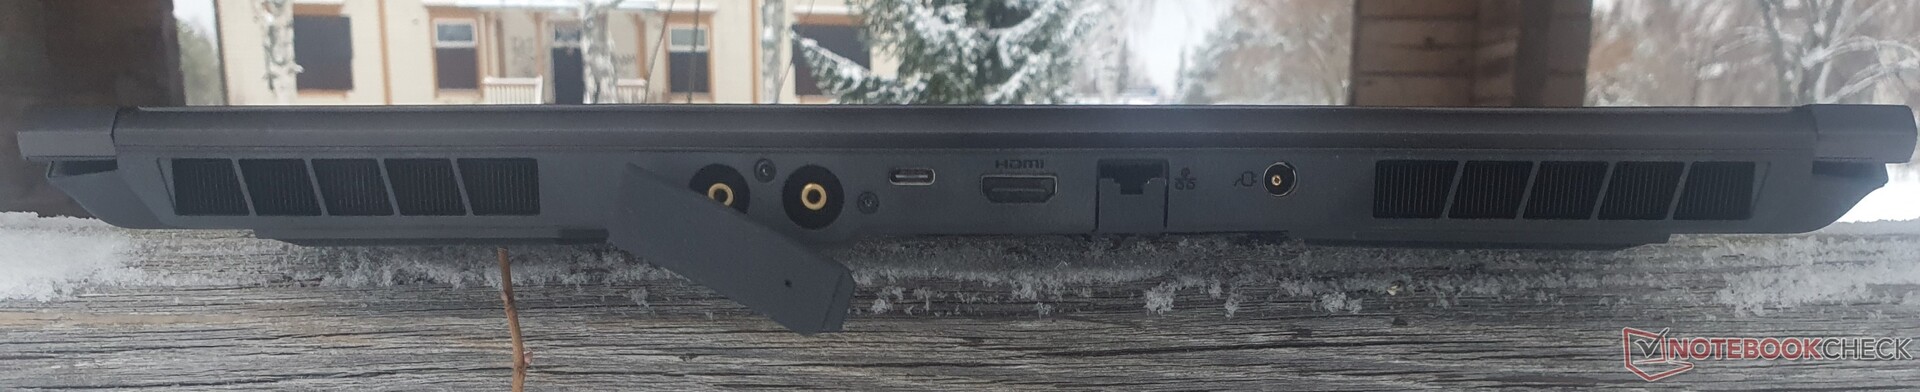
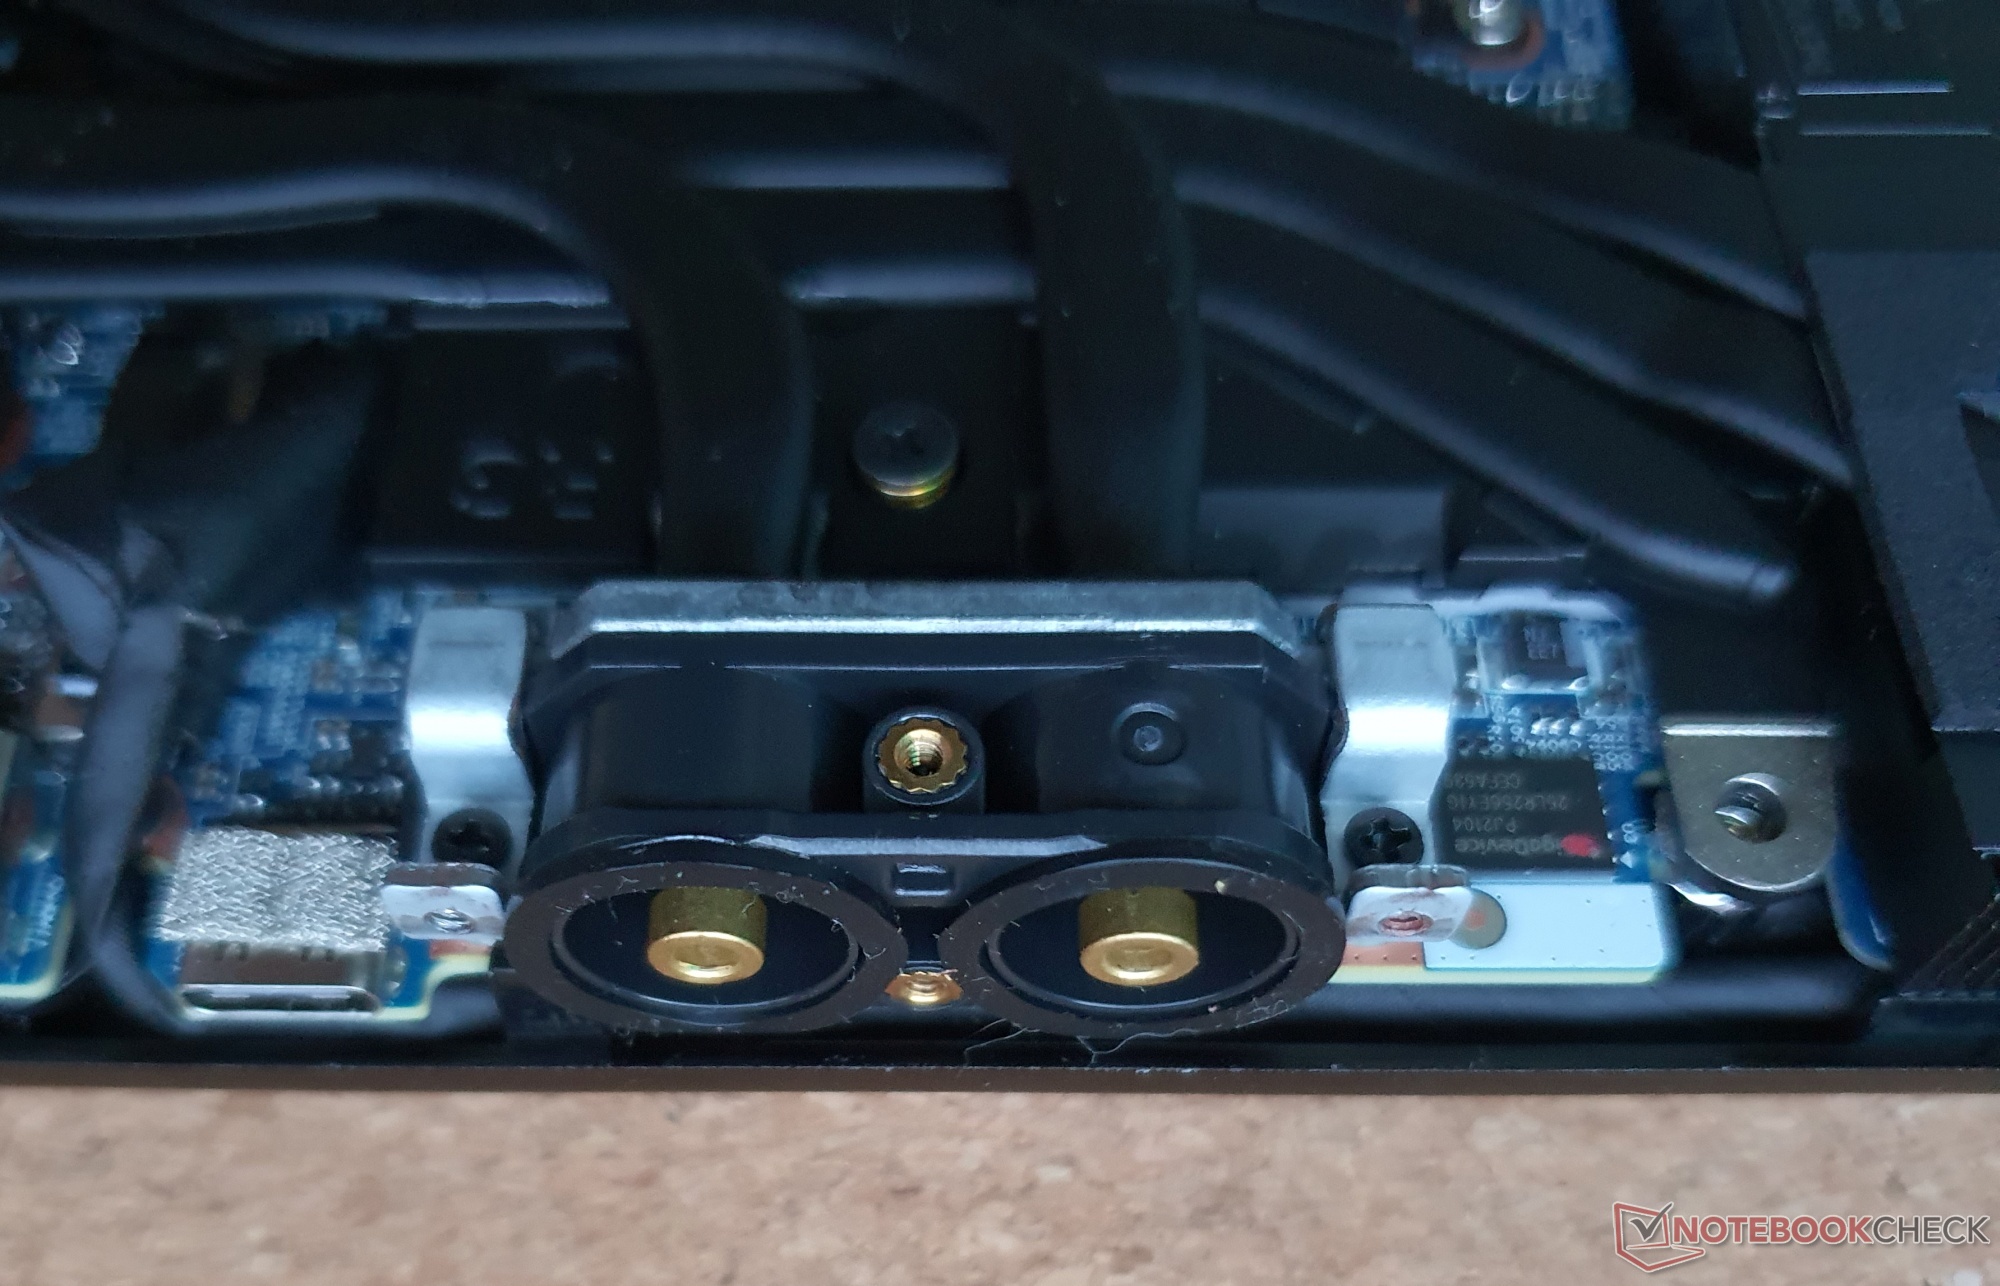
Funktioner: vattenport, men ingen USB4 och USB-C-PD
Jämfört med föregångaren är porten för den externa XMG Oasis-vattenkylningen en intressant och användbar innovation. USB 2.0-porten på vänster sida ger plats för en snabbare USB-A 3.2 Gen2, medan vi fortfarande saknar USB4 och laddning via USB-C.
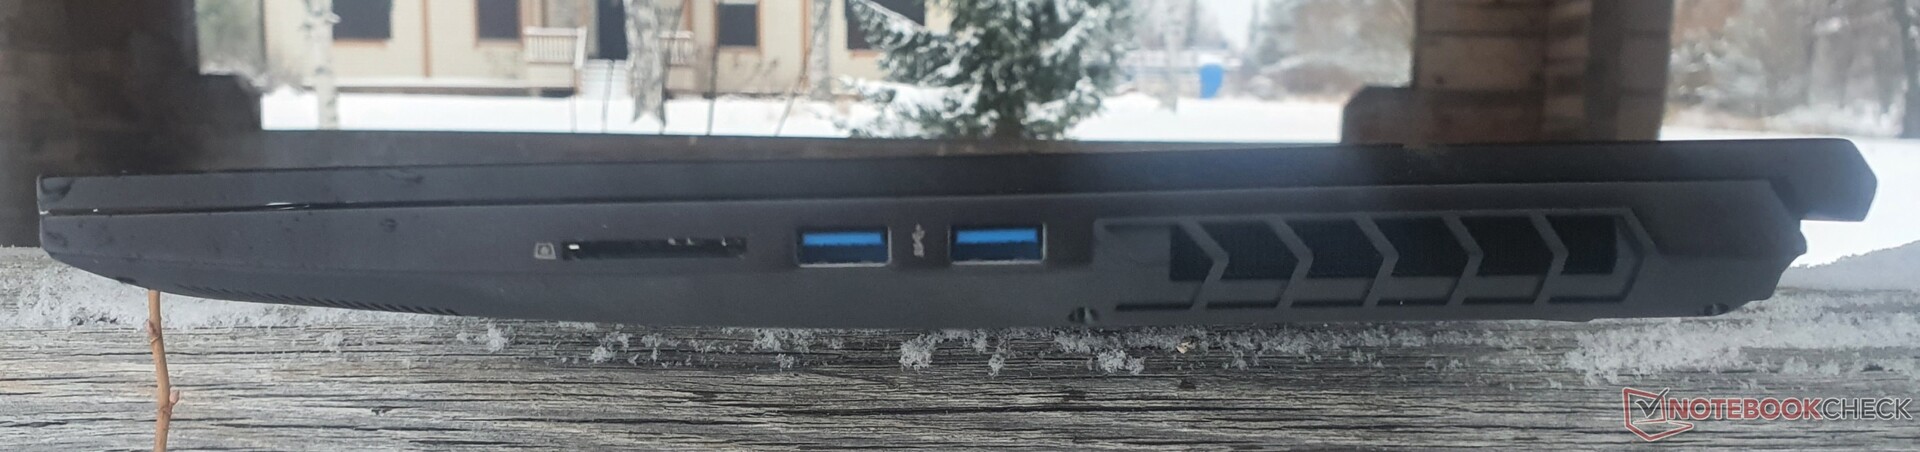
SD-kortläsare
| SD Card Reader | |
| average JPG Copy Test (av. of 3 runs) | |
| Genomsnitt av klass Gaming (20.9 - 210, n=54, senaste 2 åren) | |
| Schenker XMG Core 15 Ampere (Toshiba Exceria Pro SDXC 64 GB UHS-II) | |
| Schenker XMG Apex 15 Max (AV PRO microSD 128 GB V60) | |
| Schenker XMG Fusion 15 (Mid 22) (AV PRO microSD 128 GB V60) | |
| Schenker XMG Core 15 (M22) (AV PRO microSD 128 GB V60) | |
| maximum AS SSD Seq Read Test (1GB) | |
| Genomsnitt av klass Gaming (25.5 - 261, n=51, senaste 2 åren) | |
| Schenker XMG Apex 15 Max (AV PRO microSD 128 GB V60) | |
| Schenker XMG Core 15 Ampere (Toshiba Exceria Pro SDXC 64 GB UHS-II) | |
| Schenker XMG Core 15 (M22) (AV PRO microSD 128 GB V60) | |
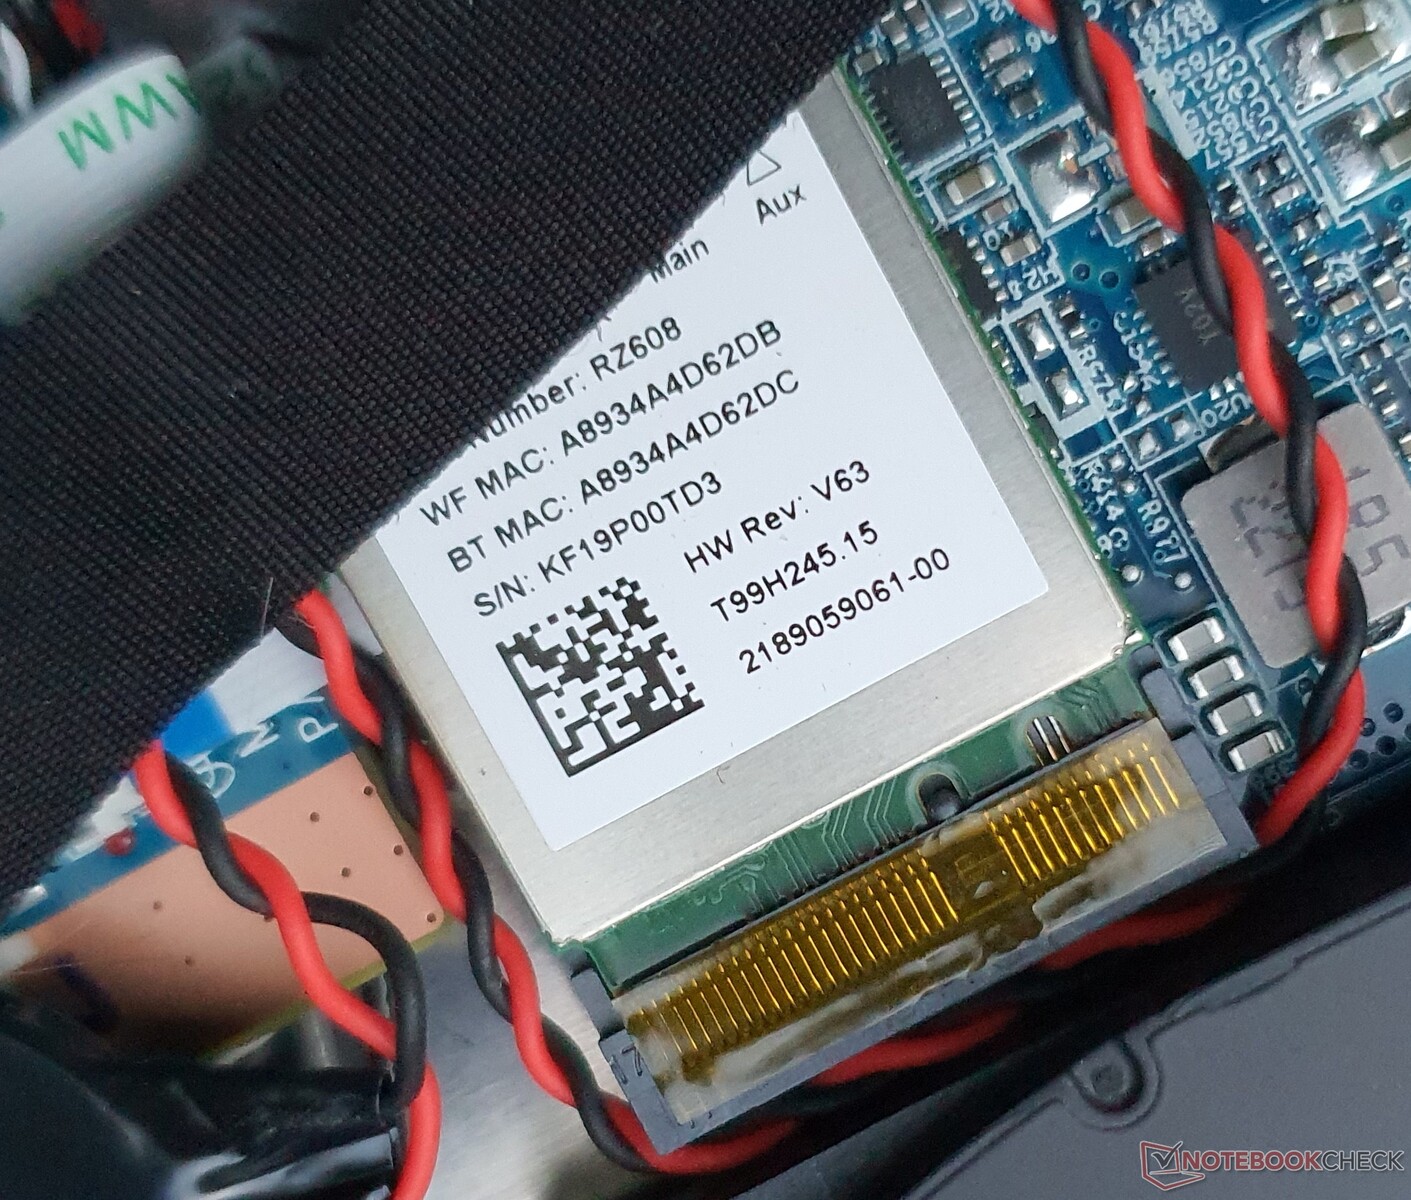
Kommunikation
| Networking | |
| iperf3 receive AXE11000 6GHz | |
| Lenovo Legion 5 15IAH7H 82RB | |
| Schenker XMG Core 15 (M22) | |
| Genomsnitt MediaTek RZ608 (430 - 961, n=16) | |
| iperf3 receive AXE11000 | |
| Schenker XMG Fusion 15 (Mid 22) | |
| Lenovo Legion 5 15IAH7H 82RB | |
| Schenker XMG Core 15 (M22) | |
| Genomsnitt MediaTek RZ608 (430 - 975, n=20) | |
| iperf3 transmit AXE11000 6GHz | |
| Lenovo Legion 5 15IAH7H 82RB | |
| Schenker XMG Core 15 (M22) | |
| Genomsnitt MediaTek RZ608 (572 - 980, n=16) | |
| iperf3 transmit AXE11000 | |
| Lenovo Legion 5 15IAH7H 82RB | |
| Schenker XMG Fusion 15 (Mid 22) | |
| Schenker XMG Core 15 (M22) | |
| Genomsnitt MediaTek RZ608 (572 - 979, n=20) | |
| iperf3 receive AX12 | |
| Asus TUF Gaming F15 FX507ZM | |
| Schenker XMG Core 15 Ampere | |
| Alienware m15 R5 Ryzen Edition | |
| Genomsnitt MediaTek RZ608 (837 - 880, n=2) | |
| iperf3 transmit AX12 | |
| Schenker XMG Core 15 Ampere | |
| Alienware m15 R5 Ryzen Edition | |
| Asus TUF Gaming F15 FX507ZM | |
| Genomsnitt MediaTek RZ608 (657 - 821, n=2) | |

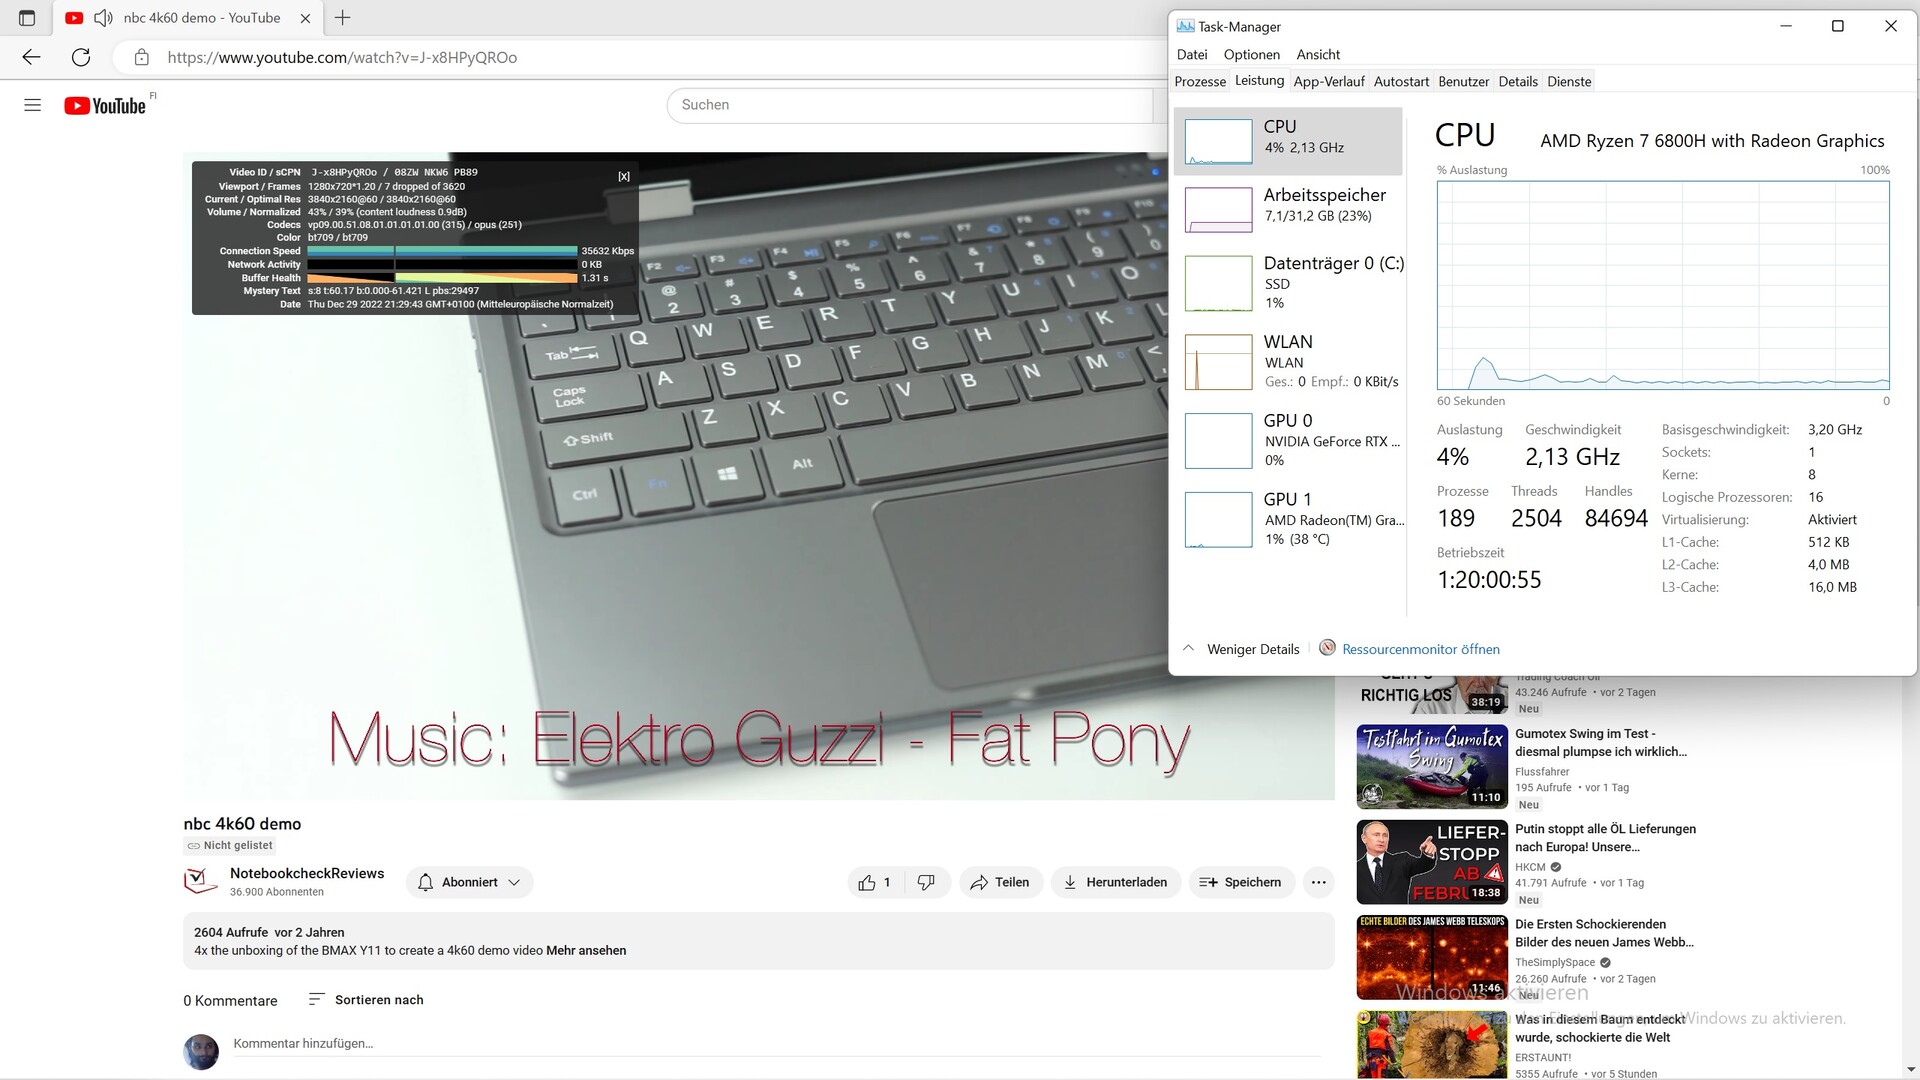
 GeForce RTX 3060 Laptop GPU, R7 6800H, Samsung SSD 980 Pro 1TB MZ-V8P1T0BW")
 GeForce RTX 3060 Laptop GPU, R7 6800H, Samsung SSD 980 Pro 1TB MZ-V8P1T0BW")
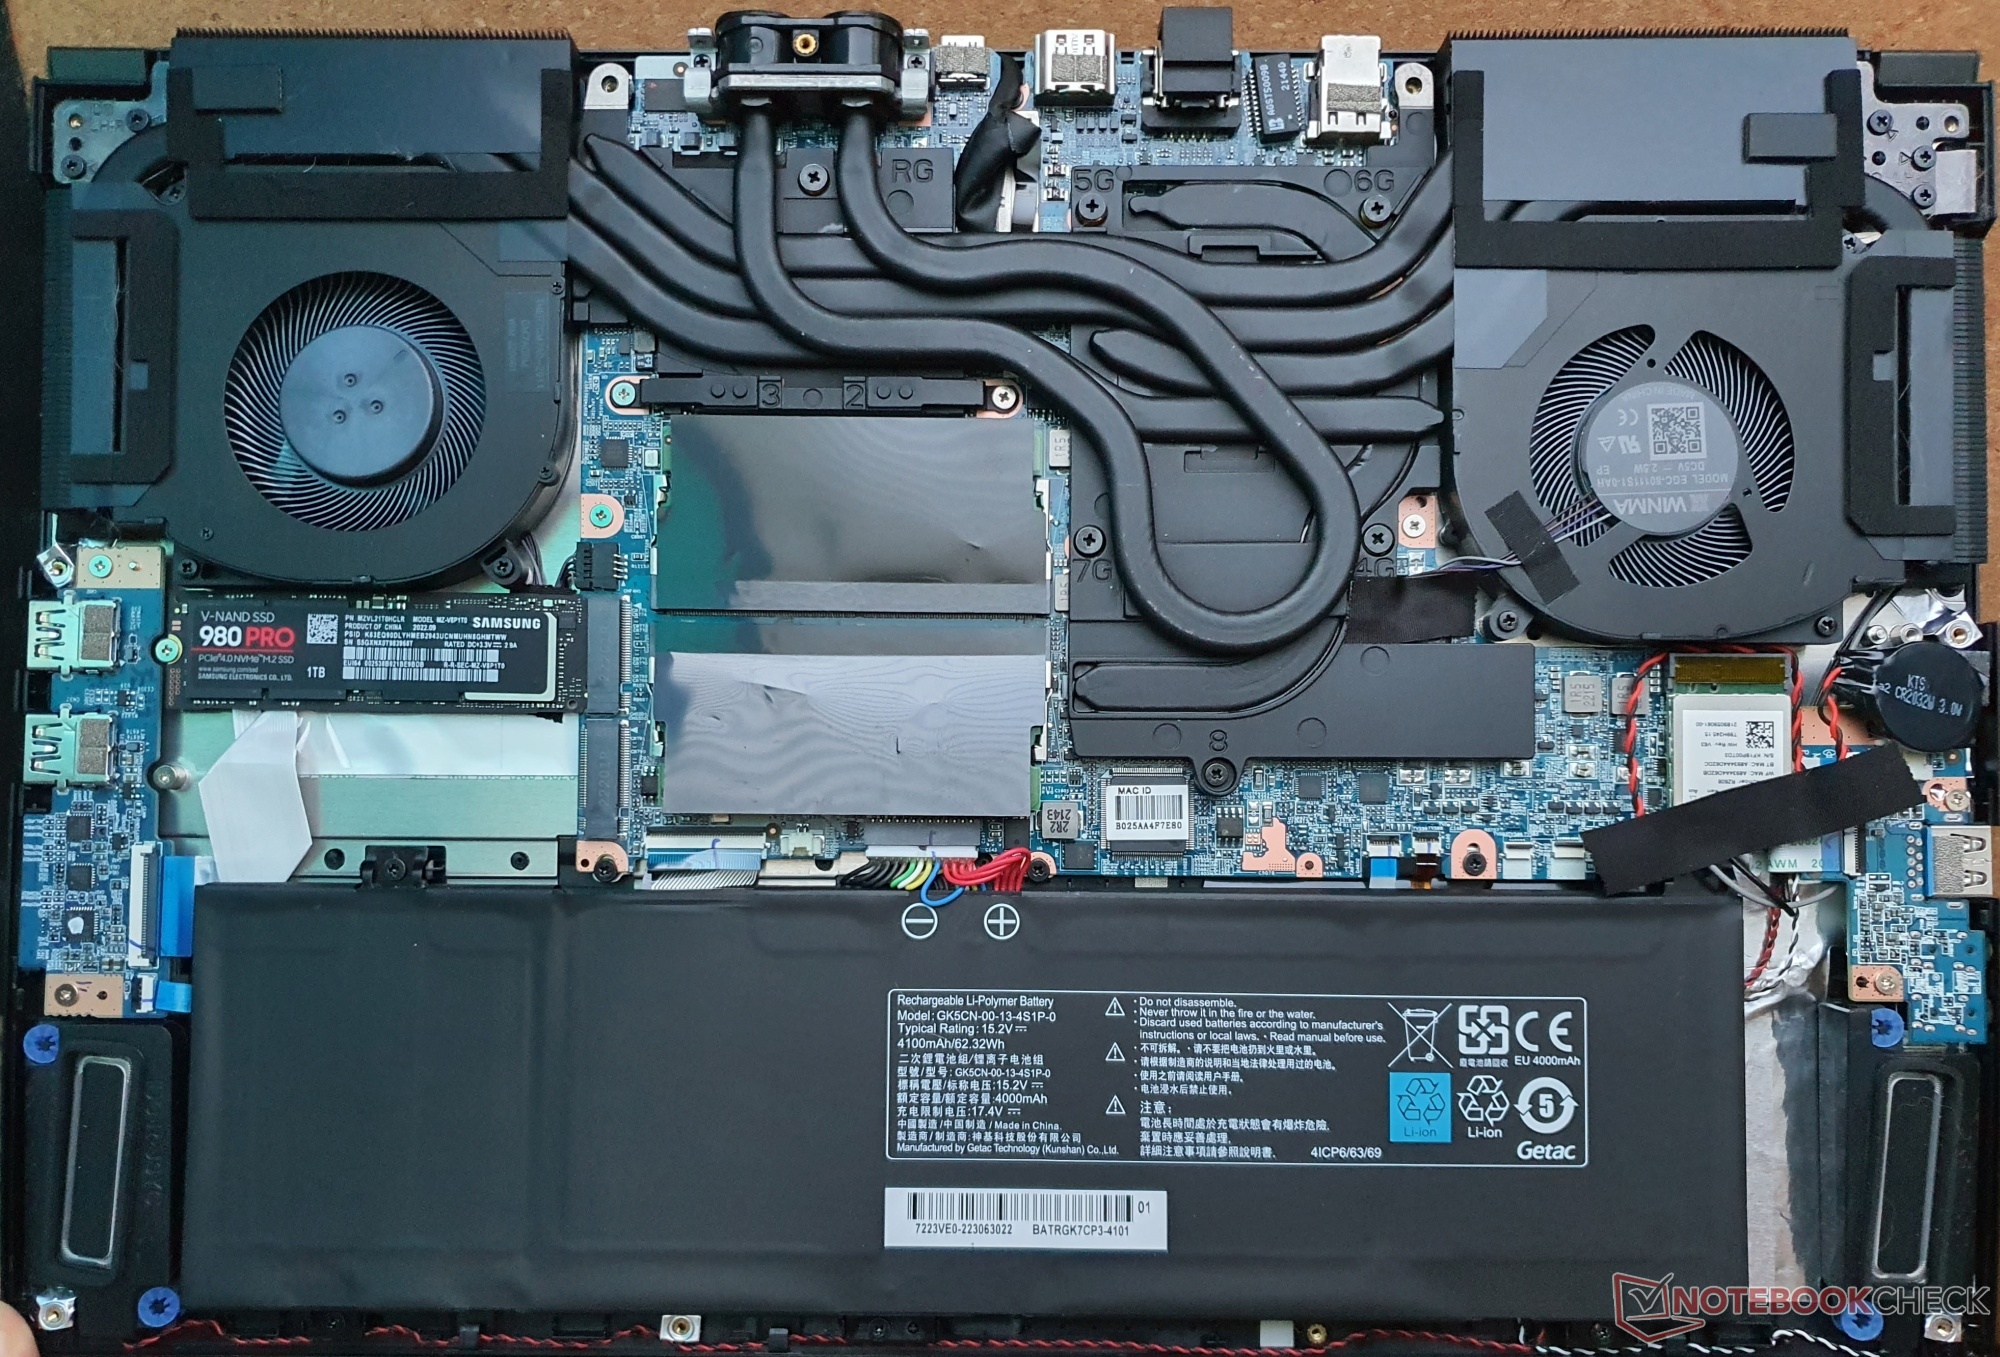
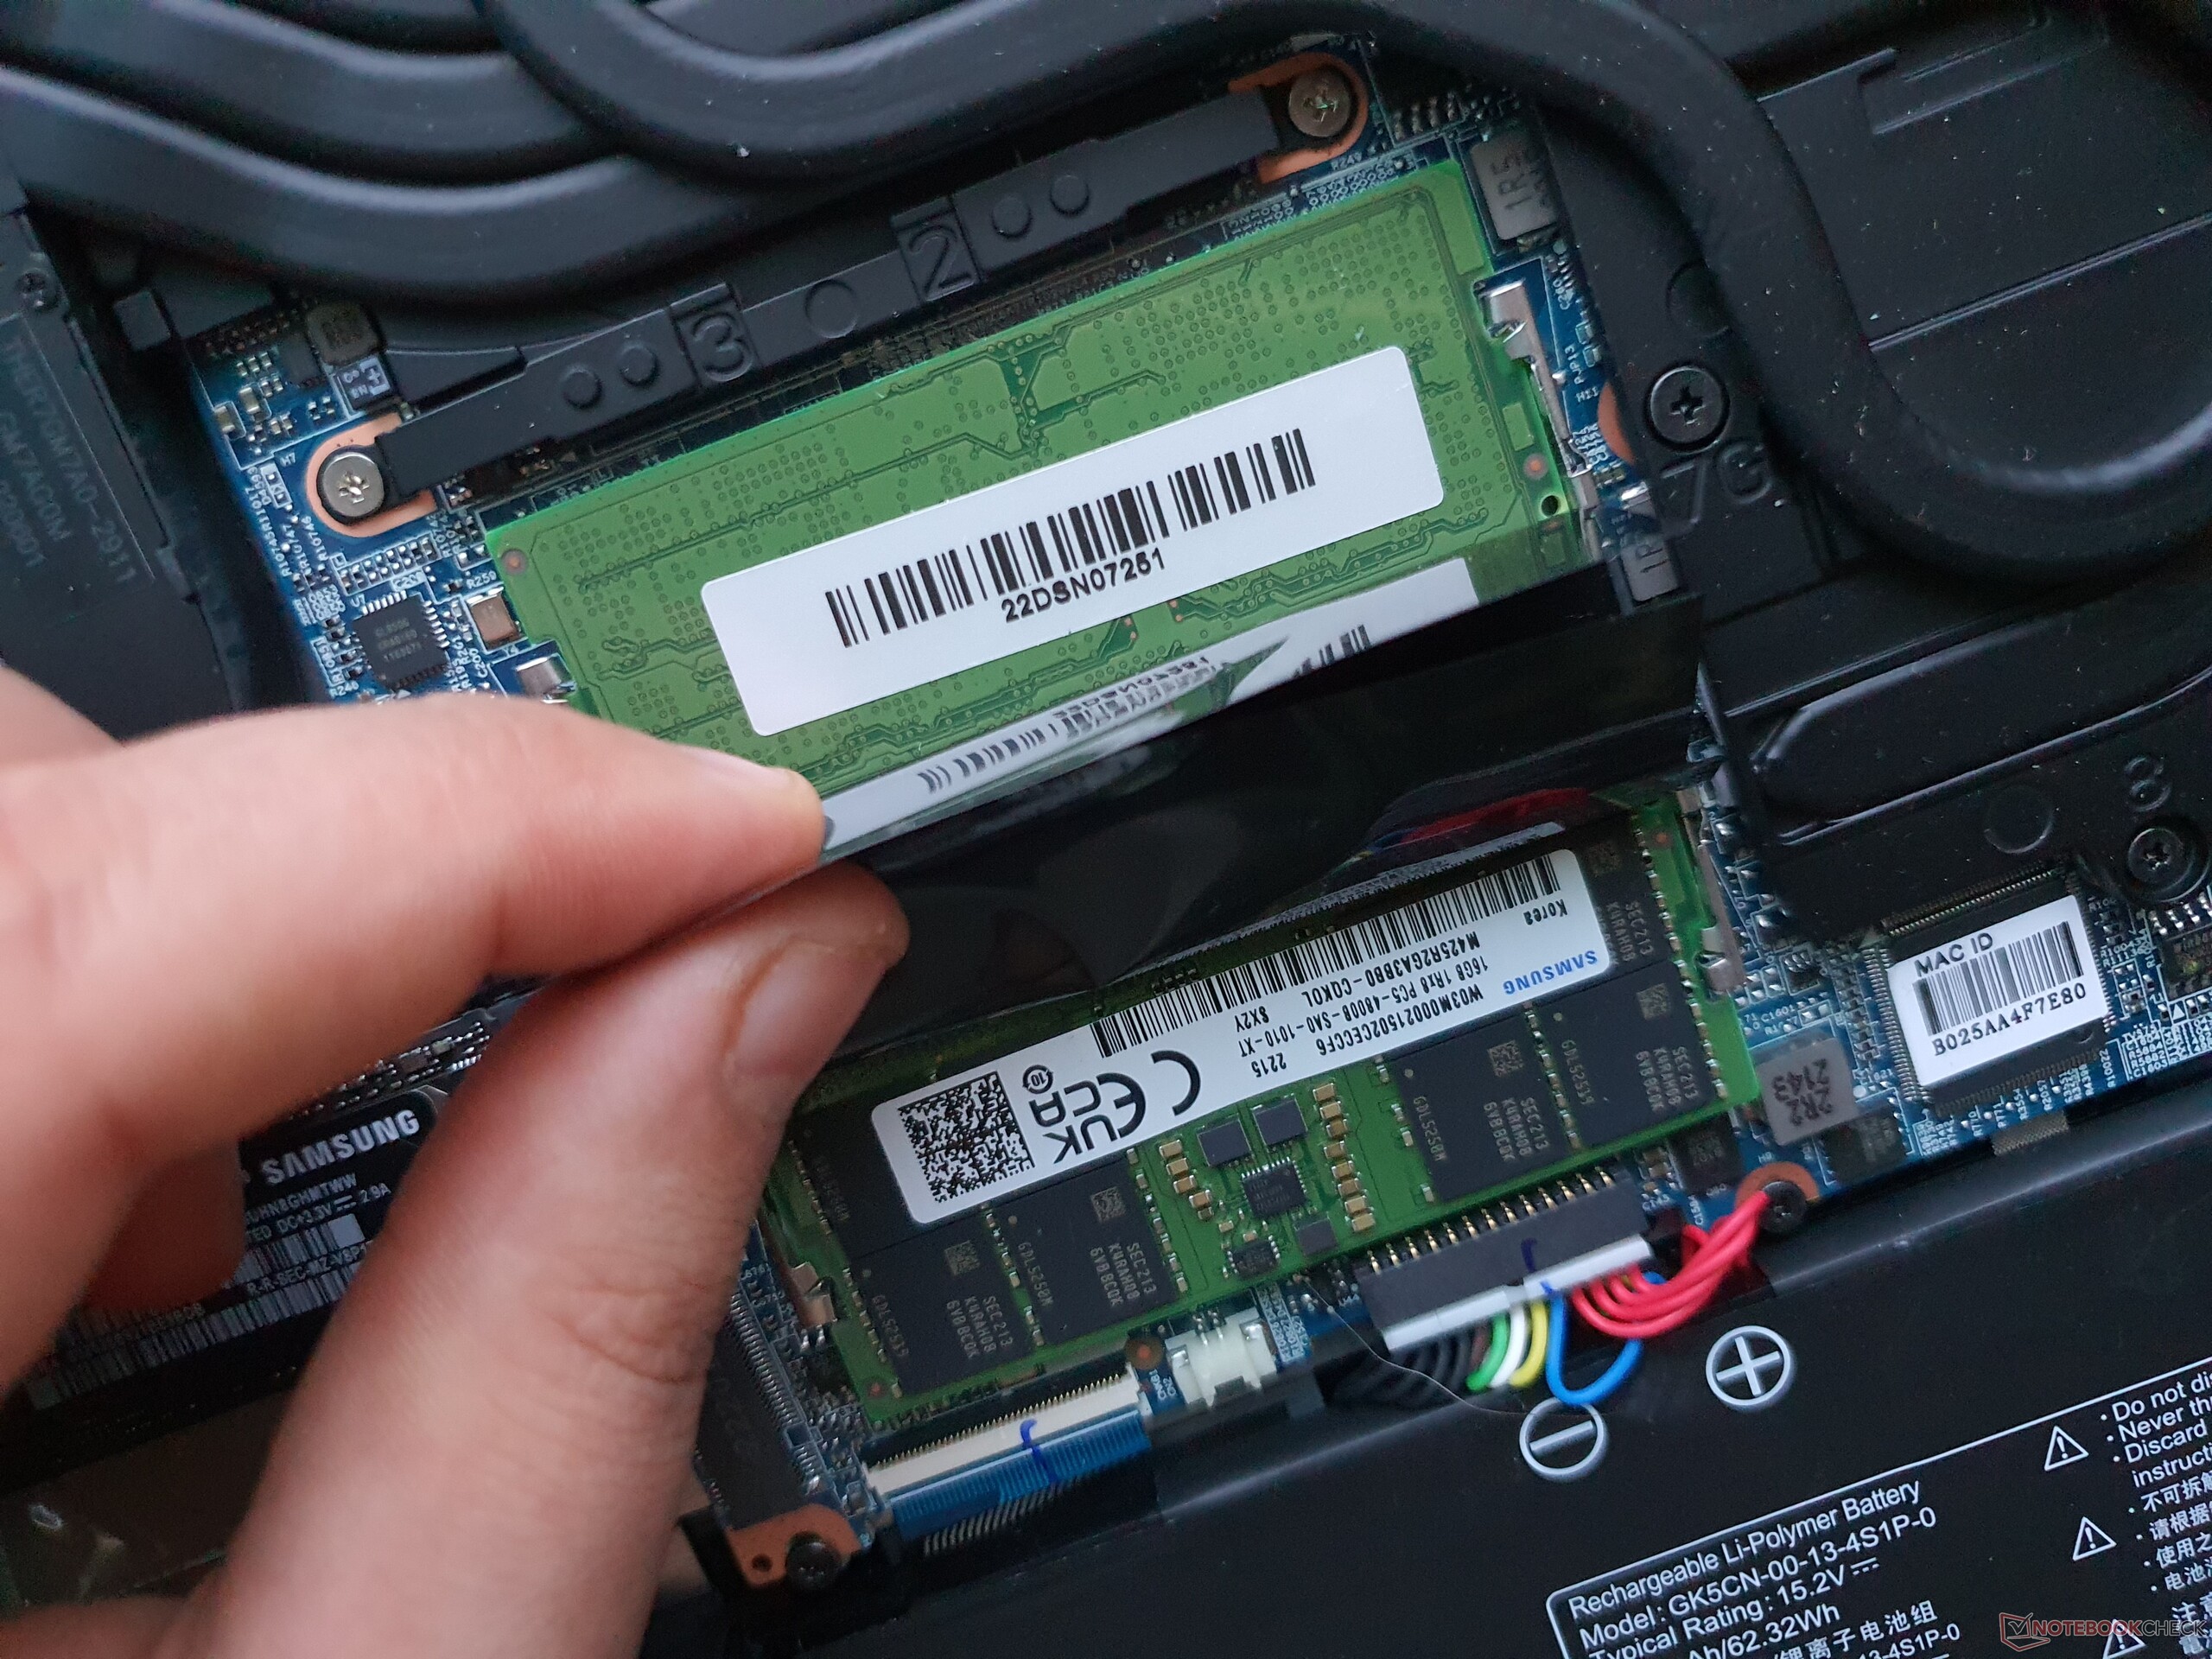
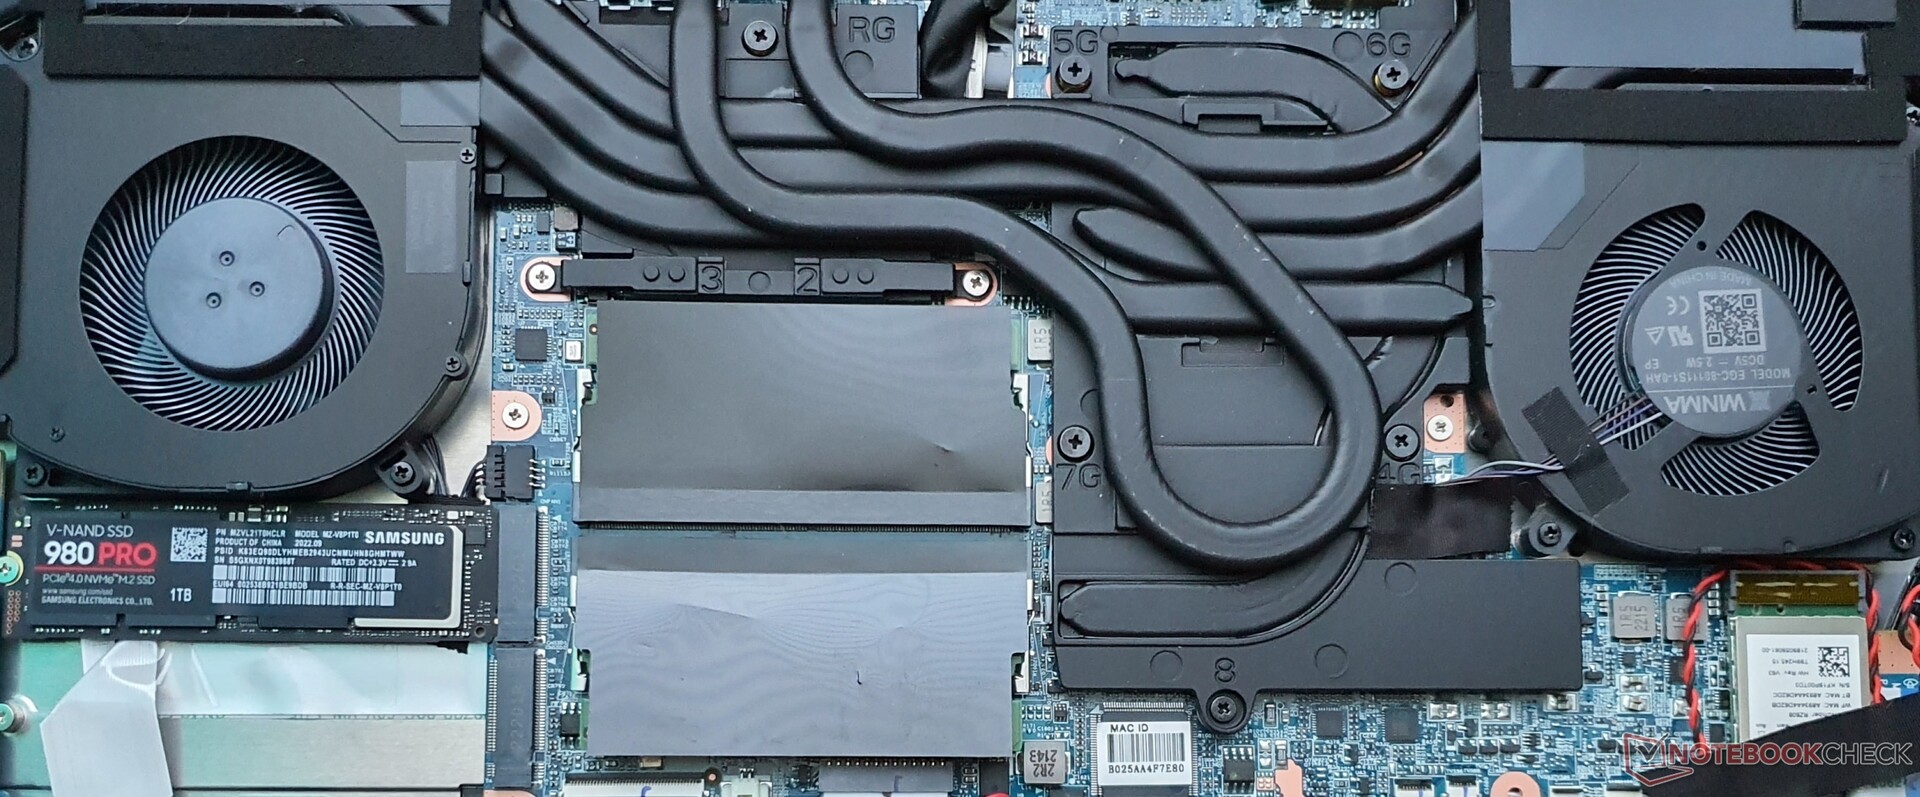
Underhåll

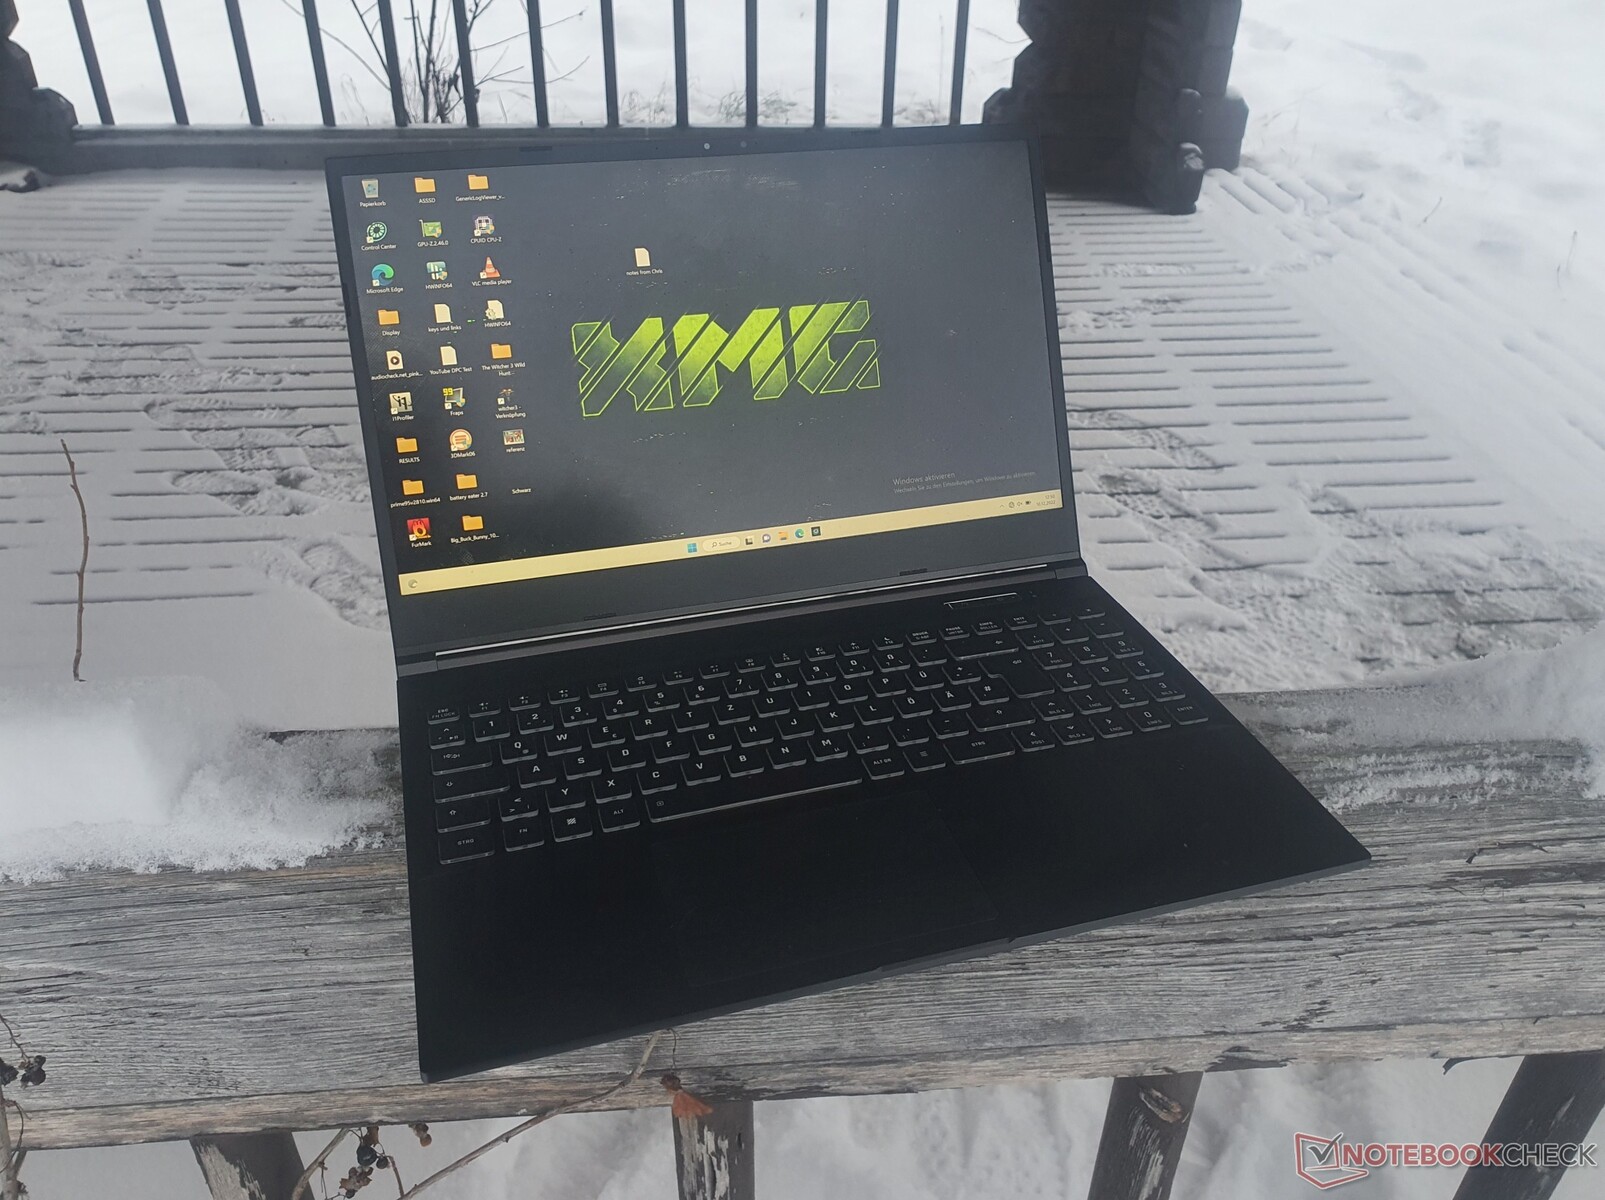
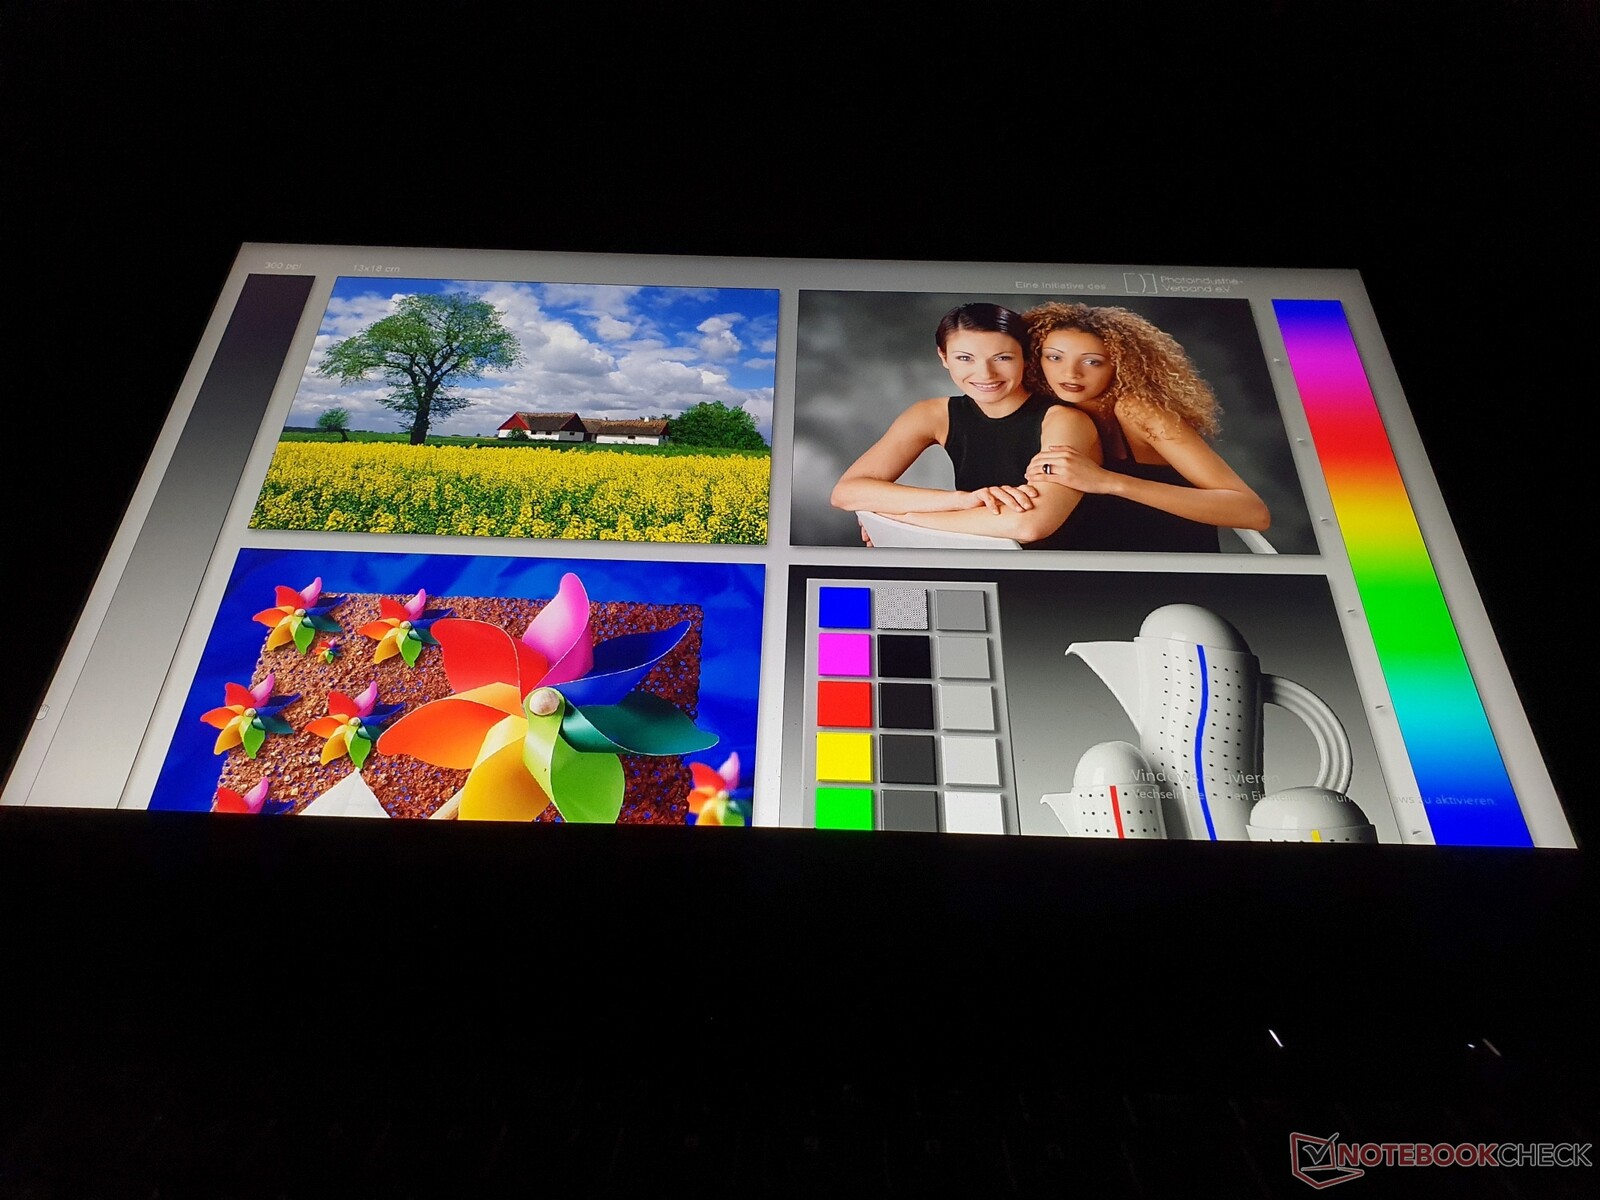
Visa: WQHD 165 Hz med snabb responstid
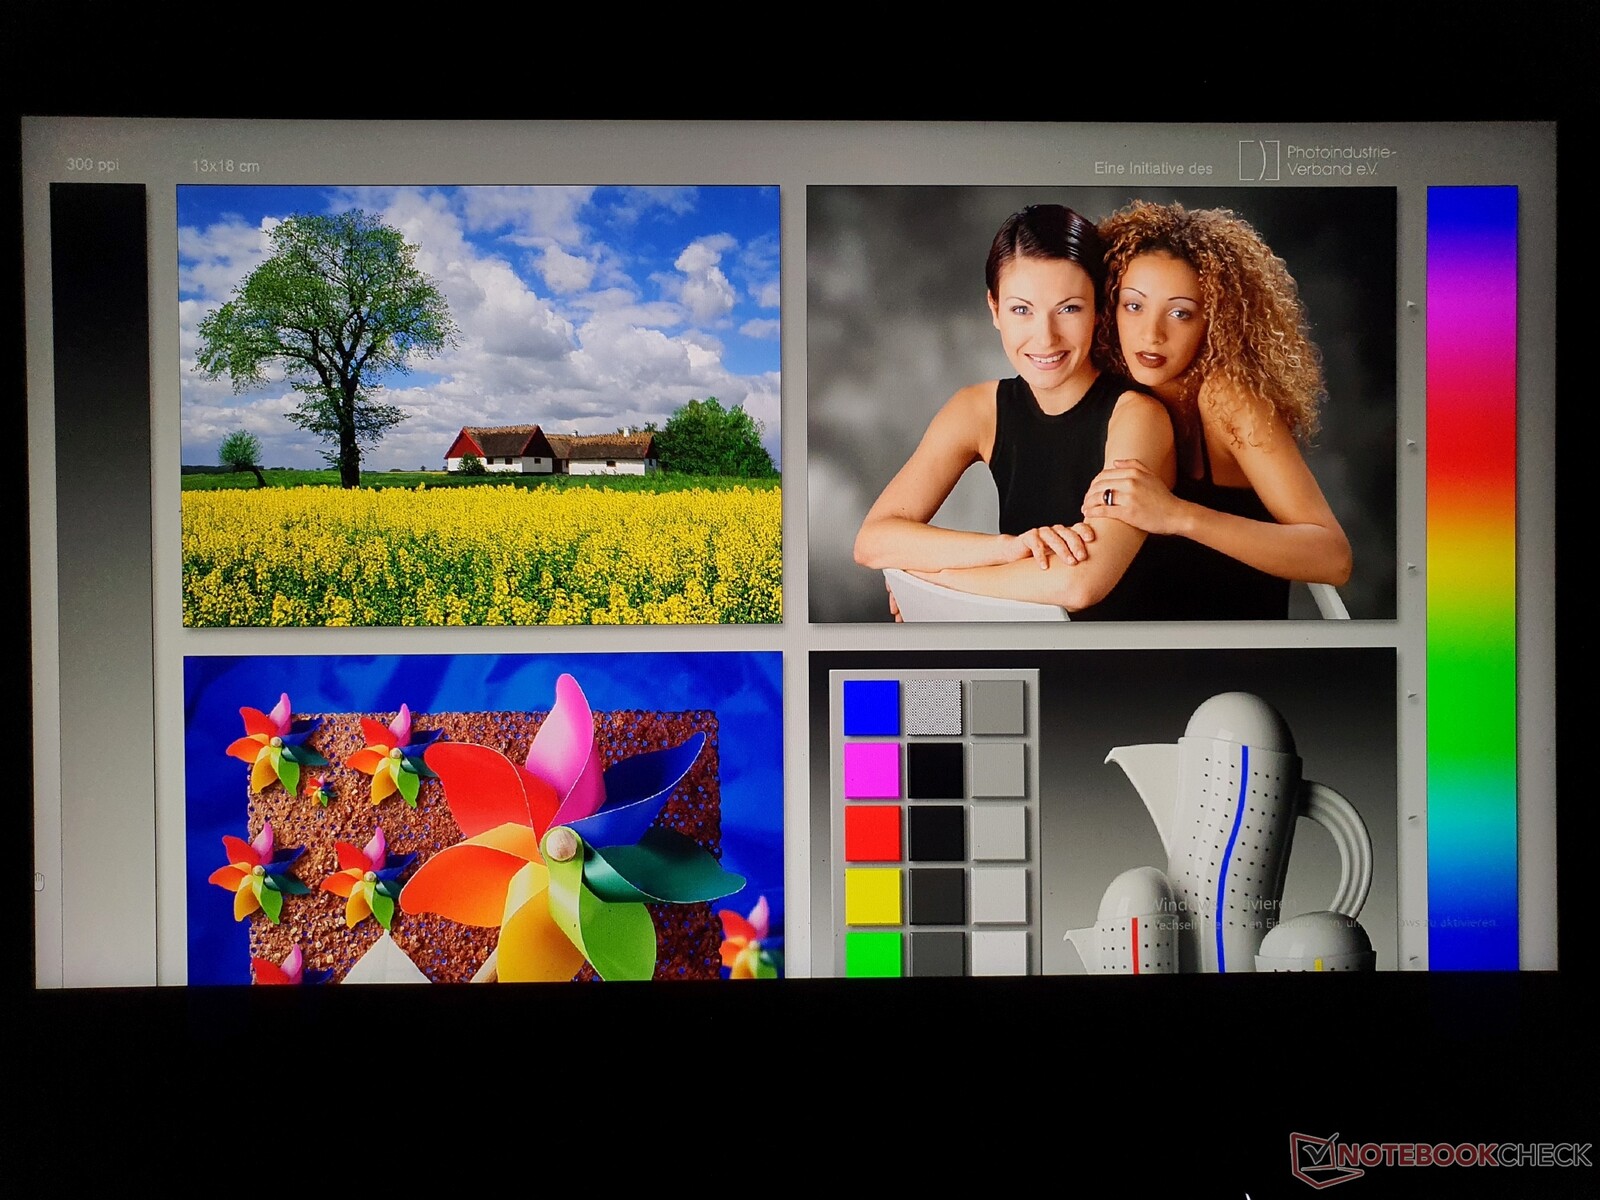
Schenker erbjuder två bildskärmsalternativ för XMG Core 15: FHD 144 Hz med 300 cd/m² och 90 % sRGB samt WQHD-panelen (2 560 x 1 440) installerad i den testade enheten med 165 Hz (83-165 Hz dynamisk), specificerad 350 cd/m² och 95 % sRGB. Specifikationen för ljusstyrka för den matta 16:9-skärmen överträffas med ett genomsnitt på 371 cd/m². Legion 5 Proär ljusare med 500 cd/m², vilket är användbart vid utomhusbruk.
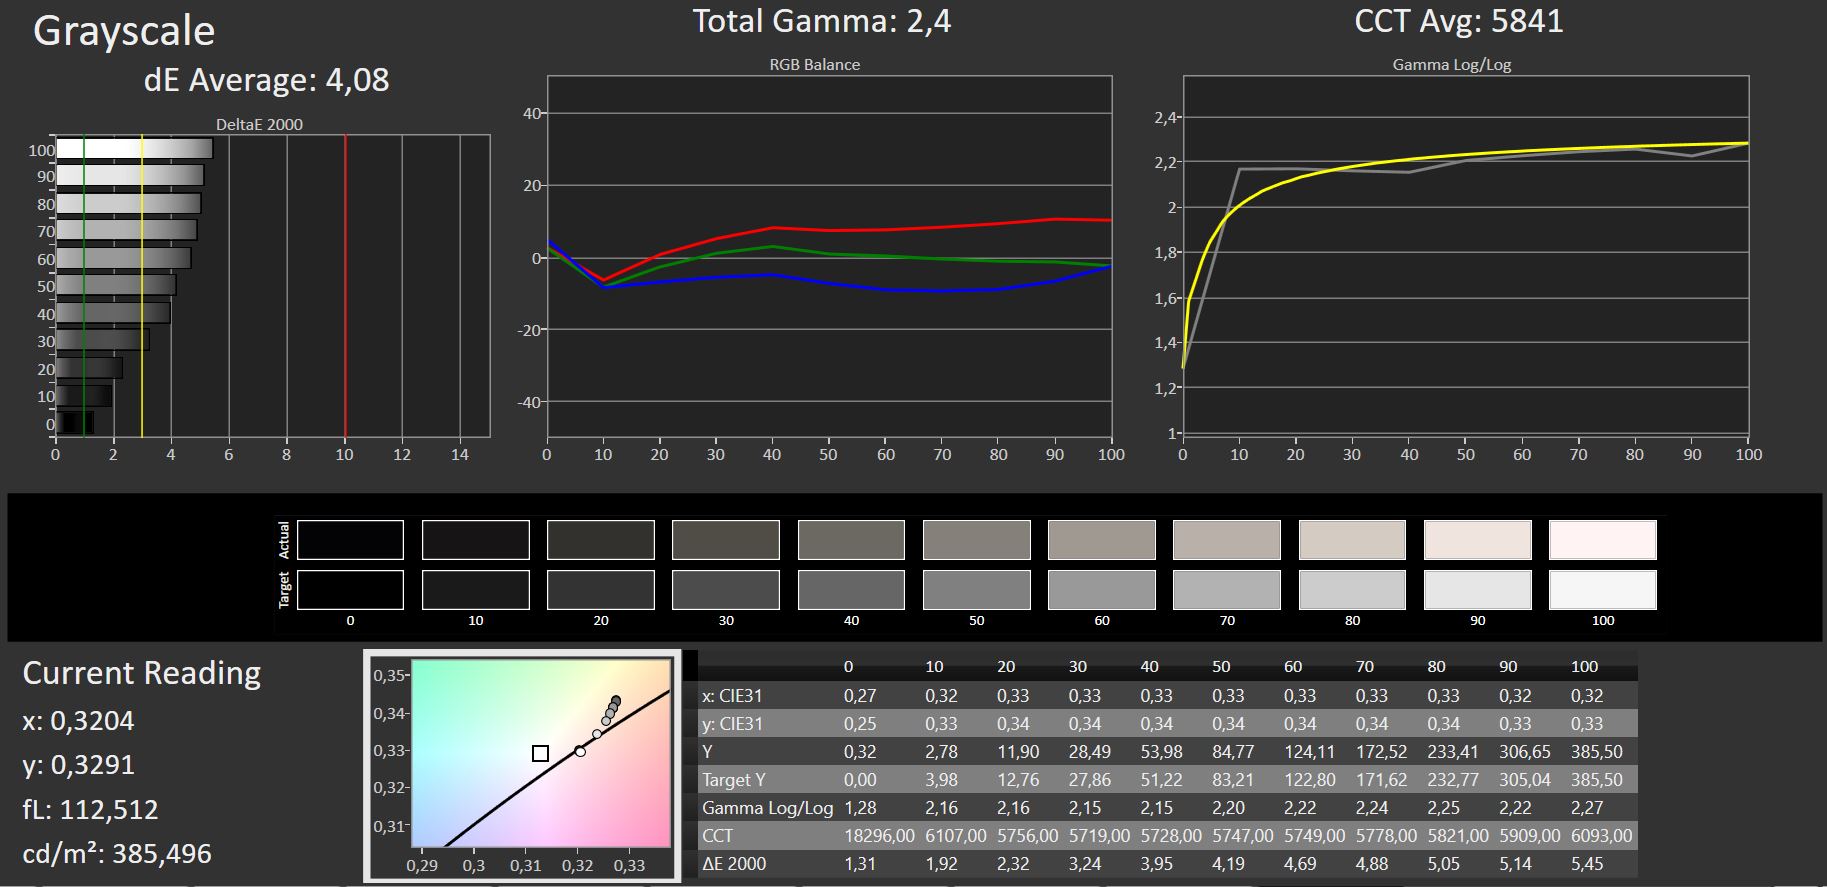
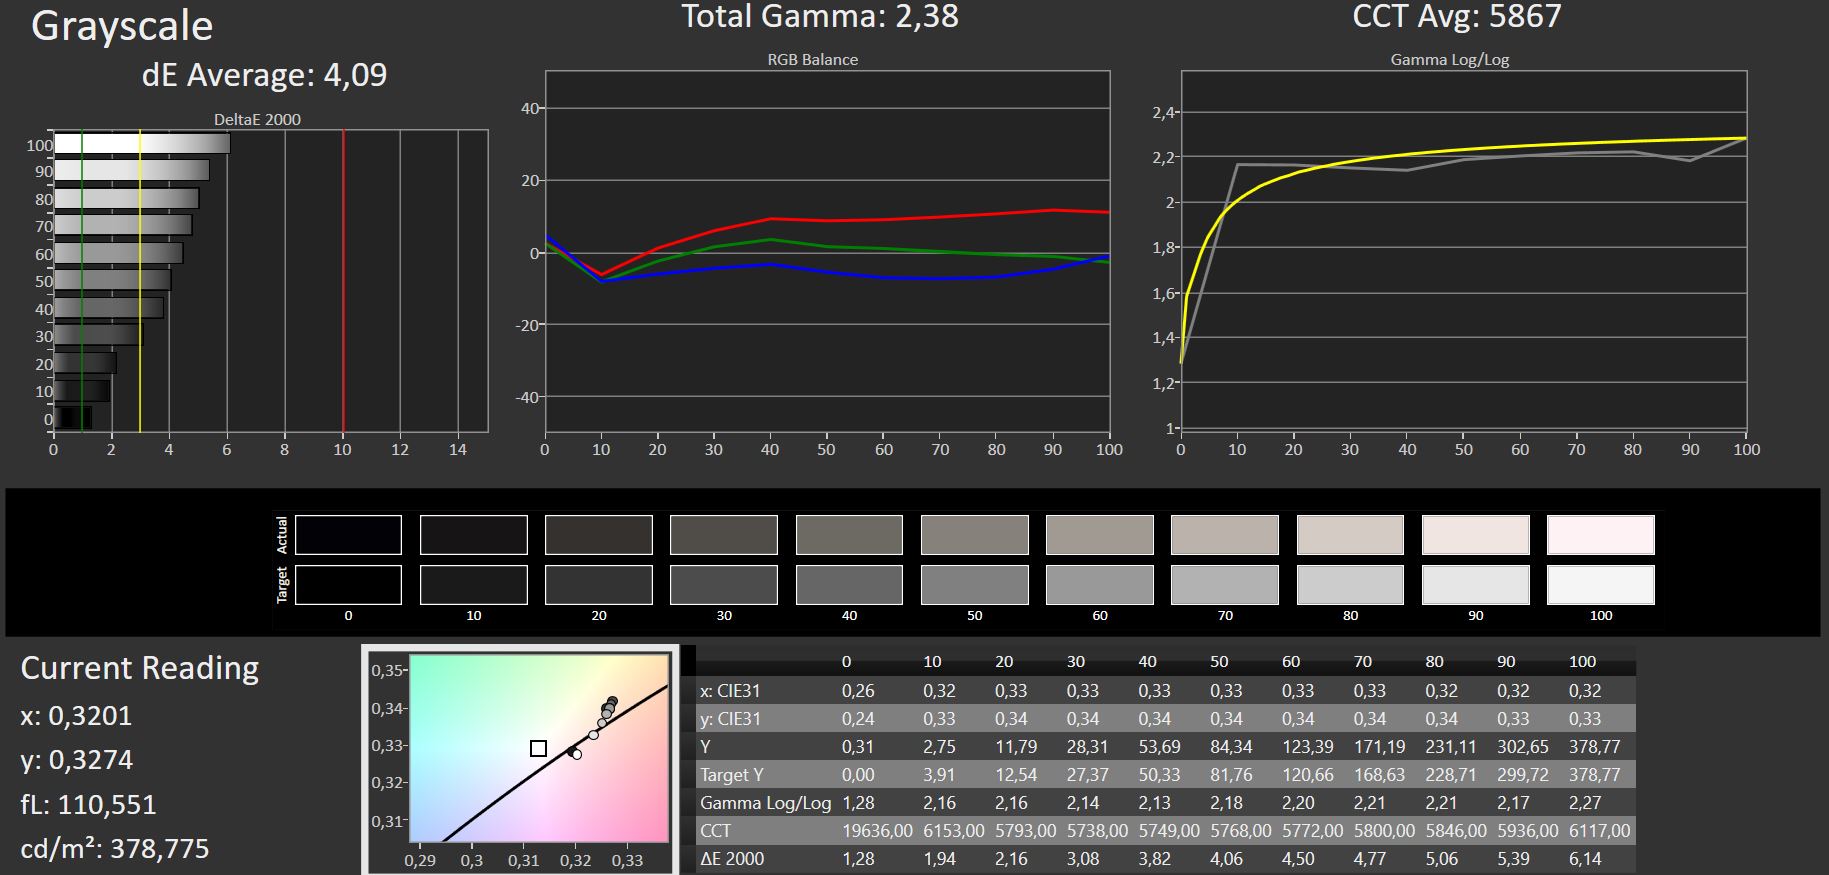
Kontrast och svartnivå är på en bra nivå med 1 145:1 respektive 0,32 cd/m², medan belysningen är ganska jämn. Det vita värdet på 5 841 K är en bit ifrån det optimala (6 500 K).
Svarstiderna är korta till mycket korta med 16 ms (GtG) samt 7,6 ms (BtW), medan endast Alienware m15 uppnår en betydande fördel på detta område. Vi kunde inte konstatera något PWM-flimmer.
| |||||||||||||||||||||||||
Distribution av ljusstyrkan: 93 %
Mitt på batteriet: 384 cd/m²
Kontrast: 1145:1 (Svärta: 0.33 cd/m²)
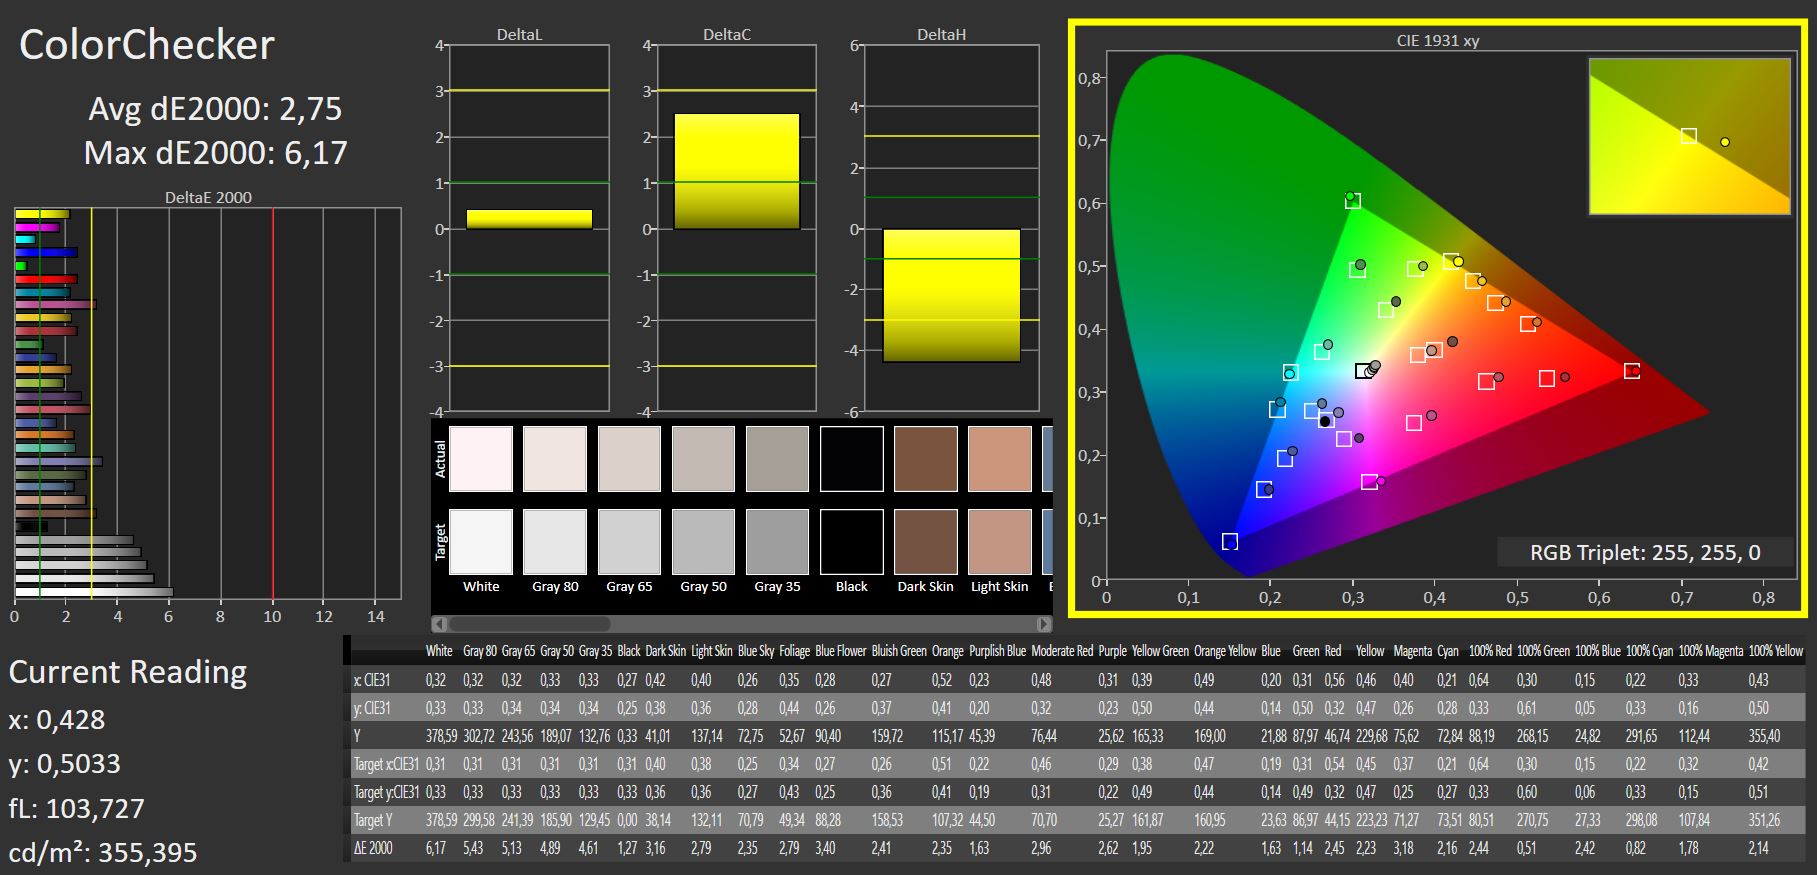
ΔE ColorChecker Calman: 2.84 | ∀{0.5-29.43 Ø4.72}
calibrated: 2.75
ΔE Greyscale Calman: 4.08 | ∀{0.09-98 Ø4.97}
69.9% AdobeRGB 1998 (Argyll 3D)
99.3% sRGB (Argyll 3D)
68.8% Display P3 (Argyll 3D)
Gamma: 2.4
CCT: 5841 K
| Schenker XMG Core 15 (M22) CSOT MNF601CA1-1, IPS, 2560x1440, 15.6" | Schenker XMG Fusion 15 (Mid 22) BOE CQ NE156QHM-NY2, IPS, 2560x1440, 15.6" | Lenovo Legion 5 15IAH7H 82RB CSOT MNF601CA1-3, IPS, 1920x1080, 15.6" | Asus TUF Gaming F15 FX507ZM TL156VDXP0101, IPS, 1920x1080, 15.6" | Alienware m15 R5 Ryzen Edition B156HAN, IPS, 1920x1080, 15.6" | Schenker XMG Core 15 Ampere BOE CQ NE156QHM-NY2, IPS, 2560x1440, 15.6" | |
|---|---|---|---|---|---|---|
| Display | -2% | 0% | -2% | 0% | ||
| Display P3 Coverage (%) | 68.8 | 67.3 -2% | 69.1 0% | 66.4 -3% | 69.8 1% | |
| sRGB Coverage (%) | 99.3 | 96.7 -3% | 99.5 0% | 97 -2% | 98.8 -1% | |
| AdobeRGB 1998 Coverage (%) | 69.9 | 68.2 -2% | 70 0% | 68.5 -2% | 70.7 1% | |
| Response Times | 18% | -26% | -2% | 32% | -15% | |
| Response Time Grey 50% / Grey 80% * (ms) | 16 ? | 11.6 ? 27% | 14.8 ? 7% | 5.6 ? 65% | 4 ? 75% | 14.8 ? 7% |
| Response Time Black / White * (ms) | 7.6 ? | 7 ? 8% | 12 ? -58% | 12.8 ? -68% | 8.4 ? -11% | 10.4 ? -37% |
| PWM Frequency (Hz) | ||||||
| Screen | -11% | -13% | 19% | 10% | 23% | |
| Brightness middle (cd/m²) | 378 | 326 -14% | 363.5 -4% | 353.7 -6% | 329 -13% | 347 -8% |
| Brightness (cd/m²) | 371 | 303 -18% | 350 -6% | 340 -8% | 321 -13% | 328 -12% |
| Brightness Distribution (%) | 93 | 89 -4% | 89 -4% | 89 -4% | 92 -1% | 89 -4% |
| Black Level * (cd/m²) | 0.33 | 0.33 -0% | 0.39 -18% | 0.34 -3% | 0.27 18% | 0.27 18% |
| Contrast (:1) | 1145 | 988 -14% | 932 -19% | 1040 -9% | 1219 6% | 1285 12% |
| Colorchecker dE 2000 * | 2.84 | 2.73 4% | 3.68 -30% | 1.74 39% | 2.78 2% | 1.66 42% |
| Colorchecker dE 2000 max. * | 5.51 | 9.54 -73% | 8.92 -62% | 3.63 34% | 4.88 11% | 3.03 45% |
| Colorchecker dE 2000 calibrated * | 2.75 | 1.36 51% | 0.53 81% | 0.5 82% | 1.63 41% | 1.23 55% |
| Greyscale dE 2000 * | 4.08 | 5.2 -27% | 6.5 -59% | 2.1 49% | 2.5 39% | 1.6 61% |
| Gamma | 2.4 92% | 2.074 106% | 2.2 100% | 2.3 96% | 2.106 104% | 2.278 97% |
| CCT | 5841 111% | 6911 94% | 5995 108% | 6257 104% | 6201 105% | 6430 101% |
| Color Space (Percent of AdobeRGB 1998) (%) | 76 | 71 | ||||
| Color Space (Percent of sRGB) (%) | 99 | 94 | ||||
| Totalt genomsnitt (program/inställningar) | 2% /
-5% | -13% /
-12% | 5% /
12% | 21% /
14% | 3% /
13% |
* ... mindre är bättre
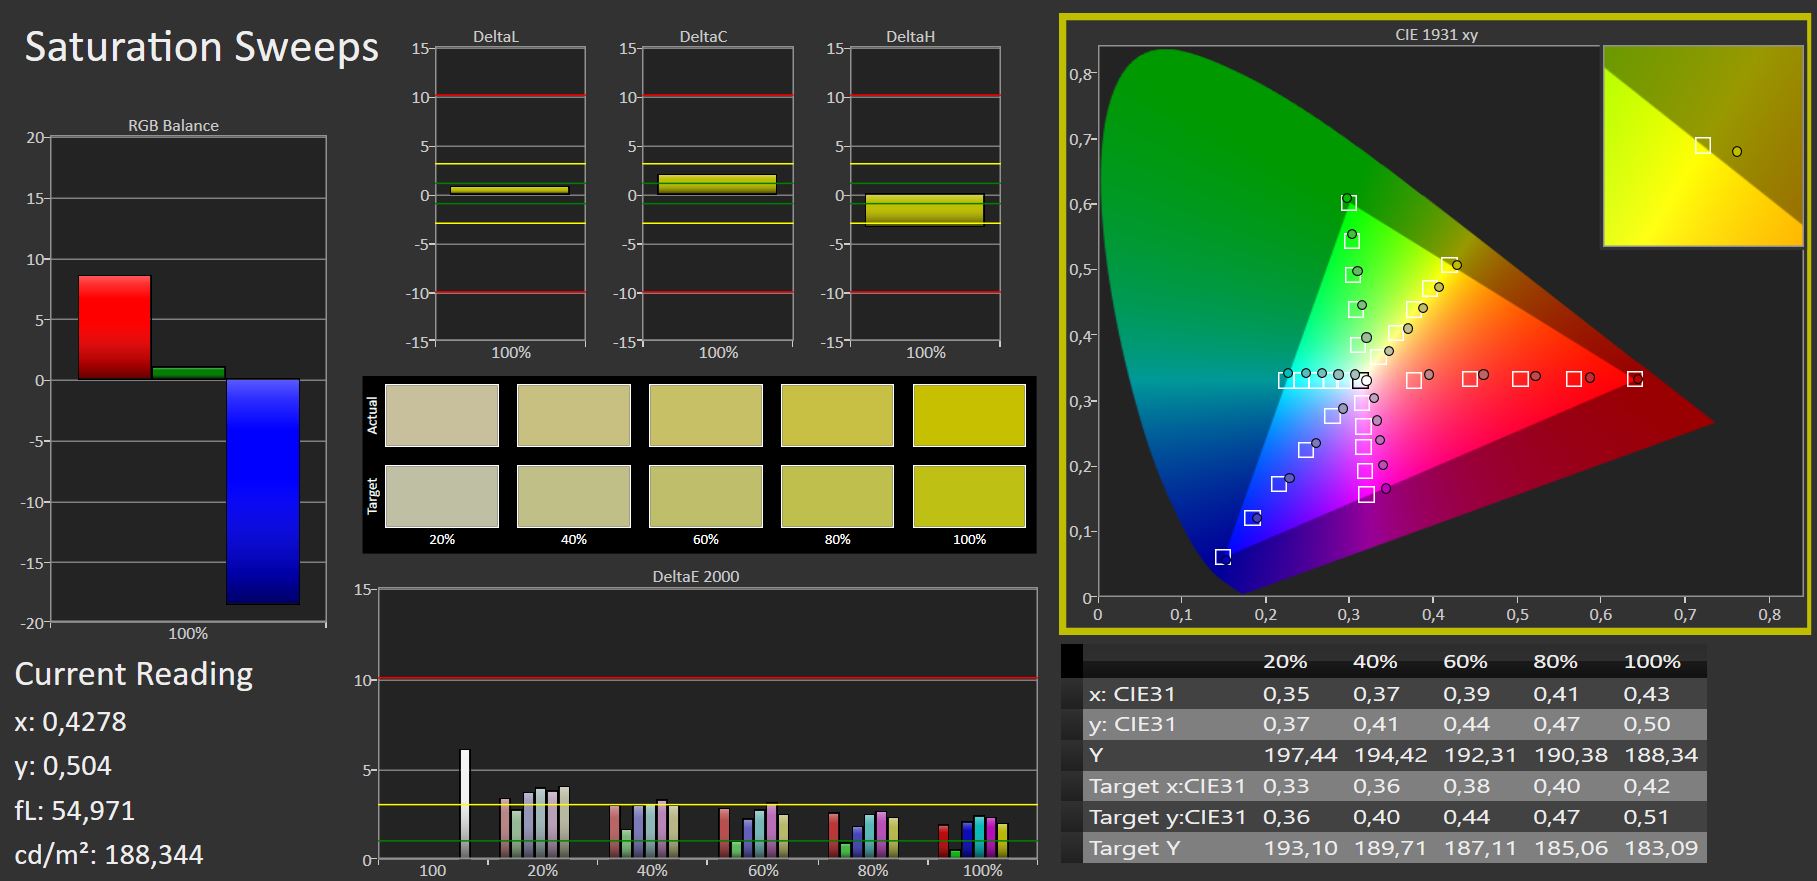
SRGB-färgrymden täcks till 99,3 %, vilket möjliggör professionell bildredigering på det digitala området. Större färgrymder, som DCI-P3 för videoredigering och AdobeRGB för professionell utskrift av redigerade bilder, täcks dock endast av Alienware m15 och HP Envy 16 täcker dem nästan helt.
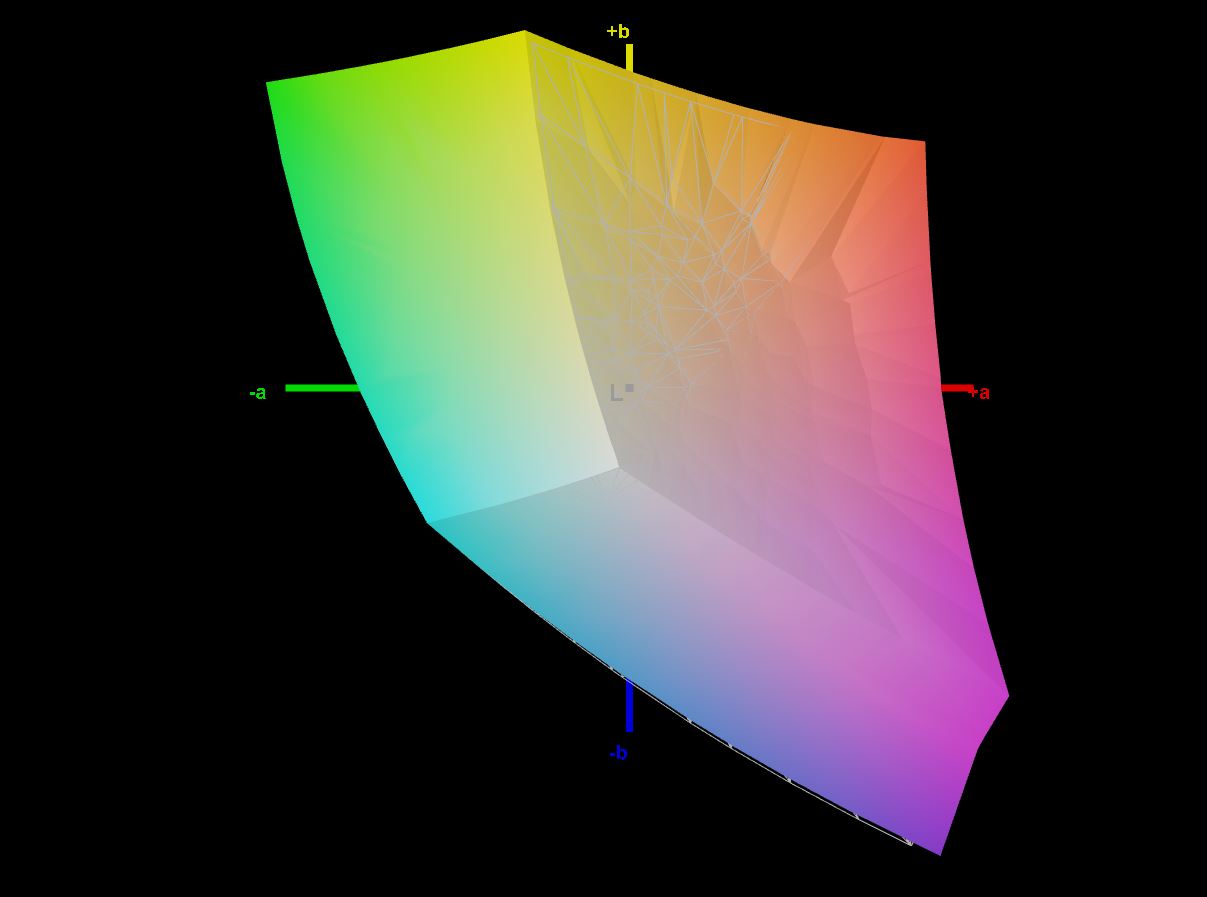
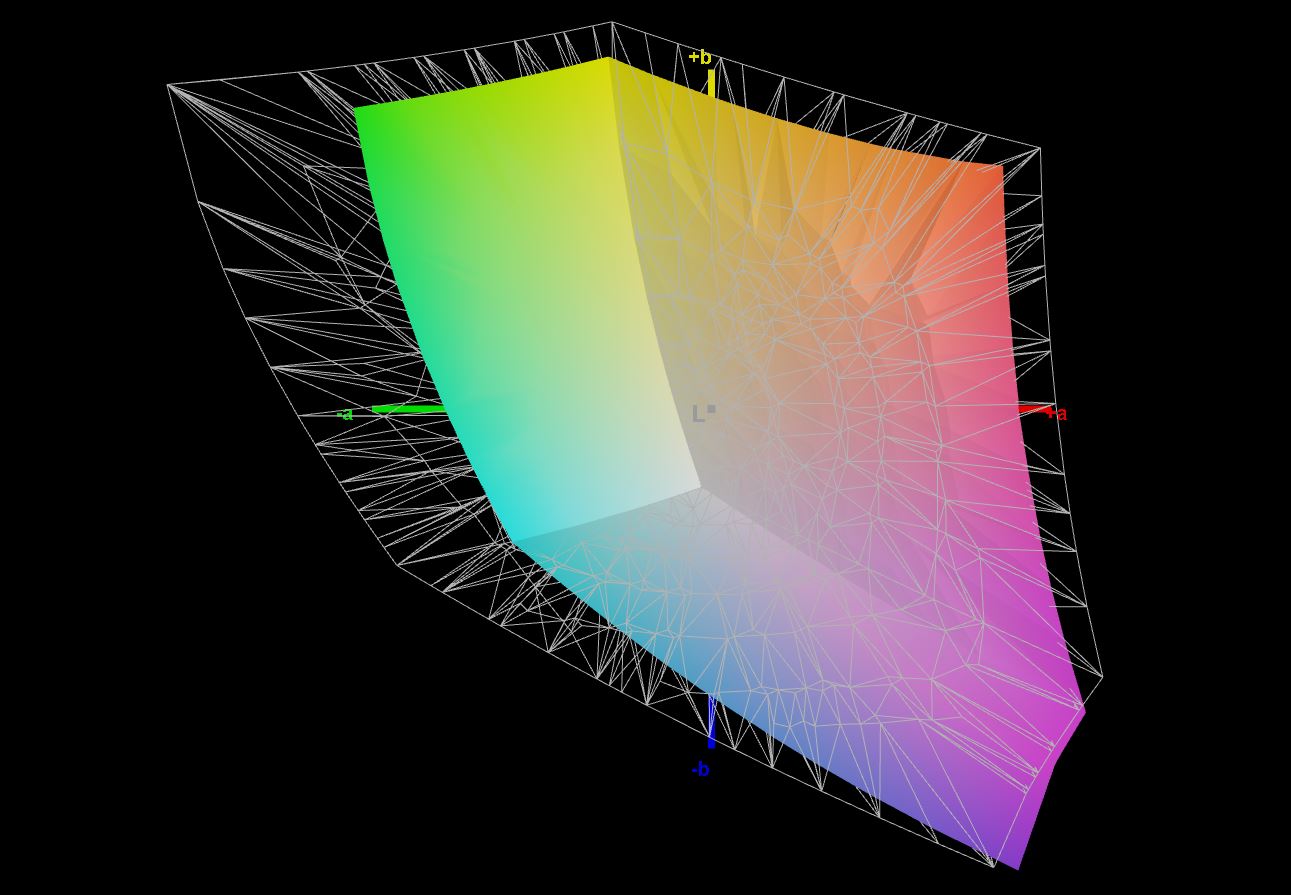
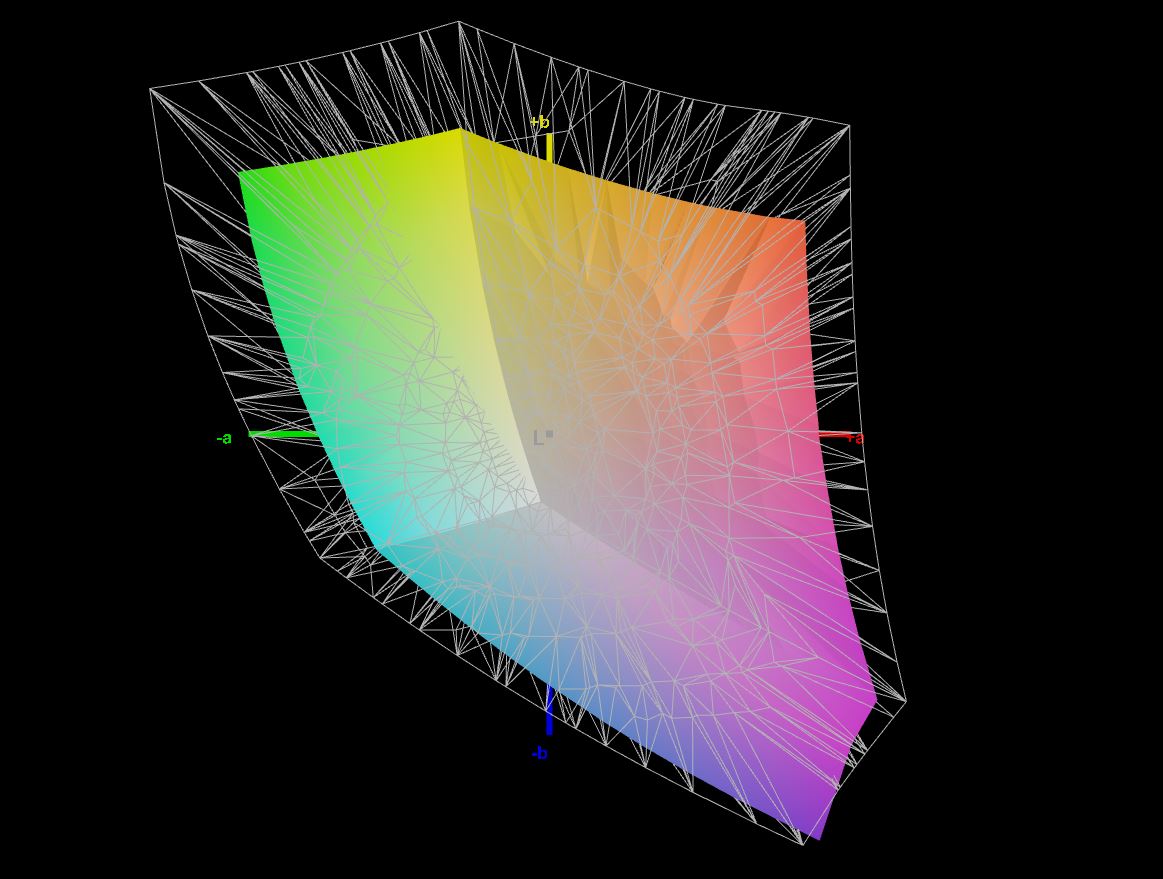
Nästan alla färger ligger under tröskelvärdet DeltaE 3. En lätt rödtoning syns dock redan från fabrik, som inte försvinner ens efter vår kalibrering. Vår kalibrerade färgprofil kan laddas nerhär.


Visa svarstider
| ↔ Svarstid svart till vitt | ||
|---|---|---|
| 7.6 ms ... stiga ↗ och falla ↘ kombinerat | ↗ 3 ms stiga | 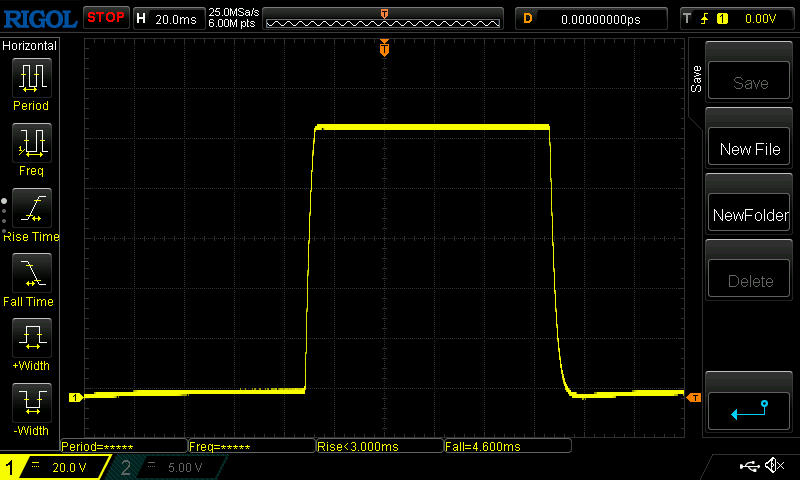 |
| ↘ 4.6 ms hösten | ||
| Skärmen visar väldigt snabba svarsfrekvenser i våra tester och borde vara mycket väl lämpad för fartfyllt spel. I jämförelse sträcker sig alla testade enheter från 0.1 (minst) till 240 (maximalt) ms. » 22 % av alla enheter är bättre. Det betyder att den uppmätta svarstiden är bättre än genomsnittet av alla testade enheter (19.8 ms). | ||
| ↔ Svarstid 50 % grått till 80 % grått | ||
| 16 ms ... stiga ↗ och falla ↘ kombinerat | ↗ 7 ms stiga | 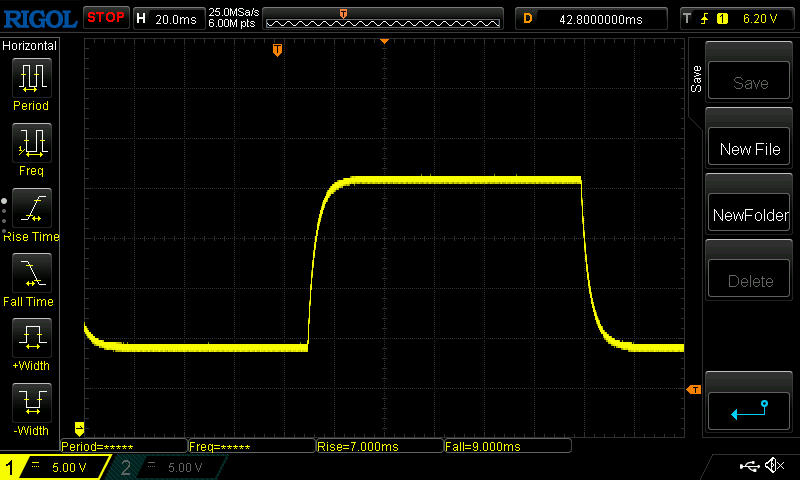 |
| ↘ 9 ms hösten | ||
| Skärmen visar bra svarsfrekvens i våra tester, men kan vara för långsam för konkurrenskraftiga spelare. I jämförelse sträcker sig alla testade enheter från 0.165 (minst) till 636 (maximalt) ms. » 30 % av alla enheter är bättre. Det betyder att den uppmätta svarstiden är bättre än genomsnittet av alla testade enheter (31 ms). | ||
Skärmflimmer / PWM (Puls-Width Modulation)
| Skärmflimmer / PWM upptäcktes inte | 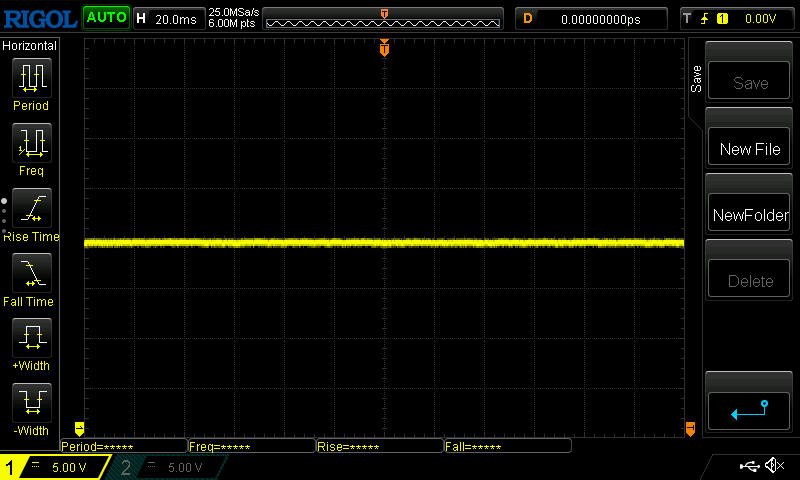 | ||
Som jämförelse: 52 % av alla testade enheter använder inte PWM för att dämpa skärmen. Om PWM upptäcktes mättes ett medelvärde av 7769 (minst: 5 - maximum: 343500) Hz. | |||
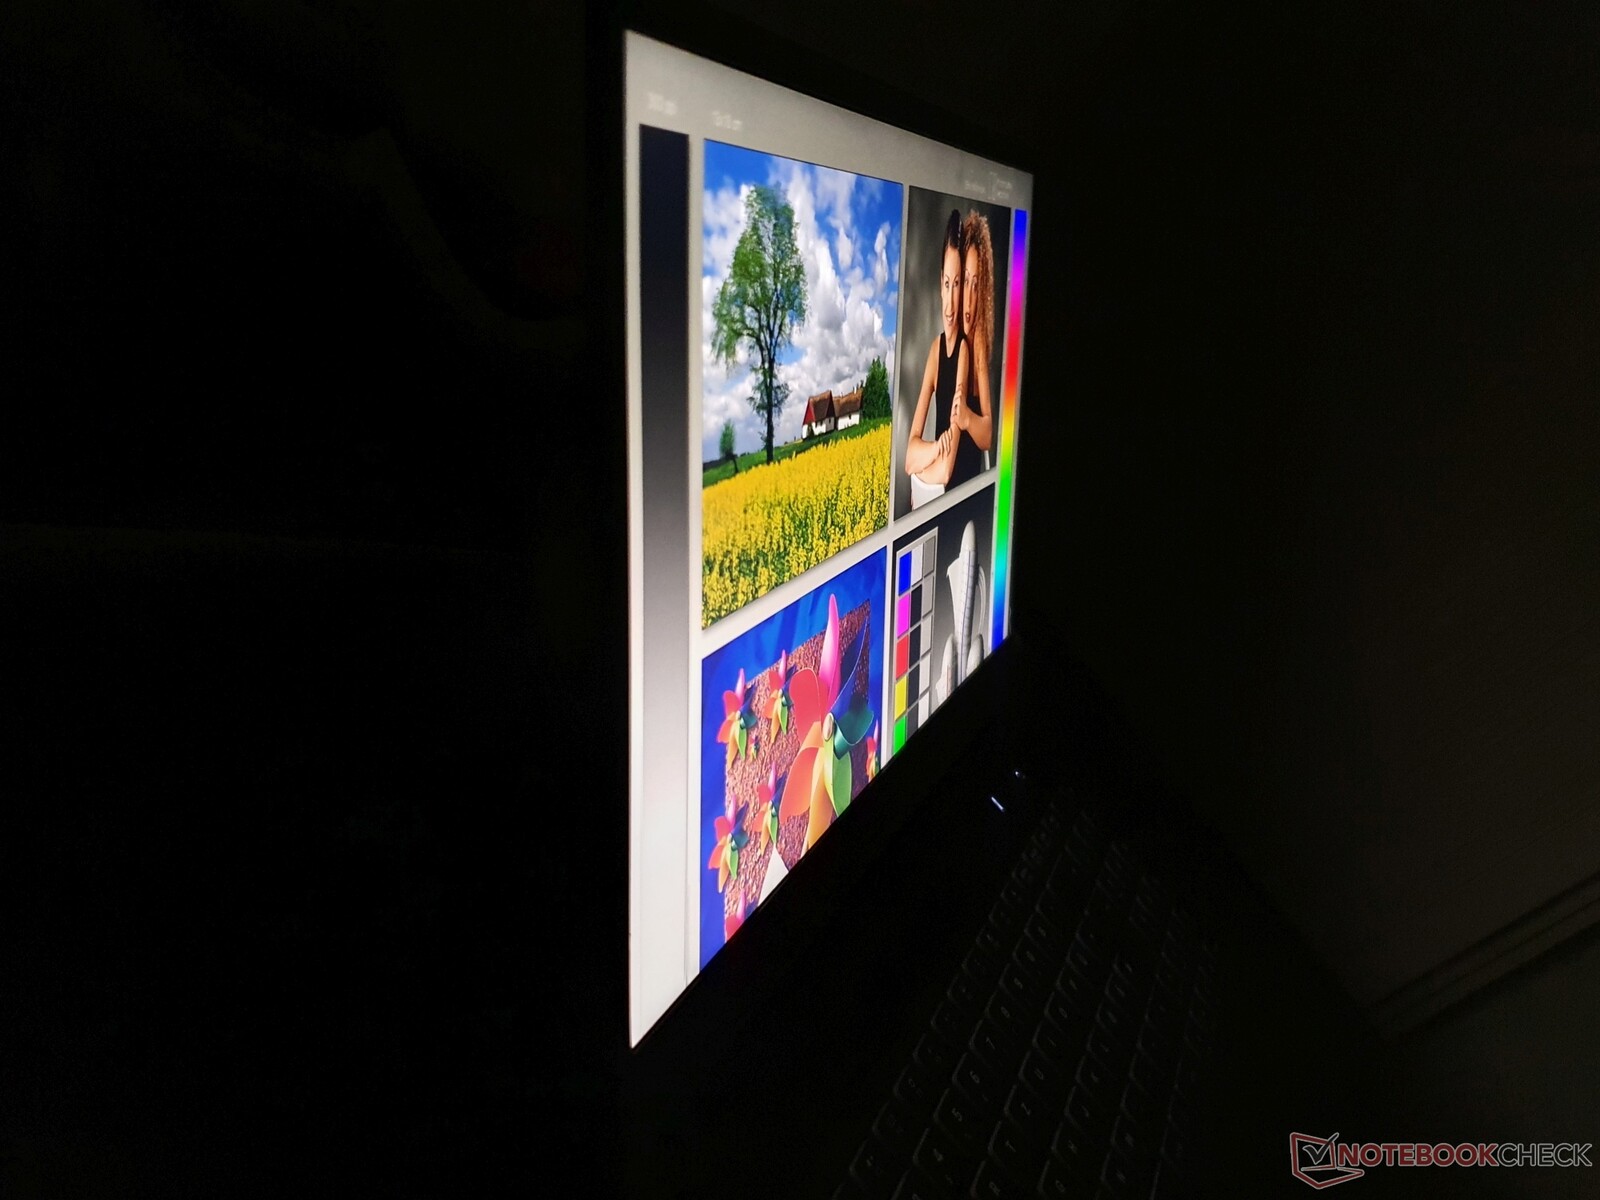
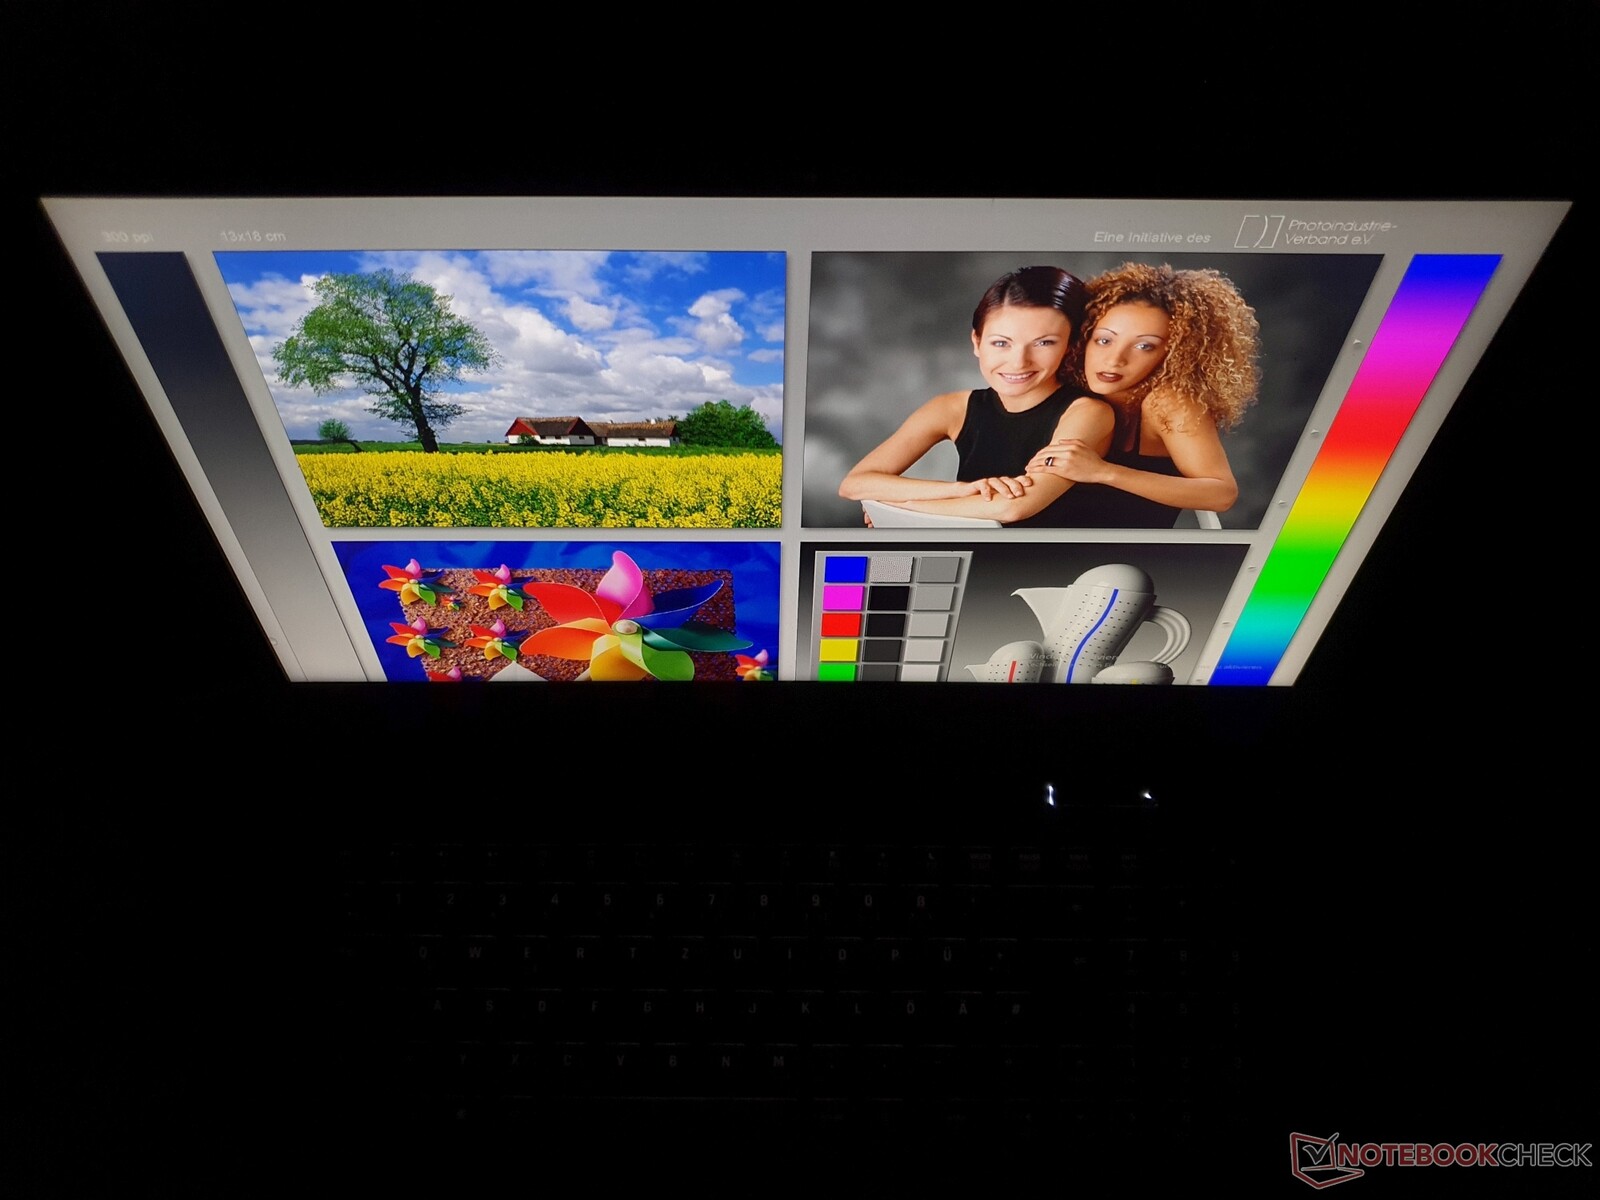
Skärmens 371 cd/m² kan bara läsas bra utan direkt solljus på baksidan trots den matta ytan.

Prestanda: RTX 3060 med maximal TGP, men det finns snabbare
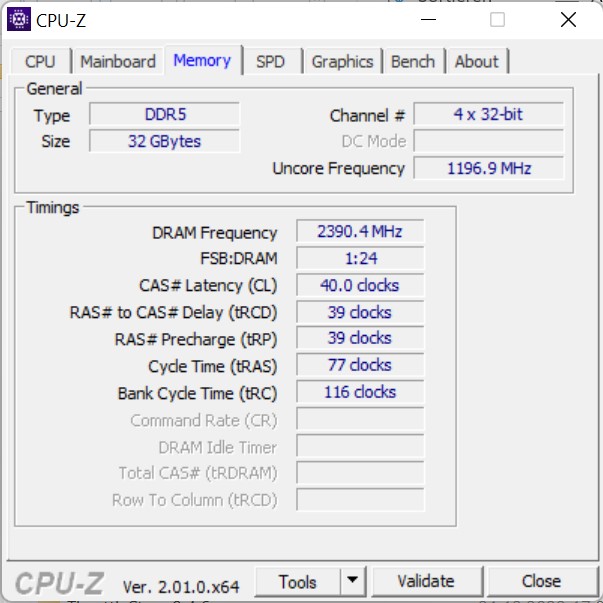
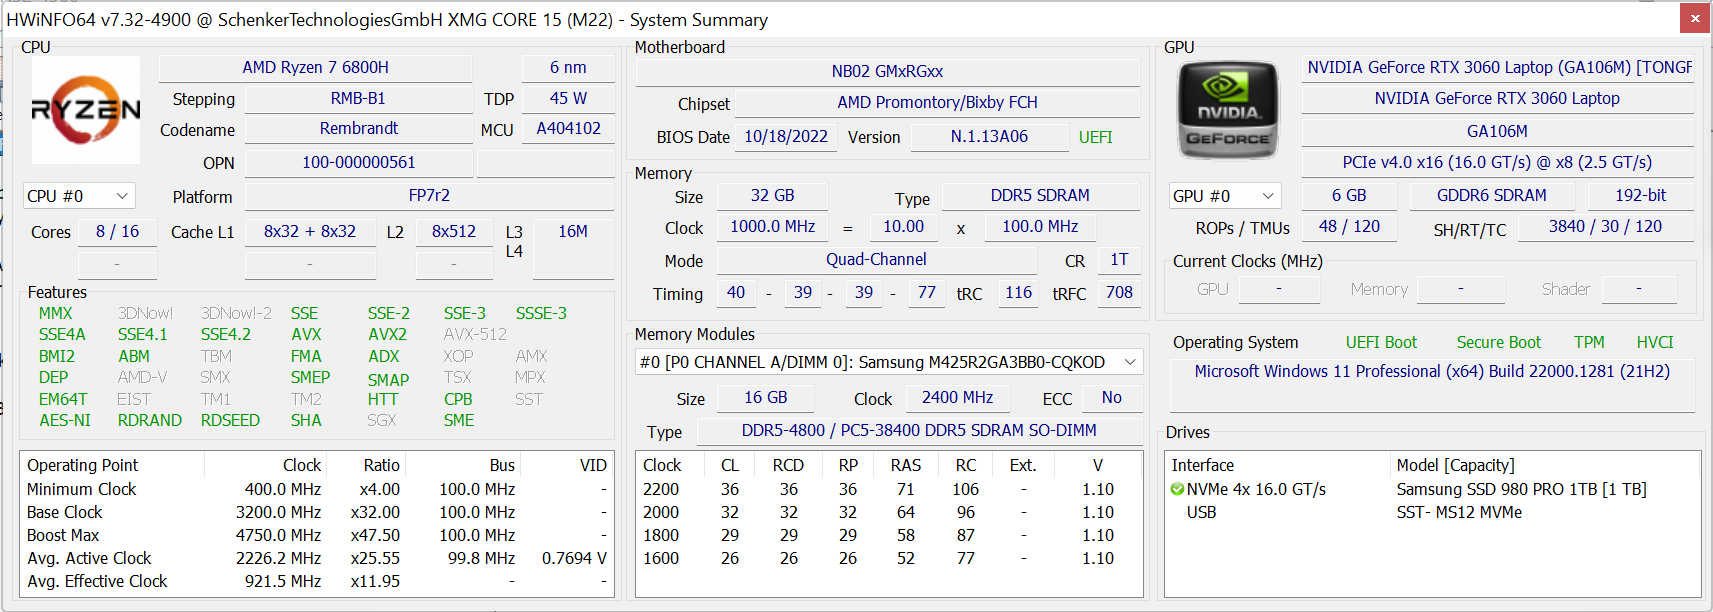
Den bärbara 15,6-tums gamingdatorn är mycket kraftfull tack vare sin Nvidia RTX 3060 med 140 W TGP som är utformad för aktuella spel, det finns inget annat GPU-alternativ. Processorn Ryzen 7 6800H är också stark och är det enda valet. RAM-minne och masslagring är generösa med 32 GB DDR5-4800 (maximalt 64 GB) respektive en 1 TB PCIe 4.0 SSD. Arbetsstationsuppgifter och videoarbete klaras också snabbt och ger mycket låga utsläpp när man använder den externa vattenkylningen.
Provningsvillkor
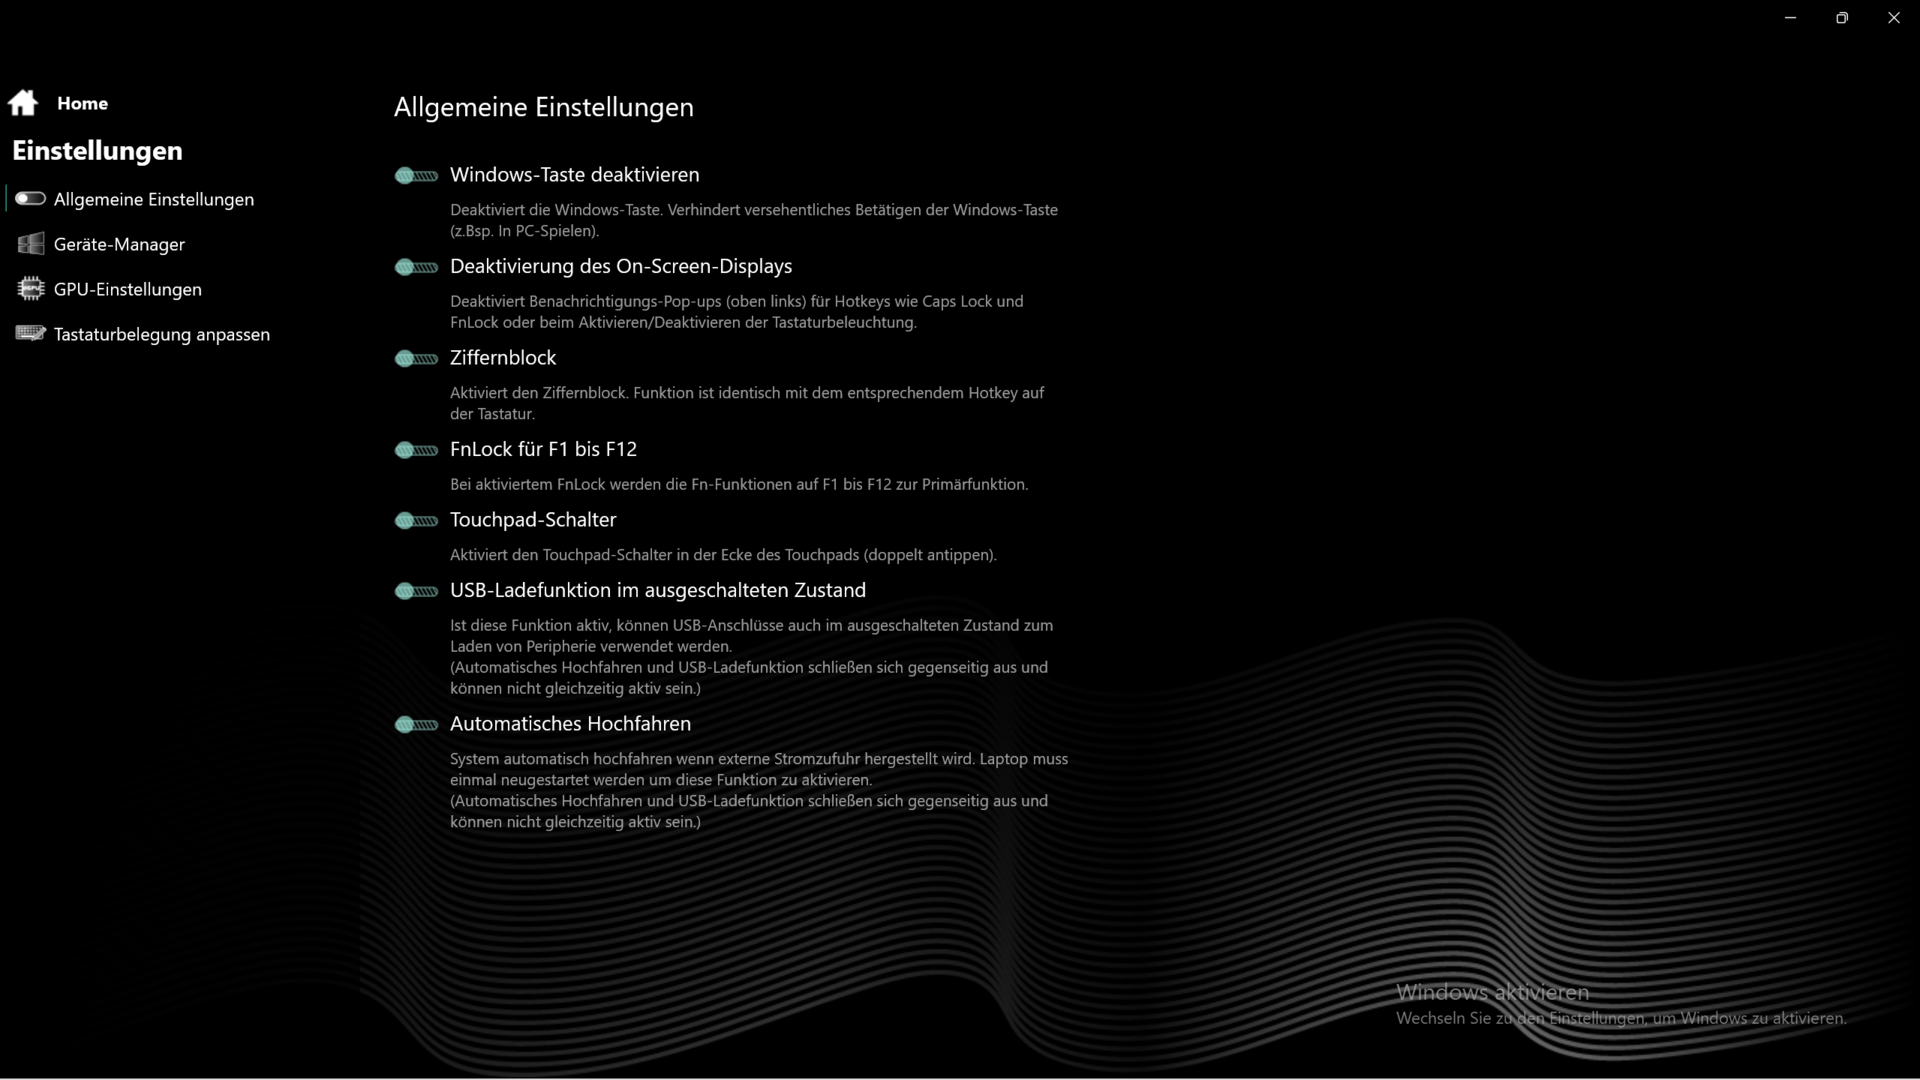
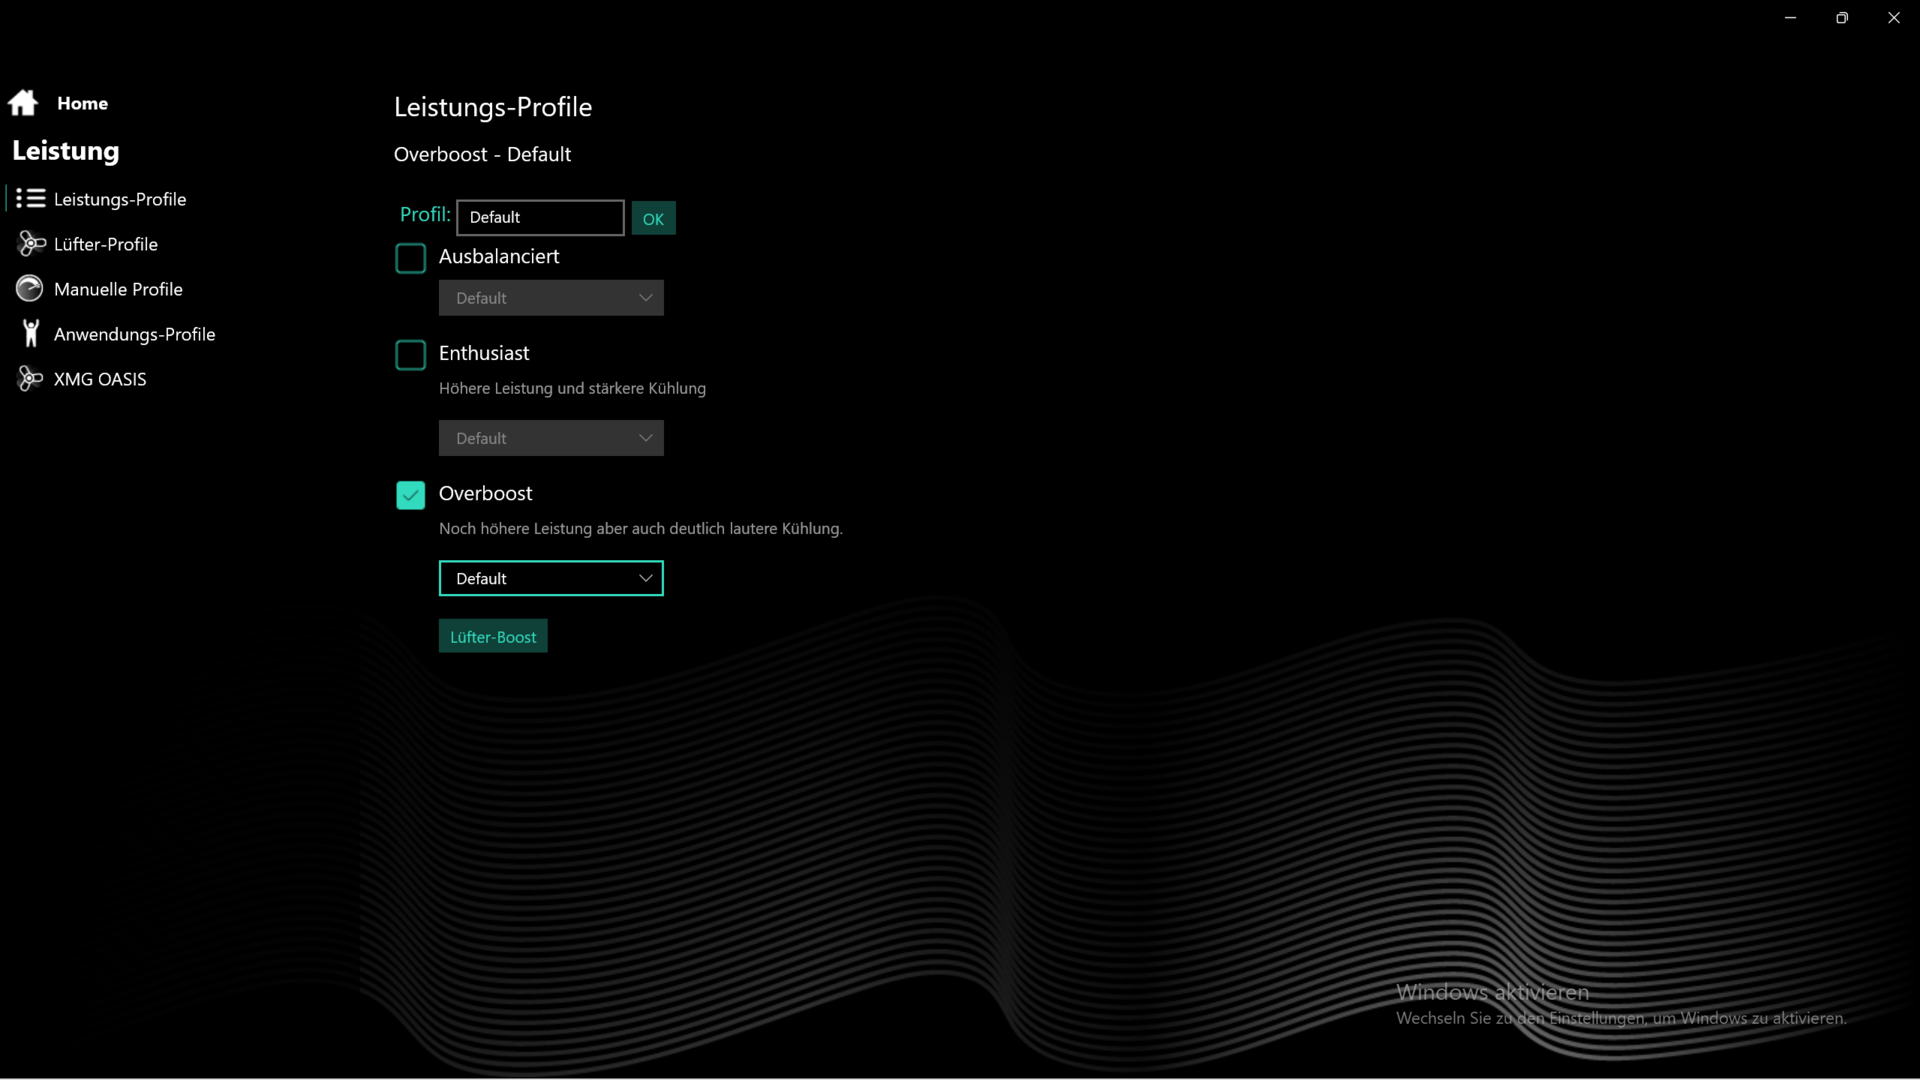
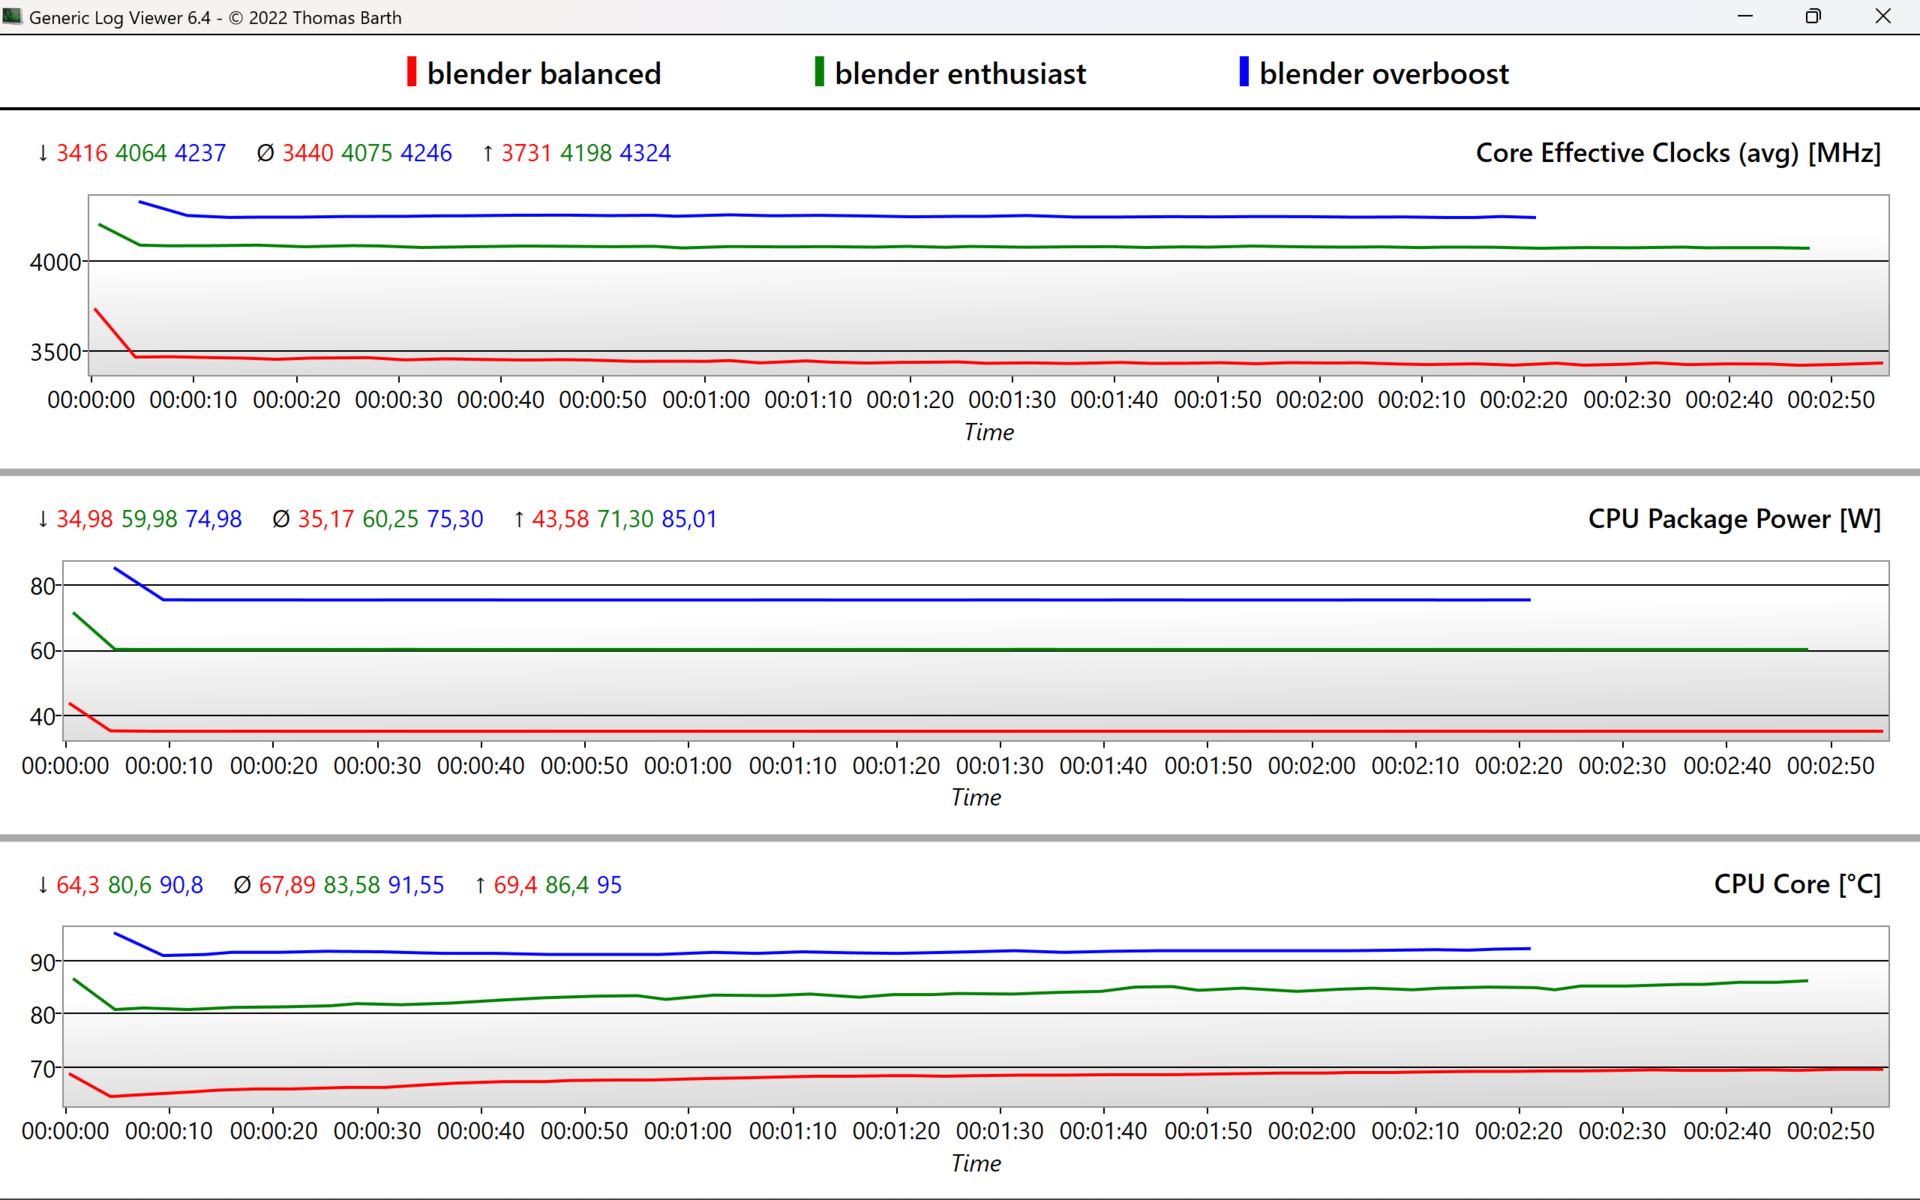
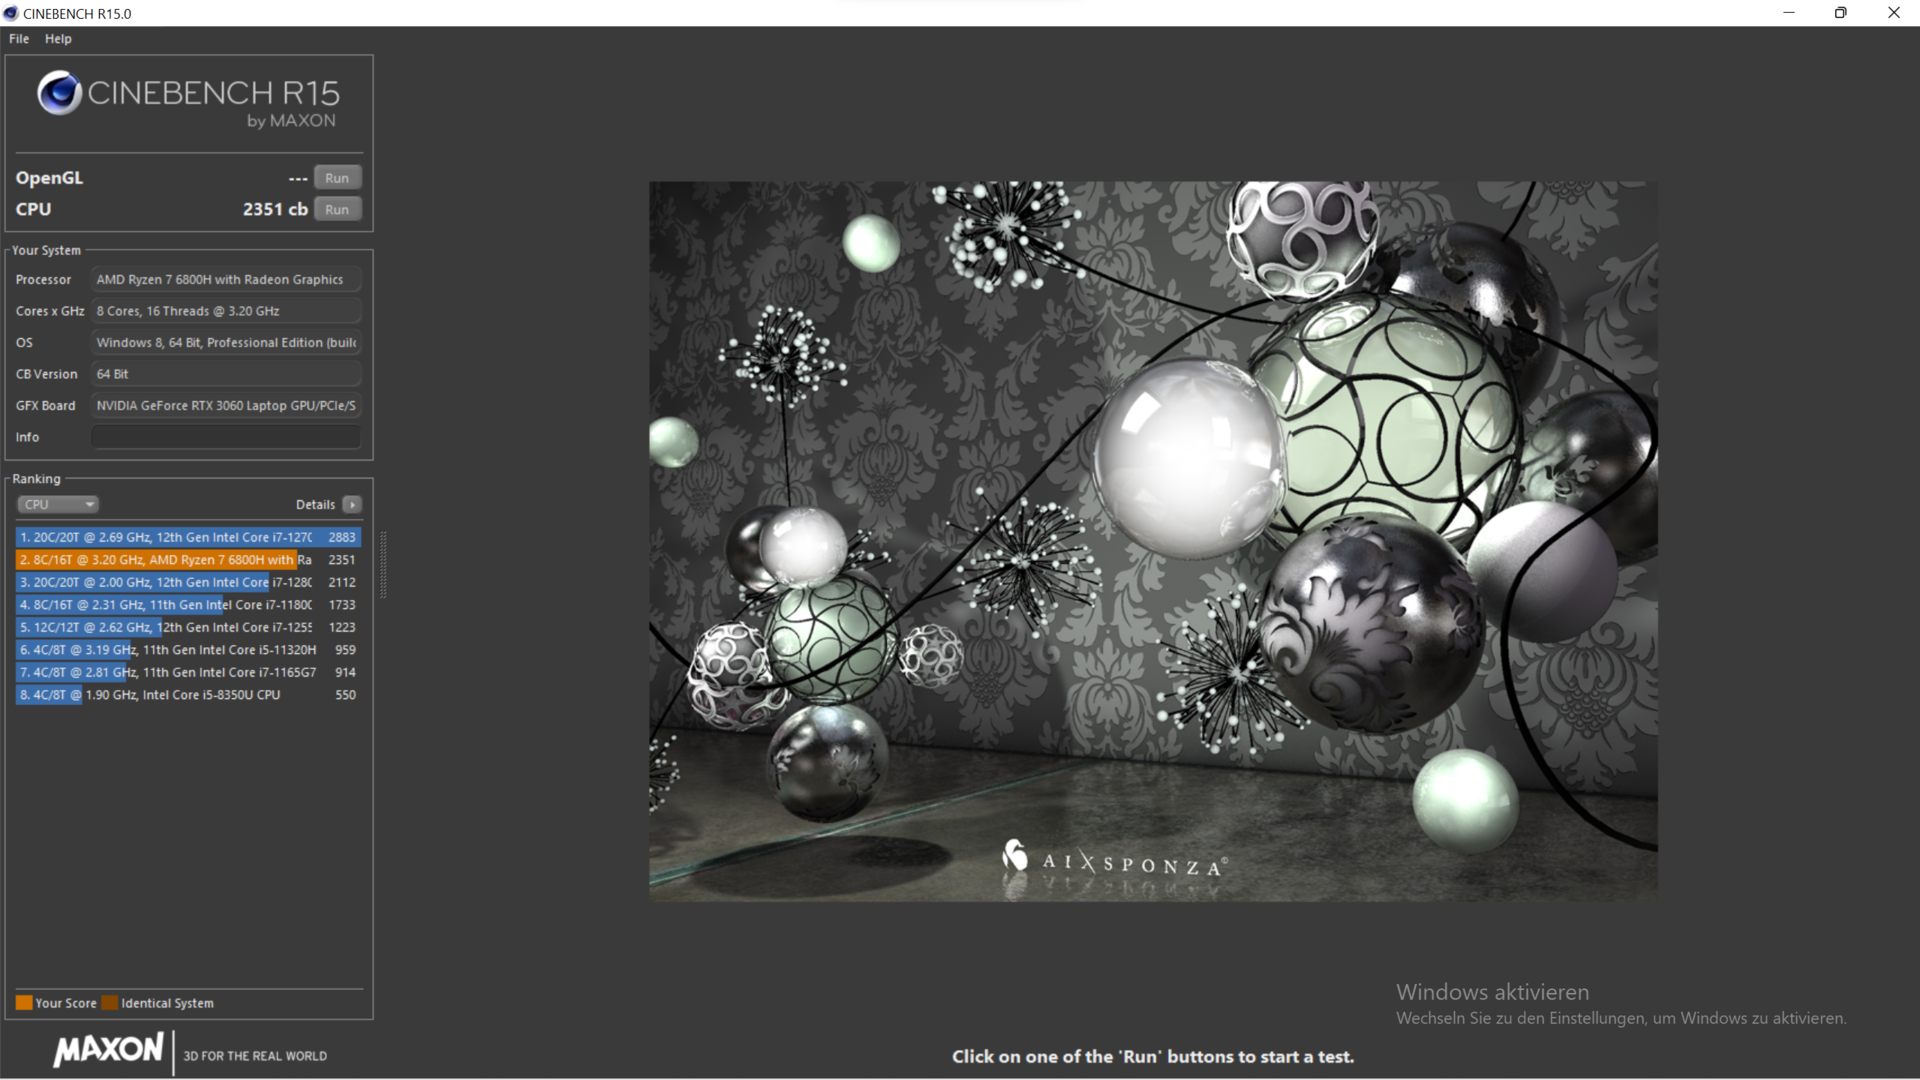
Schenker erbjuder tre strömlägen i Core 15, men även individuella profiler. Knappen till vänster om strömbrytaren kan användas för att (av)aktivera en profil, vilket kan vara användbart för många scenarier. Overboost möjliggör en permanent effektgräns på 75 W för CPU:n, 60 W i Enthusiast och 35 watt i Balanced-läget. Det finns också funktionen Fan Boost, som håller CPU:n kallare med cirka 5 °C med en mycket högre ljudnivå.
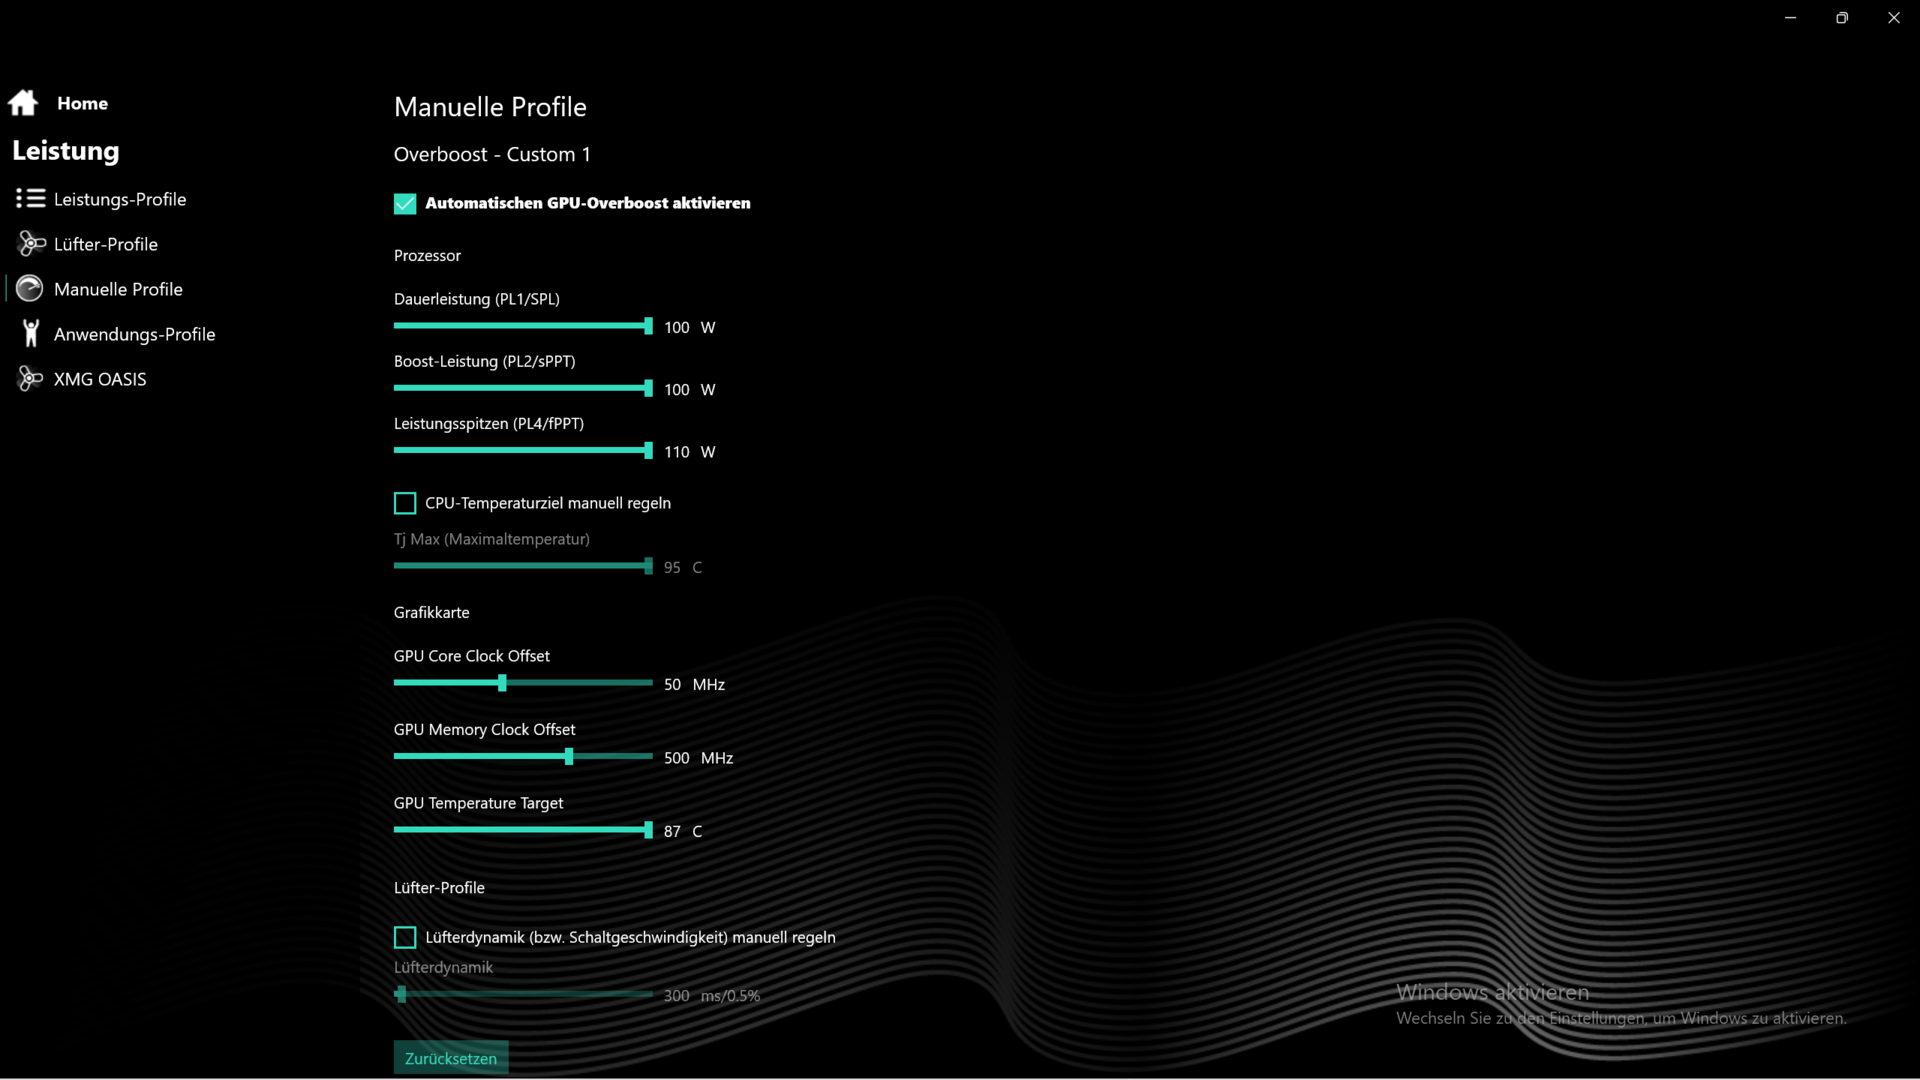
Prestandabänkningarna kördes i förinställningen Overboost, men vi rekommenderar ändå Enthusiast, som i princip ger samma prestanda med tystare ljud. Att flytta TDP-reglagen till 100 W gav bara 5 W till effektgränsen, medan överklockning av GPU:n till de rekommenderade värdena (se skärmbilden "GPU-inställningar") gav några bonusprocenter.
Processor
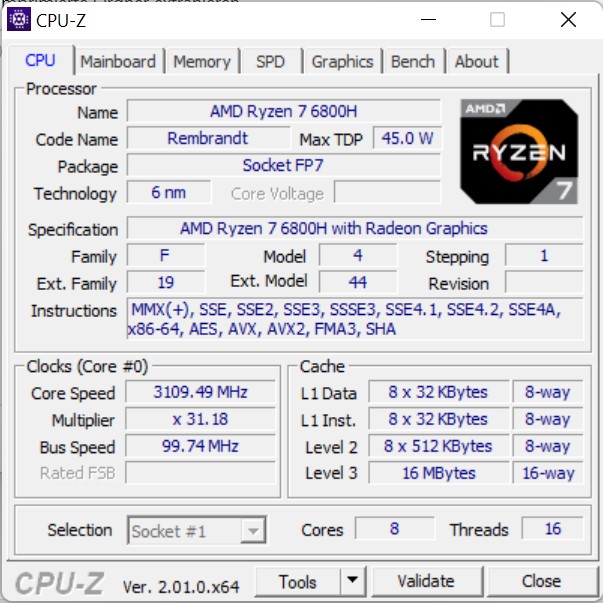
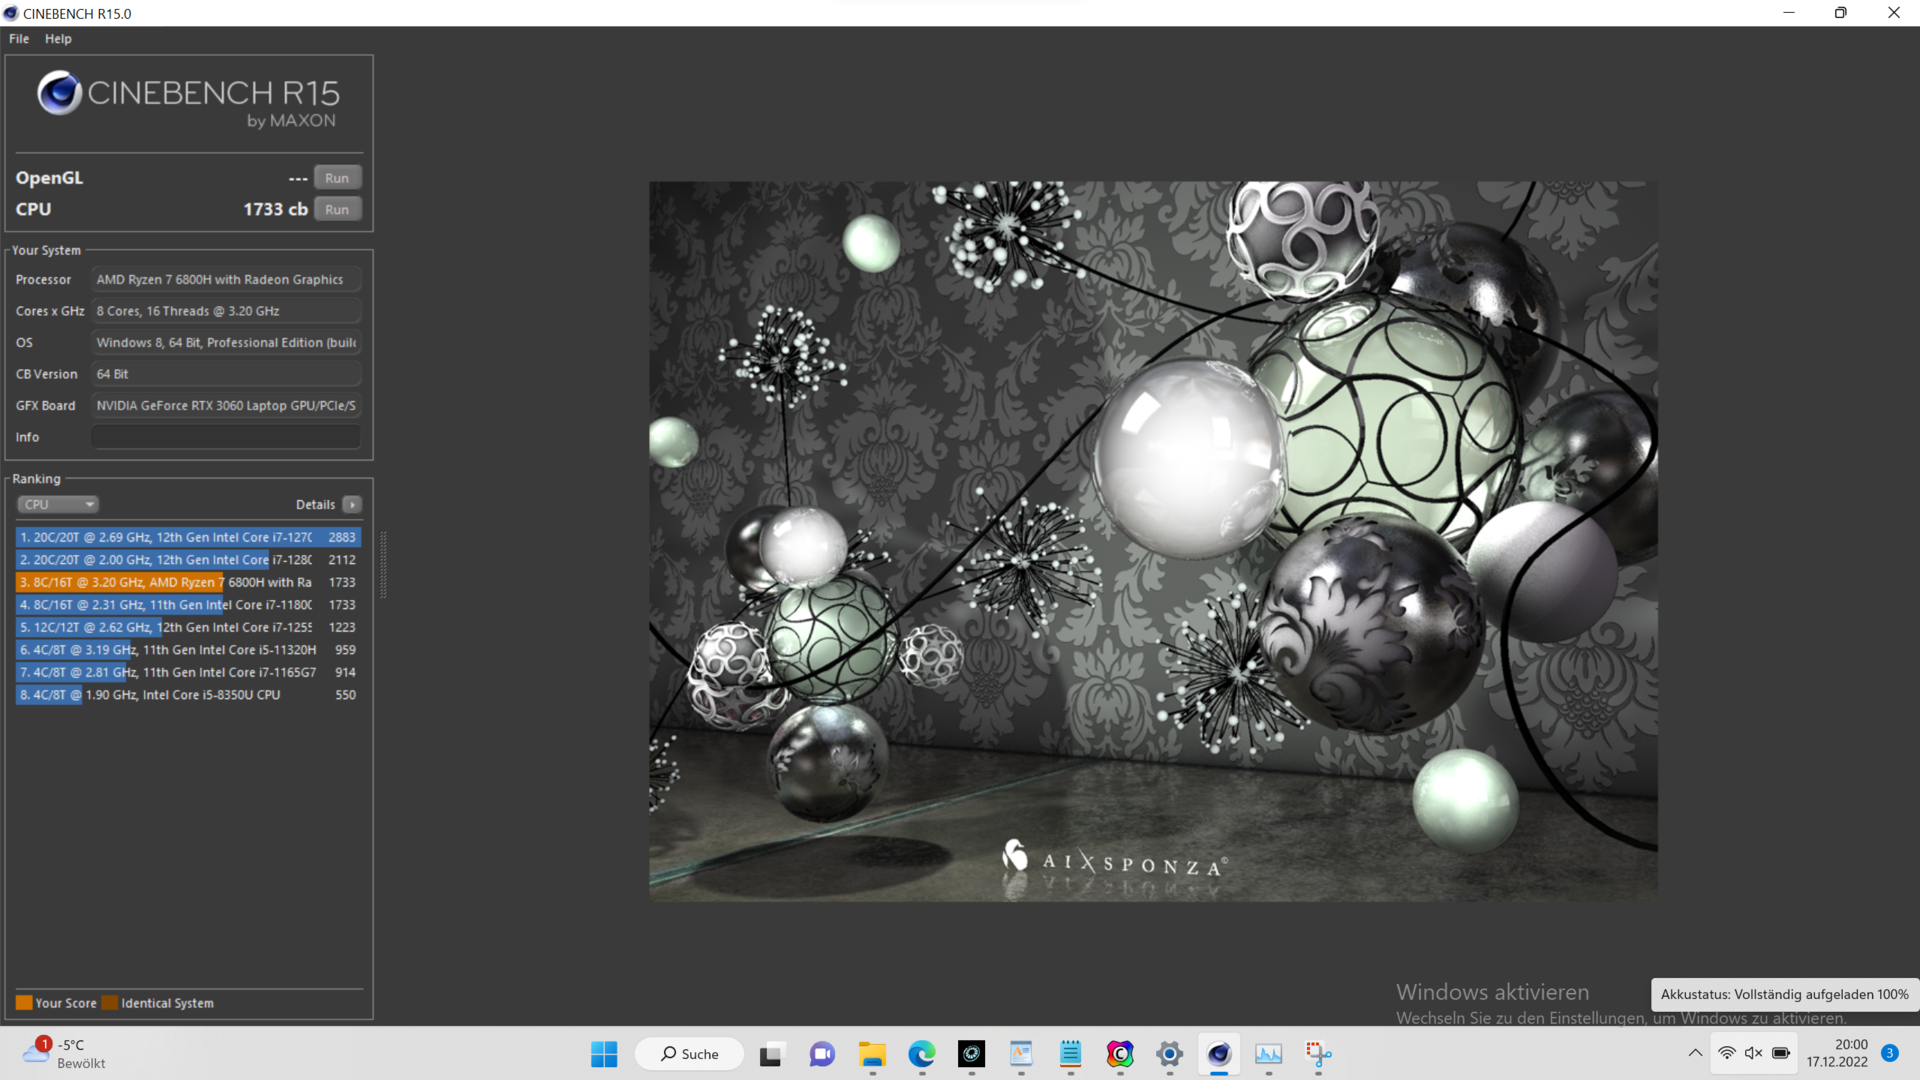
AMD:s Ryzen 7 6800H är en CPU på 45 W och körs permanent med 75 W i XMG Core 15, så att en klockfrekvens på 4,3 GHz för alla åtta kärnor kan hållas vid cirka 92 °C (~198 °F). Under några sekunder förses processorn med 85 W.
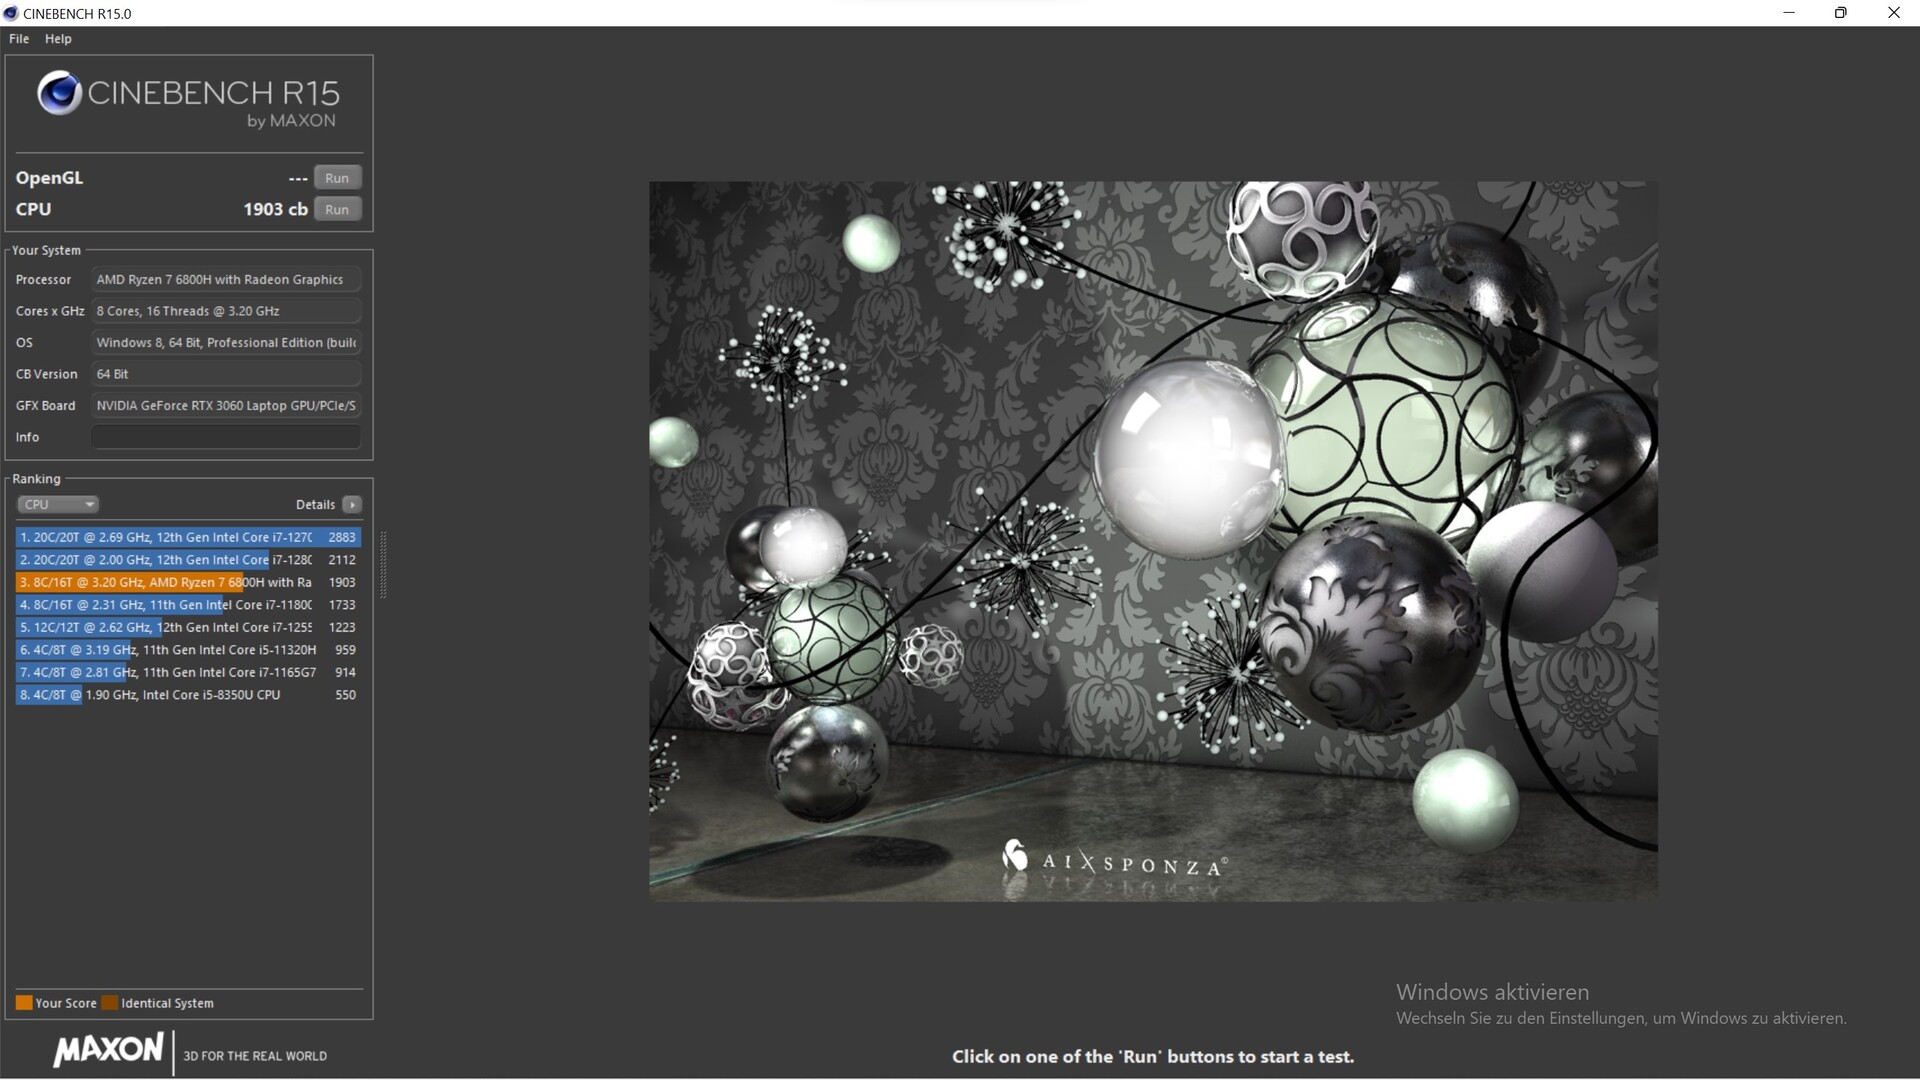
Vår Cinebench R15-slinga visar att Core i7-12700H fungerar betydligt snabbare i Legion 5 och TUF Gaming F15 , även om XMG utnyttjar Ryzen 7 6800H:s potential. Vid en effektgräns på 35 W (balanserat läge) minskar prestandan hos den effektiva Ryzen-CPU:n endast med 20 %
I batteriläge minskar prestandan med cirka 25 % trotsOverboost.

Cinebench R15 Multi endurance test
Cinebench R23: Multi Core | Single Core
Cinebench R20: CPU (Multi Core) | CPU (Single Core)
Cinebench R15: CPU Multi 64Bit | CPU Single 64Bit
Blender: v2.79 BMW27 CPU
7-Zip 18.03: 7z b 4 | 7z b 4 -mmt1
Geekbench 5.5: Multi-Core | Single-Core
HWBOT x265 Benchmark v2.2: 4k Preset
LibreOffice : 20 Documents To PDF
R Benchmark 2.5: Overall mean
| CPU Performance rating | |
| Genomsnitt av klass Gaming | |
| Lenovo Legion 5 15IAH7H 82RB | |
| Asus TUF Gaming F15 FX507ZM | |
| Schenker XMG Core 15 (M22) | |
| Genomsnitt AMD Ryzen 7 6800H | |
| Alienware m15 R5 Ryzen Edition | |
| Schenker XMG Fusion 15 (Mid 22) | |
| Schenker XMG Core 15 Ampere | |
| Cinebench R23 / Multi Core | |
| Genomsnitt av klass Gaming (10488 - 40970, n=110, senaste 2 åren) | |
| Lenovo Legion 5 15IAH7H 82RB | |
| Asus TUF Gaming F15 FX507ZM | |
| Schenker XMG Core 15 (M22) | |
| Genomsnitt AMD Ryzen 7 6800H (11481 - 14660, n=11) | |
| Alienware m15 R5 Ryzen Edition | |
| Schenker XMG Core 15 Ampere | |
| Schenker XMG Fusion 15 (Mid 22) | |
| Cinebench R23 / Single Core | |
| Genomsnitt av klass Gaming (1166 - 2356, n=110, senaste 2 åren) | |
| Lenovo Legion 5 15IAH7H 82RB | |
| Asus TUF Gaming F15 FX507ZM | |
| Schenker XMG Core 15 (M22) | |
| Genomsnitt AMD Ryzen 7 6800H (1500 - 1552, n=9) | |
| Schenker XMG Fusion 15 (Mid 22) | |
| Alienware m15 R5 Ryzen Edition | |
| Schenker XMG Core 15 Ampere | |
| Cinebench R20 / CPU (Multi Core) | |
| Genomsnitt av klass Gaming (4029 - 16108, n=109, senaste 2 åren) | |
| Lenovo Legion 5 15IAH7H 82RB | |
| Asus TUF Gaming F15 FX507ZM | |
| Schenker XMG Core 15 (M22) | |
| Genomsnitt AMD Ryzen 7 6800H (4460 - 5661, n=9) | |
| Alienware m15 R5 Ryzen Edition | |
| Schenker XMG Core 15 Ampere | |
| Schenker XMG Fusion 15 (Mid 22) | |
| Cinebench R20 / CPU (Single Core) | |
| Genomsnitt av klass Gaming (442 - 895, n=109, senaste 2 åren) | |
| Lenovo Legion 5 15IAH7H 82RB | |
| Asus TUF Gaming F15 FX507ZM | |
| Schenker XMG Core 15 (M22) | |
| Genomsnitt AMD Ryzen 7 6800H (580 - 605, n=9) | |
| Schenker XMG Fusion 15 (Mid 22) | |
| Alienware m15 R5 Ryzen Edition | |
| Schenker XMG Core 15 Ampere | |
| Cinebench R15 / CPU Multi 64Bit | |
| Genomsnitt av klass Gaming (1578 - 6271, n=108, senaste 2 åren) | |
| Lenovo Legion 5 15IAH7H 82RB | |
| Asus TUF Gaming F15 FX507ZM | |
| Schenker XMG Core 15 (M22) | |
| Genomsnitt AMD Ryzen 7 6800H (1585 - 2366, n=10) | |
| Alienware m15 R5 Ryzen Edition | |
| Schenker XMG Core 15 Ampere | |
| Schenker XMG Fusion 15 (Mid 22) | |
| Cinebench R15 / CPU Single 64Bit | |
| Genomsnitt av klass Gaming (188.8 - 343, n=109, senaste 2 åren) | |
| Lenovo Legion 5 15IAH7H 82RB | |
| Asus TUF Gaming F15 FX507ZM | |
| Schenker XMG Core 15 (M22) | |
| Genomsnitt AMD Ryzen 7 6800H (182.7 - 250, n=10) | |
| Alienware m15 R5 Ryzen Edition | |
| Schenker XMG Fusion 15 (Mid 22) | |
| Schenker XMG Core 15 Ampere | |
| Blender / v2.79 BMW27 CPU | |
| Schenker XMG Fusion 15 (Mid 22) | |
| Alienware m15 R5 Ryzen Edition | |
| Schenker XMG Core 15 Ampere | |
| Genomsnitt AMD Ryzen 7 6800H (213 - 268, n=8) | |
| Schenker XMG Core 15 (M22) | |
| Asus TUF Gaming F15 FX507ZM | |
| Lenovo Legion 5 15IAH7H 82RB | |
| Genomsnitt av klass Gaming (80 - 330, n=107, senaste 2 åren) | |
| 7-Zip 18.03 / 7z b 4 | |
| Genomsnitt av klass Gaming (33491 - 148086, n=108, senaste 2 åren) | |
| Lenovo Legion 5 15IAH7H 82RB | |
| Asus TUF Gaming F15 FX507ZM | |
| Schenker XMG Core 15 (M22) | |
| Genomsnitt AMD Ryzen 7 6800H (55067 - 64817, n=8) | |
| Alienware m15 R5 Ryzen Edition | |
| Schenker XMG Core 15 Ampere | |
| Schenker XMG Fusion 15 (Mid 22) | |
| 7-Zip 18.03 / 7z b 4 -mmt1 | |
| Genomsnitt av klass Gaming (4199 - 7436, n=108, senaste 2 åren) | |
| Lenovo Legion 5 15IAH7H 82RB | |
| Schenker XMG Core 15 (M22) | |
| Genomsnitt AMD Ryzen 7 6800H (5521 - 5803, n=8) | |
| Alienware m15 R5 Ryzen Edition | |
| Schenker XMG Fusion 15 (Mid 22) | |
| Asus TUF Gaming F15 FX507ZM | |
| Schenker XMG Core 15 Ampere | |
| Geekbench 5.5 / Multi-Core | |
| Genomsnitt av klass Gaming (6460 - 27010, n=108, senaste 2 åren) | |
| Lenovo Legion 5 15IAH7H 82RB | |
| Asus TUF Gaming F15 FX507ZM | |
| Schenker XMG Core 15 (M22) | |
| Genomsnitt AMD Ryzen 7 6800H (8898 - 10355, n=10) | |
| Schenker XMG Fusion 15 (Mid 22) | |
| Schenker XMG Core 15 Ampere | |
| Alienware m15 R5 Ryzen Edition | |
| Geekbench 5.5 / Single-Core | |
| Genomsnitt av klass Gaming (986 - 2474, n=108, senaste 2 åren) | |
| Lenovo Legion 5 15IAH7H 82RB | |
| Asus TUF Gaming F15 FX507ZM | |
| Schenker XMG Fusion 15 (Mid 22) | |
| Schenker XMG Core 15 (M22) | |
| Genomsnitt AMD Ryzen 7 6800H (1518 - 1568, n=10) | |
| Alienware m15 R5 Ryzen Edition | |
| Schenker XMG Core 15 Ampere | |
| HWBOT x265 Benchmark v2.2 / 4k Preset | |
| Genomsnitt av klass Gaming (11.5 - 44.3, n=108, senaste 2 åren) | |
| Lenovo Legion 5 15IAH7H 82RB | |
| Asus TUF Gaming F15 FX507ZM | |
| Schenker XMG Core 15 (M22) | |
| Genomsnitt AMD Ryzen 7 6800H (14.9 - 18.5, n=9) | |
| Alienware m15 R5 Ryzen Edition | |
| Schenker XMG Core 15 Ampere | |
| Schenker XMG Fusion 15 (Mid 22) | |
| LibreOffice / 20 Documents To PDF | |
| Schenker XMG Core 15 (M22) | |
| Schenker XMG Core 15 Ampere | |
| Alienware m15 R5 Ryzen Edition | |
| Genomsnitt AMD Ryzen 7 6800H (48.7 - 79.5, n=8) | |
| Asus TUF Gaming F15 FX507ZM | |
| Genomsnitt av klass Gaming (19 - 88.8, n=108, senaste 2 åren) | |
| Schenker XMG Fusion 15 (Mid 22) | |
| Lenovo Legion 5 15IAH7H 82RB | |
| R Benchmark 2.5 / Overall mean | |
| Schenker XMG Core 15 Ampere | |
| Schenker XMG Fusion 15 (Mid 22) | |
| Alienware m15 R5 Ryzen Edition | |
| Genomsnitt AMD Ryzen 7 6800H (0.4783 - 0.515, n=8) | |
| Schenker XMG Core 15 (M22) | |
| Asus TUF Gaming F15 FX507ZM | |
| Lenovo Legion 5 15IAH7H 82RB | |
| Genomsnitt av klass Gaming (0.3439 - 0.759, n=109, senaste 2 åren) | |
* ... mindre är bättre
AIDA64: FP32 Ray-Trace | FPU Julia | CPU SHA3 | CPU Queen | FPU SinJulia | FPU Mandel | CPU AES | CPU ZLib | FP64 Ray-Trace | CPU PhotoWorxx
| Performance rating | |
| Genomsnitt av klass Gaming | |
| Lenovo Legion 5 15IAH7H 82RB | |
| Schenker XMG Core 15 (M22) | |
| Genomsnitt AMD Ryzen 7 6800H | |
| Alienware m15 R5 Ryzen Edition | |
| Schenker XMG Core 15 Ampere | |
| Schenker XMG Fusion 15 (Mid 22) | |
| Asus TUF Gaming F15 FX507ZM | |
| AIDA64 / FP32 Ray-Trace | |
| Genomsnitt av klass Gaming (10227 - 85542, n=107, senaste 2 åren) | |
| Lenovo Legion 5 15IAH7H 82RB | |
| Schenker XMG Core 15 (M22) | |
| Genomsnitt AMD Ryzen 7 6800H (12876 - 17031, n=8) | |
| Schenker XMG Core 15 Ampere | |
| Alienware m15 R5 Ryzen Edition | |
| Schenker XMG Fusion 15 (Mid 22) | |
| Asus TUF Gaming F15 FX507ZM | |
| AIDA64 / FPU Julia | |
| Genomsnitt av klass Gaming (51376 - 238426, n=107, senaste 2 åren) | |
| Schenker XMG Core 15 (M22) | |
| Genomsnitt AMD Ryzen 7 6800H (82673 - 105987, n=8) | |
| Alienware m15 R5 Ryzen Edition | |
| Lenovo Legion 5 15IAH7H 82RB | |
| Schenker XMG Core 15 Ampere | |
| Schenker XMG Fusion 15 (Mid 22) | |
| Asus TUF Gaming F15 FX507ZM | |
| AIDA64 / CPU SHA3 | |
| Genomsnitt av klass Gaming (2180 - 9817, n=107, senaste 2 åren) | |
| Lenovo Legion 5 15IAH7H 82RB | |
| Schenker XMG Fusion 15 (Mid 22) | |
| Schenker XMG Core 15 (M22) | |
| Asus TUF Gaming F15 FX507ZM | |
| Genomsnitt AMD Ryzen 7 6800H (2886 - 3634, n=8) | |
| Alienware m15 R5 Ryzen Edition | |
| Schenker XMG Core 15 Ampere | |
| AIDA64 / CPU Queen | |
| Genomsnitt av klass Gaming (49785 - 173351, n=95, senaste 2 åren) | |
| Lenovo Legion 5 15IAH7H 82RB | |
| Asus TUF Gaming F15 FX507ZM | |
| Schenker XMG Core 15 Ampere | |
| Genomsnitt AMD Ryzen 7 6800H (75117 - 106322, n=8) | |
| Alienware m15 R5 Ryzen Edition | |
| Schenker XMG Core 15 (M22) | |
| Schenker XMG Fusion 15 (Mid 22) | |
| AIDA64 / FPU SinJulia | |
| Genomsnitt av klass Gaming (4424 - 33636, n=107, senaste 2 åren) | |
| Schenker XMG Core 15 Ampere | |
| Schenker XMG Core 15 (M22) | |
| Genomsnitt AMD Ryzen 7 6800H (11771 - 13120, n=8) | |
| Alienware m15 R5 Ryzen Edition | |
| Lenovo Legion 5 15IAH7H 82RB | |
| Asus TUF Gaming F15 FX507ZM | |
| Schenker XMG Fusion 15 (Mid 22) | |
| AIDA64 / FPU Mandel | |
| Genomsnitt av klass Gaming (25115 - 128721, n=107, senaste 2 åren) | |
| Schenker XMG Core 15 (M22) | |
| Genomsnitt AMD Ryzen 7 6800H (45287 - 58327, n=8) | |
| Alienware m15 R5 Ryzen Edition | |
| Lenovo Legion 5 15IAH7H 82RB | |
| Schenker XMG Core 15 Ampere | |
| Schenker XMG Fusion 15 (Mid 22) | |
| Asus TUF Gaming F15 FX507ZM | |
| AIDA64 / CPU AES | |
| Lenovo Legion 5 15IAH7H 82RB | |
| Schenker XMG Fusion 15 (Mid 22) | |
| Alienware m15 R5 Ryzen Edition | |
| Genomsnitt AMD Ryzen 7 6800H (67816 - 137383, n=8) | |
| Genomsnitt av klass Gaming (39258 - 247074, n=107, senaste 2 åren) | |
| Schenker XMG Core 15 Ampere | |
| Schenker XMG Core 15 (M22) | |
| Asus TUF Gaming F15 FX507ZM | |
| AIDA64 / CPU ZLib | |
| Genomsnitt av klass Gaming (574 - 2531, n=107, senaste 2 åren) | |
| Asus TUF Gaming F15 FX507ZM | |
| Lenovo Legion 5 15IAH7H 82RB | |
| Schenker XMG Core 15 (M22) | |
| Schenker XMG Core 15 Ampere | |
| Genomsnitt AMD Ryzen 7 6800H (732 - 901, n=8) | |
| Alienware m15 R5 Ryzen Edition | |
| Schenker XMG Fusion 15 (Mid 22) | |
| AIDA64 / FP64 Ray-Trace | |
| Genomsnitt av klass Gaming (5509 - 45446, n=107, senaste 2 åren) | |
| Lenovo Legion 5 15IAH7H 82RB | |
| Schenker XMG Core 15 (M22) | |
| Genomsnitt AMD Ryzen 7 6800H (6917 - 8980, n=8) | |
| Schenker XMG Core 15 Ampere | |
| Alienware m15 R5 Ryzen Edition | |
| Schenker XMG Fusion 15 (Mid 22) | |
| Asus TUF Gaming F15 FX507ZM | |
| AIDA64 / CPU PhotoWorxx | |
| Genomsnitt av klass Gaming (12271 - 89891, n=107, senaste 2 åren) | |
| Lenovo Legion 5 15IAH7H 82RB | |
| Asus TUF Gaming F15 FX507ZM | |
| Schenker XMG Core 15 (M22) | |
| Genomsnitt AMD Ryzen 7 6800H (26496 - 30360, n=8) | |
| Schenker XMG Core 15 Ampere | |
| Schenker XMG Fusion 15 (Mid 22) | |
| Alienware m15 R5 Ryzen Edition | |
Systemprestanda
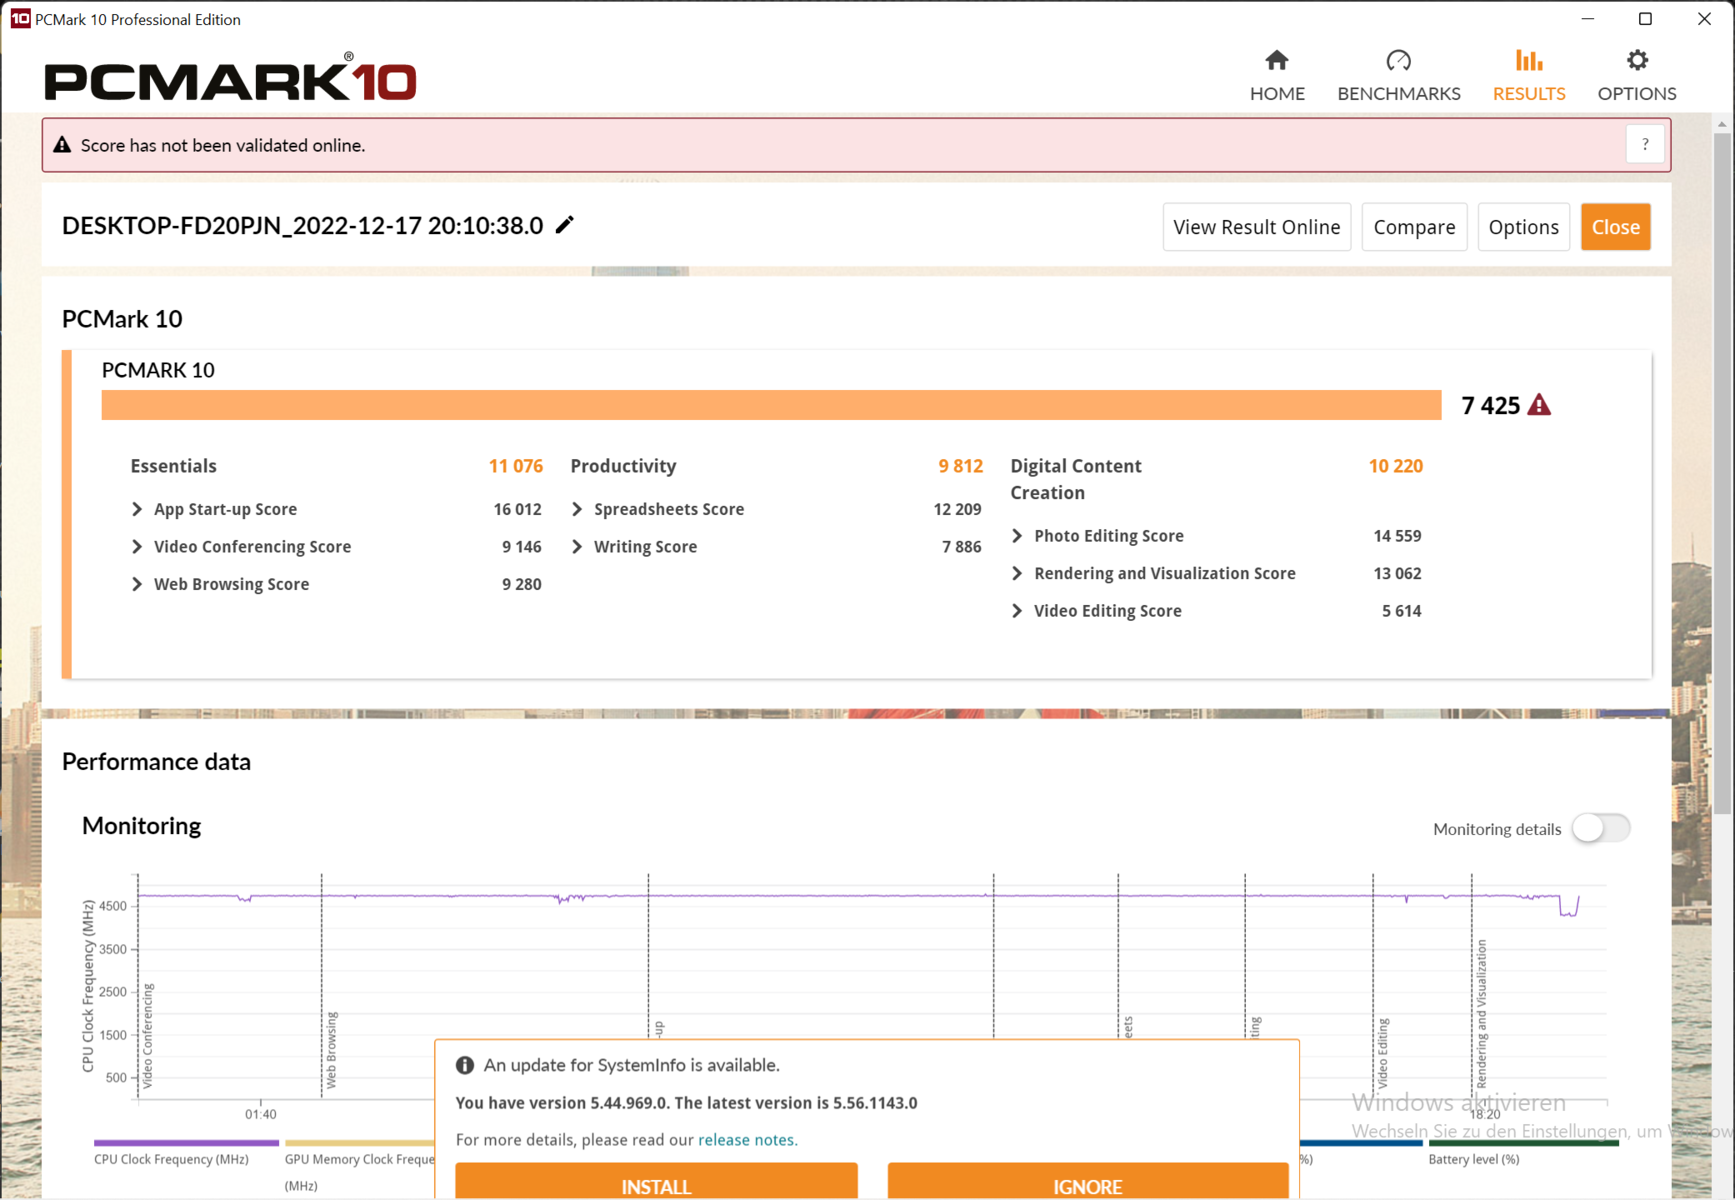
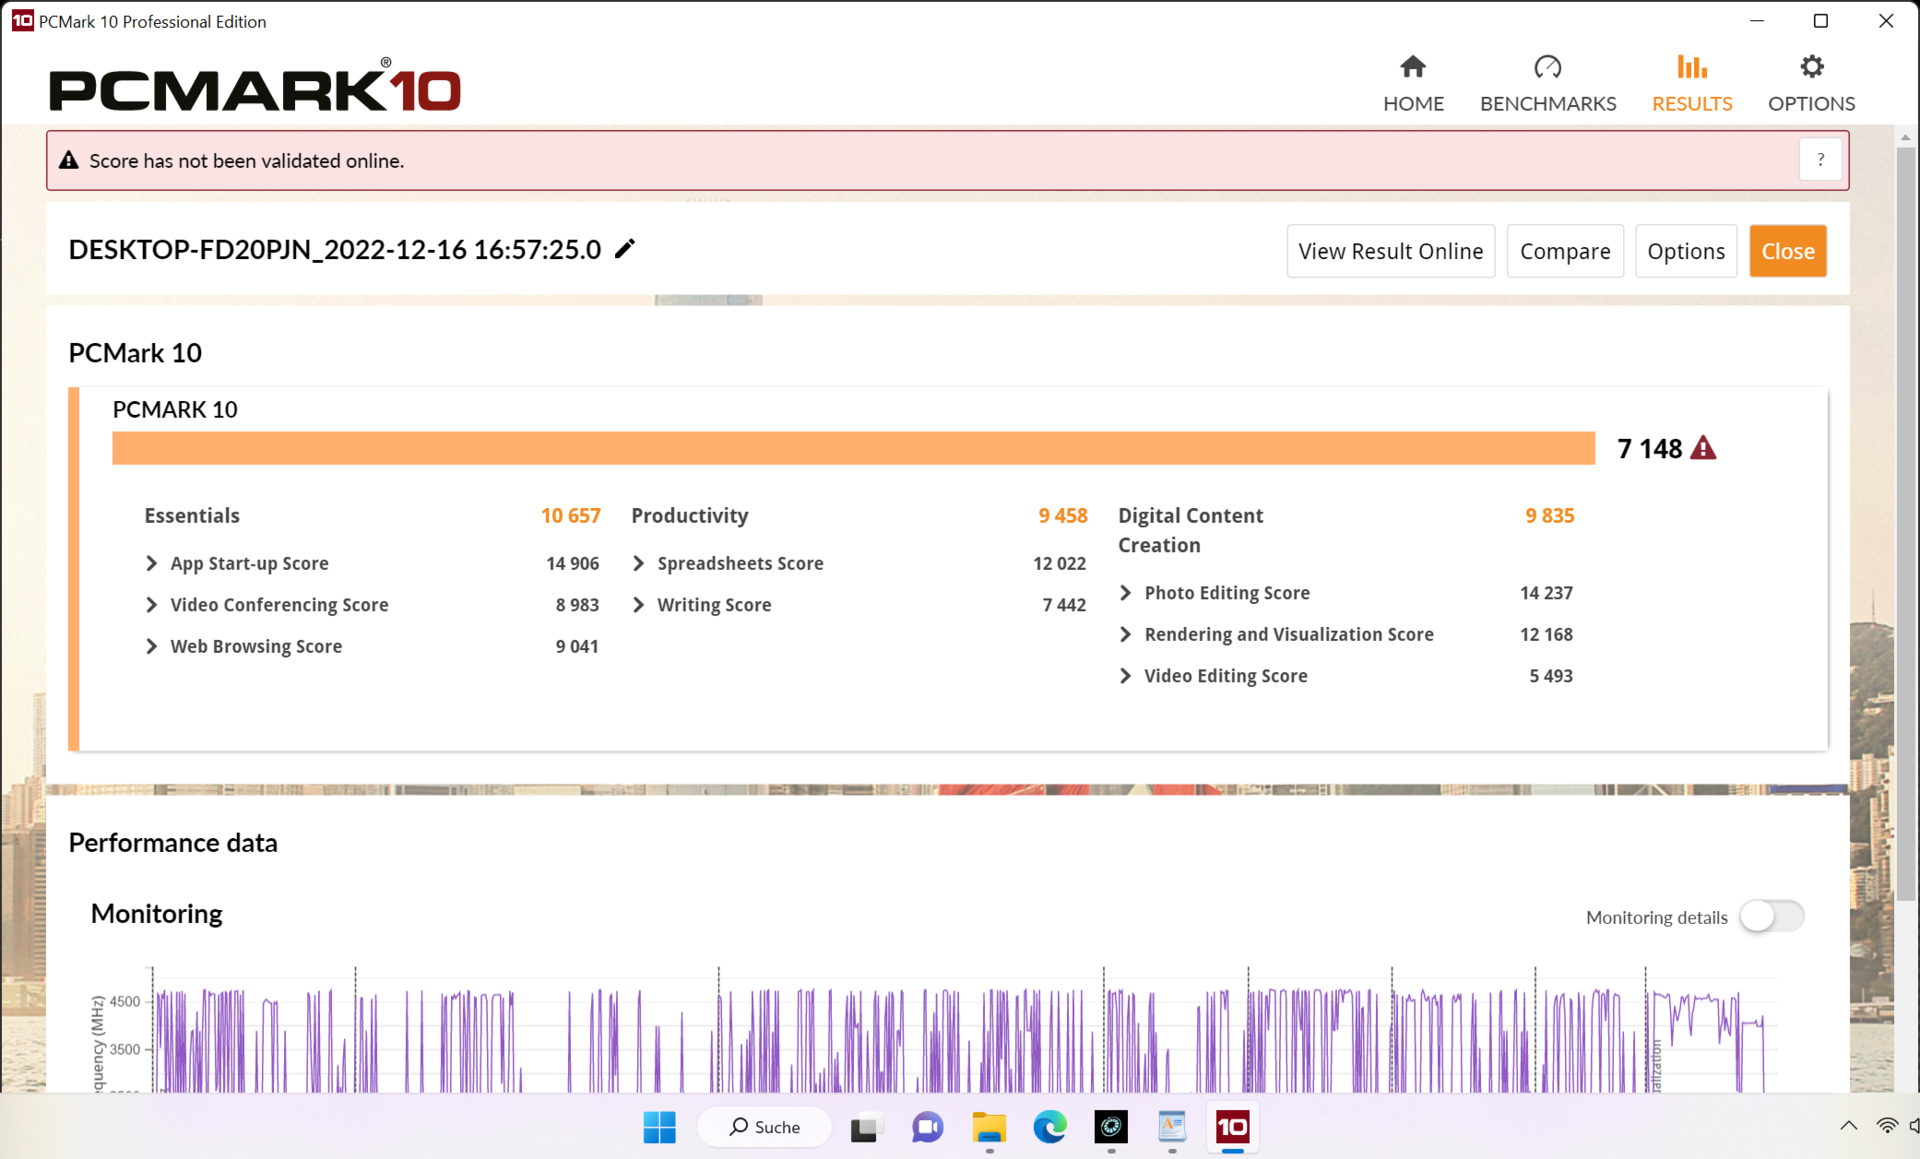
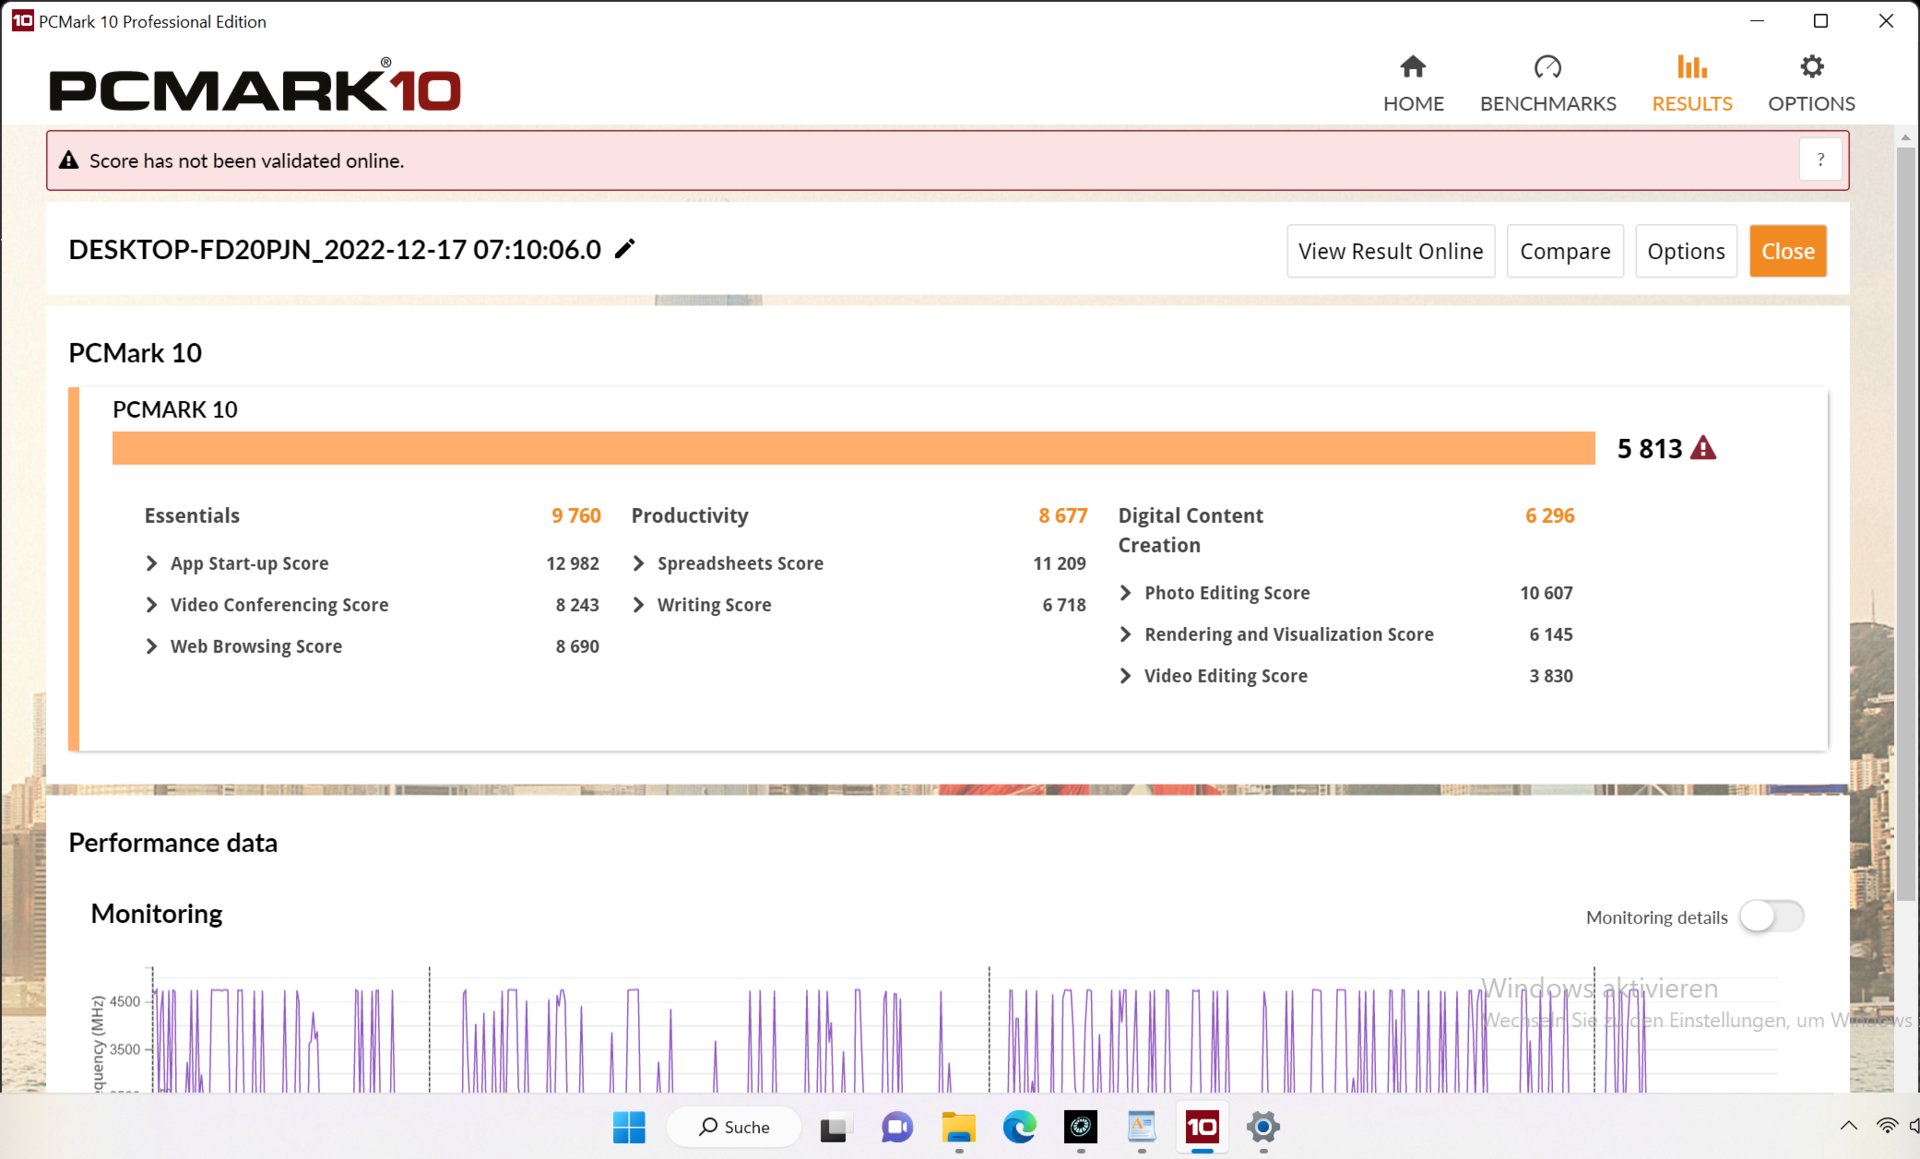
PCMark 10-benchmark visar ett resultat på den förväntade nivån för systemkonfigurationen. Vardagliga uppgifter behandlas snabbt och utan fördröjningar.
Webbsurfandet går lite snabbare på Intel-system på grund av den starkare Turbo och prestandan för enkärniga system - men skillnaden är knappast märkbar i praktiken.

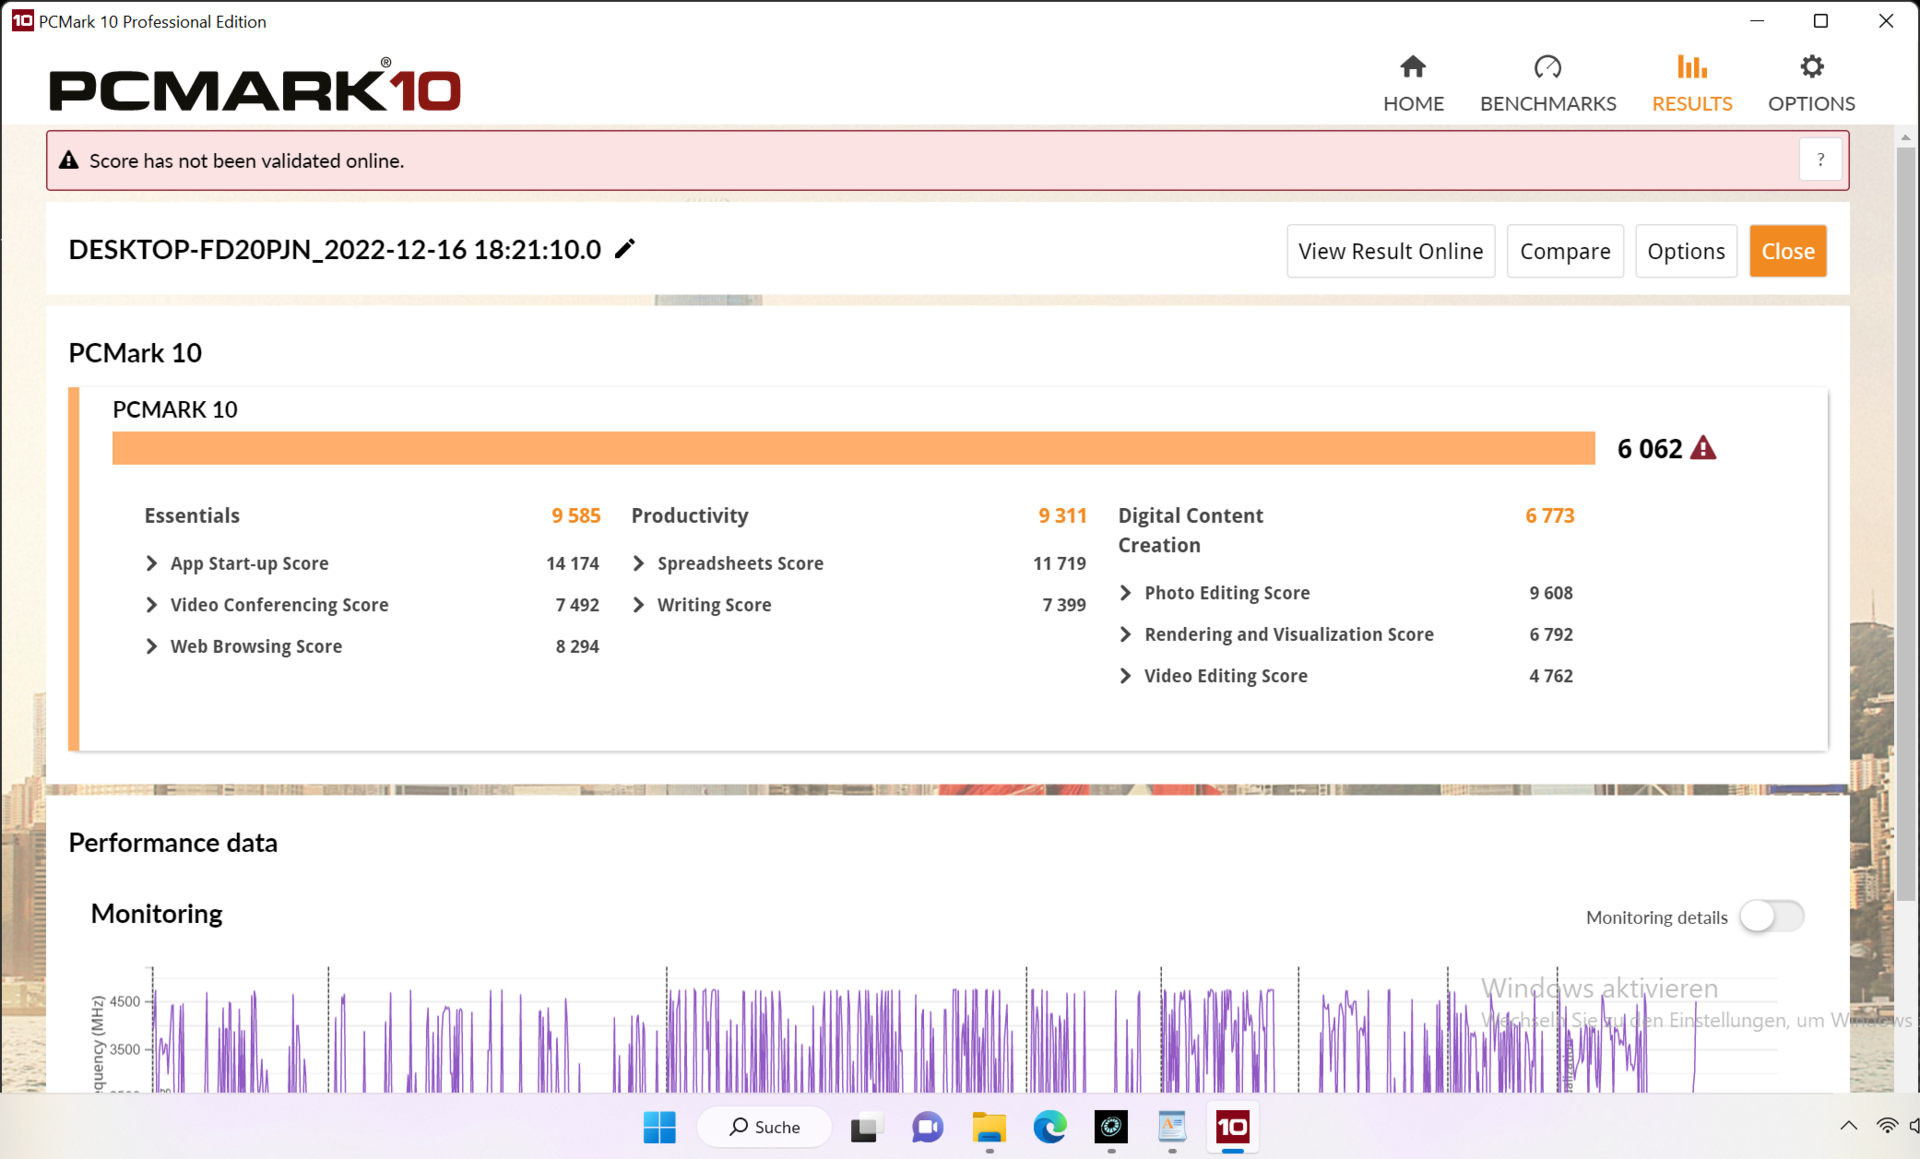
CrossMark: Overall | Productivity | Creativity | Responsiveness
Mozilla Kraken 1.1: Total
Speedometer 2.0: Result 2.0
Octane V2: Total Score
Jetstream 2: 2.0 Total
WebXPRT 3: Overall
WebXPRT 4: Overall
| PCMark 10 / Score | |
| Genomsnitt av klass Gaming (5828 - 11574, n=95, senaste 2 åren) | |
| Lenovo Legion 5 15IAH7H 82RB | |
| Asus TUF Gaming F15 FX507ZM | |
| Schenker XMG Core 15 (M22) | |
| Genomsnitt AMD Ryzen 7 6800H, NVIDIA GeForce RTX 3060 Laptop GPU (n=1) | |
| Alienware m15 R5 Ryzen Edition | |
| Schenker XMG Fusion 15 (Mid 22) | |
| Schenker XMG Core 15 Ampere | |
| PCMark 10 / Essentials | |
| Lenovo Legion 5 15IAH7H 82RB | |
| Schenker XMG Core 15 (M22) | |
| Genomsnitt AMD Ryzen 7 6800H, NVIDIA GeForce RTX 3060 Laptop GPU (n=1) | |
| Genomsnitt av klass Gaming (8810 - 12600, n=99, senaste 2 åren) | |
| Asus TUF Gaming F15 FX507ZM | |
| Alienware m15 R5 Ryzen Edition | |
| Schenker XMG Fusion 15 (Mid 22) | |
| Schenker XMG Core 15 Ampere | |
| PCMark 10 / Productivity | |
| Genomsnitt av klass Gaming (6845 - 21327, n=97, senaste 2 åren) | |
| Lenovo Legion 5 15IAH7H 82RB | |
| Schenker XMG Core 15 (M22) | |
| Genomsnitt AMD Ryzen 7 6800H, NVIDIA GeForce RTX 3060 Laptop GPU (n=1) | |
| Asus TUF Gaming F15 FX507ZM | |
| Alienware m15 R5 Ryzen Edition | |
| Schenker XMG Fusion 15 (Mid 22) | |
| Schenker XMG Core 15 Ampere | |
| PCMark 10 / Digital Content Creation | |
| Genomsnitt av klass Gaming (7602 - 19657, n=97, senaste 2 åren) | |
| Lenovo Legion 5 15IAH7H 82RB | |
| Asus TUF Gaming F15 FX507ZM | |
| Schenker XMG Core 15 (M22) | |
| Genomsnitt AMD Ryzen 7 6800H, NVIDIA GeForce RTX 3060 Laptop GPU (n=1) | |
| Alienware m15 R5 Ryzen Edition | |
| Schenker XMG Core 15 Ampere | |
| Schenker XMG Fusion 15 (Mid 22) | |
| CrossMark / Overall | |
| Lenovo Legion 5 15IAH7H 82RB | |
| Genomsnitt av klass Gaming (1366 - 2409, n=95, senaste 2 åren) | |
| Schenker XMG Fusion 15 (Mid 22) | |
| Schenker XMG Core 15 (M22) | |
| Genomsnitt AMD Ryzen 7 6800H, NVIDIA GeForce RTX 3060 Laptop GPU (n=1) | |
| CrossMark / Productivity | |
| Lenovo Legion 5 15IAH7H 82RB | |
| Genomsnitt av klass Gaming (1386 - 2254, n=95, senaste 2 åren) | |
| Schenker XMG Fusion 15 (Mid 22) | |
| Schenker XMG Core 15 (M22) | |
| Genomsnitt AMD Ryzen 7 6800H, NVIDIA GeForce RTX 3060 Laptop GPU (n=1) | |
| CrossMark / Creativity | |
| Genomsnitt av klass Gaming (1343 - 2729, n=95, senaste 2 åren) | |
| Lenovo Legion 5 15IAH7H 82RB | |
| Schenker XMG Core 15 (M22) | |
| Genomsnitt AMD Ryzen 7 6800H, NVIDIA GeForce RTX 3060 Laptop GPU (n=1) | |
| Schenker XMG Fusion 15 (Mid 22) | |
| CrossMark / Responsiveness | |
| Lenovo Legion 5 15IAH7H 82RB | |
| Genomsnitt av klass Gaming (1226 - 2334, n=95, senaste 2 åren) | |
| Schenker XMG Fusion 15 (Mid 22) | |
| Schenker XMG Core 15 (M22) | |
| Genomsnitt AMD Ryzen 7 6800H, NVIDIA GeForce RTX 3060 Laptop GPU (n=1) | |
| Mozilla Kraken 1.1 / Total | |
| Schenker XMG Core 15 Ampere | |
| Schenker XMG Fusion 15 (Mid 22) | |
| Alienware m15 R5 Ryzen Edition | |
| Schenker XMG Core 15 (M22) | |
| Genomsnitt AMD Ryzen 7 6800H, NVIDIA GeForce RTX 3060 Laptop GPU (n=1) | |
| Asus TUF Gaming F15 FX507ZM | |
| Lenovo Legion 5 15IAH7H 82RB | |
| Genomsnitt av klass Gaming (391 - 590, n=105, senaste 2 åren) | |
| Speedometer 2.0 / Result 2.0 | |
| Genomsnitt av klass Gaming (29 - 686, n=27, senaste 2 åren) | |
| Schenker XMG Core 15 (M22) | |
| Genomsnitt AMD Ryzen 7 6800H, NVIDIA GeForce RTX 3060 Laptop GPU (n=1) | |
| Alienware m15 R5 Ryzen Edition | |
| Octane V2 / Total Score | |
| Genomsnitt av klass Gaming (93292 - 139447, n=27, senaste 2 åren) | |
| Schenker XMG Core 15 (M22) | |
| Genomsnitt AMD Ryzen 7 6800H, NVIDIA GeForce RTX 3060 Laptop GPU (n=1) | |
| Alienware m15 R5 Ryzen Edition | |
| Jetstream 2 / 2.0 Total | |
| Genomsnitt av klass Gaming (306 - 516, n=28, senaste 2 åren) | |
| Lenovo Legion 5 15IAH7H 82RB | |
| Asus TUF Gaming F15 FX507ZM | |
| Schenker XMG Core 15 (M22) | |
| Genomsnitt AMD Ryzen 7 6800H, NVIDIA GeForce RTX 3060 Laptop GPU (n=1) | |
| Alienware m15 R5 Ryzen Edition | |
| WebXPRT 3 / Overall | |
| Lenovo Legion 5 15IAH7H 82RB | |
| Genomsnitt av klass Gaming (220 - 532, n=100, senaste 2 åren) | |
| Asus TUF Gaming F15 FX507ZM | |
| Schenker XMG Core 15 (M22) | |
| Genomsnitt AMD Ryzen 7 6800H, NVIDIA GeForce RTX 3060 Laptop GPU (n=1) | |
| Alienware m15 R5 Ryzen Edition | |
| Schenker XMG Fusion 15 (Mid 22) | |
| Schenker XMG Core 15 Ampere | |
| WebXPRT 4 / Overall | |
| Genomsnitt av klass Gaming (165 - 354, n=101, senaste 2 åren) | |
| Lenovo Legion 5 15IAH7H 82RB | |
| Schenker XMG Core 15 (M22) | |
| Genomsnitt AMD Ryzen 7 6800H, NVIDIA GeForce RTX 3060 Laptop GPU (n=1) | |
| Schenker XMG Fusion 15 (Mid 22) | |
* ... mindre är bättre
| PCMark 10 Score | 7250 poäng | |
Hjälp | ||
| AIDA64 / Memory Copy | |
| Genomsnitt av klass Gaming (21750 - 129946, n=107, senaste 2 åren) | |
| Asus TUF Gaming F15 FX507ZM | |
| Lenovo Legion 5 15IAH7H 82RB | |
| Schenker XMG Core 15 (M22) | |
| Genomsnitt AMD Ryzen 7 6800H (48209 - 51186, n=8) | |
| Schenker XMG Fusion 15 (Mid 22) | |
| Schenker XMG Core 15 Ampere | |
| Alienware m15 R5 Ryzen Edition | |
| AIDA64 / Memory Read | |
| Genomsnitt av klass Gaming (22956 - 118858, n=107, senaste 2 åren) | |
| Lenovo Legion 5 15IAH7H 82RB | |
| Asus TUF Gaming F15 FX507ZM | |
| Schenker XMG Core 15 (M22) | |
| Genomsnitt AMD Ryzen 7 6800H (43828 - 51778, n=8) | |
| Schenker XMG Fusion 15 (Mid 22) | |
| Schenker XMG Core 15 Ampere | |
| Alienware m15 R5 Ryzen Edition | |
| AIDA64 / Memory Write | |
| Genomsnitt av klass Gaming (22297 - 135096, n=107, senaste 2 åren) | |
| Lenovo Legion 5 15IAH7H 82RB | |
| Asus TUF Gaming F15 FX507ZM | |
| Schenker XMG Core 15 (M22) | |
| Genomsnitt AMD Ryzen 7 6800H (51116 - 55307, n=8) | |
| Schenker XMG Fusion 15 (Mid 22) | |
| Schenker XMG Core 15 Ampere | |
| Alienware m15 R5 Ryzen Edition | |
| AIDA64 / Memory Latency | |
| Genomsnitt av klass Gaming (75.3 - 259, n=107, senaste 2 åren) | |
| Lenovo Legion 5 15IAH7H 82RB | |
| Schenker XMG Fusion 15 (Mid 22) | |
| Genomsnitt AMD Ryzen 7 6800H (83.1 - 104.1, n=8) | |
| Schenker XMG Core 15 (M22) | |
| Schenker XMG Core 15 Ampere | |
| Alienware m15 R5 Ryzen Edition | |
| Asus TUF Gaming F15 FX507ZM | |
* ... mindre är bättre
DPC-fördröjningar
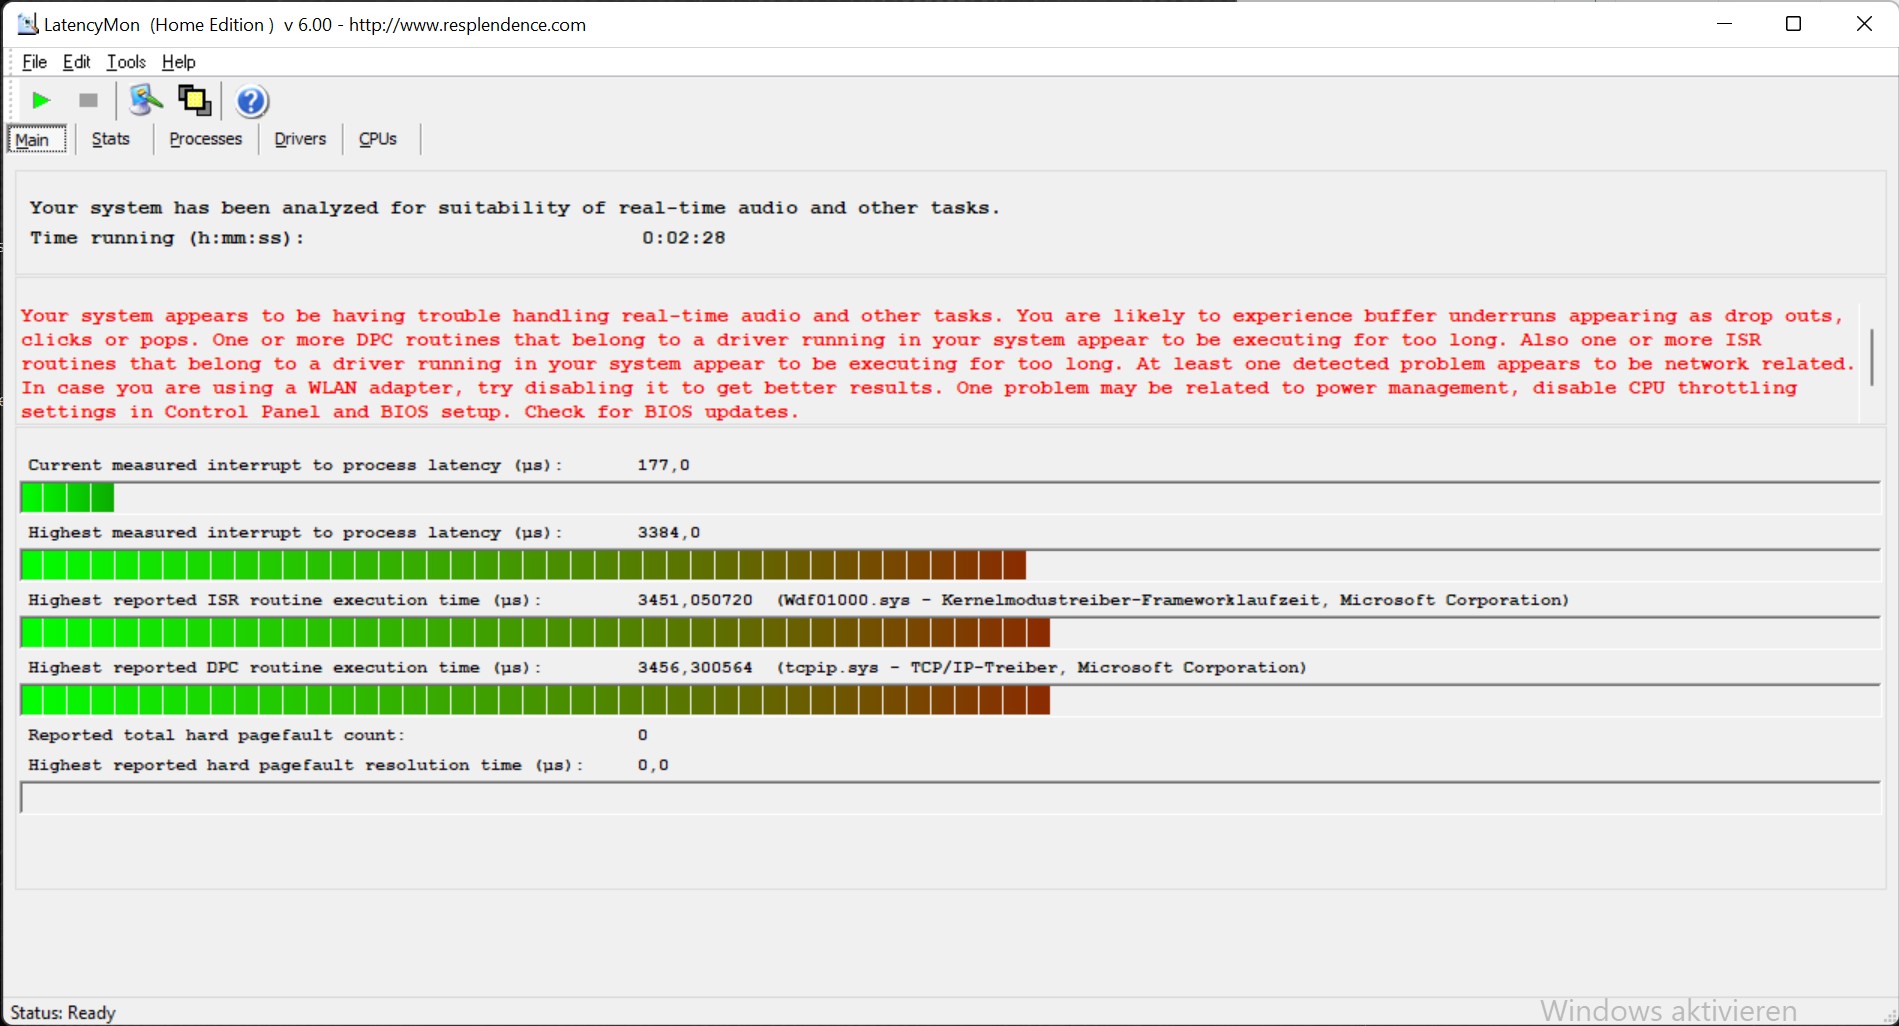
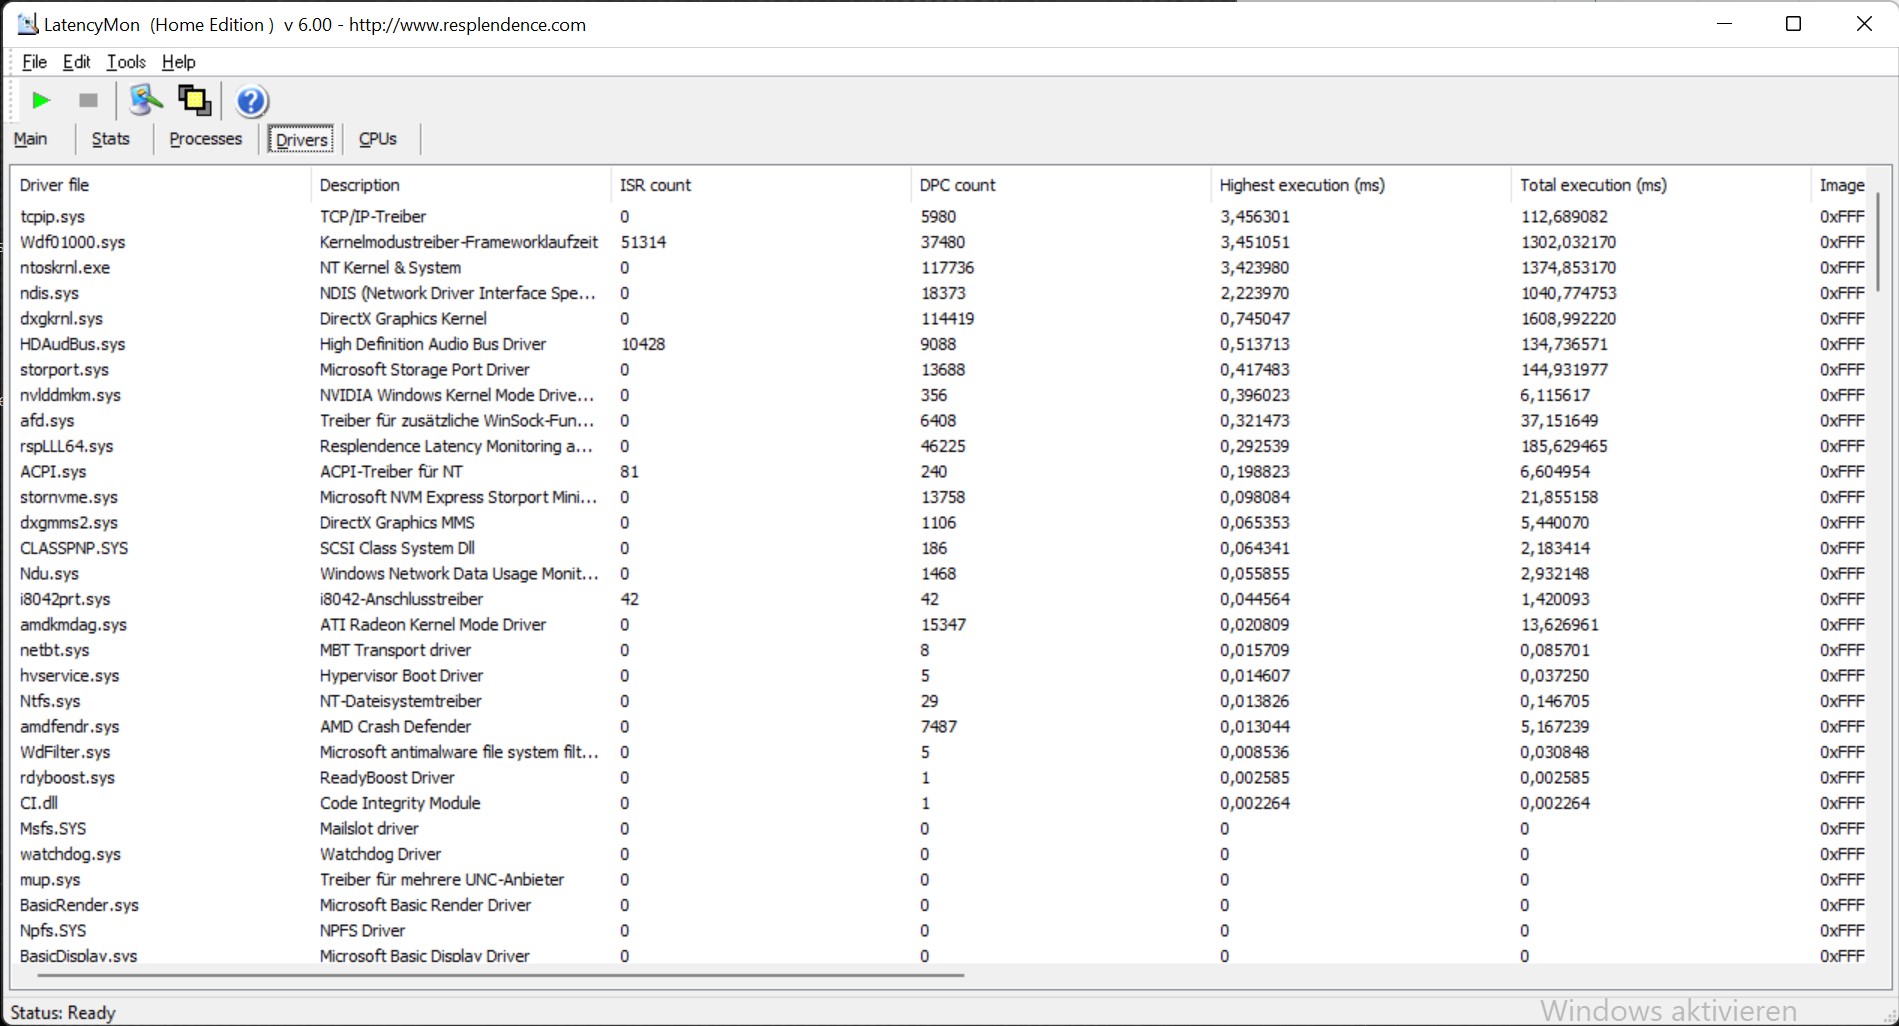
| DPC Latencies / LatencyMon - interrupt to process latency (max), Web, Youtube, Prime95 | |
| Schenker XMG Core 15 (M22) | |
| Schenker XMG Fusion 15 (Mid 22) | |
| Lenovo Legion 5 15IAH7H 82RB | |
| Asus TUF Gaming F15 FX507ZM | |
| Schenker XMG Core 15 Ampere | |
| Alienware m15 R5 Ryzen Edition | |
* ... mindre är bättre
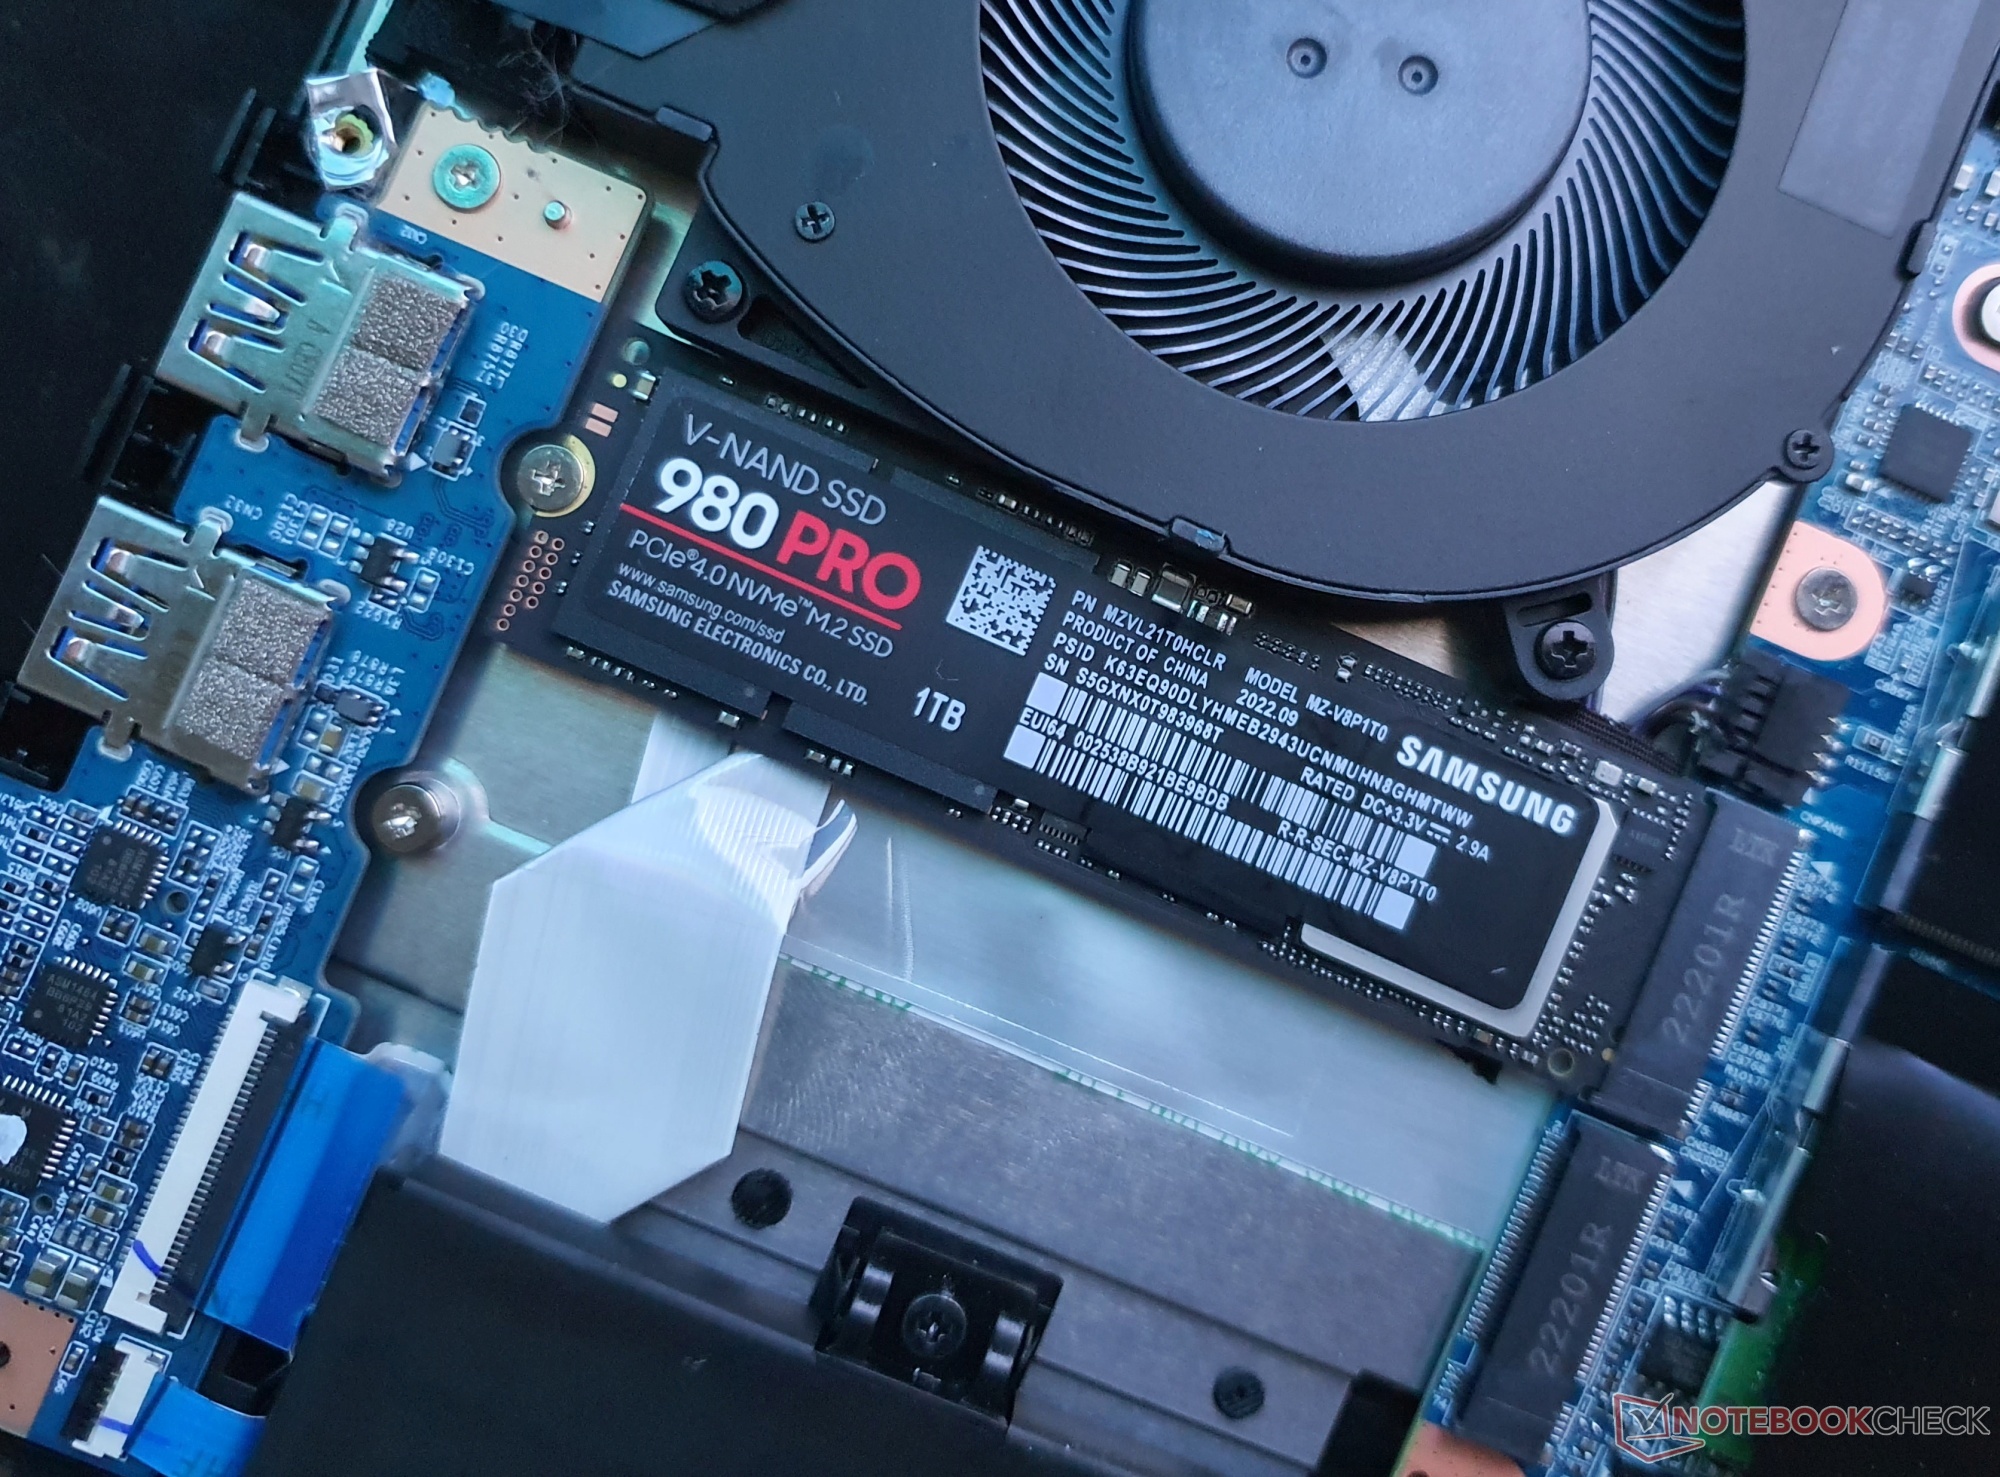
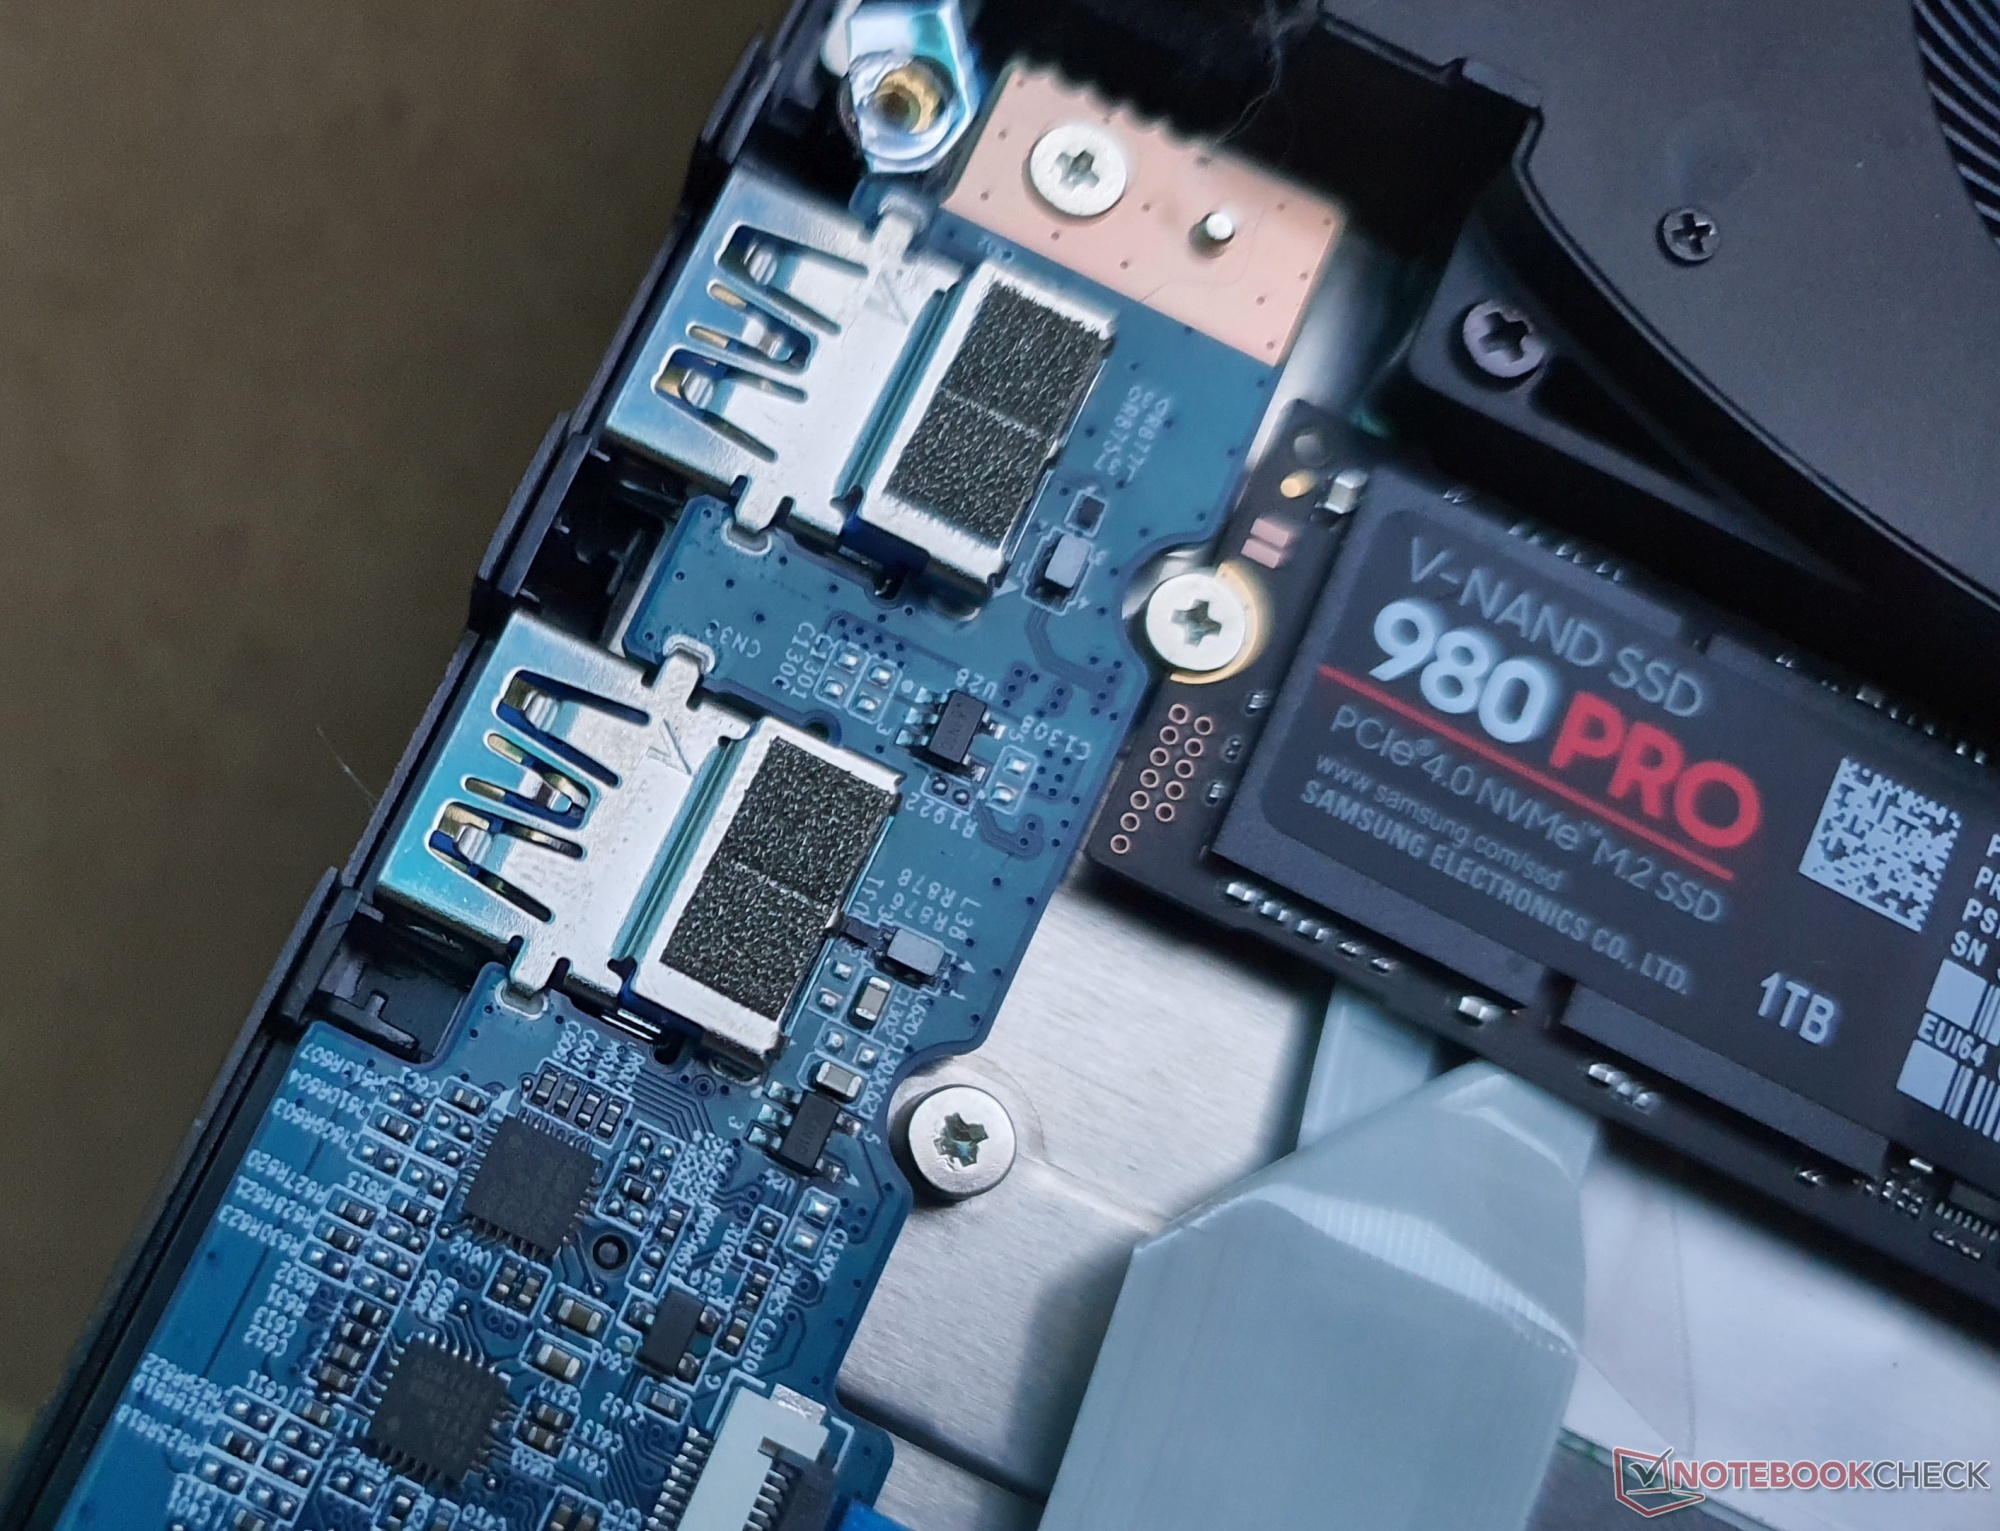
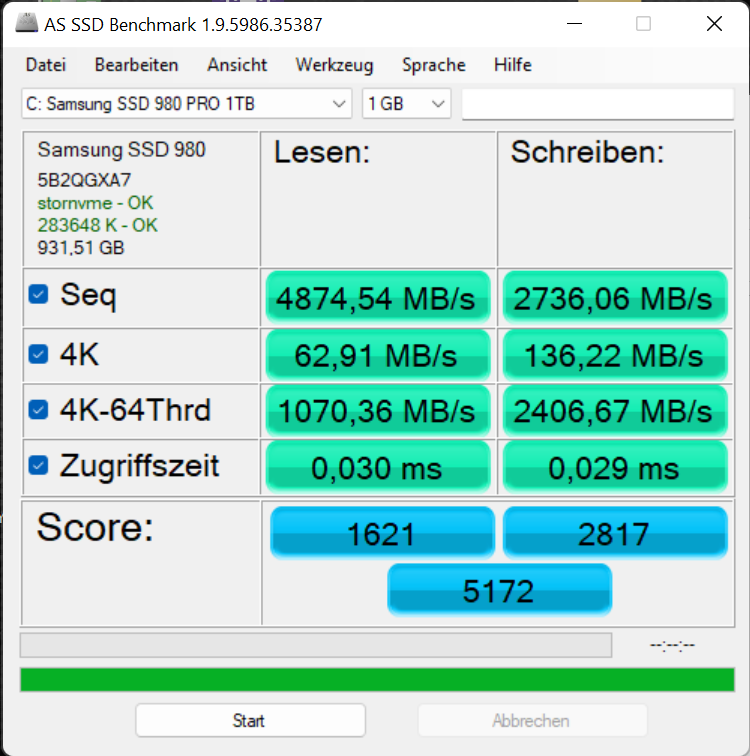
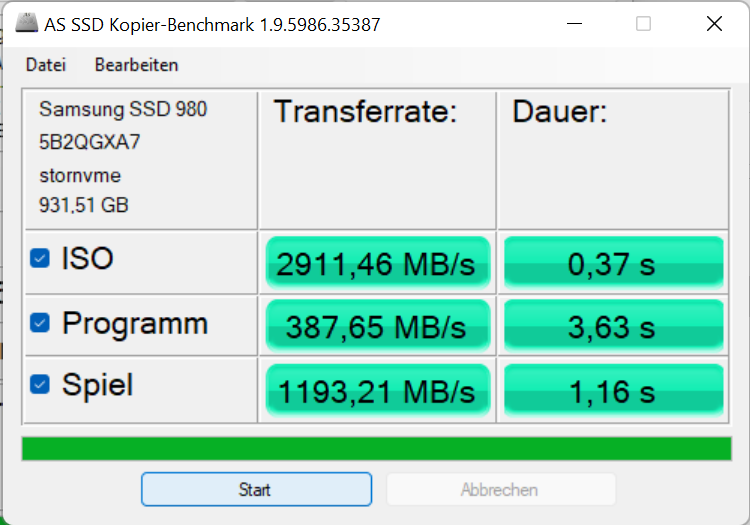
Masslagring

Den installerade Samsung 980 Pro 1 TB når PCIe 4.0-hastigheter även vid permanent belastning, men har svårt att klara 32-64 samtidiga 4K-läs- och skrivprocesser i den bärbara XMG-datorn, vilket främst är relevant för servrar. Samma SSD är snabbare i XMG Fusion 15, så dess potential utnyttjas inte fullt ut av Core 15.
| Schenker XMG Core 15 (M22) Samsung SSD 980 Pro 1TB MZ-V8P1T0BW | Lenovo Legion 5 15IAH7H 82RB | Schenker XMG Fusion 15 (Mid 22) Samsung SSD 980 Pro 1TB MZ-V8P1T0BW | Asus TUF Gaming F15 FX507ZM SK Hynix HFM001TD3JX013N | Alienware m15 R5 Ryzen Edition Toshiba KBG40ZNS512G NVMe | Schenker XMG Core 15 Ampere Samsung SSD 970 EVO Plus 1TB | |
|---|---|---|---|---|---|---|
| AS SSD | 37% | 21% | 7% | -78% | 5% | |
| Seq Read (MB/s) | 4874 | 5844.9 20% | 5171.96 6% | 3013 -38% | 2082 -57% | 2829 -42% |
| Seq Write (MB/s) | 2711 | 2038.42 -25% | 3881.37 43% | 2768 2% | 825 -70% | 2646 -2% |
| 4K Read (MB/s) | 63 | 71.99 14% | 66.29 5% | 66.9 6% | 42.41 -33% | 54.8 -13% |
| 4K Write (MB/s) | 136 | 310.54 128% | 189.98 40% | 184.8 36% | 98.3 -28% | 179.1 32% |
| 4K-64 Read (MB/s) | 1070 | 2771.98 159% | 2539.3 137% | 1923 80% | 1255 17% | 1734 62% |
| 4K-64 Write (MB/s) | 2407 | 4007.67 67% | 3144.88 31% | 2198 -9% | 738 -69% | 2396 0% |
| Access Time Read * (ms) | 0.03 | 0.037 -23% | 0.07 -133% | 0.03 -0% | 0.109 -263% | 0.033 -10% |
| Access Time Write * (ms) | 0.029 | 0.053 -83% | 0.022 24% | 0.081 -179% | 0.17 -486% | 0.021 28% |
| Score Read (Points) | 1621 | 3428 111% | 3123 93% | 2291 41% | 1506 -7% | 2072 28% |
| Score Write (Points) | 2814 | 4522 61% | 3723 32% | 2660 -5% | 918 -67% | 2839 1% |
| Score Total (Points) | 5168 | 9510 84% | 8376 62% | 6117 18% | 3136 -39% | 5965 15% |
| Copy ISO MB/s (MB/s) | 2911 | 2320.82 -20% | 2364.44 -19% | 2143 -26% | 1391 -52% | 2119 -27% |
| Copy Program MB/s (MB/s) | 388 | 429.5 11% | 329.45 -15% | 871 124% | 645 66% | 406.1 5% |
| Copy Game MB/s (MB/s) | 1193 | 1290.19 8% | 1079.59 -10% | 1840 54% | 1101 -8% | 1086 -9% |
| DiskSpd | 135% | 174% | 80% | -24% | 84% | |
| seq read (MB/s) | 3429 | 5217 52% | 4199 22% | 2383 -31% | 1726 -50% | 2367 -31% |
| seq write (MB/s) | 3148 | 4897 56% | 4299 37% | 2894 -8% | 1520 -52% | 2601 -17% |
| seq q8 t1 read (MB/s) | 6850 | 7087 3% | 6847 0% | 3554 -48% | 2314 -66% | 3347 -51% |
| seq q8 t1 write (MB/s) | 4927 | 1498 -70% | 4999 1% | 2869 -42% | 1449 -71% | 3263 -34% |
| 4k q1 t1 read (MB/s) | 61.1 | 74.8 22% | 77.9 27% | 69.4 14% | 48.3 -21% | 52.3 -14% |
| 4k q1 t1 write (MB/s) | 132.2 | 369 179% | 239 81% | 211 60% | 121 -8% | 204 54% |
| 4k q32 t16 read (MB/s) | 1010 | 4443 340% | 4309 327% | 2217 120% | 1301 29% | 1853 83% |
| 4k q32 t16 write (MB/s) | 345 | 2050 494% | 3435 896% | 2314 571% | 497 44% | 2683 678% |
| Totalt genomsnitt (program/inställningar) | 86% /
72% | 98% /
77% | 44% /
34% | -51% /
-59% | 45% /
33% |
* ... mindre är bättre
| Drive Performance rating - Percent | |
| Lenovo Legion 5 15IAH7H 82RB | |
| Schenker XMG Fusion 15 (Mid 22) | |
| Genomsnitt Samsung SSD 980 Pro 1TB MZ-V8P1T0BW | |
| Genomsnitt av klass Gaming | |
| Asus TUF Gaming F15 FX507ZM | |
| Schenker XMG Core 15 (M22) | |
| Schenker XMG Core 15 Ampere | |
| Alienware m15 R5 Ryzen Edition | |
* ... mindre är bättre
Continuous: DiskSpd Read Loop, Queue Depth 8
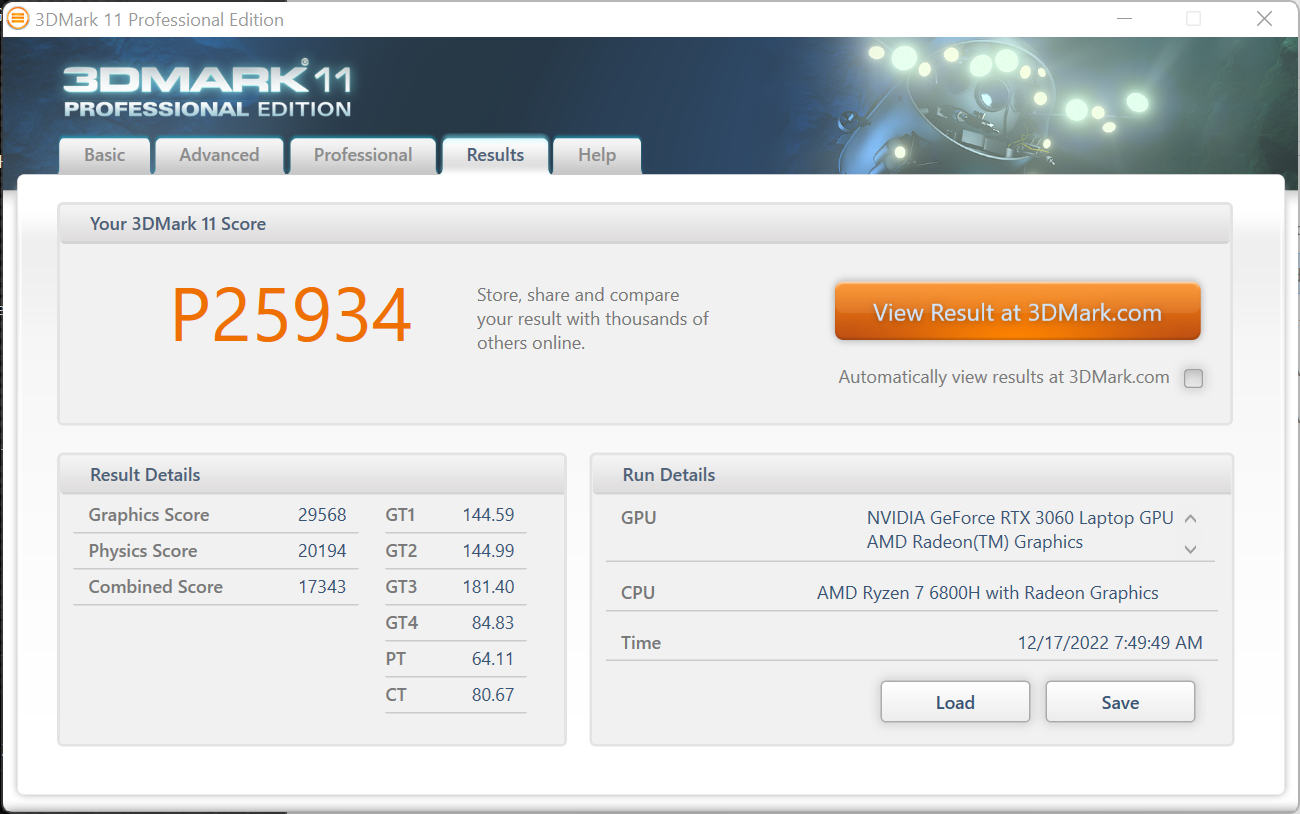
Grafikkort
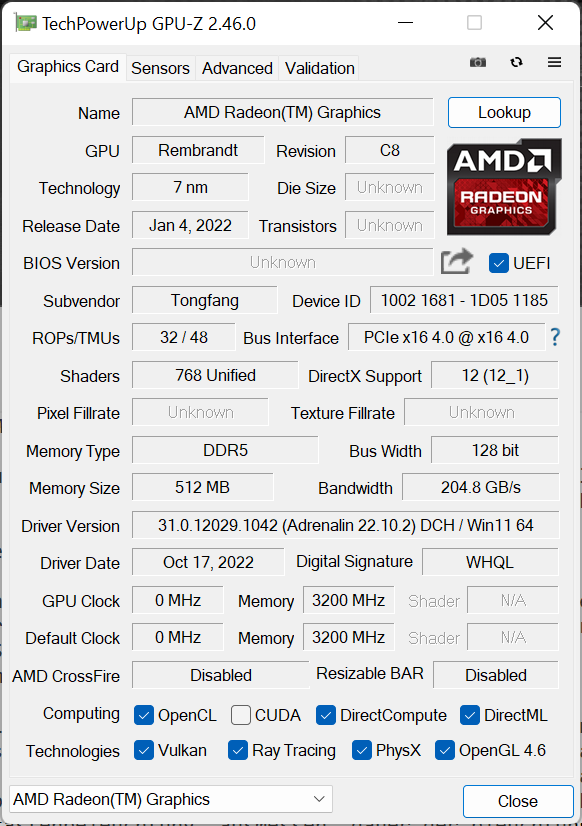
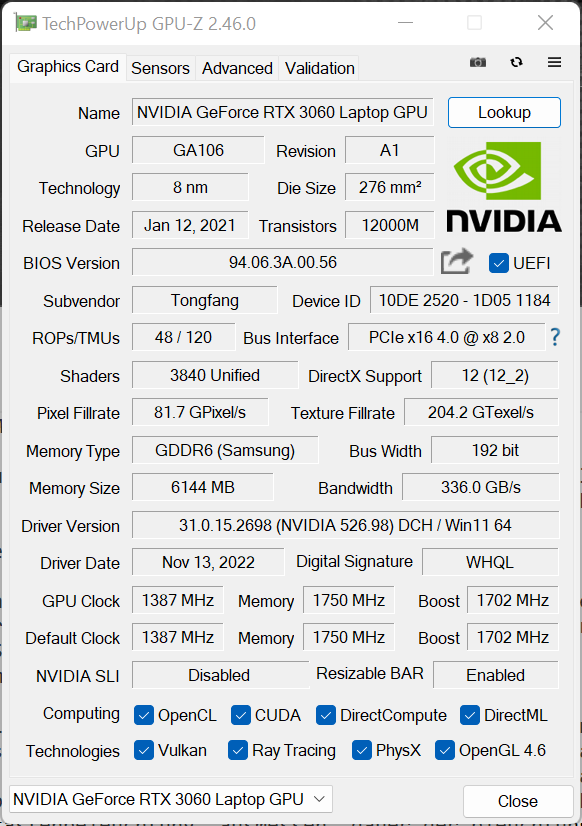
Förutom en integrerad Radeon 680M har den bärbara speldatorn naturligtvis en dedikerad grafikenhet - i XMG Core 15:s fall en GeForce RTX 3060 med 140-W TGP.
Många nyare spel kan återges smidigt i den ursprungliga WQHD-upplösningen, men mycket prestandakrävande spel måste förmodligen avnjutas i FullHD eller på lägre detaljnivå.
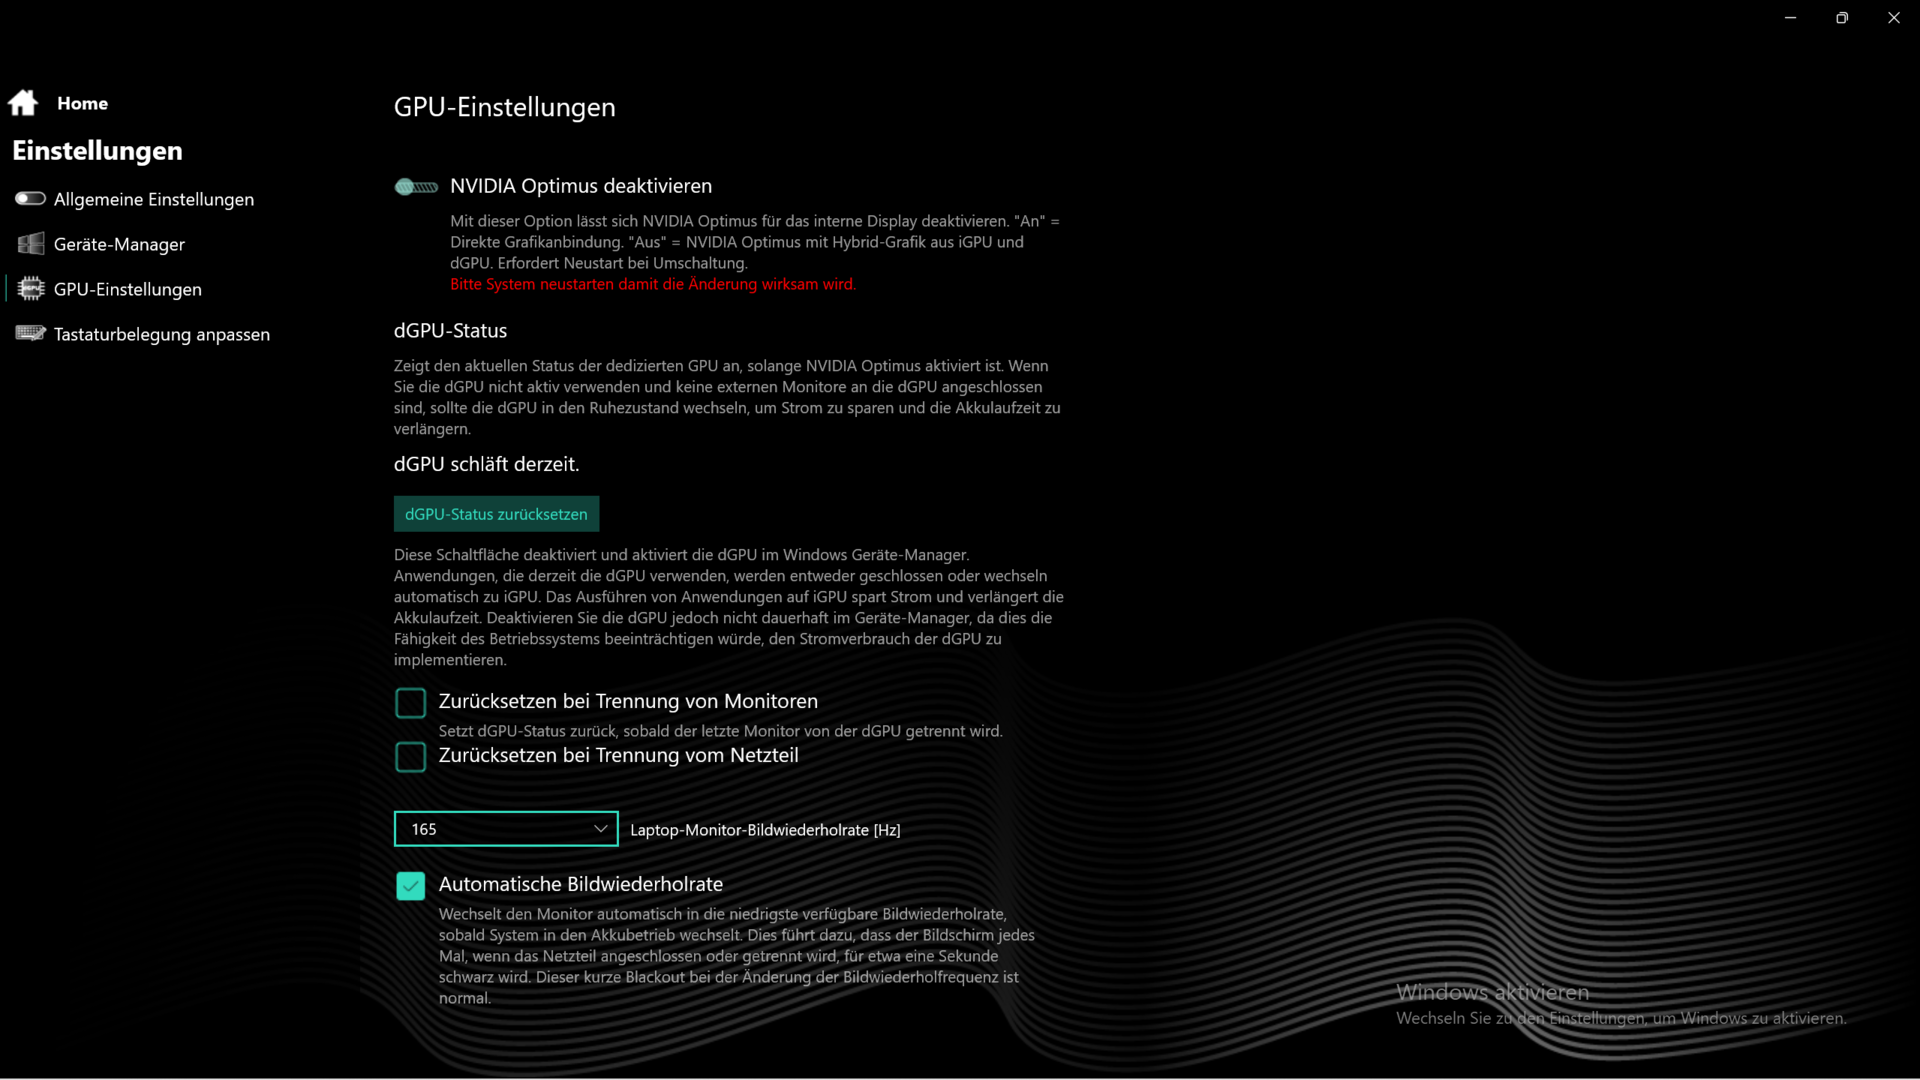
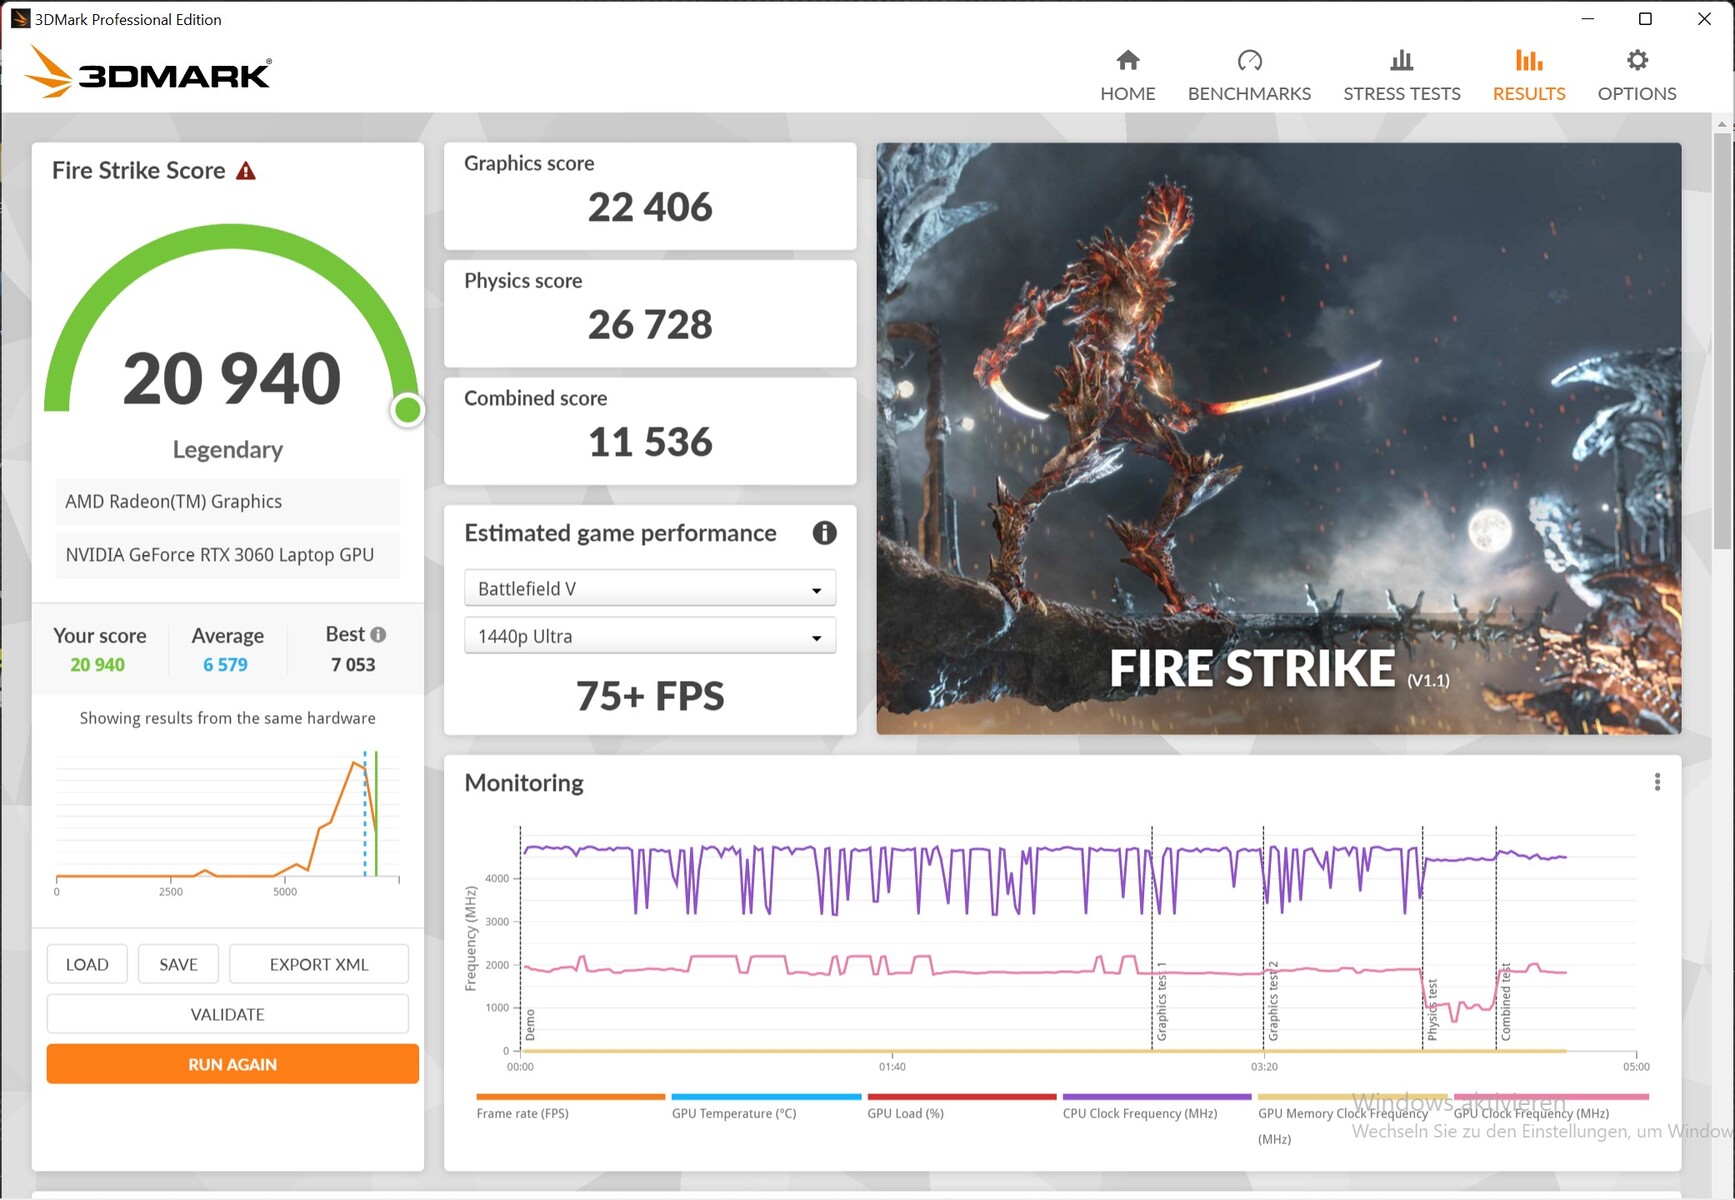
Överklockningsfunktionen i XMG Control Center kan öka prestandan med 3-4 % beroende på 3D-program, och MUX-switchen (omstart krävs) ger ~5 % mer. Trots detta måste Core 15 erkänna sig besegrad mot andra RTX 3060-spelare, även om gapet inte är särskilt stort.
Grafikprestandan sjunker betydligt på batteri, så endast 25 % av den ursprungliga prestandan återstår. Detta beror delvis på det lilla 62 Wh-batteriet, som annars skulle laddas ur för snabbt.
| 3DMark Performance rating - Percent | |
| Genomsnitt av klass Gaming | |
| Schenker XMG Fusion 15 (Mid 22) | |
| Asus TUF Gaming F15 FX507ZM | |
| Lenovo Legion 5 15ACH-82JU00C6GE-FL | |
| Schenker XMG Core 15 Ampere | |
| Schenker XMG Core 15 (M22) | |
| Schenker XMG Apex 15 NH57E PS | |
| Genomsnitt NVIDIA GeForce RTX 3060 Laptop GPU | |
| Alienware m15 R5 Ryzen Edition | |
| 3DMark 11 Performance | 25934 poäng | |
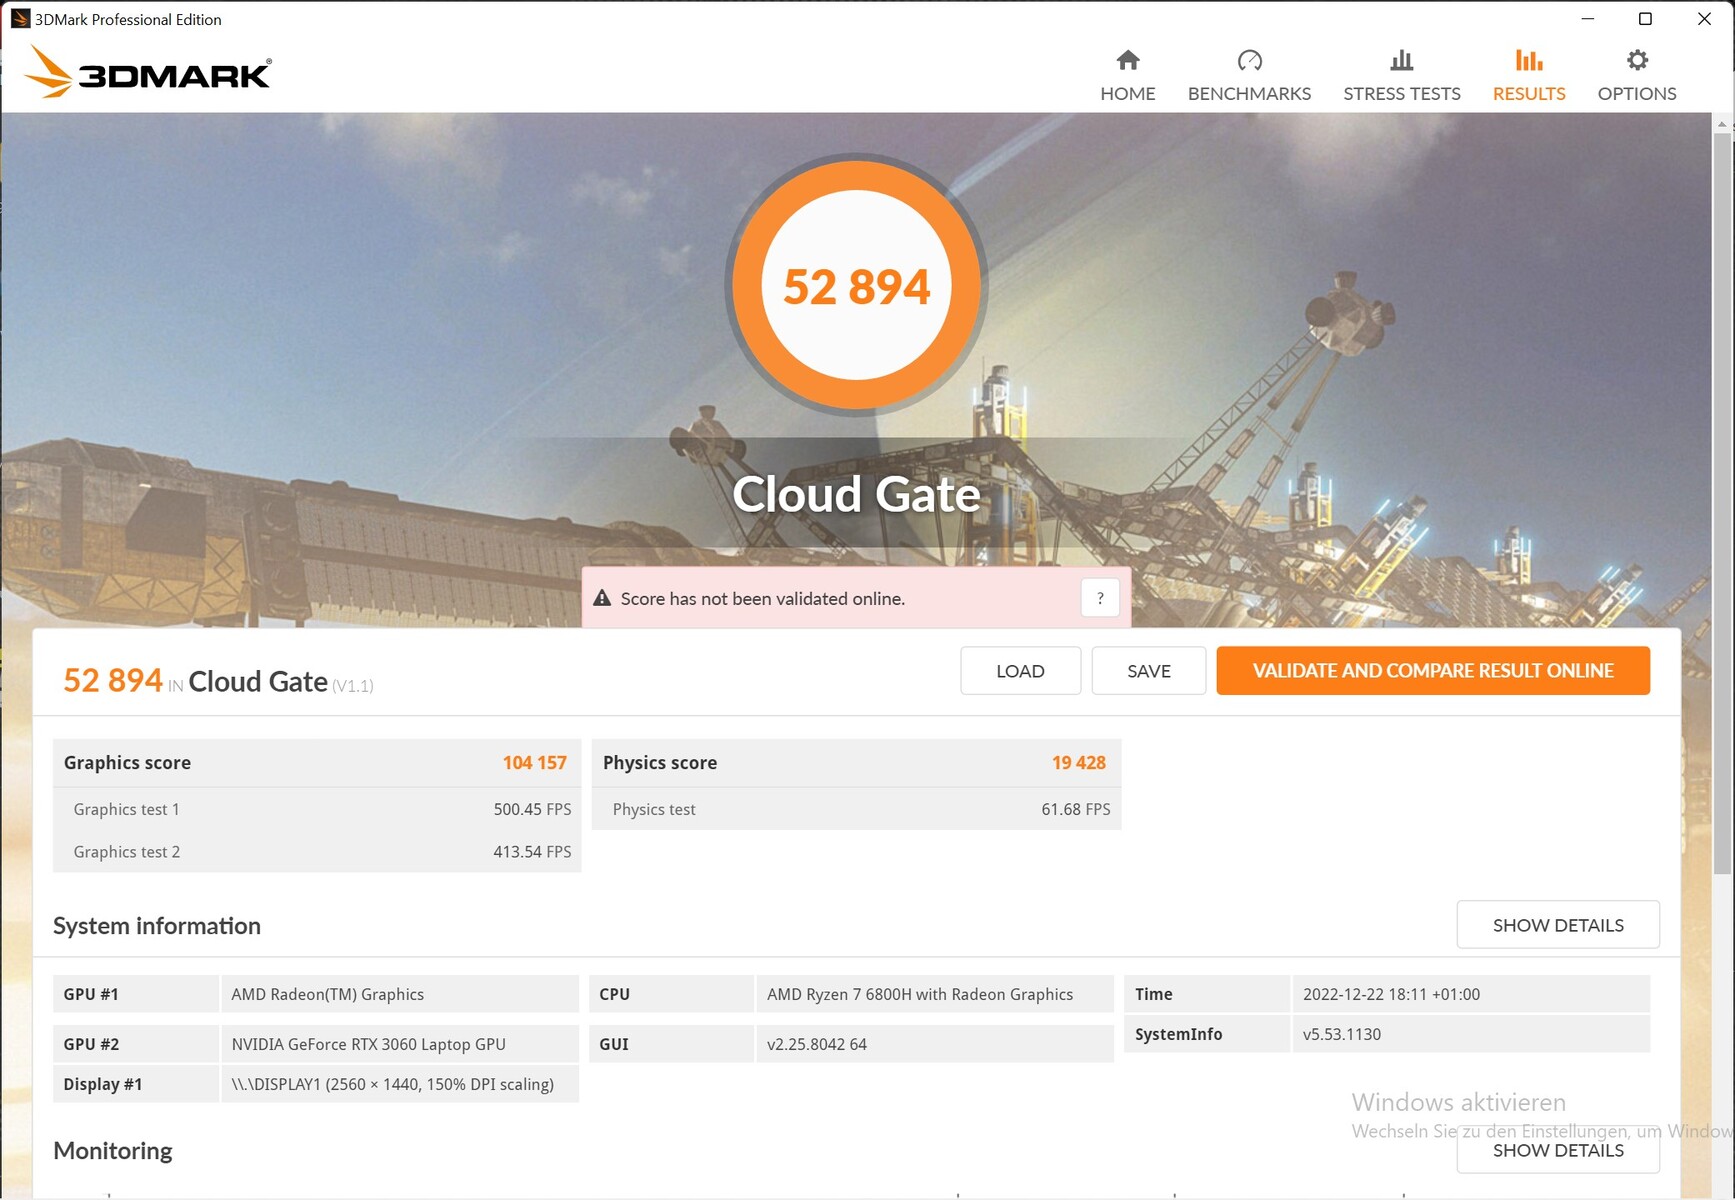
| 3DMark Cloud Gate Standard Score | 52894 poäng | |
| 3DMark Fire Strike Score | 20940 poäng | |
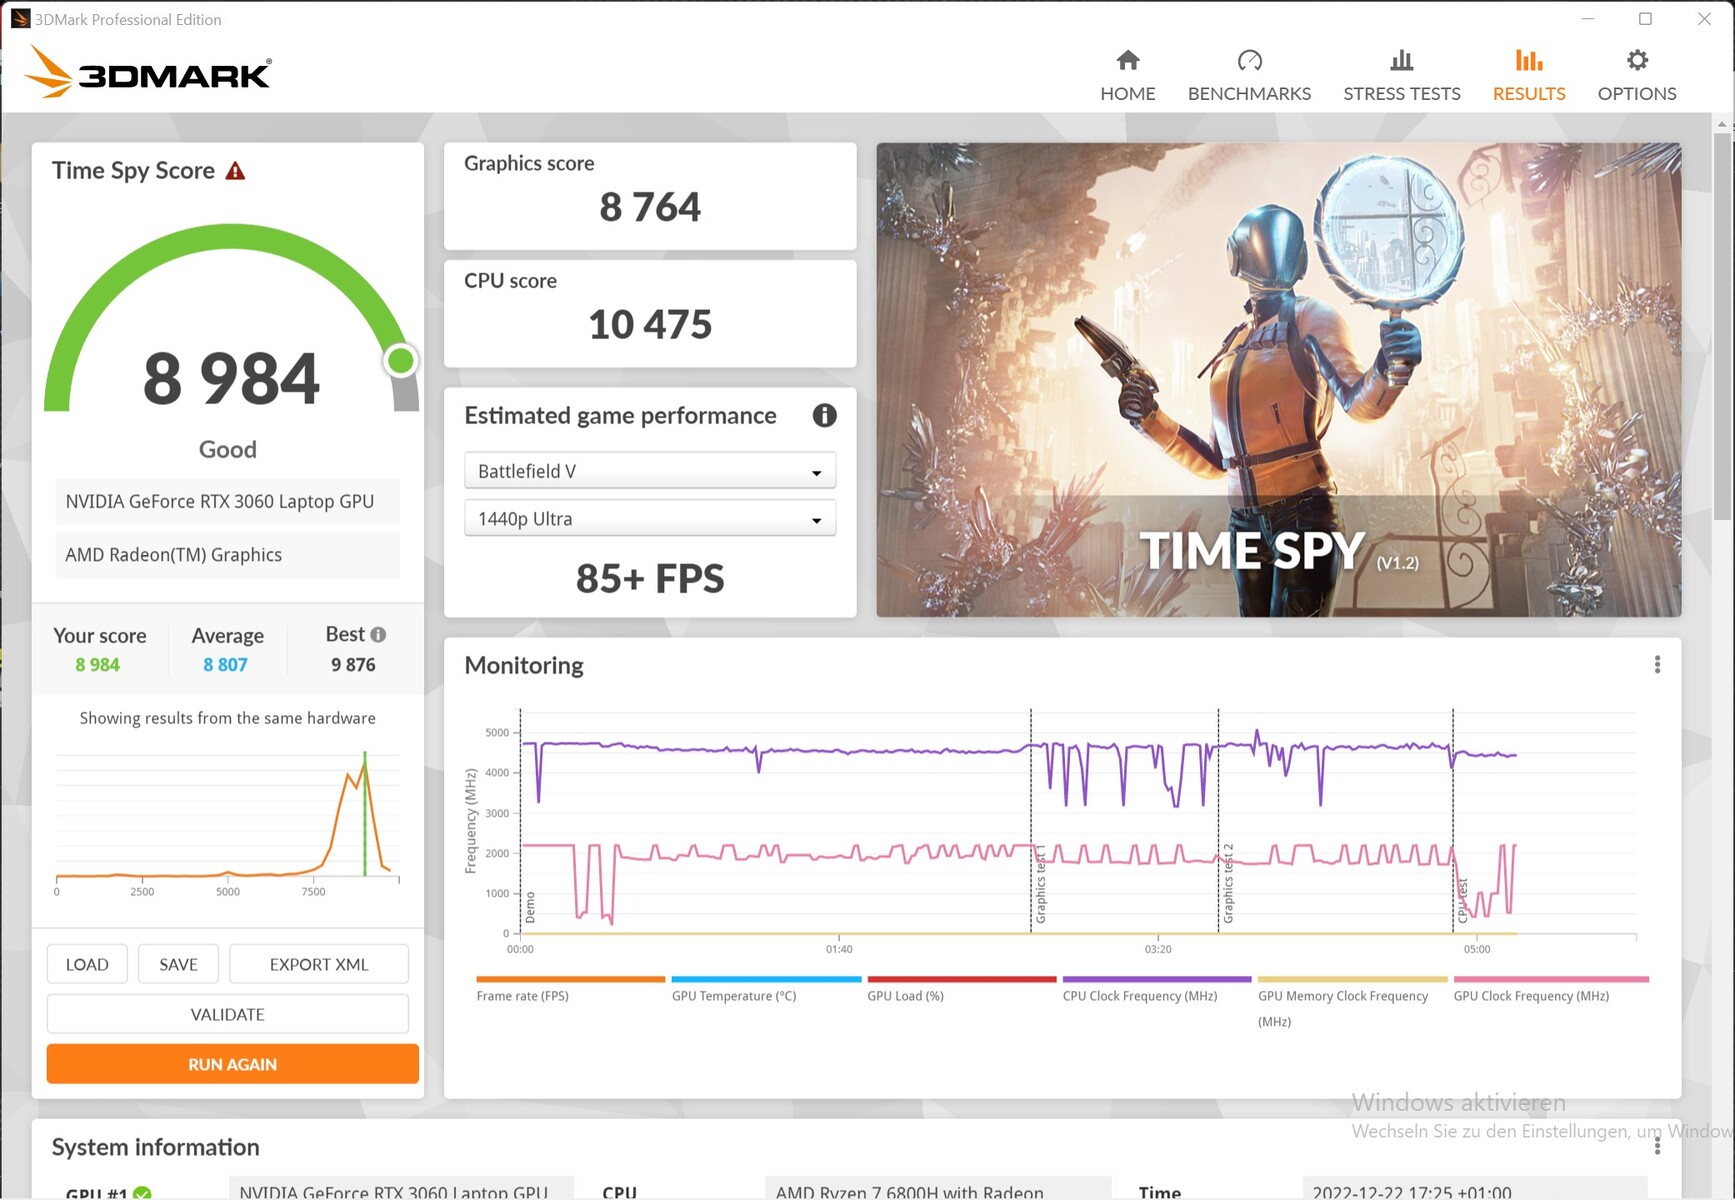
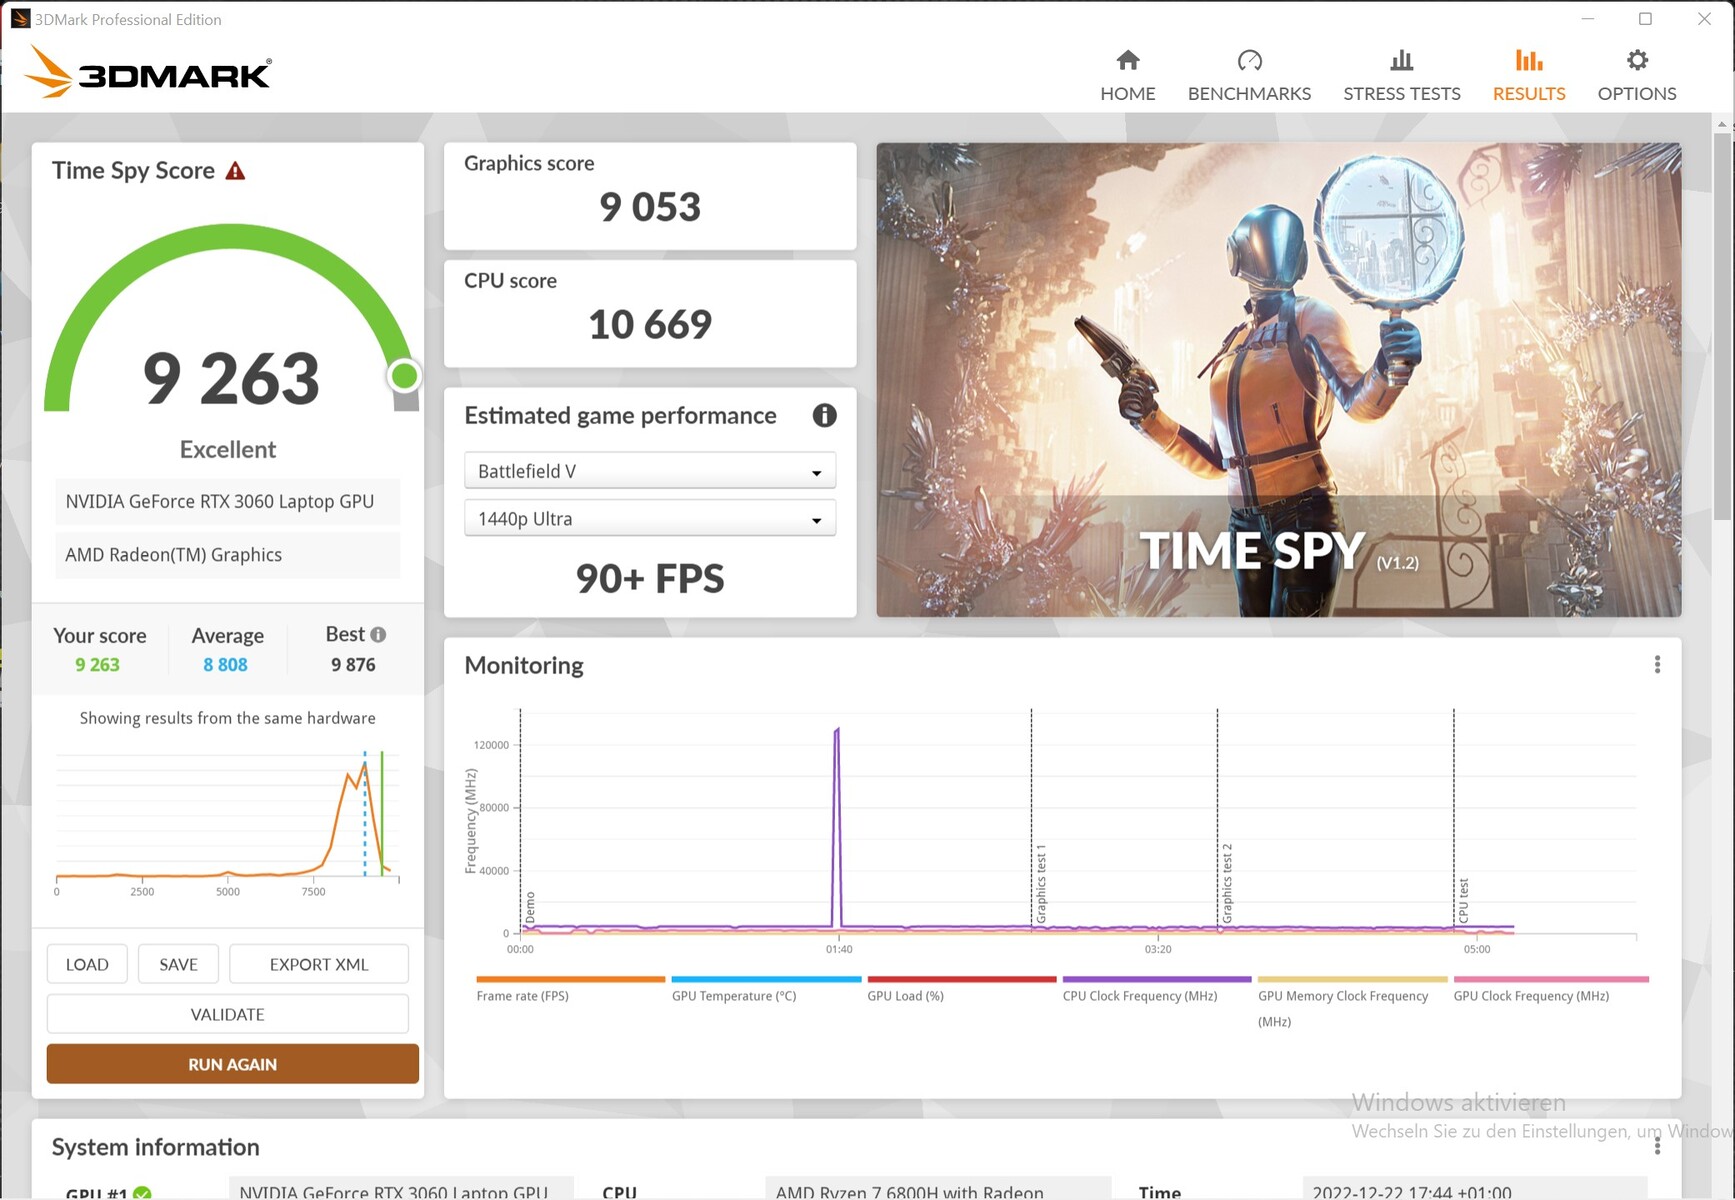
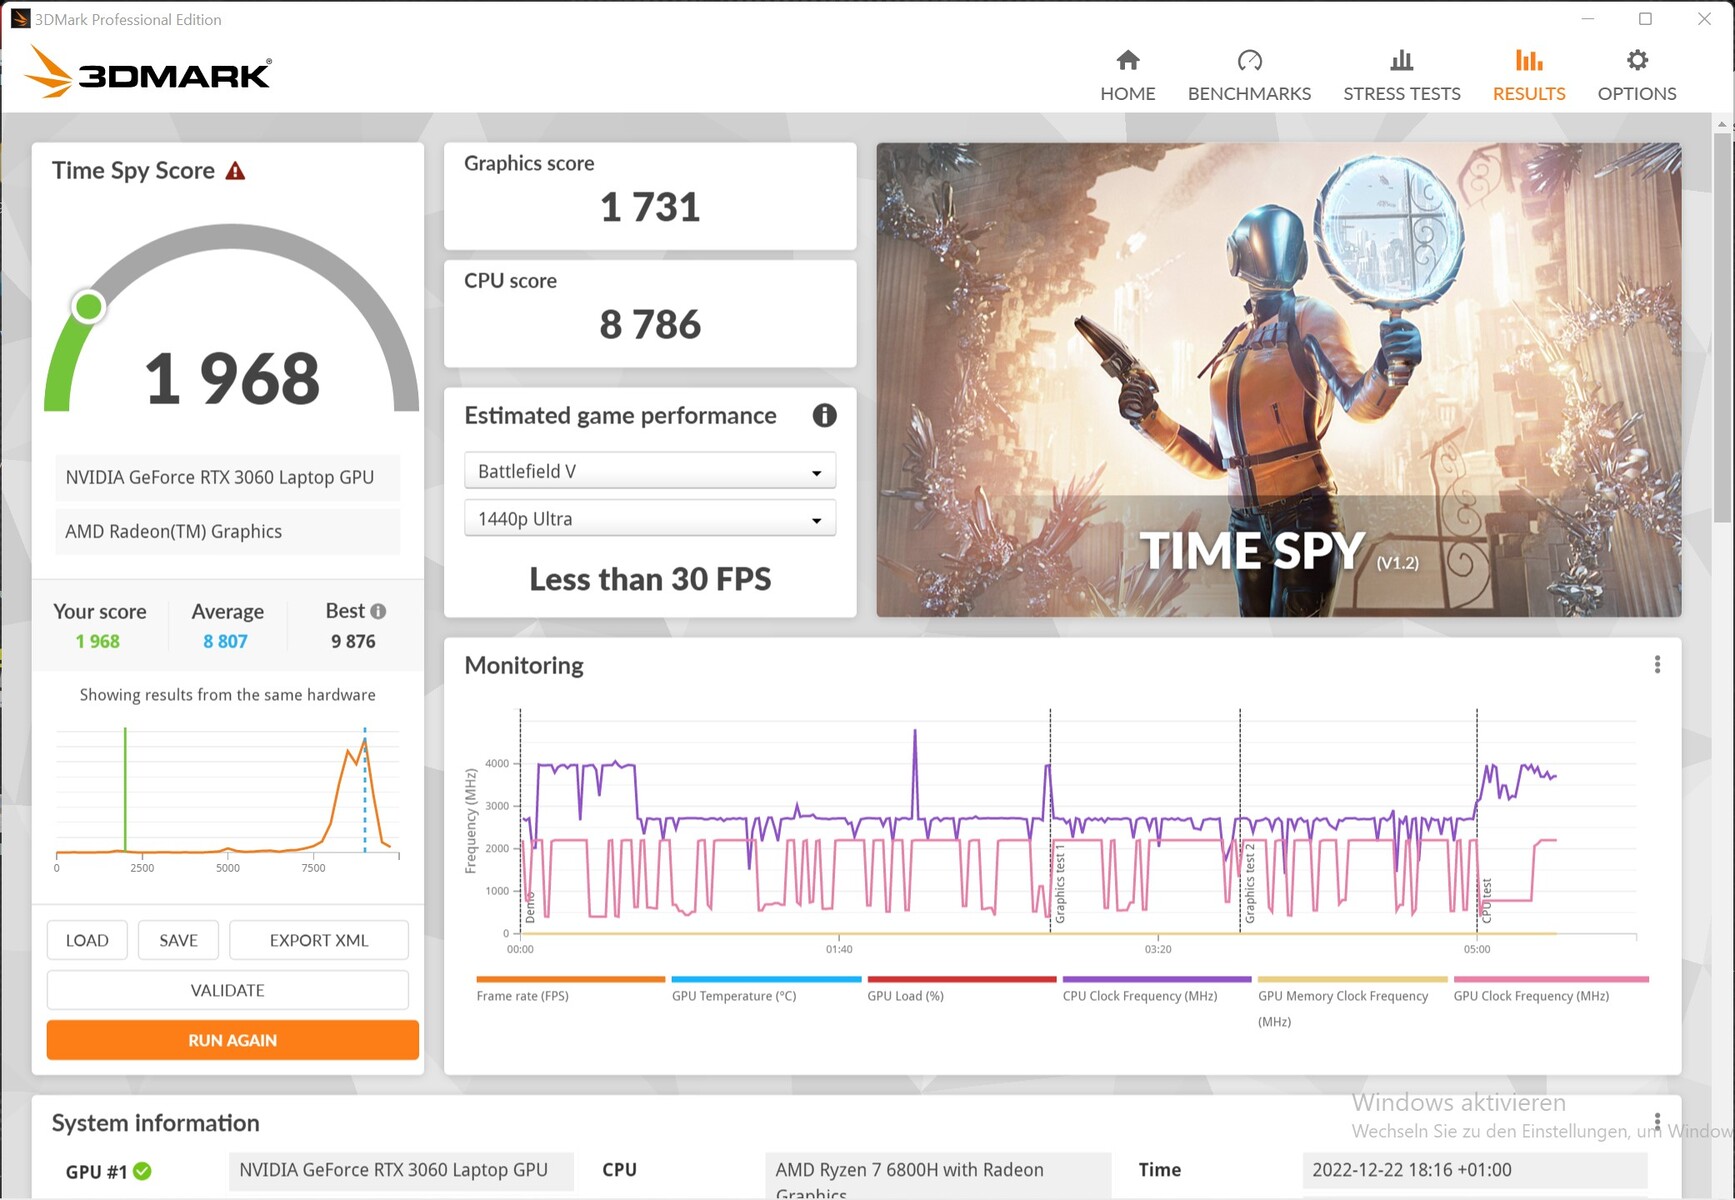
| 3DMark Time Spy Score | 8984 poäng | |
Hjälp | ||
| 3DMark - 2560x1440 Time Spy Graphics | |
| Asus TUF Gaming F15 FX507ZM | |
| Lenovo Legion 5 15IAH7H 82RB | |
| Schenker XMG Fusion 15 (Mid 22) | |
| Schenker XMG Core 15 (M22) | |
| Schenker XMG Core 15 Ampere | |
| Alienware m15 R5 Ryzen Edition | |
| HP Envy 16 h0112nr | |
| MSI CreatorPro Z16P B12UKST | |
| HP ZBook Studio 16 G9 62U04EA | |
| V-Ray Benchmark Next 4.10 - GPU | |
| Schenker XMG Fusion 15 (Mid 22) | |
| Schenker XMG Core 15 (M22) | |
| Schenker XMG Core 15 Ampere | |
| Alienware m15 R5 Ryzen Edition | |
| MSI CreatorPro Z16P B12UKST | |
| HP ZBook Studio 16 G9 62U04EA | |
| Geekbench 5.5 - OpenCL Score | |
| Schenker XMG Fusion 15 (Mid 22) | |
| Asus TUF Gaming F15 FX507ZM | |
| Lenovo Legion 5 15IAH7H 82RB | |
| Schenker XMG Core 15 (M22) | |
| Alienware m15 R5 Ryzen Edition | |
| MSI CreatorPro Z16P B12UKST | |
| Schenker XMG Core 15 Ampere | |
| HP Envy 16 h0112nr | |
| HP ZBook Studio 16 G9 62U04EA | |
* ... mindre är bättre
Spelprestanda
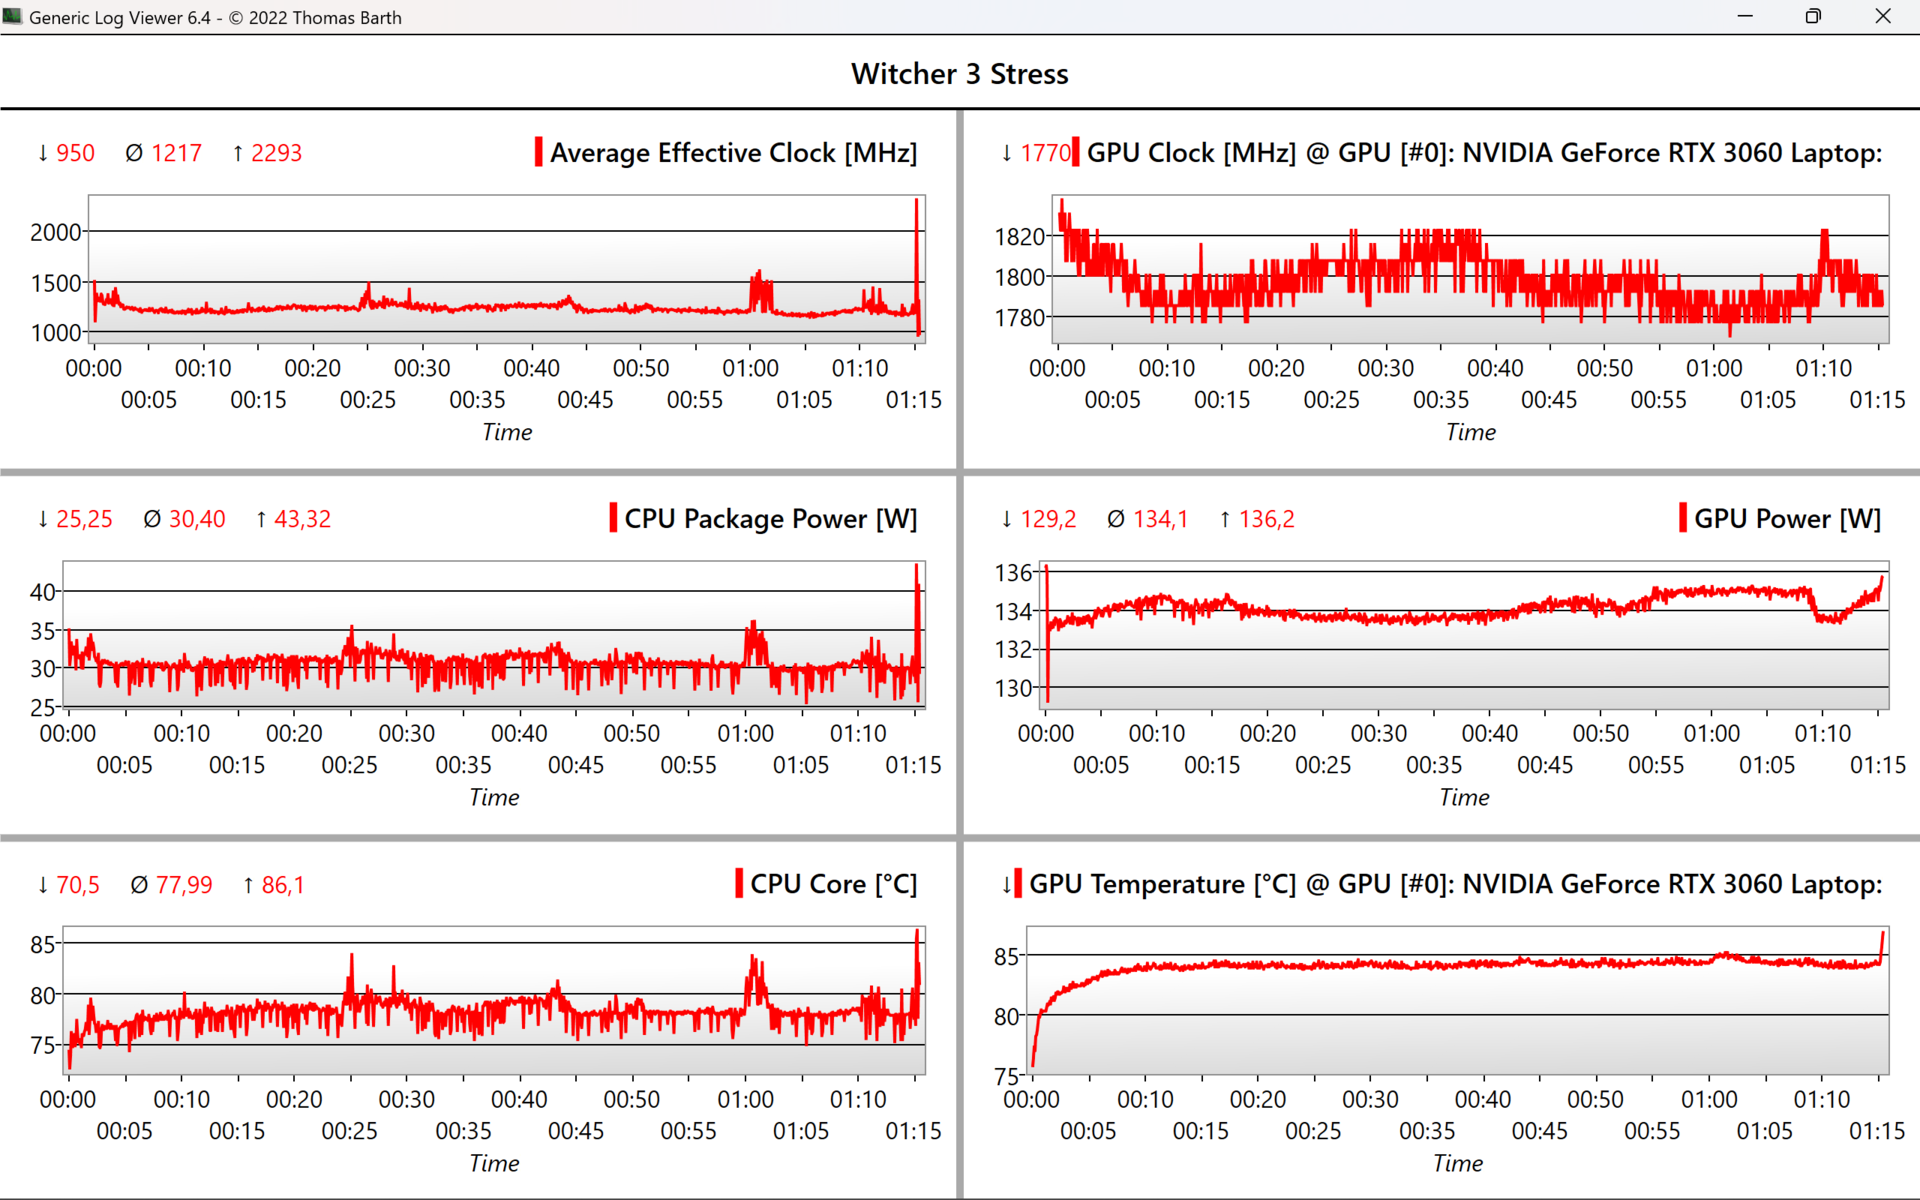
Konkurrenten med samma grafikenhet överträffar XMG Core 15 med upp till 13 % i spel trots den höga TGP, som vi mäter till 134 W, samtidigt som den åtminstone inte blir för varm vid 84 °C. Kärnklockan på ~1 800 MHz ligger redan över specifikationen på 1 702 MHz. Prestandan motsvarar det övre mellansegmentet.
Klockfrekvensen förblir stabil även efter en timme i The Witcher 3 och därmed också FPS, vilket de två följande graferna visar.
Witcher 3 FPS-Diagram
| låg | med. | hög | ultra | QHD | |
|---|---|---|---|---|---|
| GTA V (2015) | 178.7 | 172.1 | 158.4 | 97.3 | 86.5 |
| The Witcher 3 (2015) | 303 | 253 | 159.7 | 81.5 | |
| Dota 2 Reborn (2015) | 136.8 | 126.5 | 117.6 | 112.3 | |
| Final Fantasy XV Benchmark (2018) | 178.4 | 119.5 | 91.9 | 67.5 | |
| X-Plane 11.11 (2018) | 104.8 | 93.3 | 74.2 | ||
| Far Cry 5 (2018) | 118 | 107 | 90 | ||
| Strange Brigade (2018) | 273 | 200 | 171.7 | 152.7 | |
| God of War (2022) | 92.6 | 73.1 | 51.5 | 44 |
Utsläpp: XMG Core 15: Tyst spelande med höga FPS är möjligt med XMG Core 15
Bullerutsläpp
Fläktarna är oftast avstängda vid tomgångskörning och även när du surfar på webben. Även om det är ganska högljudda 42 dB(A) vid full CPU-belastning, kan detta begränsas särskilt av det balanserade läget, som fortfarande har gott om kraft i beredskap.
Det blir väldigt högt med 55 dB(A) under spelande, men det lågfrekventa ljudet förblir relativt behagligt. Även här ger det balanserade läget ett tydligt botemedel, samtidigt som FPS bara sjönk med 5 % i till exempel GTA V, vilket är ett mycket bra resultat. Från fabrik är XMG Fusion 15 och Alienware m15 fortfarande betydligt tystare vid spel med 46 respektive 48 dB(A).
.
Ljudnivå
| Låg belastning |
| 23 / 23 / 23 dB(A) |
| Hög belastning |
| 42.41 / 55.05 dB(A) |
 | ||
30 dB tyst 40 dB(A) hörbar 50 dB(A) högt ljud |
||
min: | ||
| Schenker XMG Core 15 (M22) R7 6800H, GeForce RTX 3060 Laptop GPU | Lenovo Legion 5 15IAH7H 82RB i7-12700H, GeForce RTX 3060 Laptop GPU | Schenker XMG Fusion 15 (Mid 22) i7-11800H, GeForce RTX 3070 Laptop GPU | Asus TUF Gaming F15 FX507ZM i7-12700H, GeForce RTX 3060 Laptop GPU | Alienware m15 R5 Ryzen Edition R7 5800H, GeForce RTX 3060 Laptop GPU | Schenker XMG Core 15 Ampere R7 4800H, GeForce RTX 3060 Laptop GPU | |
|---|---|---|---|---|---|---|
| Noise | 3% | -9% | -1% | -7% | -8% | |
| av / miljö * (dB) | 23 | 23.3 -1% | 26 -13% | 23.2 -1% | 24 -4% | 24 -4% |
| Idle Minimum * (dB) | 23 | 23.5 -2% | 26 -13% | 23.6 -3% | 24 -4% | 26 -13% |
| Idle Average * (dB) | 23 | 23.5 -2% | 28 -22% | 23.6 -3% | 25 -9% | 28 -22% |
| Idle Maximum * (dB) | 23 | 26.8 -17% | 31 -35% | 25.4 -10% | 35 -52% | 30 -30% |
| Load Average * (dB) | 42.41 | 29.3 31% | 45 -6% | 38 10% | 44 -4% | 42 1% |
| Witcher 3 ultra * (dB) | 54.71 | 51.4 6% | 46 16% | 54.1 1% | 48 12% | 50 9% |
| Load Maximum * (dB) | 55.05 | 53 4% | 48 13% | 57.2 -4% | 50 9% | 52 6% |
* ... mindre är bättre
Temperatur
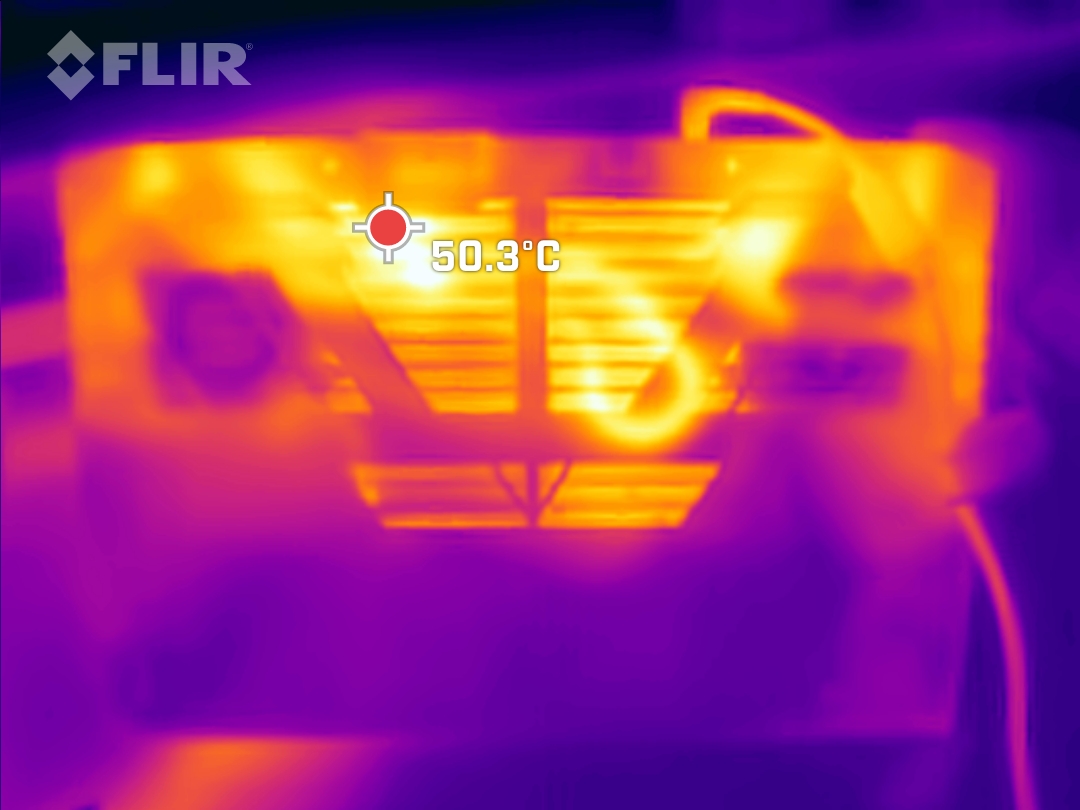
Temperaturen är aldrig för hög, inte ens under spelandet. Vid maximal belastning finns det en hotspot på 51 °C på enhetens undersida, medan Alienware m15 och Schenker XMG Fusion 15 är mycket varmare med 61 °C och 63 °C respektive 63 °C.
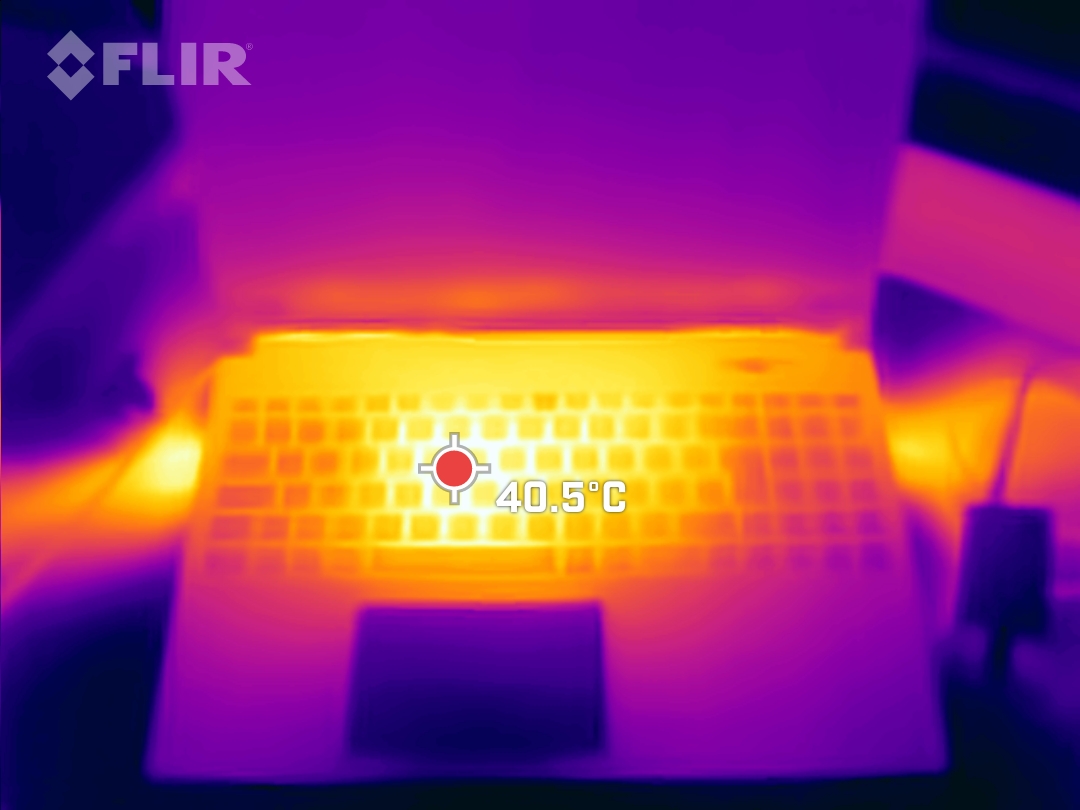
(-) Den maximala temperaturen på ovansidan är 48 °C / 118 F, jämfört med genomsnittet av 40.4 °C / 105 F , allt från 21.2 till 68.8 °C för klassen Gaming.
(-) Botten värms upp till maximalt 51 °C / 124 F, jämfört med genomsnittet av 43.2 °C / 110 F
(+) Vid tomgångsbruk är medeltemperaturen för ovansidan 25.6 °C / 78 F, jämfört med enhetsgenomsnittet på 33.9 °C / ### class_avg_f### F.
(±) När du spelar The Witcher 3 är medeltemperaturen för ovansidan 34.9 °C / 95 F, jämfört med enhetsgenomsnittet på 33.9 °C / ## #class_avg_f### F.
(+) Handledsstöden och pekplattan är kallare än hudtemperaturen med maximalt 28 °C / 82.4 F och är därför svala att ta på.
(±) Medeltemperaturen för handledsstödsområdet på liknande enheter var 28.8 °C / 83.8 F (+0.8 °C / 1.4 F).
| Schenker XMG Core 15 (M22) AMD Ryzen 7 6800H, NVIDIA GeForce RTX 3060 Laptop GPU | Lenovo Legion 5 15IAH7H 82RB Intel Core i7-12700H, NVIDIA GeForce RTX 3060 Laptop GPU | Schenker XMG Fusion 15 (Mid 22) Intel Core i7-11800H, NVIDIA GeForce RTX 3070 Laptop GPU | Asus TUF Gaming F15 FX507ZM Intel Core i7-12700H, NVIDIA GeForce RTX 3060 Laptop GPU | Alienware m15 R5 Ryzen Edition AMD Ryzen 7 5800H, NVIDIA GeForce RTX 3060 Laptop GPU | Schenker XMG Core 15 Ampere AMD Ryzen 7 4800H, NVIDIA GeForce RTX 3060 Laptop GPU | |
|---|---|---|---|---|---|---|
| Heat | 11% | -20% | -11% | -20% | 2% | |
| Maximum Upper Side * (°C) | 48 | 37.8 21% | 52 -8% | 44.4 7% | 62 -29% | 48 -0% |
| Maximum Bottom * (°C) | 51 | 51 -0% | 63 -24% | 48.8 4% | 61 -20% | 50 2% |
| Idle Upper Side * (°C) | 28 | 25.8 8% | 37 -32% | 37.8 -35% | 36 -29% | 28 -0% |
| Idle Bottom * (°C) | 33 | 28.8 13% | 38 -15% | 39.6 -20% | 33 -0% | 31 6% |
* ... mindre är bättre
Stresstest
Även i det kombinerade stresstestet räknar processorn fortfarande något över basklockan på 3,2 GHz, medan den värms upp till 86 °C under de första 40 minuterna och 93 °C därefter när den kombinerade TDP-nivån ändras till processorns fördel och den återhämtar sig till 4 GHz. GPU-temperaturen är här 86 °C samtidigt som den fortfarande klockas vid ~1 400 MHz.
Ett GPU-benchmark som utfördes direkt efteråt utfördes utan prestandaförluster.
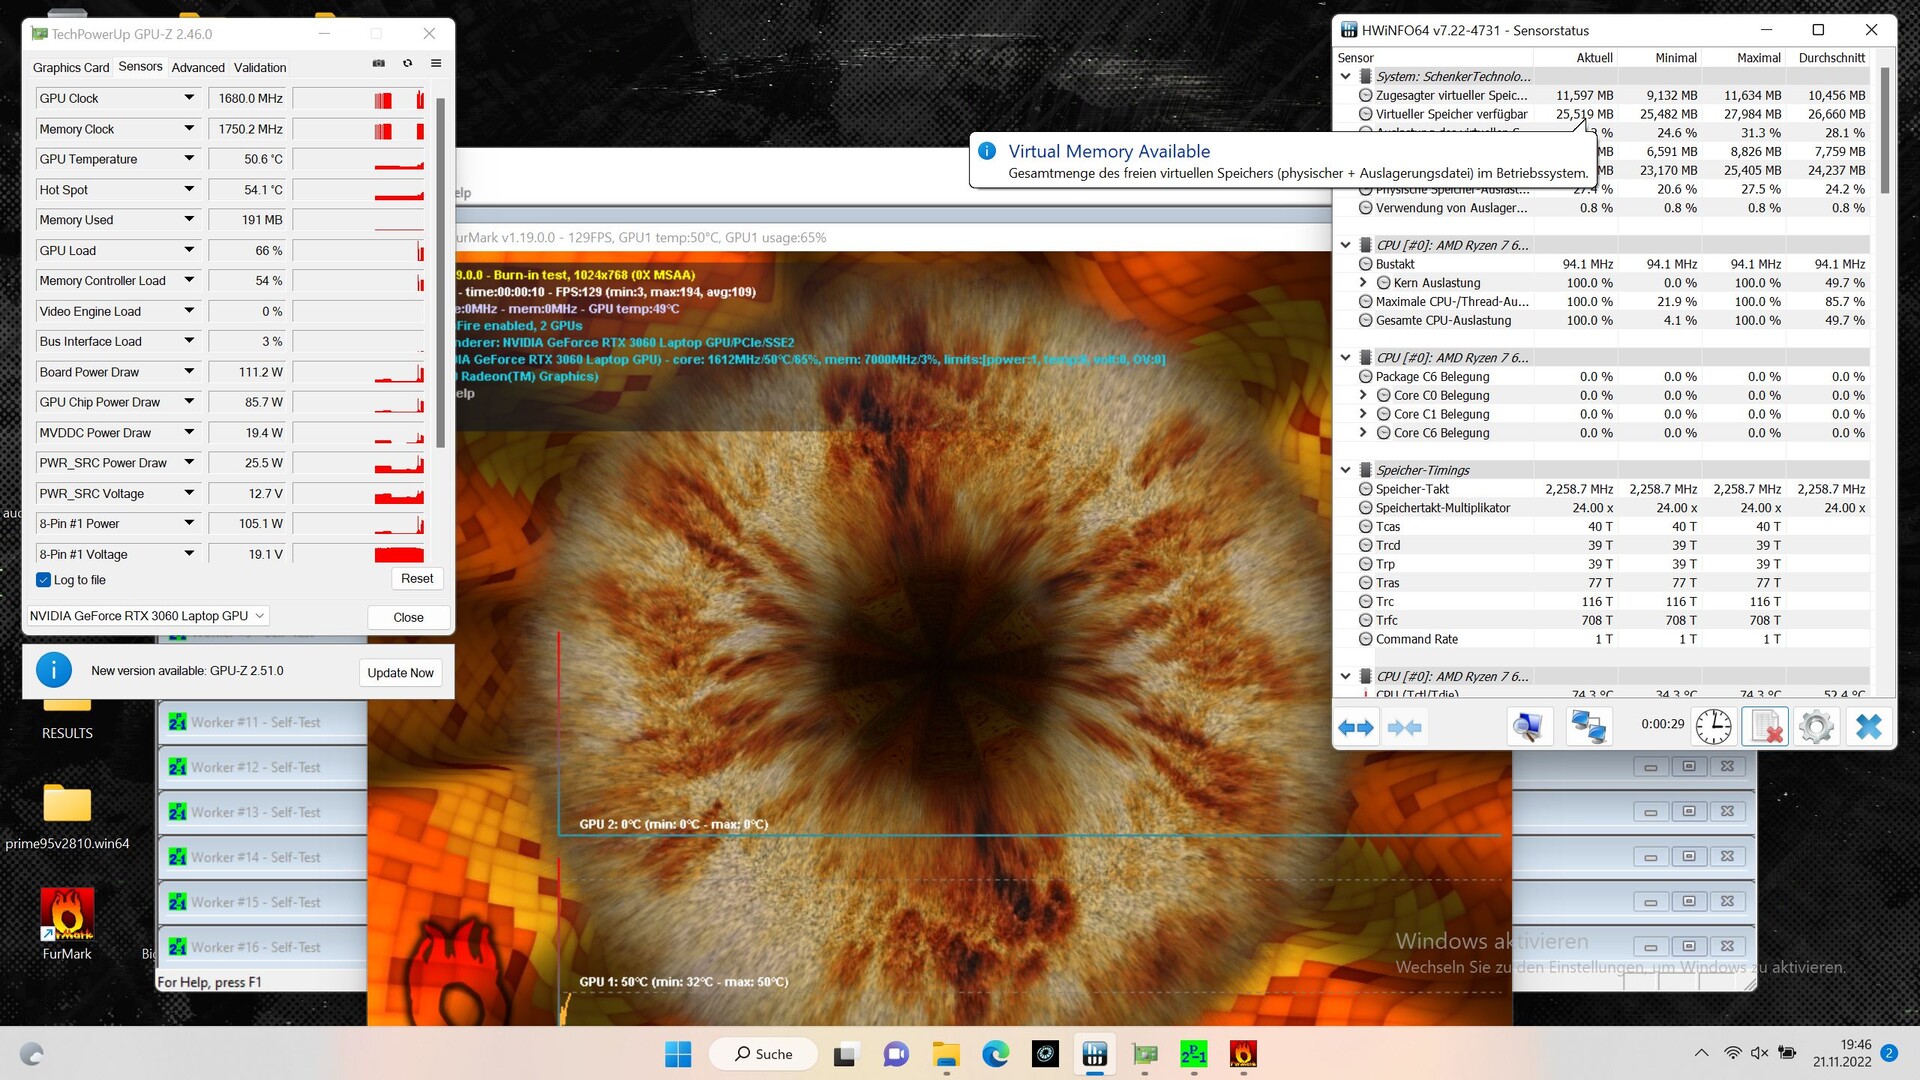
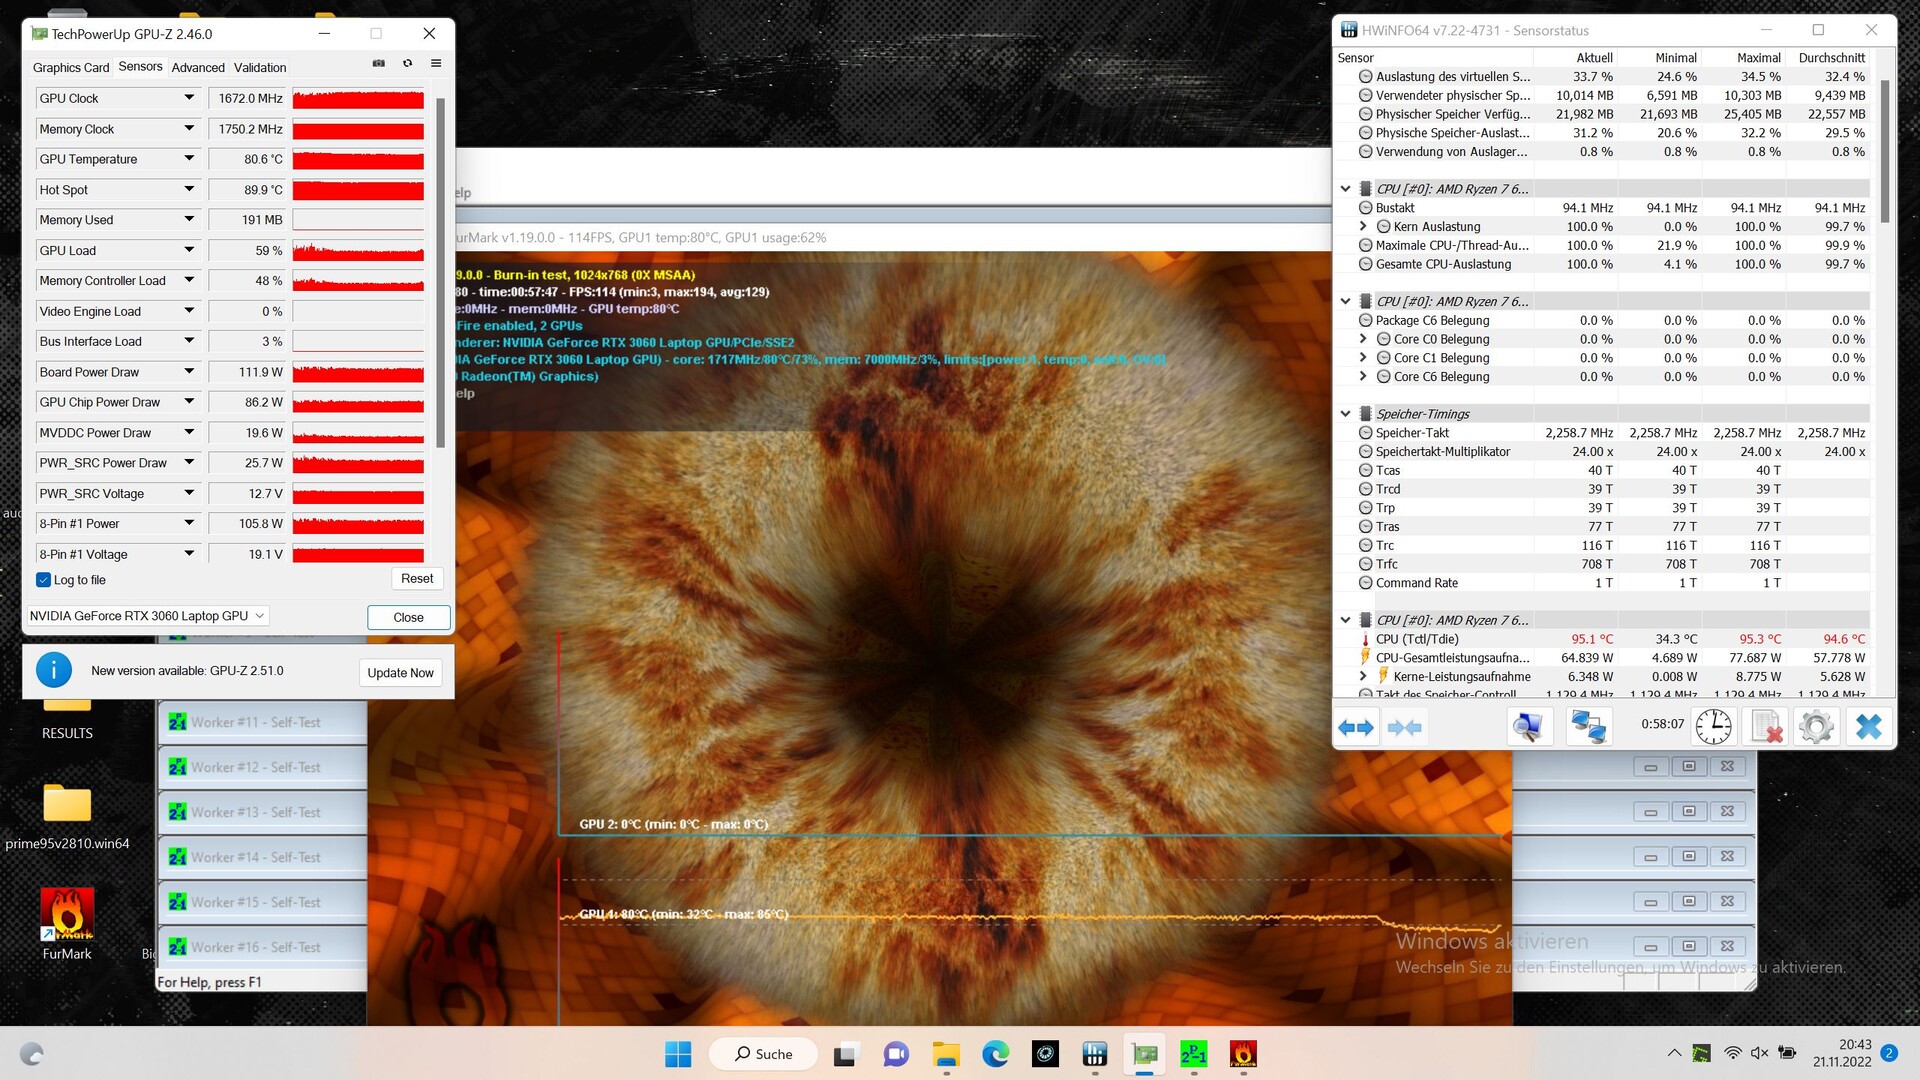
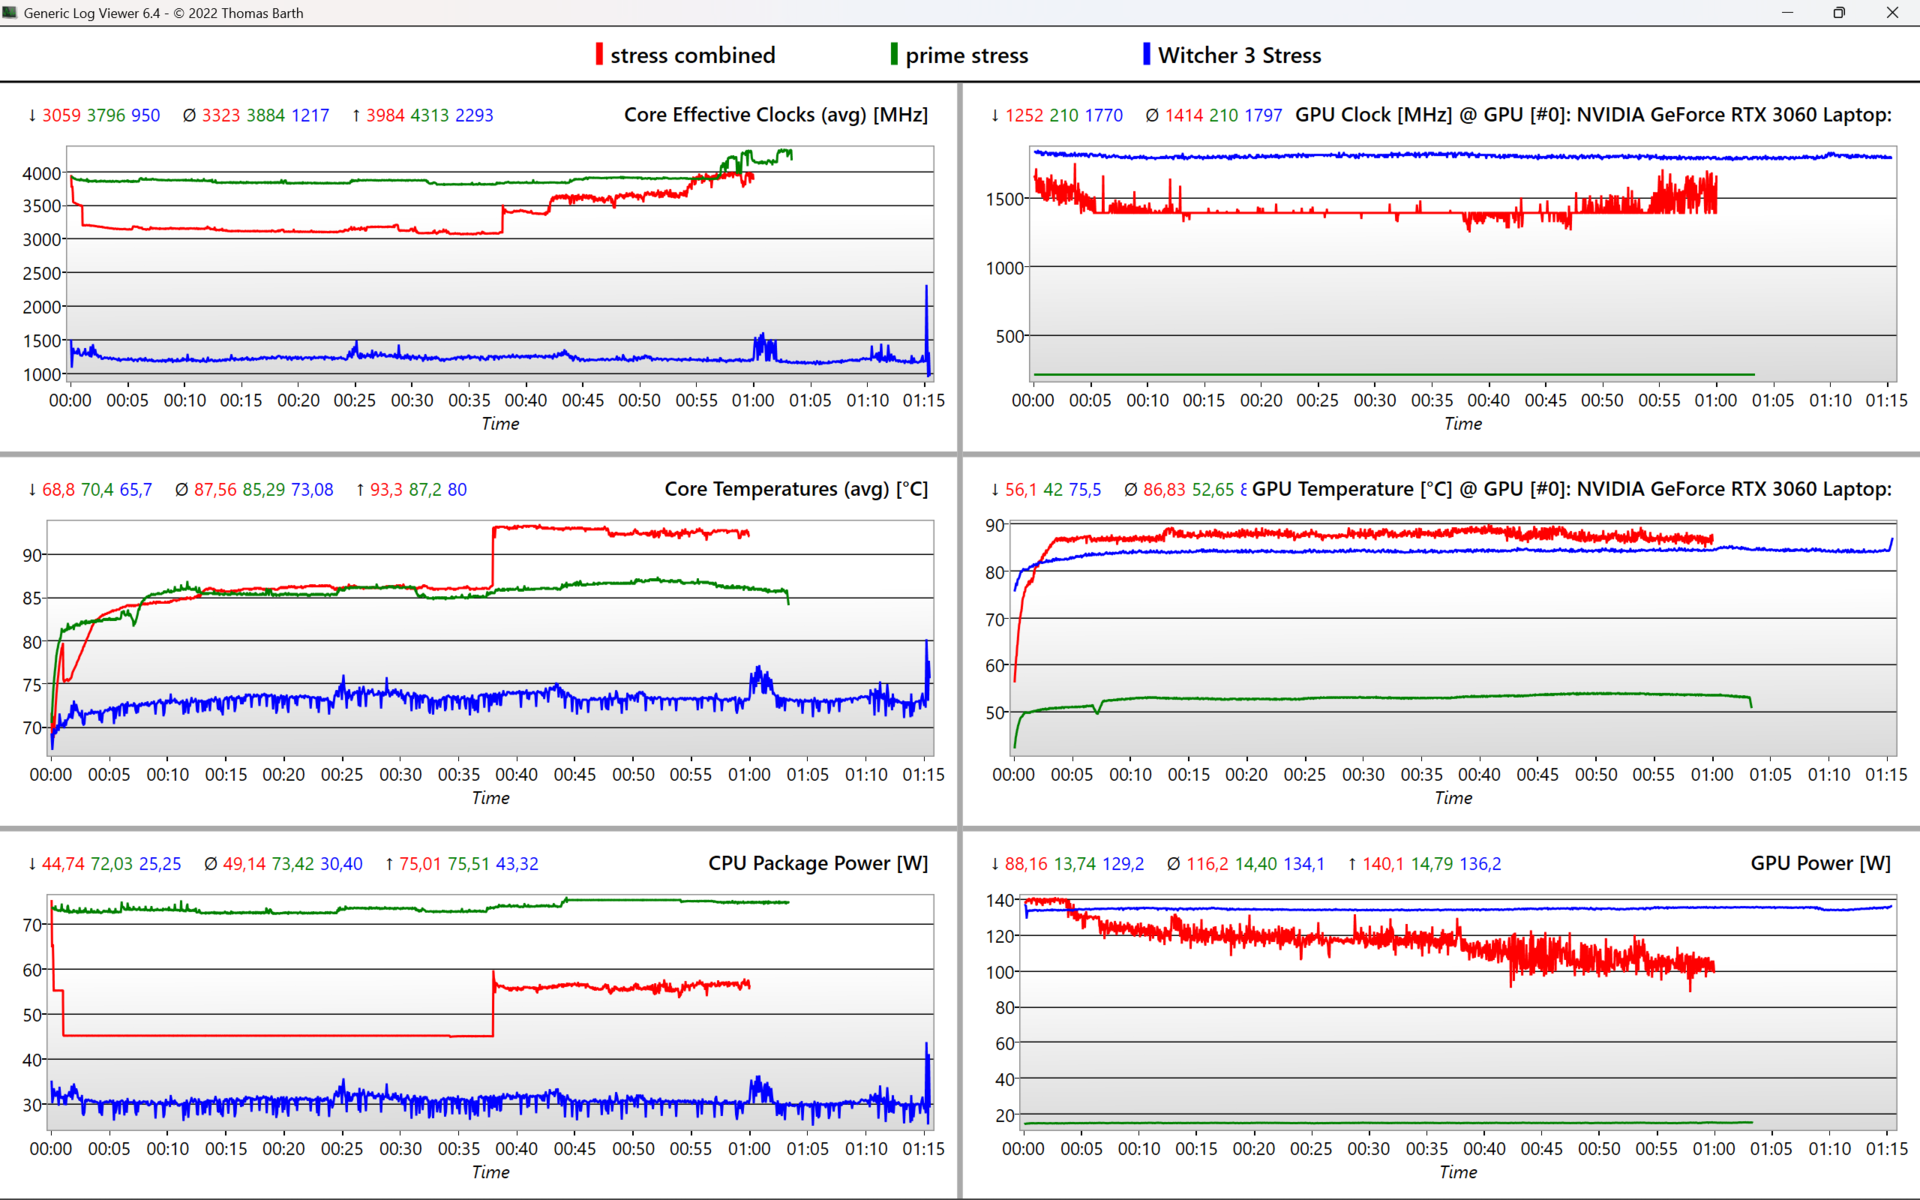
| CPU-klocka (GHz) | GPU-klocka (MHz) | Genomsnittlig CPU-temperatur (°C) | Genomsnittlig GPU-temperatur (°C) | |
| System Idle | 0.15 | 200 | 34 | 42 |
| Prime95, stress | 3,9 | 200 | 85 | 53 |
| Prime95 + FurMark, stress | 3,3 | 1 400 | 93 | 87 |
| Witcher 3, Stress | 1,2 | 1 800 | 73 | 84 |
Högtalare
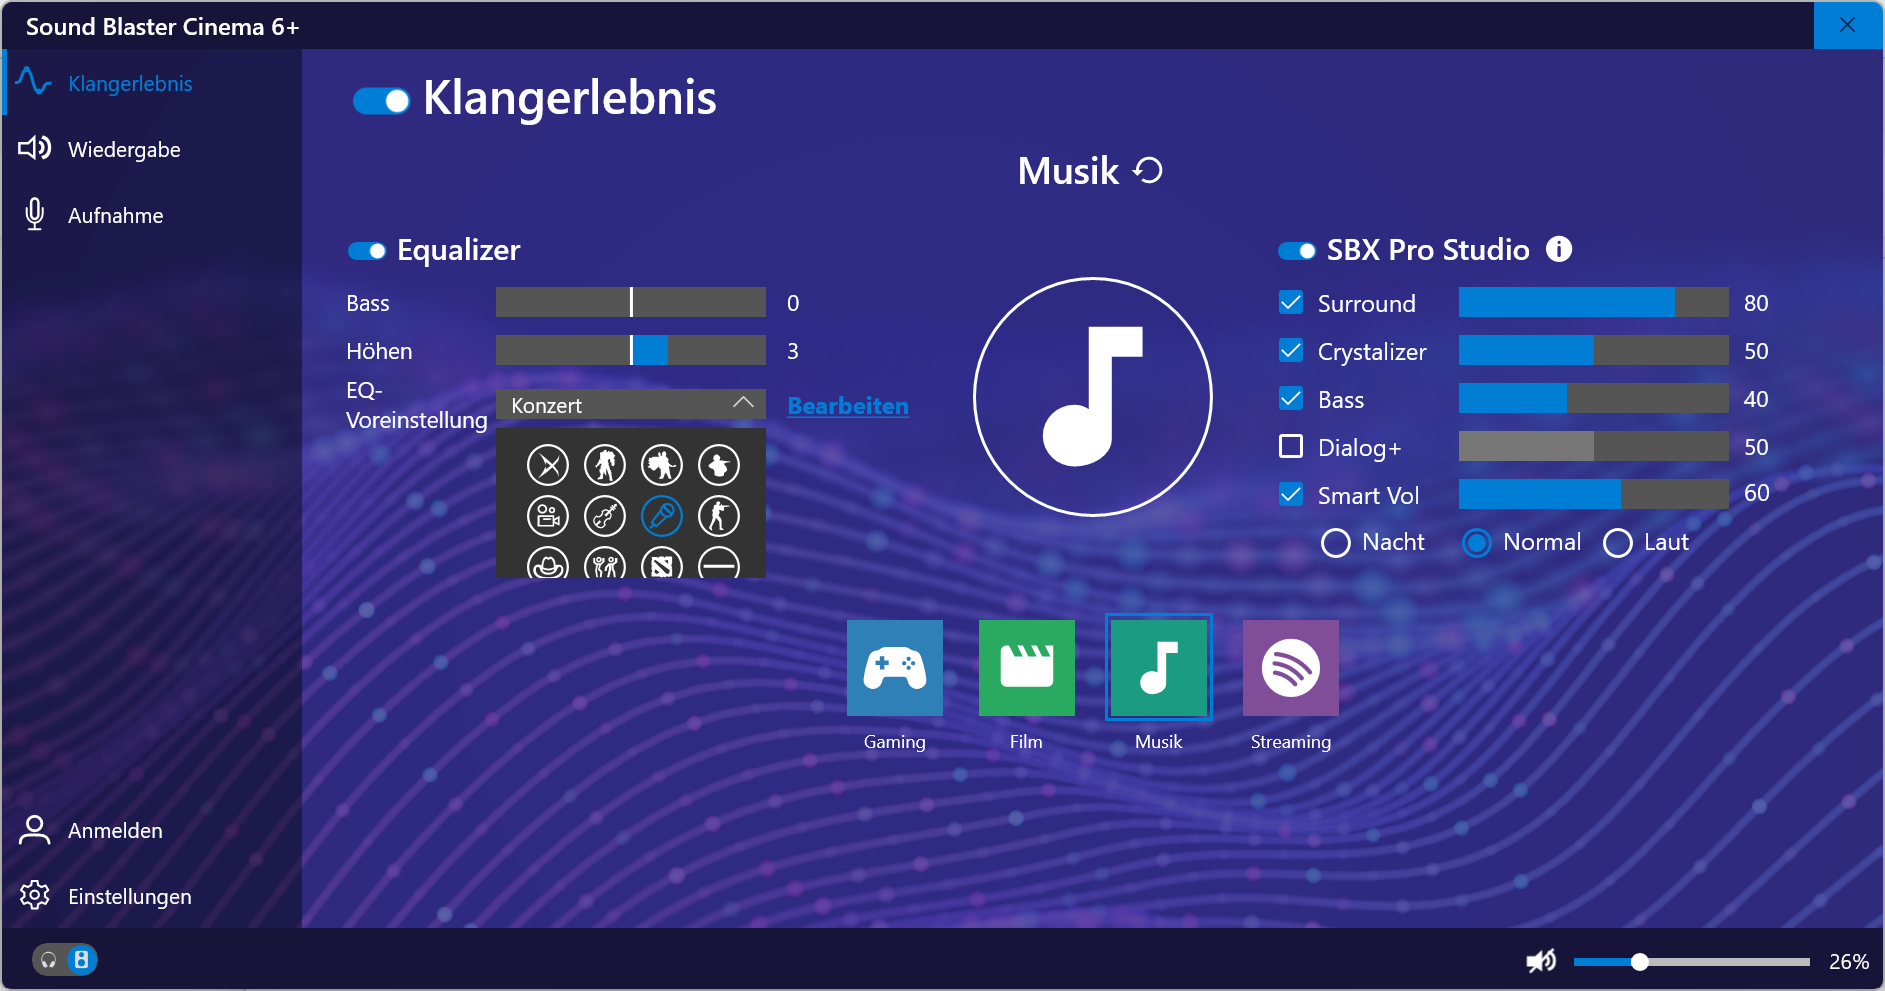
Stereoljudsystemet erbjuder linjära och balanserade höga toner och har till och med en antydan till bas. Programvaran Sound Blaster Cinema 6+ förbättrar ljudet genom att välja olika lägen. För en bättre ljudupplevelse bör hörlurar eller ett externt ljudsystem fortfarande anslutas via jack eller Bluetooth.
Schenker XMG Core 15 (M22) ljudanalys
(±) | högtalarljudstyrkan är genomsnittlig men bra (81.28 dB)
Bas 100 - 315 Hz
(-) | nästan ingen bas - i genomsnitt 19.8% lägre än medianen
(+) | basen är linjär (6.4% delta till föregående frekvens)
Mellan 400 - 2000 Hz
(±) | högre mellan - i genomsnitt 6.2% högre än median
(±) | linjäriteten för mids är genomsnittlig (7.9% delta till föregående frekvens)
Högsta 2 - 16 kHz
(+) | balanserade toppar - endast 1.8% från medianen
(+) | toppar är linjära (4.8% delta till föregående frekvens)
Totalt 100 - 16 000 Hz
(±) | linjäriteten för det totala ljudet är genomsnittlig (17.1% skillnad mot median)
Jämfört med samma klass
» 46% av alla testade enheter i den här klassen var bättre, 12% liknande, 43% sämre
» Den bästa hade ett delta på 6%, genomsnittet var 18%, sämst var 132%
Jämfört med alla testade enheter
» 31% av alla testade enheter var bättre, 8% liknande, 61% sämre
» Den bästa hade ett delta på 4%, genomsnittet var 24%, sämst var 134%
Lenovo Legion Slim 7-16IAH 82TF004YGE ljudanalys
(±) | högtalarljudstyrkan är genomsnittlig men bra (73.4 dB)
Bas 100 - 315 Hz
(±) | reducerad bas - i genomsnitt 10% lägre än medianen
(±) | linjäriteten för basen är genomsnittlig (13.4% delta till föregående frekvens)
Mellan 400 - 2000 Hz
(+) | balanserad mellan - endast 1.2% från medianen
(+) | mids är linjära (3.3% delta till föregående frekvens)
Högsta 2 - 16 kHz
(±) | högre toppar - i genomsnitt 5.5% högre än medianen
(±) | linjäriteten för toppar är genomsnittlig (10.6% delta till föregående frekvens)
Totalt 100 - 16 000 Hz
(+) | det totala ljudet är linjärt (13% skillnad mot median)
Jämfört med samma klass
» 18% av alla testade enheter i den här klassen var bättre, 3% liknande, 79% sämre
» Den bästa hade ett delta på 6%, genomsnittet var 18%, sämst var 132%
Jämfört med alla testade enheter
» 13% av alla testade enheter var bättre, 2% liknande, 85% sämre
» Den bästa hade ett delta på 4%, genomsnittet var 24%, sämst var 134%
Energihantering: Bärbar dator för AMD-spel med användbar batteritid
Energiförbrukning
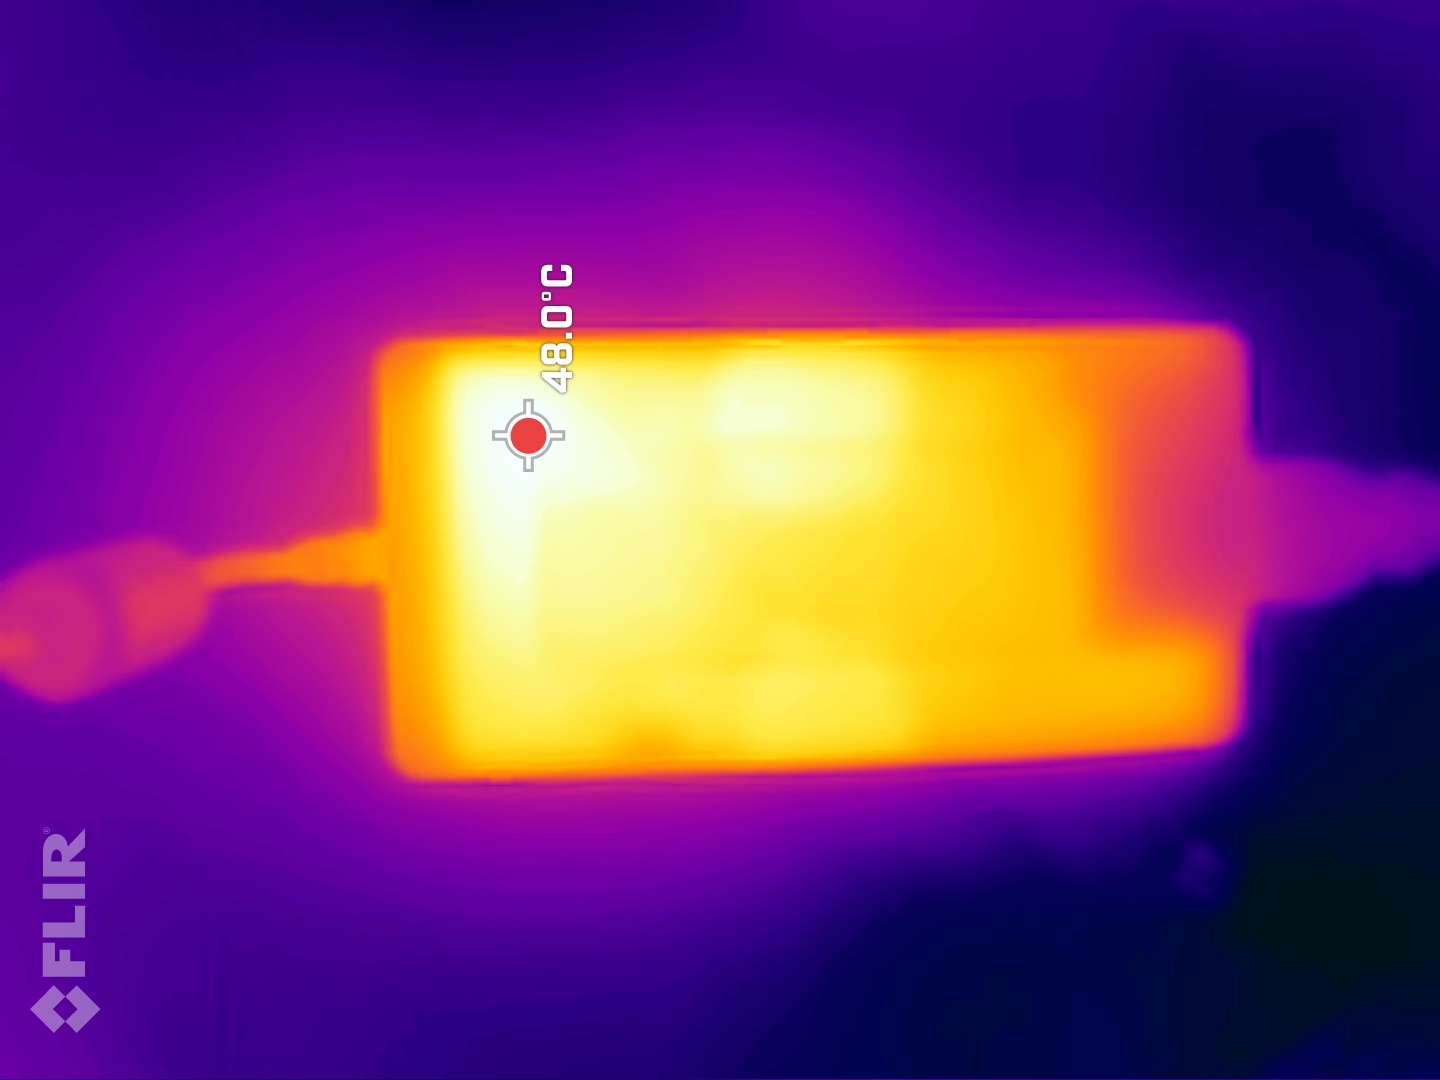
Energiförbrukningen ligger i princip på den förväntade nivån och är ungefär på samma nivå som konkurrenterna i vårt jämförelseområde. Endast Legion 5 drar betydligt mer juice från uttaget i tomgång, medan TUF Gaming F15 är den mest sparsamma i tomgång i vår jämförelse. Nätaggregatet på 230 W klarar sin uppgift, eftersom det sällan når 236 W i topp.
| Låg belastning | |
| Hög belastning |
|
Förklaring:
min: | |
| Schenker XMG Core 15 (M22) R7 6800H, GeForce RTX 3060 Laptop GPU, Samsung SSD 980 Pro 1TB MZ-V8P1T0BW, IPS, 2560x1440, 15.6" | Lenovo Legion 5 15IAH7H 82RB i7-12700H, GeForce RTX 3060 Laptop GPU, , IPS, 1920x1080, 15.6" | Schenker XMG Fusion 15 (Mid 22) i7-11800H, GeForce RTX 3070 Laptop GPU, Samsung SSD 980 Pro 1TB MZ-V8P1T0BW, IPS, 2560x1440, 15.6" | Asus TUF Gaming F15 FX507ZM i7-12700H, GeForce RTX 3060 Laptop GPU, SK Hynix HFM001TD3JX013N, IPS, 1920x1080, 15.6" | Alienware m15 R5 Ryzen Edition R7 5800H, GeForce RTX 3060 Laptop GPU, Toshiba KBG40ZNS512G NVMe, IPS, 1920x1080, 15.6" | Schenker XMG Core 15 Ampere R7 4800H, GeForce RTX 3060 Laptop GPU, Samsung SSD 970 EVO Plus 1TB, IPS, 2560x1440, 15.6" | Genomsnitt NVIDIA GeForce RTX 3060 Laptop GPU | Genomsnitt av klass Gaming | |
|---|---|---|---|---|---|---|---|---|
| Power Consumption | -64% | -10% | -1% | -12% | -2% | -5% | -24% | |
| Idle Minimum * (Watt) | 11.8 | 19.8 -68% | 12 -2% | 6.3 47% | 11 7% | 11 7% | 10.4 ? 12% | 13.2 ? -12% |
| Idle Average * (Watt) | 14.7 | 26.2 -78% | 17 -16% | 9.8 33% | 14 5% | 14 5% | 14.5 ? 1% | 18.9 ? -29% |
| Idle Maximum * (Watt) | 15 | 48.2 -221% | 24 -60% | 26.5 -77% | 25 -67% | 20 -33% | 21.4 ? -43% | 24.5 ? -63% |
| Load Average * (Watt) | 100 | 102.9 -3% | 106 -6% | 103.8 -4% | 123 -23% | 94 6% | 109.3 ? -9% | 108.8 ? -9% |
| Witcher 3 ultra * (Watt) | 184 | 186.7 -1% | 159.9 13% | 189 -3% | 176 4% | 167 9% | ||
| Load Maximum * (Watt) | 237 | 268 -13% | 208 12% | 241.9 -2% | 226 5% | 251 -6% | 206 ? 13% | 254 ? -7% |
* ... mindre är bättre
Energy consumption Witcher 3 / Stress test
Energy consumption with external monitor
Batteriets livslängd
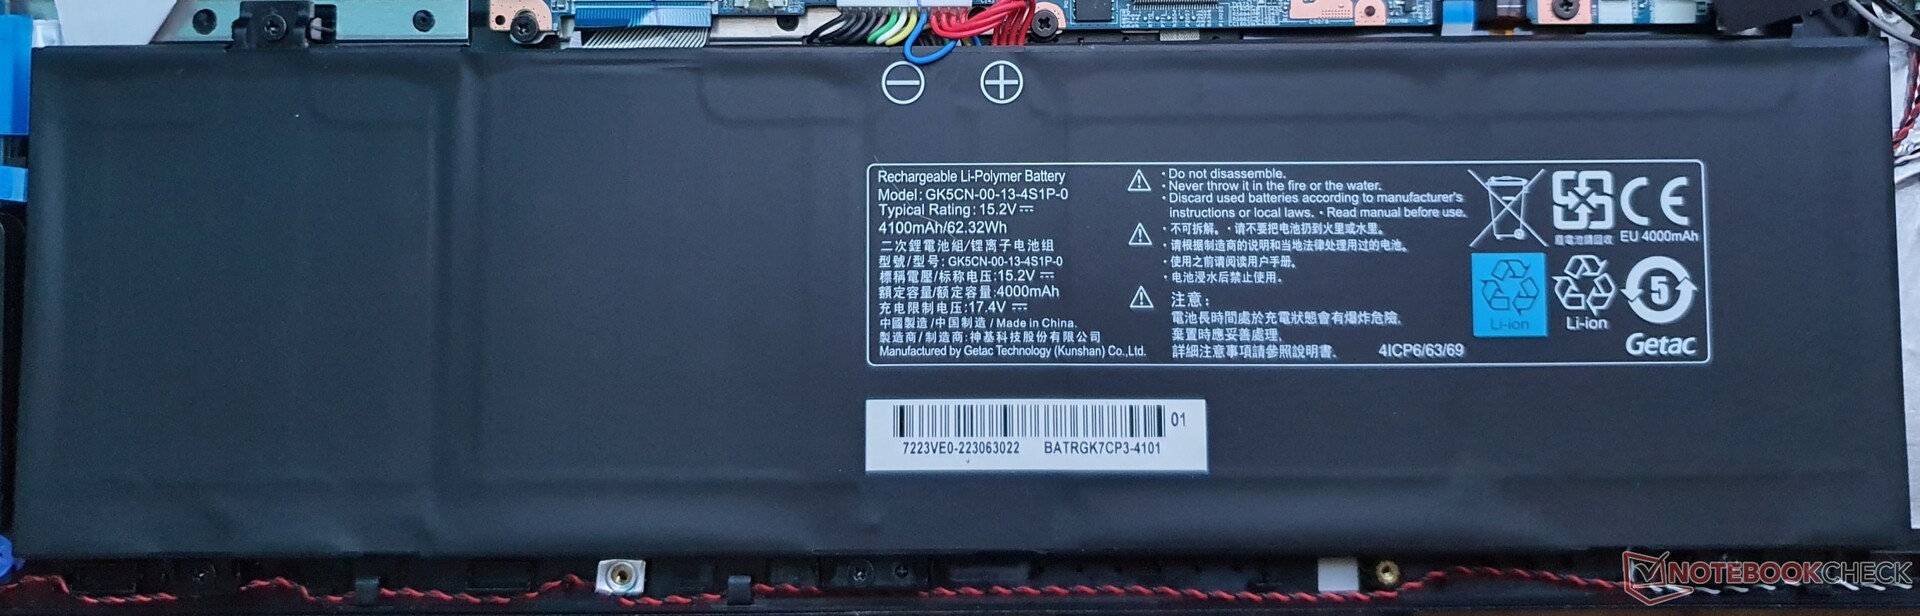
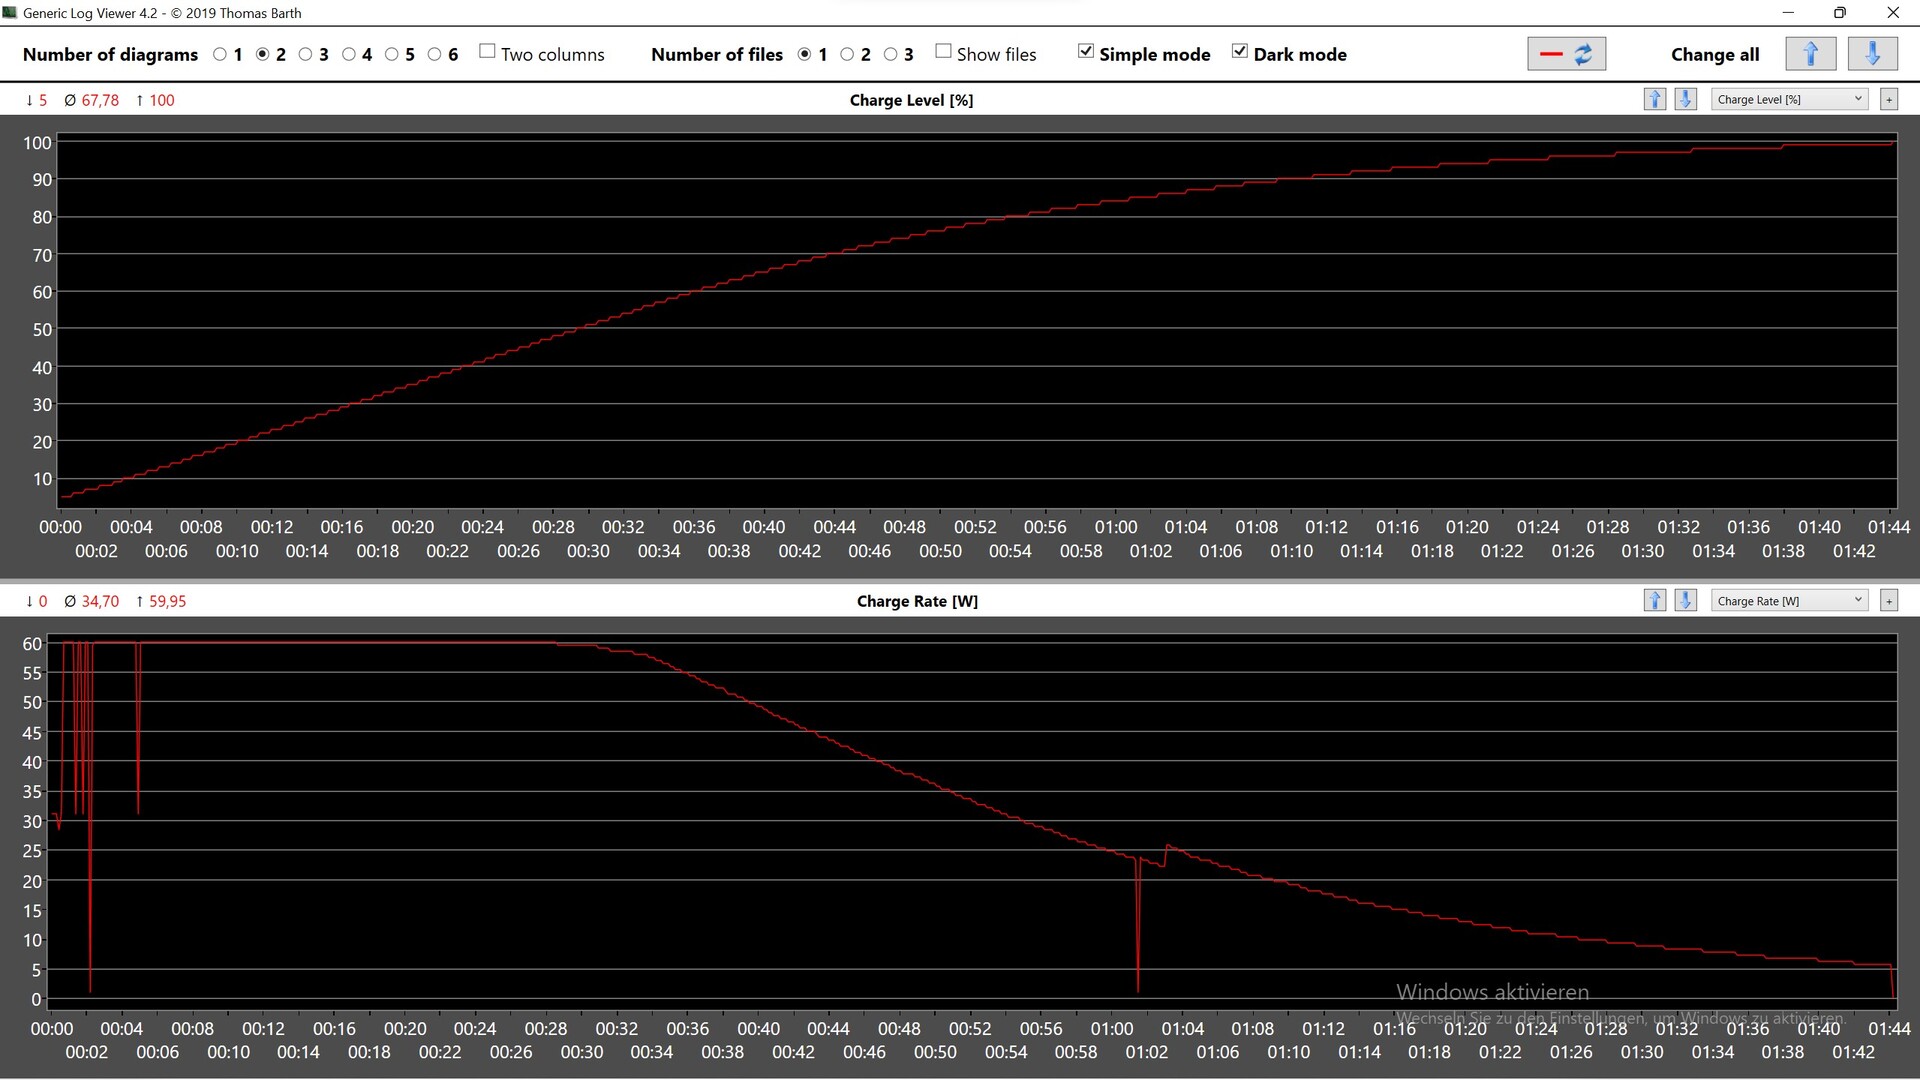
Trots det lilla 62 Wh-batteriet är drifttiden på 7:45 timmar, till exempel när du surfar på webben vid 150 cd/m², ganska hygglig. Vi testade i Enthusiast-läget , medan uppdateringsfrekvensen automatiskt minskas till 60 Hz på batteriet.
XMG Core 15 håller alltså längst i vårt jämförelsefält och är en effektiv gamer, eftersom konkurrenterna alla förlitar sig på ännu större batterier, med 80 till 93 Wh. Batteriet laddas till hälften på 30 minuter.
| Schenker XMG Core 15 (M22) R7 6800H, GeForce RTX 3060 Laptop GPU, 62 Wh | Lenovo Legion 5 15IAH7H 82RB i7-12700H, GeForce RTX 3060 Laptop GPU, 80 Wh | Schenker XMG Fusion 15 (Mid 22) i7-11800H, GeForce RTX 3070 Laptop GPU, 93.48 Wh | Asus TUF Gaming F15 FX507ZM i7-12700H, GeForce RTX 3060 Laptop GPU, 90 Wh | Alienware m15 R5 Ryzen Edition R7 5800H, GeForce RTX 3060 Laptop GPU, 86 Wh | Schenker XMG Core 15 Ampere R7 4800H, GeForce RTX 3060 Laptop GPU, 62 Wh | Genomsnitt av klass Gaming | |
|---|---|---|---|---|---|---|---|
| Batteridrifttid | -18% | 30% | -19% | -27% | -9% | 12% | |
| WiFi v1.3 (h) | 7.8 | 5 -36% | 7.4 -5% | 4.8 -38% | 5.1 -35% | 5.8 -26% | 6.96 ? -11% |
| Load (h) | 1.1 | 1.1 0% | 1.8 64% | 1.1 0% | 0.9 -18% | 1.2 9% | 1.47 ? 34% |
| H.264 (h) | 7.5 | 8.8 | 6 | 8.28 ? | |||
| Witcher 3 ultra (h) | 1.6 |
För
Emot
Domslut: Snabb Schenker gaming laptop med RTX 3060
På det hela taget visar sig Schenkers XMG Core 15 vara en solid spelare i övre mellanklassen. 3D-prestandan är på en nivå över genomsnittet, men vissa modeller med samma TGP, som Asus TUF Gaming eller Asus ROG Strix Scar, är ännu snabbare. AMD Ryzen 7 6800H bidrar åtminstone till sparsam drift, även om den släpar (minimalt) efter Intel-rivalerna med i7-12700H.
Trots det lilla 62 Wh-batteriet uppnår den kompakta bärbara speldatorn den längsta batteritiden på 7:45 h i vårt jämförelsefält, medan den matta WQHD-skärmen med 165 Hz och snabba svarstider också är mer än respektabel. Tyst spelande är möjligt utan större prestandaförluster tack vare det balanserade läget, men spelglädjen är mycket begränsad långt från eluttaget.
De som kan klara sig utan USB4, Power Delivery och spelande på batteri får en solid och potentiellt tyst mellanklassgamer med vattenkylning som tillval för 1 817 euro (~1935 dollar).
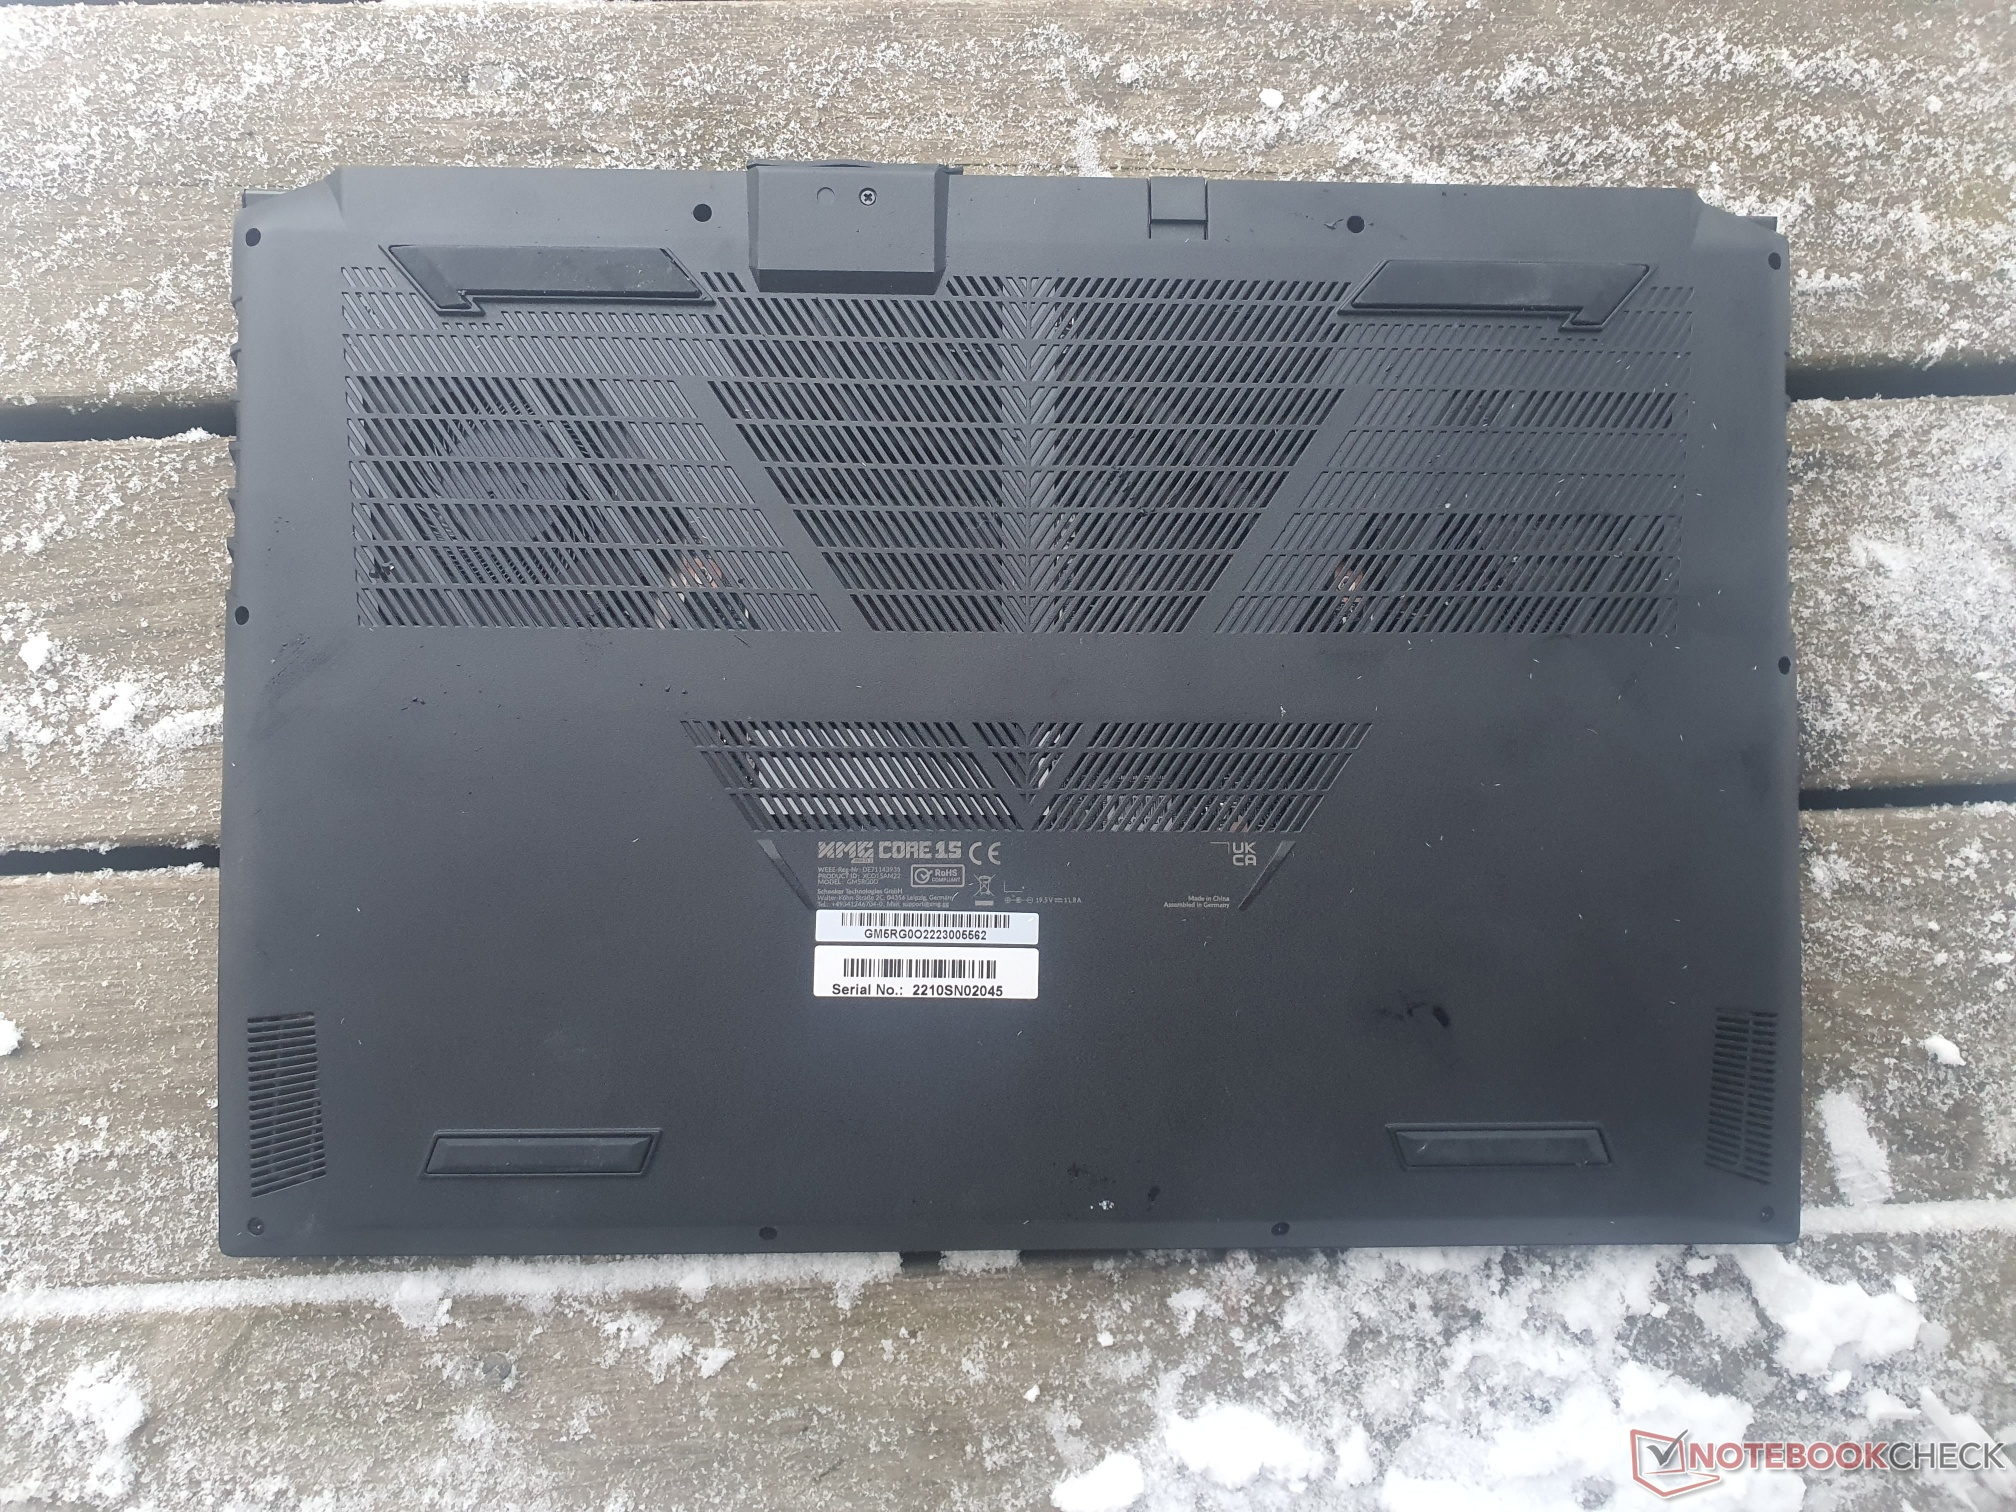
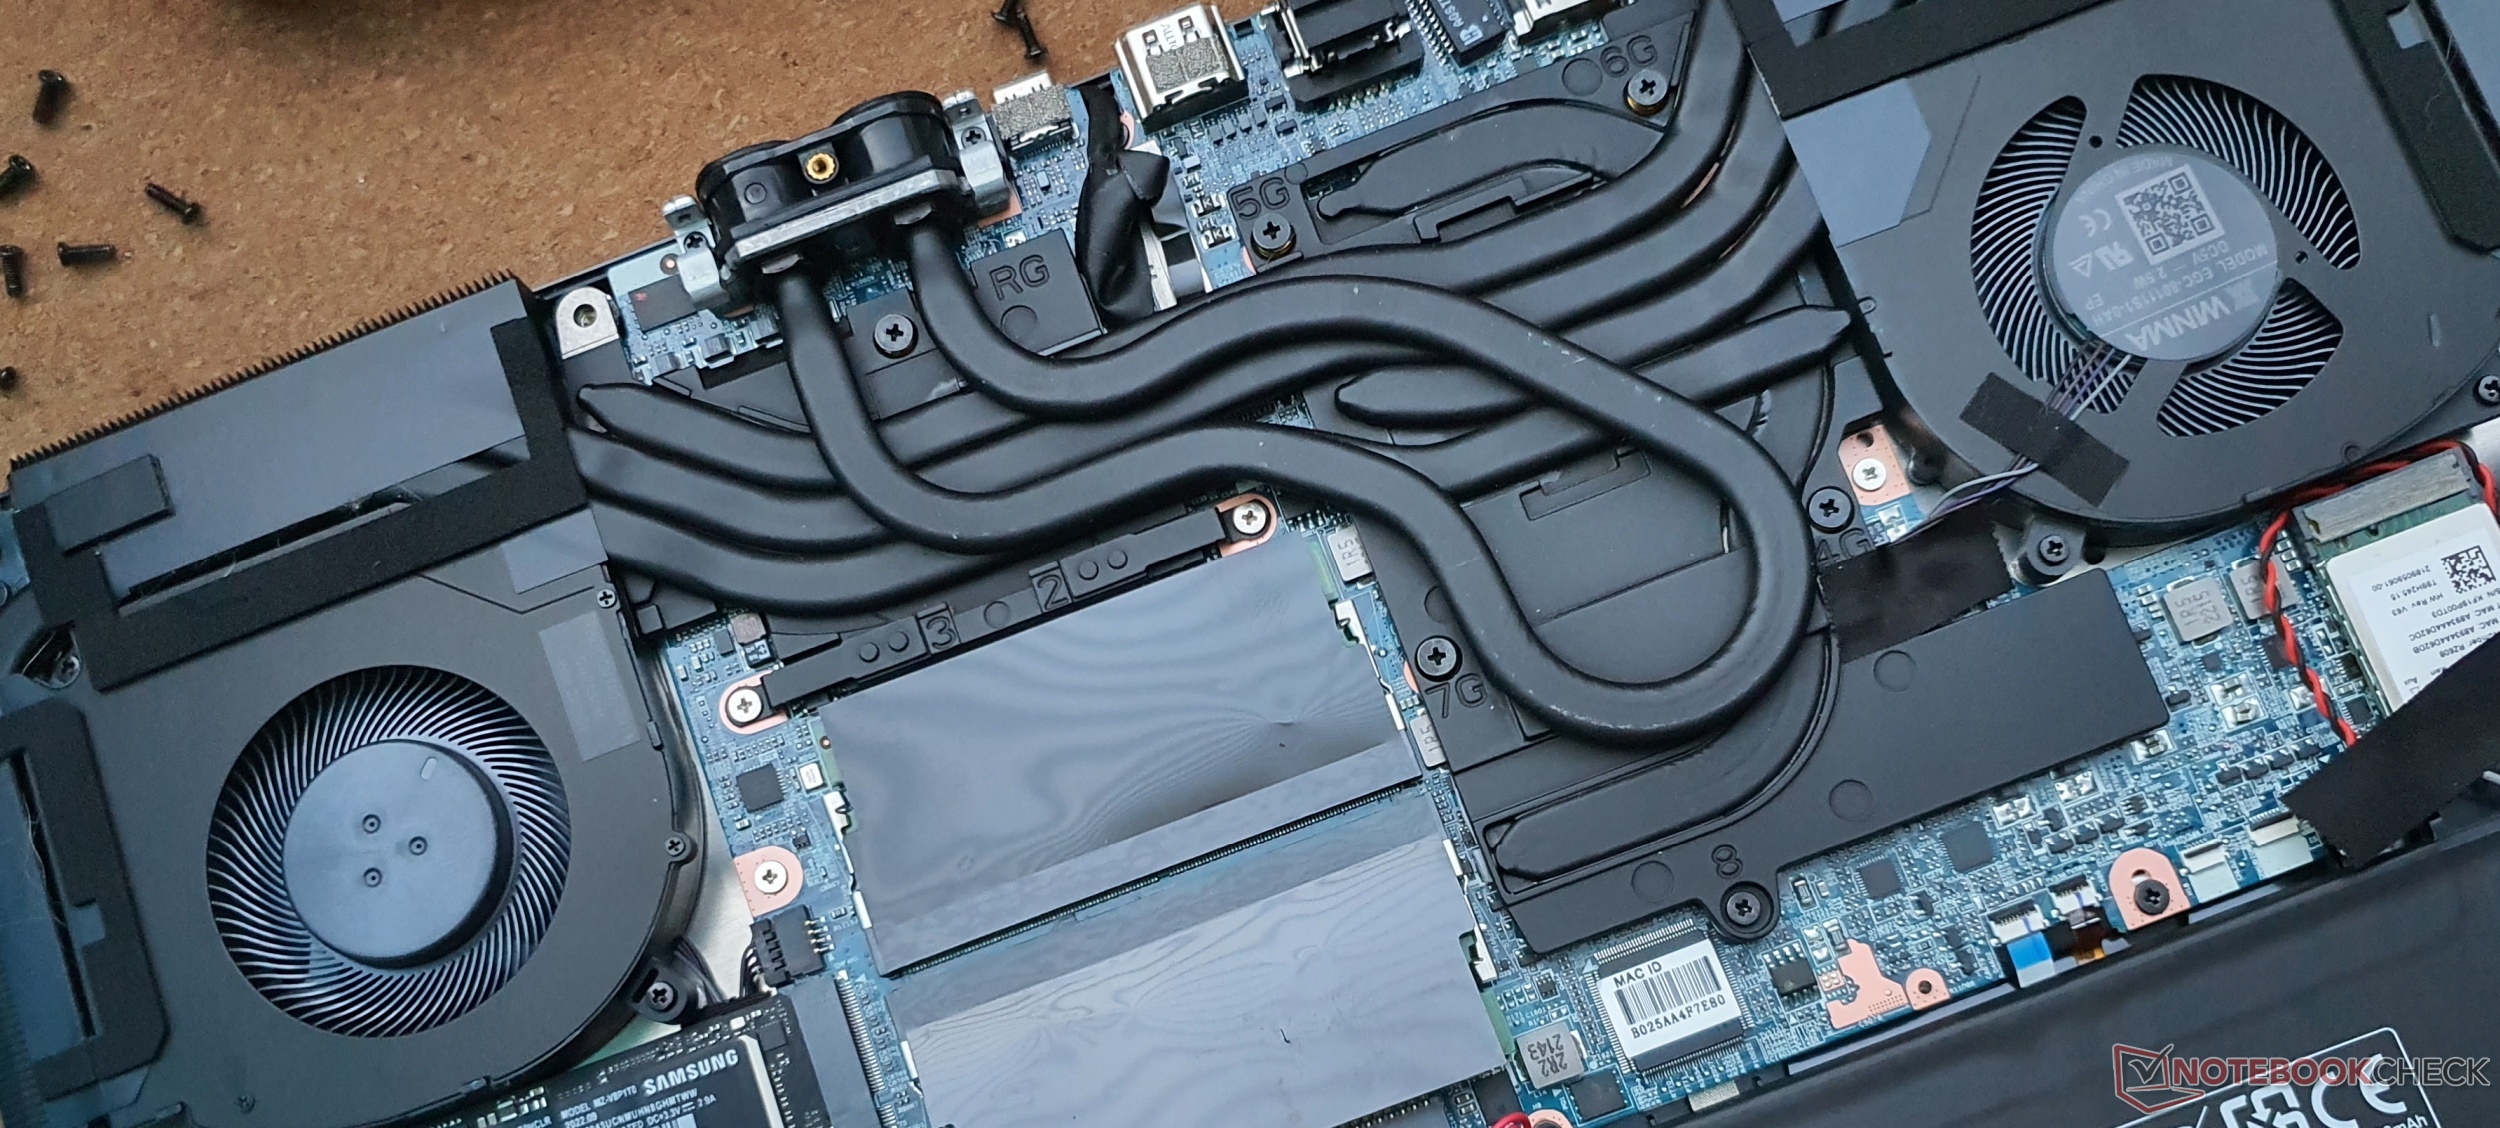
Underhållet görs enkelt eftersom det finns två M.2-2280-platser för PCIe 4.0 SSD-diskar, plus två RAM-platser, och den något långsamma WiFi-modulen kan också bytas ut. Per-Key RGB och Advanced Optimus måste man avstå från, men en MUX-switch finns tillgänglig liksom möjligheten att överklocka GPU:n.
Lenovos Legion 5 Pro erbjuder en potentiellt snabbare RTX 3070, en ljusare och större 16:10-skärm och det bättre tangentbordet till ett liknande pris. XMG Fusion 15 från Lenovo erbjuder ett ännu bättre eftersom det är mekaniskt. Legion Slim 7i är också en rekommendation, eftersom den redan finns tillgänglig för 1 529 euro (~1629 dollar) i en liknande konfiguration vid tidpunkten för denna recension.
.
Pris och tillgänglighet
Schenkers XMG Core 15 (M22) erbjuds för närvarande i den testade konfigurationen för 1 817 euro (~$1935) hos Bestware. Den för närvarande billigaste modellen med samma CPU+GPU, men mindre minne och FHD 144 Hz-panel finns för så lite som 1492 euro (~1589$).
Schenker XMG Core 15 (M22)
- 01/02/2023 v7 (old)
Marvin Gollor
Price comparison
