Recension av Schenker XMG Fusion 15 (Mitten av 22) - Lätt laptop med RTX 3070 och bra batteritid
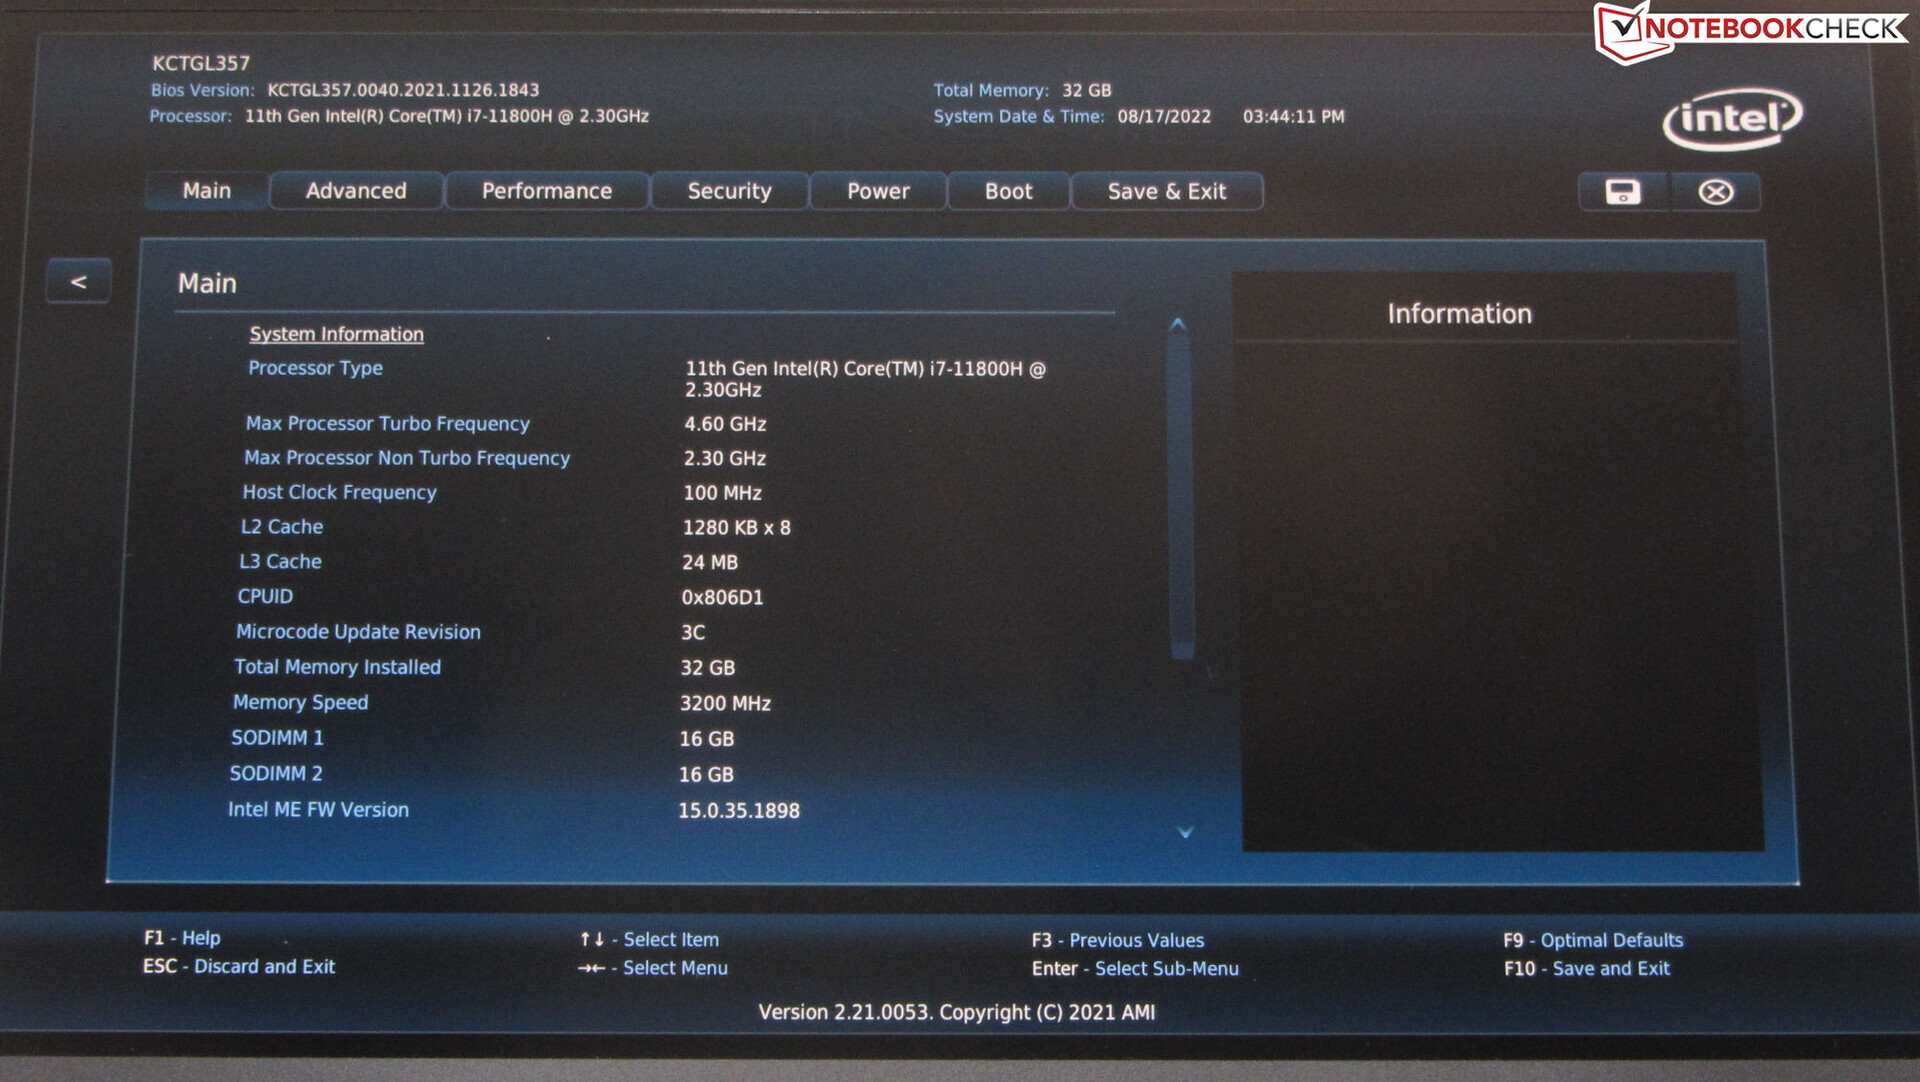
Schenker XMG Fusion 15 är främst en bärbar dator för spel, men den är också utformad för den kreativa sektorn. Enheten erbjuder en kompromiss mellan prestanda, liten storlek och bärbarhet: Högklassig hårdvara (Core i7-11800H,GeForce Bärbar dator RTX 3070) paras ihop med ett 93 Wh-batteri och packas i ett kompakt hölje. Hela paketet väger strax under 2 kg. En barebone från Intel (NUC X15 Laptop Kit C71FBF) tjänar som bas för Fusion.
Dess konkurrenter är liknande kompakta och lätta enheter som t.ex Razer Blade 15 basmodell, denMSI Delta 15ochAsus TUF Dash F15 FX517ZR. I den bredare gruppen av konkurrenter ingår bärbara datorer som t.ex Acer Nitro 5 AN515-58och HP Omen 16.
Potentiella konkurrenter i jämförelse
Gradering | Datum | Modell | Vikt | Höjd | Storlek | Upplösning | Pris |
|---|---|---|---|---|---|---|---|
| 87.4 % v7 (old) | 08/2022 | Schenker XMG Fusion 15 (Mid 22) i7-11800H, GeForce RTX 3070 Laptop GPU | 1.9 kg | 21.65 mm | 15.60" | 2560x1440 | |
| 85.8 % v7 (old) | 07/2022 | Asus TUF Dash F15 FX517ZR i7-12650H, GeForce RTX 3070 Laptop GPU | 2 kg | 20.7 mm | 15.60" | 2560x1440 | |
| 84 % v7 (old) | 06/2022 | Acer Nitro 5 AN515-58-72QR i7-12700H, GeForce RTX 3070 Ti Laptop GPU | 2.5 kg | 26.8 mm | 15.60" | 2560x1440 | |
| 85.5 % v7 (old) | 05/2022 | HP Omen 16-b1090ng i7-12700H, GeForce RTX 3070 Ti Laptop GPU | 2.3 kg | 23 mm | 16.10" | 2560x1440 | |
| 82.9 % v7 (old) | 12/2021 | MSI Delta 15 A5EFK R9 5900HX, Radeon RX 6700M | 2 kg | 19 mm | 15.60" | 1920x1080 | |
| 85.5 % v7 (old) | 04/2021 | Razer Blade 15 Base Edition 2021, i7-10750H RTX 3060 i7-10750H, GeForce RTX 3060 Laptop GPU | 2.1 kg | 19.9 mm | 15.60" | 1920x1080 |
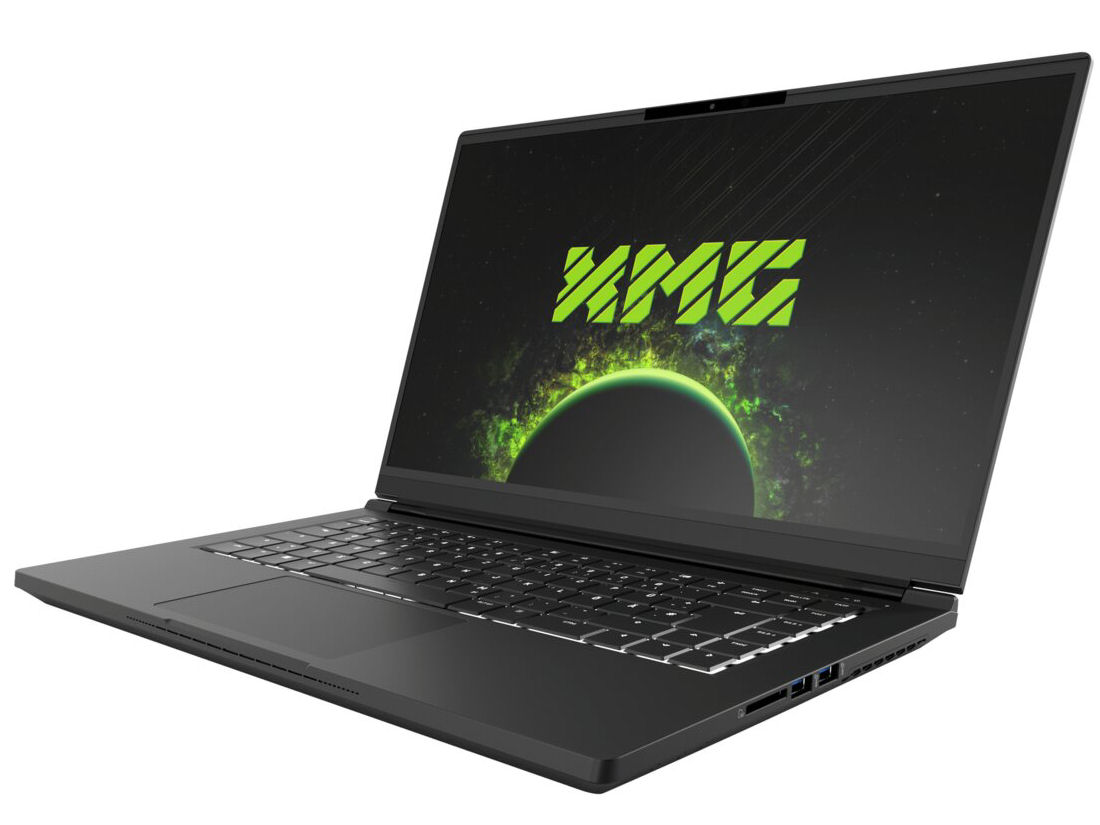
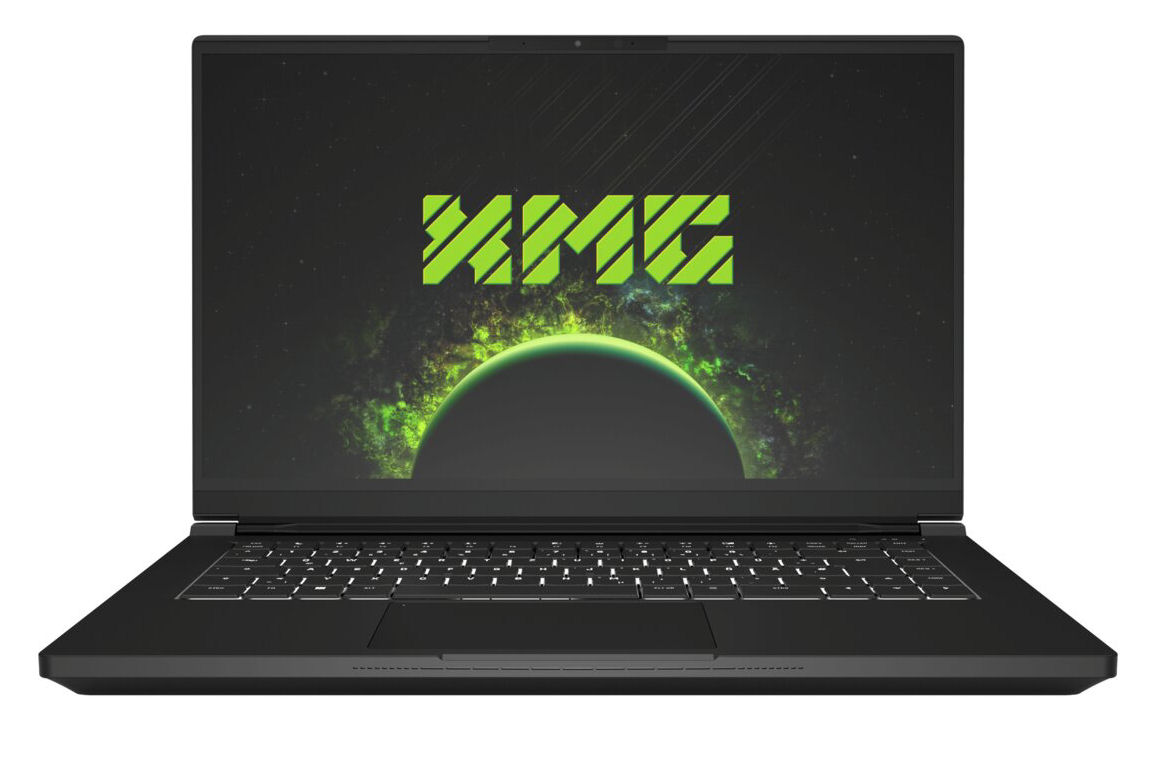
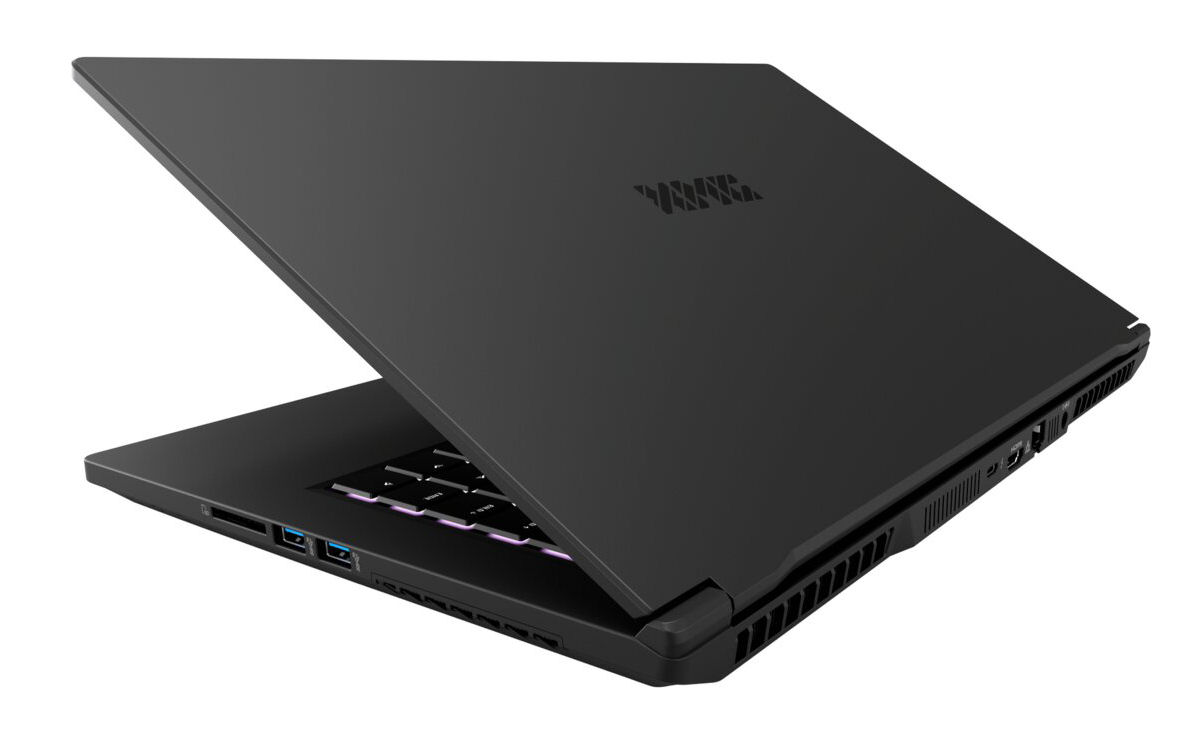
Hölje - Ett magnesiumchassi för Fusion
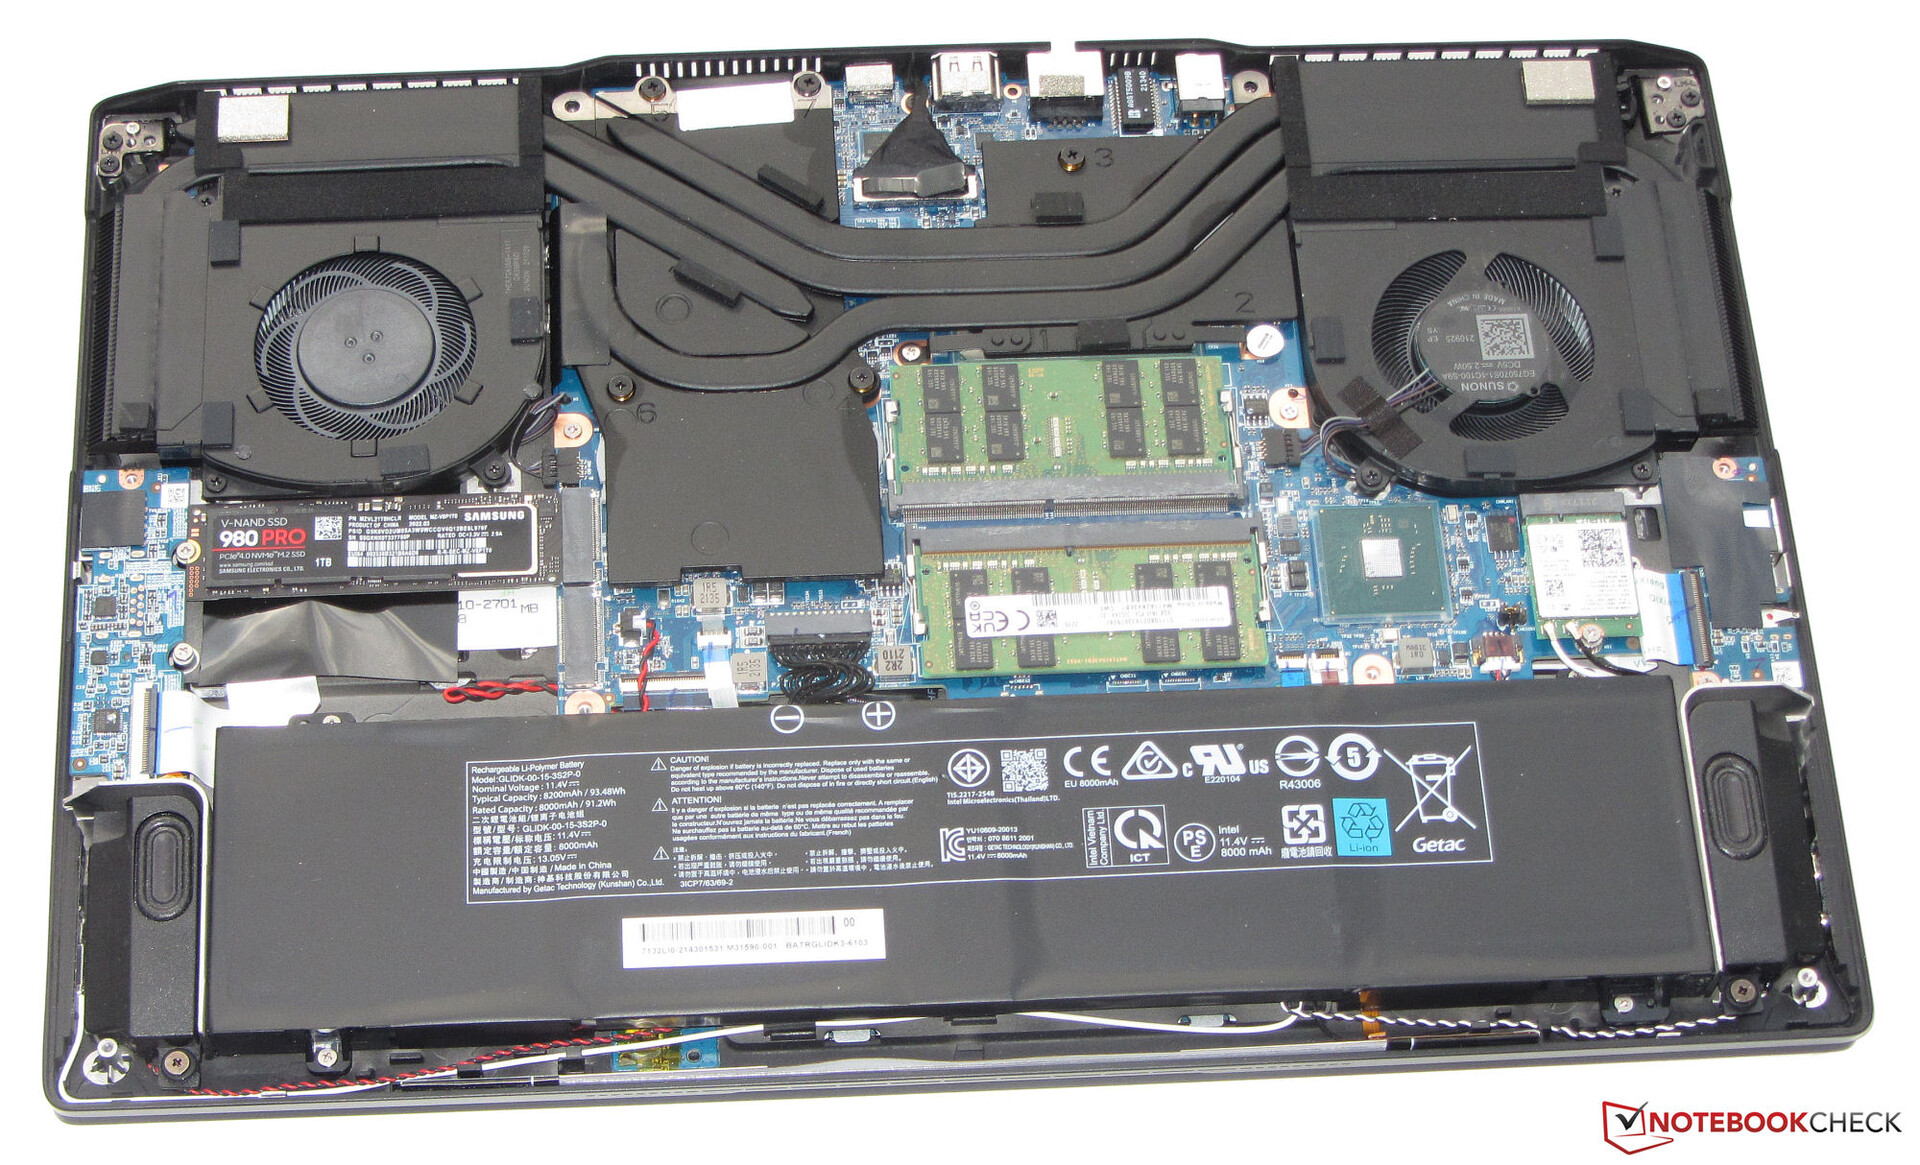
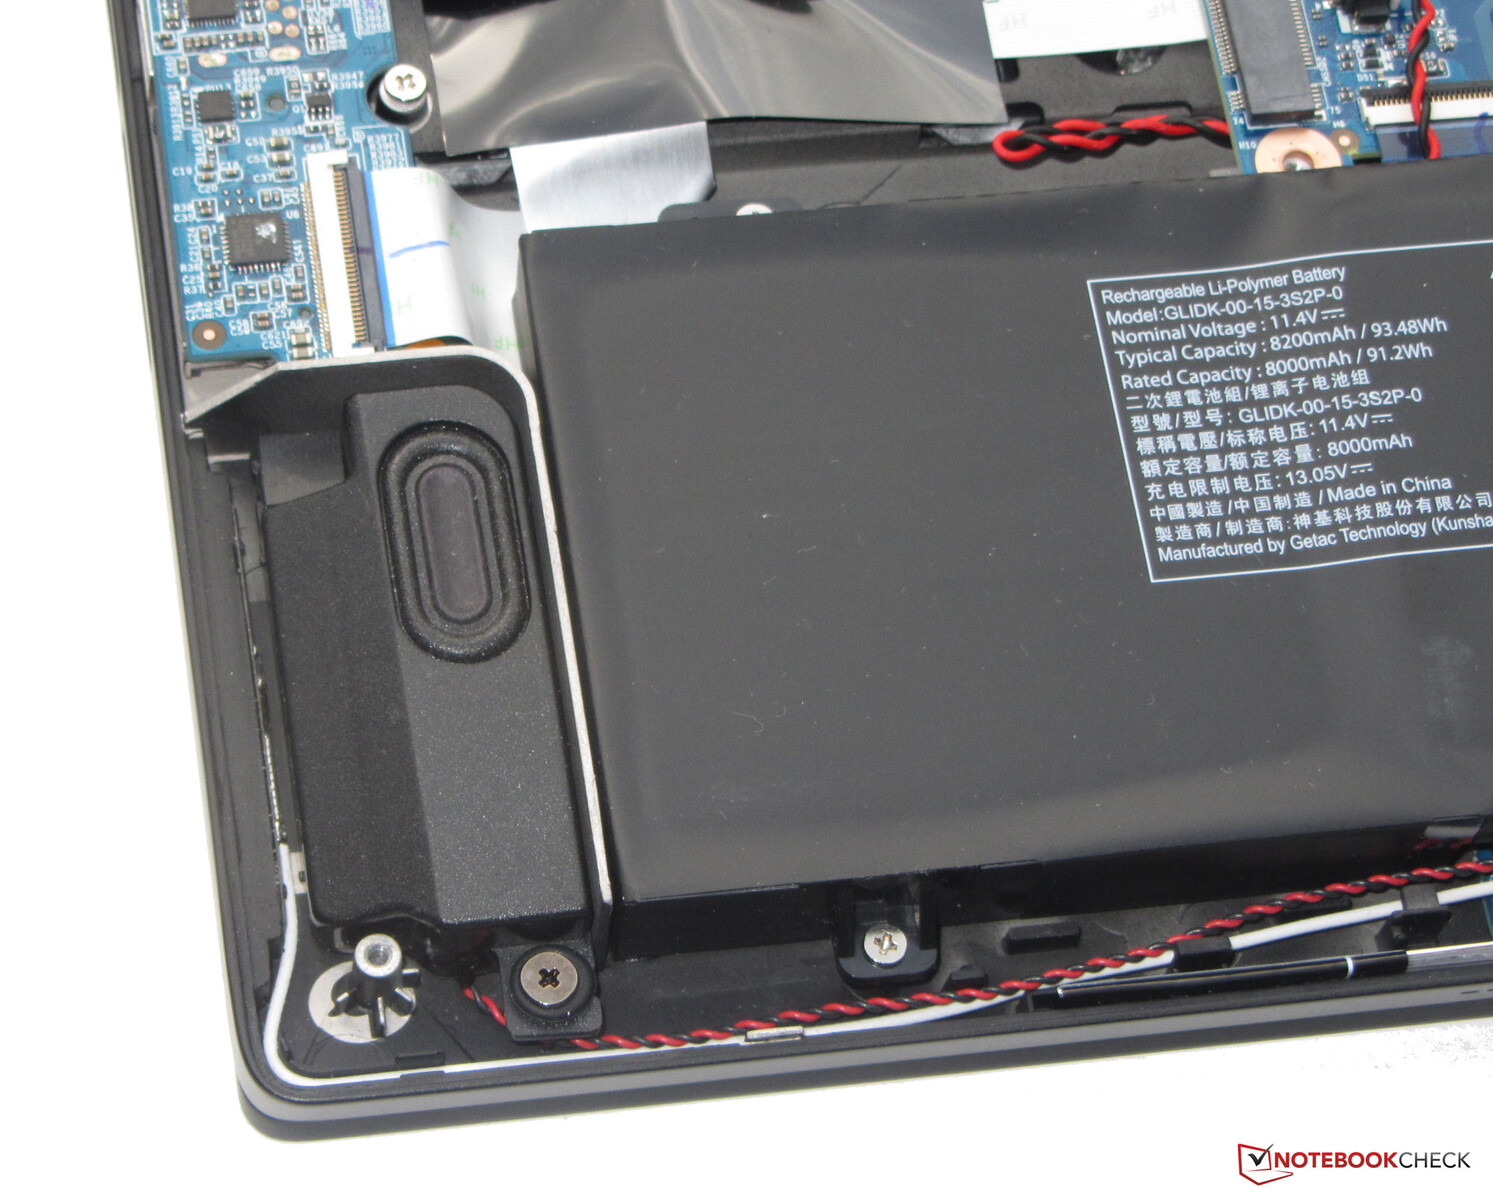
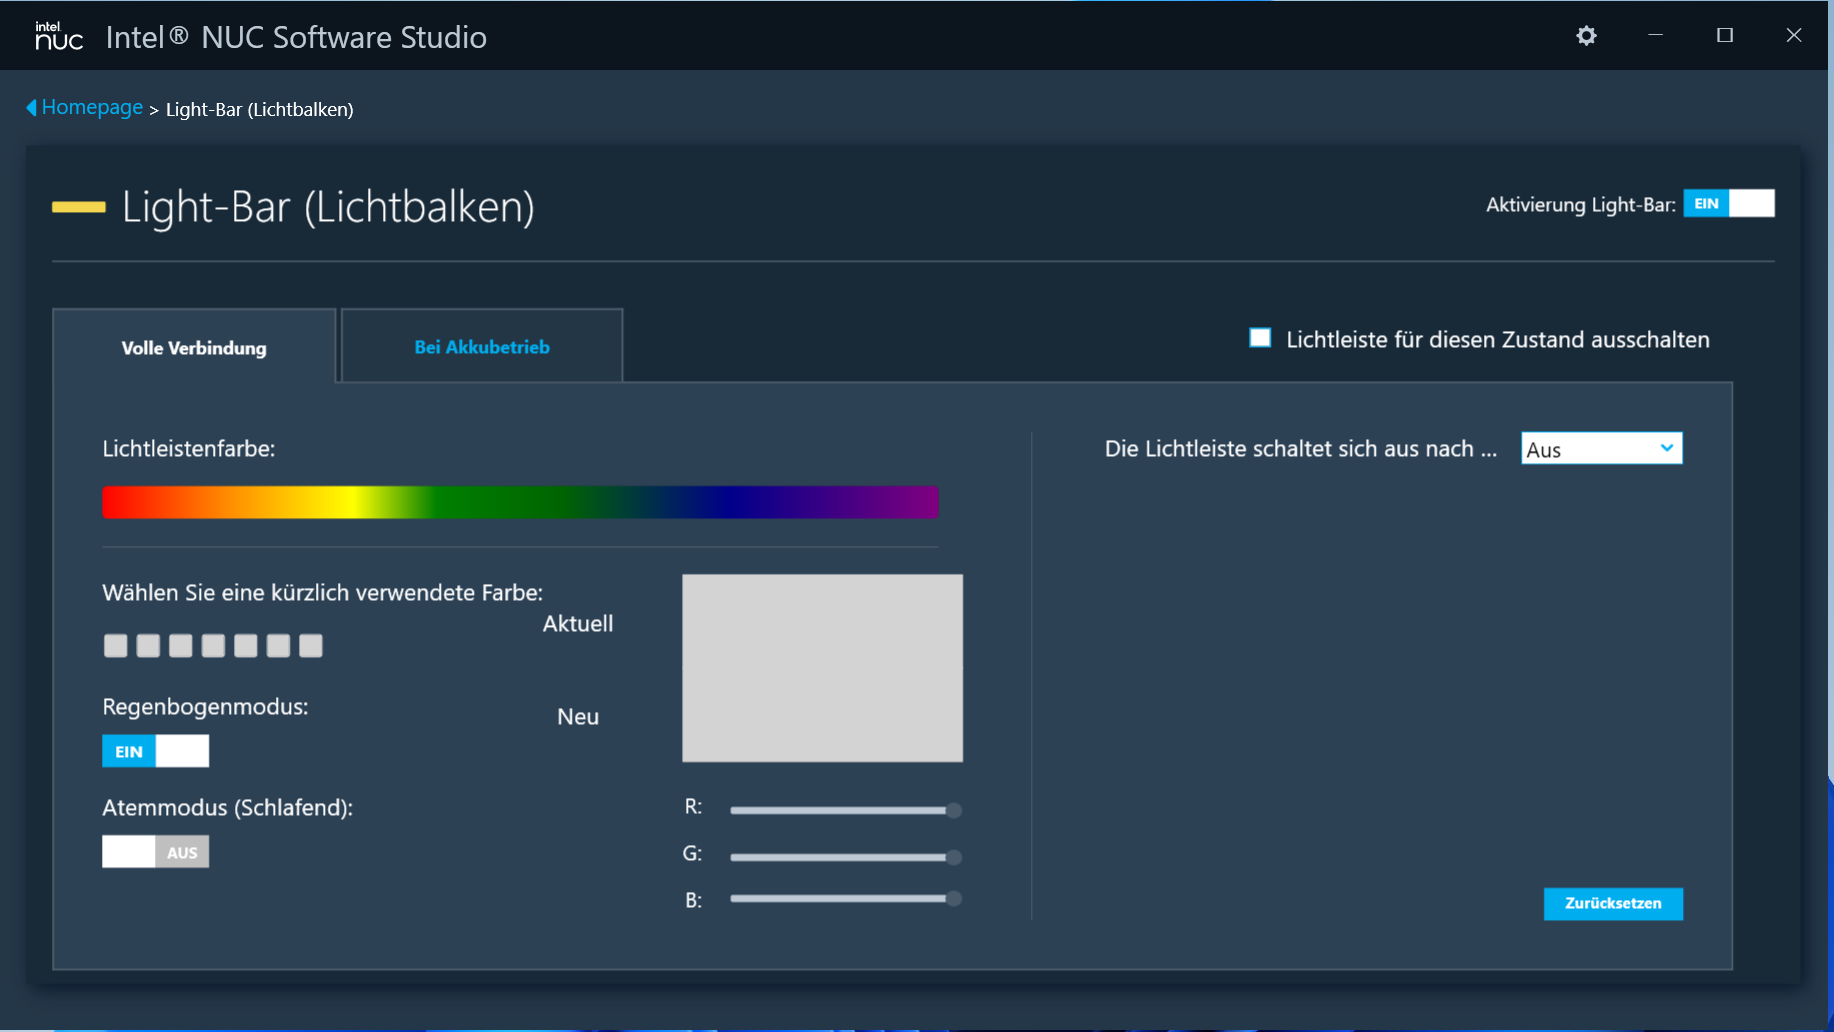
Det mattsvarta höljet är tillverkat av en magnesiumlegering och har en snygg, enkel design. Schenker väljer släta ytor. En konfigurerbar LED-remsa (RGB) på väskans sida som är vänd mot användaren ger lite färg utöver tangentbordsbelysningen. Batteriet är inbyggt i enheten (skruvat, inte limmat). Du kan komma åt insidan efter att ha tagit bort det nedre locket.
Den bärbara datorn uppvisar inga tillverkningsfel. Spaltmåtten är korrekta och det finns inga materialutsprång att hitta. Basenheten kan knappast böjas, men locket kan böjas. Gångjärnen håller locket stadigt på plats, och den maximala öppningsvinkeln är 180 grader. Det är möjligt att öppna locket med en hand.

Fusion kan inte riktigt mäta sig med de kompakta dimensionerna hos Blade 15, men den är 200 gram lättare än den. Det gör den till den lättaste enheten i jämförelsefältet
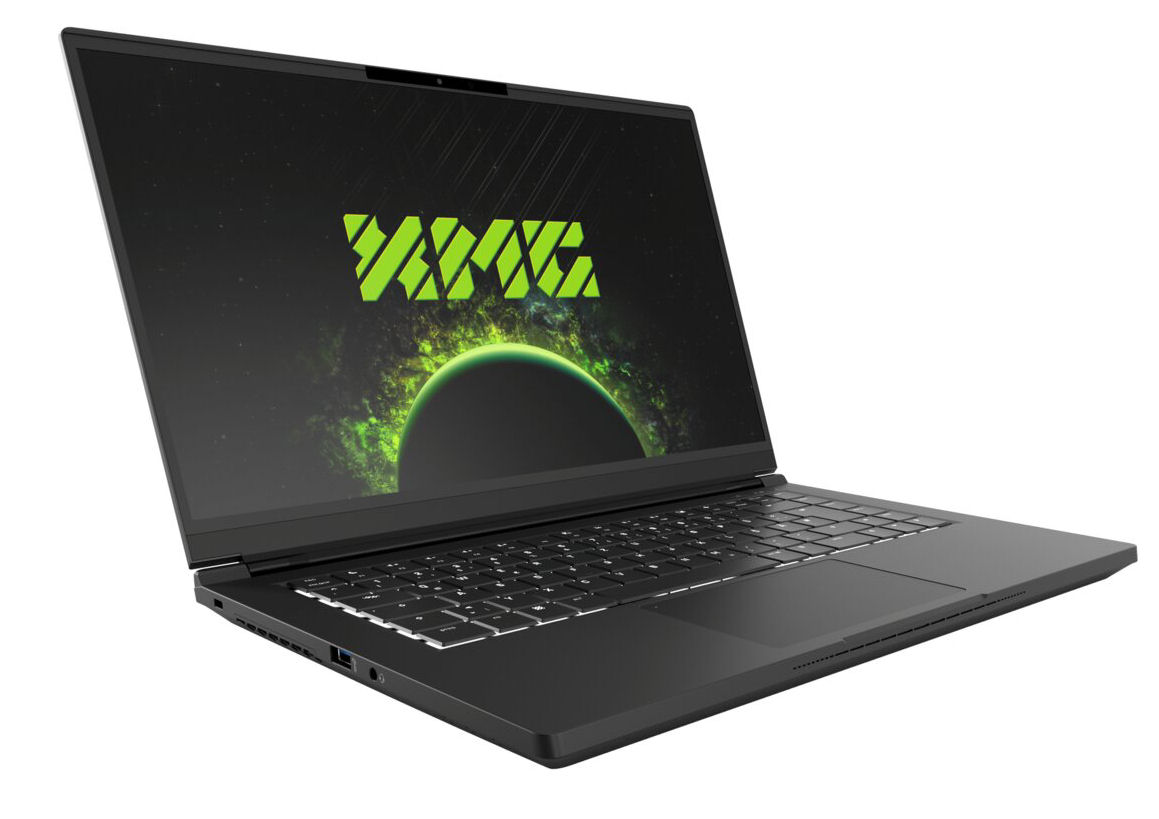
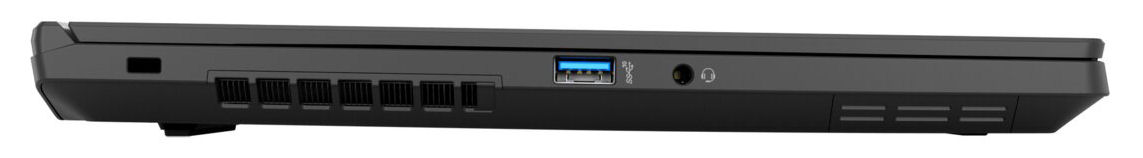
Anslutningar - XMG 15 är utrustad med Thunderbolt 4
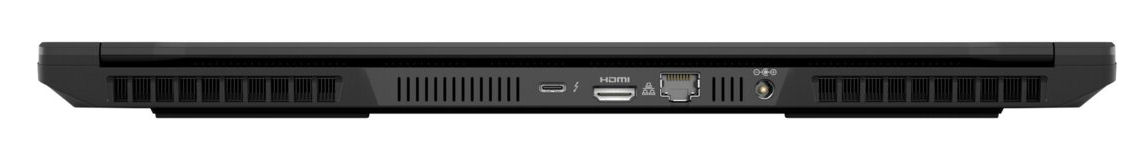
Fusion har tre USB-A-portar (USB 3.2 Gen 2) och en USB-C-port (Thunderbolt 4). Den sistnämnda stöder DisplayPort via USB-C. Sammantaget erbjuder den bärbara datorn två videoutgångar (1x DP, 1x HDMI). Dessutom finns det ett kombinerat ljuduttag, en Gigabit Ethernet-port och en plats för ett kabellås.
Portarna är fördelade på tre sidor av den bärbara datorn. Bra: Videoutgångarna, Ethernet-porten och strömanslutningen är placerade på baksidan av enheten. Därför löper motsvarande kablar mot baksidan och är inte i vägen.
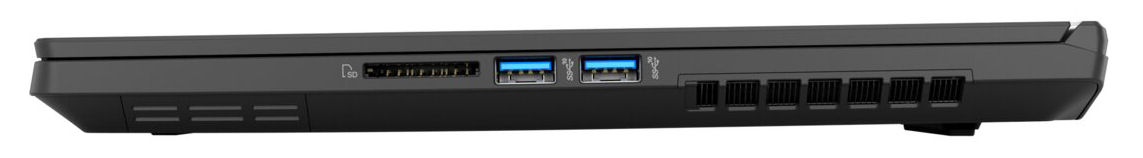
SD-kortläsare
Med en maximal överföringshastighet på 77 MB/s (överföring av 250 jpg-bildfiler på cirka 5 MB vardera) uppvisar SD-minneskortläsaren (referenskort: 128 GB AV PRO V60 microSD) medelhög hastighet
| SD Card Reader - average JPG Copy Test (av. of 3 runs) | |
| Genomsnitt av klass Gaming (20.9 - 210, n=54, senaste 2 åren) | |
| Schenker XMG Fusion 15 (Mid 22) (AV PRO microSD 128 GB V60) | |
| HP Omen 16-b1090ng (AV PRO microSD 128 GB V60) | |
Kommunikation
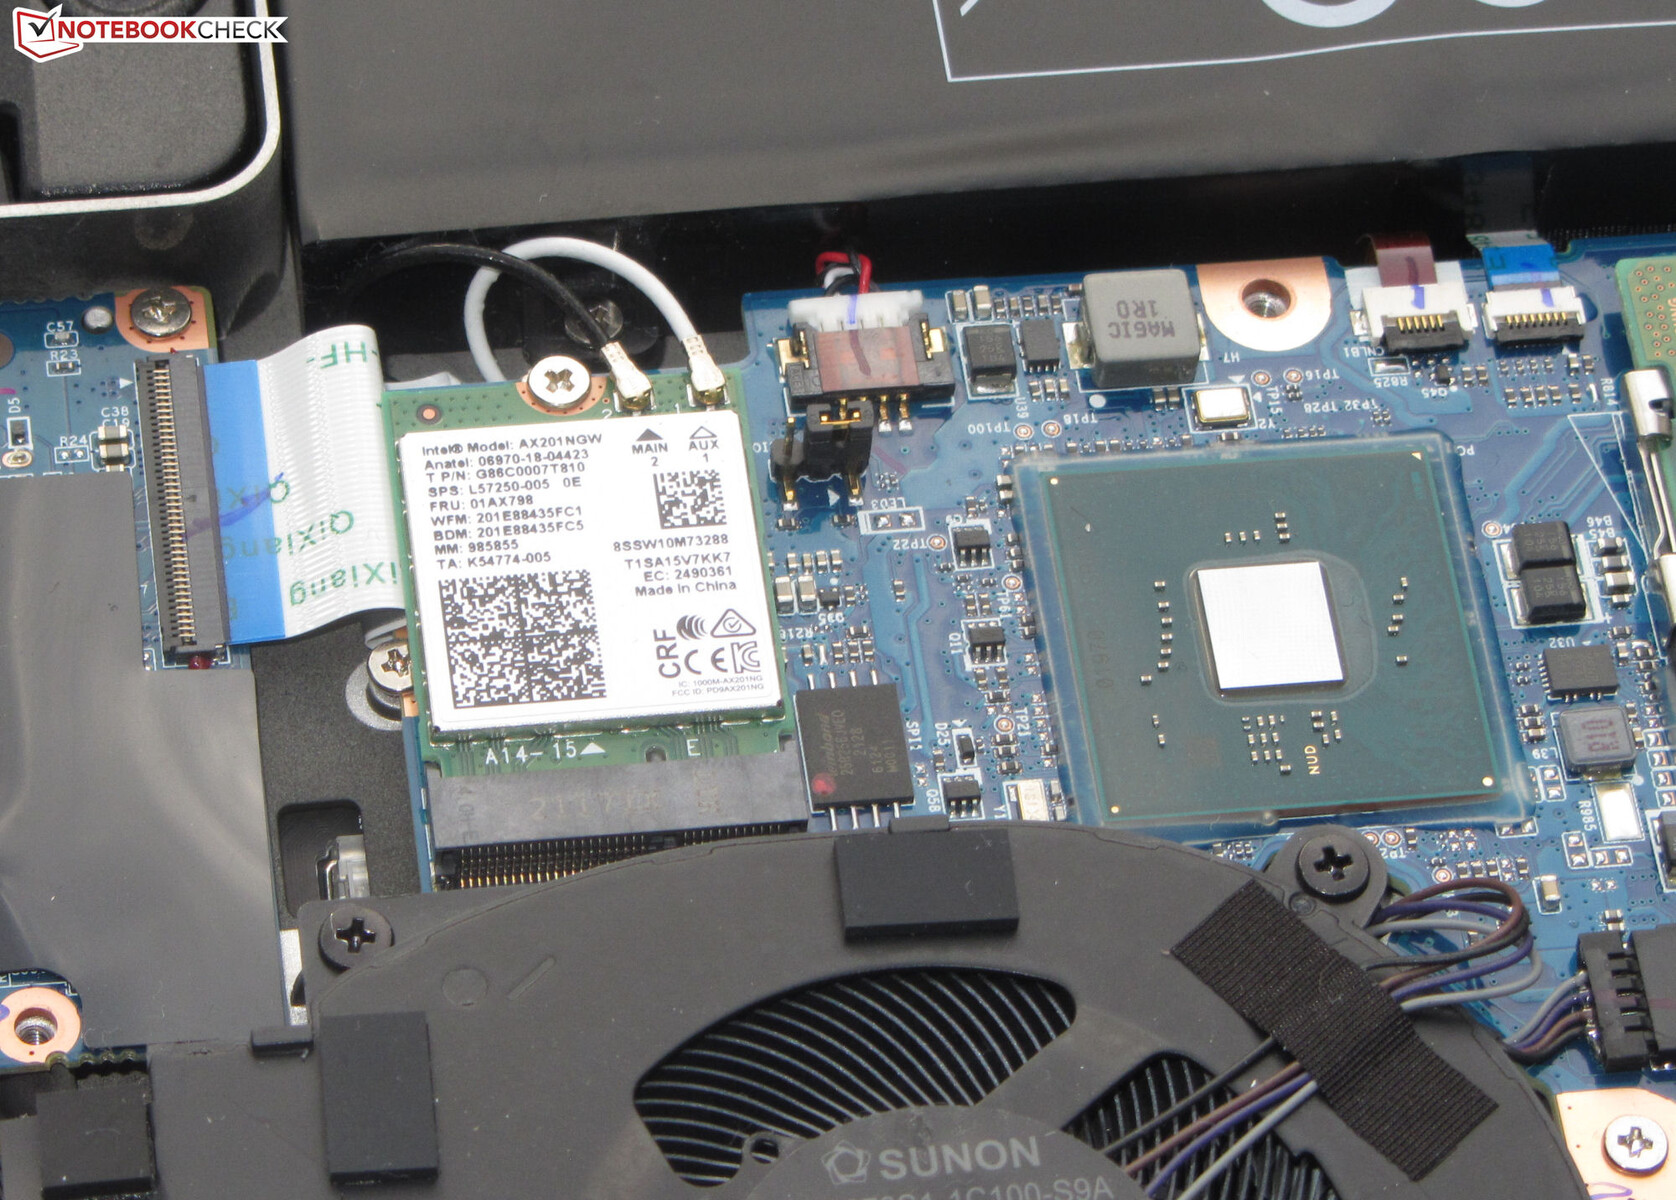
De överföringshastigheter som fastställts under optimala förhållanden (inga andra Wi-Fi-enheter i närheten, kort avstånd mellan den bärbara datorn och serverdatorn) är mycket bra och överensstämmer med Wi-Fi-chipets kapacitet (Intel AX201; 802.11ax). Ett Gigabit Ethernet-chip (Intel I225-V, 2,5 gigabit) hanterar trådbundna nätverksanslutningar
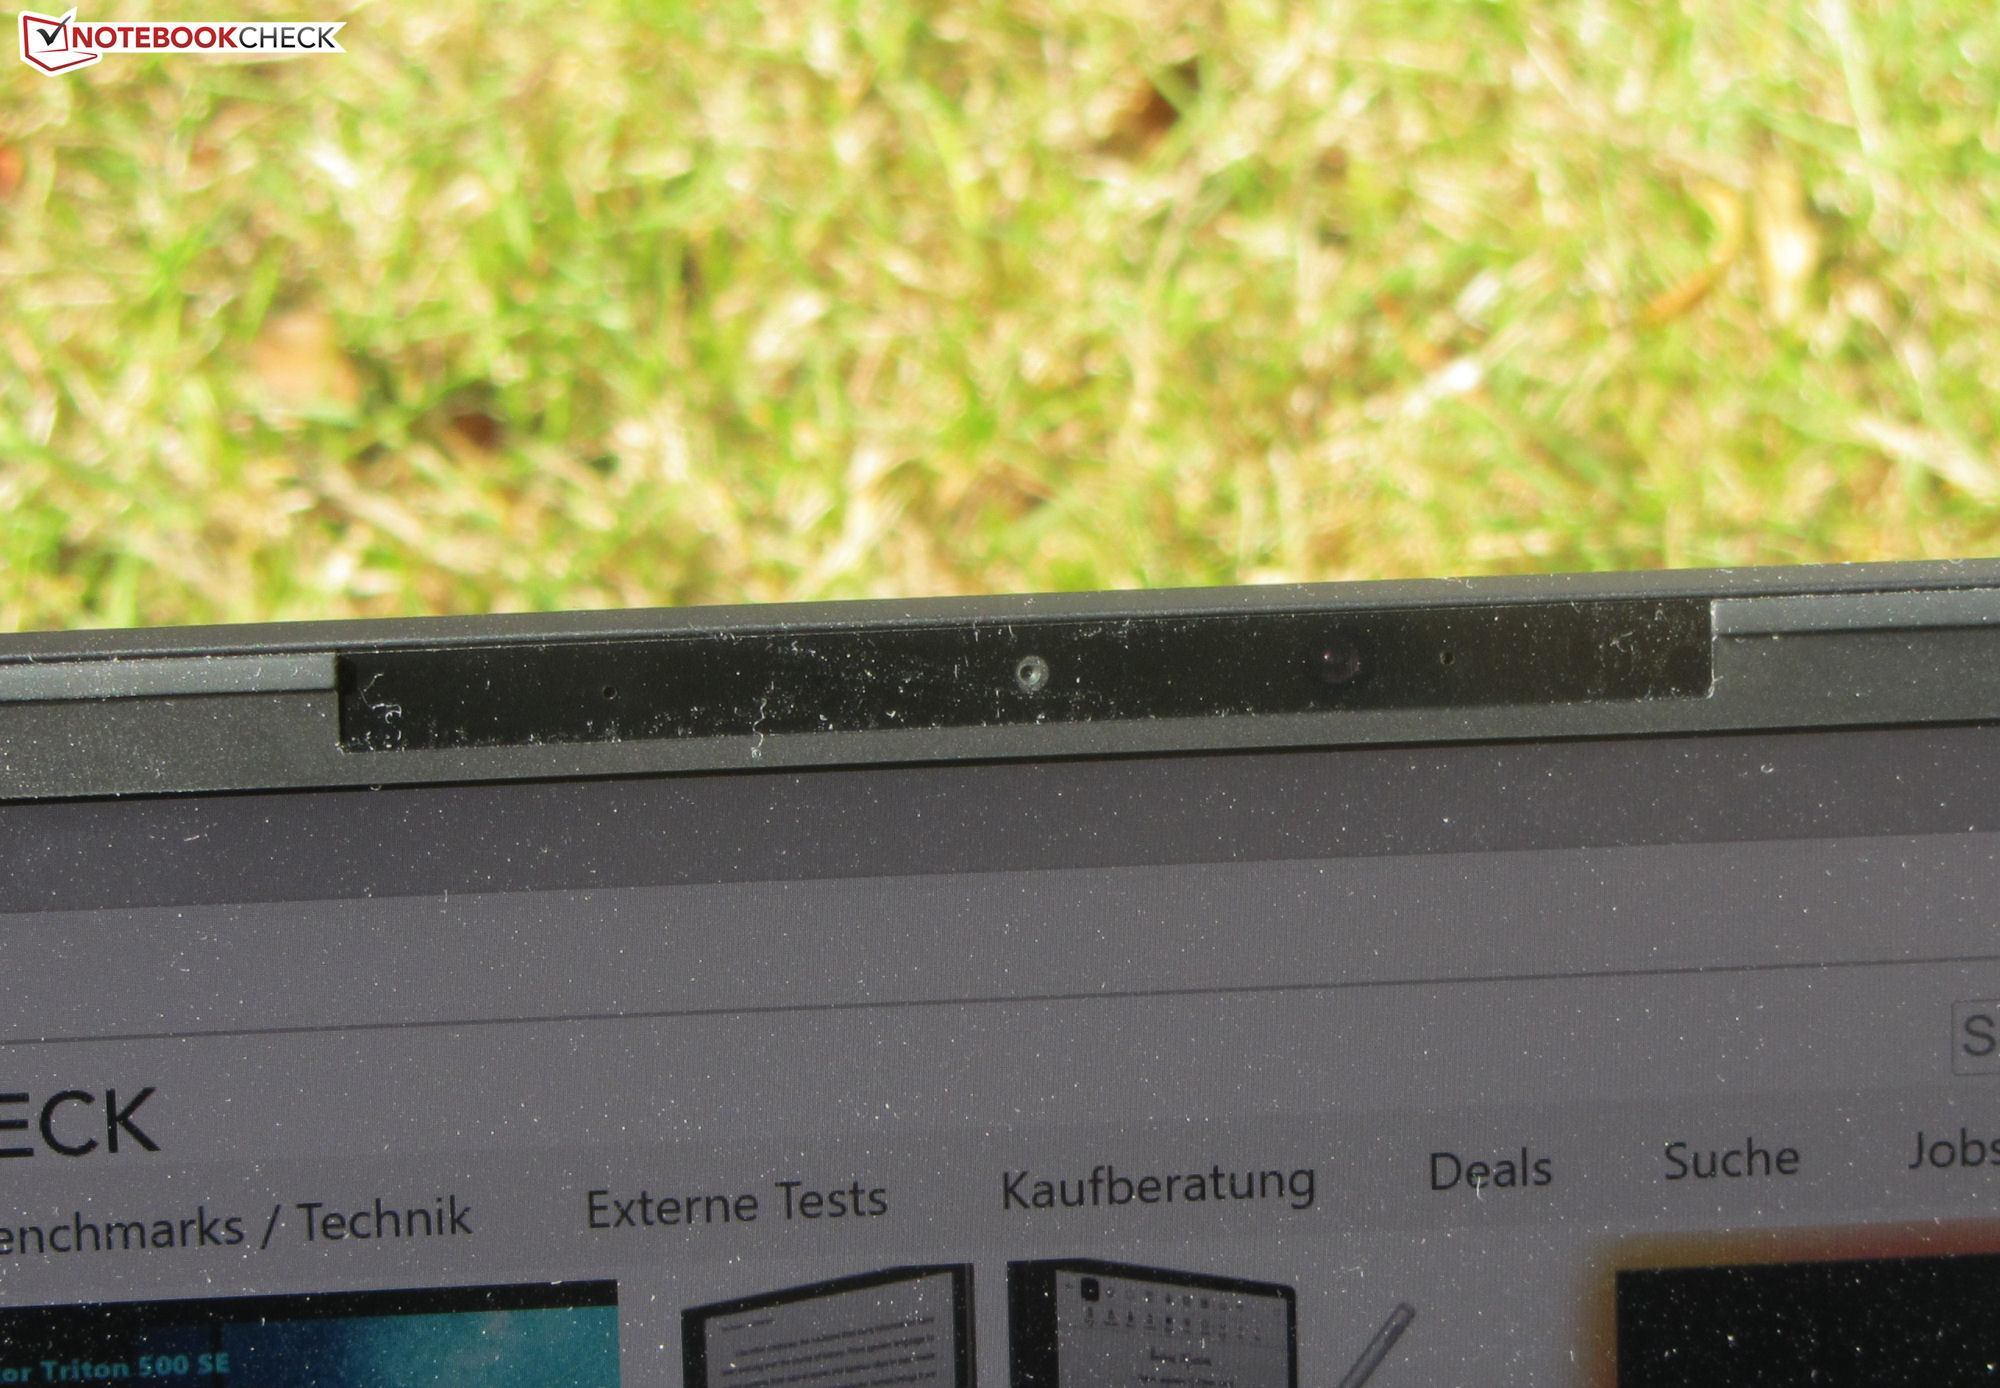
Webbkamera
Webbkameran (0,9 MP) ger bilder med en maximal upplösning på 1 280x720 pixlar. Det finns problem med färgprecisionen: Färgerna avviker från målet. Kameran har ingen mekanisk slutare

 GeForce RTX 3070 Laptop GPU, i7-11800H, Samsung SSD 980 Pro 1TB MZ-V8P1T0BW")
 GeForce RTX 3070 Laptop GPU, i7-11800H, Samsung SSD 980 Pro 1TB MZ-V8P1T0BW")
Tillbehör
Förutom garantiinformation och en tryckt bruksanvisning levereras den bärbara datorn med ett USB-minne (drivrutiner, instruktioner), klistermärken och en musmatta
Underhåll
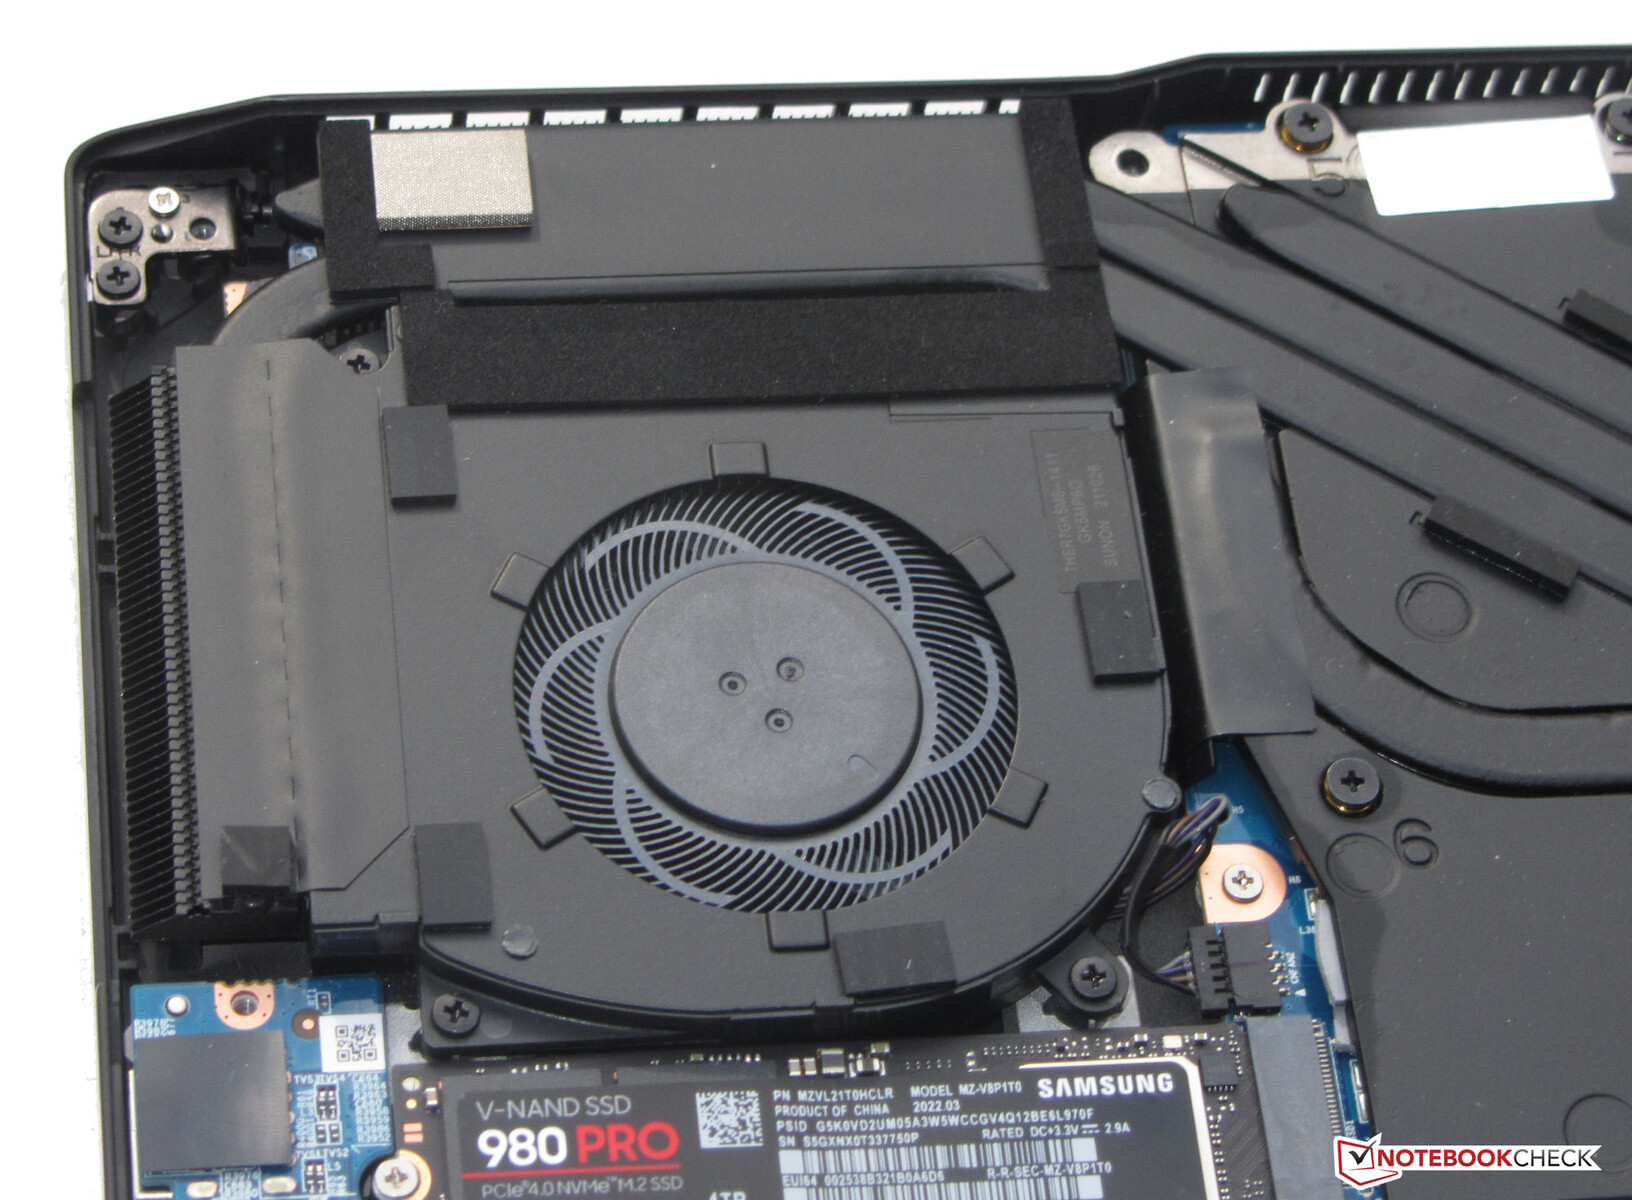
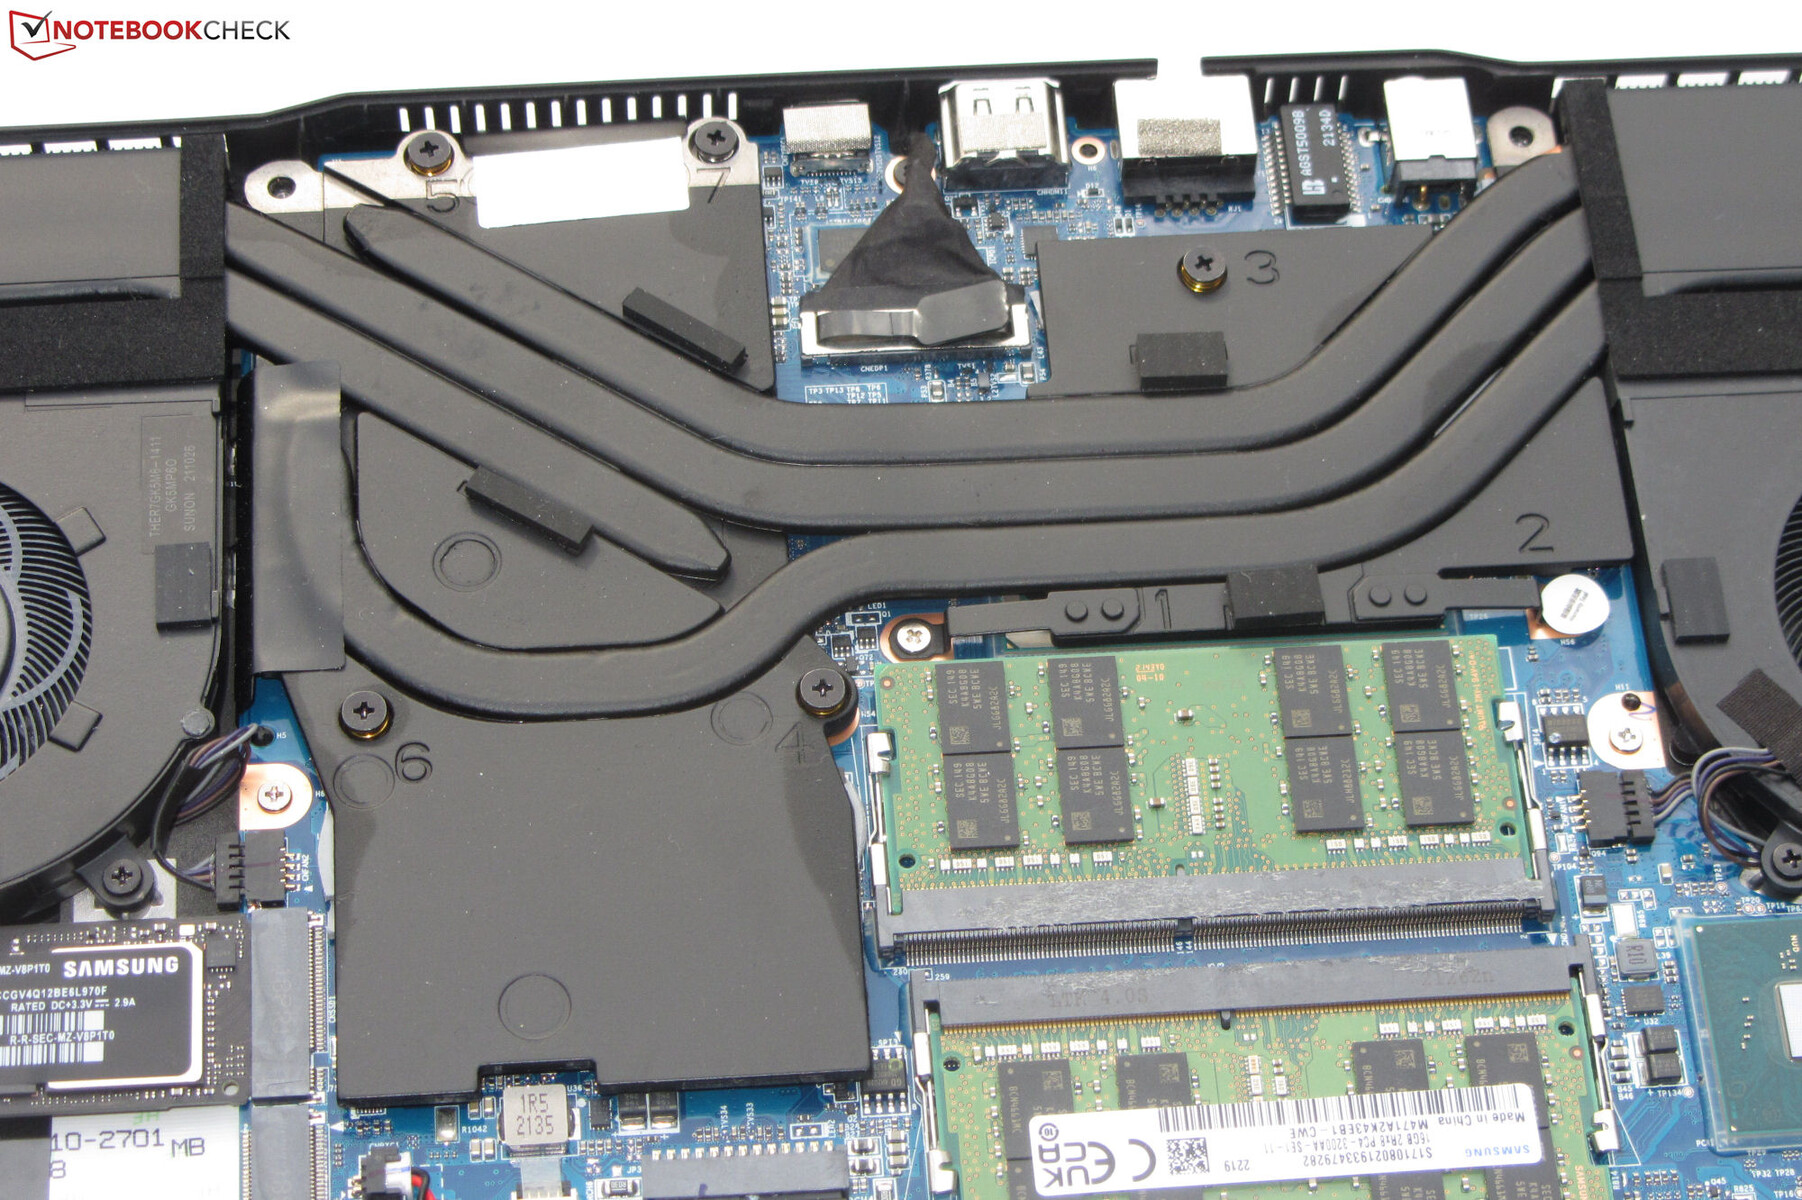
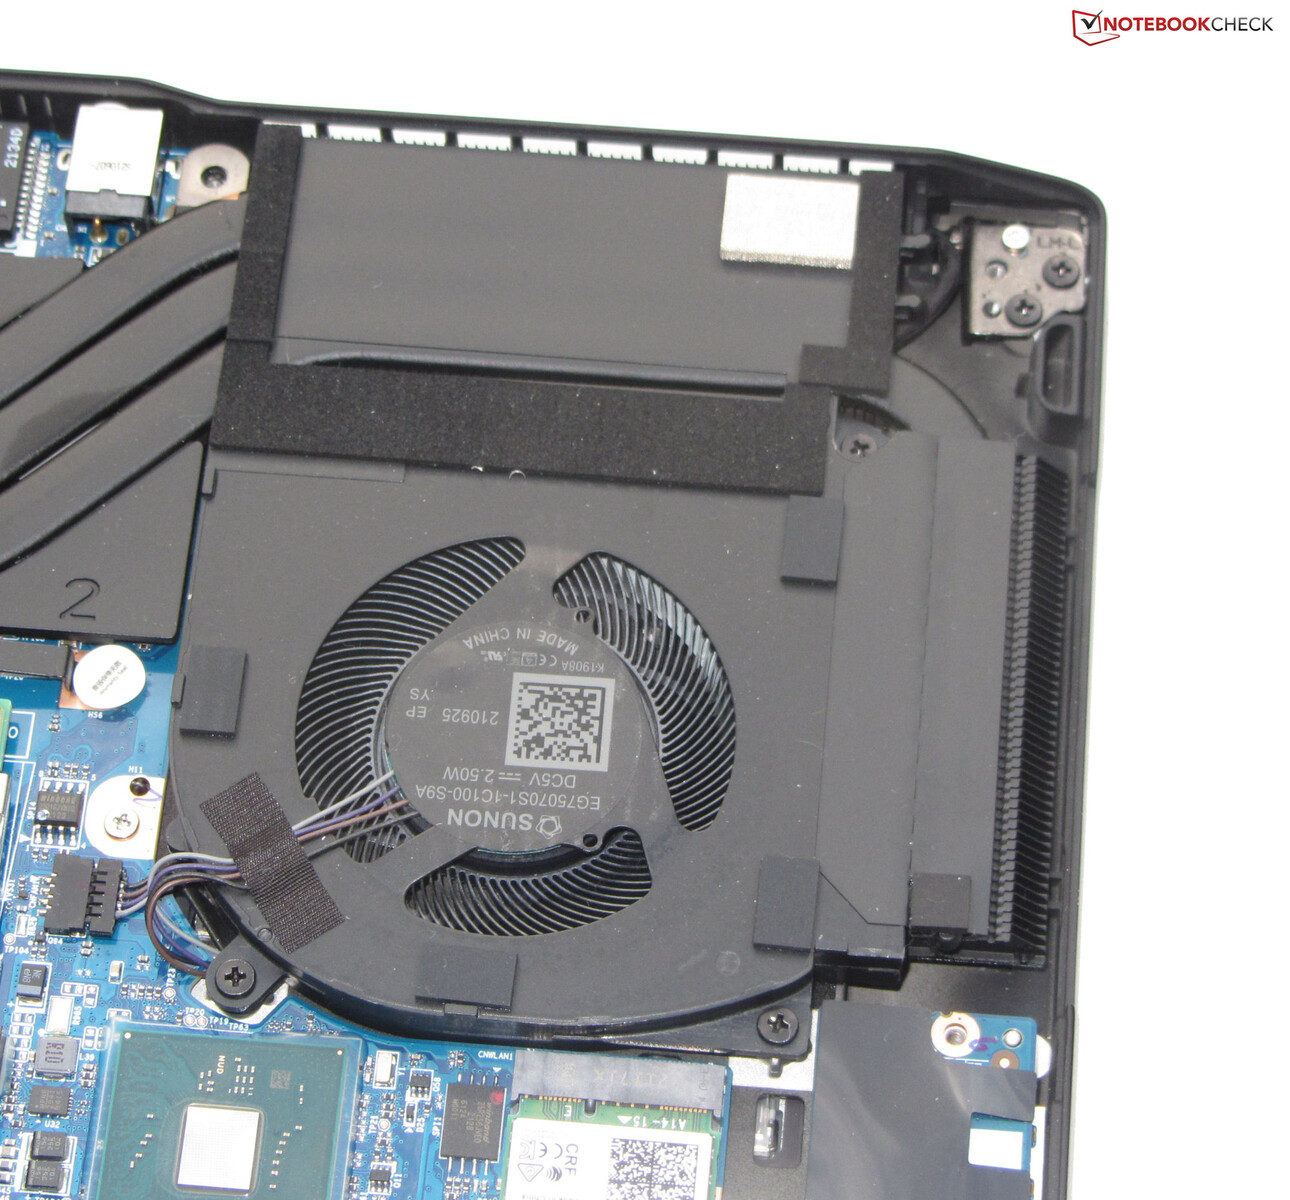
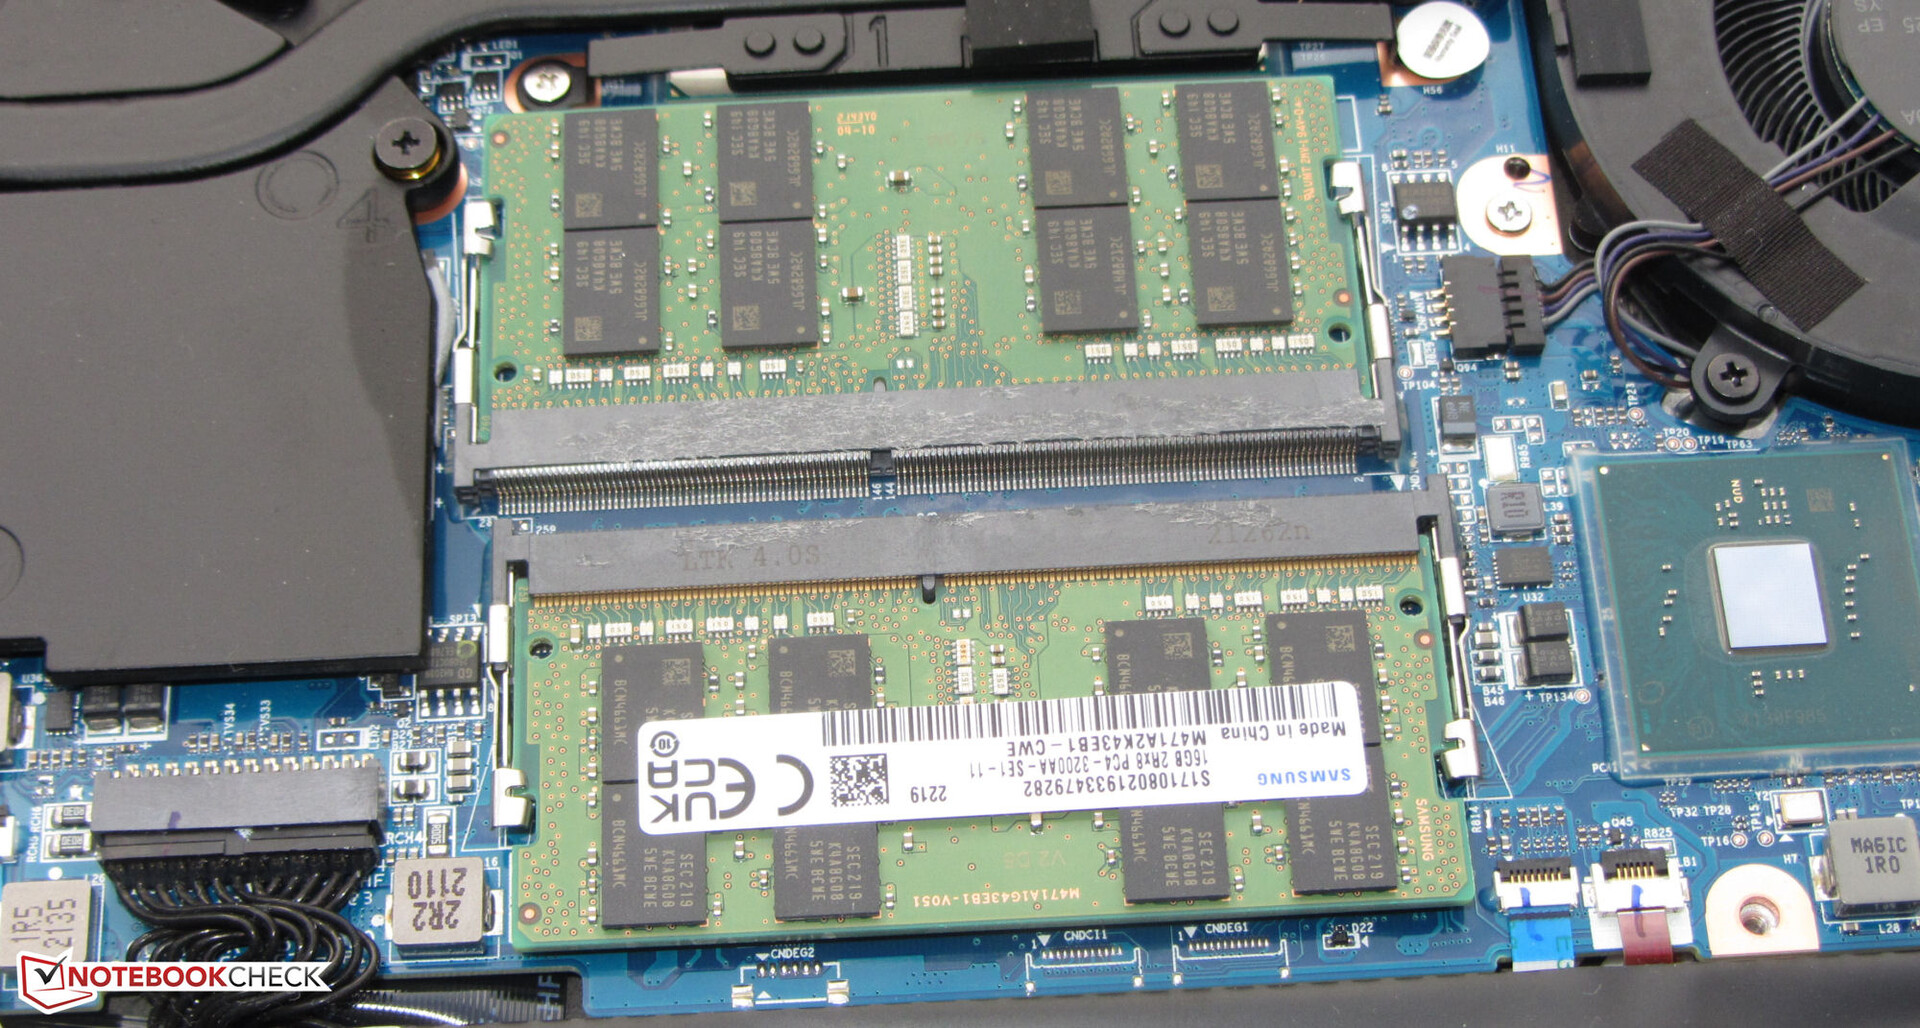
Underhåll och uppgradering kan utföras utan problem. Efter att ha lossat alla skruvar på enhetens undersida kan bottenskyddet tas bort ganska enkelt. Du har då tillgång till RAM-platserna (båda upptagna), SSD (PCIe 4), den andra M.2-2280-platsen (PCIe 3/SATA), Wi-Fi-modulen, fläktarna, BIOS-batteriet och batteriet
Garanti
Grundgarantin täcker två år - inklusive hämtning och 6 månaders snabbreparation (reparation inom 48 timmar). En 36-månaders garanti kostar mellan 100 och 149 euro (~99,53 och 148,30 dollar) - beroende på vilken period för snabbreparation som valts
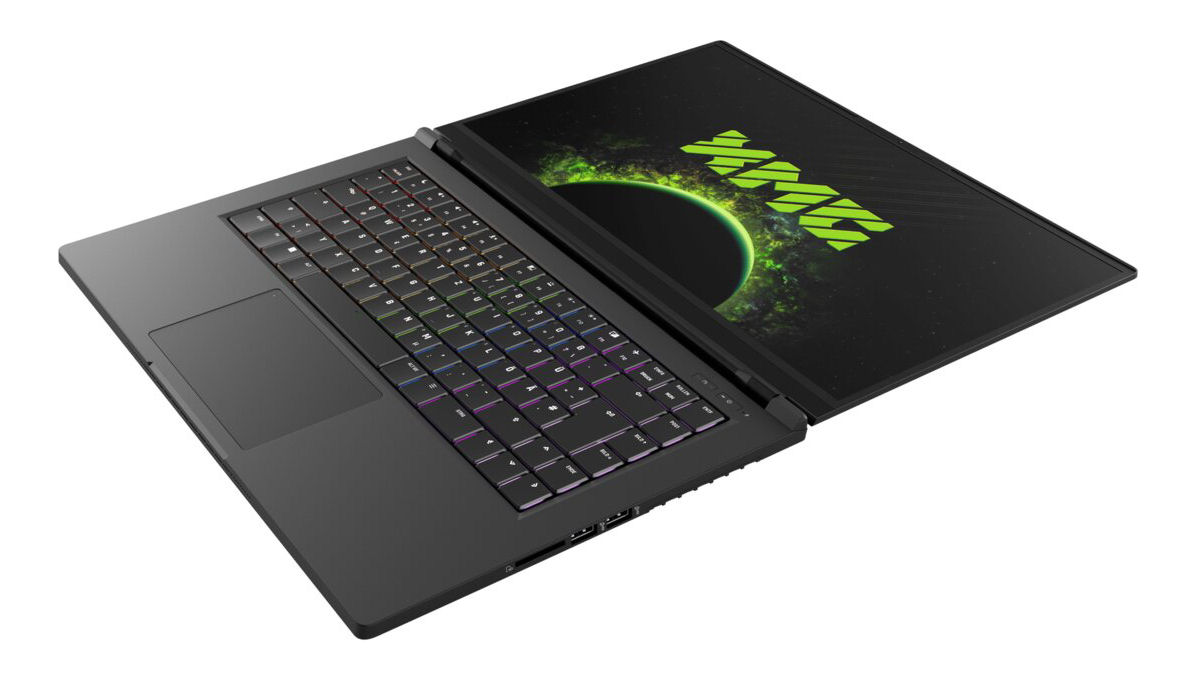
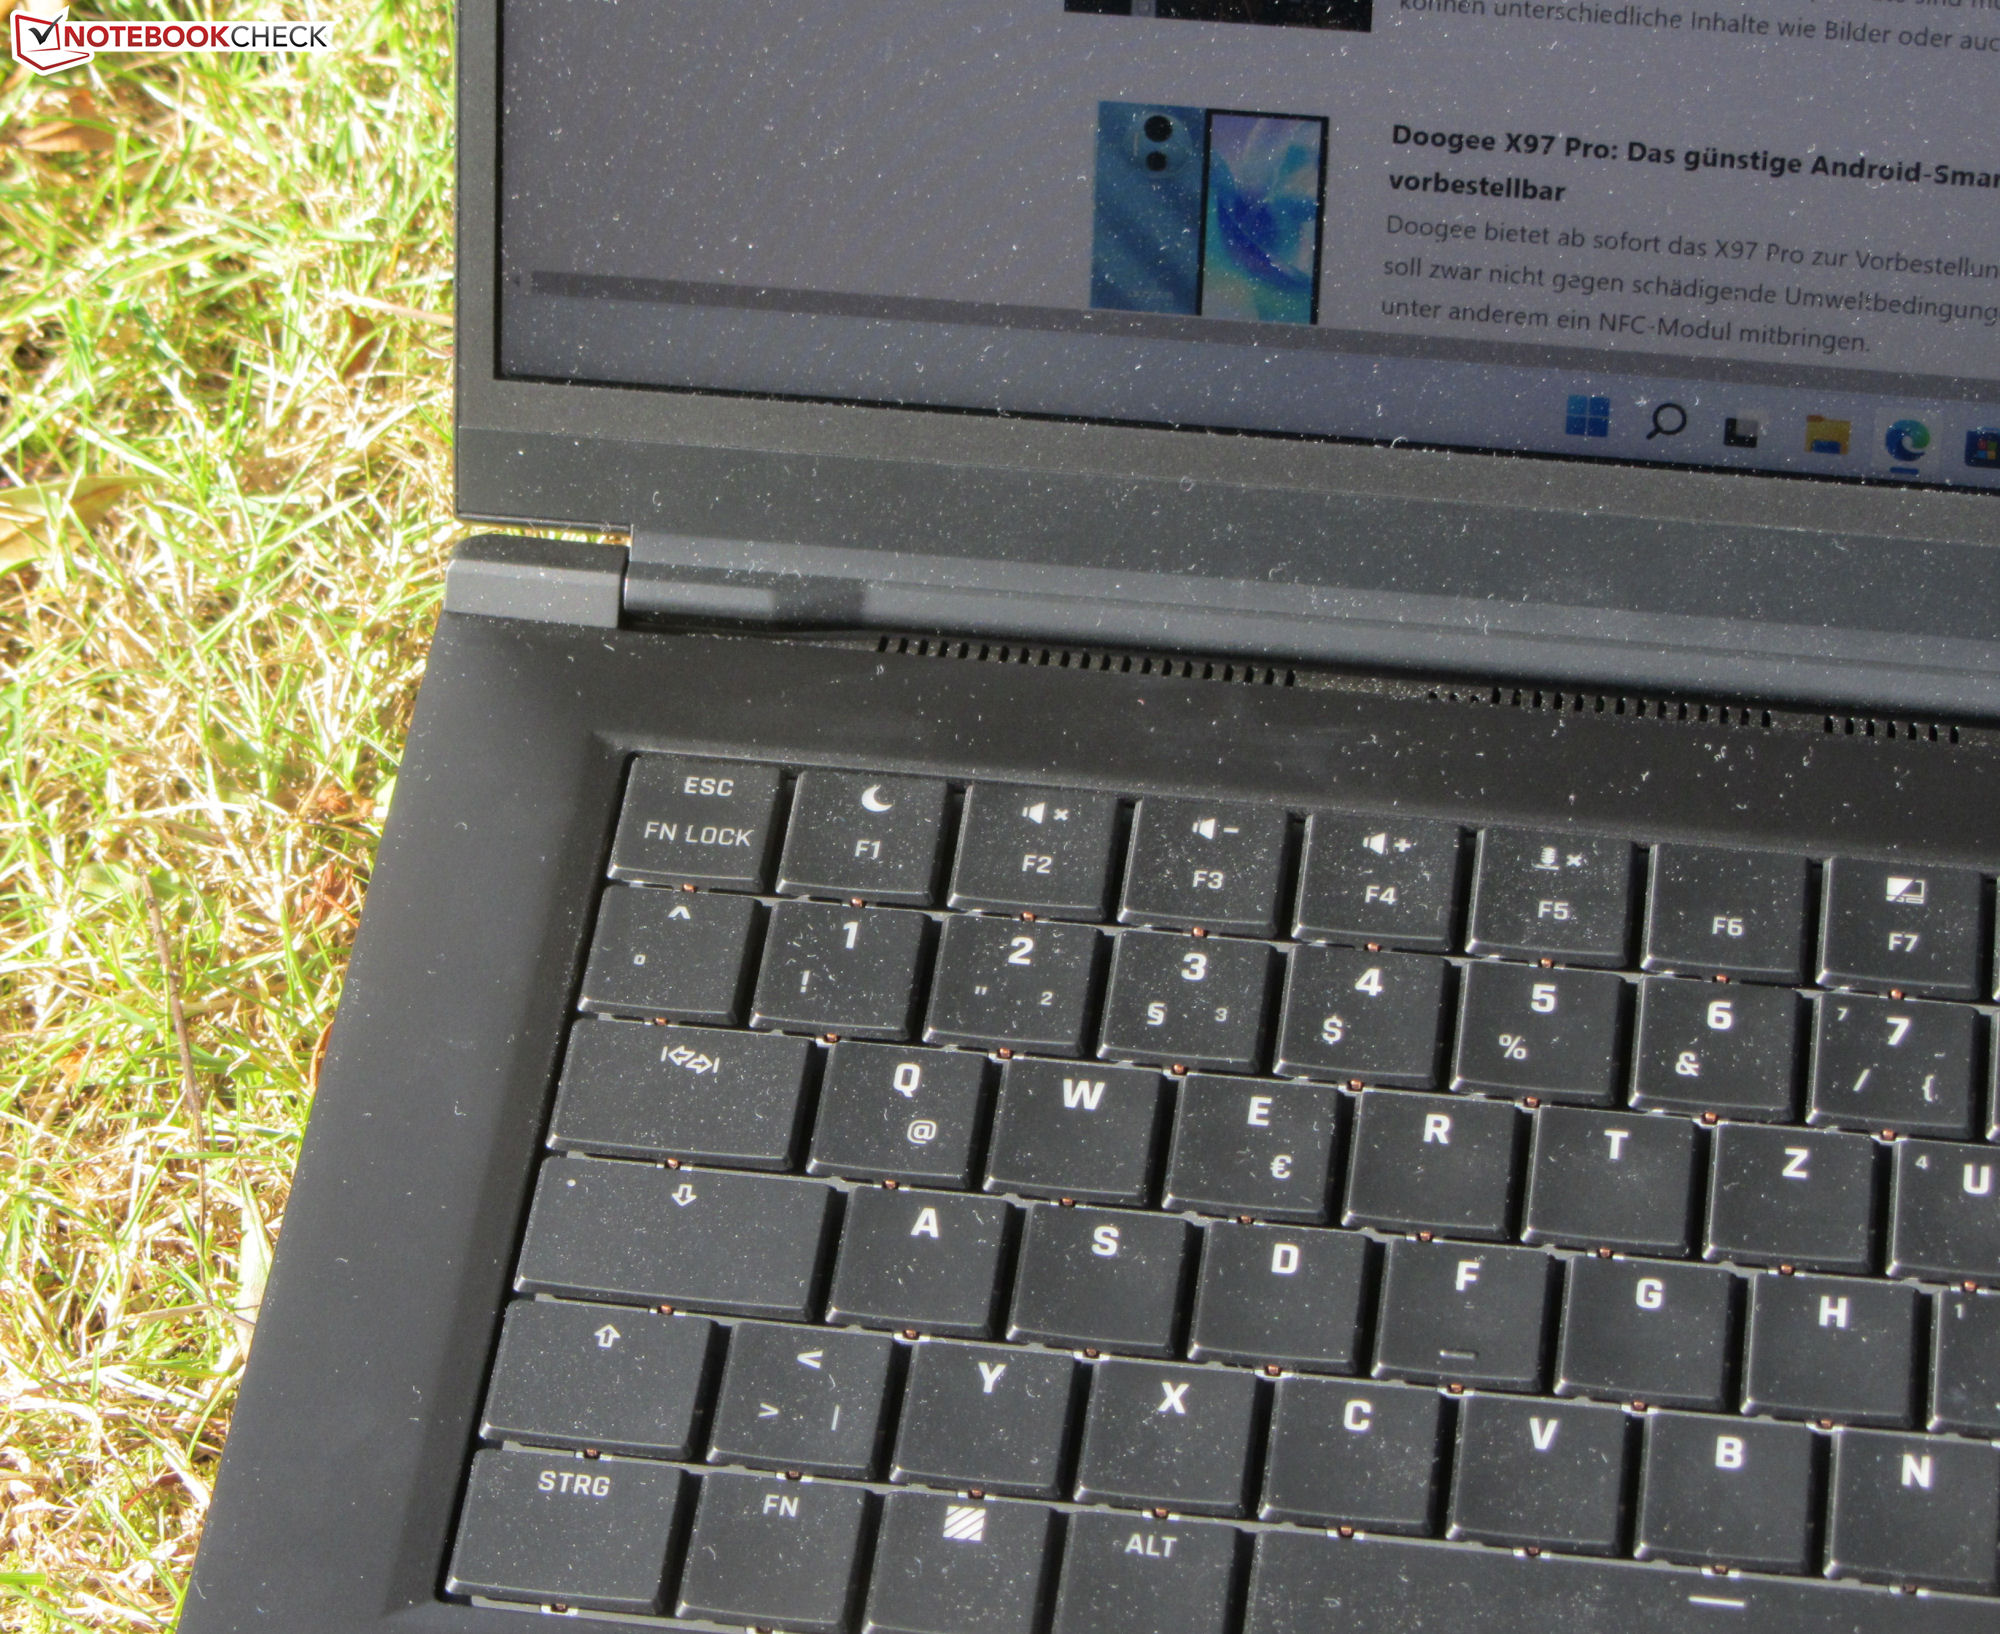
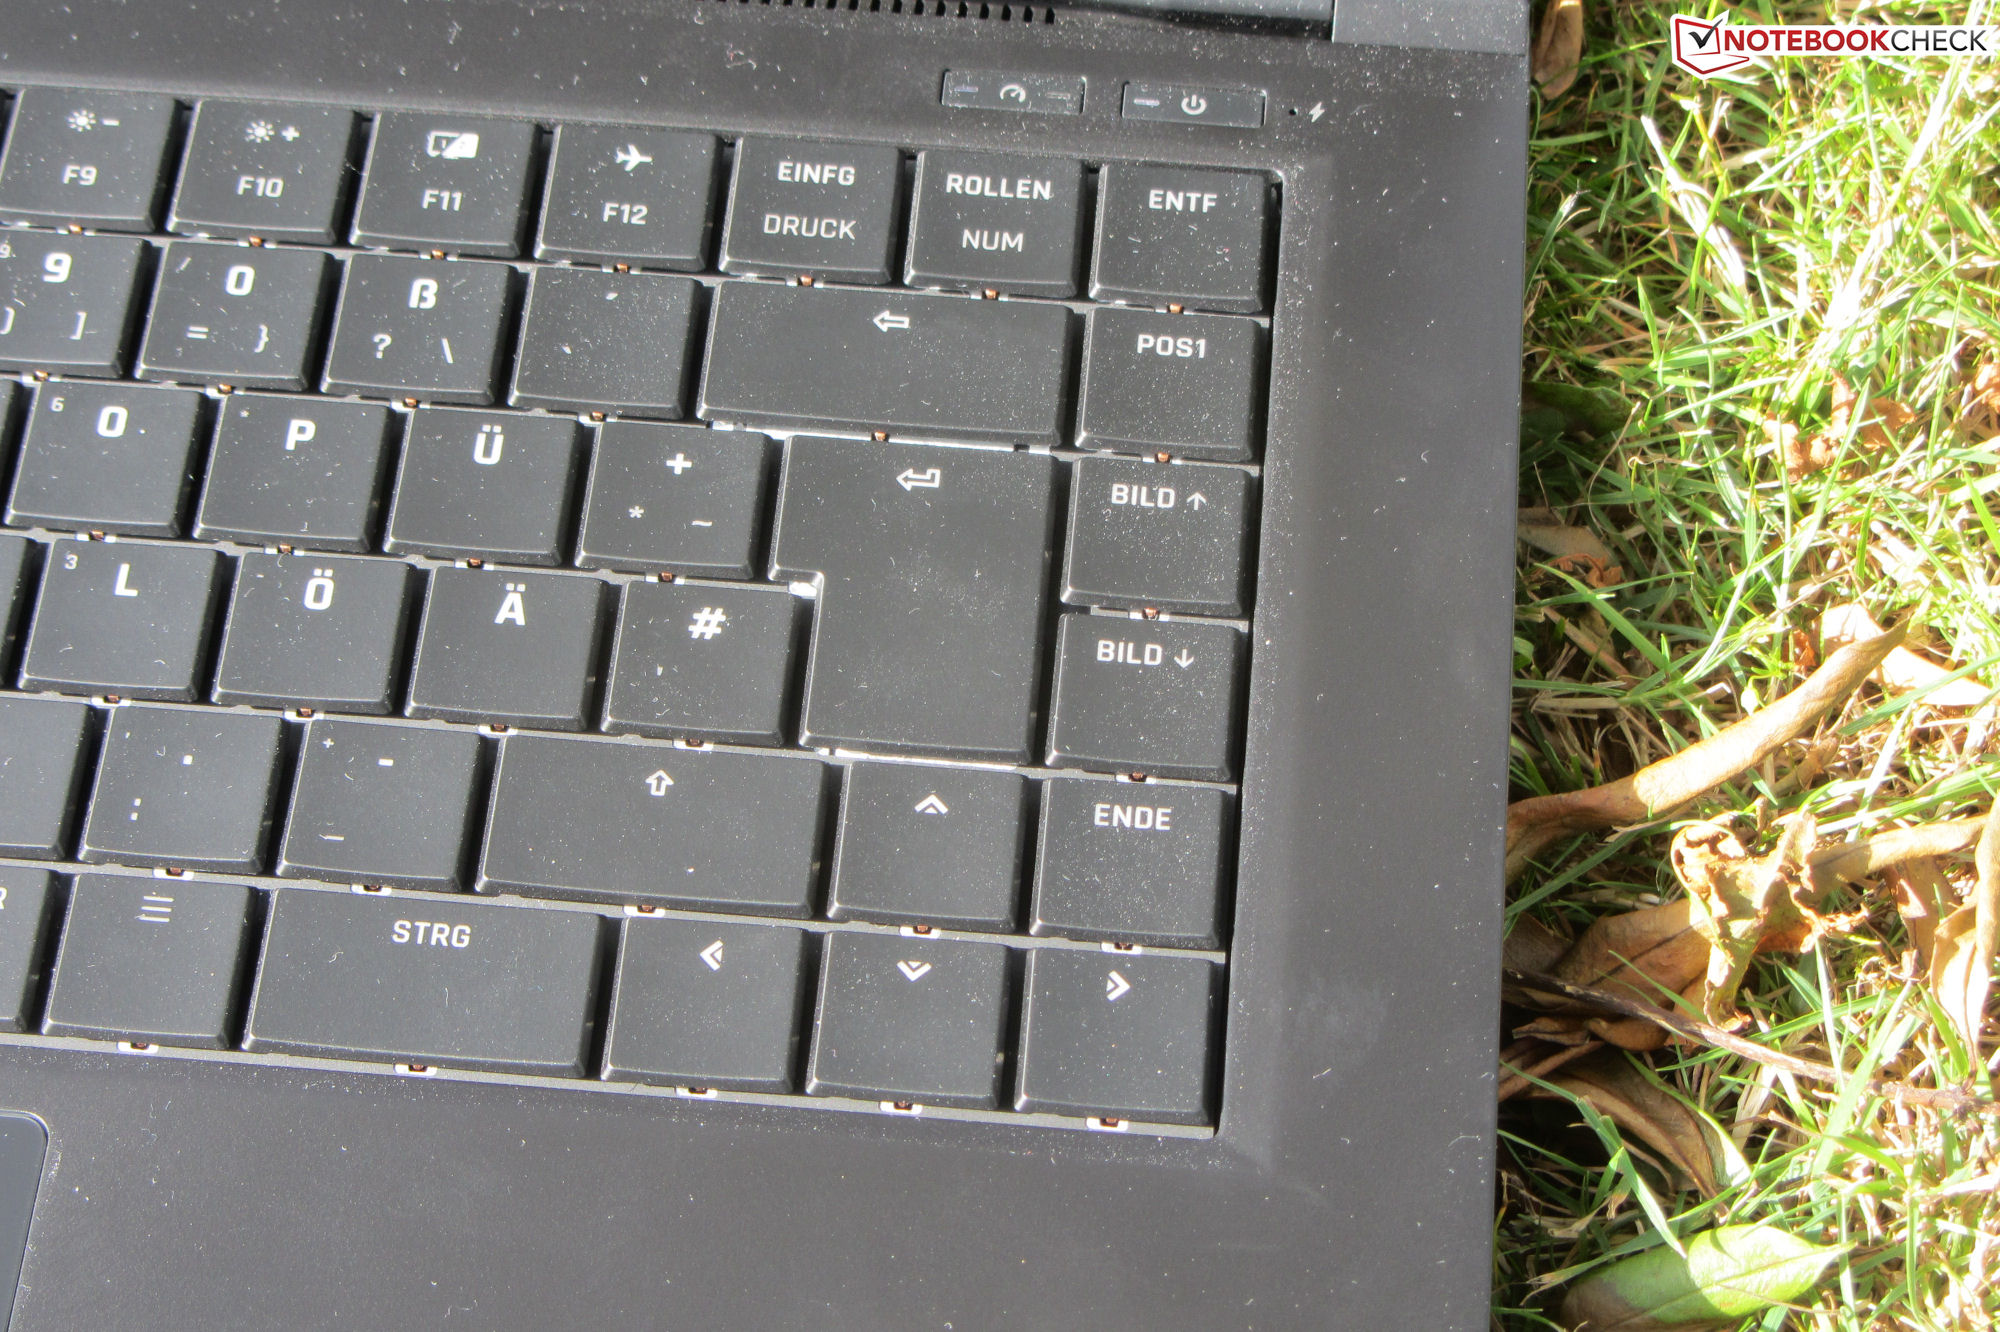
Inmatningsenheter - Schenkers bärbara dator har ett mekaniskt tangentbord
Tangentbord
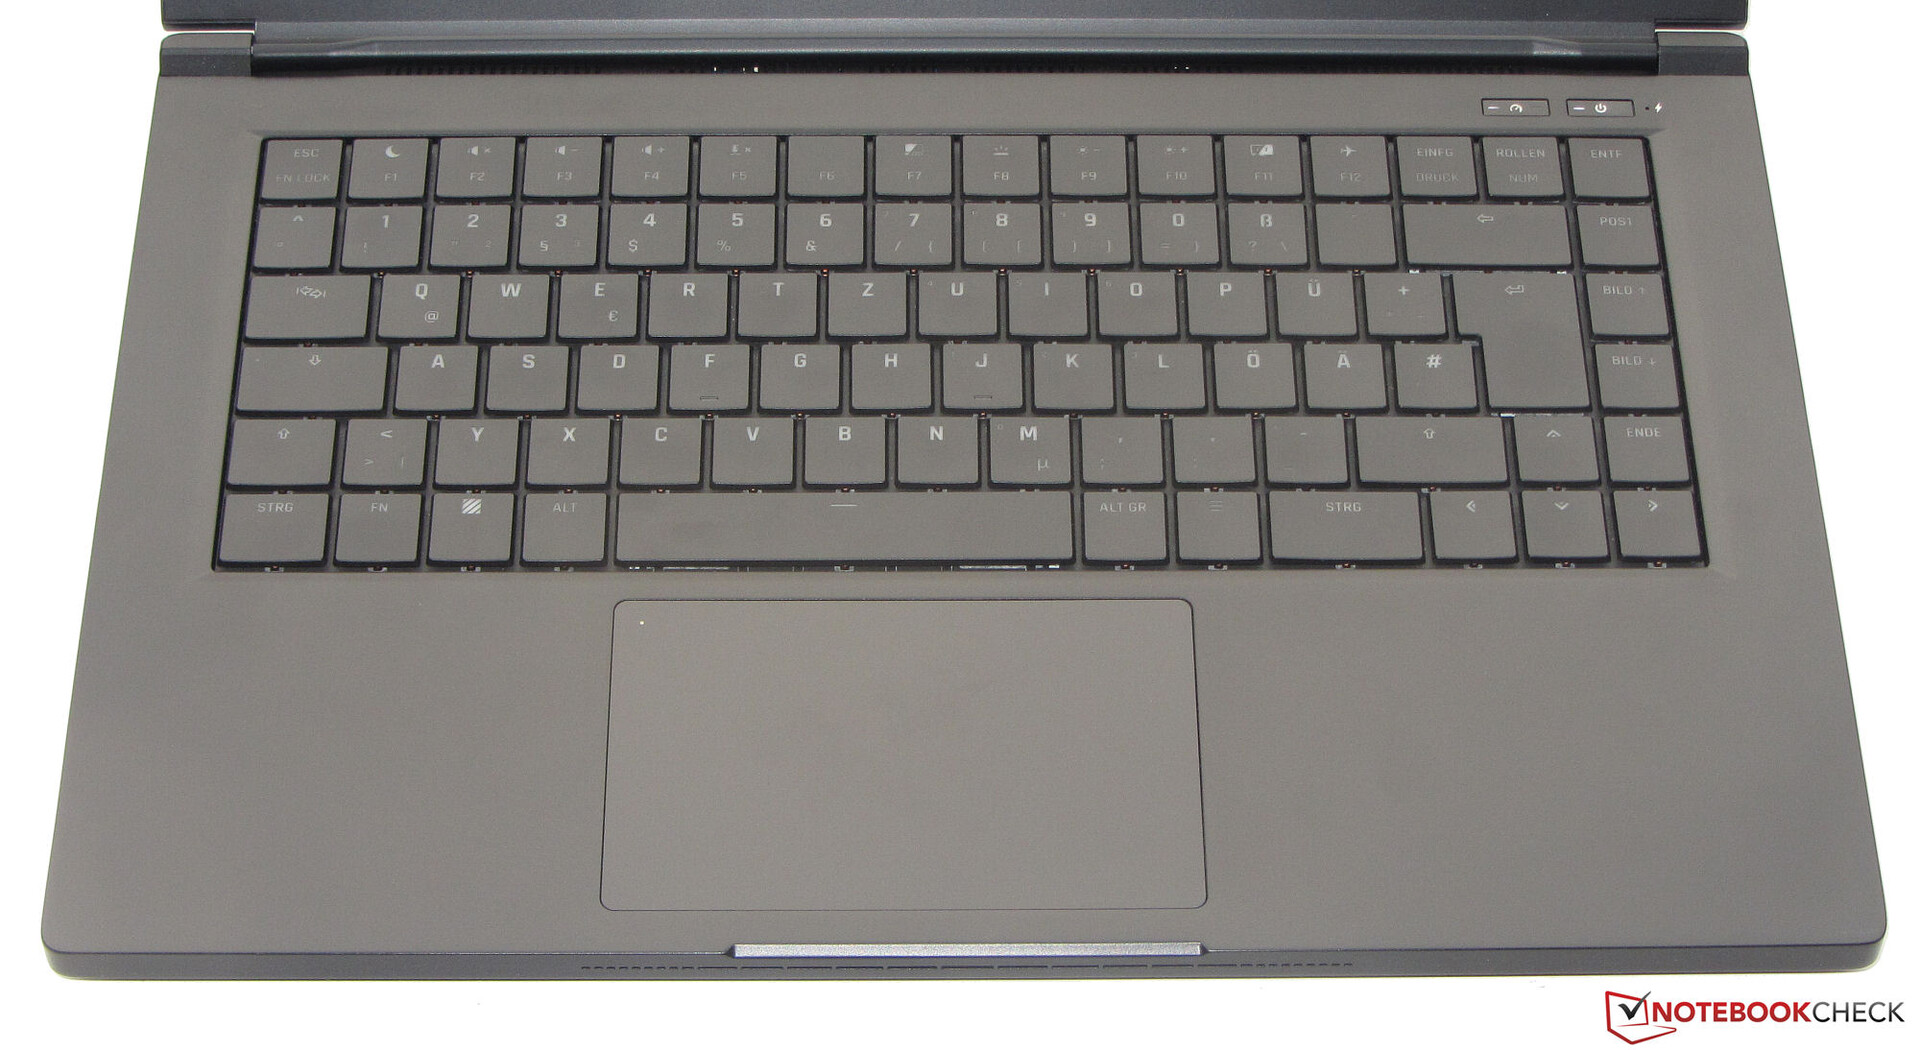
Det mekaniska tangentbordet (med RGB-belysning för enstaka tangenter) består av konkavt böjda tangenter. Dessa har en medelhög slaglängd och har en tydligt hörbar och märkbar tryckpunkt. Tangentbordet ger inte efter under skrivandet. Den tvåstegsbelysningen styrs via en funktionstangent. På det hela taget är detta ett balanserat och välgjort tangentbord
Pekplatta
En multitouch-kapabel ClickPad (ca 11,7 x 7,2 cm) ersätter musen. Den släta ytan gör det lätt för fingrarna att glida på den. Padden har en kort resväg och en tydlig tryckpunkt. Genom att dubbeltrycka på det övre vänstra hörnet slås kudden på/av (indikeras av en lysdiod)
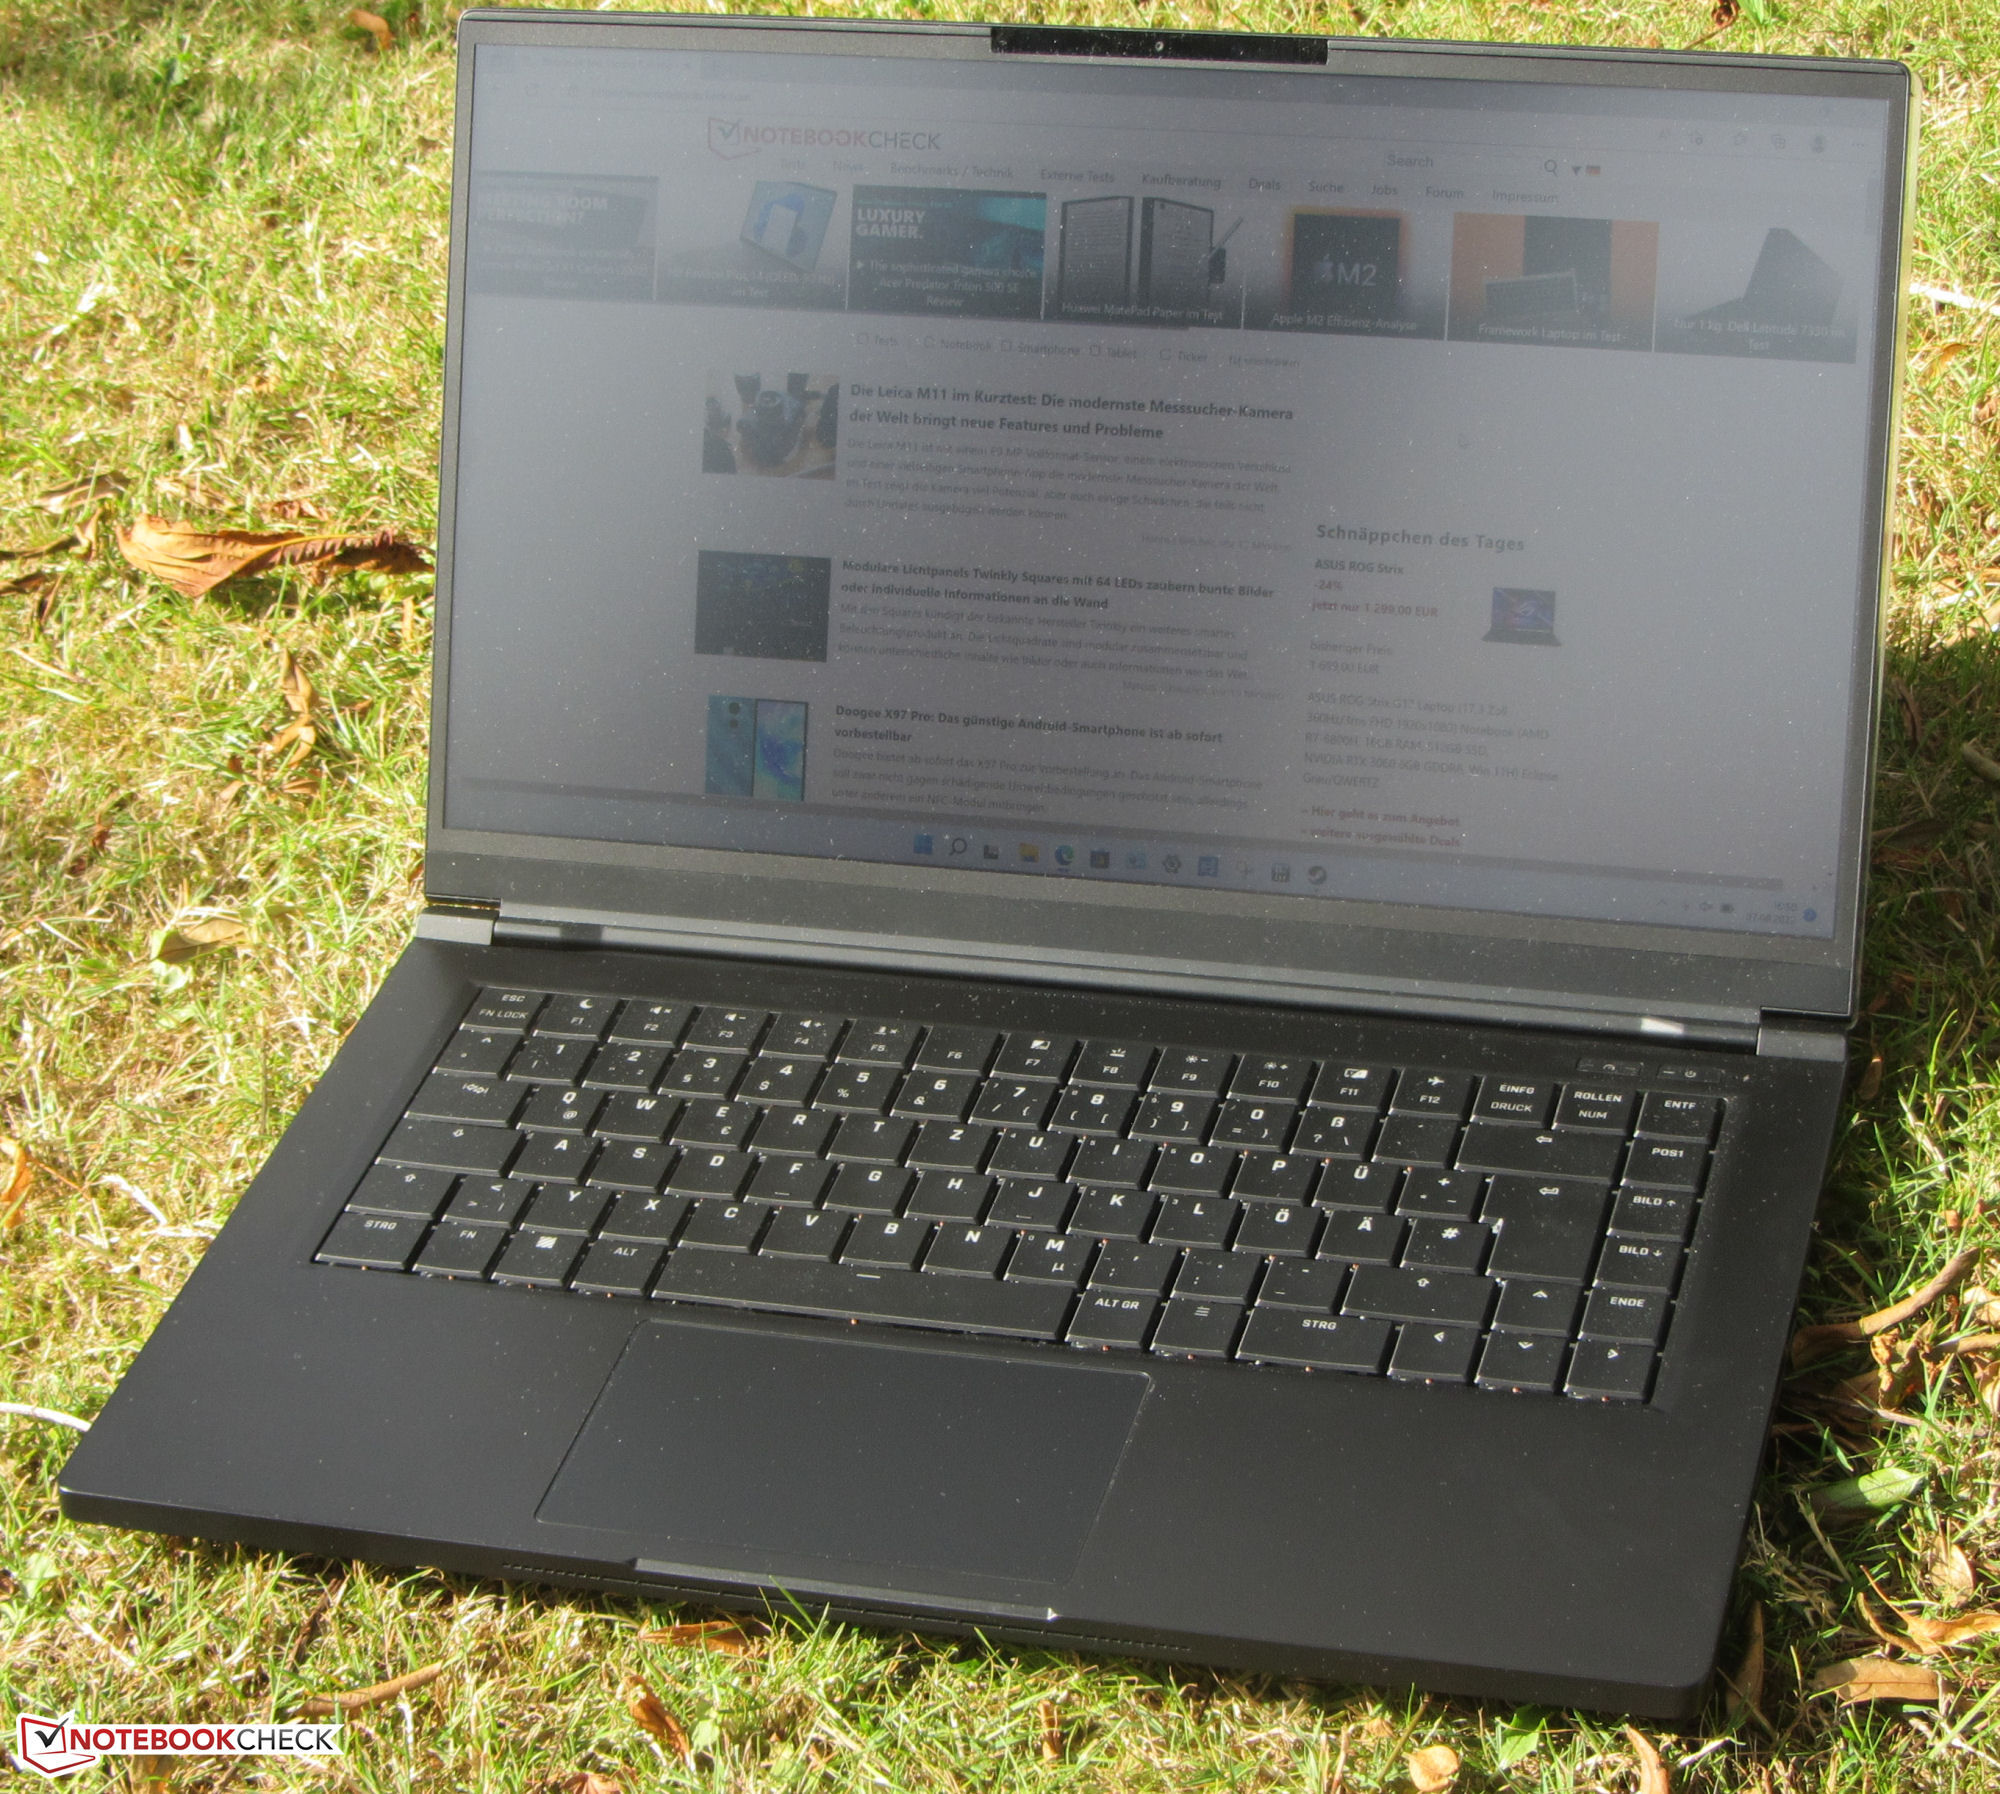
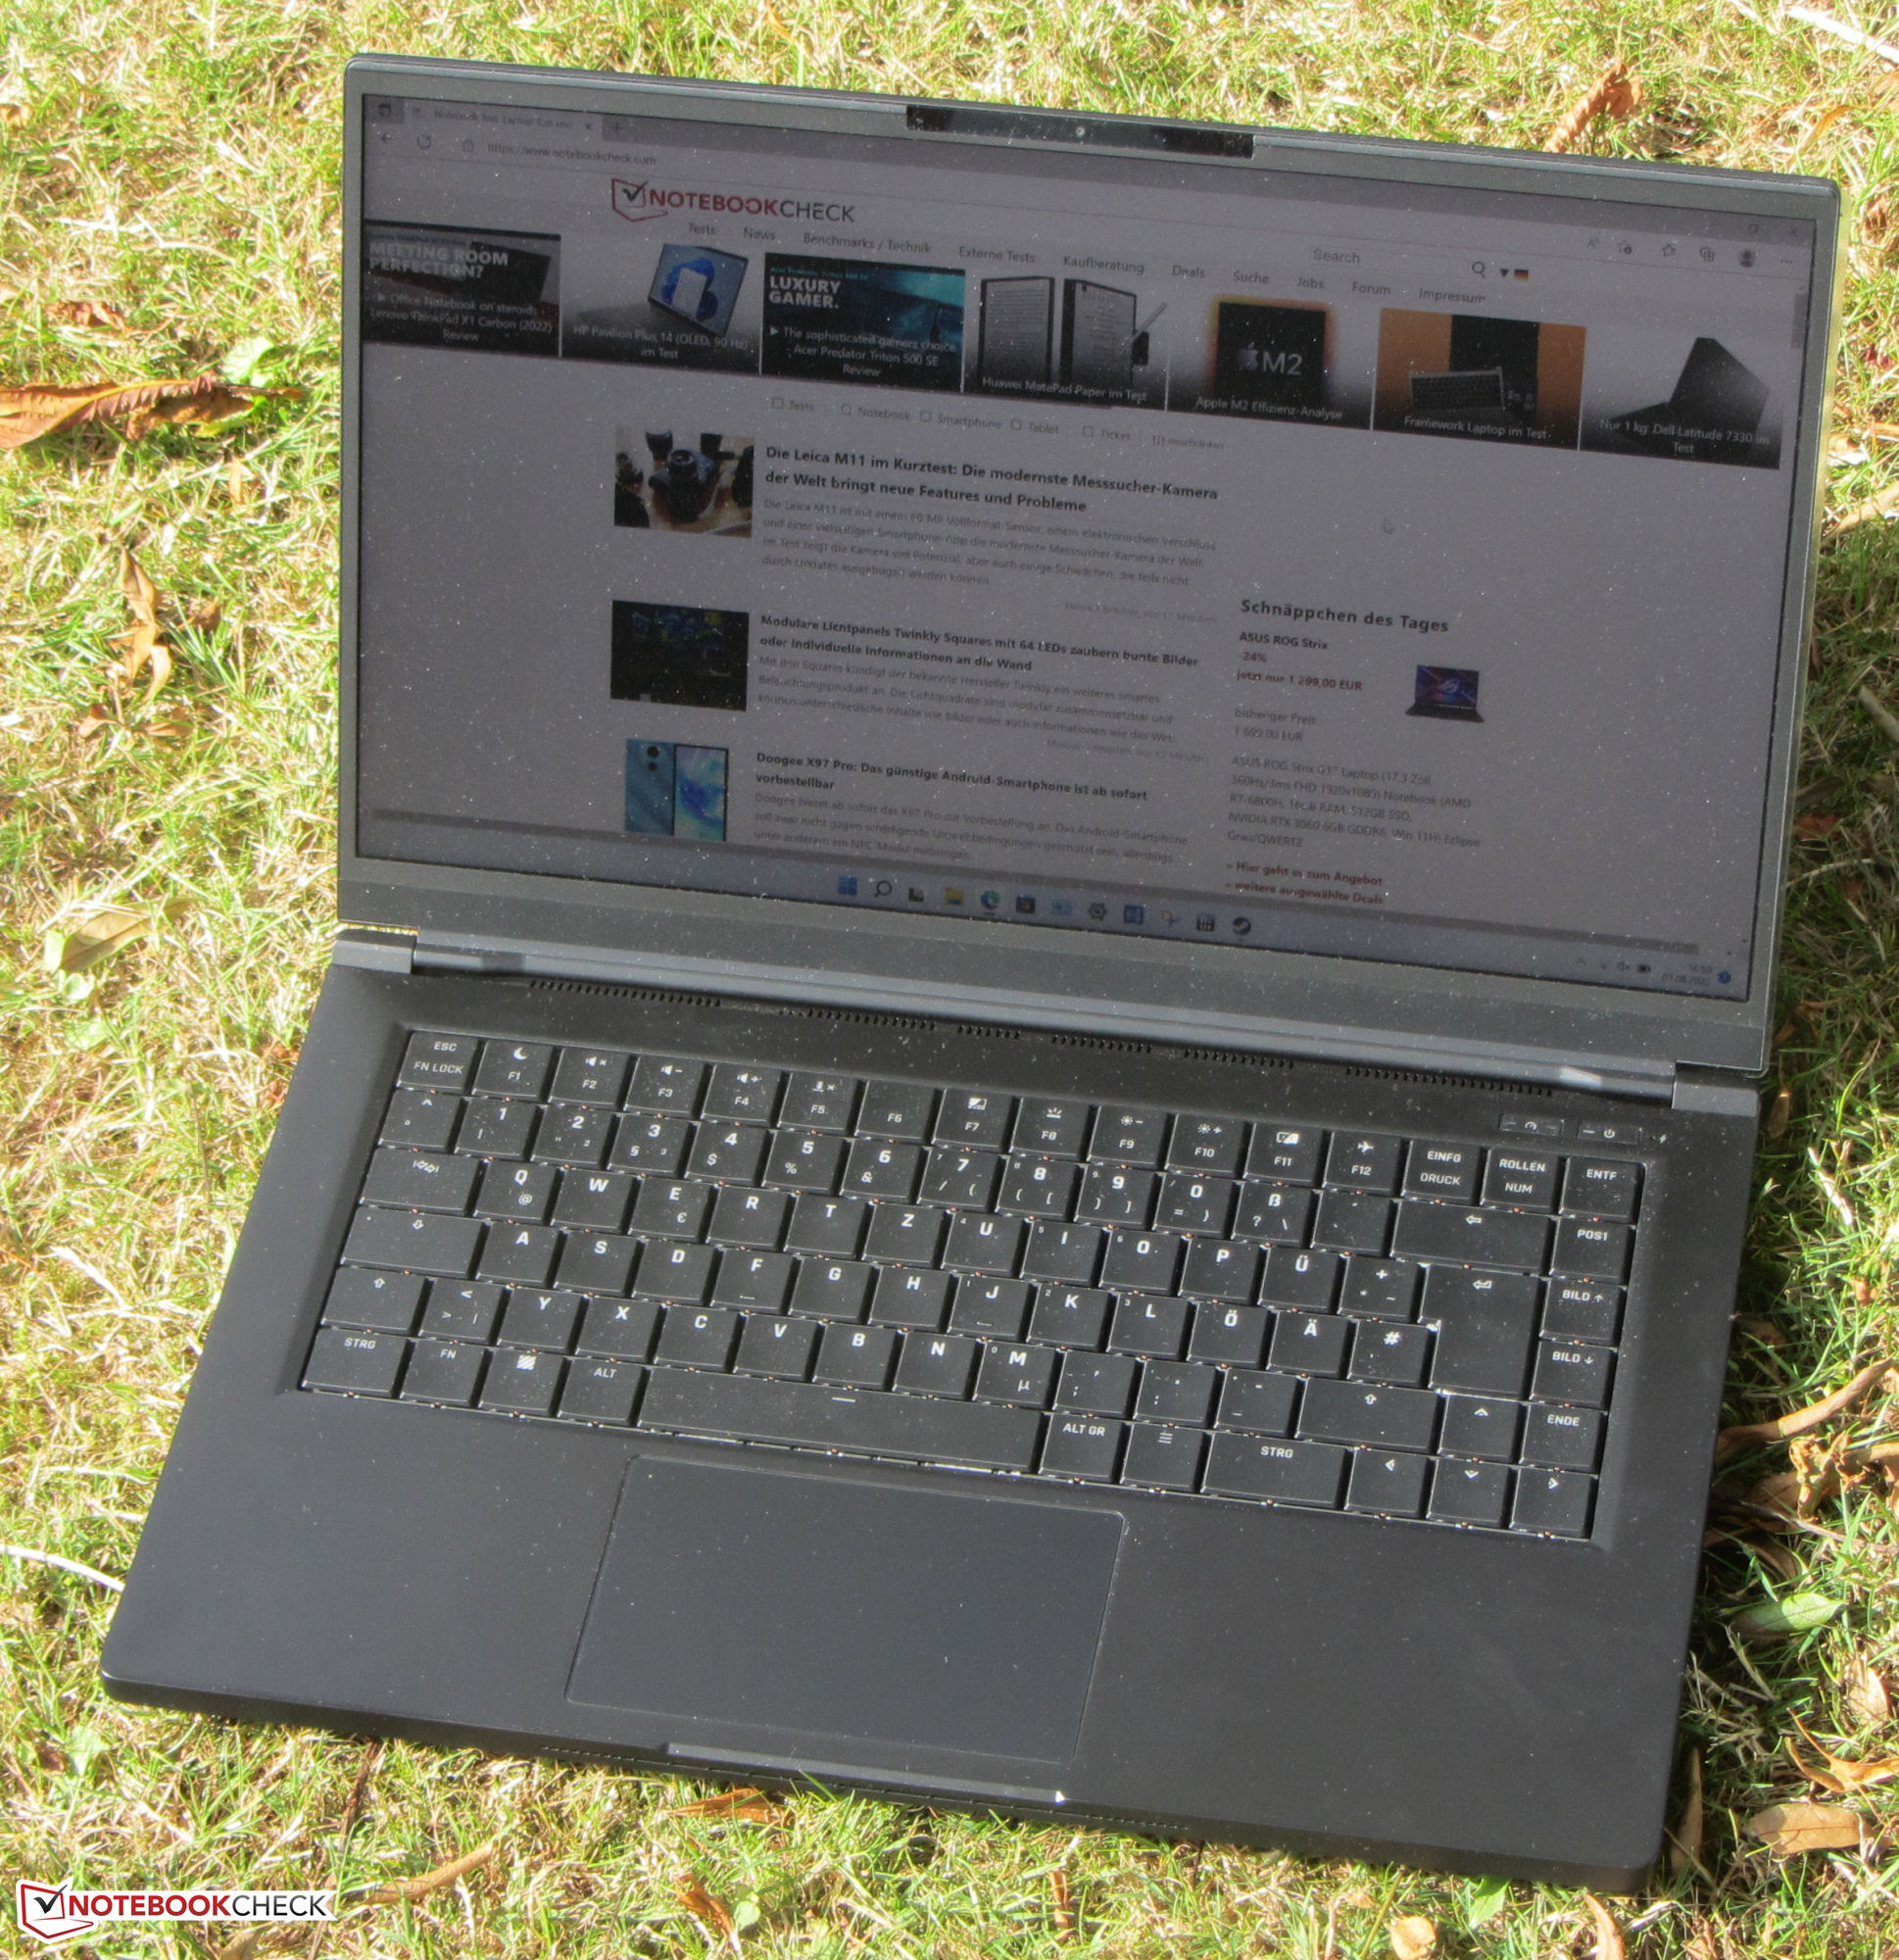
Skärm - IPS ombord
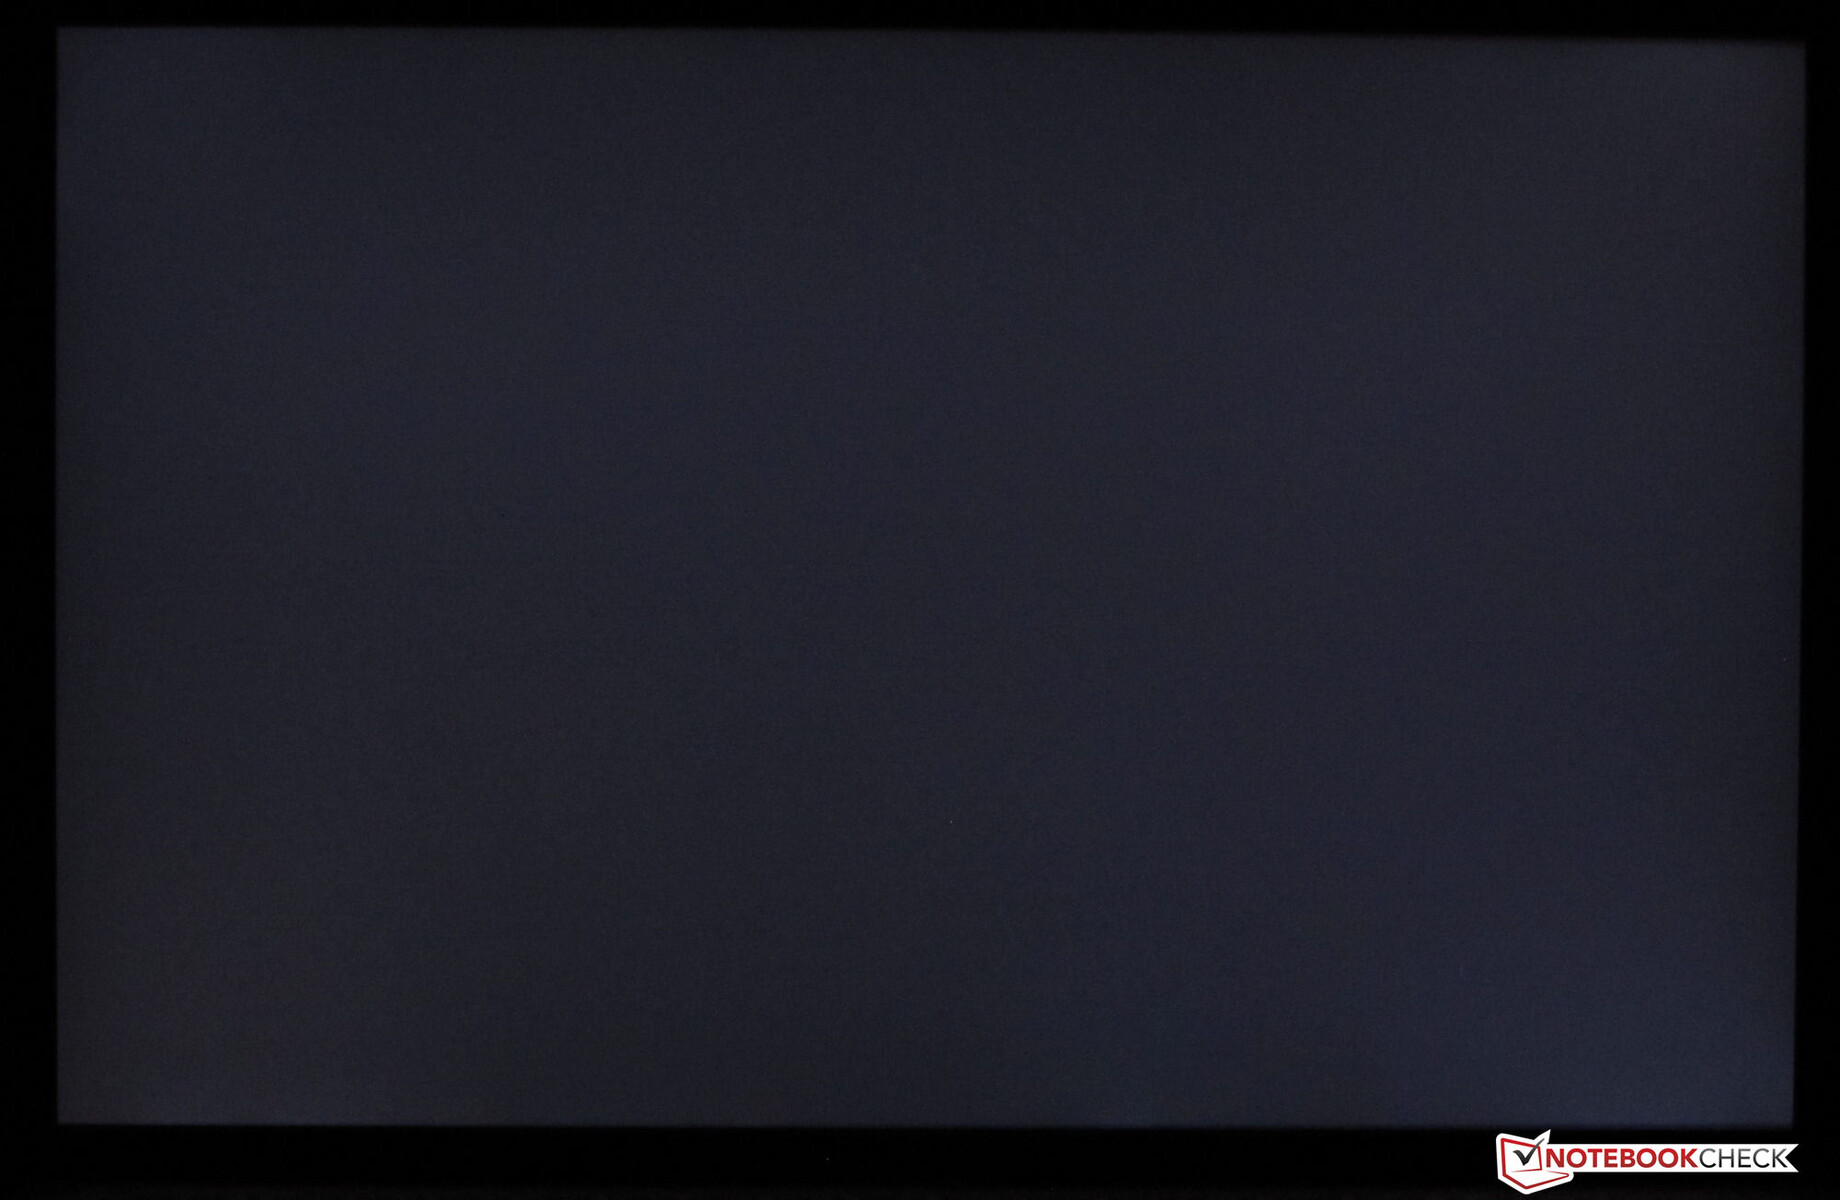
Ljusstyrkan (303,1 cd/m²) och kontrasten (988:1) på den matta 15,6-tumsskärmen (2 560 x 1 440 pixlar) uppfyller knappt sina respektive mål. Panelen med 165 Hz har snabba svarstider. Inget PWM-flimmer kunde upptäckas
| |||||||||||||||||||||||||
Distribution av ljusstyrkan: 89 %
Mitt på batteriet: 326 cd/m²
Kontrast: 988:1 (Svärta: 0.33 cd/m²)
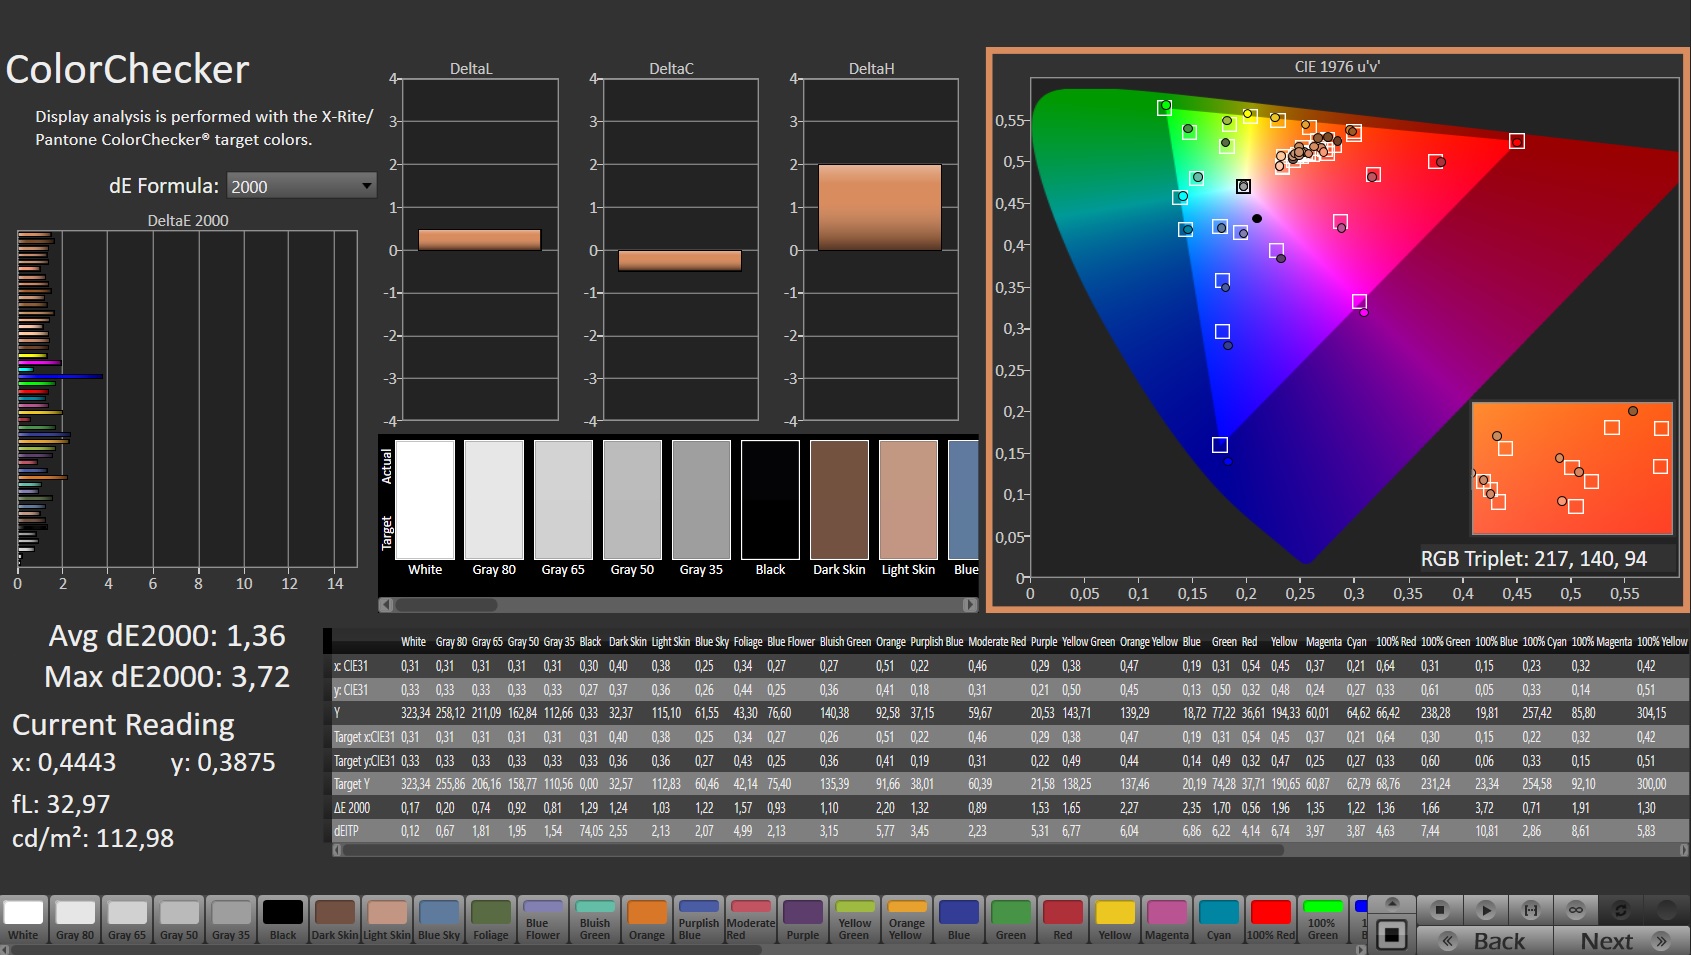
ΔE ColorChecker Calman: 2.73 | ∀{0.5-29.43 Ø4.71}
calibrated: 1.36
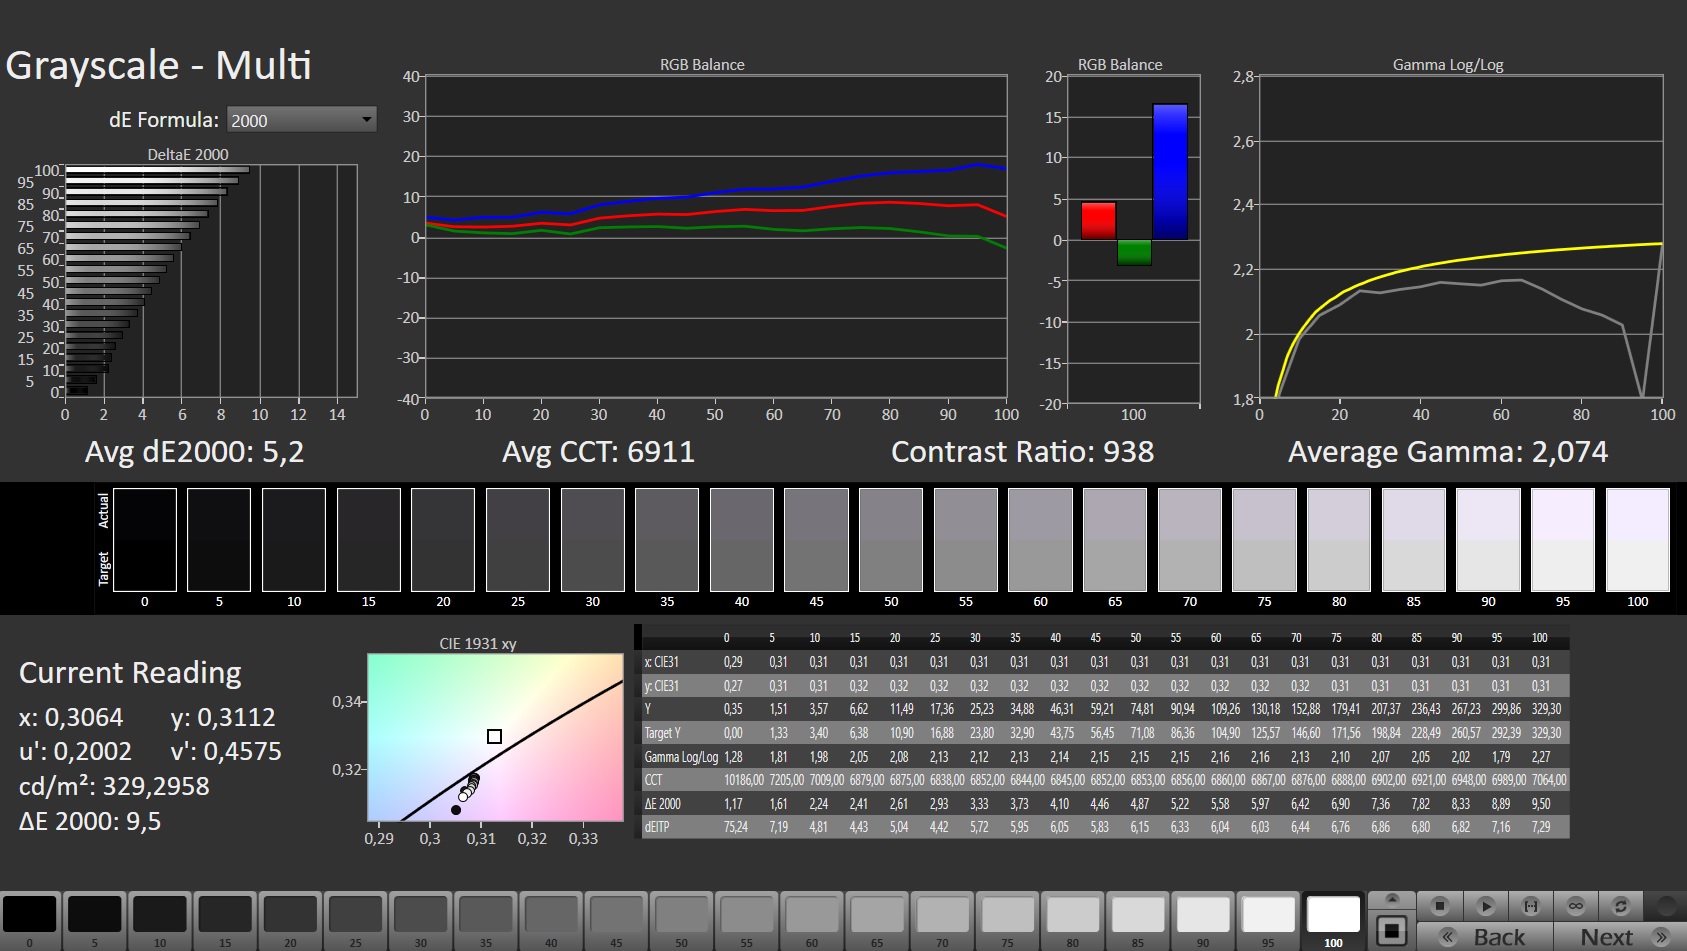
ΔE Greyscale Calman: 5.2 | ∀{0.09-98 Ø4.96}
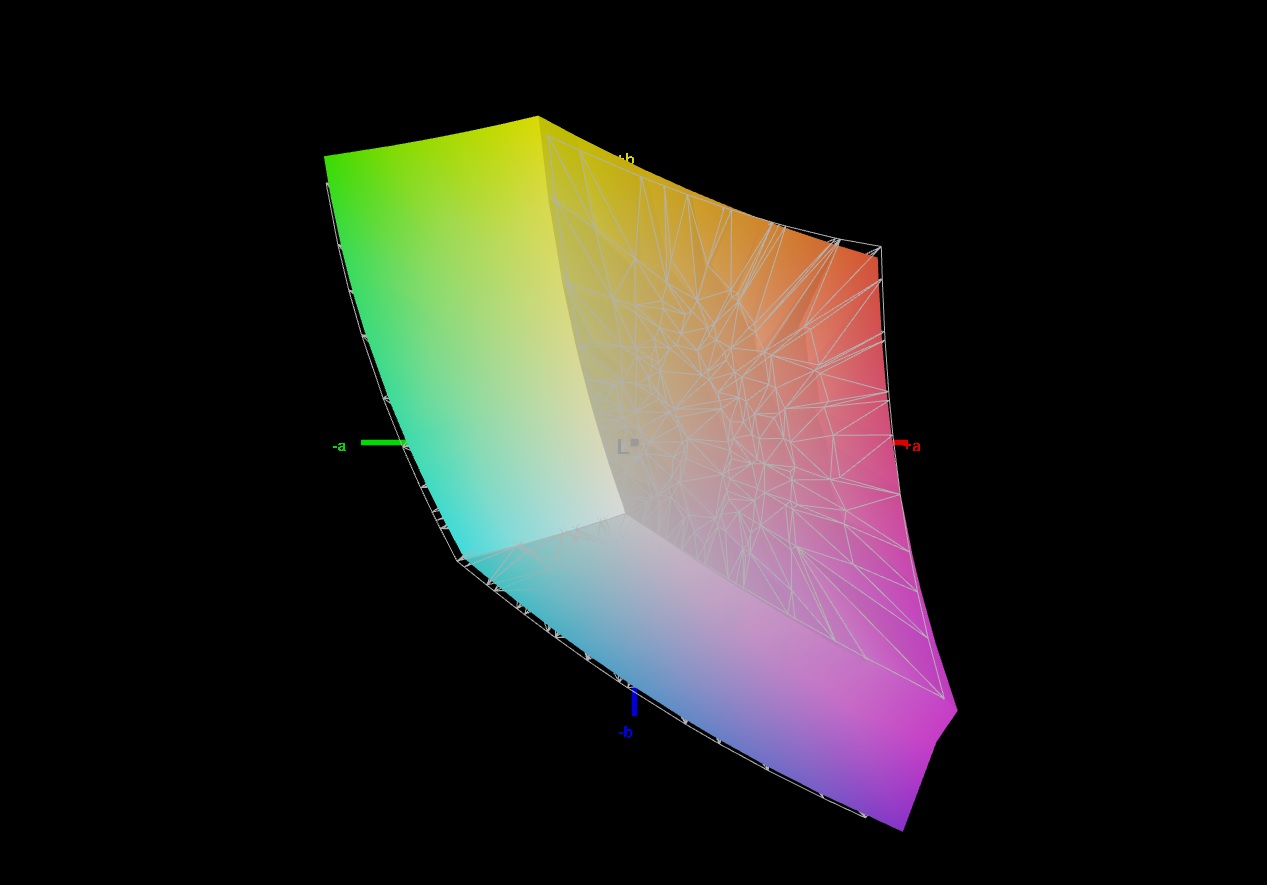
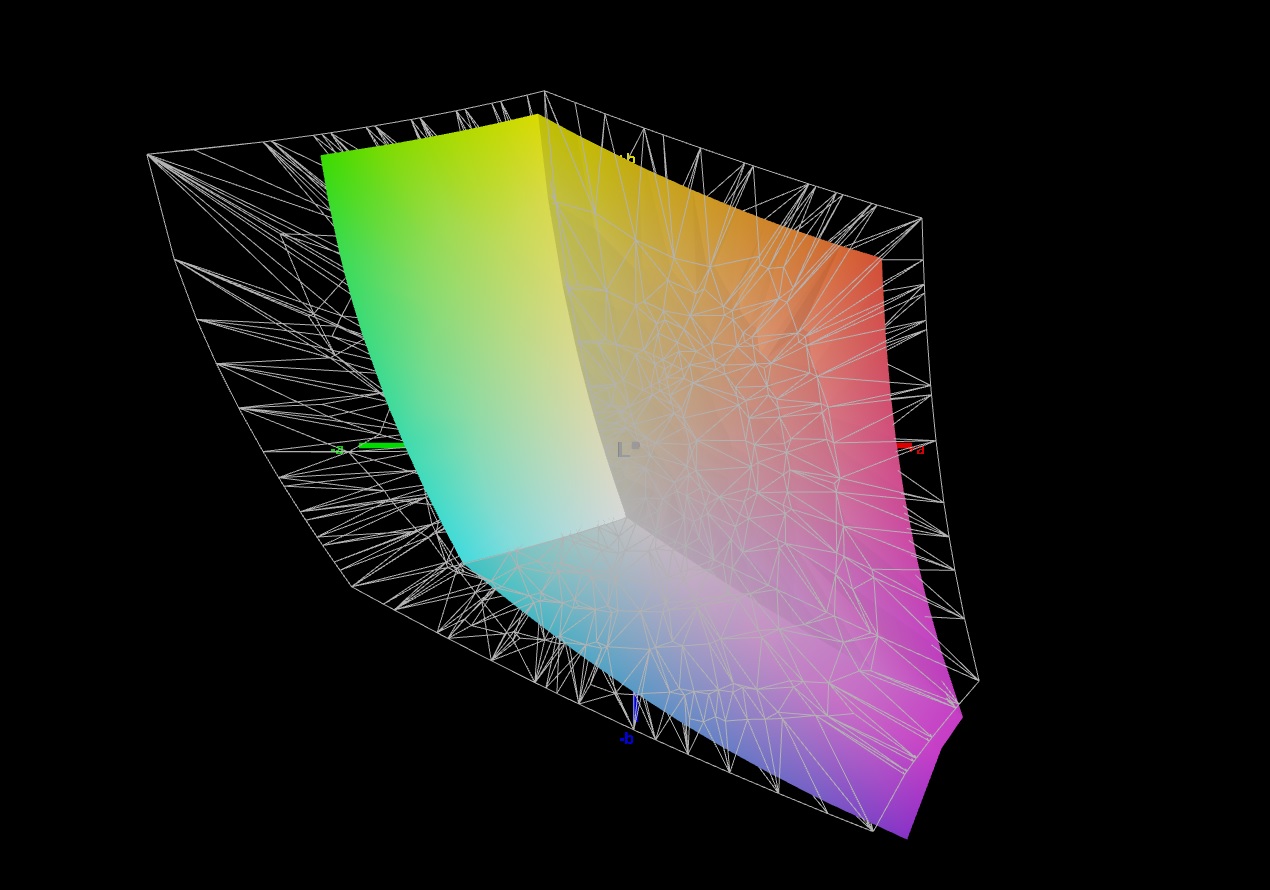
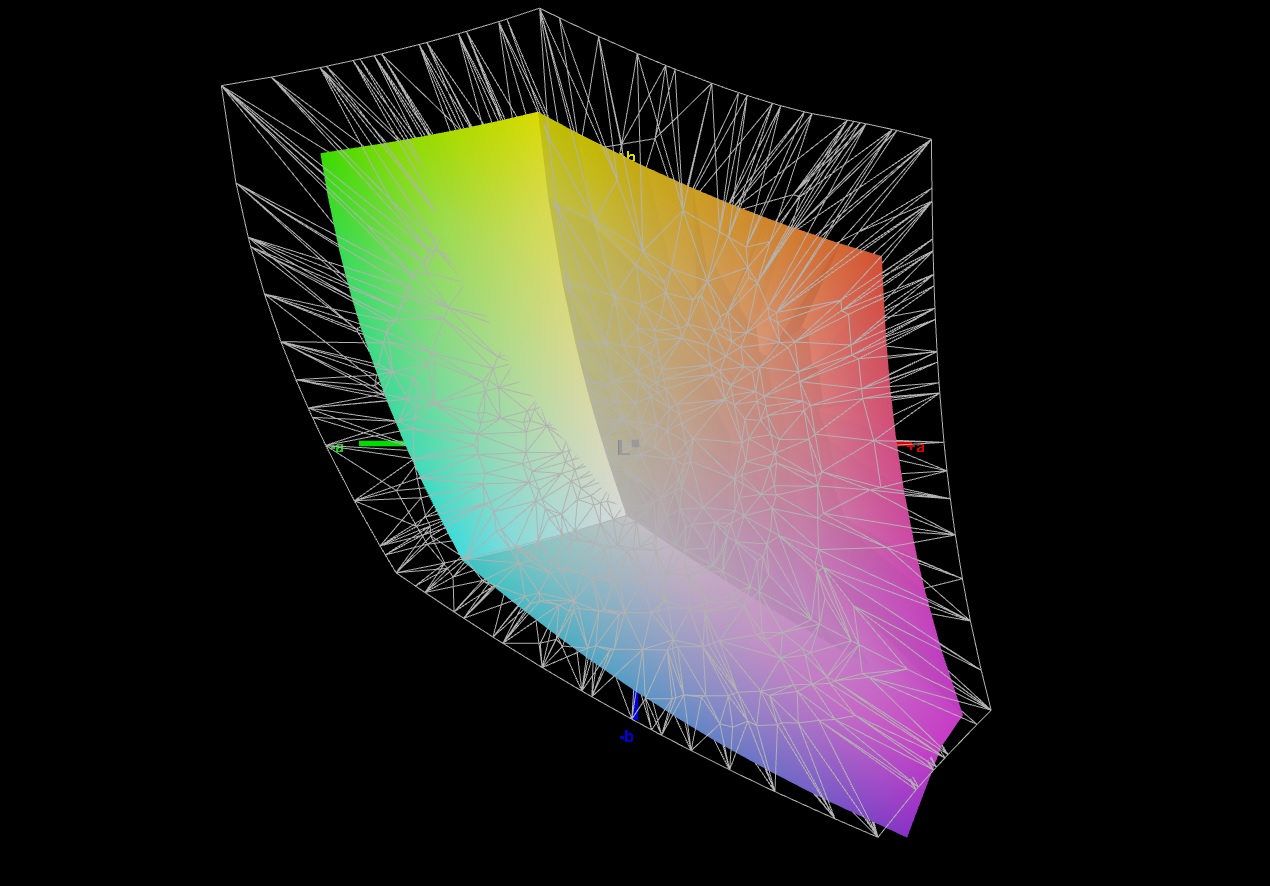
68.2% AdobeRGB 1998 (Argyll 3D)
96.7% sRGB (Argyll 3D)
67.3% Display P3 (Argyll 3D)
Gamma: 2.074
CCT: 6911 K
| Schenker XMG Fusion 15 (Mid 22) BOE CQ NE156QHM-NY2, IPS, 2560x1440, 15.6" | Asus TUF Dash F15 FX517ZR BOE CQ NE156QHM-NY1, IPS, 2560x1440, 15.6" | Acer Nitro 5 AN515-58-72QR Chi Mei N156KME-GNA, IPS, 2560x1440, 15.6" | HP Omen 16-b1090ng BOE09E5, IPS, 2560x1440, 16.1" | MSI Delta 15 A5EFK LQ156M1JW03 (SHP155D), IPS-Level, 1920x1080, 15.6" | Razer Blade 15 Base Edition 2021, i7-10750H RTX 3060 BOE NV156FHM-N4K, IPS, 1920x1080, 15.6" | |
|---|---|---|---|---|---|---|
| Display | 25% | 23% | 4% | -0% | -4% | |
| Display P3 Coverage (%) | 67.3 | 98.4 46% | 95.6 42% | 71 5% | 66.5 -1% | 64.3 -4% |
| sRGB Coverage (%) | 96.7 | 99.9 3% | 99.8 3% | 97.9 1% | 97.8 1% | 91.8 -5% |
| AdobeRGB 1998 Coverage (%) | 68.2 | 85.9 26% | 85.2 25% | 73.3 7% | 67.6 -1% | 65.5 -4% |
| Response Times | 9% | -41% | -30% | -30% | -10% | |
| Response Time Grey 50% / Grey 80% * (ms) | 11.6 ? | 5.6 ? 52% | 15.7 ? -35% | 14.5 ? -25% | 12.8 ? -10% | 8.8 ? 24% |
| Response Time Black / White * (ms) | 7 ? | 9.4 ? -34% | 10.2 ? -46% | 9.4 ? -34% | 10.4 ? -49% | 10 ? -43% |
| PWM Frequency (Hz) | 23580 ? | 1000 ? | ||||
| Screen | 20% | 8% | -5% | 1% | -12% | |
| Brightness middle (cd/m²) | 326 | 286 -12% | 332 2% | 335 3% | 291 -11% | 317.2 -3% |
| Brightness (cd/m²) | 303 | 266 -12% | 303 0% | 319 5% | 266 -12% | 306 1% |
| Brightness Distribution (%) | 89 | 87 -2% | 86 -3% | 90 1% | 88 -1% | 89 0% |
| Black Level * (cd/m²) | 0.33 | 0.25 24% | 0.29 12% | 0.28 15% | 0.36 -9% | 0.31 6% |
| Contrast (:1) | 988 | 1144 16% | 1145 16% | 1196 21% | 808 -18% | 1023 4% |
| Colorchecker dE 2000 * | 2.73 | 2.14 22% | 3.61 -32% | 4.38 -60% | 2.98 -9% | 4.37 -60% |
| Colorchecker dE 2000 max. * | 9.54 | 5.22 45% | 7.71 19% | 9.48 1% | 7.59 20% | 6.62 31% |
| Colorchecker dE 2000 calibrated * | 1.36 | 0.67 51% | 0.59 57% | 1.33 2% | 0.91 33% | 2.67 -96% |
| Greyscale dE 2000 * | 5.2 | 2.8 46% | 5.2 -0% | 7 -35% | 4.2 19% | 4.5 13% |
| Gamma | 2.074 106% | 2.23 99% | 2.155 102% | 2.103 105% | 2.293 96% | 2.4 92% |
| CCT | 6911 94% | 7092 92% | 6724 97% | 6244 104% | 7624 85% | 7418 88% |
| Color Space (Percent of AdobeRGB 1998) (%) | 59.2 | |||||
| Color Space (Percent of sRGB) (%) | 91.4 | |||||
| Totalt genomsnitt (program/inställningar) | 18% /
19% | -3% /
4% | -10% /
-7% | -10% /
-3% | -9% /
-10% |
* ... mindre är bättre
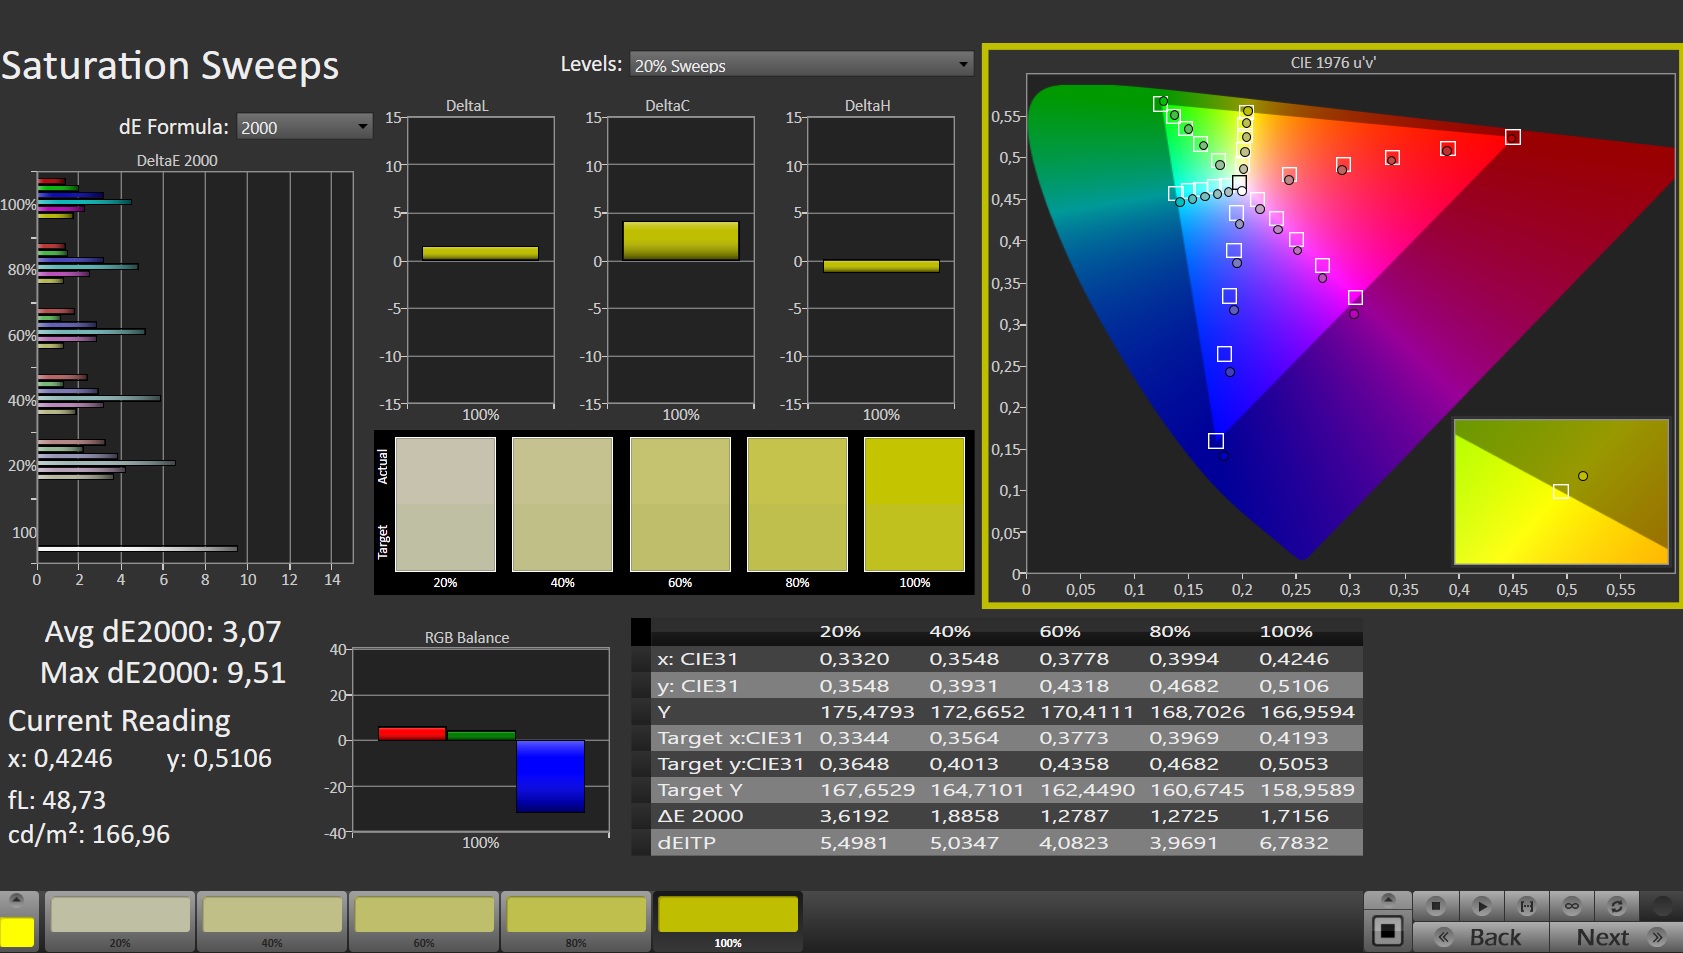
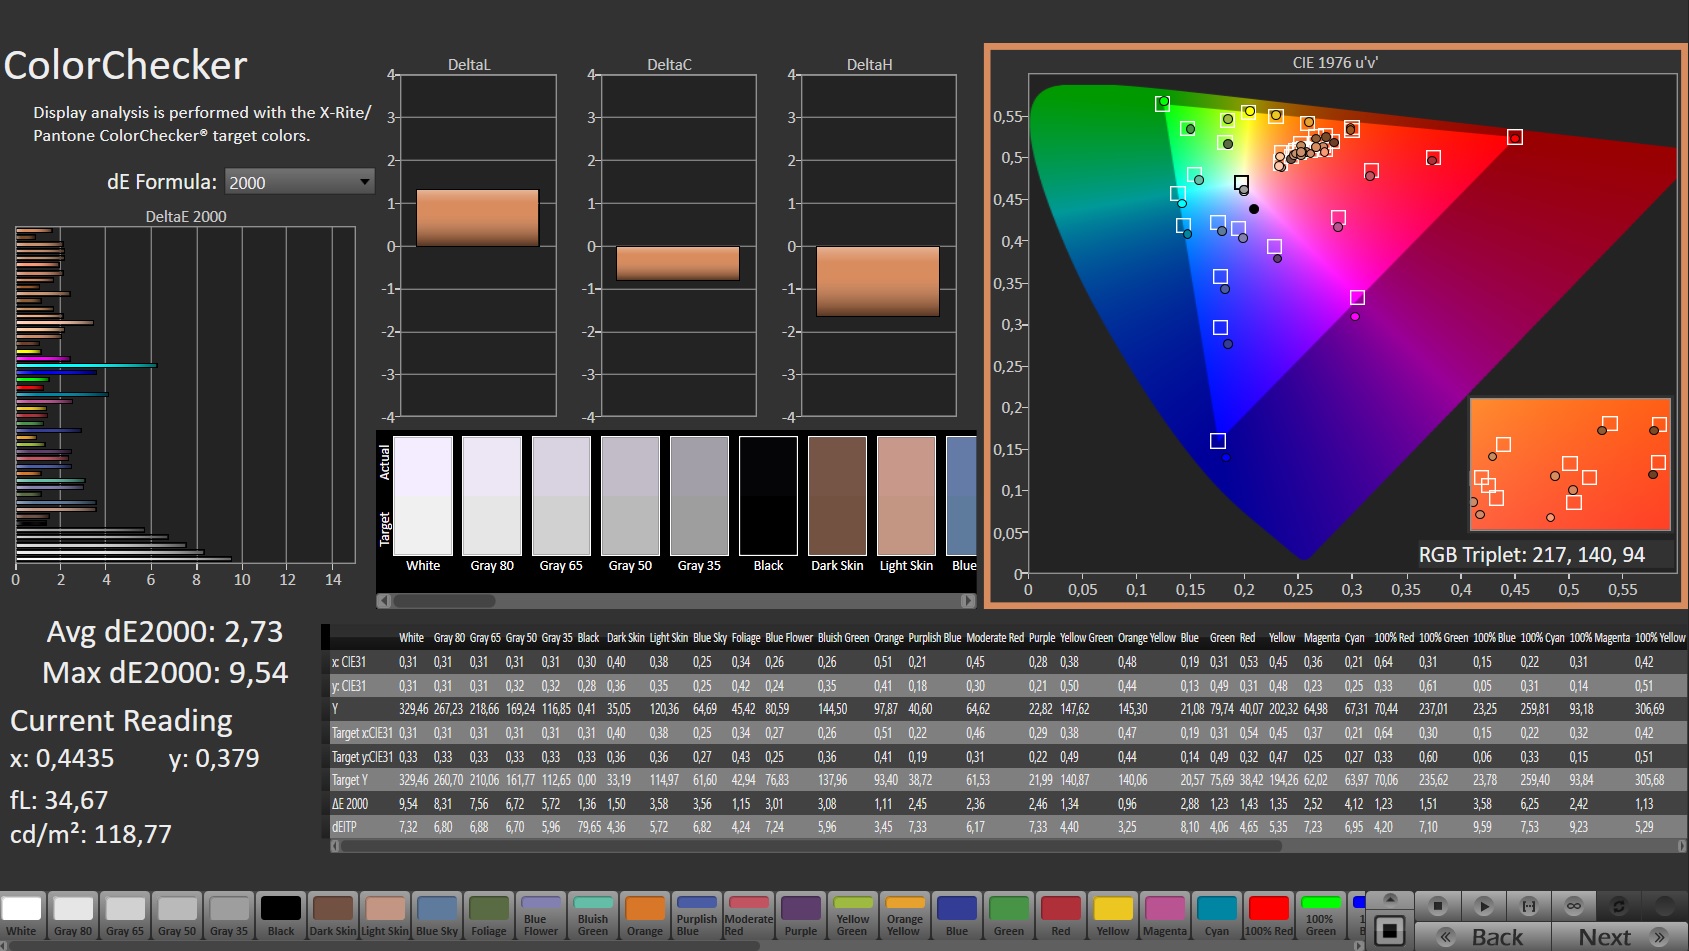
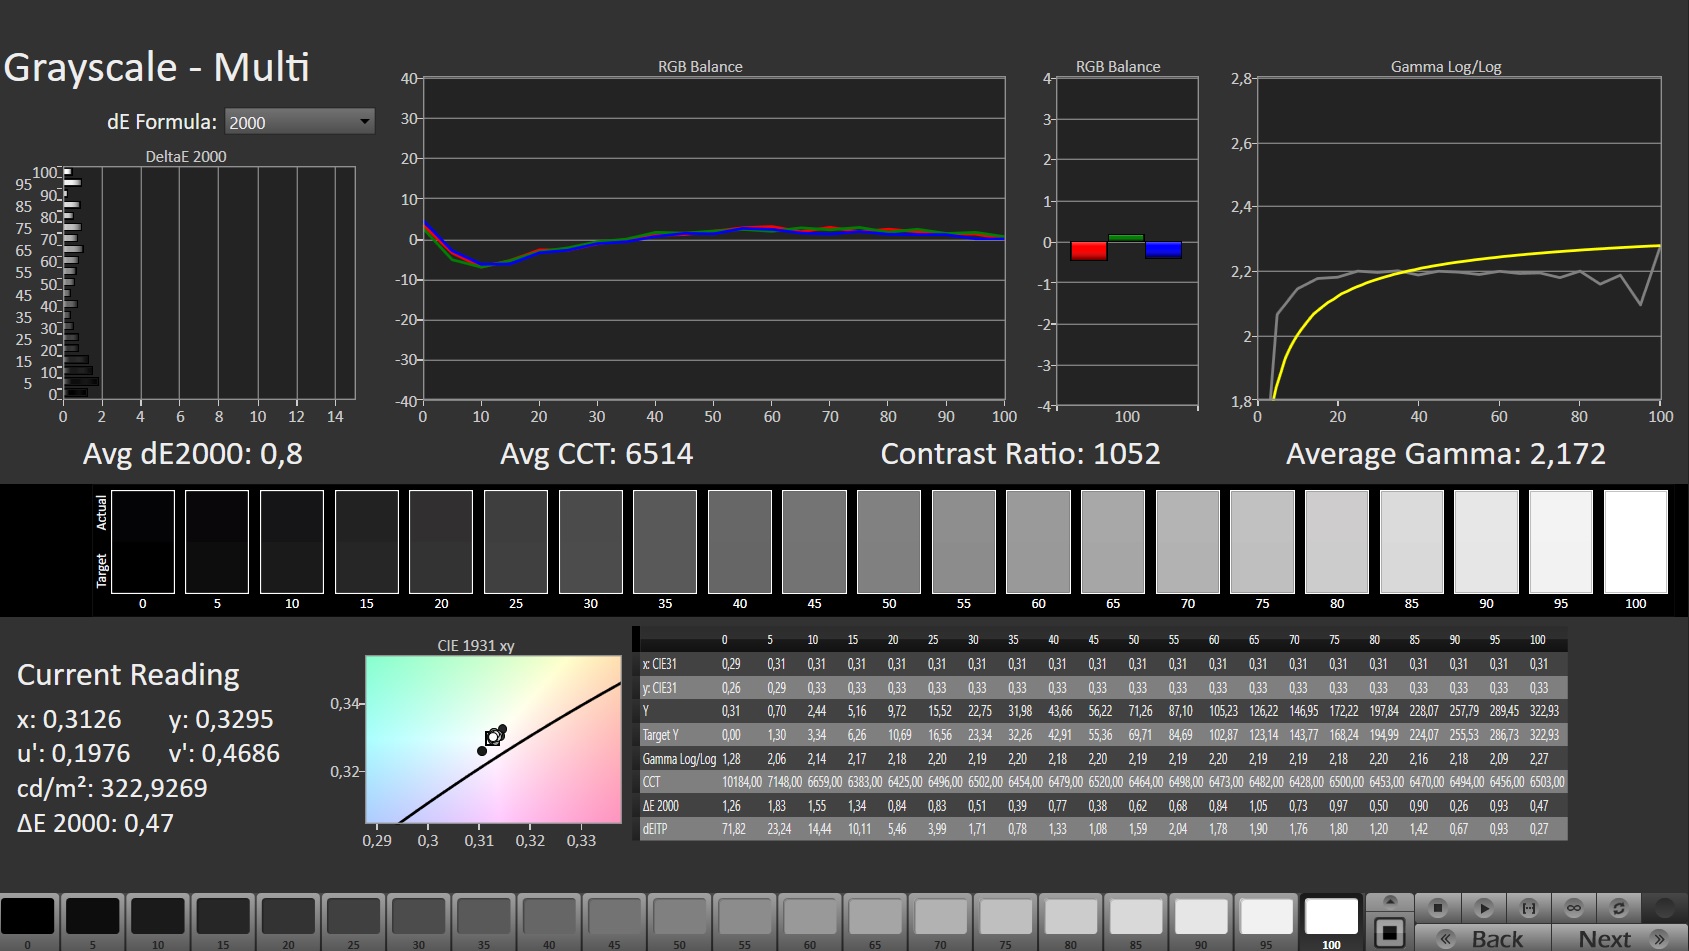
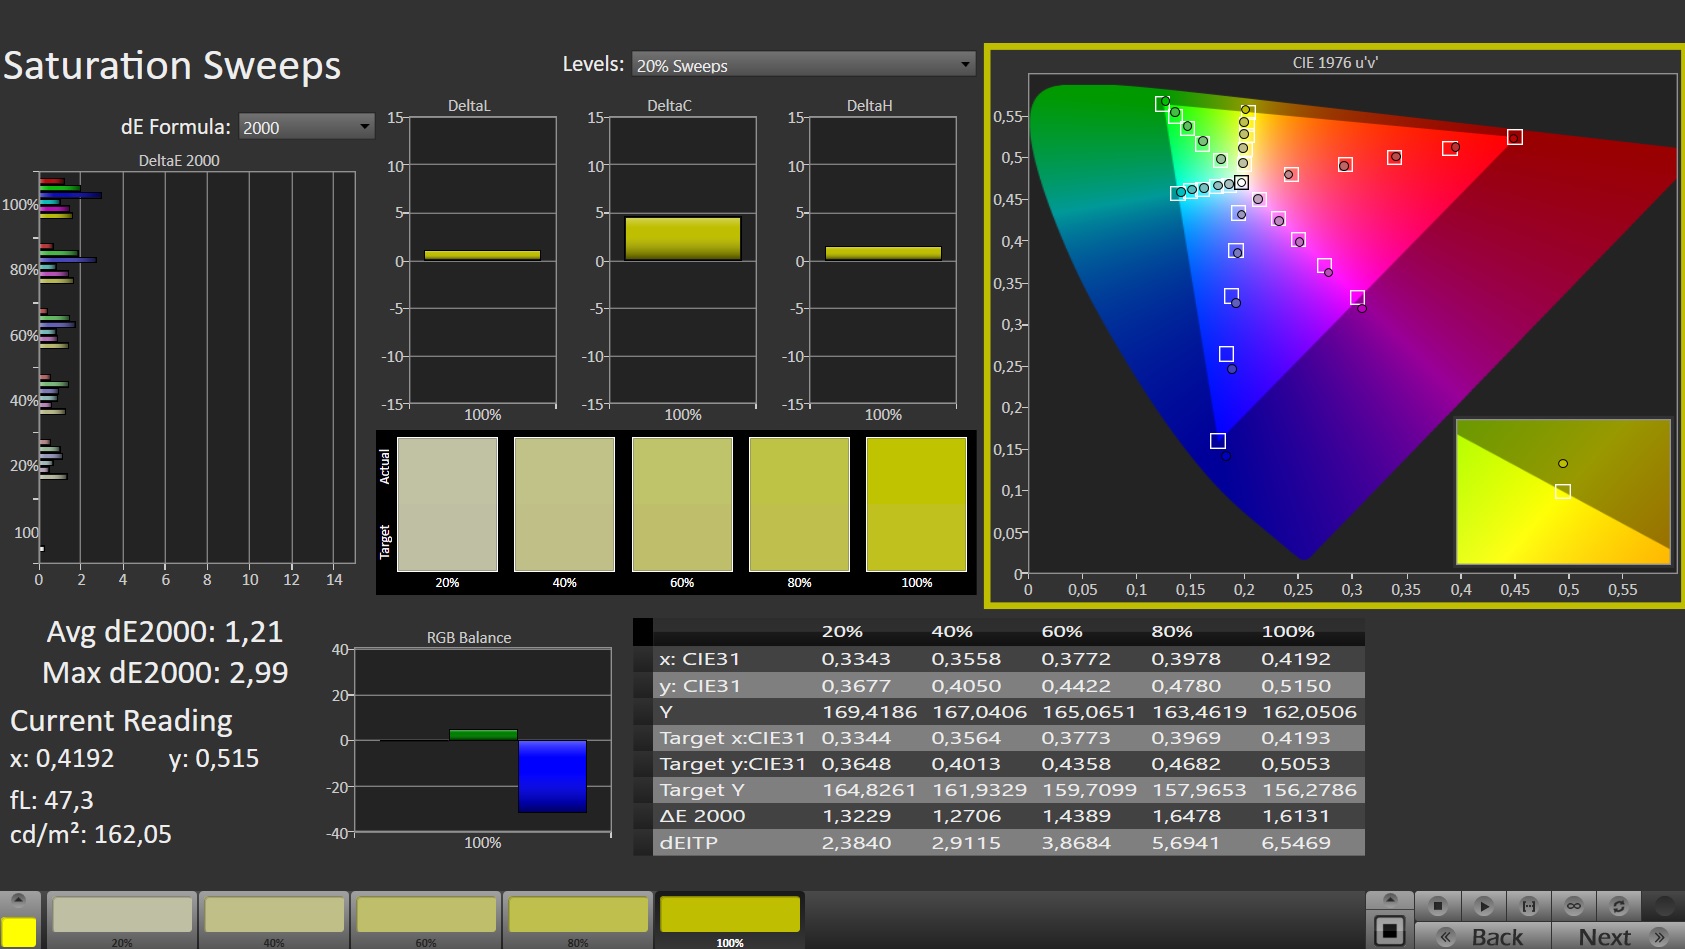
Skärmen återger färgerna bra redan från början. Avvikelsen på 2,73 ligger inom målintervallet (Delta E < 3) - denna lilla avvikelse är inte märkbar för tittarna. Kalibrering leder till förbättringar: Färgavvikelsen sjunker till 1,36, och gråskalan visas på ett mer balanserat sätt. Skärmen kan återge sRGB-färgrymden (96,7 %) nästan helt och hållet; AdobeRGB- och DCI-P3-färgrymderna återges till 68 % respektive 67 %
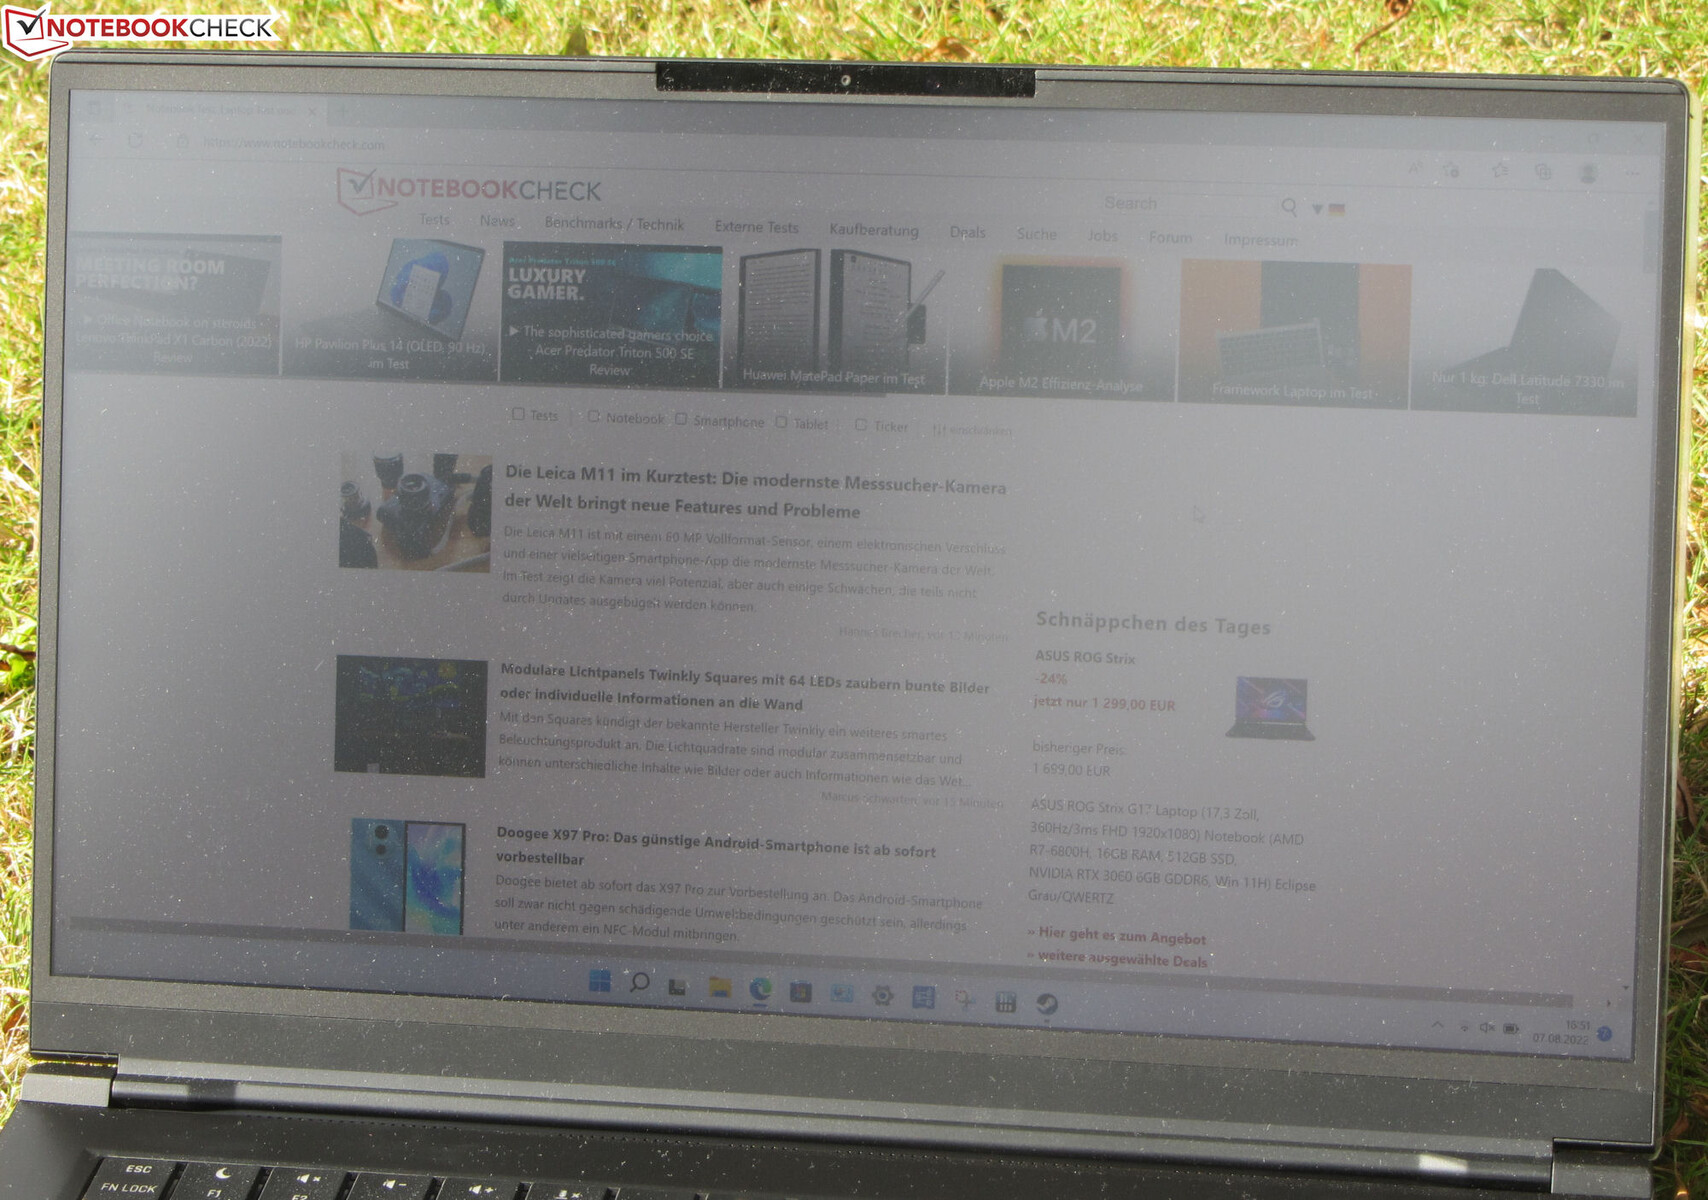
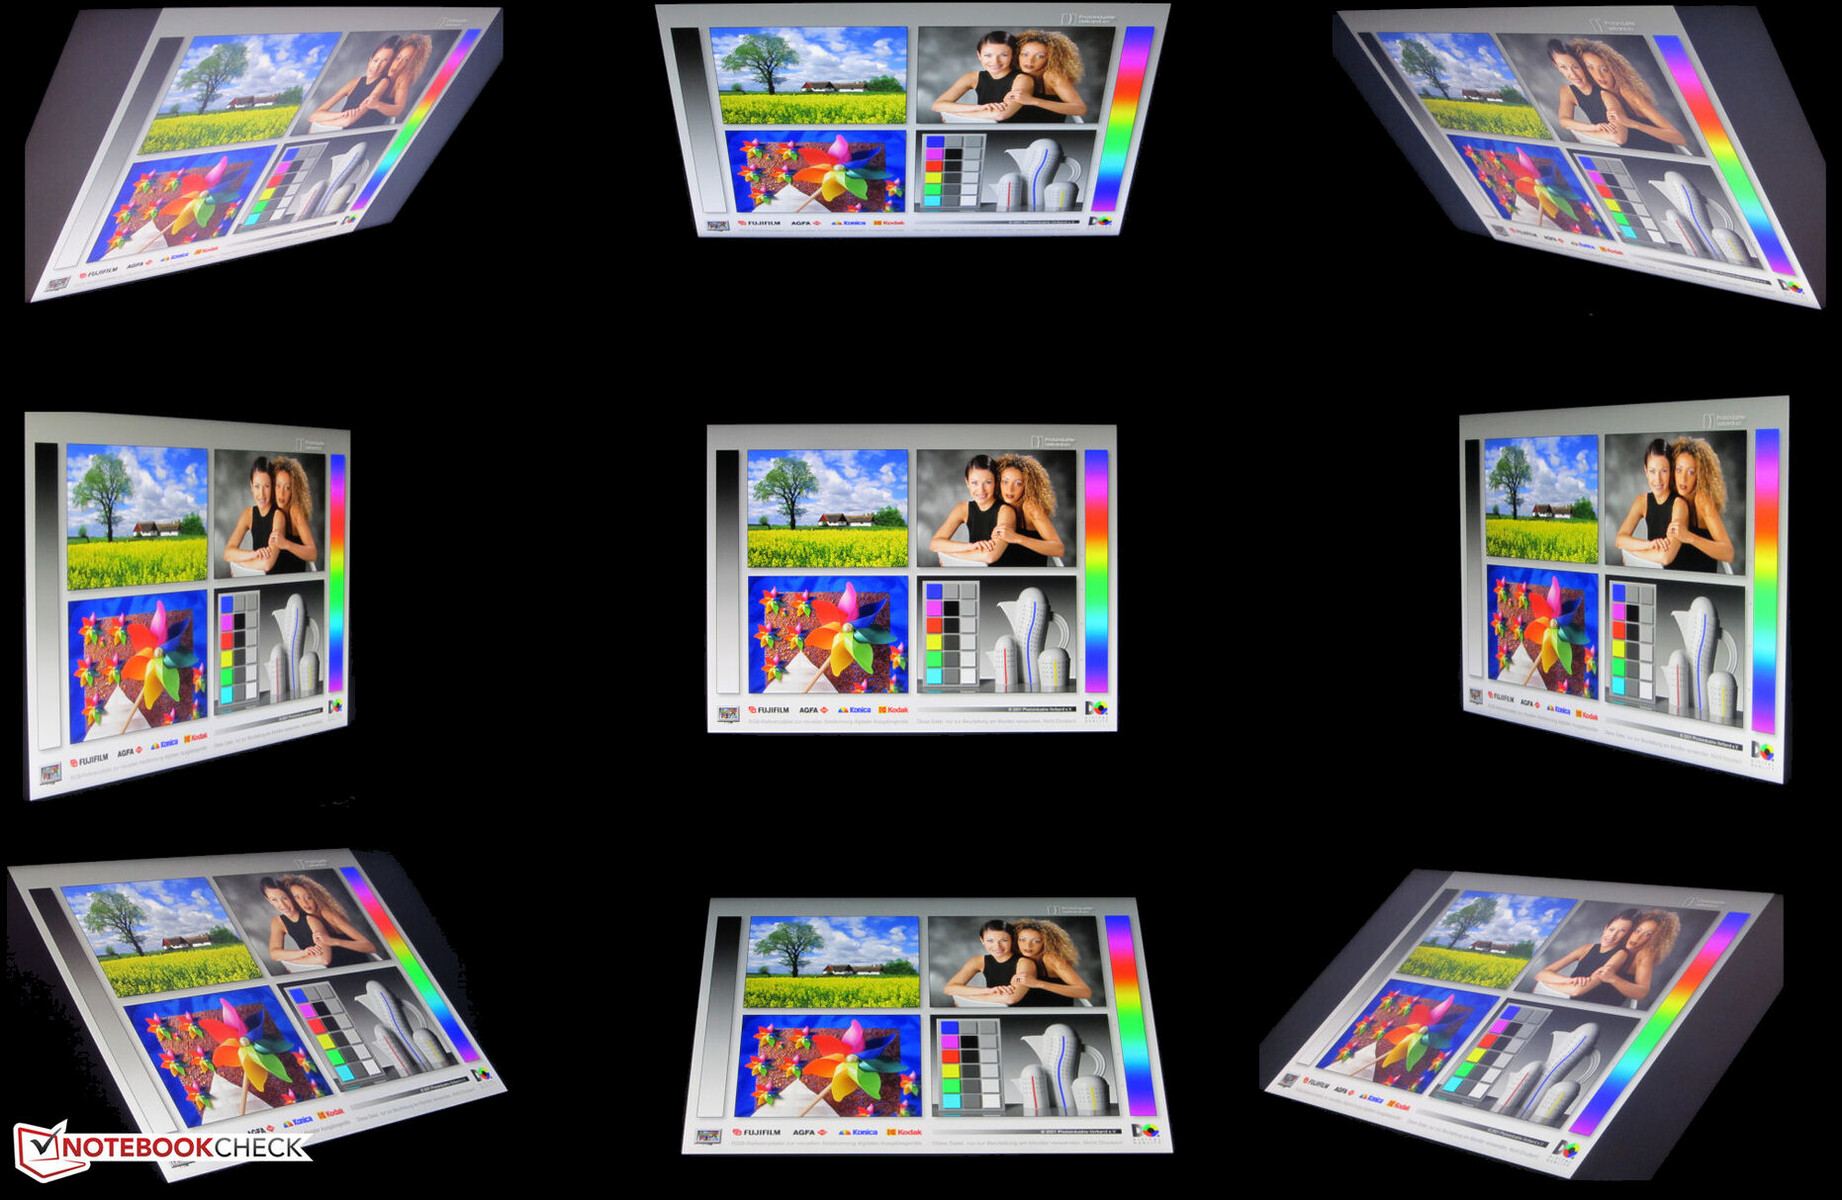
Den stabila IPS-panelen med en visningsvinkel är läsbar från vilken position som helst. Läsbarhet utomhus är möjlig när solen inte skiner för starkt
Visa svarstider
| ↔ Svarstid svart till vitt | ||
|---|---|---|
| 7 ms ... stiga ↗ och falla ↘ kombinerat | ↗ 3.3 ms stiga | 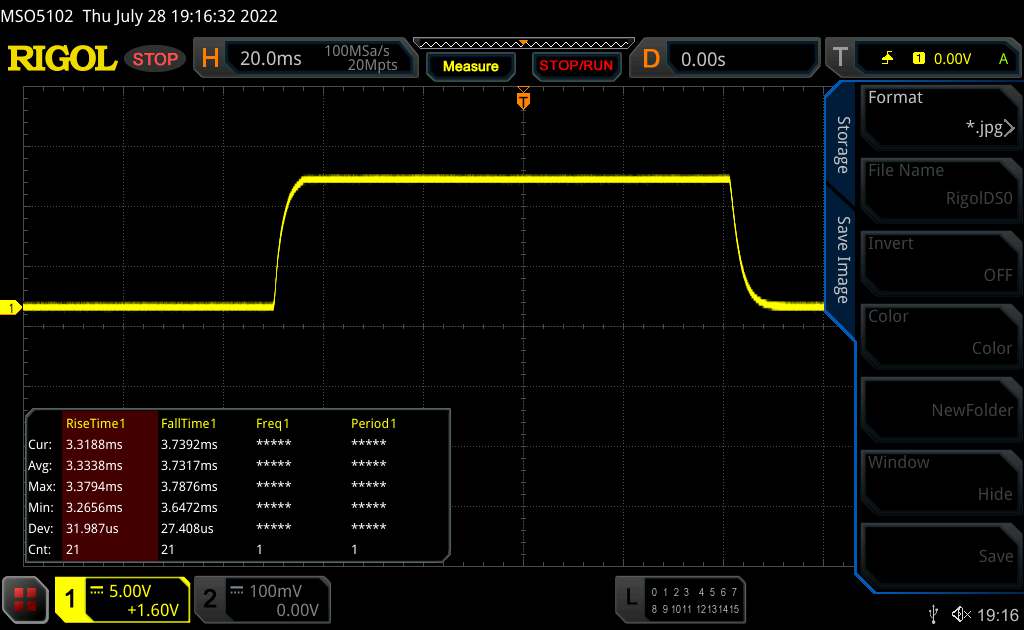 |
| ↘ 3.7 ms hösten | ||
| Skärmen visar väldigt snabba svarsfrekvenser i våra tester och borde vara mycket väl lämpad för fartfyllt spel. I jämförelse sträcker sig alla testade enheter från 0.1 (minst) till 240 (maximalt) ms. » 21 % av alla enheter är bättre. Det betyder att den uppmätta svarstiden är bättre än genomsnittet av alla testade enheter (19.8 ms). | ||
| ↔ Svarstid 50 % grått till 80 % grått | ||
| 11.6 ms ... stiga ↗ och falla ↘ kombinerat | ↗ 5.6 ms stiga | 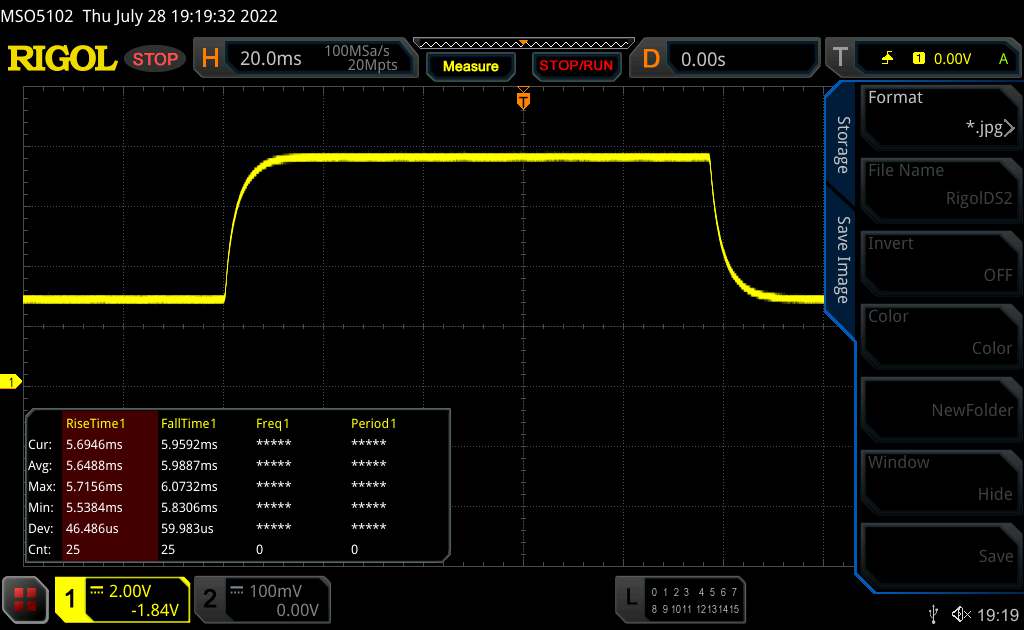 |
| ↘ 6 ms hösten | ||
| Skärmen visar bra svarsfrekvens i våra tester, men kan vara för långsam för konkurrenskraftiga spelare. I jämförelse sträcker sig alla testade enheter från 0.165 (minst) till 636 (maximalt) ms. » 25 % av alla enheter är bättre. Det betyder att den uppmätta svarstiden är bättre än genomsnittet av alla testade enheter (30.9 ms). | ||
Skärmflimmer / PWM (Puls-Width Modulation)
| Skärmflimmer / PWM upptäcktes inte |  | ||
Som jämförelse: 52 % av alla testade enheter använder inte PWM för att dämpa skärmen. Om PWM upptäcktes mättes ett medelvärde av 7744 (minst: 5 - maximum: 343500) Hz. | |||
Prestanda - Tiger Lake möter Ampere
Med XMG Fusion 15 har Schenker en kraftfull bärbar dator på 15,6 tum i sitt sortiment som är utformad för olika användningsområden
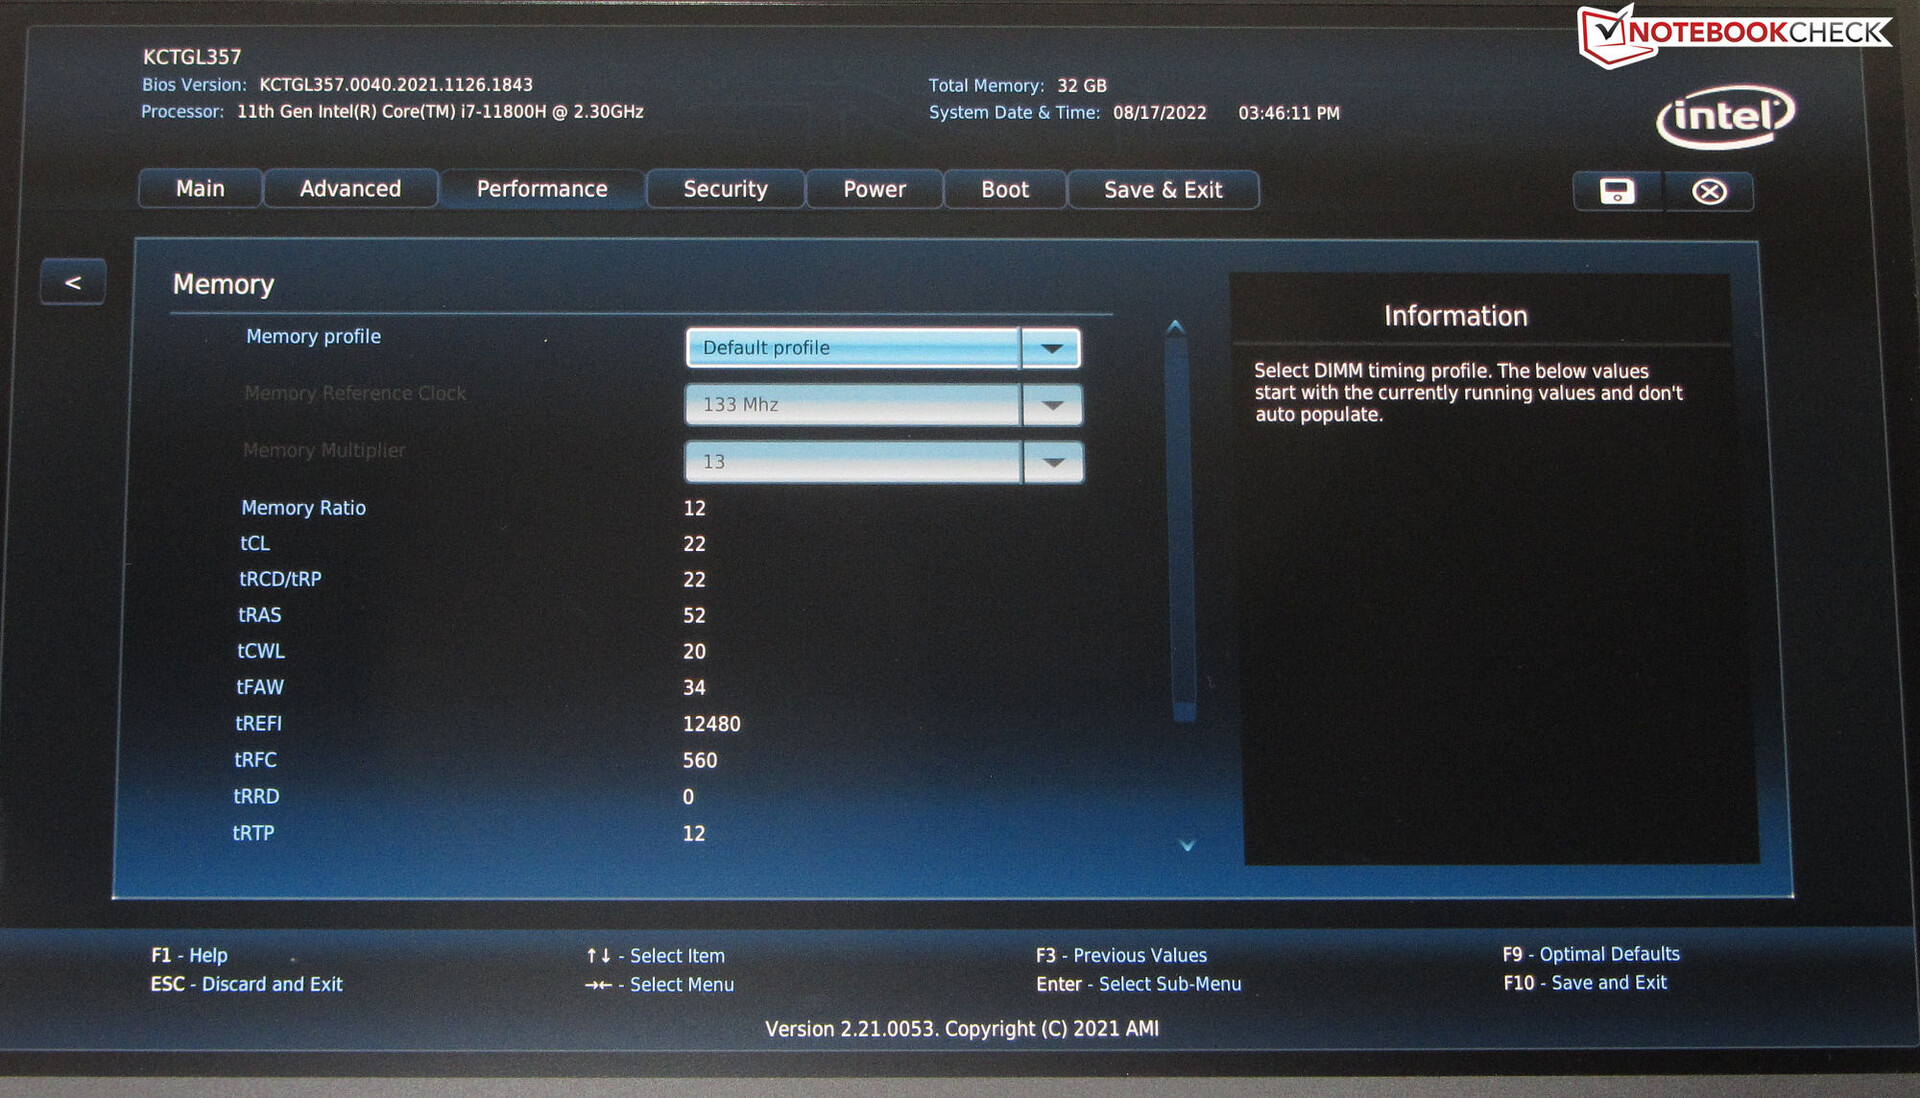
Provningsvillkor
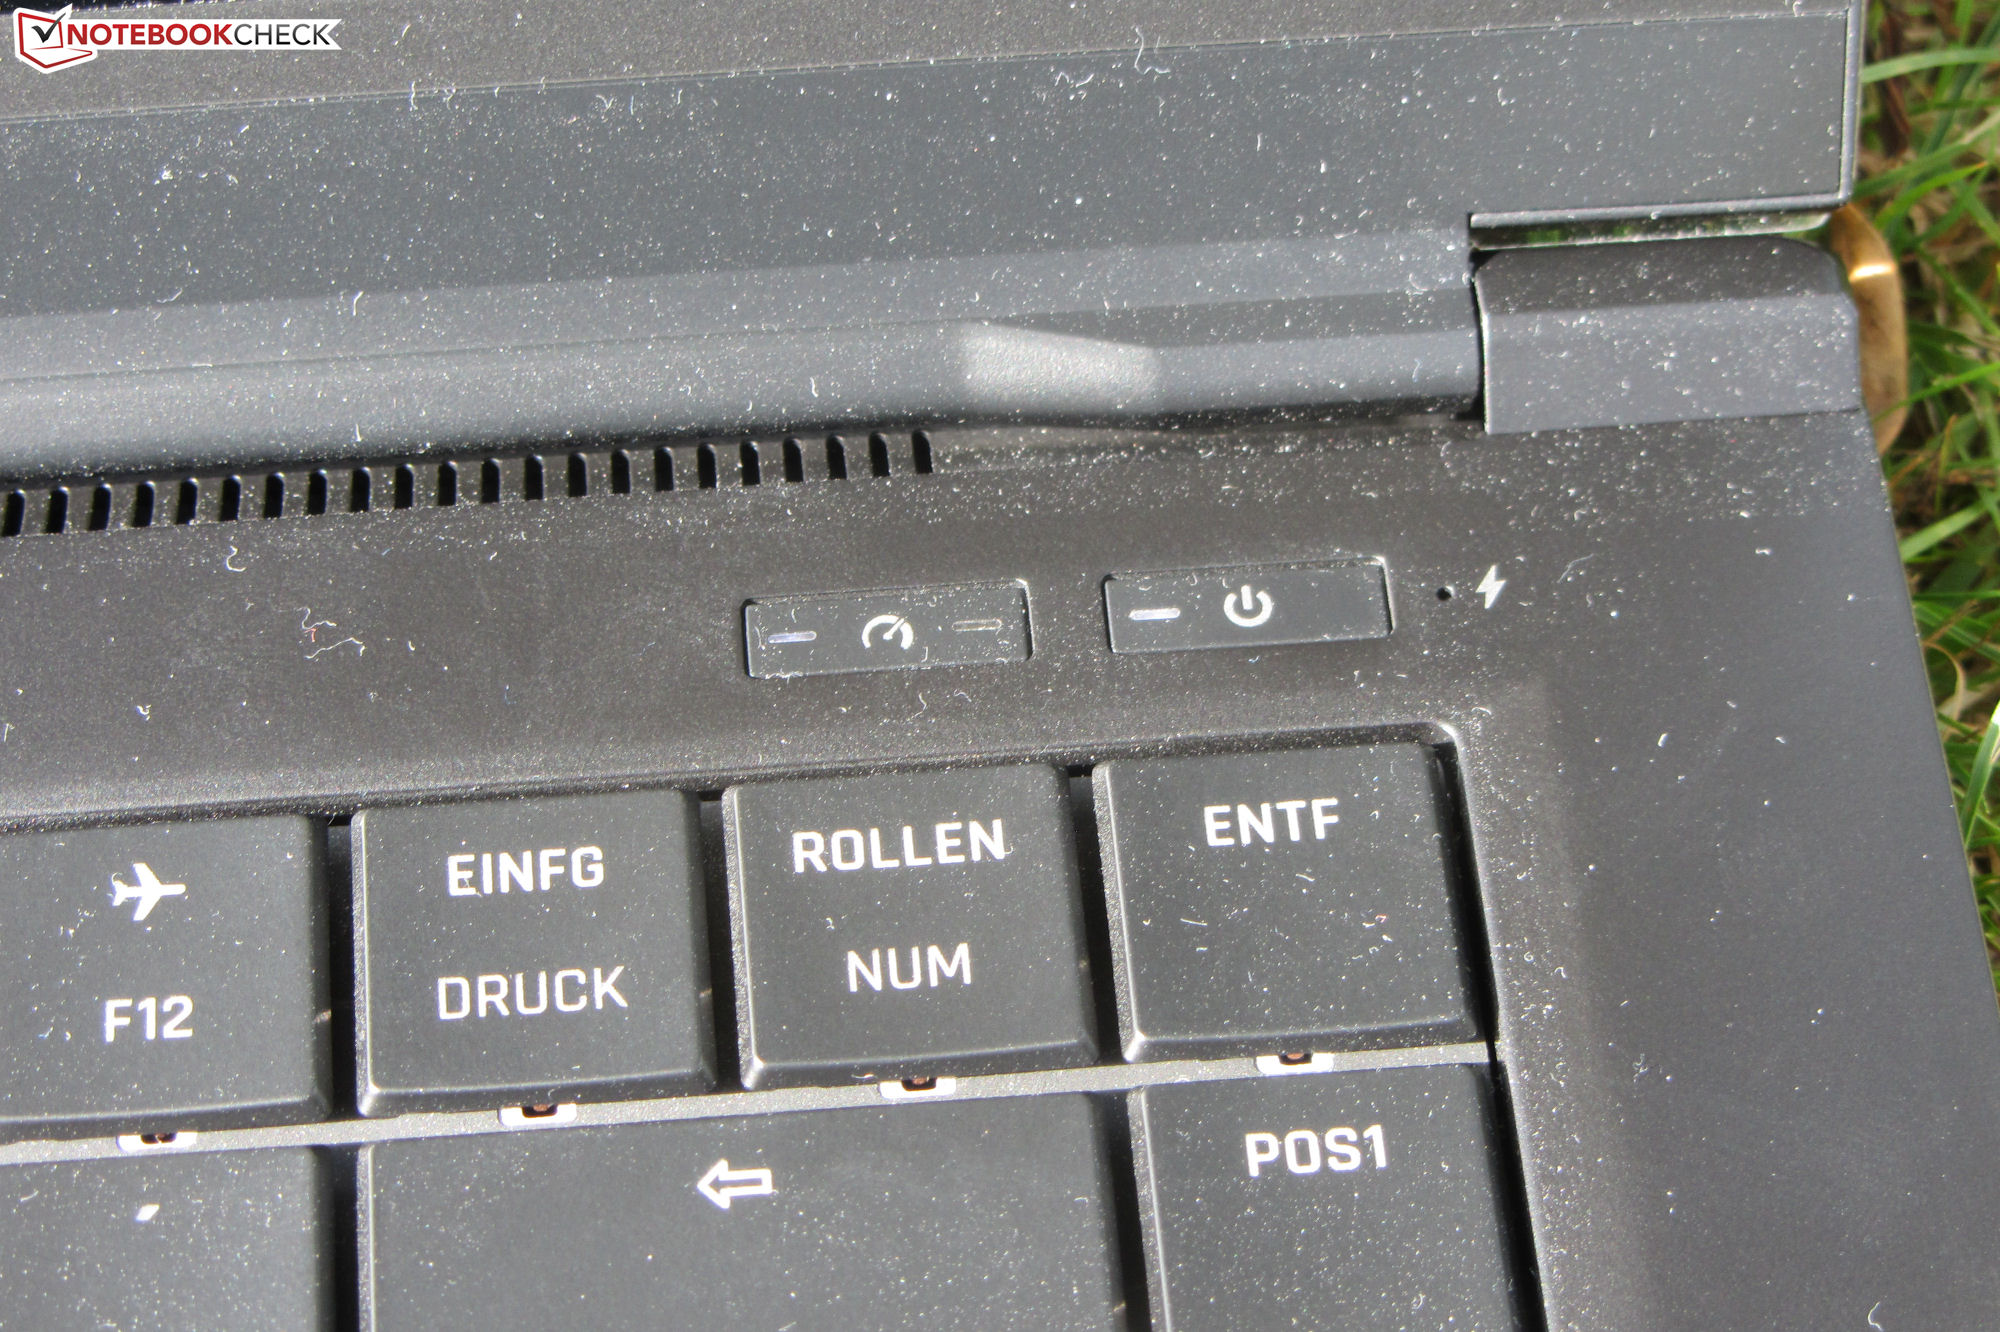
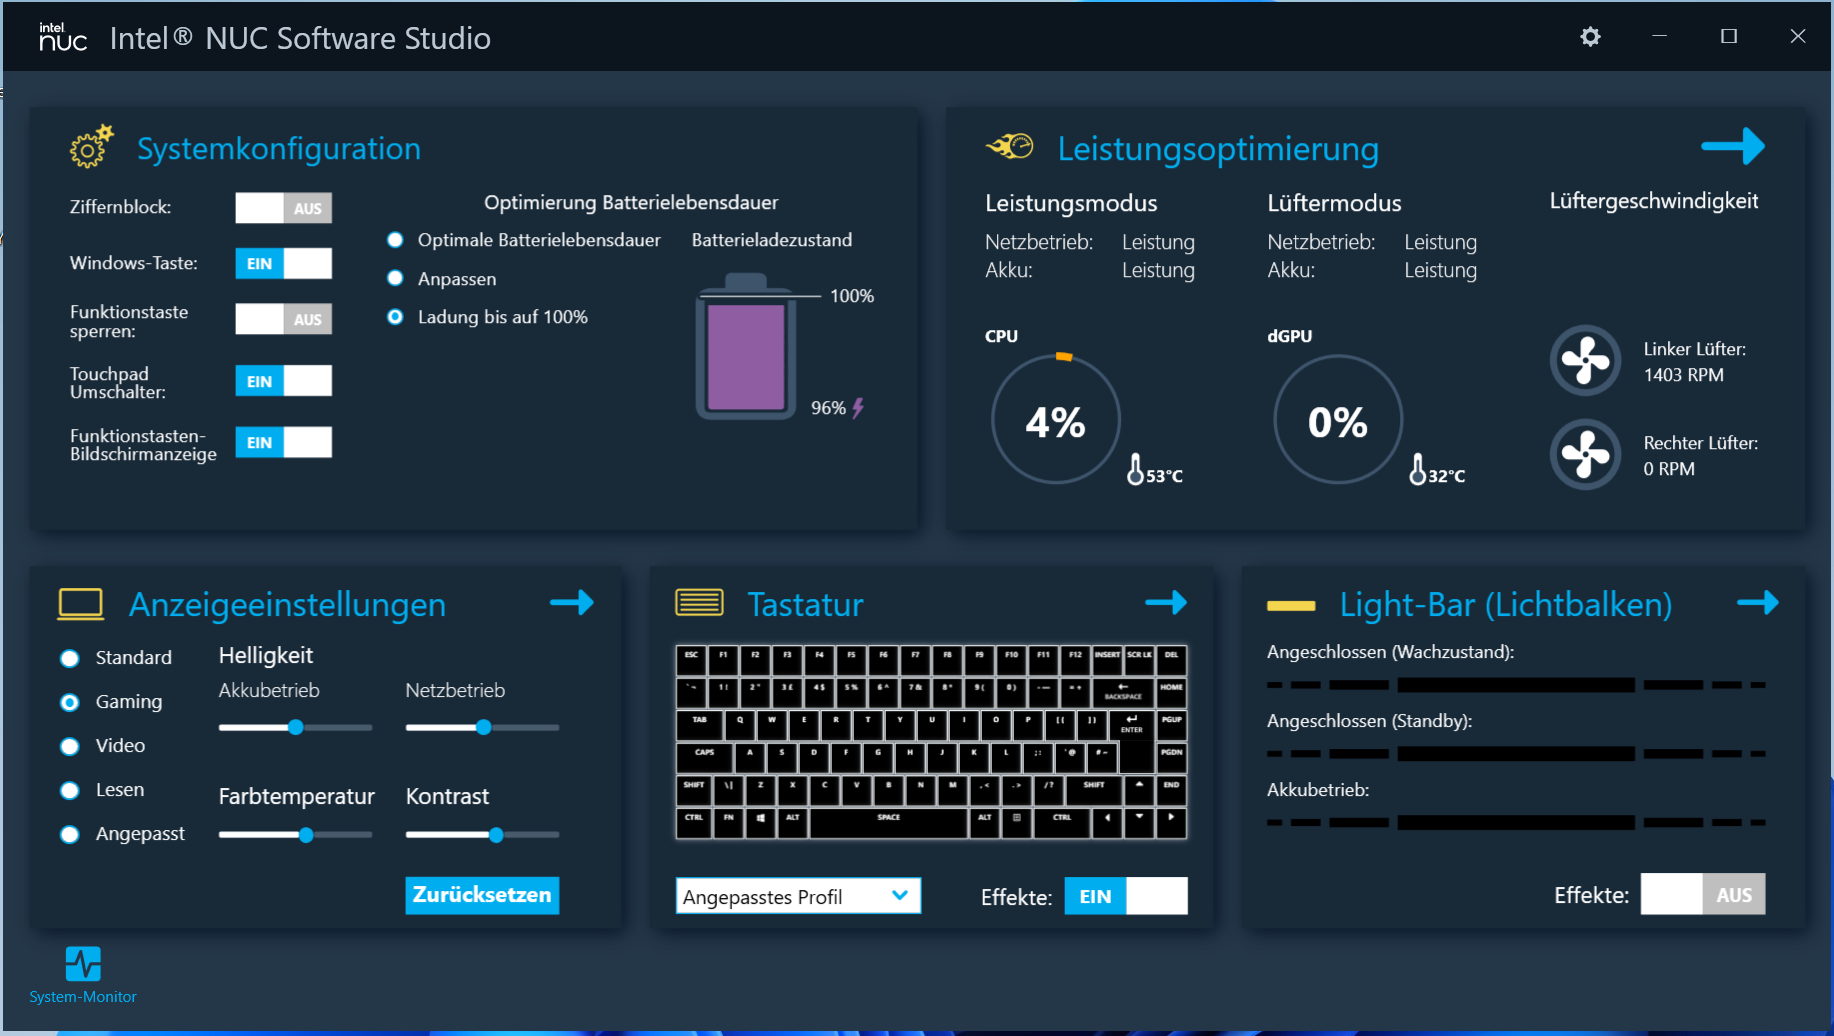
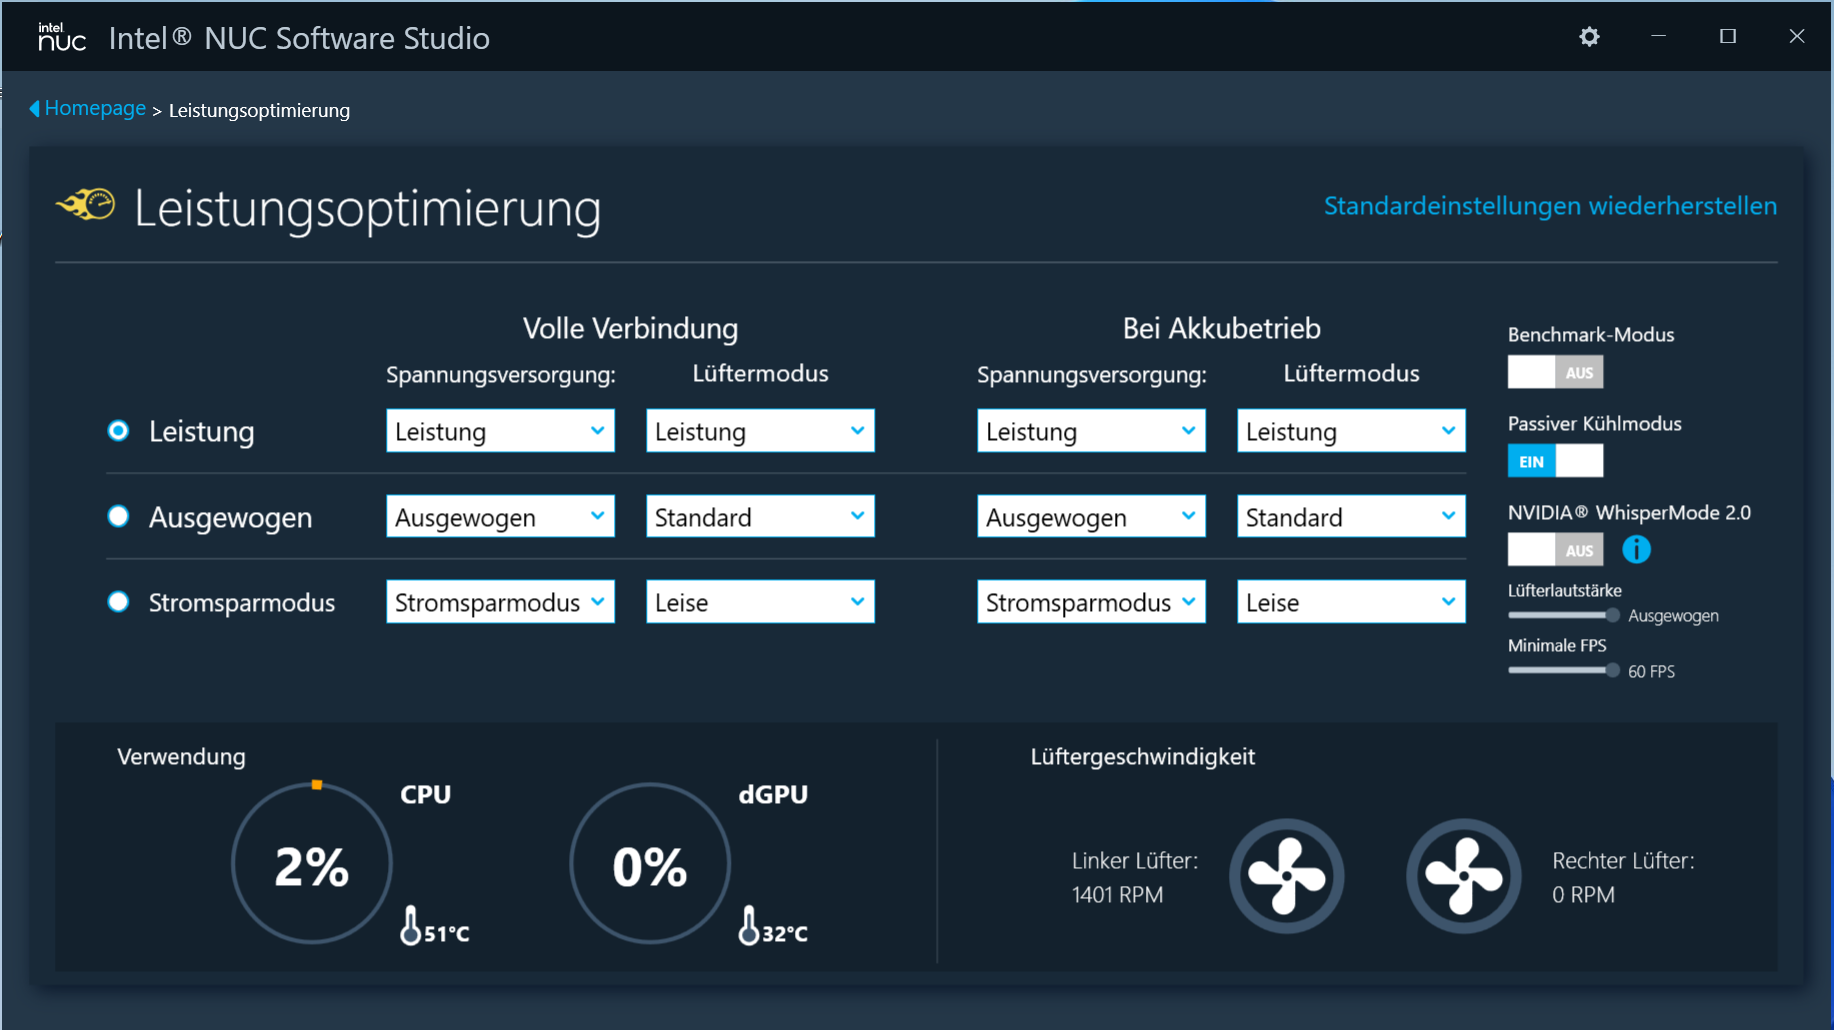
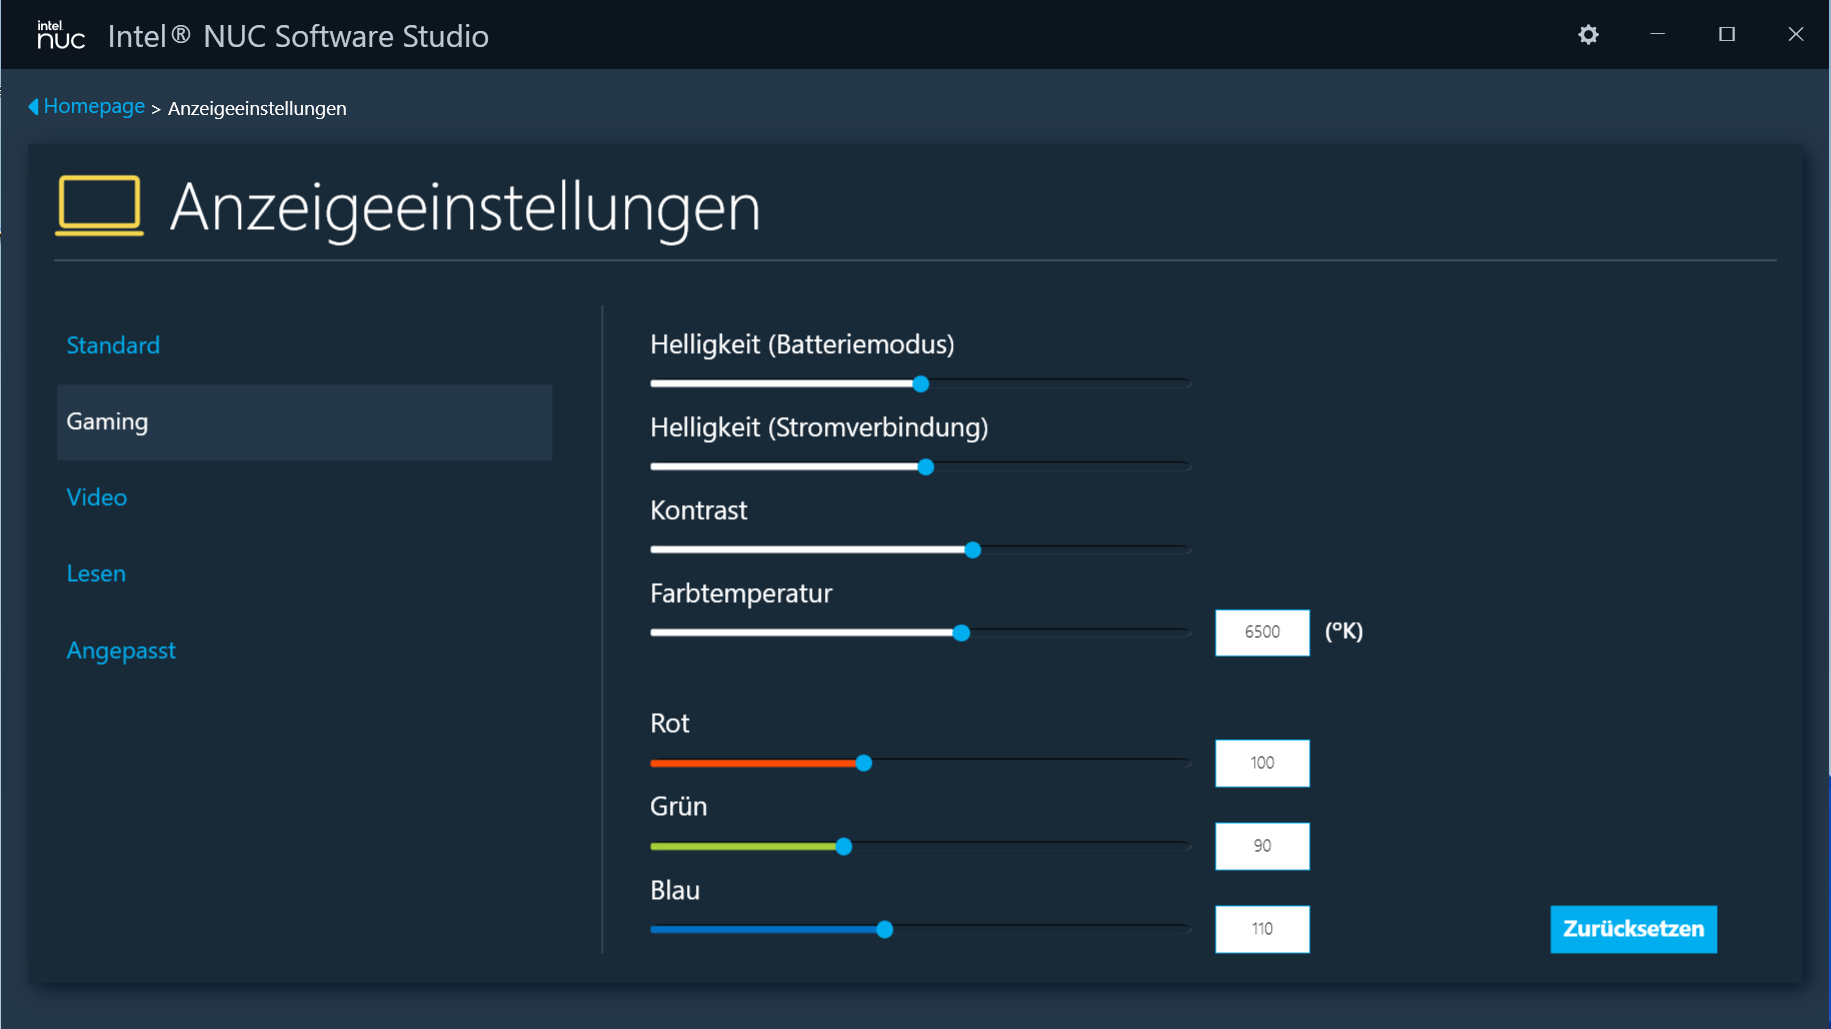
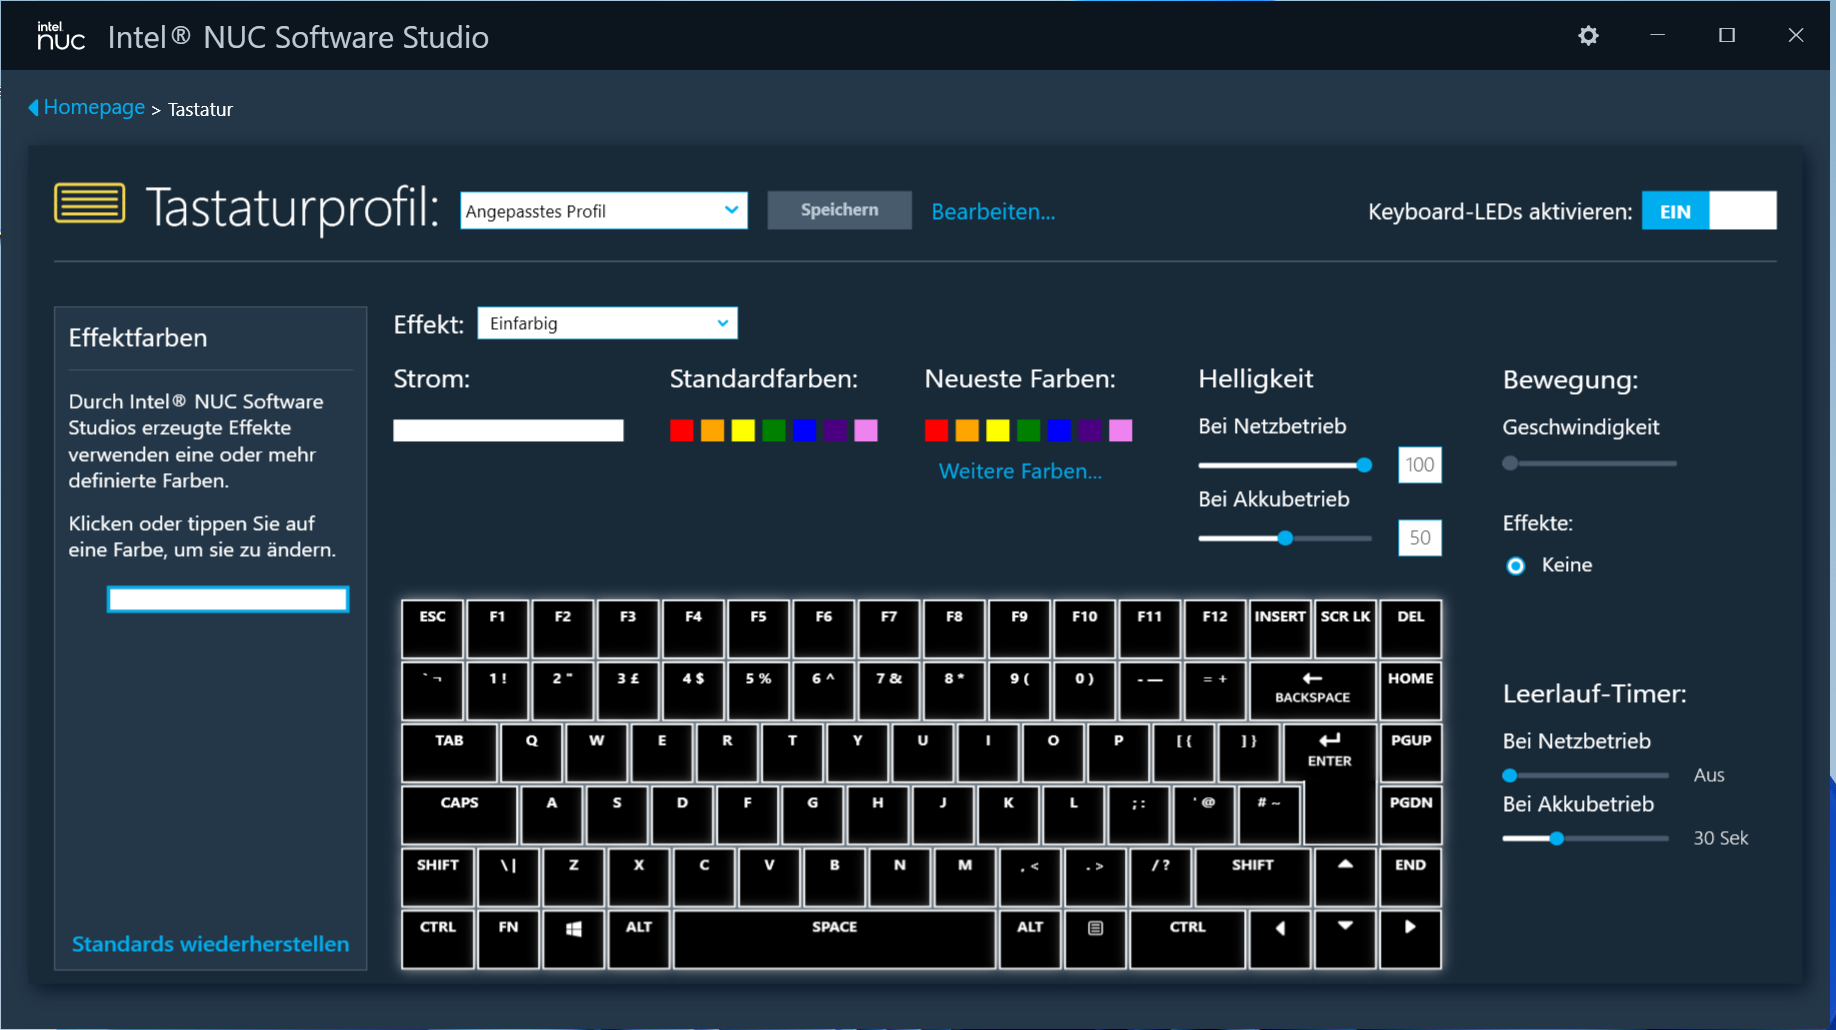
Den bärbara datorns förinstallerade kontrollcenter (Intel NUC Software Studio) gör det möjligt för användaren att bland annat justera prestandan. Det finns tre prestandaprofiler tillgängliga, som man kan växla mellan i programmet eller via en separat knapp (bredvid strömbrytaren). En fjärde profil finns tillgänglig inom centret, som endast kan aktiveras med ett musklick: "Benchmark mode". Denna profil frigör den inbyggda maskinvarans maximala prestanda och låter fläktarna kontinuerligt arbeta med full effekt.
Vårt test körs med profilen "Balanserad" och den aktiva funktionen "Passivt kylningsläge". Detta är standardinställningarna som finns i förpackningen. Det passiva kylningsläget gör att fläktarna stannar så snart temperaturerna tillåter det. Annars skulle en fläkt permanent köras med låg hastighet.
| Prestanda | Balanserad | Energisparande | Benchmark Mode | |
|---|---|---|---|---|
| Effektbegränsning 1 | 65 W | 45 W | 30 W | 100 W |
| Effektgräns 2 | 90 W | 65 W | 60 W | 110 W |
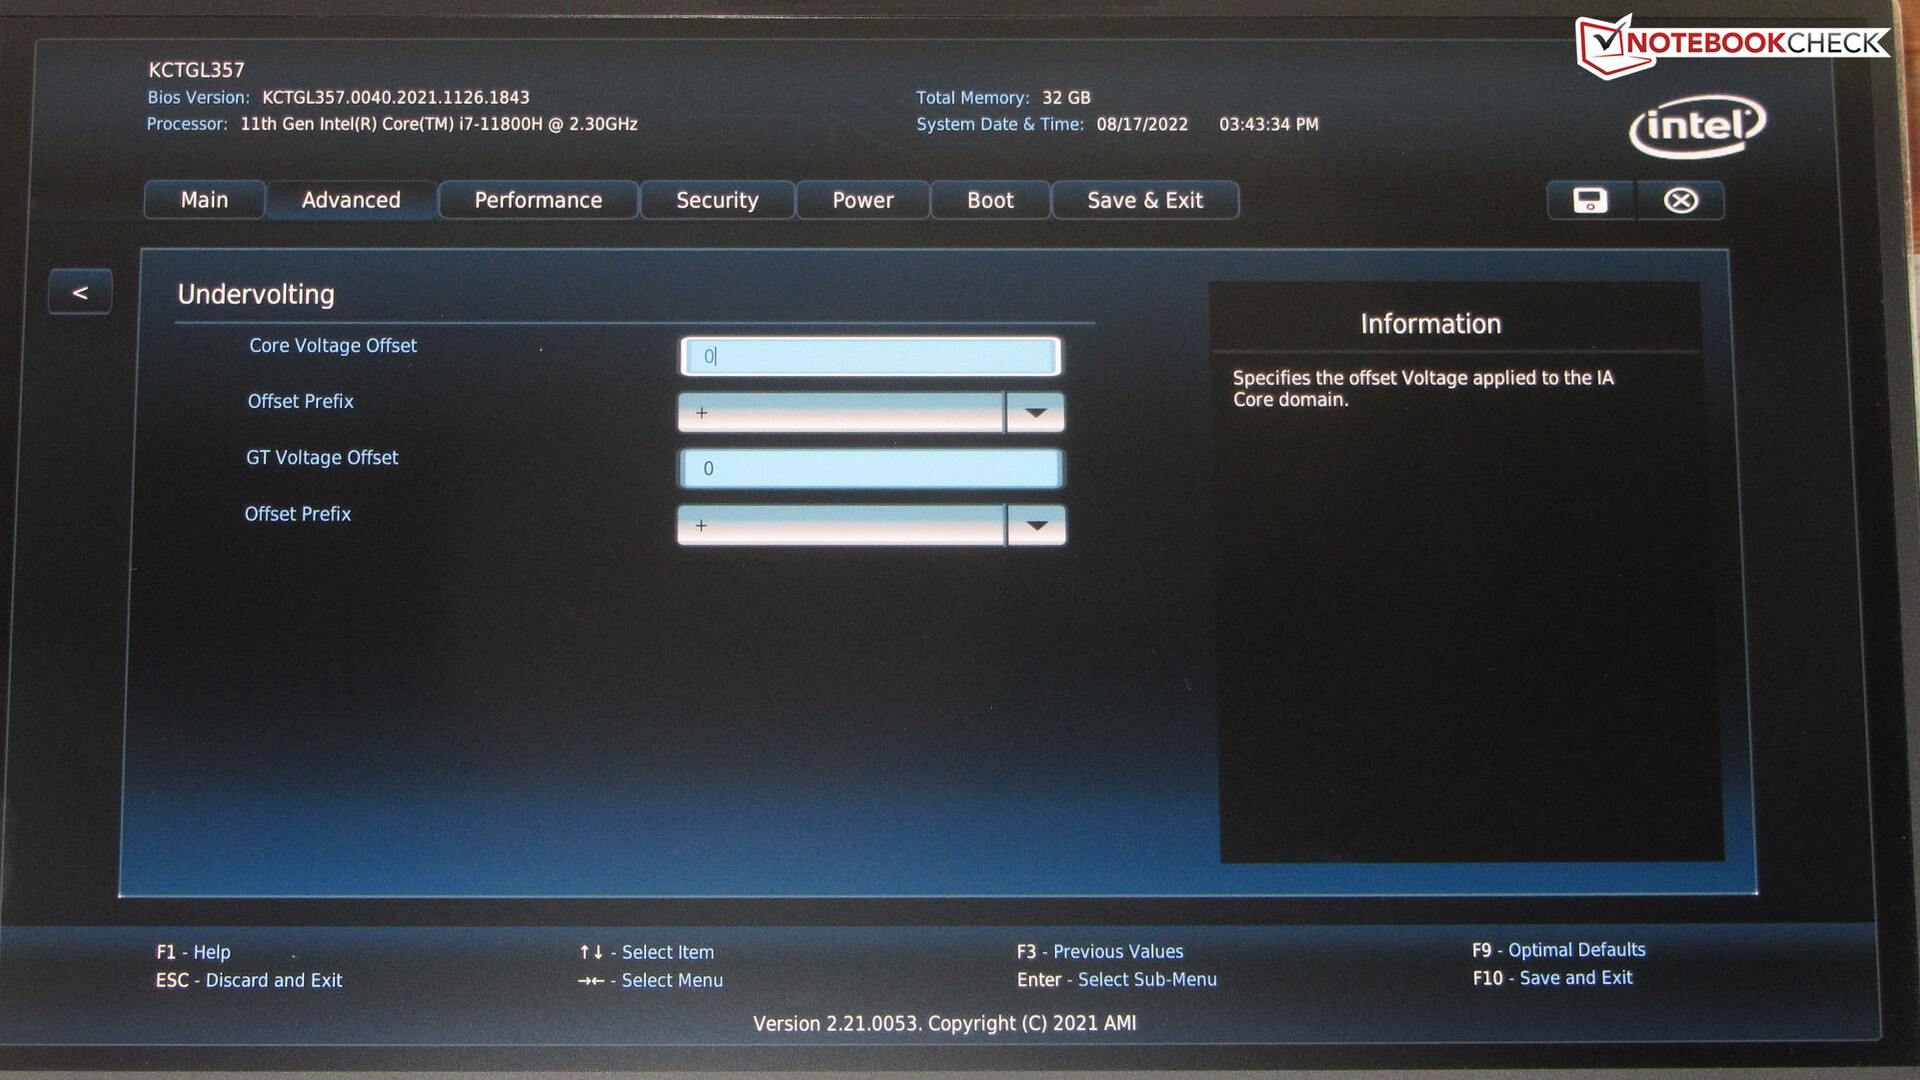
Undervolting via BIOS
Processorn och iGPU:n kan drivas med lägre spänningar än vad tillverkaren har avsett (undervolting). Som ett resultat av detta minskar energiförbrukningen och värmeutvecklingen. Men se upp: Att sänka spänningen för mycket kan leda till ett instabilt eller felaktigt system. I det här fallet är det nödvändigt att återgå till den tidigare spänningsnivån. Undervolting görs på användarens egen risk
Processor
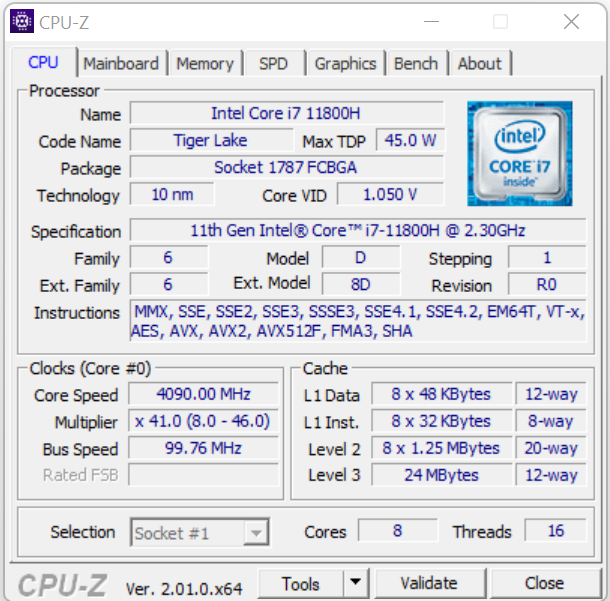
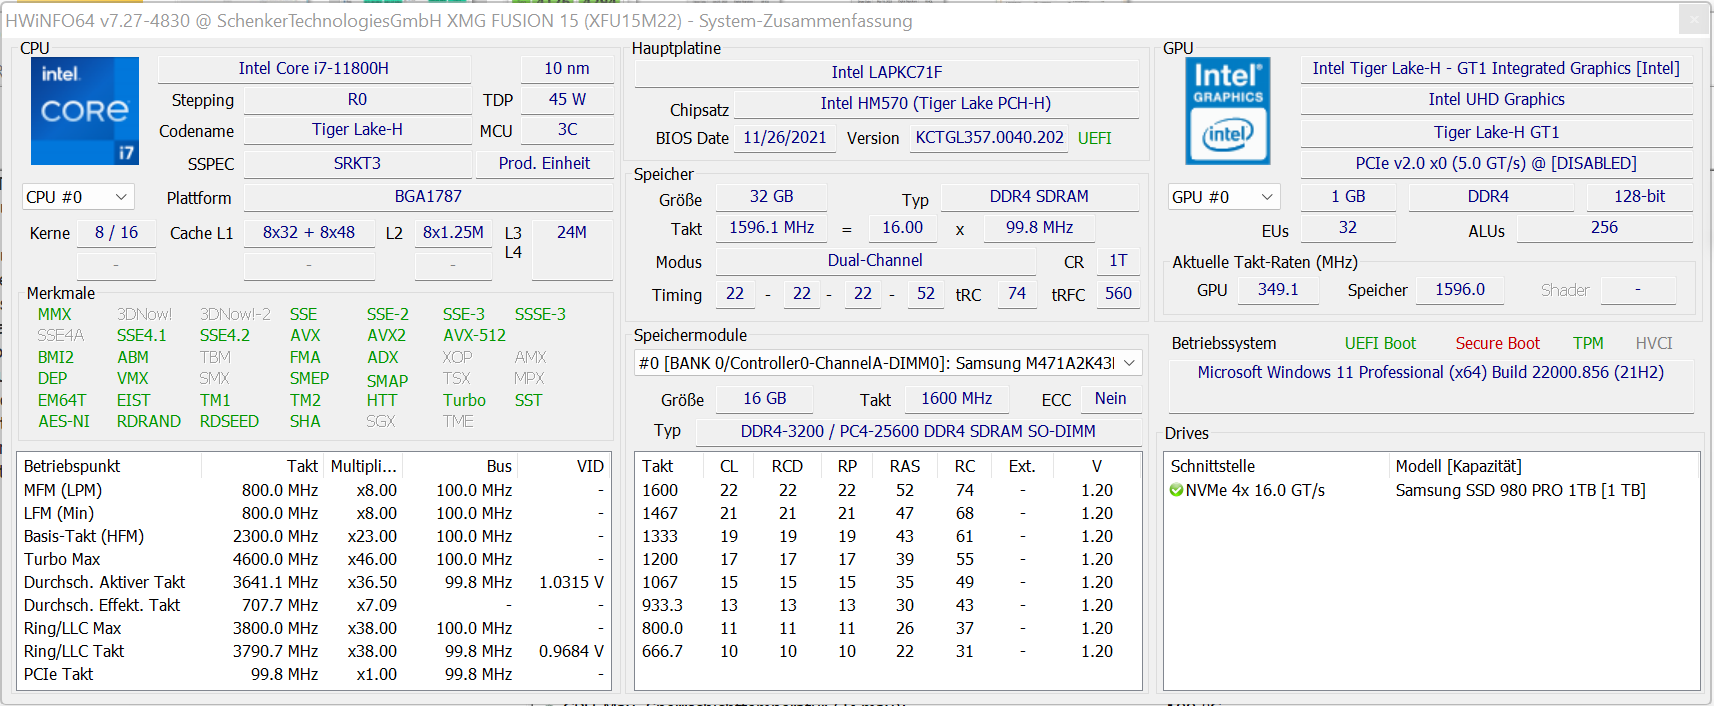
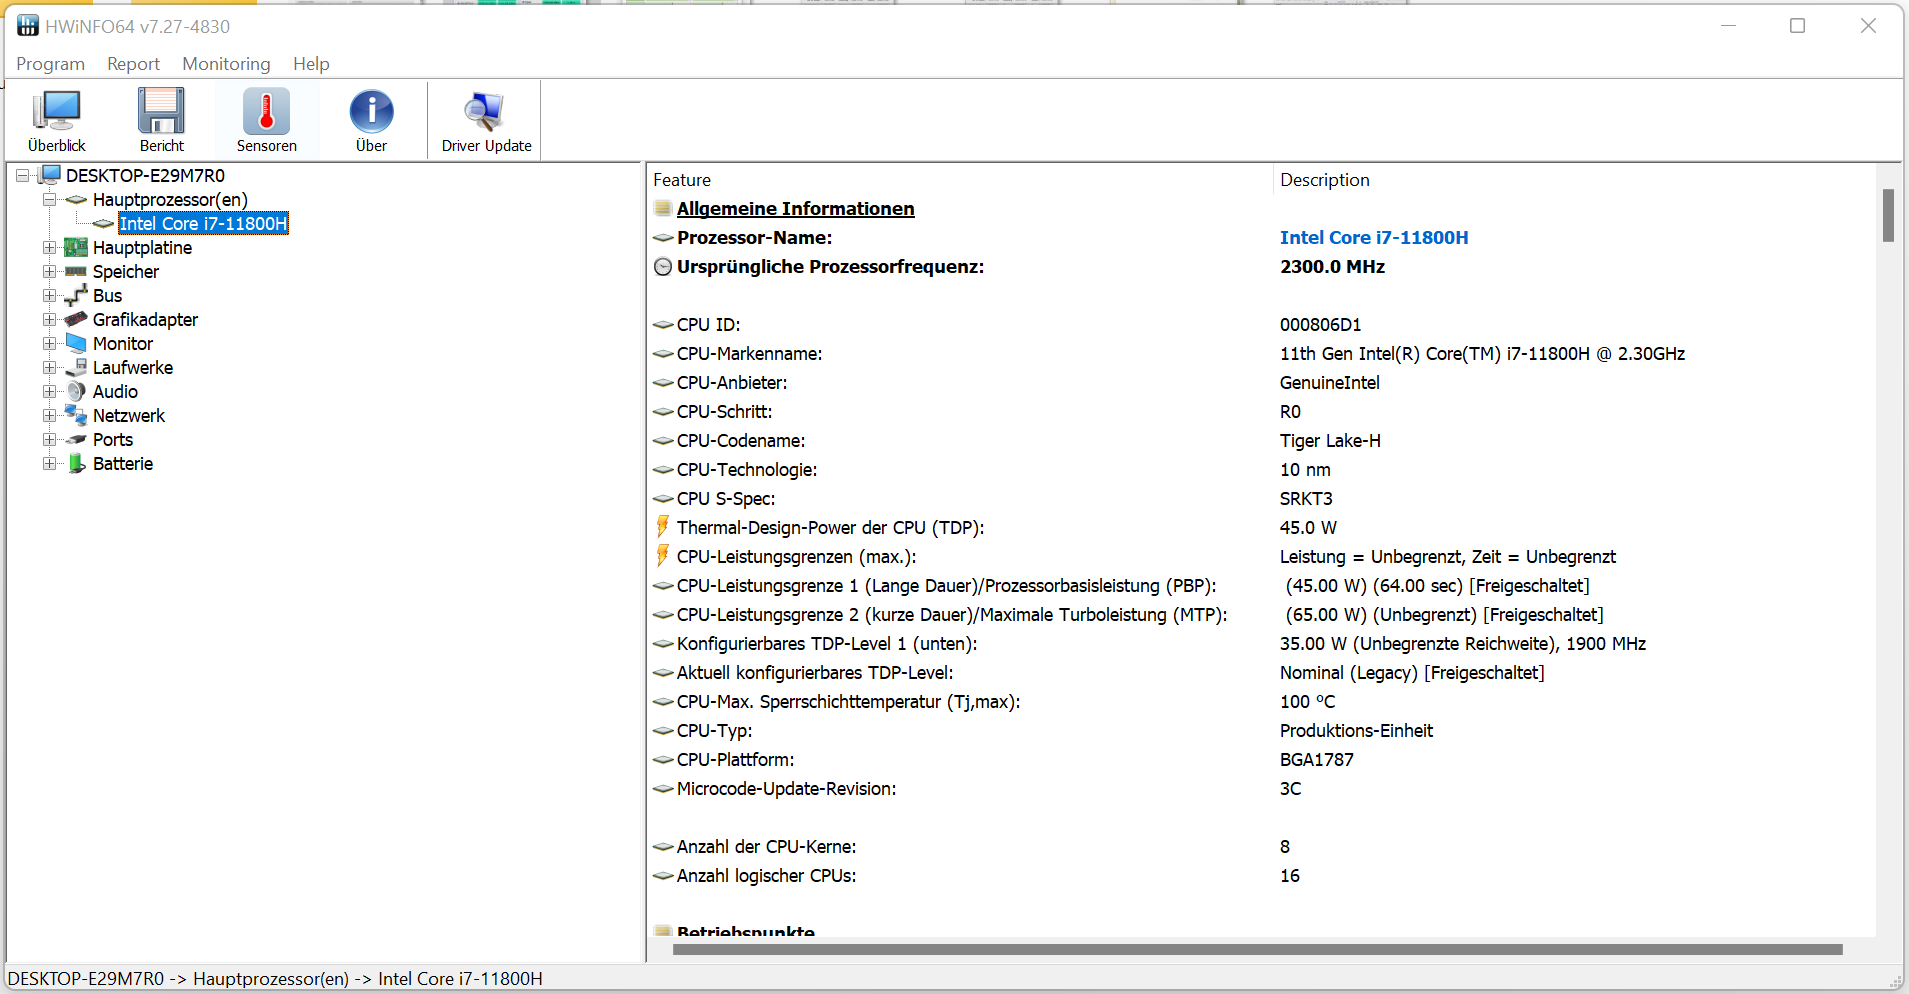
Core-i7-11800H fyrkärnig processor (Tiger Lake) har en basklockfrekvens på 2,3 GHz. En ökning till 4,2 GHz (åtta kärnor) eller 4,6 GHz (en kärna) är möjlig via Turbo. Hyper-Threading (två trådar per kärna) stöds.
Cinebench R15-jämförelsetestet med flera trådar bearbetas vid 1,3 till 4,2 GHz, medan testet med en tråd körs vid 1,1 till 4,6 GHz. Klockfrekvenserna förblir på en liknande nivå på batteridrift.
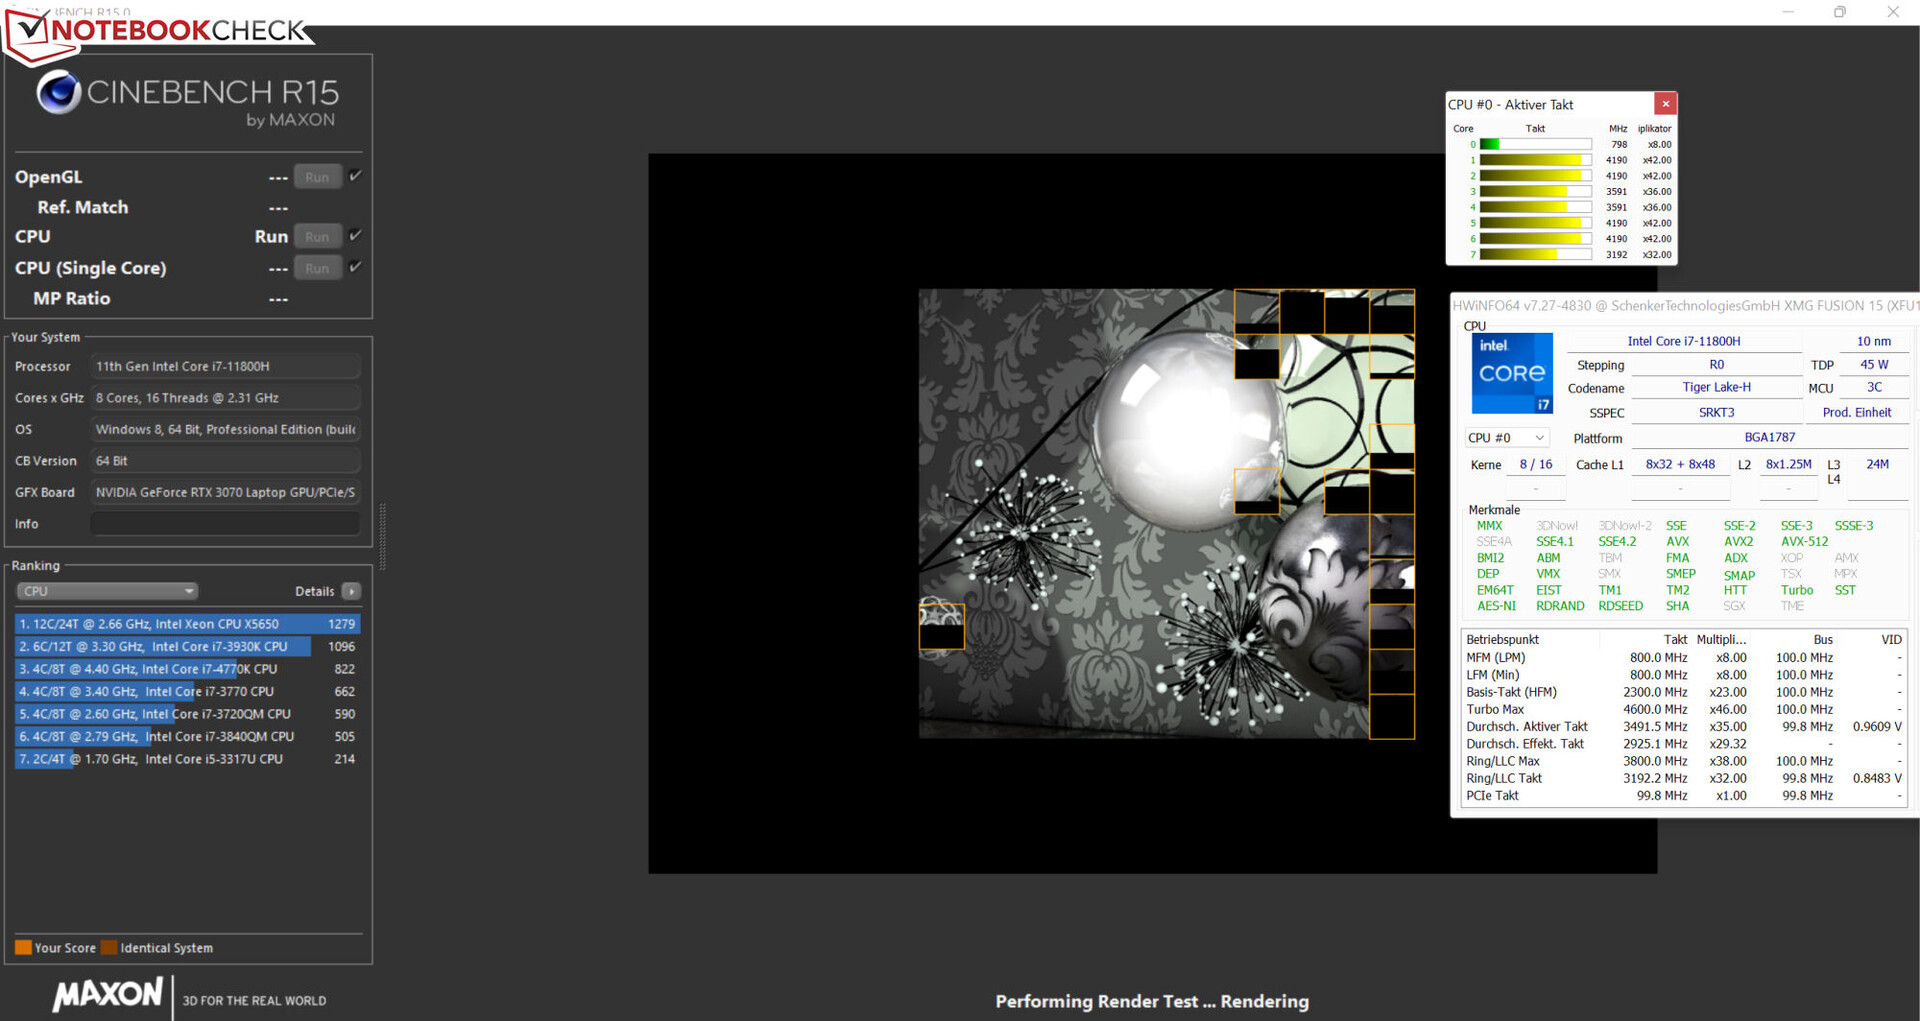

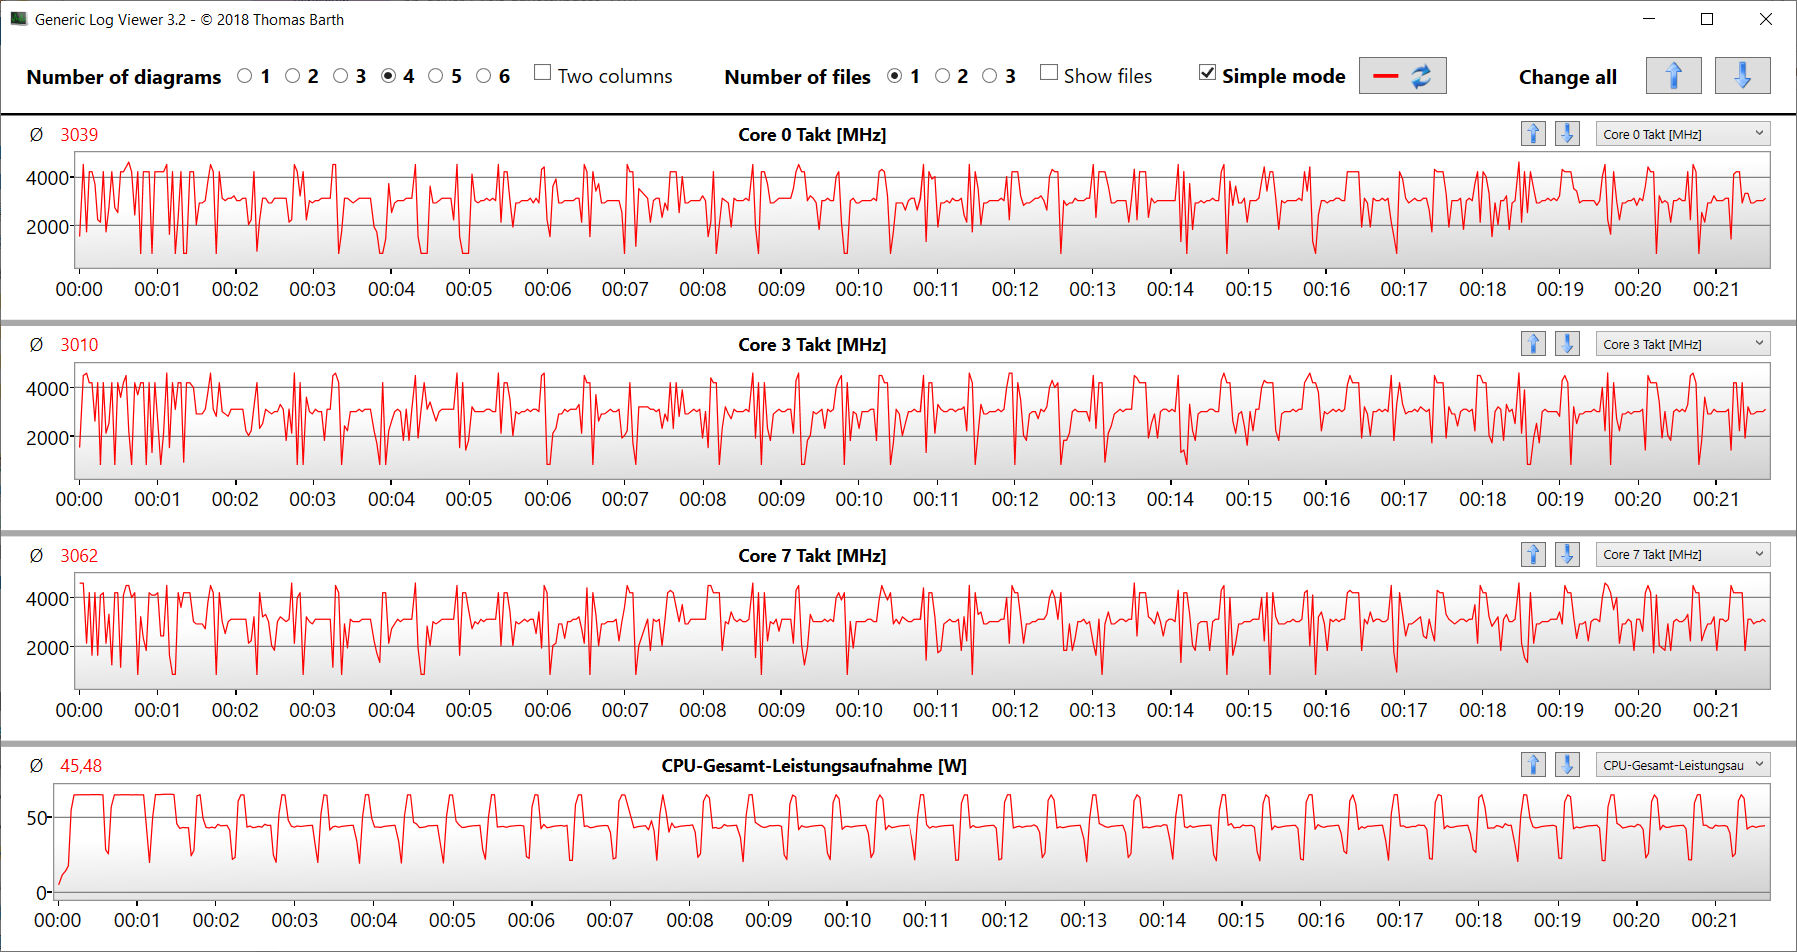
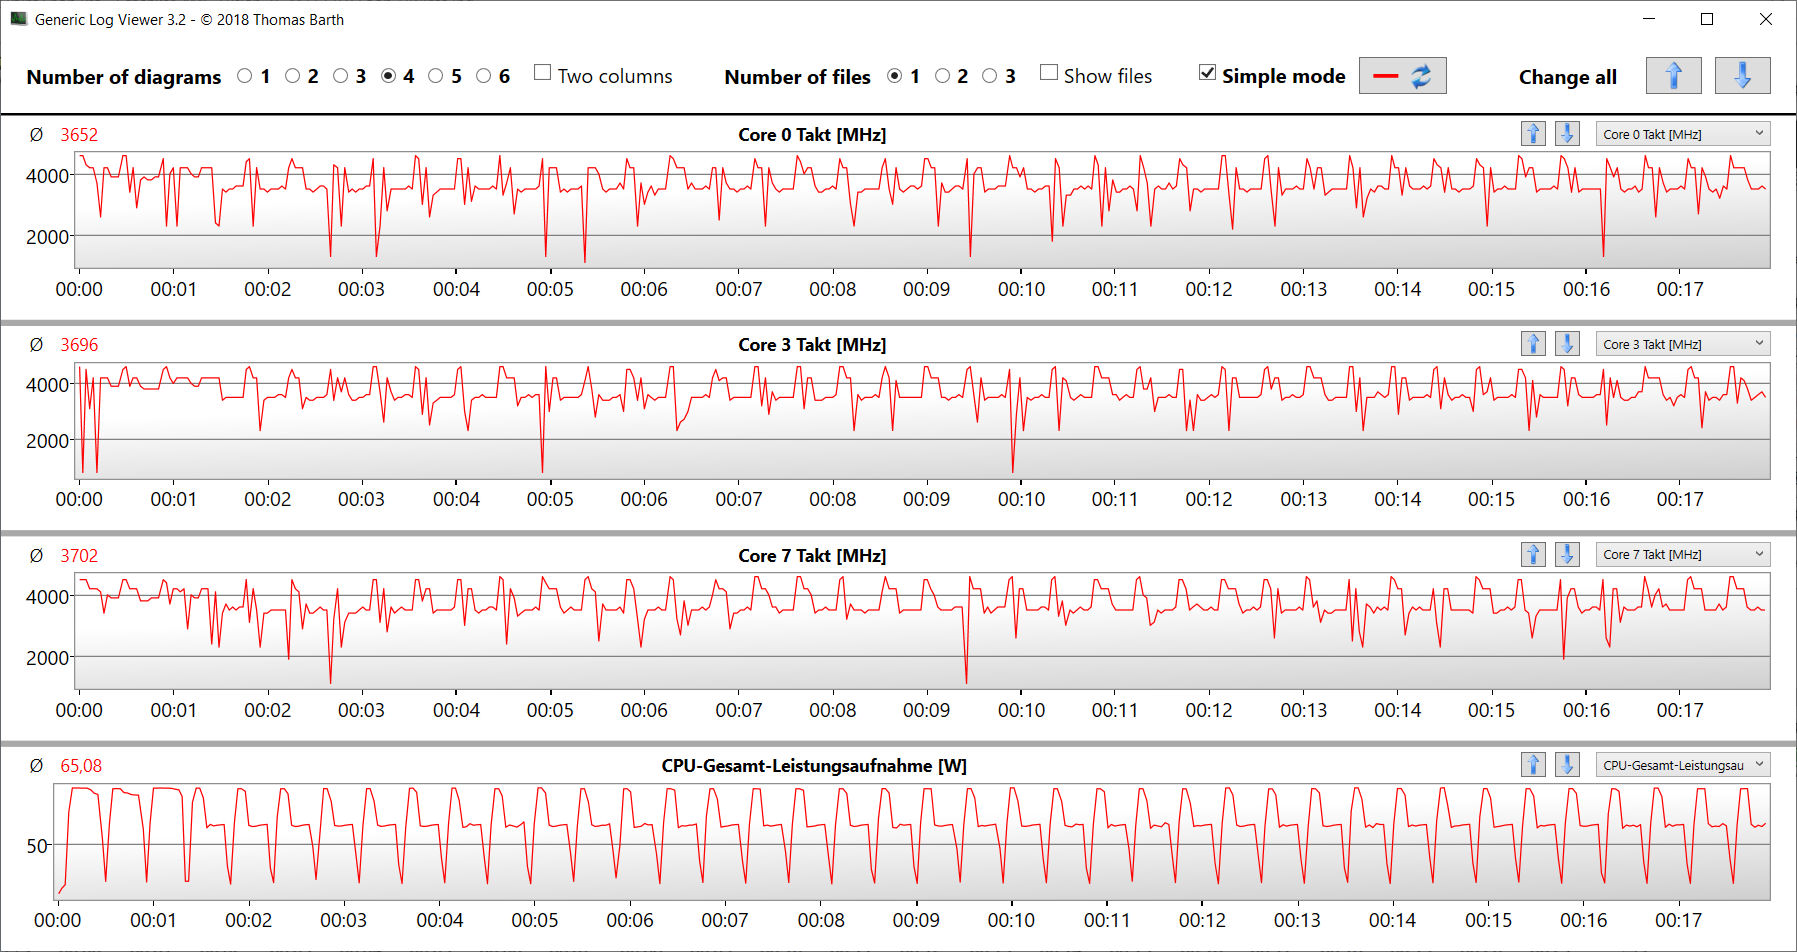
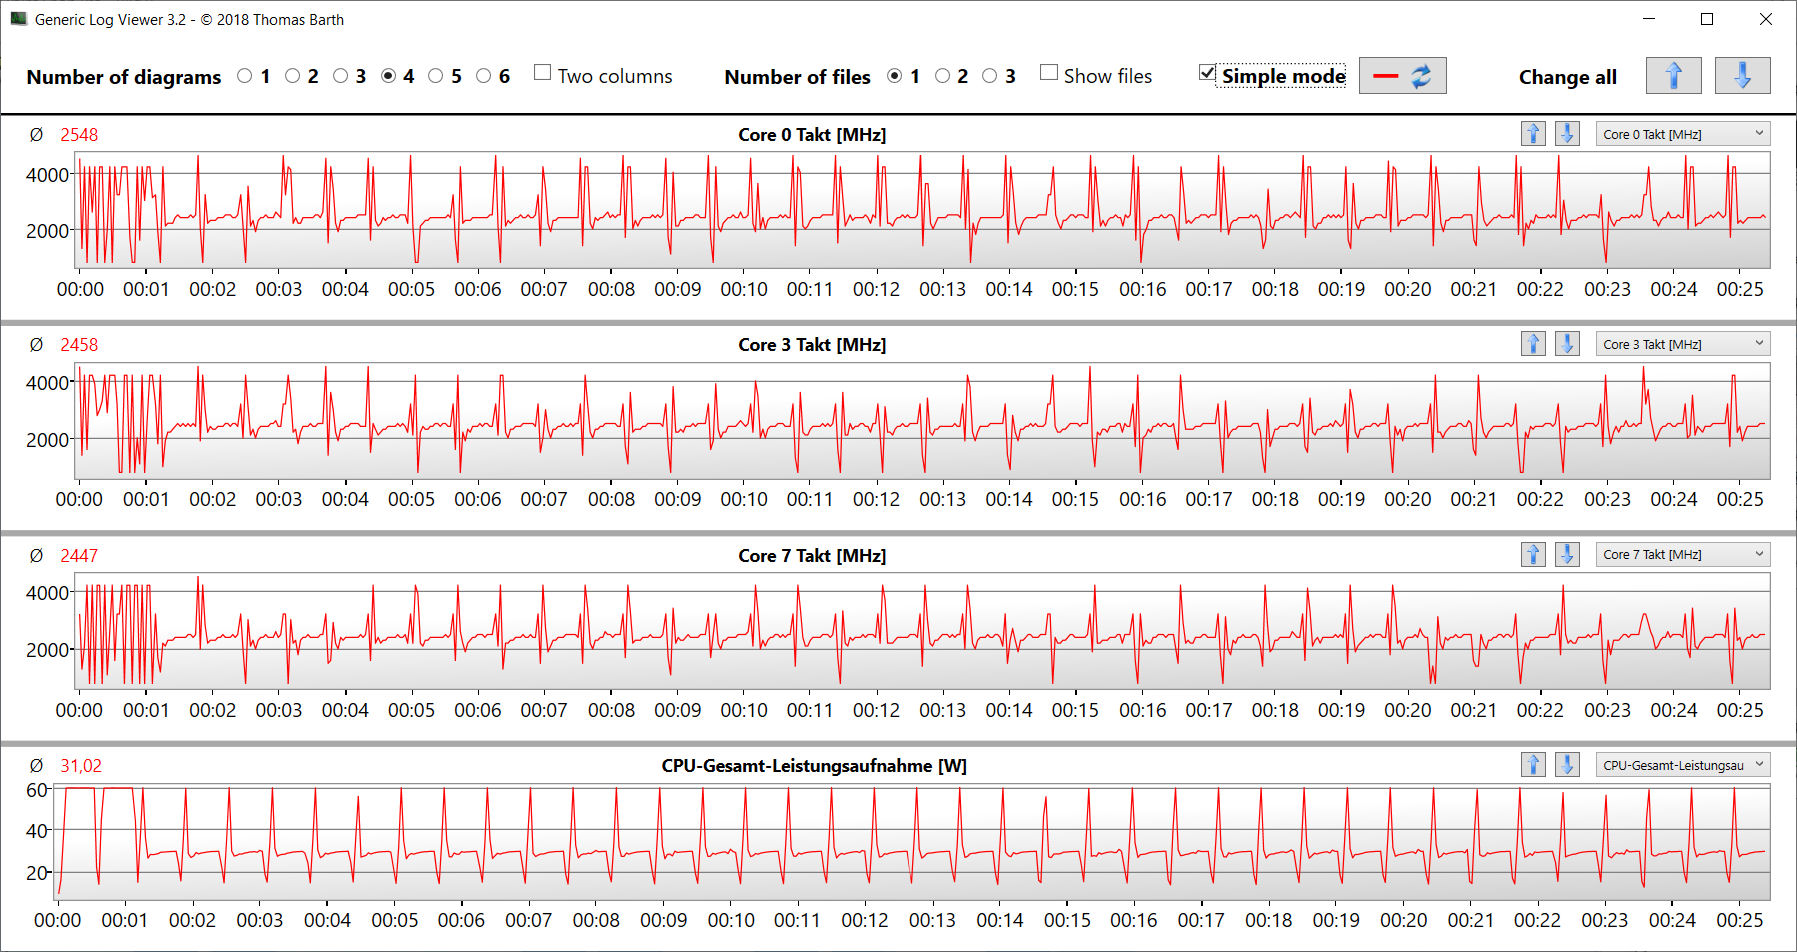
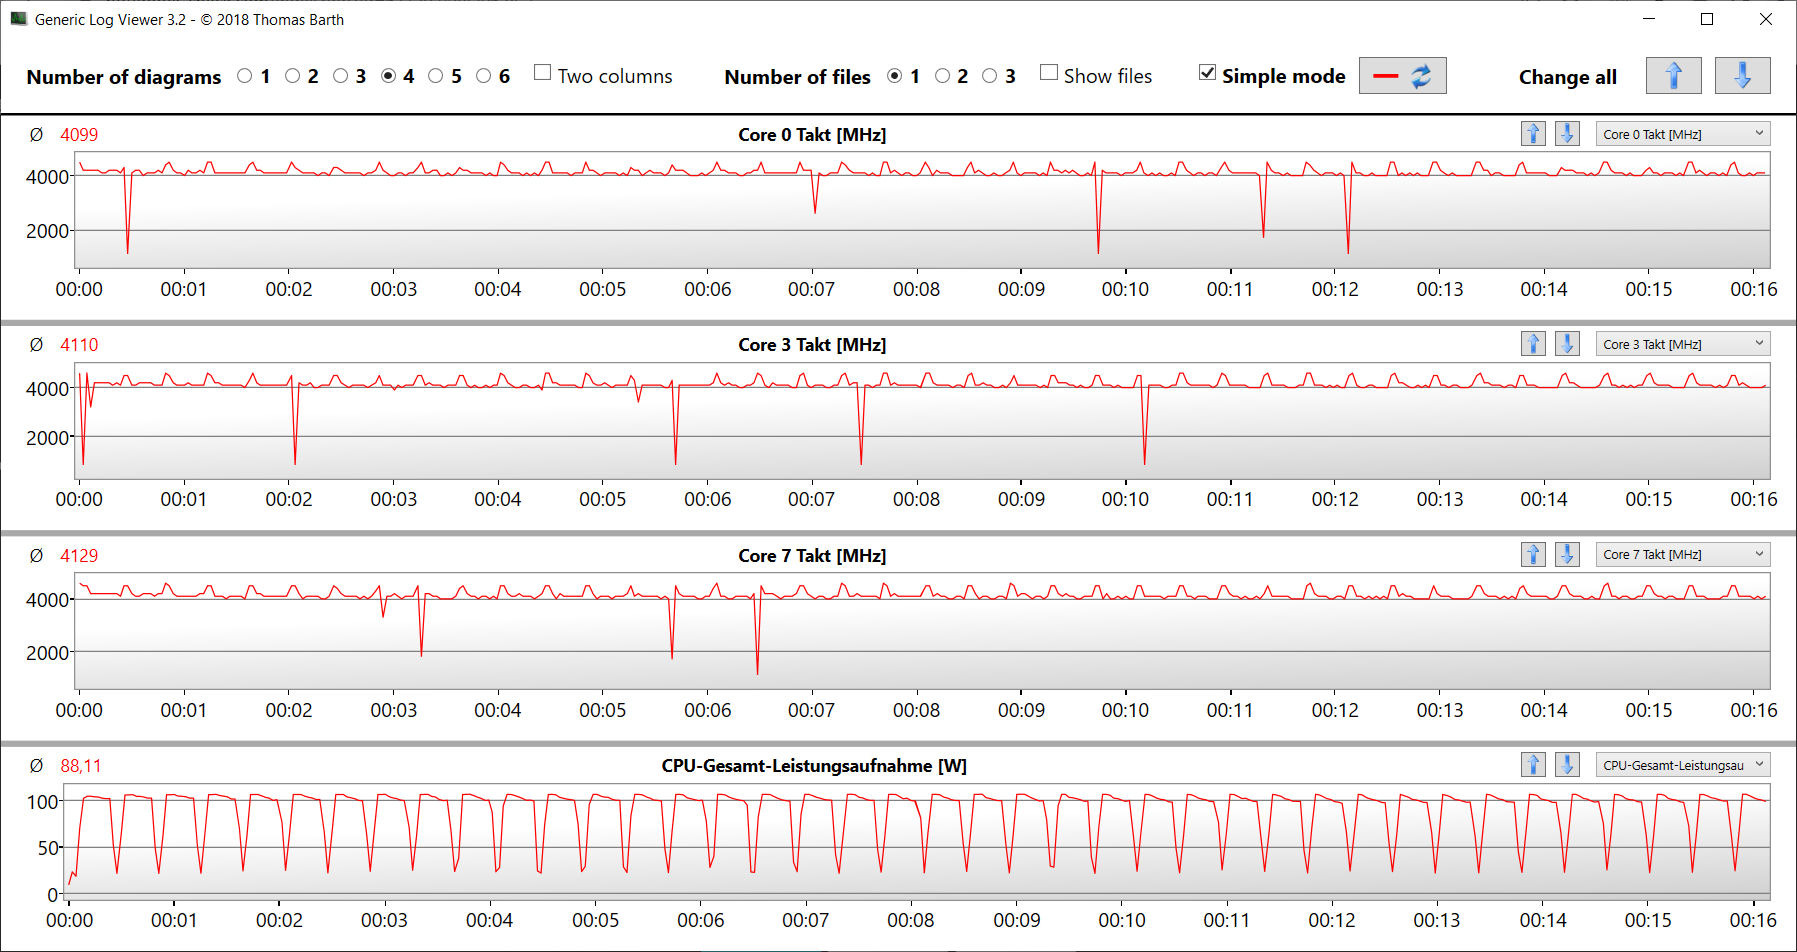
Vi kontrollerar om CPU Turbo används konsekvent när den är inkopplad genom att köra Cinebench R15-jämförelsetestet med flera trådar i minst 30 minuter. Turbo används i medelstor utsträckning. Profilen "Benchmark Mode" utnyttjar CPU Turbo nästan helt och hållet.
Cinebench R15 Multi endurance test
| CPU Performance rating - Percent | |
| Genomsnitt av klass Gaming | |
| HP Omen 16-b1090ng | |
| Acer Nitro 5 AN515-58-72QR | |
| Asus TUF Dash F15 FX517ZR | |
| Schenker XMG Fusion 15 (Mid 22) | |
| Schenker XMG Fusion 15 (Mid 22) | |
| MSI Delta 15 A5EFK | |
| Genomsnitt Intel Core i7-11800H | |
| Schenker XMG Fusion 15 (Mid 22) | |
| Schenker XMG Fusion 15 (Mid 22) | |
| Razer Blade 15 Base Edition 2021, i7-10750H RTX 3060 | |
| Cinebench R23 | |
| Multi Core | |
| Genomsnitt av klass Gaming (10488 - 42661, n=104, senaste 2 åren) | |
| Acer Nitro 5 AN515-58-72QR | |
| HP Omen 16-b1090ng | |
| Asus TUF Dash F15 FX517ZR | |
| Schenker XMG Fusion 15 (Mid 22) (Benchmark-Modus) | |
| Schenker XMG Fusion 15 (Mid 22) (Leistung) | |
| MSI Delta 15 A5EFK | |
| Genomsnitt Intel Core i7-11800H (6508 - 14088, n=48) | |
| Schenker XMG Fusion 15 (Mid 22) | |
| Schenker XMG Fusion 15 (Mid 22) (Stromsparmodus) | |
| Razer Blade 15 Base Edition 2021, i7-10750H RTX 3060 | |
| Single Core | |
| Genomsnitt av klass Gaming (1601 - 2415, n=104, senaste 2 åren) | |
| Acer Nitro 5 AN515-58-72QR | |
| Asus TUF Dash F15 FX517ZR | |
| HP Omen 16-b1090ng | |
| Schenker XMG Fusion 15 (Mid 22) | |
| Schenker XMG Fusion 15 (Mid 22) (Benchmark-Modus) | |
| Schenker XMG Fusion 15 (Mid 22) (Leistung) | |
| Genomsnitt Intel Core i7-11800H (1386 - 1522, n=45) | |
| Schenker XMG Fusion 15 (Mid 22) (Stromsparmodus) | |
| MSI Delta 15 A5EFK | |
| Razer Blade 15 Base Edition 2021, i7-10750H RTX 3060 | |
| Cinebench R20 | |
| CPU (Multi Core) | |
| Genomsnitt av klass Gaming (4029 - 16433, n=103, senaste 2 åren) | |
| Acer Nitro 5 AN515-58-72QR | |
| HP Omen 16-b1090ng | |
| Asus TUF Dash F15 FX517ZR | |
| Schenker XMG Fusion 15 (Mid 22) (Benchmark-Modus) | |
| Schenker XMG Fusion 15 (Mid 22) (Leistung) | |
| MSI Delta 15 A5EFK | |
| Genomsnitt Intel Core i7-11800H (2498 - 5408, n=50) | |
| Schenker XMG Fusion 15 (Mid 22) | |
| Schenker XMG Fusion 15 (Mid 22) (Stromsparmodus) | |
| Razer Blade 15 Base Edition 2021, i7-10750H RTX 3060 | |
| CPU (Single Core) | |
| Genomsnitt av klass Gaming (622 - 913, n=103, senaste 2 åren) | |
| Asus TUF Dash F15 FX517ZR | |
| HP Omen 16-b1090ng | |
| Acer Nitro 5 AN515-58-72QR | |
| Schenker XMG Fusion 15 (Mid 22) (Benchmark-Modus) | |
| Schenker XMG Fusion 15 (Mid 22) (Leistung) | |
| Schenker XMG Fusion 15 (Mid 22) | |
| MSI Delta 15 A5EFK | |
| Genomsnitt Intel Core i7-11800H (520 - 586, n=47) | |
| Schenker XMG Fusion 15 (Mid 22) (Stromsparmodus) | |
| Razer Blade 15 Base Edition 2021, i7-10750H RTX 3060 | |
| Cinebench R15 | |
| CPU Multi 64Bit | |
| Genomsnitt av klass Gaming (1578 - 6330, n=102, senaste 2 åren) | |
| HP Omen 16-b1090ng | |
| Acer Nitro 5 AN515-58-72QR | |
| Asus TUF Dash F15 FX517ZR | |
| MSI Delta 15 A5EFK | |
| Schenker XMG Fusion 15 (Mid 22) (Benchmark-Modus) | |
| Schenker XMG Fusion 15 (Mid 22) (Leistung) | |
| Genomsnitt Intel Core i7-11800H (1342 - 2173, n=50) | |
| Schenker XMG Fusion 15 (Mid 22) | |
| Schenker XMG Fusion 15 (Mid 22) (Stromsparmodus) | |
| Razer Blade 15 Base Edition 2021, i7-10750H RTX 3060 | |
| CPU Single 64Bit | |
| Genomsnitt av klass Gaming (188.8 - 350, n=103, senaste 2 åren) | |
| Acer Nitro 5 AN515-58-72QR | |
| HP Omen 16-b1090ng | |
| Asus TUF Dash F15 FX517ZR | |
| MSI Delta 15 A5EFK | |
| Schenker XMG Fusion 15 (Mid 22) | |
| Schenker XMG Fusion 15 (Mid 22) (Leistung) | |
| Schenker XMG Fusion 15 (Mid 22) (Benchmark-Modus) | |
| Genomsnitt Intel Core i7-11800H (201 - 231, n=46) | |
| Schenker XMG Fusion 15 (Mid 22) (Stromsparmodus) | |
| Razer Blade 15 Base Edition 2021, i7-10750H RTX 3060 | |
| Blender - v2.79 BMW27 CPU | |
| Razer Blade 15 Base Edition 2021, i7-10750H RTX 3060 | |
| Schenker XMG Fusion 15 (Mid 22) (Stromsparmodus) | |
| Schenker XMG Fusion 15 (Mid 22) | |
| Genomsnitt Intel Core i7-11800H (217 - 454, n=46) | |
| Schenker XMG Fusion 15 (Mid 22) (Leistung) | |
| MSI Delta 15 A5EFK | |
| Asus TUF Dash F15 FX517ZR | |
| Schenker XMG Fusion 15 (Mid 22) (Benchmark-Modus) | |
| Acer Nitro 5 AN515-58-72QR | |
| HP Omen 16-b1090ng | |
| Genomsnitt av klass Gaming (79 - 330, n=101, senaste 2 åren) | |
| 7-Zip 18.03 | |
| 7z b 4 | |
| Genomsnitt av klass Gaming (33491 - 148086, n=102, senaste 2 åren) | |
| HP Omen 16-b1090ng | |
| MSI Delta 15 A5EFK | |
| Asus TUF Dash F15 FX517ZR | |
| Acer Nitro 5 AN515-58-72QR | |
| Schenker XMG Fusion 15 (Mid 22) (Benchmark-Modus) | |
| Schenker XMG Fusion 15 (Mid 22) (Leistung) | |
| Genomsnitt Intel Core i7-11800H (33718 - 56758, n=46) | |
| Schenker XMG Fusion 15 (Mid 22) | |
| Schenker XMG Fusion 15 (Mid 22) (Stromsparmodus) | |
| Razer Blade 15 Base Edition 2021, i7-10750H RTX 3060 | |
| 7z b 4 -mmt1 | |
| Genomsnitt av klass Gaming (4824 - 7436, n=102, senaste 2 åren) | |
| HP Omen 16-b1090ng | |
| Acer Nitro 5 AN515-58-72QR | |
| Asus TUF Dash F15 FX517ZR | |
| MSI Delta 15 A5EFK | |
| Schenker XMG Fusion 15 (Mid 22) (Benchmark-Modus) | |
| Schenker XMG Fusion 15 (Mid 22) | |
| Genomsnitt Intel Core i7-11800H (5138 - 5732, n=46) | |
| Schenker XMG Fusion 15 (Mid 22) (Leistung) | |
| Schenker XMG Fusion 15 (Mid 22) (Stromsparmodus) | |
| Razer Blade 15 Base Edition 2021, i7-10750H RTX 3060 | |
| Geekbench 5.5 | |
| Multi-Core | |
| Genomsnitt av klass Gaming (6460 - 28263, n=102, senaste 2 åren) | |
| HP Omen 16-b1090ng | |
| Asus TUF Dash F15 FX517ZR | |
| Acer Nitro 5 AN515-58-72QR | |
| Schenker XMG Fusion 15 (Mid 22) (Benchmark-Modus) | |
| Schenker XMG Fusion 15 (Mid 22) (Leistung) | |
| MSI Delta 15 A5EFK | |
| Genomsnitt Intel Core i7-11800H (4655 - 9851, n=40) | |
| Schenker XMG Fusion 15 (Mid 22) | |
| Schenker XMG Fusion 15 (Mid 22) (Stromsparmodus) | |
| Razer Blade 15 Base Edition 2021, i7-10750H RTX 3060 | |
| Single-Core | |
| Genomsnitt av klass Gaming (1403 - 2474, n=102, senaste 2 åren) | |
| HP Omen 16-b1090ng | |
| Asus TUF Dash F15 FX517ZR | |
| Acer Nitro 5 AN515-58-72QR | |
| Schenker XMG Fusion 15 (Mid 22) (Benchmark-Modus) | |
| Schenker XMG Fusion 15 (Mid 22) (Leistung) | |
| Schenker XMG Fusion 15 (Mid 22) | |
| MSI Delta 15 A5EFK | |
| Genomsnitt Intel Core i7-11800H (1429 - 1625, n=40) | |
| Schenker XMG Fusion 15 (Mid 22) (Stromsparmodus) | |
| Razer Blade 15 Base Edition 2021, i7-10750H RTX 3060 | |
| HWBOT x265 Benchmark v2.2 - 4k Preset | |
| Genomsnitt av klass Gaming (11.5 - 44.4, n=102, senaste 2 åren) | |
| HP Omen 16-b1090ng | |
| Acer Nitro 5 AN515-58-72QR | |
| Asus TUF Dash F15 FX517ZR | |
| Schenker XMG Fusion 15 (Mid 22) (Benchmark-Modus) | |
| Schenker XMG Fusion 15 (Mid 22) (Leistung) | |
| MSI Delta 15 A5EFK | |
| Genomsnitt Intel Core i7-11800H (7.38 - 17.4, n=46) | |
| Schenker XMG Fusion 15 (Mid 22) | |
| Schenker XMG Fusion 15 (Mid 22) (Stromsparmodus) | |
| Razer Blade 15 Base Edition 2021, i7-10750H RTX 3060 | |
| LibreOffice - 20 Documents To PDF | |
| MSI Delta 15 A5EFK | |
| Genomsnitt av klass Gaming (33.2 - 88.8, n=102, senaste 2 åren) | |
| Razer Blade 15 Base Edition 2021, i7-10750H RTX 3060 | |
| Schenker XMG Fusion 15 (Mid 22) | |
| Genomsnitt Intel Core i7-11800H (38.6 - 59.9, n=45) | |
| Schenker XMG Fusion 15 (Mid 22) (Stromsparmodus) | |
| Schenker XMG Fusion 15 (Mid 22) (Benchmark-Modus) | |
| Schenker XMG Fusion 15 (Mid 22) (Leistung) | |
| Acer Nitro 5 AN515-58-72QR | |
| HP Omen 16-b1090ng | |
| Asus TUF Dash F15 FX517ZR | |
| R Benchmark 2.5 - Overall mean | |
| Razer Blade 15 Base Edition 2021, i7-10750H RTX 3060 | |
| Schenker XMG Fusion 15 (Mid 22) (Stromsparmodus) | |
| Genomsnitt Intel Core i7-11800H (0.548 - 0.615, n=46) | |
| Schenker XMG Fusion 15 (Mid 22) | |
| Schenker XMG Fusion 15 (Mid 22) (Leistung) | |
| Schenker XMG Fusion 15 (Mid 22) (Benchmark-Modus) | |
| MSI Delta 15 A5EFK | |
| Asus TUF Dash F15 FX517ZR | |
| Acer Nitro 5 AN515-58-72QR | |
| HP Omen 16-b1090ng | |
| Genomsnitt av klass Gaming (0.3439 - 0.59, n=102, senaste 2 åren) | |
* ... mindre är bättre
AIDA64: FP32 Ray-Trace | FPU Julia | CPU SHA3 | CPU Queen | FPU SinJulia | FPU Mandel | CPU AES | CPU ZLib | FP64 Ray-Trace | CPU PhotoWorxx
| Performance rating | |
| Genomsnitt av klass Gaming | |
| MSI Delta 15 A5EFK | |
| Schenker XMG Fusion 15 (Mid 22) | |
| Schenker XMG Fusion 15 (Mid 22) | |
| Schenker XMG Fusion 15 (Mid 22) | |
| Asus TUF Dash F15 FX517ZR | |
| Genomsnitt Intel Core i7-11800H | |
| HP Omen 16-b1090ng | |
| Schenker XMG Fusion 15 (Mid 22) | |
| Acer Nitro 5 AN515-58-72QR | |
| AIDA64 / FP32 Ray-Trace | |
| Genomsnitt av klass Gaming (10227 - 85542, n=102, senaste 2 åren) | |
| Schenker XMG Fusion 15 (Mid 22) (v6.70.6000, Benchmark-Modus) | |
| Schenker XMG Fusion 15 (Mid 22) (v6.70.6000, Leistung) | |
| MSI Delta 15 A5EFK (v6.33.5700) | |
| Asus TUF Dash F15 FX517ZR (v6.70.6000) | |
| Genomsnitt Intel Core i7-11800H (8772 - 15961, n=20) | |
| Schenker XMG Fusion 15 (Mid 22) (v6.70.6000) | |
| Schenker XMG Fusion 15 (Mid 22) (v6.70.6000, Stromsparmodus) | |
| Acer Nitro 5 AN515-58-72QR (v6.50.5800) | |
| HP Omen 16-b1090ng (v6.50.5800) | |
| AIDA64 / FPU Julia | |
| Genomsnitt av klass Gaming (51376 - 372155, n=102, senaste 2 åren) | |
| MSI Delta 15 A5EFK (v6.33.5700) | |
| Asus TUF Dash F15 FX517ZR (v6.70.6000) | |
| Schenker XMG Fusion 15 (Mid 22) (v6.70.6000, Benchmark-Modus) | |
| Schenker XMG Fusion 15 (Mid 22) (v6.70.6000) | |
| Schenker XMG Fusion 15 (Mid 22) (v6.70.6000, Leistung) | |
| Genomsnitt Intel Core i7-11800H (39404 - 65636, n=20) | |
| Schenker XMG Fusion 15 (Mid 22) (v6.70.6000, Stromsparmodus) | |
| Acer Nitro 5 AN515-58-72QR (v6.50.5800) | |
| HP Omen 16-b1090ng (v6.50.5800) | |
| AIDA64 / CPU SHA3 | |
| Genomsnitt av klass Gaming (2180 - 10115, n=102, senaste 2 åren) | |
| Schenker XMG Fusion 15 (Mid 22) (v6.70.6000, Benchmark-Modus) | |
| Schenker XMG Fusion 15 (Mid 22) (v6.70.6000, Leistung) | |
| Schenker XMG Fusion 15 (Mid 22) (v6.70.6000) | |
| Genomsnitt Intel Core i7-11800H (2599 - 4439, n=20) | |
| MSI Delta 15 A5EFK (v6.33.5700) | |
| Acer Nitro 5 AN515-58-72QR (v6.50.5800) | |
| Asus TUF Dash F15 FX517ZR (v6.70.6000) | |
| Schenker XMG Fusion 15 (Mid 22) (v6.70.6000, Stromsparmodus) | |
| HP Omen 16-b1090ng (v6.50.5800) | |
| AIDA64 / CPU Queen | |
| Genomsnitt av klass Gaming (49785 - 173351, n=86, senaste 2 åren) | |
| MSI Delta 15 A5EFK (v6.33.5700) | |
| HP Omen 16-b1090ng (v6.50.5800) | |
| Acer Nitro 5 AN515-58-72QR (v6.50.5800) | |
| Schenker XMG Fusion 15 (Mid 22) (v6.70.6000, Leistung) | |
| Schenker XMG Fusion 15 (Mid 22) (v6.70.6000, Benchmark-Modus) | |
| Genomsnitt Intel Core i7-11800H (85233 - 91941, n=20) | |
| Asus TUF Dash F15 FX517ZR (v6.70.6000) | |
| Schenker XMG Fusion 15 (Mid 22) (v6.70.6000, Stromsparmodus) | |
| Schenker XMG Fusion 15 (Mid 22) | |
| AIDA64 / FPU SinJulia | |
| Genomsnitt av klass Gaming (4424 - 33636, n=102, senaste 2 åren) | |
| MSI Delta 15 A5EFK (v6.33.5700) | |
| Acer Nitro 5 AN515-58-72QR (v6.50.5800) | |
| Schenker XMG Fusion 15 (Mid 22) (v6.70.6000, Benchmark-Modus) | |
| Schenker XMG Fusion 15 (Mid 22) (v6.70.6000, Leistung) | |
| HP Omen 16-b1090ng (v6.50.5800) | |
| Genomsnitt Intel Core i7-11800H (6420 - 9792, n=20) | |
| Schenker XMG Fusion 15 (Mid 22) (v6.70.6000) | |
| Asus TUF Dash F15 FX517ZR (v6.70.6000) | |
| Schenker XMG Fusion 15 (Mid 22) (v6.70.6000, Stromsparmodus) | |
| AIDA64 / FPU Mandel | |
| Genomsnitt av klass Gaming (25115 - 196829, n=102, senaste 2 åren) | |
| MSI Delta 15 A5EFK (v6.33.5700) | |
| Schenker XMG Fusion 15 (Mid 22) (v6.70.6000, Benchmark-Modus) | |
| Schenker XMG Fusion 15 (Mid 22) (v6.70.6000, Leistung) | |
| Schenker XMG Fusion 15 (Mid 22) (v6.70.6000) | |
| Genomsnitt Intel Core i7-11800H (23365 - 39464, n=20) | |
| Asus TUF Dash F15 FX517ZR (v6.70.6000) | |
| Schenker XMG Fusion 15 (Mid 22) (v6.70.6000, Stromsparmodus) | |
| Acer Nitro 5 AN515-58-72QR | |
| HP Omen 16-b1090ng (v6.50.5800) | |
| AIDA64 / CPU AES | |
| Schenker XMG Fusion 15 (Mid 22) (v6.70.6000, Benchmark-Modus) | |
| Schenker XMG Fusion 15 (Mid 22) (v6.70.6000) | |
| Schenker XMG Fusion 15 (Mid 22) (v6.70.6000, Leistung) | |
| MSI Delta 15 A5EFK (v6.33.5700) | |
| Genomsnitt Intel Core i7-11800H (74617 - 149388, n=20) | |
| Genomsnitt av klass Gaming (39258 - 247074, n=102, senaste 2 åren) | |
| Schenker XMG Fusion 15 (Mid 22) (v6.70.6000, Stromsparmodus) | |
| HP Omen 16-b1090ng (v6.50.5800) | |
| Asus TUF Dash F15 FX517ZR (v6.70.6000) | |
| Acer Nitro 5 AN515-58-72QR (v6.50.5800) | |
| AIDA64 / CPU ZLib | |
| Genomsnitt av klass Gaming (574 - 2531, n=102, senaste 2 åren) | |
| Acer Nitro 5 AN515-58-72QR (v6.50.5800) | |
| HP Omen 16-b1090ng (v6.50.5800) | |
| Asus TUF Dash F15 FX517ZR (v6.70.6000) | |
| MSI Delta 15 A5EFK (v6.33.5700) | |
| Schenker XMG Fusion 15 (Mid 22) (v6.70.6000, Benchmark-Modus) | |
| Schenker XMG Fusion 15 (Mid 22) (v6.70.6000, Leistung) | |
| Schenker XMG Fusion 15 (Mid 22) (v6.70.6000) | |
| Schenker XMG Fusion 15 (Mid 22) (v6.70.6000, Stromsparmodus) | |
| Genomsnitt Intel Core i7-11800H (461 - 830, n=43) | |
| AIDA64 / FP64 Ray-Trace | |
| Genomsnitt av klass Gaming (5509 - 45446, n=102, senaste 2 åren) | |
| Schenker XMG Fusion 15 (Mid 22) (v6.70.6000, Benchmark-Modus) | |
| Schenker XMG Fusion 15 (Mid 22) (v6.70.6000, Leistung) | |
| MSI Delta 15 A5EFK (v6.33.5700) | |
| Asus TUF Dash F15 FX517ZR (v6.70.6000) | |
| Genomsnitt Intel Core i7-11800H (4545 - 8717, n=21) | |
| Schenker XMG Fusion 15 (Mid 22) (v6.70.6000) | |
| Schenker XMG Fusion 15 (Mid 22) (v6.70.6000, Stromsparmodus) | |
| Acer Nitro 5 AN515-58-72QR (v6.50.5800) | |
| HP Omen 16-b1090ng (v6.50.5800) | |
| AIDA64 / CPU PhotoWorxx | |
| Genomsnitt av klass Gaming (12271 - 89891, n=102, senaste 2 åren) | |
| HP Omen 16-b1090ng (v6.50.5800) | |
| Asus TUF Dash F15 FX517ZR (v6.70.6000) | |
| Schenker XMG Fusion 15 (Mid 22) (v6.70.6000, Benchmark-Modus) | |
| Schenker XMG Fusion 15 (Mid 22) (v6.70.6000, Leistung) | |
| Schenker XMG Fusion 15 (Mid 22) (v6.70.6000) | |
| Schenker XMG Fusion 15 (Mid 22) (v6.70.6000, Stromsparmodus) | |
| Genomsnitt Intel Core i7-11800H (11898 - 26757, n=21) | |
| Acer Nitro 5 AN515-58-72QR (v6.50.5800) | |
| MSI Delta 15 A5EFK (v6.33.5700) | |
Systemprestanda
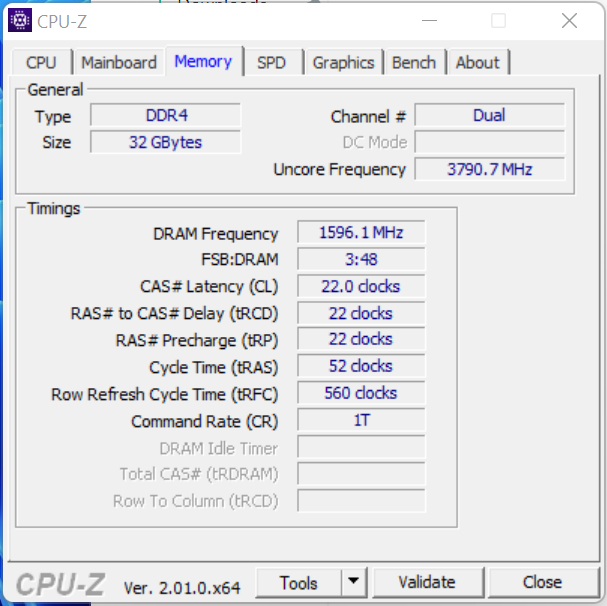
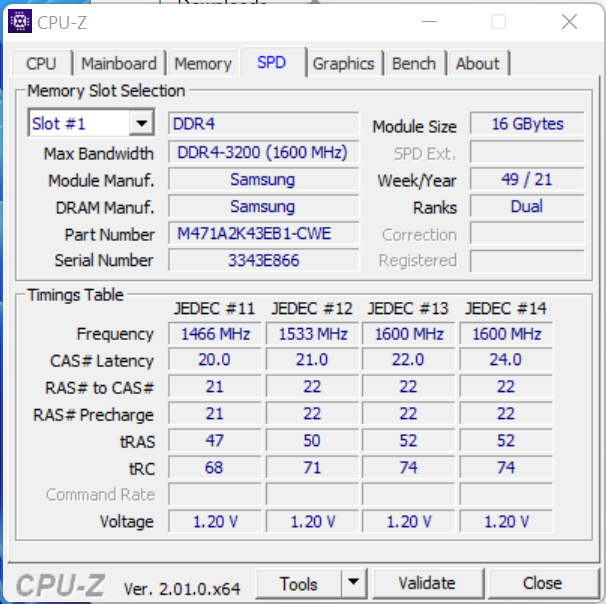
Det väl avrundade och smidigt fungerande systemet erbjuder tillräcklig processorkraft för krävande tillämpningar som rendering och spel. PCMark-resultaten är bra. RAM-minnets överföringshastigheter ligger på en normal nivå för DDR4-3200-minne
CrossMark: Overall | Productivity | Creativity | Responsiveness
| PCMark 10 / Score | |
| Genomsnitt av klass Gaming (5828 - 12414, n=93, senaste 2 åren) | |
| HP Omen 16-b1090ng | |
| MSI Delta 15 A5EFK | |
| Acer Nitro 5 AN515-58-72QR | |
| Genomsnitt Intel Core i7-11800H, NVIDIA GeForce RTX 3070 Laptop GPU (6126 - 7311, n=11) | |
| Asus TUF Dash F15 FX517ZR | |
| Schenker XMG Fusion 15 (Mid 22) (Benchmark-Modus) | |
| Razer Blade 15 Base Edition 2021, i7-10750H RTX 3060 | |
| Schenker XMG Fusion 15 (Mid 22) | |
| PCMark 10 / Essentials | |
| Genomsnitt av klass Gaming (8810 - 11935, n=97, senaste 2 åren) | |
| MSI Delta 15 A5EFK | |
| HP Omen 16-b1090ng | |
| Razer Blade 15 Base Edition 2021, i7-10750H RTX 3060 | |
| Genomsnitt Intel Core i7-11800H, NVIDIA GeForce RTX 3070 Laptop GPU (9248 - 10832, n=11) | |
| Asus TUF Dash F15 FX517ZR | |
| Acer Nitro 5 AN515-58-72QR | |
| Schenker XMG Fusion 15 (Mid 22) (Benchmark-Modus) | |
| Schenker XMG Fusion 15 (Mid 22) | |
| PCMark 10 / Productivity | |
| Genomsnitt av klass Gaming (6845 - 25323, n=95, senaste 2 åren) | |
| HP Omen 16-b1090ng | |
| Asus TUF Dash F15 FX517ZR | |
| MSI Delta 15 A5EFK | |
| Schenker XMG Fusion 15 (Mid 22) (Benchmark-Modus) | |
| Genomsnitt Intel Core i7-11800H, NVIDIA GeForce RTX 3070 Laptop GPU (8571 - 9669, n=11) | |
| Acer Nitro 5 AN515-58-72QR | |
| Schenker XMG Fusion 15 (Mid 22) | |
| Razer Blade 15 Base Edition 2021, i7-10750H RTX 3060 | |
| PCMark 10 / Digital Content Creation | |
| Genomsnitt av klass Gaming (7602 - 19954, n=95, senaste 2 åren) | |
| HP Omen 16-b1090ng | |
| MSI Delta 15 A5EFK | |
| Acer Nitro 5 AN515-58-72QR | |
| Genomsnitt Intel Core i7-11800H, NVIDIA GeForce RTX 3070 Laptop GPU (7627 - 10851, n=11) | |
| Asus TUF Dash F15 FX517ZR | |
| Razer Blade 15 Base Edition 2021, i7-10750H RTX 3060 | |
| Schenker XMG Fusion 15 (Mid 22) (Benchmark-Modus) | |
| Schenker XMG Fusion 15 (Mid 22) | |
| CrossMark / Overall | |
| Genomsnitt av klass Gaming (1366 - 2409, n=94, senaste 2 åren) | |
| Asus TUF Dash F15 FX517ZR | |
| Acer Nitro 5 AN515-58-72QR | |
| Schenker XMG Fusion 15 (Mid 22) | |
| Genomsnitt Intel Core i7-11800H, NVIDIA GeForce RTX 3070 Laptop GPU (1569 - 1656, n=3) | |
| CrossMark / Productivity | |
| Genomsnitt av klass Gaming (1386 - 2254, n=94, senaste 2 åren) | |
| Acer Nitro 5 AN515-58-72QR | |
| Asus TUF Dash F15 FX517ZR | |
| Schenker XMG Fusion 15 (Mid 22) | |
| Genomsnitt Intel Core i7-11800H, NVIDIA GeForce RTX 3070 Laptop GPU (1573 - 1640, n=3) | |
| CrossMark / Creativity | |
| Genomsnitt av klass Gaming (1343 - 2786, n=94, senaste 2 åren) | |
| Asus TUF Dash F15 FX517ZR | |
| Acer Nitro 5 AN515-58-72QR | |
| Schenker XMG Fusion 15 (Mid 22) | |
| Genomsnitt Intel Core i7-11800H, NVIDIA GeForce RTX 3070 Laptop GPU (1613 - 1692, n=3) | |
| CrossMark / Responsiveness | |
| Genomsnitt av klass Gaming (1226 - 2334, n=94, senaste 2 åren) | |
| Acer Nitro 5 AN515-58-72QR | |
| Schenker XMG Fusion 15 (Mid 22) | |
| Asus TUF Dash F15 FX517ZR | |
| Genomsnitt Intel Core i7-11800H, NVIDIA GeForce RTX 3070 Laptop GPU (1435 - 1600, n=3) | |
| PCMark 8 Home Score Accelerated v2 | 4521 poäng | |
| PCMark 8 Creative Score Accelerated v2 | 6766 poäng | |
| PCMark 8 Work Score Accelerated v2 | 5851 poäng | |
| PCMark 10 Score | 6126 poäng | |
Hjälp | ||
| AIDA64 / Memory Copy | |
| Genomsnitt av klass Gaming (21750 - 129946, n=102, senaste 2 åren) | |
| HP Omen 16-b1090ng | |
| Asus TUF Dash F15 FX517ZR | |
| Schenker XMG Fusion 15 (Mid 22) | |
| Acer Nitro 5 AN515-58-72QR | |
| Genomsnitt Intel Core i7-11800H (24508 - 48144, n=21) | |
| MSI Delta 15 A5EFK | |
| AIDA64 / Memory Read | |
| Genomsnitt av klass Gaming (22956 - 118858, n=102, senaste 2 åren) | |
| HP Omen 16-b1090ng | |
| Asus TUF Dash F15 FX517ZR | |
| Schenker XMG Fusion 15 (Mid 22) | |
| MSI Delta 15 A5EFK | |
| Genomsnitt Intel Core i7-11800H (25882 - 50365, n=20) | |
| Acer Nitro 5 AN515-58-72QR | |
| AIDA64 / Memory Write | |
| Genomsnitt av klass Gaming (22297 - 135096, n=102, senaste 2 åren) | |
| HP Omen 16-b1090ng | |
| Asus TUF Dash F15 FX517ZR | |
| Schenker XMG Fusion 15 (Mid 22) | |
| Acer Nitro 5 AN515-58-72QR | |
| MSI Delta 15 A5EFK | |
| Genomsnitt Intel Core i7-11800H (22240 - 46214, n=20) | |
| AIDA64 / Memory Latency | |
| Genomsnitt av klass Gaming (75.3 - 165.4, n=102, senaste 2 åren) | |
| Asus TUF Dash F15 FX517ZR | |
| Schenker XMG Fusion 15 (Mid 22) | |
| HP Omen 16-b1090ng | |
| MSI Delta 15 A5EFK | |
| Genomsnitt Intel Core i7-11800H (71.9 - 104.1, n=44) | |
| Acer Nitro 5 AN515-58-72QR | |
| Acer Nitro 5 AN515-58-72QR | |
* ... mindre är bättre
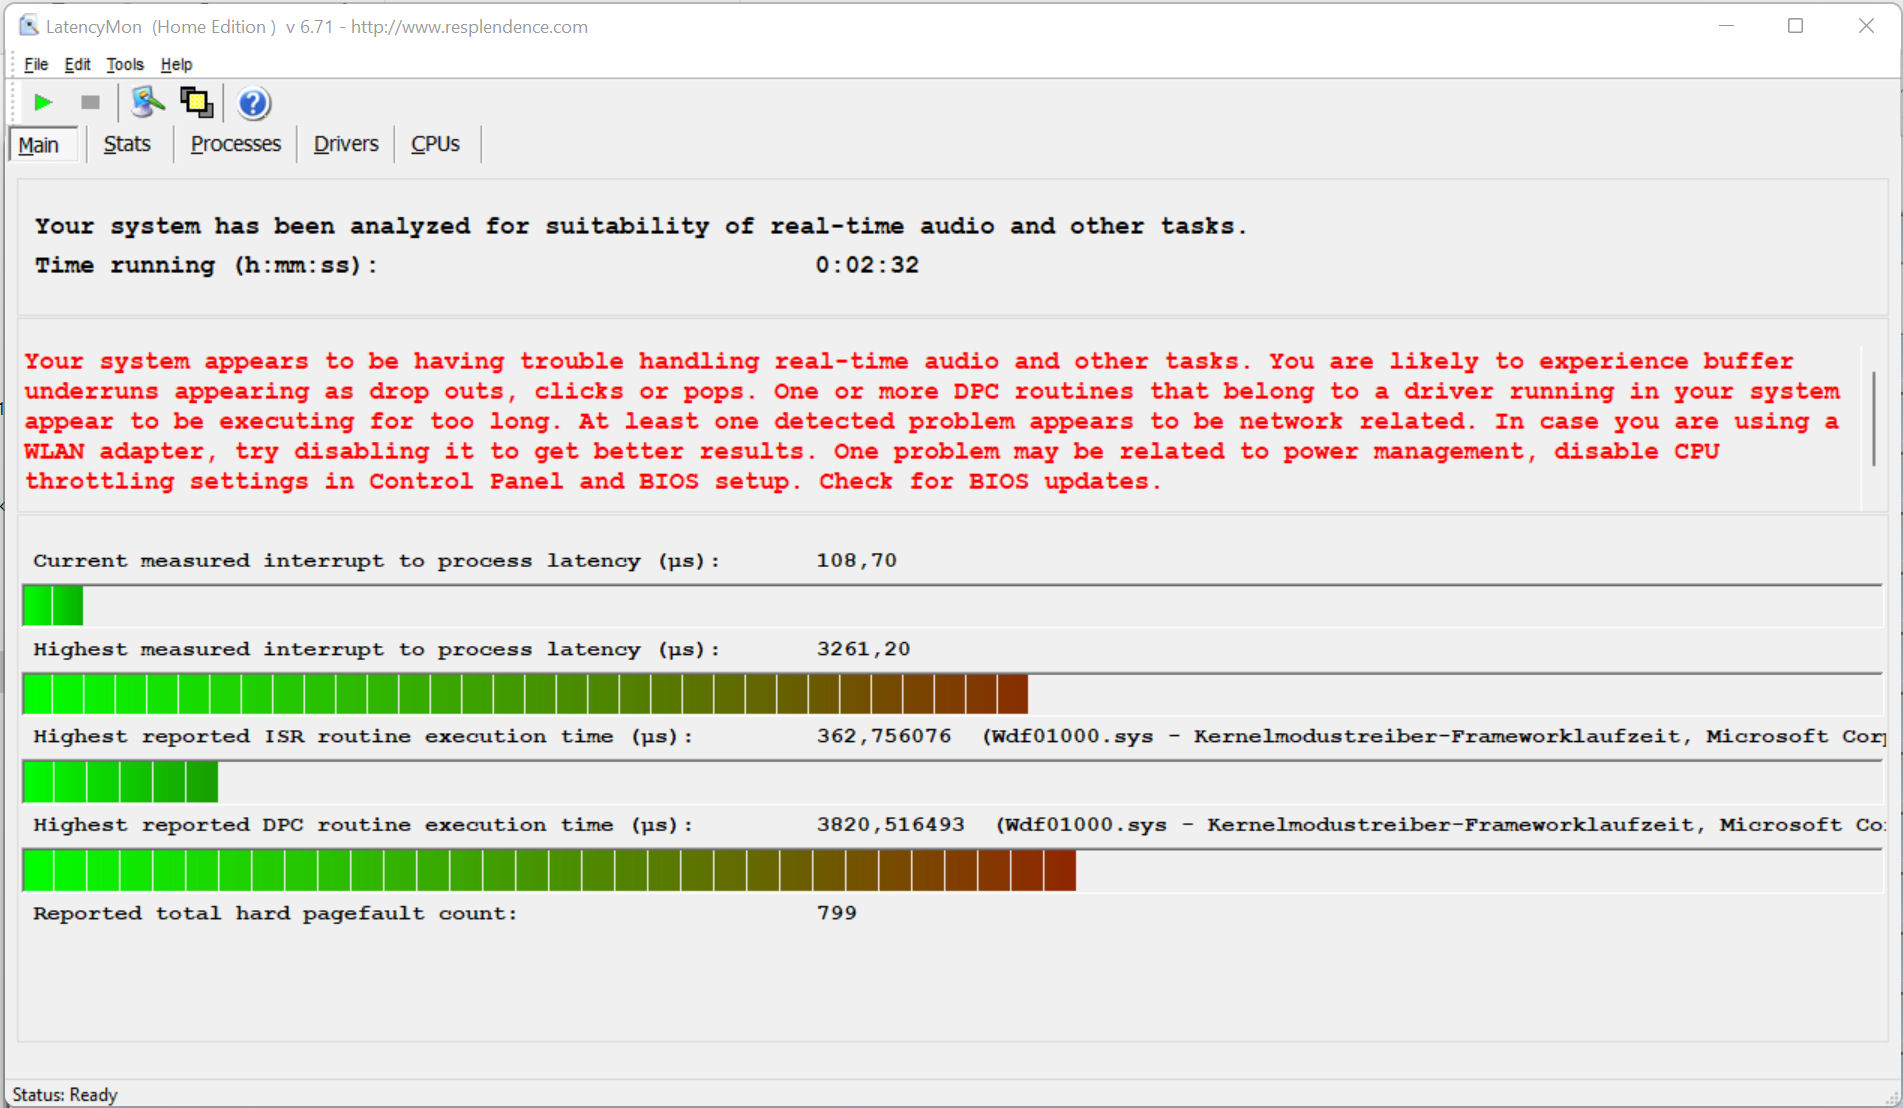
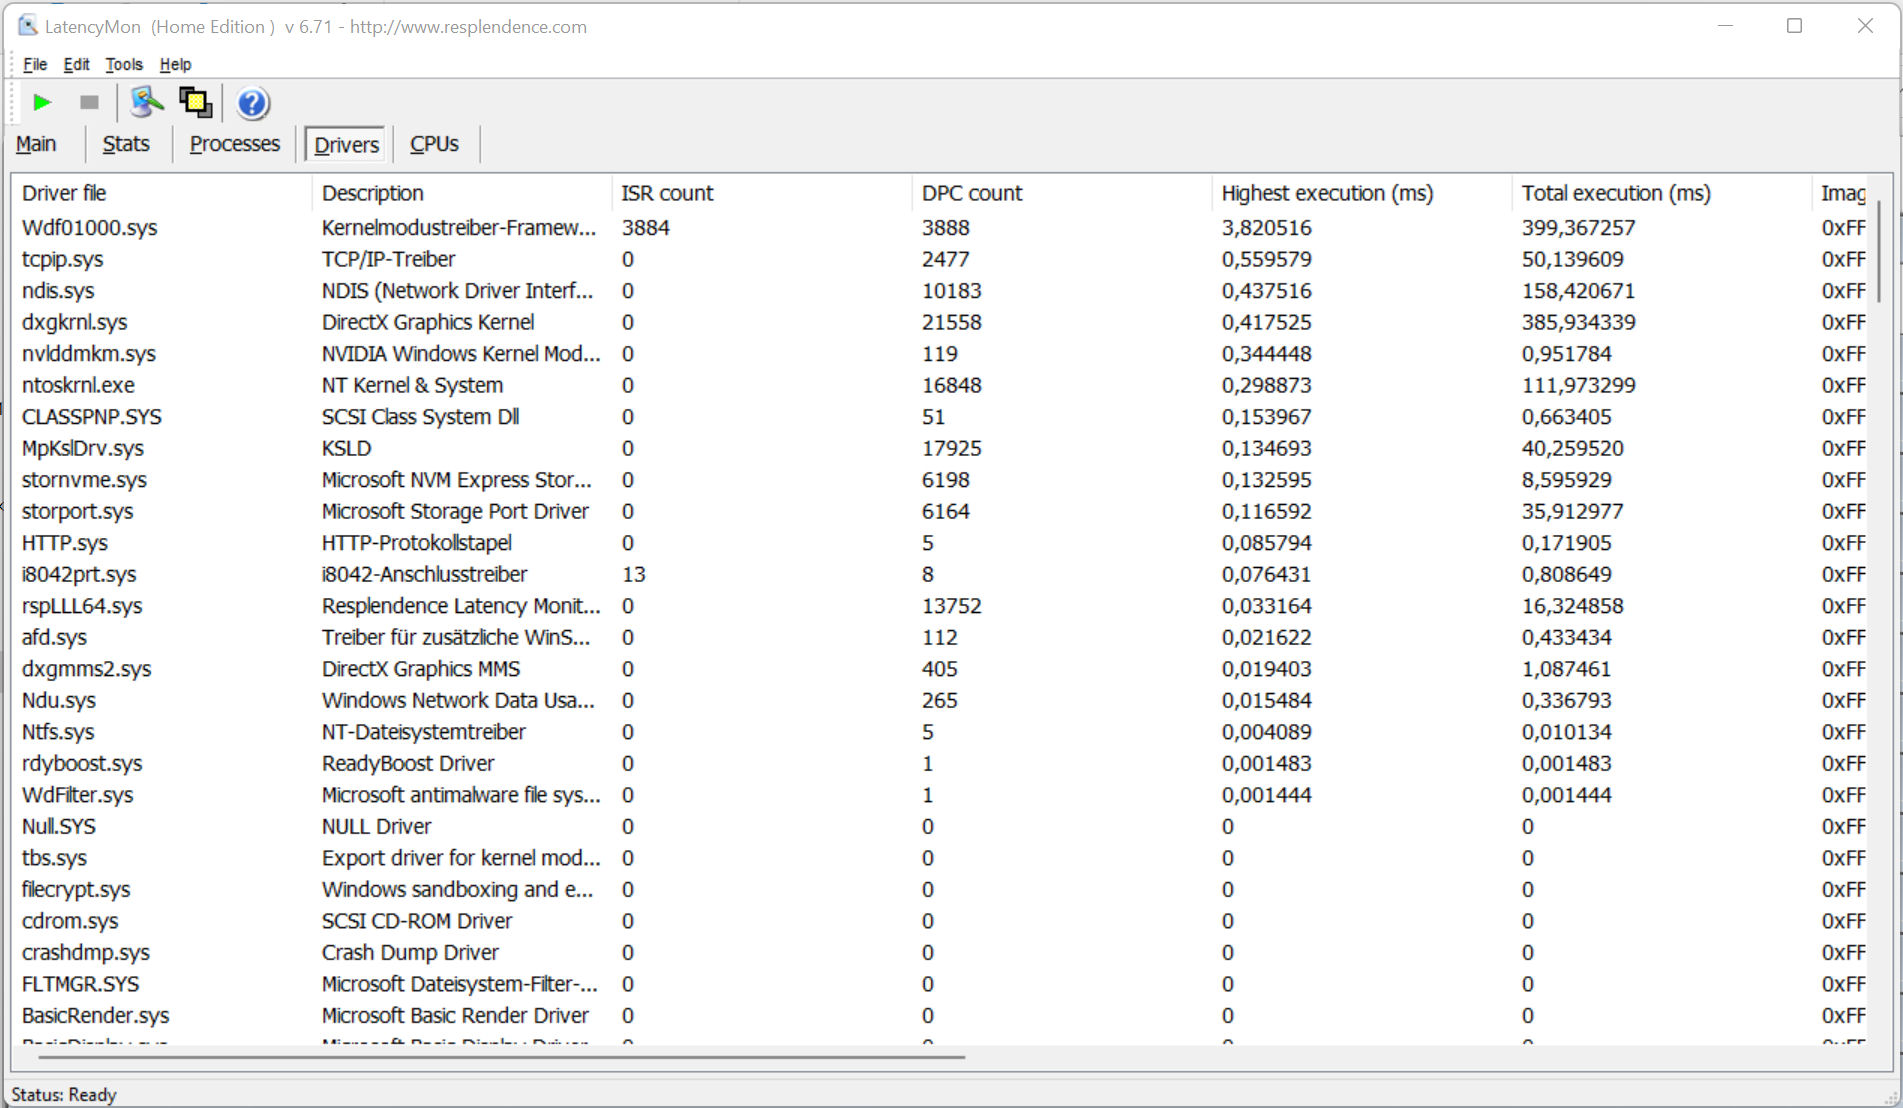
DPC-fördröjningar
Det standardiserade testet för övervakning av latens (webbsökning, uppspelning av 4K-video, Prime95 med hög belastning) visade på oregelbundenheter i DPC-latenserna. Systemet verkar inte vara lämpligt för video- och ljudredigering i realtid. Framtida mjukvaruuppdateringar kan leda till förbättringar eller sämre prestanda också
| DPC Latencies / LatencyMon - interrupt to process latency (max), Web, Youtube, Prime95 | |
| Schenker XMG Fusion 15 (Mid 22) | |
| MSI Delta 15 A5EFK | |
| Acer Nitro 5 AN515-58-72QR | |
| HP Omen 16-b1090ng | |
| Razer Blade 15 Base Edition 2021, i7-10750H RTX 3060 | |
| Asus TUF Dash F15 FX517ZR | |
* ... mindre är bättre
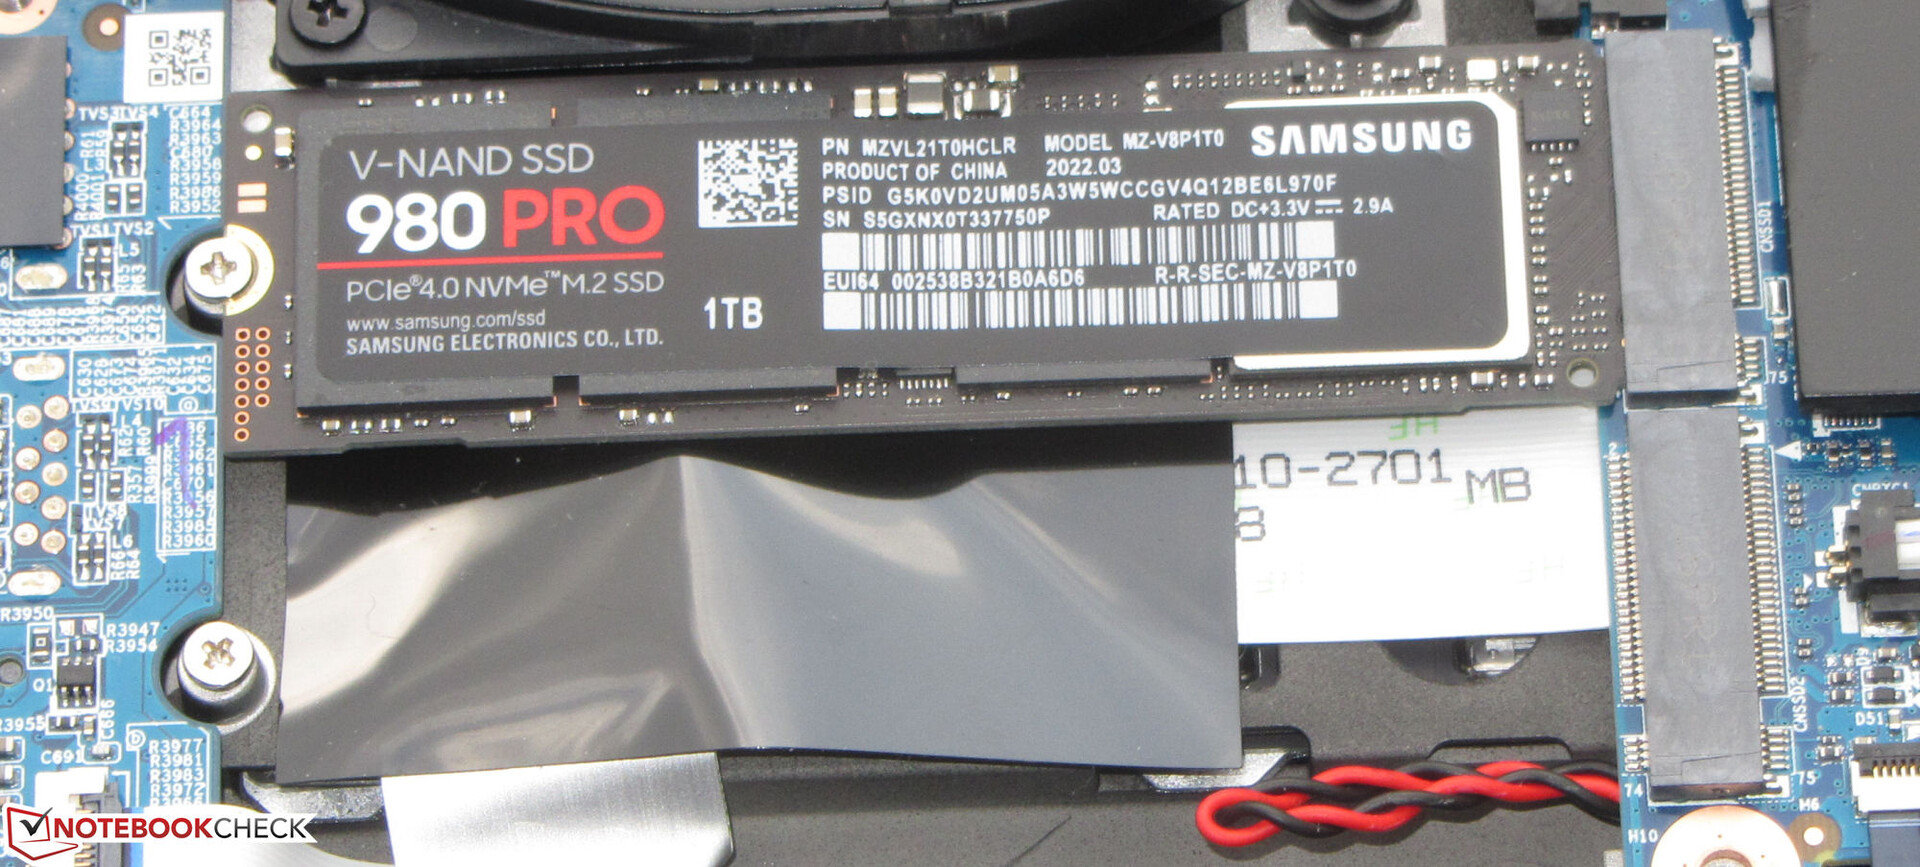
Lagring
Schenker utrustar den bärbara datorn med en PCIe 4 SSD (1 TB, M.2 2280) från Samsung som ger utmärkta överföringshastigheter. Den bärbara datorn har plats för totalt två M.2-2280 SSD-enheter (1x PCIe 4.0, 1x PCIe 3.0/SATA). RAID 0/1 stöds

* ... mindre är bättre
Continuous load read: DiskSpd Read Loop, Queue Depth 8
Grafikkort
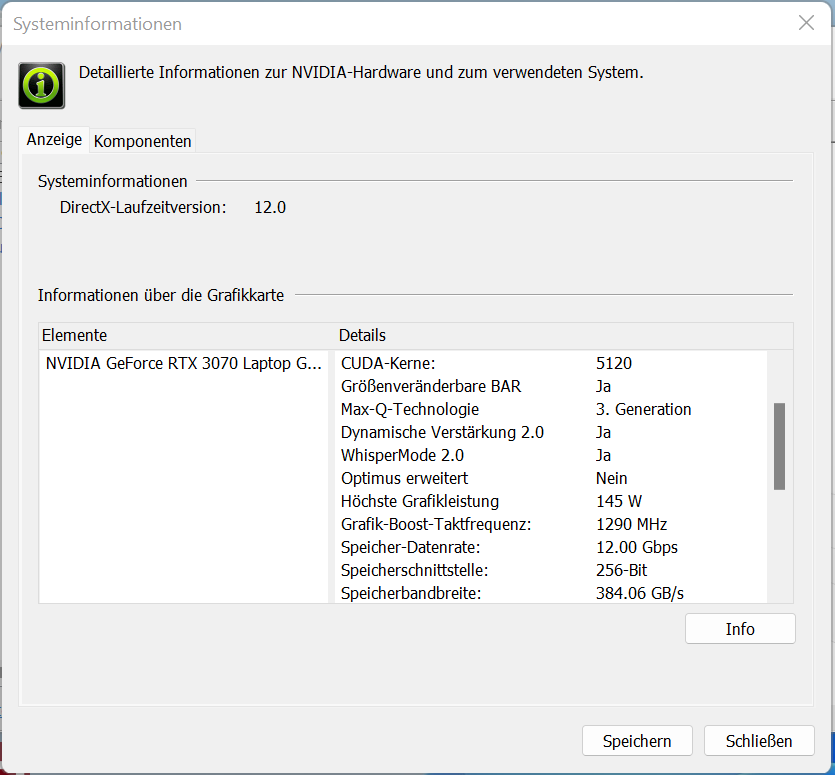
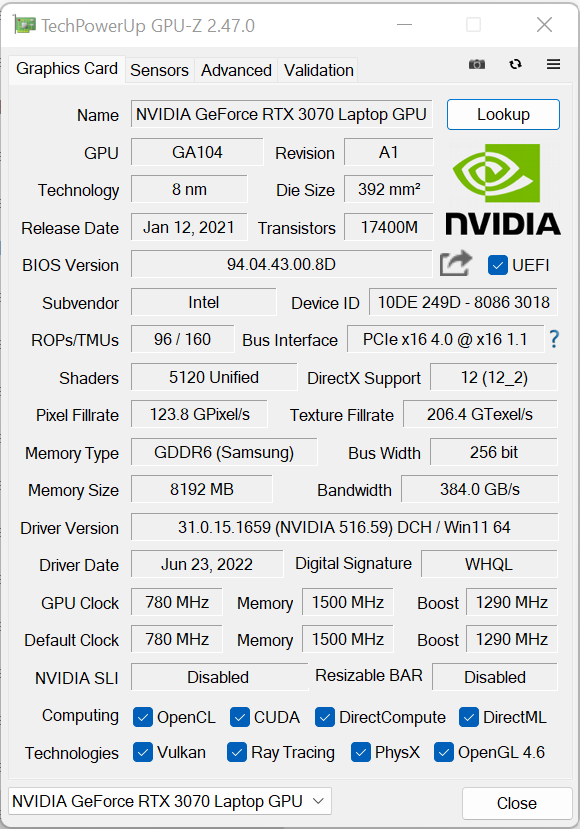
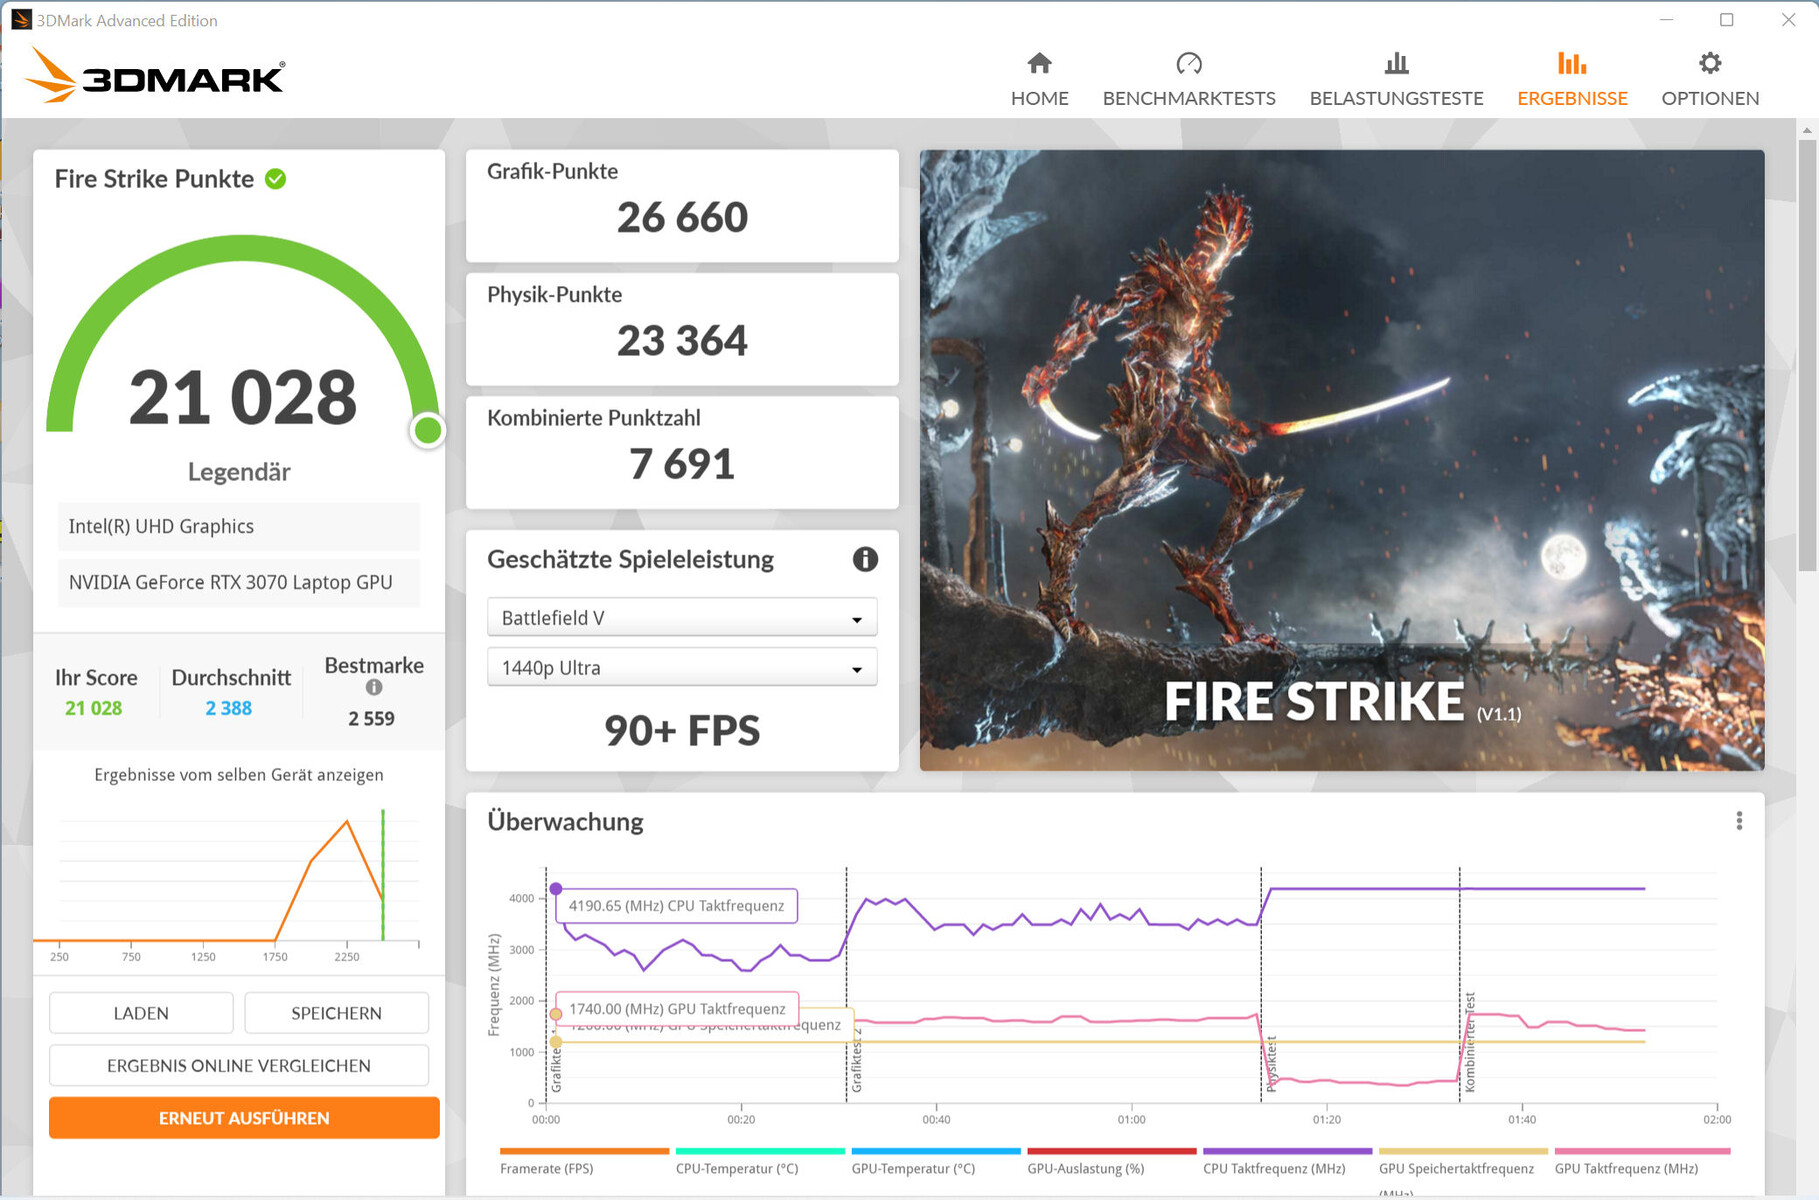
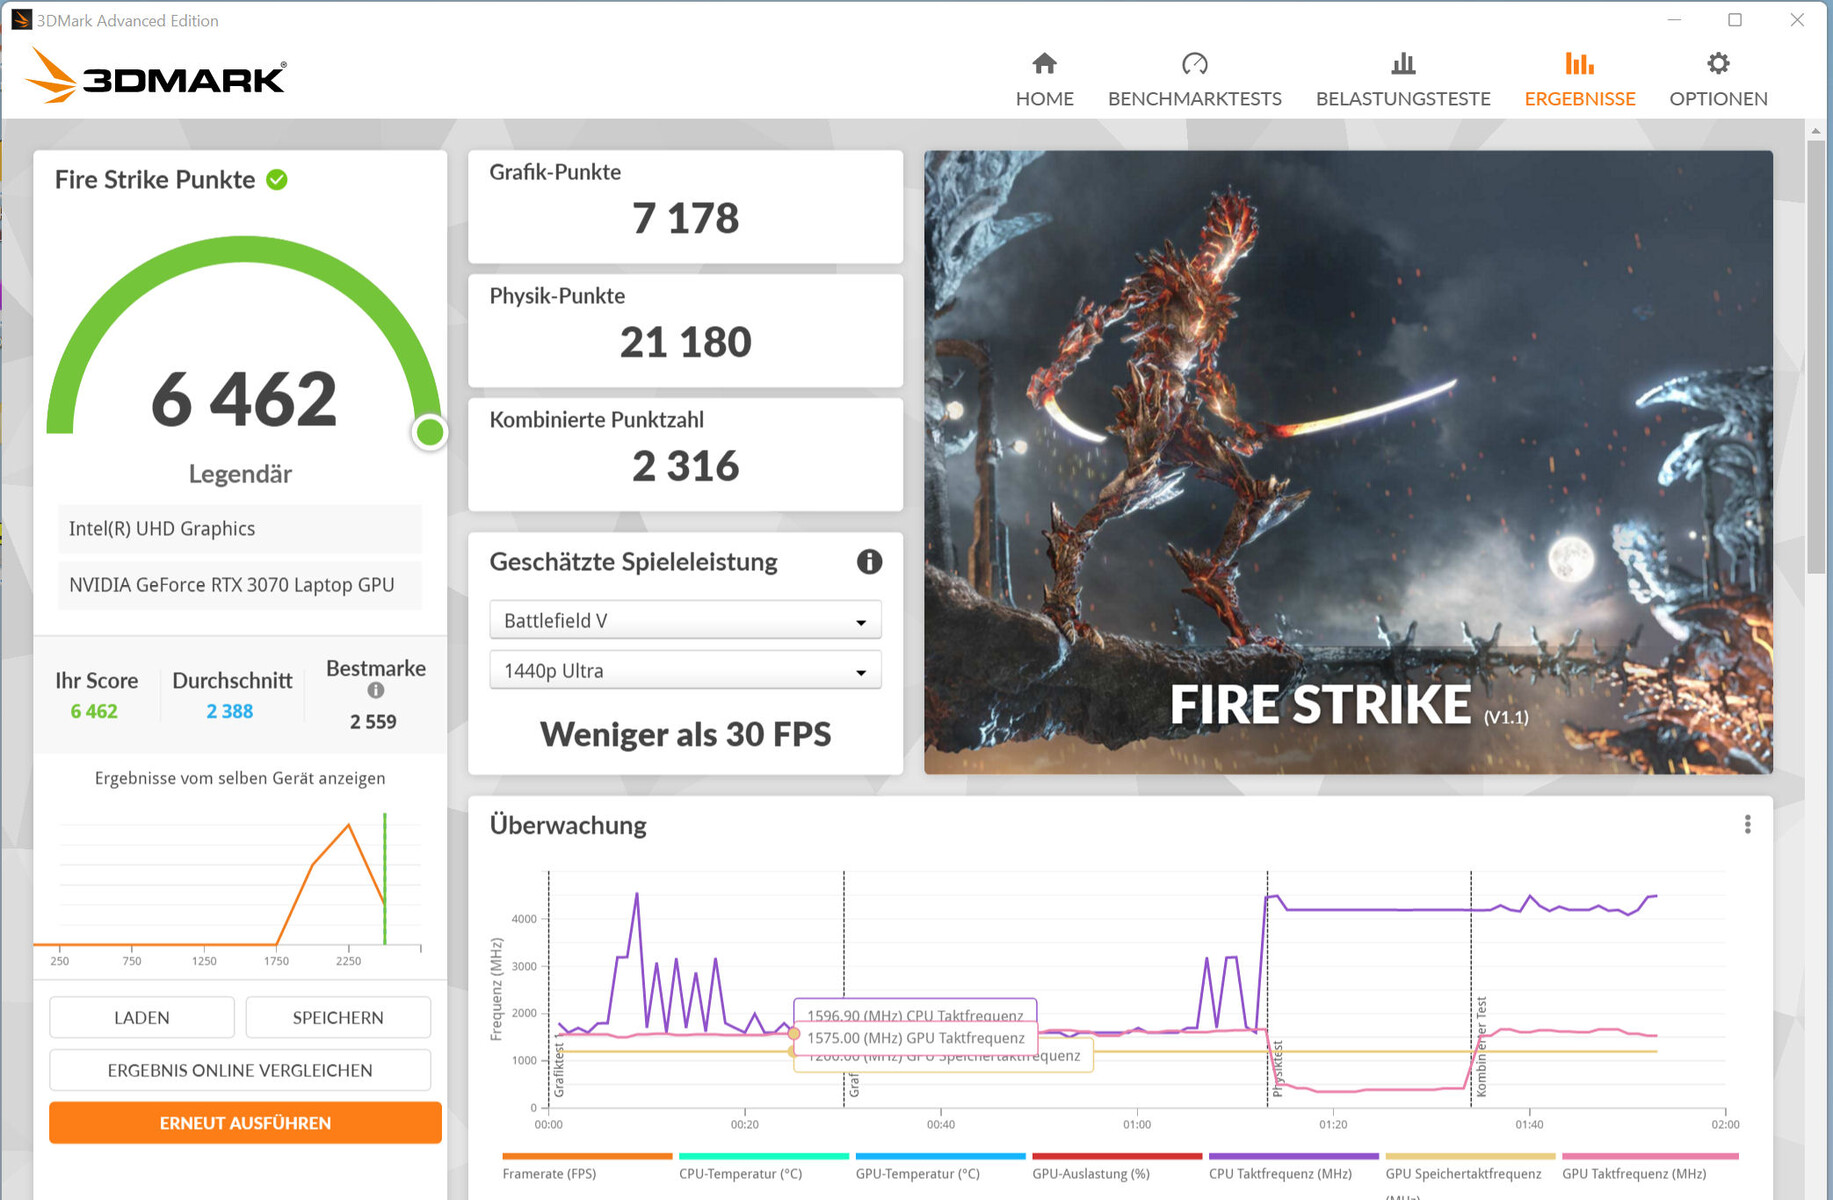
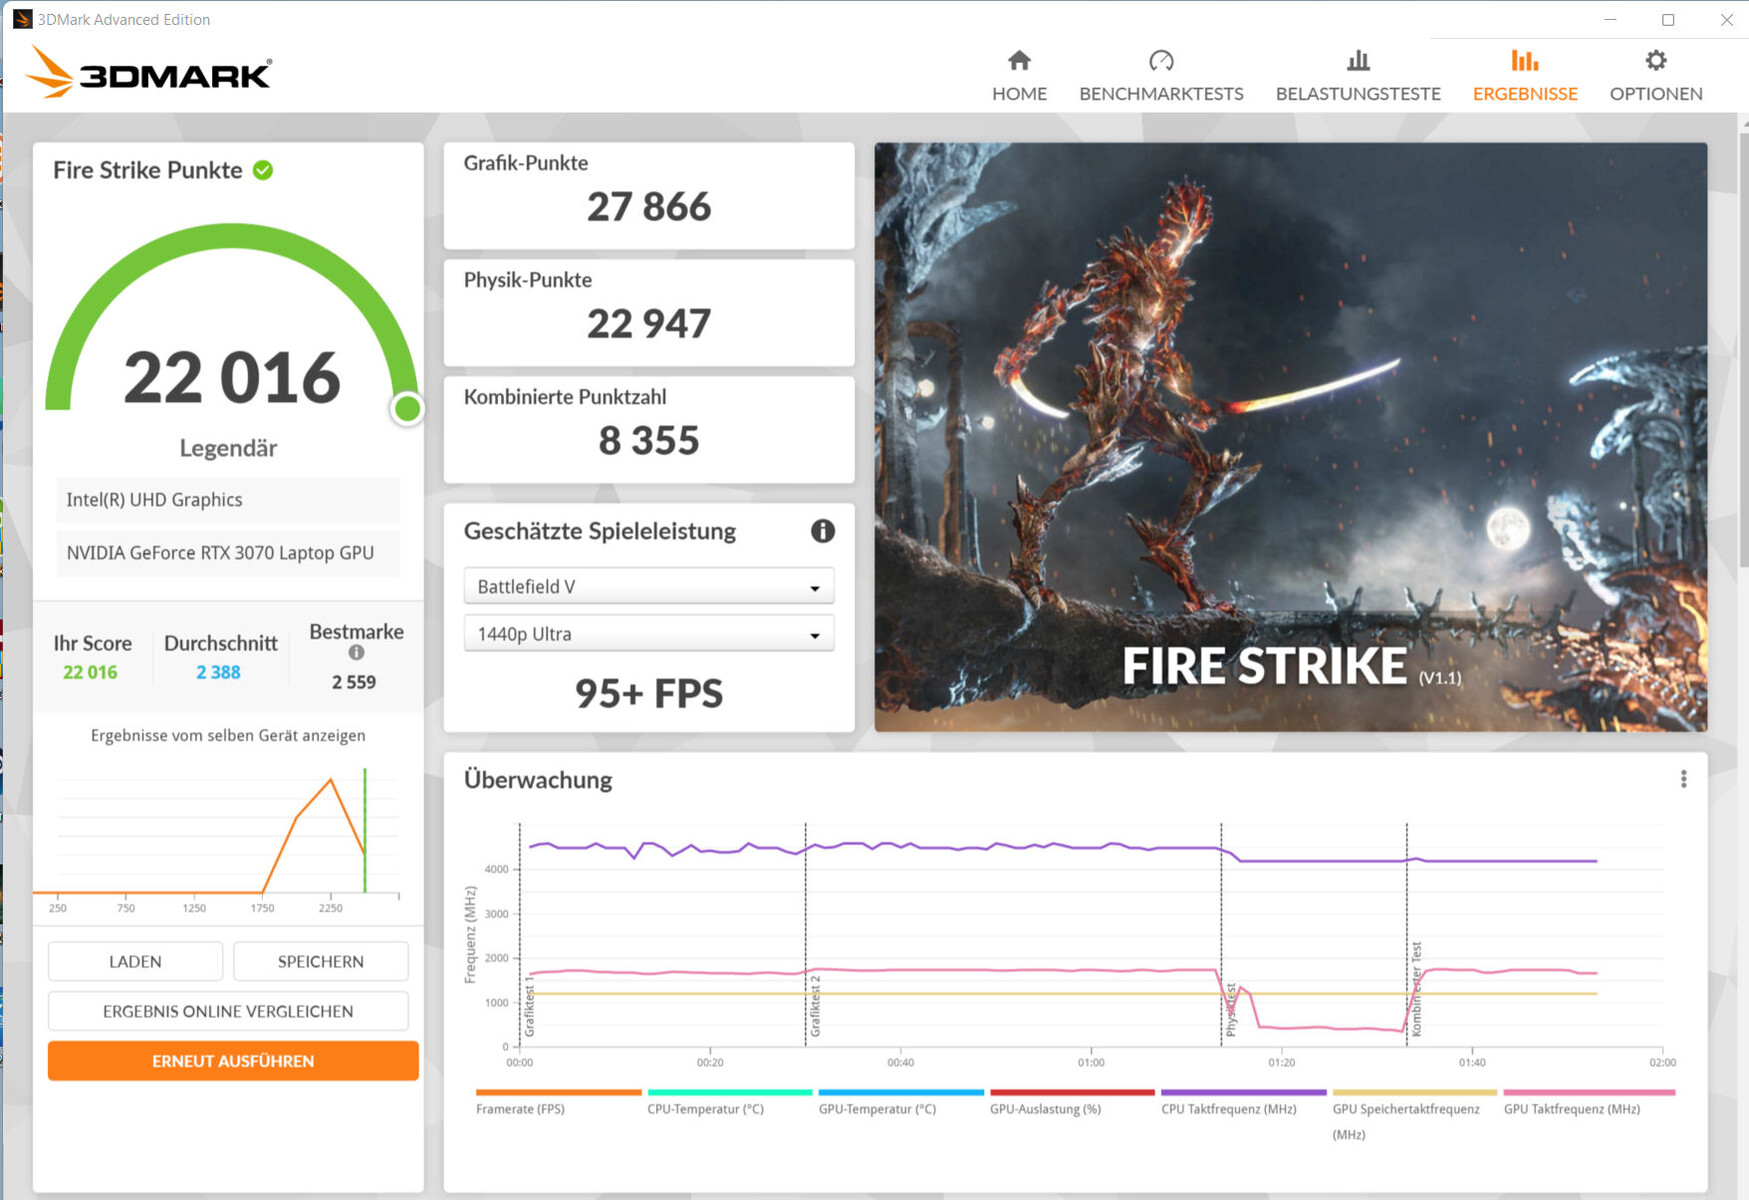
Den faktiska prestandan hos en RTX 3000 GPU beror på några faktorer: Kylning, minneskonfiguration och den maximala TGP som tillverkaren av en bärbar dator väljer inom de gränser som Nvidia har definierat. Schenker tillhandahåller den inbyggdaGeForce RTX 3070 bärbar dator GPU med en maximal TGP på 145 watt (125 watt + 20 watt Dynamic Boost). Dynamic Boost används dock endast när profilen "Benchmark Mode" är aktiv. GPU:n har tillgång till snabbt GDDR6-grafikminne (8 192 MB).
Profilen "Balanced" leder till benchmarkresultat i nivå med det tidigare fastställda genomsnittet för RTX 3070. Profilen "Benchmark Mode" gör det möjligt att öka hastigheterna. Även då utnyttjas inte den maximala TGP (145 W) fullt ut - det visar vårt test The Witcher 3. En del av Dynamic Boost används dock.
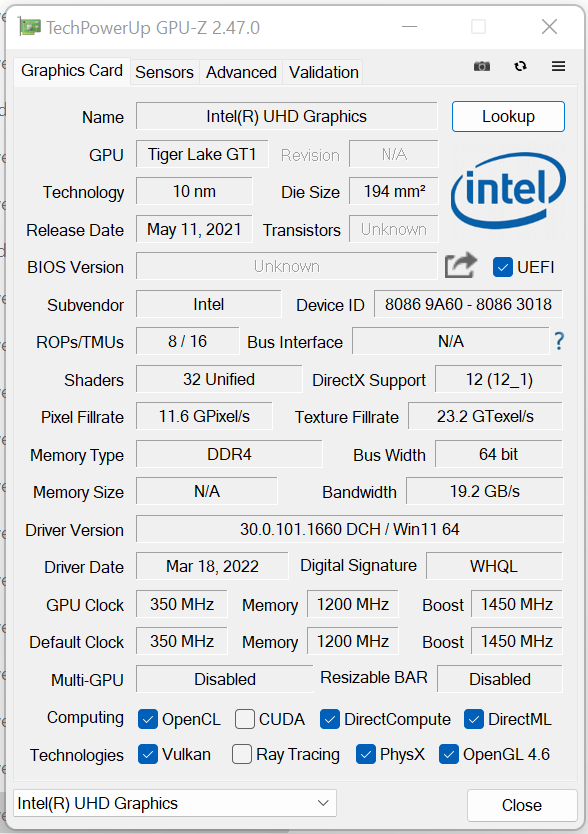
TheUHD Graphics Xe 32EUs grafikkärna som är integrerad i processorn är aktiv och den bärbara datorn arbetar med Nvidias Optimus-lösning för grafikkoppling. Fusion erbjuder inte möjligheten till direkt bildutgång via RTX 3070 GPU:n.

| 3DMark Performance rating - Percent | |
| Genomsnitt av klass Gaming | |
| Schenker XMG Fusion 15 (Mid 22) | |
| Acer Nitro 5 AN515-58-72QR | |
| MSI Delta 15 A5EFK -1! | |
| Schenker XMG Fusion 15 (Mid 22) | |
| HP Omen 16-b1090ng | |
| Genomsnitt NVIDIA GeForce RTX 3070 Laptop GPU | |
| Schenker XMG Fusion 15 (Mid 22) | |
| Asus TUF Dash F15 FX517ZR | |
| Razer Blade 15 Base Edition 2021, i7-10750H RTX 3060 | |
| Schenker XMG Fusion 15 (Mid 22) | |
| 3DMark 11 - 1280x720 Performance GPU | |
| Genomsnitt av klass Gaming (21841 - 80022, n=103, senaste 2 åren) | |
| Schenker XMG Fusion 15 (Mid 22) (Benchmark-Modus) | |
| Acer Nitro 5 AN515-58-72QR | |
| Schenker XMG Fusion 15 (Mid 22) (Leistung) | |
| HP Omen 16-b1090ng | |
| MSI Delta 15 A5EFK | |
| Genomsnitt NVIDIA GeForce RTX 3070 Laptop GPU (12535 - 38275, n=54) | |
| Schenker XMG Fusion 15 (Mid 22) | |
| Asus TUF Dash F15 FX517ZR | |
| Razer Blade 15 Base Edition 2021, i7-10750H RTX 3060 | |
| Schenker XMG Fusion 15 (Mid 22) (Stromsparmodus) | |
| Geekbench 5.5 - OpenCL Score | |
| Genomsnitt av klass Gaming (80702 - 277970, n=98, senaste 2 åren) | |
| Acer Nitro 5 AN515-58-72QR | |
| Schenker XMG Apex 15 Max | |
| Schenker XMG Fusion 15 (Mid 22) (Benchmark-Modus) | |
| Schenker XMG Fusion 15 (Mid 22) (Leistung) | |
| Schenker XMG Fusion 15 (Mid 22) | |
| HP Omen 16-b1090ng | |
| Asus TUF Dash F15 FX517ZR | |
| Genomsnitt NVIDIA GeForce RTX 3070 Laptop GPU (5732 - 125874, n=52) | |
| Razer Blade 15 Base Edition 2021, i7-10750H RTX 3060 | |
| MSI Delta 15 A5EFK | |
| Schenker XMG Fusion 15 (Mid 22) (Stromsparmodus) | |
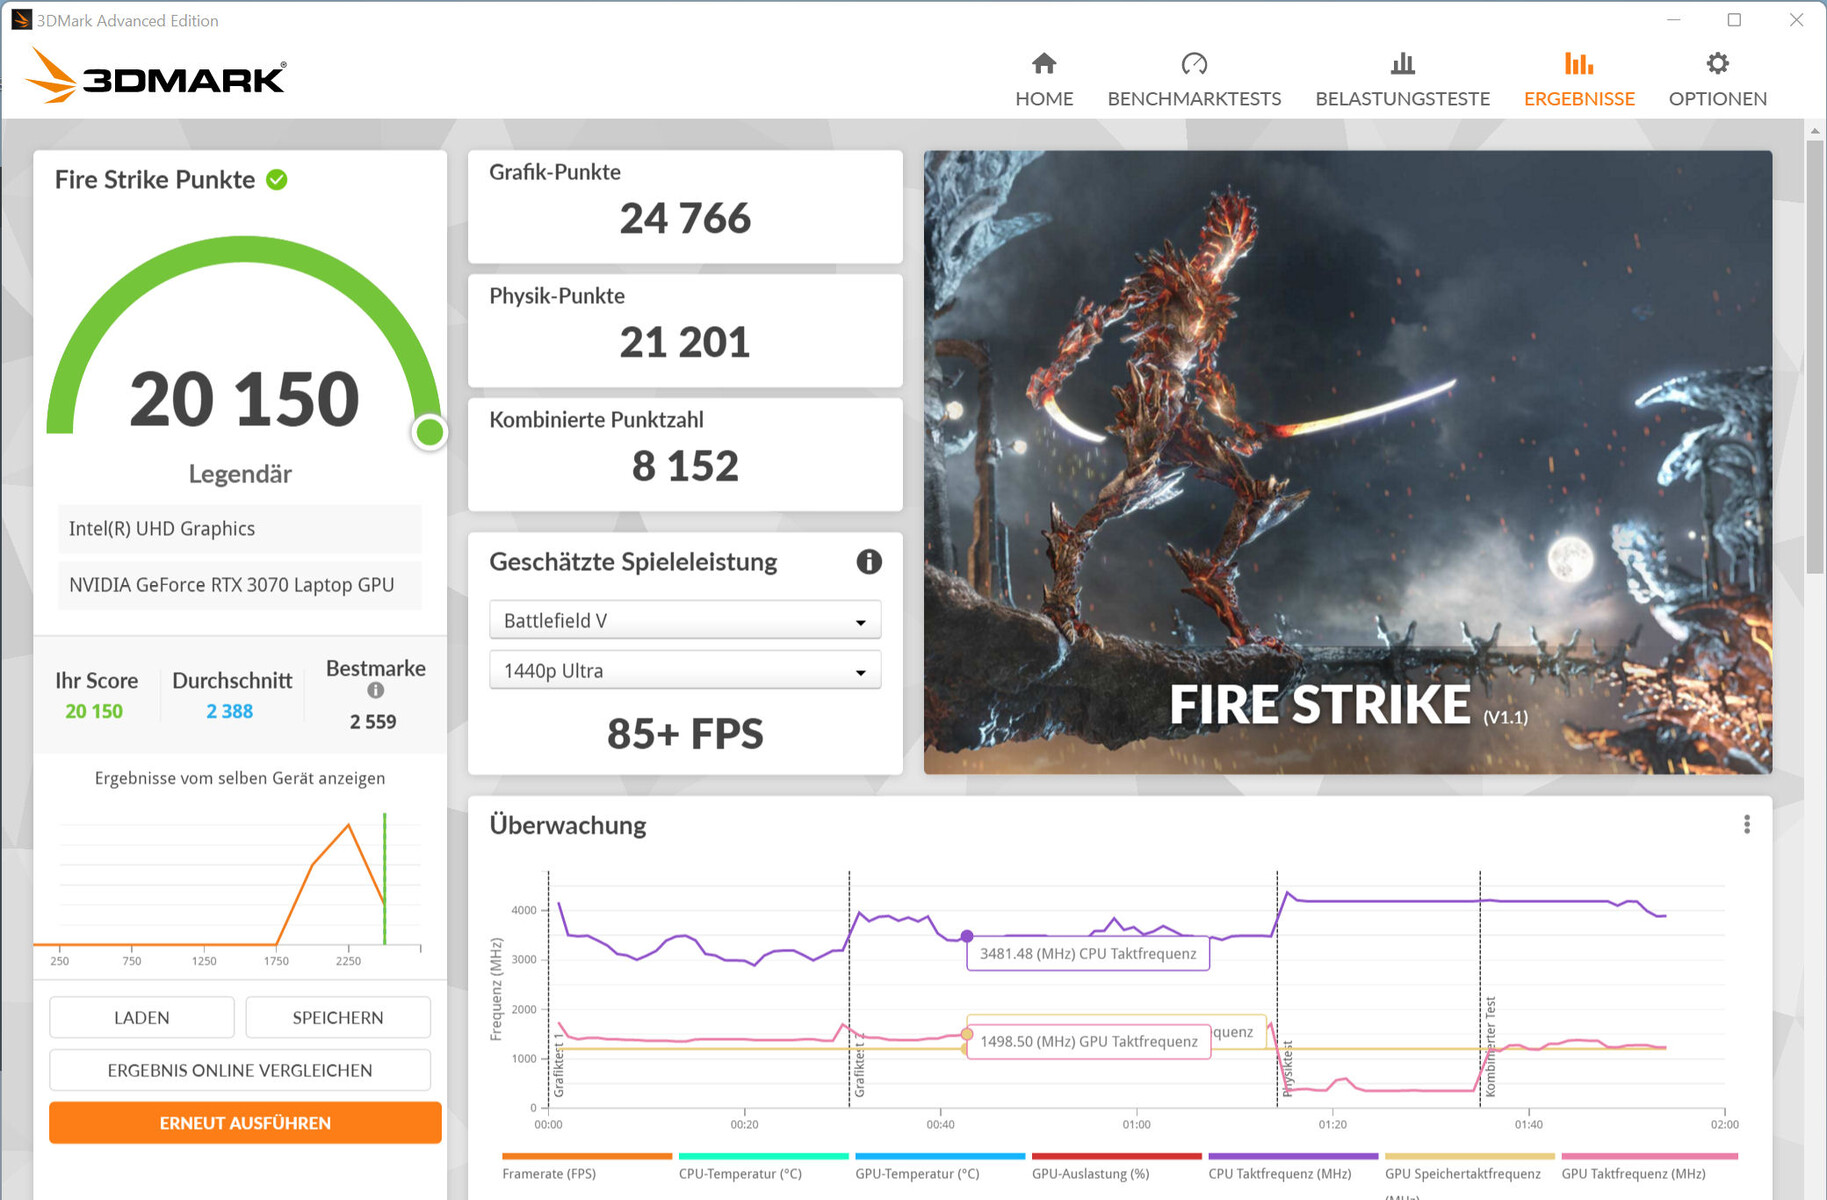
| 3DMark 11 Performance | 26211 poäng | |
| 3DMark Cloud Gate Standard Score | 48271 poäng | |
| 3DMark Fire Strike Score | 20150 poäng | |
| 3DMark Time Spy Score | 9025 poäng | |
Hjälp | ||
Spelprestanda
Hårdvaran möjliggör QHD-spel med höga till maximala inställningar. Högre upplösningar kan också användas när en motsvarande skärm är ansluten - ibland med reducerade inställningar. Bildfrekvenserna ligger på samma nivå som RTX 3070-genomsnittet. Profilen "Benchmark Mode" leder till en ökning av ramfrekvensen
| The Witcher 3 - 1920x1080 Ultra Graphics & Postprocessing (HBAO+) | |
| Genomsnitt av klass Gaming (104.7 - 240, n=7, senaste 2 åren) | |
| Schenker XMG Fusion 15 (Mid 22) (Benchmark-Modus) | |
| Acer Nitro 5 AN515-58-72QR | |
| HP Omen 16-b1090ng | |
| MSI Delta 15 A5EFK | |
| Schenker XMG Fusion 15 (Mid 22) | |
| Genomsnitt NVIDIA GeForce RTX 3070 Laptop GPU (34.9 - 109, n=52) | |
| Asus TUF Dash F15 FX517ZR | |
| Razer Blade 15 Base Edition 2021, i7-10750H RTX 3060 | |
| Dota 2 Reborn - 1920x1080 ultra (3/3) best looking | |
| Genomsnitt av klass Gaming (84.8 - 252, n=104, senaste 2 åren) | |
| HP Omen 16-b1090ng | |
| Acer Nitro 5 AN515-58-72QR | |
| Schenker XMG Fusion 15 (Mid 22) | |
| Schenker XMG Fusion 15 (Mid 22) (Benchmark-Modus) | |
| Razer Blade 15 Base Edition 2021, i7-10750H RTX 3060 | |
| Genomsnitt NVIDIA GeForce RTX 3070 Laptop GPU (26.9 - 163.9, n=58) | |
| Schenker XMG Fusion 15 (Mid 22) (Leistung) | |
| MSI Delta 15 A5EFK | |
| Asus TUF Dash F15 FX517ZR | |
| Schenker XMG Fusion 15 (Mid 22) (Stromsparmodus) | |
| X-Plane 11.11 - 1920x1080 high (fps_test=3) | |
| HP Omen 16-b1090ng | |
| Asus TUF Dash F15 FX517ZR | |
| Genomsnitt av klass Gaming (55.5 - 148.5, n=106, senaste 2 åren) | |
| Acer Nitro 5 AN515-58-72QR | |
| Schenker XMG Fusion 15 (Mid 22) | |
| Genomsnitt NVIDIA GeForce RTX 3070 Laptop GPU (12.4 - 118.8, n=61) | |
| Razer Blade 15 Base Edition 2021, i7-10750H RTX 3060 | |
| Schenker XMG Fusion 15 (Mid 22) (Benchmark-Modus) | |
| Schenker XMG Fusion 15 (Mid 22) (Leistung) | |
| Schenker XMG Fusion 15 (Mid 22) (Stromsparmodus) | |
| Final Fantasy XV Benchmark | |
| 1920x1080 High Quality | |
| Genomsnitt av klass Gaming (64.2 - 215, n=91, senaste 2 åren) | |
| Schenker XMG Fusion 15 (Mid 22) (1.3, Benchmark-Modus) | |
| HP Omen 16-b1090ng | |
| Schenker XMG Fusion 15 (Mid 22) (1.3, Leistung) | |
| Schenker XMG Fusion 15 (Mid 22) (1.3) | |
| Acer Nitro 5 AN515-58-72QR (1.3) | |
| Genomsnitt NVIDIA GeForce RTX 3070 Laptop GPU (27.9 - 107, n=49) | |
| Asus TUF Dash F15 FX517ZR (1.3) | |
| MSI Delta 15 A5EFK | |
| Razer Blade 15 Base Edition 2021, i7-10750H RTX 3060 (1.3) | |
| Schenker XMG Fusion 15 (Mid 22) (1.3, Stromsparmodus) | |
| 2560x1440 High Quality | |
| Genomsnitt av klass Gaming (73.6 - 184.3, n=83, senaste 2 åren) | |
| Schenker XMG Fusion 15 (Mid 22) (1.3, Benchmark-Modus) | |
| Schenker XMG Fusion 15 (Mid 22) (1.3, Leistung) | |
| Schenker XMG Fusion 15 (Mid 22) (1.3) | |
| Acer Nitro 5 AN515-58-72QR (1.3) | |
| Genomsnitt NVIDIA GeForce RTX 3070 Laptop GPU (19.8 - 79.9, n=25) | |
| Asus TUF Dash F15 FX517ZR (1.3) | |
| Schenker XMG Fusion 15 (Mid 22) (1.3, Stromsparmodus) | |
| GTA V | |
| 2560x1440 Highest AA:4xMSAA + FX AF:16x | |
| Genomsnitt av klass Gaming (62.7 - 183.9, n=68, senaste 2 åren) | |
| Schenker XMG Fusion 15 (Mid 22) (Benchmark-Modus) | |
| Schenker XMG Fusion 15 (Mid 22) (Leistung) | |
| Schenker XMG Fusion 15 (Mid 22) | |
| Genomsnitt NVIDIA GeForce RTX 3070 Laptop GPU (70.8 - 97.1, n=19) | |
| Acer Nitro 5 AN515-58-72QR | |
| Asus TUF Dash F15 FX517ZR | |
| 1920x1080 Highest AA:4xMSAA + FX AF:16x | |
| Genomsnitt av klass Gaming (67.1 - 186.9, n=90, senaste 2 åren) | |
| HP Omen 16-b1090ng | |
| Schenker XMG Fusion 15 (Mid 22) (Benchmark-Modus) | |
| Asus TUF Dash F15 FX517ZR | |
| Schenker XMG Fusion 15 (Mid 22) (Leistung) | |
| Schenker XMG Fusion 15 (Mid 22) | |
| Acer Nitro 5 AN515-58-72QR | |
| Genomsnitt NVIDIA GeForce RTX 3070 Laptop GPU (21.7 - 125.8, n=50) | |
| MSI Delta 15 A5EFK | |
| Razer Blade 15 Base Edition 2021, i7-10750H RTX 3060 | |
| Schenker XMG Fusion 15 (Mid 22) (Stromsparmodus) | |
| Strange Brigade | |
| 2560x1440 ultra AA:ultra AF:16 | |
| Genomsnitt av klass Gaming (103.8 - 354, n=72, senaste 2 åren) | |
| Acer Nitro 5 AN515-58-72QR (1.47.22.14 D3D12) | |
| Schenker XMG Fusion 15 (Mid 22) (1.47.22.14 D3D12, Benchmark-Modus) | |
| Schenker XMG Fusion 15 (Mid 22) (1.47.22.14 D3D12) | |
| Genomsnitt NVIDIA GeForce RTX 3070 Laptop GPU (82.3 - 140.5, n=18) | |
| Asus TUF Dash F15 FX517ZR (1.47.22.14 D3D12) | |
| 1920x1080 ultra AA:ultra AF:16 | |
| Genomsnitt av klass Gaming (113.6 - 458, n=83, senaste 2 åren) | |
| Schenker XMG Fusion 15 (Mid 22) (1.47.22.14 D3D12, Benchmark-Modus) | |
| Acer Nitro 5 AN515-58-72QR (1.47.22.14 D3D12) | |
| Schenker XMG Fusion 15 (Mid 22) (1.47.22.14 D3D12, Leistung) | |
| MSI Delta 15 A5EFK (1.47.22.14 D3D12) | |
| Schenker XMG Fusion 15 (Mid 22) (1.47.22.14 D3D12) | |
| Genomsnitt NVIDIA GeForce RTX 3070 Laptop GPU (36.2 - 194, n=46) | |
| Asus TUF Dash F15 FX517ZR (1.47.22.14 D3D12) | |
| HP Omen 16-b1090ng (1.47.22.14 D3D12) | |
| Razer Blade 15 Base Edition 2021, i7-10750H RTX 3060 (1.47.22.14 D3D12) | |
| Schenker XMG Fusion 15 (Mid 22) (1.47.22.14 D3D12, Stromsparmodus) | |
| F1 2021 | |
| 2560x1440 Ultra High Preset + Raytracing AA:T AF:16x | |
| Schenker XMG Fusion 15 (Mid 22) (874931, Benchmark-Modus) | |
| Schenker XMG Fusion 15 (Mid 22) (874931, Leistung) | |
| Genomsnitt NVIDIA GeForce RTX 3070 Laptop GPU (67.1 - 90.2, n=11) | |
| Acer Nitro 5 AN515-58-72QR (874931) | |
| Schenker XMG Fusion 15 (Mid 22) (874931) | |
| Asus TUF Dash F15 FX517ZR (874931) | |
| 1920x1080 Ultra High Preset + Raytracing AA:T AF:16x | |
| Schenker XMG Fusion 15 (Mid 22) (874931, Benchmark-Modus) | |
| Schenker XMG Fusion 15 (Mid 22) (874931, Leistung) | |
| Acer Nitro 5 AN515-58-72QR (874931) | |
| Schenker XMG Fusion 15 (Mid 22) (874931) | |
| MSI Delta 15 A5EFK | |
| Genomsnitt NVIDIA GeForce RTX 3070 Laptop GPU (33.1 - 123.1, n=23) | |
| Asus TUF Dash F15 FX517ZR (874931) | |
| Schenker XMG Fusion 15 (Mid 22) (874931, Stromsparmodus) | |
| Far Cry 5 | |
| 2560x1440 Ultra Preset AA:T | |
| Genomsnitt av klass Gaming (93 - 149, n=5, senaste 2 åren) | |
| Schenker XMG Fusion 15 (Mid 22) (Benchmark-Modus) | |
| Genomsnitt NVIDIA GeForce RTX 3070 Laptop GPU (81 - 101, n=18) | |
| Schenker XMG Fusion 15 (Mid 22) | |
| Asus TUF Dash F15 FX517ZR | |
| Acer Nitro 5 AN515-58-72QR | |
| 1920x1080 Ultra Preset AA:T | |
| Genomsnitt av klass Gaming (70 - 151, n=6, senaste 2 åren) | |
| Schenker XMG Fusion 15 (Mid 22) (Benchmark-Modus) | |
| Schenker XMG Fusion 15 (Mid 22) | |
| Genomsnitt NVIDIA GeForce RTX 3070 Laptop GPU (89 - 140, n=36) | |
| Asus TUF Dash F15 FX517ZR | |
| MSI Delta 15 A5EFK | |
| Acer Nitro 5 AN515-58-72QR | |
För att kontrollera om bildfrekvensen förblir i stort sett konstant under en längre tidsperiod lät vi spelet The Witcher 3 köras i cirka 60 minuter med Full HD-upplösning och maximala kvalitetsinställningar. Karaktären flyttas inte. Någon minskning av bildfrekvensen hittades inte
The Witcher 3 FPS diagram
| låg | med. | hög | ultra | QHD | |
|---|---|---|---|---|---|
| GTA V (2015) | 183.5 | 177 | 168.5 | 100 | 83.4 |
| The Witcher 3 (2015) | 348 | 260 | 163.4 | 91.8 | |
| Dota 2 Reborn (2015) | 155.7 | 139.4 | 132.8 | 125.3 | |
| Final Fantasy XV Benchmark (2018) | 171.3 | 121.6 | 93.8 | 72.1 | |
| X-Plane 11.11 (2018) | 121.2 | 111 | 86.8 | ||
| Far Cry 5 (2018) | 152 | 122 | 115 | 109 | 89 |
| Strange Brigade (2018) | 389 | 232 | 188.8 | 165.6 | 124.1 |
| F1 2021 (2021) | 267 | 194.2 | 170.1 | 105 | 79.8 |
Utsläpp - Schenkers bärbara dator värms upp rejält
Bullerutsläpp
De två fläktarna ger upphov till ganska lite buller vid daglig användning (kontor, Internet). De står till och med stilla ibland. Det blir högljutt vid full belastning med maximala ljudtrycksnivåer på 48 dB(A) (stresstest) respektive 46 dB(A) (vårt The Witcher 3 -test ), men det är inte överdrivet högljutt. De flesta konkurrenterna producerar mer buller, med endast denAsus TUF Dash F15 som ligger ungefär på samma nivå
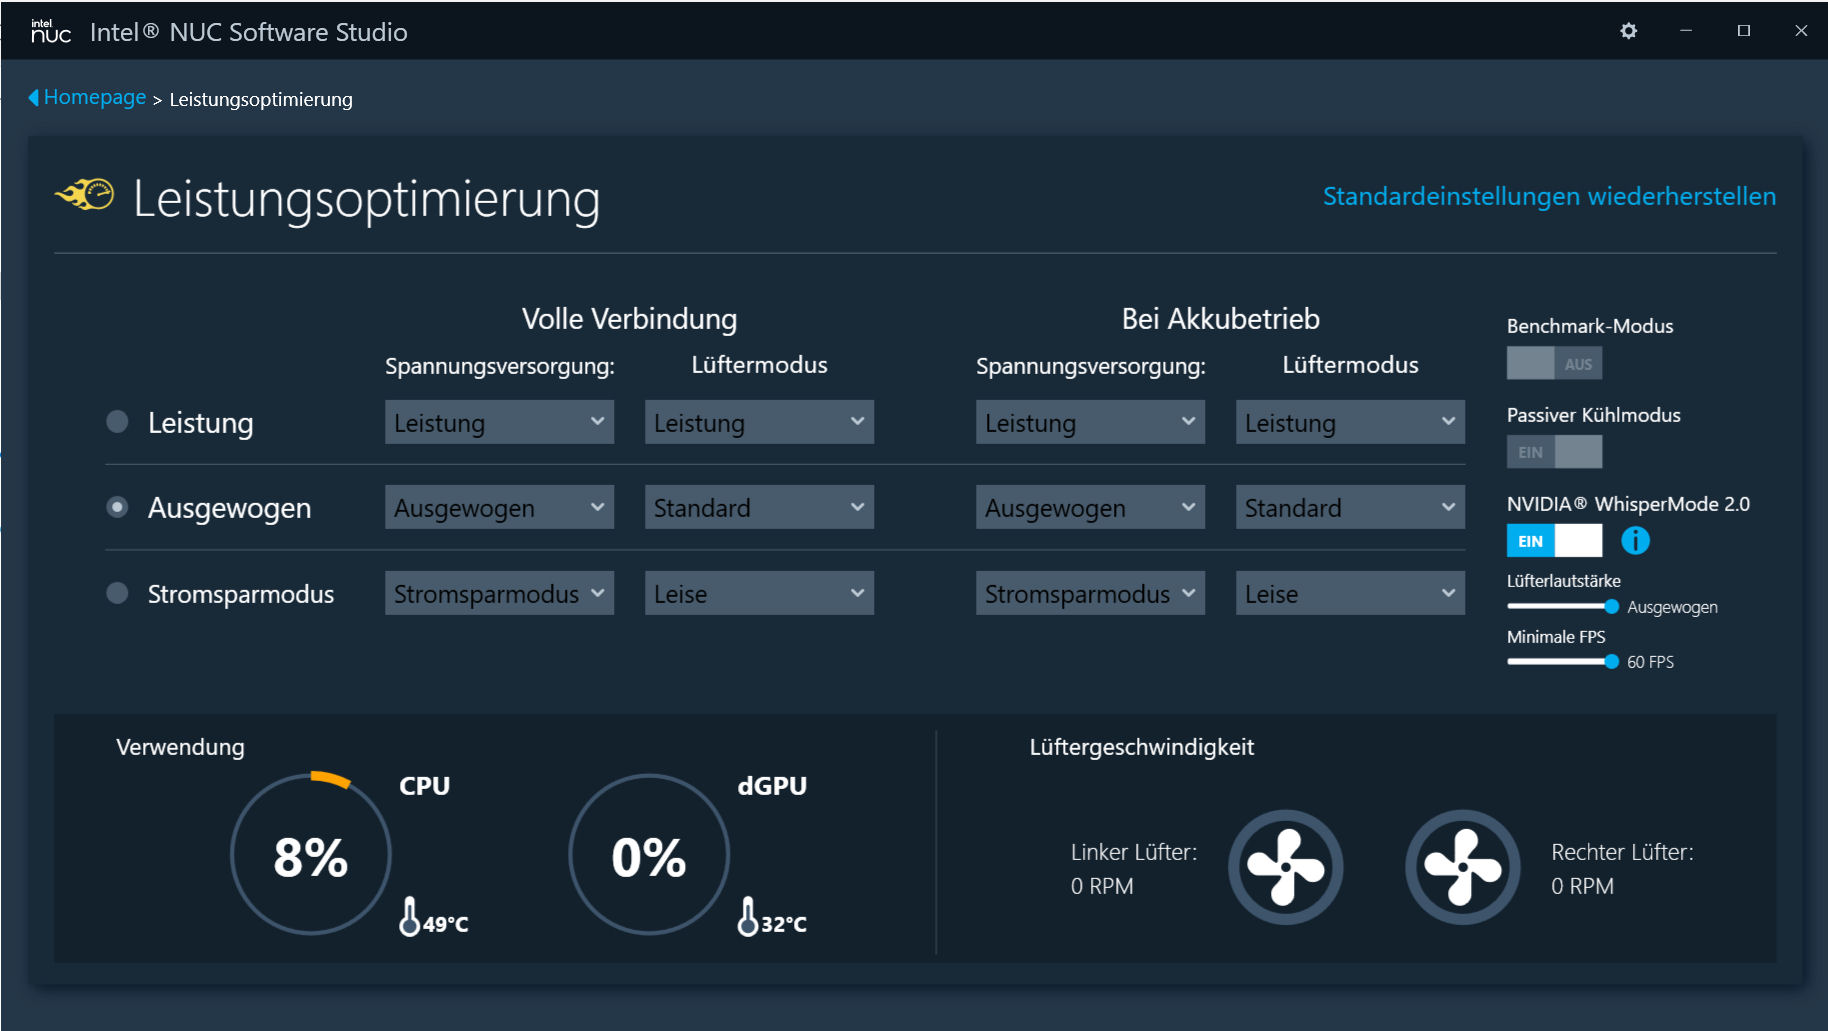
Bullerutvecklingen under belastning kan minskas på två sätt: Genom att använda profilen "Power-saving Mode" eller genom att aktivera GeForce GPU:s "WhisperMode 2.0". Den sistnämnda kan aktiveras i kontrollcentret (i avsnittet "Performance Optimization"). Den innehåller profilen "Power-saving Mode". Whisper Mode ska uppnå lägsta möjliga ljudnivå genom att använda bildfrekvensnivåer som är tillräckliga för ett datorspel (minst 30 till 60 fps). GPU:n behöver inte arbeta med full effekt; den producerar mindre värme och fläktarna kan sakta ner.
Ett ord om profilen "Benchmark Mode": Fläktarna körs kontinuerligt på full hastighet och är - föga förvånande - tydligt hörbara. Allt detta återspeglas i ett konstant väsande. Fläktarna i vårt recensionsexemplar avger inte något obehagligt bakgrundsljud.
Ljudnivå
| Låg belastning |
| 26 / 28 / 31 dB(A) |
| Hög belastning |
| 45 / 48 dB(A) |
 | ||
30 dB tyst 40 dB(A) hörbar 50 dB(A) högt ljud |
||
min: | ||
| Schenker XMG Fusion 15 (Mid 22) i7-11800H, GeForce RTX 3070 Laptop GPU | Asus TUF Dash F15 FX517ZR i7-12650H, GeForce RTX 3070 Laptop GPU | Acer Nitro 5 AN515-58-72QR i7-12700H, GeForce RTX 3070 Ti Laptop GPU | HP Omen 16-b1090ng i7-12700H, GeForce RTX 3070 Ti Laptop GPU | MSI Delta 15 A5EFK R9 5900HX, Radeon RX 6700M | Razer Blade 15 Base Edition 2021, i7-10750H RTX 3060 i7-10750H, GeForce RTX 3060 Laptop GPU | |
|---|---|---|---|---|---|---|
| Noise | -4% | -6% | -11% | -6% | 5% | |
| av / miljö * (dB) | 26 | 26 -0% | 26 -0% | 26 -0% | 25 4% | 25.3 3% |
| Idle Minimum * (dB) | 26 | 26 -0% | 26 -0% | 30 -15% | 25 4% | 25.4 2% |
| Idle Average * (dB) | 28 | 32 -14% | 29 -4% | 31 -11% | 30 -7% | 25.4 9% |
| Idle Maximum * (dB) | 31 | 33 -6% | 33 -6% | 33 -6% | 40 -29% | 25.4 18% |
| Load Average * (dB) | 45 | 48 -7% | 47 -4% | 49 -9% | 47 -4% | 42.5 6% |
| Witcher 3 ultra * (dB) | 46 | 47 -2% | 53 -15% | 53 -15% | 48 -4% | 42 9% |
| Load Maximum * (dB) | 48 | 49 -2% | 53 -10% | 57 -19% | 51 -6% | 52.2 -9% |
* ... mindre är bättre
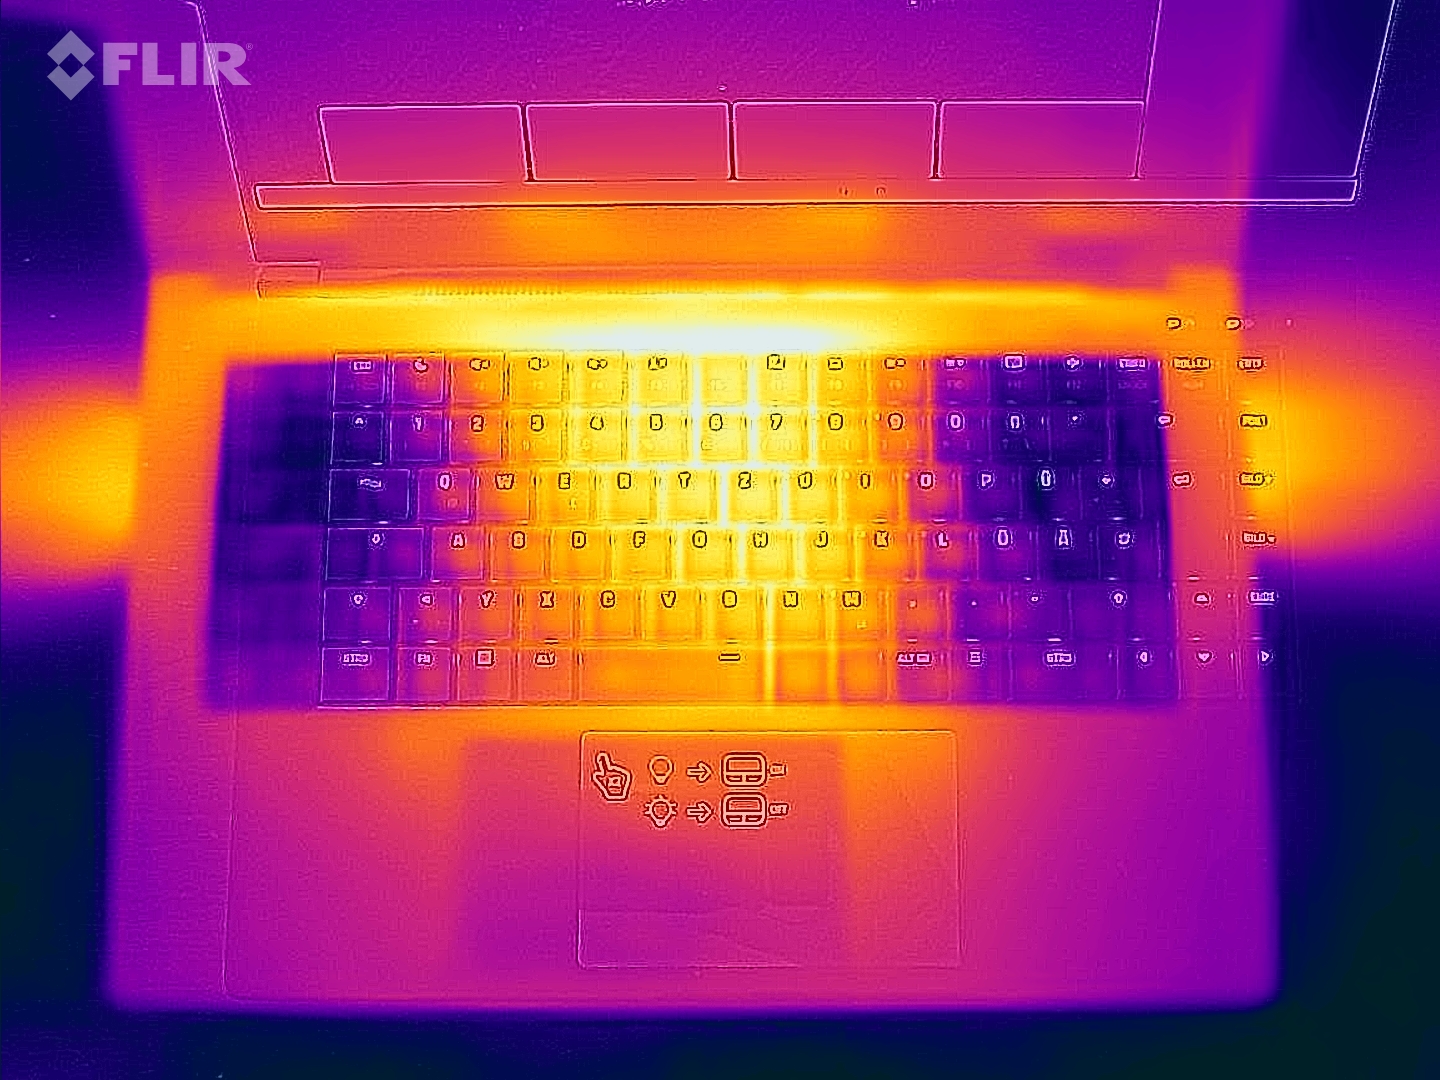
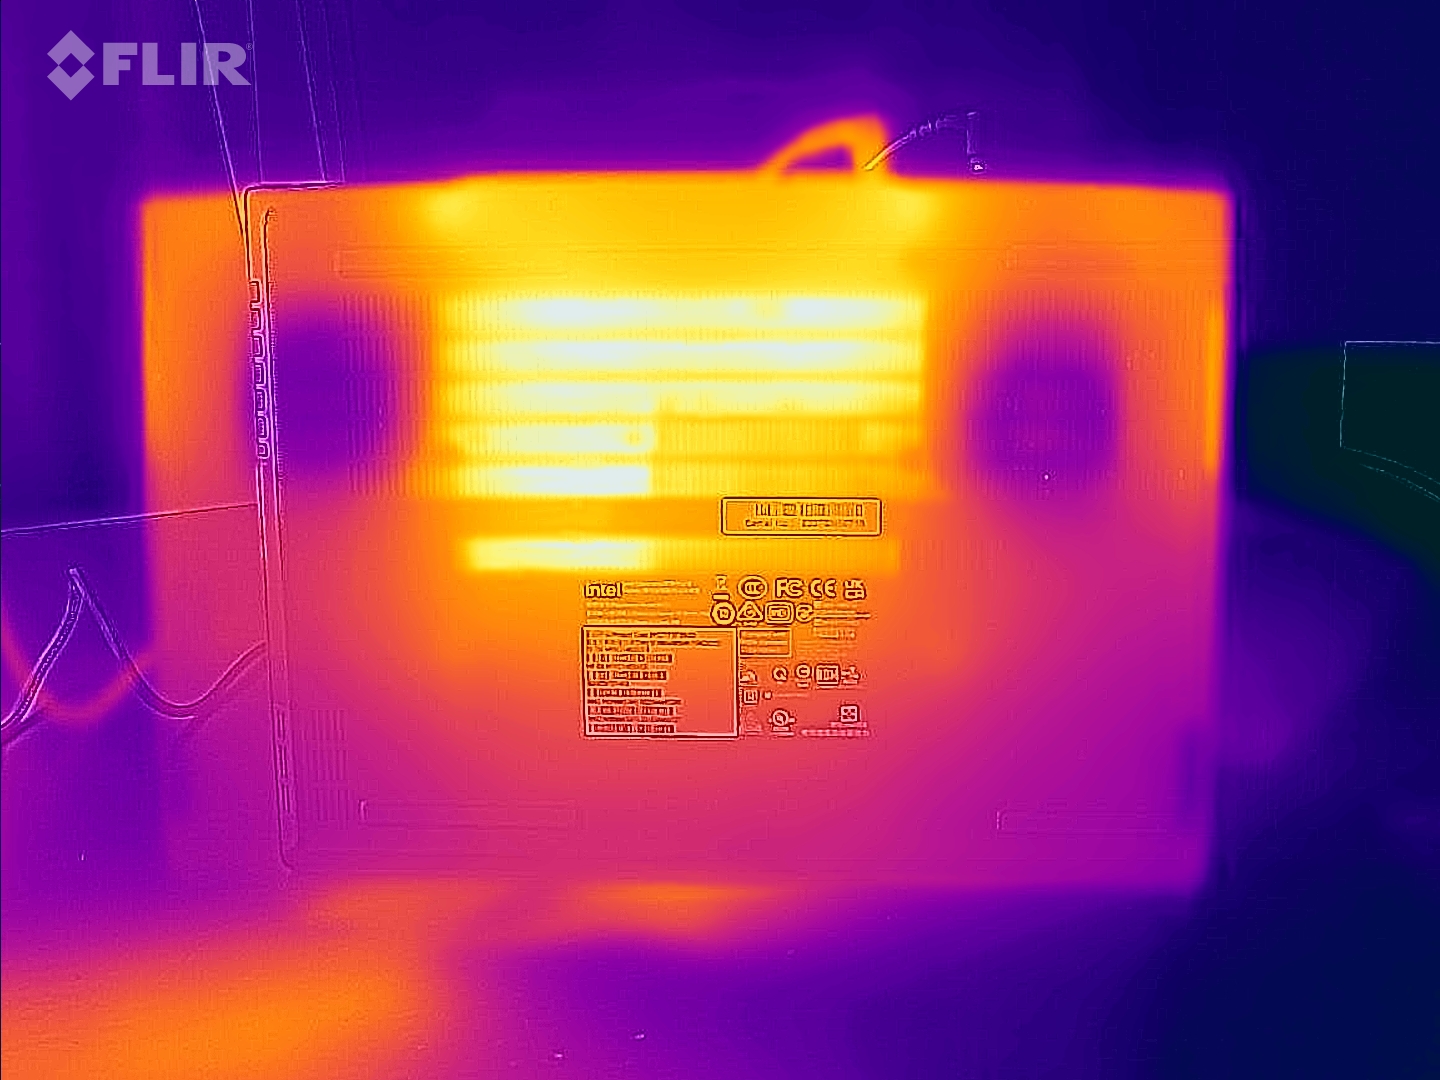
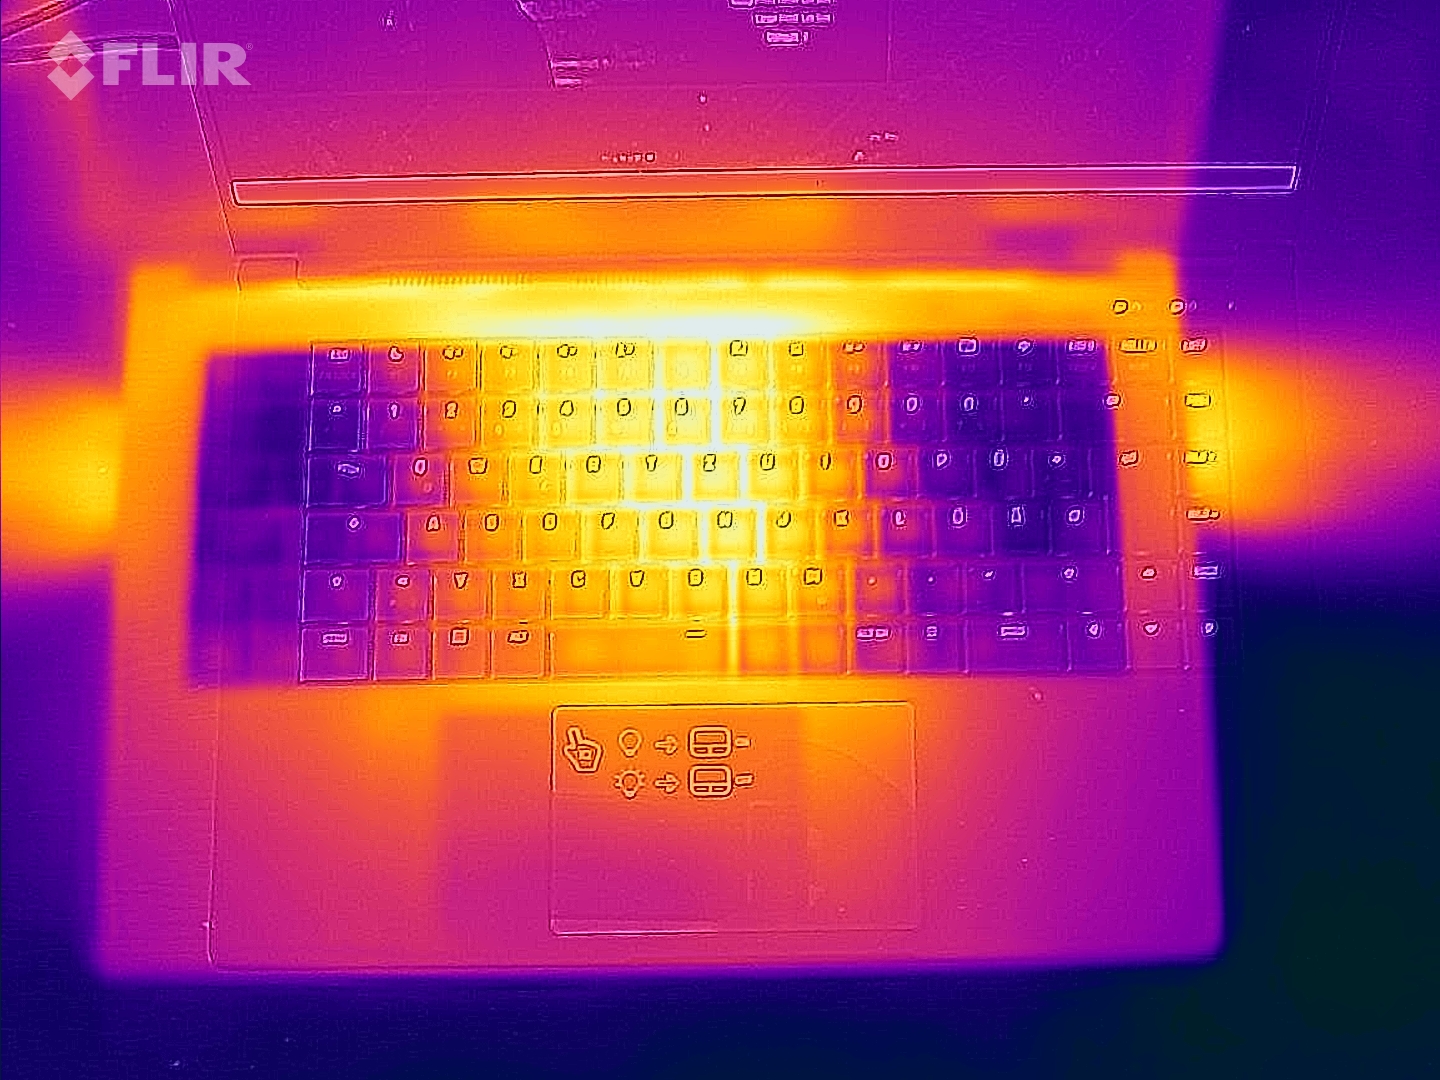
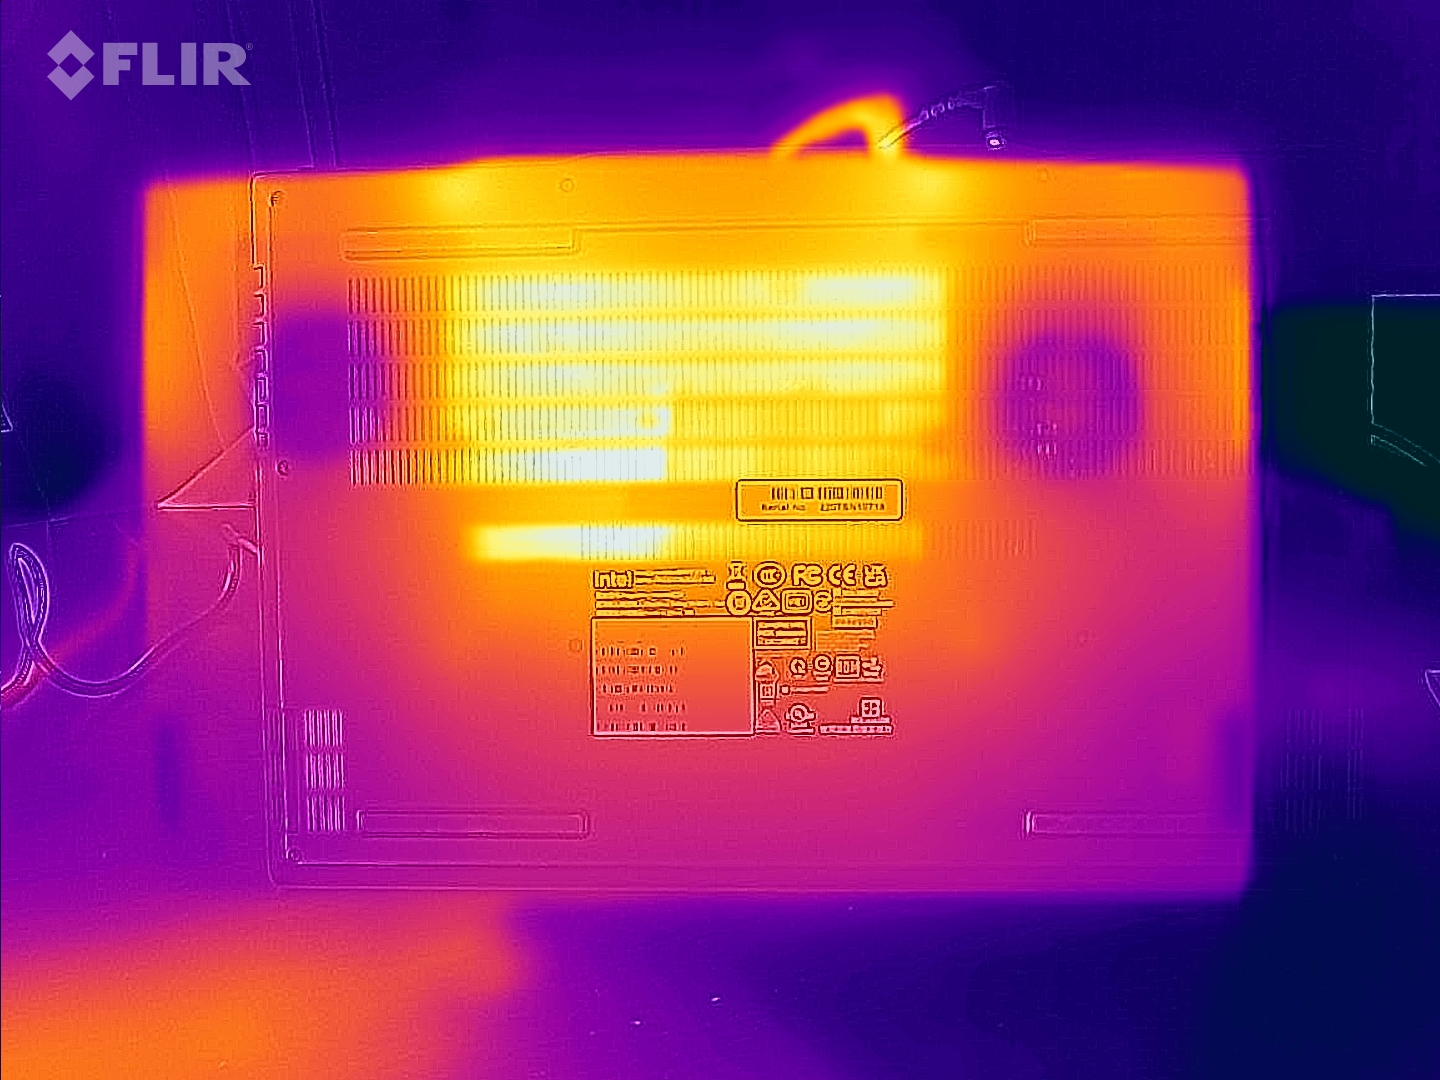
Temperatur
Vid vardaglig användning (kontor, Internet) håller sig temperaturerna inom ett acceptabelt intervall. Den bärbara datorn värms dock upp avsevärt under belastning (stress stress test, vårt The Witcher 3 test). Temperaturer strax över 60 °C (~140 °F) kan registreras vid flera mätpunkter. CPU-temperaturerna ger ingen anledning till oro
(-) Den maximala temperaturen på ovansidan är 52 °C / 126 F, jämfört med genomsnittet av 40.4 °C / 105 F , allt från 21.2 till 68.8 °C för klassen Gaming.
(-) Botten värms upp till maximalt 63 °C / 145 F, jämfört med genomsnittet av 43.2 °C / 110 F
(±) Vid tomgångsbruk är medeltemperaturen för ovansidan 35.6 °C / 96 F, jämfört med enhetsgenomsnittet på 33.9 °C / ### class_avg_f### F.
(-) När du spelar The Witcher 3 är medeltemperaturen för ovansidan 48.8 °C / 120 F, jämfört med enhetsgenomsnittet på 33.9 °C / ## #class_avg_f### F.
(-) Handledsstöden och pekplattan kan bli väldigt varma vid beröring med maximalt 46 °C / 114.8 F.
(-) Medeltemperaturen för handledsstödsområdet på liknande enheter var 28.8 °C / 83.8 F (-17.2 °C / -31 F).
| Schenker XMG Fusion 15 (Mid 22) Intel Core i7-11800H, NVIDIA GeForce RTX 3070 Laptop GPU | Asus TUF Dash F15 FX517ZR Intel Core i7-12650H, NVIDIA GeForce RTX 3070 Laptop GPU | Acer Nitro 5 AN515-58-72QR Intel Core i7-12700H, NVIDIA GeForce RTX 3070 Ti Laptop GPU | HP Omen 16-b1090ng Intel Core i7-12700H, NVIDIA GeForce RTX 3070 Ti Laptop GPU | MSI Delta 15 A5EFK AMD Ryzen 9 5900HX, AMD Radeon RX 6700M | Razer Blade 15 Base Edition 2021, i7-10750H RTX 3060 Intel Core i7-10750H, NVIDIA GeForce RTX 3060 Laptop GPU | |
|---|---|---|---|---|---|---|
| Heat | 8% | 12% | 22% | 14% | 12% | |
| Maximum Upper Side * (°C) | 52 | 52 -0% | 48 8% | 41 21% | 50 4% | 45.2 13% |
| Maximum Bottom * (°C) | 63 | 52 17% | 51 19% | 62 2% | 55 13% | 48 24% |
| Idle Upper Side * (°C) | 37 | 33 11% | 34 8% | 25 32% | 31 16% | 34.4 7% |
| Idle Bottom * (°C) | 38 | 36 5% | 33 13% | 26 32% | 30 21% | 37.2 2% |
* ... mindre är bättre
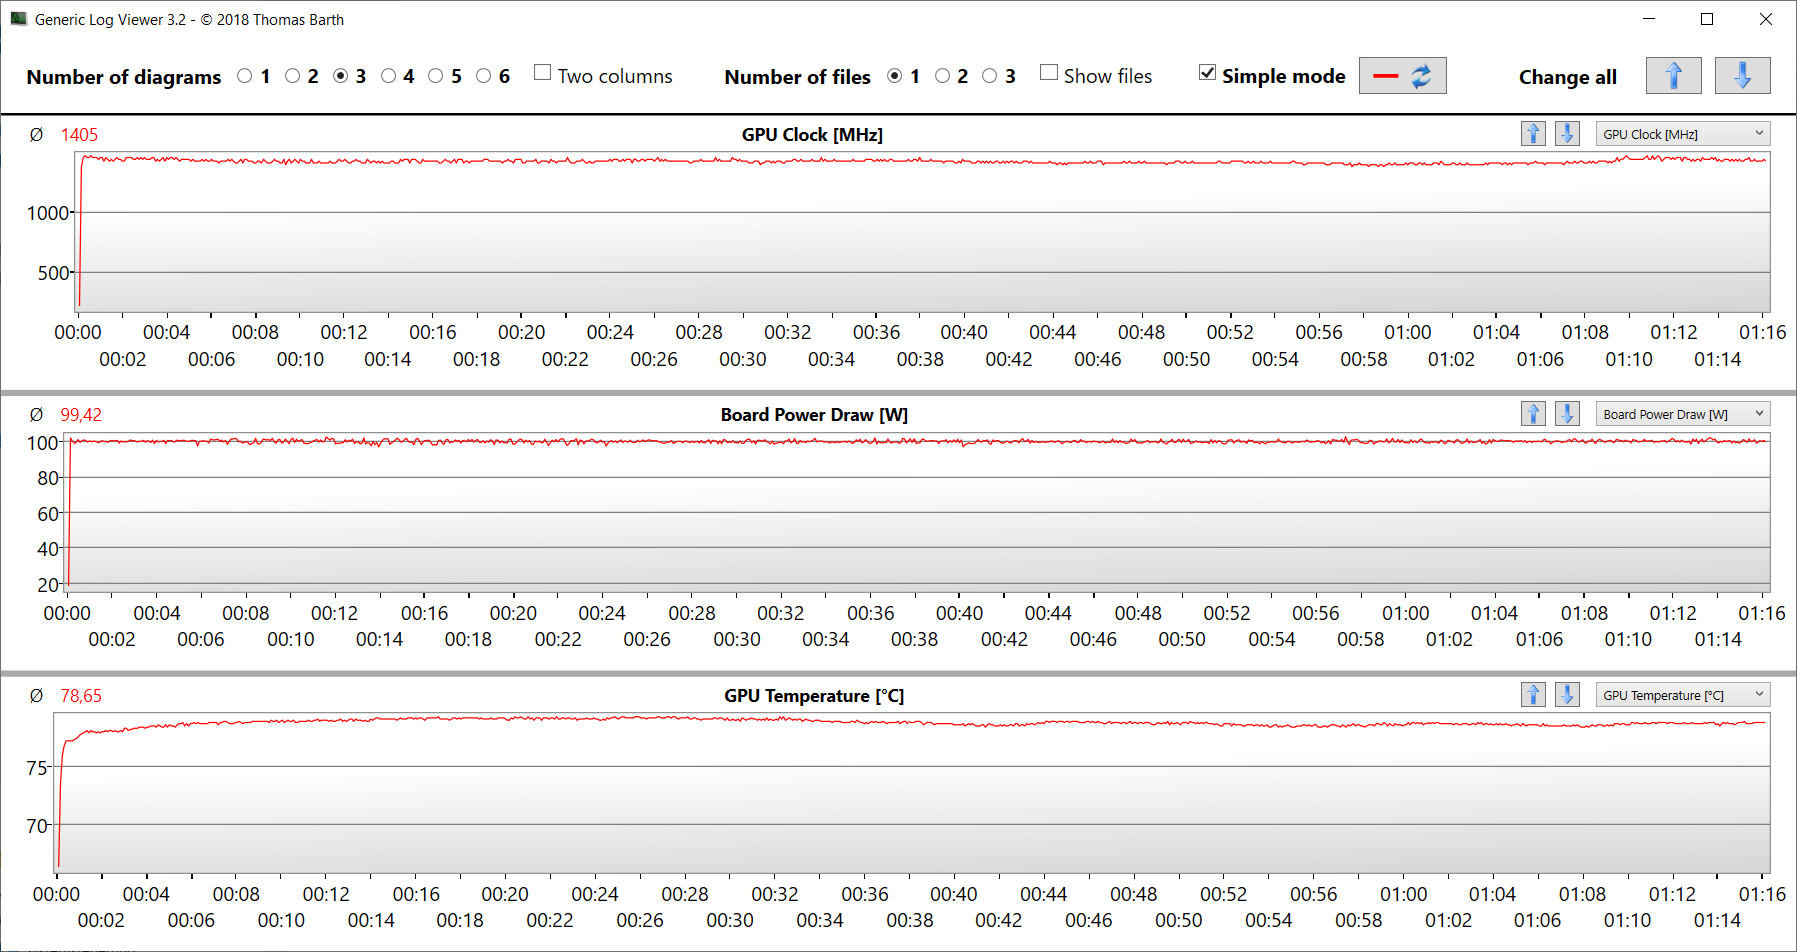
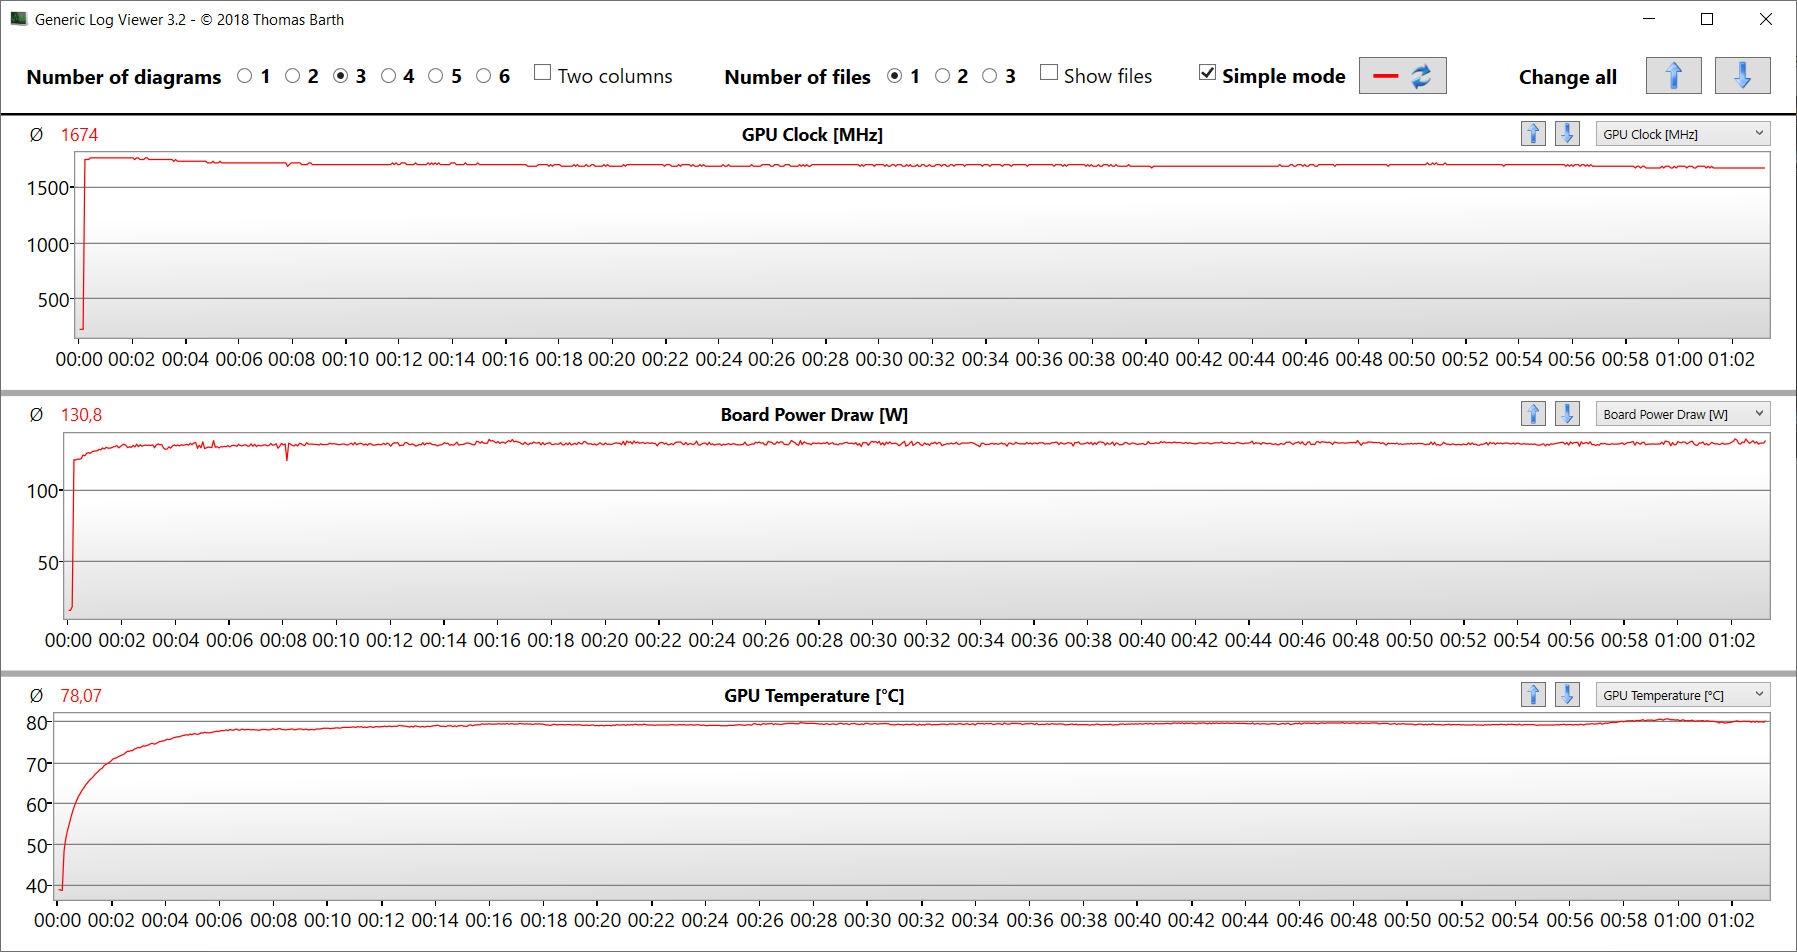
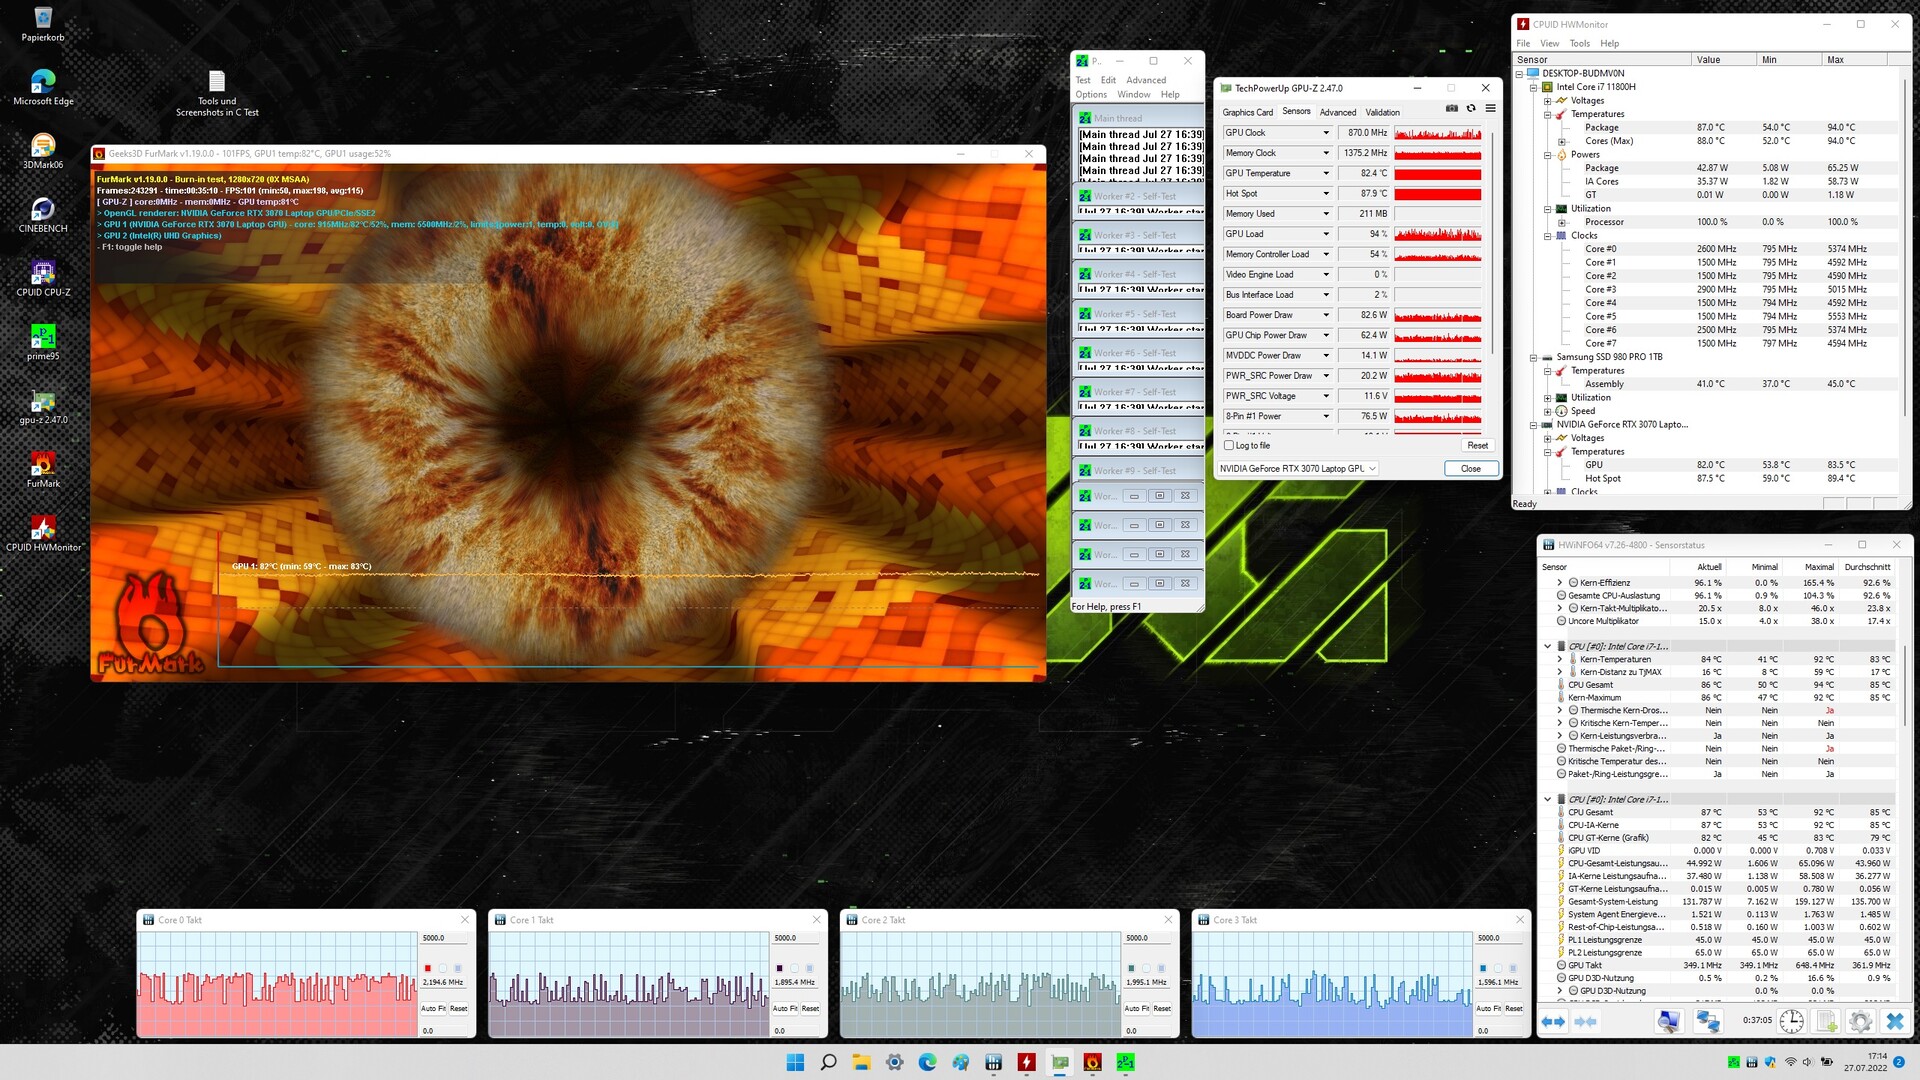
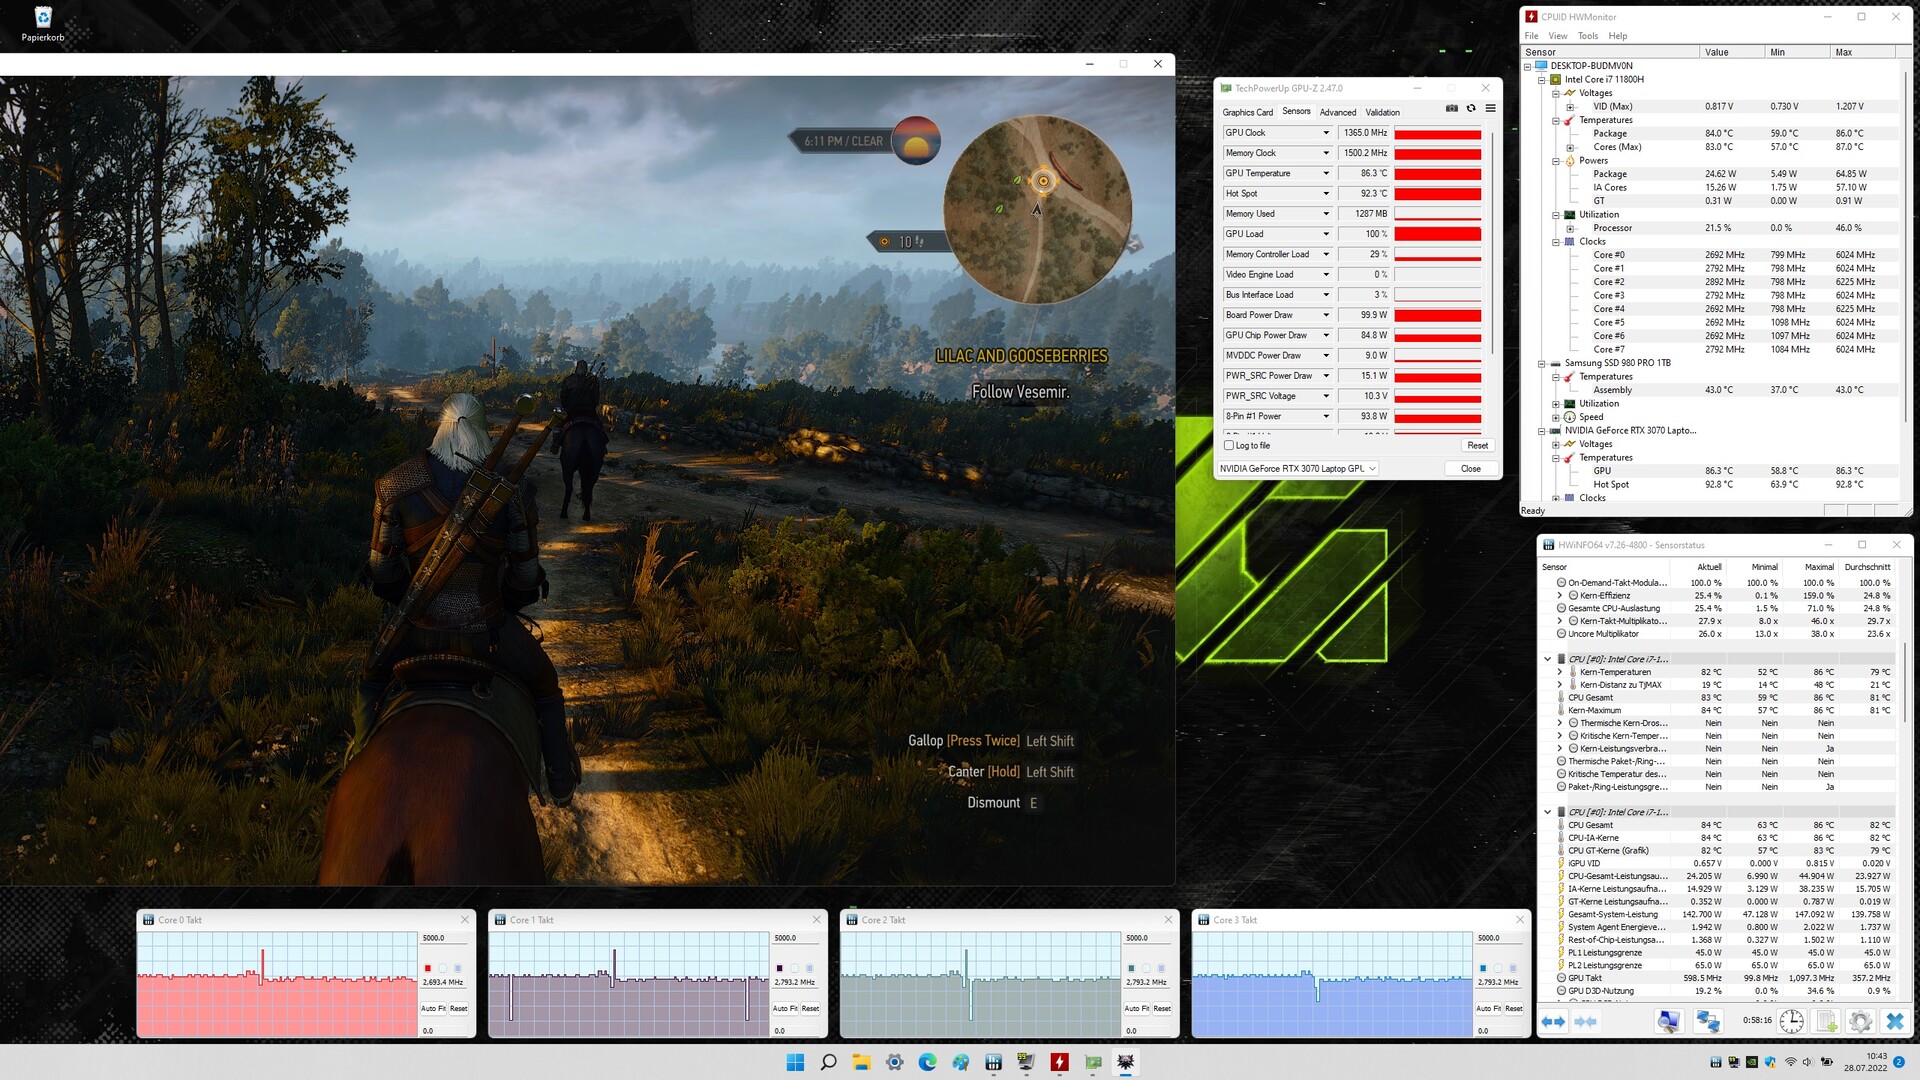
Stresstest
Processorn (1,8 till 4,2 GHz) och grafikprocessorn (1 000 till 1 700 MHz) påbörjar stresstestet (Prime95 och FurMark körs i minst en timme) med en hög nivå av fluktuerande driftshastigheter. Allt eftersom testet fortskrider sjunker klockfrekvenserna. Stresstestet representerar ett extremt scenario. Vi använder detta test för att kontrollera att systemet förblir stabilt under full belastning.
Högtalare
Stereohögtalarna ger ett relativt bra ljud, men det finns knappt någon bas. Vi rekommenderar att du använder hörlurar eller externa högtalare för en bättre ljudupplevelse
Schenker XMG Fusion 15 (Mid 22) ljudanalys
(+) | högtalare kan spela relativt högt (82 dB)
Bas 100 - 315 Hz
(-) | nästan ingen bas - i genomsnitt 17.6% lägre än medianen
(±) | linjäriteten för basen är genomsnittlig (12.1% delta till föregående frekvens)
Mellan 400 - 2000 Hz
(+) | balanserad mellan - endast 3% från medianen
(+) | mids är linjära (3.9% delta till föregående frekvens)
Högsta 2 - 16 kHz
(+) | balanserade toppar - endast 2.8% från medianen
(+) | toppar är linjära (5.5% delta till föregående frekvens)
Totalt 100 - 16 000 Hz
(+) | det totala ljudet är linjärt (13.3% skillnad mot median)
Jämfört med samma klass
» 19% av alla testade enheter i den här klassen var bättre, 5% liknande, 76% sämre
» Den bästa hade ett delta på 6%, genomsnittet var 18%, sämst var 132%
Jämfört med alla testade enheter
» 14% av alla testade enheter var bättre, 3% liknande, 83% sämre
» Den bästa hade ett delta på 4%, genomsnittet var 23%, sämst var 134%
Energihantering - NUC har god batteritid
Energiförbrukning
Överlag är strömförbrukningen på en normal nivå för den maskinvara som installerats här. Vårt Witcher 3 -test och vårt stresstest resulterar i en genomsnittlig strömförbrukning på 208 watt respektive upp till 160 watt. Medan vårt The Witcher 3 -test körs med konstant energiförbrukning, fluktuerar och sjunker efterfrågan under stresstestet. Det medföljande nätaggregatet (230 watt) har tillräcklig kapacitet
| Av/Standby | |
| Låg belastning | |
| Hög belastning |
|
Förklaring:
min: | |
| Schenker XMG Fusion 15 (Mid 22) i7-11800H, GeForce RTX 3070 Laptop GPU | Asus TUF Dash F15 FX517ZR i7-12650H, GeForce RTX 3070 Laptop GPU | Acer Nitro 5 AN515-58-72QR i7-12700H, GeForce RTX 3070 Ti Laptop GPU | HP Omen 16-b1090ng i7-12700H, GeForce RTX 3070 Ti Laptop GPU | MSI Delta 15 A5EFK R9 5900HX, Radeon RX 6700M | Razer Blade 15 Base Edition 2021, i7-10750H RTX 3060 i7-10750H, GeForce RTX 3060 Laptop GPU | Genomsnitt NVIDIA GeForce RTX 3070 Laptop GPU | Genomsnitt av klass Gaming | |
|---|---|---|---|---|---|---|---|---|
| Power Consumption | 10% | 2% | 17% | -2% | 2% | -16% | -11% | |
| Idle Minimum * (Watt) | 12 | 10 17% | 7 42% | 4 67% | 10 17% | 11.7 2% | 15.6 ? -30% | 13.1 ? -9% |
| Idle Average * (Watt) | 17 | 14 18% | 15 12% | 10 41% | 18 -6% | 16 6% | 20.1 ? -18% | 19 ? -12% |
| Idle Maximum * (Watt) | 24 | 20 17% | 24 -0% | 19 21% | 25 -4% | 29.3 -22% | 29.4 ? -22% | 24.6 ? -3% |
| Load Average * (Watt) | 106 | 122 -15% | 124 -17% | 114 -8% | 101 5% | 95.6 10% | 110.8 ? -5% | 111.3 ? -5% |
| Witcher 3 ultra * (Watt) | 159.9 | 138.6 13% | 195.1 -22% | 183.2 -15% | 187 -17% | 141.3 12% | ||
| Load Maximum * (Watt) | 208 | 189 9% | 220 -6% | 221 -6% | 217 -4% | 197 5% | 214 ? -3% | 260 ? -25% |
* ... mindre är bättre
Energy consumption during The Witcher 3 / Stress test
Energy consumption with an external monitor
Batteriets livslängd
Schenkers bärbara dator har den bästa batteritiden i jämförelsen - ingen överraskning: Den bärbara datorn har den högsta batterikapaciteten (93 Wh). 15,6-tummaren uppnår löptider på 7:26 timmar respektive 7:28 timmar i vårt Wi-Fi-test (åtkomst till webbplatser via ett skript) och videotest (kortfilmen Big Buck Bunny (H.264-kodning, Full HD) som körs i en loop). Den bärbara datorns energisparfunktioner är inaktiverade under båda testerna och skärmens ljusstyrka är inställd på cirka 150 cd/m². Dessutom är de trådlösa modulerna inaktiverade för videotestet
| Schenker XMG Fusion 15 (Mid 22) i7-11800H, GeForce RTX 3070 Laptop GPU, 93.48 Wh | Asus TUF Dash F15 FX517ZR i7-12650H, GeForce RTX 3070 Laptop GPU, 76 Wh | Acer Nitro 5 AN515-58-72QR i7-12700H, GeForce RTX 3070 Ti Laptop GPU, 57.5 Wh | HP Omen 16-b1090ng i7-12700H, GeForce RTX 3070 Ti Laptop GPU, 83 Wh | MSI Delta 15 A5EFK R9 5900HX, Radeon RX 6700M, 82 Wh | Razer Blade 15 Base Edition 2021, i7-10750H RTX 3060 i7-10750H, GeForce RTX 3060 Laptop GPU, 65 Wh | Genomsnitt av klass Gaming | |
|---|---|---|---|---|---|---|---|
| Batteridrifttid | -8% | -45% | -18% | -11% | -34% | -15% | |
| Reader / Idle (h) | 15.5 | 10.8 -30% | 5.7 -63% | 10.1 -35% | 11.1 -28% | 7.8 -50% | 7.84 ? -49% |
| H.264 (h) | 7.5 | 5.8 -23% | 4.7 -37% | 8.27 ? 10% | |||
| WiFi v1.3 (h) | 7.4 | 7 -5% | 3.9 -47% | 5.6 -24% | 7.9 7% | 4.8 -35% | 7.08 ? -4% |
| Load (h) | 1.8 | 2.3 28% | 1.2 -33% | 1.9 6% | 1.6 -11% | 1.5 -17% | 1.496 ? -17% |
För
Emot
Slutsats - Kompakt och kraftfull
Rendering och spelande är några av den här kompakta, lätta bärbara datorns kärnkompetenser. QHD-spel är möjligt vid höga till maximala inställningar. Fokus ligger inte på maximal prestanda utan på en kompromiss mellan prestanda och bärbarhet.
Med XMG Fusion 15 (Mitten av 2022) levererar Schenker en helt igenom välgjord kompakt spellaptop. Den kommer dock inte att få några stilpoäng.
Core i7-11800H och GeForce RTX 3070 kan köras med konsekvent höga klockfrekvenser. Beroende på inställningarna ligger GPU-prestandan på eller över RTX 3070-genomsnittet. Den bärbara datorn värms upp mycket kraftigt under belastning, och ljudutvecklingen når den vanliga klassnivån. Enheten kan fungera tyst vid daglig användning.
Ett 93 Wh-batteri garanterar praktiska driftstider på cirka 7:30 timmar - en ganska bra takt. Synd: Batteriet kan inte laddas via USB-C-porten (Thunderbolt 4). Detta hade varit en mycket användbar funktion, särskilt för en enhet som är utformad för mobilitet. Thunderbolt 4-porten öppnar dock upp för expansionsmöjligheter i form av en dockningslösning eller en extern GPU.
Det mekaniska tangentbordet (med RGB-bakgrundsbelysning för enstaka tangenter) lämnade ett gott intryck, och det kommer sannolikt att vara ett viktigt kriterium för många potentiella köpare. Den matta QHD-skärmen (15,6 tum, IPS, 165 Hz) lider inte av några större svagheter, men det är inte heller en toppskärm. Panelen får poäng med god färgåtergivning, mycket hygglig färgområdestäckning och snabba svarstider.
Ett alternativ till Fusion skulle vara Asus TUF Dash F15 FX517ZR, som också är lätt och kompakt. Den bärbara datorn erbjuder bättre färgrymdstäckning, Adaptive Sync, ett dGPU-läge och Power Delivery. GPU-prestandan ligger dock något efter Fusion 15.
Pris och tillgänglighet
Schenker XMG Fusion 15 (Mid 2022) kan anpassas i Schenkers webbutik. Den konfigurationsvariant som vi fick tillgång till (Core i7-11800H, GeForce RTX 3070 Laptop, 32 GB RAM, 1 TB SSD, QHD-skärm) finns tillgänglig för strax under 2 000 euro (~1 991 dollar). Ingångsmodeller finns tillgängliga från cirka 1 500 euro (~1 493 dollar).
Tips: I skrivande stund erbjuder nätbutiken en rabatt på 150 euro (~149 dollar) på alla konfigurationer av Fusion. Rabatten tillämpas i kundvagnen.
Schenker XMG Fusion 15 (Mid 22)
- 08/21/2022 v7 (old)
Sascha Mölck
Price comparison

