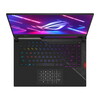
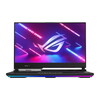
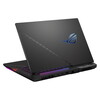
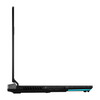
Asus ROG Strix Scar 15 G533zm recension: Modern RTX 3060-spelbärbar dator med många styrkor

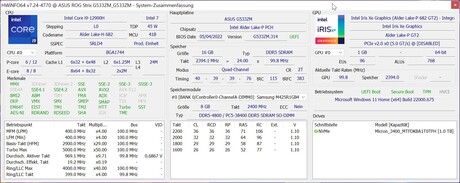
Vi har för närvarande två modeller av Asus ROG Strix Scar 15 tillgängliga för testning. Den här artikeln kommer att fokusera på RTX 3060 versionen, medan en recension av RTX 3070 Ti modellen kommer att publiceras parallellt. Förutom RTX 3060 är vår SKU utrustad med en kraftfull Alder Lake i9-12900H CPU, 16 GB RAM och en 240Hz QHD-skärm.
Förra året granskade vi den tidigare Scar 15 med en RTX 3080så det är mer meningsfullt att jämföra vår granskningsenhet med dess RTX 3070 Ti-syskon istället. Dessutom har vi valt att inkludera andra 15-tums bärbara speldatorer med samma GPU i vår jämförelse, till exempel Asus TUF Gaming F15och MSI Pulse GL66 och Alienware m15 R5. Även om jämförelsen också innehåller Lenovo Legion 5 med en Radeon RX6600Mär den här bärbara datorn inte i samma prisklass som Strix Scar, med tanke på att vår recensionskonfiguration kostar cirka 2 000 euro (2 170 USD) medan Legion kostar strax över 1 000 euro (1 085 USD).
För avsnitt om chassit, underhåll, inmatningsenheter och mer, se vår huvudrecension av Asus ROG Strix Scar med RTX 3070 Ti.
Jämförelse av möjliga alternativ
Gradering | Datum | Modell | Vikt | Höjd | Storlek | Upplösning | Pris |
|---|---|---|---|---|---|---|---|
| 89.2 % v7 (old) | 11/2024 | Asus ROG Strix Scar 15 G533zm i9-12900H, GeForce RTX 3060 Laptop GPU | 2.3 kg | 27.2 mm | 15.60" | 2560x1440 | |
| 86.3 % v7 (old) | 06/2022 | Asus ROG Strix Scar 15 G533ZW-LN106WS i9-12900H, GeForce RTX 3070 Ti Laptop GPU | 2.3 kg | 27.2 mm | 15.60" | 2560x1440 | |
| 87.2 % v7 (old) | 03/2022 | Asus TUF Gaming F15 FX507ZM i7-12700H, GeForce RTX 3060 Laptop GPU | 2.1 kg | 24.95 mm | 15.60" | 1920x1080 | |
| 80.7 % v7 (old) | 04/2022 | MSI Pulse GL66 12UEK i9-12900H, GeForce RTX 3060 Laptop GPU | 2.3 kg | 25 mm | 15.60" | 1920x1080 | |
| 84.7 % v7 (old) | 08/2025 | Alienware m15 R5 Ryzen Edition R7 5800H, GeForce RTX 3060 Laptop GPU | 2.5 kg | 22.85 mm | 15.60" | 1920x1080 | |
| 82.6 % v7 (old) | 05/2022 | Lenovo Legion 5 15ACH6A-82NW0010GE R5 5600H, Radeon RX 6600M | 2.5 kg | 25.75 mm | 15.60" | 1920x1080 |
Topp 10...
» Topp 10: Bästa bärbara allround/multimediadatorerna
» Topp 10: Bästa bärbara speldatorerna
» Topp 10: Bärbara budget/kontorsdatorer
» Topp 10: Bästa bärbara kontors/premiumdatorerna
» Topp 10: Bärbara arbetsstationer
» Topp 10: De bästa små/kompakta bärbara datorerna
» Topp 10: Bästa ultrabooks
» Topp 10: Bästa hybriddatorerna
» Topp 10: Bästa surfplattorna
» Topp 10: Marknadens bästa smartphones
Fodral - Tilltalande design för bärbar dator för spel
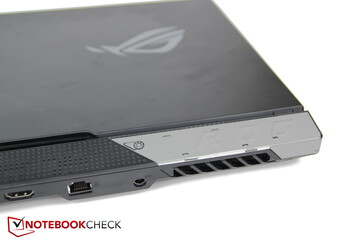
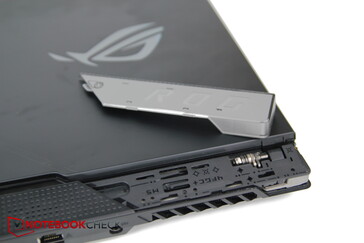
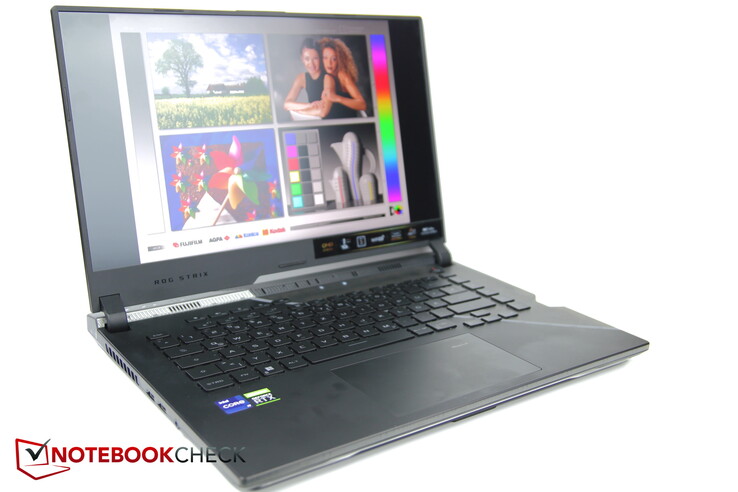
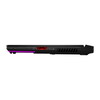
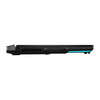
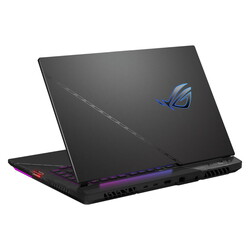
En ganska unik designfilosofi genomsyrar hela ROG Scar, vilket gör den till en attraktiv bärbar dator för gamers. Med diagonala linjer, en utbytbar platta på bakstycket, subtila färgaccenter och RGB-element har tillverkaren skapat en tydlig spelstil utan alltför skrikig belysning som blinkar och lyser.
Det finns till exempel en ljuslist som löper över hela framsidan, men den är något infälld, vilket gör att den känns mindre framträdande. Denna ljusremsa kan också synkroniseras med tangentbordet och ROG-logotypen på ovansidan.
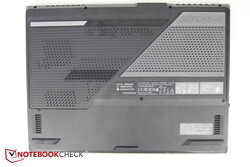
På undersidan finns breda, färgglada gummifötter som ger kontrast till det övervägande svarta chassit.
Trots sin nästan heltäckande plastkonstruktion känns Strix Scar 15 ganska robust. Skärmen ger inte ifrån sig något ljud när den vrids, medan basdelen bara knakar lite.
Skärmen hålls säkert på plats av två gångjärn och uppvisar knappt någon vobbling när den flyttas.
Jämförelse av storlek
Sammantaget är Scar 15 marginellt tjockare men en bråkdel mindre än några av sina konkurrenter. Den är också relativt lätt; till exempel är Alienware- och Legion -modellerna tyngre, och endast TUF Gaming F15 är något lättare.
Specifikationer - Thunderbolt 4, Keystone, men ingen webbkamera
Strix är utrustad med två USB-C-portar, varav den ena stöder Thunderbolt 4 och den andra klarar USB 3.2 Gen 2-hastigheter; båda erbjuder DisplayPort-funktionalitet. Detta visar att den bärbara datorn har ganska moderna funktioner. I/O:erna är väl fördelade över enhetens vänstra sida och baksida.
På höger sida finns endast en Keystone-plats. Keystone är ungefär som en liten lagringsenhet och switch i en. Till exempel kan den användas för att lagra inställningar och överföra dem till bärbara datorer som stöder den här funktionen (en lista över kompatibla modeller tillhandahålls av Asus). Den kan också fungera som en säkerhetsnyckel på Strix Scar: när den är konfigurerad slås den bärbara datorn bara på när Keystone är isatt. En annan tillämpning är att ge snabb åtkomst till program. Användaren kan instruera den bärbara datorn att automatiskt öppna ett visst program, t.ex. ett spel, när Keystone är inkopplad. Den bärbara datorn kan också programmeras att utföra en kombination av åtgärder, t.ex. att växla till högpresterande fläktläge och starta Cyberpunk samtidigt. Valet ligger i användarens händer.
En sak saknas dock på Asus-enheten - en webbkamera. Detta gör Scar Strix till en av de få (spel-)bärbara datorerna utan webbkamera.
Anslutningsmöjligheter
Inmatningsenheter - Pekplattans knapp kan fastna något
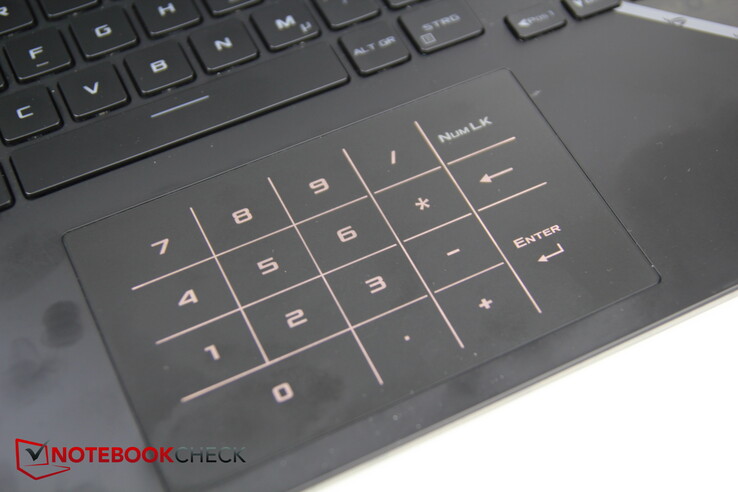
Pekplatta
Skärm - QHD med 240 Hz och Dolby Vision Atmos
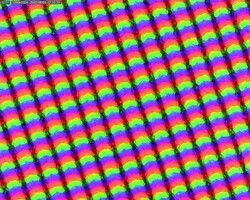
QHD IPS-skärmen (2.560 x 1.440 pixlar) från BOE har ganska snabba svarstider, en hög uppdateringsfrekvens på 240 Hz och utmärkt färgtäckning, som kan återge nästan hela sRGB- och AdobeRGB-omfånget.
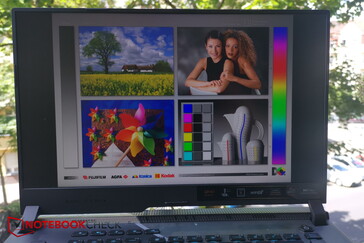
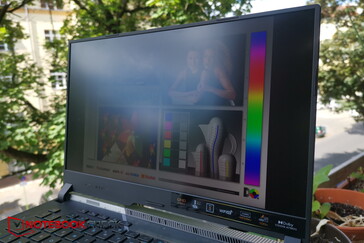
Panelen har en genomsnittlig toppljusstyrka på 300 nits och en ganska bra ljusfördelning på 89%. Dess svartnivå och kontrast är dock ganska genomsnittliga.
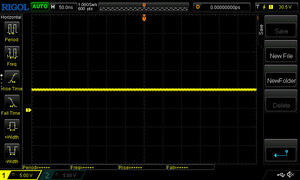
Den bärbara datorn använder inte PWM för att justera ljusstyrkan, och det finns bara en liten mängd skärmblödning.
| |||||||||||||||||||||||||
Distribution av ljusstyrkan: 89 %
Mitt på batteriet: 357 cd/m²
Kontrast: 1026:1 (Svärta: 0.34 cd/m²)
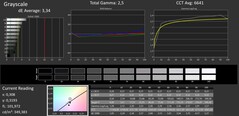
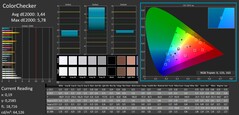
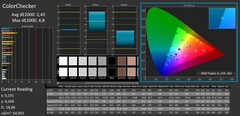
ΔE ColorChecker Calman: 3.44 | ∀{0.5-29.43 Ø4.77}
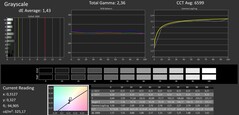
calibrated: 2.43
ΔE Greyscale Calman: 3.34 | ∀{0.09-98 Ø5}
84.1% AdobeRGB 1998 (Argyll 3D)
99.6% sRGB (Argyll 3D)
95% Display P3 (Argyll 3D)
Gamma: 2.5
CCT: 6641 K
| Asus ROG Strix Scar 15 G533zm BOE CQ NE156QHM-NZ2 (BOE0A55), IPS, 2560x1440, 15.6" | Asus ROG Strix Scar 15 G533ZW-LN106WS BOE CQ NE156QHM-NZ2, IPS-level, 2560x1440, 15.6" | Asus TUF Gaming F15 FX507ZM TL156VDXP0101, IPS, 1920x1080, 15.6" | MSI Pulse GL66 12UEK AU Optronics B156HAN08.4 (AUOAF90), IPS, 1920x1080, 15.6" | Alienware m15 R5 Ryzen Edition B156HAN, IPS, 1920x1080, 15.6" | Lenovo Legion 5 15ACH6A-82NW0010GE LGD06A5, IPS, 1920x1080, 15.6" | |
|---|---|---|---|---|---|---|
| Display | 0% | -17% | -51% | -13% | ||
| Display P3 Coverage (%) | 95 | 96.2 1% | 66.4 -30% | 39 -59% | 71.1 -25% | |
| sRGB Coverage (%) | 99.6 | 99.9 0% | 97 -3% | 58.4 -41% | 99.1 -1% | |
| AdobeRGB 1998 Coverage (%) | 84.1 | 84.5 0% | 68.5 -19% | 40.3 -52% | 72.3 -14% | |
| Response Times | 14% | -4% | -333% | 30% | -45% | |
| Response Time Grey 50% / Grey 80% * (ms) | 6.4 ? | 7.86 ? -23% 4.21 ? 34% | 5.6 ? 12% | 38.8 ? -506% | 4 ? 37% | 15 ? -134% |
| Response Time Black / White * (ms) | 10.8 ? | 7.5 ? 31% | 12.8 ? -19% | 28 ? -159% | 8.4 ? 22% | 6 ? 44% |
| PWM Frequency (Hz) | ||||||
| Screen | -14% | 23% | 15% | 14% | 2% | |
| Brightness middle (cd/m²) | 349 | 346 -1% | 353.7 1% | 248 -29% | 329 -6% | 371 6% |
| Brightness (cd/m²) | 333 | 329 -1% | 340 2% | 245 -26% | 321 -4% | 328 -2% |
| Brightness Distribution (%) | 89 | 91 2% | 89 0% | 86 -3% | 92 3% | 85 -4% |
| Black Level * (cd/m²) | 0.34 | 0.59 -74% | 0.34 -0% | 0.13 62% | 0.27 21% | 0.32 6% |
| Contrast (:1) | 1026 | 586 -43% | 1040 1% | 1908 86% | 1219 19% | 1159 13% |
| Colorchecker dE 2000 * | 3.44 | 3.06 11% | 1.74 49% | 3.14 9% | 2.78 19% | 3.25 6% |
| Colorchecker dE 2000 max. * | 5.78 | 5.81 -1% | 3.63 37% | 5.82 -1% | 4.88 16% | 6.33 -10% |
| Colorchecker dE 2000 calibrated * | 2.43 | 2.57 -6% | 0.5 79% | 3.14 -29% | 1.63 33% | 1.11 54% |
| Greyscale dE 2000 * | 3.34 | 2.1 37% | 1.2 64% | 2.5 25% | 4.94 -48% | |
| Gamma | 2.5 88% | 2.12 104% | 2.3 96% | 2.49 88% | 2.106 104% | 2.45 90% |
| CCT | 6641 98% | 7021 93% | 6257 104% | 6468 100% | 6201 105% | 6064 107% |
| Color Space (Percent of AdobeRGB 1998) (%) | 76 | |||||
| Color Space (Percent of sRGB) (%) | 99 | |||||
| Totalt genomsnitt (program/inställningar) | 0% /
-5% | 1% /
11% | -123% /
-49% | 22% /
17% | -19% /
-8% |
* ... mindre är bättre
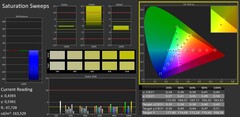
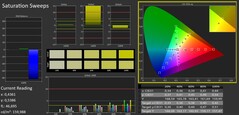
Med hjälp av Portrait Displays Calman färgkalibreringsverktyg uppmätte vi normala till måttliga färgskillnader direkt från förpackningen, med en mer orangeaktig nyans på skärmen. Genom vår kalibrering lyckades vi minska färgskillnaderna avsevärt.
Visa svarstider
| ↔ Svarstid svart till vitt | ||
|---|---|---|
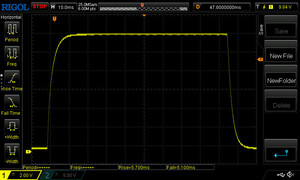
| 10.8 ms ... stiga ↗ och falla ↘ kombinerat | ↗ 5.7 ms stiga | |
| ↘ 5.1 ms hösten | ||
| Skärmen visar bra svarsfrekvens i våra tester, men kan vara för långsam för konkurrenskraftiga spelare. I jämförelse sträcker sig alla testade enheter från 0.1 (minst) till 240 (maximalt) ms. » 28 % av alla enheter är bättre. Det betyder att den uppmätta svarstiden är bättre än genomsnittet av alla testade enheter (20.2 ms). | ||
| ↔ Svarstid 50 % grått till 80 % grått | ||
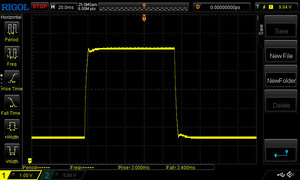
| 6.4 ms ... stiga ↗ och falla ↘ kombinerat | ↗ 3 ms stiga | |
| ↘ 3.4 ms hösten | ||
| Skärmen visar väldigt snabba svarsfrekvenser i våra tester och borde vara mycket väl lämpad för fartfyllt spel. I jämförelse sträcker sig alla testade enheter från 0.165 (minst) till 636 (maximalt) ms. » 18 % av alla enheter är bättre. Det betyder att den uppmätta svarstiden är bättre än genomsnittet av alla testade enheter (31.5 ms). | ||
Skärmflimmer / PWM (Puls-Width Modulation)
| Skärmflimmer / PWM upptäcktes inte | |||
Som jämförelse: 53 % av alla testade enheter använder inte PWM för att dämpa skärmen. Om PWM upptäcktes mättes ett medelvärde av 8073 (minst: 5 - maximum: 343500) Hz. | |||
Prestanda - Bra spelprestanda med en 140W RTX 3060
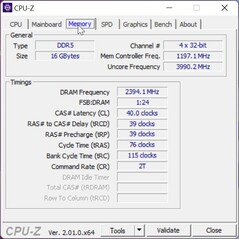
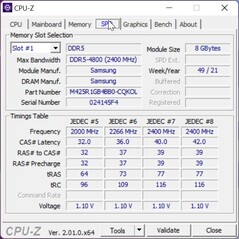
Den nya Core i9-12900H är bland de bästa i sin hårdvaruklass. Även om RTX 3060 bör kunna hantera alla spel vid FHD, kan det kämpa med mycket krävande spel vid skärmens ursprungliga QHD-upplösning. Asus har också inkluderat höghastighets DDR5 RAM. Sammantaget är Strix Scar en bärbar speldator i övre mellanklassen som vissa foto- och videoredigerare också kan tycka är tilltalande.
Testförhållanden
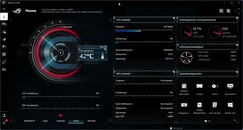
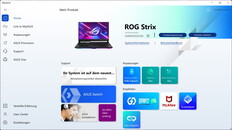
Enligt vår mening har Asus gått överbord med sin programvara. Asus spelbärbara datorer levereras med Armoury Crate-programvaran ovanpå MyASUS-programmet, som också är förinstallerat på deras vanliga bärbara datorer. Armoury Crate låter dig justera fläkt- och prestandaprofiler, och vi använde Turbo-läget för att uppnå bästa möjliga benchmarkresultat i våra tester. Å andra sidan innehåller MyASUS inställningar för batteriets laddningsbeteende, Wi-Fi-alternativ och sätt att kontakta kundsupport. Det kan vara fördelaktigt för Asus att överväga att kombinera de två programmen för att undvika onödig mjukvarubloat för sina kunder.
Processor
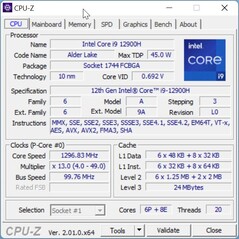
Asus har valt att utrusta de flesta modellerna med den avancerade Intel Core i9-12900Hsom har 6 Performance (P)- och 8 Efficiency (E)-kärnor, som kan hantera 20 trådar samtidigt. Varje P-kärna kan köras i upp till 5 GHz. Både Strix G533zm och G533zw finns tillgängliga med den något mindre kraftfulla i7-12700H.
I vårt Cinebench R15-looptest levererade processorn som väntat bra prestanda och överträffade både i7-12700H i Asus TUF Gaming F15 och tidigare generationers Ryzen-chips. Den hamnade bara på efterkälken på ett reproducerbart sätt i Cinebench R20.
Byte till batteriström fick Cinebench R15-poängen att sjunka till 1 752.
Cinebench R15 Multi sustained load
Cinebench R23: Multi Core | Single Core
Cinebench R20: CPU (Multi Core) | CPU (Single Core)
Cinebench R15: CPU Multi 64Bit | CPU Single 64Bit
Blender: v2.79 BMW27 CPU
7-Zip 18.03: 7z b 4 | 7z b 4 -mmt1
Geekbench 5.5: Multi-Core | Single-Core
HWBOT x265 Benchmark v2.2: 4k Preset
LibreOffice : 20 Documents To PDF
R Benchmark 2.5: Overall mean
| CPU Performance rating | |
| Genomsnitt av klass Gaming | |
| Asus ROG Strix Scar 15 G533ZW-LN106WS | |
| Asus ROG Strix Scar 15 G533zm | |
| MSI Pulse GL66 12UEK | |
| Asus TUF Gaming F15 FX507ZM | |
| Genomsnitt Intel Core i9-12900H | |
| Alienware m15 R5 Ryzen Edition | |
| Lenovo Legion 5 15ACH6A-82NW0010GE | |
| Cinebench R23 / Multi Core | |
| Genomsnitt av klass Gaming (5668 - 40970, n=145, senaste 2 åren) | |
| Asus ROG Strix Scar 15 G533ZW-LN106WS | |
| Asus TUF Gaming F15 FX507ZM | |
| MSI Pulse GL66 12UEK | |
| Asus ROG Strix Scar 15 G533zm | |
| Genomsnitt Intel Core i9-12900H (7359 - 19648, n=28) | |
| Alienware m15 R5 Ryzen Edition | |
| Lenovo Legion 5 15ACH6A-82NW0010GE | |
| Cinebench R23 / Single Core | |
| Genomsnitt av klass Gaming (1136 - 2267, n=145, senaste 2 åren) | |
| Asus ROG Strix Scar 15 G533ZW-LN106WS | |
| MSI Pulse GL66 12UEK | |
| Genomsnitt Intel Core i9-12900H (1634 - 1930, n=28) | |
| Asus ROG Strix Scar 15 G533zm | |
| Asus TUF Gaming F15 FX507ZM | |
| Alienware m15 R5 Ryzen Edition | |
| Lenovo Legion 5 15ACH6A-82NW0010GE | |
| Cinebench R20 / CPU (Multi Core) | |
| Genomsnitt av klass Gaming (2179 - 16108, n=144, senaste 2 åren) | |
| Asus ROG Strix Scar 15 G533ZW-LN106WS | |
| Asus TUF Gaming F15 FX507ZM | |
| MSI Pulse GL66 12UEK | |
| Genomsnitt Intel Core i9-12900H (2681 - 7471, n=28) | |
| Asus ROG Strix Scar 15 G533zm | |
| Alienware m15 R5 Ryzen Edition | |
| Lenovo Legion 5 15ACH6A-82NW0010GE | |
| Cinebench R20 / CPU (Single Core) | |
| Genomsnitt av klass Gaming (439 - 870, n=144, senaste 2 åren) | |
| MSI Pulse GL66 12UEK | |
| Asus ROG Strix Scar 15 G533zm | |
| Asus ROG Strix Scar 15 G533ZW-LN106WS | |
| Genomsnitt Intel Core i9-12900H (624 - 738, n=28) | |
| Asus TUF Gaming F15 FX507ZM | |
| Alienware m15 R5 Ryzen Edition | |
| Lenovo Legion 5 15ACH6A-82NW0010GE | |
| Cinebench R15 / CPU Multi 64Bit | |
| Genomsnitt av klass Gaming (1537 - 6271, n=144, senaste 2 åren) | |
| Asus ROG Strix Scar 15 G533zm | |
| Asus ROG Strix Scar 15 G533ZW-LN106WS | |
| Asus TUF Gaming F15 FX507ZM | |
| MSI Pulse GL66 12UEK | |
| Genomsnitt Intel Core i9-12900H (1395 - 3077, n=28) | |
| Alienware m15 R5 Ryzen Edition | |
| Lenovo Legion 5 15ACH6A-82NW0010GE | |
| Cinebench R15 / CPU Single 64Bit | |
| Genomsnitt av klass Gaming (188.8 - 343, n=143, senaste 2 åren) | |
| MSI Pulse GL66 12UEK | |
| Asus ROG Strix Scar 15 G533zm | |
| Asus ROG Strix Scar 15 G533ZW-LN106WS | |
| Genomsnitt Intel Core i9-12900H (235 - 277, n=29) | |
| Asus TUF Gaming F15 FX507ZM | |
| Alienware m15 R5 Ryzen Edition | |
| Lenovo Legion 5 15ACH6A-82NW0010GE | |
| Blender / v2.79 BMW27 CPU | |
| Lenovo Legion 5 15ACH6A-82NW0010GE | |
| Alienware m15 R5 Ryzen Edition | |
| Genomsnitt Intel Core i9-12900H (160 - 451, n=28) | |
| MSI Pulse GL66 12UEK | |
| Asus TUF Gaming F15 FX507ZM | |
| Asus ROG Strix Scar 15 G533ZW-LN106WS | |
| Asus ROG Strix Scar 15 G533zm | |
| Genomsnitt av klass Gaming (80 - 517, n=140, senaste 2 åren) | |
| 7-Zip 18.03 / 7z b 4 | |
| Genomsnitt av klass Gaming (23795 - 148086, n=142, senaste 2 åren) | |
| Asus ROG Strix Scar 15 G533zm | |
| Asus ROG Strix Scar 15 G533ZW-LN106WS | |
| Asus TUF Gaming F15 FX507ZM | |
| MSI Pulse GL66 12UEK | |
| Genomsnitt Intel Core i9-12900H (34684 - 76677, n=28) | |
| Alienware m15 R5 Ryzen Edition | |
| Lenovo Legion 5 15ACH6A-82NW0010GE | |
| 7-Zip 18.03 / 7z b 4 -mmt1 | |
| Genomsnitt av klass Gaming (4199 - 7508, n=142, senaste 2 åren) | |
| MSI Pulse GL66 12UEK | |
| Asus ROG Strix Scar 15 G533zm | |
| Asus ROG Strix Scar 15 G533ZW-LN106WS | |
| Genomsnitt Intel Core i9-12900H (5302 - 6289, n=28) | |
| Alienware m15 R5 Ryzen Edition | |
| Asus TUF Gaming F15 FX507ZM | |
| Lenovo Legion 5 15ACH6A-82NW0010GE | |
| Geekbench 5.5 / Multi-Core | |
| Genomsnitt av klass Gaming (4557 - 27010, n=141, senaste 2 åren) | |
| Asus ROG Strix Scar 15 G533ZW-LN106WS | |
| Asus ROG Strix Scar 15 G533zm | |
| Asus TUF Gaming F15 FX507ZM | |
| Genomsnitt Intel Core i9-12900H (8519 - 14376, n=31) | |
| MSI Pulse GL66 12UEK | |
| Alienware m15 R5 Ryzen Edition | |
| Lenovo Legion 5 15ACH6A-82NW0010GE | |
| Geekbench 5.5 / Single-Core | |
| Genomsnitt av klass Gaming (986 - 2474, n=141, senaste 2 åren) | |
| Asus ROG Strix Scar 15 G533ZW-LN106WS | |
| MSI Pulse GL66 12UEK | |
| Asus ROG Strix Scar 15 G533zm | |
| Genomsnitt Intel Core i9-12900H (1631 - 1897, n=31) | |
| Asus TUF Gaming F15 FX507ZM | |
| Alienware m15 R5 Ryzen Edition | |
| Lenovo Legion 5 15ACH6A-82NW0010GE | |
| HWBOT x265 Benchmark v2.2 / 4k Preset | |
| Genomsnitt av klass Gaming (7.7 - 44.3, n=142, senaste 2 åren) | |
| Asus ROG Strix Scar 15 G533zm | |
| Asus ROG Strix Scar 15 G533ZW-LN106WS | |
| Asus TUF Gaming F15 FX507ZM | |
| MSI Pulse GL66 12UEK | |
| Genomsnitt Intel Core i9-12900H (8.05 - 22.5, n=28) | |
| Alienware m15 R5 Ryzen Edition | |
| Lenovo Legion 5 15ACH6A-82NW0010GE | |
| LibreOffice / 20 Documents To PDF | |
| Alienware m15 R5 Ryzen Edition | |
| Lenovo Legion 5 15ACH6A-82NW0010GE | |
| Asus TUF Gaming F15 FX507ZM | |
| Genomsnitt av klass Gaming (19 - 88.8, n=141, senaste 2 åren) | |
| Genomsnitt Intel Core i9-12900H (36.8 - 59.8, n=28) | |
| MSI Pulse GL66 12UEK | |
| Asus ROG Strix Scar 15 G533zm | |
| Asus ROG Strix Scar 15 G533ZW-LN106WS | |
| R Benchmark 2.5 / Overall mean | |
| Lenovo Legion 5 15ACH6A-82NW0010GE | |
| Alienware m15 R5 Ryzen Edition | |
| Asus TUF Gaming F15 FX507ZM | |
| Genomsnitt Intel Core i9-12900H (0.4218 - 0.506, n=28) | |
| Asus ROG Strix Scar 15 G533zm | |
| Asus ROG Strix Scar 15 G533ZW-LN106WS | |
| Genomsnitt av klass Gaming (0.3439 - 0.759, n=142, senaste 2 åren) | |
| MSI Pulse GL66 12UEK | |
* ... mindre är bättre
AIDA64: FP32 Ray-Trace | FPU Julia | CPU SHA3 | CPU Queen | FPU SinJulia | FPU Mandel | CPU AES | CPU ZLib | FP64 Ray-Trace | CPU PhotoWorxx
| Performance rating | |
| Genomsnitt av klass Gaming | |
| Alienware m15 R5 Ryzen Edition | |
| Asus ROG Strix Scar 15 G533zm | |
| Asus ROG Strix Scar 15 G533ZW-LN106WS | |
| Genomsnitt Intel Core i9-12900H | |
| MSI Pulse GL66 12UEK | |
| Asus TUF Gaming F15 FX507ZM | |
| Lenovo Legion 5 15ACH6A-82NW0010GE | |
| AIDA64 / FP32 Ray-Trace | |
| Genomsnitt av klass Gaming (7192 - 85542, n=141, senaste 2 åren) | |
| Alienware m15 R5 Ryzen Edition | |
| Lenovo Legion 5 15ACH6A-82NW0010GE | |
| Genomsnitt Intel Core i9-12900H (4074 - 18289, n=28) | |
| Asus ROG Strix Scar 15 G533zm | |
| Asus ROG Strix Scar 15 G533ZW-LN106WS | |
| Asus TUF Gaming F15 FX507ZM | |
| MSI Pulse GL66 12UEK | |
| AIDA64 / FPU Julia | |
| Genomsnitt av klass Gaming (35040 - 238426, n=141, senaste 2 åren) | |
| Alienware m15 R5 Ryzen Edition | |
| Lenovo Legion 5 15ACH6A-82NW0010GE | |
| Genomsnitt Intel Core i9-12900H (22307 - 93236, n=28) | |
| Asus ROG Strix Scar 15 G533zm | |
| Asus ROG Strix Scar 15 G533ZW-LN106WS | |
| Asus TUF Gaming F15 FX507ZM | |
| MSI Pulse GL66 12UEK | |
| AIDA64 / CPU SHA3 | |
| Genomsnitt av klass Gaming (1728 - 9817, n=141, senaste 2 åren) | |
| Asus ROG Strix Scar 15 G533zm | |
| Asus ROG Strix Scar 15 G533ZW-LN106WS | |
| Asus TUF Gaming F15 FX507ZM | |
| MSI Pulse GL66 12UEK | |
| Alienware m15 R5 Ryzen Edition | |
| Genomsnitt Intel Core i9-12900H (1378 - 4215, n=28) | |
| Lenovo Legion 5 15ACH6A-82NW0010GE | |
| AIDA64 / CPU Queen | |
| Genomsnitt av klass Gaming (49785 - 173351, n=141, senaste 2 åren) | |
| Asus ROG Strix Scar 15 G533zm | |
| MSI Pulse GL66 12UEK | |
| Asus ROG Strix Scar 15 G533ZW-LN106WS | |
| Genomsnitt Intel Core i9-12900H (78172 - 111241, n=28) | |
| Asus TUF Gaming F15 FX507ZM | |
| Alienware m15 R5 Ryzen Edition | |
| Lenovo Legion 5 15ACH6A-82NW0010GE | |
| AIDA64 / FPU SinJulia | |
| Genomsnitt av klass Gaming (4424 - 33636, n=141, senaste 2 åren) | |
| Alienware m15 R5 Ryzen Edition | |
| Asus ROG Strix Scar 15 G533zm | |
| Asus ROG Strix Scar 15 G533ZW-LN106WS | |
| MSI Pulse GL66 12UEK | |
| Asus TUF Gaming F15 FX507ZM | |
| Genomsnitt Intel Core i9-12900H (5709 - 10410, n=28) | |
| Lenovo Legion 5 15ACH6A-82NW0010GE | |
| AIDA64 / FPU Mandel | |
| Genomsnitt av klass Gaming (17585 - 128721, n=141, senaste 2 åren) | |
| Alienware m15 R5 Ryzen Edition | |
| Lenovo Legion 5 15ACH6A-82NW0010GE | |
| Genomsnitt Intel Core i9-12900H (11257 - 45581, n=28) | |
| Asus ROG Strix Scar 15 G533zm | |
| Asus TUF Gaming F15 FX507ZM | |
| Asus ROG Strix Scar 15 G533ZW-LN106WS | |
| MSI Pulse GL66 12UEK | |
| AIDA64 / CPU AES | |
| Alienware m15 R5 Ryzen Edition | |
| Genomsnitt av klass Gaming (19065 - 247074, n=141, senaste 2 åren) | |
| Asus ROG Strix Scar 15 G533zm | |
| Asus ROG Strix Scar 15 G533ZW-LN106WS | |
| MSI Pulse GL66 12UEK | |
| Lenovo Legion 5 15ACH6A-82NW0010GE | |
| Genomsnitt Intel Core i9-12900H (31935 - 151546, n=28) | |
| Asus TUF Gaming F15 FX507ZM | |
| AIDA64 / CPU ZLib | |
| Genomsnitt av klass Gaming (373 - 2531, n=141, senaste 2 åren) | |
| Asus ROG Strix Scar 15 G533ZW-LN106WS | |
| Asus ROG Strix Scar 15 G533zm | |
| Asus TUF Gaming F15 FX507ZM | |
| MSI Pulse GL66 12UEK | |
| Genomsnitt Intel Core i9-12900H (449 - 1193, n=28) | |
| Alienware m15 R5 Ryzen Edition | |
| Lenovo Legion 5 15ACH6A-82NW0010GE | |
| AIDA64 / FP64 Ray-Trace | |
| Genomsnitt av klass Gaming (3856 - 45446, n=141, senaste 2 åren) | |
| Alienware m15 R5 Ryzen Edition | |
| Lenovo Legion 5 15ACH6A-82NW0010GE | |
| Genomsnitt Intel Core i9-12900H (2235 - 10511, n=28) | |
| Asus ROG Strix Scar 15 G533zm | |
| Asus ROG Strix Scar 15 G533ZW-LN106WS | |
| Asus TUF Gaming F15 FX507ZM | |
| MSI Pulse GL66 12UEK | |
| AIDA64 / CPU PhotoWorxx | |
| Genomsnitt av klass Gaming (10805 - 62916, n=141, senaste 2 åren) | |
| Asus ROG Strix Scar 15 G533ZW-LN106WS | |
| Genomsnitt Intel Core i9-12900H (20960 - 48269, n=29) | |
| Asus ROG Strix Scar 15 G533zm | |
| Asus TUF Gaming F15 FX507ZM | |
| MSI Pulse GL66 12UEK | |
| Lenovo Legion 5 15ACH6A-82NW0010GE | |
| Alienware m15 R5 Ryzen Edition | |
Systemets prestanda
CrossMark: Overall | Productivity | Creativity | Responsiveness
| PCMark 10 / Score | |
| Genomsnitt av klass Gaming (5776 - 10060, n=119, senaste 2 åren) | |
| Asus ROG Strix Scar 15 G533ZW-LN106WS | |
| Asus ROG Strix Scar 15 G533zm | |
| Genomsnitt Intel Core i9-12900H, NVIDIA GeForce RTX 3060 Laptop GPU (7135 - 7861, n=4) | |
| Asus TUF Gaming F15 FX507ZM | |
| MSI Pulse GL66 12UEK | |
| Lenovo Legion 5 15ACH6A-82NW0010GE | |
| Alienware m15 R5 Ryzen Edition | |
| PCMark 10 / Essentials | |
| Asus ROG Strix Scar 15 G533zm | |
| Genomsnitt Intel Core i9-12900H, NVIDIA GeForce RTX 3060 Laptop GPU (10380 - 11198, n=4) | |
| Genomsnitt av klass Gaming (8810 - 12600, n=123, senaste 2 åren) | |
| Asus ROG Strix Scar 15 G533ZW-LN106WS | |
| Lenovo Legion 5 15ACH6A-82NW0010GE | |
| Asus TUF Gaming F15 FX507ZM | |
| MSI Pulse GL66 12UEK | |
| Alienware m15 R5 Ryzen Edition | |
| PCMark 10 / Productivity | |
| Asus ROG Strix Scar 15 G533zm | |
| Asus ROG Strix Scar 15 G533ZW-LN106WS | |
| Genomsnitt Intel Core i9-12900H, NVIDIA GeForce RTX 3060 Laptop GPU (9751 - 10486, n=4) | |
| Genomsnitt av klass Gaming (6662 - 16716, n=121, senaste 2 åren) | |
| MSI Pulse GL66 12UEK | |
| Lenovo Legion 5 15ACH6A-82NW0010GE | |
| Asus TUF Gaming F15 FX507ZM | |
| Alienware m15 R5 Ryzen Edition | |
| PCMark 10 / Digital Content Creation | |
| Genomsnitt av klass Gaming (7440 - 19351, n=121, senaste 2 åren) | |
| Asus ROG Strix Scar 15 G533ZW-LN106WS | |
| Asus TUF Gaming F15 FX507ZM | |
| Asus ROG Strix Scar 15 G533zm | |
| Genomsnitt Intel Core i9-12900H, NVIDIA GeForce RTX 3060 Laptop GPU (9741 - 11226, n=4) | |
| Lenovo Legion 5 15ACH6A-82NW0010GE | |
| MSI Pulse GL66 12UEK | |
| Alienware m15 R5 Ryzen Edition | |
| CrossMark / Overall | |
| MSI Pulse GL66 12UEK | |
| Asus ROG Strix Scar 15 G533ZW-LN106WS | |
| Asus ROG Strix Scar 15 G533zm | |
| Genomsnitt av klass Gaming (1247 - 2344, n=117, senaste 2 åren) | |
| Genomsnitt Intel Core i9-12900H, NVIDIA GeForce RTX 3060 Laptop GPU (1789 - 2096, n=4) | |
| CrossMark / Productivity | |
| MSI Pulse GL66 12UEK | |
| Asus ROG Strix Scar 15 G533ZW-LN106WS | |
| Asus ROG Strix Scar 15 G533zm | |
| Genomsnitt Intel Core i9-12900H, NVIDIA GeForce RTX 3060 Laptop GPU (1677 - 2062, n=4) | |
| Genomsnitt av klass Gaming (1299 - 2211, n=117, senaste 2 åren) | |
| CrossMark / Creativity | |
| Genomsnitt av klass Gaming (1275 - 2729, n=117, senaste 2 åren) | |
| Asus ROG Strix Scar 15 G533zm | |
| Asus ROG Strix Scar 15 G533ZW-LN106WS | |
| Genomsnitt Intel Core i9-12900H, NVIDIA GeForce RTX 3060 Laptop GPU (2032 - 2125, n=4) | |
| MSI Pulse GL66 12UEK | |
| CrossMark / Responsiveness | |
| MSI Pulse GL66 12UEK | |
| Asus ROG Strix Scar 15 G533ZW-LN106WS | |
| Asus ROG Strix Scar 15 G533zm | |
| Genomsnitt Intel Core i9-12900H, NVIDIA GeForce RTX 3060 Laptop GPU (1486 - 2230, n=4) | |
| Genomsnitt av klass Gaming (1030 - 2330, n=117, senaste 2 åren) | |
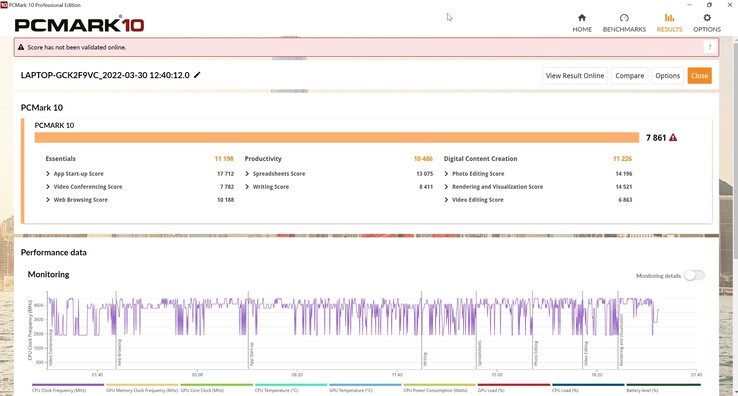
| PCMark 10 Score | 7861 poäng | |
Hjälp | ||
| AIDA64 / Memory Copy | |
| Genomsnitt av klass Gaming (21750 - 108104, n=141, senaste 2 åren) | |
| Asus ROG Strix Scar 15 G533ZW-LN106WS | |
| Genomsnitt Intel Core i9-12900H (34438 - 74264, n=28) | |
| Asus TUF Gaming F15 FX507ZM | |
| Asus ROG Strix Scar 15 G533zm | |
| MSI Pulse GL66 12UEK | |
| Alienware m15 R5 Ryzen Edition | |
| Lenovo Legion 5 15ACH6A-82NW0010GE | |
| AIDA64 / Memory Read | |
| Genomsnitt av klass Gaming (22956 - 104349, n=141, senaste 2 åren) | |
| Asus ROG Strix Scar 15 G533ZW-LN106WS | |
| Genomsnitt Intel Core i9-12900H (36365 - 74642, n=28) | |
| Asus TUF Gaming F15 FX507ZM | |
| Asus ROG Strix Scar 15 G533zm | |
| MSI Pulse GL66 12UEK | |
| Alienware m15 R5 Ryzen Edition | |
| Lenovo Legion 5 15ACH6A-82NW0010GE | |
| AIDA64 / Memory Write | |
| Genomsnitt av klass Gaming (22297 - 133486, n=141, senaste 2 åren) | |
| Asus ROG Strix Scar 15 G533ZW-LN106WS | |
| Genomsnitt Intel Core i9-12900H (32276 - 67858, n=28) | |
| Asus ROG Strix Scar 15 G533zm | |
| Asus TUF Gaming F15 FX507ZM | |
| MSI Pulse GL66 12UEK | |
| Alienware m15 R5 Ryzen Edition | |
| Lenovo Legion 5 15ACH6A-82NW0010GE | |
| AIDA64 / Memory Latency | |
| Genomsnitt av klass Gaming (59.5 - 259, n=141, senaste 2 åren) | |
| Asus ROG Strix Scar 15 G533zm | |
| Asus ROG Strix Scar 15 G533ZW-LN106WS | |
| MSI Pulse GL66 12UEK | |
| Lenovo Legion 5 15ACH6A-82NW0010GE | |
| Genomsnitt Intel Core i9-12900H (74.7 - 118.1, n=27) | |
| Alienware m15 R5 Ryzen Edition | |
| Asus TUF Gaming F15 FX507ZM | |
* ... mindre är bättre
DPC-latens
LatencyMon rapporterade omedelbart problem när en webbläsare startades. Problemen förvärrades om man öppnade flera flikar. Latensvärdena ökade ytterligare under uppspelning av vår YouTube-testvideo i 4K och 60 bilder per sekund. Videon kördes dock utan några tappade bildrutor.
| DPC Latencies / LatencyMon - interrupt to process latency (max), Web, Youtube, Prime95 | |
| Asus ROG Strix Scar 15 G533zm | |
| MSI Pulse GL66 12UEK | |
| Asus ROG Strix Scar 15 G533ZW-LN106WS | |
| Lenovo Legion 5 15ACH6A-82NW0010GE | |
| Asus TUF Gaming F15 FX507ZM | |
| Alienware m15 R5 Ryzen Edition | |
* ... mindre är bättre
Masslagring
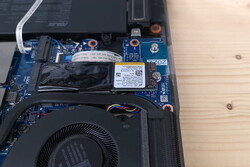
Asus har monterat en ganska ny 1TB PCIe 4.0 NVMe SSD tillverkad av Micron. Trots att enheten gav utmärkta överföringshastigheter utnyttjade den inte fullt ut de hastigheter som erbjuds av den relativt nya standarden. Med det sagt levererade den mestadels den bästa prestandan jämfört med lagringsenheterna i konkurrerande bärbara datorer. Dess prestanda är också utmärkt under ihållande belastning.
* ... mindre är bättre
Sustained load Read: DiskSpd Read Loop, Queue Depth 8
Grafikkort
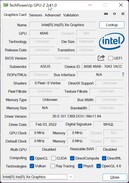
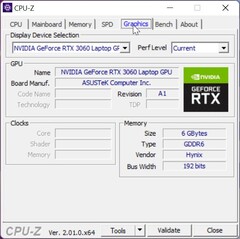
Nividia Nividia GeForce RTX 3060 befinner sig mellan mellanklass och high-end. Dess TGP kan variera från 60 till 115 watt, och strömkonfigurationen har en bestående inverkan på kortets 3D-prestanda. RTX 3060 i Strix Scar har tillgång till hela 115 watt och kan gå upp till 140 watt med en 25-watts Dynamic Boost.
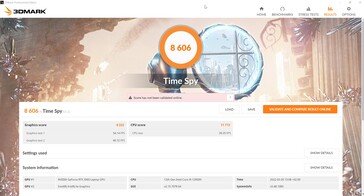
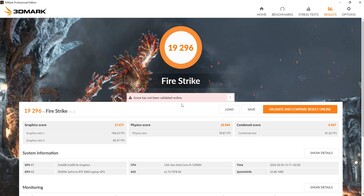
I syntetiska 3D-benchmarks presterade GPU:erna något bättre än en genomsnittlig RTX 3060 från vår databas, men Lenovo Legion 5 och Asus TUF Gaming F15 är marginellt snabbare än Strix Scar. RTX 3070 Ti i Scar 15 G533zw är ungefär 35 % mer kraftfull.
På batteridrift sjönk den bärbara datorns 3D-prestanda med cirka 67% i en ny Fire Strike -testkörning, vilket resulterade i en grafikpoäng på bara 7 168 snarare än de vanliga 21 671.
| 3DMark 11 Performance | 27156 poäng | |
| 3DMark Fire Strike Score | 19296 poäng | |
| 3DMark Time Spy Score | 8606 poäng | |
Hjälp | ||
Prestanda för spel
Tyvärr begränsar Optimus Strix till att köra DirectX 11-spel med bara 60 bilder per sekund. Detta är ett generellt problem som påverkar vissa bärbara datorer med Optimus. Förutom att spela dessa spel på en extern bildskärm är den enda lösningen att aktivera MUX-omkopplaren och använda dGPU:n direkt.
Strix 15 erbjuder mestadels den bästa prestandan bland enheterna i vår jämförelse. Endast TUF Gaming F15 är marginellt snabbare i vissa spel.
När Strix kopplades ur stabiliserades bildhastigheten på 30 bilder per sekund i Witcher 3 som kördes på Ultra, och fläktarna förblev behagligt tysta hela tiden.
Witcher 3 kördes ganska stabilt under hela den en timme långa testperioden, med endast en liten minskning av bildfrekvensen.
Witcher 3 FPS chart
| låg | med. | hög | ultra | QHD | |
|---|---|---|---|---|---|
| GTA V (2015) | 186.2 | 181.6 | 166.9 | 105 | 80.5 |
| The Witcher 3 (2015) | 400 | 290 | 165 | 88.7 | |
| Dota 2 Reborn (2015) | 182.6 | 167.7 | 159.1 | 151.4 | |
| Final Fantasy XV Benchmark (2018) | 178.9 | 117.2 | 87.5 | 65.1 | |
| X-Plane 11.11 (2018) | 145.8 | 123.9 | 99.8 | ||
| Far Cry 5 (2018) | 160 | 129 | 123 | 117 | 92 |
| Strange Brigade (2018) | 398 | 216 | 176.4 | 153 | |
| Cyberpunk 2077 1.6 (2022) | 120 | 118 | 63 | 63 |
Utsläpp - Coolt, men inte nödvändigtvis tyst
Bullerutsläpp
I Turbo-läge snurrar fläktarna inuti regelbundet ganska högt i några sekunder innan de återgår till tomgång. Asus kanske vill överväga att göra kylsystemet mindre aggressivt i en framtida uppdatering. Med det sagt snurrar fläktarna vanligtvis inte i tyst läge.
Asus Strix Scar är inte nödvändigtvis tyst under belastning. Under spel och stresstestet var Asus TUF och MSI Pulse lika högljudda, medan Lenovo Legion och Alienware förblev tystare.
När vi startade vissa belastningar (t.ex. Witcher 3) märkte vi också mjuka elektroniska pipande ljud som kom från enheten, men de var bara närvarande tillfälligt.
Ljudnivå
| Låg belastning |
| 23 / 23 / 37.75 dB(A) |
| Hög belastning |
| 45.35 / 56.22 dB(A) |
 | ||
30 dB tyst 40 dB(A) hörbar 50 dB(A) högt ljud |
||
min: | ||
| Asus ROG Strix Scar 15 G533zm GeForce RTX 3060 Laptop GPU, i9-12900H | Asus ROG Strix Scar 15 G533ZW-LN106WS GeForce RTX 3070 Ti Laptop GPU, i9-12900H, Samsung PM9A1 MZVL22T0HBLB | Asus TUF Gaming F15 FX507ZM GeForce RTX 3060 Laptop GPU, i7-12700H, SK Hynix HFM001TD3JX013N | MSI Pulse GL66 12UEK GeForce RTX 3060 Laptop GPU, i9-12900H, Micron 2450 512GB MTFDKBA512TFK | Alienware m15 R5 Ryzen Edition GeForce RTX 3060 Laptop GPU, R7 5800H, Toshiba KBG40ZNS512G NVMe | Lenovo Legion 5 15ACH6A-82NW0010GE Radeon RX 6600M, R5 5600H, Micron 2210 MTFDHBA512QFD | |
|---|---|---|---|---|---|---|
| Noise | -26% | 6% | 0% | 2% | -4% | |
| av / miljö * (dB) | 23 | 26.86 -17% | 23.2 -1% | 23 -0% | 24 -4% | 25 -9% |
| Idle Minimum * (dB) | 23 | 39.07 -70% | 23.6 -3% | 23 -0% | 24 -4% | 25 -9% |
| Idle Average * (dB) | 23 | 39.07 -70% | 23.6 -3% | 27 -17% | 25 -9% | 25 -9% |
| Idle Maximum * (dB) | 37.75 | 39.07 -3% | 25.4 33% | 27 28% | 35 7% | 34.5 9% |
| Load Average * (dB) | 45.35 | 53.34 -18% | 38 16% | 48.2 -6% | 44 3% | 51.1 -13% |
| Witcher 3 ultra * (dB) | 55.48 | 56.6 -2% | 54.1 2% | 56.9 -3% | 48 13% | |
| Load Maximum * (dB) | 56.22 | 56.6 -1% | 57.2 -2% | 56.94 -1% | 50 11% | 51.3 9% |
* ... mindre är bättre
Temperatur
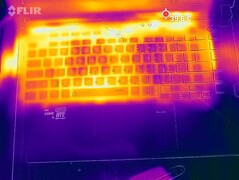
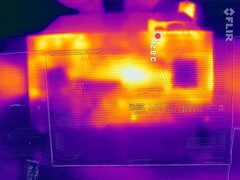
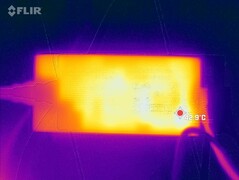
Asus bärbara speldator kan hålla sig relativt sval både vid tomgång och under belastning. Alienware blir till exempel mycket varmare trots sitt utskjutande kylsystem. Strix Scar har en hörbart mer aggressiv fläktkurva, vilket hjälper yttemperaturerna att hålla sig på en rimlig nivå.
(±) Den maximala temperaturen på ovansidan är 43 °C / 109 F, jämfört med genomsnittet av 40.4 °C / 105 F , allt från 21.2 till 68.8 °C för klassen Gaming.
(-) Botten värms upp till maximalt 47 °C / 117 F, jämfört med genomsnittet av 43.3 °C / 110 F
(+) Vid tomgångsbruk är medeltemperaturen för ovansidan 29.2 °C / 85 F, jämfört med enhetsgenomsnittet på 33.9 °C / ### class_avg_f### F.
(±) När du spelar The Witcher 3 är medeltemperaturen för ovansidan 32.9 °C / 91 F, jämfört med enhetsgenomsnittet på 33.9 °C / ## #class_avg_f### F.
(+) Handledsstöden och pekplattan är kallare än hudtemperaturen med maximalt 25 °C / 77 F och är därför svala att ta på.
(+) Medeltemperaturen för handledsstödsområdet på liknande enheter var 28.8 °C / 83.8 F (+3.8 °C / 6.8 F).
| Asus ROG Strix Scar 15 G533zm Intel Core i9-12900H, NVIDIA GeForce RTX 3060 Laptop GPU | Asus ROG Strix Scar 15 G533ZW-LN106WS Intel Core i9-12900H, NVIDIA GeForce RTX 3070 Ti Laptop GPU | Asus TUF Gaming F15 FX507ZM Intel Core i7-12700H, NVIDIA GeForce RTX 3060 Laptop GPU | MSI Pulse GL66 12UEK Intel Core i9-12900H, NVIDIA GeForce RTX 3060 Laptop GPU | Alienware m15 R5 Ryzen Edition AMD Ryzen 7 5800H, NVIDIA GeForce RTX 3060 Laptop GPU | Lenovo Legion 5 15ACH6A-82NW0010GE AMD Ryzen 5 5600H, AMD Radeon RX 6600M | |
|---|---|---|---|---|---|---|
| Heat | -10% | -11% | -11% | -22% | 3% | |
| Maximum Upper Side * (°C) | 43 | 42.6 1% | 44.4 -3% | 50 -16% | 62 -44% | 39.9 7% |
| Maximum Bottom * (°C) | 47 | 50.2 -7% | 48.8 -4% | 47 -0% | 61 -30% | 43.8 7% |
| Idle Upper Side * (°C) | 32 | 36.2 -13% | 37.8 -18% | 36 -13% | 36 -13% | 34.1 -7% |
| Idle Bottom * (°C) | 33 | 40.2 -22% | 39.6 -20% | 38 -15% | 33 -0% | 31.7 4% |
* ... mindre är bättre
Stresstest
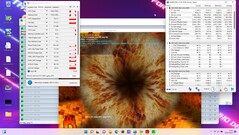
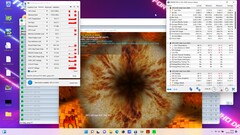
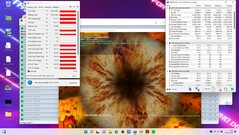
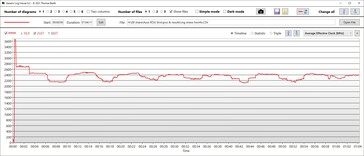
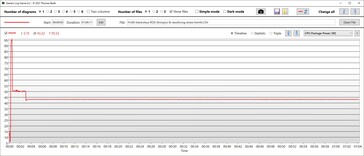
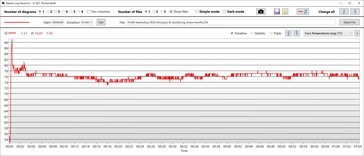
Under stresstestet nådde TDP cirka 95 watt under några sekunder innan den föll till nominella 45 watt. Samtidigt sjönk CPU:ns klockfrekvens till cirka 2,3 GHz i genomsnitt, med kärntemperaturer som låg runt 76°C (168,8°F).
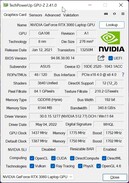
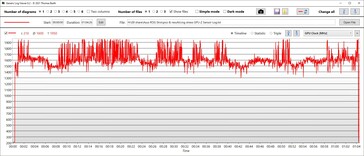
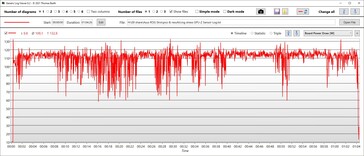
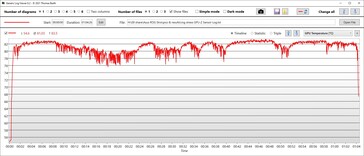
GPU:ns klocka gick på cirka 1,6 GHz med endast mindre fluktuationer. Minnesklockan låg på absolut stabila 1 750 MHz. GPU-temperaturerna var dock relativt höga på cirka 81 °C (177,8 °F), vilket ändå fortfarande faller inom ett säkert intervall och indikerar att spelrummet utnyttjades väl. Hela kortet drog i genomsnitt 109 watt.
| CPU-klocka (GHz) | GPU-klocka (MHz) | Genomsnittlig CPU-temperatur (°C) | Genomsnittlig GPU-temperatur (°C) | |
| Prime95 + FurMark Stress | 2.3 | 1.600 | 76 | 81 |
Högtalare
Högtalarna blir inte tillräckligt starka ens vid maximal volym. Med det sagt kan de åtminstone producera en hyfsad bas för att vara bärbara högtalare. Å andra sidan är de höga tonerna inte riktigt lika imponerande som på konkurrerande enheter.
Det finns ett kombinerat ljuduttag för användare som vill ansluta externa analoga ljudenheter.
Asus ROG Strix Scar 15 G533zm ljudanalys
(±) | högtalarljudstyrkan är genomsnittlig men bra (79.48 dB)
Bas 100 - 315 Hz
(+) | bra bas - bara 3.5% från medianen
(+) | basen är linjär (4.6% delta till föregående frekvens)
Mellan 400 - 2000 Hz
(±) | högre mellan - i genomsnitt 5.6% högre än median
(+) | mids är linjära (4.8% delta till föregående frekvens)
Högsta 2 - 16 kHz
(±) | reducerade toppar - i genomsnitt 6.8% lägre än medianen
(±) | linjäriteten för toppar är genomsnittlig (8.2% delta till föregående frekvens)
Totalt 100 - 16 000 Hz
(+) | det totala ljudet är linjärt (14.7% skillnad mot median)
Jämfört med samma klass
» 28% av alla testade enheter i den här klassen var bättre, 7% liknande, 65% sämre
» Den bästa hade ett delta på 6%, genomsnittet var 18%, sämst var 132%
Jämfört med alla testade enheter
» 19% av alla testade enheter var bättre, 4% liknande, 77% sämre
» Den bästa hade ett delta på 4%, genomsnittet var 24%, sämst var 134%
Asus TUF Gaming F15 FX507ZM ljudanalys
(±) | högtalarljudstyrkan är genomsnittlig men bra (76.7 dB)
Bas 100 - 315 Hz
(±) | reducerad bas - i genomsnitt 13.7% lägre än medianen
(±) | linjäriteten för basen är genomsnittlig (10.1% delta till föregående frekvens)
Mellan 400 - 2000 Hz
(±) | högre mellan - i genomsnitt 5.2% högre än median
(+) | mids är linjära (4.9% delta till föregående frekvens)
Högsta 2 - 16 kHz
(+) | balanserade toppar - endast 4.1% från medianen
(±) | linjäriteten för toppar är genomsnittlig (8.6% delta till föregående frekvens)
Totalt 100 - 16 000 Hz
(±) | linjäriteten för det totala ljudet är genomsnittlig (15.9% skillnad mot median)
Jämfört med samma klass
» 37% av alla testade enheter i den här klassen var bättre, 7% liknande, 56% sämre
» Den bästa hade ett delta på 6%, genomsnittet var 18%, sämst var 132%
Jämfört med alla testade enheter
» 24% av alla testade enheter var bättre, 5% liknande, 71% sämre
» Den bästa hade ett delta på 4%, genomsnittet var 24%, sämst var 134%
Energihantering - Hyfsad batteritid
Strömförbrukning
Trots att Asus Strix Scar 15 inte är särskilt strömsnål är den inte heller särskilt problematisk i det här avseendet. Den förbrukar något mer ström än sina konkurrenter i det energisparande viloläget såväl som under spel. Ändå är dess övergående toppanvändning på 221 watt inte högre än hos konkurrenterna och ligger väl inom ramen för 240-wattladdaren.
| Låg belastning | |
| Hög belastning |
|
Förklaring:
min: | |
| Asus ROG Strix Scar 15 G533zm i9-12900H, GeForce RTX 3060 Laptop GPU, , IPS, 2560x1440, 15.6" | Asus ROG Strix Scar 15 G533ZW-LN106WS i9-12900H, GeForce RTX 3070 Ti Laptop GPU, Samsung PM9A1 MZVL22T0HBLB, IPS-level, 2560x1440, 15.6" | Asus TUF Gaming F15 FX507ZM i7-12700H, GeForce RTX 3060 Laptop GPU, SK Hynix HFM001TD3JX013N, IPS, 1920x1080, 15.6" | MSI Pulse GL66 12UEK i9-12900H, GeForce RTX 3060 Laptop GPU, Micron 2450 512GB MTFDKBA512TFK, IPS, 1920x1080, 15.6" | Alienware m15 R5 Ryzen Edition R7 5800H, GeForce RTX 3060 Laptop GPU, Toshiba KBG40ZNS512G NVMe, IPS, 1920x1080, 15.6" | Lenovo Legion 5 15ACH6A-82NW0010GE R5 5600H, Radeon RX 6600M, Micron 2210 MTFDHBA512QFD, IPS, 1920x1080, 15.6" | Genomsnitt NVIDIA GeForce RTX 3060 Laptop GPU | Genomsnitt av klass Gaming | |
|---|---|---|---|---|---|---|---|---|
| Power Consumption | 7% | 9% | 28% | 1% | 8% | 7% | -14% | |
| Idle Minimum * (Watt) | 13 | 7.56 42% | 6.3 52% | 7 46% | 11 15% | 10 23% | 10.4 ? 20% | 13.6 ? -5% |
| Idle Average * (Watt) | 17 | 13.5 21% | 9.8 42% | 13 24% | 14 18% | 13.2 22% | 14.5 ? 15% | 19.3 ? -14% |
| Idle Maximum * (Watt) | 17 | 16.87 1% | 26.5 -56% | 13.7 19% | 25 -47% | 15.6 8% | 21.4 ? -26% | 25.7 ? -51% |
| Load Average * (Watt) | 135 | 128.9 5% | 103.8 23% | 48.4 64% | 123 9% | 178 -32% | 109.3 ? 19% | 110.1 ? 18% |
| Witcher 3 ultra * (Watt) | 195 | 196.2 -1% | 189 3% | 148 24% | 176 10% | 181 7% | ||
| Load Maximum * (Watt) | 221 | 274.86 -24% | 241.9 -9% | 244 -10% | 226 -2% | 180 19% | 206 ? 7% | 258 ? -17% |
* ... mindre är bättre
Power consumption Witcher 3 / stress test
Power consumption with external monitor
Batteriets livslängd
Asus har utrustat den bärbara datorn med ett stort 90Wh-batteri som kan erbjuda enastående 8,5 timmars videouppspelning och 9 timmars internetsurfning i våra tester, som utfördes med reducerad skärmens ljusstyrka.
| Asus ROG Strix Scar 15 G533zm i9-12900H, GeForce RTX 3060 Laptop GPU, 90 Wh | Asus ROG Strix Scar 15 G533ZW-LN106WS i9-12900H, GeForce RTX 3070 Ti Laptop GPU, 90 Wh | Asus TUF Gaming F15 FX507ZM i7-12700H, GeForce RTX 3060 Laptop GPU, 90 Wh | MSI Pulse GL66 12UEK i9-12900H, GeForce RTX 3060 Laptop GPU, 53.5 Wh | Alienware m15 R5 Ryzen Edition R7 5800H, GeForce RTX 3060 Laptop GPU, 86 Wh | Lenovo Legion 5 15ACH6A-82NW0010GE R5 5600H, Radeon RX 6600M, 80 Wh | Genomsnitt av klass Gaming | |
|---|---|---|---|---|---|---|---|
| Batteridrifttid | -16% | -40% | -17% | -16% | 13% | -17% | |
| H.264 (h) | 8.6 | 8.5 -1% | 4 -53% | 8.8 2% | 8.13 ? -5% | ||
| WiFi v1.3 (h) | 9.2 | 8.4 -9% | 4.8 -48% | 5.1 -45% | 9.2 0% | 6.75 ? -27% | |
| Witcher 3 ultra (h) | 1.3 | 1.2 -8% | 1.6 23% | 0.958 ? -26% | |||
| Load (h) | 1.6 | 0.9 -44% | 1.1 -31% | 1.9 19% | 0.9 -44% | 2 25% | 1.45 ? -9% |
| Reader / Idle (h) | 15.8 | 14.7 | 12.8 | 9.17 ? |
För
Emot
Omdöme - Imponerande bärbar dator för spel för 1 999 euro
G533zm-modellen av Asus ROG Strix Scar 15 har en RTX 3060 och är också en mycket kompetent och bra bärbar speldator med superb byggkvalitet. Den erbjuder moderna I/O, en fantastisk skrivupplevelse, kraftfull hårdvara och anpassningsmöjligheter. Dessutom utmärker sig skärmen med bra responstid, utmärkt färgtäckning och solid kontrast och ljusstyrka. Jämfört med RTX 3070 Ti-modellen (G533zw) och direkta konkurrenter går G533zm relativt svalt.
Vi har inga riktiga klagomål på den bärbara datorn. Dess ljudnivå skulle kunna använda lite optimering men är annars ganska rimlig. På den noten kan du fråga dig själv om det är nödvändigt att para ihop en RTX 3060 med den snabba men heta i9-12900H, när en i7-12700H förmodligen skulle göra jobbet helt fint. På vår granskningsenhet fastnade den vänstra pekplattans knapp ibland lite, även om den andra Scar-modellen inte hade det här problemet.
För cirka 2 000 euro (2 170 USD) får spelare en utmärkt bärbar dator med bra prestanda, massor av styrkor och få nackdelar.
Även om det kanske inte är ett överpris för en bärbar RTX 3060-spelkonsol är prislappen på €2 000 (US$2 170) ganska rimlig med tanke på de många positiva aspekterna och de nästan obefintliga nackdelarna. De som vill investera mindre pengar kan också överväga Asus TUF Gaming F15. Denna bärbara dator har färre funktioner men erbjuder utmärkt prestanda till en kostnad av cirka 400 euro (2 170 kr)
Pris och tillgänglighet
Granskningskonfigurationen finns för närvarande tillgänglig från Cyberport för 1 999 euro (2 166 US-dollar). Du kan också hitta en modell med lägre specifikation med mindre minne och en FHD-skärm på Amazon för cirka 1 600 US-dollar.
Asus ROG Strix Scar 15 G533zm
- 04/30/2024 v7 (old)
Christian Hintze


