Test: Lenovo Legion 5 15 G6 AMD - Billig spellaptop med massor av kraft (Sammanfattning)
Testgrupp
Gradering | Datum | Modell | Vikt | Höjd | Storlek | Upplösning | Pris |
|---|---|---|---|---|---|---|---|
| 83.4 % v7 (old) | 09/2021 | Lenovo Legion 5 15ACH-82JU00C6GE-FL R7 5800H, GeForce RTX 3060 Laptop GPU | 2.5 kg | 26 mm | 15.60" | 1920x1080 | |
| 82.2 % v7 (old) | 09/2021 | Acer Nitro 5 AN515-45-R1JH R7 5800H, GeForce RTX 3070 Laptop GPU | 2.3 kg | 23.9 mm | 15.60" | 2560x1440 | |
| 85.9 % v7 (old) | 10/2021 | Asus TUF Gaming F15 FX506HM i7-11800H, GeForce RTX 3060 Laptop GPU | 2.3 kg | 24.9 mm | 15.60" | 1920x1080 | |
| 84.7 % v7 (old) | 08/2025 | Alienware m15 R5 Ryzen Edition R7 5800H, GeForce RTX 3060 Laptop GPU | 2.5 kg | 22.85 mm | 15.60" | 1920x1080 | |
| 84.9 % v7 (old) | Schenker XMG Core 15 Ampere R7 4800H, GeForce RTX 3060 Laptop GPU | 2 kg | 22.9 mm | 15.60" | 2560x1440 |
| Networking | |
| iperf3 transmit AX12 | |
| Schenker XMG Core 15 Ampere | |
| Alienware m15 R5 Ryzen Edition | |
| Acer Nitro 5 AN515-45-R1JH | |
| Asus TUF Gaming F15 FX506HM | |
| Genomsnitt RealTek Semiconductor RTL8852AE (424 - 928, n=20) | |
| Lenovo Legion 5 15ACH-82JU00C6GE-FL | |
| iperf3 receive AX12 | |
| Schenker XMG Core 15 Ampere | |
| Alienware m15 R5 Ryzen Edition | |
| Asus TUF Gaming F15 FX506HM | |
| Lenovo Legion 5 15ACH-82JU00C6GE-FL | |
| Genomsnitt RealTek Semiconductor RTL8852AE (621 - 877, n=20) | |
| Acer Nitro 5 AN515-45-R1JH | |


| |||||||||||||||||||||||||
Distribution av ljusstyrkan: 96 %
Mitt på batteriet: 350 cd/m²
Kontrast: 1167:1 (Svärta: 0.3 cd/m²)
ΔE ColorChecker Calman: 3.9 | ∀{0.5-29.43 Ø4.72}
calibrated: 1.6
ΔE Greyscale Calman: 5.5 | ∀{0.09-98 Ø4.97}
67.5% AdobeRGB 1998 (Argyll 3D)
96.3% sRGB (Argyll 3D)
65.4% Display P3 (Argyll 3D)
Gamma: 2.15
CCT: 7414 K
| Lenovo Legion 5 15ACH-82JU00C6GE-FL B156HAN12.H, , 1920x1080, 15.6" | Acer Nitro 5 AN515-45-R1JH BOE BOE09B8, IPS, 2560x1440, 15.6" | Asus TUF Gaming F15 FX506HM Chi Mei N156HRA-EA1, IPS, 1920x1080, 15.6" | Alienware m15 R5 Ryzen Edition B156HAN, IPS, 1920x1080, 15.6" | Schenker XMG Core 15 Ampere BOE CQ NE156QHM-NY2, IPS, 2560x1440, 15.6" | |
|---|---|---|---|---|---|
| Display | 0% | -36% | 5% | ||
| Display P3 Coverage (%) | 65.4 | 66.2 1% | 41.9 -36% | 69.8 7% | |
| sRGB Coverage (%) | 96.3 | 96.3 0% | 62.9 -35% | 98.8 3% | |
| AdobeRGB 1998 Coverage (%) | 67.5 | 67.1 -1% | 43.3 -36% | 70.7 5% | |
| Response Times | 5% | -122% | 40% | -11% | |
| Response Time Grey 50% / Grey 80% * (ms) | 13.6 ? | 14 ? -3% | 28.4 ? -109% | 4 ? 71% | 14.8 ? -9% |
| Response Time Black / White * (ms) | 9.2 ? | 8 ? 13% | 21.6 ? -135% | 8.4 ? 9% | 10.4 ? -13% |
| PWM Frequency (Hz) | |||||
| Screen | -18% | -36% | 13% | 24% | |
| Brightness middle (cd/m²) | 350 | 349 0% | 268.3 -23% | 329 -6% | 347 -1% |
| Brightness (cd/m²) | 350 | 304 -13% | 257 -27% | 321 -8% | 328 -6% |
| Brightness Distribution (%) | 96 | 79 -18% | 84 -12% | 92 -4% | 89 -7% |
| Black Level * (cd/m²) | 0.3 | 0.535 -78% | 0.34 -13% | 0.27 10% | 0.27 10% |
| Contrast (:1) | 1167 | 652 -44% | 789 -32% | 1219 4% | 1285 10% |
| Colorchecker dE 2000 * | 3.9 | 3.11 20% | 5.05 -29% | 2.78 29% | 1.66 57% |
| Colorchecker dE 2000 max. * | 8.2 | 9.57 -17% | 15.43 -88% | 4.88 40% | 3.03 63% |
| Colorchecker dE 2000 calibrated * | 1.6 | 3.21 -101% | 1.63 -2% | 1.23 23% | |
| Greyscale dE 2000 * | 5.5 | 5 9% | 5.5 -0% | 2.5 55% | 1.6 71% |
| Gamma | 2.15 102% | 2.36 93% | 2.35 94% | 2.106 104% | 2.278 97% |
| CCT | 7414 88% | 6976 93% | 7392 88% | 6201 105% | 6430 101% |
| Color Space (Percent of AdobeRGB 1998) (%) | 76 | 71 | |||
| Color Space (Percent of sRGB) (%) | 99 | 94 | |||
| Totalt genomsnitt (program/inställningar) | -4% /
-10% | -65% /
-48% | 27% /
18% | 6% /
15% |
* ... mindre är bättre
Visa svarstider
| ↔ Svarstid svart till vitt | ||
|---|---|---|
| 9.2 ms ... stiga ↗ och falla ↘ kombinerat | ↗ 4.4 ms stiga | 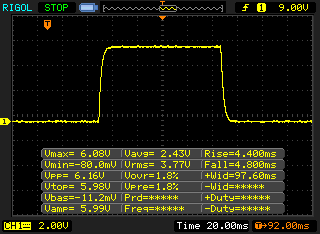 |
| ↘ 4.8 ms hösten | ||
| Skärmen visar snabba svarsfrekvenser i våra tester och bör passa för spel. I jämförelse sträcker sig alla testade enheter från 0.1 (minst) till 240 (maximalt) ms. » 26 % av alla enheter är bättre. Det betyder att den uppmätta svarstiden är bättre än genomsnittet av alla testade enheter (19.8 ms). | ||
| ↔ Svarstid 50 % grått till 80 % grått | ||
| 13.6 ms ... stiga ↗ och falla ↘ kombinerat | ↗ 6.8 ms stiga | 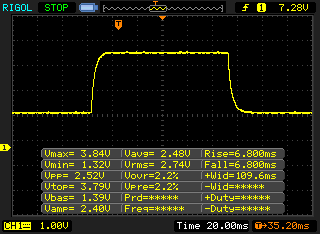 |
| ↘ 6.8 ms hösten | ||
| Skärmen visar bra svarsfrekvens i våra tester, men kan vara för långsam för konkurrenskraftiga spelare. I jämförelse sträcker sig alla testade enheter från 0.165 (minst) till 636 (maximalt) ms. » 27 % av alla enheter är bättre. Det betyder att den uppmätta svarstiden är bättre än genomsnittet av alla testade enheter (31 ms). | ||
Skärmflimmer / PWM (Puls-Width Modulation)
| Skärmflimmer / PWM upptäcktes inte | 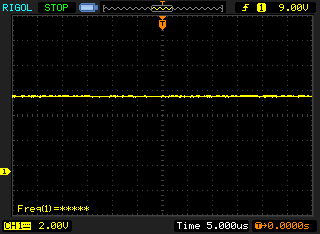 | ||
Som jämförelse: 52 % av alla testade enheter använder inte PWM för att dämpa skärmen. Om PWM upptäcktes mättes ett medelvärde av 7763 (minst: 5 - maximum: 343500) Hz. | |||
Cinebench R15 Multi Loop
Cinebench R20: CPU (Single Core) | CPU (Multi Core)
Cinebench R15: CPU Single 64Bit | CPU Multi 64Bit
Blender: v2.79 BMW27 CPU
7-Zip 18.03: 7z b 4 -mmt1 | 7z b 4
Geekbench 5.5: Single-Core | Multi-Core
HWBOT x265 Benchmark v2.2: 4k Preset
LibreOffice : 20 Documents To PDF
R Benchmark 2.5: Overall mean
| Cinebench R23 / Single Core | |
| Genomsnitt av klass Gaming (1166 - 2356, n=109, senaste 2 åren) | |
| Asus TUF Gaming F15 FX506HM | |
| Acer Nitro 5 AN515-45-R1JH | |
| Alienware m15 R5 Ryzen Edition | |
| Lenovo Legion 5 15ACH-82JU00C6GE-FL | |
| Genomsnitt AMD Ryzen 7 5800H (1294 - 1441, n=29) | |
| Schenker XMG Core 15 Ampere | |
| Cinebench R23 / Multi Core | |
| Genomsnitt av klass Gaming (10488 - 40970, n=109, senaste 2 åren) | |
| Asus TUF Gaming F15 FX506HM | |
| Lenovo Legion 5 15ACH-82JU00C6GE-FL | |
| Alienware m15 R5 Ryzen Edition | |
| Acer Nitro 5 AN515-45-R1JH | |
| Genomsnitt AMD Ryzen 7 5800H (8812 - 13214, n=29) | |
| Schenker XMG Core 15 Ampere | |
| Cinebench R20 / CPU (Single Core) | |
| Genomsnitt av klass Gaming (442 - 895, n=108, senaste 2 åren) | |
| Asus TUF Gaming F15 FX506HM | |
| Alienware m15 R5 Ryzen Edition | |
| Acer Nitro 5 AN515-45-R1JH | |
| Lenovo Legion 5 15ACH-82JU00C6GE-FL | |
| Genomsnitt AMD Ryzen 7 5800H (502 - 560, n=30) | |
| Schenker XMG Core 15 Ampere | |
| Cinebench R20 / CPU (Multi Core) | |
| Genomsnitt av klass Gaming (4029 - 16108, n=108, senaste 2 åren) | |
| Asus TUF Gaming F15 FX506HM | |
| Lenovo Legion 5 15ACH-82JU00C6GE-FL | |
| Alienware m15 R5 Ryzen Edition | |
| Acer Nitro 5 AN515-45-R1JH | |
| Genomsnitt AMD Ryzen 7 5800H (3430 - 5020, n=31) | |
| Schenker XMG Core 15 Ampere | |
| Cinebench R15 / CPU Single 64Bit | |
| Genomsnitt av klass Gaming (188.8 - 343, n=108, senaste 2 åren) | |
| Alienware m15 R5 Ryzen Edition | |
| Acer Nitro 5 AN515-45-R1JH | |
| Asus TUF Gaming F15 FX506HM | |
| Genomsnitt AMD Ryzen 7 5800H (209 - 234, n=29) | |
| Lenovo Legion 5 15ACH-82JU00C6GE-FL | |
| Schenker XMG Core 15 Ampere | |
| Cinebench R15 / CPU Multi 64Bit | |
| Genomsnitt av klass Gaming (1578 - 6271, n=107, senaste 2 åren) | |
| Lenovo Legion 5 15ACH-82JU00C6GE-FL | |
| Asus TUF Gaming F15 FX506HM | |
| Alienware m15 R5 Ryzen Edition | |
| Acer Nitro 5 AN515-45-R1JH | |
| Genomsnitt AMD Ryzen 7 5800H (1487 - 2119, n=28) | |
| Schenker XMG Core 15 Ampere | |
| Blender / v2.79 BMW27 CPU | |
| Genomsnitt AMD Ryzen 7 5800H (237 - 340, n=29) | |
| Acer Nitro 5 AN515-45-R1JH | |
| Alienware m15 R5 Ryzen Edition | |
| Schenker XMG Core 15 Ampere | |
| Lenovo Legion 5 15ACH-82JU00C6GE-FL | |
| Asus TUF Gaming F15 FX506HM | |
| Genomsnitt av klass Gaming (80 - 330, n=106, senaste 2 åren) | |
| 7-Zip 18.03 / 7z b 4 -mmt1 | |
| Genomsnitt av klass Gaming (4199 - 7436, n=107, senaste 2 åren) | |
| Asus TUF Gaming F15 FX506HM | |
| Alienware m15 R5 Ryzen Edition | |
| Acer Nitro 5 AN515-45-R1JH | |
| Genomsnitt AMD Ryzen 7 5800H (5038 - 5632, n=29) | |
| Lenovo Legion 5 15ACH-82JU00C6GE-FL | |
| Schenker XMG Core 15 Ampere | |
| 7-Zip 18.03 / 7z b 4 | |
| Genomsnitt av klass Gaming (33491 - 148086, n=107, senaste 2 åren) | |
| Genomsnitt AMD Ryzen 7 5800H (45773 - 59986, n=28) | |
| Acer Nitro 5 AN515-45-R1JH | |
| Alienware m15 R5 Ryzen Edition | |
| Lenovo Legion 5 15ACH-82JU00C6GE-FL | |
| Schenker XMG Core 15 Ampere | |
| Asus TUF Gaming F15 FX506HM | |
| Geekbench 5.5 / Single-Core | |
| Genomsnitt av klass Gaming (986 - 2474, n=107, senaste 2 åren) | |
| Alienware m15 R5 Ryzen Edition | |
| Lenovo Legion 5 15ACH-82JU00C6GE-FL | |
| Acer Nitro 5 AN515-45-R1JH | |
| Genomsnitt AMD Ryzen 7 5800H (1336 - 1505, n=28) | |
| Schenker XMG Core 15 Ampere | |
| Geekbench 5.5 / Multi-Core | |
| Genomsnitt av klass Gaming (6460 - 27010, n=107, senaste 2 åren) | |
| Schenker XMG Core 15 Ampere | |
| Genomsnitt AMD Ryzen 7 5800H (6551 - 9062, n=28) | |
| Alienware m15 R5 Ryzen Edition | |
| Lenovo Legion 5 15ACH-82JU00C6GE-FL | |
| Acer Nitro 5 AN515-45-R1JH | |
| HWBOT x265 Benchmark v2.2 / 4k Preset | |
| Genomsnitt av klass Gaming (11.5 - 44.3, n=107, senaste 2 åren) | |
| Asus TUF Gaming F15 FX506HM | |
| Lenovo Legion 5 15ACH-82JU00C6GE-FL | |
| Alienware m15 R5 Ryzen Edition | |
| Acer Nitro 5 AN515-45-R1JH | |
| Genomsnitt AMD Ryzen 7 5800H (11.6 - 16.1, n=29) | |
| Schenker XMG Core 15 Ampere | |
| LibreOffice / 20 Documents To PDF | |
| Lenovo Legion 5 15ACH-82JU00C6GE-FL | |
| Acer Nitro 5 AN515-45-R1JH | |
| Genomsnitt AMD Ryzen 7 5800H (47.4 - 113, n=29) | |
| Schenker XMG Core 15 Ampere | |
| Alienware m15 R5 Ryzen Edition | |
| Genomsnitt av klass Gaming (33.2 - 88.8, n=107, senaste 2 åren) | |
| Asus TUF Gaming F15 FX506HM | |
| R Benchmark 2.5 / Overall mean | |
| Schenker XMG Core 15 Ampere | |
| Asus TUF Gaming F15 FX506HM | |
| Lenovo Legion 5 15ACH-82JU00C6GE-FL | |
| Genomsnitt AMD Ryzen 7 5800H (0.511 - 0.559, n=28) | |
| Alienware m15 R5 Ryzen Edition | |
| Acer Nitro 5 AN515-45-R1JH | |
| Genomsnitt av klass Gaming (0.3439 - 0.759, n=108, senaste 2 åren) | |
* ... mindre är bättre
| PCMark 10 / Score | |
| Genomsnitt av klass Gaming (5828 - 11574, n=94, senaste 2 åren) | |
| Asus TUF Gaming F15 FX506HM | |
| Acer Nitro 5 AN515-45-R1JH | |
| Genomsnitt AMD Ryzen 7 5800H, NVIDIA GeForce RTX 3060 Laptop GPU (6465 - 6855, n=6) | |
| Lenovo Legion 5 15ACH-82JU00C6GE-FL | |
| Alienware m15 R5 Ryzen Edition | |
| Schenker XMG Core 15 Ampere | |
| PCMark 10 / Essentials | |
| Genomsnitt av klass Gaming (8810 - 11935, n=98, senaste 2 åren) | |
| Asus TUF Gaming F15 FX506HM | |
| Lenovo Legion 5 15ACH-82JU00C6GE-FL | |
| Genomsnitt AMD Ryzen 7 5800H, NVIDIA GeForce RTX 3060 Laptop GPU (9589 - 10414, n=6) | |
| Acer Nitro 5 AN515-45-R1JH | |
| Alienware m15 R5 Ryzen Edition | |
| Schenker XMG Core 15 Ampere | |
| PCMark 10 / Productivity | |
| Genomsnitt av klass Gaming (6845 - 21327, n=96, senaste 2 åren) | |
| Lenovo Legion 5 15ACH-82JU00C6GE-FL | |
| Acer Nitro 5 AN515-45-R1JH | |
| Genomsnitt AMD Ryzen 7 5800H, NVIDIA GeForce RTX 3060 Laptop GPU (8798 - 9728, n=6) | |
| Alienware m15 R5 Ryzen Edition | |
| Asus TUF Gaming F15 FX506HM | |
| Schenker XMG Core 15 Ampere | |
| PCMark 10 / Digital Content Creation | |
| Genomsnitt av klass Gaming (7602 - 19657, n=96, senaste 2 åren) | |
| Asus TUF Gaming F15 FX506HM | |
| Acer Nitro 5 AN515-45-R1JH | |
| Genomsnitt AMD Ryzen 7 5800H, NVIDIA GeForce RTX 3060 Laptop GPU (7884 - 9497, n=6) | |
| Alienware m15 R5 Ryzen Edition | |
| Schenker XMG Core 15 Ampere | |
| Lenovo Legion 5 15ACH-82JU00C6GE-FL | |
| PCMark 10 Score | 6648 poäng | |
Hjälp | ||
| DPC Latencies / LatencyMon - interrupt to process latency (max), Web, Youtube, Prime95 | |
| Asus TUF Gaming F15 FX506HM | |
| Lenovo Legion 5 15ACH-82JU00C6GE-FL | |
| Schenker XMG Core 15 Ampere | |
| Alienware m15 R5 Ryzen Edition | |
| Acer Nitro 5 AN515-45-R1JH | |
* ... mindre är bättre
| Lenovo Legion 5 15ACH-82JU00C6GE-FL Micron 2300 512GB MTFDHBA512TDV | Acer Nitro 5 AN515-45-R1JH WDC PC SN530 SDBPNPZ-1T00 | Asus TUF Gaming F15 FX506HM SK Hynix HFM001TD3JX013N | Alienware m15 R5 Ryzen Edition Toshiba KBG40ZNS512G NVMe | Schenker XMG Core 15 Ampere Samsung SSD 970 EVO Plus 1TB | Genomsnitt Micron 2300 512GB MTFDHBA512TDV | |
|---|---|---|---|---|---|---|
| CrystalDiskMark 5.2 / 6 | -13% | 0% | -25% | 4% | -12% | |
| Write 4K (MB/s) | 124.6 | 161.3 29% | 168.1 35% | 116.9 -6% | 139.1 12% | 105.5 ? -15% |
| Read 4K (MB/s) | 54.2 | 49.49 -9% | 65.1 20% | 44.56 -18% | 47.59 -12% | 51.2 ? -6% |
| Write Seq (MB/s) | 2706 | 1970 -27% | 2124 -22% | 1552 -43% | 2917 8% | 2041 ? -25% |
| Read Seq (MB/s) | 2298 | 2007 -13% | 2204 -4% | 1682 -27% | 2586 13% | 1845 ? -20% |
| Write 4K Q32T1 (MB/s) | 499.7 | 416.8 -17% | 455.3 -9% | 497.8 0% | 511 2% | 494 ? -1% |
| Read 4K Q32T1 (MB/s) | 570 | 554 -3% | 465.6 -18% | 436.8 -23% | 571 0% | 445 ? -22% |
| Write Seq Q32T1 (MB/s) | 2999 | 1965 -34% | 2911 -3% | 1461 -51% | 3263 9% | 2867 ? -4% |
| Read Seq Q32T1 (MB/s) | 3461 | 2369 -32% | 3519 2% | 2364 -32% | 3567 3% | 3272 ? -5% |
| AS SSD | -35% | 9% | -34% | 28% | -21% | |
| Seq Read (MB/s) | 2960 | 2217 -25% | 2873 -3% | 2082 -30% | 2829 -4% | 2300 ? -22% |
| Seq Write (MB/s) | 2586 | 1929 -25% | 1619 -37% | 825 -68% | 2646 2% | 1550 ? -40% |
| 4K Read (MB/s) | 46.84 | 28.71 -39% | 57.5 23% | 42.41 -9% | 54.8 17% | 45 ? -4% |
| 4K Write (MB/s) | 96.1 | 146.3 52% | 149.6 56% | 98.3 2% | 179.1 86% | 106.6 ? 11% |
| 4K-64 Read (MB/s) | 854 | 215.9 -75% | 1252 47% | 1255 47% | 1734 103% | 676 ? -21% |
| 4K-64 Write (MB/s) | 2015 | 1475 -27% | 2196 9% | 738 -63% | 2396 19% | 1616 ? -20% |
| Access Time Read * (ms) | 0.048 | 0.04 17% | 0.109 -127% | 0.033 31% | 0.059 ? -23% | |
| Access Time Write * (ms) | 0.094 | 0.105 -12% | 0.082 13% | 0.17 -81% | 0.021 78% | 0.1807 ? -92% |
| Score Read (Points) | 1197 | 466 -61% | 1597 33% | 1506 26% | 2072 73% | 952 ? -20% |
| Score Write (Points) | 2370 | 814 -66% | 2508 6% | 918 -61% | 2839 20% | 1877 ? -21% |
| Score Total (Points) | 4170 | 2513 -40% | 4869 17% | 3136 -25% | 5965 43% | 3290 ? -21% |
| Copy ISO MB/s (MB/s) | 2064 | 1698 -18% | 1583 -23% | 1391 -33% | 2119 3% | 1603 ? -22% |
| Copy Program MB/s (MB/s) | 873 | 284.7 -67% | 964 10% | 645 -26% | 406.1 -53% | 843 ? -3% |
| Copy Game MB/s (MB/s) | 1503 | 786 -48% | 943 -37% | 1101 -27% | 1086 -28% | 1570 ? 4% |
| Totalt genomsnitt (program/inställningar) | -24% /
-27% | 5% /
6% | -30% /
-31% | 16% /
19% | -17% /
-18% |
* ... mindre är bättre

DiskSpd Read Loop, Queue Depth 8
| 3DMark 11 - 1280x720 Performance GPU | |
| Genomsnitt av klass Gaming (21841 - 80022, n=106, senaste 2 åren) | |
| Acer Nitro 5 AN515-45-R1JH | |
| Lenovo Legion 5 15ACH-82JU00C6GE-FL | |
| Asus TUF Gaming F15 FX506HM | |
| Schenker XMG Core 15 Ampere | |
| Alienware m15 R5 Ryzen Edition | |
| Genomsnitt NVIDIA GeForce RTX 3060 Laptop GPU (13799 - 30772, n=43) | |
| Lenovo Legion 5 15IMH05H | |
| 3DMark 11 Performance | 23146 poäng | |
| 3DMark Cloud Gate Standard Score | 53687 poäng | |
| 3DMark Fire Strike Score | 19980 poäng | |
| 3DMark Time Spy Score | 8863 poäng | |
Hjälp | ||
| F1 2020 | |
| 1920x1080 Ultra High Preset AA:T AF:16x | |
| Lenovo Legion 5 15ACH-82JU00C6GE-FL | |
| Alienware m15 R5 Ryzen Edition | |
| Genomsnitt NVIDIA GeForce RTX 3060 Laptop GPU (97.6 - 142, n=7) | |
| 1920x1080 High Preset AA:T AF:16x | |
| Lenovo Legion 5 15ACH-82JU00C6GE-FL | |
| Genomsnitt NVIDIA GeForce RTX 3060 Laptop GPU (138 - 193, n=7) | |
| Alienware m15 R5 Ryzen Edition | |
| 1920x1080 Medium Preset AF:16x | |
| Lenovo Legion 5 15ACH-82JU00C6GE-FL | |
| Genomsnitt NVIDIA GeForce RTX 3060 Laptop GPU (150 - 204, n=6) | |
| Alienware m15 R5 Ryzen Edition | |
| 1280x720 Ultra Low Preset | |
| Lenovo Legion 5 15ACH-82JU00C6GE-FL | |
| Genomsnitt NVIDIA GeForce RTX 3060 Laptop GPU (215 - 260, n=6) | |
| Alienware m15 R5 Ryzen Edition | |
Witcher 3 FPS-diagram
| låg | med. | hög | ultra | |
|---|---|---|---|---|
| GTA V (2015) | 170 | 164 | 142 | 81.3 |
| The Witcher 3 (2015) | 280 | 216 | 146 | 67 |
| Dota 2 Reborn (2015) | 124 | 128 | 106 | 102 |
| Final Fantasy XV Benchmark (2018) | 151 | 106 | 78.9 | |
| X-Plane 11.11 (2018) | 87.1 | 80.7 | 66.2 | |
| Far Cry 5 (2018) | 102 | 88 | 85 | 80 |
| F1 2020 (2020) | 243 | 200 | 183 | 131 |
| Cyberpunk 2077 1.0 (2020) | 101 | 81 | 68 | 58 |
| F1 2021 (2021) | 236 | 210 | 179 | 67 |
Ljudnivå
| Låg belastning |
| 29 / 29 / 29 dB(A) |
| Hög belastning |
| 53.5 / 53.5 dB(A) |
 | ||
30 dB tyst 40 dB(A) hörbar 50 dB(A) högt ljud |
||
min: | ||
| Lenovo Legion 5 15ACH-82JU00C6GE-FL GeForce RTX 3060 Laptop GPU, R7 5800H, Micron 2300 512GB MTFDHBA512TDV | Acer Nitro 5 AN515-45-R1JH GeForce RTX 3070 Laptop GPU, R7 5800H, WDC PC SN530 SDBPNPZ-1T00 | Asus TUF Gaming F15 FX506HM GeForce RTX 3060 Laptop GPU, i7-11800H, SK Hynix HFM001TD3JX013N | Alienware m15 R5 Ryzen Edition GeForce RTX 3060 Laptop GPU, R7 5800H, Toshiba KBG40ZNS512G NVMe | Schenker XMG Core 15 Ampere GeForce RTX 3060 Laptop GPU, R7 4800H, Samsung SSD 970 EVO Plus 1TB | |
|---|---|---|---|---|---|
| Noise | 6% | 16% | 7% | 6% | |
| av / miljö * (dB) | 24.2 | 25 -3% | 24.8 -2% | 24 1% | 24 1% |
| Idle Minimum * (dB) | 29 | 25 14% | 24.6 15% | 24 17% | 26 10% |
| Idle Average * (dB) | 29 | 25 14% | 24.9 14% | 25 14% | 28 3% |
| Idle Maximum * (dB) | 29 | 32.2 -11% | 24.9 14% | 35 -21% | 30 -3% |
| Load Average * (dB) | 53.5 | 45.8 14% | 27.1 49% | 44 18% | 42 21% |
| Witcher 3 ultra * (dB) | 53.5 | 46.4 13% | 48 10% | 50 7% | |
| Load Maximum * (dB) | 53.5 | 49.1 8% | 49 8% | 50 7% | 52 3% |
* ... mindre är bättre
(±) Den maximala temperaturen på ovansidan är 42.6 °C / 109 F, jämfört med genomsnittet av 40.4 °C / 105 F , allt från 21.2 till 68.8 °C för klassen Gaming.
(-) Botten värms upp till maximalt 52.2 °C / 126 F, jämfört med genomsnittet av 43.2 °C / 110 F
(+) Vid tomgångsbruk är medeltemperaturen för ovansidan 24.2 °C / 76 F, jämfört med enhetsgenomsnittet på 33.9 °C / ### class_avg_f### F.
(±) När du spelar The Witcher 3 är medeltemperaturen för ovansidan 34.8 °C / 95 F, jämfört med enhetsgenomsnittet på 33.9 °C / ## #class_avg_f### F.
(+) Handledsstöden och pekplattan når maximal hudtemperatur (34.8 °C / 94.6 F) och är därför inte varma.
(-) Medeltemperaturen för handledsstödsområdet på liknande enheter var 28.8 °C / 83.8 F (-6 °C / -10.8 F).
Lenovo Legion 5 15ACH-82JU00C6GE-FL ljudanalys
(±) | högtalarljudstyrkan är genomsnittlig men bra (81 dB)
Bas 100 - 315 Hz
(-) | nästan ingen bas - i genomsnitt 22.1% lägre än medianen
(±) | linjäriteten för basen är genomsnittlig (11.4% delta till föregående frekvens)
Mellan 400 - 2000 Hz
(+) | balanserad mellan - endast 4.5% från medianen
(+) | mids är linjära (5% delta till föregående frekvens)
Högsta 2 - 16 kHz
(+) | balanserade toppar - endast 2.9% från medianen
(+) | toppar är linjära (4.5% delta till föregående frekvens)
Totalt 100 - 16 000 Hz
(±) | linjäriteten för det totala ljudet är genomsnittlig (17.8% skillnad mot median)
Jämfört med samma klass
» 53% av alla testade enheter i den här klassen var bättre, 10% liknande, 37% sämre
» Den bästa hade ett delta på 6%, genomsnittet var 18%, sämst var 132%
Jämfört med alla testade enheter
» 36% av alla testade enheter var bättre, 8% liknande, 56% sämre
» Den bästa hade ett delta på 4%, genomsnittet var 23%, sämst var 134%
Acer Nitro 5 AN515-45-R1JH ljudanalys
(±) | högtalarljudstyrkan är genomsnittlig men bra (75.5 dB)
Bas 100 - 315 Hz
(-) | nästan ingen bas - i genomsnitt 33.4% lägre än medianen
(±) | linjäriteten för basen är genomsnittlig (12.8% delta till föregående frekvens)
Mellan 400 - 2000 Hz
(+) | balanserad mellan - endast 3.4% från medianen
(±) | linjäriteten för mids är genomsnittlig (8.6% delta till föregående frekvens)
Högsta 2 - 16 kHz
(±) | högre toppar - i genomsnitt 5% högre än medianen
(±) | linjäriteten för toppar är genomsnittlig (7.3% delta till föregående frekvens)
Totalt 100 - 16 000 Hz
(±) | linjäriteten för det totala ljudet är genomsnittlig (25.1% skillnad mot median)
Jämfört med samma klass
» 90% av alla testade enheter i den här klassen var bättre, 3% liknande, 7% sämre
» Den bästa hade ett delta på 6%, genomsnittet var 18%, sämst var 132%
Jämfört med alla testade enheter
» 77% av alla testade enheter var bättre, 5% liknande, 18% sämre
» Den bästa hade ett delta på 4%, genomsnittet var 23%, sämst var 134%
Asus TUF Gaming F15 FX506HM ljudanalys
(±) | högtalarljudstyrkan är genomsnittlig men bra (77.1 dB)
Bas 100 - 315 Hz
(±) | reducerad bas - i genomsnitt 13.8% lägre än medianen
(±) | linjäriteten för basen är genomsnittlig (7.9% delta till föregående frekvens)
Mellan 400 - 2000 Hz
(+) | balanserad mellan - endast 2.9% från medianen
(+) | mids är linjära (5.9% delta till föregående frekvens)
Högsta 2 - 16 kHz
(+) | balanserade toppar - endast 1.8% från medianen
(+) | toppar är linjära (2.7% delta till föregående frekvens)
Totalt 100 - 16 000 Hz
(+) | det totala ljudet är linjärt (13.1% skillnad mot median)
Jämfört med samma klass
» 18% av alla testade enheter i den här klassen var bättre, 4% liknande, 78% sämre
» Den bästa hade ett delta på 6%, genomsnittet var 18%, sämst var 132%
Jämfört med alla testade enheter
» 13% av alla testade enheter var bättre, 3% liknande, 84% sämre
» Den bästa hade ett delta på 4%, genomsnittet var 23%, sämst var 134%
| Av/Standby | |
| Låg belastning | |
| Hög belastning |
|
Förklaring:
min: | |
| Lenovo Legion 5 15ACH-82JU00C6GE-FL R7 5800H, GeForce RTX 3060 Laptop GPU, Micron 2300 512GB MTFDHBA512TDV, , 1920x1080, 15.6" | Acer Nitro 5 AN515-45-R1JH R7 5800H, GeForce RTX 3070 Laptop GPU, WDC PC SN530 SDBPNPZ-1T00, IPS, 2560x1440, 15.6" | Asus TUF Gaming F15 FX506HM i7-11800H, GeForce RTX 3060 Laptop GPU, SK Hynix HFM001TD3JX013N, IPS, 1920x1080, 15.6" | Alienware m15 R5 Ryzen Edition R7 5800H, GeForce RTX 3060 Laptop GPU, Toshiba KBG40ZNS512G NVMe, IPS, 1920x1080, 15.6" | Schenker XMG Core 15 Ampere R7 4800H, GeForce RTX 3060 Laptop GPU, Samsung SSD 970 EVO Plus 1TB, IPS, 2560x1440, 15.6" | Genomsnitt NVIDIA GeForce RTX 3060 Laptop GPU | Genomsnitt av klass Gaming | |
|---|---|---|---|---|---|---|---|
| Power Consumption | -2% | -8% | -26% | -17% | -21% | -43% | |
| Idle Minimum * (Watt) | 7.3 | 8.8 -21% | 9.5 -30% | 11 -51% | 11 -51% | 10.4 ? -42% | 12.8 ? -75% |
| Idle Average * (Watt) | 10.5 | 13 -24% | 12.1 -15% | 14 -33% | 14 -33% | 14.5 ? -38% | 18.5 ? -76% |
| Idle Maximum * (Watt) | 15.7 | 14.6 7% | 22.5 -43% | 25 -59% | 20 -27% | 21.4 ? -36% | 24 ? -53% |
| Load Average * (Watt) | 108 | 133 -23% | 99.5 8% | 123 -14% | 94 13% | 109.3 ? -1% | 108.2 ? -0% |
| Witcher 3 ultra * (Watt) | 175 | 134 23% | 157 10% | 176 -1% | 167 5% | ||
| Load Maximum * (Watt) | 228 | 164 28% | 173.5 24% | 226 1% | 251 -10% | 206 ? 10% | 254 ? -11% |
* ... mindre är bättre
Energiförbrukning: Witcher 3 - Stress-test
| Lenovo Legion 5 15ACH-82JU00C6GE-FL R7 5800H, GeForce RTX 3060 Laptop GPU, 80 Wh | Acer Nitro 5 AN515-45-R1JH R7 5800H, GeForce RTX 3070 Laptop GPU, 57.5 Wh | Asus TUF Gaming F15 FX506HM i7-11800H, GeForce RTX 3060 Laptop GPU, 90 Wh | Alienware m15 R5 Ryzen Edition R7 5800H, GeForce RTX 3060 Laptop GPU, 86 Wh | Schenker XMG Core 15 Ampere R7 4800H, GeForce RTX 3060 Laptop GPU, 62 Wh | Genomsnitt av klass Gaming | |
|---|---|---|---|---|---|---|
| Batteridrifttid | 12% | 38% | 20% | 9% | 46% | |
| H.264 (h) | 4.3 | 6.9 60% | 8.8 105% | 6 40% | 8.9 ? 107% | |
| WiFi v1.3 (h) | 4.8 | 5.7 19% | 7.9 65% | 5.1 6% | 5.8 21% | 7.09 ? 48% |
| Load (h) | 1.8 | 1 -44% | 2 11% | 0.9 -50% | 1.2 -33% | 1.51 ? -16% |
| Reader / Idle (h) | 9.2 | 11 | 14.7 | 7.8 | 8.71 ? | |
| Witcher 3 ultra (h) | 1.6 |
För
Emot
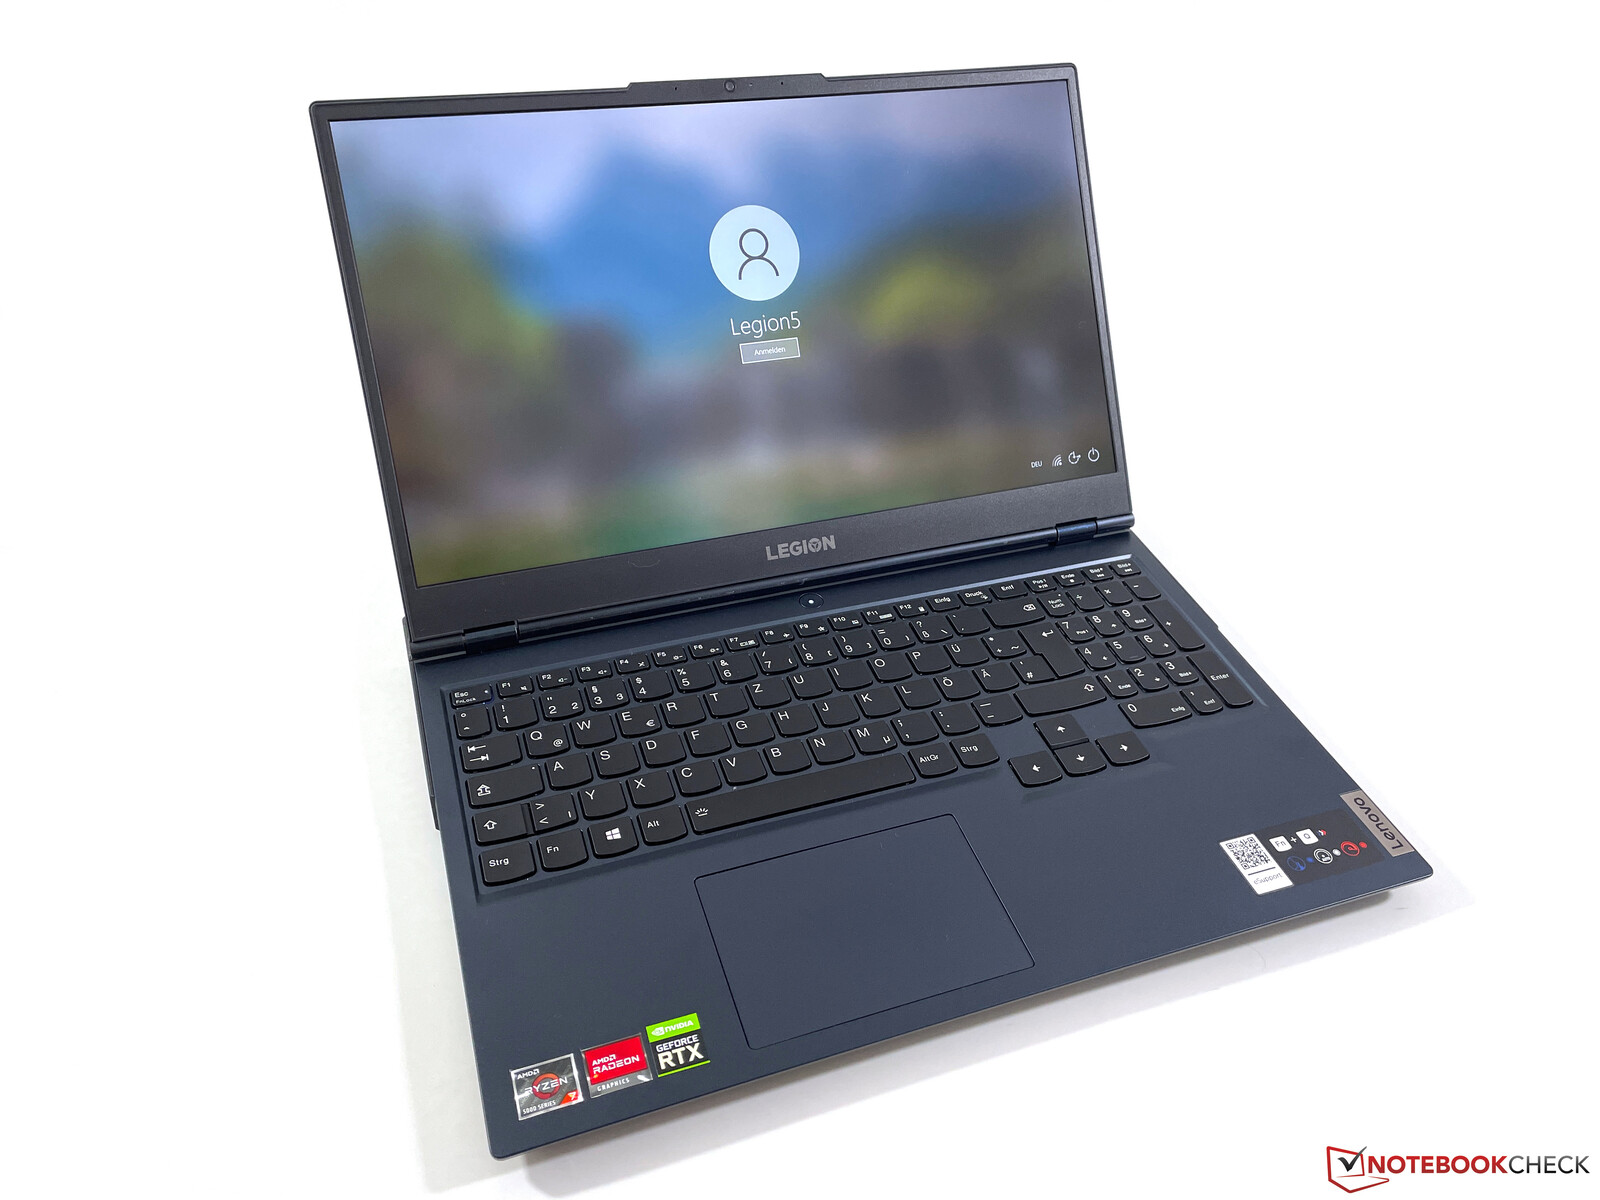
Omdöme - Legion 5 15 övertygar med bra skärm och hög prestanda
Läs den fullständiga versionen av den här recensionen på engelska här.
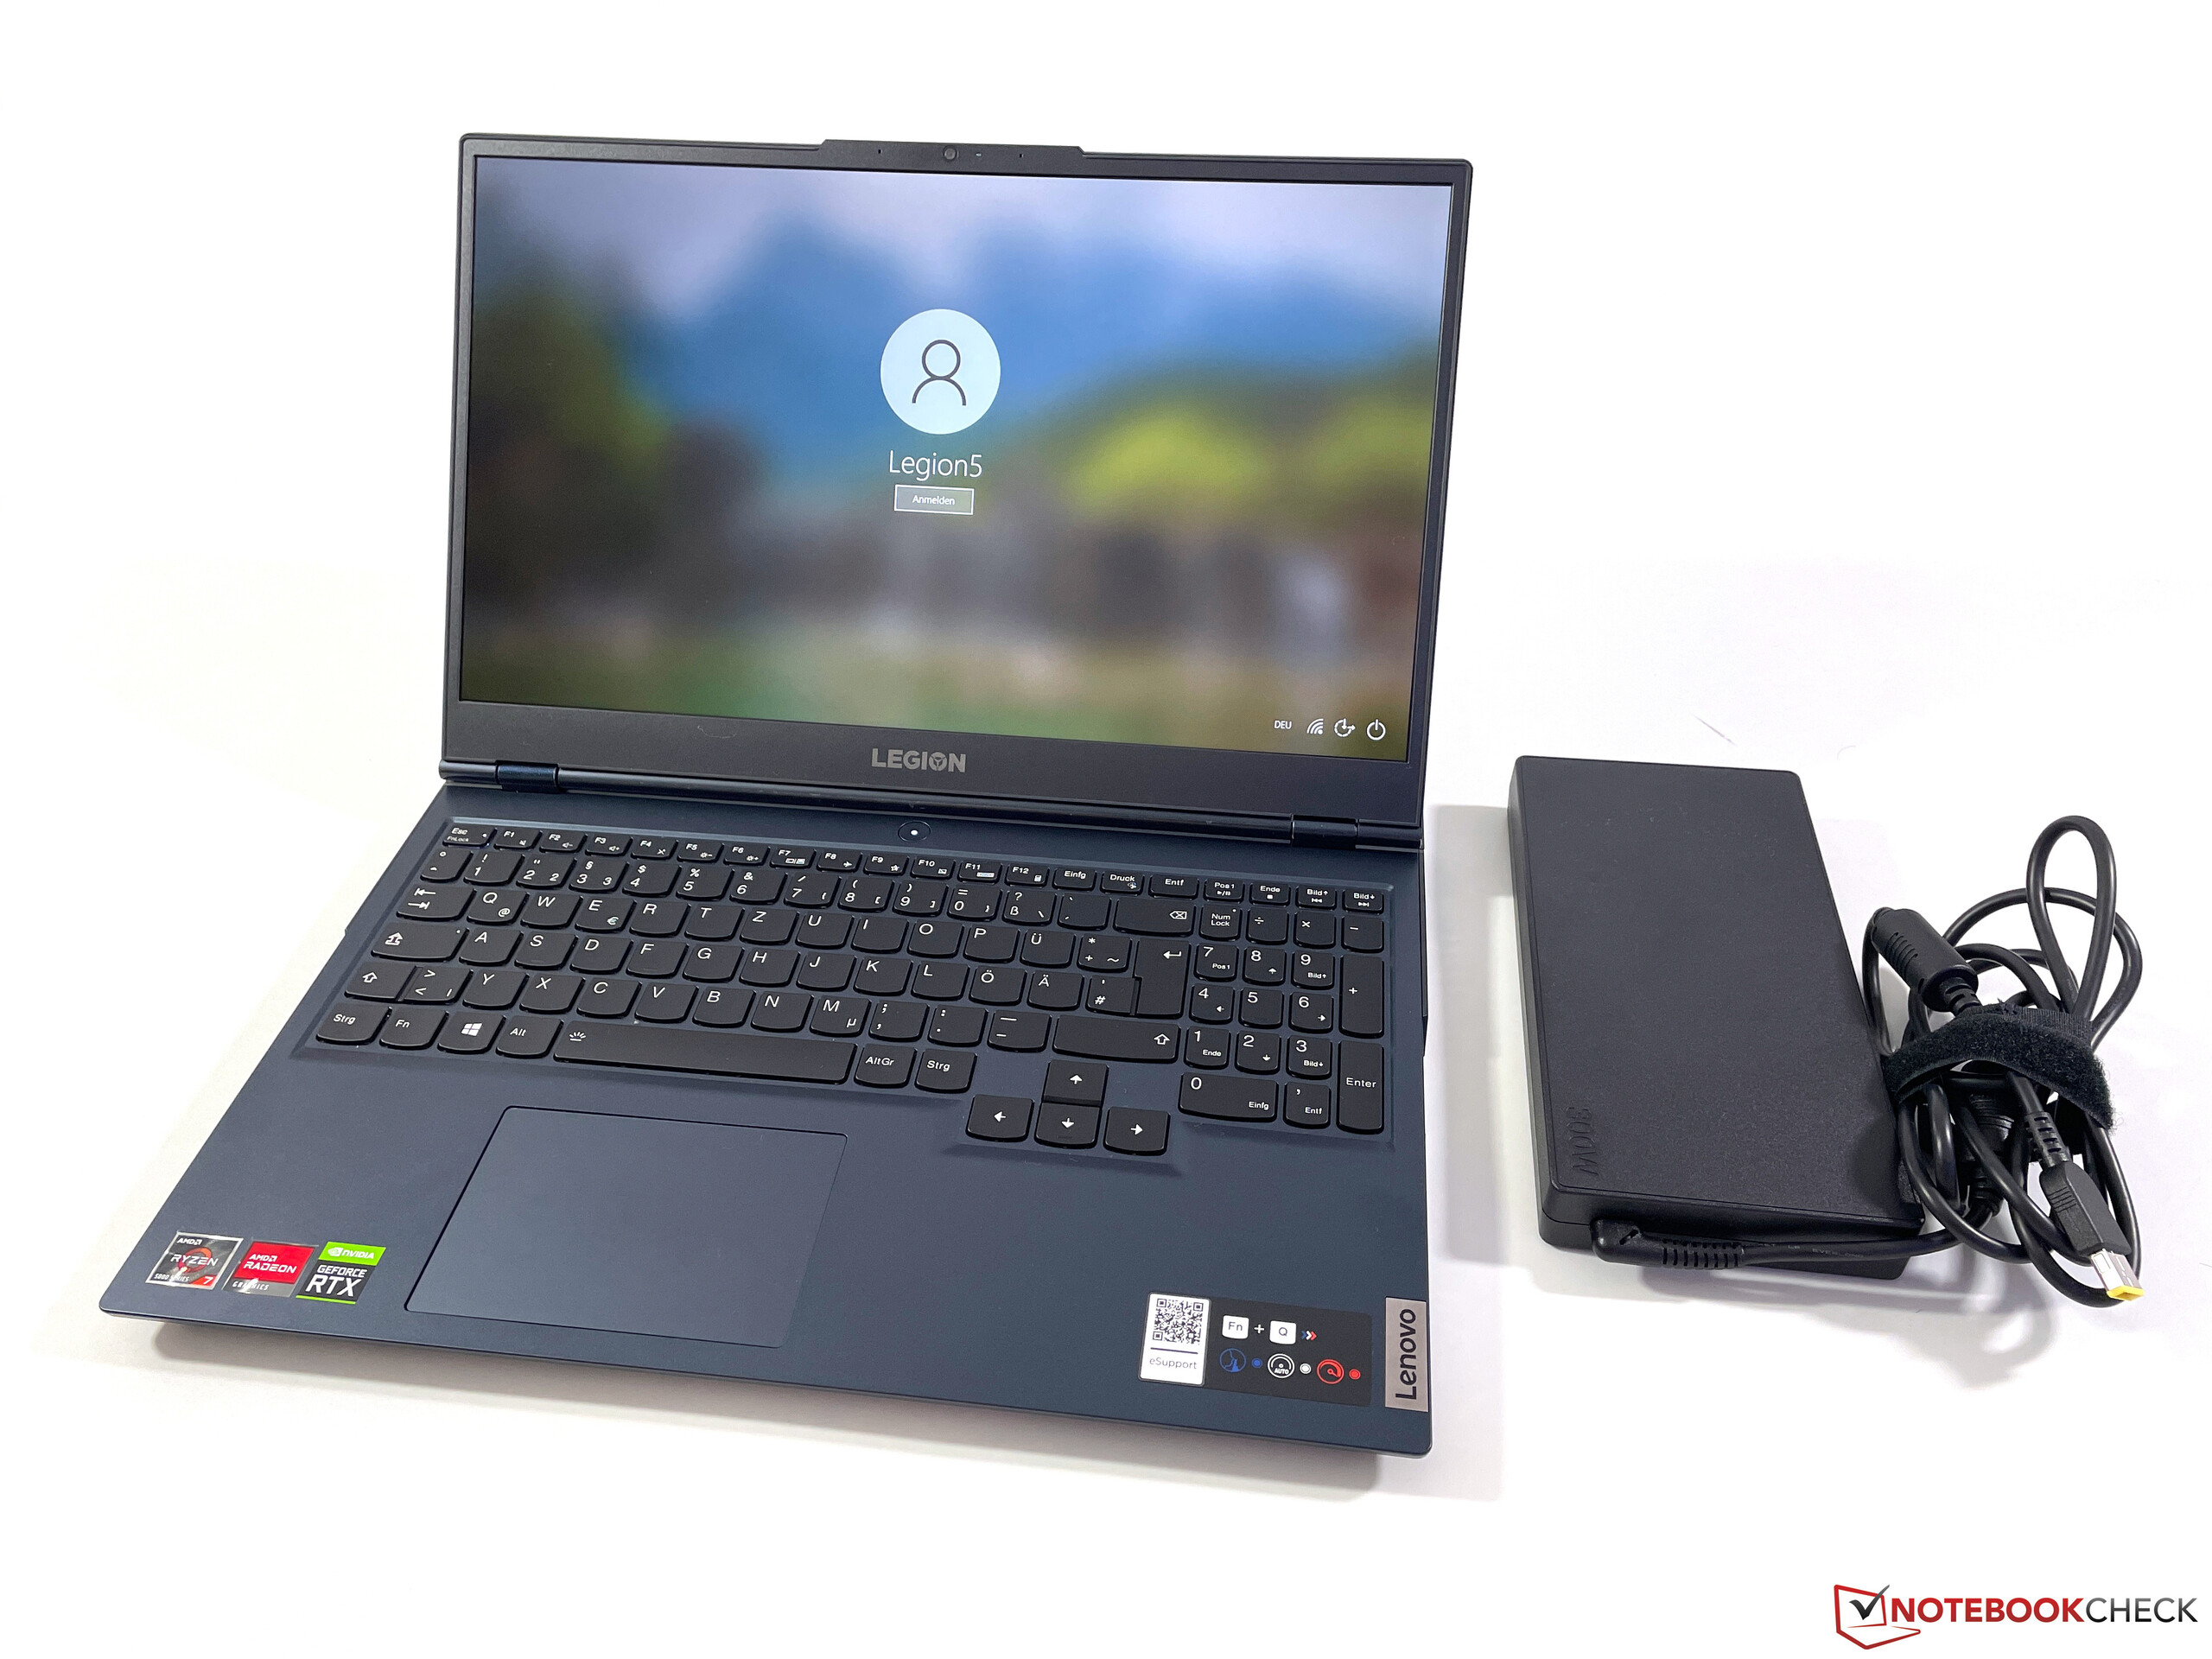
Nya Legion 5 15 Gen.6 är även den här gången en bra spellaptop med kraftfulla komponenter och ett jämförelsevis lågt pris. Den nya processorn från AMD, en Ryzen 7 5800H, ger rikligt med prestanda och är väldigt effektiv. I kombination med en snabb 130W-version av GeForce RTX 3060 är hög spelprestanda garanterad. Vi gillade också den snabba 165 Hz-skärmen med 1080p upplösning.
Den automatiska grafikbytesfunktionen gav vissa problem med ryckighet, vilket var riktigt irriterande. Om du inte behöver lång batteritid bör du verkligen stänga av hybridgrafiksläget i Lenovos Vantage-program. Lenovo har också extra energi-inställningar som känns logiska och det går snabbt att byta mellan dem, men vi hade gärna sett att fläktarna stängdes av ibland, åtminstone i Eco-läget. Legion 5 15 är aldrig tyst.
Legion 5 15 Gen.6 fokuserar på speldatorns kärnkomponenter och har rejäl prestanda samt en snabb 165 Hz-skärm. Problemen med den automatiska grafikbytesfunktionen är dock irriterande och borde lösas så snart som möjligt.
Jämfört med de närmaste rivalerna, som Acer Nitro 5 eller Asus TUF Gaming F15, står Legion i huvudsak ut på grund av sitt kraftfulla grafikkort. Det finns ingen avancerad belysning som på Alienware m15, men Lenovos laptop är i gengäld billigare.
Lenovo Legion 5 15ACH-82JU00C6GE-FL
- 09/06/2021 v7 (old)
Andreas Osthoff
Price comparison
