Recension av den bärbara datorn Asus TUF Gaming F15 FX507ZM: Maxad GeForce RTX 3060-prestanda
Asus har uppdaterat sin TUF Gaming F15-serie för 2022 nu när Intel 12th gen CPU-serien är allmänt tillgänglig. Istället för ett enkelt CPU-byte har tillverkaren dock uppdaterat betydande aspekter av förra årets FX506-chassi för att skapa FX507. Den här recensionen kommer att gå igenom alla de viktigaste skillnaderna mellan 2021 FX506 och 2022 FX507 samt vilka prestandanivåer användarna kan förvänta sig av FX507.
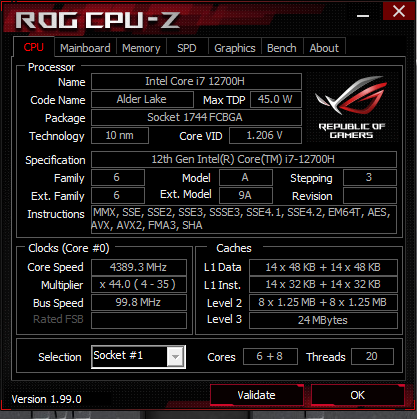
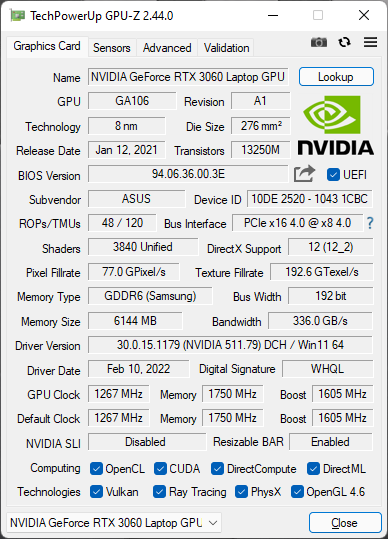
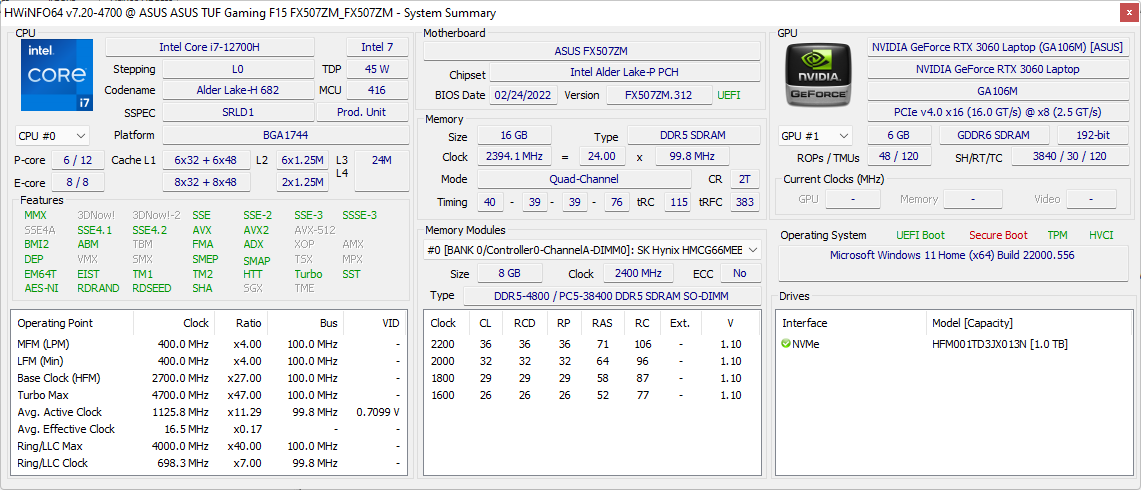
Vår konfiguration i recensionen kommer med Alder Lake-H Core i7-12700H CPU, GeForce RTX 3060 GPU, 300 Hz 1080p IPS-panel och 90 Wh-batteri för cirka 1 500 USD i detaljhandeln. Andra SKU:er med lägre uppdateringsfrekvens för skärmen, mindre batteri på 56 Wh och långsammare CPU-alternativ kan finnas tillgängliga. Observera att även om FX507 levereras med samma GeForce RTX 3060 GPU som i den äldre FX506, så är GPU:n i den nyare modellen inriktad på en mycket högre TGP för att få ut mer prestanda (140 W jämfört med 95 W).
Konkurrenterna till FX507 är bland annat andra 15,6-tums bärbara datorer för spel med tunn och lätt vikt på 15,6 tum, som t.ex Razer Blade 15 basmodell, MSI GP66, Acer Predator Tritoneller Gigabyte Aorus 5-serien.
Fler recensioner av Asus:
Jämförelse av potentiella konkurrenter
Gradering | Datum | Modell | Vikt | Höjd | Storlek | Upplösning | Pris |
|---|---|---|---|---|---|---|---|
| 87.2 % v7 (old) | 03/2022 | Asus TUF Gaming F15 FX507ZM i7-12700H, GeForce RTX 3060 Laptop GPU | 2.1 kg | 24.95 mm | 15.60" | 1920x1080 | |
| 85.9 % v7 (old) | 10/2021 | Asus TUF Gaming F15 FX506HM i7-11800H, GeForce RTX 3060 Laptop GPU | 2.3 kg | 24.9 mm | 15.60" | 1920x1080 | |
| 82.4 % v7 (old) | 02/2021 | Asus TUF Dash F15 FX516PR i7-11370H, GeForce RTX 3070 Laptop GPU | 2 kg | 20 mm | 15.60" | 1920x1080 | |
| 86.3 % v7 (old) | 09/2021 | Asus ROG Strix Scar 15 G533QS R9 5900HX, GeForce RTX 3080 Laptop GPU | 2.3 kg | 27.2 mm | 15.60" | 2560x1440 | |
| 82.9 % v7 (old) | Asus Zephyrus S15 GX502L i7-10875H, GeForce RTX 2070 Super Mobile | 2.1 kg | 19 mm | 15.60" | 1920x1080 | ||
| 85.8 % v7 (old) | 07/2021 | Asus ZenBook Pro Duo UX582 LR-1BH2 i7-10870H, GeForce RTX 3070 Laptop GPU | 2.4 kg | 21.5 mm | 15.60" | 3840x2160 |
Hölje - Mindre och lättare
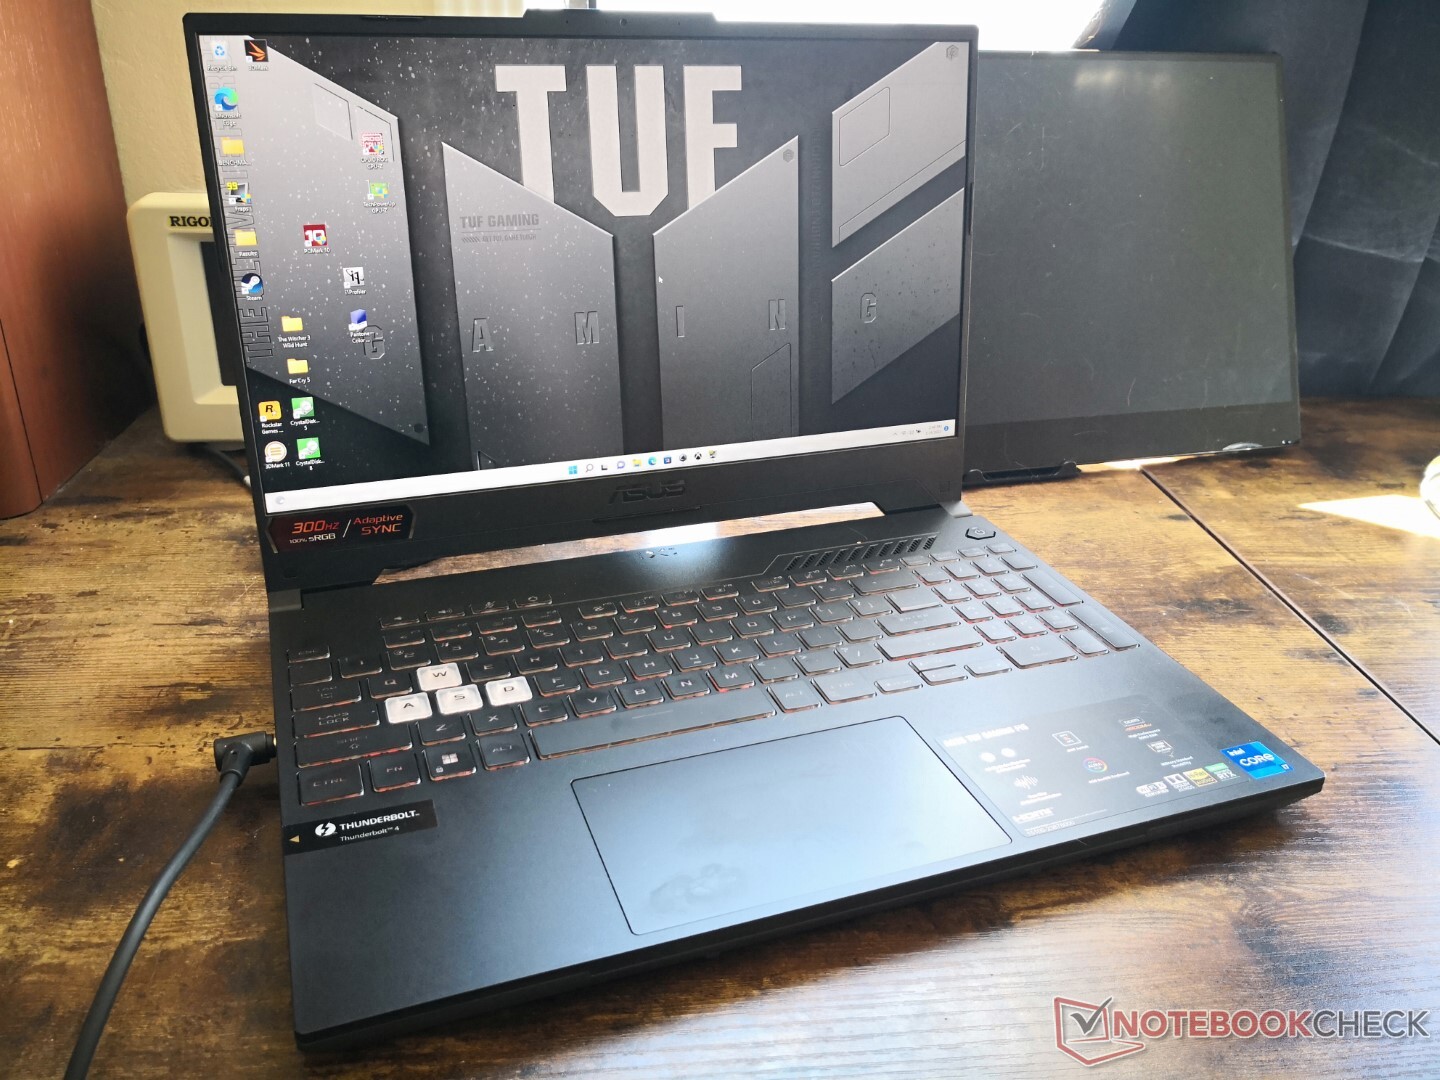
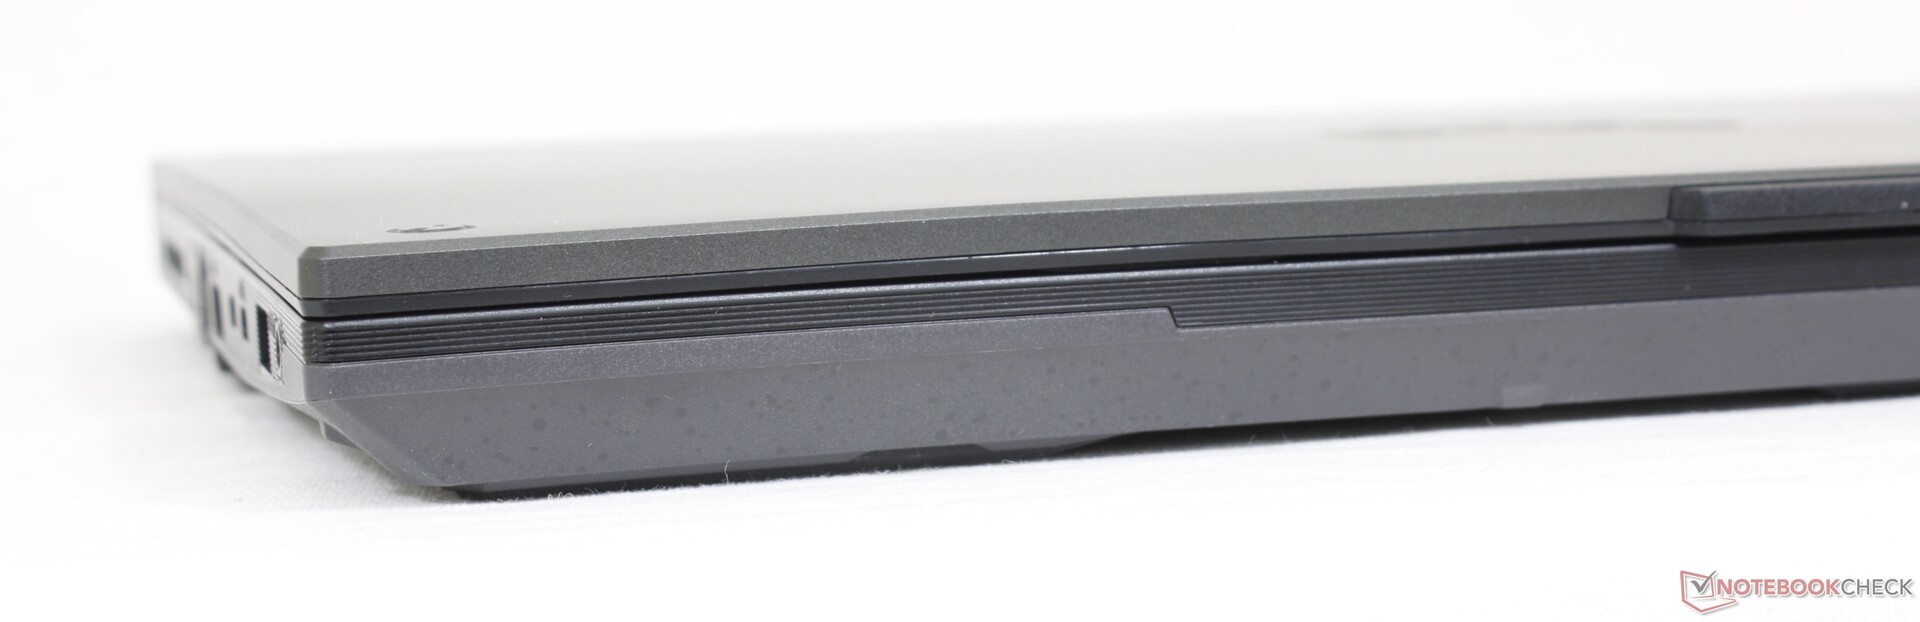
FX507 kan se identisk ut med FX506 vid en första anblick, men det finns faktiskt många små förändringar. Hörnen är till exempel vassare än tidigare, medan de falskt borstade glansiga handflatorna nu har en plattare matt textur. De flesta av stötarna och de alternerande texturerna på FX506 har tagits bort för ett renare och mer minimalistiskt utseende. Chassimaterialen verkar i övrigt vara desamma som förra årets modell för en liknande nivå av styvhet.
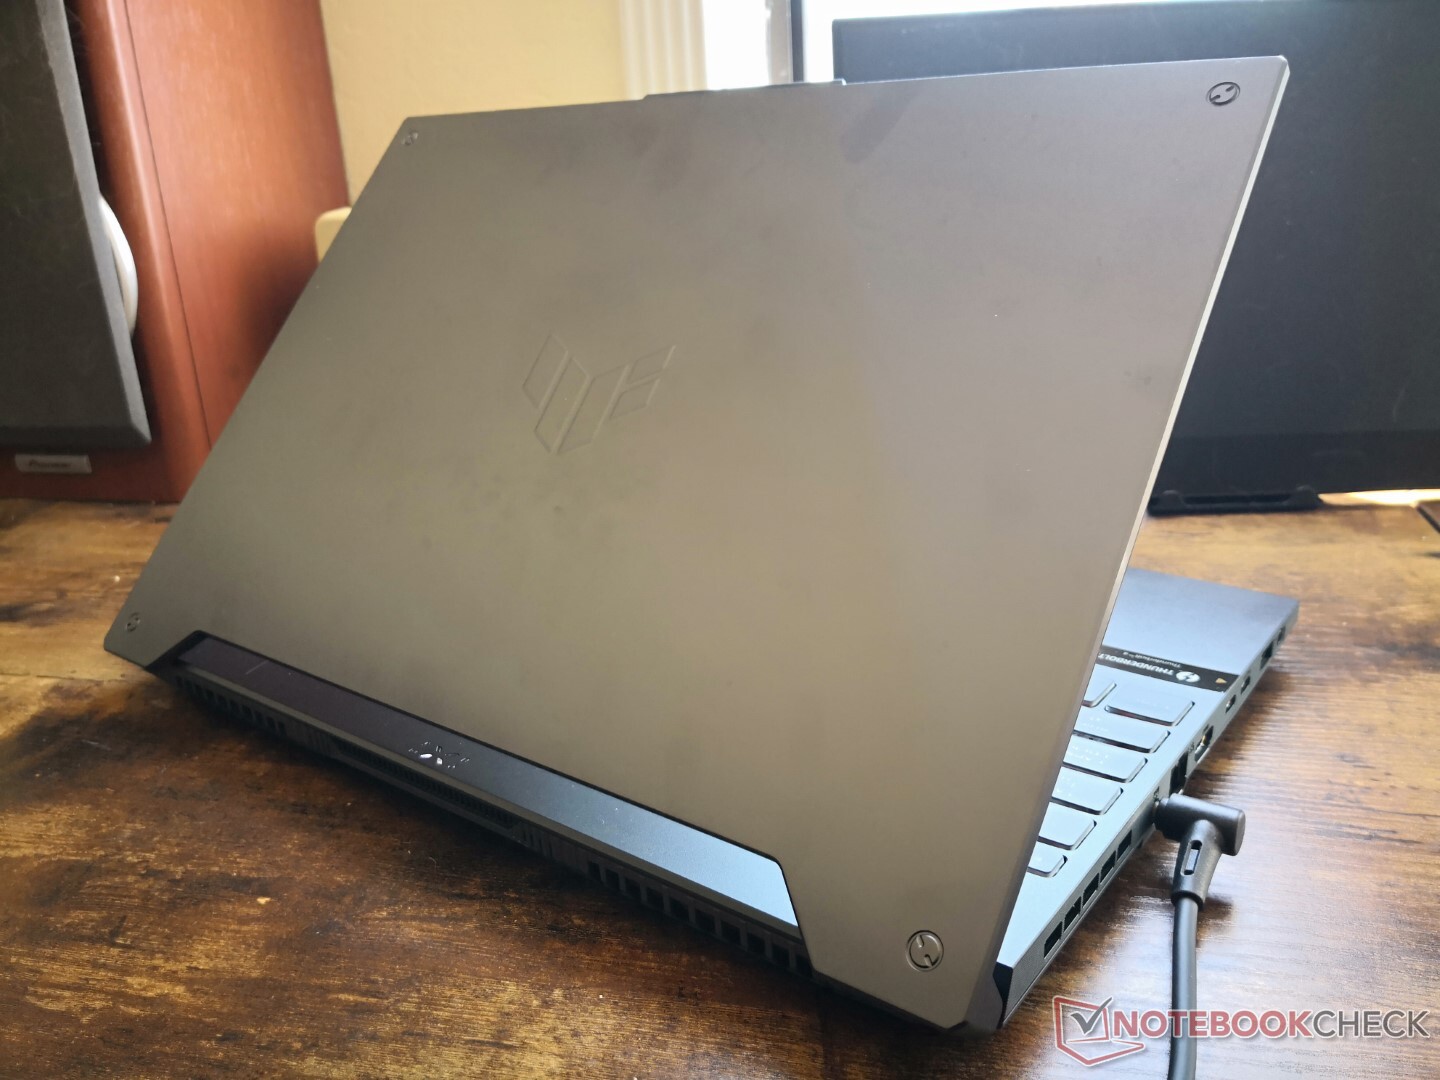
Asus har lyckats minska både storlek och vikt på FX507 jämfört med föregångaren FX506. Den nyare modellen är något kortare (354,9 mm jämfört med 359,8 mm), något smalare (251,9 mm x 256 mm) och en hel del lättare (2,1 kg jämfört med 2,3 kg) för att vara lika lätt som den tunnare Zephyrus S15-designen.
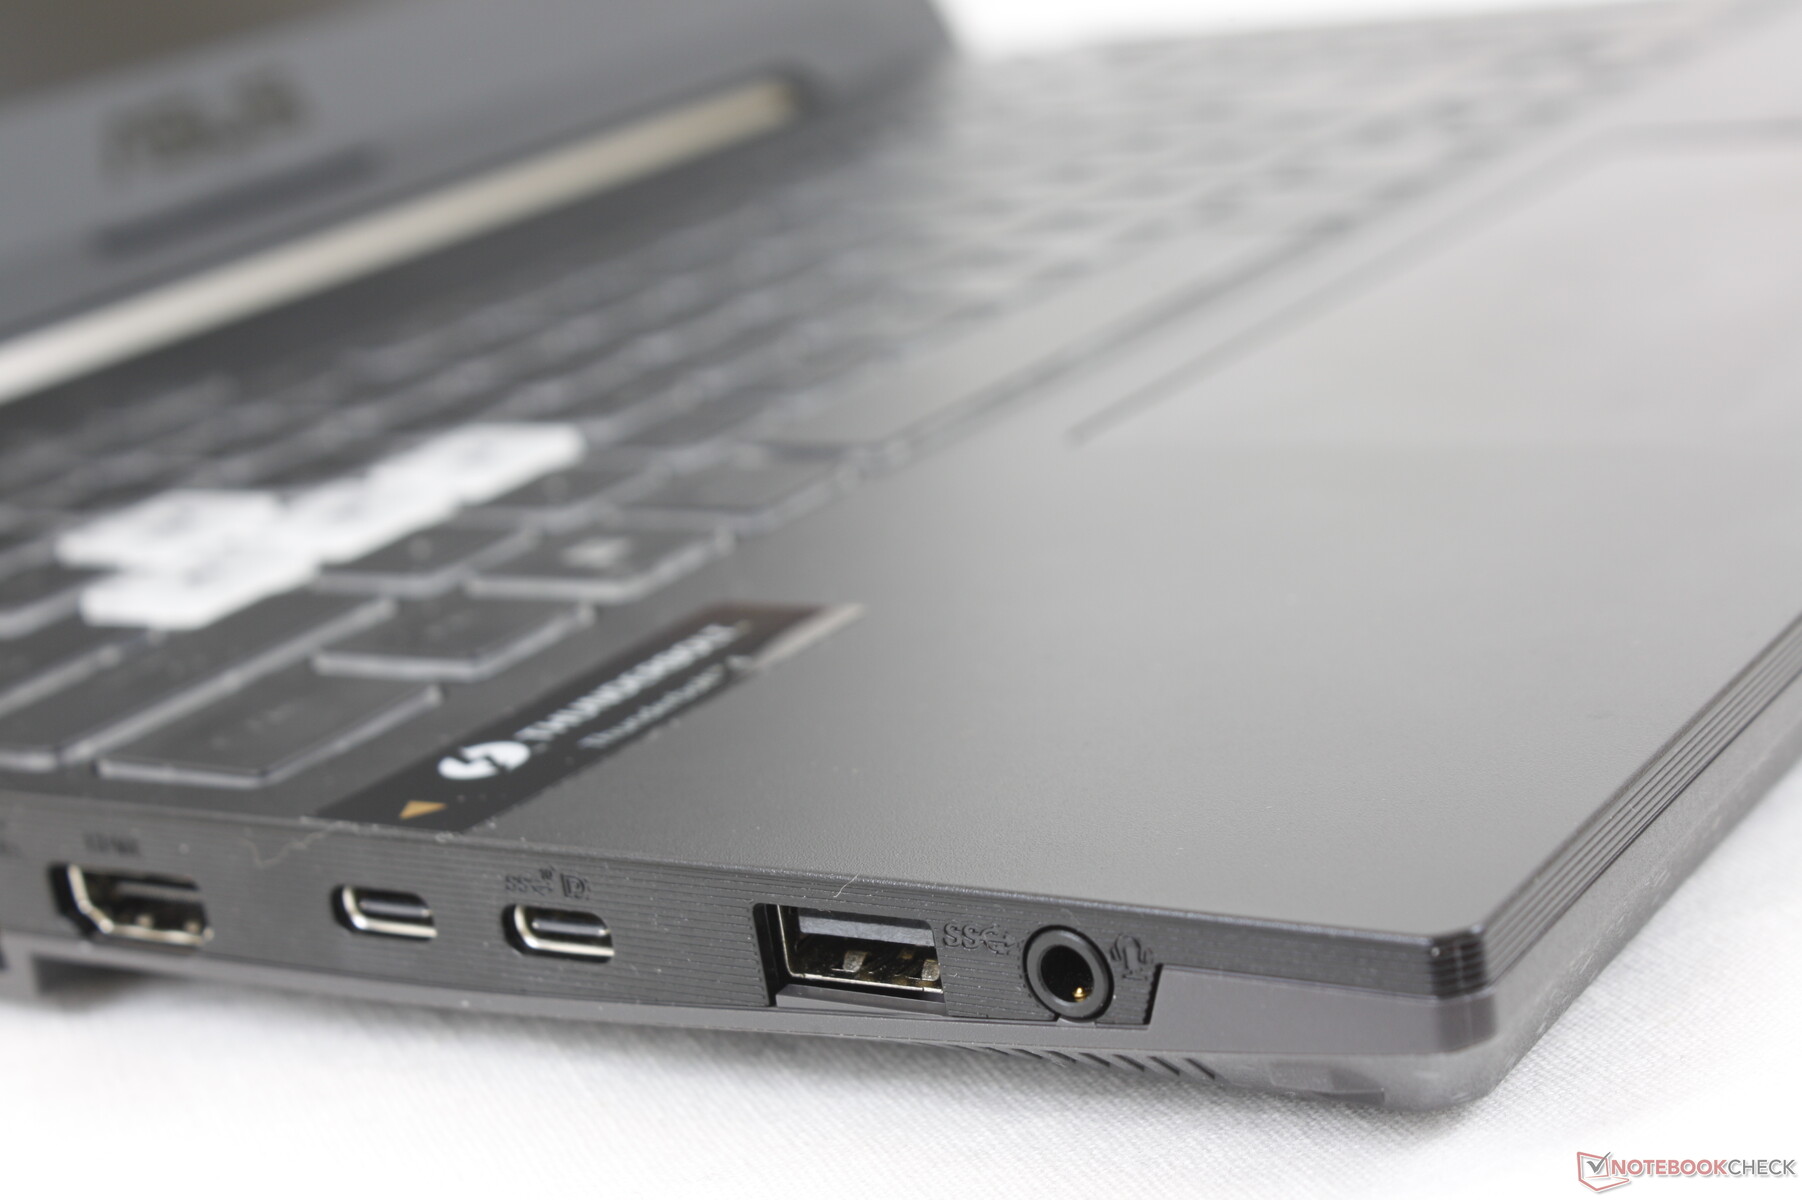
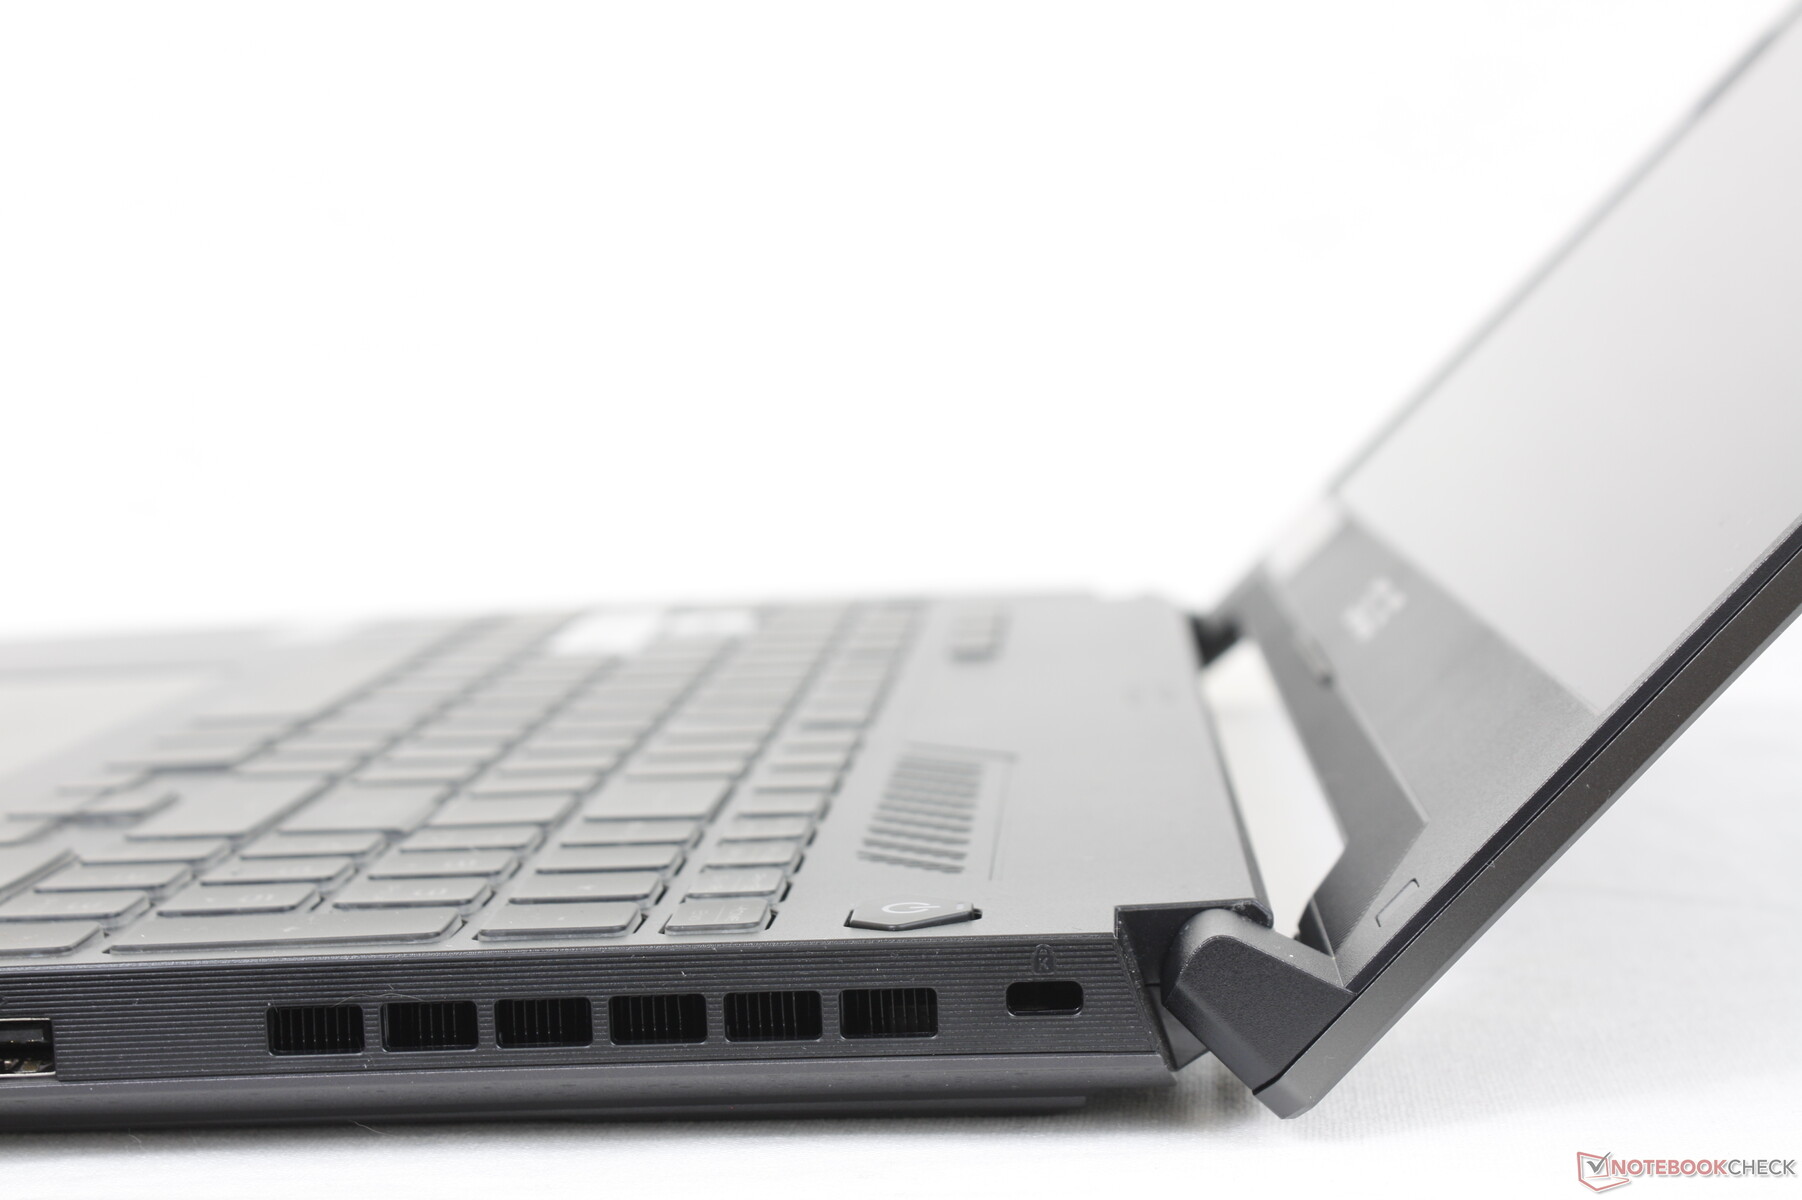
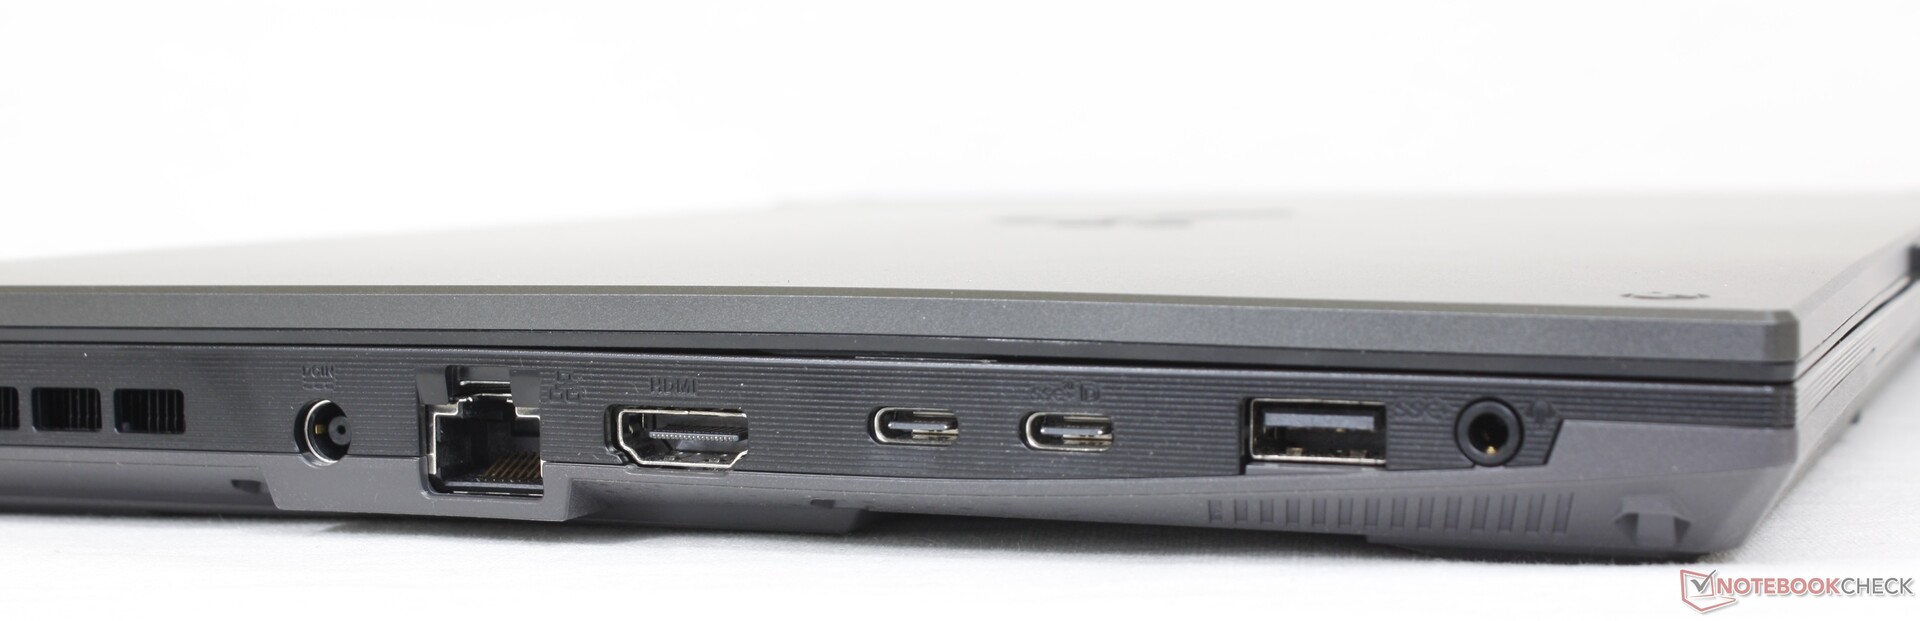
Anslutningsmöjligheter - Ytterligare en USB-C-port
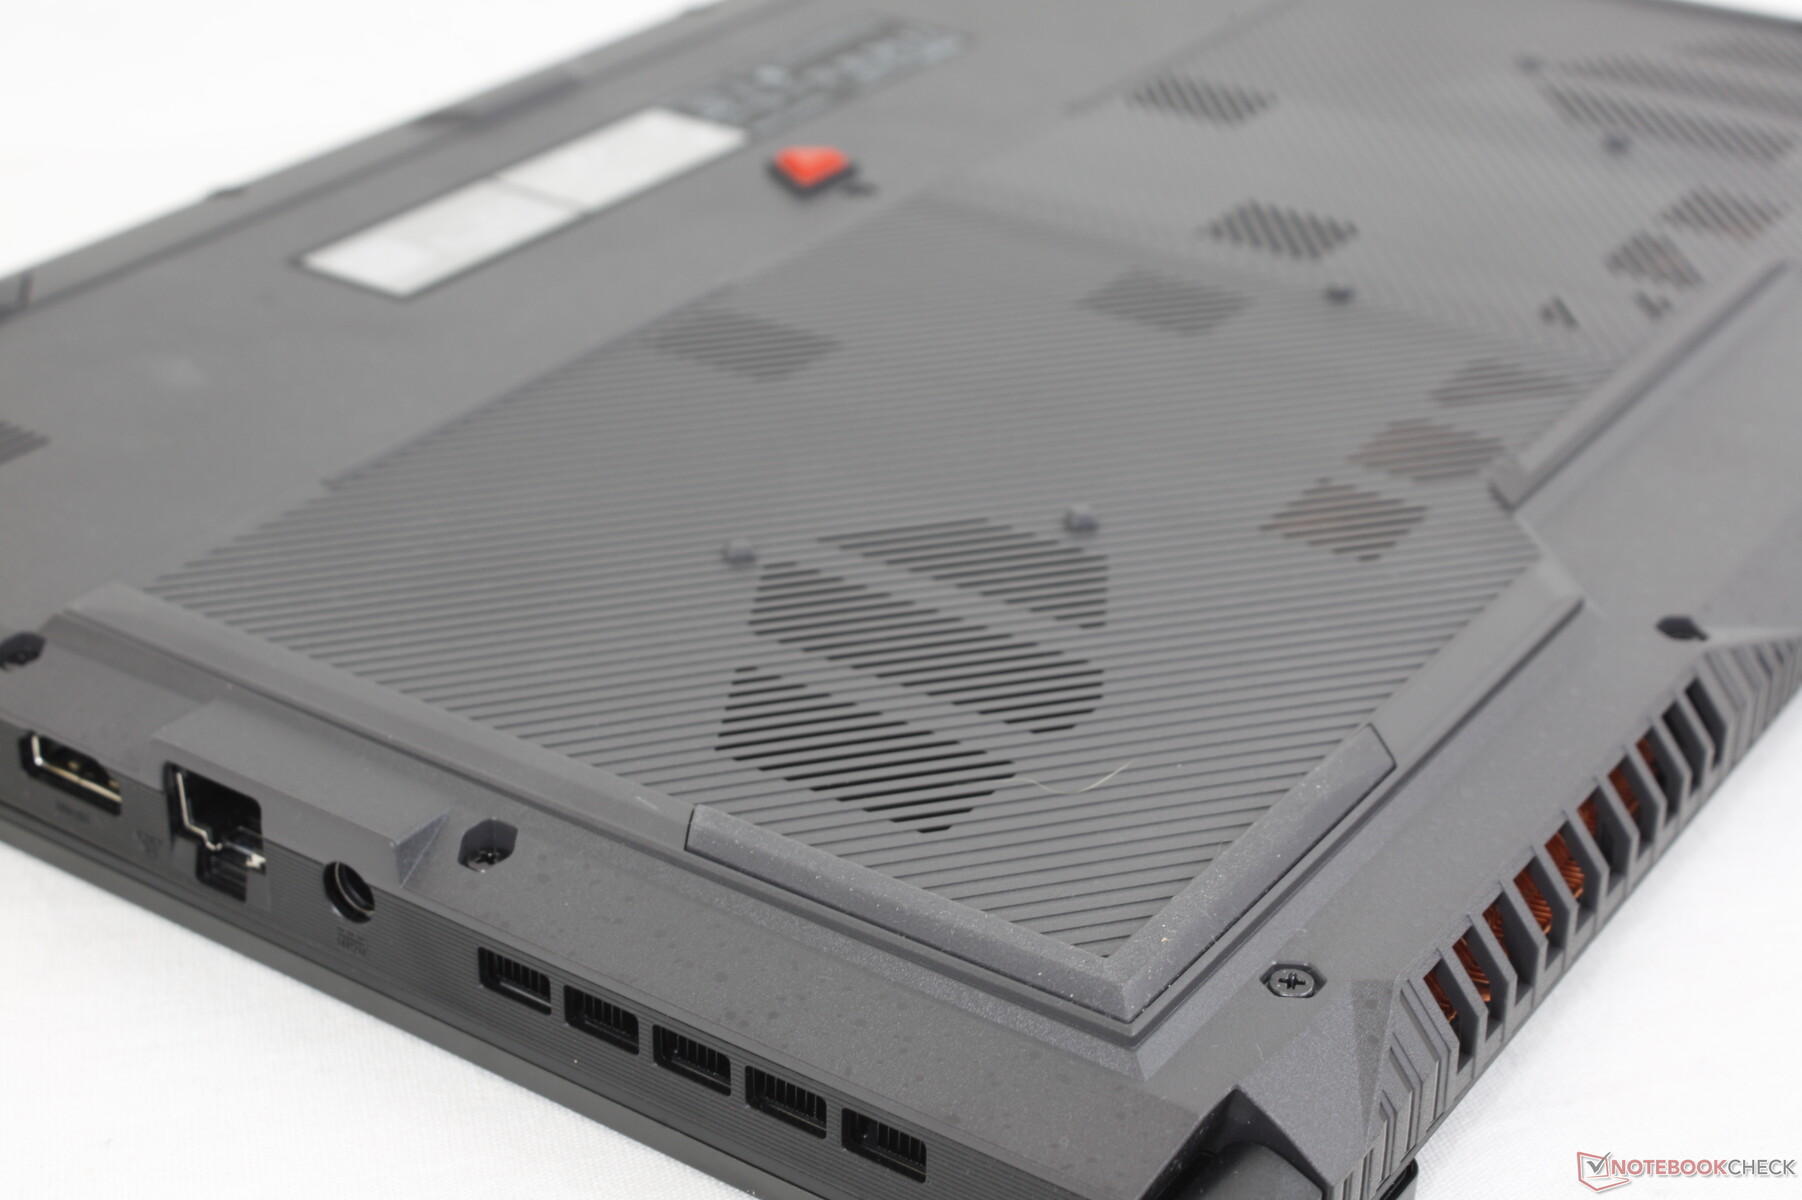
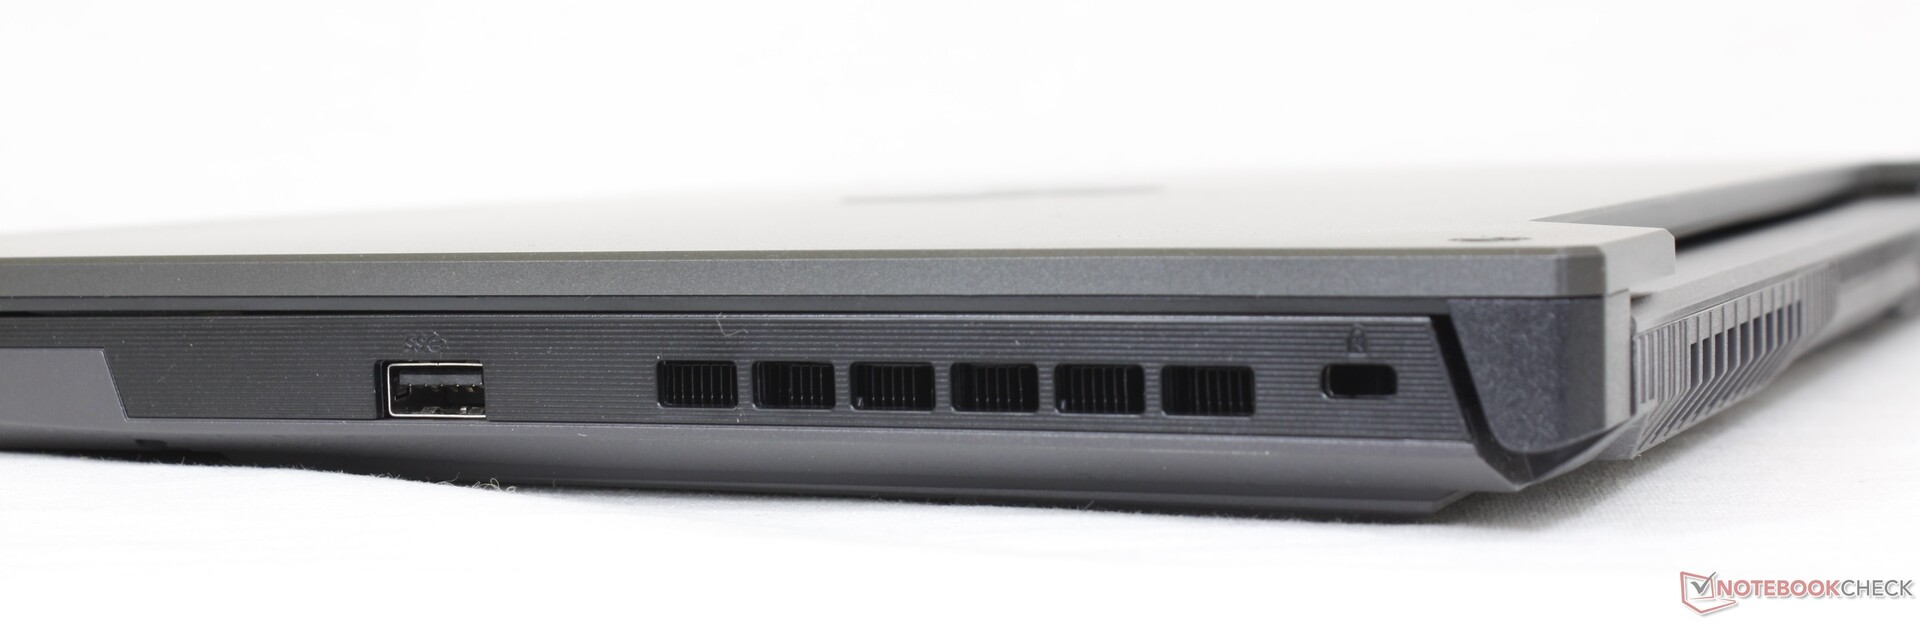
Portalternativen har ändrats något jämfört med FX506. I FX507 har en USB-A-port försvunnit till förmån för en andra USB-C-port. Alla andra portar är annars identiska.
Tänk på att den bärbara datorn måste vara i MSHybrid-läge om du ansluter någon Thunderbolt 4-enhet. Detta är en begränsning för alla bärbara datorer som körs på 12:e generationens Alder Lake-H CPU:er hittills.
Kommunikation
| Networking | |
| iperf3 transmit AX12 | |
| Asus ZenBook Pro Duo UX582 LR-1BH2 | |
| Asus Zephyrus S15 GX502L | |
| Asus TUF Gaming F15 FX507ZM | |
| Asus TUF Dash F15 FX516PR | |
| Asus TUF Gaming F15 FX506HM | |
| Asus ROG Strix Scar 15 G533QS | |
| iperf3 receive AX12 | |
| Asus TUF Gaming F15 FX507ZM | |
| Asus Zephyrus S15 GX502L | |
| Asus TUF Dash F15 FX516PR | |
| Asus ZenBook Pro Duo UX582 LR-1BH2 | |
| Asus TUF Gaming F15 FX506HM | |
| Asus ROG Strix Scar 15 G533QS | |
Webbkamera
Kamerakvaliteten är dålig för 720p-kameran. Det finns inte heller något stöd för integritetsskydd eller Windows Hello.


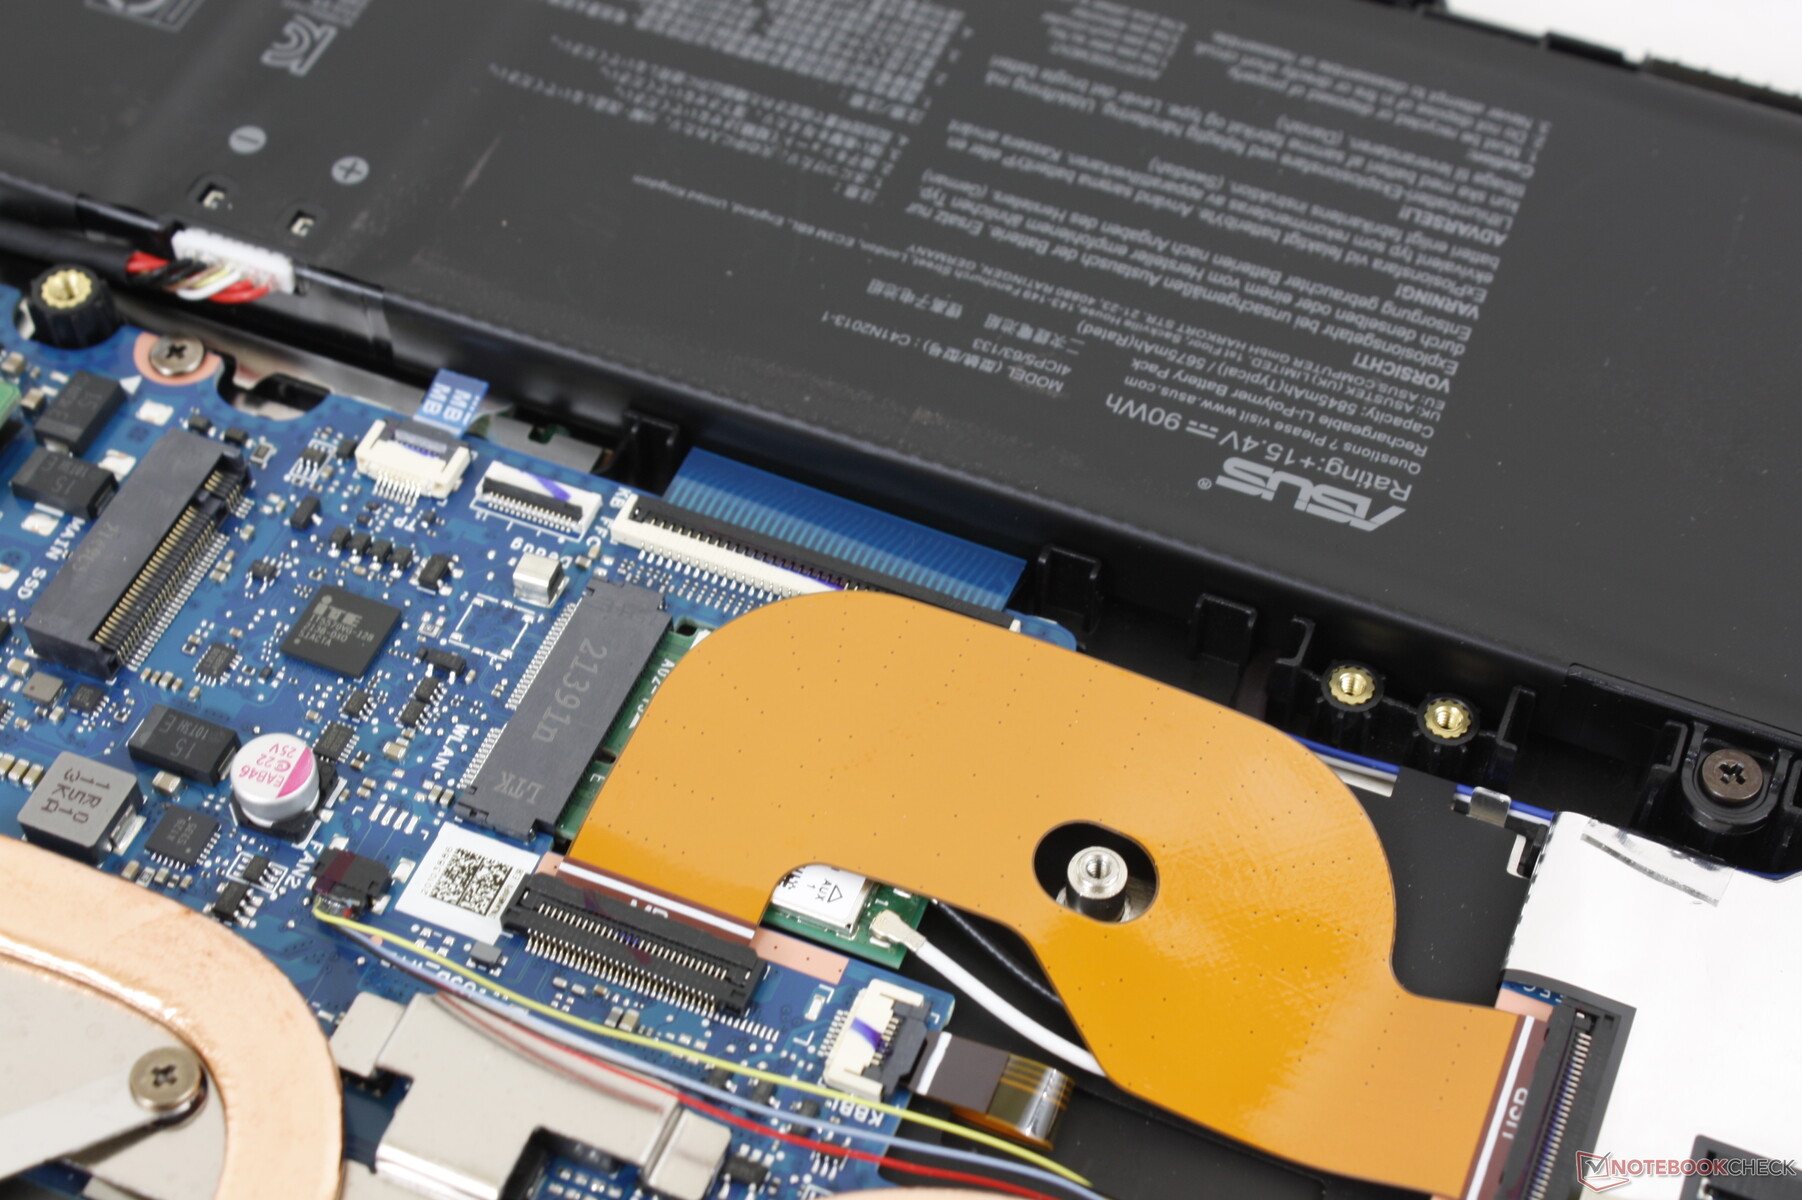
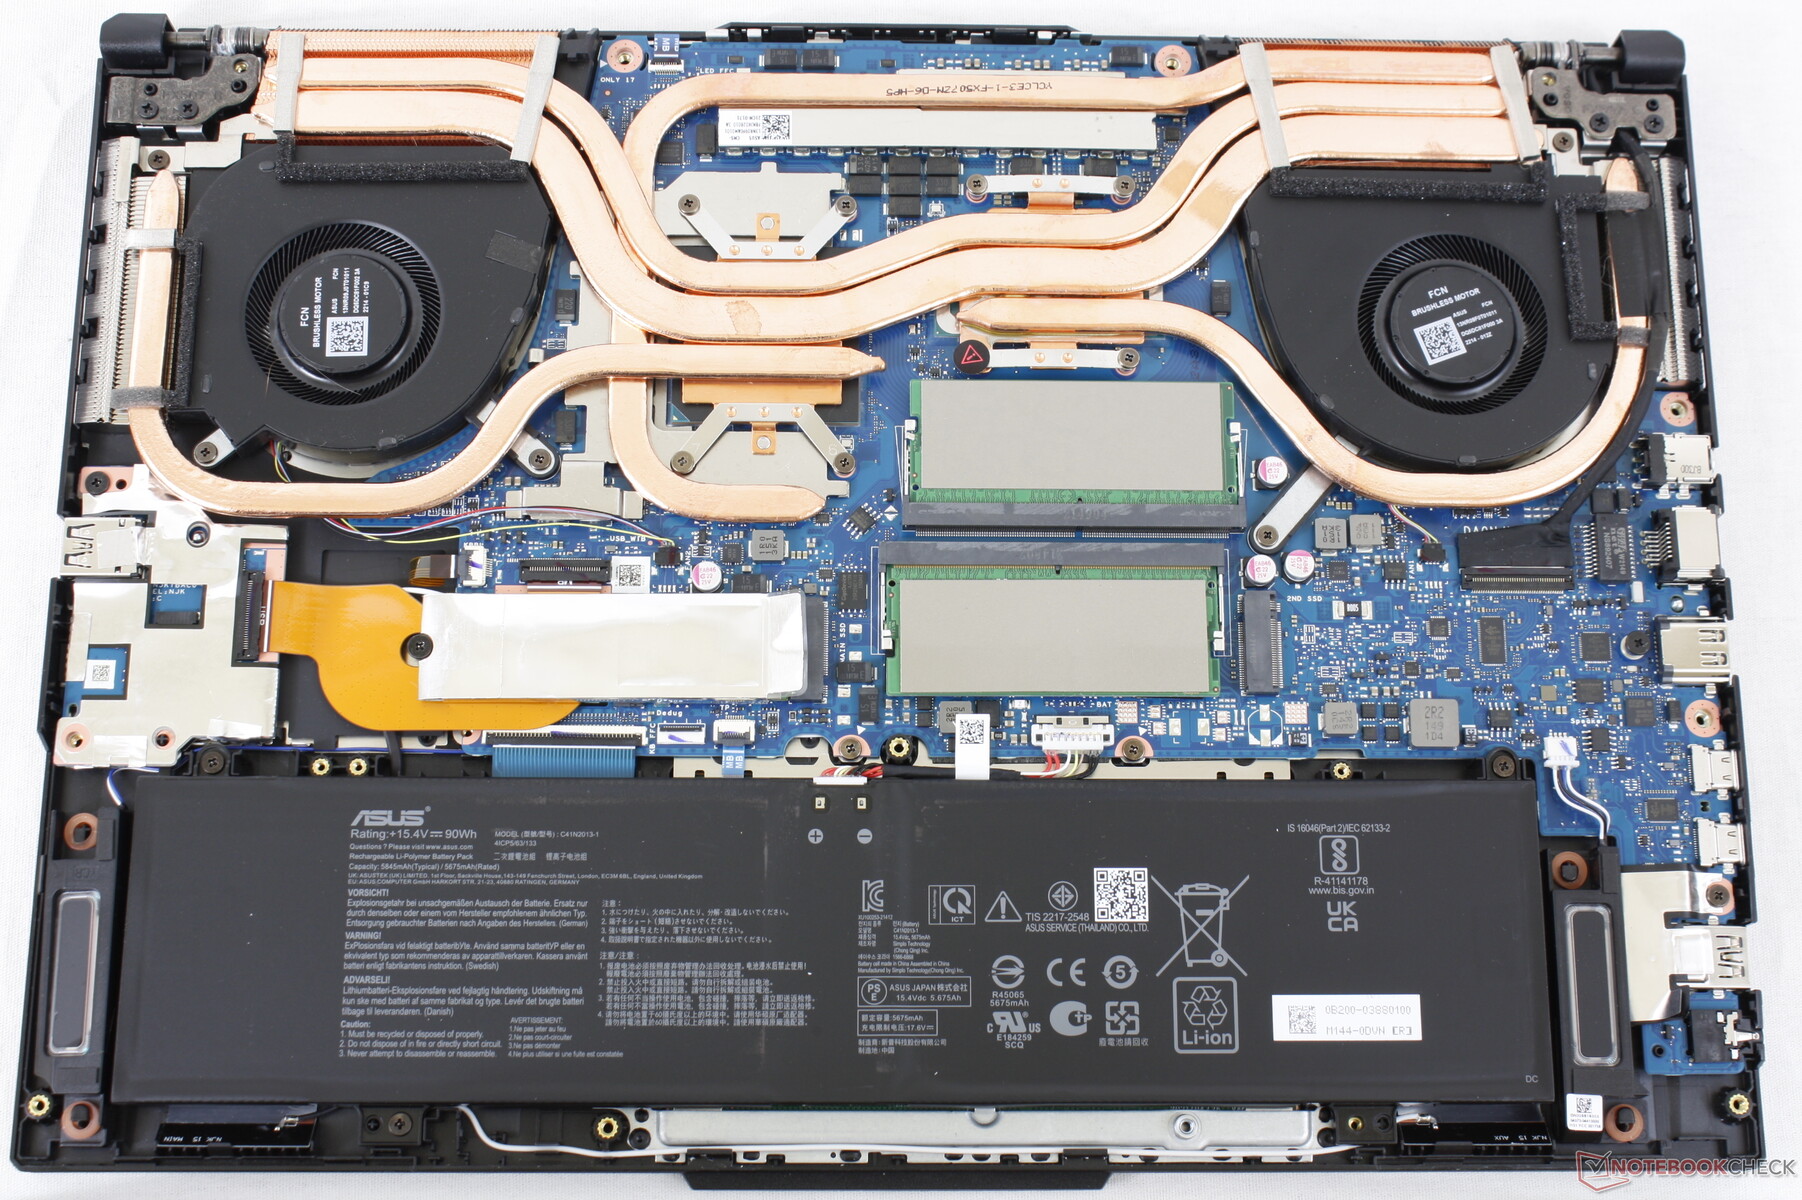
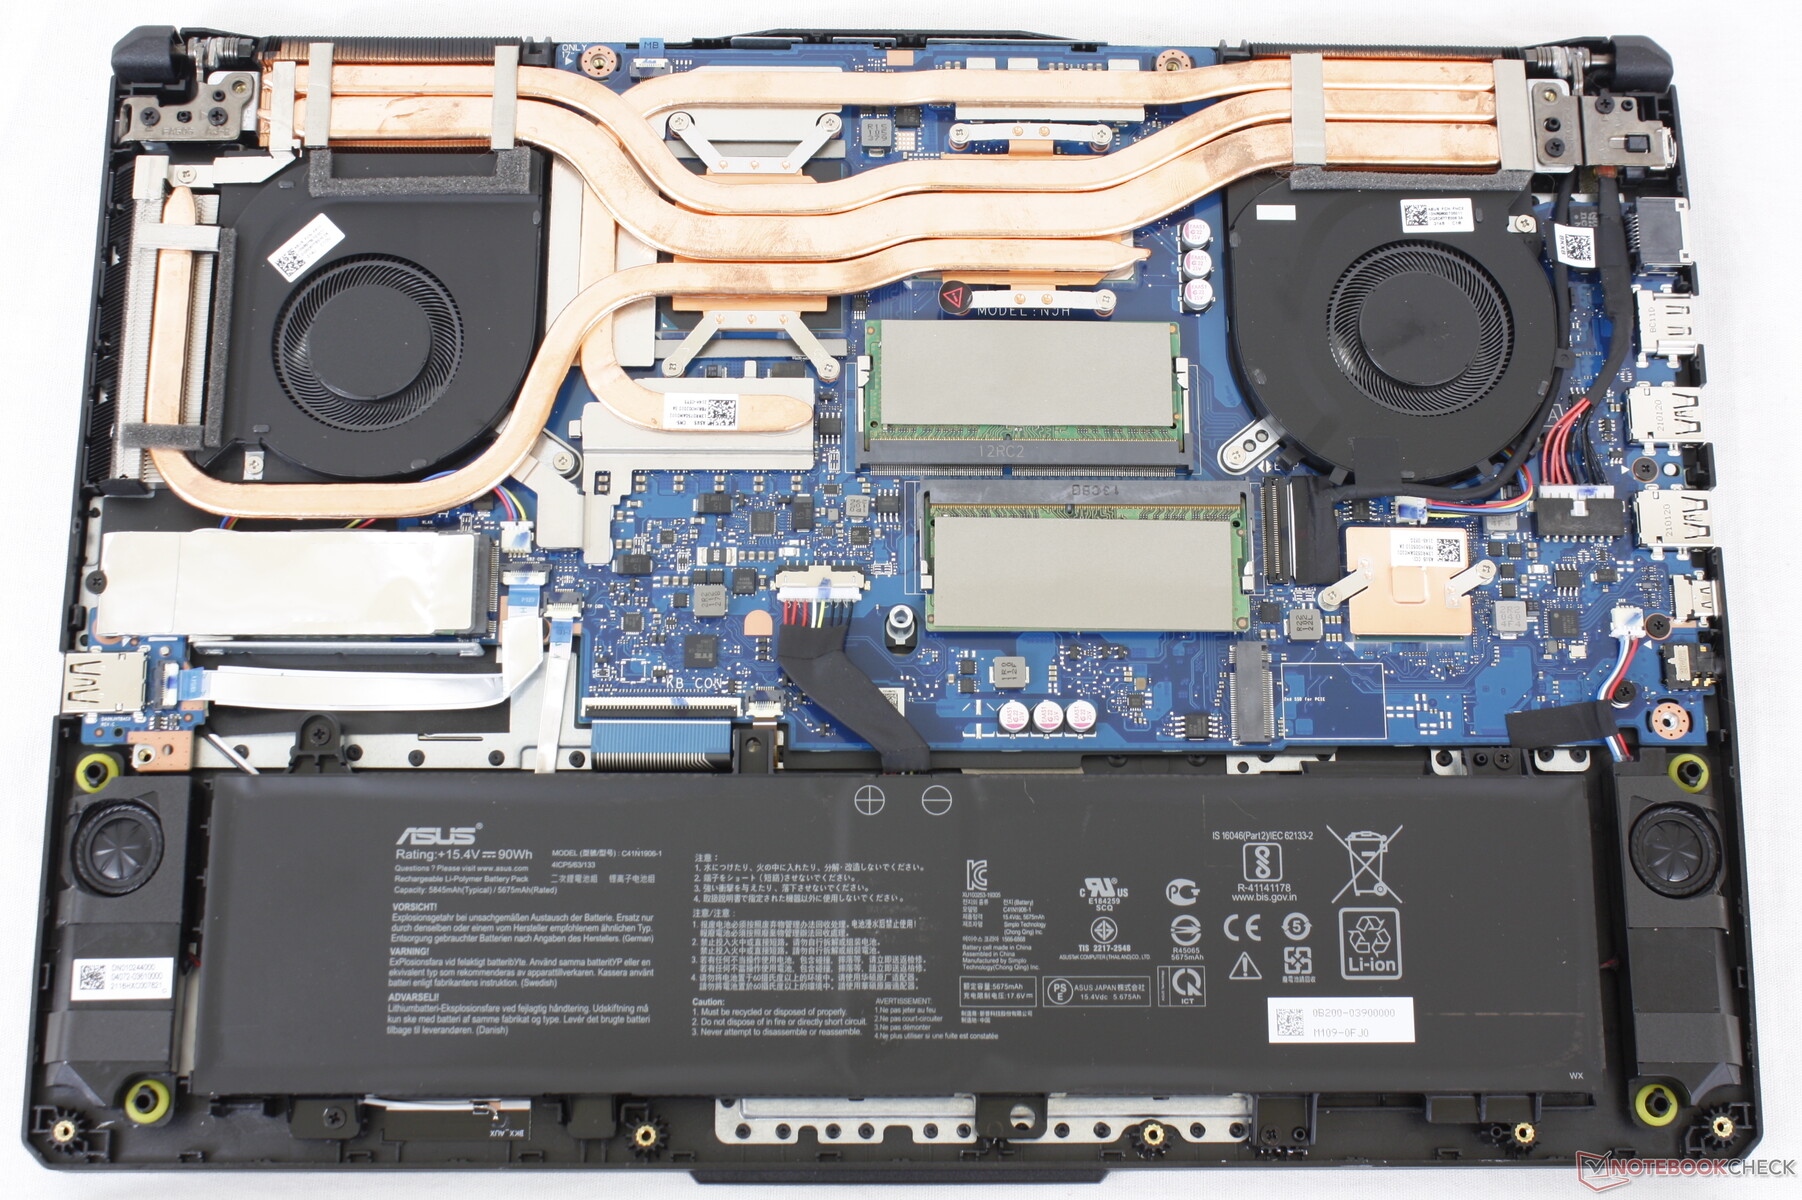
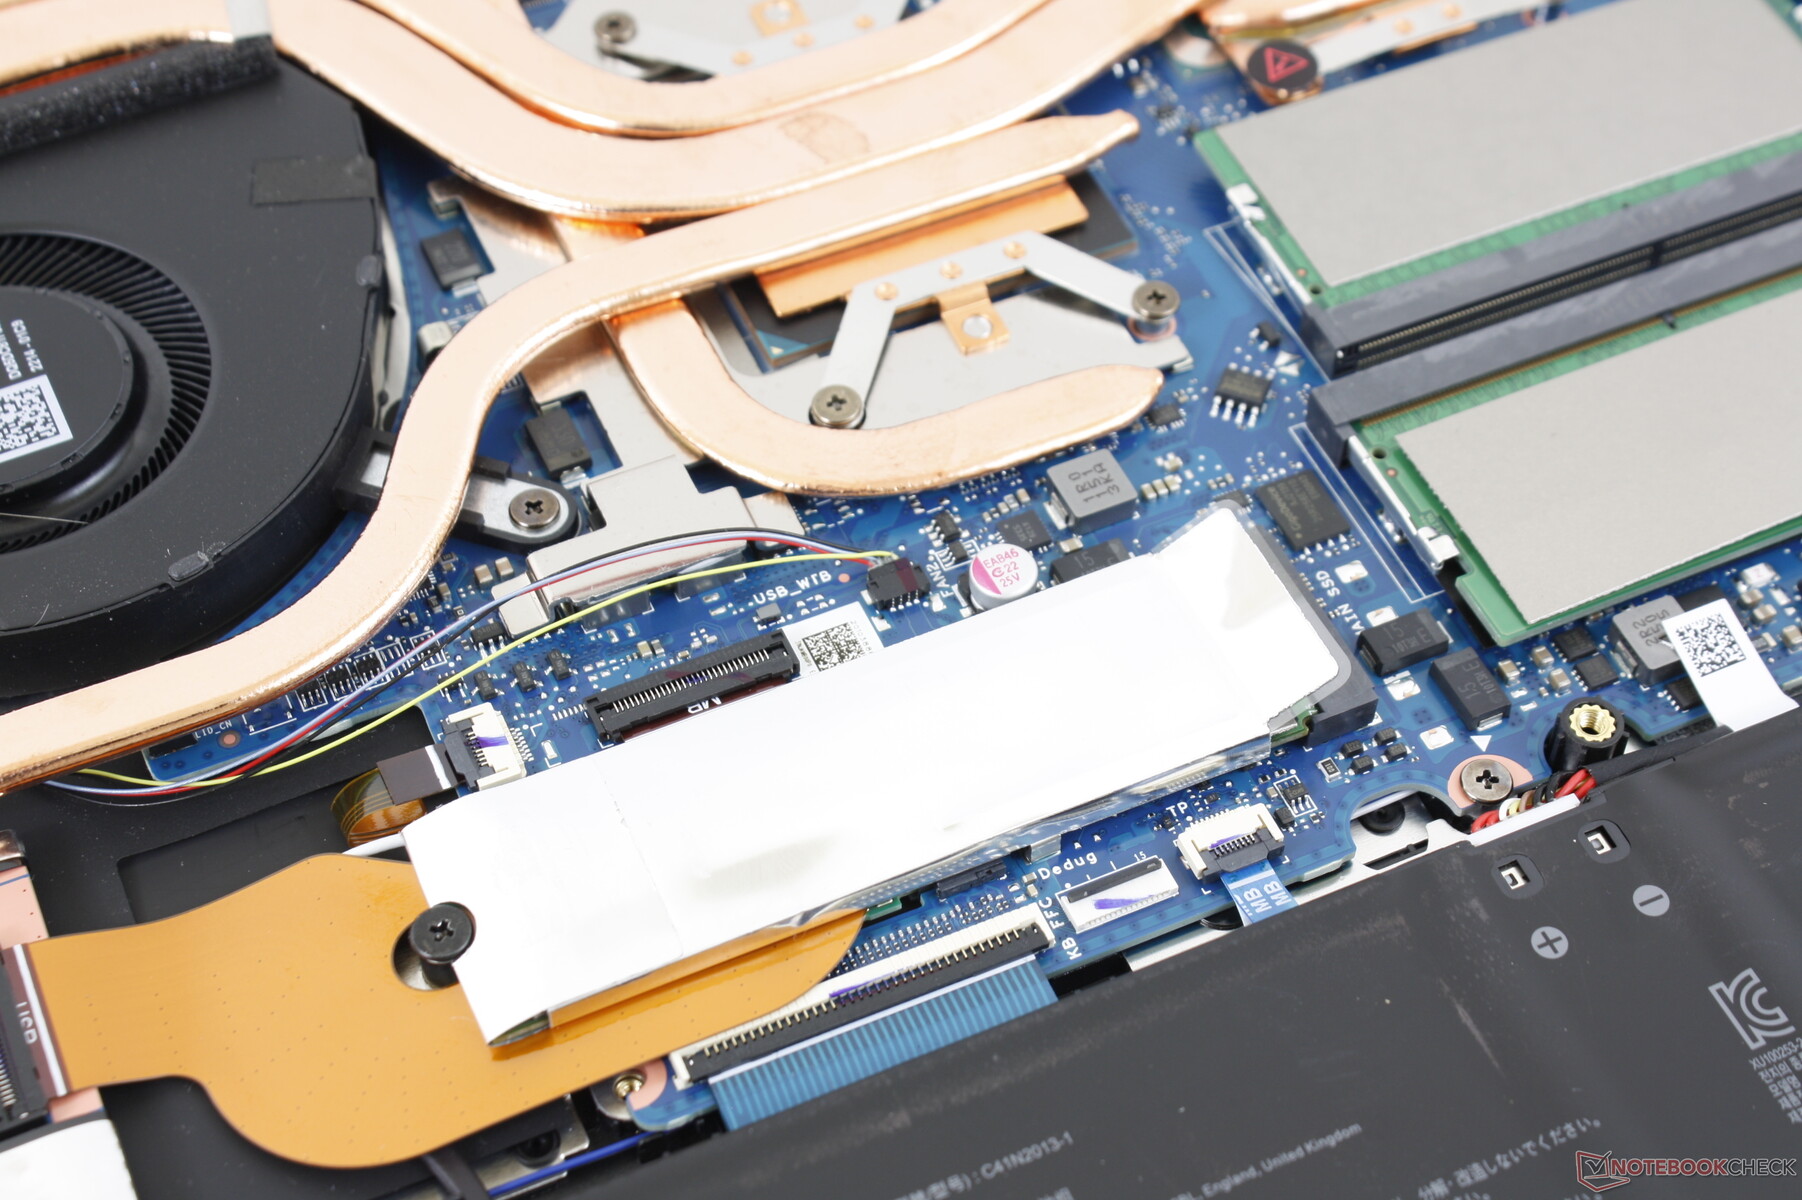
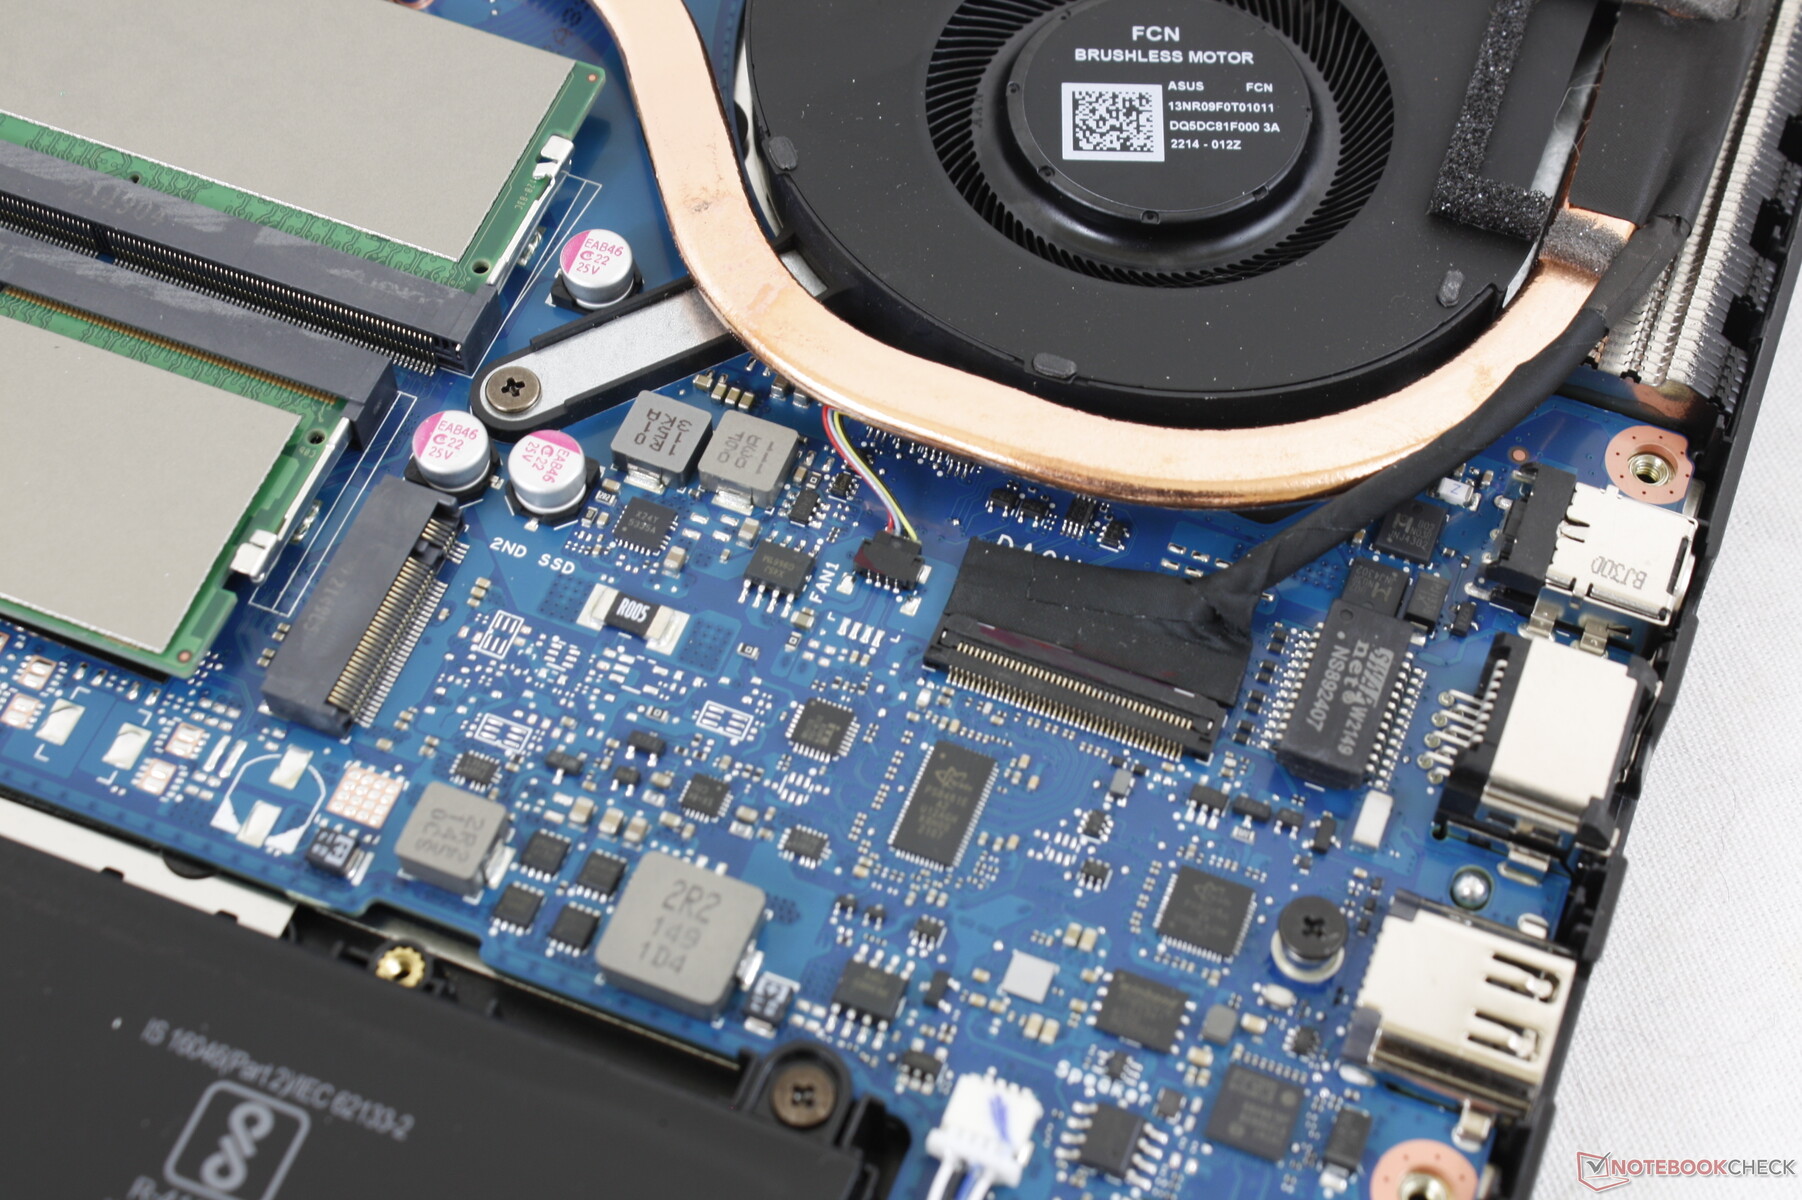
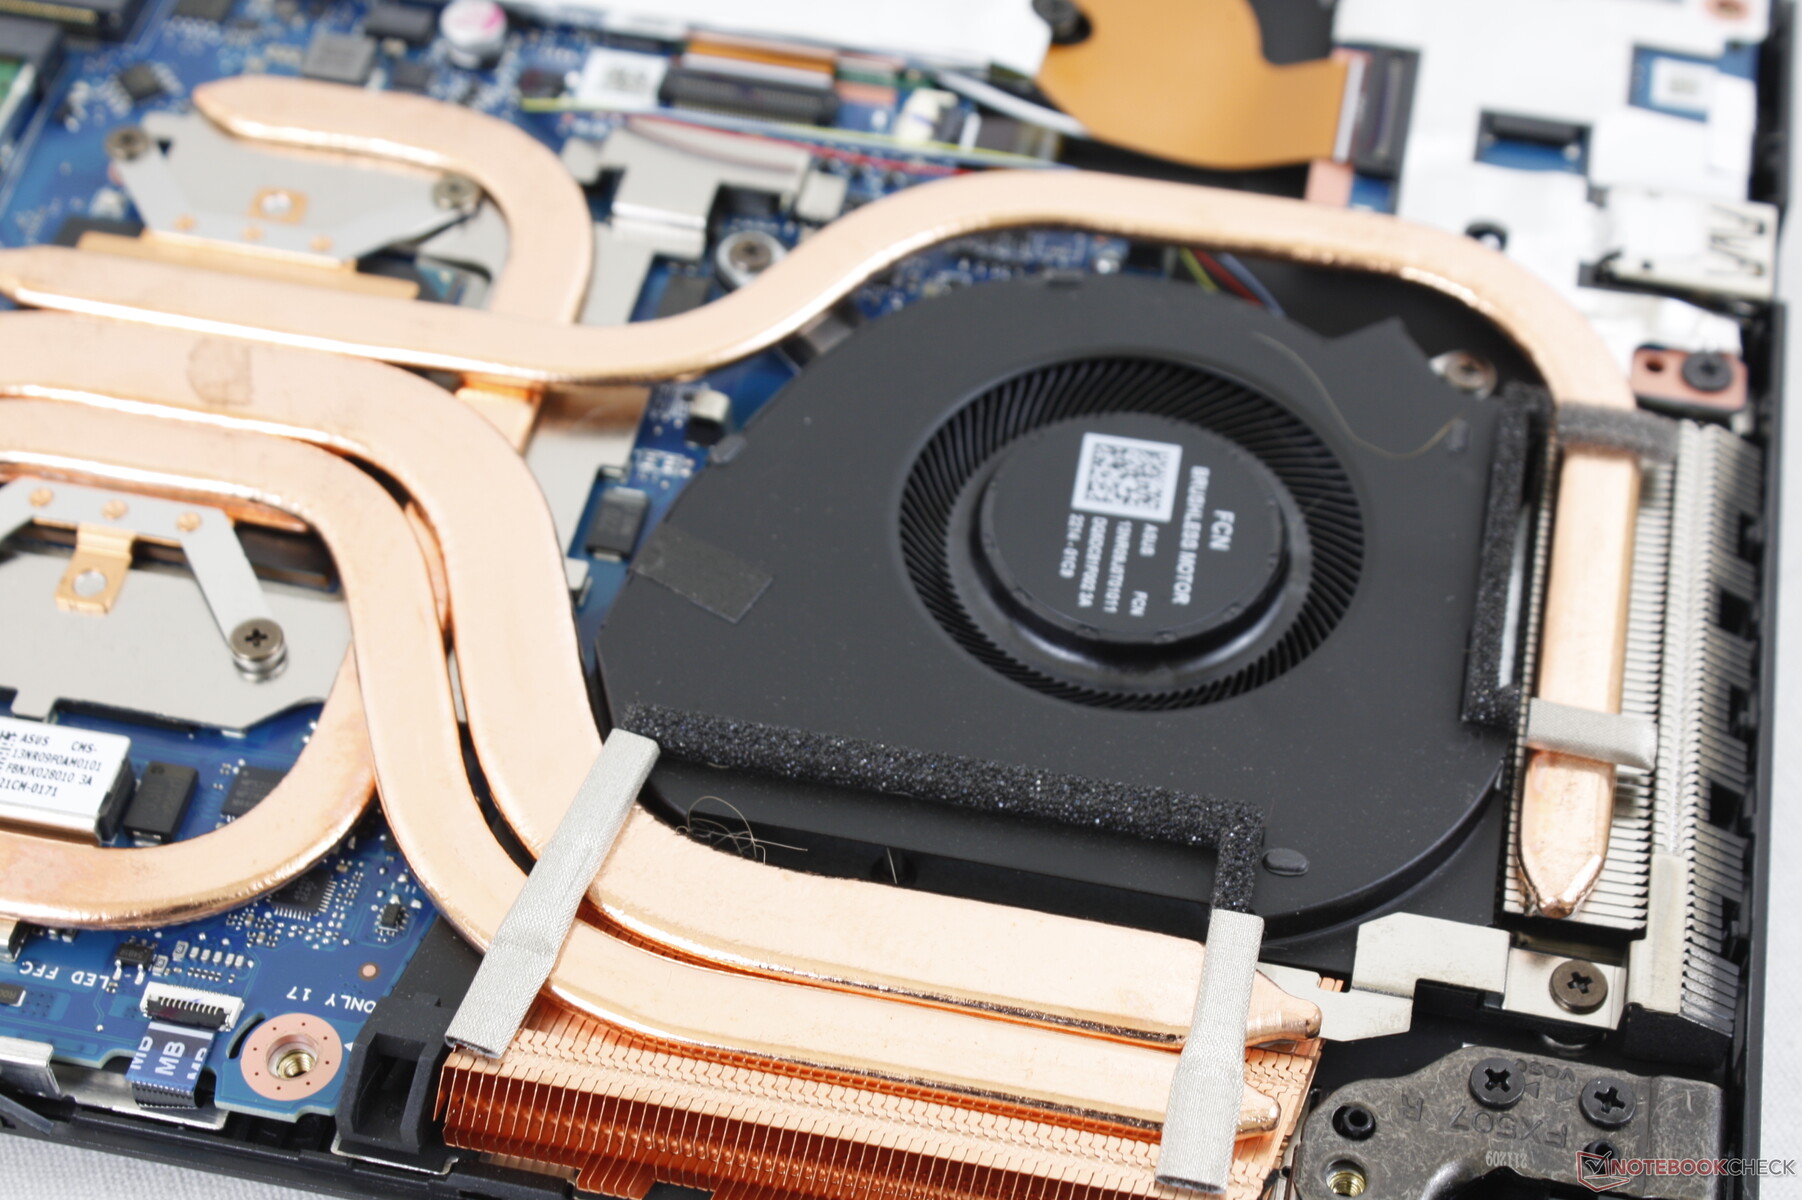
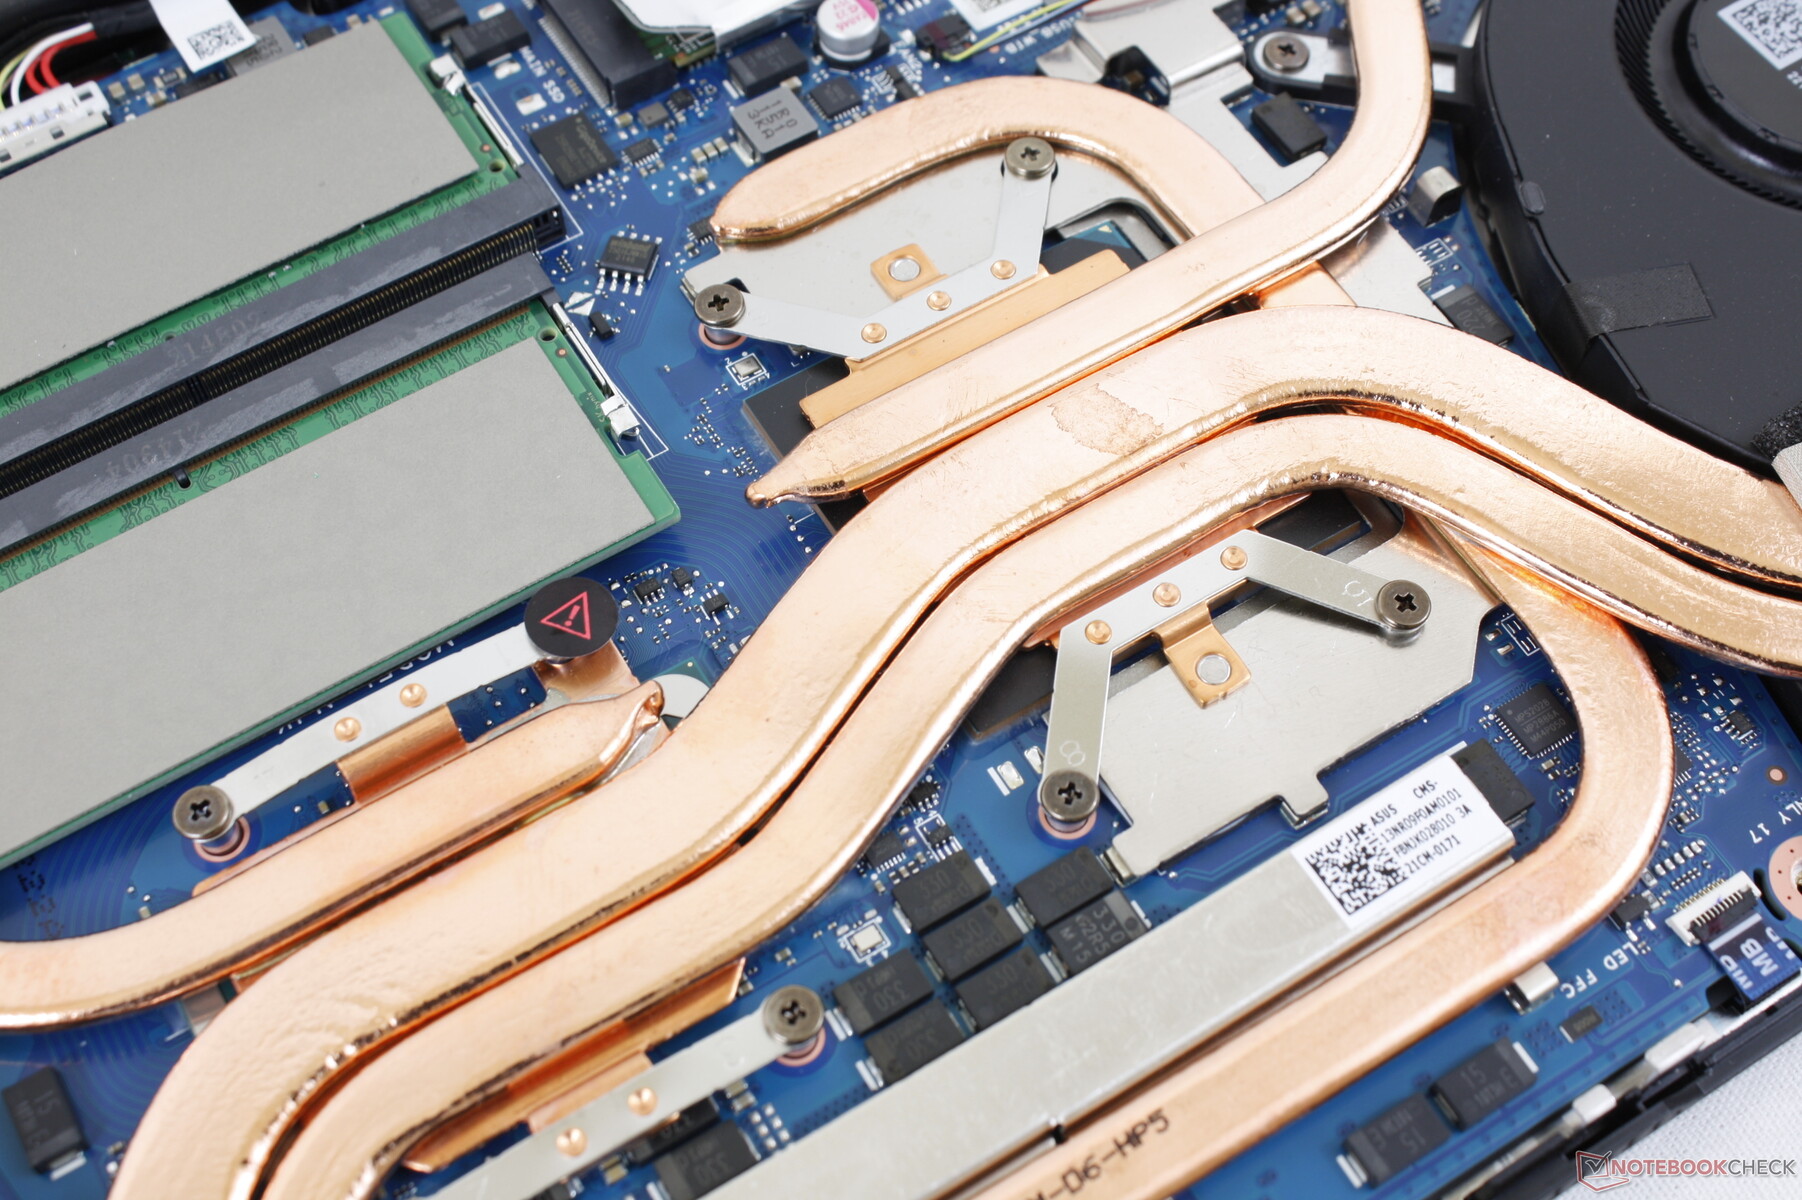
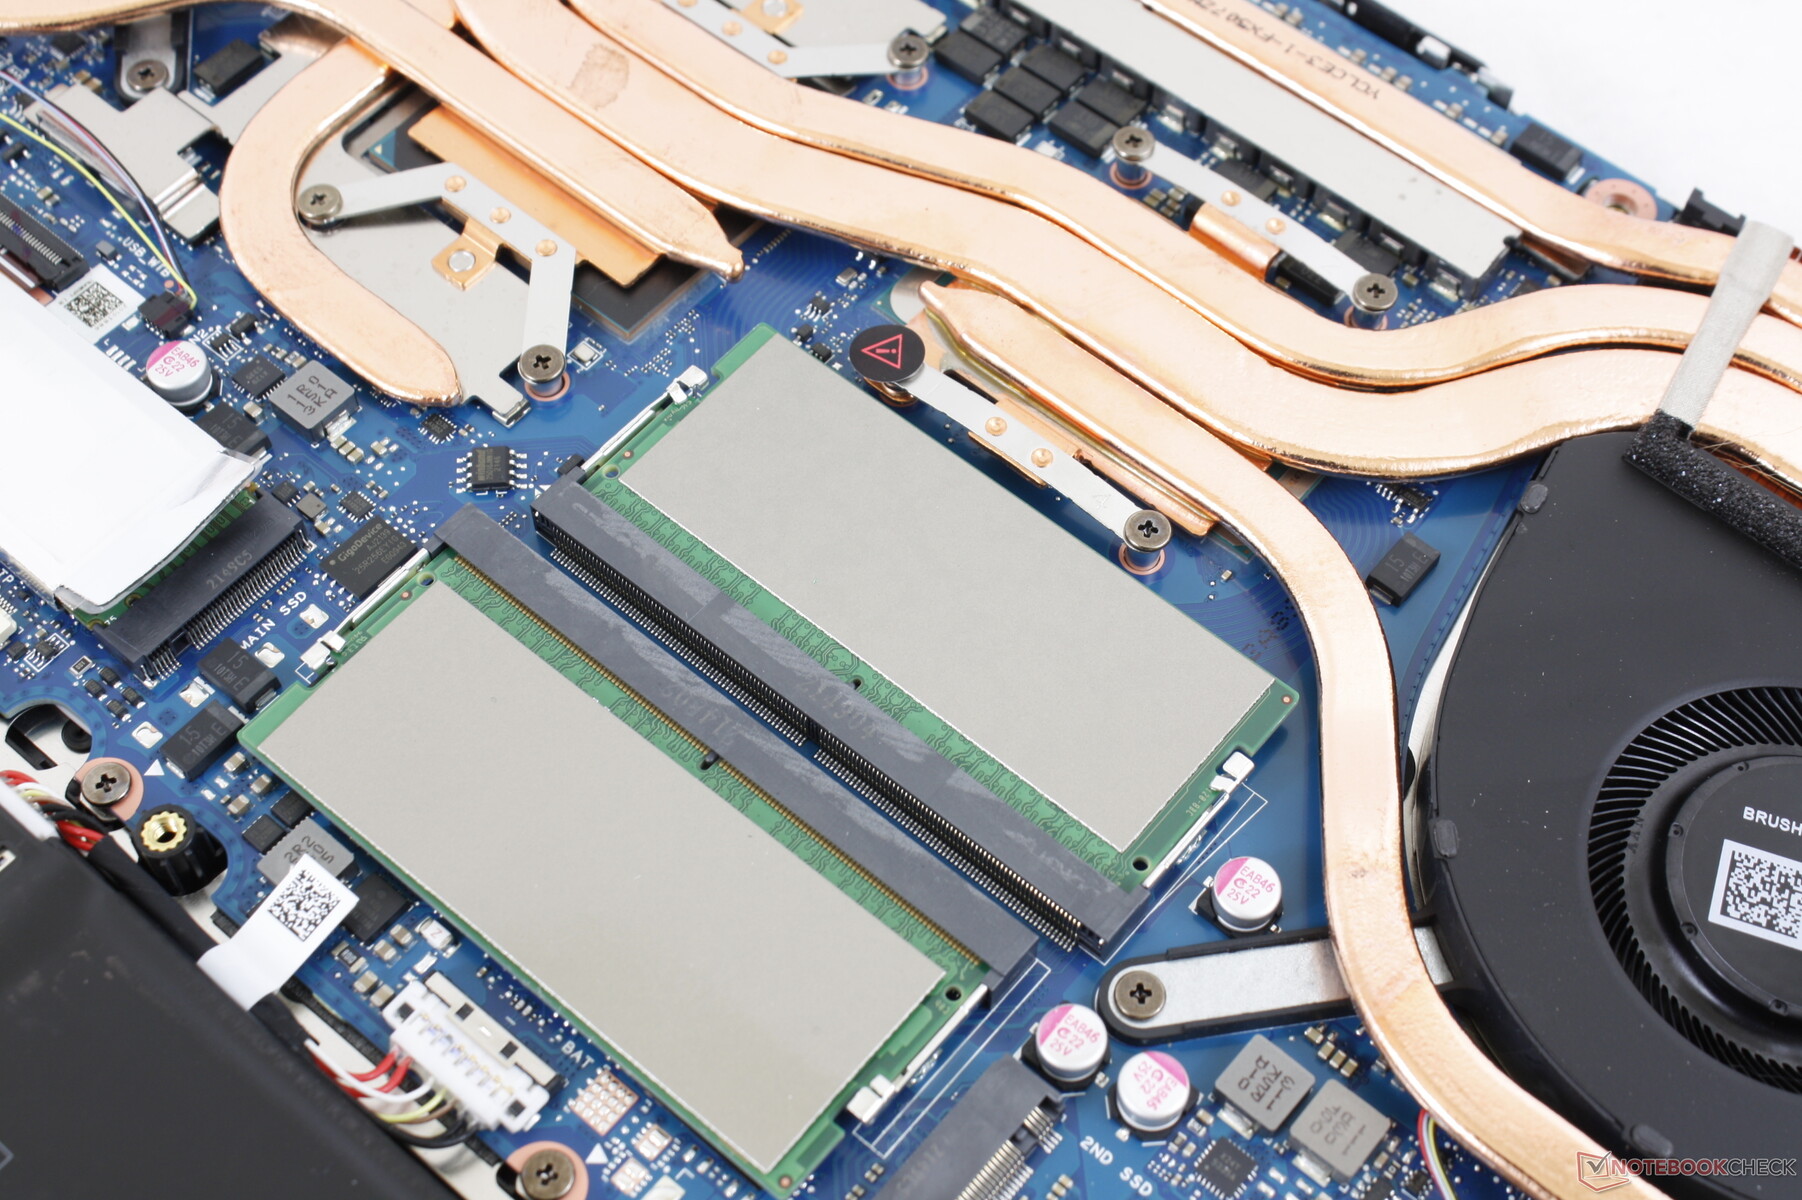
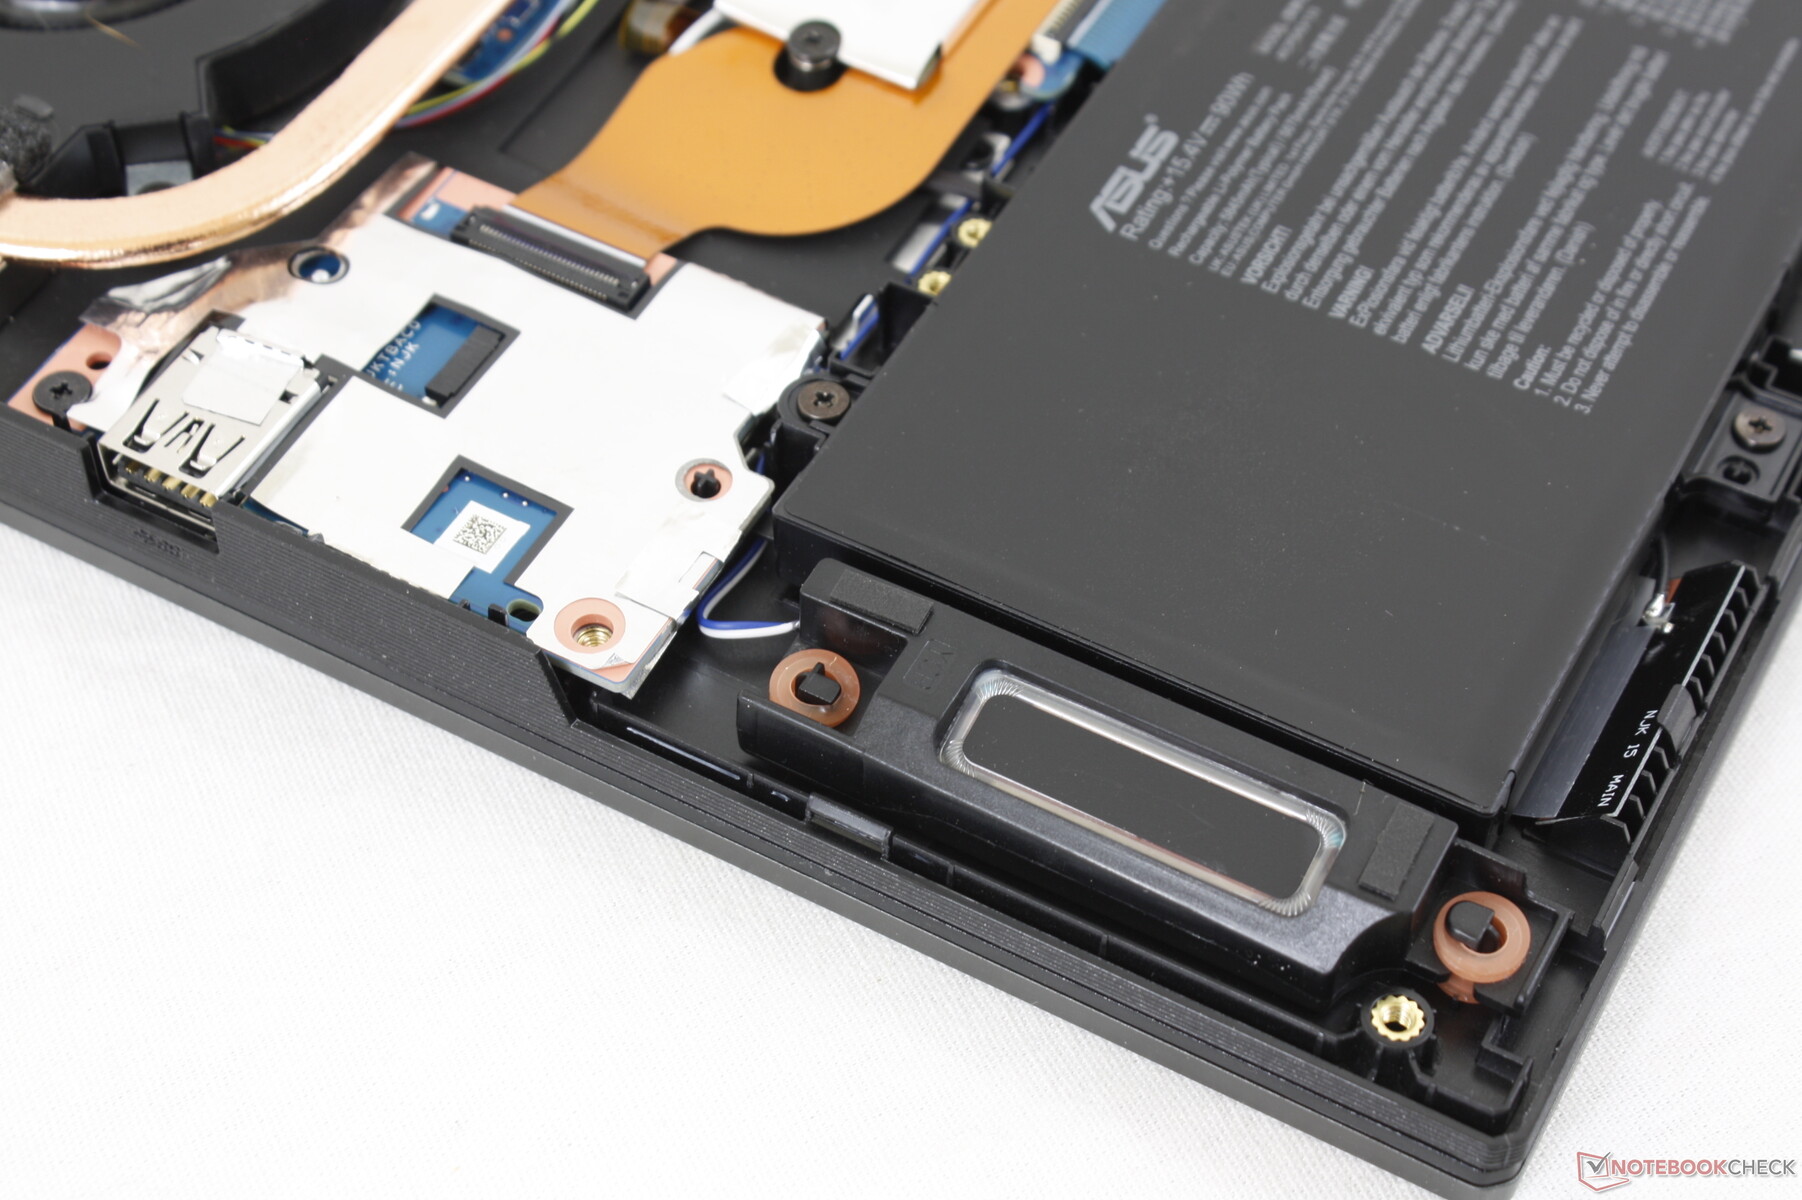
Underhåll
Bottenpanelen är relativt lätt att ta bort med en Philips-skruvmejsel och en platt kant. De inre delarna har förnyats, vilket framgår av jämförelsebilderna nedan, men de 2x SODIMM-platserna, 2x M.2 SSD-platserna och den avtagbara WLAN-modulen finns kvar.
Tillbehör och garanti
Det finns inget extra i lådan förutom den vanliga nätadaptern och pappersarbetet. Den typiska ettåriga tillverkargarantin gäller.
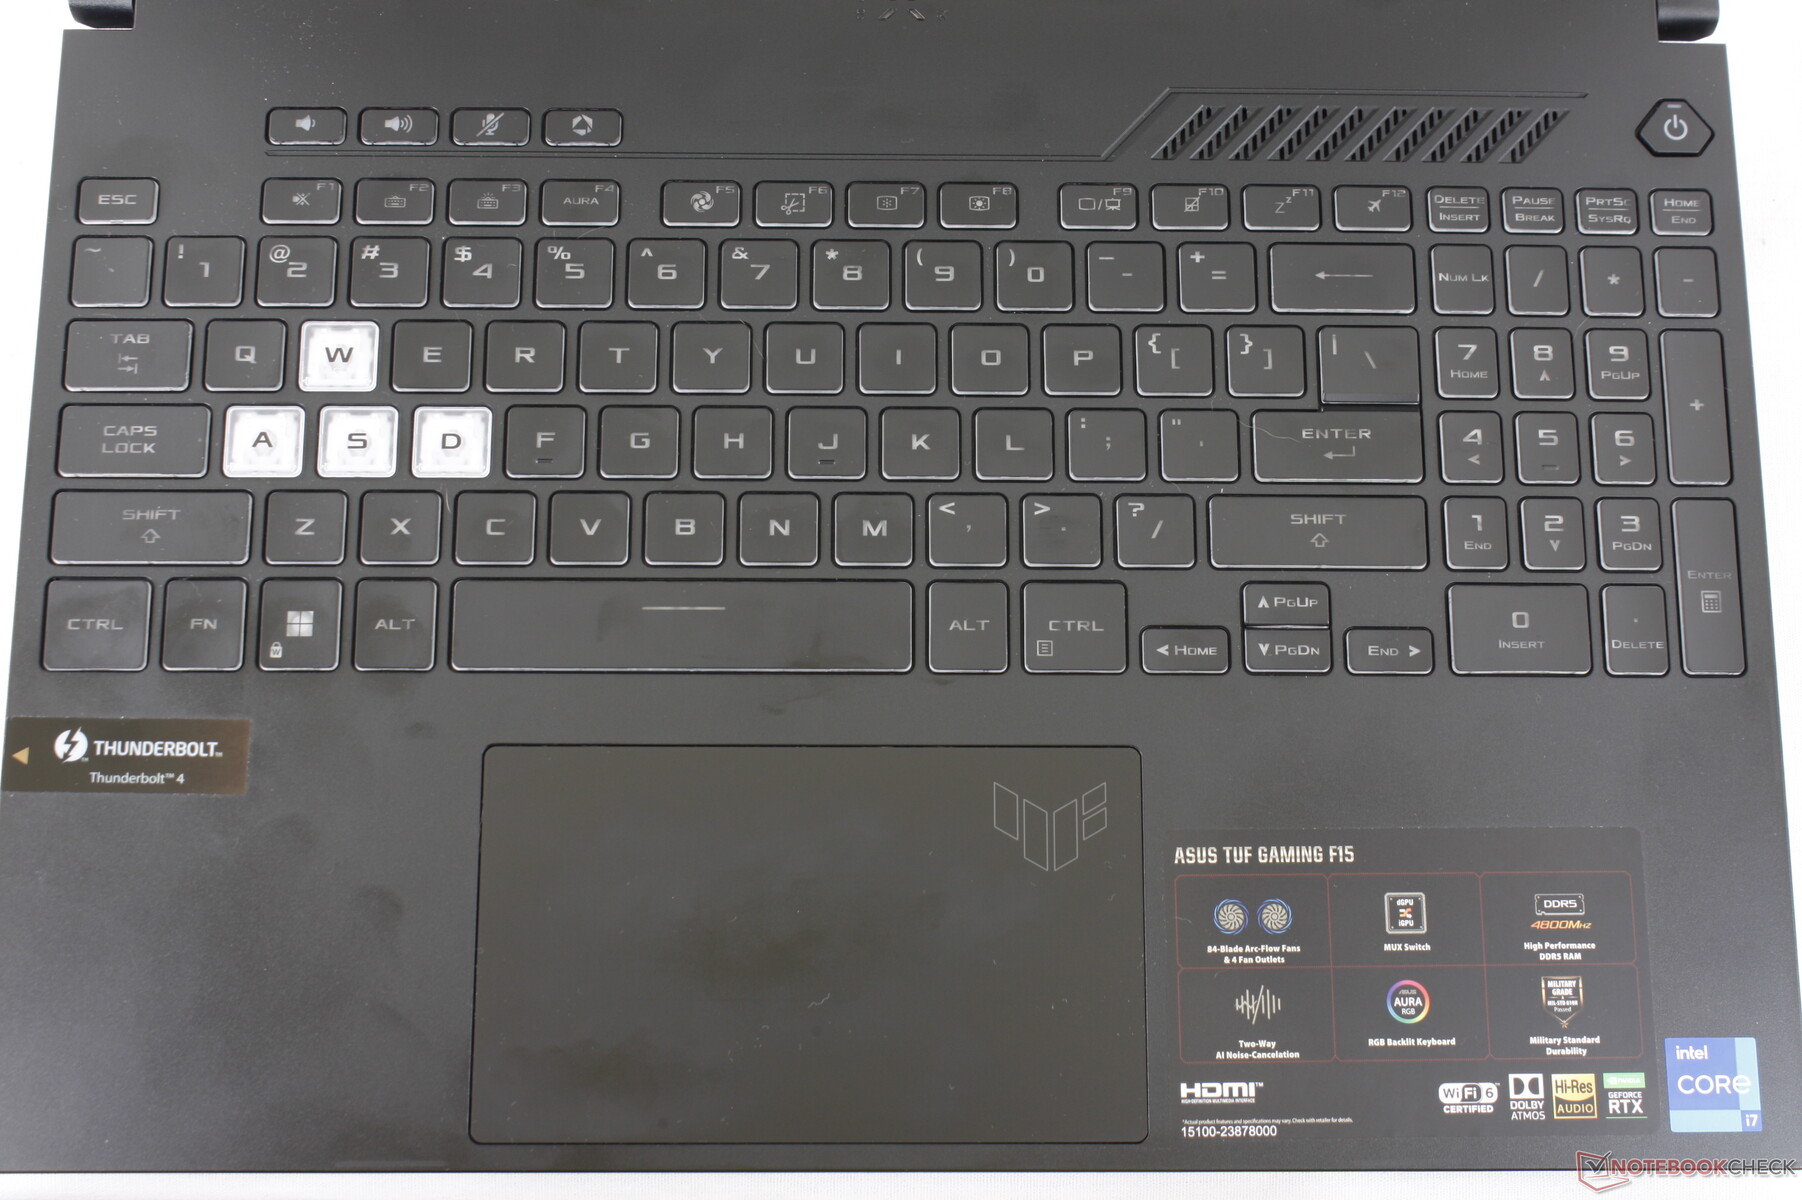
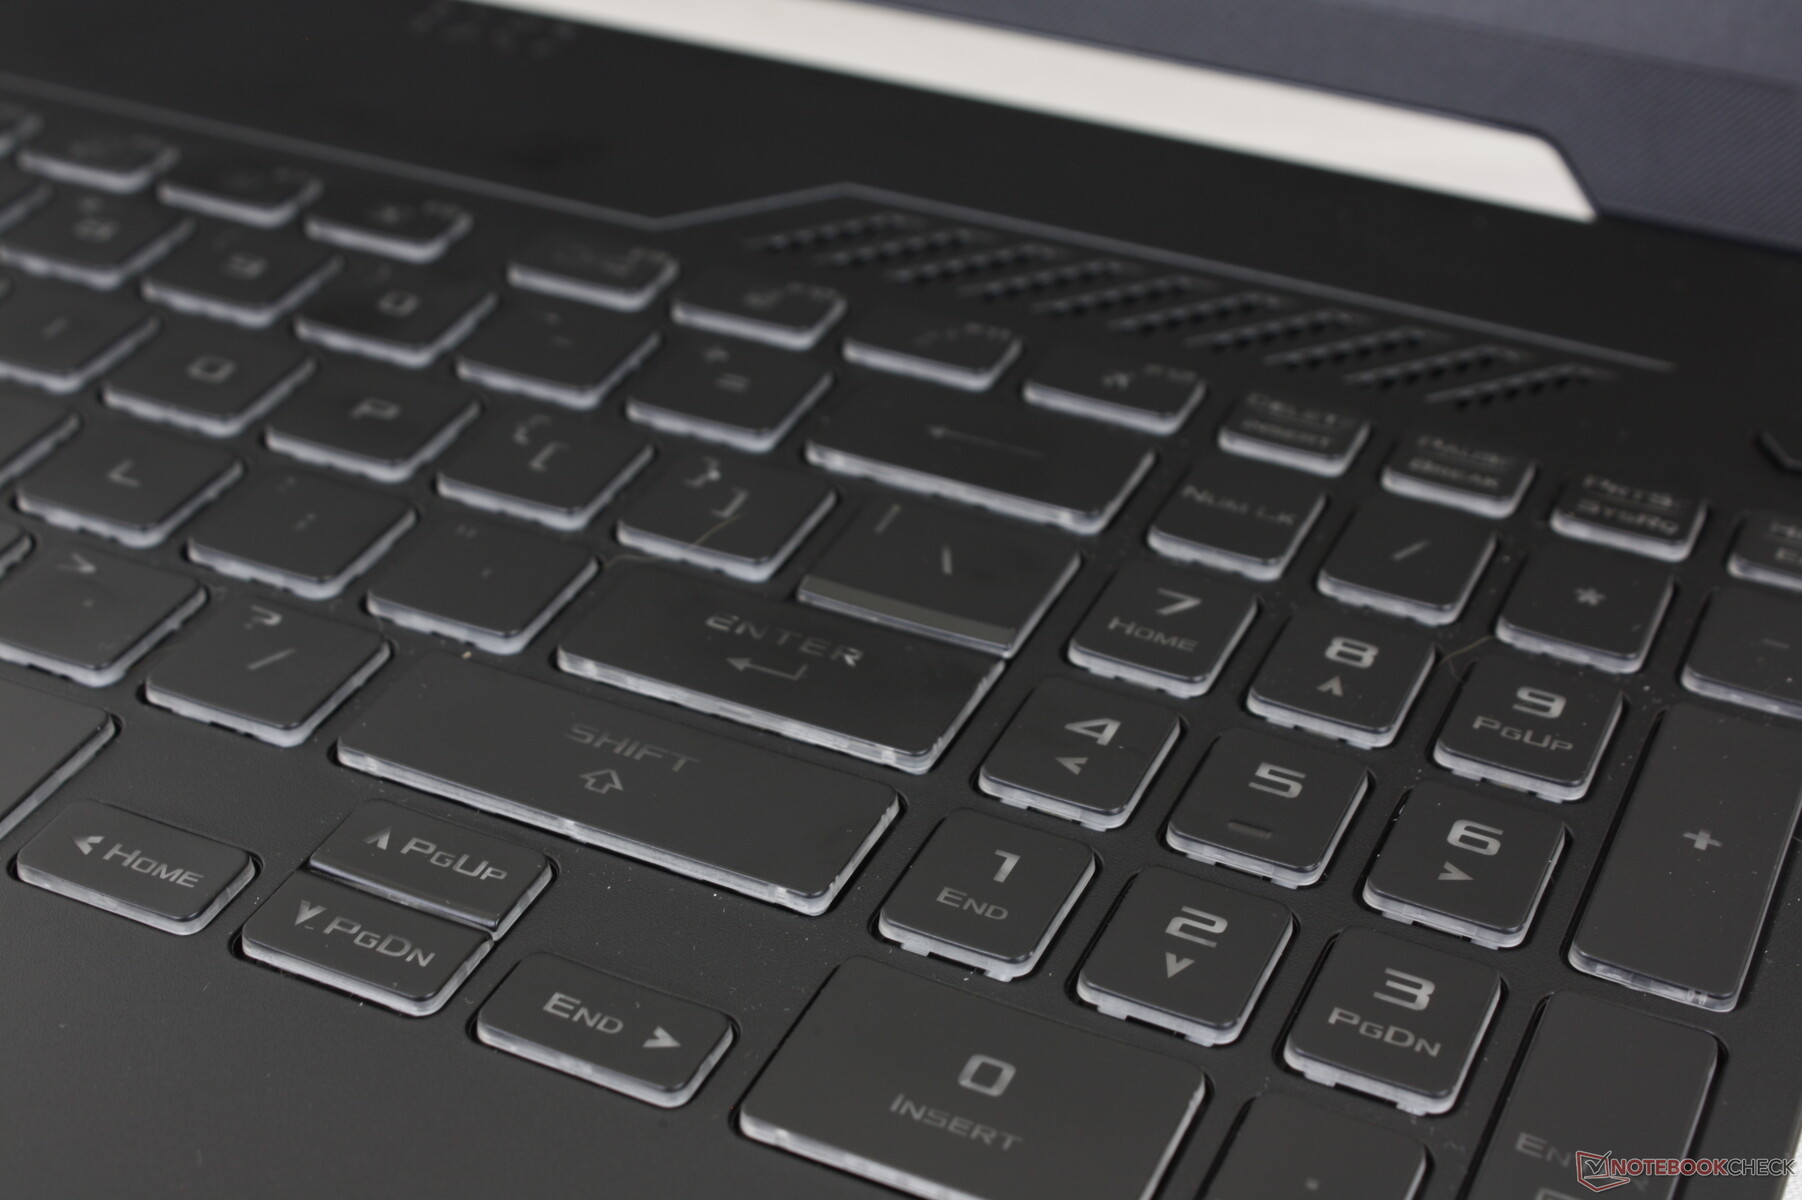
Inmatningsenheter - annorlunda men inte nödvändigtvis bättre
Tangentbord
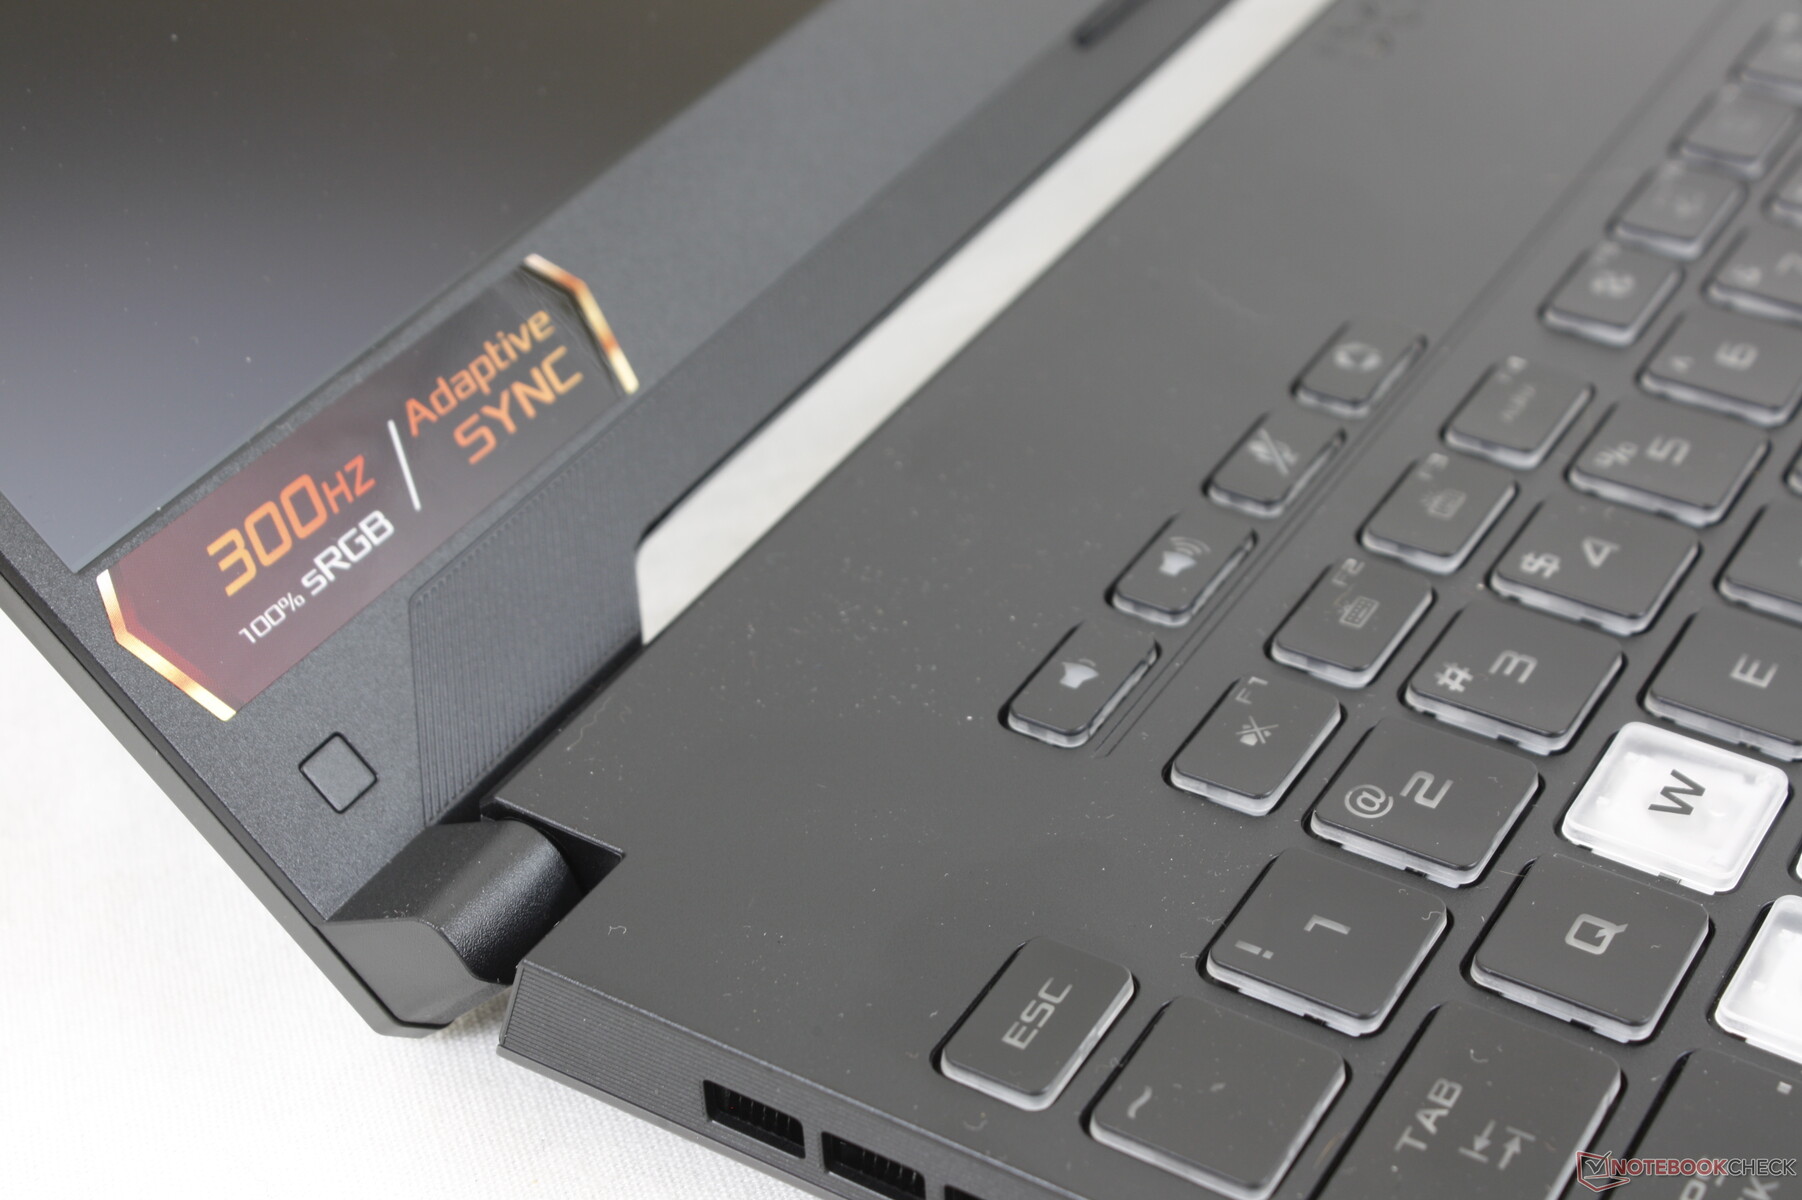
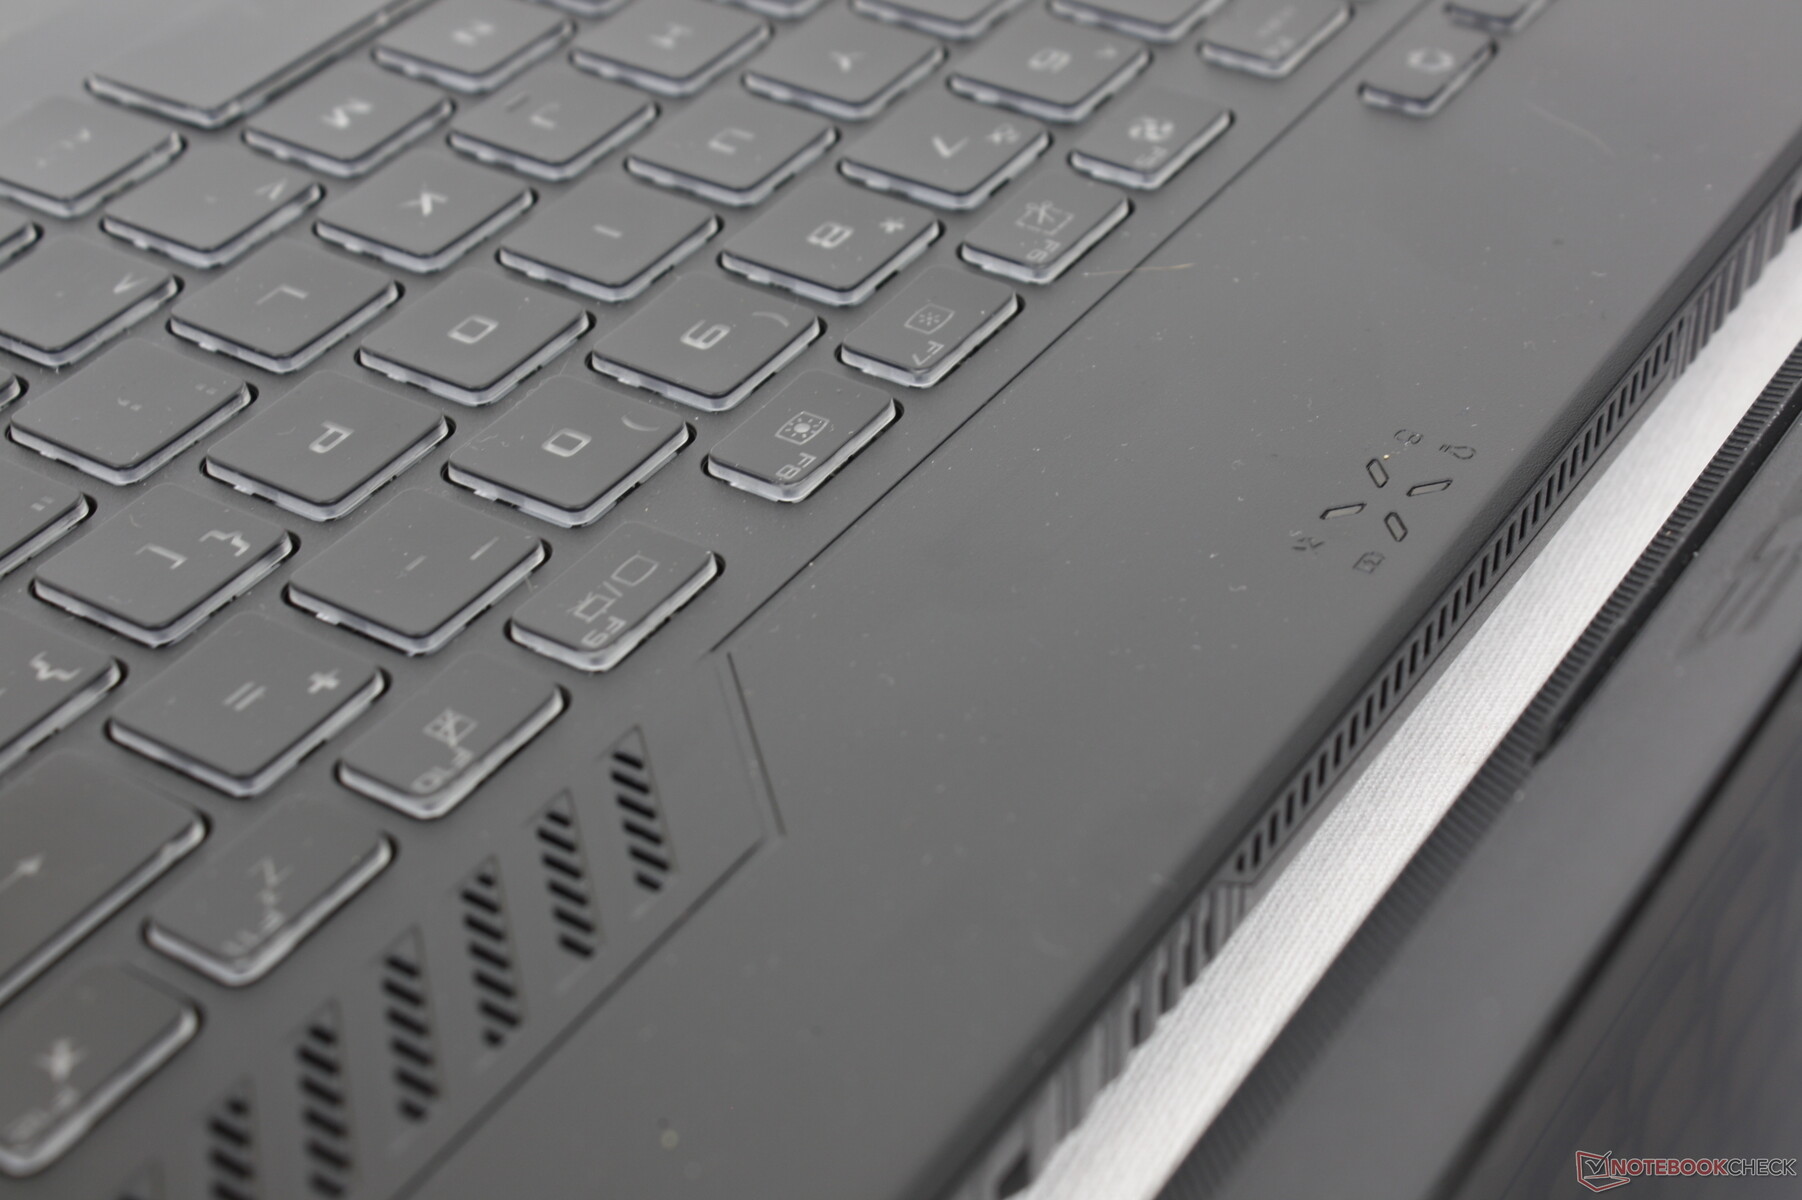
Asus har ändrat tangentbordslayouten jämfört med FX506. Några av hjälptangenterna finns nu i en egen rad nära den övre vänstra kanten medan piltangenterna nu är något längre i längd. Typsnittet på varje tangent är också mörkare och gråare vilket tyvärr gör det svårare att läsa.
Både tangentåterkopplingen och RGB-bakgrundsbelysningen med en enda zon är identisk från år till år. Vi tycker att tangenterna är till den ljusare och mjukare sidan jämfört med tangenterna på Eurocom RX315 samtidigt som de ligger väldigt nära tangentborden på de flesta Zephyrus S-modeller.
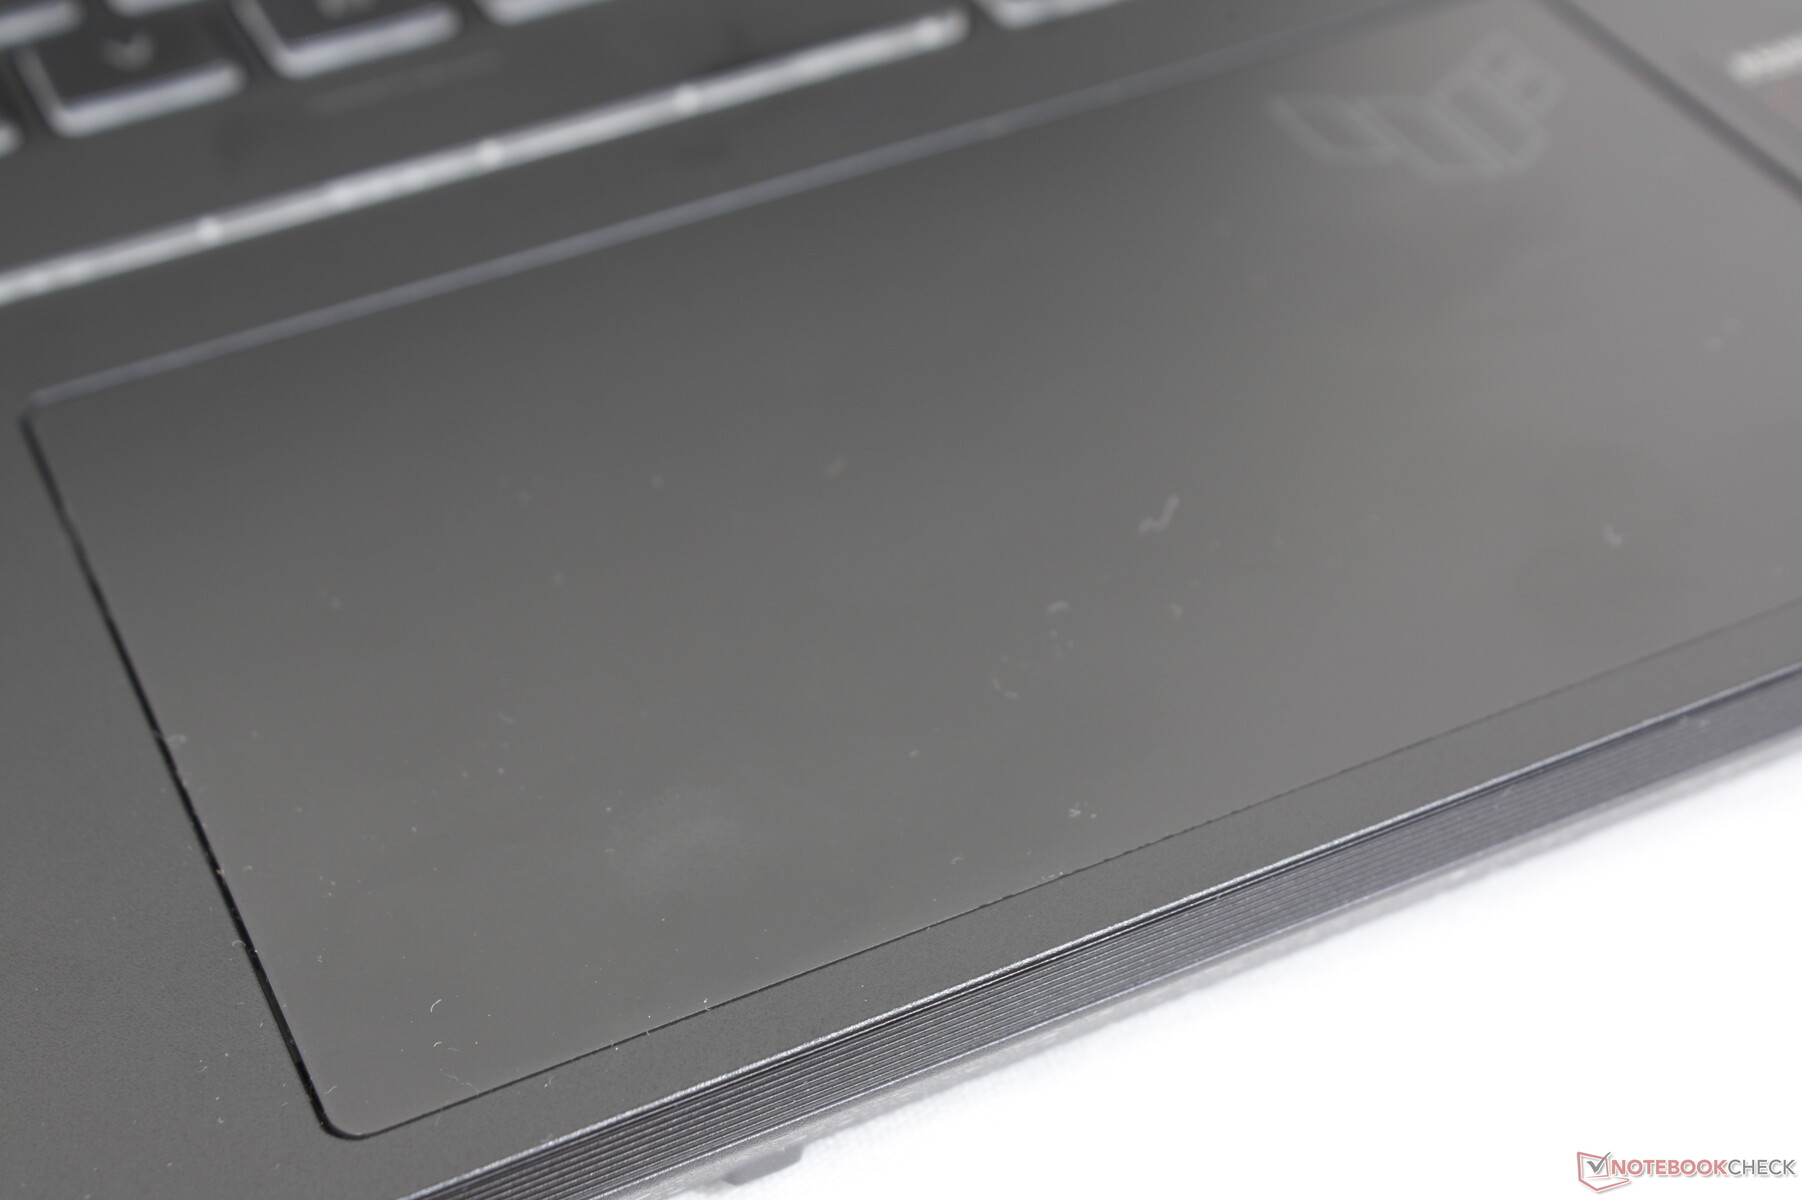
Pekplatta
I FX507 har de dedikerade musknapparna på FX506 försvunnit för att istället få en större klickplatta (13 x 7,8 cm jämfört med 10,6 x 8,0 cm). Glidningen är jämn i alla hastigheter med mycket lite kladd, men återkopplingen är svag och något svampig vid inmatning av klick. Drag- och draghandlingar är därför inte lika bekväma som på den äldre FX506.

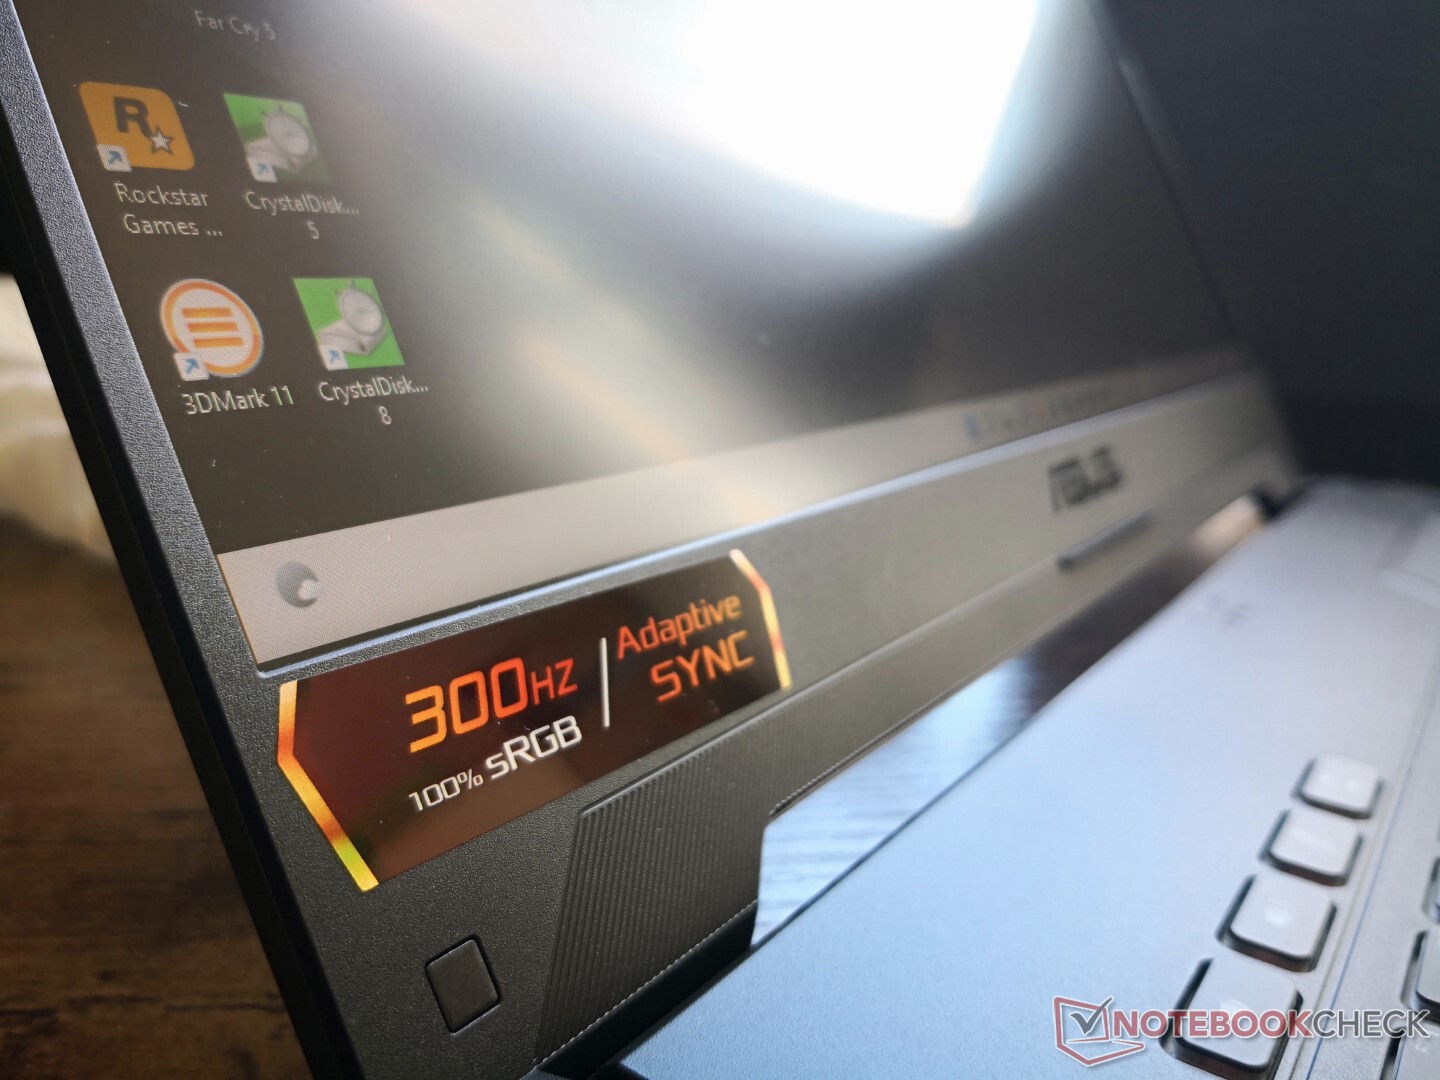
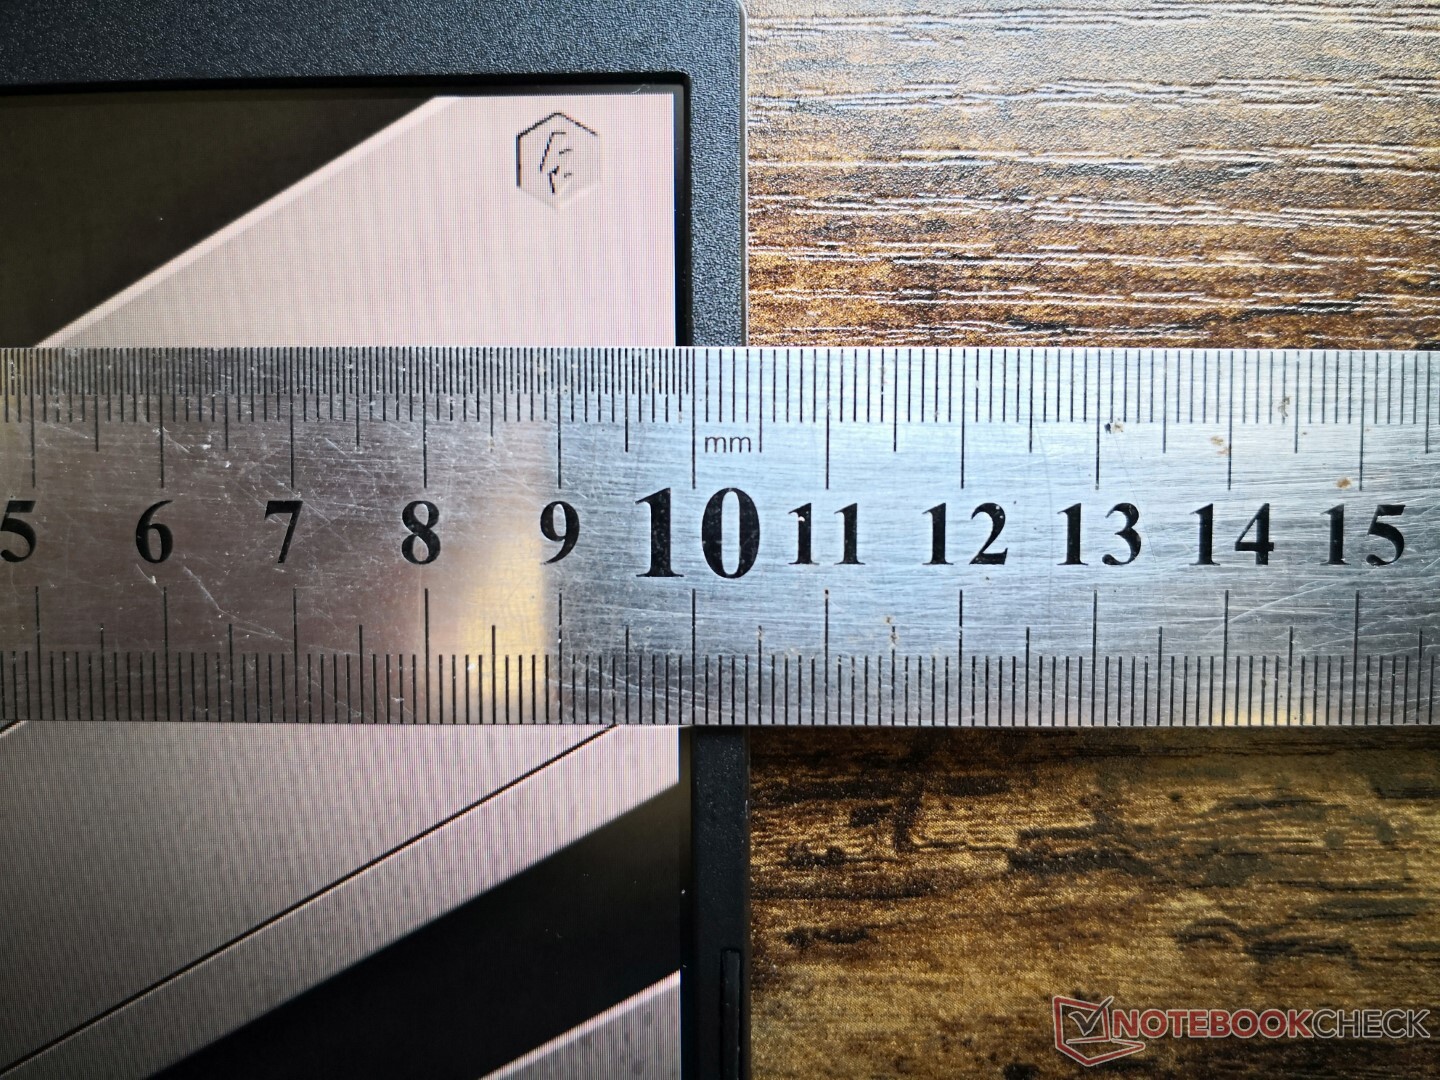
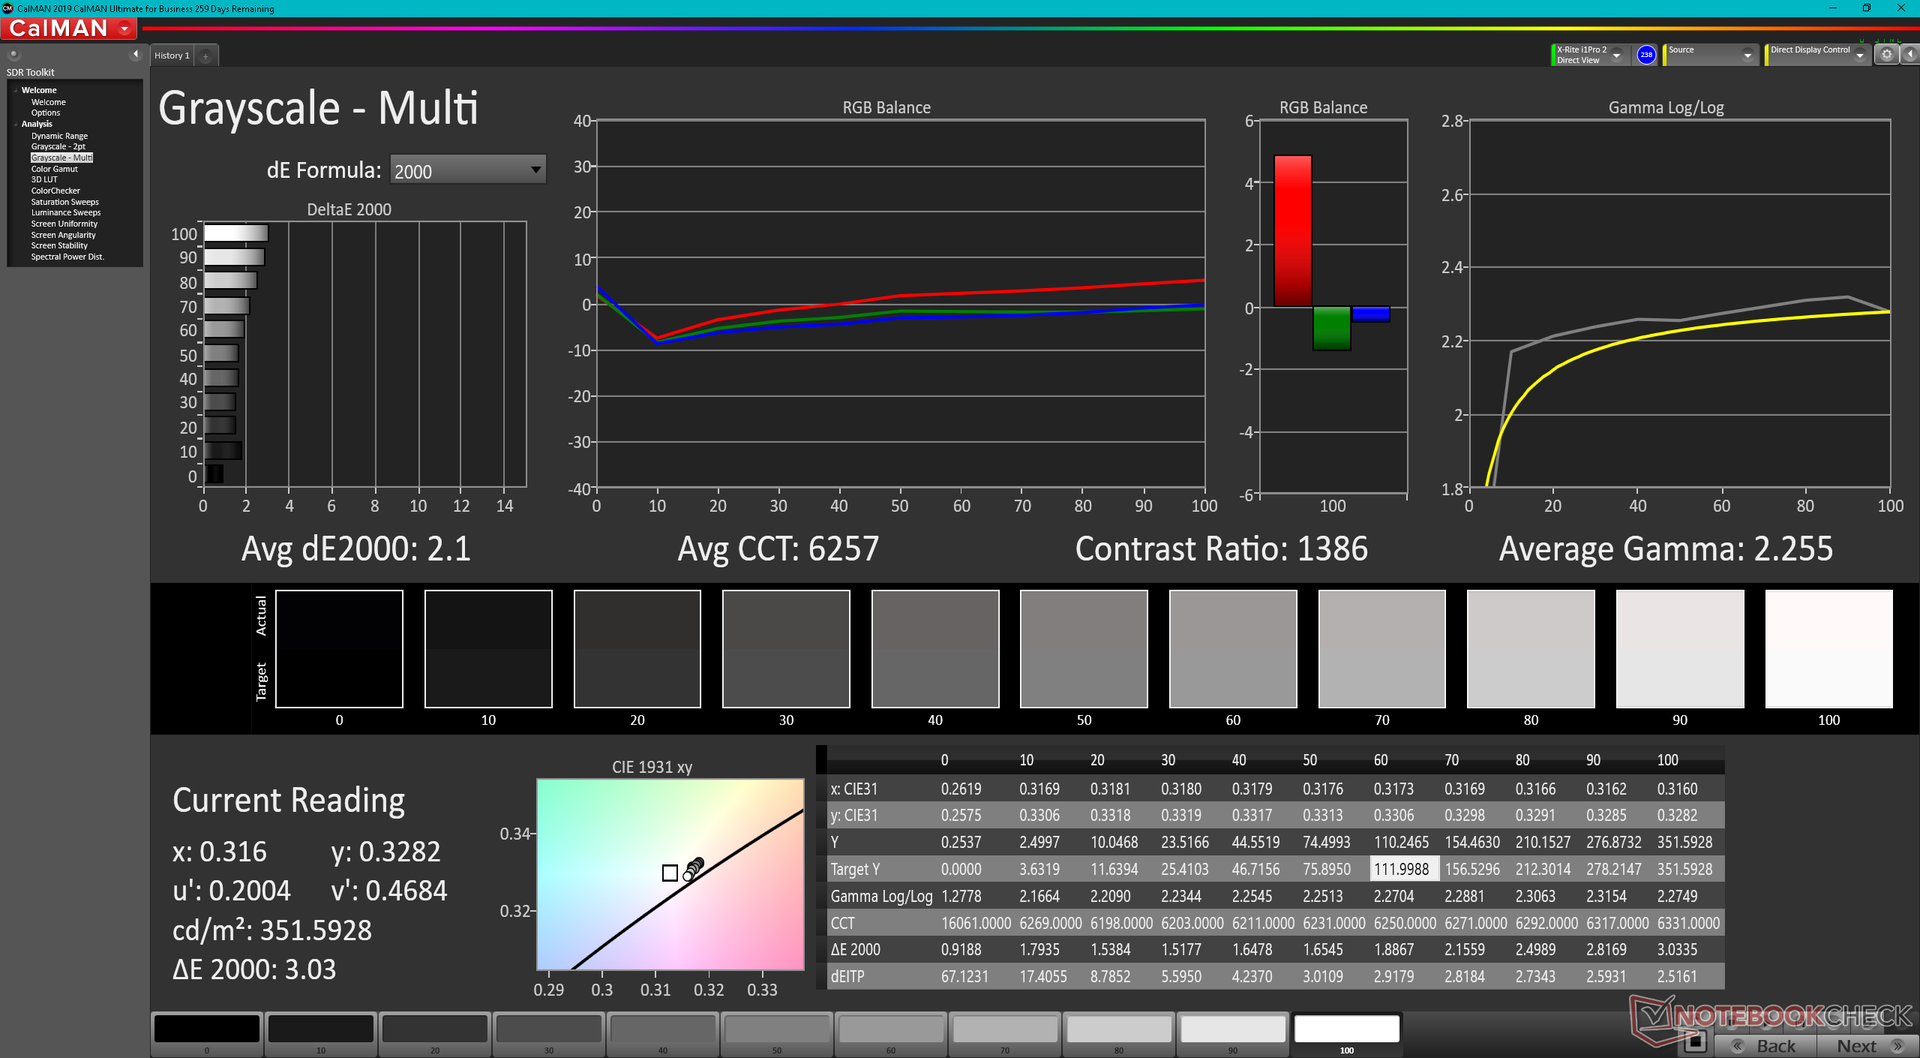
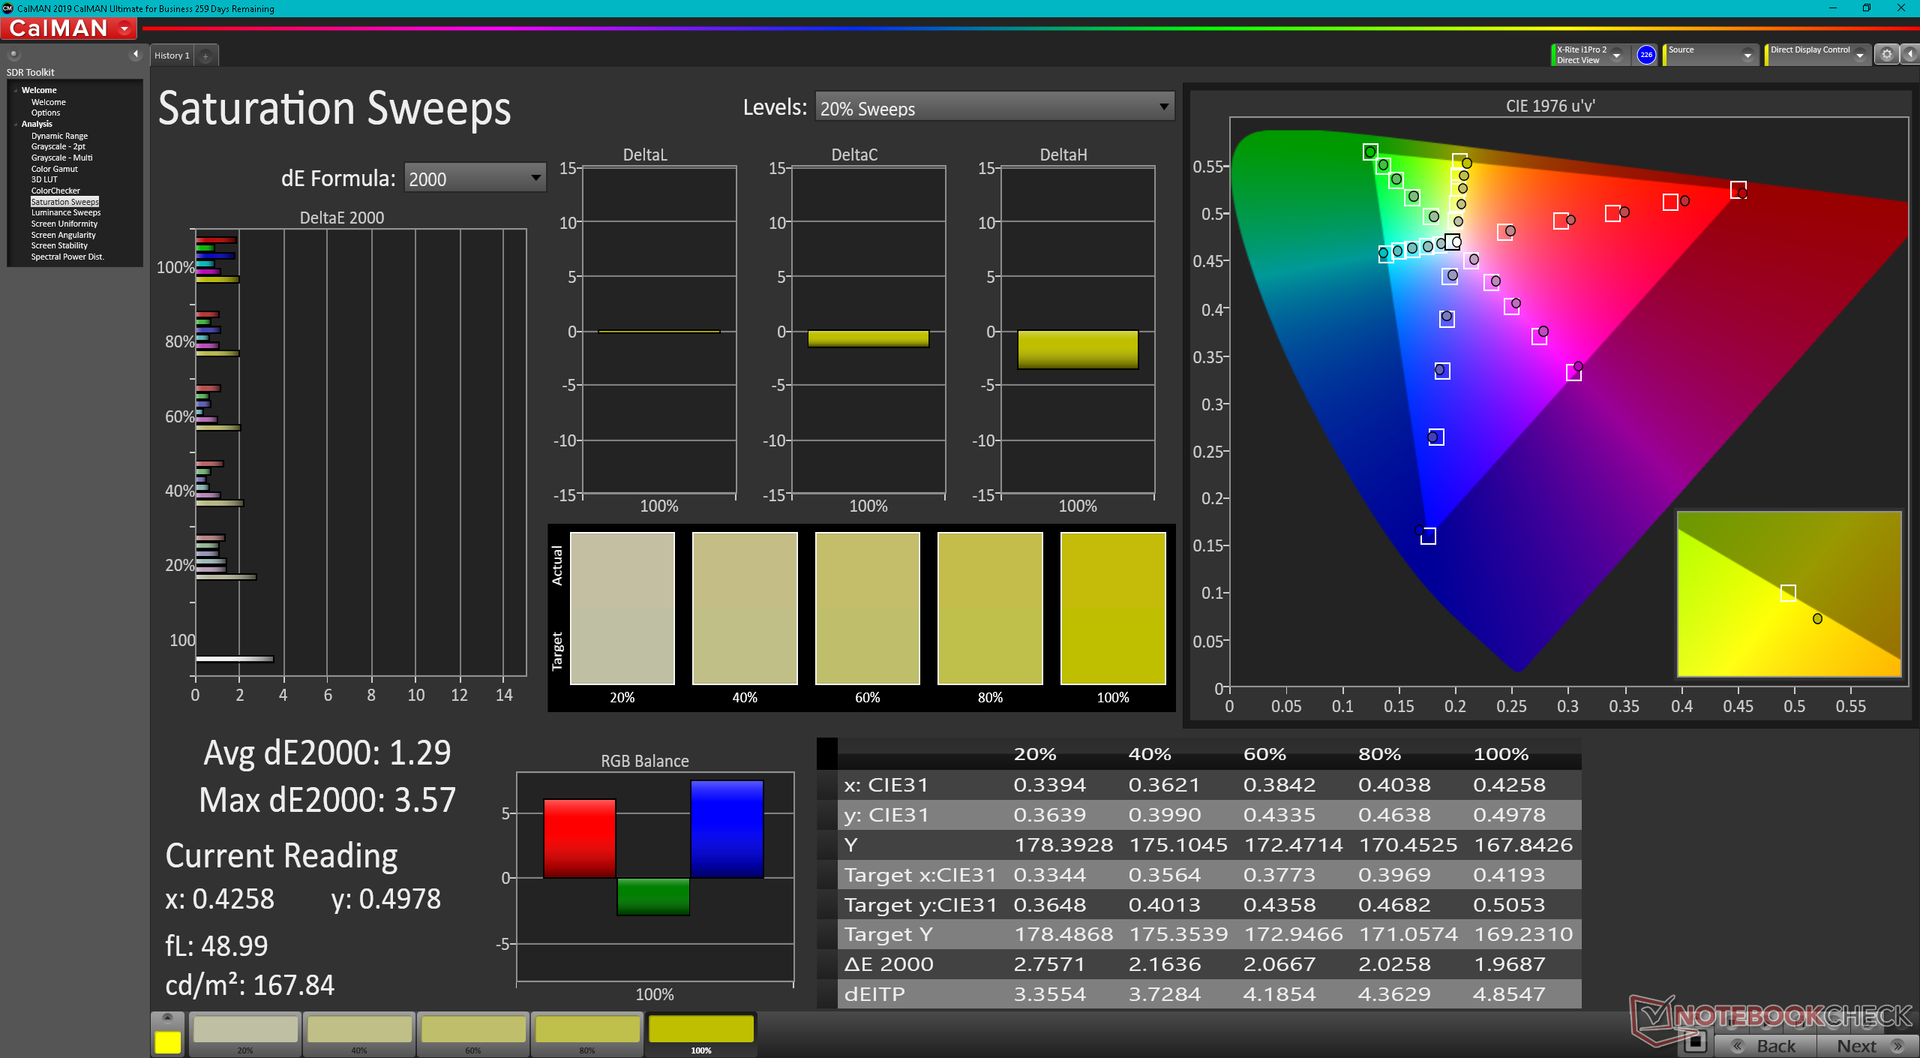
Skärm - 300 Hz med adaptiv synkronisering
Asus har uppgraderat den 240 Hz Sharp LQ156M1JW26 IPS-panelen på den äldre FX516PR för en snabbare 300 Hz Sharp TL156VDXP0101 IPS-panel på FX507. Förutom den högre uppdateringsfrekvensen ger den nyare panelen också snabbare svarstider för grått och grått och en ljusare bakgrundsbelysning samtidigt som den behåller ungefär samma kontrastförhållande och gamut som på FX516PR.
Vi är glada att se att Asus har släppt den hemska Chi Mei-panelen på FX506 som hade betydligt sämre färger och svarstider.

| |||||||||||||||||||||||||
Distribution av ljusstyrkan: 89 %
Mitt på batteriet: 353.7 cd/m²
Kontrast: 1040:1 (Svärta: 0.34 cd/m²)
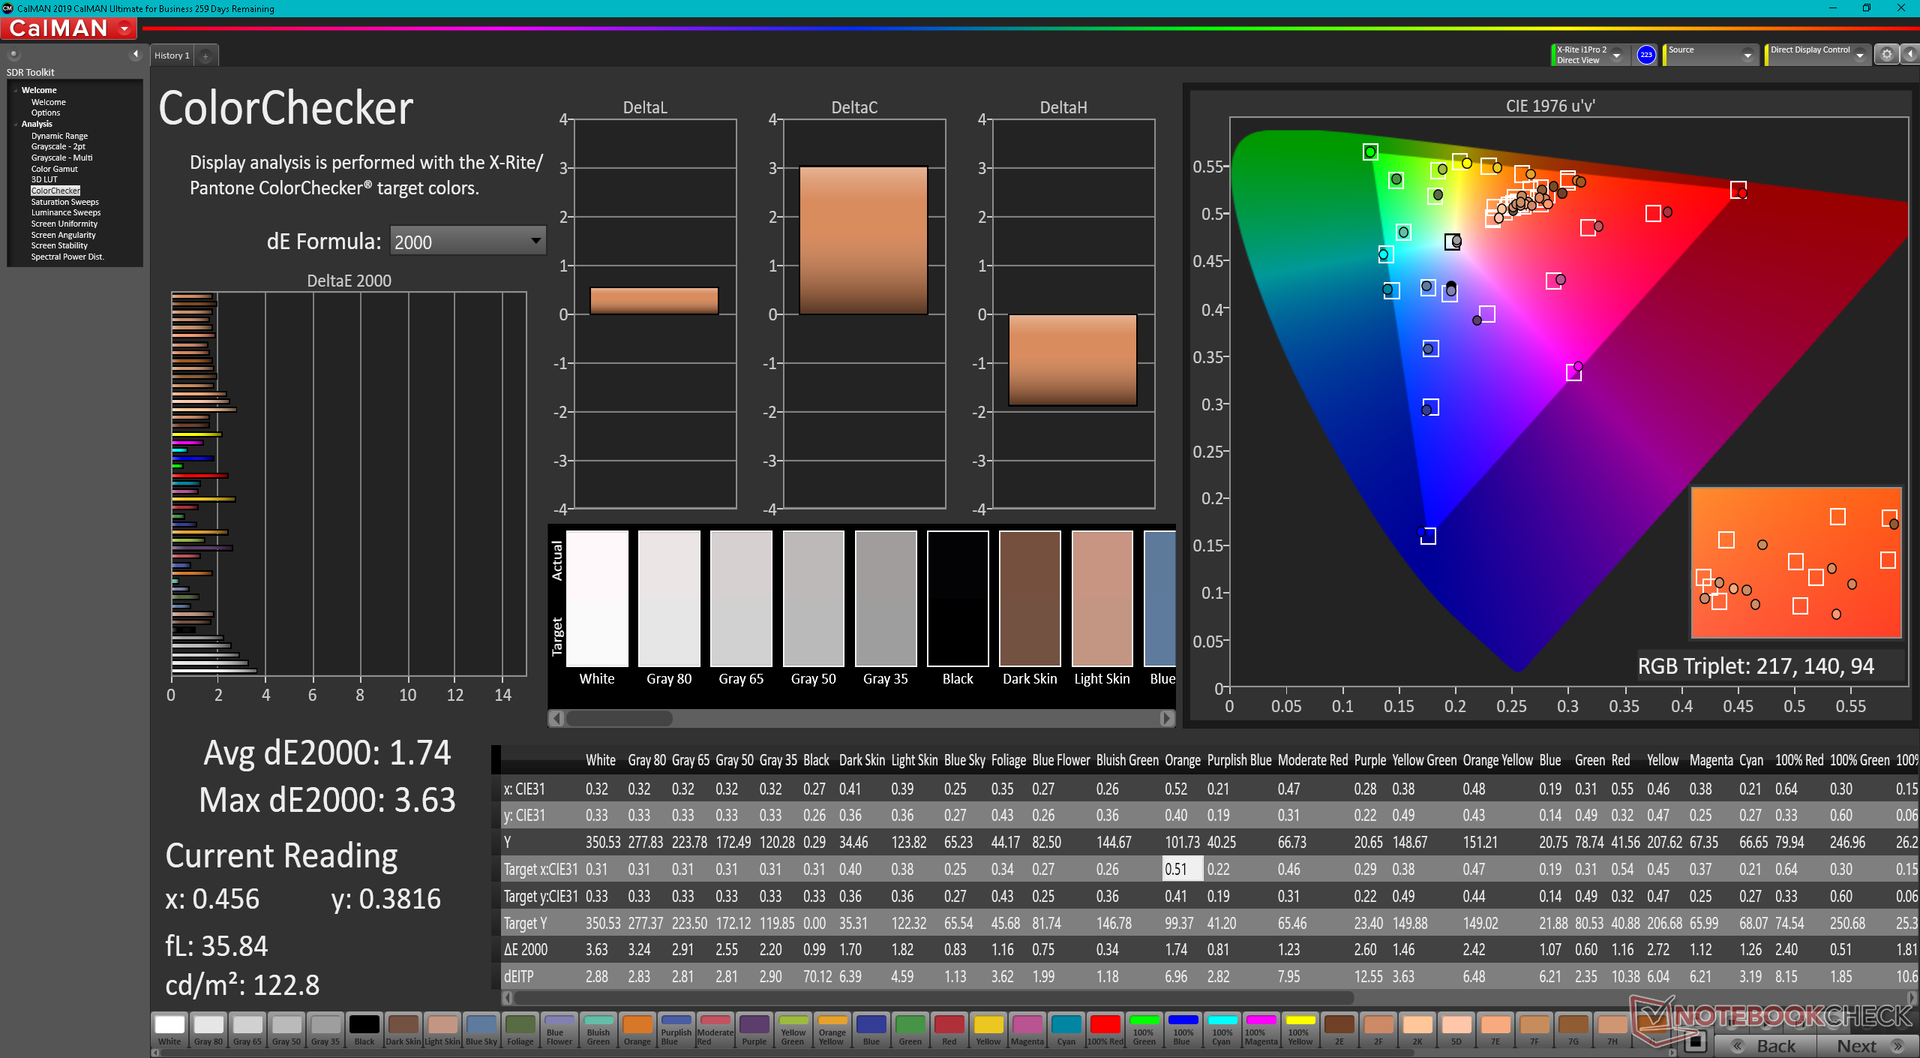
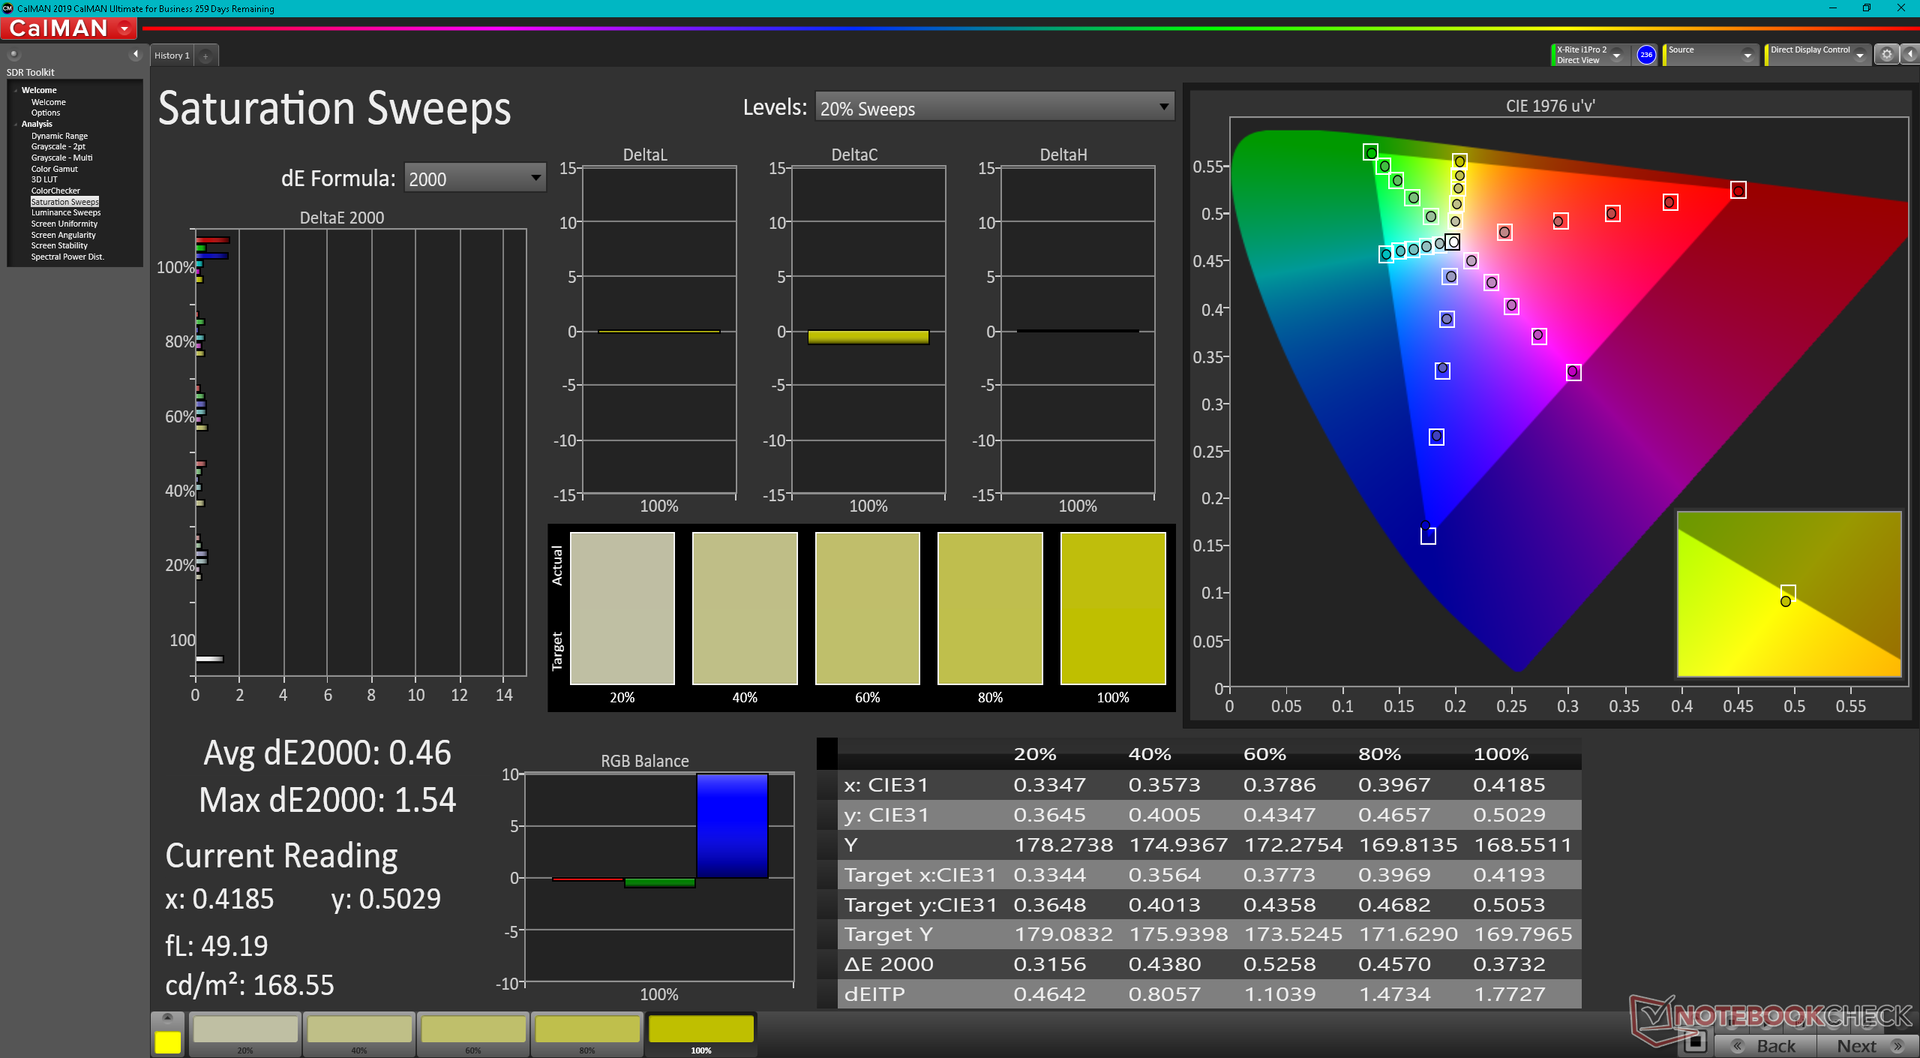
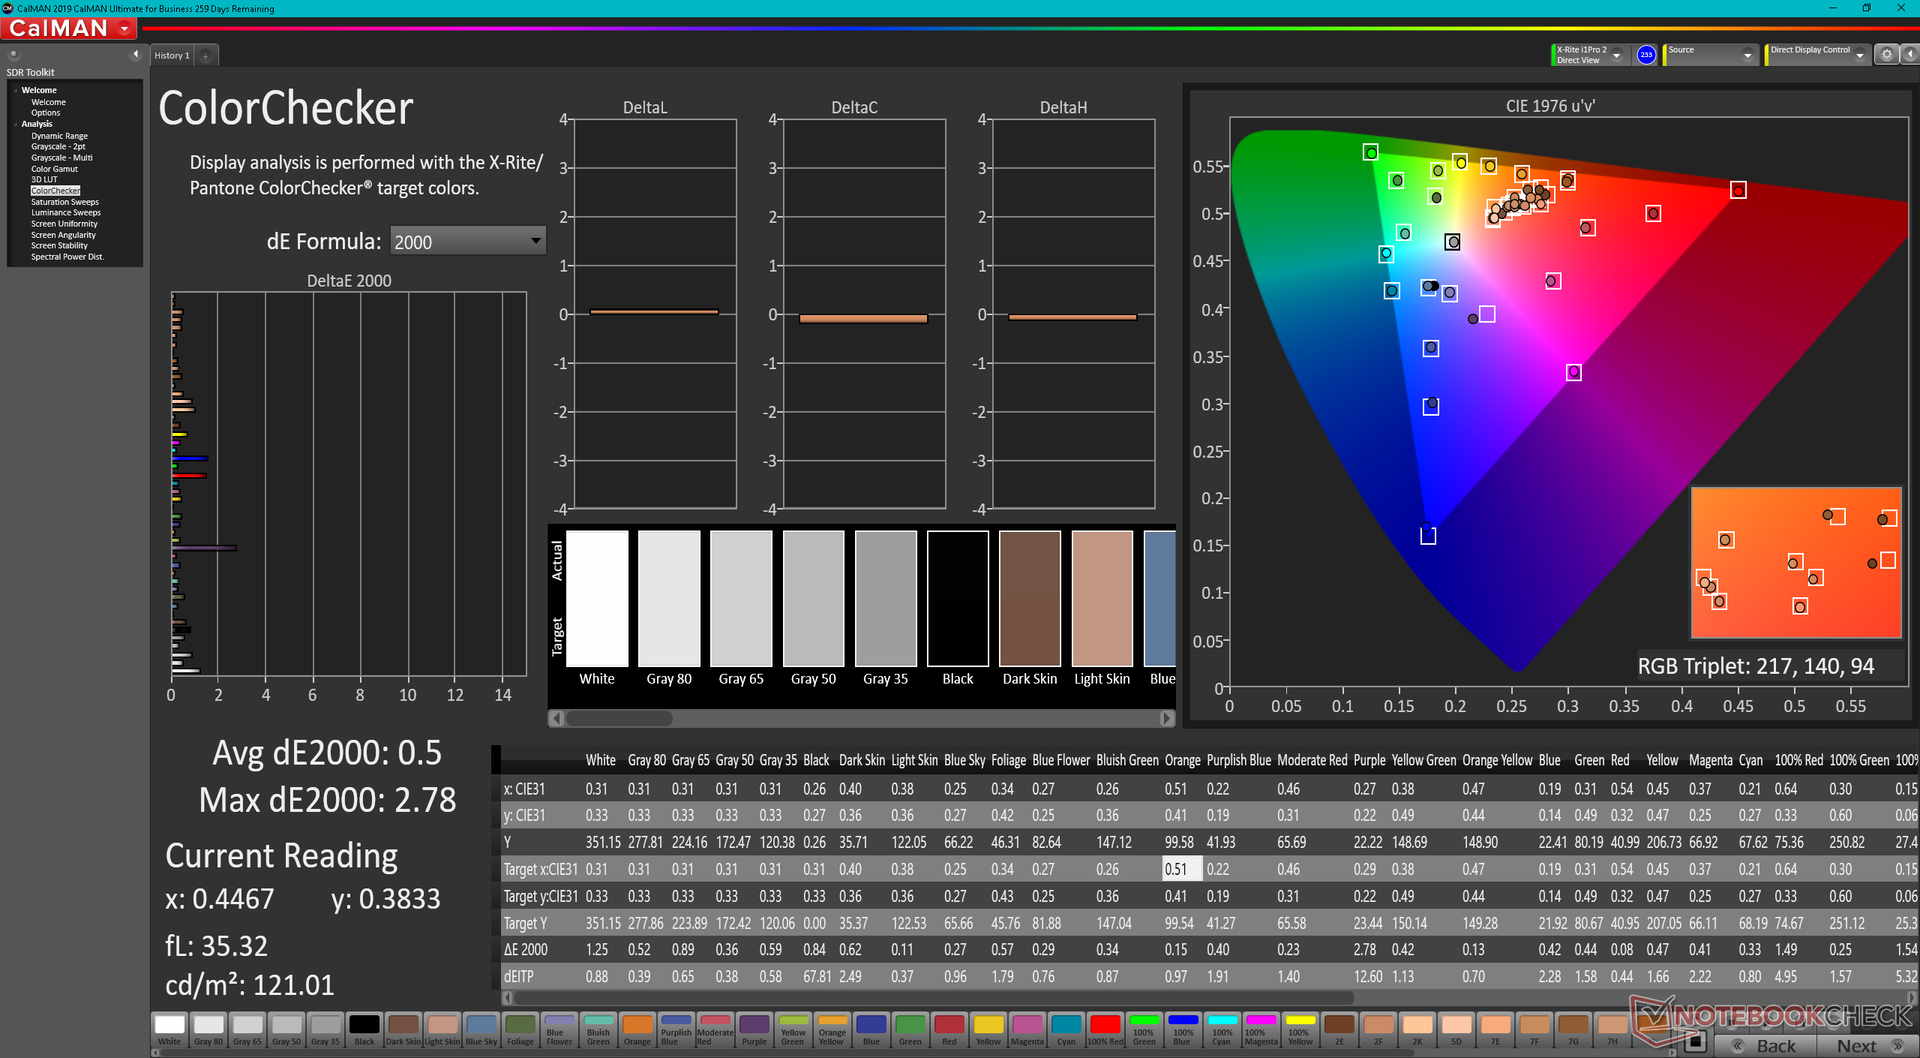
ΔE ColorChecker Calman: 1.74 | ∀{0.5-29.43 Ø4.71}
calibrated: 0.5
ΔE Greyscale Calman: 2.1 | ∀{0.09-98 Ø4.96}
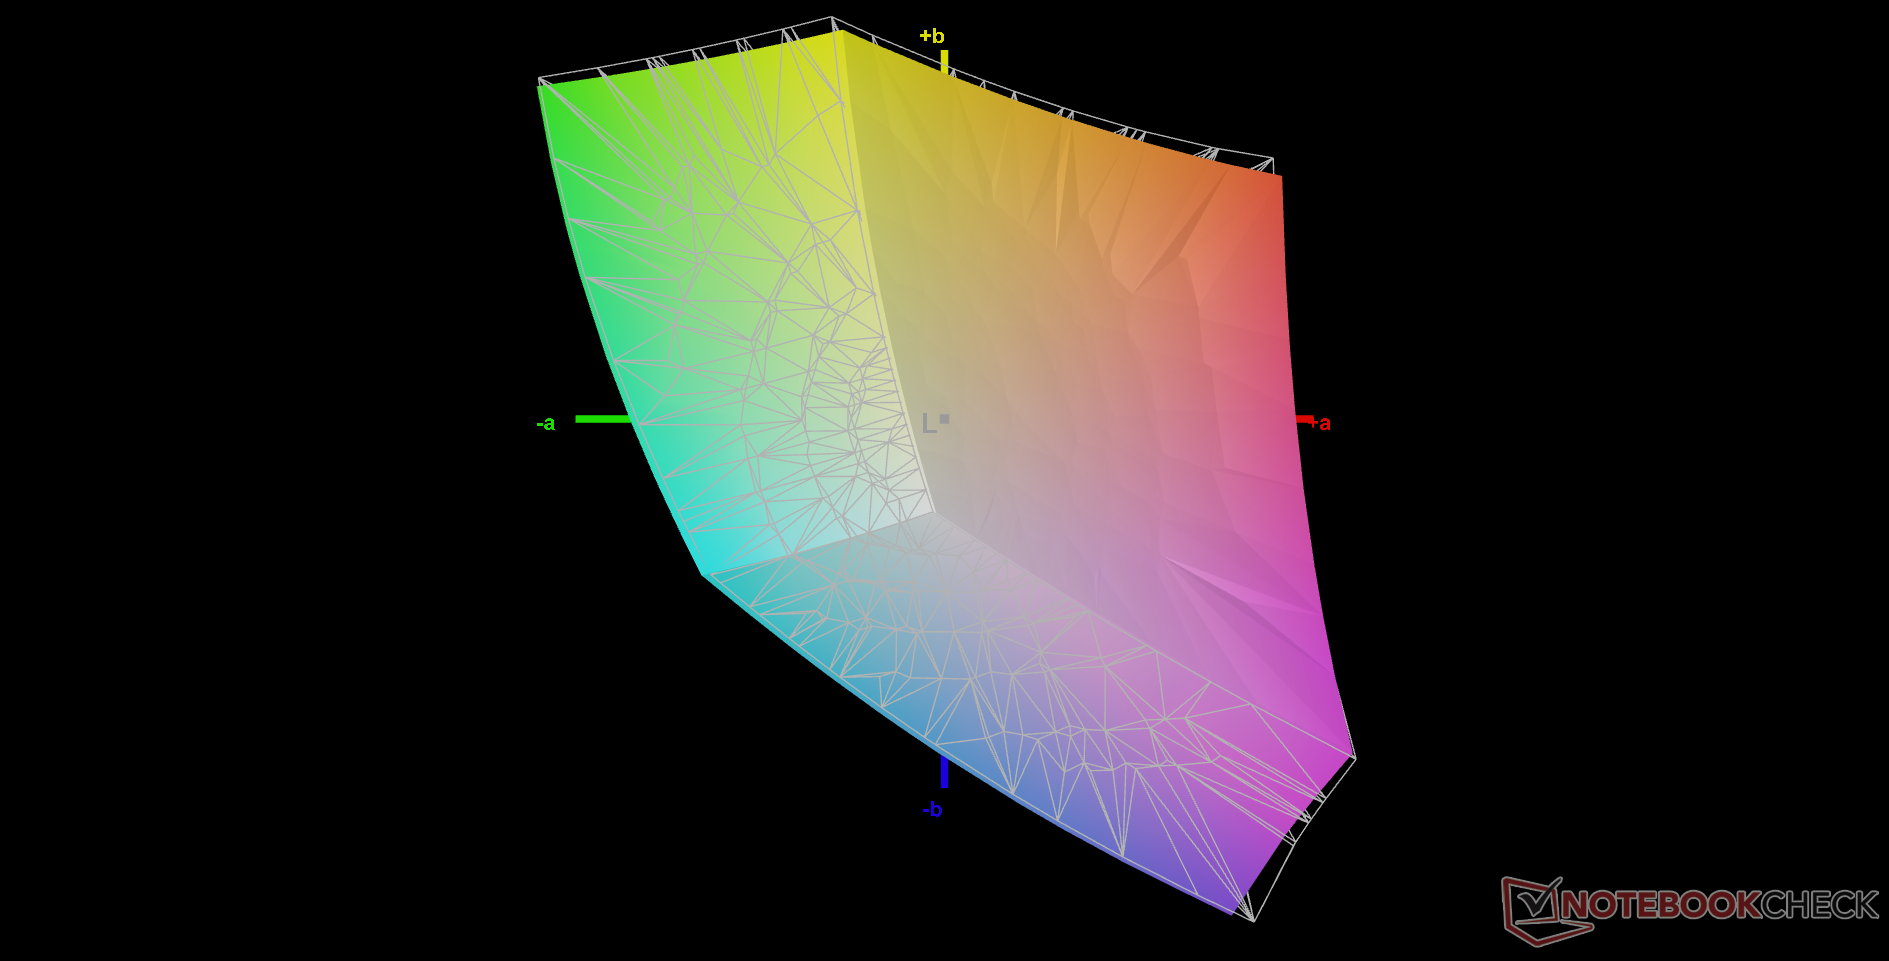
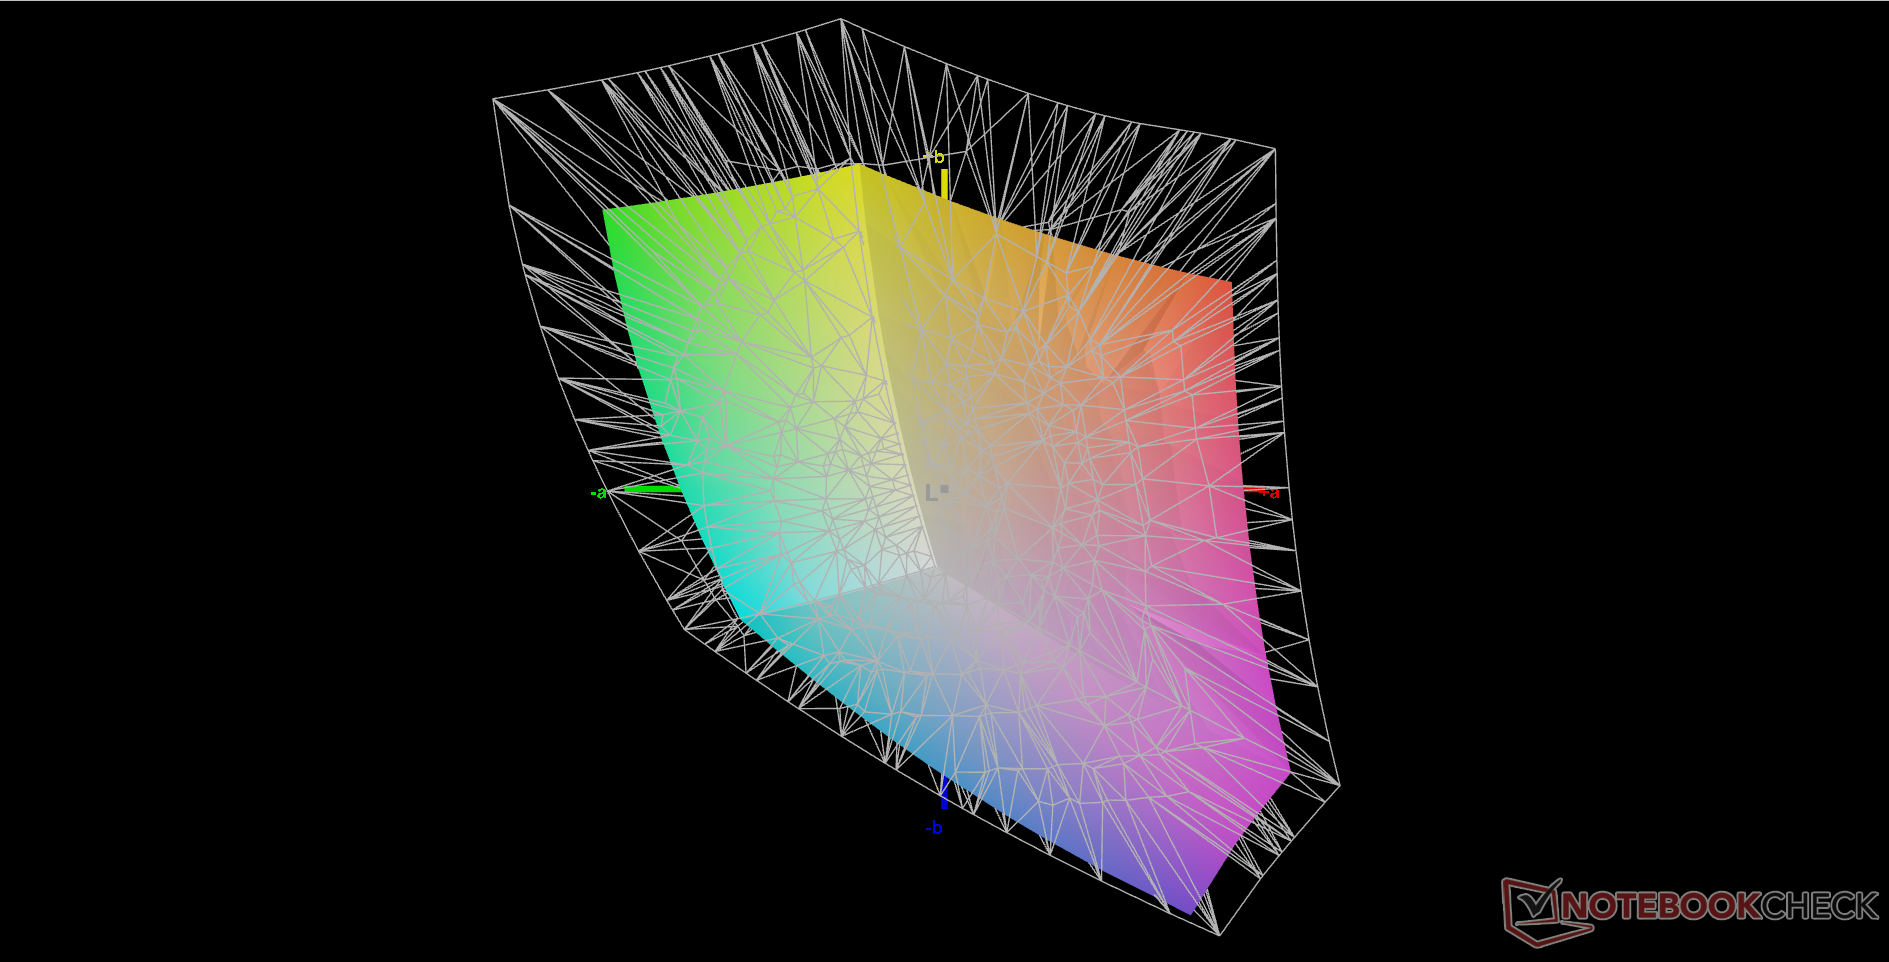
68.5% AdobeRGB 1998 (Argyll 3D)
97% sRGB (Argyll 3D)
66.4% Display P3 (Argyll 3D)
Gamma: 2.3
CCT: 6257 K
| Asus TUF Gaming F15 FX507ZM TL156VDXP0101, IPS, 1920x1080, 15.6" | Asus TUF Gaming F15 FX506HM Chi Mei N156HRA-EA1, IPS, 1920x1080, 15.6" | Asus TUF Dash F15 FX516PR LQ156M1JW26 (SHP1532), IPS, 1920x1080, 15.6" | Asus ROG Strix Scar 15 G533QS BOE CQ NE156QHM-NY1, IPS, 2560x1440, 15.6" | Asus Zephyrus S15 GX502L B156HAN12.0 (AUOBC8C), IPS, 1920x1080, 15.6" | Asus ZenBook Pro Duo UX582 LR-1BH2 SDC4143, OLED + IPS, 3840x2160, 15.6" | |
|---|---|---|---|---|---|---|
| Display | -36% | 0% | 25% | 4% | 33% | |
| Display P3 Coverage (%) | 66.4 | 41.9 -37% | 66.9 1% | 97.6 47% | 69.7 5% | 99.9 50% |
| sRGB Coverage (%) | 97 | 62.9 -35% | 98.1 1% | 99.9 3% | 99.7 3% | 100 3% |
| AdobeRGB 1998 Coverage (%) | 68.5 | 43.3 -37% | 67.9 -1% | 85.3 25% | 71.1 4% | 99.7 46% |
| Response Times | -238% | -46% | -74% | -63% | 69% | |
| Response Time Grey 50% / Grey 80% * (ms) | 5.6 ? | 28.4 ? -407% | 12 ? -114% | 14 ? -150% | 14 ? -150% | 2.4 ? 57% |
| Response Time Black / White * (ms) | 12.8 ? | 21.6 ? -69% | 10 ? 22% | 12.4 ? 3% | 9.6 ? 25% | 2.4 ? 81% |
| PWM Frequency (Hz) | 23580 ? | 59.5 ? | ||||
| Screen | -144% | -27% | -70% | -29% | -87% | |
| Brightness middle (cd/m²) | 353.7 | 268.3 -24% | 286 -19% | 304.3 -14% | 283 -20% | 345 -2% |
| Brightness (cd/m²) | 340 | 257 -24% | 275 -19% | 286 -16% | 289 -15% | 332 -2% |
| Brightness Distribution (%) | 89 | 84 -6% | 91 2% | 76 -15% | 90 1% | 87 -2% |
| Black Level * (cd/m²) | 0.34 | 0.34 -0% | 0.25 26% | 0.33 3% | 0.24 29% | |
| Contrast (:1) | 1040 | 789 -24% | 1144 10% | 922 -11% | 1179 13% | |
| Colorchecker dE 2000 * | 1.74 | 5.05 -190% | 2.43 -40% | 2.76 -59% | 2.26 -30% | 3.3 -90% |
| Colorchecker dE 2000 max. * | 3.63 | 15.43 -325% | 6.33 -74% | 5.57 -53% | 5.64 -55% | 7.2 -98% |
| Colorchecker dE 2000 calibrated * | 0.5 | 3.21 -542% | 0.83 -66% | 2.38 -376% | 1.11 -122% | 2.6 -420% |
| Greyscale dE 2000 * | 2.1 | 5.5 -162% | 3.5 -67% | 4 -90% | 3.4 -62% | 2 5% |
| Gamma | 2.3 96% | 2.35 94% | 2.32 95% | 2.14 103% | 2.228 99% | 2.01 109% |
| CCT | 6257 104% | 7392 88% | 7145 91% | 6844 95% | 7249 90% | 6566 99% |
| Color Space (Percent of AdobeRGB 1998) (%) | 68 | 71 | 89.2 | |||
| Color Space (Percent of sRGB) (%) | 91 | 93 | 100 | |||
| Totalt genomsnitt (program/inställningar) | -139% /
-134% | -24% /
-24% | -40% /
-50% | -29% /
-27% | 5% /
-31% |
* ... mindre är bättre
Det finns inga betydande förändringar i färgrymden mellan FX506 och FX507. Asus erbjuder inga AdobeRGB- eller DCI-P3-täckningsalternativ för sin FX507-serie till skillnad från FX507-serien Razer Blade 15 serien eller den professionella ZenBook-serien.
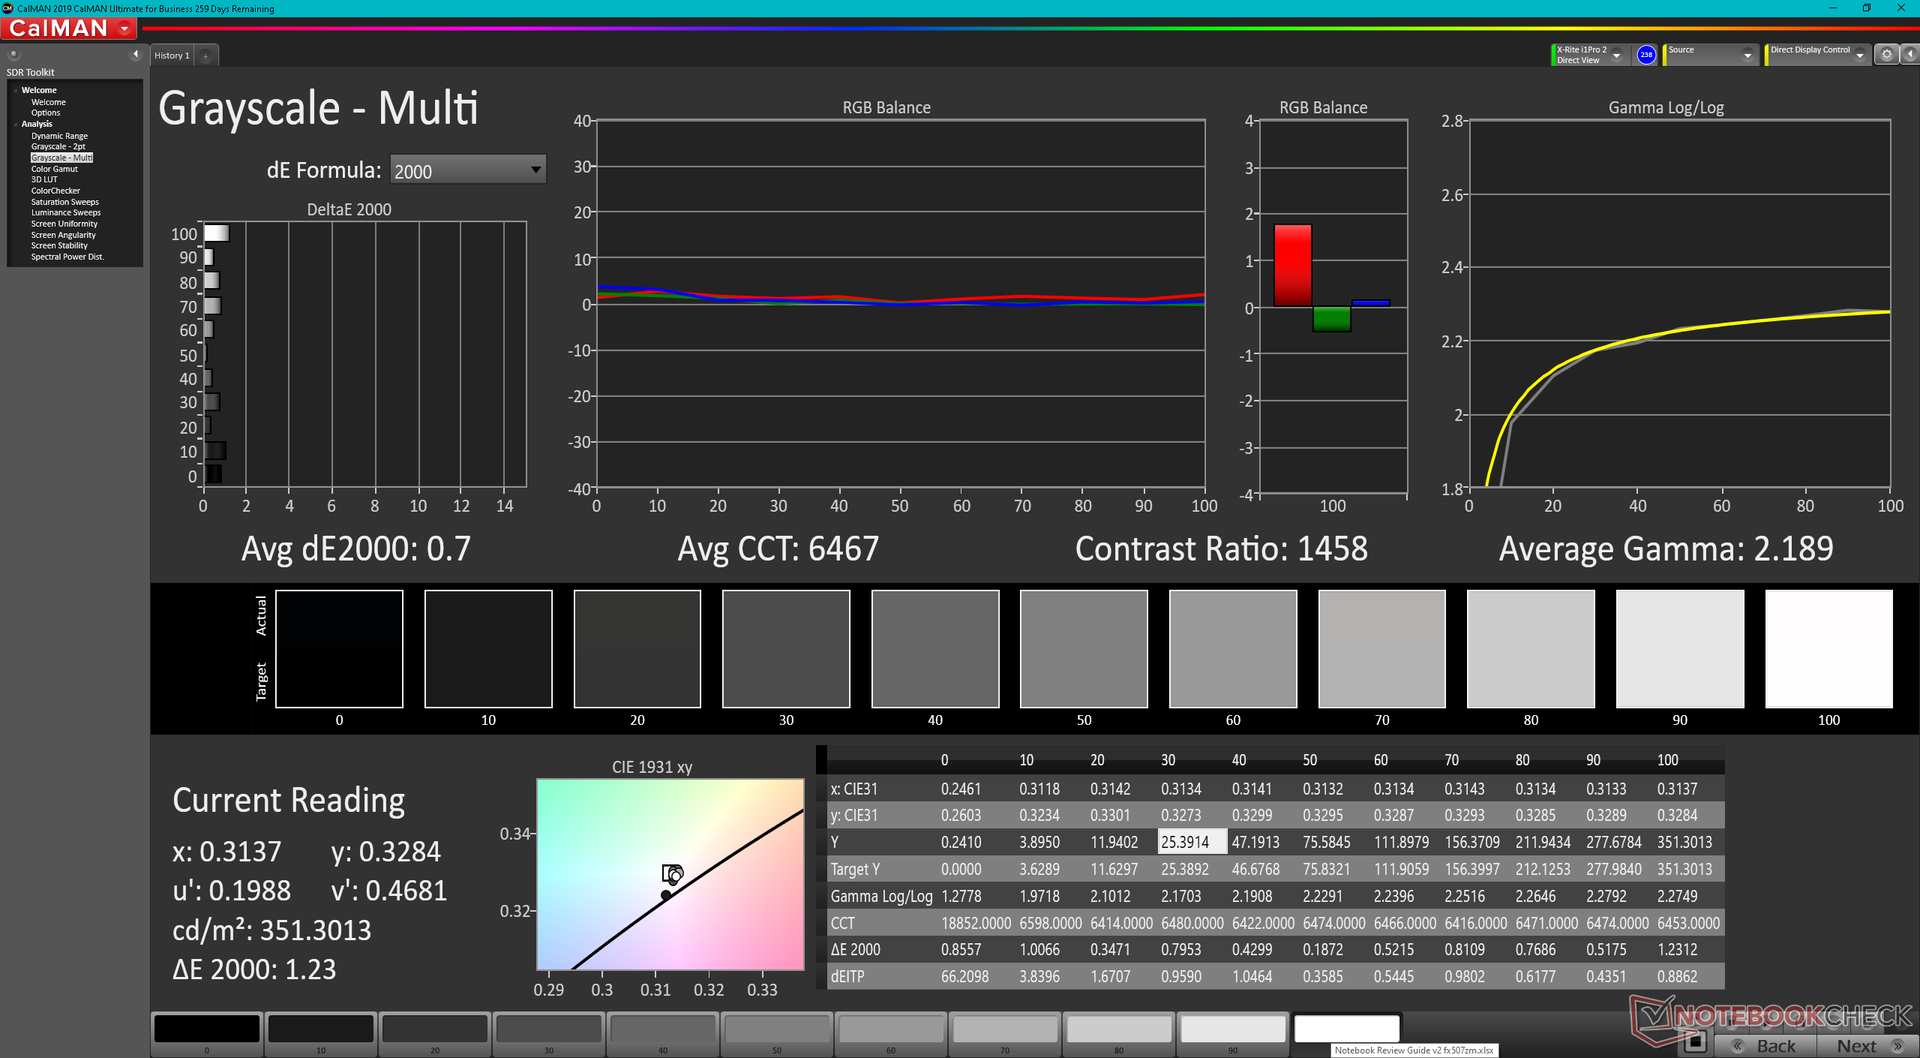
Skärmen är välkalibrerad direkt från förpackningen med genomsnittliga deltaE-värden för gråskala och färg på endast 2,1 respektive 1,74. Om vi själva kalibrerar skärmen ytterligare med en X-Rite-kolorimeter skulle deltaE förbättras ytterligare till mindre än 1 vardera.
Visa svarstider
| ↔ Svarstid svart till vitt | ||
|---|---|---|
| 12.8 ms ... stiga ↗ och falla ↘ kombinerat | ↗ 6.8 ms stiga | 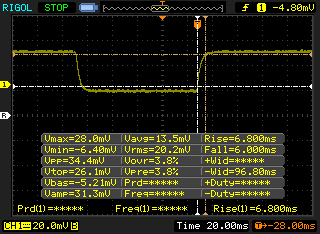 |
| ↘ 6 ms hösten | ||
| Skärmen visar bra svarsfrekvens i våra tester, men kan vara för långsam för konkurrenskraftiga spelare. I jämförelse sträcker sig alla testade enheter från 0.1 (minst) till 240 (maximalt) ms. » 33 % av alla enheter är bättre. Det betyder att den uppmätta svarstiden är bättre än genomsnittet av alla testade enheter (19.8 ms). | ||
| ↔ Svarstid 50 % grått till 80 % grått | ||
| 5.6 ms ... stiga ↗ och falla ↘ kombinerat | ↗ 3.2 ms stiga | 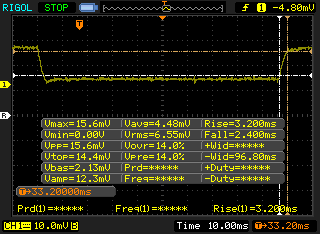 |
| ↘ 2.4 ms hösten | ||
| Skärmen visar väldigt snabba svarsfrekvenser i våra tester och borde vara mycket väl lämpad för fartfyllt spel. I jämförelse sträcker sig alla testade enheter från 0.165 (minst) till 636 (maximalt) ms. » 18 % av alla enheter är bättre. Det betyder att den uppmätta svarstiden är bättre än genomsnittet av alla testade enheter (31 ms). | ||
Skärmflimmer / PWM (Puls-Width Modulation)
| Skärmflimmer / PWM upptäcktes inte |  | ||
Som jämförelse: 52 % av alla testade enheter använder inte PWM för att dämpa skärmen. Om PWM upptäcktes mättes ett medelvärde av 7757 (minst: 5 - maximum: 343500) Hz. | |||

Prestanda - Intel 12th Gen-skillnaden
Provningsförhållanden
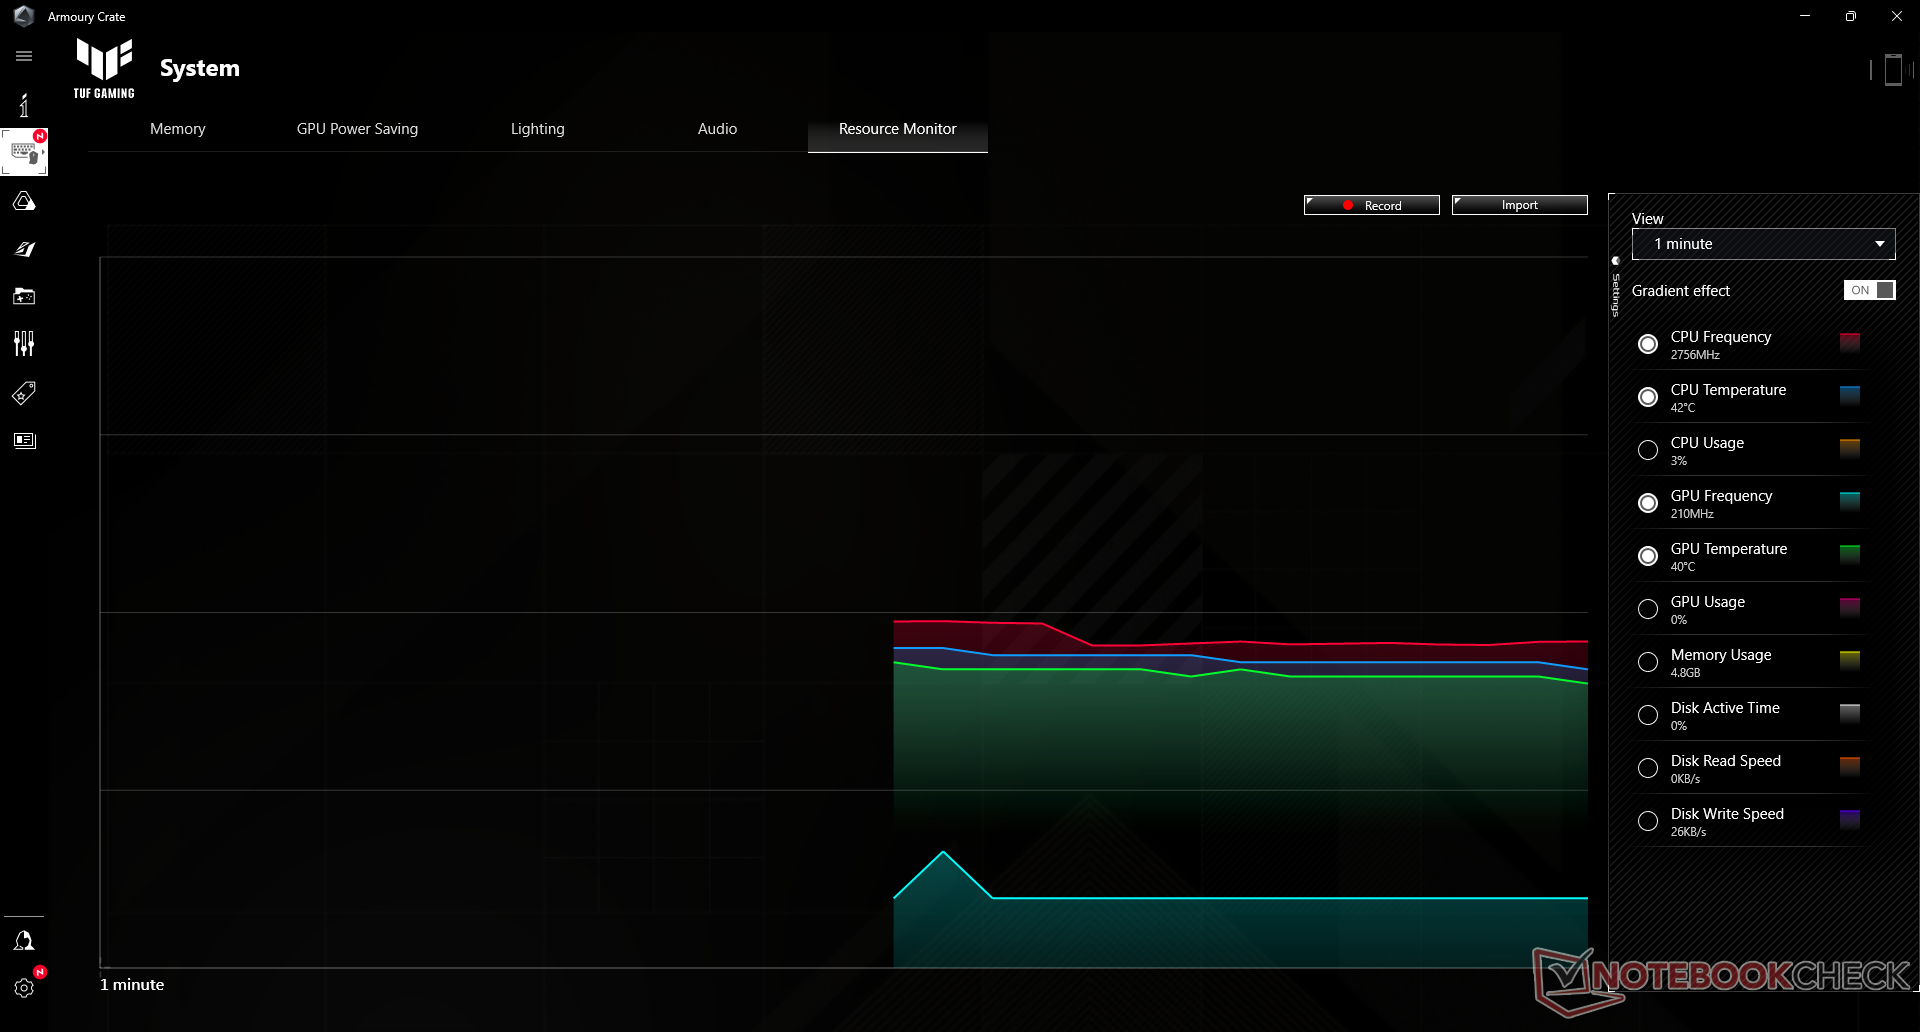
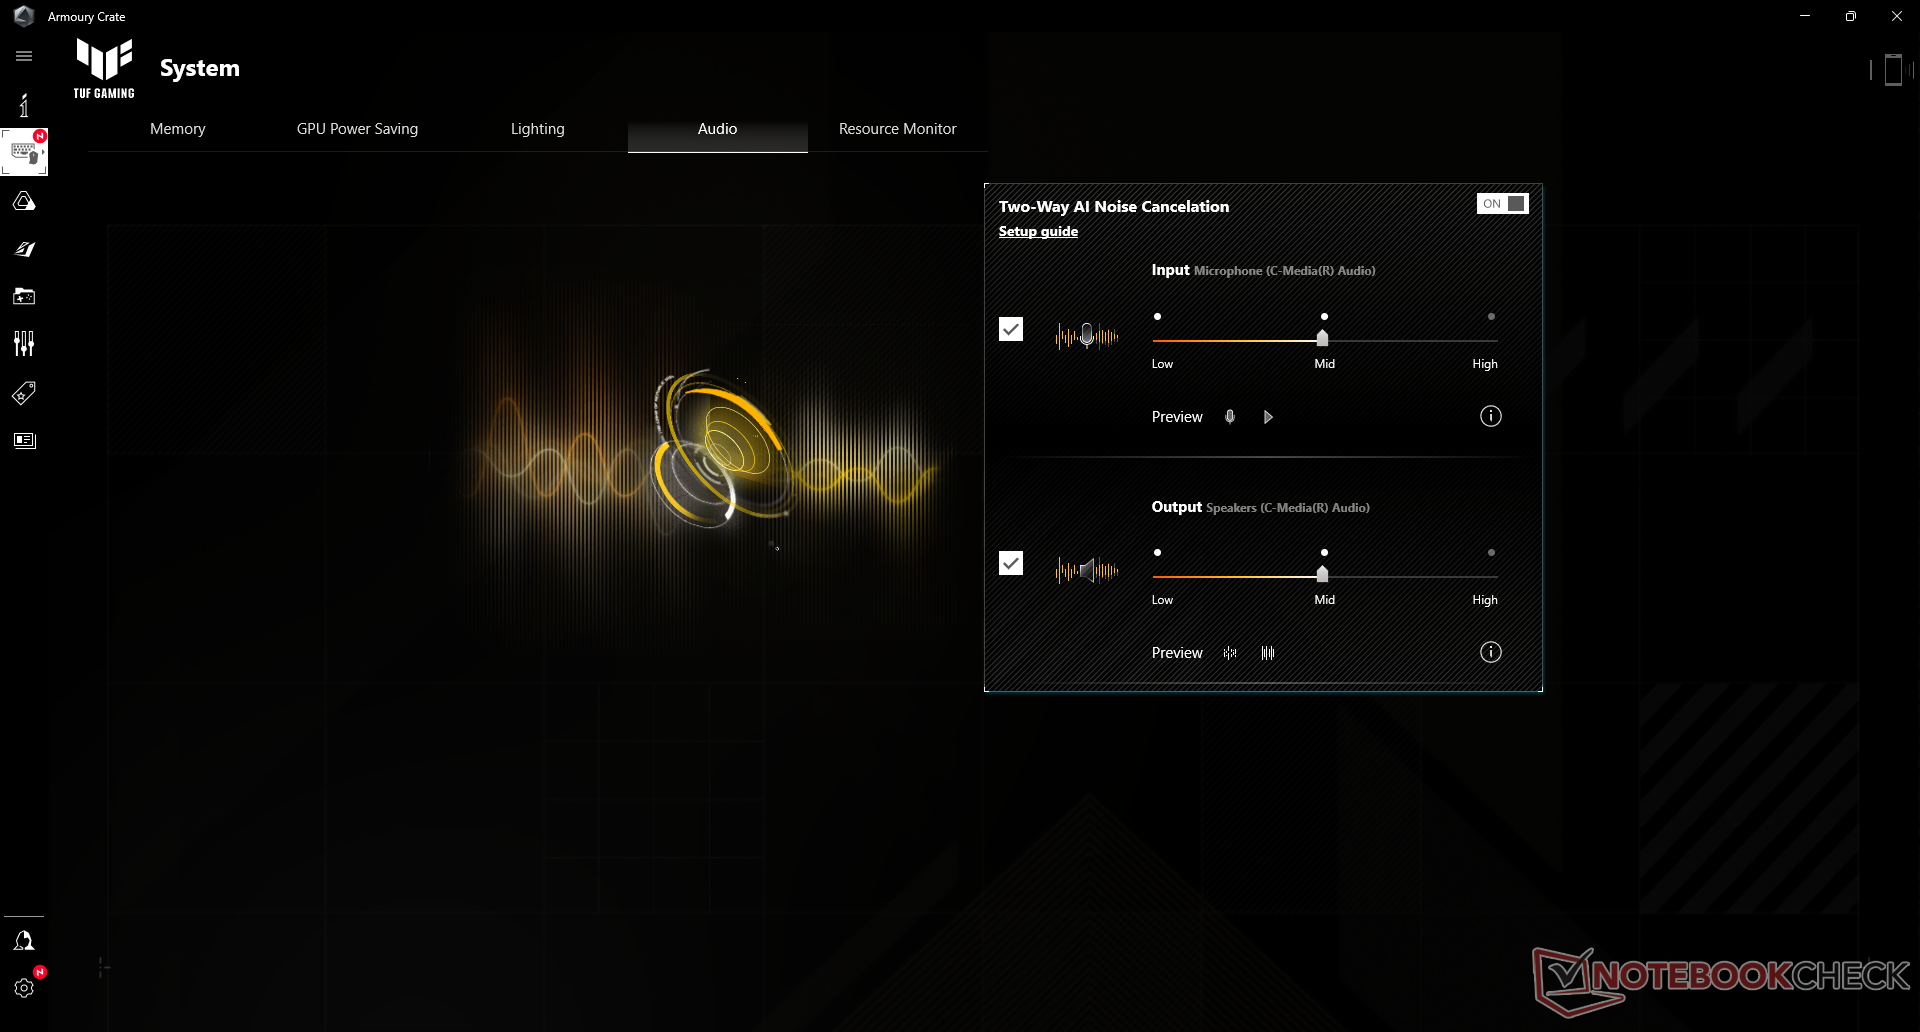
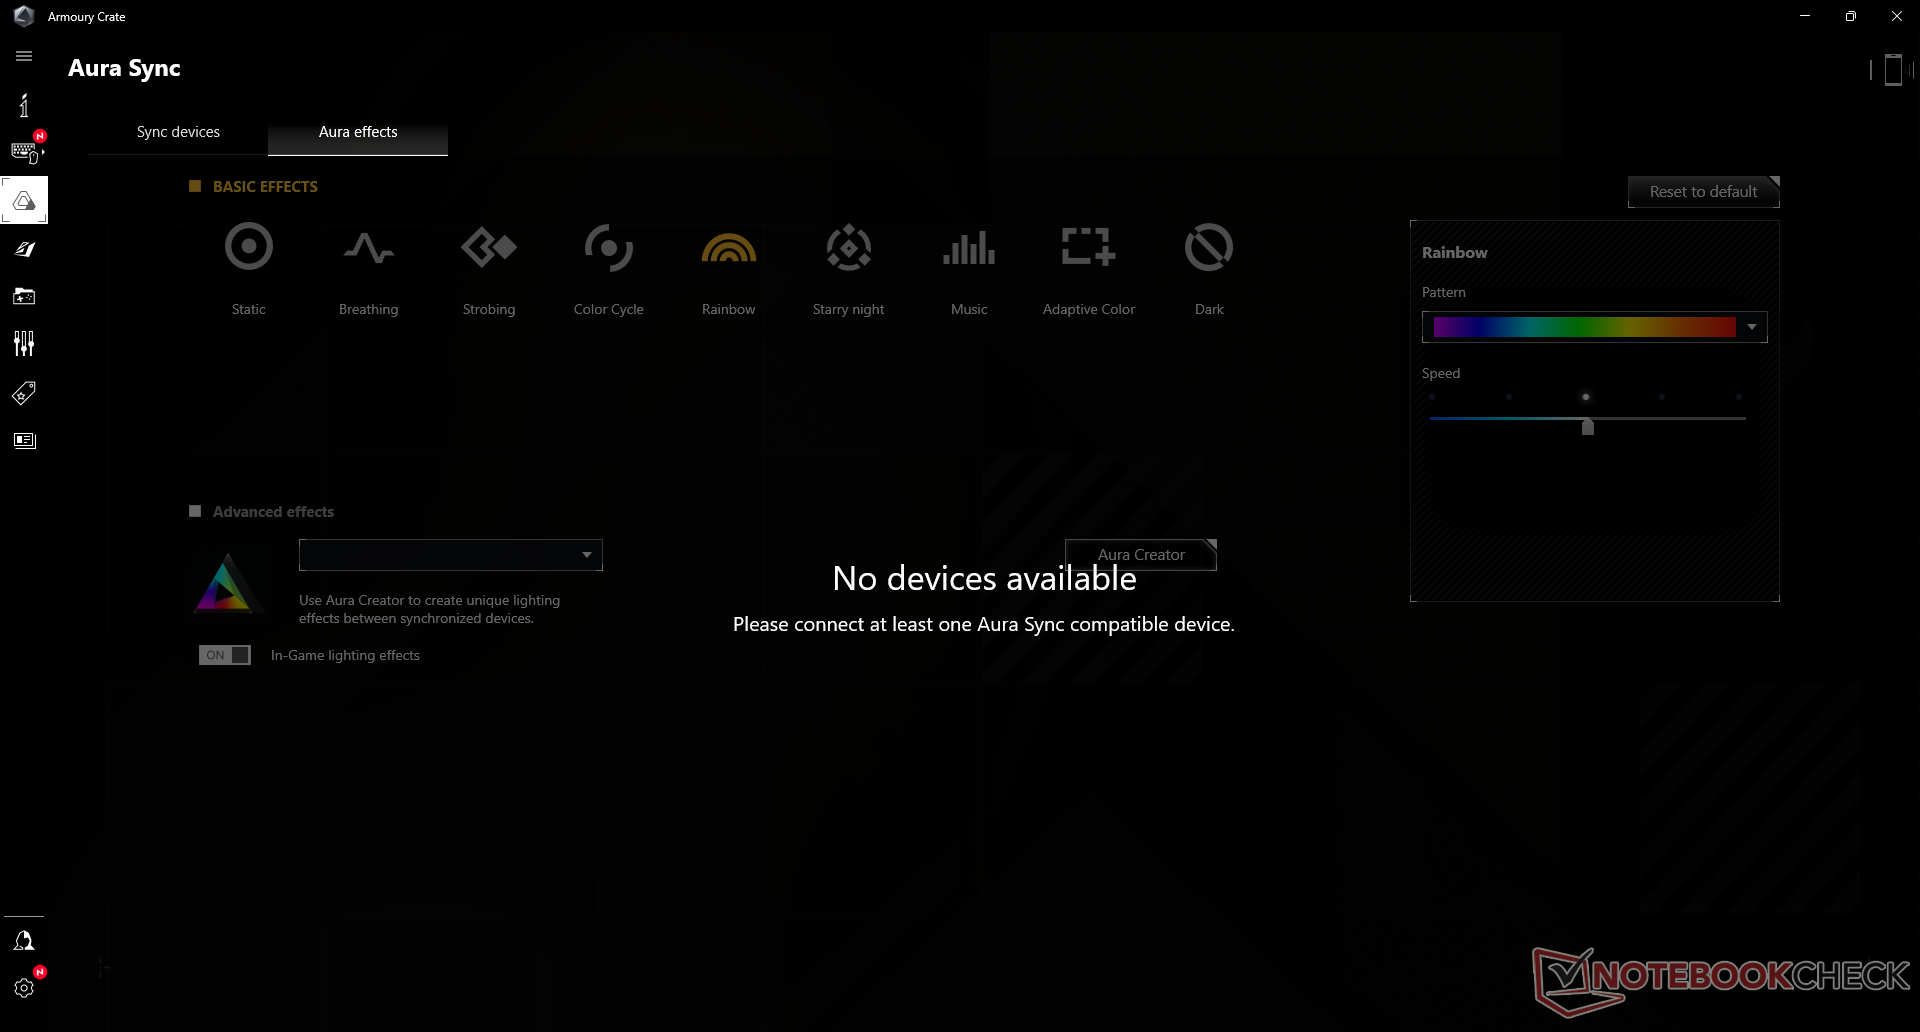
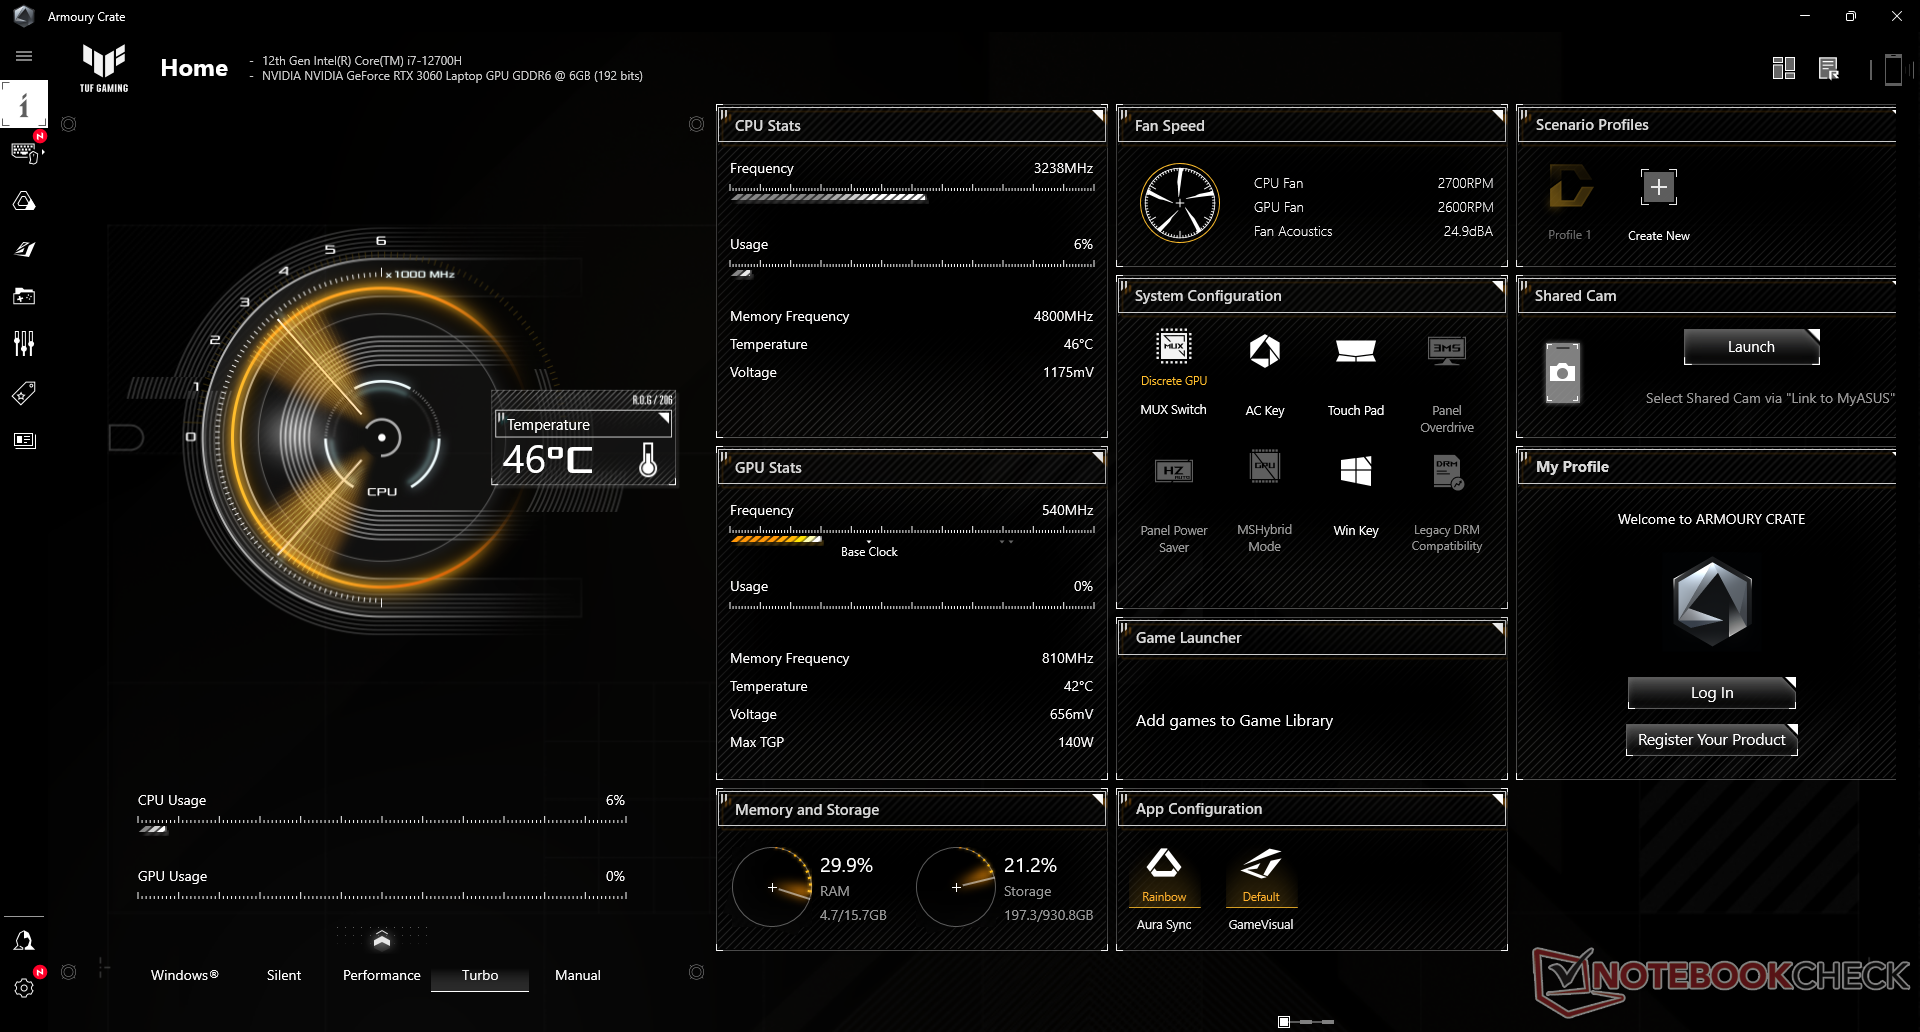
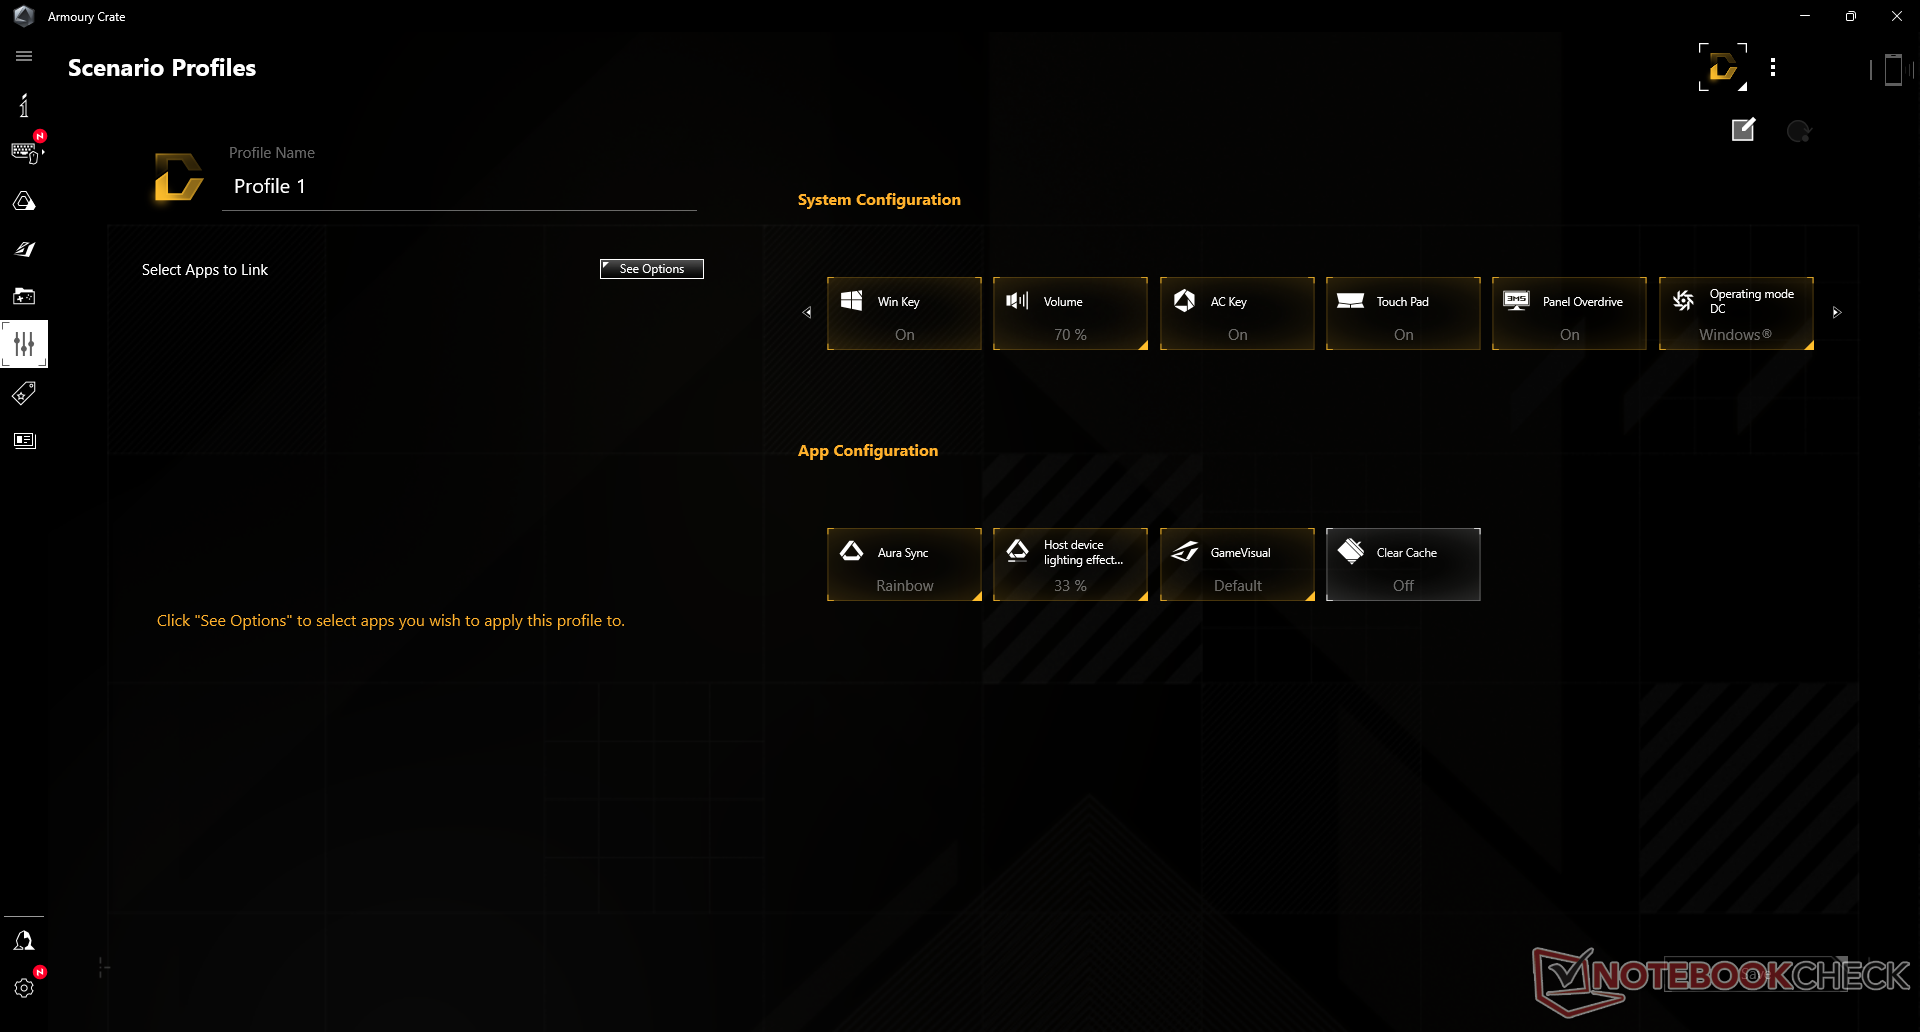
Vår enhet ställdes in i Turbo-läge och diskret GPU-läge via den förinstallerade Armoury Crate-profilen innan vi körde några av prestandabänkningarna nedan. Det rekommenderas att ägarna bekantar sig med den här programvaran eftersom den fungerar som nav för övervakning av prestanda, växling av hjälpfunktioner och växling mellan prestandaprofiler. Mest anmärkningsvärt är att användarna kan växla mellan MSHybrid- eller MUX-grafiklägena direkt via programvaran. Den tidigare FX506-modellen hade ingen MUX-omkopplare
Advanced Optimus stöds inte, vilket innebär att det krävs en mjuk omstart när man växlar mellan diskret eller Optimus-grafik. För att Adaptive Sync ska fungera på den interna skärmen måste användarna köra i MSHybrid-läget eftersom dGPU MUX-läget inte stöder Adaptive Sync. G-Sync och FreeSync kan aktiveras på en extern bildskärm som stöds oavsett GPU-läge så länge den är ansluten via USB-C DisplayPort och inte HDMI.
Målen för CPU TDP och GPU TGP kommer att variera beroende på Armoury Crate power profile enligt tabellen nedan. Därför måste ägarna köra systemet i Turbo- eller manuellt läge för att få ut mesta möjliga kraft ur FX507.
| Effektprofil | Tyst | Prestanda | Turbo | Manuell |
| Mål-CPU PL1 | 45 W | 70 W | 90 W | 100 W |
| Mål-CPU PL2 | 60 W | 105 W | 115 W | 135 W |
| Mål GPU TGP | <115 W (WhisperMode 2.0 på) | 100 W + 15 W | 115 W + 25 W | 115 W + 25 W |
| Max TDP+TGP för målet | 25 W + <100 W (WhisperMode 2.0 på) | 35 W + 100 W | 45 W + 115 W | 45 W + 115 W |
| Målvärde dB(A) (tillverkarens uppgifter) | <35 dB(A) | 40 dB(A) | 48 dB(A) | 52 dB(A) |
Processor
CPU-prestandan är utmärkt och exakt där vi förväntar oss att den ska vara i förhållande till andra bärbara datorer med exakt samma CPU. Jämfört med Core i7-11800H i förra årets FX506 är Core i7-12700H kan erbjuda ungefär 17 procent och 30 procent snabbare prestanda för enkeltråds och multitråds prestanda, respektive. Den totala prestandan är i huvudsak i nivå med den dyrare Core i9-12900H samtidigt som den ligger före Core i7-12800H som finns i Razer Blade 15
Hållbarheten för Turbo Boost är bra eftersom vår ursprungliga poäng på 2735 poäng endast sjönk med några få procentenheter när vi körde CineBench R15 xT i en slinga.
Cinebench R15 Multi Loop
Cinebench R23: Multi Core | Single Core
Cinebench R15: CPU Multi 64Bit | CPU Single 64Bit
Blender: v2.79 BMW27 CPU
7-Zip 18.03: 7z b 4 | 7z b 4 -mmt1
Geekbench 5.5: Multi-Core | Single-Core
HWBOT x265 Benchmark v2.2: 4k Preset
LibreOffice : 20 Documents To PDF
R Benchmark 2.5: Overall mean
| LibreOffice / 20 Documents To PDF | |
| Alienware m15 R4 RTX 3080 | |
| Asus VivoBook 15 Pro M3500QC-L1062 | |
| Schenker XMG Apex 15 NH57E PS | |
| MSI Delta 15 A5EFK | |
| Razer Blade 15 2022 | |
| Asus TUF Gaming F15 FX507ZM | |
| Genomsnitt Intel Core i7-12700H (34.2 - 95.3, n=63) | |
| Acer Predator Helios 300 PH315-53-786B | |
| Asus TUF Gaming F15 FX506HM | |
| MSI Vector GP66 12UGS | |
| Corsair One i300 | |
* ... mindre är bättre
AIDA64: FP32 Ray-Trace | FPU Julia | CPU SHA3 | CPU Queen | FPU SinJulia | FPU Mandel | CPU AES | CPU ZLib | FP64 Ray-Trace | CPU PhotoWorxx
| Performance rating | |
| Asus ROG Strix Scar 15 G533QS | |
| Genomsnitt Intel Core i7-12700H | |
| Asus Zephyrus S15 GX502L | |
| Asus TUF Gaming F15 FX507ZM | |
| Asus ZenBook Pro Duo UX582 LR-1BH2 | |
| Asus TUF Dash F15 FX516PR | |
| Asus TUF Gaming F15 FX506HM -9! | |
| AIDA64 / FP32 Ray-Trace | |
| Asus ROG Strix Scar 15 G533QS | |
| Asus Zephyrus S15 GX502L | |
| Asus ZenBook Pro Duo UX582 LR-1BH2 | |
| Genomsnitt Intel Core i7-12700H (2585 - 17957, n=64) | |
| Asus TUF Gaming F15 FX507ZM | |
| Asus TUF Dash F15 FX516PR | |
| AIDA64 / FPU Julia | |
| Asus ROG Strix Scar 15 G533QS | |
| Asus Zephyrus S15 GX502L | |
| Asus ZenBook Pro Duo UX582 LR-1BH2 | |
| Genomsnitt Intel Core i7-12700H (12439 - 90760, n=64) | |
| Asus TUF Gaming F15 FX507ZM | |
| Asus TUF Dash F15 FX516PR | |
| AIDA64 / CPU SHA3 | |
| Asus ROG Strix Scar 15 G533QS | |
| Asus TUF Gaming F15 FX507ZM | |
| Asus Zephyrus S15 GX502L | |
| Genomsnitt Intel Core i7-12700H (833 - 4242, n=64) | |
| Asus ZenBook Pro Duo UX582 LR-1BH2 | |
| Asus TUF Dash F15 FX516PR | |
| AIDA64 / CPU Queen | |
| Asus ROG Strix Scar 15 G533QS | |
| Asus TUF Gaming F15 FX507ZM | |
| Genomsnitt Intel Core i7-12700H (57923 - 103202, n=63) | |
| Asus Zephyrus S15 GX502L | |
| Asus ZenBook Pro Duo UX582 LR-1BH2 | |
| Asus TUF Dash F15 FX516PR | |
| AIDA64 / FPU SinJulia | |
| Asus ROG Strix Scar 15 G533QS | |
| Asus Zephyrus S15 GX502L | |
| Asus TUF Gaming F15 FX507ZM | |
| Asus ZenBook Pro Duo UX582 LR-1BH2 | |
| Genomsnitt Intel Core i7-12700H (3249 - 9939, n=64) | |
| Asus TUF Dash F15 FX516PR | |
| AIDA64 / FPU Mandel | |
| Asus ROG Strix Scar 15 G533QS | |
| Asus Zephyrus S15 GX502L | |
| Asus ZenBook Pro Duo UX582 LR-1BH2 | |
| Genomsnitt Intel Core i7-12700H (7135 - 44760, n=64) | |
| Asus TUF Gaming F15 FX507ZM | |
| Asus TUF Dash F15 FX516PR | |
| AIDA64 / CPU AES | |
| Asus ROG Strix Scar 15 G533QS | |
| Genomsnitt Intel Core i7-12700H (31839 - 144360, n=64) | |
| Asus TUF Dash F15 FX516PR | |
| Asus TUF Gaming F15 FX507ZM | |
| Asus Zephyrus S15 GX502L | |
| Asus ZenBook Pro Duo UX582 LR-1BH2 | |
| AIDA64 / CPU ZLib | |
| Asus TUF Gaming F15 FX507ZM | |
| Genomsnitt Intel Core i7-12700H (305 - 1171, n=64) | |
| Asus ROG Strix Scar 15 G533QS | |
| Asus Zephyrus S15 GX502L | |
| Asus ZenBook Pro Duo UX582 LR-1BH2 | |
| Asus TUF Dash F15 FX516PR | |
| Asus TUF Gaming F15 FX506HM | |
| AIDA64 / FP64 Ray-Trace | |
| Asus ROG Strix Scar 15 G533QS | |
| Asus Zephyrus S15 GX502L | |
| Asus ZenBook Pro Duo UX582 LR-1BH2 | |
| Genomsnitt Intel Core i7-12700H (1437 - 9692, n=64) | |
| Asus TUF Gaming F15 FX507ZM | |
| Asus TUF Dash F15 FX516PR | |
| AIDA64 / CPU PhotoWorxx | |
| Asus TUF Gaming F15 FX507ZM | |
| Genomsnitt Intel Core i7-12700H (12863 - 52207, n=64) | |
| Asus ROG Strix Scar 15 G533QS | |
| Asus Zephyrus S15 GX502L | |
| Asus TUF Dash F15 FX516PR | |
| Asus ZenBook Pro Duo UX582 LR-1BH2 | |
Systemets prestanda
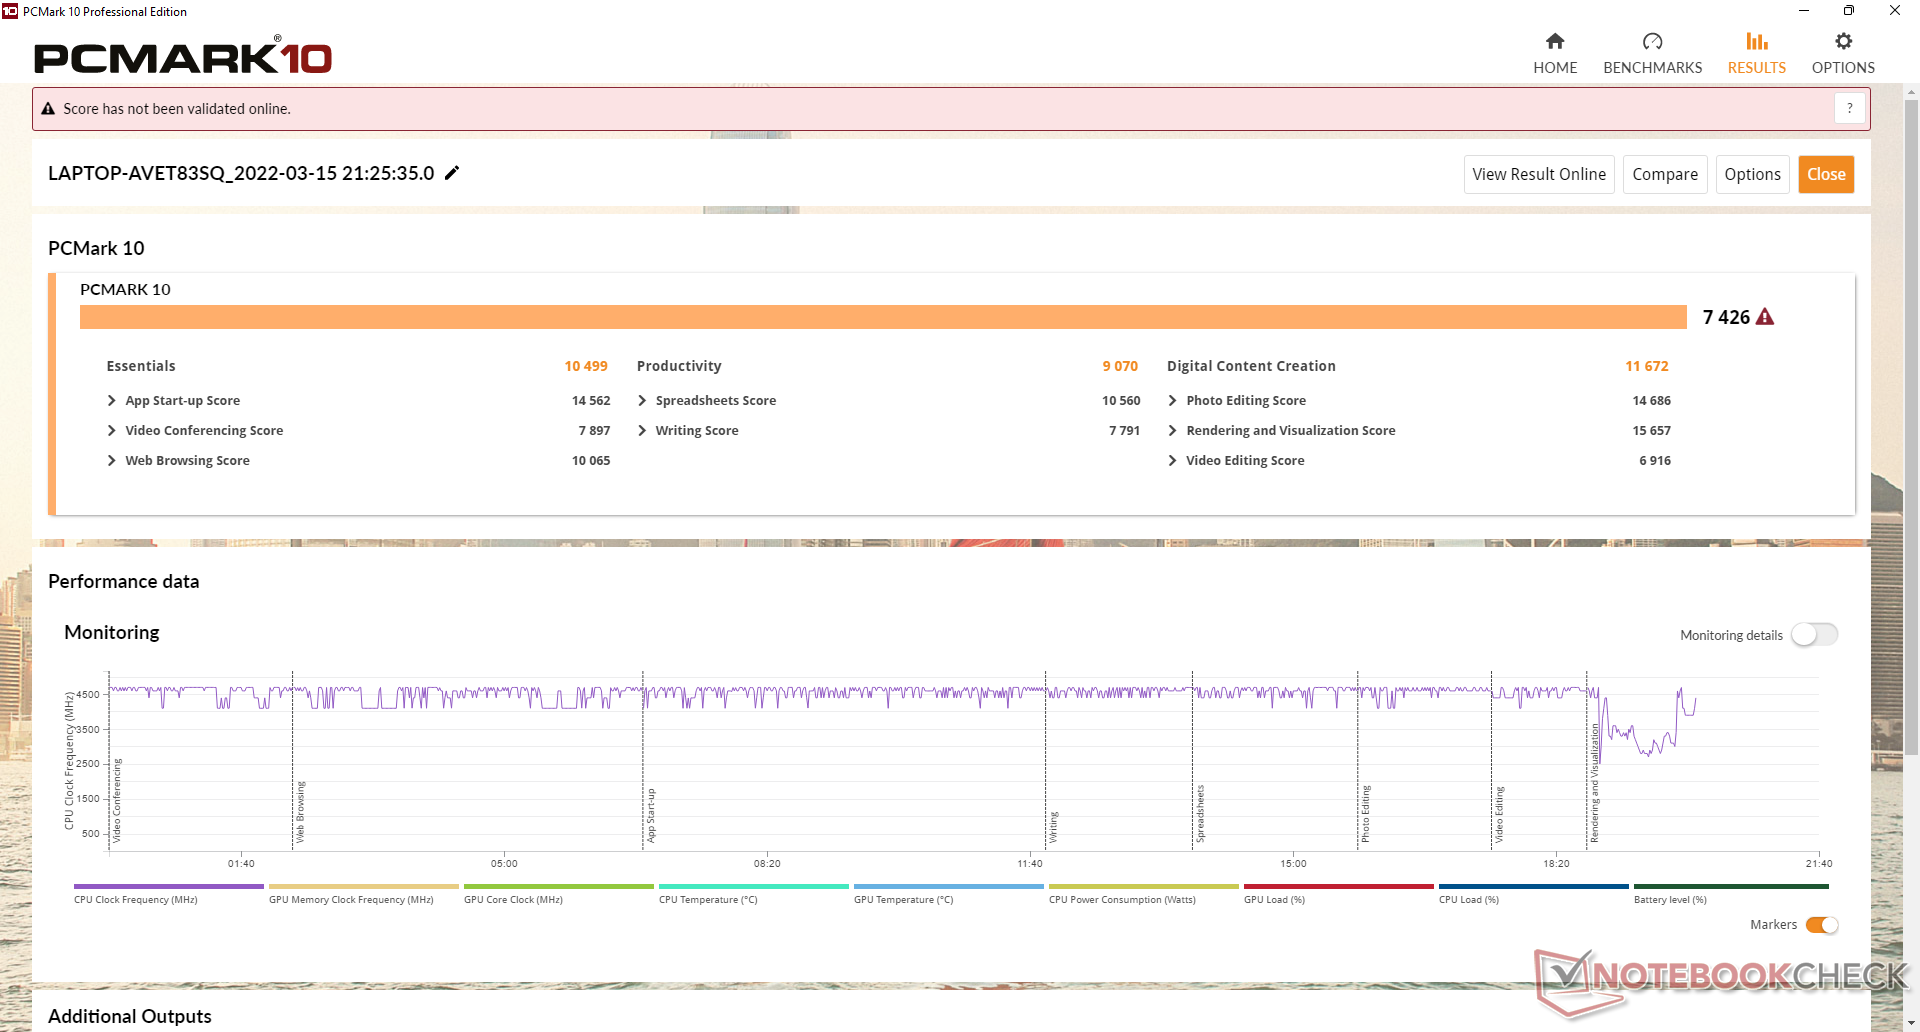
PCMark 10-resultaten är i stort sett identiska med FX506, vilket innebär att dagliga aktiviteter inte nödvändigtvis kommer att kännas snabbare trots CPU- och GPU-uppgraderingar. Undertestet Digital Content Creation är dock märkbart högre, vilket sannolikt beror på de snabbare GPU-klockfrekvenserna jämfört med den äldre RTX 3060.
| PCMark 10 / Score | |
| Asus TUF Gaming F15 FX507ZM | |
| Genomsnitt Intel Core i7-12700H, NVIDIA GeForce RTX 3060 Laptop GPU (5986 - 8156, n=12) | |
| Asus ROG Strix Scar 15 G533QS | |
| Asus TUF Gaming F15 FX506HM | |
| Asus TUF Dash F15 FX516PR | |
| Asus ZenBook Pro Duo UX582 LR-1BH2 | |
| Asus Zephyrus S15 GX502L | |
| PCMark 10 / Essentials | |
| Genomsnitt Intel Core i7-12700H, NVIDIA GeForce RTX 3060 Laptop GPU (9289 - 12144, n=12) | |
| Asus TUF Gaming F15 FX506HM | |
| Asus TUF Gaming F15 FX507ZM | |
| Asus ROG Strix Scar 15 G533QS | |
| Asus Zephyrus S15 GX502L | |
| Asus TUF Dash F15 FX516PR | |
| Asus ZenBook Pro Duo UX582 LR-1BH2 | |
| PCMark 10 / Productivity | |
| Asus ROG Strix Scar 15 G533QS | |
| Asus TUF Dash F15 FX516PR | |
| Genomsnitt Intel Core i7-12700H, NVIDIA GeForce RTX 3060 Laptop GPU (6161 - 10362, n=12) | |
| Asus TUF Gaming F15 FX507ZM | |
| Asus TUF Gaming F15 FX506HM | |
| Asus Zephyrus S15 GX502L | |
| Asus ZenBook Pro Duo UX582 LR-1BH2 | |
| PCMark 10 / Digital Content Creation | |
| Asus TUF Gaming F15 FX507ZM | |
| Genomsnitt Intel Core i7-12700H, NVIDIA GeForce RTX 3060 Laptop GPU (8950 - 12554, n=12) | |
| Asus ROG Strix Scar 15 G533QS | |
| Asus TUF Gaming F15 FX506HM | |
| Asus ZenBook Pro Duo UX582 LR-1BH2 | |
| Asus TUF Dash F15 FX516PR | |
| Asus Zephyrus S15 GX502L | |
| PCMark 10 Score | 7426 poäng | |
Hjälp | ||
| AIDA64 / Memory Copy | |
| Genomsnitt Intel Core i7-12700H (25615 - 80511, n=64) | |
| Asus TUF Gaming F15 FX507ZM | |
| Asus ROG Strix Scar 15 G533QS | |
| Asus Zephyrus S15 GX502L | |
| Asus ZenBook Pro Duo UX582 LR-1BH2 | |
| Asus TUF Dash F15 FX516PR | |
| AIDA64 / Memory Read | |
| Asus TUF Gaming F15 FX507ZM | |
| Genomsnitt Intel Core i7-12700H (25586 - 79442, n=64) | |
| Asus ROG Strix Scar 15 G533QS | |
| Asus Zephyrus S15 GX502L | |
| Asus ZenBook Pro Duo UX582 LR-1BH2 | |
| Asus TUF Dash F15 FX516PR | |
| AIDA64 / Memory Write | |
| Asus TUF Gaming F15 FX507ZM | |
| Genomsnitt Intel Core i7-12700H (23679 - 88660, n=64) | |
| Asus ROG Strix Scar 15 G533QS | |
| Asus Zephyrus S15 GX502L | |
| Asus ZenBook Pro Duo UX582 LR-1BH2 | |
| Asus TUF Dash F15 FX516PR | |
| AIDA64 / Memory Latency | |
| Asus TUF Dash F15 FX516PR | |
| Asus ROG Strix Scar 15 G533QS | |
| Genomsnitt Intel Core i7-12700H (76.2 - 133.9, n=62) | |
| Asus Zephyrus S15 GX502L | |
| Asus ZenBook Pro Duo UX582 LR-1BH2 | |
| Asus TUF Gaming F15 FX506HM | |
| Asus TUF Gaming F15 FX507ZM | |
* ... mindre är bättre
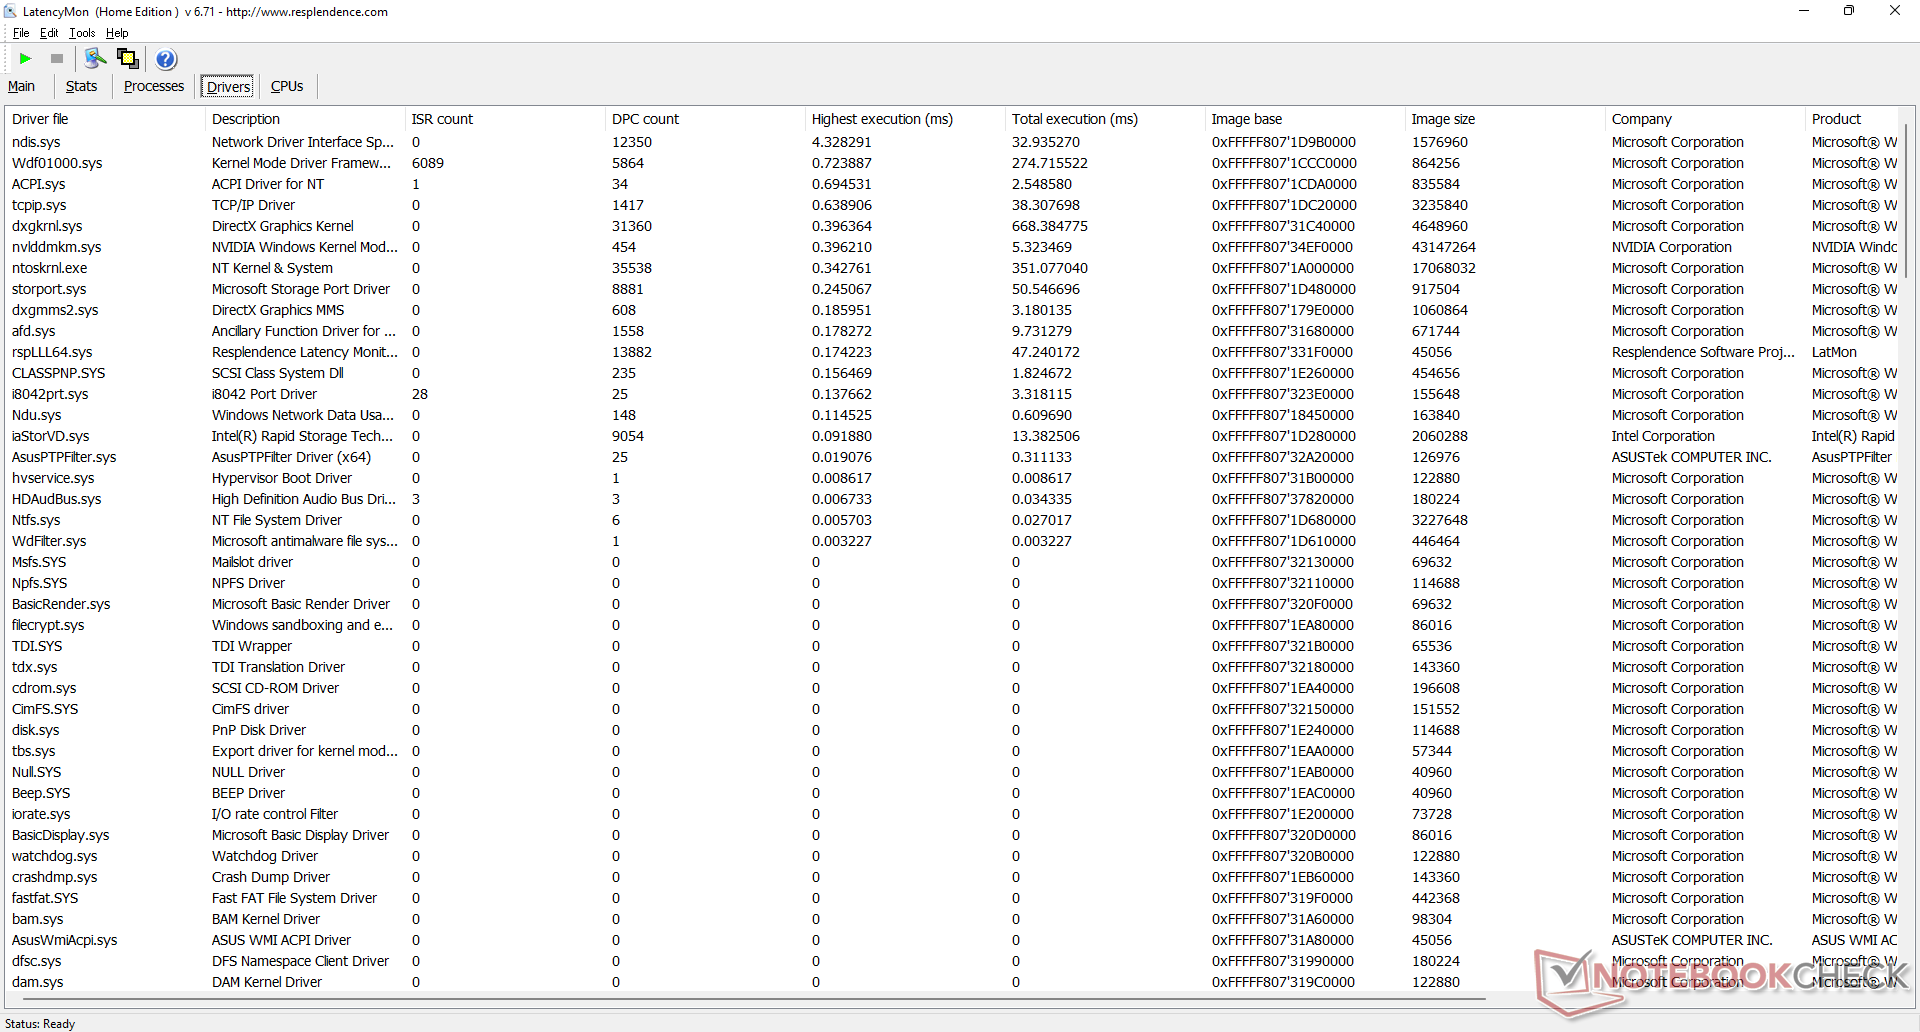
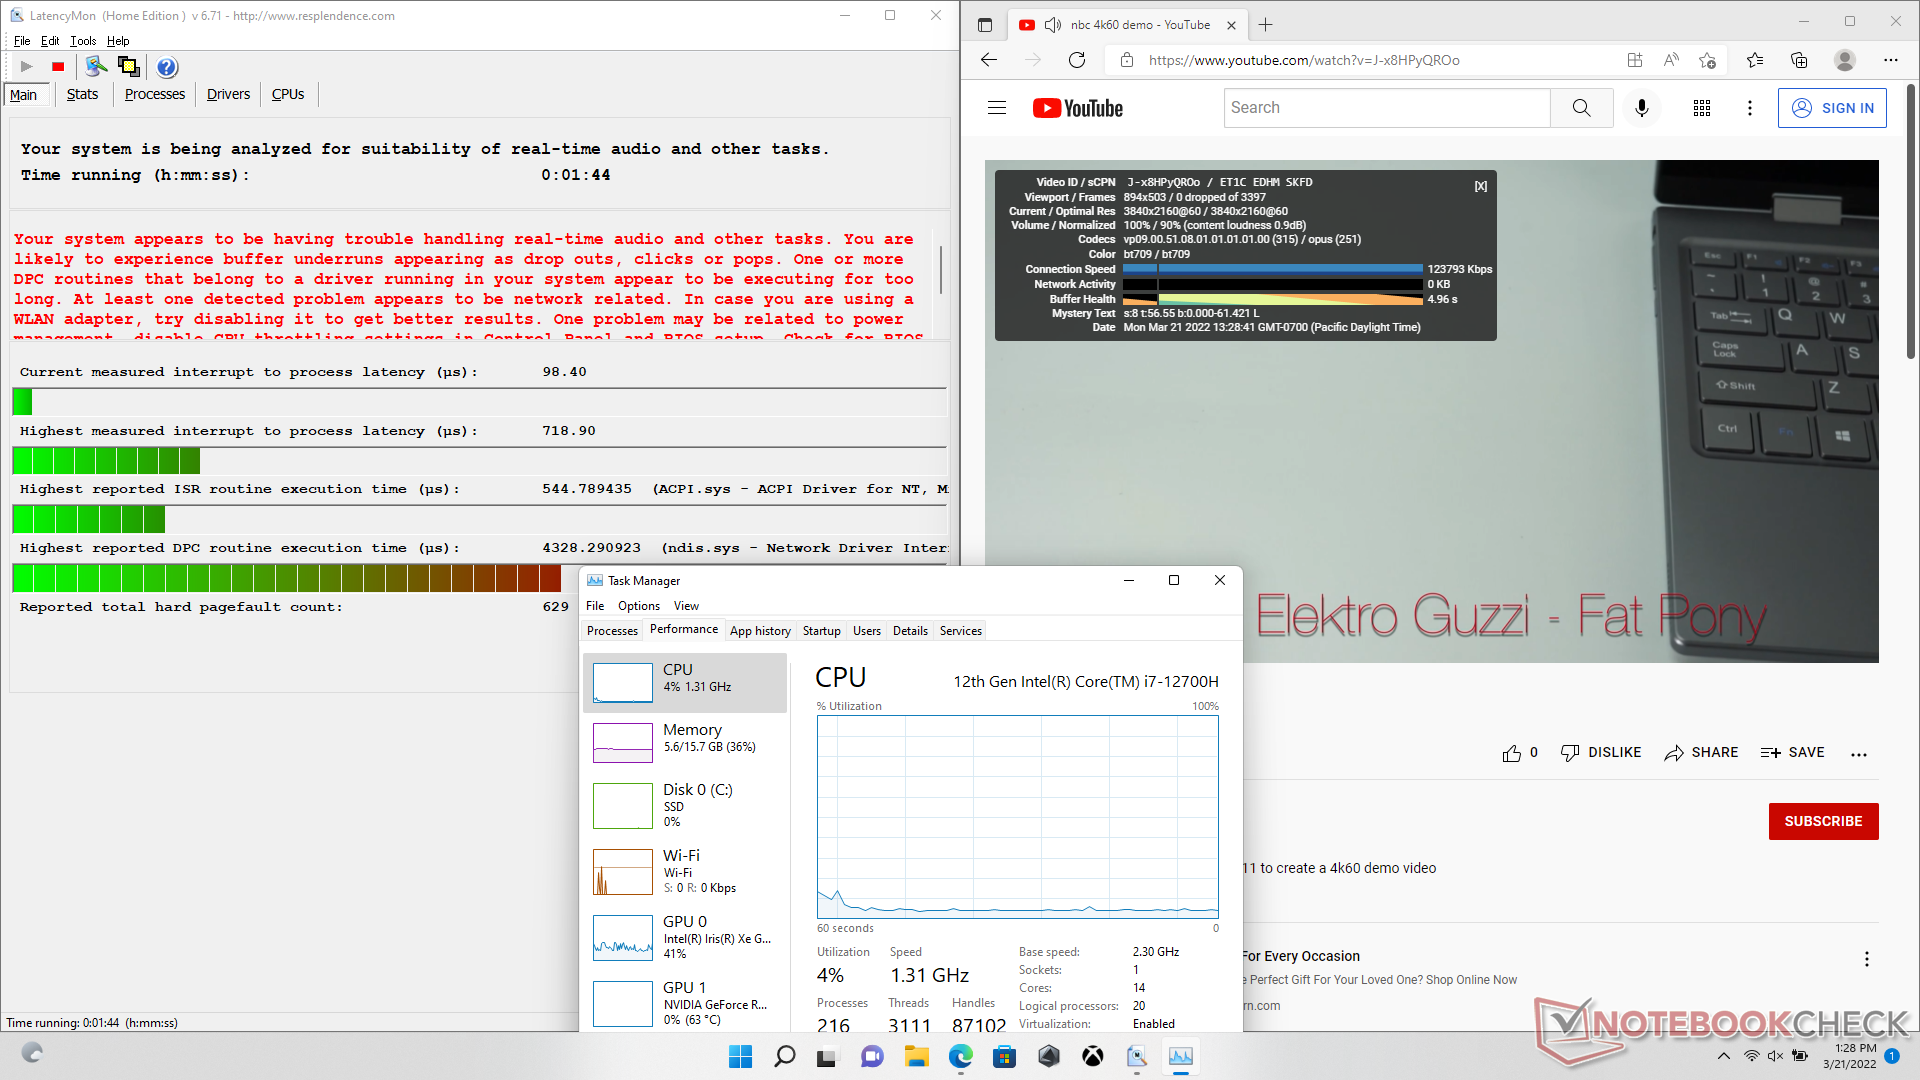
DPC-latenstid
LatencyMon avslöjar DPC-problem när du öppnar flera webbläsarflikar på vår hemsida. uppspelning av 4K-video vid 60 FPS går annars smidigt och utan att några ramar tappas bort.
| DPC Latencies / LatencyMon - interrupt to process latency (max), Web, Youtube, Prime95 | |
| Asus Zephyrus S15 GX502L | |
| Asus TUF Gaming F15 FX506HM | |
| Asus ROG Strix Scar 15 G533QS | |
| Asus TUF Dash F15 FX516PR | |
| Asus ZenBook Pro Duo UX582 LR-1BH2 | |
| Asus TUF Gaming F15 FX507ZM | |
* ... mindre är bättre
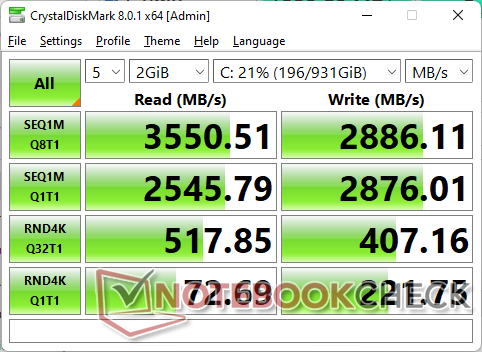
Lagringsenheter - upp till två M.2 PCIe4 x4-enheter
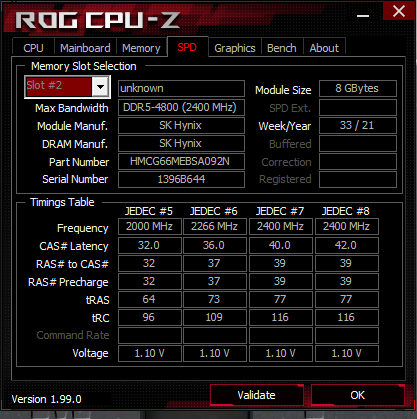
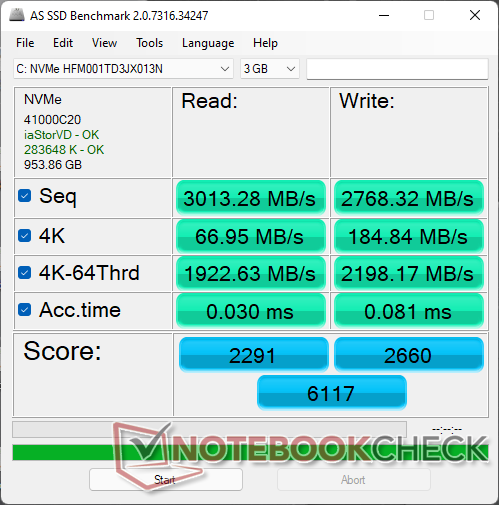
Vår enhet levereras med sammaSK Hynix HFM001TD3JX013N PCIe3 x4 NVMe SSD som i förra årets modell. Tänk dock på att FX507 stöder PCIe4 x4 SSD-diskar, vilket innebär att slutanvändare kan installera ännu snabbare diskar om så önskas. Hållbarheten i prestandan kan vara begränsad eftersom det inte finns någon värmespridare ovanpå de två M.2-platserna.

| Drive Performance rating - Percent | |
| Asus TUF Gaming F15 FX507ZM | |
| Genomsnitt SK Hynix HFM001TD3JX013N | |
| Asus TUF Gaming F15 FX506HM | |
| Asus Zephyrus S15 GX502L | |
| Asus ZenBook Pro Duo UX582 LR-1BH2 | |
| Asus TUF Dash F15 FX516PR | |
| Asus ROG Strix Scar 15 G533QS | |
* ... mindre är bättre
Disk Throttling: DiskSpd Read Loop, Queue Depth 8
GPU-prestanda - 140 W TGP Graphics
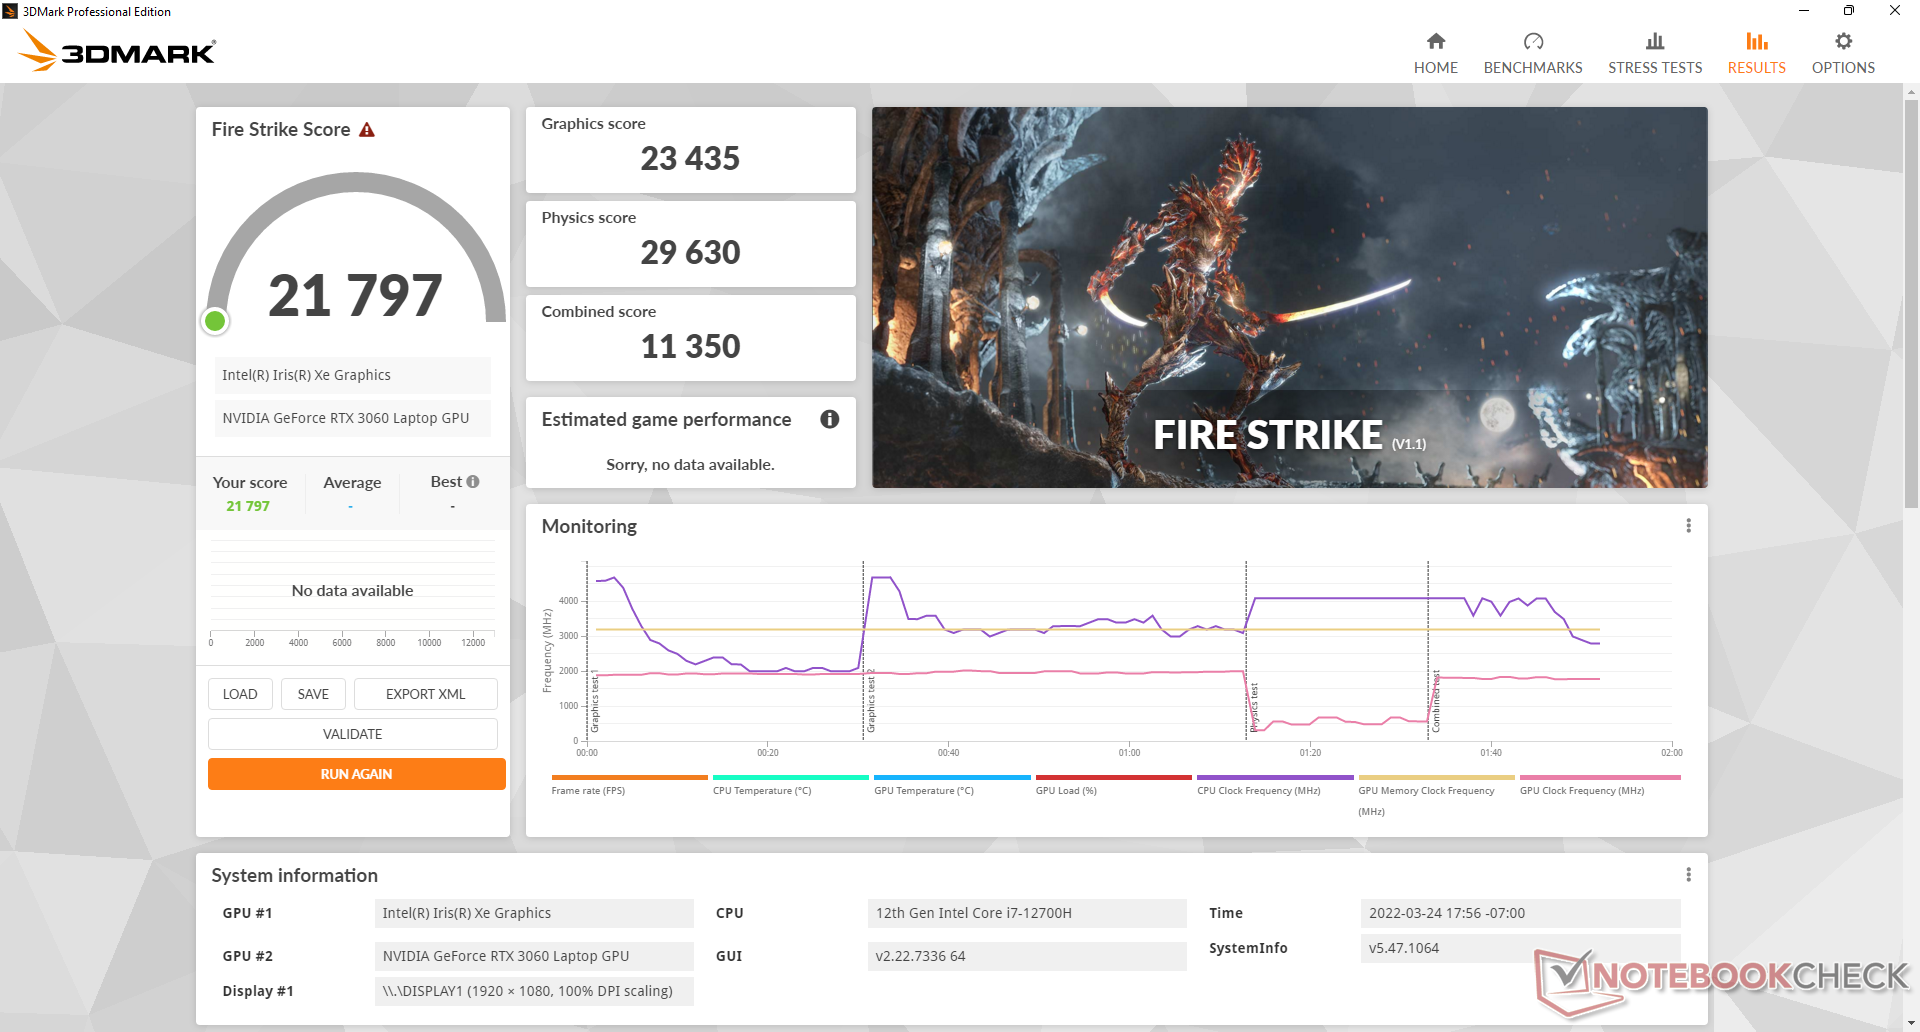
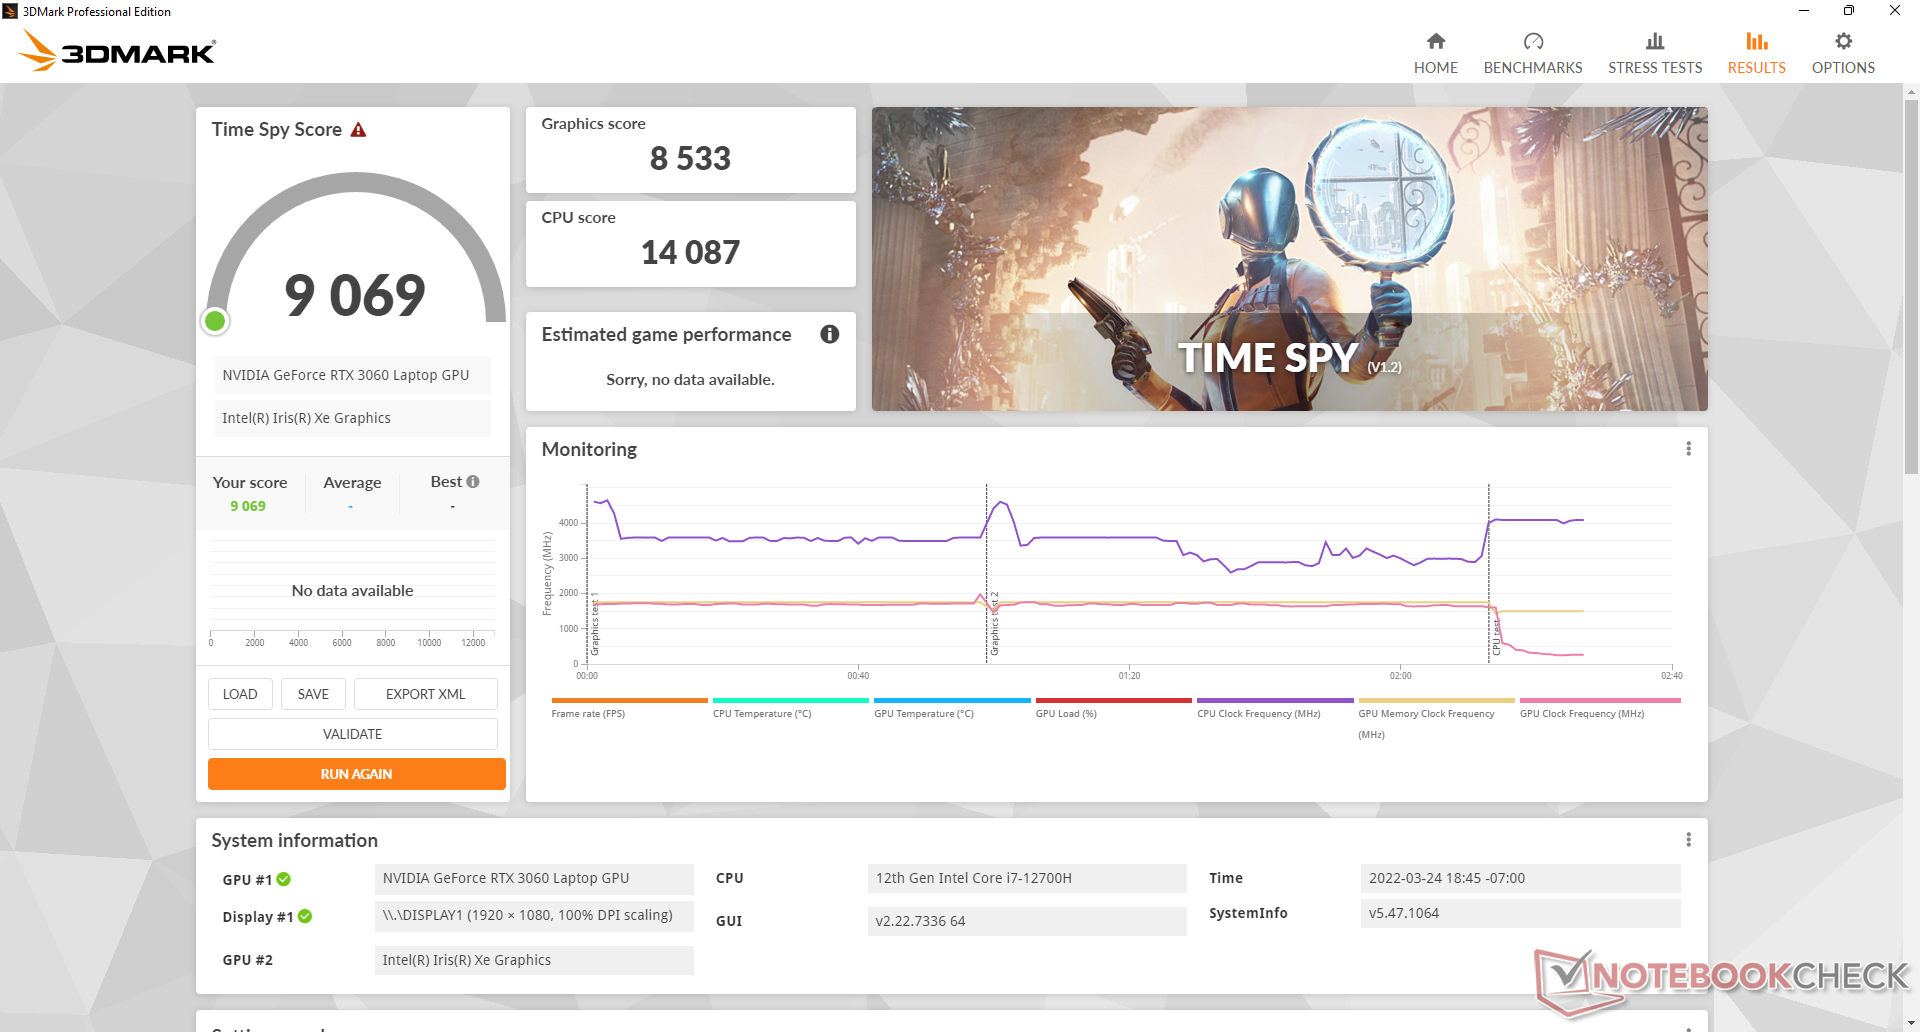
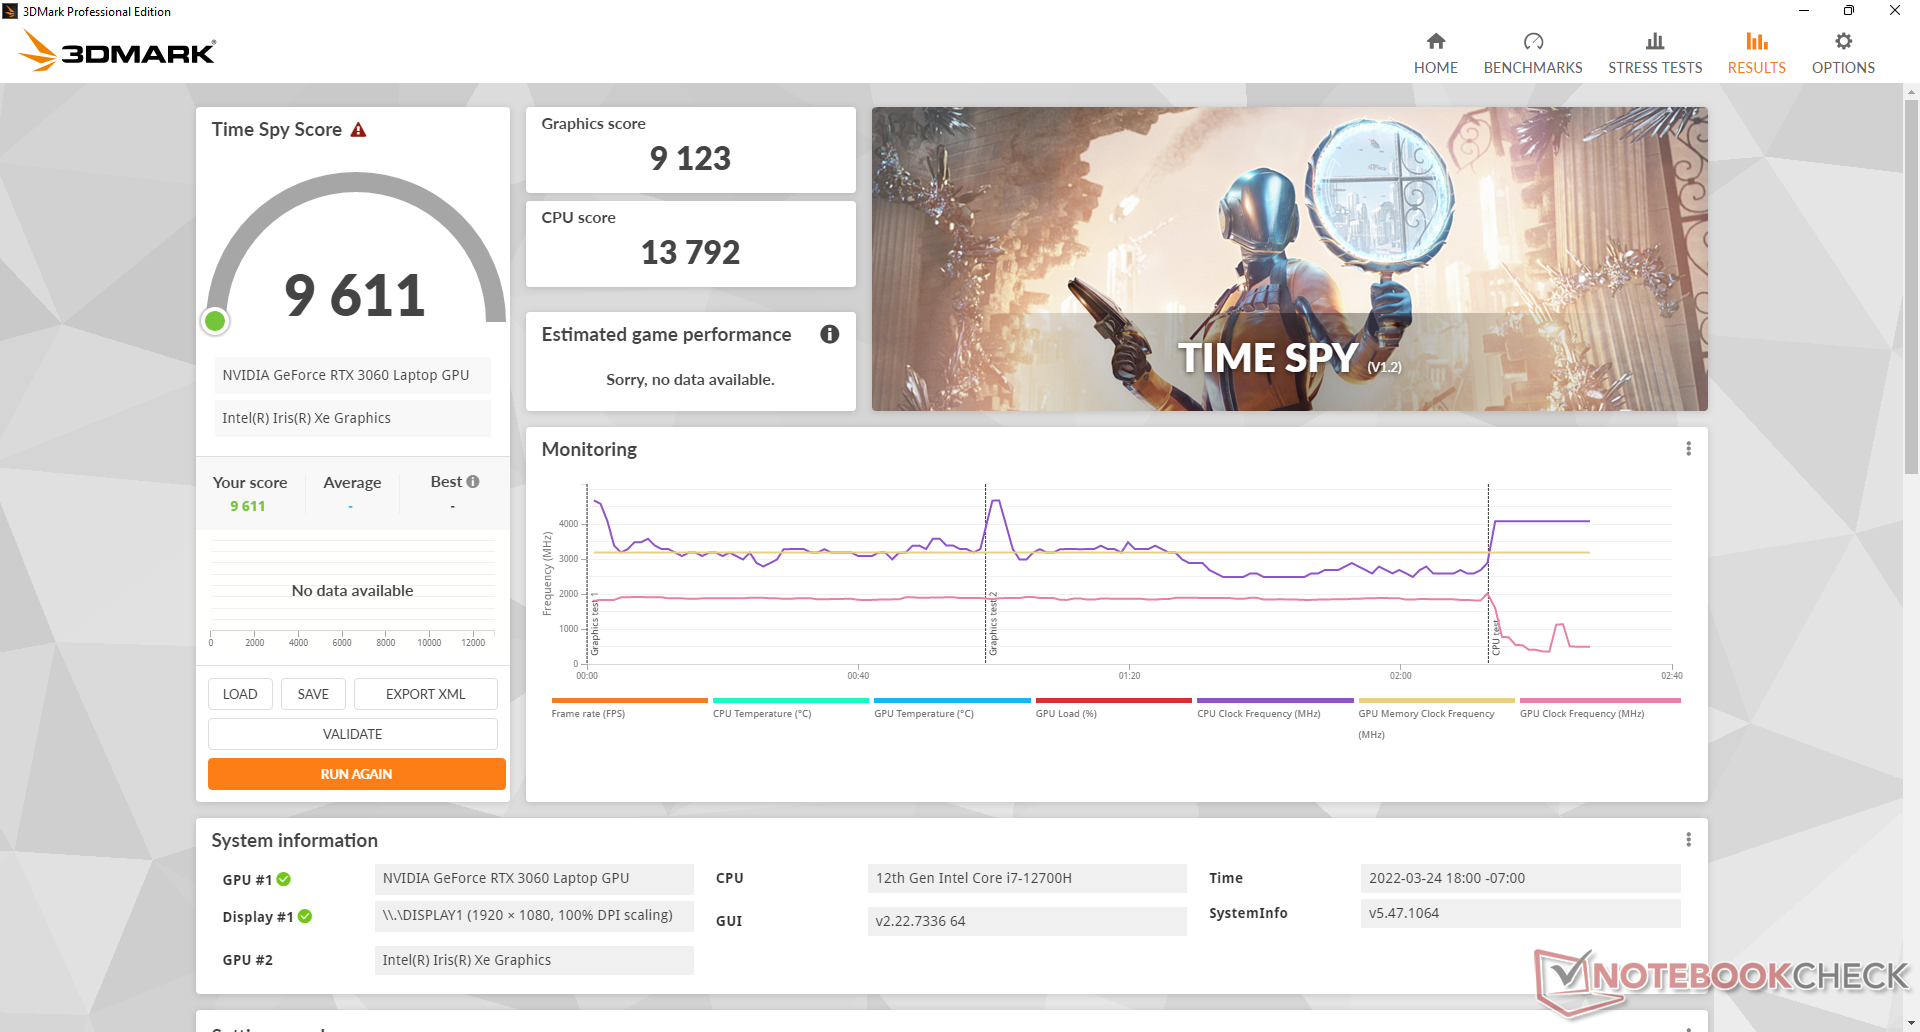
Det högre GeForce RTX 3060 TGP-målet jämfört med förra årets modell (140 W mot 95 W) har naturligtvis lett till högre grafikprestanda. Användare kan förvänta sig en prestandaförbättring på 10 till 20 procent jämfört med FX506 utrustad med samma RTX 3060 GPU. Faktum är att FX507 är en av de snabbaste GeForce RTX 3060 bärbara datorer du kan köpa för tillfället med resultat som är cirka 15 procent högre än den genomsnittliga bärbara datorn som är utrustad med samma GPU.
Att köra i MSHybrid-läge i stället för diskret GPU-läge skulle bara resultera i mycket små prestandaförluster eller nästan inget underskott alls. 3DMark-resultaten skulle vara nästan identiska mellan de två lägena medan bildfrekvensen vid spel skulle vara långsammare med bara ett par procentenheter i våra tester.
Att köra i dGPU Performance-läget istället för dGPU Turbo-läget skulle resultera i ett GPU-prestandaunderskott på 5-10 procent.
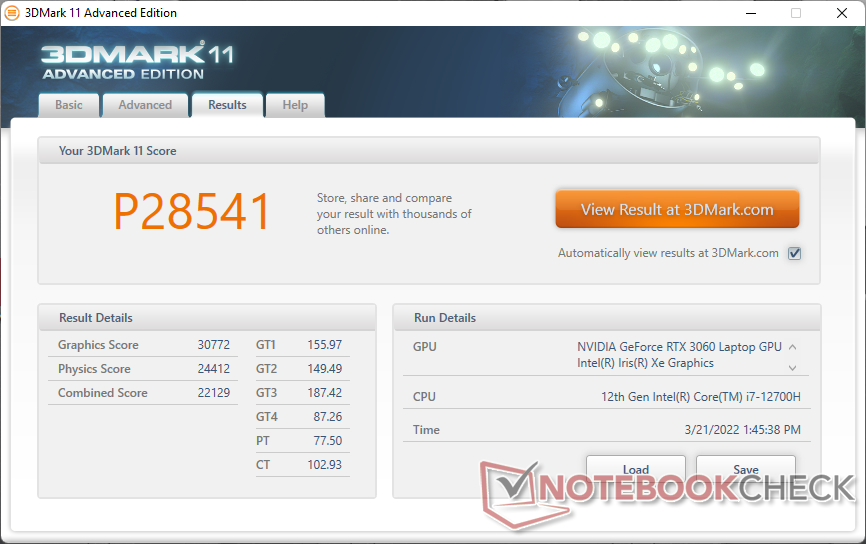
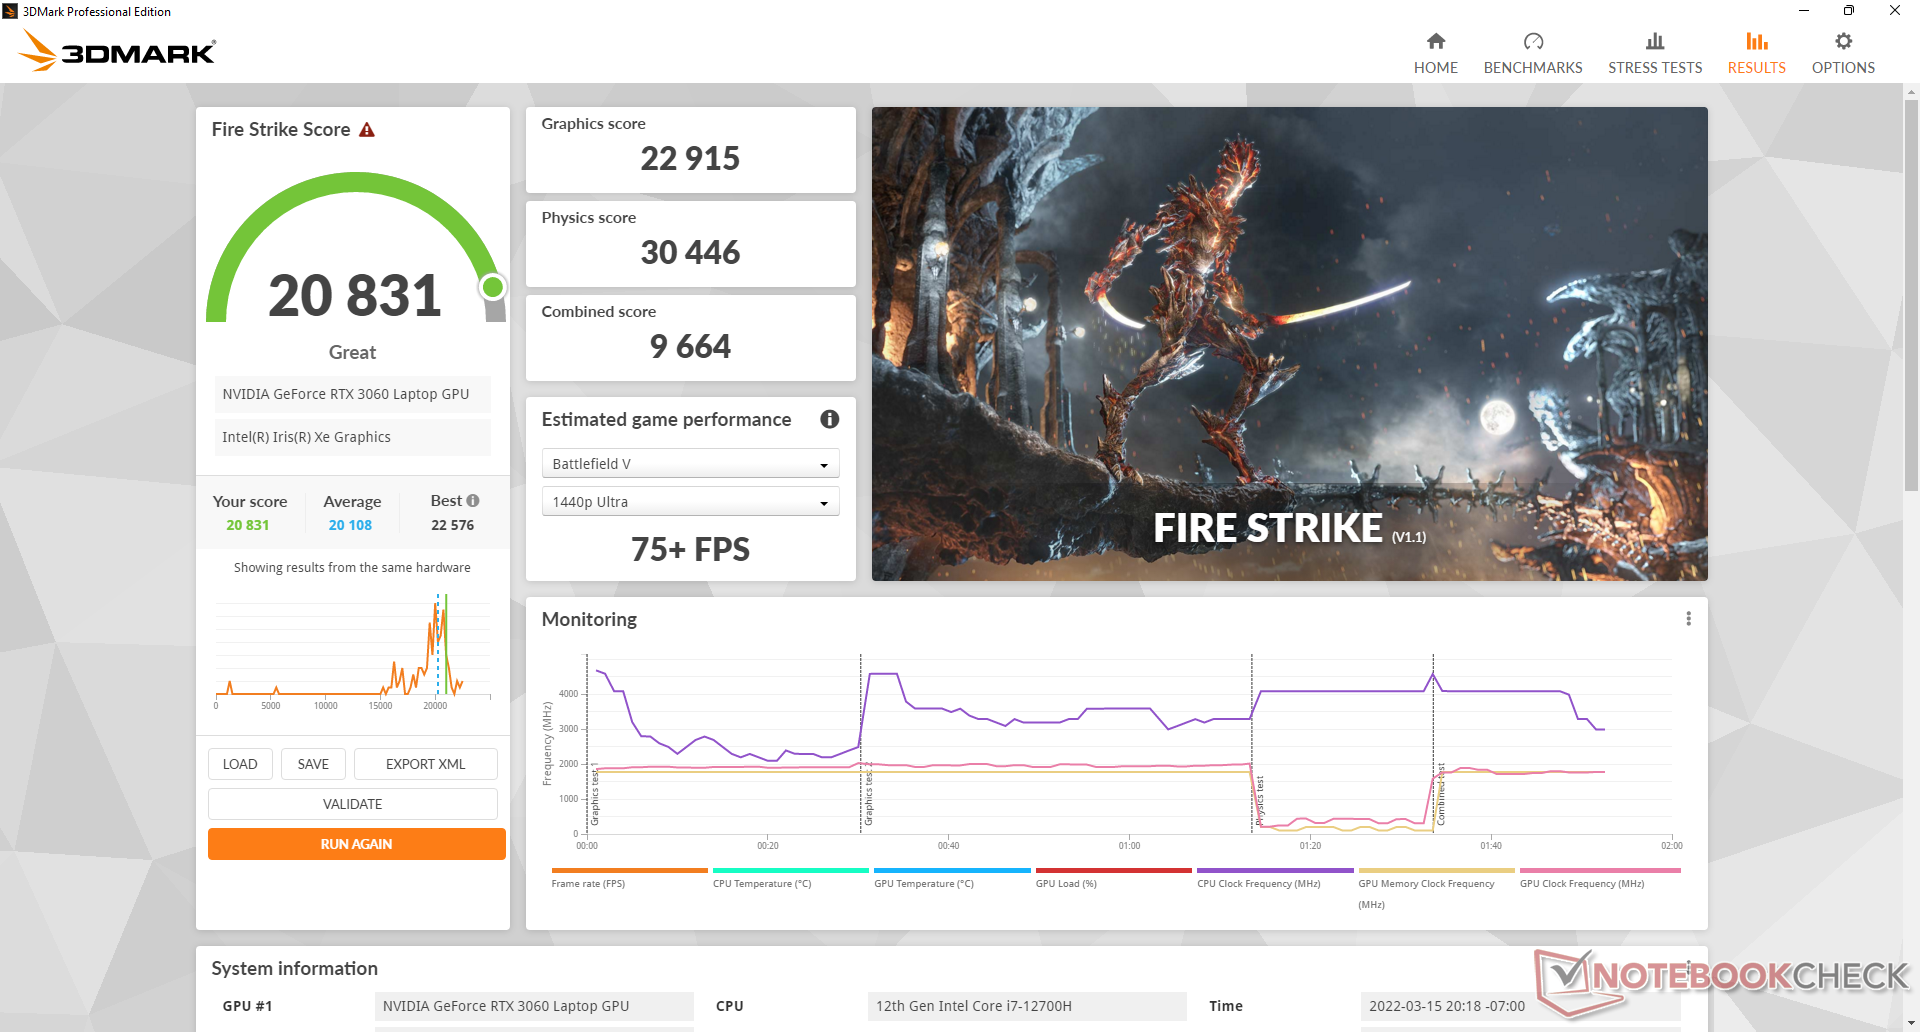
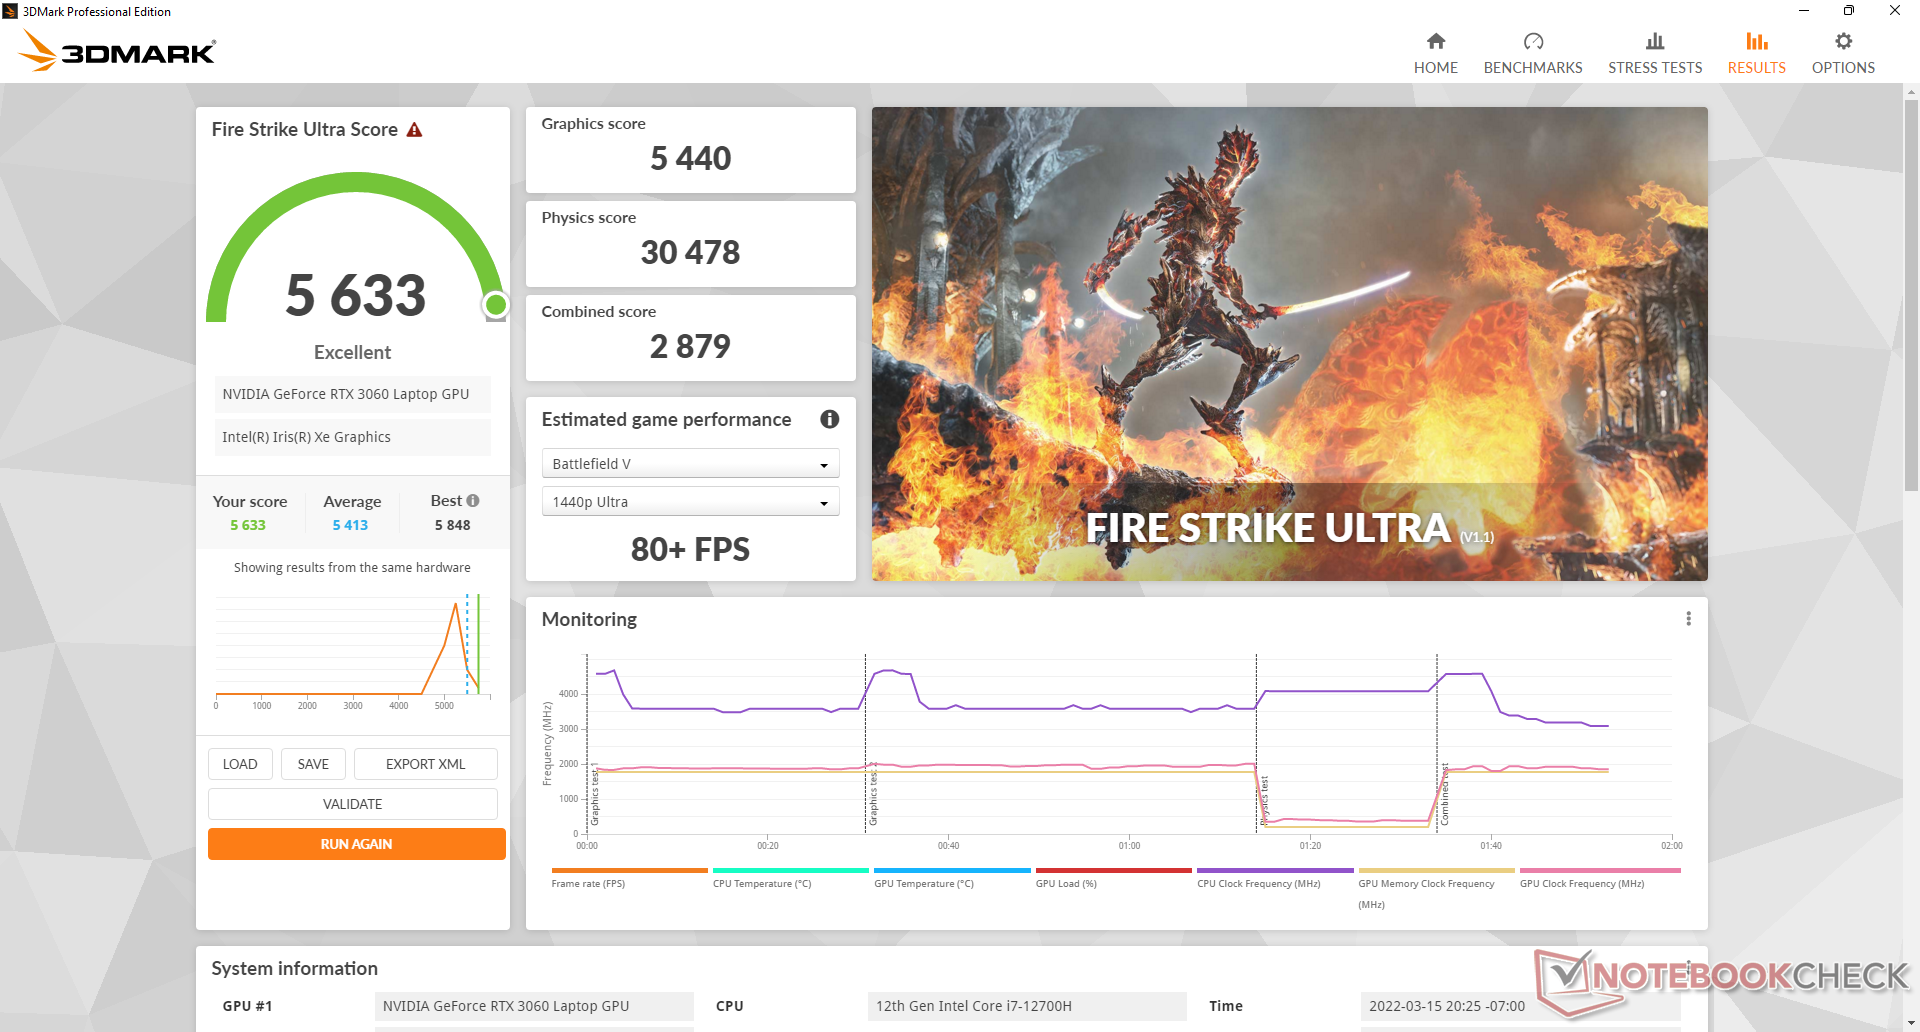
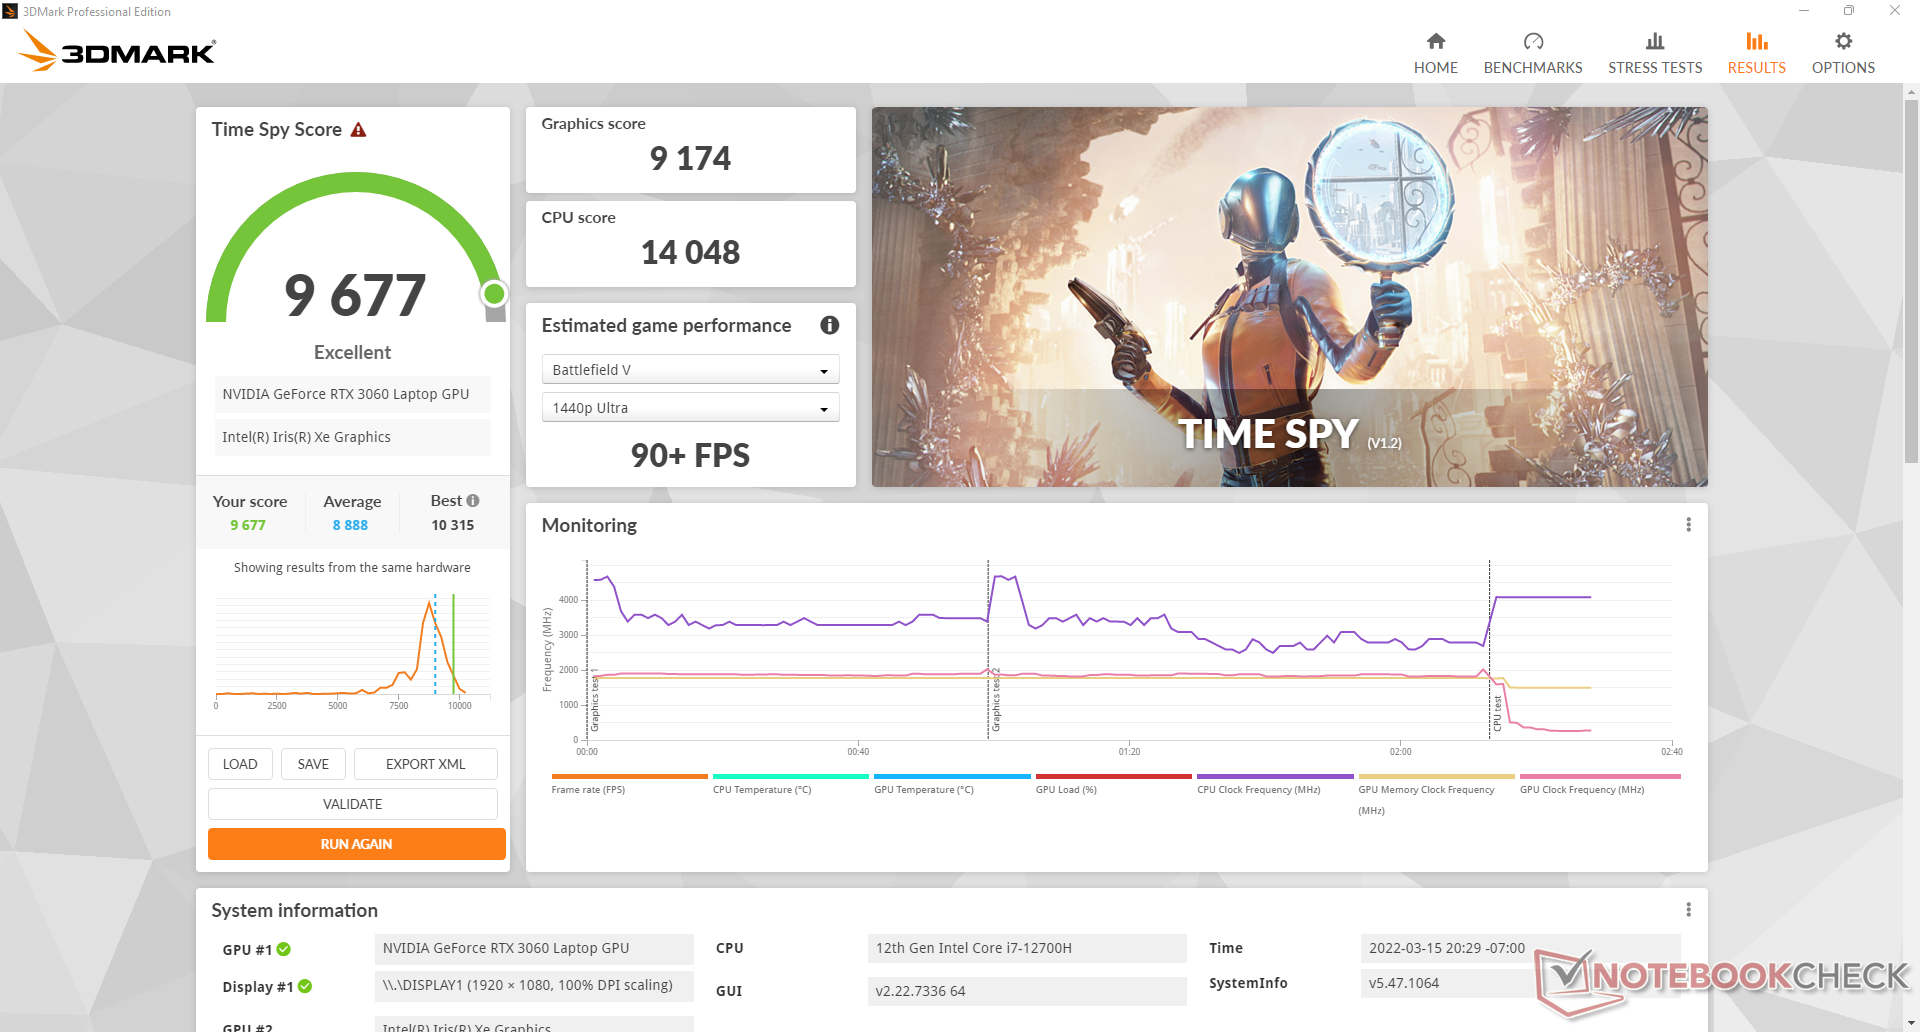
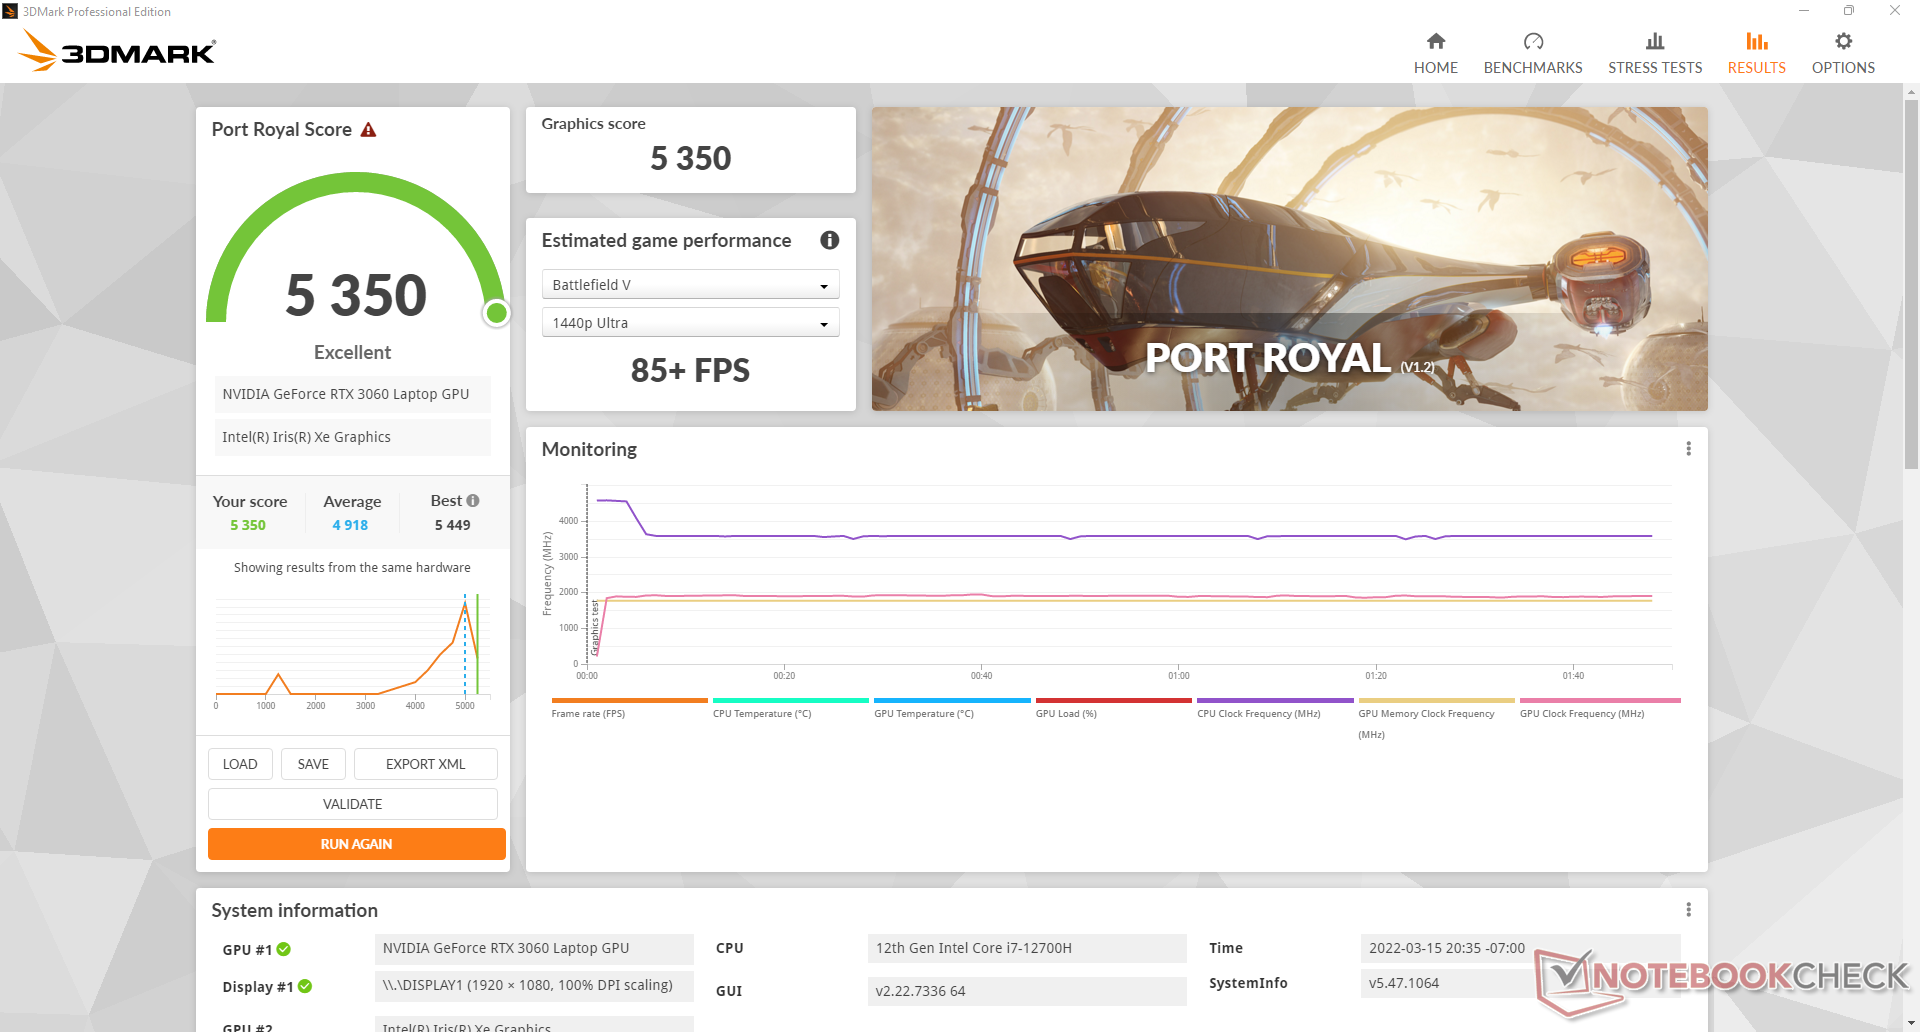

| 3DMark 11 Performance | 28541 poäng | |
| 3DMark Cloud Gate Standard Score | 58475 poäng | |
| 3DMark Fire Strike Score | 20831 poäng | |
| 3DMark Time Spy Score | 9677 poäng | |
Hjälp | ||
| Final Fantasy XV Benchmark | |
| 1280x720 Lite Quality | |
| Inno3D GeForce RTX 3060 Twin X2 | |
| MSI Vector GP66 12UGS | |
| Schenker XMG Neo 15 Tiger Lake | |
| Razer Blade 15 2022 | |
| Eurocom RX315 NH57AF1 | |
| Asus TUF Gaming F15 FX507ZM | |
| Genomsnitt NVIDIA GeForce RTX 3060 Laptop GPU (122.5 - 214, n=33) | |
| Asus TUF Gaming F15 FX506HM | |
| Asus ROG Zephyrus M15 GU502LU-BI7N4 | |
| 1920x1080 Standard Quality | |
| MSI Vector GP66 12UGS | |
| Razer Blade 15 2022 | |
| Schenker XMG Neo 15 Tiger Lake | |
| Asus TUF Gaming F15 FX507ZM | |
| Inno3D GeForce RTX 3060 Twin X2 | |
| Eurocom RX315 NH57AF1 | |
| MSI Delta 15 A5EFK | |
| Genomsnitt NVIDIA GeForce RTX 3060 Laptop GPU (70.4 - 133.5, n=37) | |
| Asus TUF Gaming F15 FX506HM | |
| Asus ROG Zephyrus M15 GU502LU-BI7N4 | |
| 1920x1080 High Quality | |
| MSI Vector GP66 12UGS | |
| Razer Blade 15 2022 | |
| Schenker XMG Neo 15 Tiger Lake | |
| Asus TUF Gaming F15 FX507ZM | |
| Eurocom RX315 NH57AF1 | |
| Inno3D GeForce RTX 3060 Twin X2 | |
| MSI Delta 15 A5EFK | |
| Genomsnitt NVIDIA GeForce RTX 3060 Laptop GPU (55 - 100.9, n=42) | |
| Asus TUF Gaming F15 FX506HM | |
| Asus ROG Zephyrus M15 GU502LU-BI7N4 | |
Witcher 3 FPS Chart
| låg | med. | hög | ultra | |
|---|---|---|---|---|
| GTA V (2015) | 186 | 182 | 162 | 97.9 |
| The Witcher 3 (2015) | 395.4 | 291.8 | 186.8 | 91.5 |
| Dota 2 Reborn (2015) | 172 | 161 | 154 | 148 |
| Final Fantasy XV Benchmark (2018) | 161 | 122 | 91.9 | |
| X-Plane 11.11 (2018) | 153 | 136 | 107 | |
| Far Cry 5 (2018) | 156 | 123 | 114 | 114 |
| Strange Brigade (2018) | 345 | 232 | 185 | 160 |
Utsläpp
Systembrus
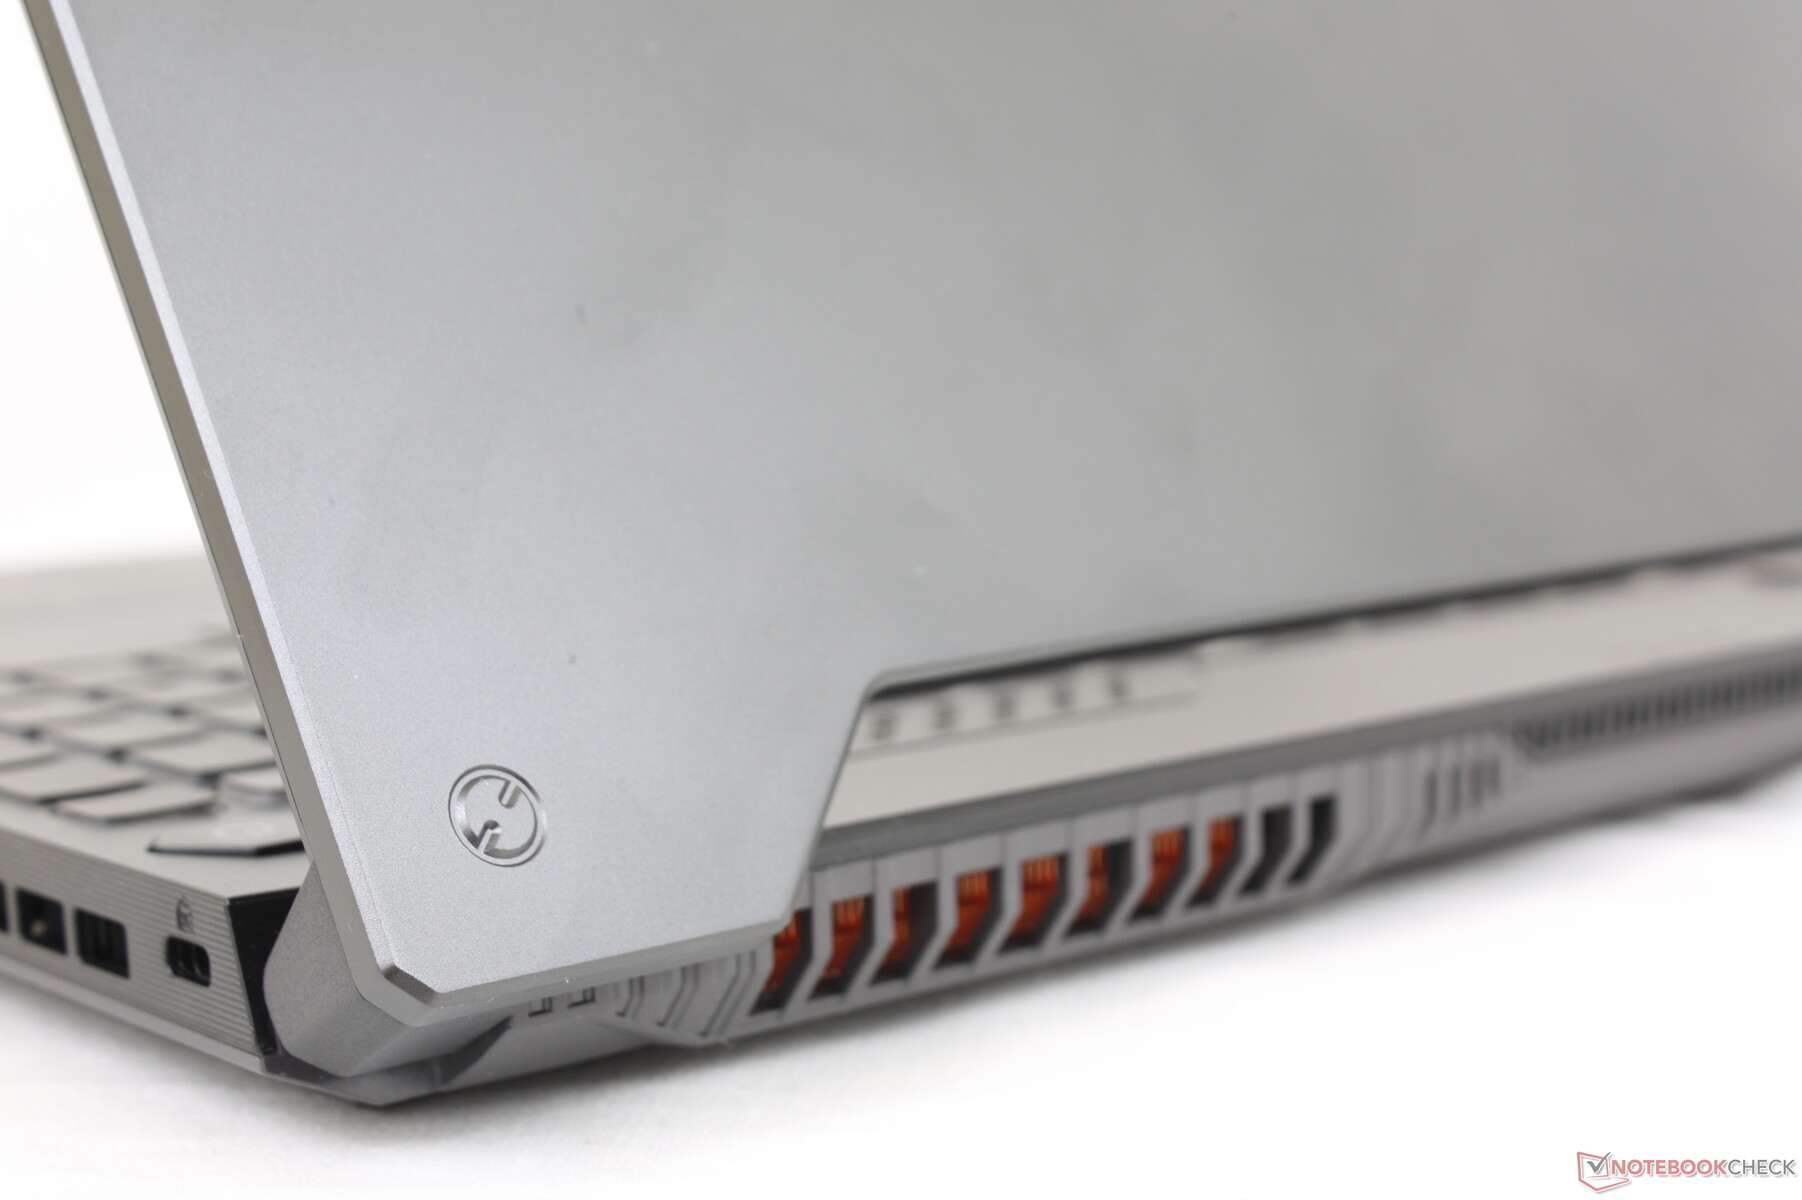
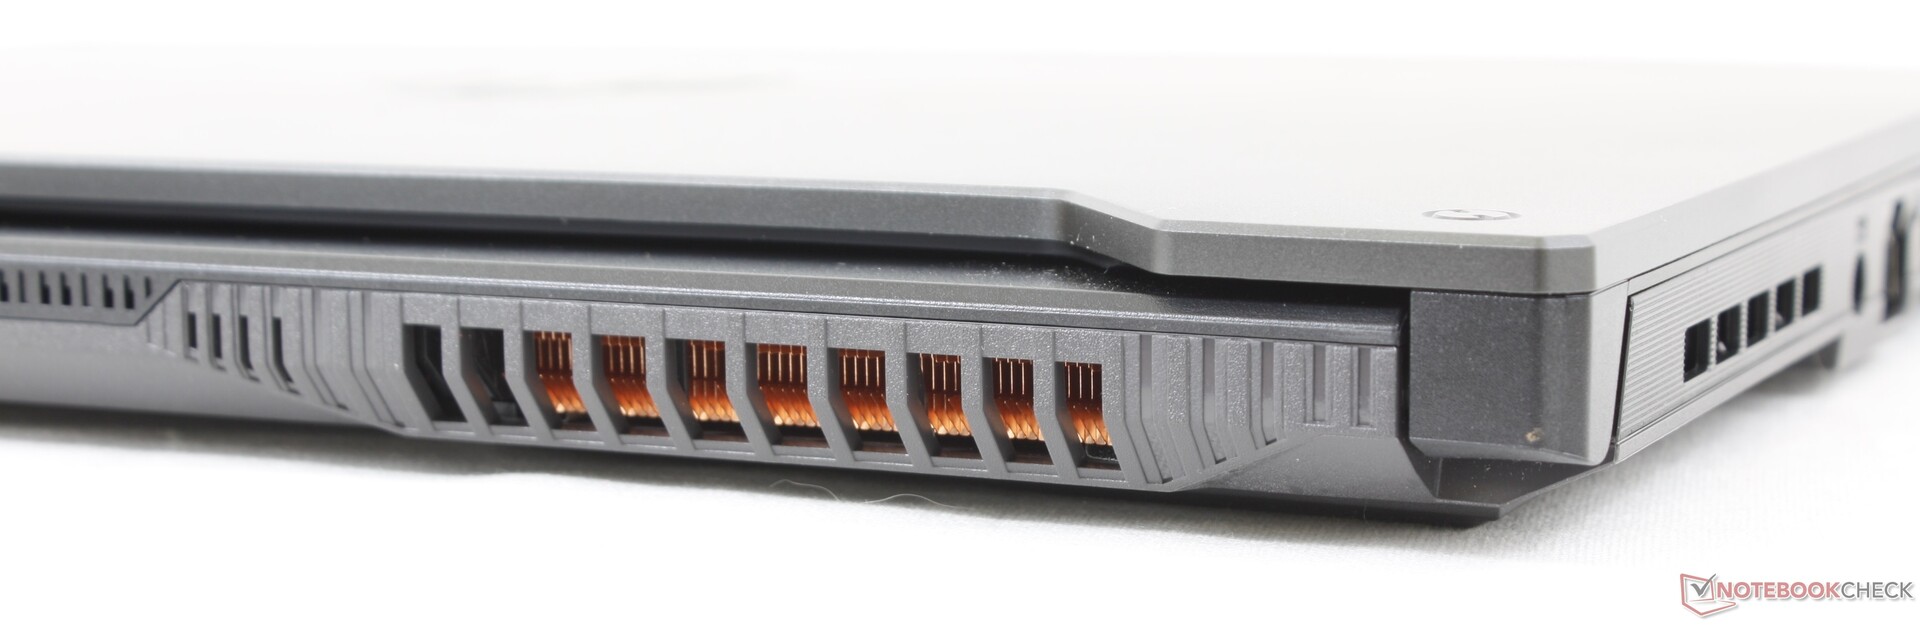
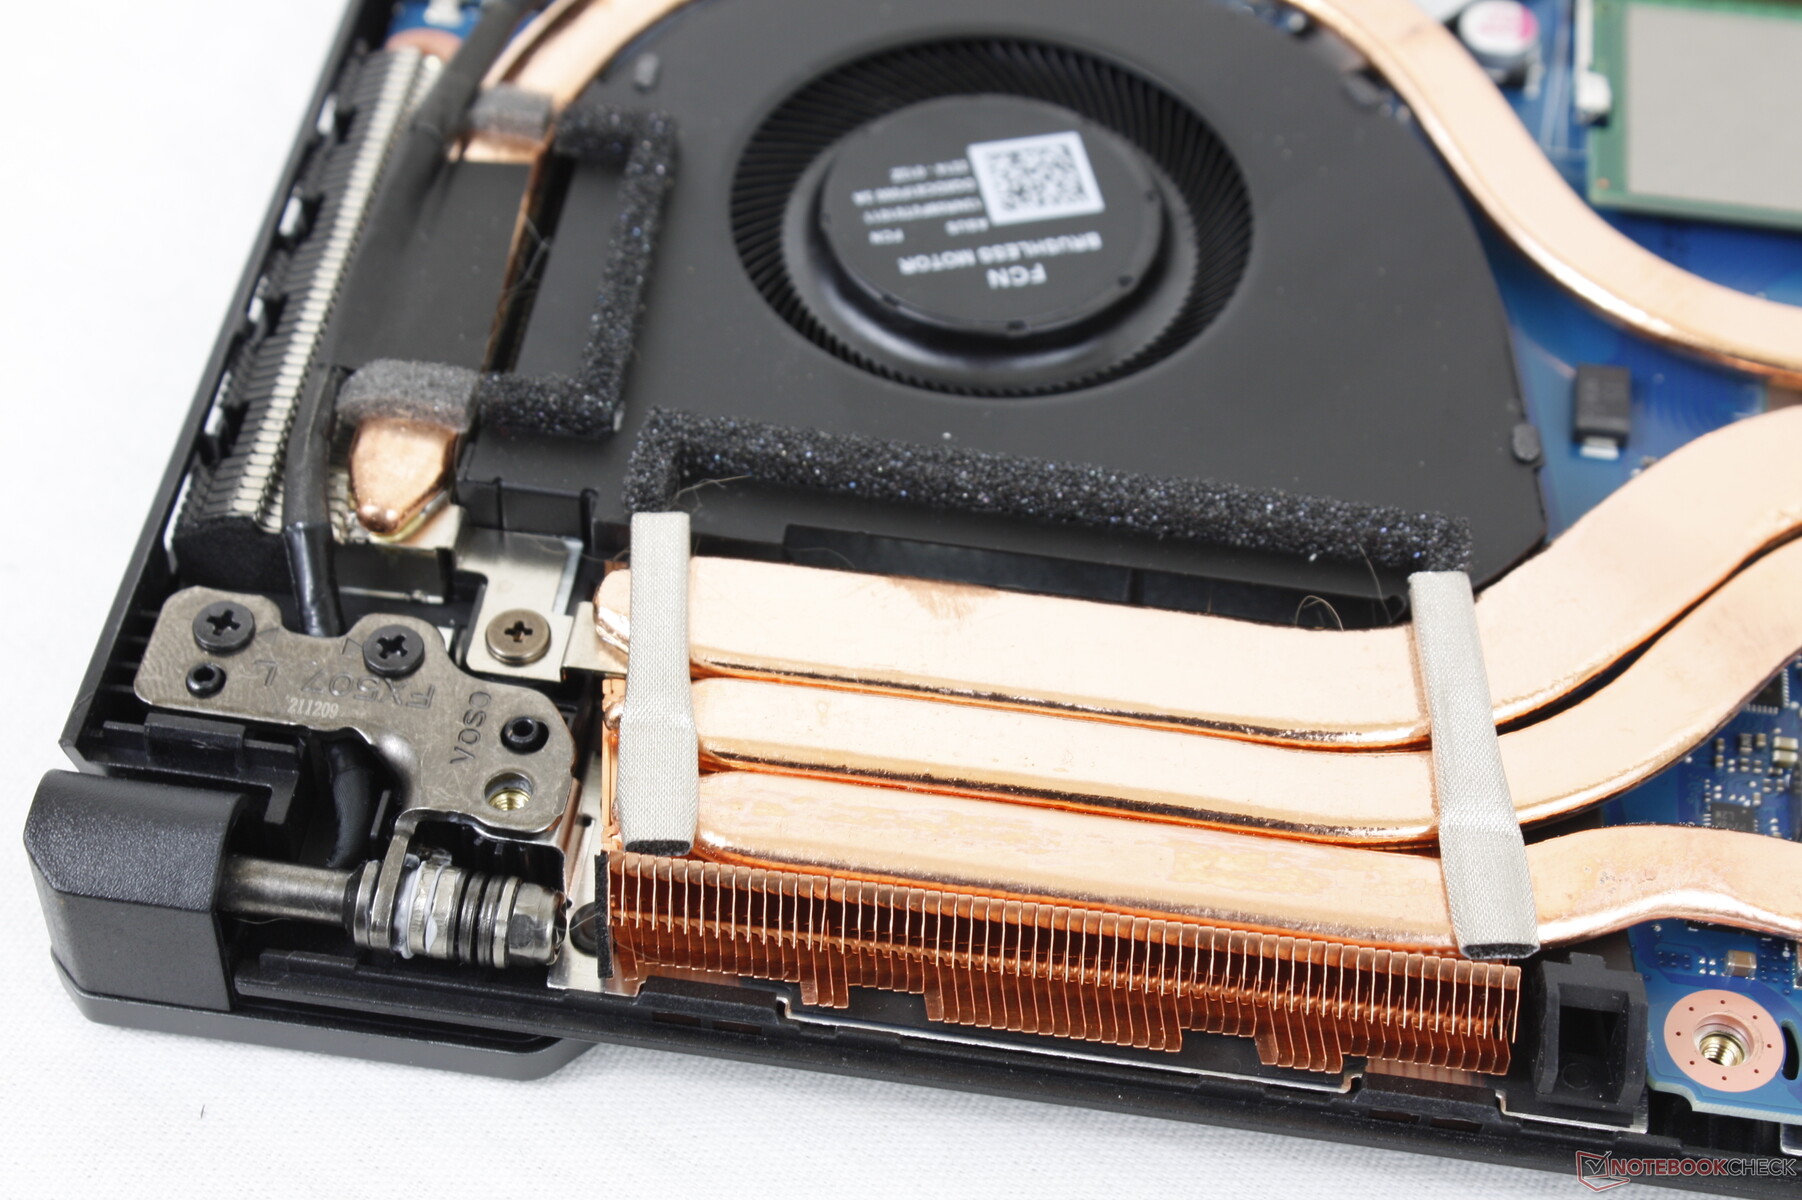
Asus har uppgraderat kylningslösningen för FX507 trots dess lägre totalvikt jämfört med FX506. Fem fläktlägen är tillgängliga via Armoury Crate: Windows, Silent, Performance, Turbo och Manual. Windows eller Silent rekommenderas vid surfning eller ordbehandling för att undvika pulserande fläktar.
Om Witcher 3 körs i prestandaläget och turboläget skulle fläktljudet vara 45,8 dB(A) respektive 54,1 dB(A). Det lägre fläktljudet i prestandaläget är betydande i förhållande till den lilla 5 till 10-procentiga minskningen av grafikprestanda jämfört med turboläget. Användare kan därför överväga att spela i prestandaläget om fläktljudet är ett problem.
Ljudnivå
| Låg belastning |
| 23.6 / 23.6 / 25.4 dB(A) |
| Hög belastning |
| 38 / 57.2 dB(A) |
 | ||
30 dB tyst 40 dB(A) hörbar 50 dB(A) högt ljud |
||
min: | ||
| Asus TUF Gaming F15 FX507ZM GeForce RTX 3060 Laptop GPU, i7-12700H, SK Hynix HFM001TD3JX013N | Asus TUF Gaming F15 FX506HM GeForce RTX 3060 Laptop GPU, i7-11800H, SK Hynix HFM001TD3JX013N | Asus TUF Dash F15 FX516PR GeForce RTX 3070 Laptop GPU, i7-11370H, SK Hynix HFM001TD3JX013N | Asus ROG Strix Scar 15 G533QS GeForce RTX 3080 Laptop GPU, R9 5900HX, ADATA Swordfish 2 TB | Asus Zephyrus S15 GX502L GeForce RTX 2070 Super Mobile, i7-10875H, WDC PC SN730 SDBPNTY-1T00 | Asus ZenBook Pro Duo UX582 LR-1BH2 GeForce RTX 3070 Laptop GPU, i7-10870H, Samsung PM981a MZVLB1T0HBLR | |
|---|---|---|---|---|---|---|
| Noise | 6% | -14% | -8% | -21% | -1% | |
| av / miljö * (dB) | 23.2 | 24.8 -7% | 24 -3% | 25.5 -10% | 25 -8% | 24.6 -6% |
| Idle Minimum * (dB) | 23.6 | 24.6 -4% | 25 -6% | 25.5 -8% | 28 -19% | 24.6 -4% |
| Idle Average * (dB) | 23.6 | 24.9 -6% | 30 -27% | 25.5 -8% | 31 -31% | 24.6 -4% |
| Idle Maximum * (dB) | 25.4 | 24.9 2% | 35 -38% | 37.1 -46% | 36 -42% | 25.9 -2% |
| Load Average * (dB) | 38 | 27.1 29% | 53 -39% | 39.2 -3% | 56 -47% | 39.6 -4% |
| Witcher 3 ultra * (dB) | 54.1 | 46.4 14% | 48 11% | 50.5 7% | 55 -2% | 49.8 8% |
| Load Maximum * (dB) | 57.2 | 49 14% | 54 6% | 51.8 9% | 57 -0% | 54.2 5% |
* ... mindre är bättre
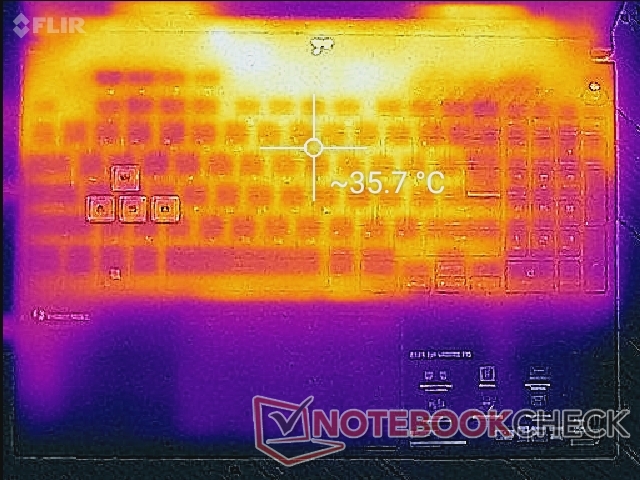
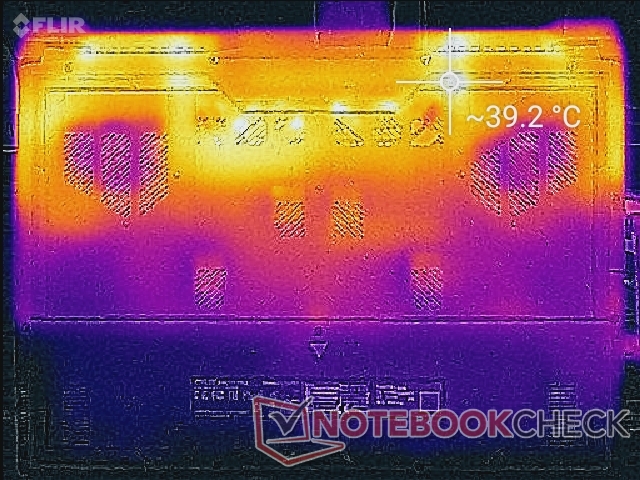
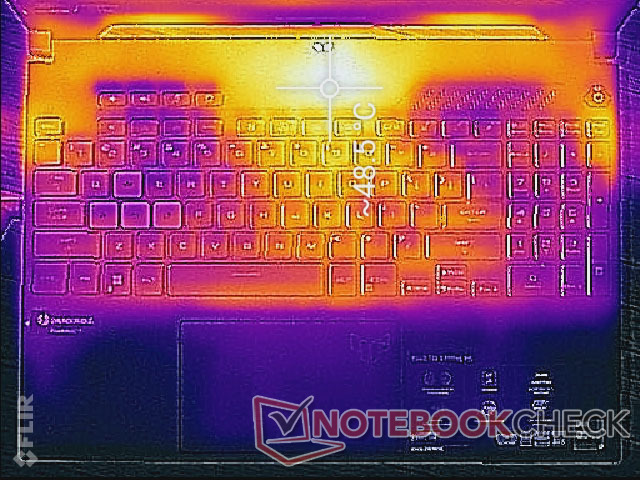
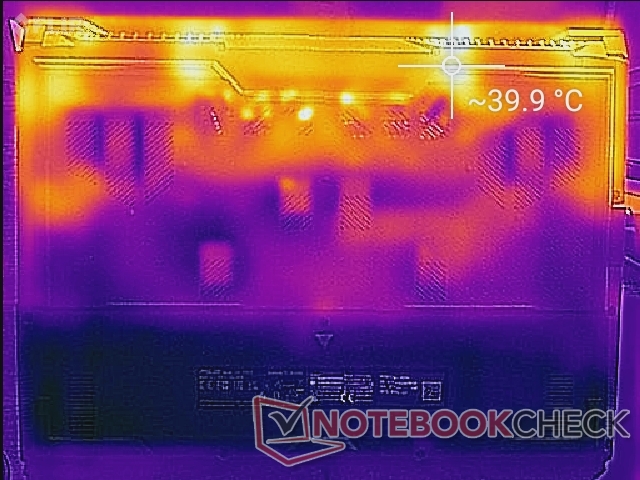
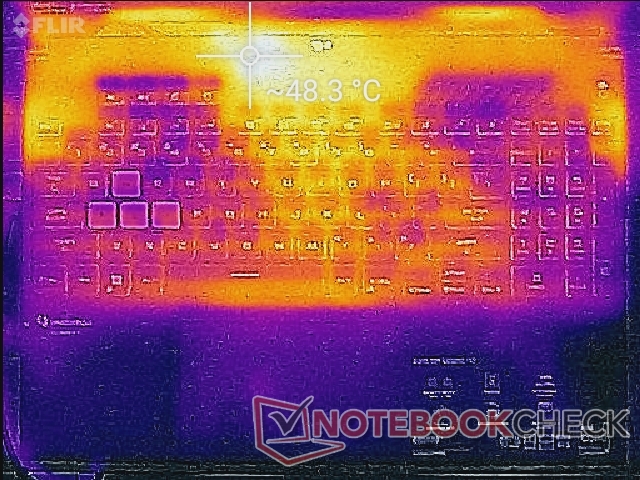
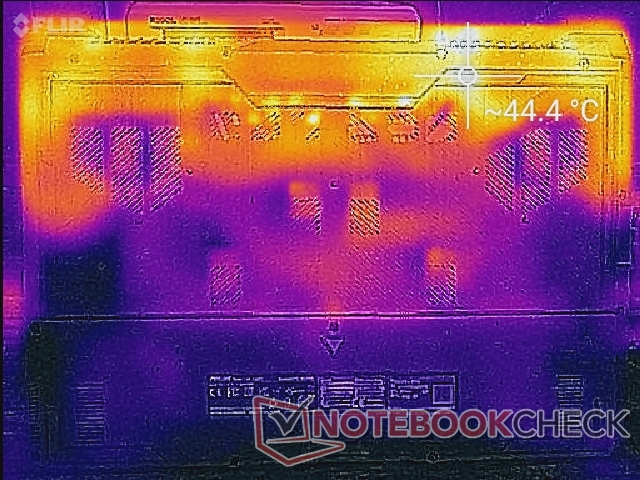
Temperatur
De heta punkterna i yttemperaturen är varmare än vad vi registrerade i förra årets modell. När man kör Witcher 3kan till exempel den översta värmepunkten på FX507 vara så varm som 49 C jämfört med endast 37 C på FX506. Den förbättrade kylningslösningen i FX507 har dock flyttat den varma punkten bort från tangentbordstangenterna så att handflator och fingrar hålls svala oavsett belastning på skärmen
Yttemperaturerna är varmare än förväntat även när den går på tomgång på skrivbordet, men det beror på att fläktarna tenderar att gå på tomgång eller köra på mycket låga hastigheter när aktiviteten är låg. Vi tycker att detta är en acceptabel kompromiss, särskilt när vi befinner oss i klassrum eller när vi spelar video eller musik.
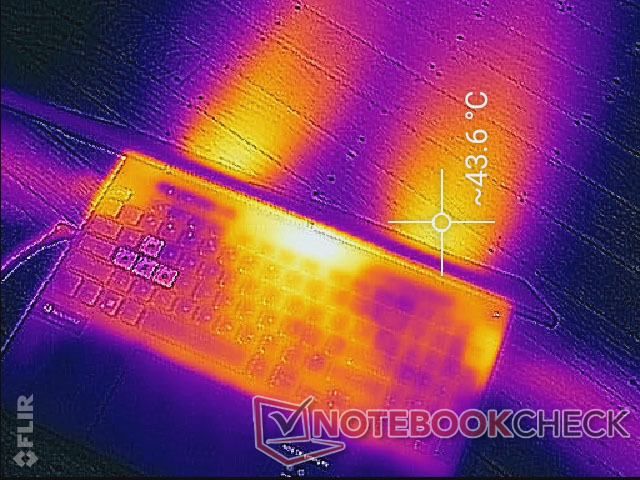
(±) Den maximala temperaturen på ovansidan är 44.4 °C / 112 F, jämfört med genomsnittet av 40.4 °C / 105 F , allt från 21.2 till 68.8 °C för klassen Gaming.
(-) Botten värms upp till maximalt 48.8 °C / 120 F, jämfört med genomsnittet av 43.2 °C / 110 F
(+) Vid tomgångsbruk är medeltemperaturen för ovansidan 30.2 °C / 86 F, jämfört med enhetsgenomsnittet på 33.9 °C / ### class_avg_f### F.
(+) När du spelar The Witcher 3 är medeltemperaturen för ovansidan 31.4 °C / 89 F, jämfört med enhetsgenomsnittet på 33.9 °C / ## #class_avg_f### F.
(+) Handledsstöden och pekplattan är kallare än hudtemperaturen med maximalt 28 °C / 82.4 F och är därför svala att ta på.
(±) Medeltemperaturen för handledsstödsområdet på liknande enheter var 28.8 °C / 83.8 F (+0.8 °C / 1.4 F).
| Asus TUF Gaming F15 FX507ZM Intel Core i7-12700H, NVIDIA GeForce RTX 3060 Laptop GPU | Asus TUF Gaming F15 FX506HM Intel Core i7-11800H, NVIDIA GeForce RTX 3060 Laptop GPU | Asus TUF Dash F15 FX516PR Intel Core i7-11370H, NVIDIA GeForce RTX 3070 Laptop GPU | Asus ROG Strix Scar 15 G533QS AMD Ryzen 9 5900HX, NVIDIA GeForce RTX 3080 Laptop GPU | Asus Zephyrus S15 GX502L Intel Core i7-10875H, NVIDIA GeForce RTX 2070 Super Mobile | Asus ZenBook Pro Duo UX582 LR-1BH2 Intel Core i7-10870H, NVIDIA GeForce RTX 3070 Laptop GPU | |
|---|---|---|---|---|---|---|
| Heat | 16% | 1% | 4% | 11% | 14% | |
| Maximum Upper Side * (°C) | 44.4 | 46.4 -5% | 55 -24% | 43.4 2% | 51 -15% | 47.7 -7% |
| Maximum Bottom * (°C) | 48.8 | 45.4 7% | 56 -15% | 48.2 1% | 44 10% | 53.8 -10% |
| Idle Upper Side * (°C) | 37.8 | 26 31% | 29 23% | 35.2 7% | 29 23% | 24.4 35% |
| Idle Bottom * (°C) | 39.6 | 27.4 31% | 32 19% | 37 7% | 30 24% | 24.7 38% |
* ... mindre är bättre
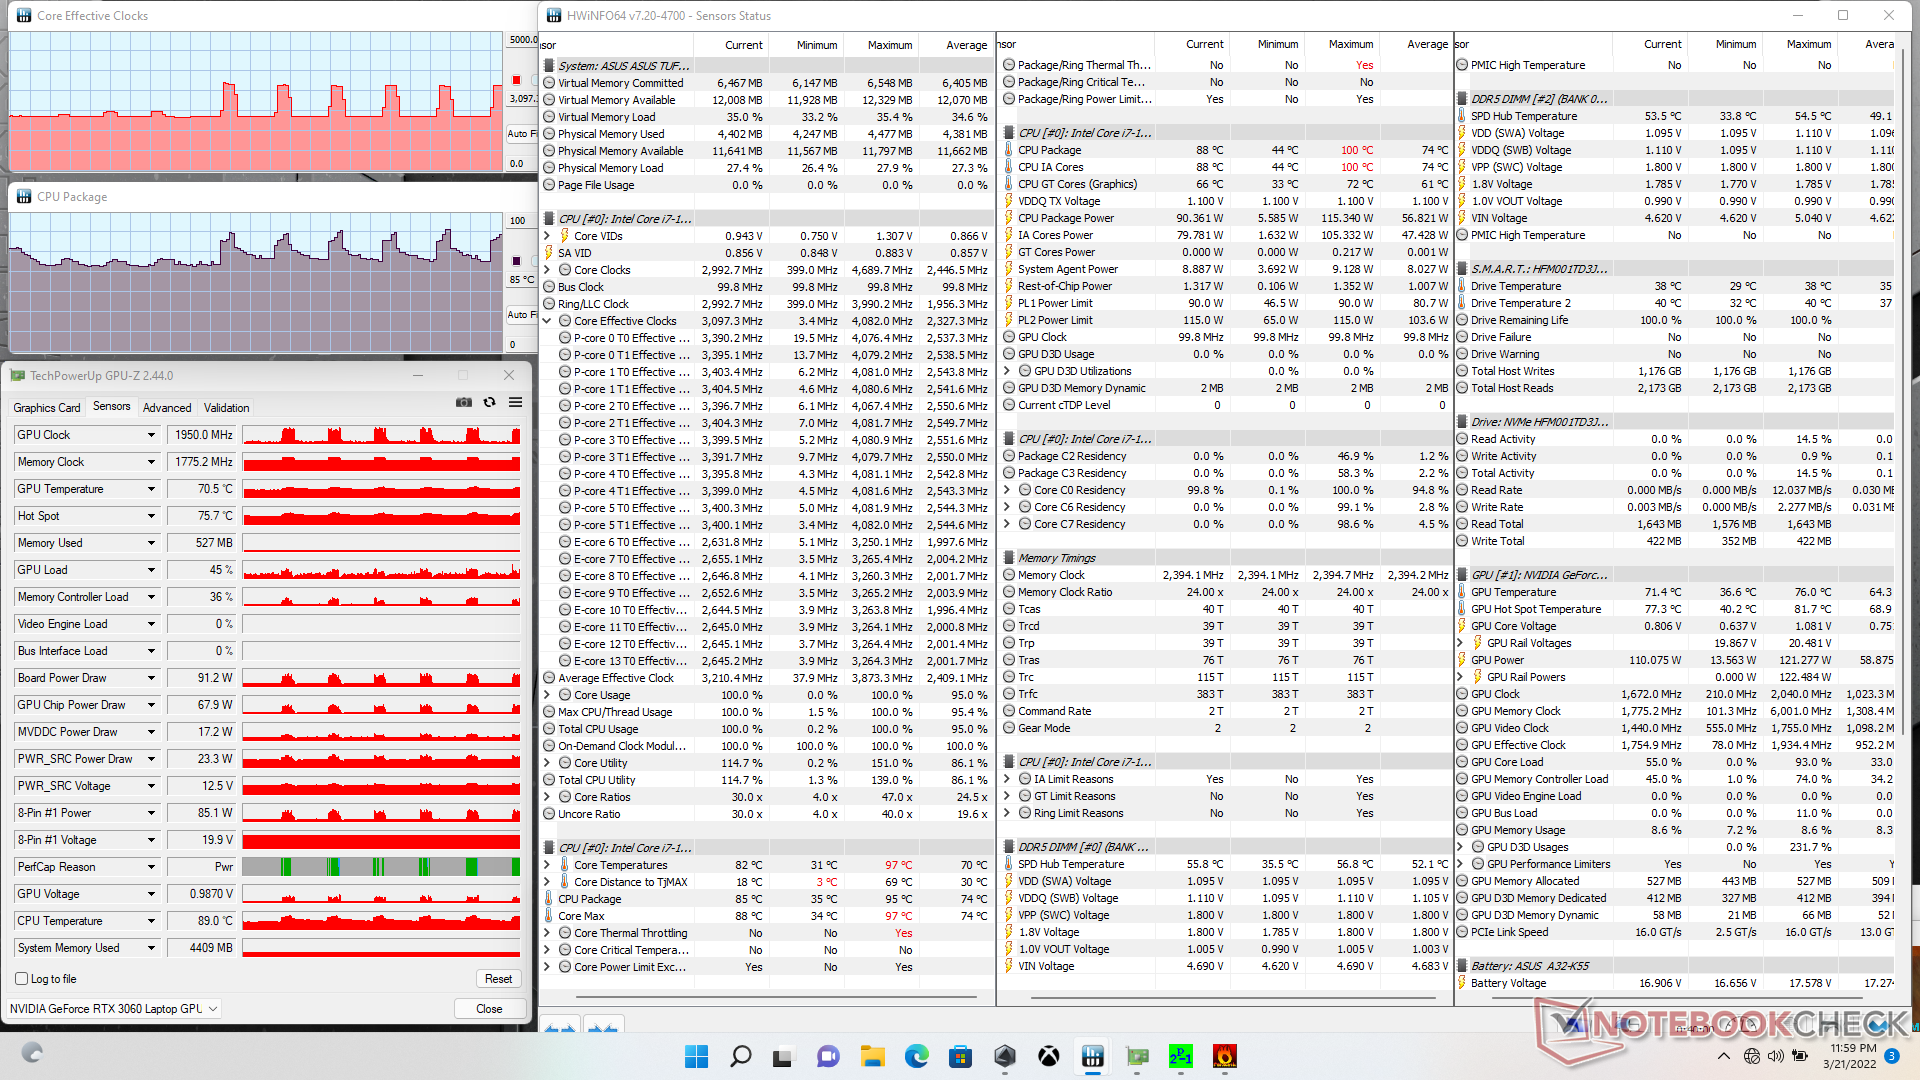
Stresstest
När Prime95 kördes ökade CPU:n till 3,8 GHz under de första 100 sekunderna och hade en kärntemperatur på 95 C. Klockfrekvensen och temperaturen sjönk så småningom och stabiliserades på 3,1 GHz respektive 83 C. Paketets effekt skulle också sjunka från 115 W till 90 W under denna tid enligt HWiNFO.
När man kör Witcher 3 för att representera typisk spelstress skulle CPU- och GPU-temperaturerna stabiliseras vid 69 C respektive 77 C, med GPU:n på 1927 MHz och ett kortuttag på 133,4 W. Om samma test körs på FX506 skulle CPU- och GPU-temperaturerna bli varmare, 75 C respektive 81 C, men GPU:ns klockfrekvens skulle vara lägre, 1717 MHz, och kortet skulle dra mindre ström på 90,4 W.
Att köra på batteri begränsar prestandan. Ett Fire Strike -test på batterier skulle ge fysik- och grafikresultat på 21169 respektive 15715 poäng, jämfört med 30446 och 22915 poäng när det är på nätet.
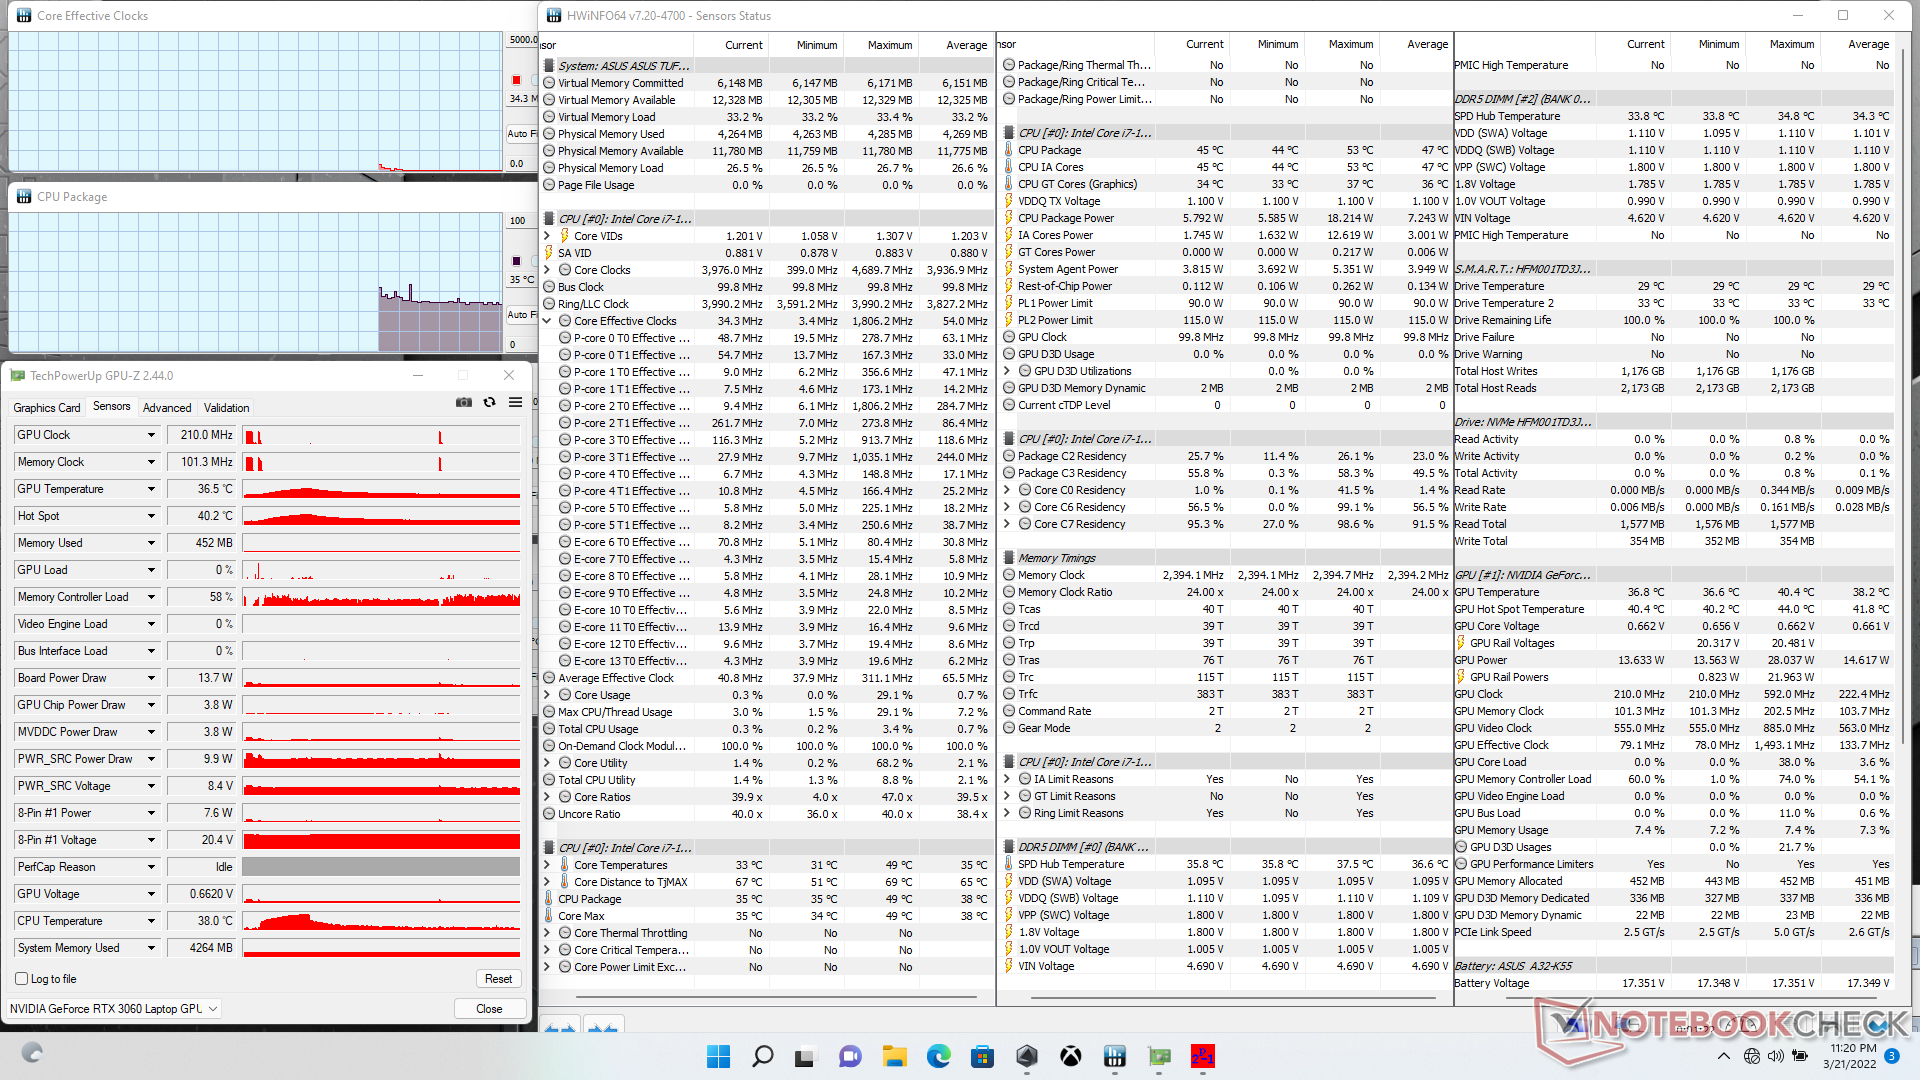
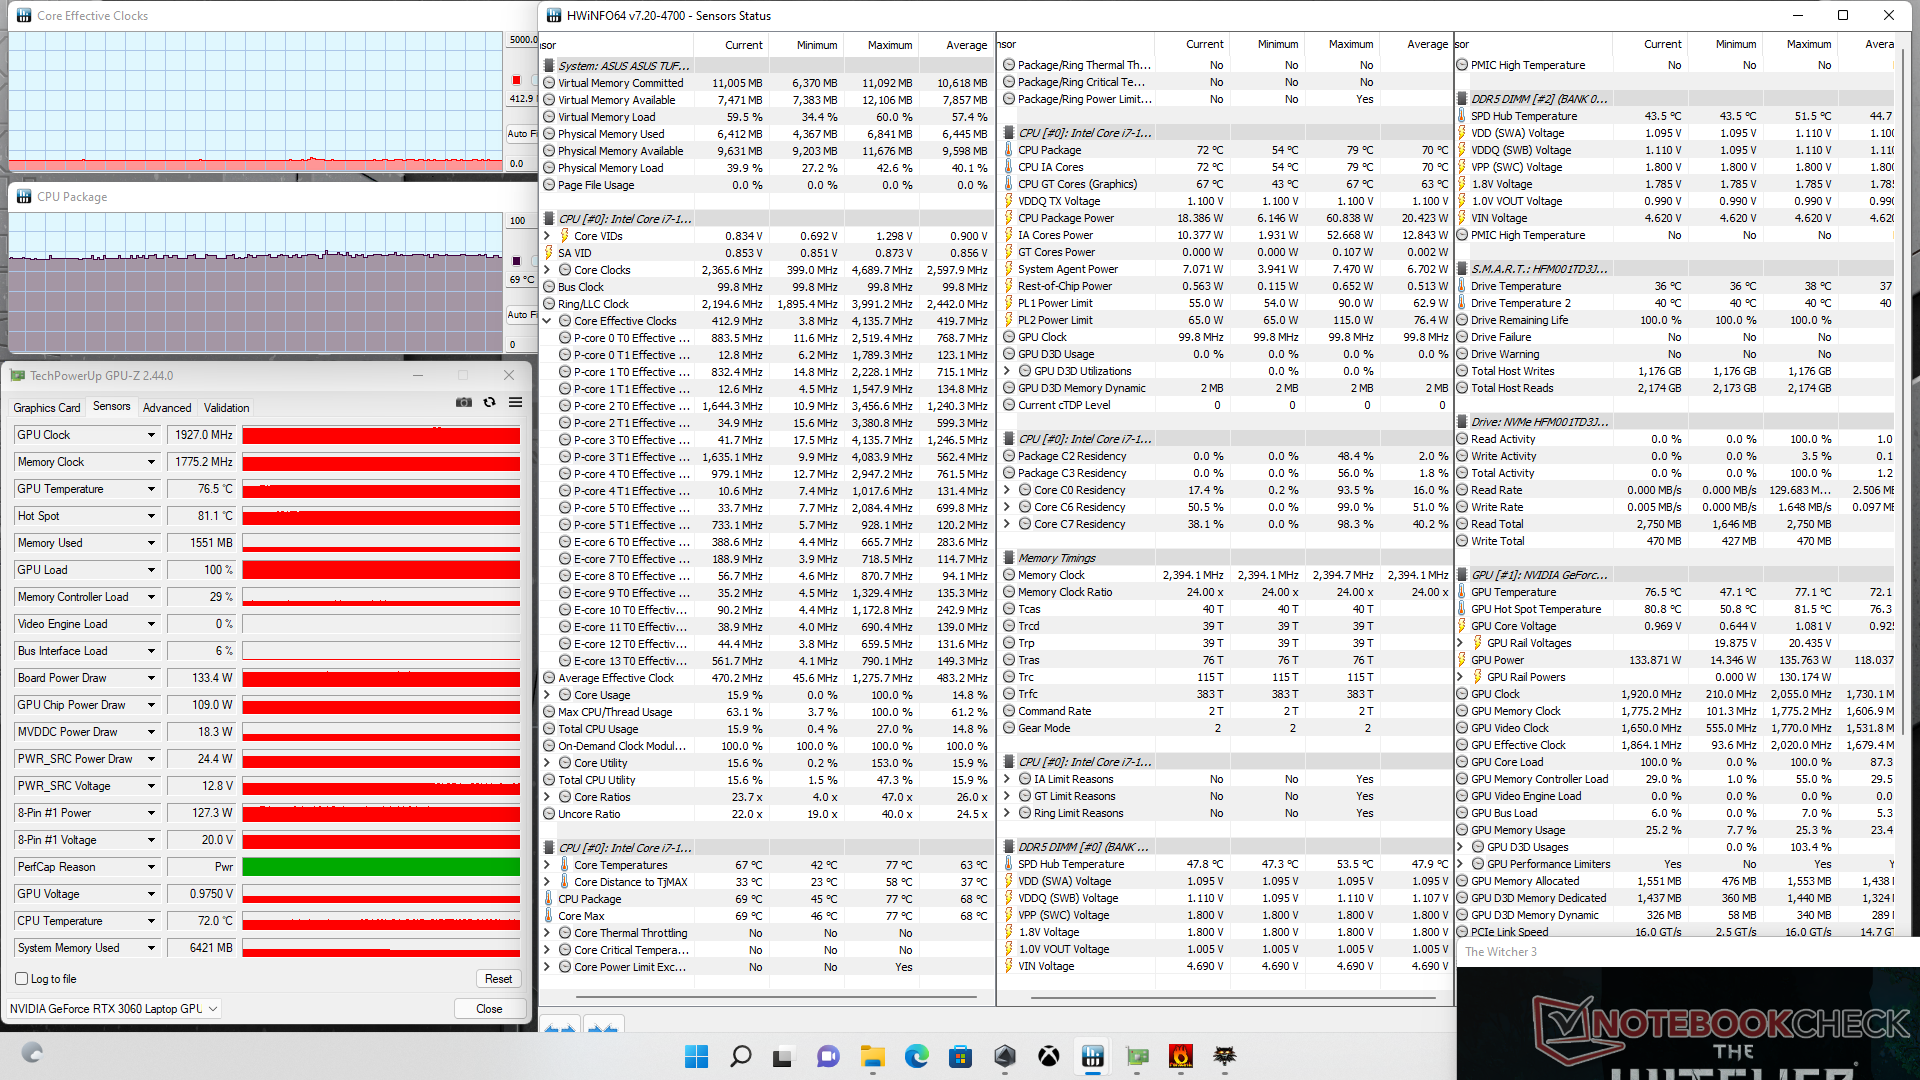
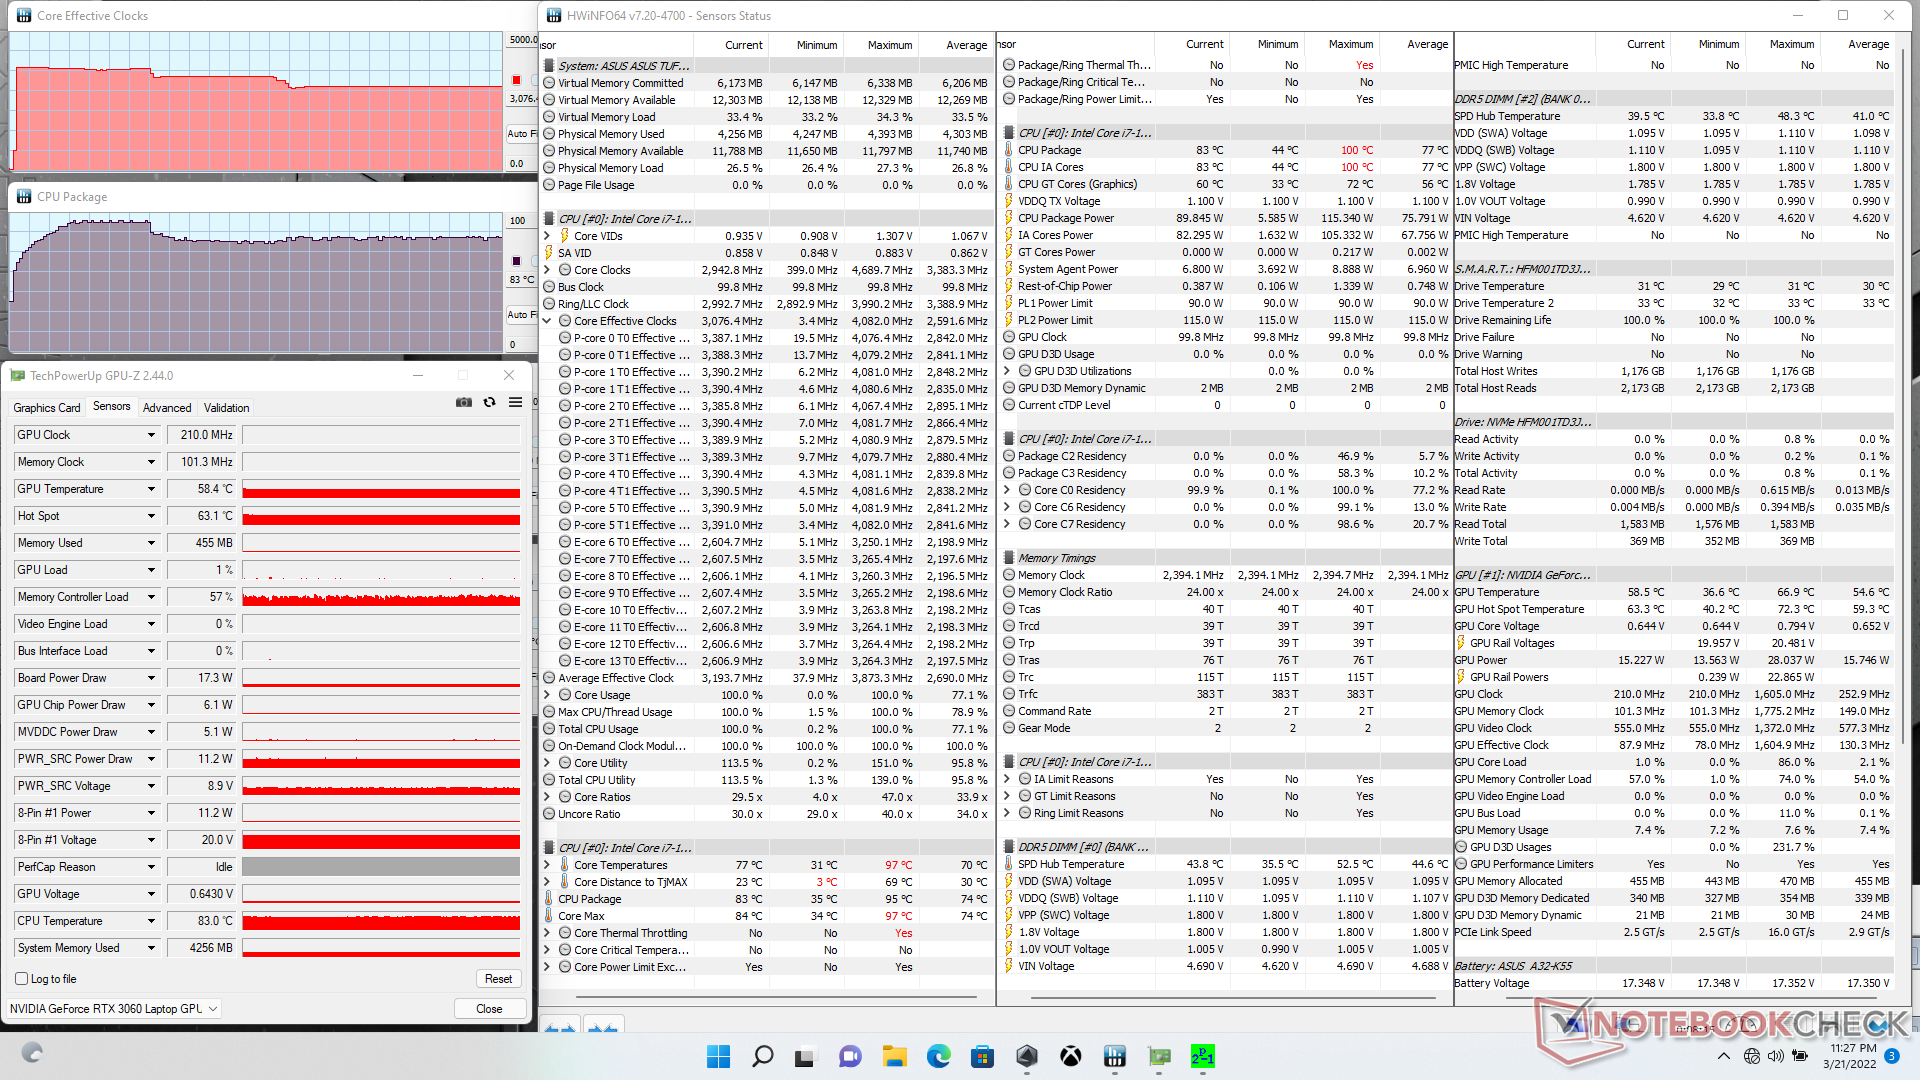
| CPU-klocka (GHz) | GPU-klocka (MHz) | Genomsnittlig CPU-temperatur (°C) | Genomsnittlig GPU-temperatur (°C) | |
| Systemets tomgång | -- | -- | 35 | 37 |
| Prime95 Stress | 3.1 | -- | 83 | 58 |
| Prime95 + FurMark Stress | 2.0 - 3.0 | 450 - 2000 | 66 - 89 | 58 - 72 |
| Witcher 3 Stress | 0,412 | 1927 | 69 | 77 |
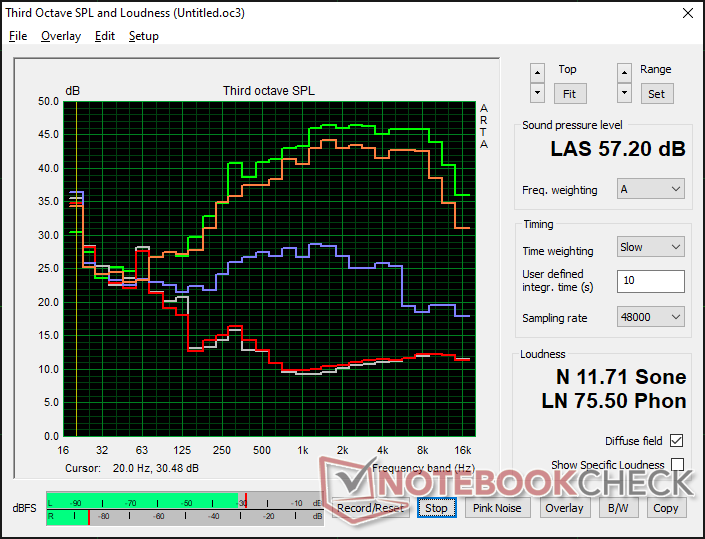
Högtalare
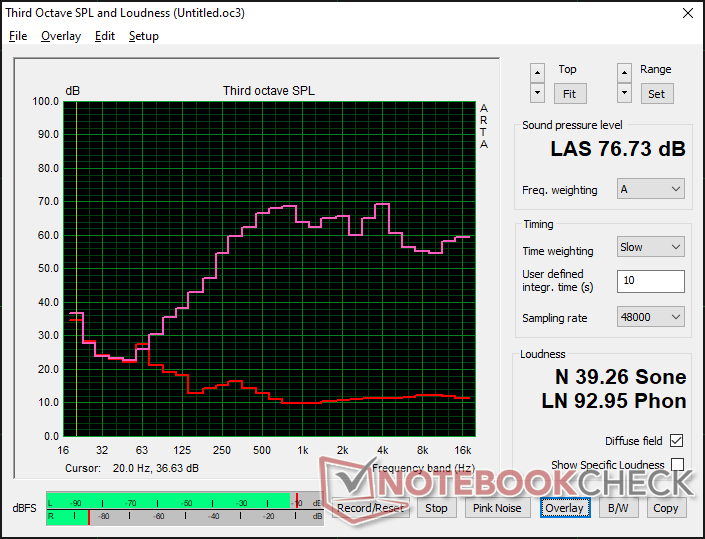
Asus TUF Gaming F15 FX507ZM ljudanalys
(±) | högtalarljudstyrkan är genomsnittlig men bra (76.7 dB)
Bas 100 - 315 Hz
(±) | reducerad bas - i genomsnitt 13.7% lägre än medianen
(±) | linjäriteten för basen är genomsnittlig (10.1% delta till föregående frekvens)
Mellan 400 - 2000 Hz
(±) | högre mellan - i genomsnitt 5.2% högre än median
(+) | mids är linjära (4.9% delta till föregående frekvens)
Högsta 2 - 16 kHz
(+) | balanserade toppar - endast 4.1% från medianen
(±) | linjäriteten för toppar är genomsnittlig (8.6% delta till föregående frekvens)
Totalt 100 - 16 000 Hz
(±) | linjäriteten för det totala ljudet är genomsnittlig (15.9% skillnad mot median)
Jämfört med samma klass
» 38% av alla testade enheter i den här klassen var bättre, 7% liknande, 56% sämre
» Den bästa hade ett delta på 6%, genomsnittet var 18%, sämst var 132%
Jämfört med alla testade enheter
» 25% av alla testade enheter var bättre, 5% liknande, 70% sämre
» Den bästa hade ett delta på 4%, genomsnittet var 23%, sämst var 134%
Apple MacBook Pro 16 2021 M1 Pro ljudanalys
(+) | högtalare kan spela relativt högt (84.7 dB)
Bas 100 - 315 Hz
(+) | bra bas - bara 3.8% från medianen
(+) | basen är linjär (5.2% delta till föregående frekvens)
Mellan 400 - 2000 Hz
(+) | balanserad mellan - endast 1.3% från medianen
(+) | mids är linjära (2.1% delta till föregående frekvens)
Högsta 2 - 16 kHz
(+) | balanserade toppar - endast 1.9% från medianen
(+) | toppar är linjära (2.7% delta till föregående frekvens)
Totalt 100 - 16 000 Hz
(+) | det totala ljudet är linjärt (4.6% skillnad mot median)
Jämfört med samma klass
» 0% av alla testade enheter i den här klassen var bättre, 0% liknande, 100% sämre
» Den bästa hade ett delta på 5%, genomsnittet var 17%, sämst var 45%
Jämfört med alla testade enheter
» 0% av alla testade enheter var bättre, 0% liknande, 100% sämre
» Den bästa hade ett delta på 4%, genomsnittet var 23%, sämst var 134%
Energihantering - mer krävande hårdvara över hela linjen
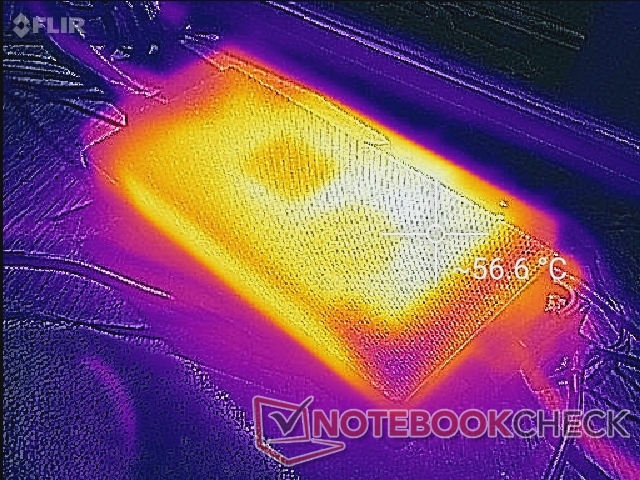
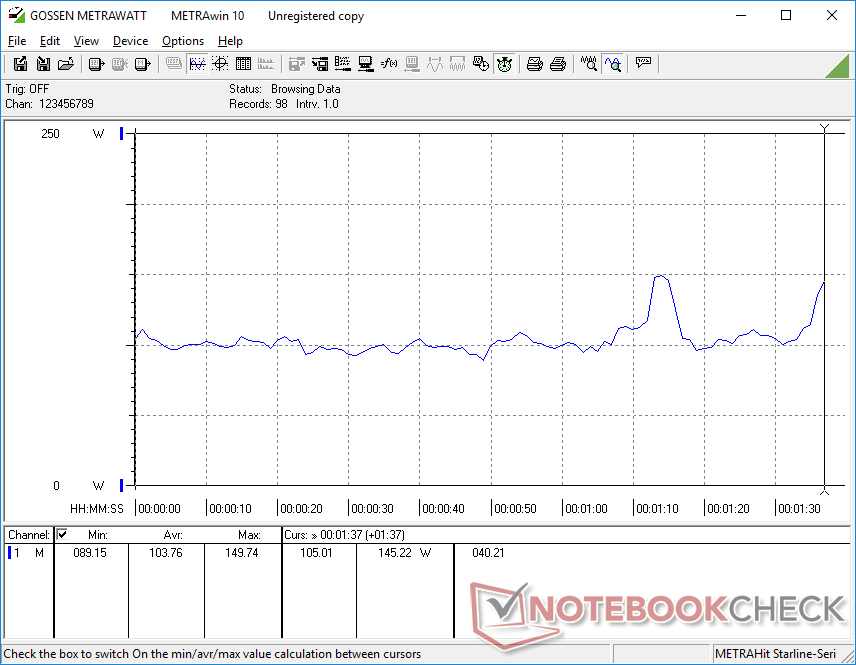
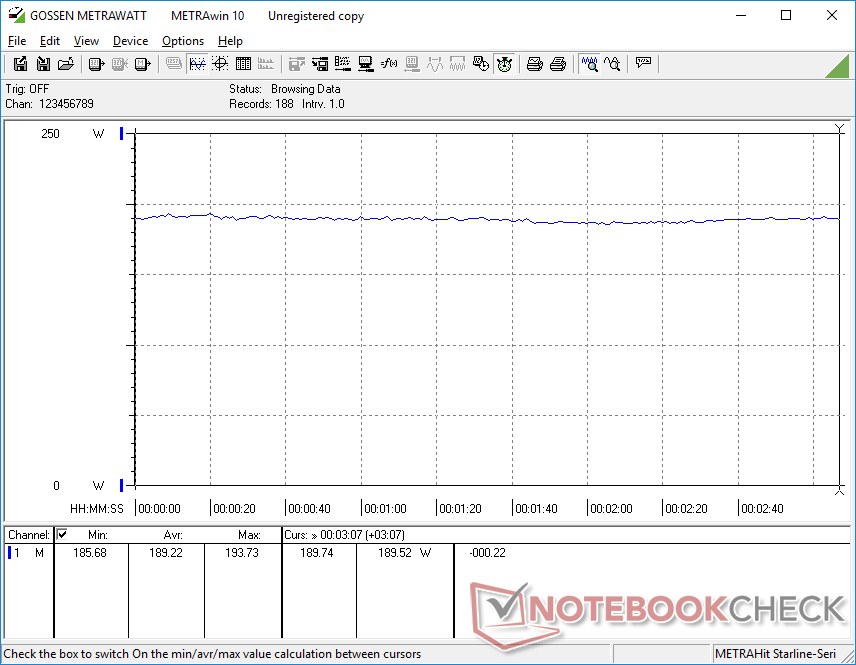
Effektförbrukning
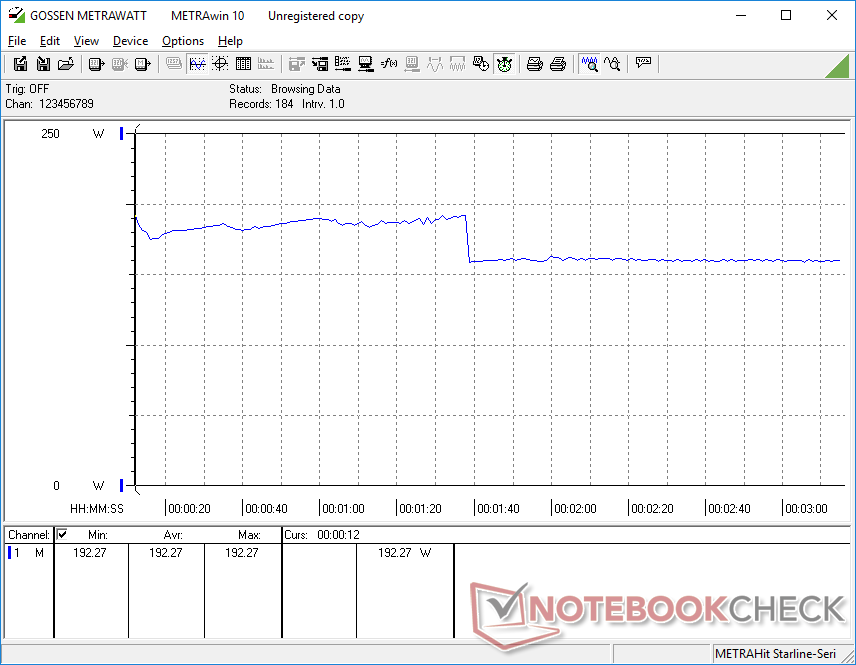
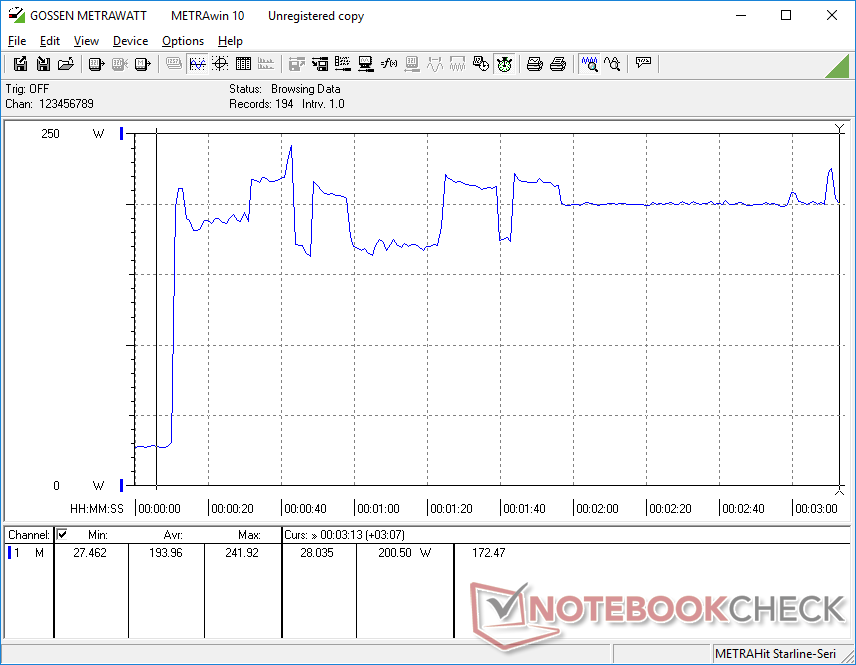
Den totala förbrukningen är högre än vad som registrerades på föregående års modell. Detta är väntat på grund av de högre effektkraven från Intels nya 12:e generationens CPU, den högre RTX 3060 TGP och den större interna kylningslösningen i FX507. Körning av Witcher 3 förbrukar cirka 20 procent mer ström jämfört med året innan för en 10 till 20 procent ökad grafikprestanda jämfört med Asus FX506 från 2021
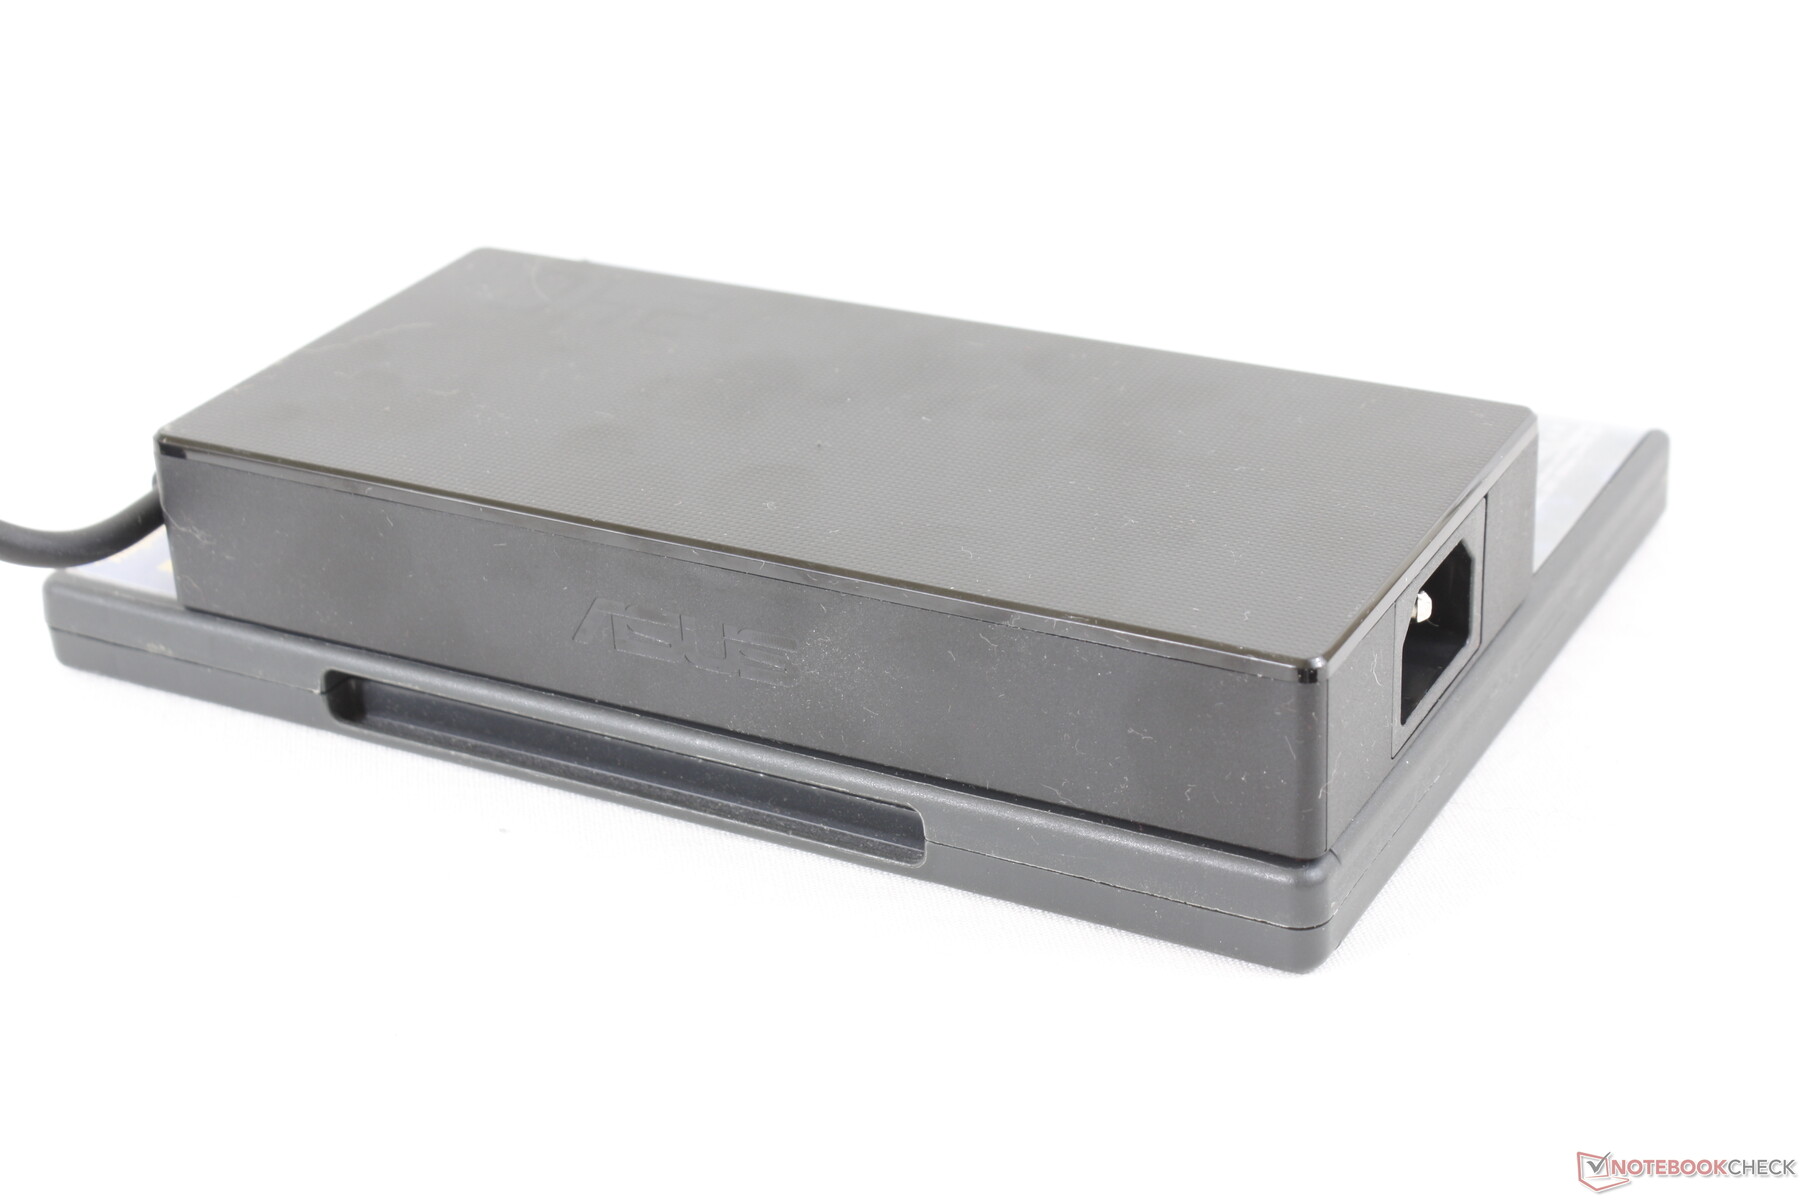
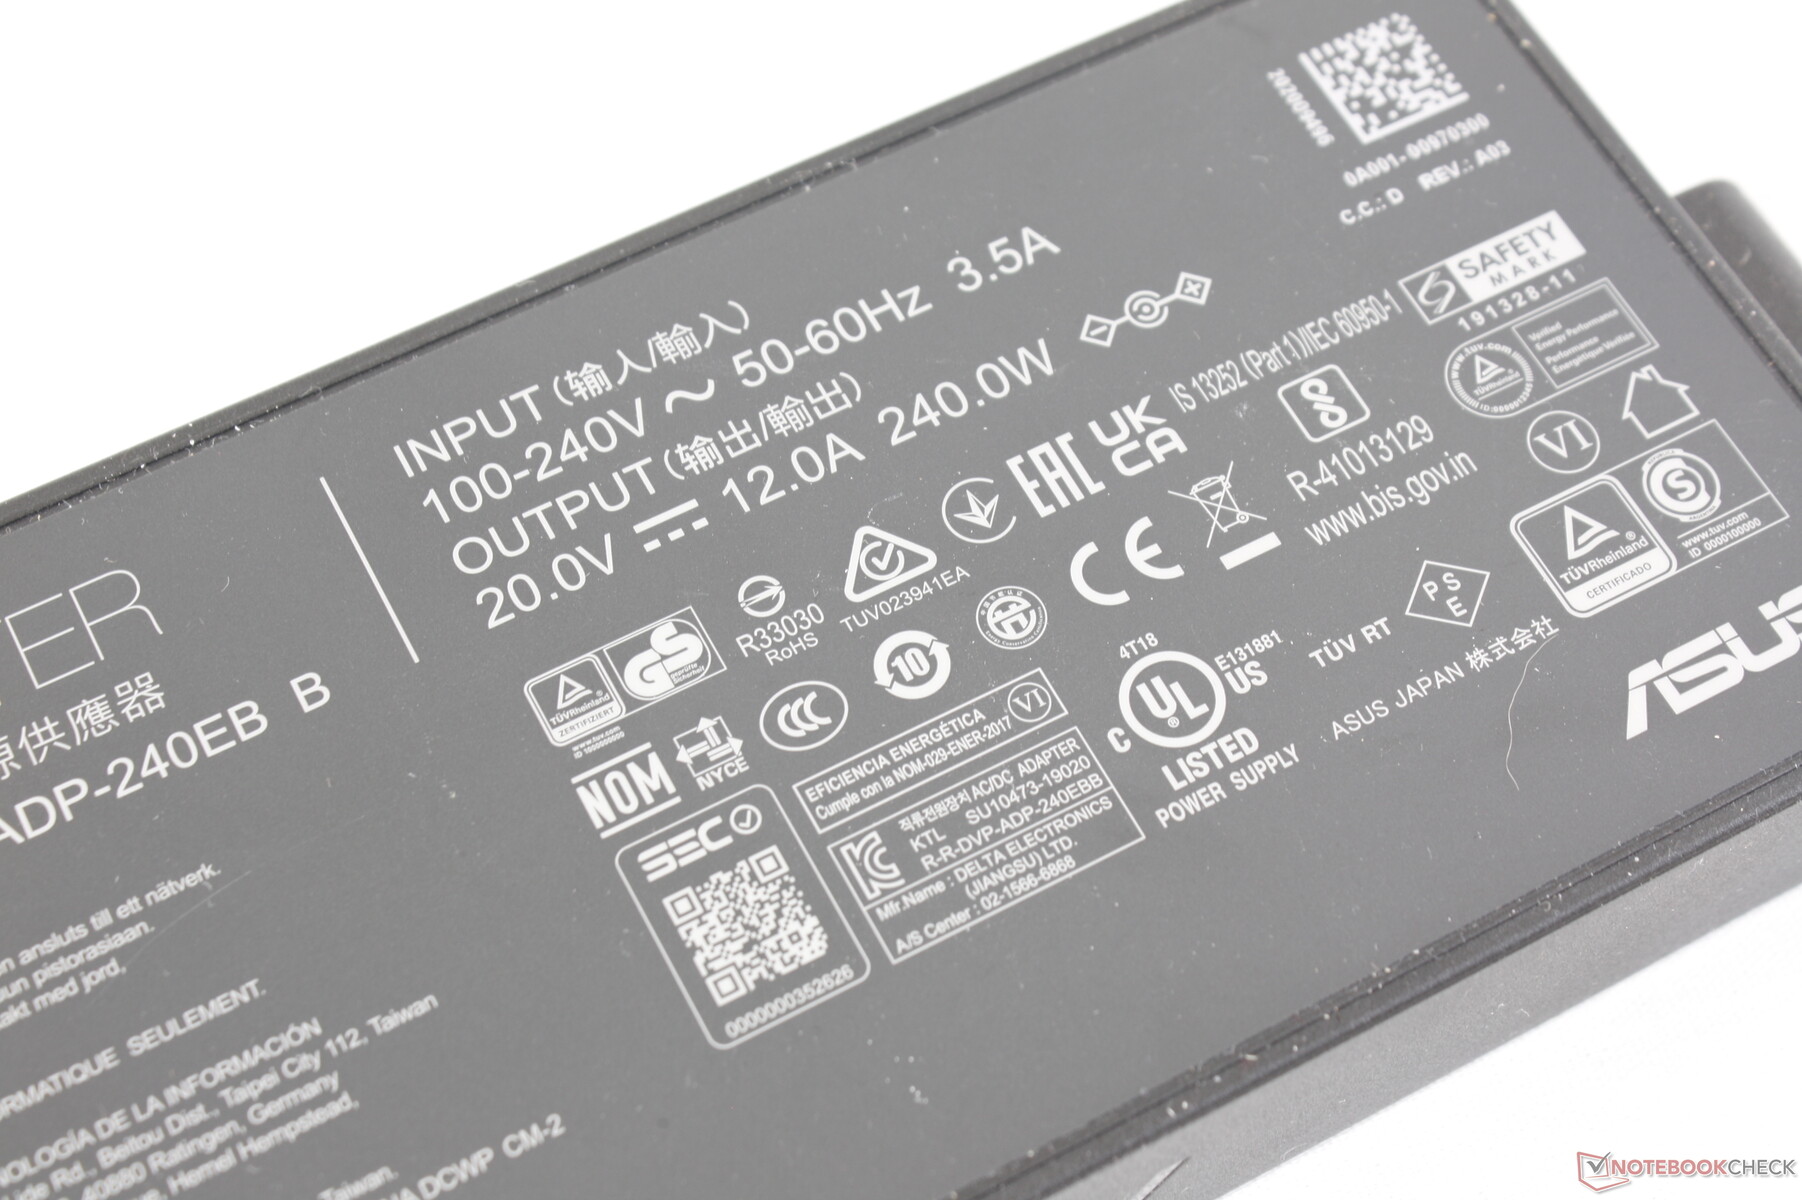
FX507 levereras med en strömsnålare 240 W AC-adapter med högre effekt jämfört med 200 W AC-adapter som levereras med FX506 för att bättre tillgodose de mer strömkrävande interna komponenterna. Den nya adaptern är därefter större än den äldre adaptern (~16,5 x 7,6 x 2,6 cm jämfört med ~15,1 x 7,2 x 2,3 cm).
| Av/Standby | |
| Låg belastning | |
| Hög belastning |
|
Förklaring:
min: | |
| Asus TUF Gaming F15 FX507ZM i7-12700H, GeForce RTX 3060 Laptop GPU, SK Hynix HFM001TD3JX013N, IPS, 1920x1080, 15.6" | Asus TUF Gaming F15 FX506HM i7-11800H, GeForce RTX 3060 Laptop GPU, SK Hynix HFM001TD3JX013N, IPS, 1920x1080, 15.6" | Asus TUF Dash F15 FX516PR i7-11370H, GeForce RTX 3070 Laptop GPU, SK Hynix HFM001TD3JX013N, IPS, 1920x1080, 15.6" | Asus ROG Strix Scar 15 G533QS R9 5900HX, GeForce RTX 3080 Laptop GPU, ADATA Swordfish 2 TB, IPS, 2560x1440, 15.6" | Asus Zephyrus S15 GX502L i7-10875H, GeForce RTX 2070 Super Mobile, WDC PC SN730 SDBPNTY-1T00, IPS, 1920x1080, 15.6" | Asus ZenBook Pro Duo UX582 LR-1BH2 i7-10870H, GeForce RTX 3070 Laptop GPU, Samsung PM981a MZVLB1T0HBLR, OLED + IPS, 3840x2160, 15.6" | |
|---|---|---|---|---|---|---|
| Power Consumption | -2% | 9% | -24% | -12% | -4% | |
| Idle Minimum * (Watt) | 6.3 | 9.5 -51% | 9 -43% | 11.2 -78% | 7 -11% | 9 -43% |
| Idle Average * (Watt) | 9.8 | 12.1 -23% | 11 -12% | 16.4 -67% | 13 -33% | 14 -43% |
| Idle Maximum * (Watt) | 26.5 | 22.5 15% | 16 40% | 29.4 -11% | 25 6% | 15 43% |
| Load Average * (Watt) | 103.8 | 99.5 4% | 107 -3% | 106.2 -2% | 148 -43% | 107.2 -3% |
| Witcher 3 ultra * (Watt) | 189 | 157 17% | 121 36% | 189 -0% | 175 7% | 156 17% |
| Load Maximum * (Watt) | 241.9 | 173.5 28% | 162 33% | 213.6 12% | 232 4% | 235 3% |
* ... mindre är bättre
Power Consumption Witcher 3 / Stresstest
Power Consumption external Monitor
Batteritid - kortare än förra generationens modell
WLAN-tiden är flera timmar kortare än vad vi noterade på förra årets modell, trots att de har samma batteri med 90 Wh kapacitet. Vi testade detta två gånger på den balanserade strömprofilen med MSHybrid aktiv och fick samma resultat. De kortare WLAN-körtiderna från år till år stämmer överens med vad vi observerade mellan 2021 Razer Blade 15 och 2022 Razer Blade 15.
Laddning från tom till full kapacitet med den medföljande växelströmsadaptern tar cirka 90 minuter. Tyvärr har den här modellen inte stöd för USB-C-laddning till skillnad från Razer Blade-serien eller MSI GS-serien.
| Asus TUF Gaming F15 FX507ZM i7-12700H, GeForce RTX 3060 Laptop GPU, 90 Wh | Asus TUF Gaming F15 FX506HM i7-11800H, GeForce RTX 3060 Laptop GPU, 90 Wh | Asus TUF Dash F15 FX516PR i7-11370H, GeForce RTX 3070 Laptop GPU, 76 Wh | Asus ROG Strix Scar 15 G533QS R9 5900HX, GeForce RTX 3080 Laptop GPU, 90 Wh | Asus Zephyrus S15 GX502L i7-10875H, GeForce RTX 2070 Super Mobile, 76 Wh | Asus ZenBook Pro Duo UX582 LR-1BH2 i7-10870H, GeForce RTX 3070 Laptop GPU, 92 Wh | |
|---|---|---|---|---|---|---|
| Batteridrifttid | 39% | 46% | 16% | -15% | 36% | |
| Reader / Idle (h) | 15.8 | 11 -30% | 16 1% | 11.1 -30% | 8.7 -45% | |
| WiFi v1.3 (h) | 4.8 | 7.9 65% | 9.1 90% | 7.3 52% | 3 -37% | 7.4 54% |
| Load (h) | 1.1 | 2 82% | 1.4 27% | 1.5 36% | 1.3 18% | |
| H.264 (h) | 8.2 |
För
Emot
Omdöme - 140 W GeForce RTX 3060-grafik
Bortsett från alla chassiuppdateringar är FX507 mest anmärkningsvärd för sitt mycket högre TGP-mål på 140 W jämfört med endast 95 W på FX506. Datortillverkare överallt använder samma GeForce GPU:er i år eftersom Nvidia ännu inte har lanserat efterföljaren till den mobila RTX 3000-serien. För att kunna erbjuda bättre grafikprestanda från samma GPU måste FX507 alltså förbruka mer ström än FX506. Resultatet är en GeForce RTX 3060 bärbar dator är snabbare än de flesta andra bärbara datorer som för närvarande finns tillgängliga utrustade med samma GPU.
För att lindra några av konsekvenserna av ett mer strömkrävande system har Asus uppgraderat kylningslösningen för att hålla temperaturen och fläktljudet i schack. FX507 är därefter inte nämnvärt varmare eller högre än sin föregångare trots sin totalt sett lägre vikt.
De mer krävande processorerna i FX507 har direkt påverkat batteritiden och storleken på nätadaptern. Räkna inte med längre körtider än på FX506 under de flesta förhållanden och var beredd på att bära runt på en ännu större AC-adapter än tidigare. Det är olyckligt att systemet inte kan laddas via USB-C-adaptrar från tredje part.
Förändringarna av tangentbordet och klickplattan är en blandad kompott med tanke på att det mörkgrå typsnittet kontrasterar dåligt mot de mörka tangentkapslarna. Dra-och-släpp-åtgärder är lättare på den senaste generationens modell på grund av dess dedikerade musknappar.
Pris och tillgänglighet
Asus TUF Gaming F15 FX507ZM, som vi recenserade, finns nu på och är tillgänglig på Amazon för 1750 USD.
Asus TUF Gaming F15 FX507ZM
- 03/26/2022 v7 (old)
Allen Ngo
Price comparison

