Recension av Eurocom RX315 laptop: MSI GS66 Stealth-alternativet
")
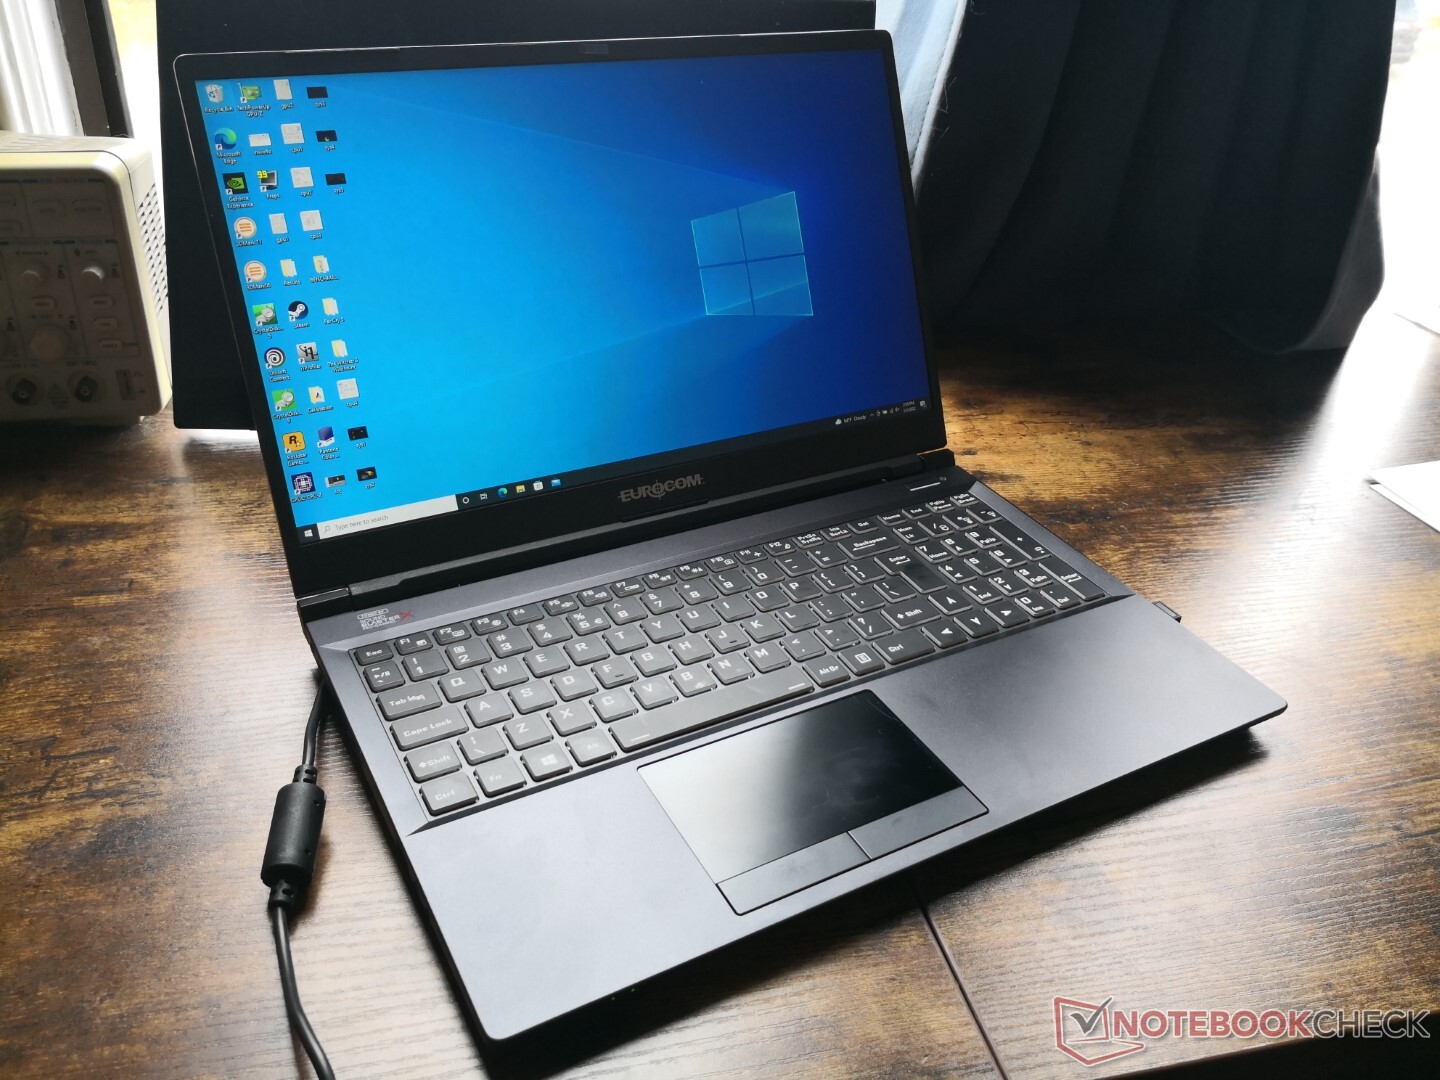
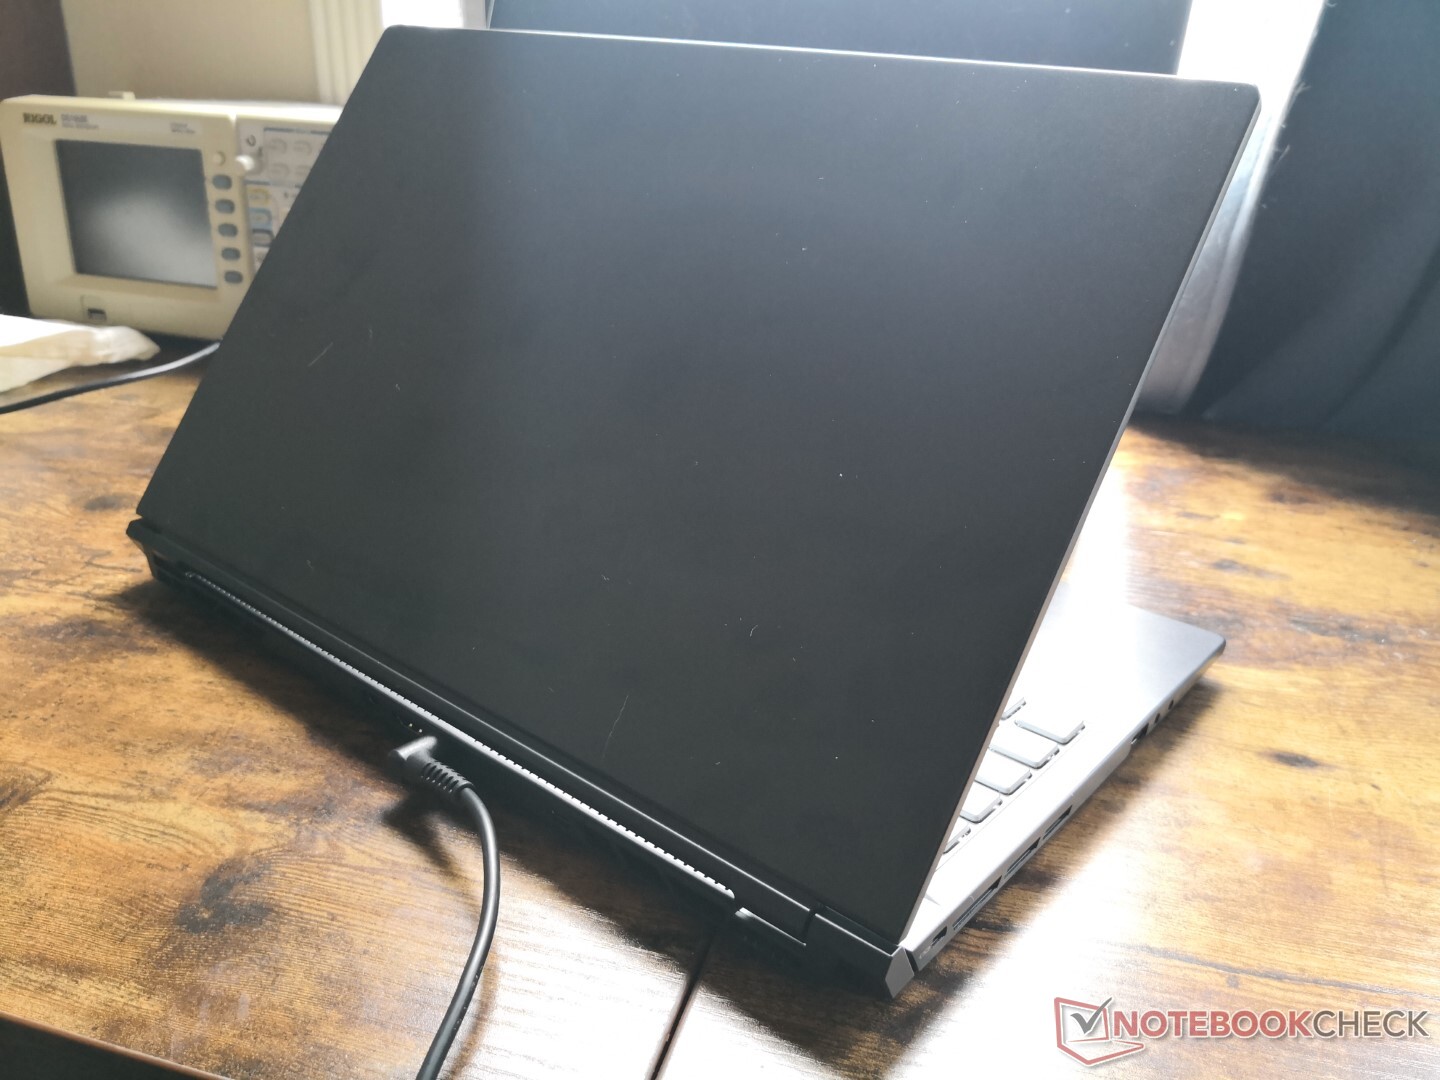
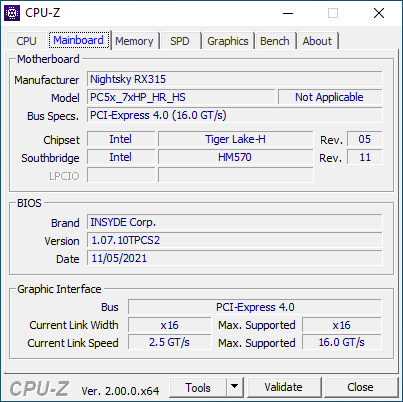
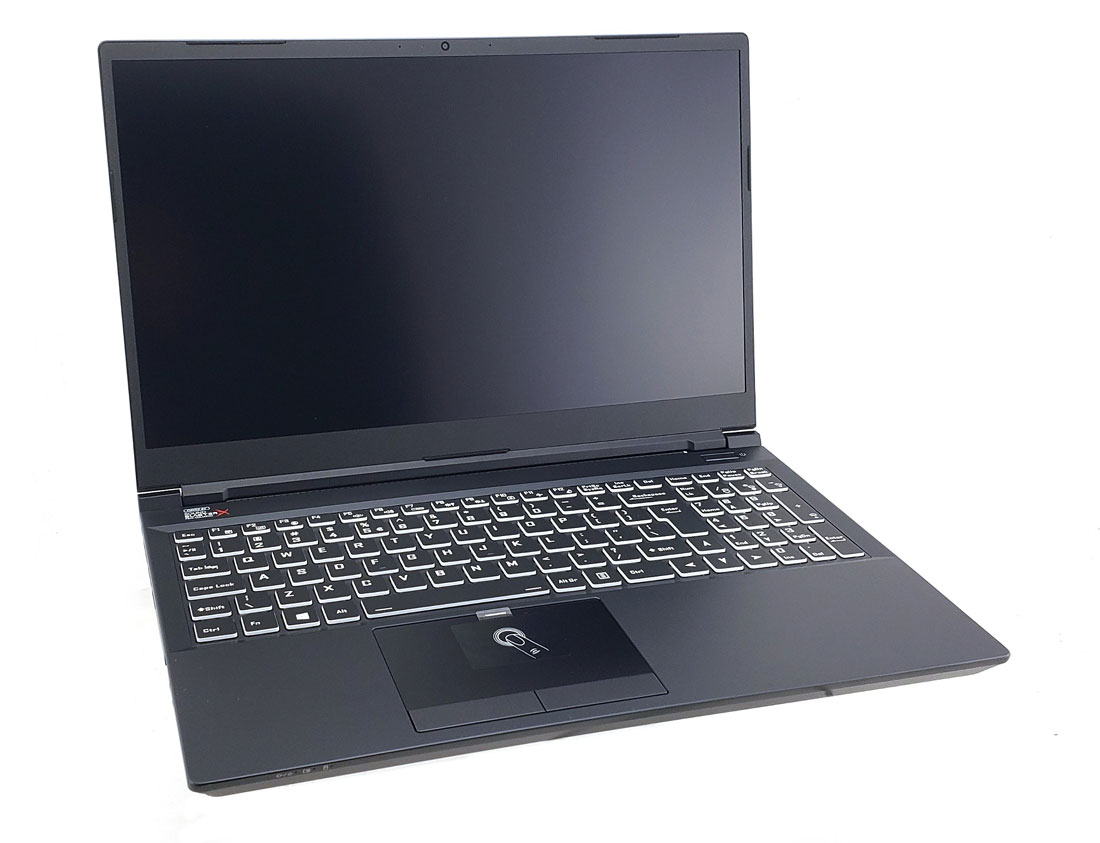
Eurocom RX315 NH57AF1 är en annan konfiguration av Eurocom RX315 NH57AF1 Schenker XMG Pro 15 som vi recenserade tidigare i år. Därför rekommenderar vi att du kollar in vår befintliga Schenker-recension för att lära dig mer om chassit och de fysiska egenskaperna eftersom båda modellerna är visuellt identiska. Den här sidan kommer istället att fokusera på den prestanda som användare kan förvänta sig av RX315.
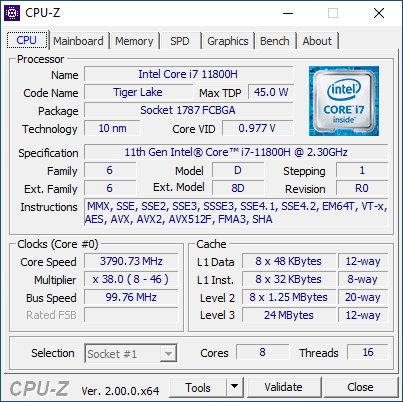
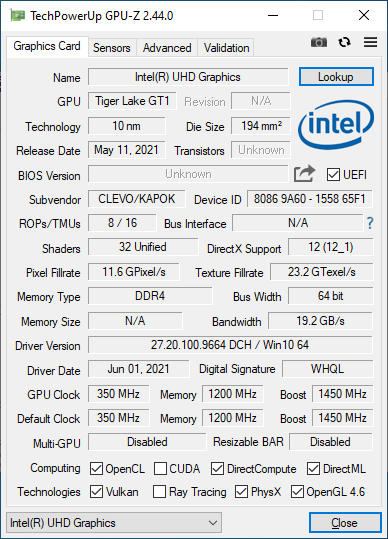
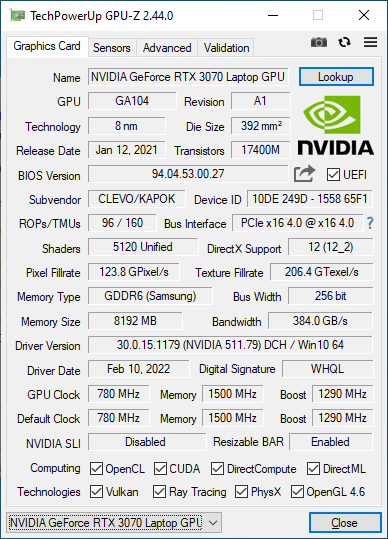
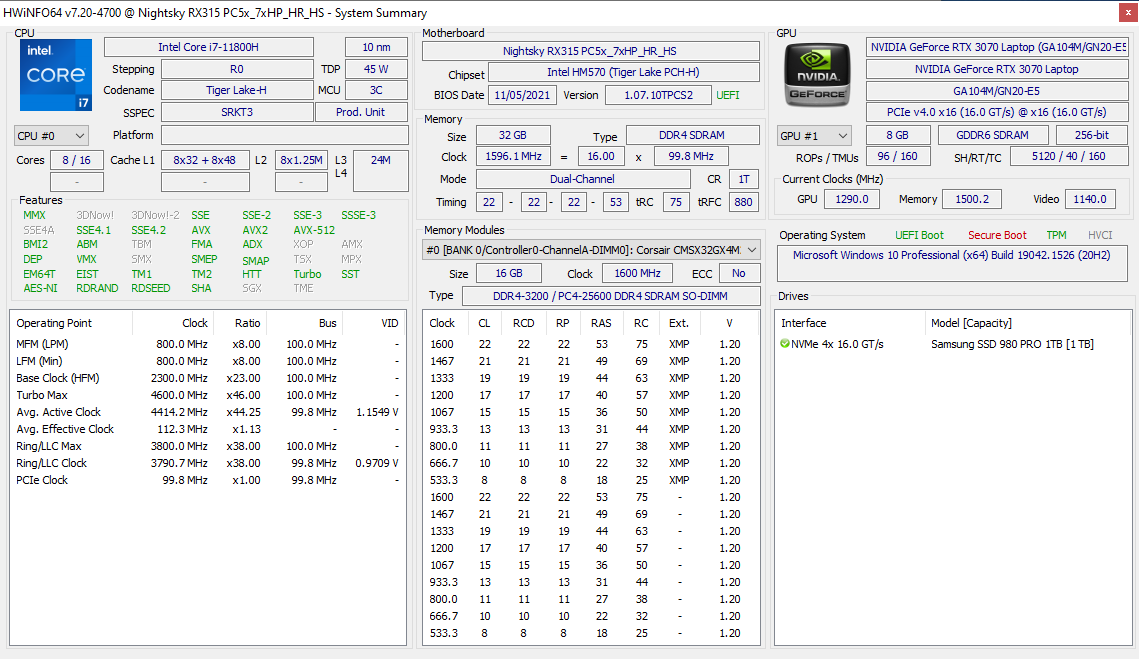
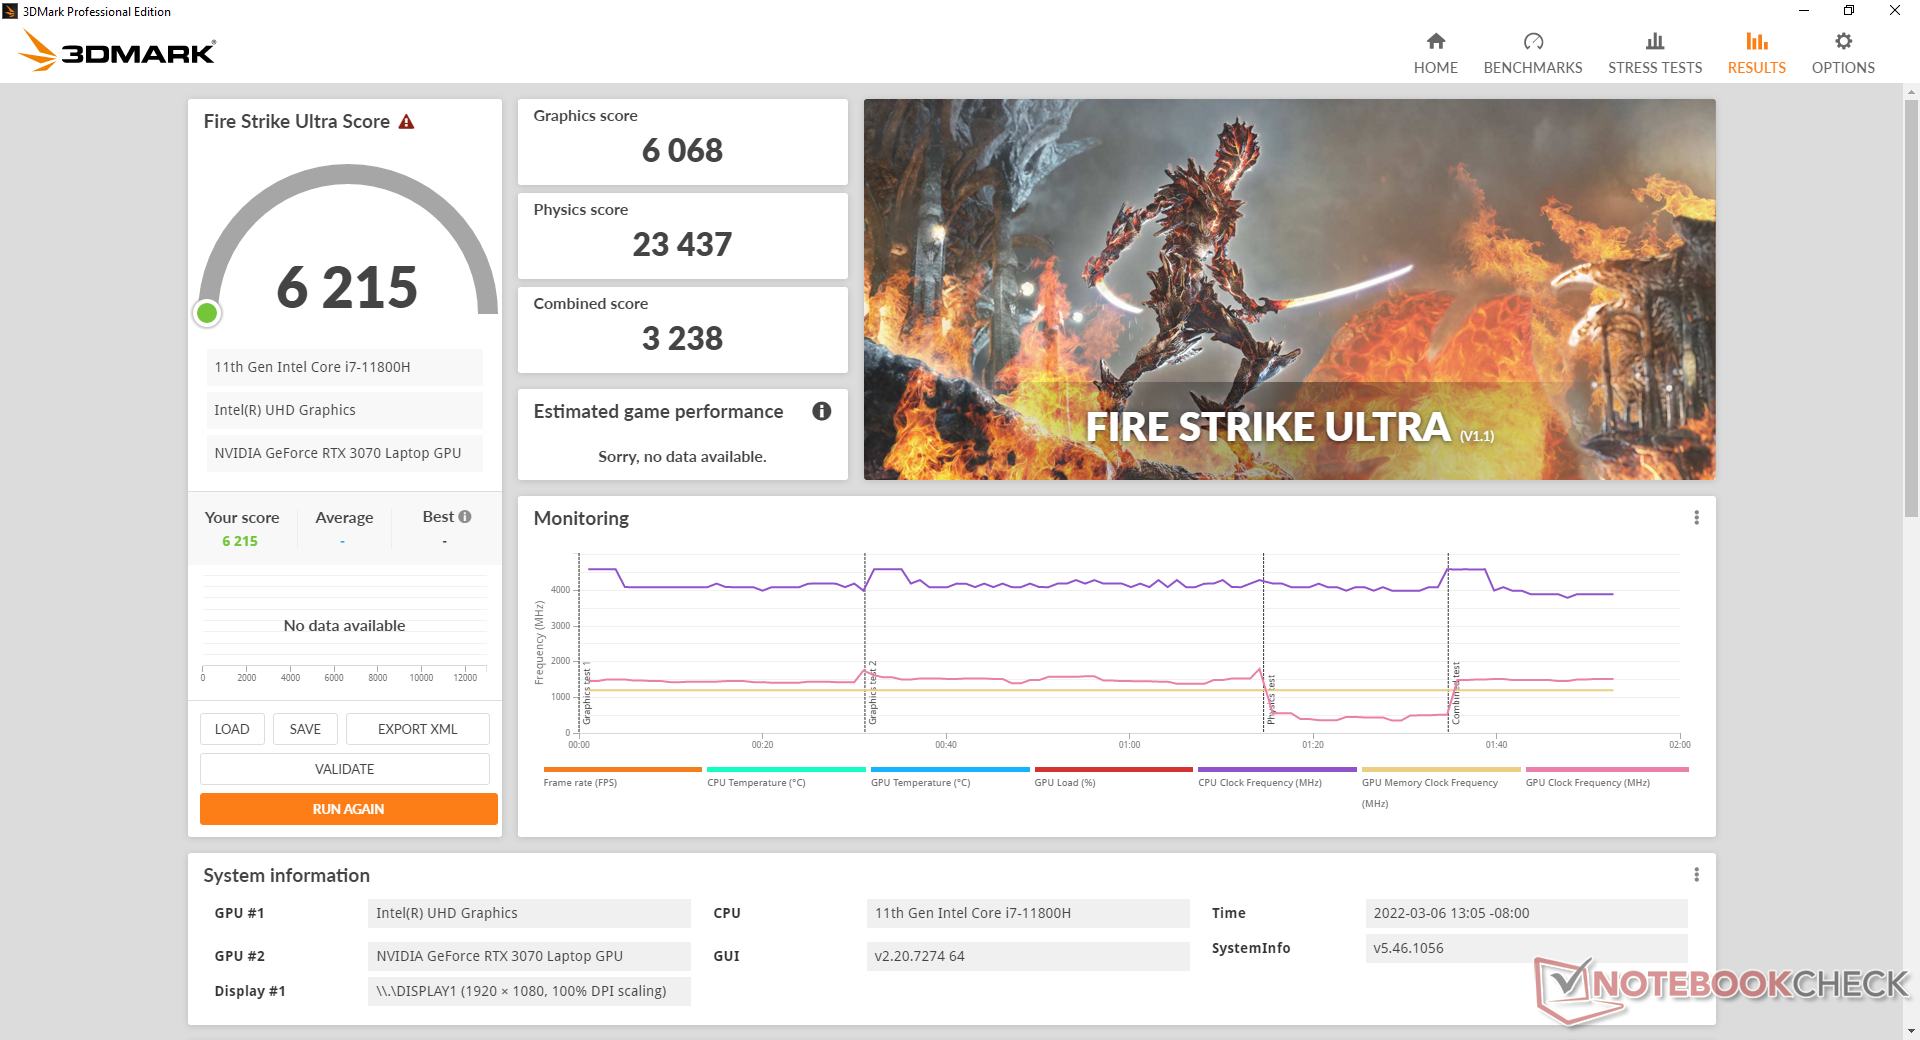
Vår enhet som granskats kommer med 11th gen Core i7-11800H CPU, 105 W TGP GeForce RTX 3070 GPU och 240 Hz IPS-skärm. Ytterligare konfigurationsalternativ kan hittas här. Eurocom säger att 12:e generationens Intel CPU:er och RTX 3080 Ti kommer inom en snar framtid.
Alternativ till RX315 är andra ultratunna bärbara 15,6-tums gamingdatorer som t.ex MSI GS66, Asus Zephyrus S15-serien, Razer Blade 15eller Alienware X15. Eurocom RX315 ska inte förväxlas med den tjockare ARX15 eller ARX315.
Fler recensioner av Eurocom:
Potentiella konkurrenter i jämförelse
Gradering | Datum | Modell | Vikt | Höjd | Storlek | Upplösning | Pris |
|---|---|---|---|---|---|---|---|
| 85.2 % v7 (old) | 03/2022 | Eurocom RX315 NH57AF1 i7-11800H, GeForce RTX 3070 Laptop GPU | 2 kg | 20 mm | 15.60" | 1920x1080 | |
| 84.5 % v7 (old) | 02/2022 | MSI Stealth GS66 12UGS i7-12700H, GeForce RTX 3070 Ti Laptop GPU | 2.2 kg | 19.8 mm | 15.60" | 2560x1440 | |
| 83 % v7 (old) | 01/2022 | Eurocom Nightsky ARX315 R9 5900X, GeForce RTX 3070 Laptop GPU | 2.6 kg | 32.5 mm | 15.60" | 1920x1080 | |
| 86.1 % v7 (old) | 11/2021 | Alienware m15 R6, i7-11800H RTX 3080 i7-11800H, GeForce RTX 3080 Laptop GPU | 2.5 kg | 22.85 mm | 15.60" | 1920x1080 | |
| 82.7 % v7 (old) | 12/2023 | Dell G15 5515 R7 5800H, GeForce RTX 3050 Ti Laptop GPU | 2.4 kg | 24.9 mm | 15.60" | 1920x1080 | |
| 88.9 % v7 (old) | 10/2021 | Razer Blade 15 Advanced (Mid 2021) i7-11800H, GeForce RTX 3080 Laptop GPU | 2 kg | 16.99 mm | 15.60" | 1920x1080 |
Fall
Kommunikation
Webbkamera


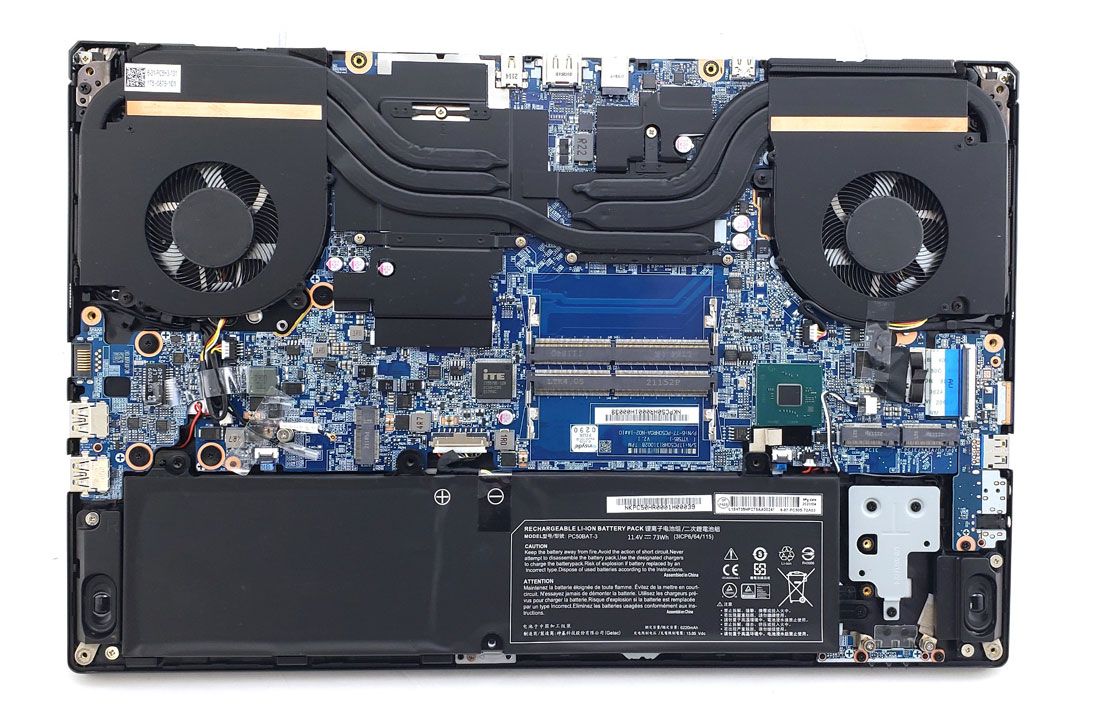
Underhåll
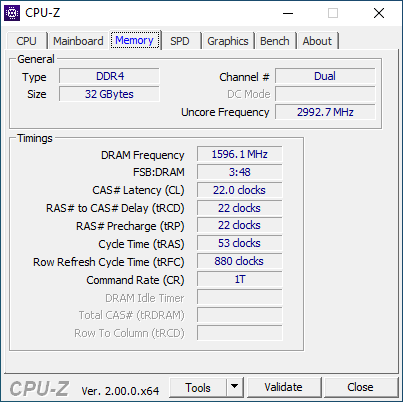
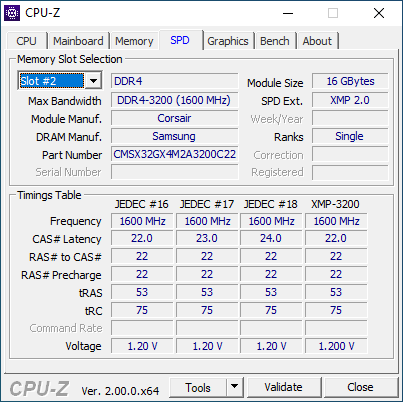
Användare kan installera upp till två DDR4 SODIMM RAM-moduler, två PCIe4 x4 M.2 2280 NVMe SSD-enheter och en WLAN-modul.
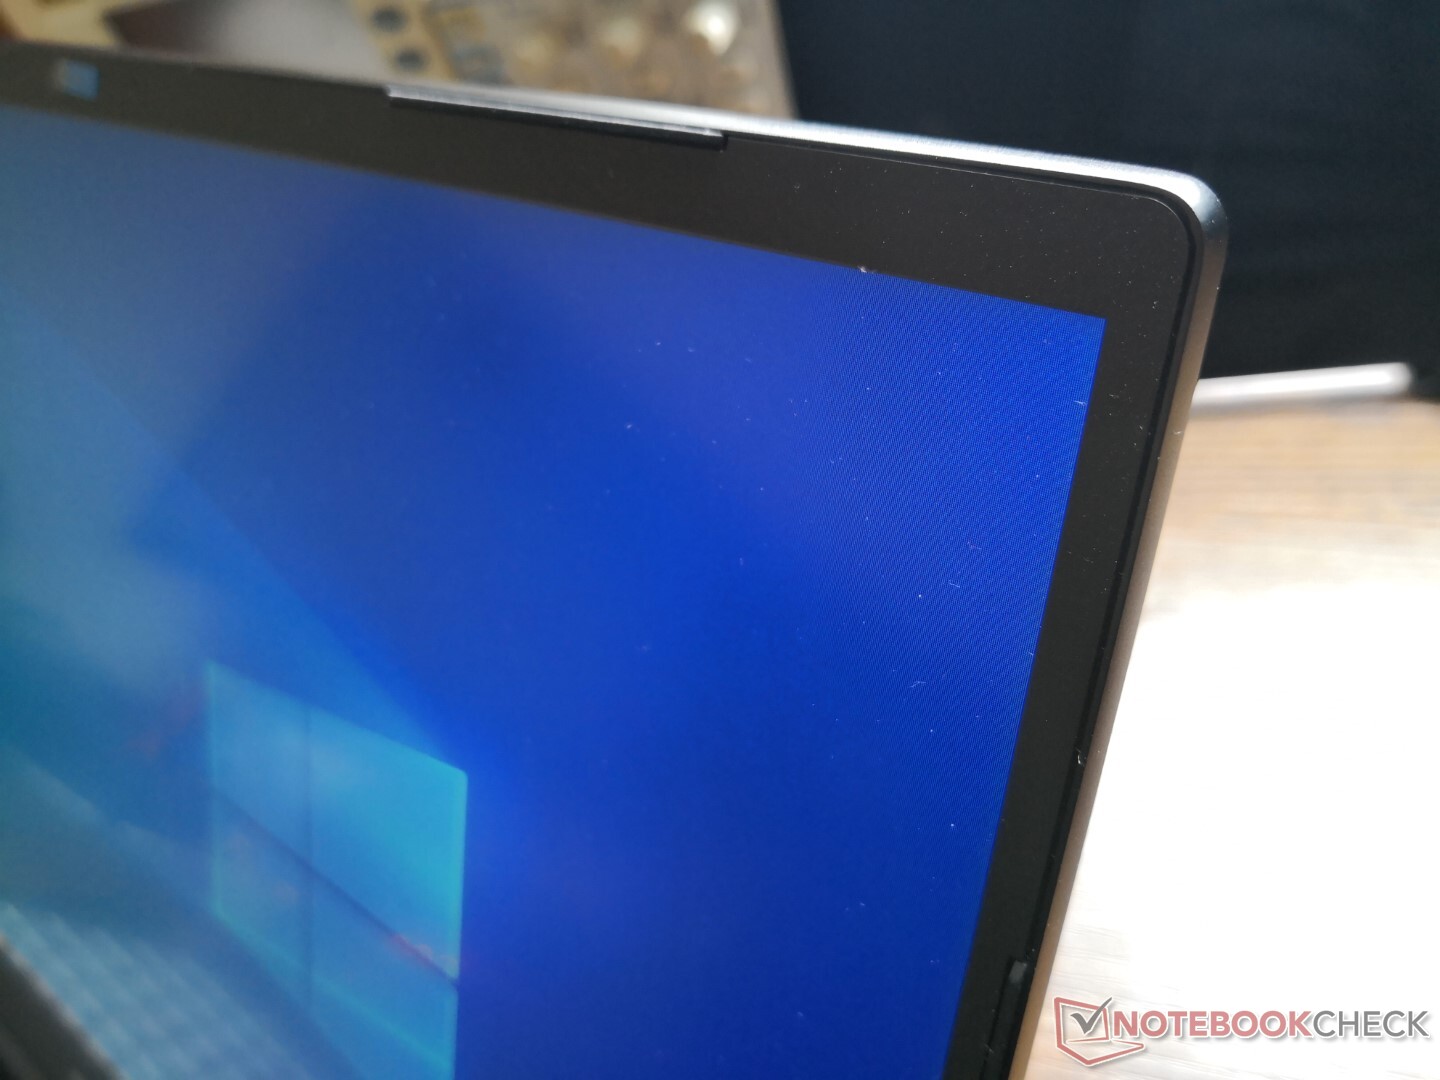
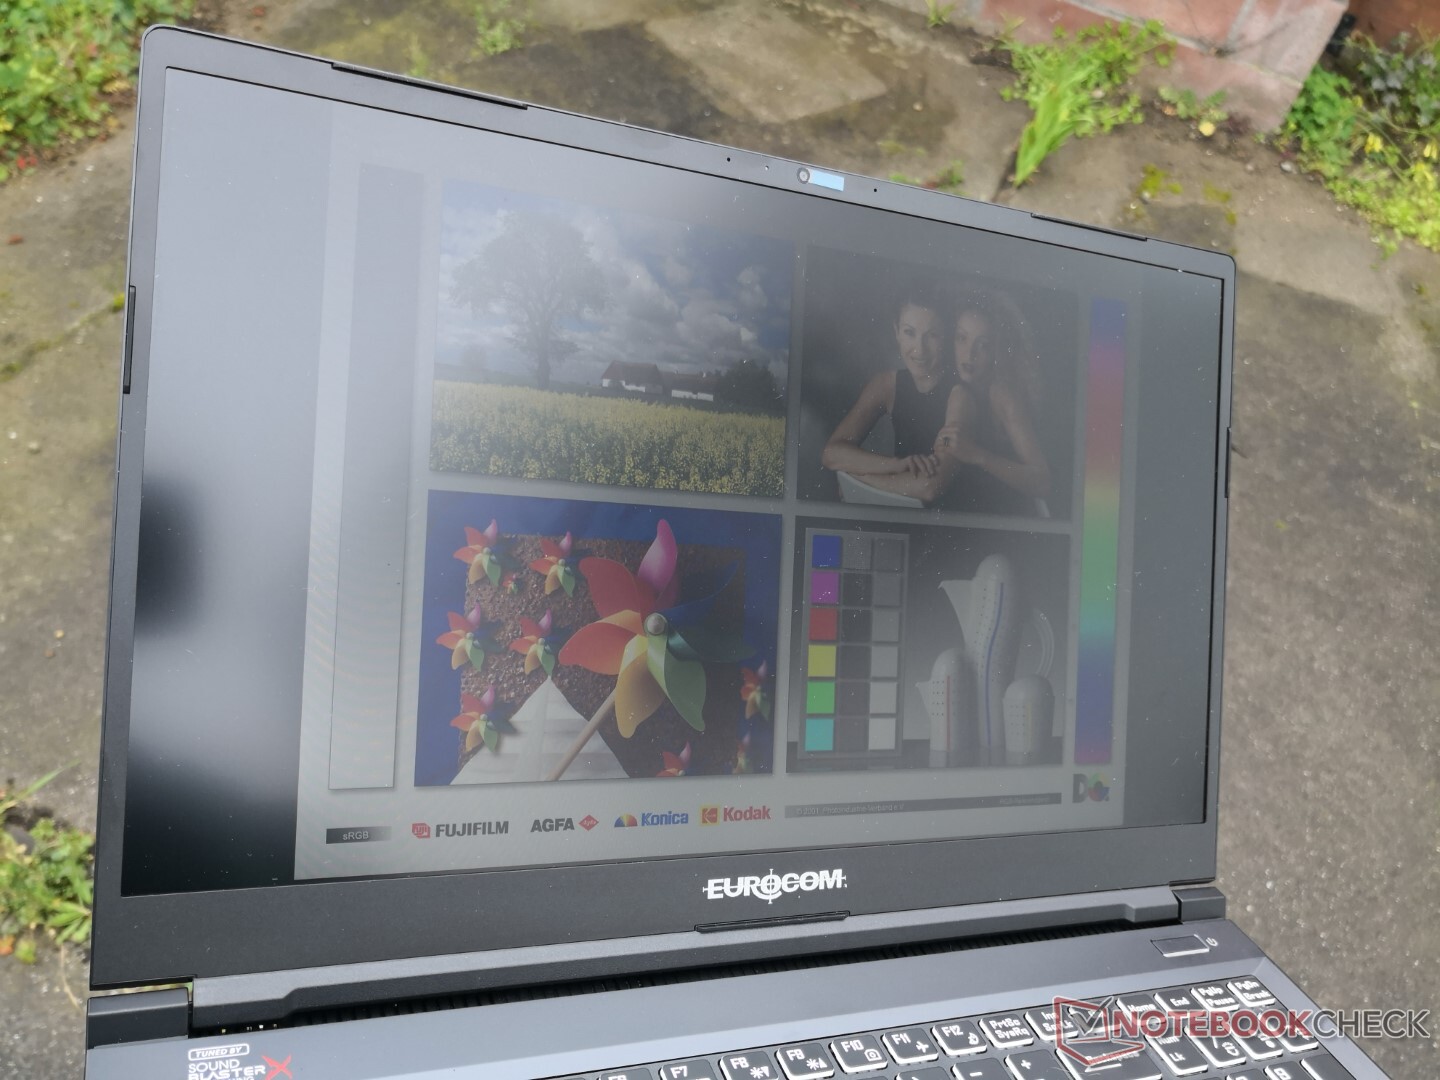
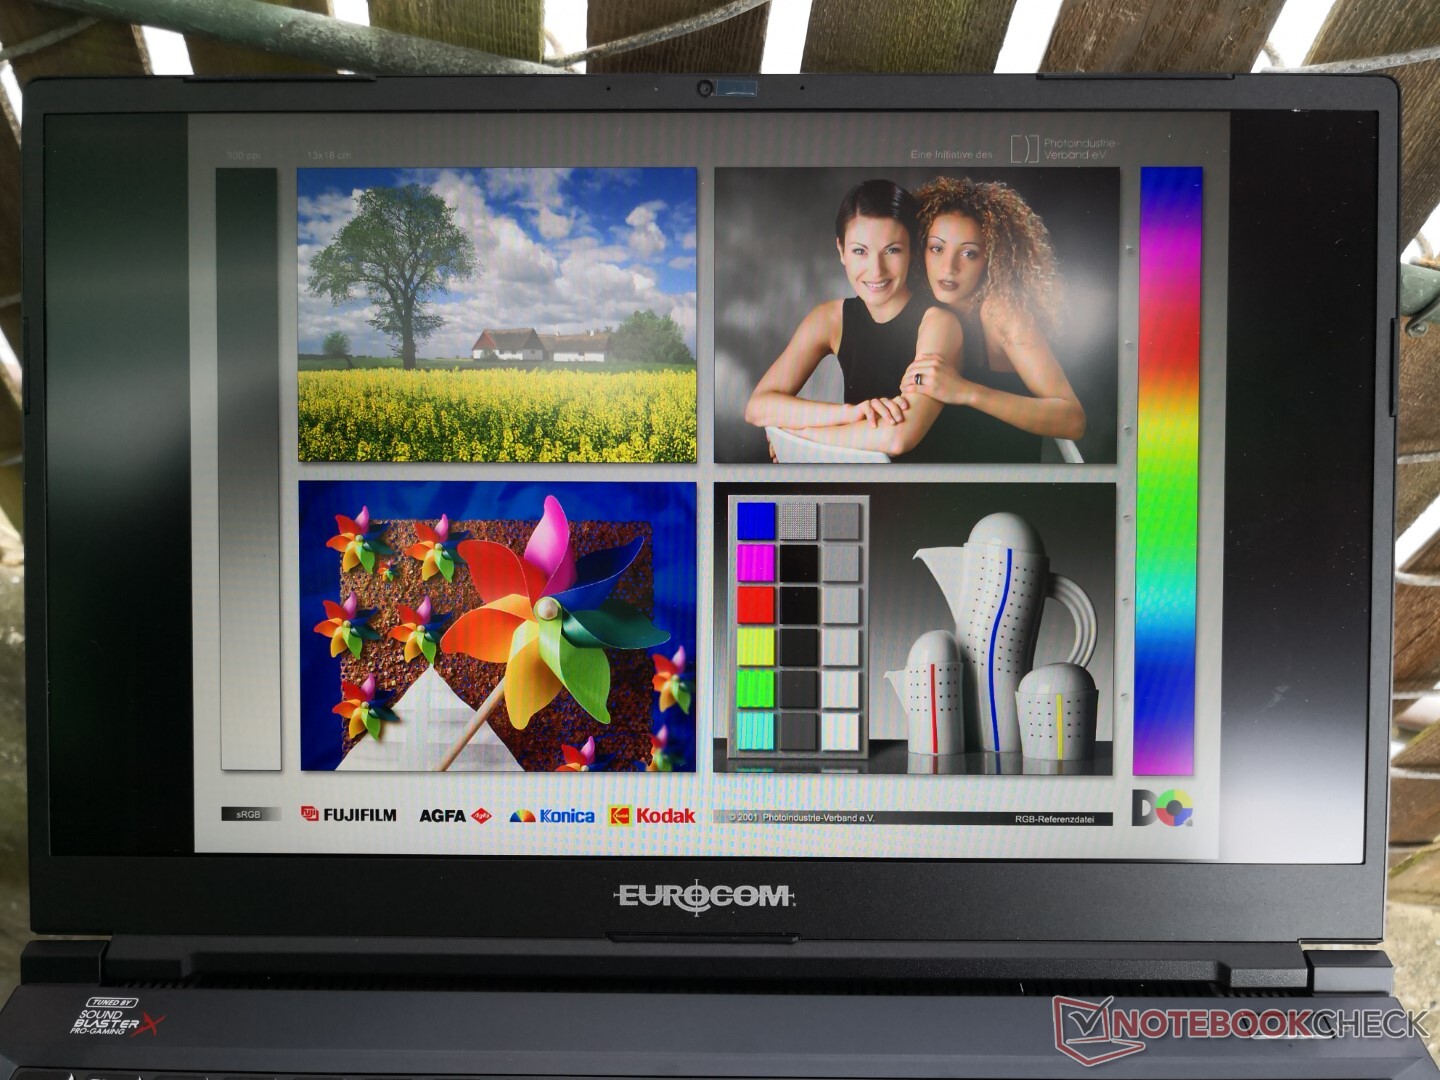
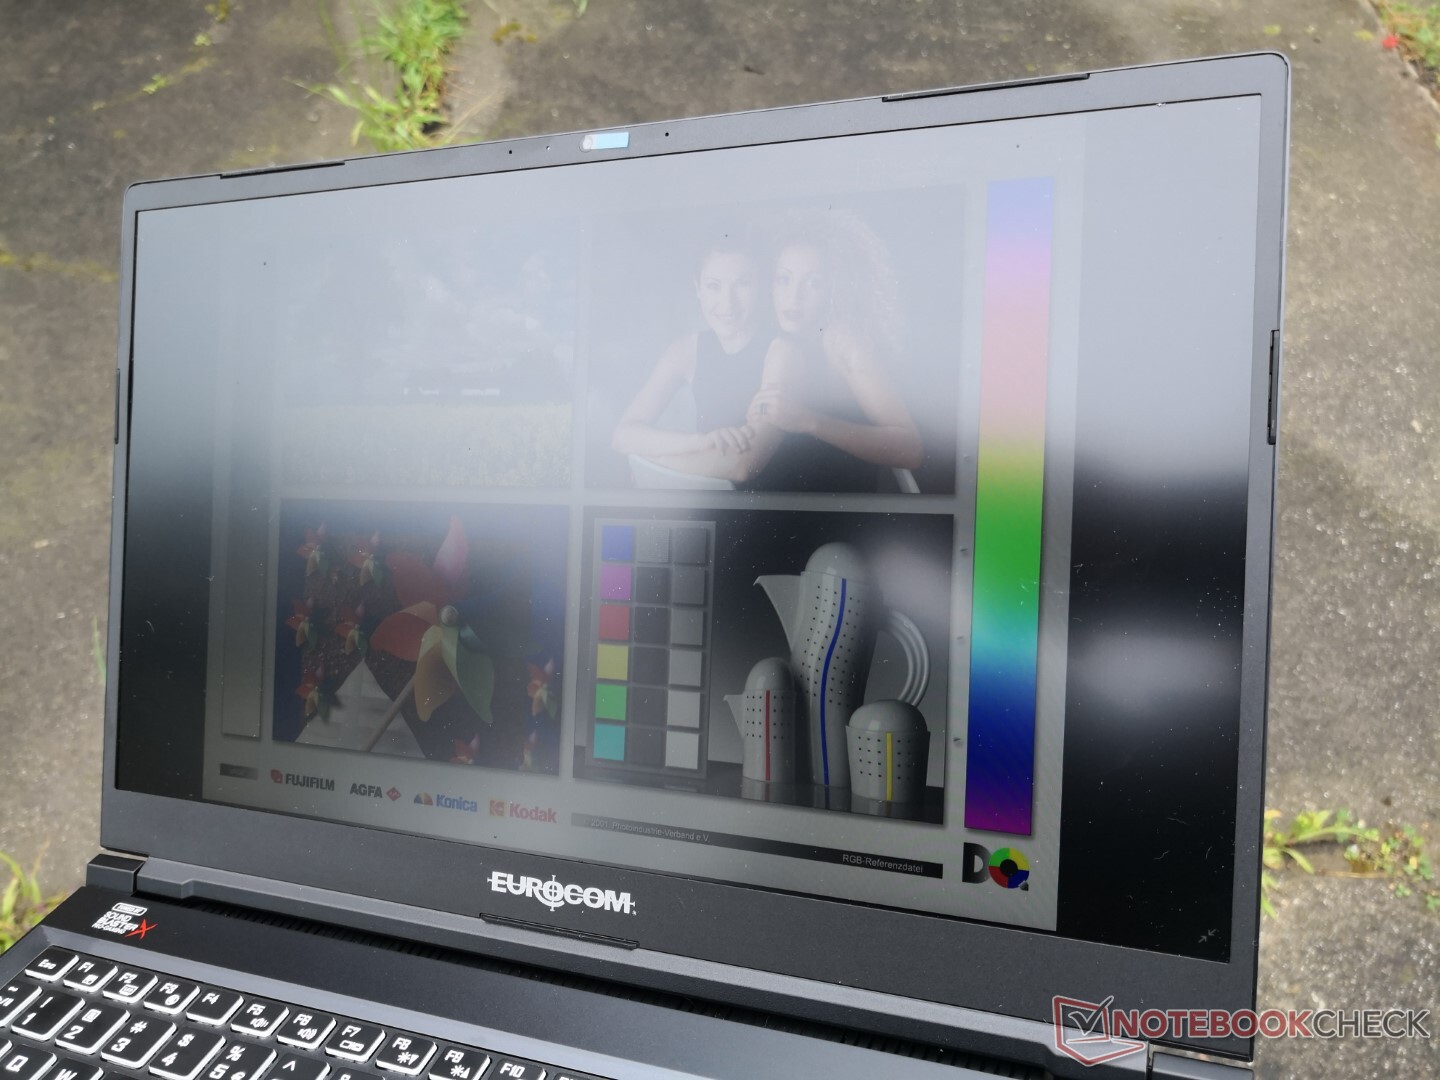
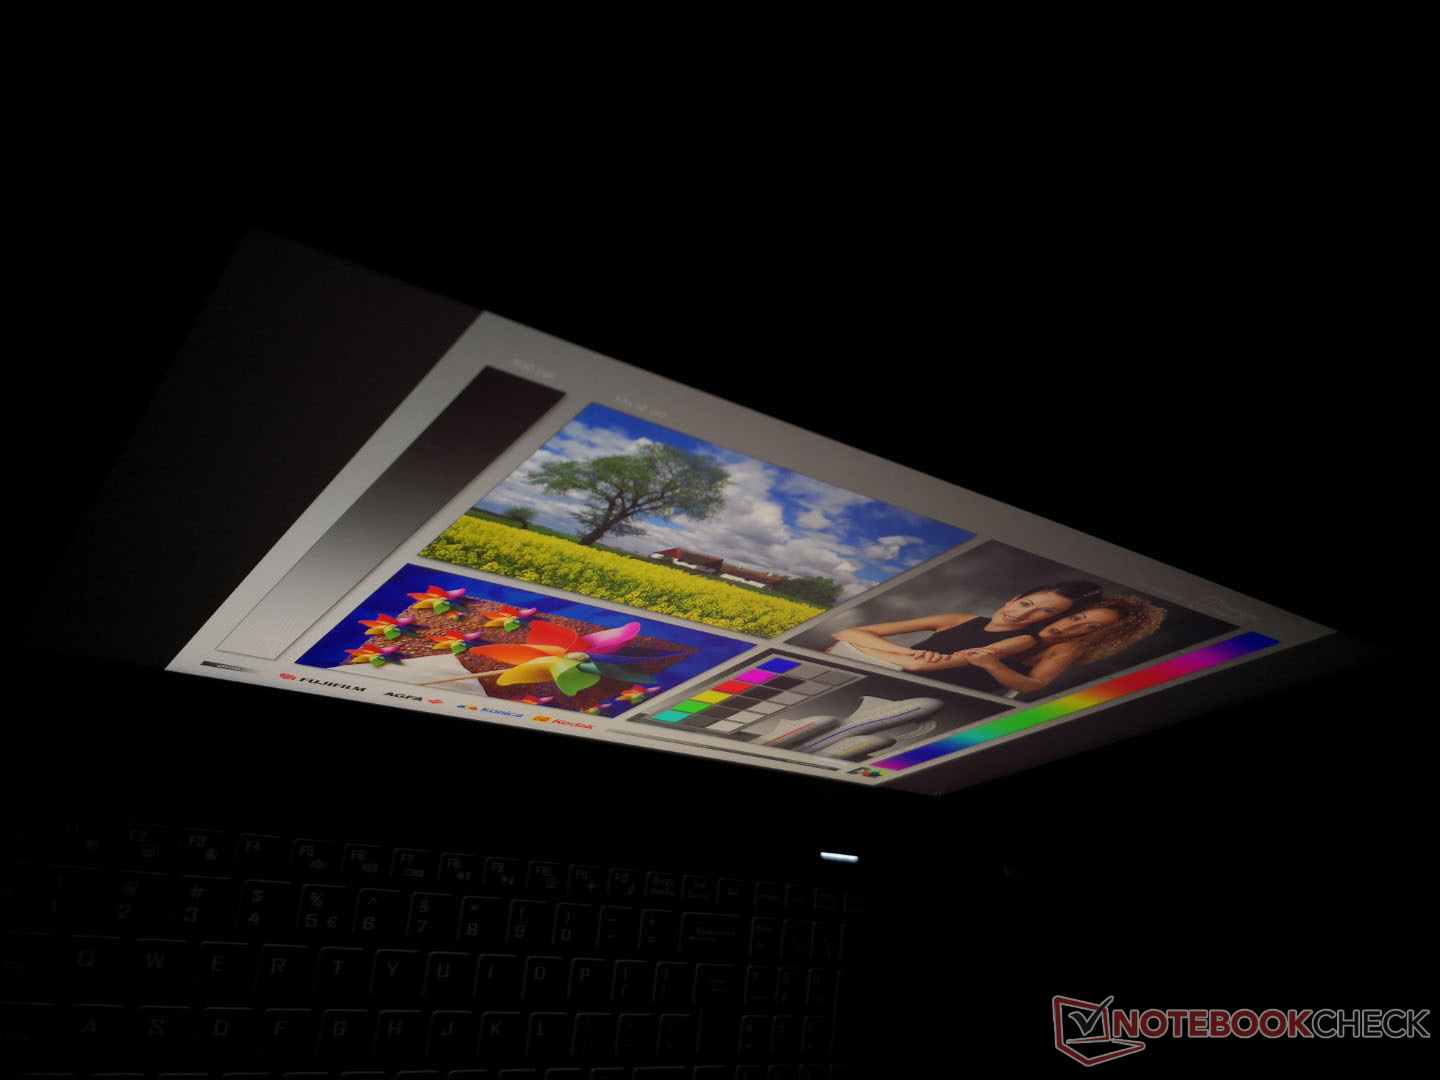
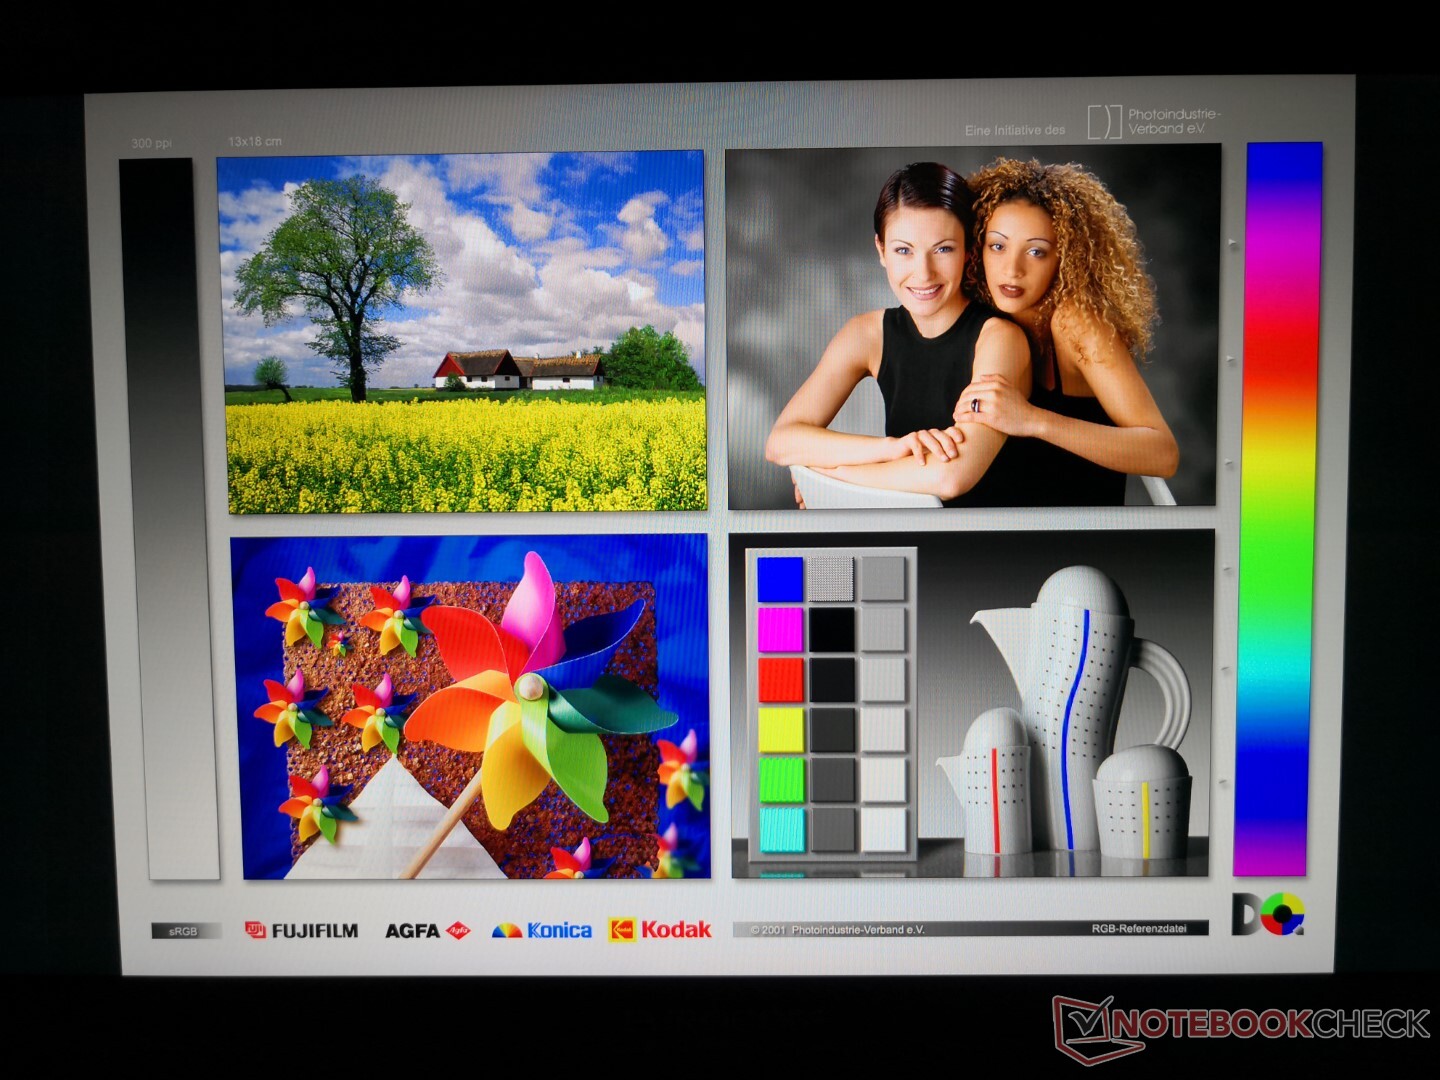
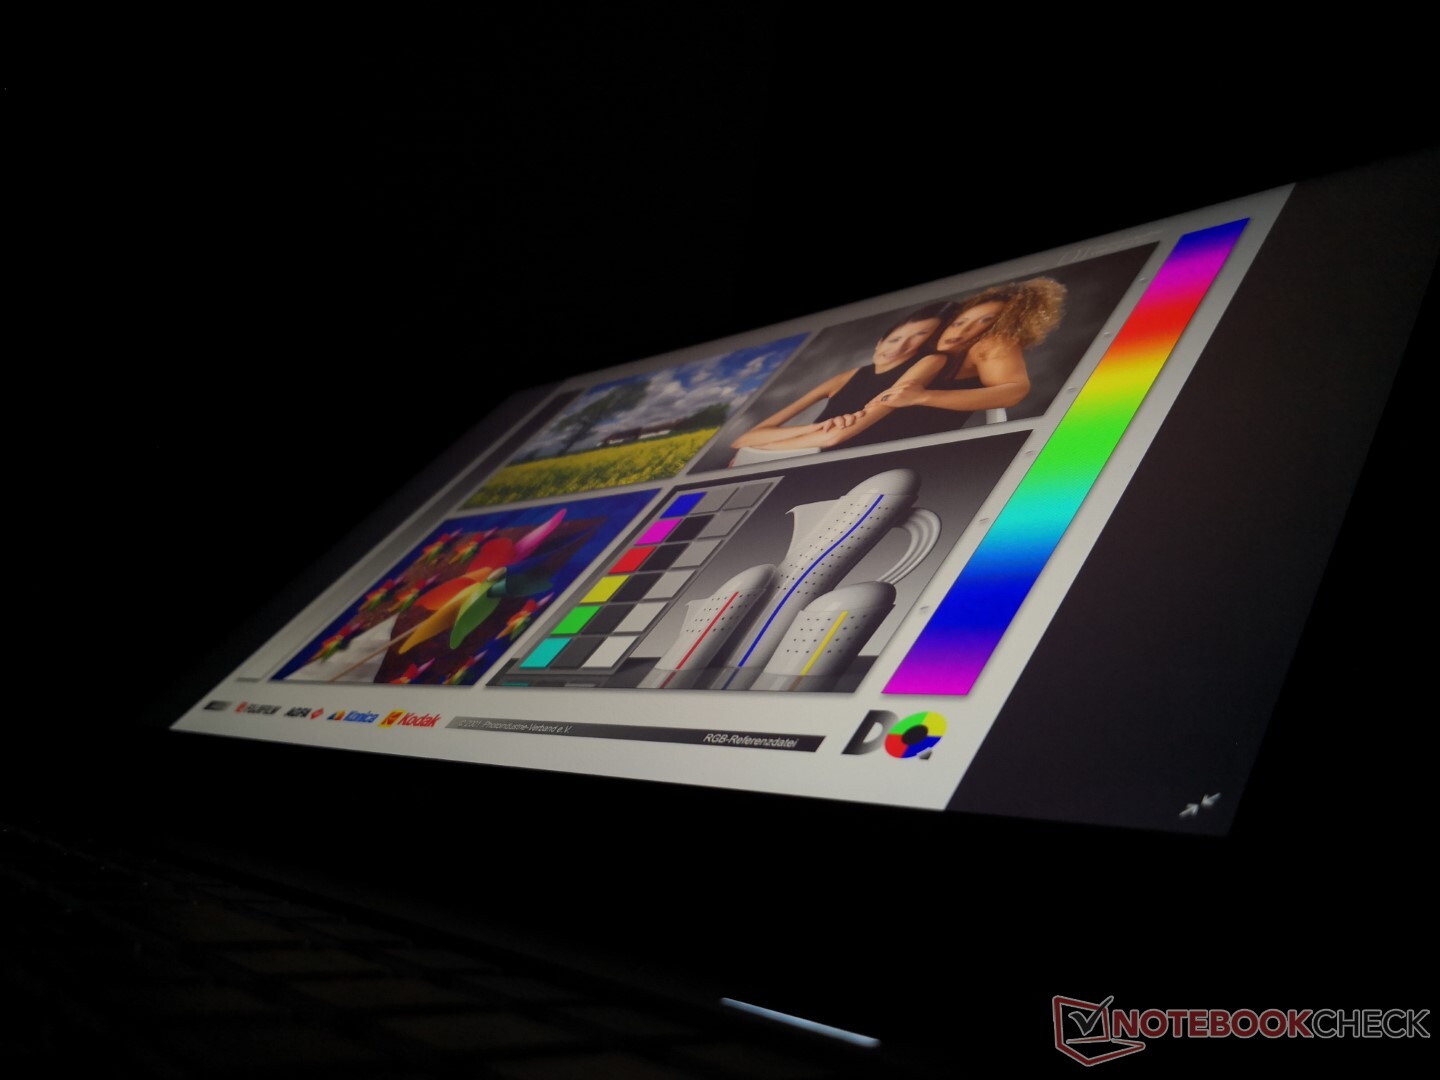
Visa
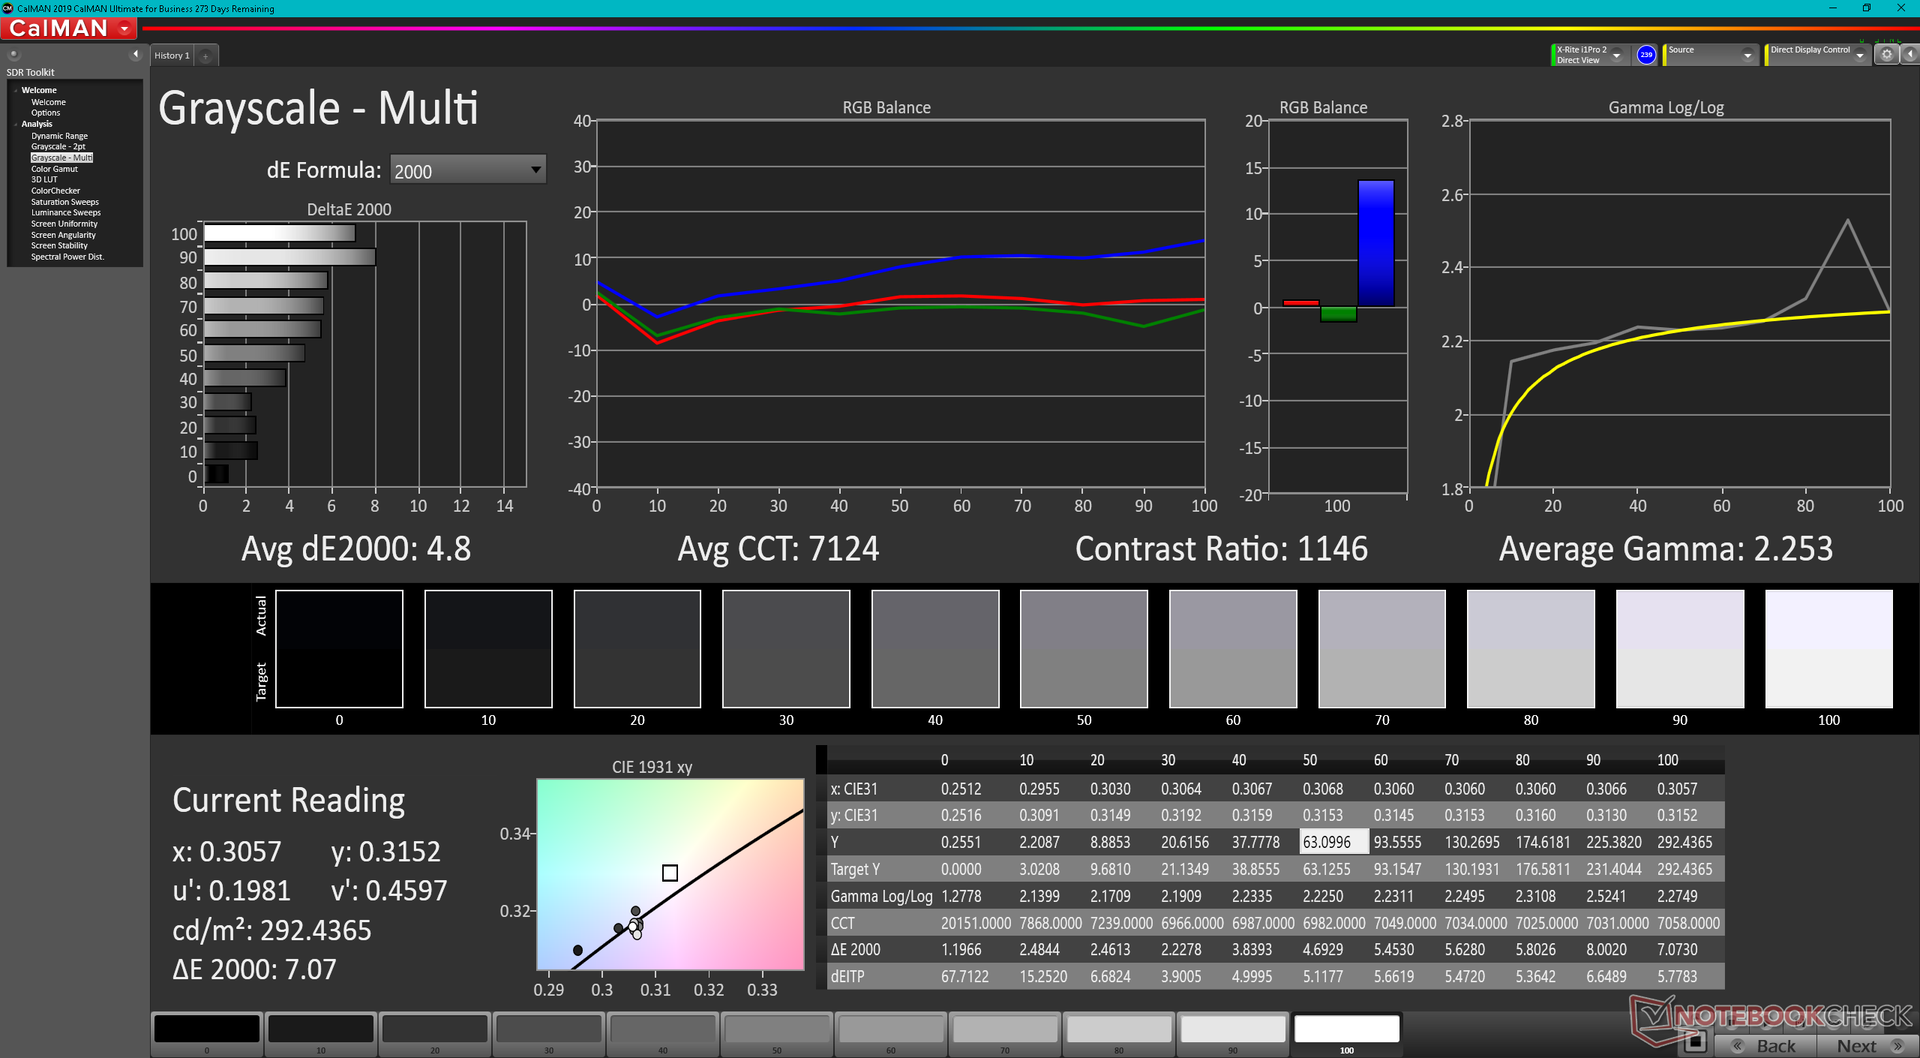
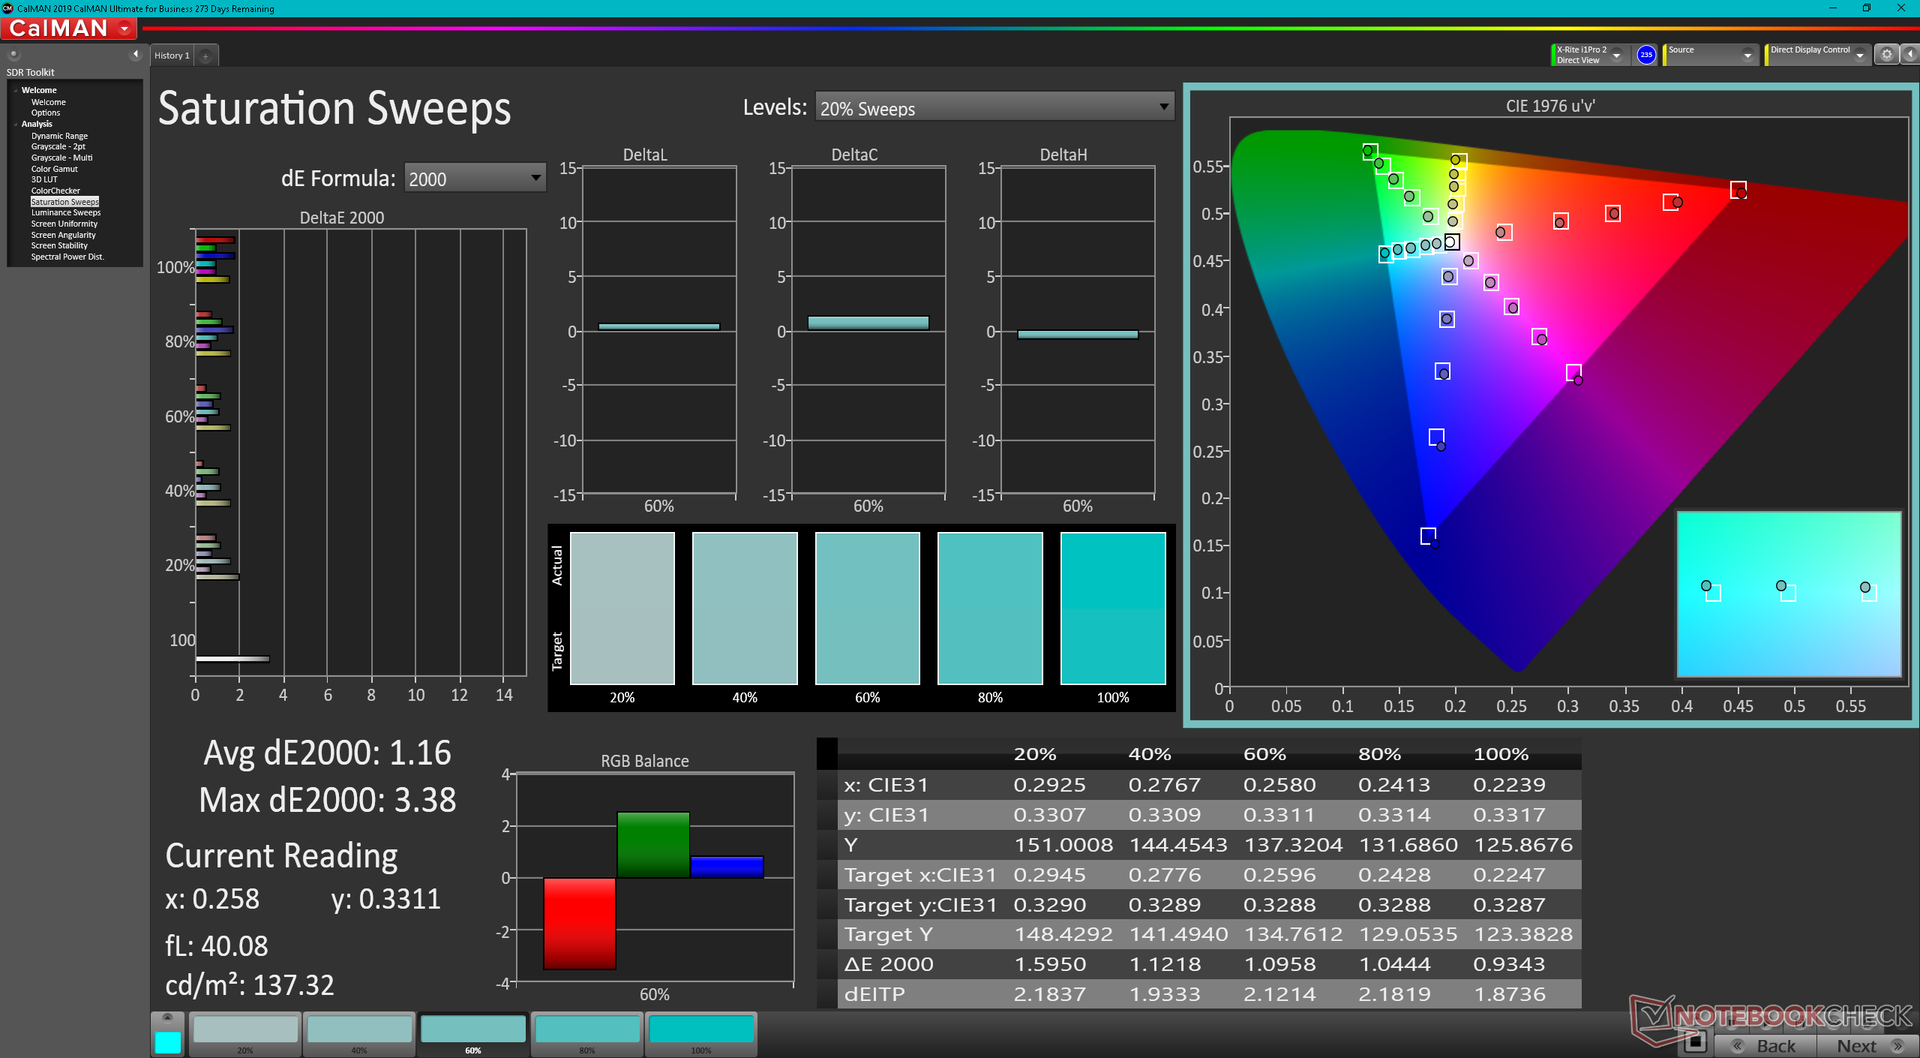
Jämfört med 4K OLED-alternativet har vår FHD IPS-panel långsammare svarstider för svartvitt och grått, en svagare bakgrundsbelysning, lägre kontrastförhållande och en smalare bildskala, vilket ger en sämre bildkvalitet. I gengäld får användarna en mycket snabbare uppdateringsfrekvens på 240 Hz för minskad skärmtårar och smidigare spelupplevelser. G-Sync stöds dock inte på den interna skärmen.

| |||||||||||||||||||||||||
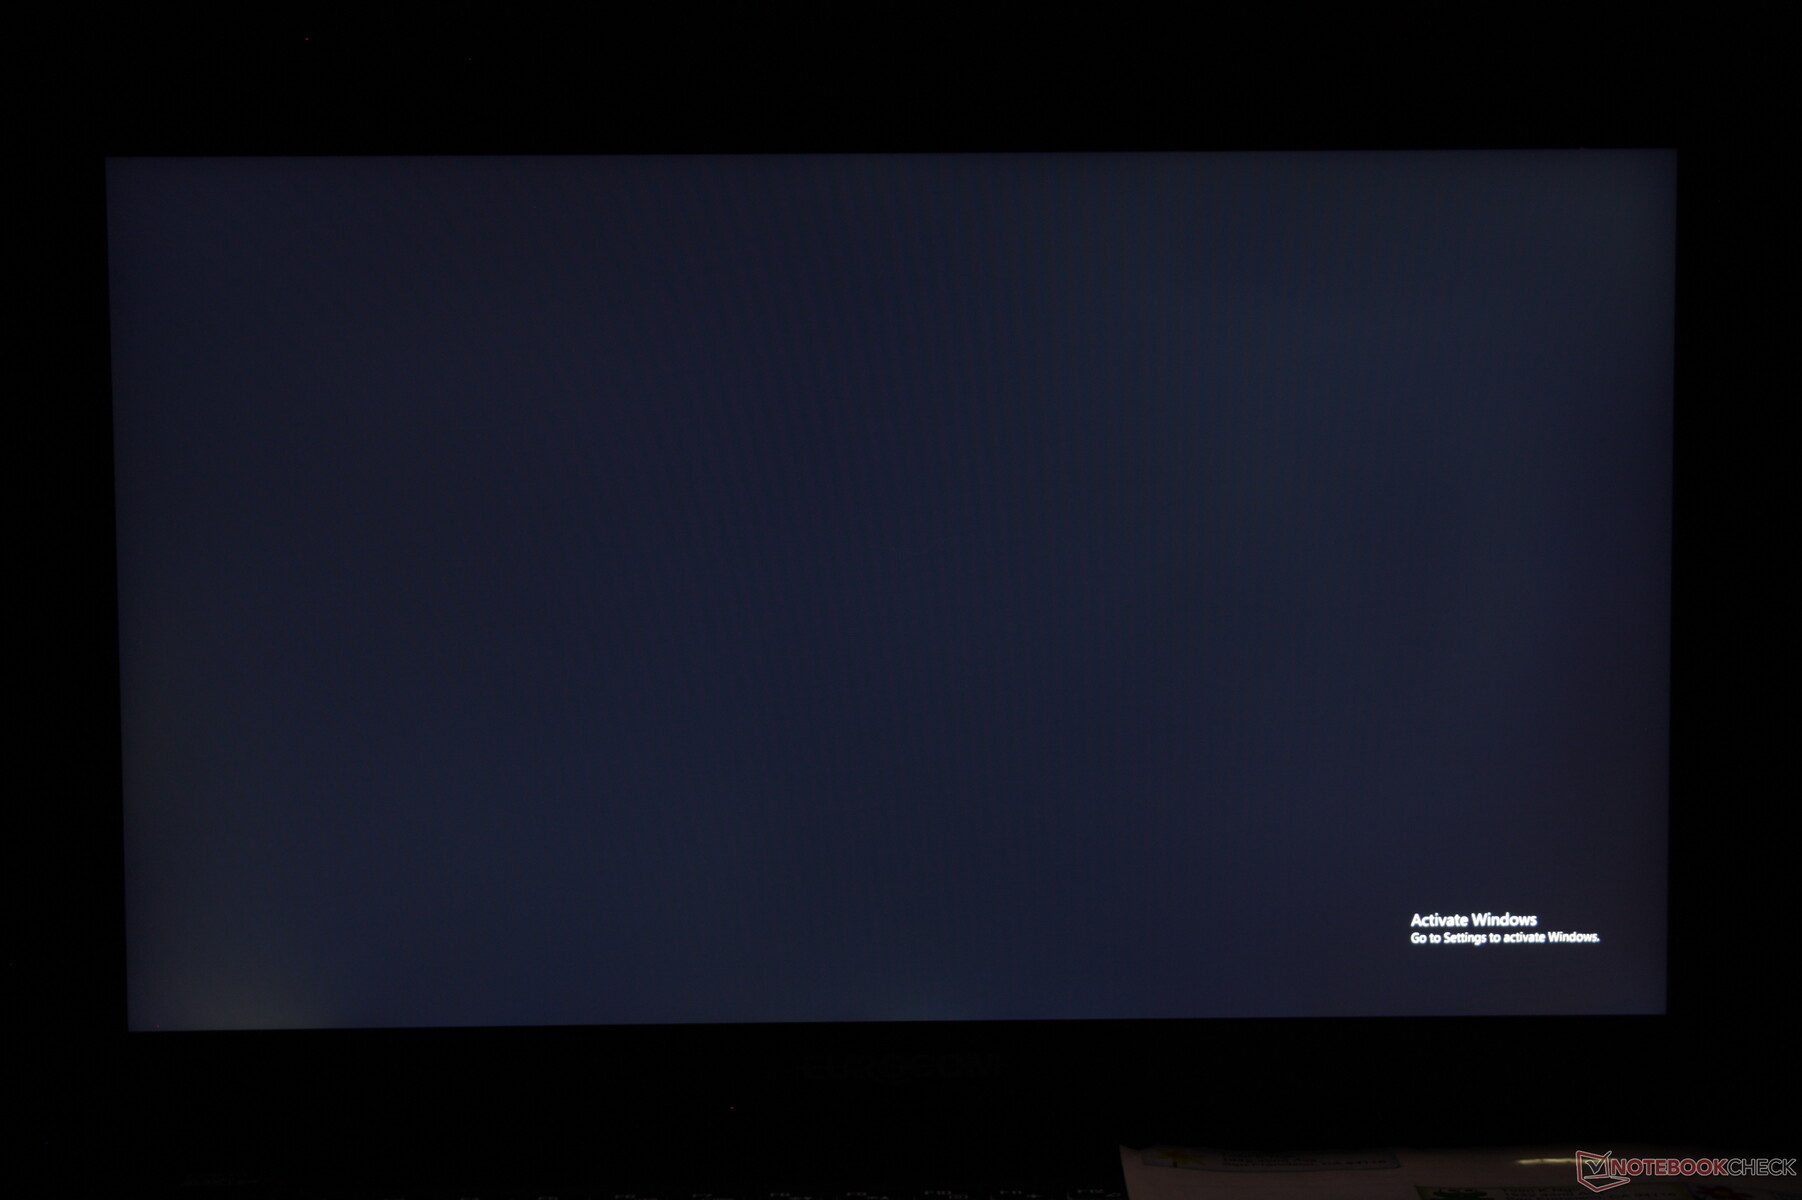
Distribution av ljusstyrkan: 91 %
Mitt på batteriet: 291.3 cd/m²
Kontrast: 832:1 (Svärta: 0.35 cd/m²)
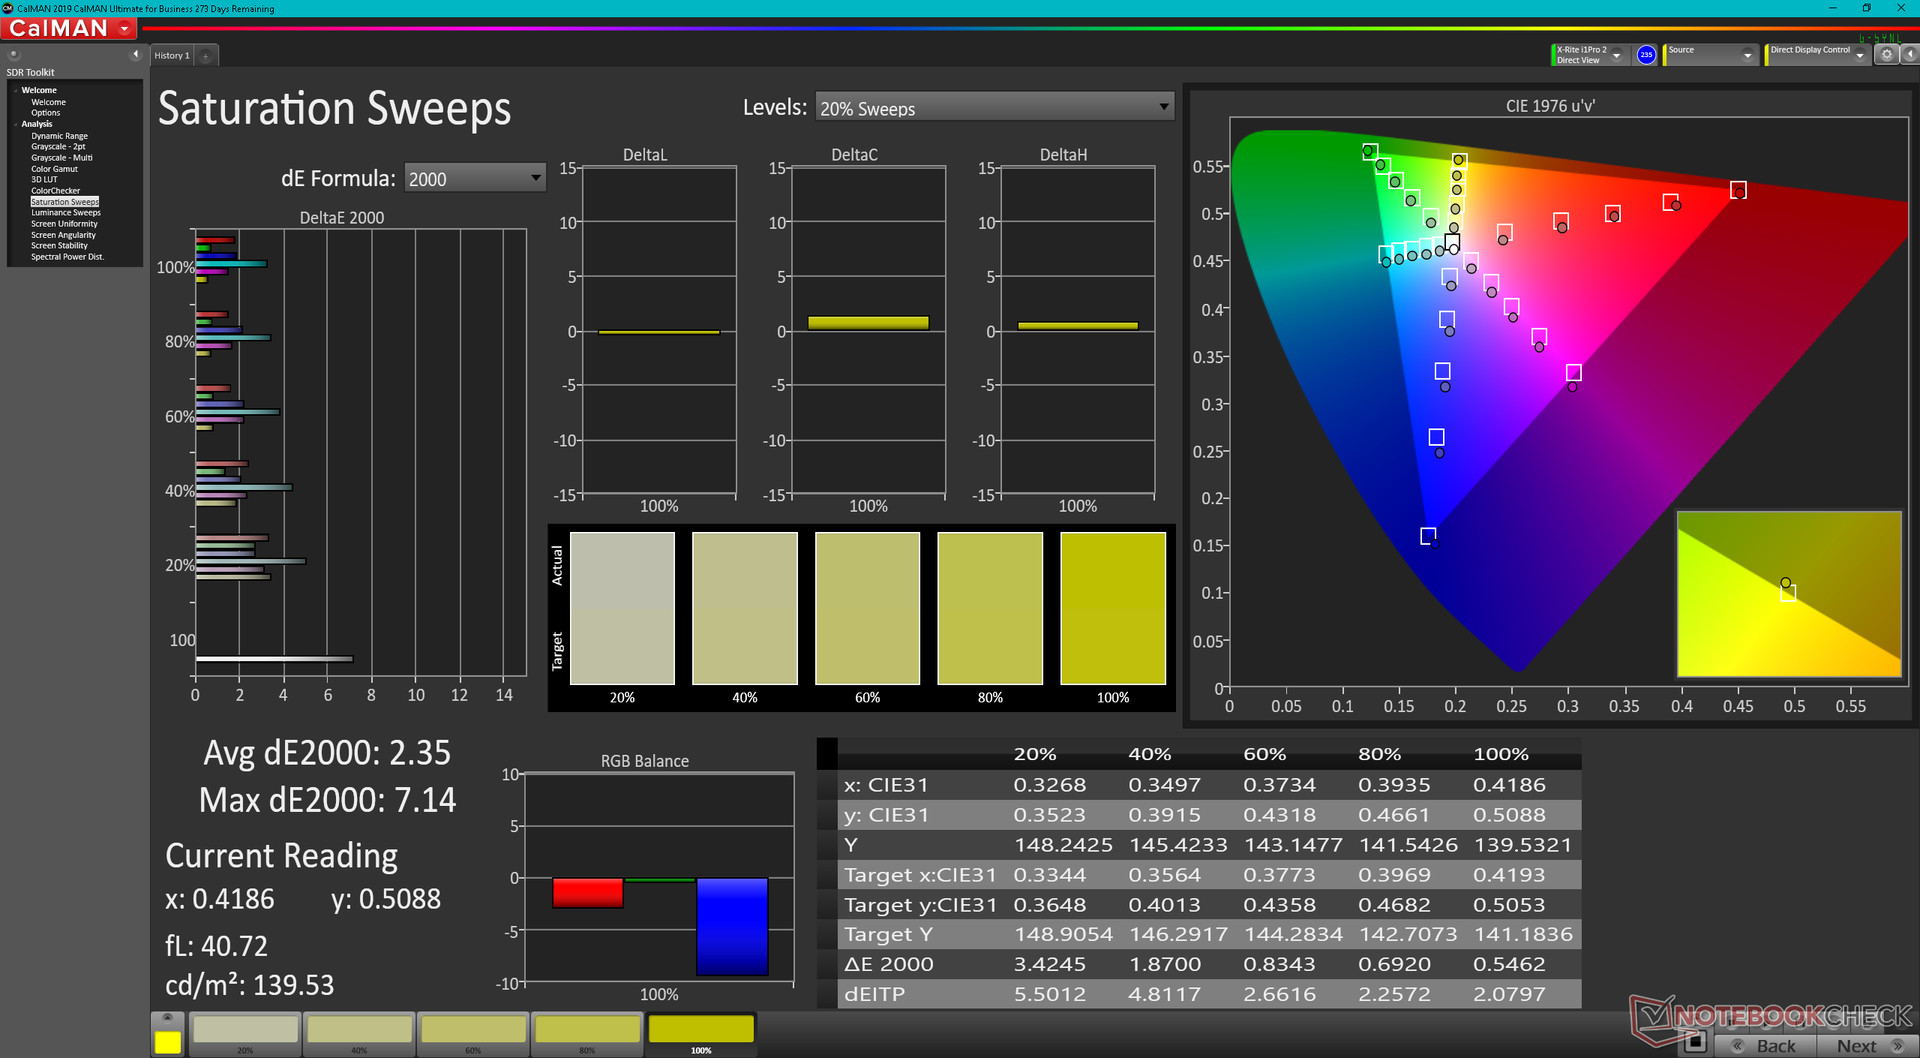
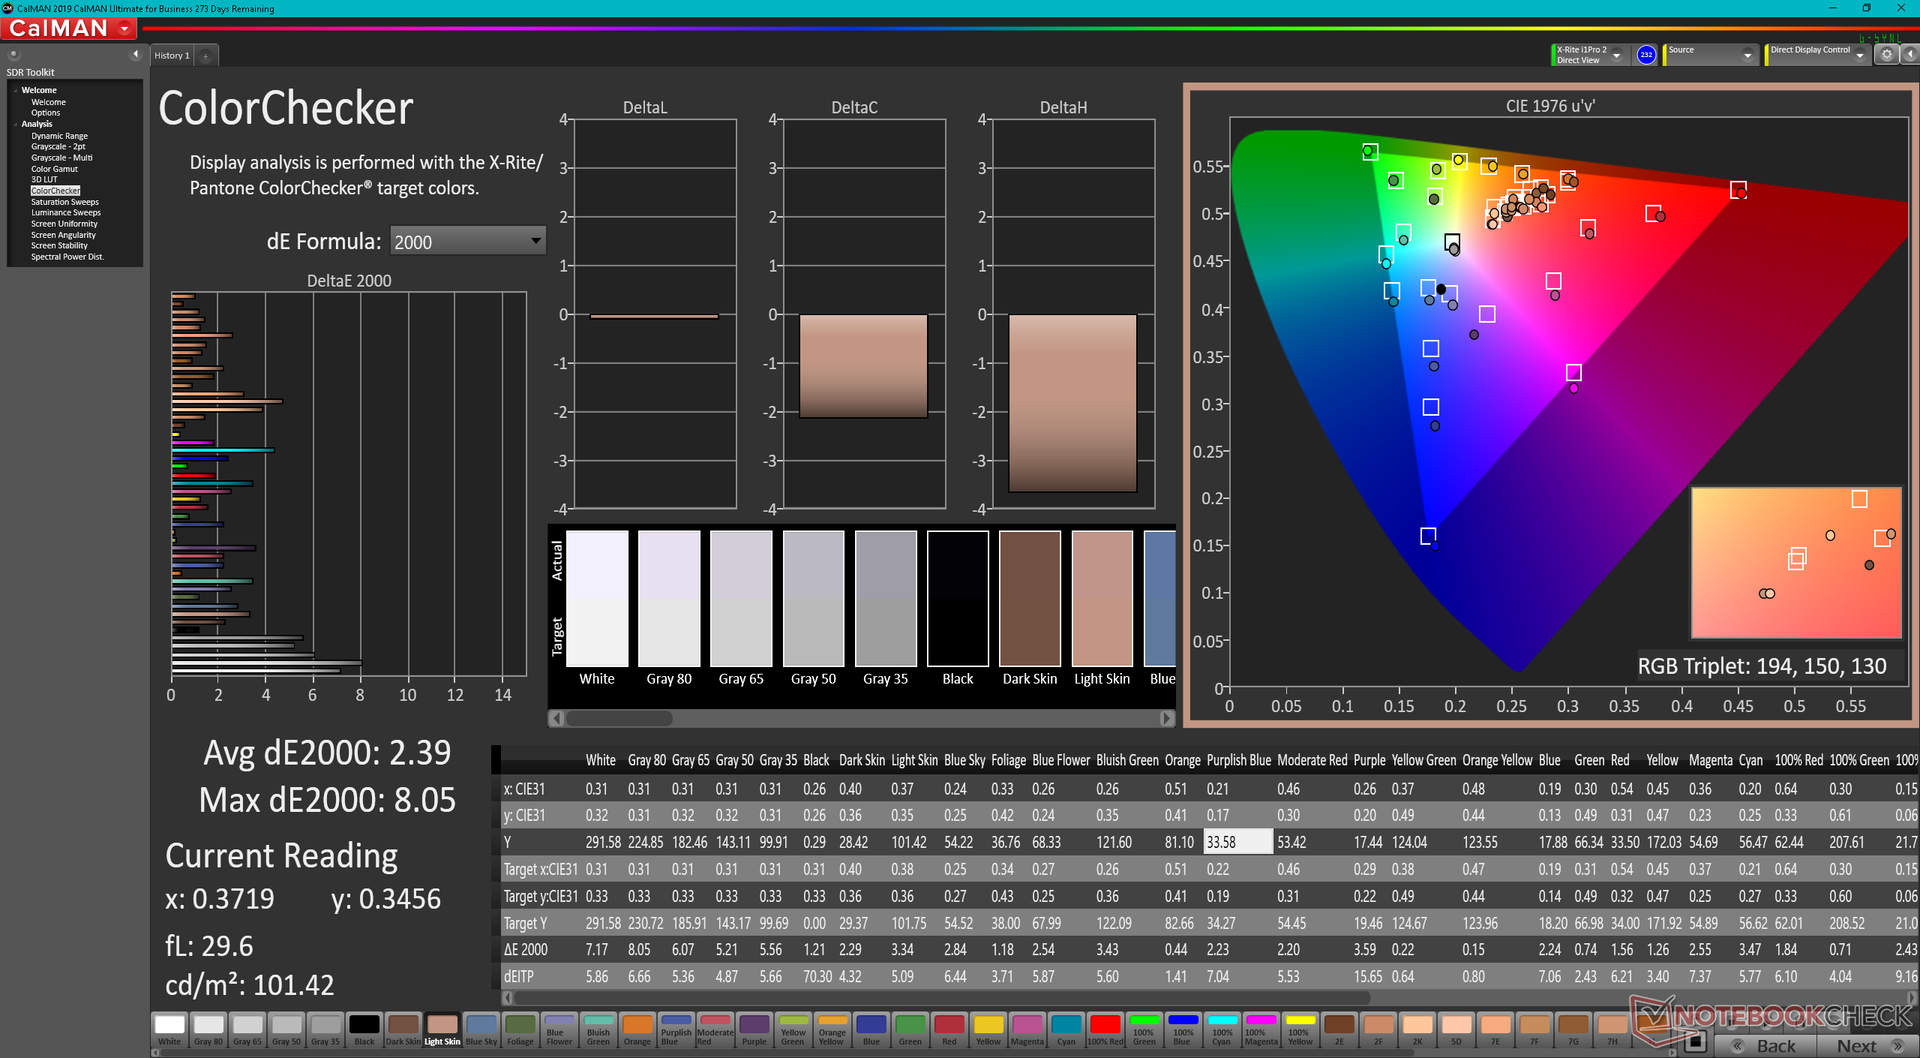
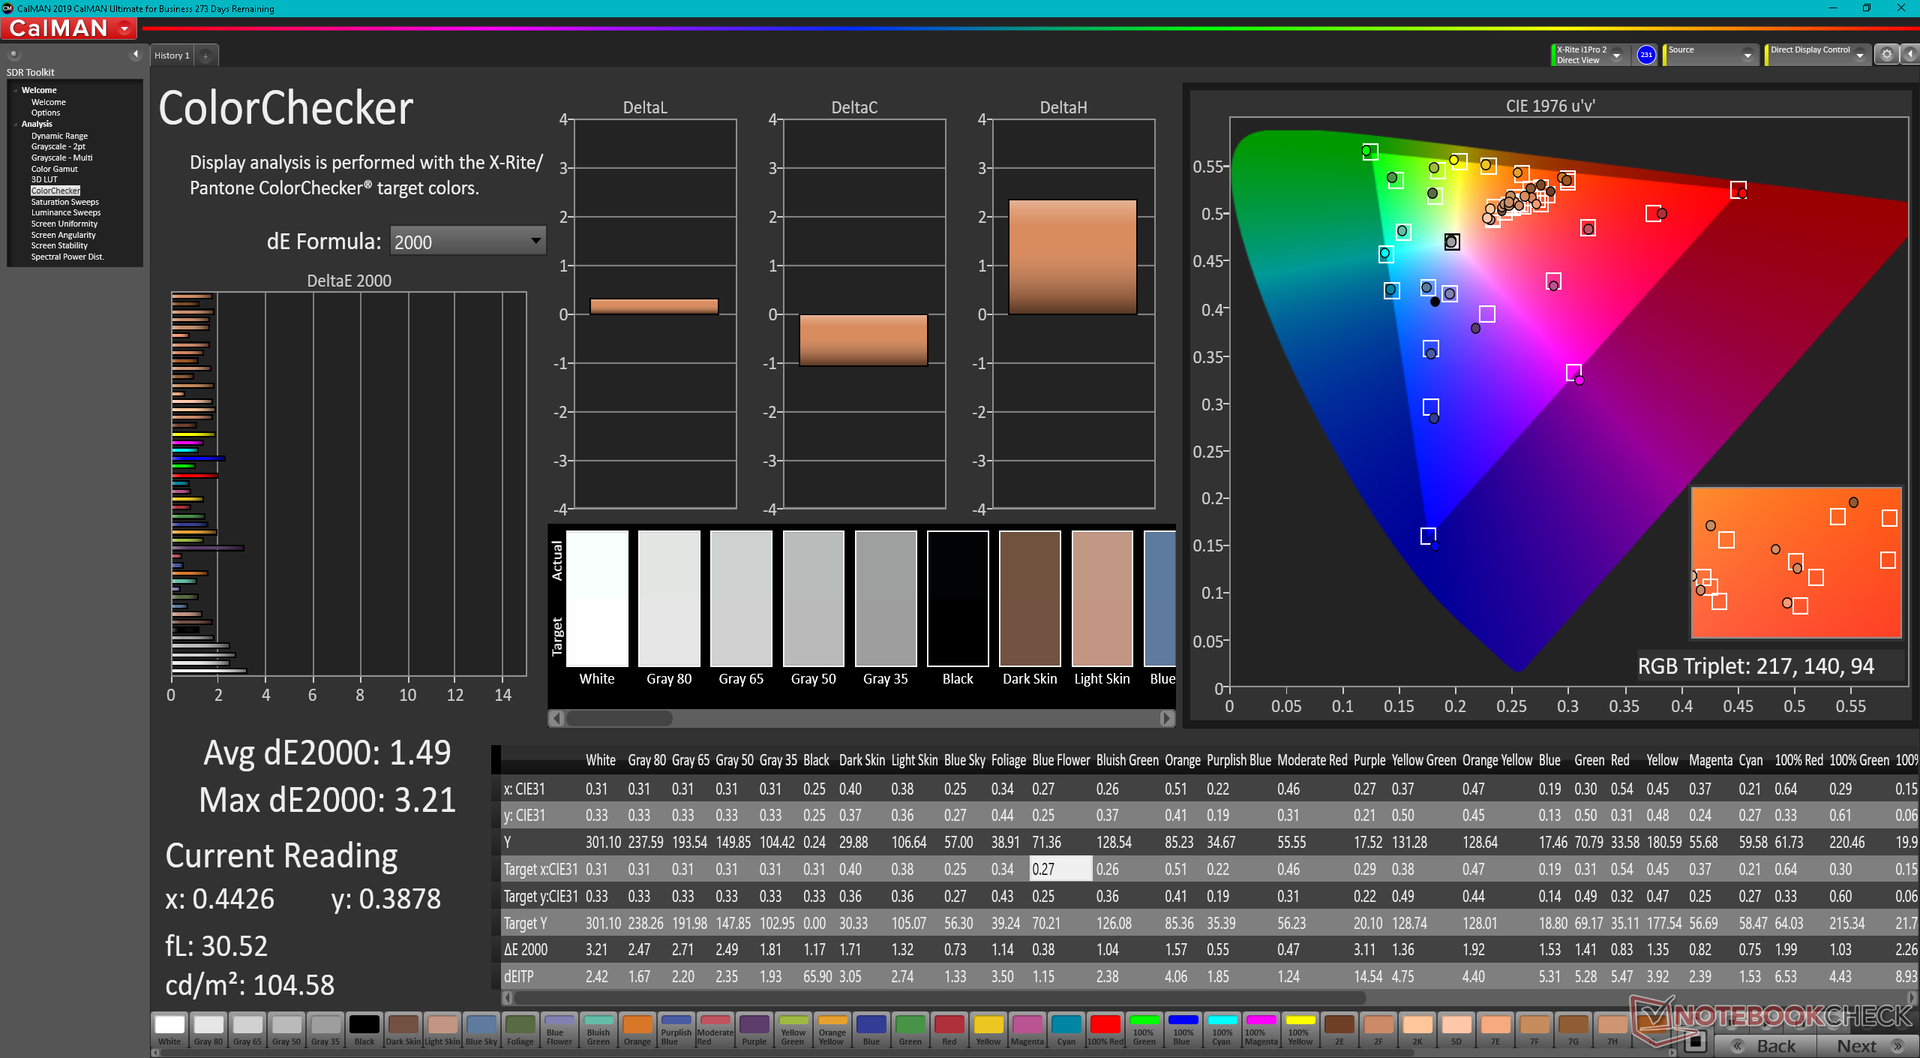
ΔE ColorChecker Calman: 2.39 | ∀{0.5-29.43 Ø4.71}
calibrated: 1.49
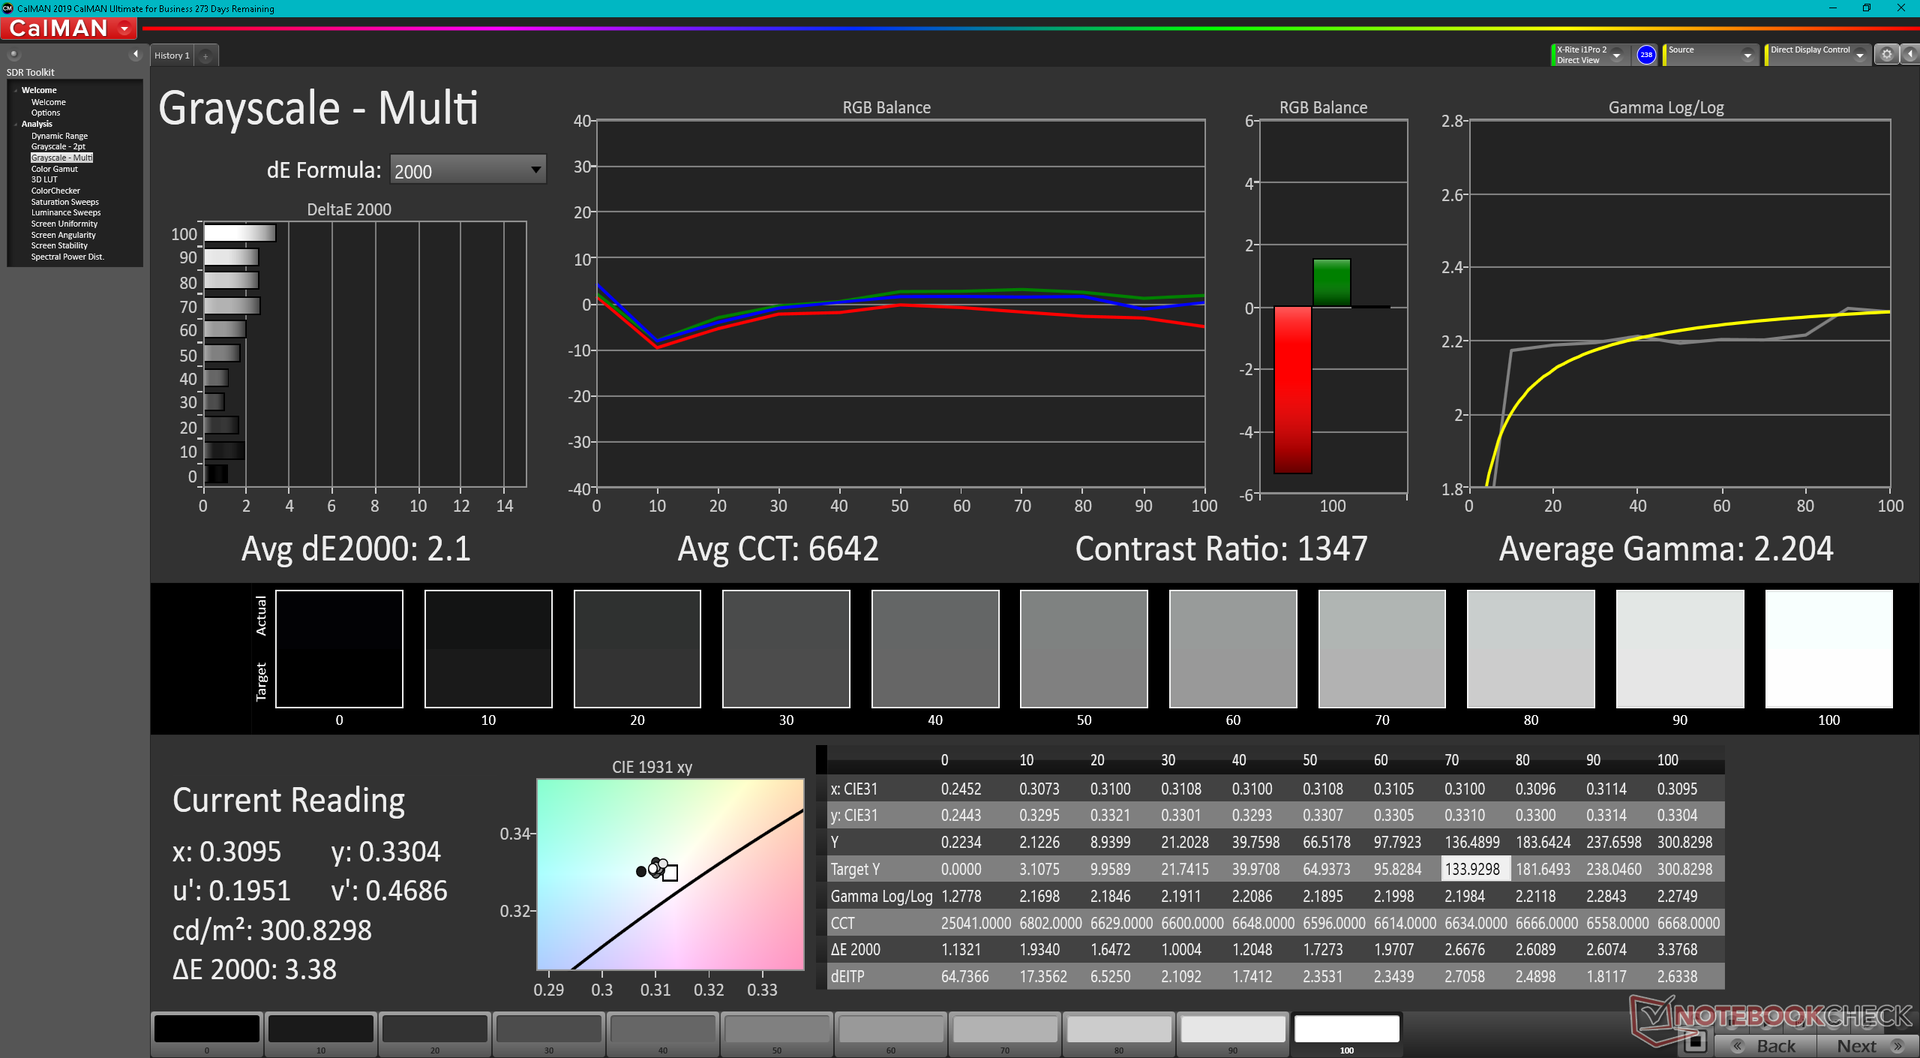
ΔE Greyscale Calman: 4.8 | ∀{0.09-98 Ø4.96}
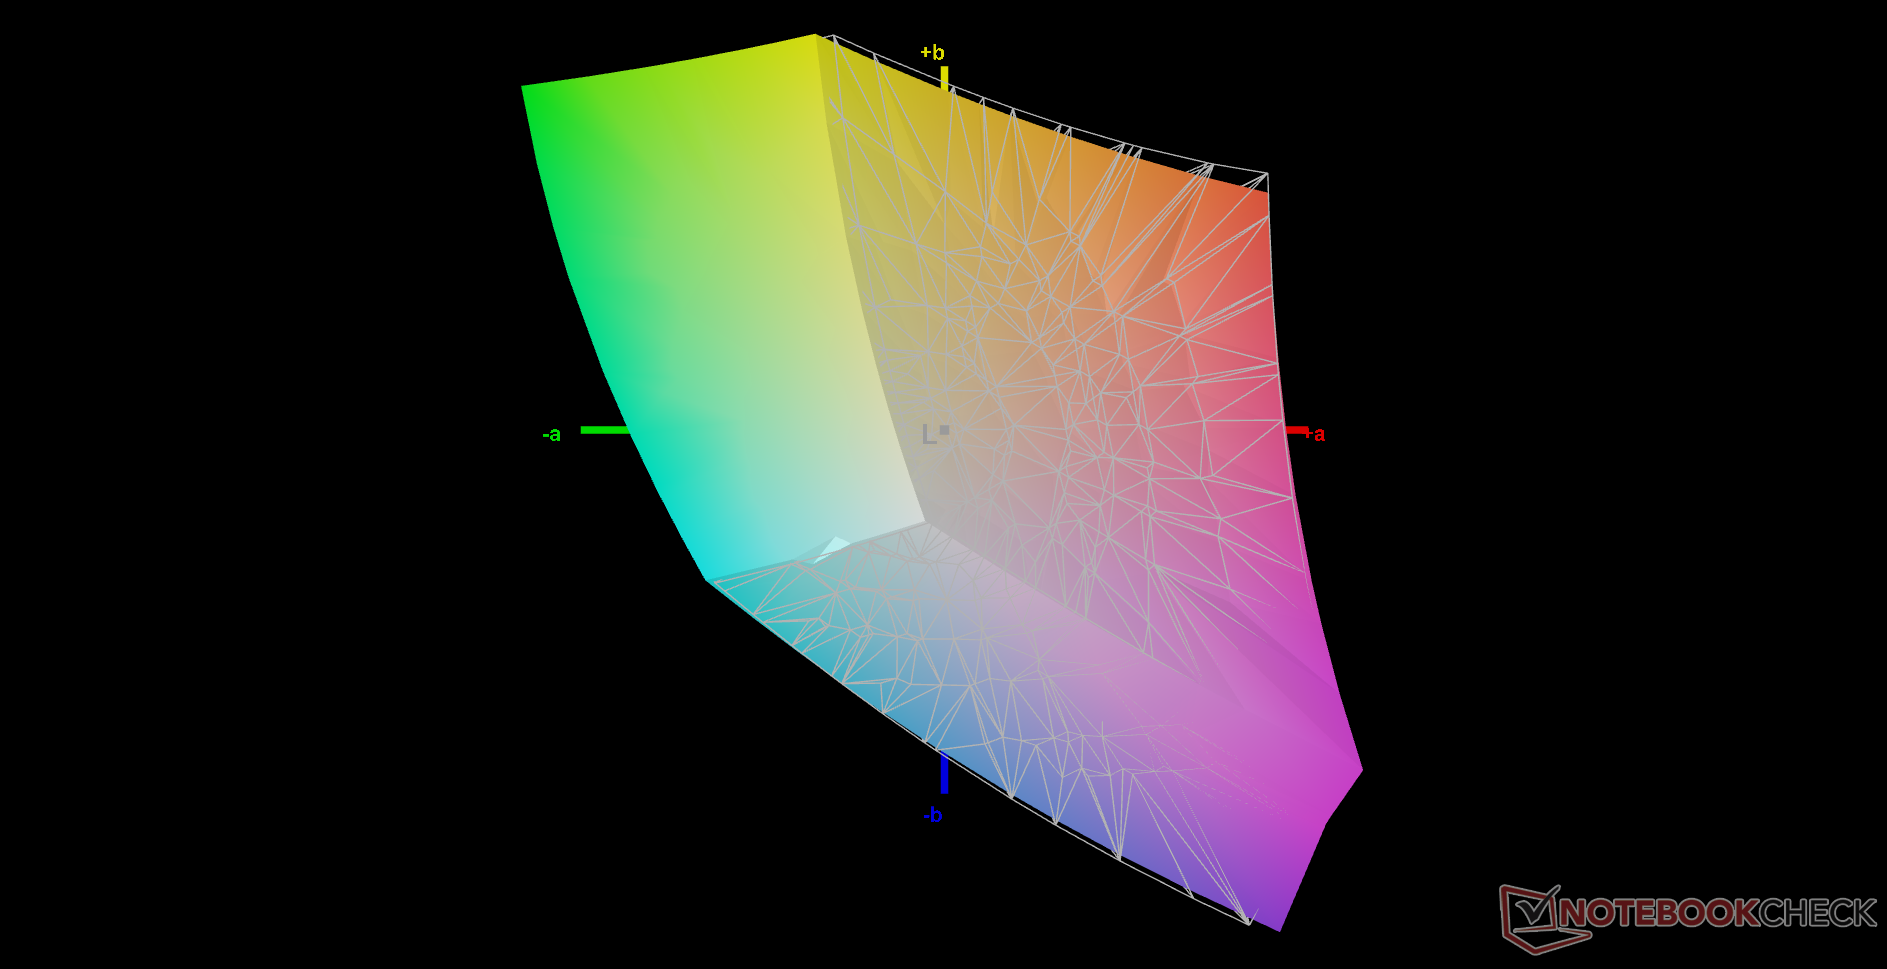
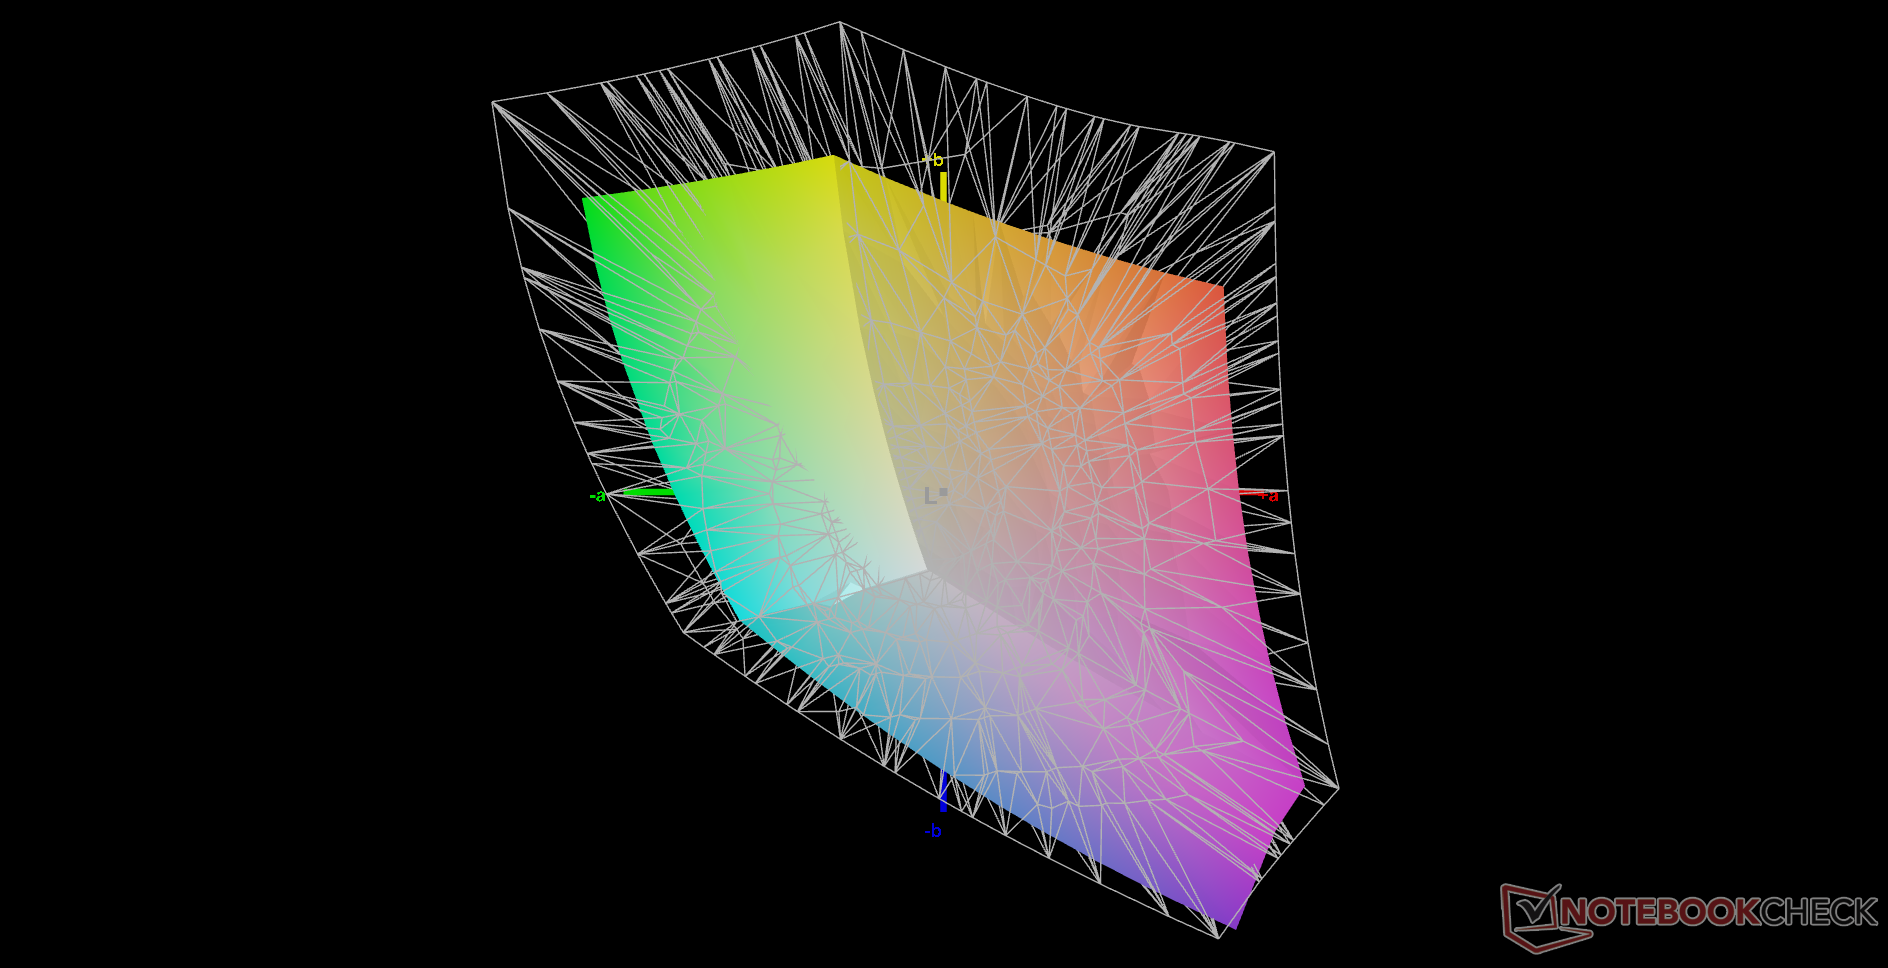
68.5% AdobeRGB 1998 (Argyll 3D)
98% sRGB (Argyll 3D)
67.5% Display P3 (Argyll 3D)
Gamma: 2.25
CCT: 7124 K
| Eurocom RX315 NH57AF1 Sharp LQ156M1JW03, IPS, 1920x1080, 15.6" | MSI Stealth GS66 12UGS Sharp LQ156T1JW04 (SHP153C), IPS-Level, 2560x1440, 15.6" | Eurocom Nightsky ARX315 Sharp LQ156M1JW03, IPS, 1920x1080, 15.6" | Alienware m15 R6, i7-11800H RTX 3080 AU Optronics AUO9092 (B156HAN), IPS, 1920x1080, 15.6" | Dell G15 5515 BOE092A, IPS, 1920x1080, 15.6" | Razer Blade 15 Advanced (Mid 2021) TL156VDXP02-0, IPS, 1920x1080, 15.6" | |
|---|---|---|---|---|---|---|
| Display | 23% | 4% | 8% | -42% | -0% | |
| Display P3 Coverage (%) | 67.5 | 96.4 43% | 67.9 1% | 74.1 10% | 39.1 -42% | 66.9 -1% |
| sRGB Coverage (%) | 98 | 99.7 2% | 99.7 2% | 99.5 2% | 56.9 -42% | 97.1 -1% |
| AdobeRGB 1998 Coverage (%) | 68.5 | 85.6 25% | 73.7 8% | 75.7 11% | 40.4 -41% | 69 1% |
| Response Times | 35% | -22% | 63% | -94% | 37% | |
| Response Time Grey 50% / Grey 80% * (ms) | 10.4 ? | 6 ? 42% | 15.2 ? -46% | 2.8 73% | 25.2 ? -142% | 4.2 ? 60% |
| Response Time Black / White * (ms) | 11.6 ? | 8.4 ? 28% | 11.2 ? 3% | 5.6 52% | 16.8 ? -45% | 10 ? 14% |
| PWM Frequency (Hz) | 22730 ? | 23150 ? | 200 ? | |||
| Screen | -4% | 10% | -3% | -55% | 21% | |
| Brightness middle (cd/m²) | 291.3 | 272 -7% | 312.8 7% | 359 23% | 278 -5% | 353.4 21% |
| Brightness (cd/m²) | 273 | 253 -7% | 294 8% | 344 26% | 262 -4% | 340 25% |
| Brightness Distribution (%) | 91 | 87 -4% | 90 -1% | 85 -7% | 83 -9% | 92 1% |
| Black Level * (cd/m²) | 0.35 | 0.25 29% | 0.28 20% | 0.35 -0% | 0.36 -3% | 0.31 11% |
| Contrast (:1) | 832 | 1088 31% | 1117 34% | 1026 23% | 772 -7% | 1140 37% |
| Colorchecker dE 2000 * | 2.39 | 3.73 -56% | 2.96 -24% | 3.3 -38% | 5.74 -140% | 2.17 9% |
| Colorchecker dE 2000 max. * | 8.05 | 9.43 -17% | 6.23 23% | 4.84 40% | 19.63 -144% | 5.69 29% |
| Colorchecker dE 2000 calibrated * | 1.49 | 0.98 34% | 3.28 -120% | 4.7 -215% | 1.05 30% | |
| Greyscale dE 2000 * | 4.8 | 6.5 -35% | 4.2 12% | 3.66 24% | 3.1 35% | 3.4 29% |
| Gamma | 2.25 98% | 2.172 101% | 2.32 95% | 2.43 91% | 2.011 109% | 2.2 100% |
| CCT | 7124 91% | 6485 100% | 7145 91% | 5896 110% | 6207 105% | 6830 95% |
| Totalt genomsnitt (program/inställningar) | 18% /
8% | -3% /
4% | 23% /
9% | -64% /
-57% | 19% /
19% |
* ... mindre är bättre
Färgtemperaturen är något för kall från början. De genomsnittliga värdena för gråskala och färg deltaE skulle förbättras från 4,8 och 2,39 till 2,1 och 1,49 efter kalibrering med vår X-Rite-kolorimeter.
Visa svarstider
| ↔ Svarstid svart till vitt | ||
|---|---|---|
| 11.6 ms ... stiga ↗ och falla ↘ kombinerat | ↗ 5.6 ms stiga | 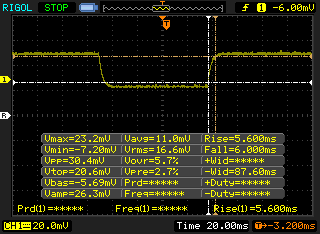 |
| ↘ 6 ms hösten | ||
| Skärmen visar bra svarsfrekvens i våra tester, men kan vara för långsam för konkurrenskraftiga spelare. I jämförelse sträcker sig alla testade enheter från 0.1 (minst) till 240 (maximalt) ms. » 31 % av alla enheter är bättre. Det betyder att den uppmätta svarstiden är bättre än genomsnittet av alla testade enheter (19.8 ms). | ||
| ↔ Svarstid 50 % grått till 80 % grått | ||
| 10.4 ms ... stiga ↗ och falla ↘ kombinerat | ↗ 5.2 ms stiga | 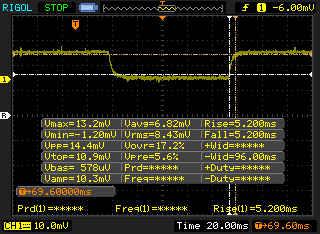 |
| ↘ 5.2 ms hösten | ||
| Skärmen visar bra svarsfrekvens i våra tester, men kan vara för långsam för konkurrenskraftiga spelare. I jämförelse sträcker sig alla testade enheter från 0.165 (minst) till 636 (maximalt) ms. » 24 % av alla enheter är bättre. Det betyder att den uppmätta svarstiden är bättre än genomsnittet av alla testade enheter (31 ms). | ||
Skärmflimmer / PWM (Puls-Width Modulation)
| Skärmflimmer / PWM upptäckt | 22730 Hz | ≤ 24 % ljusstyrka inställning | 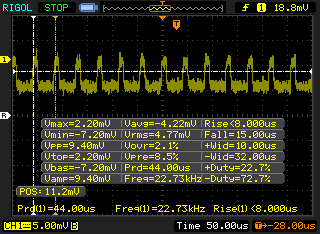 |
Displayens bakgrundsbelysning flimrar vid 22730 Hz (i värsta fall, t.ex. med PWM) Flimrande upptäckt vid en ljusstyrkeinställning på 24 % och lägre. Det ska inte finnas något flimmer eller PWM över denna ljusstyrkeinställning. Frekvensen för 22730 Hz är ganska hög, så de flesta användare som är känsliga för PWM bör inte märka något flimmer. Som jämförelse: 52 % av alla testade enheter använder inte PWM för att dämpa skärmen. Om PWM upptäcktes mättes ett medelvärde av 7757 (minst: 5 - maximum: 343500) Hz. | |||
Prestanda
Provningsförhållanden
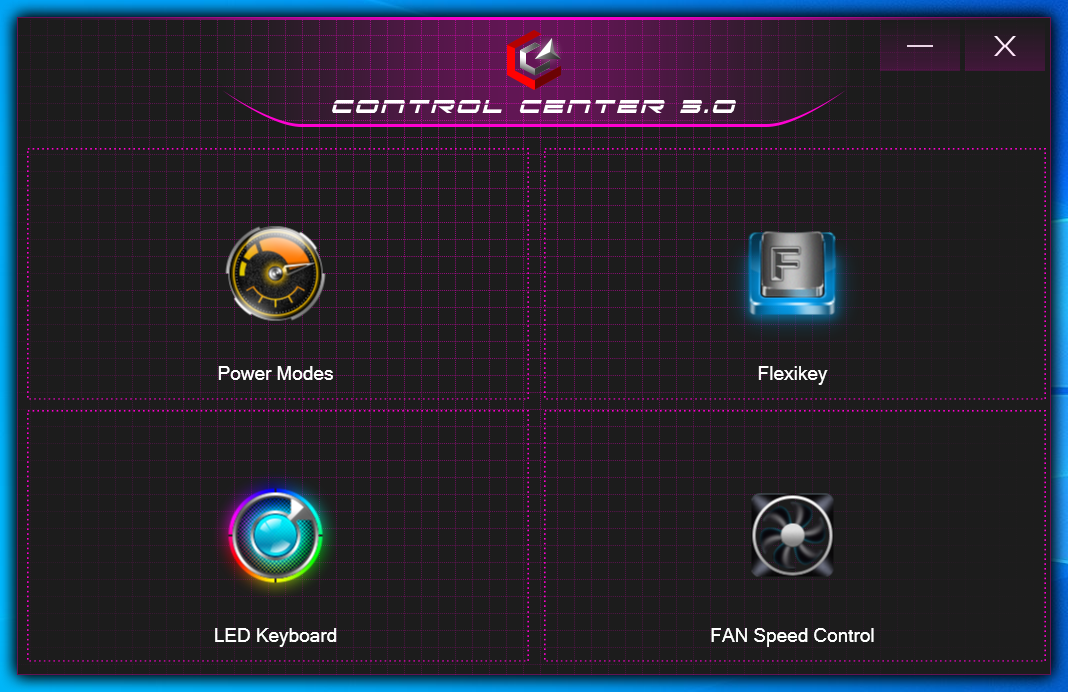
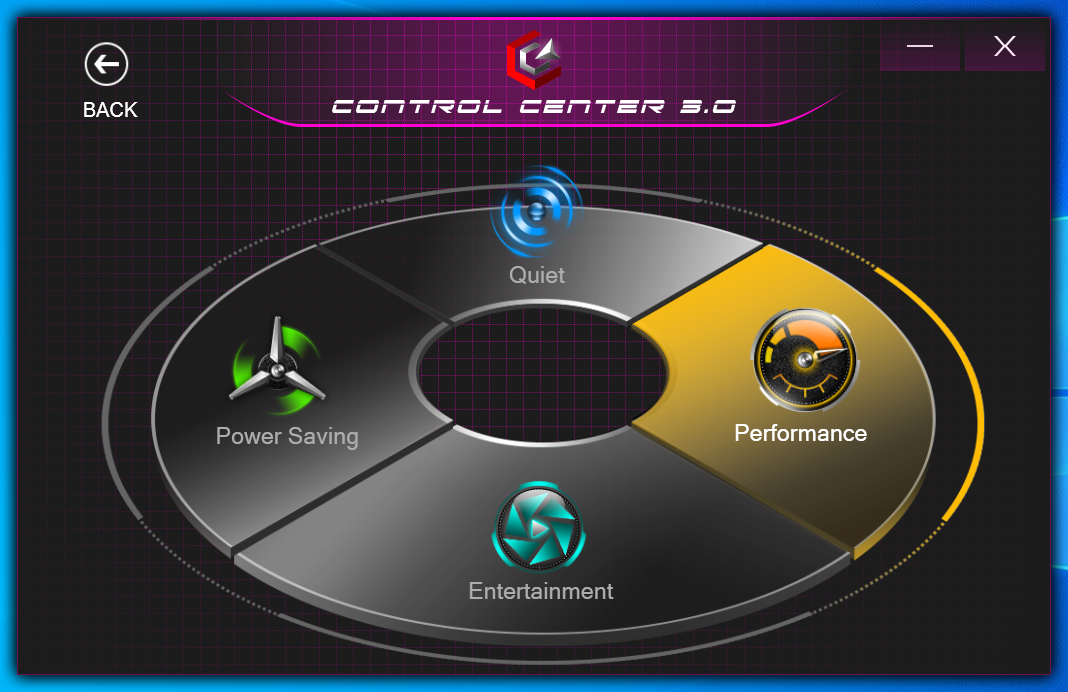
Vår enhet ställdes in i prestandaläge via Control Center 3.0-programvaran innan vi körde våra prestandabänkstester nedan för att få högsta möjliga poäng. Användare bör bekanta sig med denna programvara eftersom viktiga funktioner växlas här, inklusive tangentbordsbelysning, fläktstyrning med mera.
Tänk på att det inte finns någon MUX på RX315.
Processor
Core i7-11800H presterar där vi förväntar oss att den ska göra i förhållande till andra bärbara datorer med samma processor. Inga andra processoralternativ är för närvarande tillgängliga.
Cinebench R15 Multi Loop
Cinebench R20: CPU (Multi Core) | CPU (Single Core)
Cinebench R15: CPU Multi 64Bit | CPU Single 64Bit
Blender: v2.79 BMW27 CPU
7-Zip 18.03: 7z b 4 | 7z b 4 -mmt1
Geekbench 5.5: Multi-Core | Single-Core
HWBOT x265 Benchmark v2.2: 4k Preset
LibreOffice : 20 Documents To PDF
R Benchmark 2.5: Overall mean
| Cinebench R23 / Multi Core | |
| Corsair One i300 | |
| MSI Stealth GS66 12UGS | |
| MSI Vector GP66 12UGS | |
| Eurocom Nightsky ARX315 | |
| Schenker XMG Apex 15 NH57E PS | |
| Eurocom RX315 NH57AF1 | |
| Genomsnitt Intel Core i7-11800H (6508 - 14088, n=48) | |
| Schenker XMG Core 15 Ampere | |
| Alienware m15 R4 RTX 3080 | |
| Gigabyte G5 GD | |
| Razer Blade 15 Advanced Model Early 2021 | |
| Cinebench R23 / Single Core | |
| Corsair One i300 | |
| MSI Vector GP66 12UGS | |
| MSI Stealth GS66 12UGS | |
| Eurocom Nightsky ARX315 | |
| Eurocom RX315 NH57AF1 | |
| Genomsnitt Intel Core i7-11800H (1386 - 1522, n=45) | |
| Gigabyte G5 GD | |
| Schenker XMG Apex 15 NH57E PS | |
| Schenker XMG Core 15 Ampere | |
| Alienware m15 R4 RTX 3080 | |
| Razer Blade 15 Advanced Model Early 2021 | |
| Cinebench R20 / CPU (Multi Core) | |
| Corsair One i300 | |
| MSI Stealth GS66 12UGS | |
| MSI Vector GP66 12UGS | |
| Eurocom Nightsky ARX315 | |
| Schenker XMG Apex 15 NH57E PS | |
| Eurocom RX315 NH57AF1 | |
| Genomsnitt Intel Core i7-11800H (2498 - 5408, n=50) | |
| Schenker XMG Core 15 Ampere | |
| Alienware m15 R4 RTX 3080 | |
| Gigabyte G5 GD | |
| Razer Blade 15 Advanced Model Early 2021 | |
| Cinebench R20 / CPU (Single Core) | |
| Corsair One i300 | |
| MSI Vector GP66 12UGS | |
| MSI Stealth GS66 12UGS | |
| Eurocom Nightsky ARX315 | |
| Eurocom RX315 NH57AF1 | |
| Genomsnitt Intel Core i7-11800H (520 - 586, n=47) | |
| Gigabyte G5 GD | |
| Schenker XMG Apex 15 NH57E PS | |
| Schenker XMG Core 15 Ampere | |
| Alienware m15 R4 RTX 3080 | |
| Razer Blade 15 Advanced Model Early 2021 | |
| Cinebench R15 / CPU Multi 64Bit | |
| Corsair One i300 | |
| MSI Stealth GS66 12UGS | |
| MSI Vector GP66 12UGS | |
| Eurocom Nightsky ARX315 | |
| Schenker XMG Apex 15 NH57E PS | |
| Schenker XMG Core 15 Ampere | |
| Genomsnitt Intel Core i7-11800H (1342 - 2173, n=50) | |
| Eurocom RX315 NH57AF1 | |
| Alienware m15 R4 RTX 3080 | |
| Gigabyte G5 GD | |
| Razer Blade 15 Advanced Model Early 2021 | |
| Cinebench R15 / CPU Single 64Bit | |
| Corsair One i300 | |
| MSI Vector GP66 12UGS | |
| MSI Stealth GS66 12UGS | |
| Eurocom Nightsky ARX315 | |
| Schenker XMG Apex 15 NH57E PS | |
| Eurocom RX315 NH57AF1 | |
| Genomsnitt Intel Core i7-11800H (201 - 231, n=46) | |
| Gigabyte G5 GD | |
| Razer Blade 15 Advanced Model Early 2021 | |
| Alienware m15 R4 RTX 3080 | |
| Schenker XMG Core 15 Ampere | |
| Blender / v2.79 BMW27 CPU | |
| Razer Blade 15 Advanced Model Early 2021 | |
| Gigabyte G5 GD | |
| Alienware m15 R4 RTX 3080 | |
| Genomsnitt Intel Core i7-11800H (217 - 454, n=46) | |
| Eurocom RX315 NH57AF1 | |
| Schenker XMG Core 15 Ampere | |
| Schenker XMG Apex 15 NH57E PS | |
| Eurocom Nightsky ARX315 | |
| MSI Vector GP66 12UGS | |
| MSI Stealth GS66 12UGS | |
| Corsair One i300 | |
| 7-Zip 18.03 / 7z b 4 | |
| Corsair One i300 | |
| Eurocom Nightsky ARX315 | |
| MSI Stealth GS66 12UGS | |
| MSI Vector GP66 12UGS | |
| Schenker XMG Apex 15 NH57E PS | |
| Schenker XMG Core 15 Ampere | |
| Alienware m15 R4 RTX 3080 | |
| Genomsnitt Intel Core i7-11800H (33718 - 56758, n=46) | |
| Eurocom RX315 NH57AF1 | |
| Gigabyte G5 GD | |
| Razer Blade 15 Advanced Model Early 2021 | |
| 7-Zip 18.03 / 7z b 4 -mmt1 | |
| Corsair One i300 | |
| Eurocom Nightsky ARX315 | |
| MSI Vector GP66 12UGS | |
| MSI Stealth GS66 12UGS | |
| Schenker XMG Apex 15 NH57E PS | |
| Genomsnitt Intel Core i7-11800H (5138 - 5732, n=46) | |
| Eurocom RX315 NH57AF1 | |
| Alienware m15 R4 RTX 3080 | |
| Razer Blade 15 Advanced Model Early 2021 | |
| Gigabyte G5 GD | |
| Schenker XMG Core 15 Ampere | |
| Geekbench 5.5 / Multi-Core | |
| Corsair One i300 | |
| MSI Stealth GS66 12UGS | |
| MSI Vector GP66 12UGS | |
| Eurocom Nightsky ARX315 | |
| Eurocom RX315 NH57AF1 | |
| Genomsnitt Intel Core i7-11800H (4655 - 9851, n=40) | |
| Schenker XMG Apex 15 NH57E PS | |
| Schenker XMG Core 15 Ampere | |
| Alienware m15 R4 RTX 3080 | |
| Gigabyte G5 GD | |
| Razer Blade 15 Advanced Model Early 2021 | |
| Geekbench 5.5 / Single-Core | |
| Corsair One i300 | |
| MSI Vector GP66 12UGS | |
| MSI Stealth GS66 12UGS | |
| Eurocom Nightsky ARX315 | |
| Genomsnitt Intel Core i7-11800H (1429 - 1625, n=40) | |
| Eurocom RX315 NH57AF1 | |
| Gigabyte G5 GD | |
| Schenker XMG Apex 15 NH57E PS | |
| Alienware m15 R4 RTX 3080 | |
| Razer Blade 15 Advanced Model Early 2021 | |
| Schenker XMG Core 15 Ampere | |
| HWBOT x265 Benchmark v2.2 / 4k Preset | |
| Corsair One i300 | |
| MSI Vector GP66 12UGS | |
| MSI Stealth GS66 12UGS | |
| Eurocom Nightsky ARX315 | |
| Schenker XMG Apex 15 NH57E PS | |
| Eurocom RX315 NH57AF1 | |
| Genomsnitt Intel Core i7-11800H (7.38 - 17.4, n=46) | |
| Schenker XMG Core 15 Ampere | |
| Alienware m15 R4 RTX 3080 | |
| Gigabyte G5 GD | |
| Razer Blade 15 Advanced Model Early 2021 | |
| LibreOffice / 20 Documents To PDF | |
| Alienware m15 R4 RTX 3080 | |
| Schenker XMG Core 15 Ampere | |
| Razer Blade 15 Advanced Model Early 2021 | |
| Schenker XMG Apex 15 NH57E PS | |
| Eurocom RX315 NH57AF1 | |
| Eurocom Nightsky ARX315 | |
| Genomsnitt Intel Core i7-11800H (38.6 - 59.9, n=45) | |
| Gigabyte G5 GD | |
| MSI Stealth GS66 12UGS | |
| MSI Vector GP66 12UGS | |
| Corsair One i300 | |
| R Benchmark 2.5 / Overall mean | |
| Alienware m15 R4 RTX 3080 | |
| Gigabyte G5 GD | |
| Razer Blade 15 Advanced Model Early 2021 | |
| Schenker XMG Core 15 Ampere | |
| Eurocom RX315 NH57AF1 | |
| Genomsnitt Intel Core i7-11800H (0.548 - 0.615, n=46) | |
| Schenker XMG Apex 15 NH57E PS | |
| Eurocom Nightsky ARX315 | |
| MSI Stealth GS66 12UGS | |
| MSI Vector GP66 12UGS | |
| Corsair One i300 | |
* ... mindre är bättre
AIDA64: FP32 Ray-Trace | FPU Julia | CPU SHA3 | CPU Queen | FPU SinJulia | FPU Mandel | CPU AES | CPU ZLib | FP64 Ray-Trace | CPU PhotoWorxx
| Performance rating | |
| Eurocom Nightsky ARX315 | |
| Alienware m15 R6, i7-11800H RTX 3080 | |
| Eurocom RX315 NH57AF1 | |
| Dell G15 5515 | |
| MSI Stealth GS66 12UGS | |
| Genomsnitt Intel Core i7-11800H | |
| Razer Blade 15 Advanced (Mid 2021) -9! | |
| AIDA64 / FP32 Ray-Trace | |
| Alienware m15 R6, i7-11800H RTX 3080 | |
| Eurocom RX315 NH57AF1 | |
| Dell G15 5515 | |
| Genomsnitt Intel Core i7-11800H (8772 - 15961, n=20) | |
| Eurocom Nightsky ARX315 | |
| MSI Stealth GS66 12UGS | |
| AIDA64 / FPU Julia | |
| Eurocom Nightsky ARX315 | |
| Dell G15 5515 | |
| Alienware m15 R6, i7-11800H RTX 3080 | |
| Eurocom RX315 NH57AF1 | |
| Genomsnitt Intel Core i7-11800H (39404 - 65636, n=20) | |
| MSI Stealth GS66 12UGS | |
| AIDA64 / CPU SHA3 | |
| Alienware m15 R6, i7-11800H RTX 3080 | |
| Eurocom RX315 NH57AF1 | |
| Genomsnitt Intel Core i7-11800H (2599 - 4439, n=20) | |
| MSI Stealth GS66 12UGS | |
| Eurocom Nightsky ARX315 | |
| Dell G15 5515 | |
| AIDA64 / CPU Queen | |
| Eurocom Nightsky ARX315 | |
| MSI Stealth GS66 12UGS | |
| Dell G15 5515 | |
| Alienware m15 R6, i7-11800H RTX 3080 | |
| Eurocom RX315 NH57AF1 | |
| Genomsnitt Intel Core i7-11800H (85233 - 91941, n=20) | |
| AIDA64 / FPU SinJulia | |
| Eurocom Nightsky ARX315 | |
| Dell G15 5515 | |
| MSI Stealth GS66 12UGS | |
| Alienware m15 R6, i7-11800H RTX 3080 | |
| Eurocom RX315 NH57AF1 | |
| Genomsnitt Intel Core i7-11800H (6420 - 9792, n=20) | |
| AIDA64 / FPU Mandel | |
| Eurocom Nightsky ARX315 | |
| Dell G15 5515 | |
| Alienware m15 R6, i7-11800H RTX 3080 | |
| Eurocom RX315 NH57AF1 | |
| Genomsnitt Intel Core i7-11800H (23365 - 39464, n=20) | |
| MSI Stealth GS66 12UGS | |
| AIDA64 / CPU AES | |
| Alienware m15 R6, i7-11800H RTX 3080 | |
| Eurocom RX315 NH57AF1 | |
| Eurocom Nightsky ARX315 | |
| Genomsnitt Intel Core i7-11800H (74617 - 149388, n=20) | |
| Dell G15 5515 | |
| MSI Stealth GS66 12UGS | |
| AIDA64 / CPU ZLib | |
| MSI Stealth GS66 12UGS | |
| Eurocom Nightsky ARX315 | |
| Alienware m15 R6, i7-11800H RTX 3080 | |
| Eurocom RX315 NH57AF1 | |
| Dell G15 5515 | |
| Genomsnitt Intel Core i7-11800H (461 - 830, n=43) | |
| Razer Blade 15 Advanced (Mid 2021) | |
| AIDA64 / FP64 Ray-Trace | |
| Alienware m15 R6, i7-11800H RTX 3080 | |
| Eurocom RX315 NH57AF1 | |
| Dell G15 5515 | |
| Genomsnitt Intel Core i7-11800H (4545 - 8717, n=21) | |
| Eurocom Nightsky ARX315 | |
| MSI Stealth GS66 12UGS | |
| AIDA64 / CPU PhotoWorxx | |
| MSI Stealth GS66 12UGS | |
| Alienware m15 R6, i7-11800H RTX 3080 | |
| Eurocom RX315 NH57AF1 | |
| Genomsnitt Intel Core i7-11800H (11898 - 26757, n=21) | |
| Eurocom Nightsky ARX315 | |
| Dell G15 5515 | |
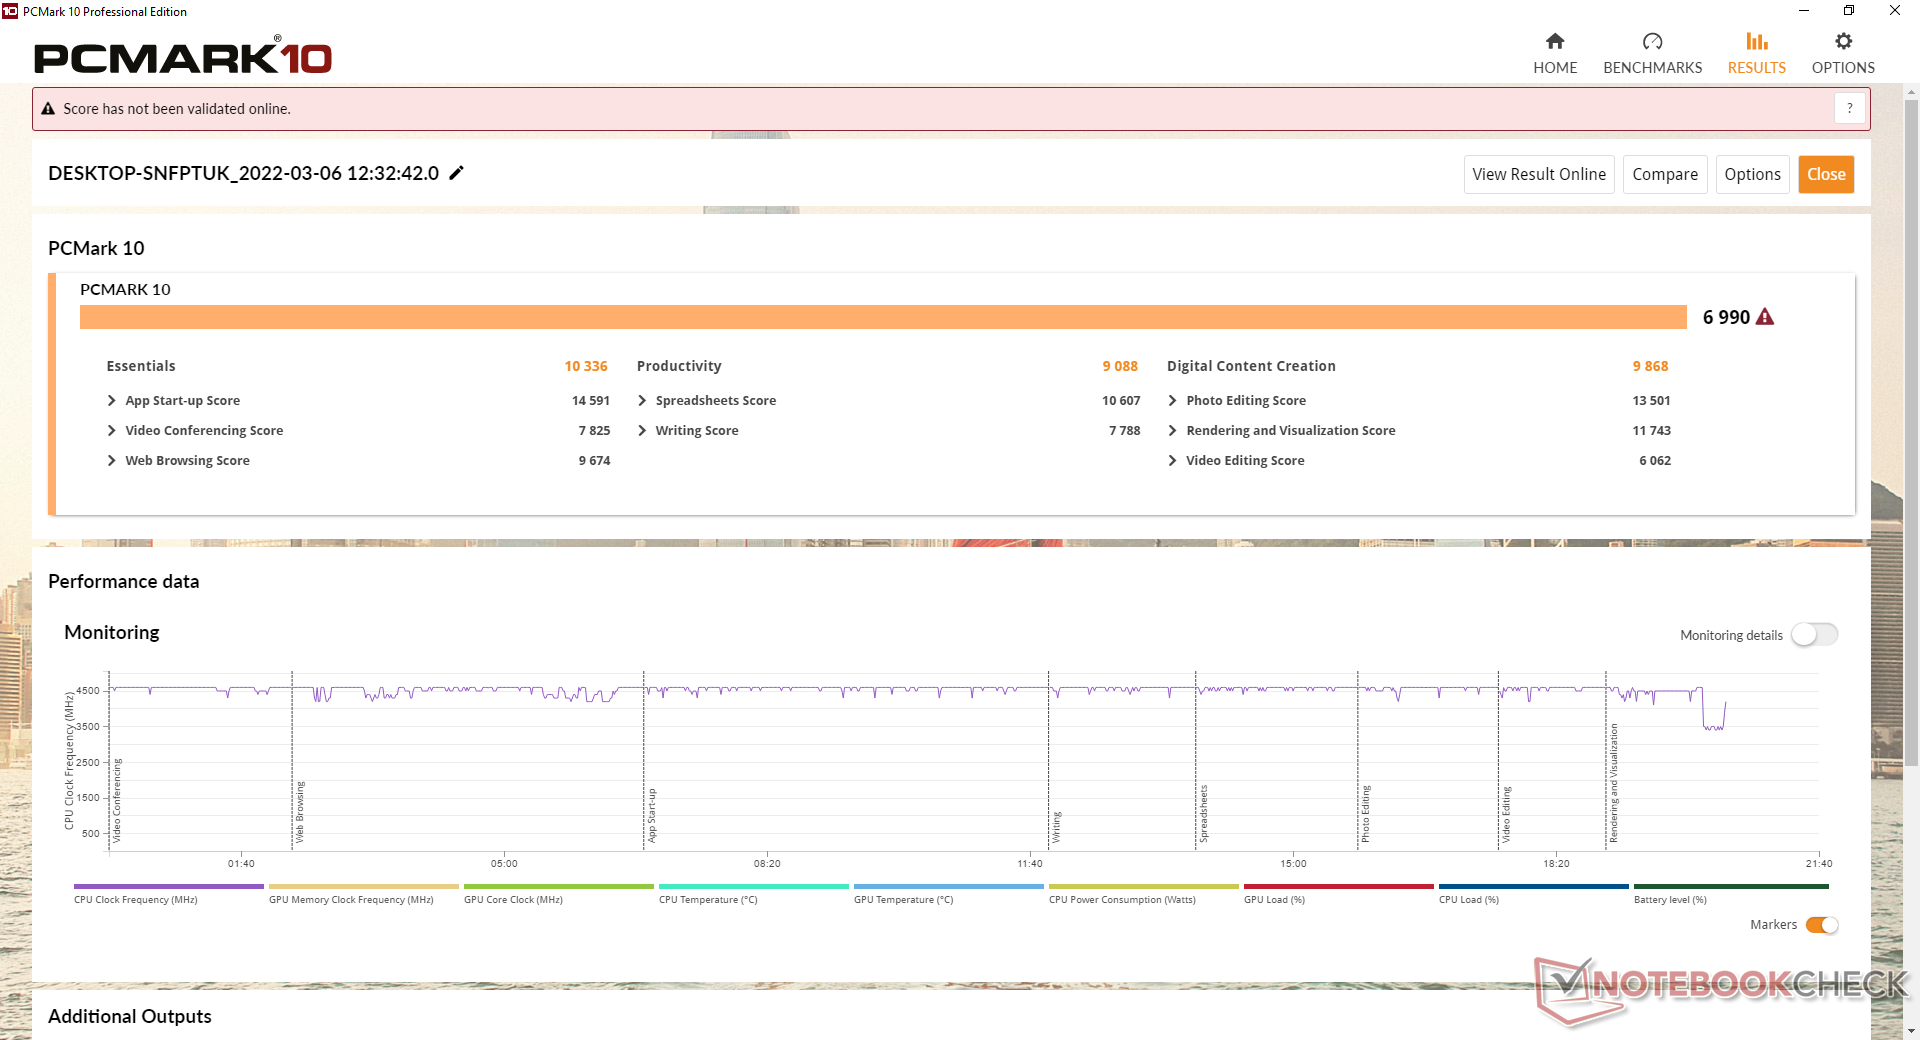
Systemets prestanda
| PCMark 10 / Score | |
| MSI Stealth GS66 12UGS | |
| Razer Blade 15 Advanced (Mid 2021) | |
| Eurocom Nightsky ARX315 | |
| Alienware m15 R6, i7-11800H RTX 3080 | |
| Eurocom RX315 NH57AF1 | |
| Genomsnitt Intel Core i7-11800H, NVIDIA GeForce RTX 3070 Laptop GPU (6126 - 7311, n=11) | |
| Dell G15 5515 | |
| PCMark 10 / Essentials | |
| Razer Blade 15 Advanced (Mid 2021) | |
| MSI Stealth GS66 12UGS | |
| Eurocom Nightsky ARX315 | |
| Eurocom RX315 NH57AF1 | |
| Genomsnitt Intel Core i7-11800H, NVIDIA GeForce RTX 3070 Laptop GPU (9248 - 10832, n=11) | |
| Alienware m15 R6, i7-11800H RTX 3080 | |
| Dell G15 5515 | |
| PCMark 10 / Productivity | |
| MSI Stealth GS66 12UGS | |
| Eurocom Nightsky ARX315 | |
| Alienware m15 R6, i7-11800H RTX 3080 | |
| Eurocom RX315 NH57AF1 | |
| Genomsnitt Intel Core i7-11800H, NVIDIA GeForce RTX 3070 Laptop GPU (8571 - 9669, n=11) | |
| Razer Blade 15 Advanced (Mid 2021) | |
| Dell G15 5515 | |
| PCMark 10 / Digital Content Creation | |
| MSI Stealth GS66 12UGS | |
| Razer Blade 15 Advanced (Mid 2021) | |
| Alienware m15 R6, i7-11800H RTX 3080 | |
| Eurocom Nightsky ARX315 | |
| Eurocom RX315 NH57AF1 | |
| Genomsnitt Intel Core i7-11800H, NVIDIA GeForce RTX 3070 Laptop GPU (7627 - 10851, n=11) | |
| Dell G15 5515 | |
| PCMark 10 Score | 6990 poäng | |
Hjälp | ||
| AIDA64 / Memory Copy | |
| MSI Stealth GS66 12UGS | |
| Alienware m15 R6, i7-11800H RTX 3080 | |
| Eurocom RX315 NH57AF1 | |
| Genomsnitt Intel Core i7-11800H (24508 - 48144, n=21) | |
| Eurocom Nightsky ARX315 | |
| Dell G15 5515 | |
| AIDA64 / Memory Read | |
| MSI Stealth GS66 12UGS | |
| Alienware m15 R6, i7-11800H RTX 3080 | |
| Eurocom RX315 NH57AF1 | |
| Eurocom Nightsky ARX315 | |
| Genomsnitt Intel Core i7-11800H (25882 - 50365, n=20) | |
| Dell G15 5515 | |
| AIDA64 / Memory Write | |
| MSI Stealth GS66 12UGS | |
| Eurocom Nightsky ARX315 | |
| Alienware m15 R6, i7-11800H RTX 3080 | |
| Eurocom RX315 NH57AF1 | |
| Genomsnitt Intel Core i7-11800H (22240 - 46214, n=20) | |
| Dell G15 5515 | |
| AIDA64 / Memory Latency | |
| Alienware m15 R6, i7-11800H RTX 3080 | |
| MSI Stealth GS66 12UGS | |
| Eurocom RX315 NH57AF1 | |
| Dell G15 5515 | |
| Eurocom Nightsky ARX315 | |
| Genomsnitt Intel Core i7-11800H (71.9 - 104.1, n=44) | |
| Razer Blade 15 Advanced (Mid 2021) | |
* ... mindre är bättre
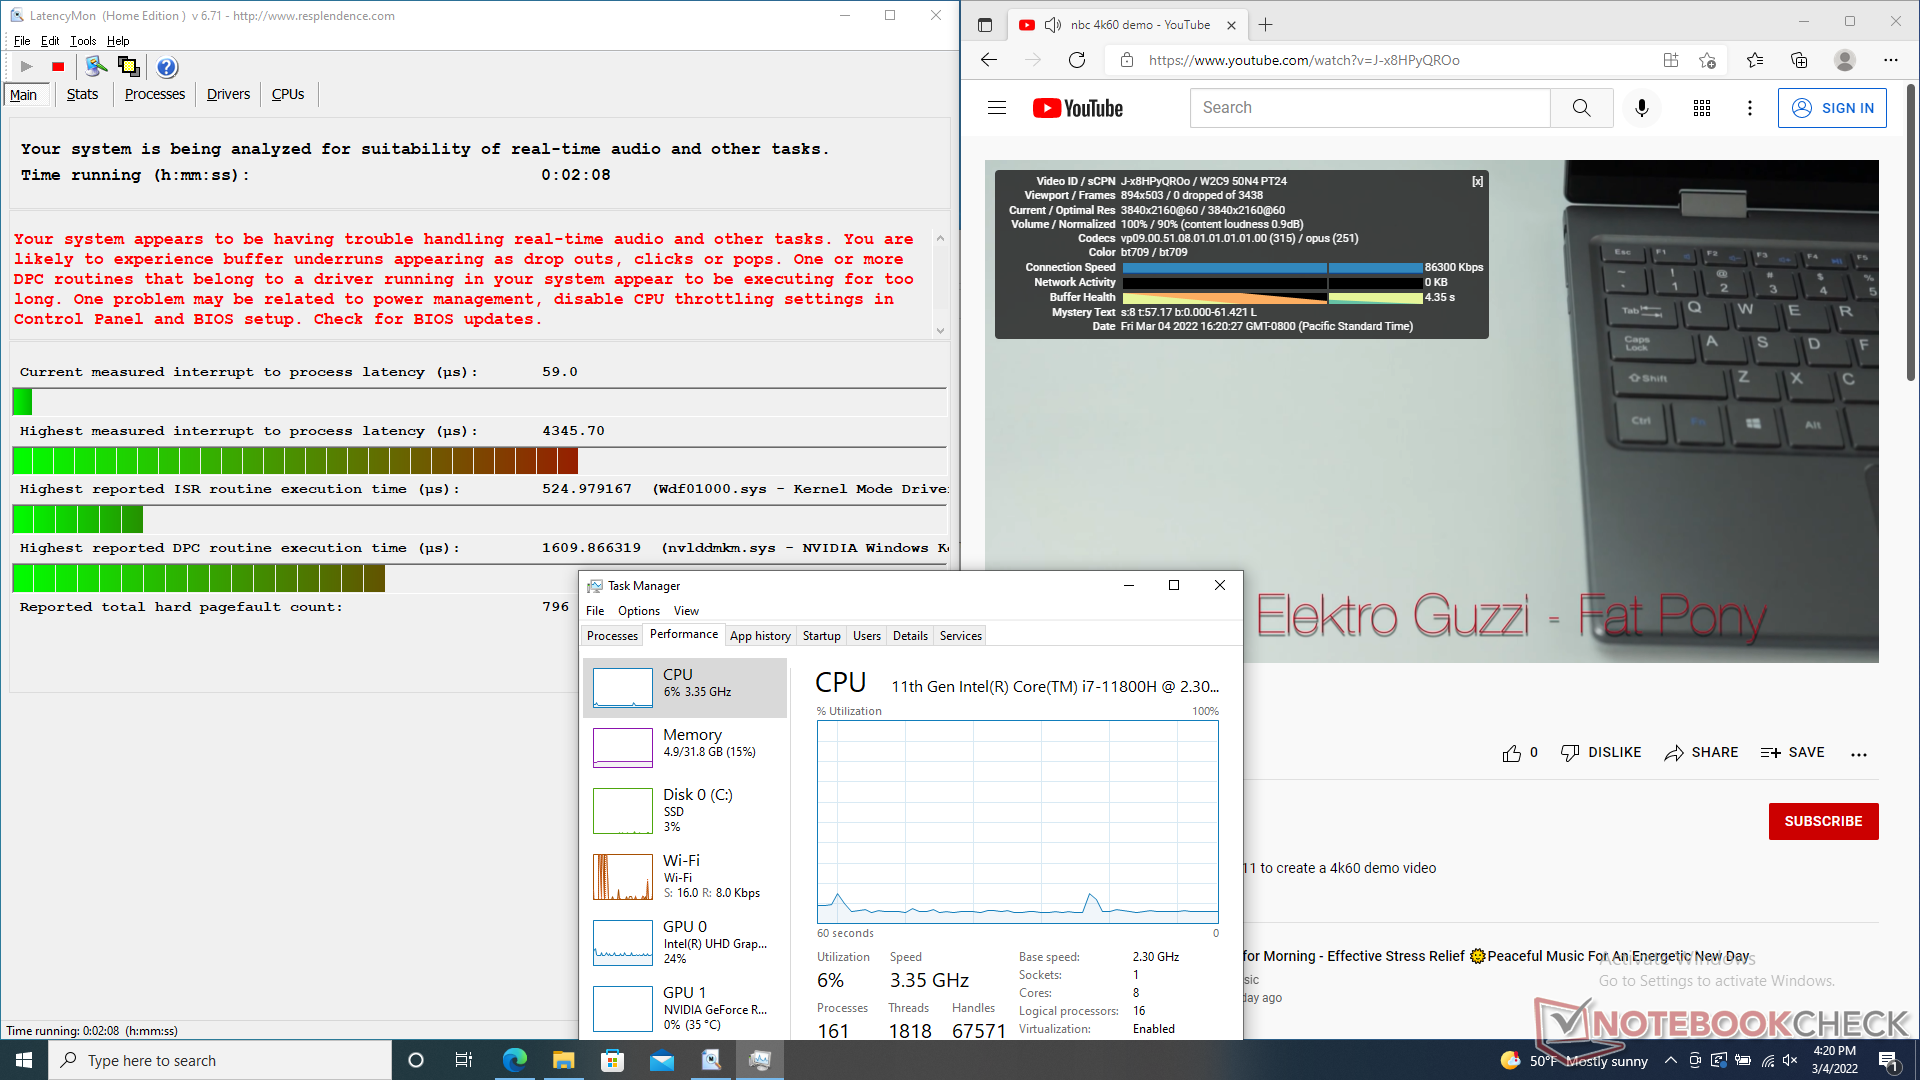
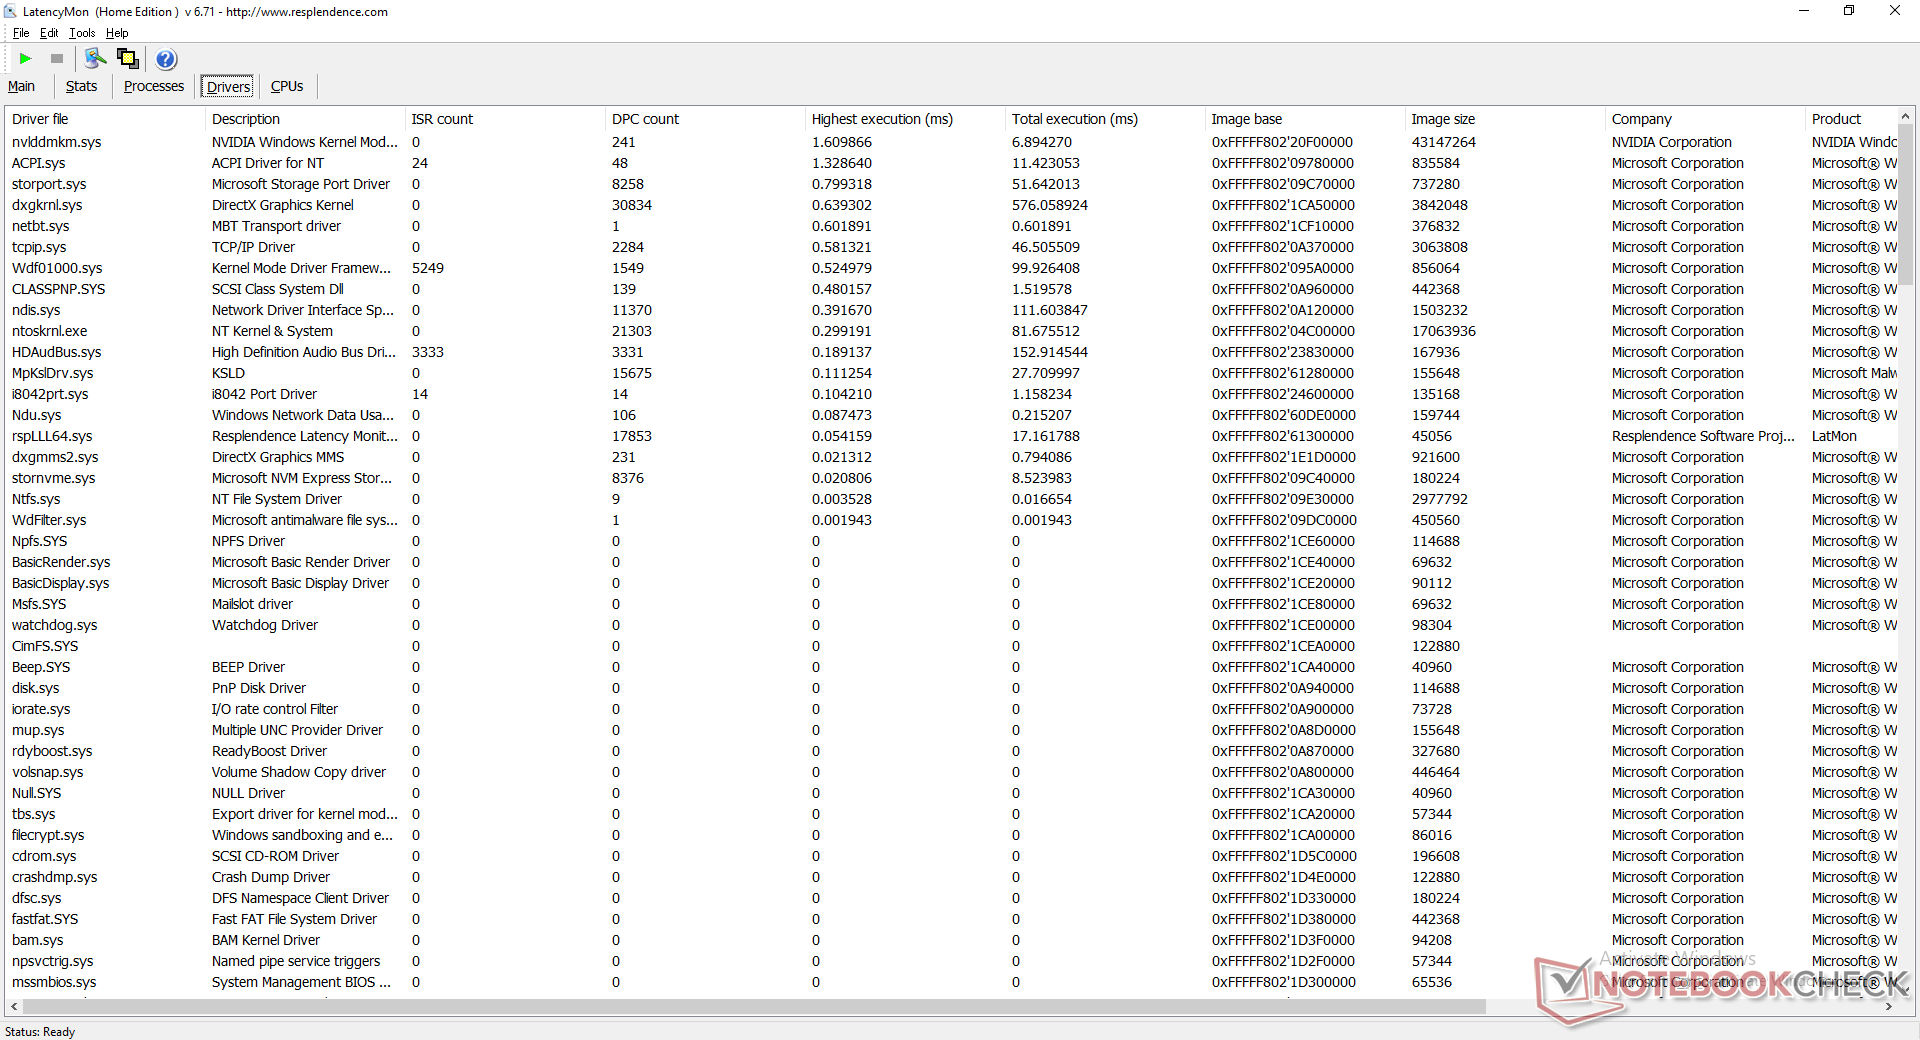
DPC-latenstid
LatencyMon avslöjar DPC-problem när du öppnar flera webbläsarflikar på vår hemsida. uppspelning av 4K UHD-video vid 60 FPS är i övrigt smidig utan att några ramar tappas bort.
| DPC Latencies / LatencyMon - interrupt to process latency (max), Web, Youtube, Prime95 | |
| Razer Blade 15 Advanced (Mid 2021) | |
| Eurocom RX315 NH57AF1 | |
| MSI Stealth GS66 12UGS | |
| Alienware m15 R6, i7-11800H RTX 3080 | |
| Dell G15 5515 | |
| Eurocom Nightsky ARX315 | |
* ... mindre är bättre
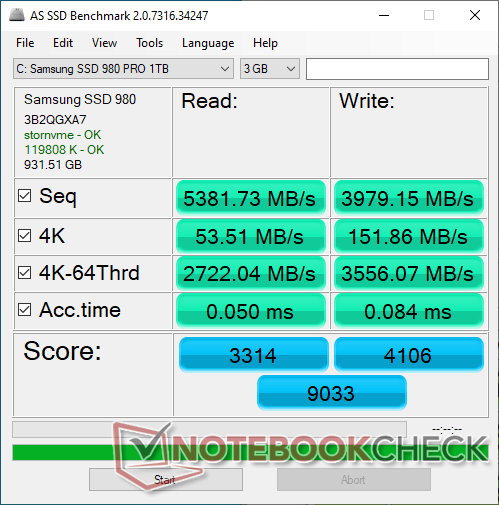
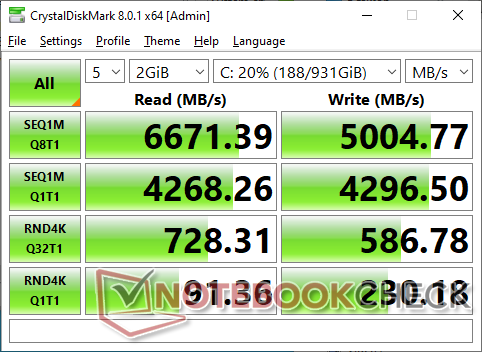
Lagringsenheter
PCIe4 x4 1 TB Samsung SSD 980 Pro i vår enhet kan nå överföringshastigheter på upp till 6500 MB/s. Hållbarheten i prestandan är också ganska bra eftersom denna maximala hastighet bara skulle sjunka något till 5900 MB/s under den senare tredjedelen av vårt DiskSpd-stresstest.

* ... mindre är bättre
Disk Throttling: DiskSpd Read Loop, Queue Depth 8
GPU-prestanda
Den 105 W GeForce RTX 3070 är cirka 15-20 procent långsammare än den nya 150 W GeForce RTX 3070 Ti. Den totala prestandan är där vi förväntar oss att den ska vara i förhållande till andra bärbara datorer med samma mobila RTX 3070 GPU.
| 3DMark 11 - 1280x720 Performance GPU | |
| Corsair One i300 | |
| MSI Vector GP66 12UGS | |
| Alienware m15 R4 RTX 3080 | |
| Eurocom Nightsky ARX315 | |
| Eurocom RX315 NH57AF1 | |
| MSI Delta 15 A5EFK | |
| Razer Blade 15 Advanced Model Early 2021 | |
| Genomsnitt NVIDIA GeForce RTX 3070 Laptop GPU (12535 - 38275, n=54) | |
| Schenker XMG Apex 15 NH57E PS | |
| Schenker XMG Core 15 Ampere | |
| Dell G15 5515 | |
| Gigabyte G5 GD | |
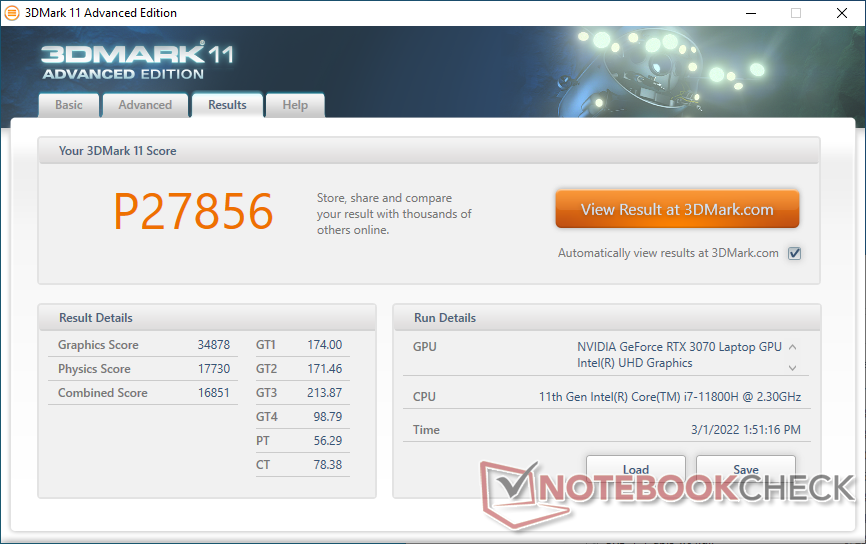
| 3DMark 11 Performance | 27856 poäng | |
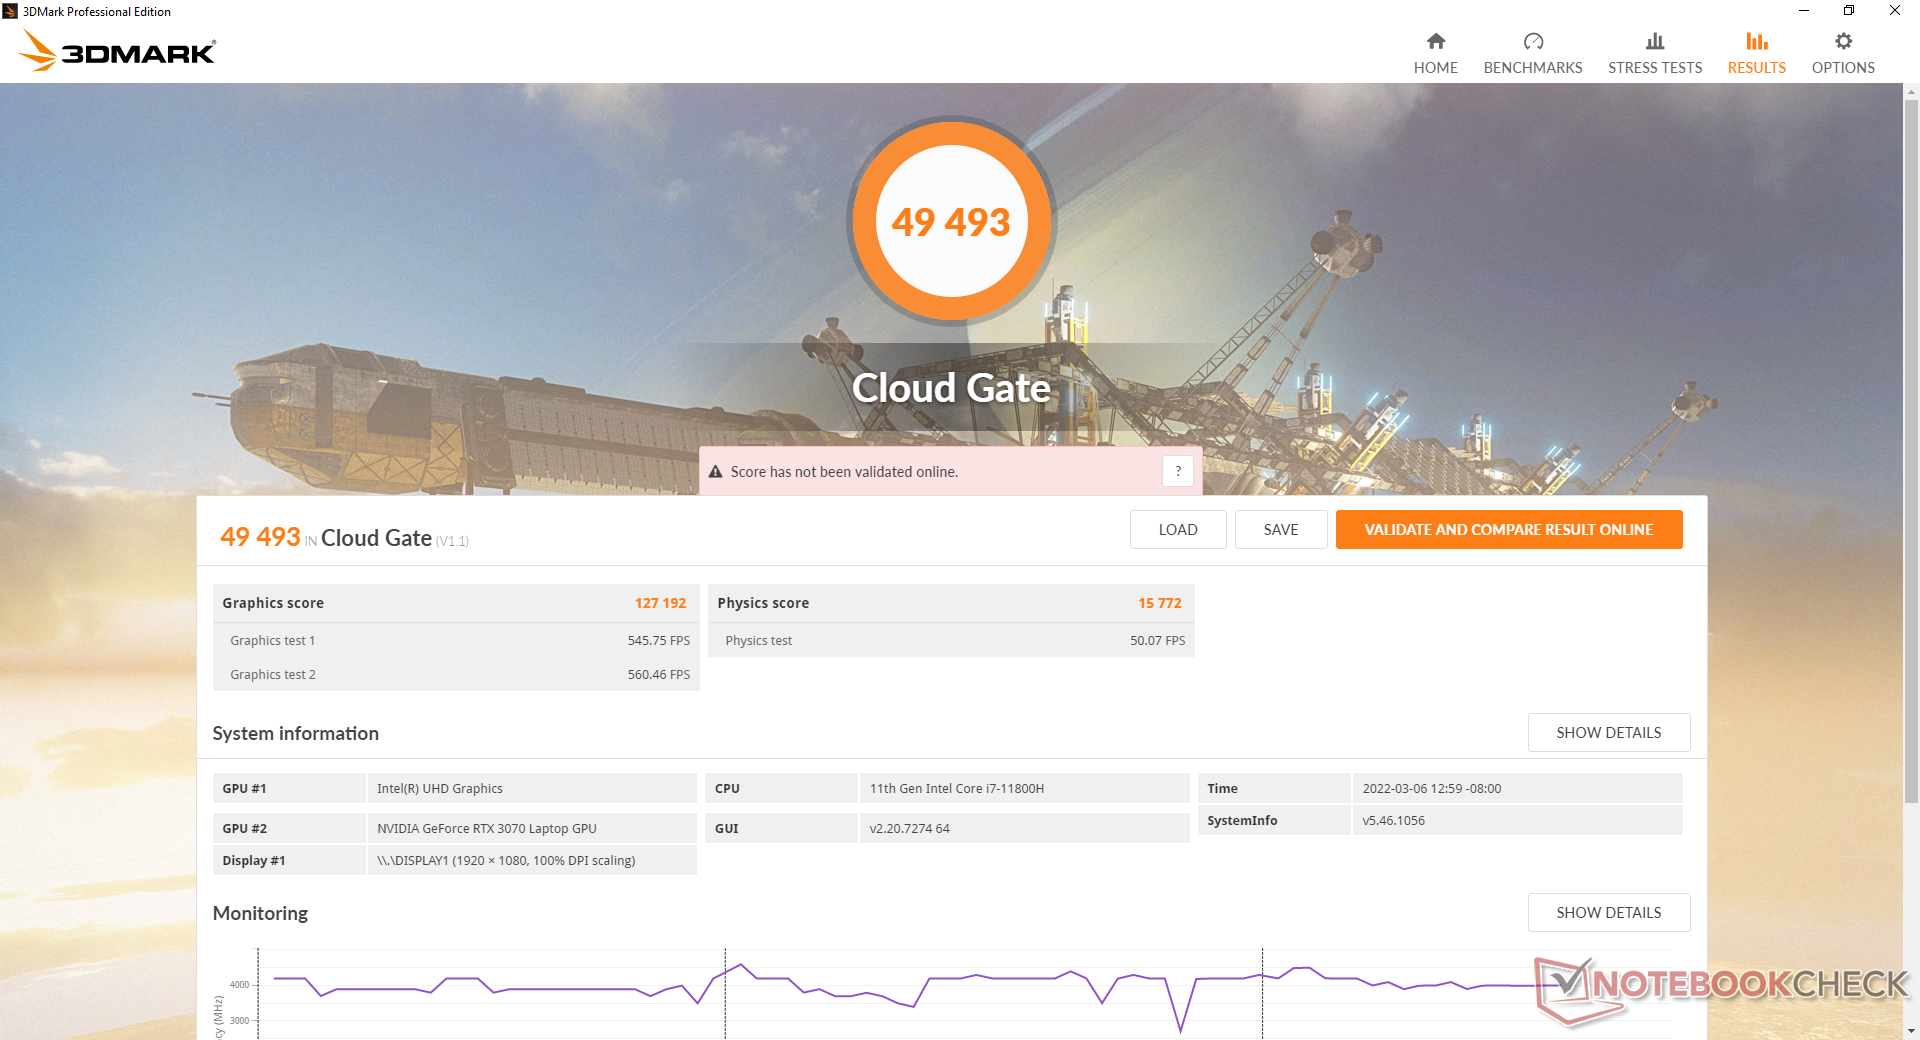
| 3DMark Cloud Gate Standard Score | 49493 poäng | |
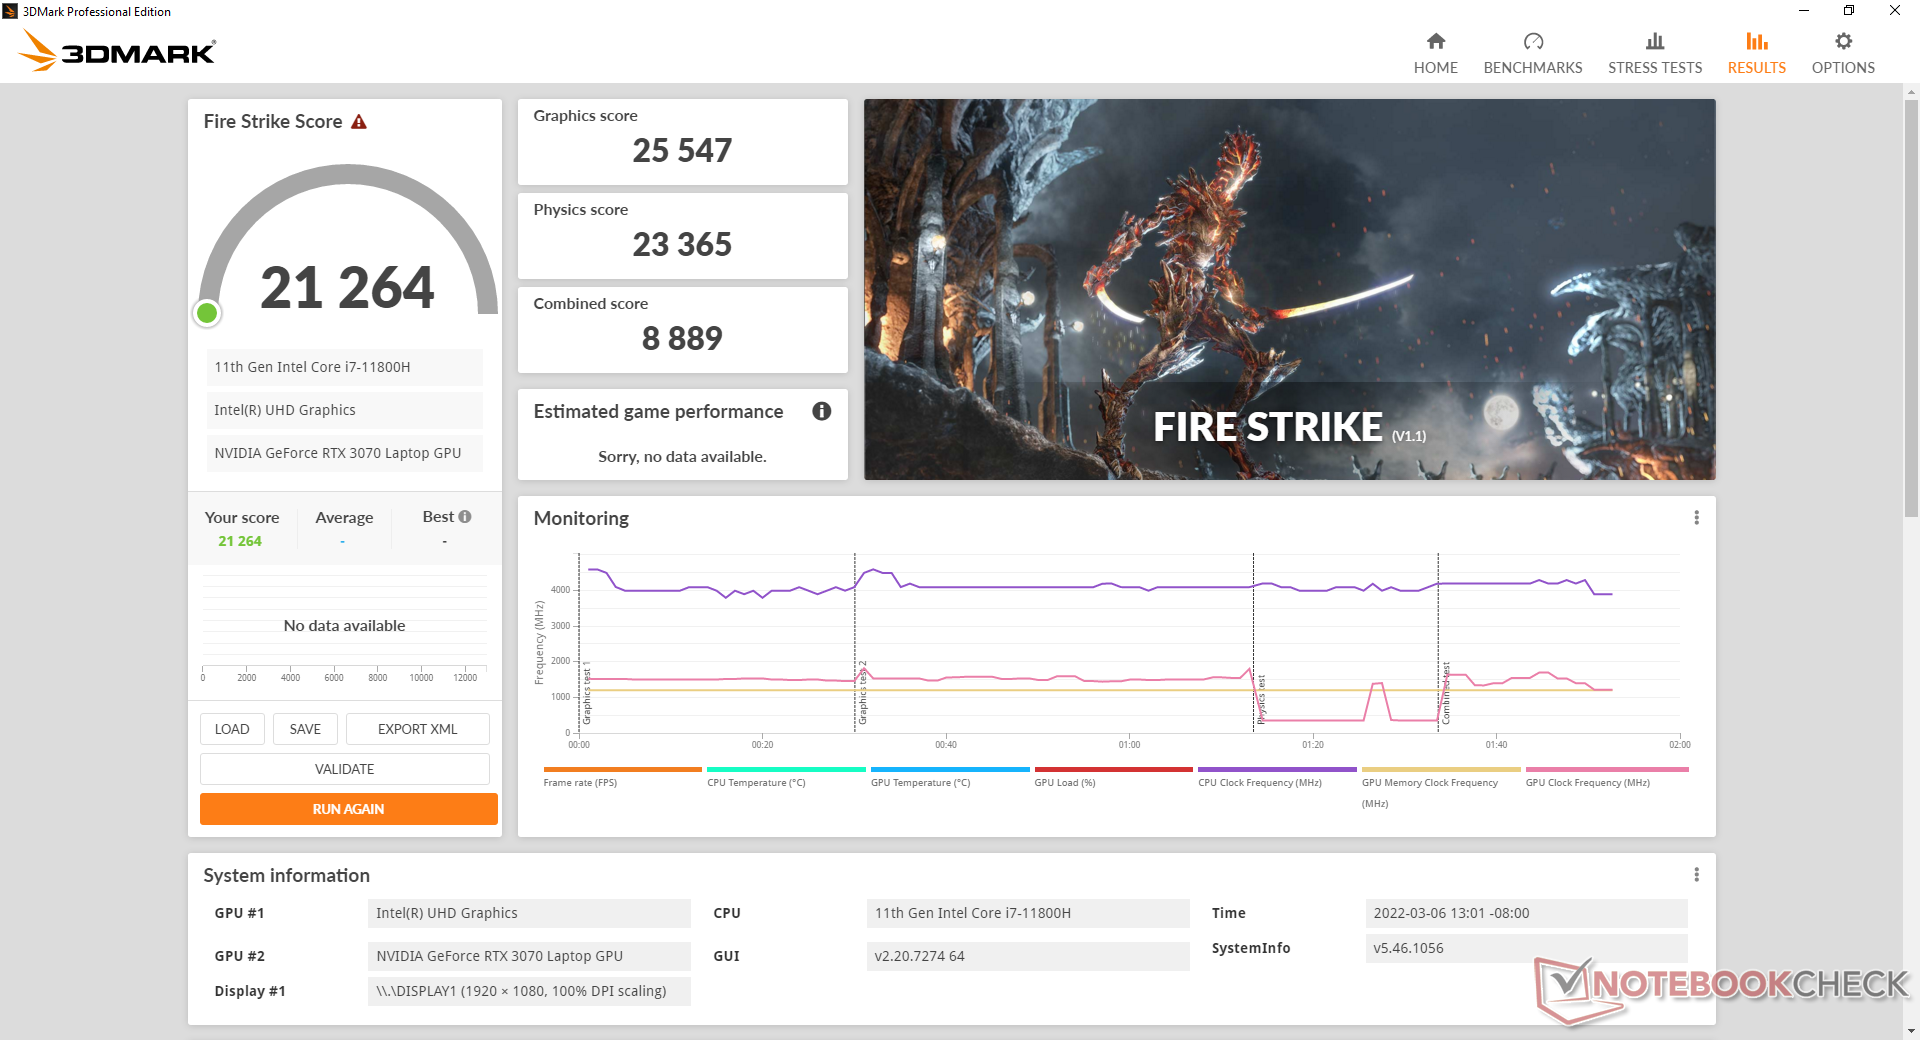
| 3DMark Fire Strike Score | 21264 poäng | |
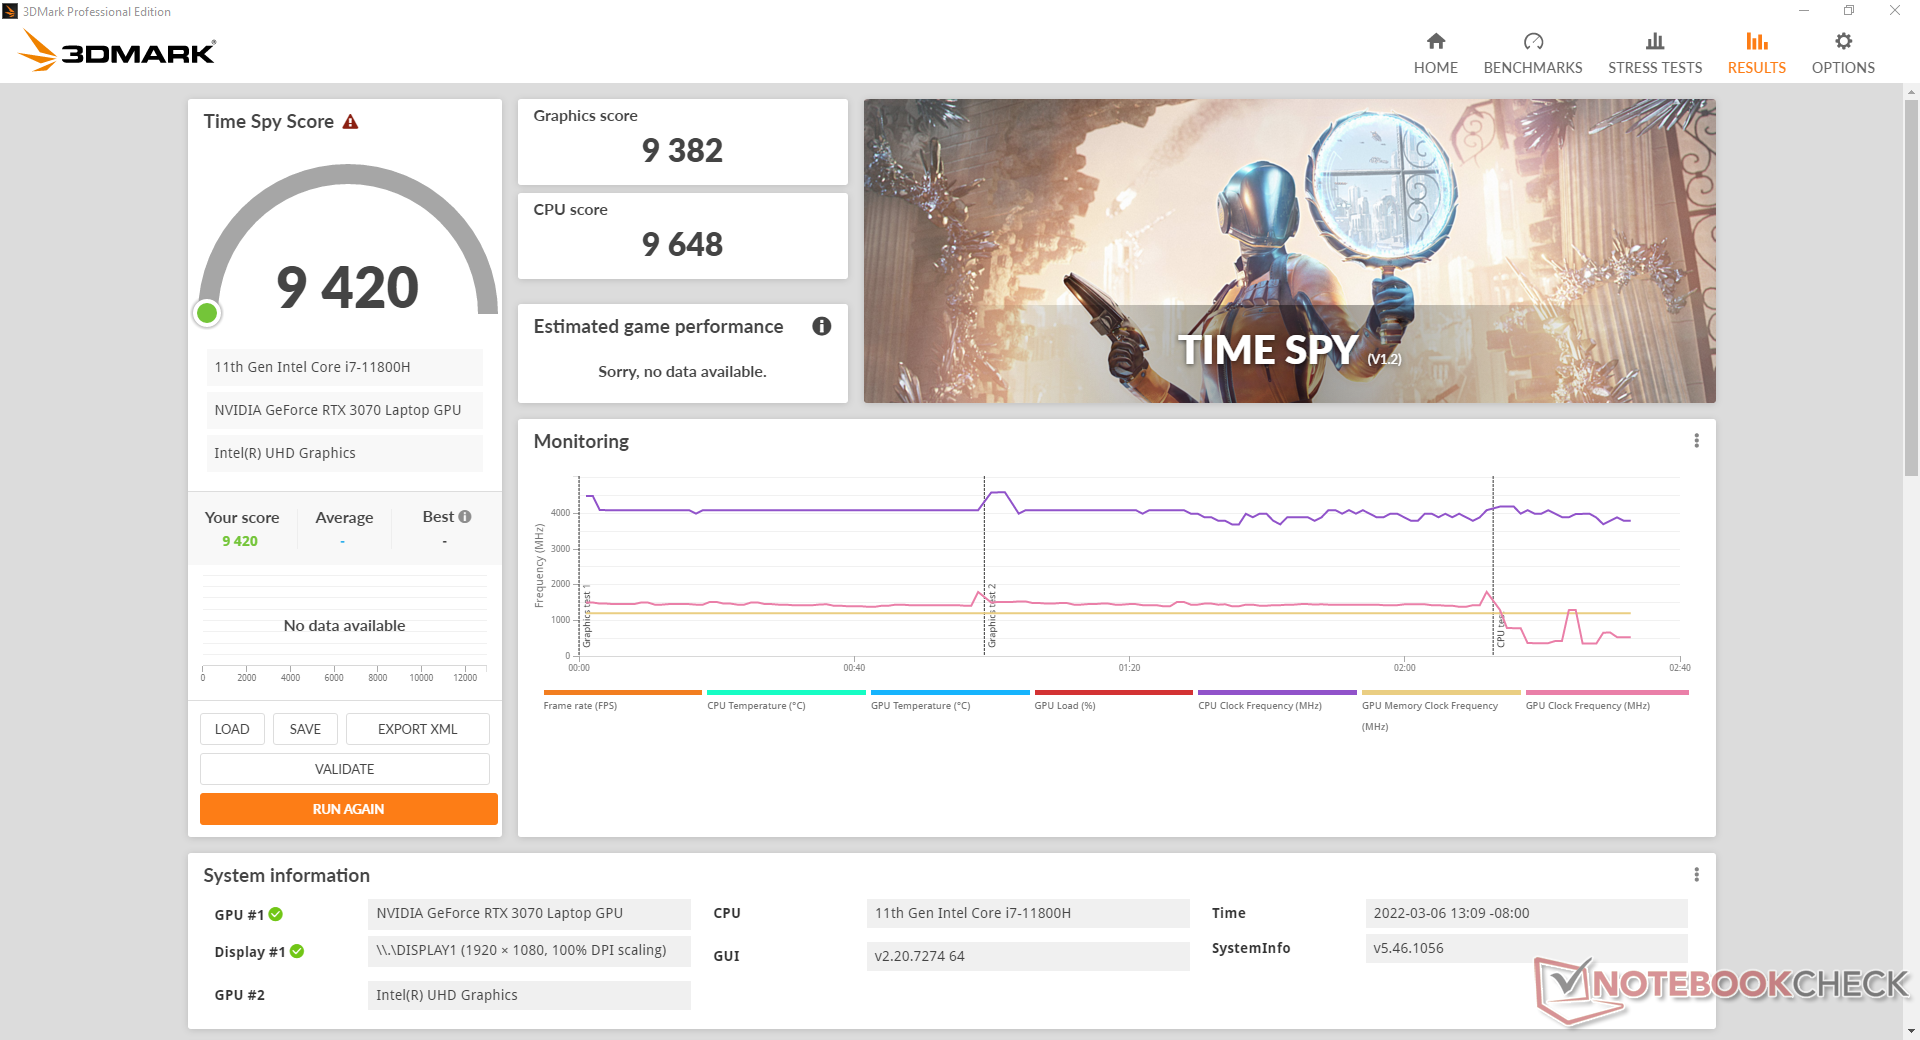
| 3DMark Time Spy Score | 9420 poäng | |
Hjälp | ||
| X-Plane 11.11 | |
| 1280x720 low (fps_test=1) | |
| Corsair One i300 | |
| MSI Vector GP66 12UGS | |
| Eurocom Nightsky ARX315 | |
| Eurocom RX315 NH57AF1 | |
| Alienware m15 R4 RTX 3080 | |
| Genomsnitt NVIDIA GeForce RTX 3070 Laptop GPU (15.3 - 152.8, n=61) | |
| Gigabyte G5 GD | |
| Razer Blade 15 Advanced Model Early 2021 | |
| Schenker XMG Apex 15 NH57E PS | |
| Dell G15 5515 | |
| Schenker XMG Core 15 Ampere | |
| 1920x1080 med (fps_test=2) | |
| Corsair One i300 | |
| MSI Vector GP66 12UGS | |
| Eurocom Nightsky ARX315 | |
| Eurocom RX315 NH57AF1 | |
| Alienware m15 R4 RTX 3080 | |
| Genomsnitt NVIDIA GeForce RTX 3070 Laptop GPU (13.7 - 144.7, n=61) | |
| Gigabyte G5 GD | |
| Schenker XMG Apex 15 NH57E PS | |
| Razer Blade 15 Advanced Model Early 2021 | |
| Dell G15 5515 | |
| Schenker XMG Core 15 Ampere | |
| 1920x1080 high (fps_test=3) | |
| Corsair One i300 | |
| MSI Vector GP66 12UGS | |
| Eurocom Nightsky ARX315 | |
| Alienware m15 R4 RTX 3080 | |
| Eurocom RX315 NH57AF1 | |
| Genomsnitt NVIDIA GeForce RTX 3070 Laptop GPU (12.4 - 118.8, n=61) | |
| Gigabyte G5 GD | |
| Razer Blade 15 Advanced Model Early 2021 | |
| Schenker XMG Apex 15 NH57E PS | |
| Dell G15 5515 | |
| Schenker XMG Core 15 Ampere | |
Witcher 3 FPS Chart
| låg | med. | hög | ultra | |
|---|---|---|---|---|
| GTA V (2015) | 182 | 176 | 159 | 95.5 |
| The Witcher 3 (2015) | 388.1 | 279.3 | 177.8 | 96.5 |
| Dota 2 Reborn (2015) | 163 | 146 | 137 | 129 |
| Final Fantasy XV Benchmark (2018) | 162 | 116 | 90.4 | |
| X-Plane 11.11 (2018) | 125 | 104 | 82.9 | |
| Far Cry 5 (2018) | 148 | 120 | 114 | 107 |
| Strange Brigade (2018) | 442 | 236 | 193 | 171 |
Utsläpp
Systembrus
Fläktljudet beror i hög grad på de fyra inställningarna i Control Center för strömprofilen: Tyst, Energisparande, Underhållning och Prestanda. Det finns också en femte manuell inställning för maximalt fläktläge som gör att fläktarna är som mest högljudda med 57 dB(A) oavsett belastning på skärmen.
Det rekommenderas att köra systemet i energisparläge om man bara surfar på webben eller använder ordbehandling, eftersom fläktarna tenderar att pulsera mycket ofta mellan 26 och 34 dB(A) i prestandaläget. Spel i prestandaläget är högre än vad vi registrerade påRazer Blade 15 Advanced eller MSI GS66.
Ljudnivå
| Låg belastning |
| 26.4 / 31 / 34 dB(A) |
| Hög belastning |
| 47.8 / 57.1 dB(A) |
 | ||
30 dB tyst 40 dB(A) hörbar 50 dB(A) högt ljud |
||
min: | ||
| Eurocom RX315 NH57AF1 GeForce RTX 3070 Laptop GPU, i7-11800H, Samsung SSD 980 Pro 1TB MZ-V8P1T0BW | MSI Stealth GS66 12UGS GeForce RTX 3070 Ti Laptop GPU, i7-12700H, WDC PC SN810 1TB | Eurocom Nightsky ARX315 GeForce RTX 3070 Laptop GPU, R9 5900X, Samsung SSD 980 Pro 1TB MZ-V8P1T0BW | Alienware m15 R6, i7-11800H RTX 3080 GeForce RTX 3080 Laptop GPU, i7-11800H, Samsung PM9A1 MZVL21T0HCLR | Dell G15 5515 GeForce RTX 3050 Ti Laptop GPU, R7 5800H, Samsung PM991a MZ9LQ512HBLU-00BD1 | Razer Blade 15 Advanced (Mid 2021) GeForce RTX 3080 Laptop GPU, i7-11800H, SSSTC CA6-8D1024 | |
|---|---|---|---|---|---|---|
| Noise | 3% | -4% | 12% | 12% | 12% | |
| av / miljö * (dB) | 26.3 | 24 9% | 25.3 4% | 23 13% | 24 9% | 25.1 5% |
| Idle Minimum * (dB) | 26.4 | 31 -17% | 25.9 2% | 23 13% | 25 5% | 25.3 4% |
| Idle Average * (dB) | 31 | 32 -3% | 27.9 10% | 23 26% | 26 16% | 25.3 18% |
| Idle Maximum * (dB) | 34 | 35 -3% | 40.8 -20% | 30 12% | 30 12% | 25.3 26% |
| Load Average * (dB) | 47.8 | 48 -0% | 55.2 -15% | 41.26 14% | 44 8% | 42 12% |
| Witcher 3 ultra * (dB) | 51.7 | 43 17% | 52.4 -1% | 53.4 -3% | 44 15% | 45.6 12% |
| Load Maximum * (dB) | 57.1 | 48 16% | 60.3 -6% | 53.37 7% | 48 16% | 51.6 10% |
* ... mindre är bättre
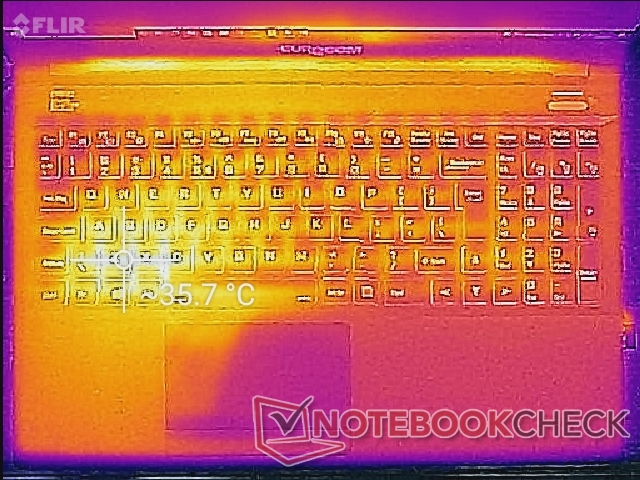
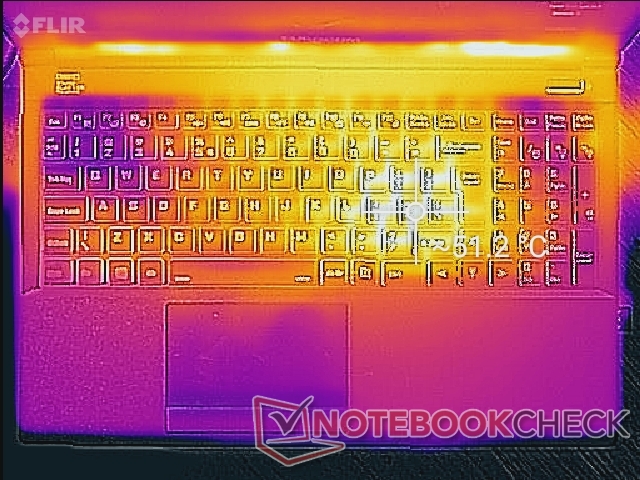
Temperatur
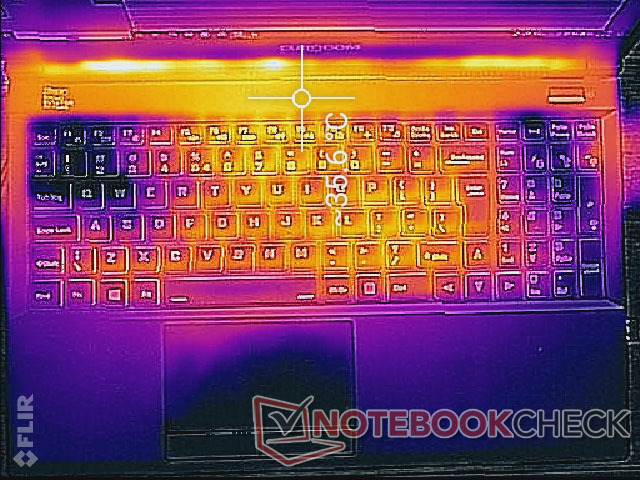
Yttemperaturen när du spelar kan vara så varm som 51 C nära tangentbordets mittpunkt jämfört med 44 C på Razer Blade 15. Precis som på de flesta bärbara datorer för spel är de två fläktarna placerade under WASD- och numpad-tangenterna för att hålla dessa delar av den bärbara datorn relativt svala oavsett belastning.
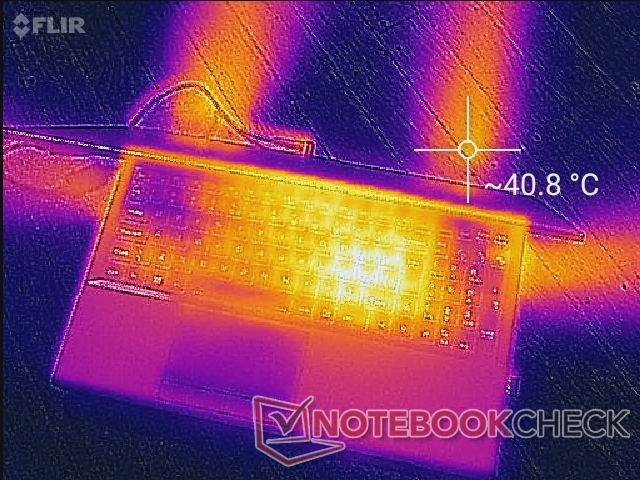
(+) Den maximala temperaturen på ovansidan är 36 °C / 97 F, jämfört med genomsnittet av 40.4 °C / 105 F , allt från 21.2 till 68.8 °C för klassen Gaming.
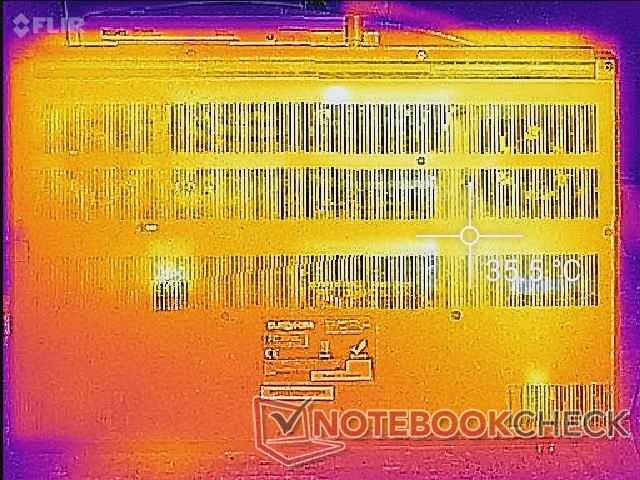
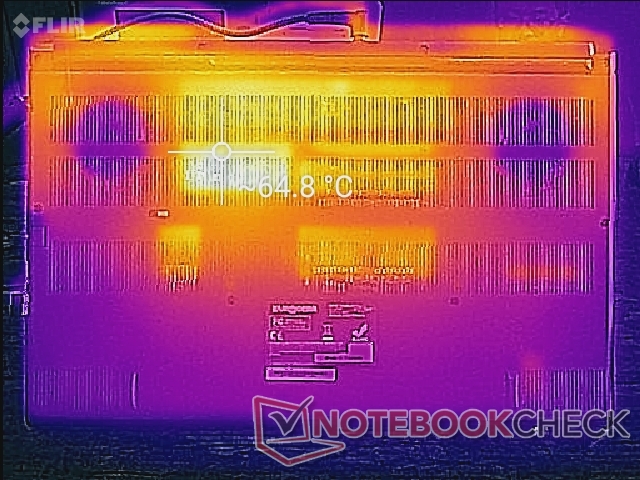
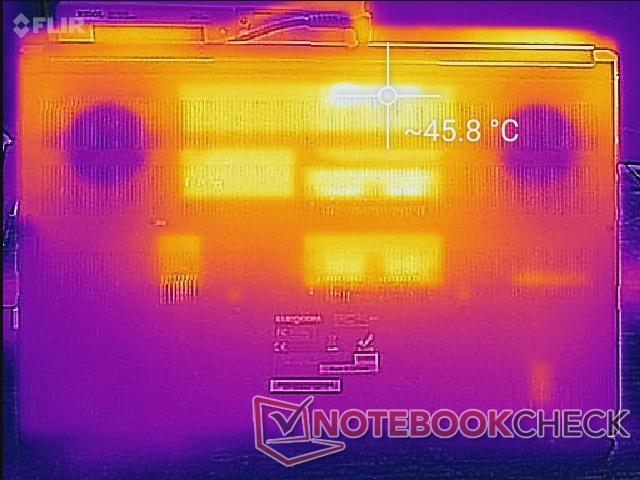
(-) Botten värms upp till maximalt 46 °C / 115 F, jämfört med genomsnittet av 43.2 °C / 110 F
(+) Vid tomgångsbruk är medeltemperaturen för ovansidan 31.4 °C / 89 F, jämfört med enhetsgenomsnittet på 33.9 °C / ### class_avg_f### F.
(±) När du spelar The Witcher 3 är medeltemperaturen för ovansidan 37.1 °C / 99 F, jämfört med enhetsgenomsnittet på 33.9 °C / ## #class_avg_f### F.
(+) Handledsstöden och pekplattan är kallare än hudtemperaturen med maximalt 31.2 °C / 88.2 F och är därför svala att ta på.
(-) Medeltemperaturen för handledsstödsområdet på liknande enheter var 28.8 °C / 83.8 F (-2.4 °C / -4.4 F).
| Eurocom RX315 NH57AF1 Intel Core i7-11800H, NVIDIA GeForce RTX 3070 Laptop GPU | MSI Stealth GS66 12UGS Intel Core i7-12700H, NVIDIA GeForce RTX 3070 Ti Laptop GPU | Eurocom Nightsky ARX315 AMD Ryzen 9 5900X, NVIDIA GeForce RTX 3070 Laptop GPU | Alienware m15 R6, i7-11800H RTX 3080 Intel Core i7-11800H, NVIDIA GeForce RTX 3080 Laptop GPU | Dell G15 5515 AMD Ryzen 7 5800H, NVIDIA GeForce RTX 3050 Ti Laptop GPU | Razer Blade 15 Advanced (Mid 2021) Intel Core i7-11800H, NVIDIA GeForce RTX 3080 Laptop GPU | |
|---|---|---|---|---|---|---|
| Heat | -6% | -5% | -25% | 3% | -14% | |
| Maximum Upper Side * (°C) | 36 | 54 -50% | 36.2 -1% | 61 -69% | 50 -39% | 51 -42% |
| Maximum Bottom * (°C) | 46 | 59 -28% | 49.6 -8% | 58 -26% | 49 -7% | 52 -13% |
| Idle Upper Side * (°C) | 35.6 | 26 27% | 32.6 8% | 38 -7% | 26 27% | 35.2 1% |
| Idle Bottom * (°C) | 36.8 | 27 27% | 43.2 -17% | 36 2% | 26 29% | 37.8 -3% |
* ... mindre är bättre
Stresstest
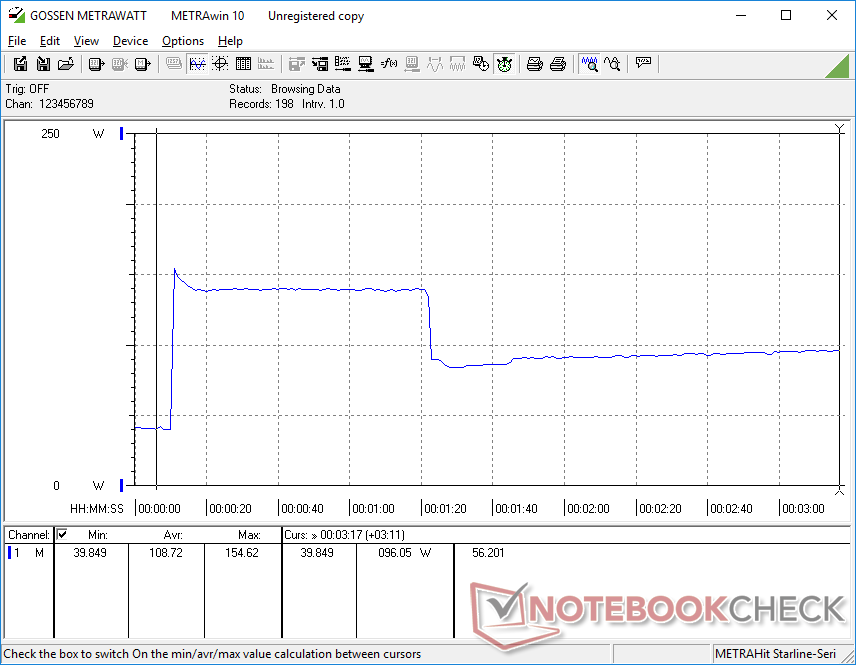
När vi körde Prime95 ökade processorn till 3,5-3,7 GHz under de första 70 sekunderna med ett paketuttag på 95 W och en kärntemperatur på 99 C. Därefter stabiliserades processorn vid en mer behaglig temperatur på 76 C och 54 W, dock med en lägre klockfrekvens på 2,8 GHz.
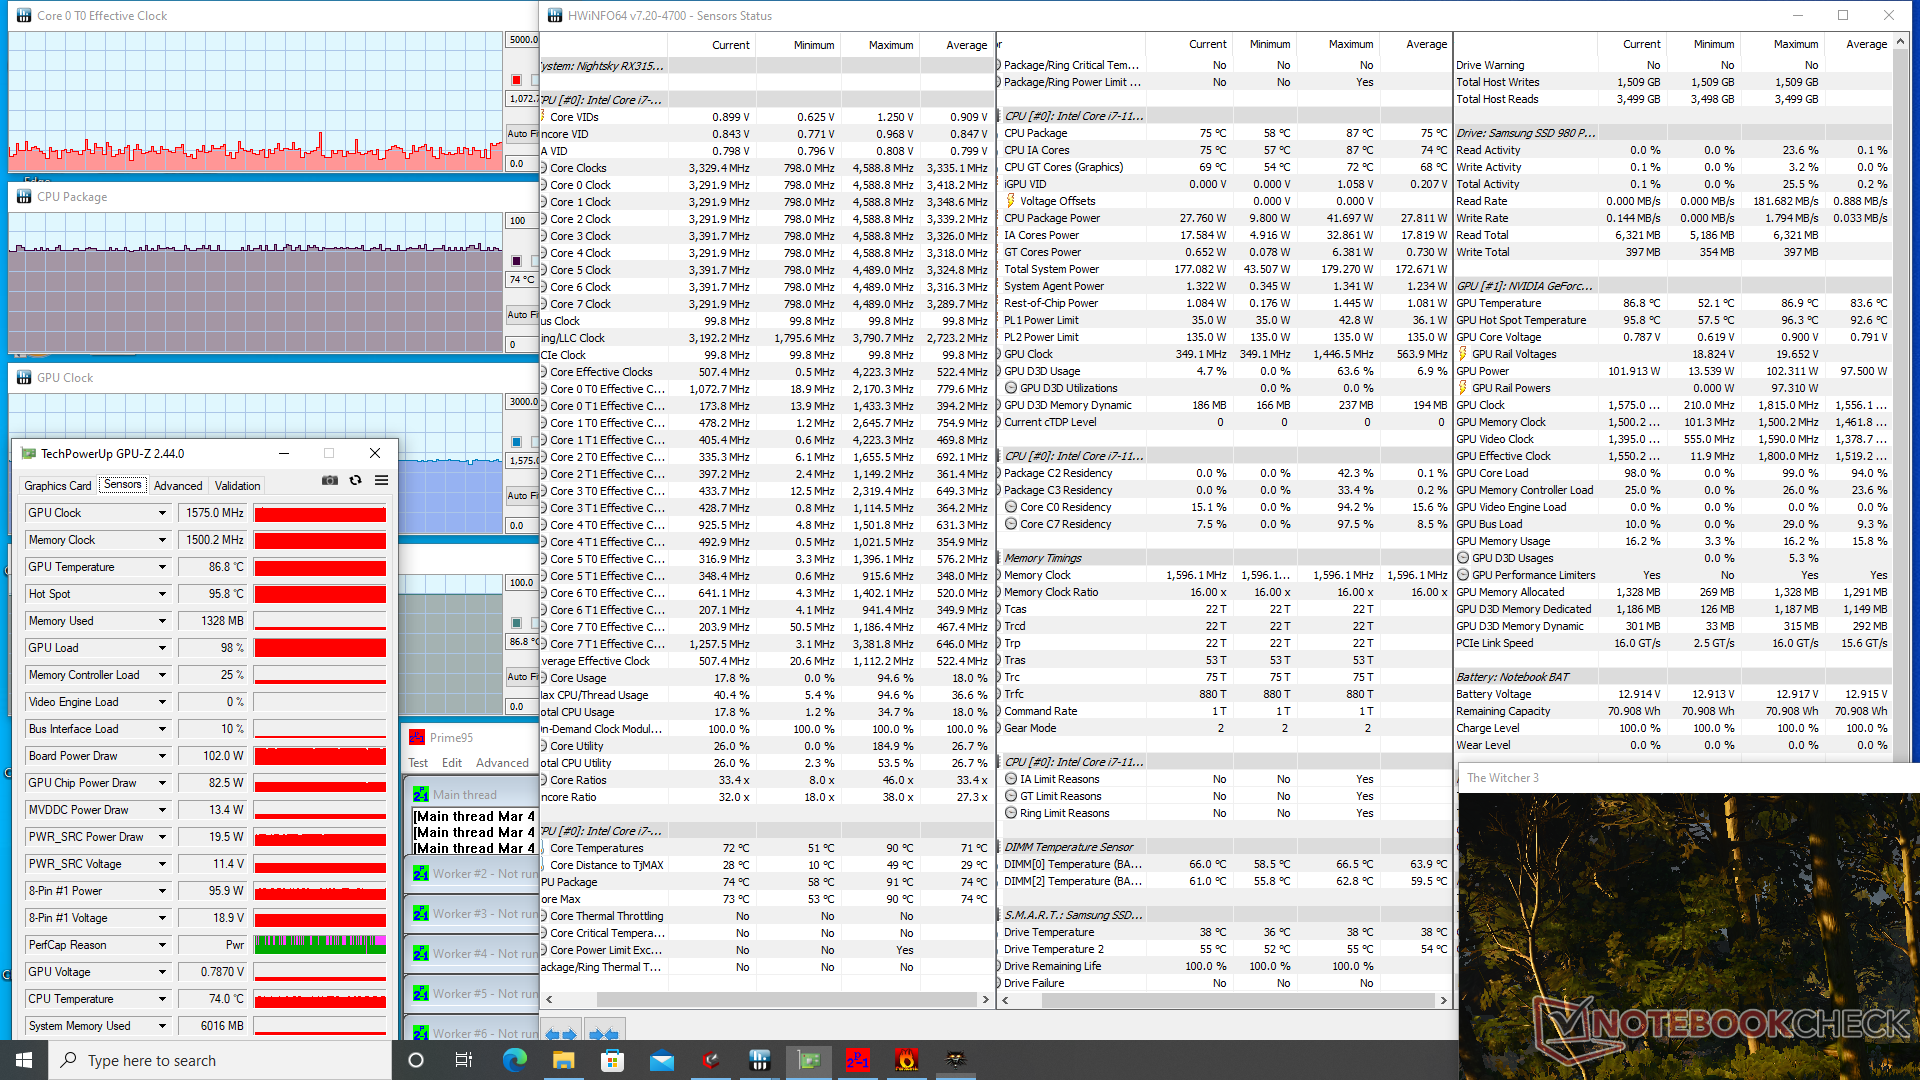
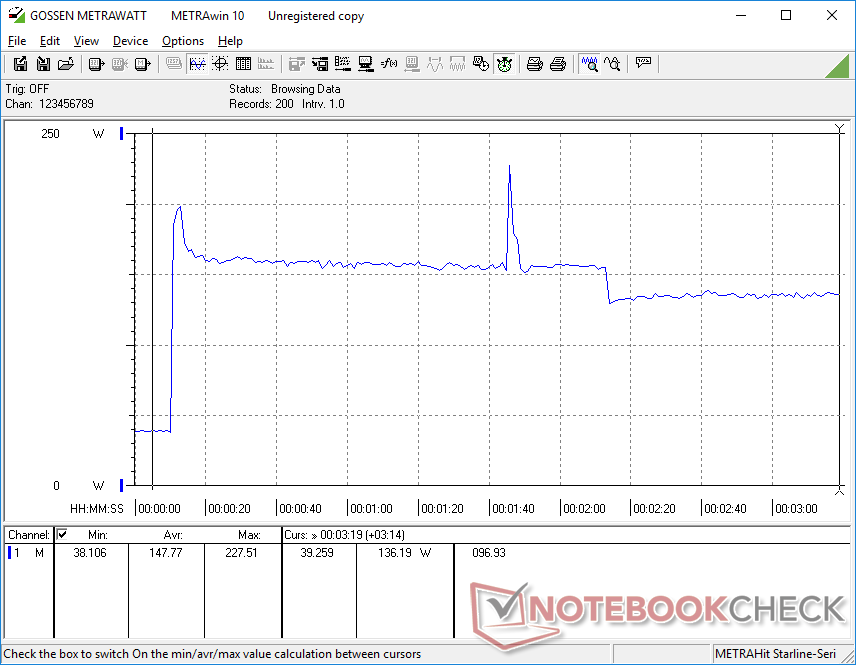
När du kör Witcher 3skulle GPU:n stabilisera sig vid 1575 MHz och 87 C. GPU-Z rapporterar en strömförbrukning på 102 W för kortet, vilket är mycket nära det annonserade TGP-målet på 105 W.
Att köra på batteri begränsar prestandan. Ett Fire Strike -test på batterier skulle ge fysik- och grafikpoäng på 15083 respektive 2154 poäng, jämfört med 23365 och 25547 poäng när det är på nätet.
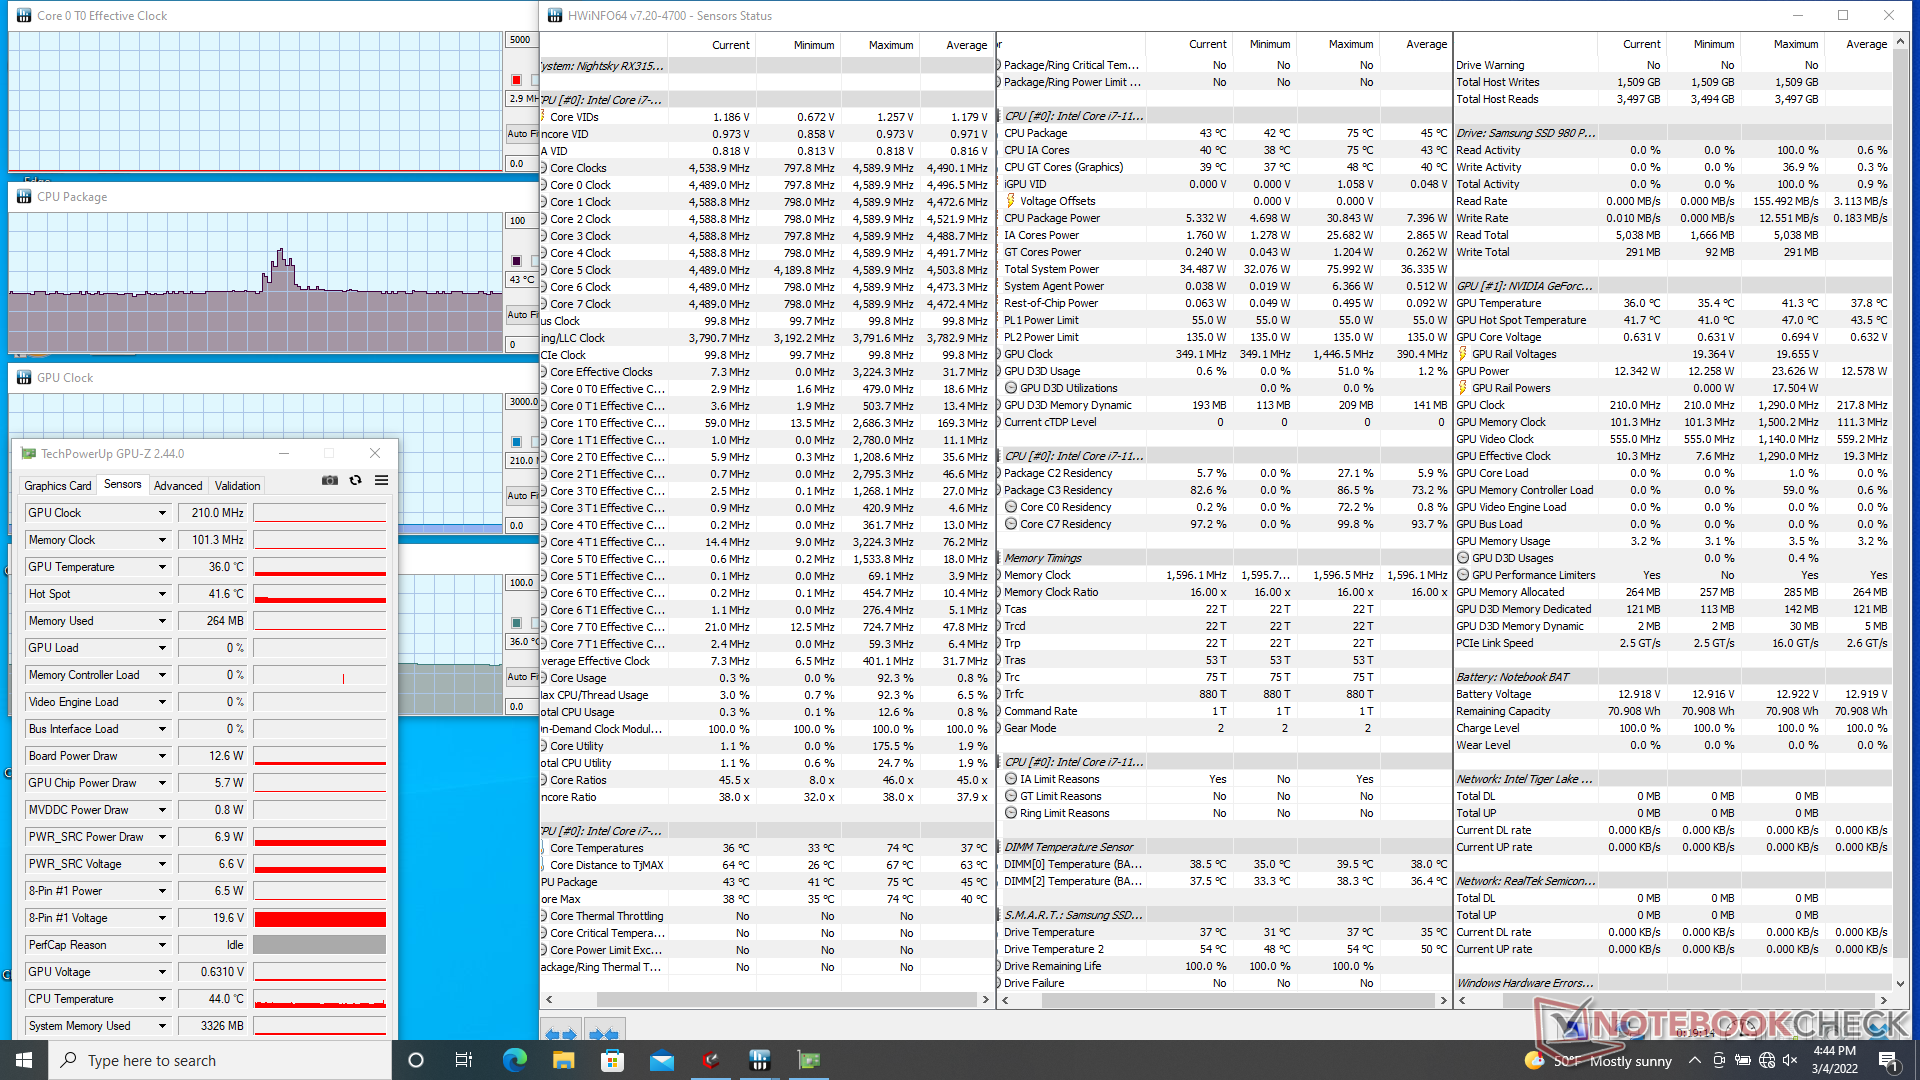
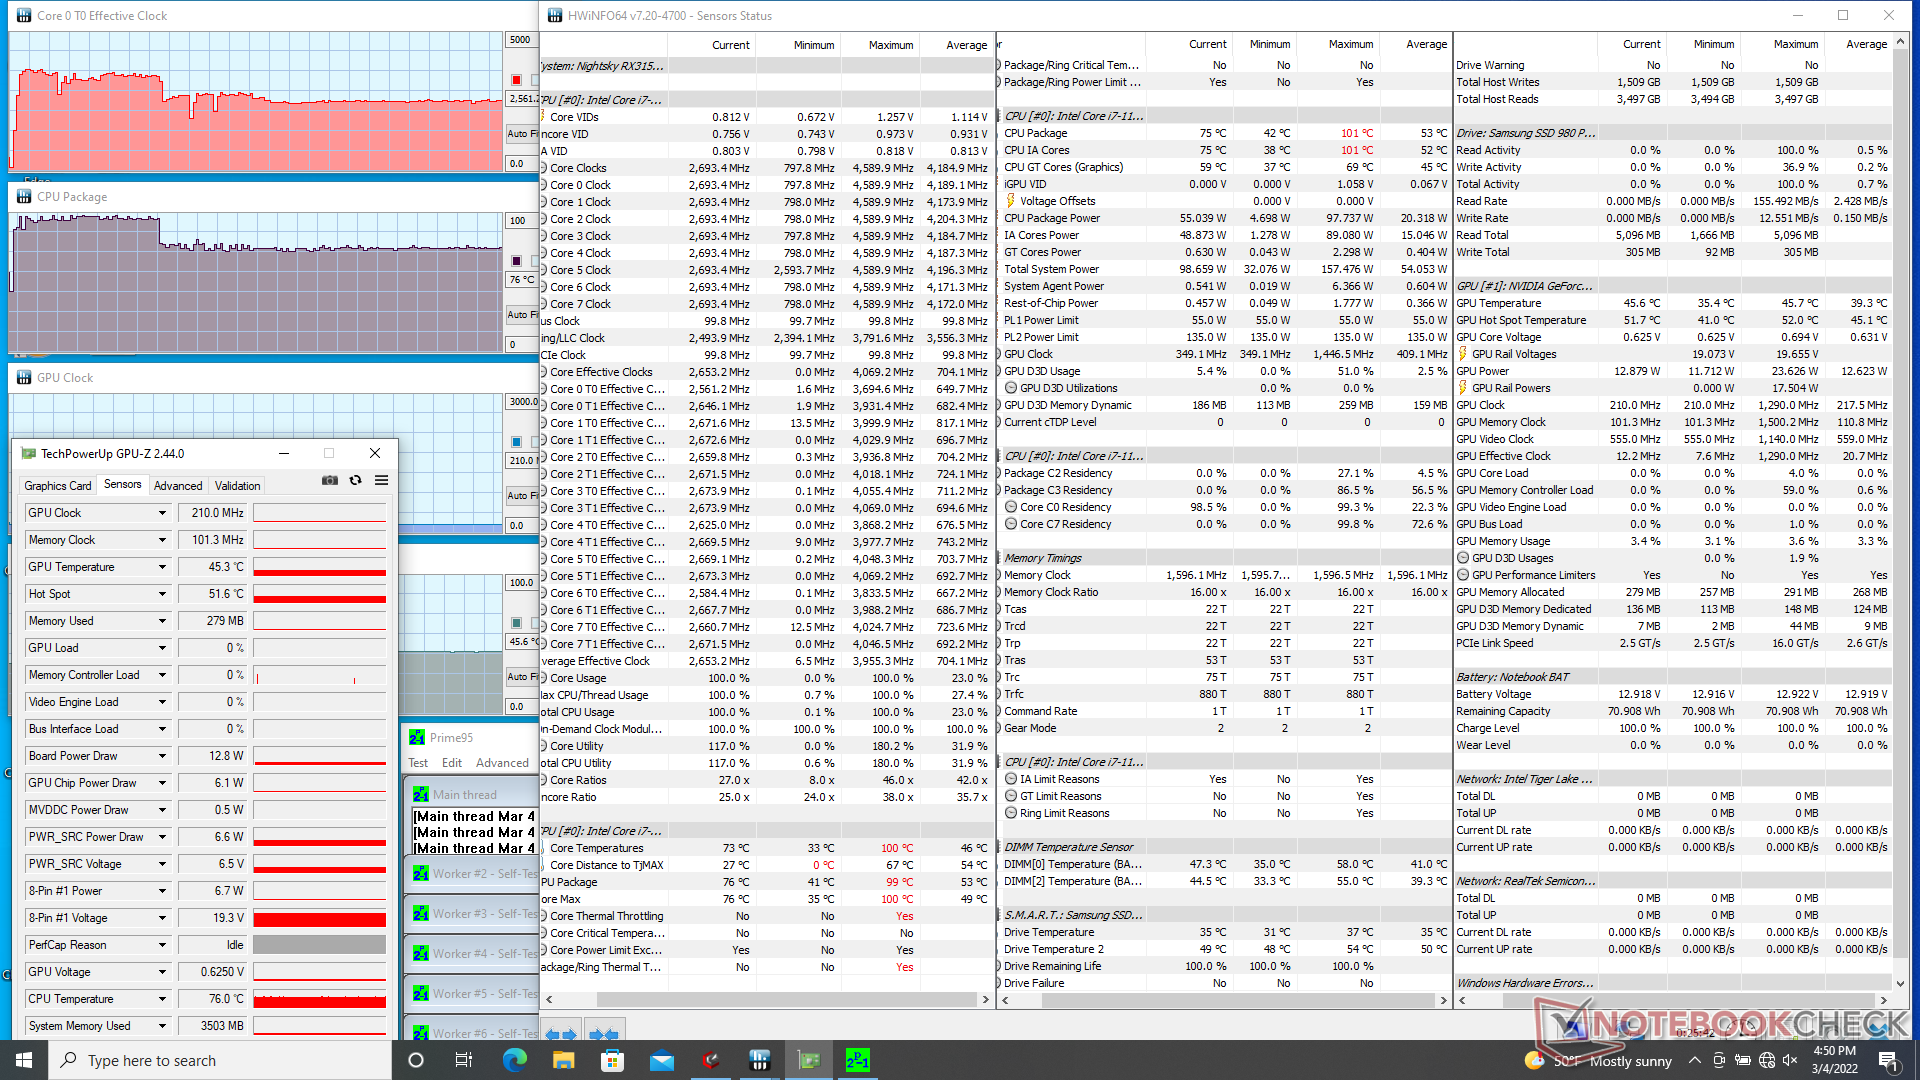
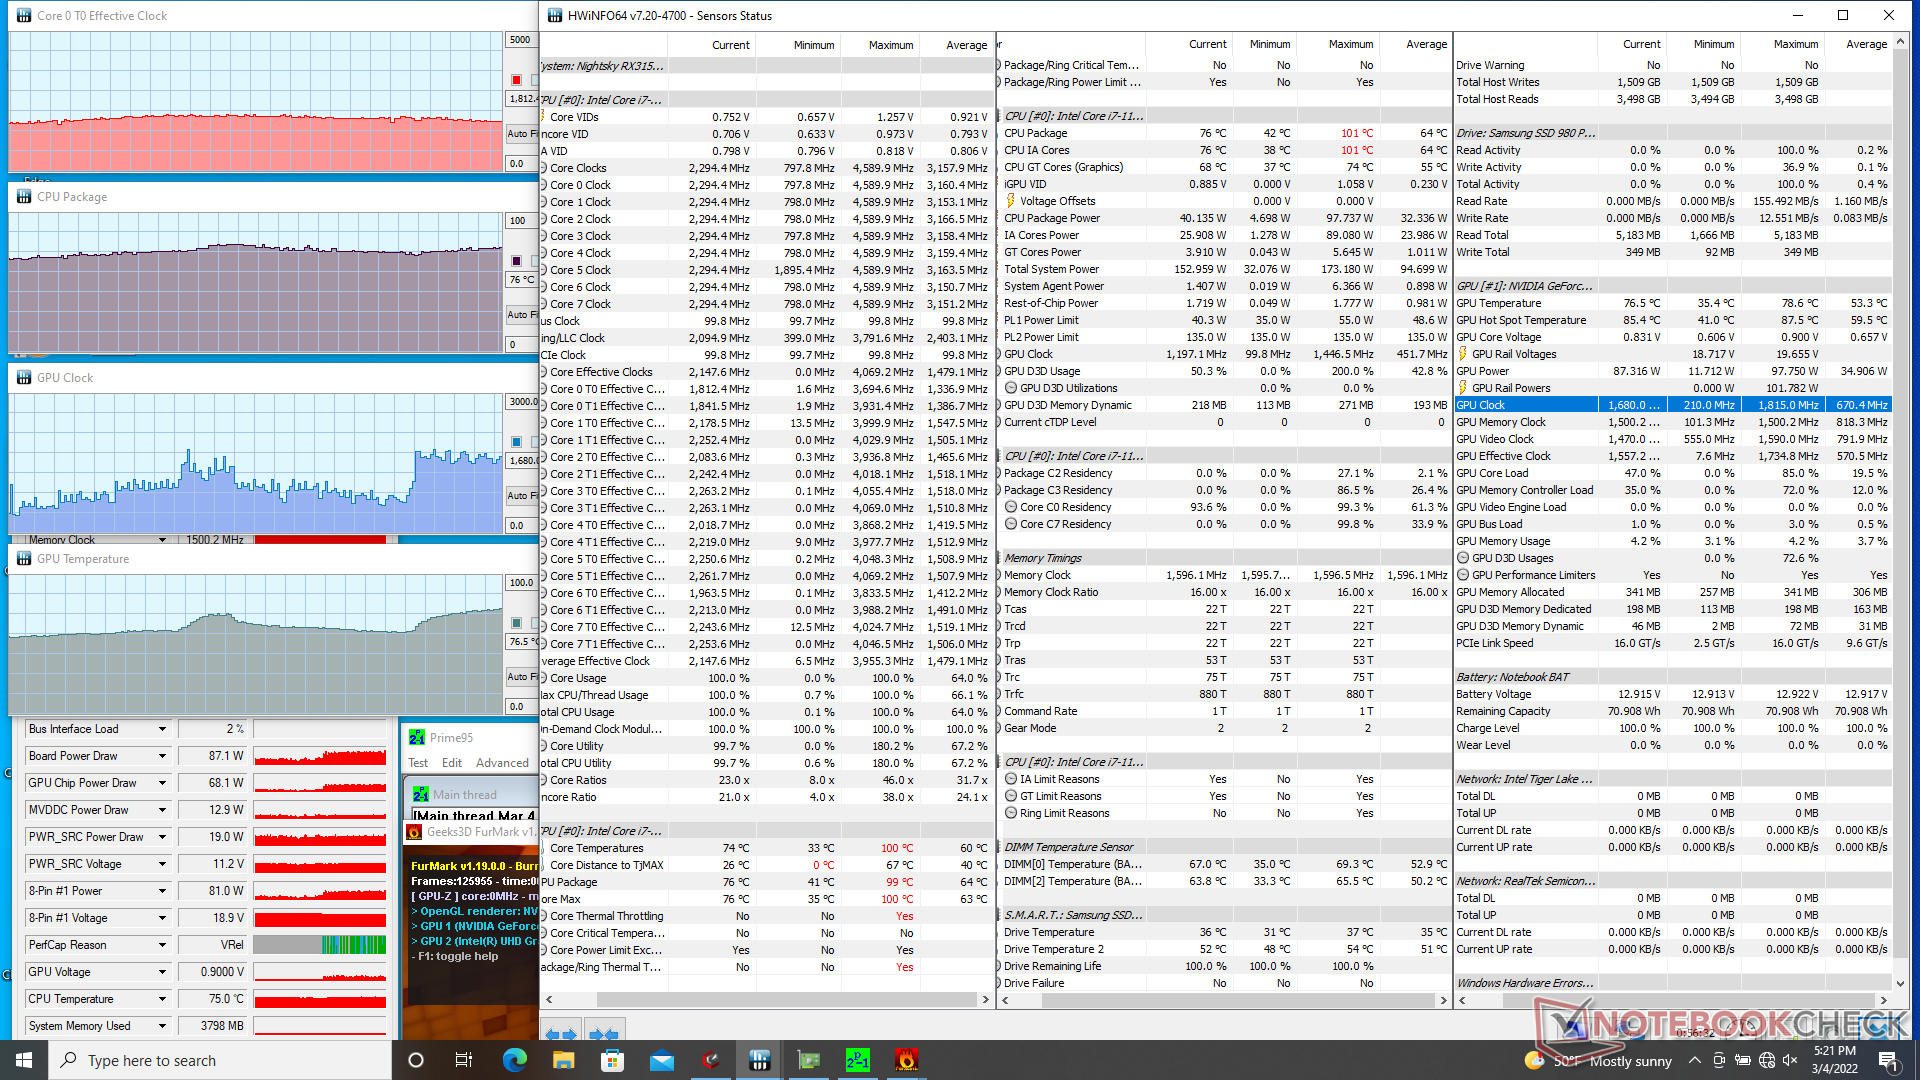
| CPU-klocka (GHz) | GPU-klocka (MHz) | Genomsnittlig CPU-temperatur (°C) | Genomsnittlig GPU-temperatur (°C) | |
| Systemets tomgång | -- | -- | 43 | 36 |
| Prime95 Stress | 2.6 | -- | 76 | 46 |
| Prime95 + FurMark Stress | 1.6 - 2.1 | 700 - 1800 | 70 - 78 | 60 - 77 |
| Witcher 3 Stress | ~1,0 | 1575 | 74 | 87 |
Högtalare
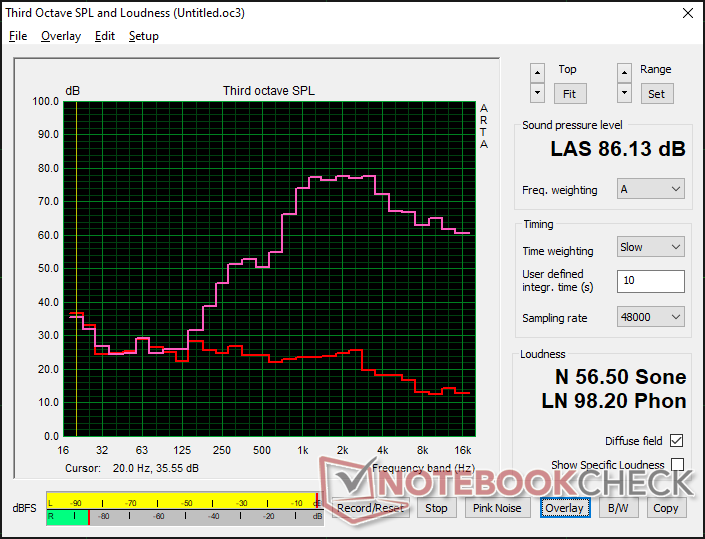
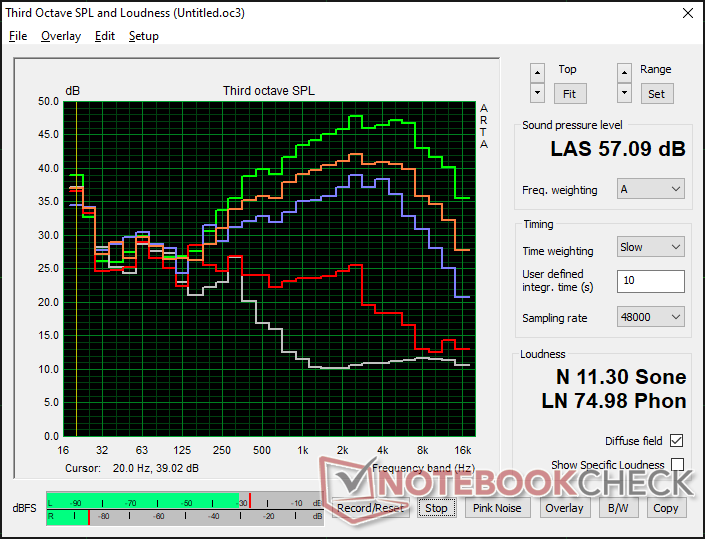
Eurocom RX315 NH57AF1 ljudanalys
(+) | högtalare kan spela relativt högt (86.1 dB)
Bas 100 - 315 Hz
(-) | nästan ingen bas - i genomsnitt 26.3% lägre än medianen
(±) | linjäriteten för basen är genomsnittlig (11.2% delta till föregående frekvens)
Mellan 400 - 2000 Hz
(±) | högre mellan - i genomsnitt 11% högre än median
(±) | linjäriteten för mids är genomsnittlig (10.3% delta till föregående frekvens)
Högsta 2 - 16 kHz
(±) | högre toppar - i genomsnitt 6.9% högre än medianen
(+) | toppar är linjära (6.7% delta till föregående frekvens)
Totalt 100 - 16 000 Hz
(-) | det totala ljudet är inte linjärt (33.3% skillnad mot median)
Jämfört med samma klass
» 98% av alla testade enheter i den här klassen var bättre, 1% liknande, 1% sämre
» Den bästa hade ett delta på 6%, genomsnittet var 18%, sämst var 132%
Jämfört med alla testade enheter
» 92% av alla testade enheter var bättre, 1% liknande, 6% sämre
» Den bästa hade ett delta på 4%, genomsnittet var 23%, sämst var 134%
Apple MacBook Pro 16 2021 M1 Pro ljudanalys
(+) | högtalare kan spela relativt högt (84.7 dB)
Bas 100 - 315 Hz
(+) | bra bas - bara 3.8% från medianen
(+) | basen är linjär (5.2% delta till föregående frekvens)
Mellan 400 - 2000 Hz
(+) | balanserad mellan - endast 1.3% från medianen
(+) | mids är linjära (2.1% delta till föregående frekvens)
Högsta 2 - 16 kHz
(+) | balanserade toppar - endast 1.9% från medianen
(+) | toppar är linjära (2.7% delta till föregående frekvens)
Totalt 100 - 16 000 Hz
(+) | det totala ljudet är linjärt (4.6% skillnad mot median)
Jämfört med samma klass
» 0% av alla testade enheter i den här klassen var bättre, 0% liknande, 100% sämre
» Den bästa hade ett delta på 5%, genomsnittet var 17%, sämst var 45%
Jämfört med alla testade enheter
» 0% av alla testade enheter var bättre, 0% liknande, 100% sämre
» Den bästa hade ett delta på 4%, genomsnittet var 23%, sämst var 134%
Energiförvaltning
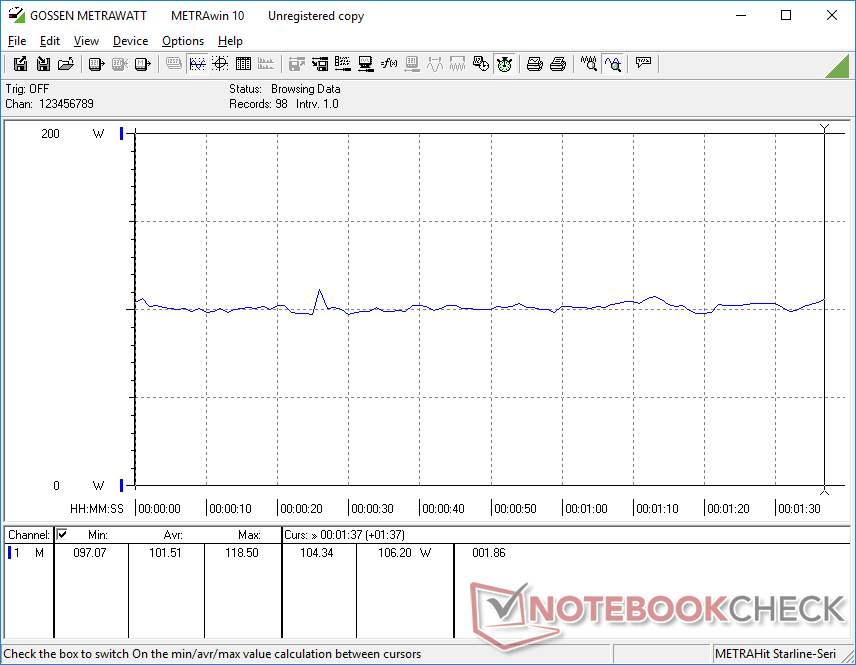
Effektförbrukning
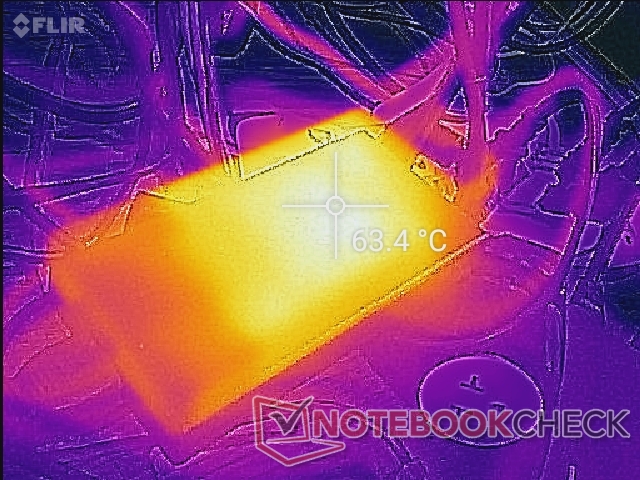
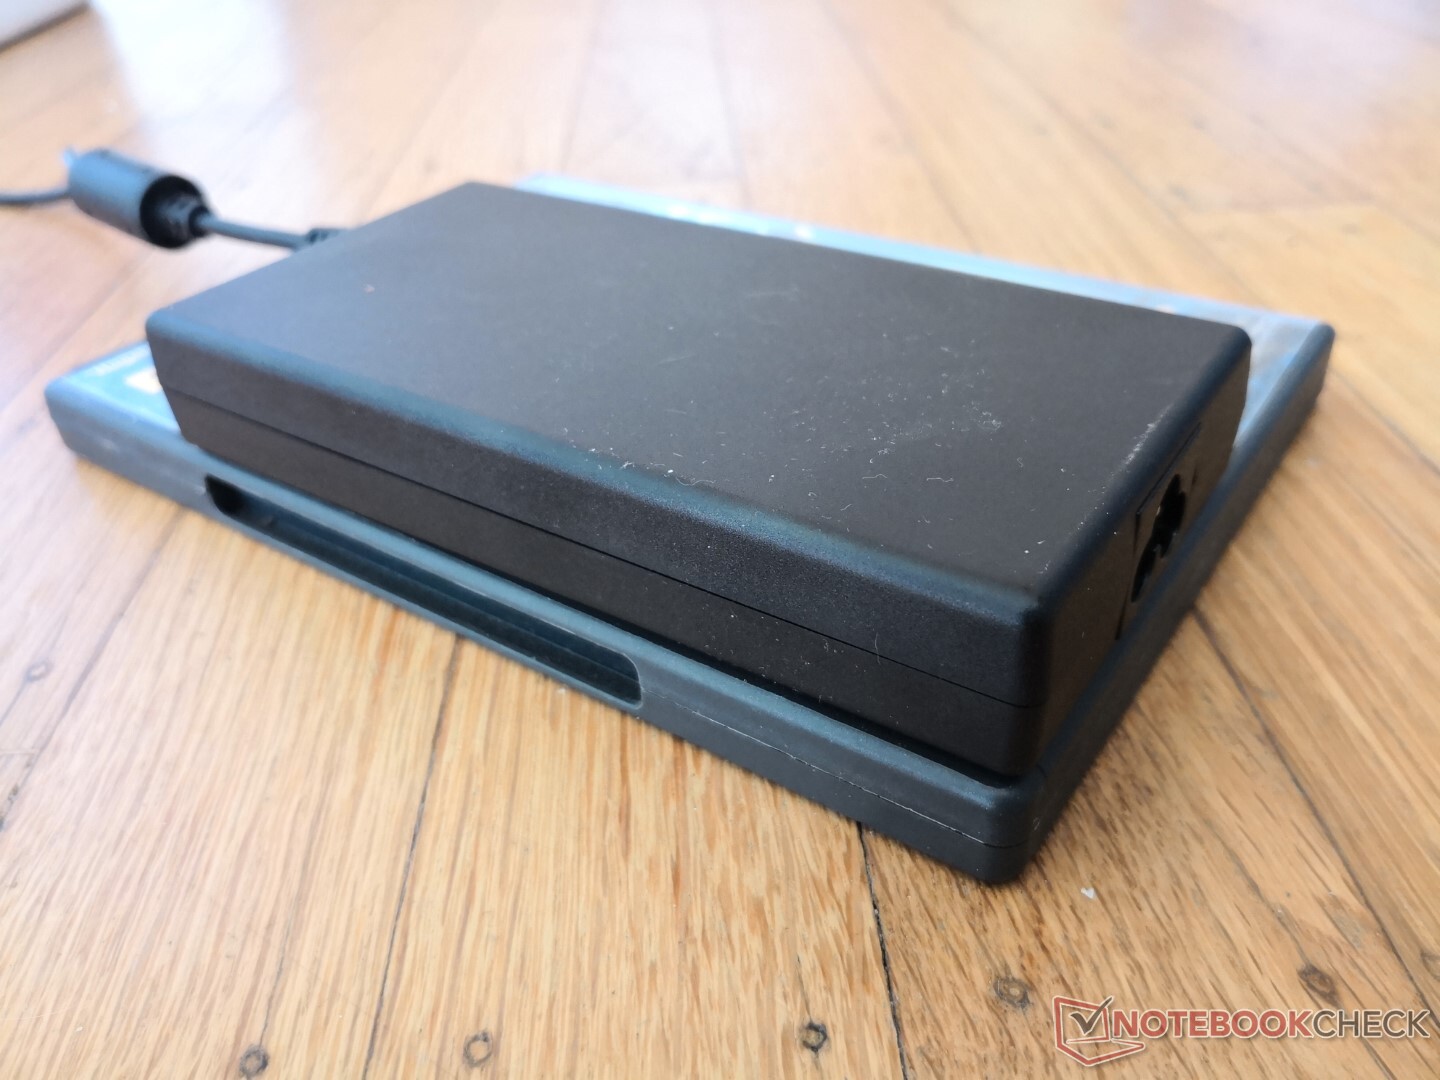
Systemet kräver mer ström än vad den begränsade 180 W AC-adaptern kan leverera. När du kör Witcher 3den lilla adaptern på 180 W (~14,5 x 7,4 x 2,5 cm) är definitivt mer portabel än de flesta andra nätadaptrar för bärbara datorer för spel, men en större och mer kapabel adapter hade potentiellt kunnat möjliggöra högre uthållig prestanda och snabbare laddningshastighet vid spel.
| Av/Standby | |
| Låg belastning | |
| Hög belastning |
|
Förklaring:
min: | |
| Eurocom RX315 NH57AF1 i7-11800H, GeForce RTX 3070 Laptop GPU, Samsung SSD 980 Pro 1TB MZ-V8P1T0BW, IPS, 1920x1080, 15.6" | MSI Stealth GS66 12UGS i7-12700H, GeForce RTX 3070 Ti Laptop GPU, WDC PC SN810 1TB, IPS-Level, 2560x1440, 15.6" | Eurocom Nightsky ARX315 R9 5900X, GeForce RTX 3070 Laptop GPU, Samsung SSD 980 Pro 1TB MZ-V8P1T0BW, IPS, 1920x1080, 15.6" | Alienware m15 R6, i7-11800H RTX 3080 i7-11800H, GeForce RTX 3080 Laptop GPU, Samsung PM9A1 MZVL21T0HCLR, IPS, 1920x1080, 15.6" | Dell G15 5515 R7 5800H, GeForce RTX 3050 Ti Laptop GPU, Samsung PM991a MZ9LQ512HBLU-00BD1, IPS, 1920x1080, 15.6" | Razer Blade 15 Advanced (Mid 2021) i7-11800H, GeForce RTX 3080 Laptop GPU, SSSTC CA6-8D1024, IPS, 1920x1080, 15.6" | |
|---|---|---|---|---|---|---|
| Power Consumption | 8% | -141% | 1% | 35% | -17% | |
| Idle Minimum * (Watt) | 12.7 | 11 13% | 55 -333% | 14 -10% | 5 61% | 19.5 -54% |
| Idle Average * (Watt) | 16.4 | 16 2% | 68.2 -316% | 18 -10% | 9 45% | 23.3 -42% |
| Idle Maximum * (Watt) | 36.1 | 23 36% | 72.5 -101% | 29 20% | 20 45% | 40.1 -11% |
| Load Average * (Watt) | 101.5 | 110 -8% | 149.2 -47% | 93 8% | 94 7% | 98.9 3% |
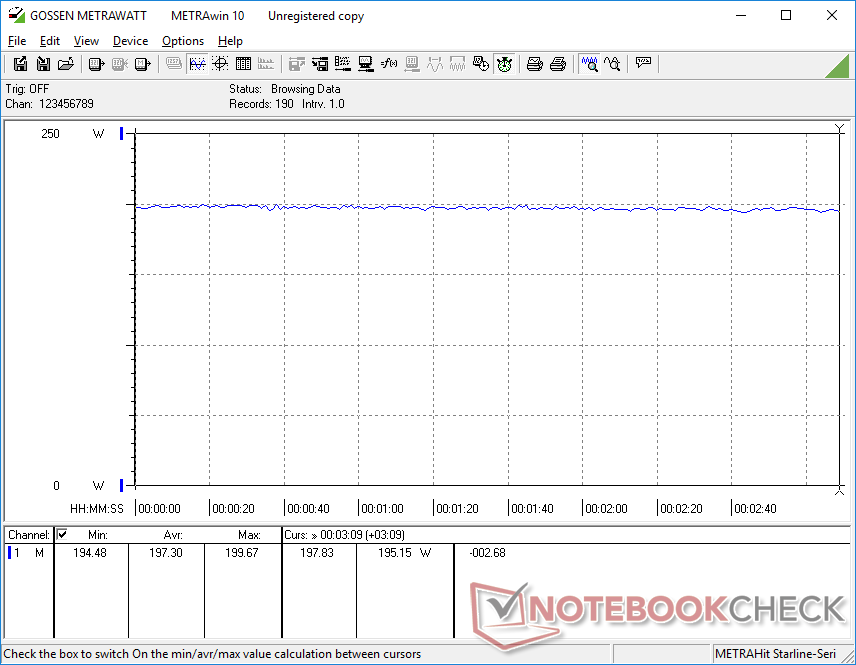
| Witcher 3 ultra * (Watt) | 197 | 151 23% | 233 -18% | 190 4% | 123 38% | 174 12% |
| Load Maximum * (Watt) | 196.1 | 230 -17% | 255.8 -30% | 203 -4% | 172 12% | 214 -9% |
* ... mindre är bättre
Power Consumption Witcher 3 / Stresstest
Power Consumption external Monitor
Batteritid
Räkna med knappt 5 timmars WLAN-användning på den balanserade profilen med den integrerade GPU:n aktiv. Laddning med den medföljande nätadaptern tar ungefär 2,5 timmar, men detta kommer att sakta ner när du kör spel på grund av den låga effekten på 180 W. Laddning via USB-C-adaptrar stöds inte.
| Eurocom RX315 NH57AF1 i7-11800H, GeForce RTX 3070 Laptop GPU, 71 Wh | MSI Stealth GS66 12UGS i7-12700H, GeForce RTX 3070 Ti Laptop GPU, 99.9 Wh | Eurocom Nightsky ARX315 R9 5900X, GeForce RTX 3070 Laptop GPU, 62 Wh | Alienware m15 R6, i7-11800H RTX 3080 i7-11800H, GeForce RTX 3080 Laptop GPU, 84 Wh | Dell G15 5515 R7 5800H, GeForce RTX 3050 Ti Laptop GPU, 56 Wh | Razer Blade 15 Advanced (Mid 2021) i7-11800H, GeForce RTX 3080 Laptop GPU, 80 Wh | |
|---|---|---|---|---|---|---|
| Batteridrifttid | 13% | -79% | 4% | 67% | 23% | |
| WiFi v1.3 (h) | 4.8 | 5.4 13% | 1 -79% | 5 4% | 8 67% | 5.9 23% |
| Reader / Idle (h) | 7.8 | 13.5 | ||||
| Load (h) | 1.6 | 1.6 | 1.5 | |||
| H.264 (h) | 5.6 | 8.8 |
För
Emot
Dom
De viktigaste fördelarna med Eurocom RX315 jämfört med konkurrerande ultratunna bärbara datorer för spel, t.ex Razer Blade 15 eller MSI GS66 är dess lägre vikt och enklare service. Ägarna kan enkelt installera upp till två M.2 SSD-diskar jämfört med bara en på Blade 15 medan GS66 är både en större och tyngre modell totalt sett. Dessa egenskaper kan vara önskvärda för användare som reser mycket och har en andra M.2 SSD som de vill installera.
Stark ultratunn utförare med enkel service och bekväma tangentbordstangenter.
Kylningslösningen och batteriet på RX315 är inte lika effektiva respektive stora som på de tidigare nämnda alternativen från Razer eller MSI. Fläktljudet är därför högre på Eurocom för att kompensera medan batteritiden generellt sett är kortare överlag. Chassiets styvhet är också ett eller två steg under Blade 15 eller GS66 för något svagare första intryck.
Pris och tillgänglighet
Eurocom Nightsky RX315 är och levereras för närvarande från 2750 USD med Core i7-11800H CPU och GeForce RTX 3070 GPU.
Eurocom RX315 NH57AF1
- 03/08/2022 v7 (old)
Allen Ngo
Price comparison

