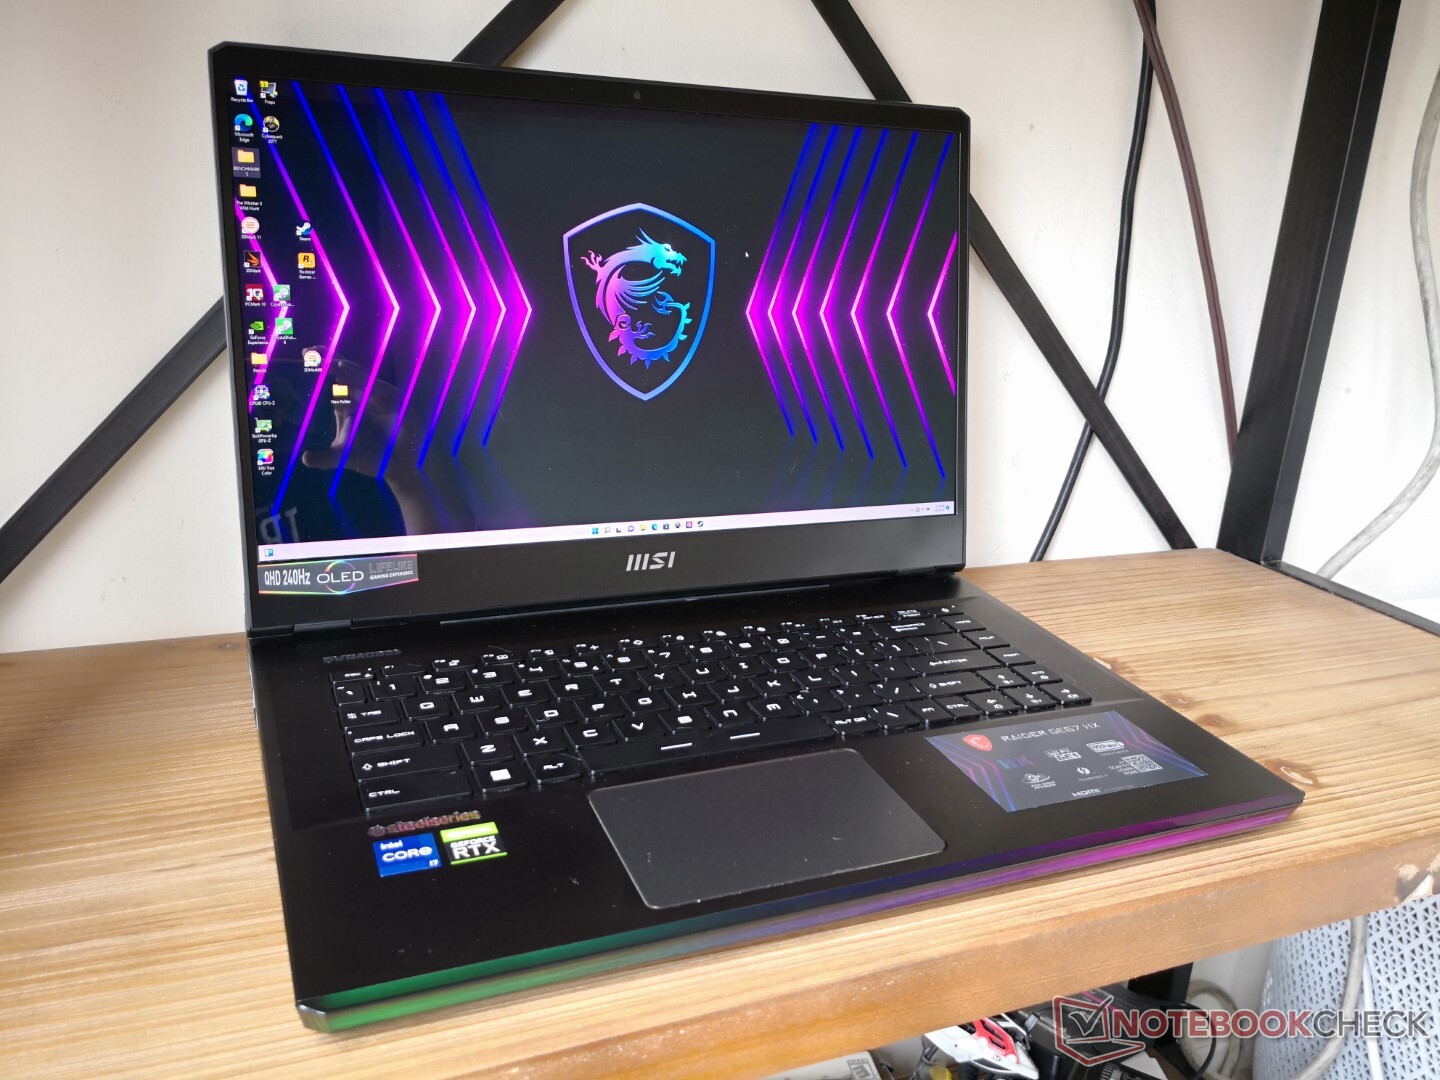
Intel Core i7-12800HX är helt galen: Recension av MSI Raider GE67 HX 12UGS
MSI GE67 är en högklassig spelserie som ligger över de billigare Katana GF- och Vector GP-serierna men under den entusiastmässiga Titan GT-serien. Vår GE67-testenhet är en direkt efterföljare till GE66 från 2020. Istället för att levereras med Intels 10:e generations Comet Lake-H CPU:er och Nvidias GeForce Super GPU:er kommer GE67 med 12:e generations Alder Lake-H CPU:er och mobila GeForce Ti GPU:er
Vi rekommenderar att du kollar in vår befintliga två recensioner om GE66 eftersom GE67 använder i stort sett samma chassidesign och funktioner. Det finns ändå några relativt små visuella skillnader som vi kommer att beskriva i detalj i vår recension nedan
Vår testenhet är utrustad med 16-kärnig Core i7-12800HX CPU, GeForce RTX 3070 Ti GPU och 240 Hz QHD OLED-panel med QHD som lovar full DCI-P3-täckning för cirka 2 500 USD i detaljhandelspris. Bland de direkta konkurrenterna i detta område finns andra bärbara 15,6-tums gamingdatorer av hög kvalitet som t.ex Asus ROG Strix Scar 15, Razer Blade 15, ellerAlienware m15 R6.
Fler recensioner av MSI:
Potentiella konkurrenter i jämförelse
Gradering | Datum | Modell | Vikt | Höjd | Storlek | Upplösning | Pris |
|---|---|---|---|---|---|---|---|
| 87.7 % v7 (old) | 07/2022 | MSI GE67 HX 12UGS i7-12800HX, GeForce RTX 3070 Ti Laptop GPU | 2.5 kg | 23.4 mm | 15.60" | 1920x1080 | |
| 87.4 % v7 (old) | 06/2022 | MSI Raider GE66 12UHS i9-12900HK, GeForce RTX 3080 Ti Laptop GPU | 2.4 kg | 23.4 mm | 15.60" | 3840x2160 | |
| 86.9 % v7 (old) | 03/2022 | MSI Vector GP66 12UGS i9-12900H, GeForce RTX 3070 Ti Laptop GPU | 2.3 kg | 23.4 mm | 15.60" | 1920x1080 | |
| 86.3 % v7 (old) | 06/2022 | Asus ROG Strix Scar 15 G533ZW-LN106WS i9-12900H, GeForce RTX 3070 Ti Laptop GPU | 2.3 kg | 27.2 mm | 15.60" | 2560x1440 | |
| 86.1 % v7 (old) | 11/2021 | Alienware m15 R6, i7-11800H RTX 3080 i7-11800H, GeForce RTX 3080 Laptop GPU | 2.5 kg | 22.85 mm | 15.60" | 1920x1080 | |
| 89.1 % v7 (old) | 03/2022 | Razer Blade 15 2022 i7-12800H, GeForce RTX 3080 Ti Laptop GPU | 2.1 kg | 16.99 mm | 15.60" | 2560x1440 |
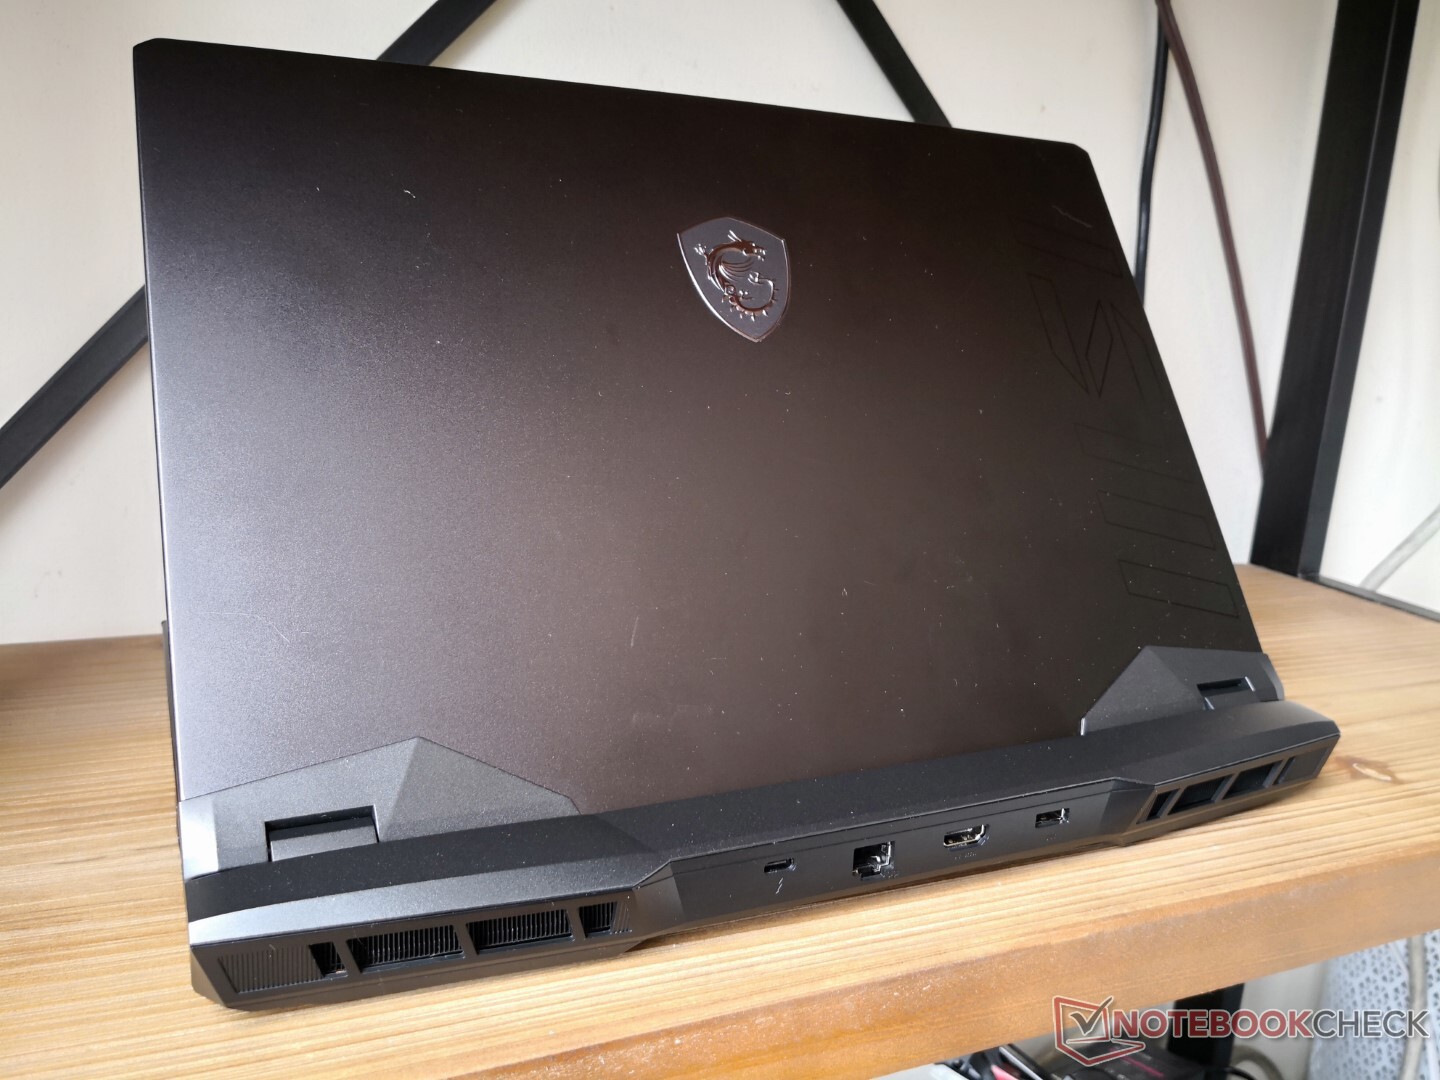
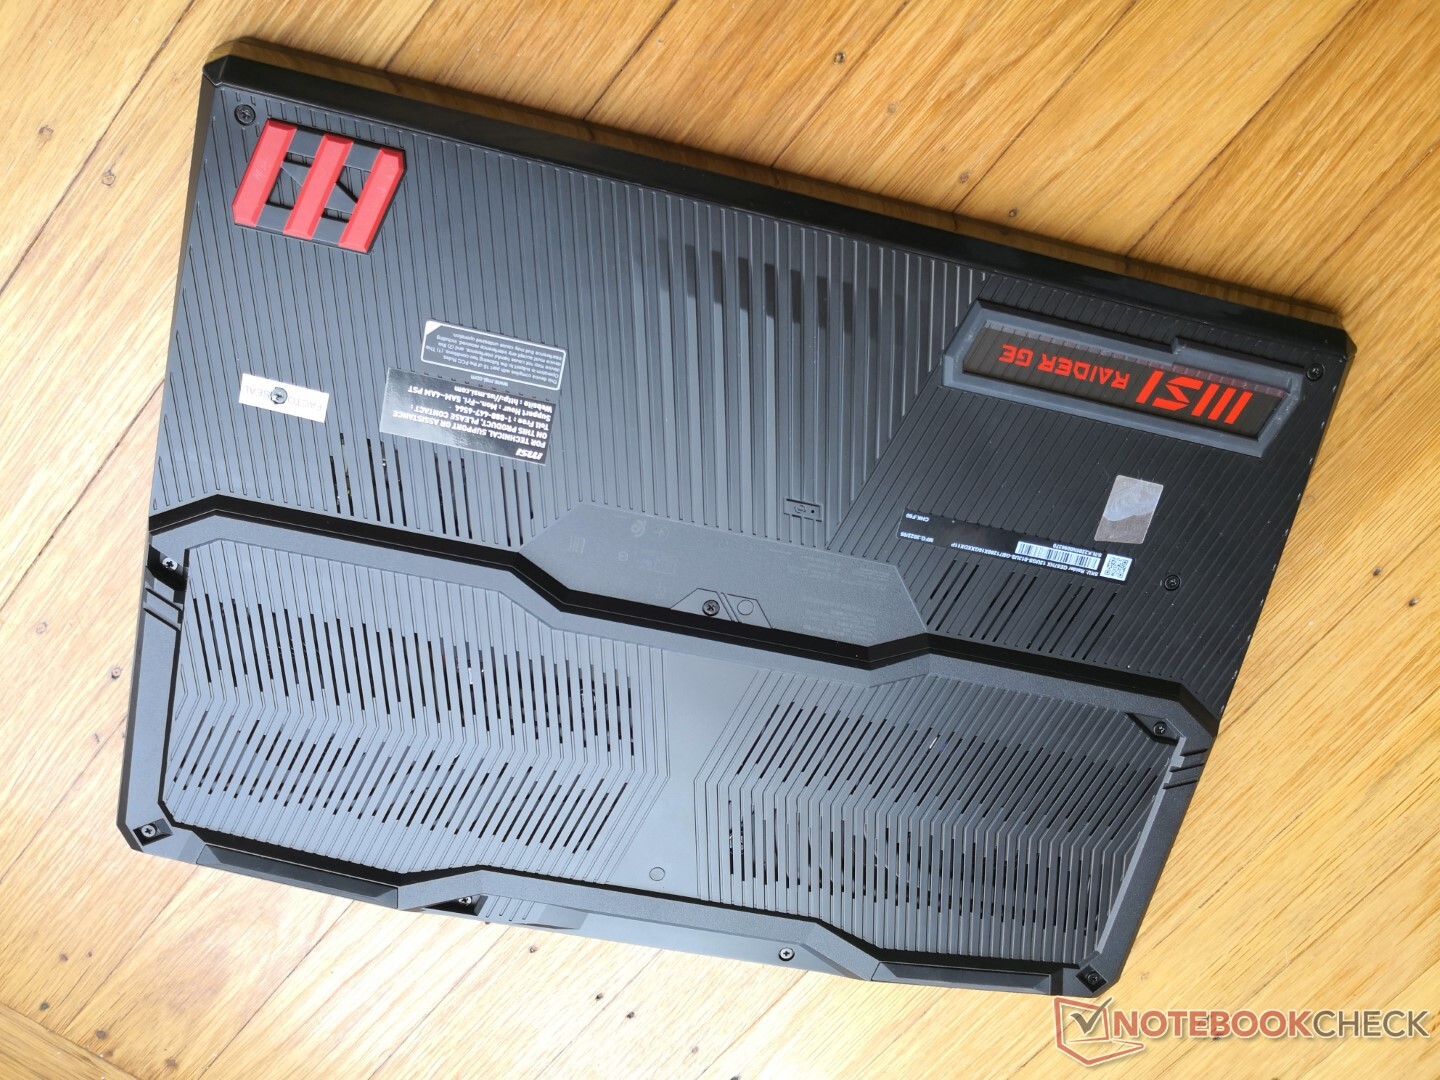
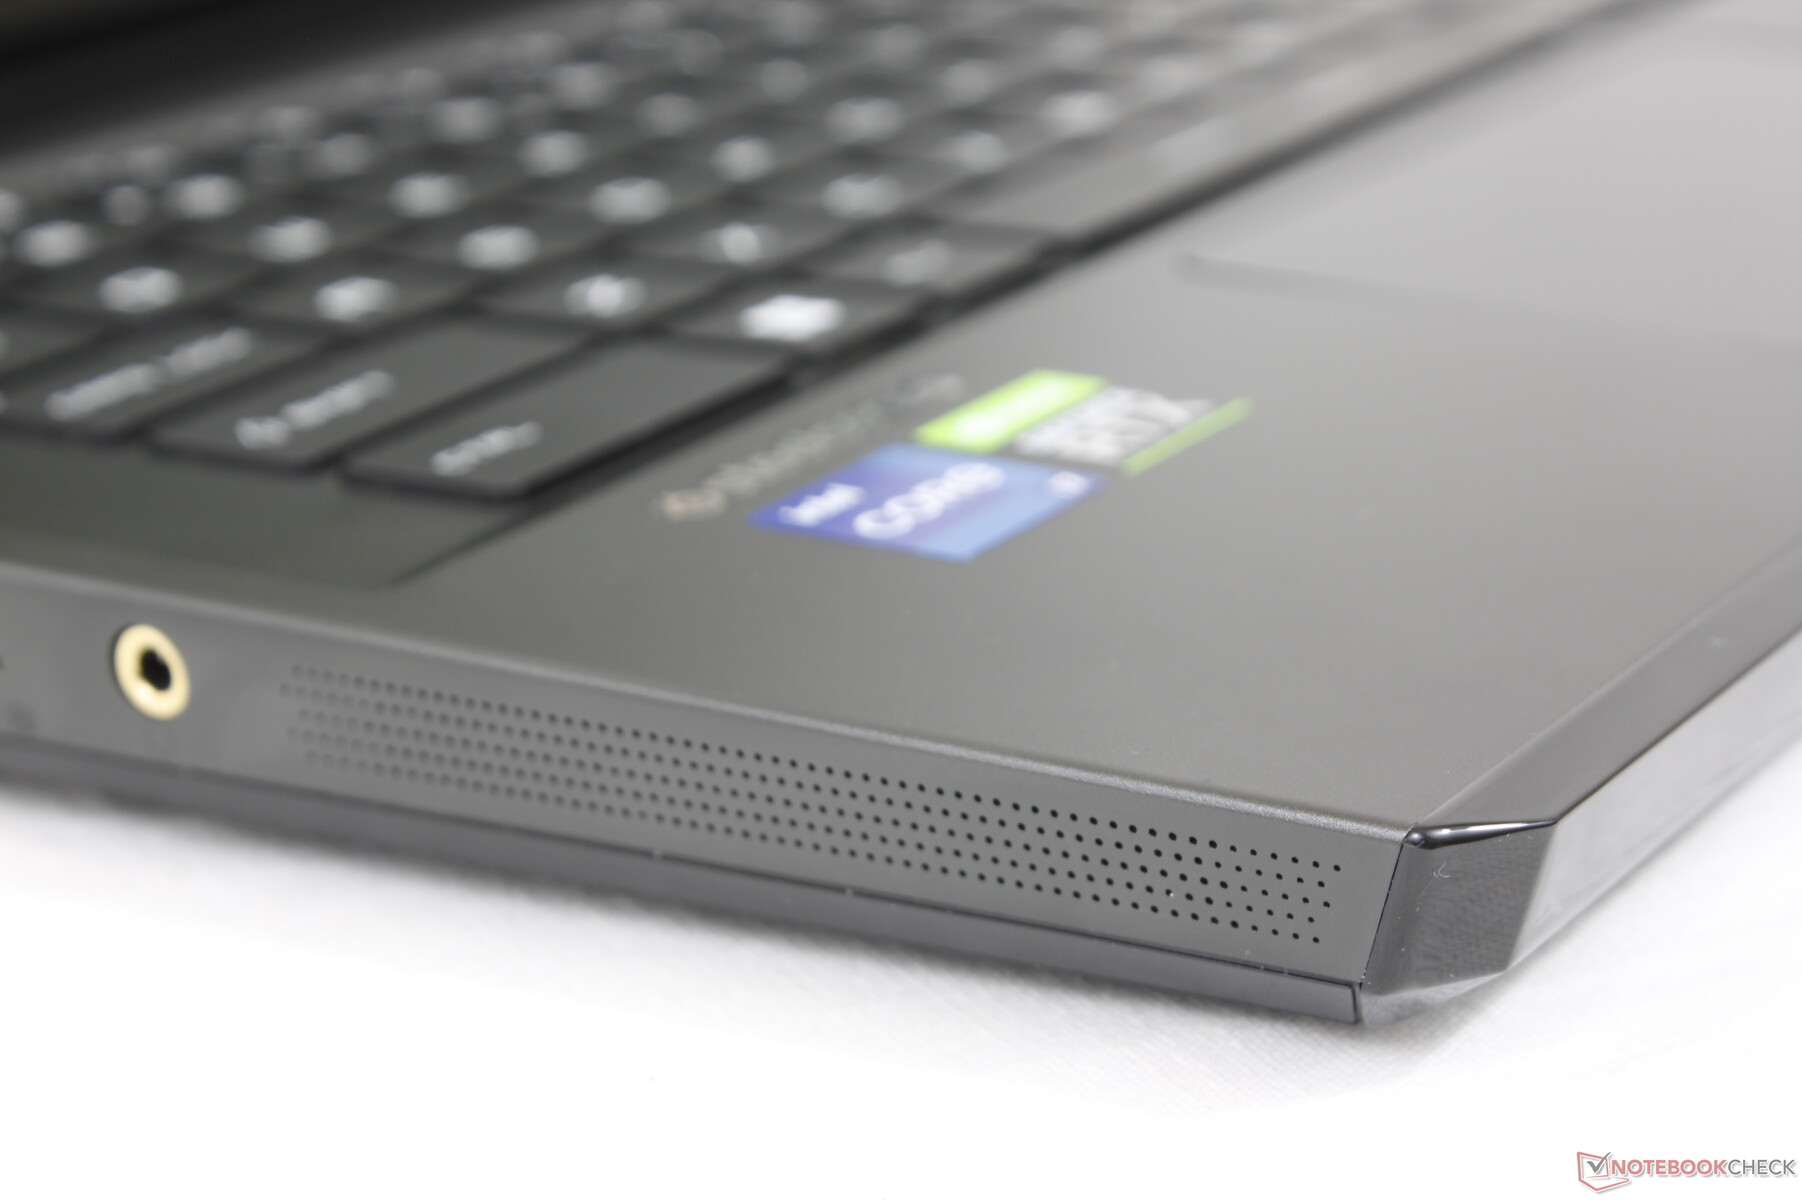
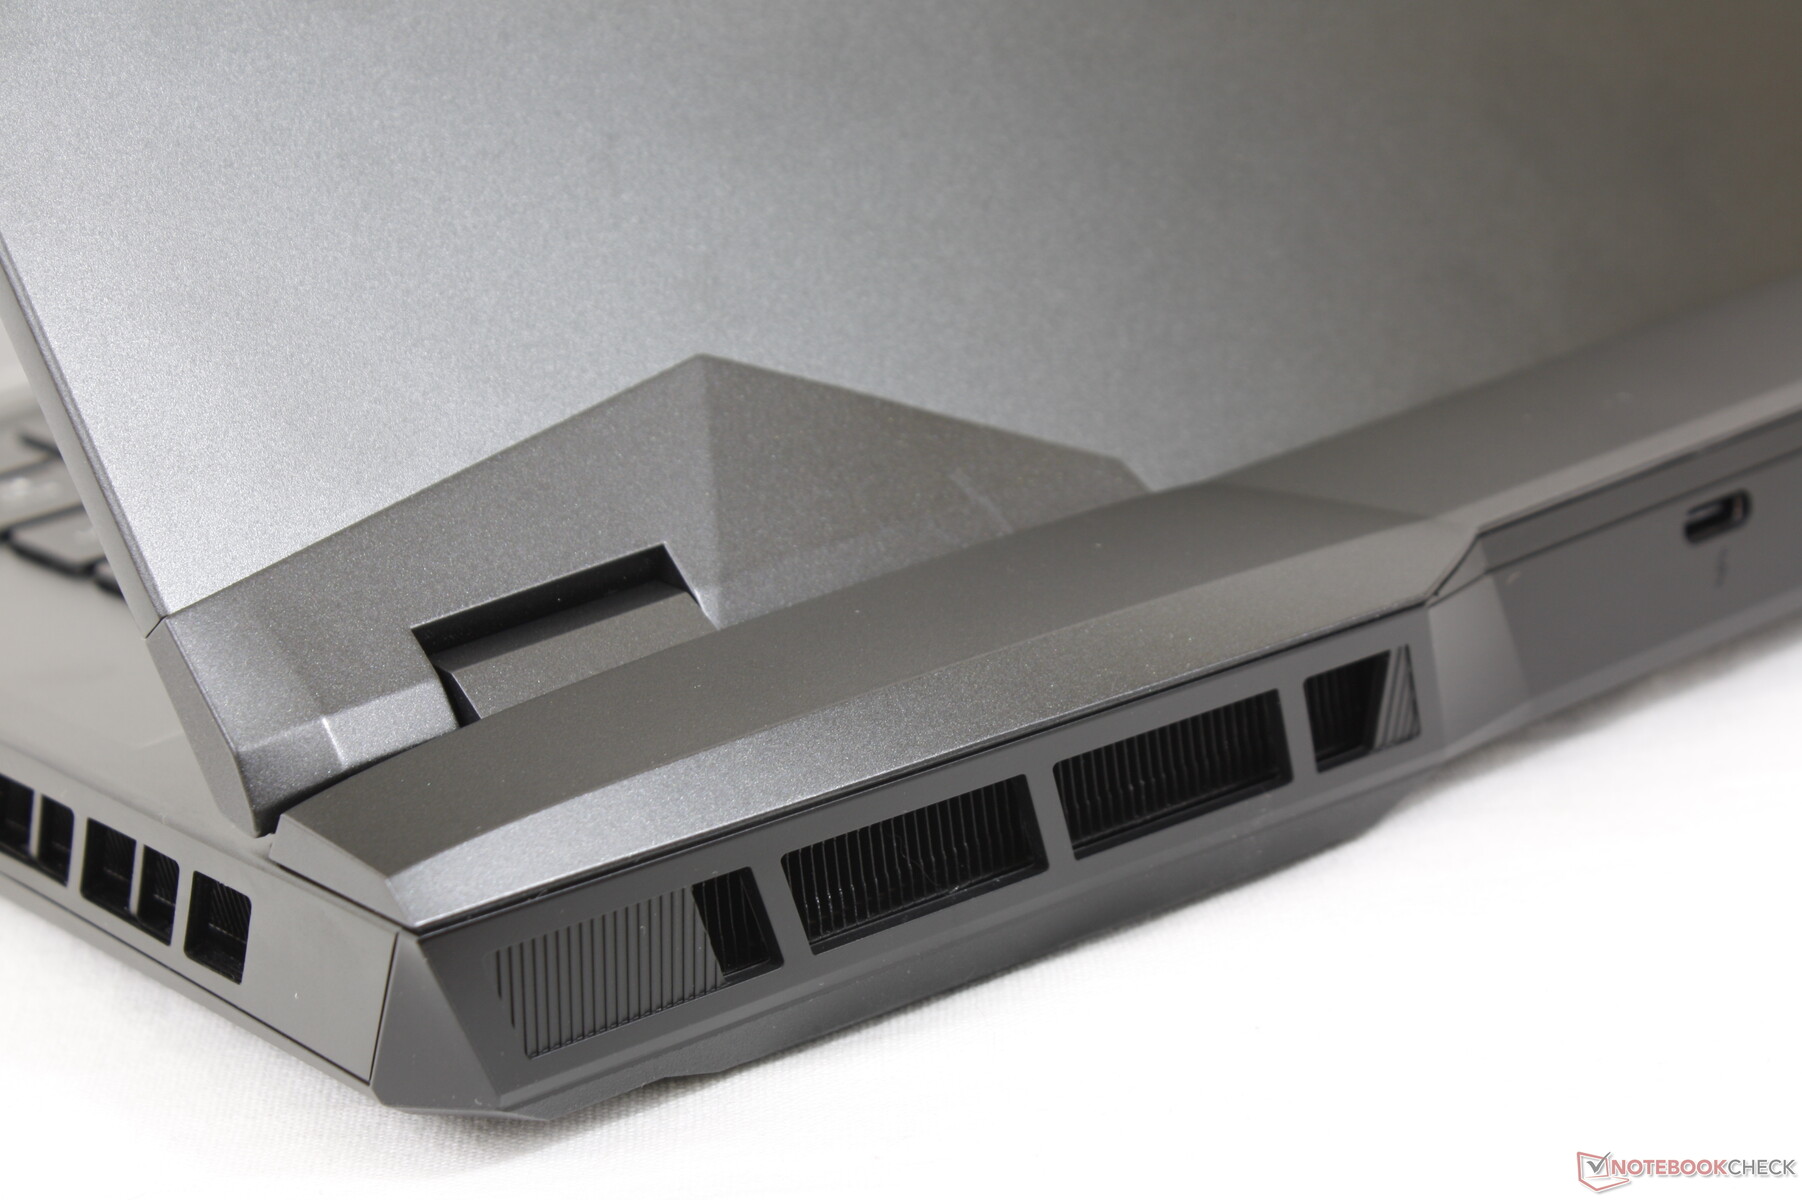
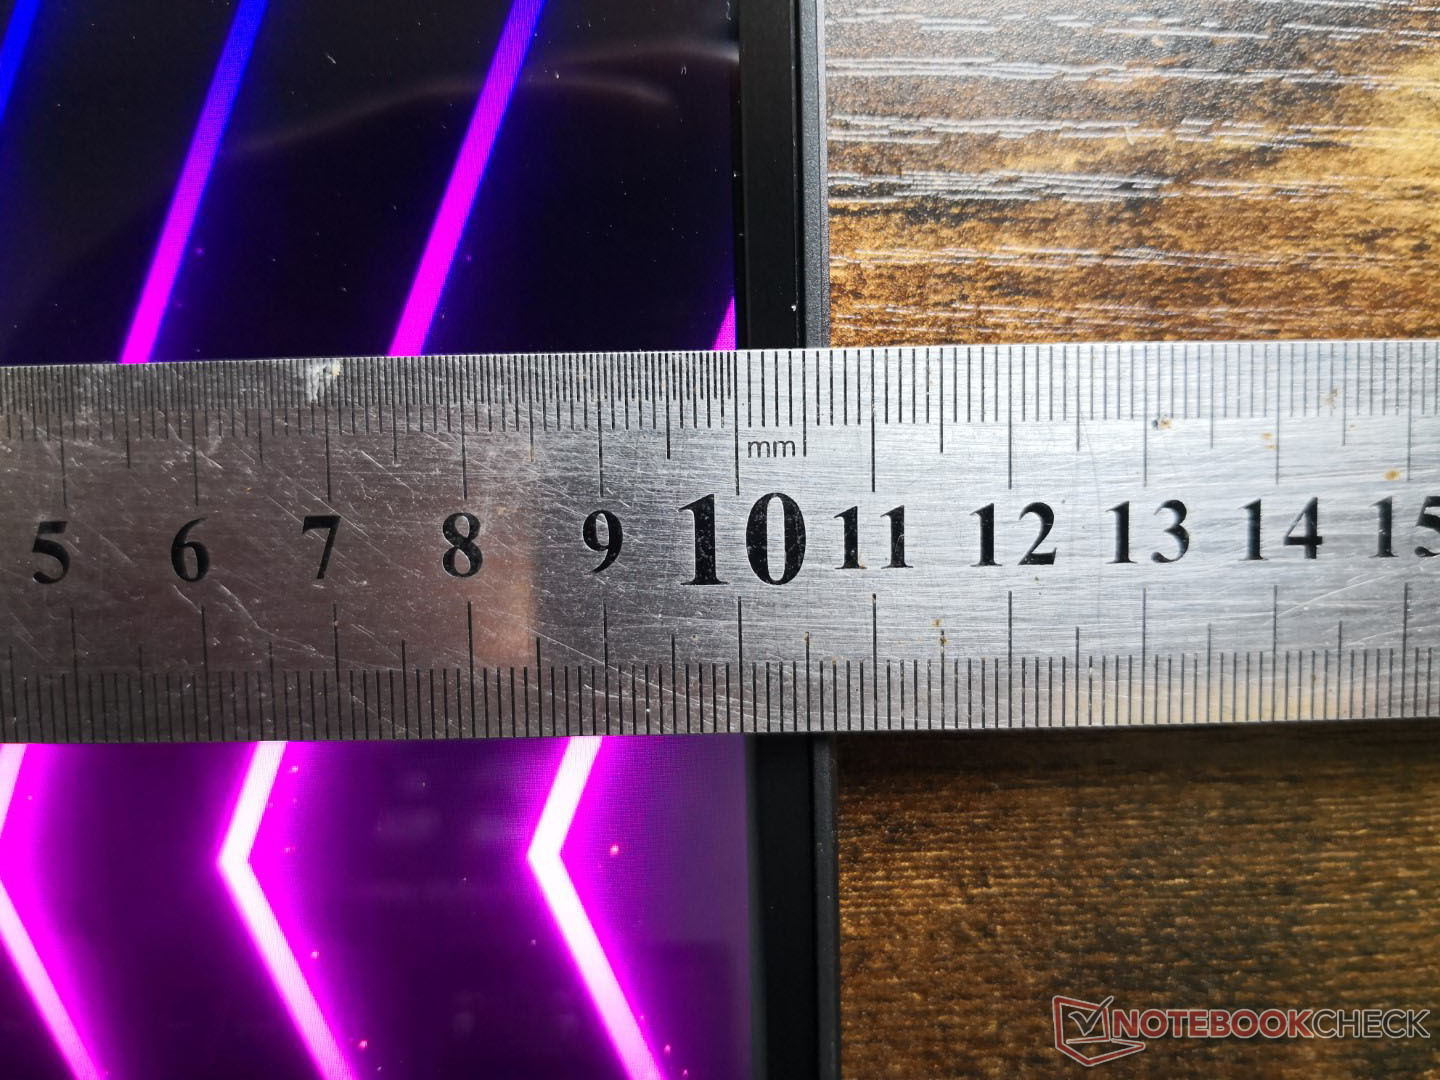
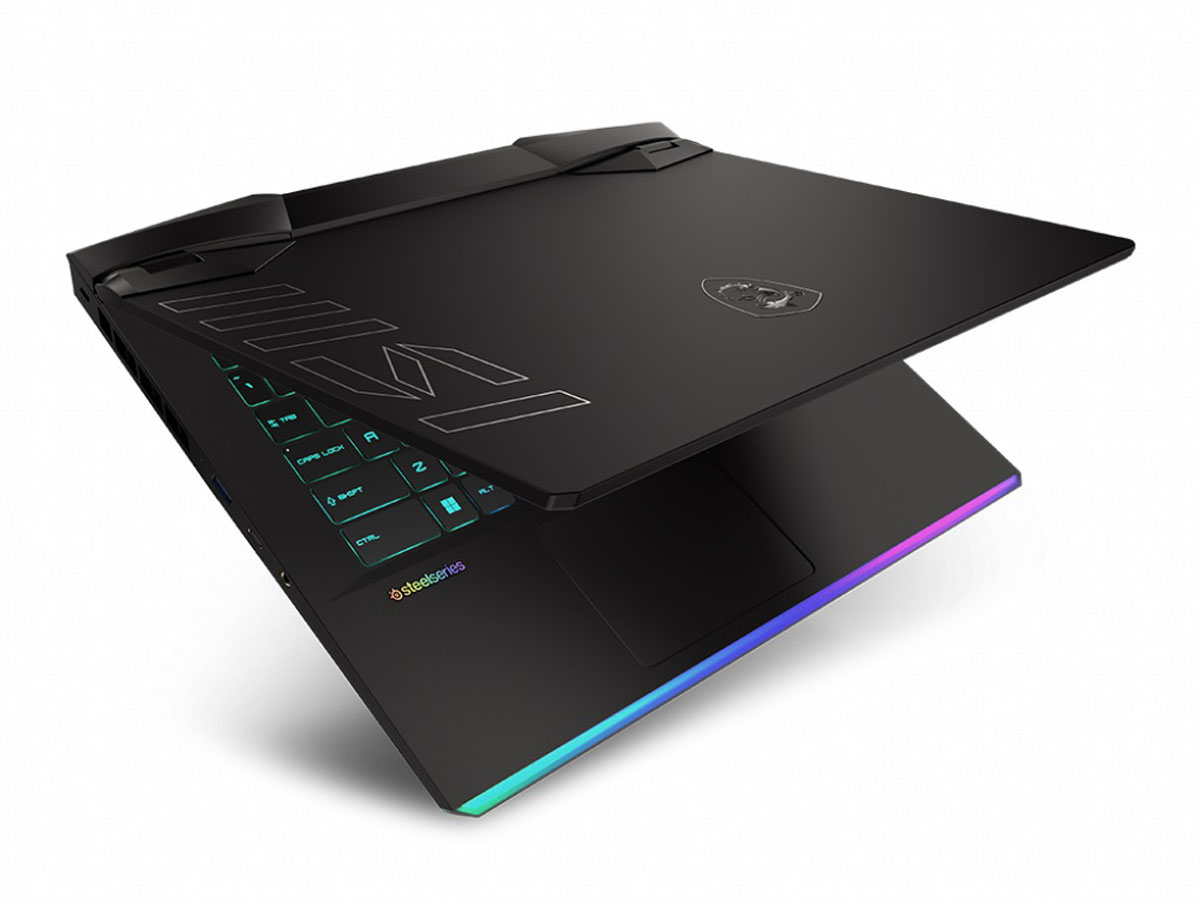
Hölje - Samma på toppen, olika på botten
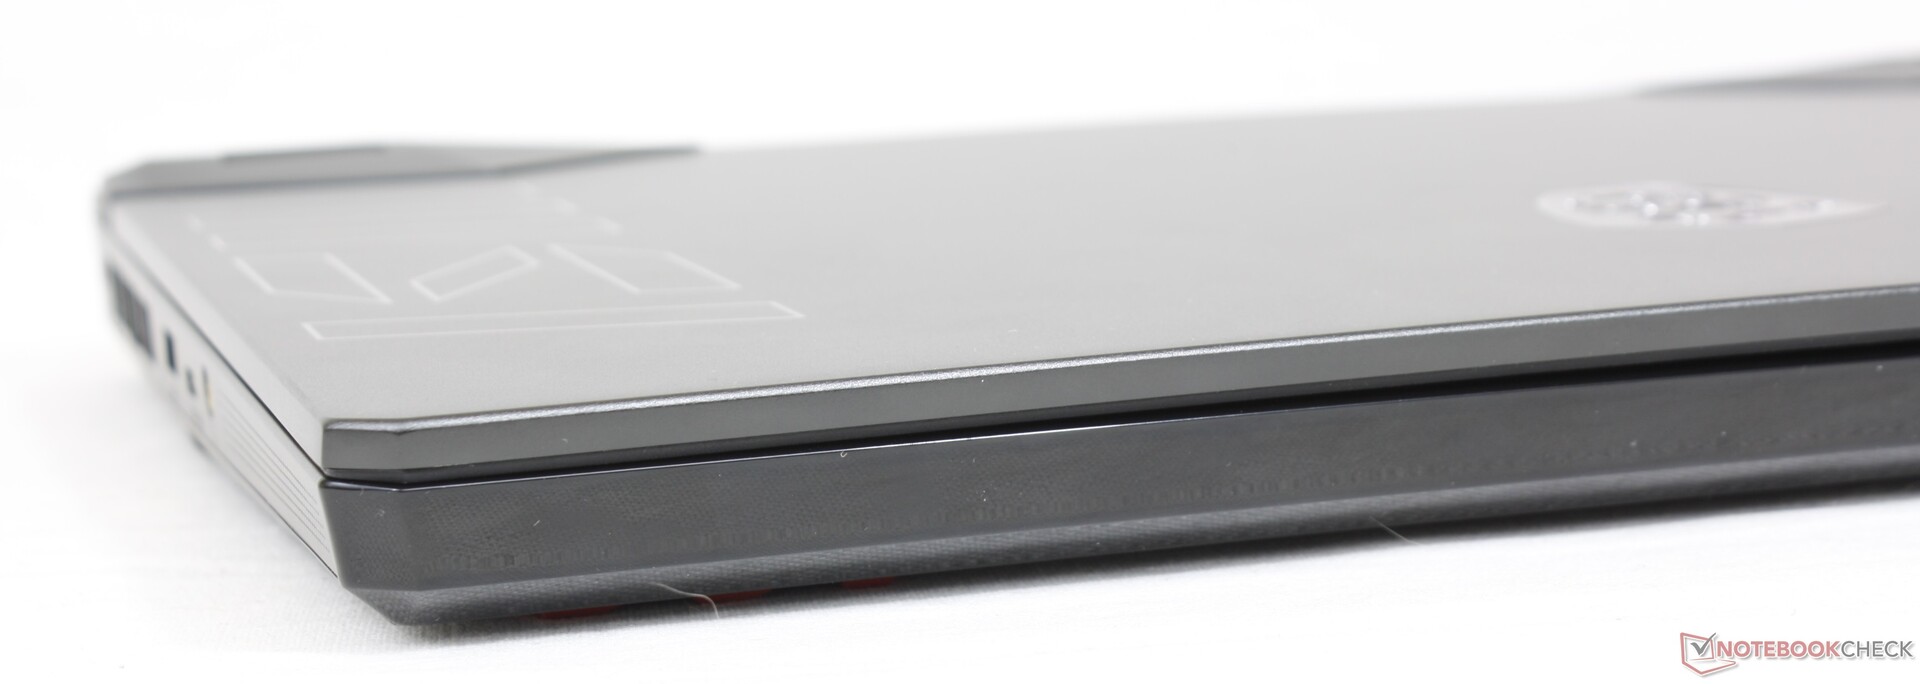
Medan chassimåtten är exakt desamma som på GE66 finns det ett antal visuella skillnader. För det första har GE67 en stor MSI-logotyp längs den vänstra kanten av det yttre locket, vilket gör det lättare att skilja mellan GE66 och GE67. För det andra har MSI helt omdesignat GE67:s undersida, sannolikt för att förbättra modellens totala kylningspotential. I övrigt använder både GE66 och GE67 liknande metallmaterial för locket och tangentbordsdäcket och plast för bottenplattan. Den karakteristiska LED-stången längs den främre kanten förblir oskadd.
Den nya modellen är något tyngre än sin föregångare med cirka 100 g sannolikt på grund av de mindre förändringarna.
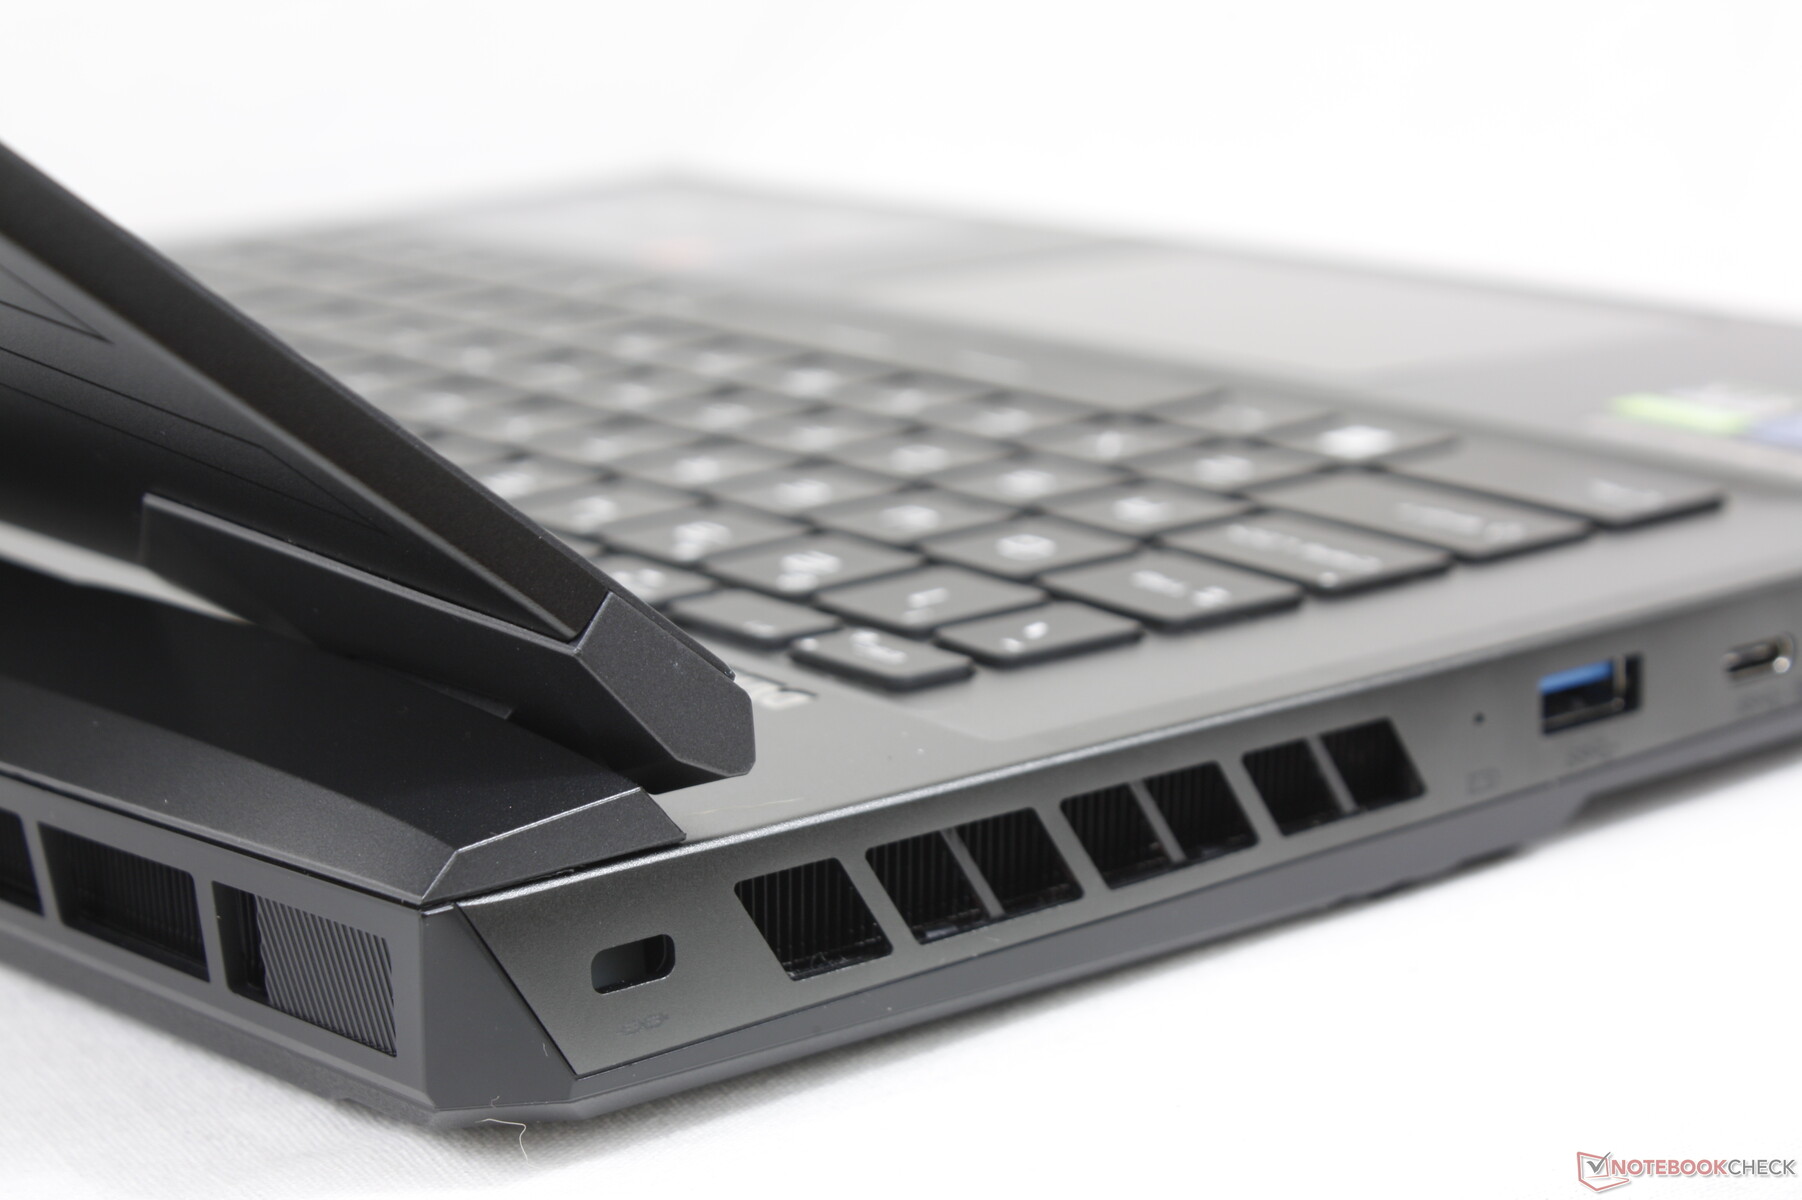
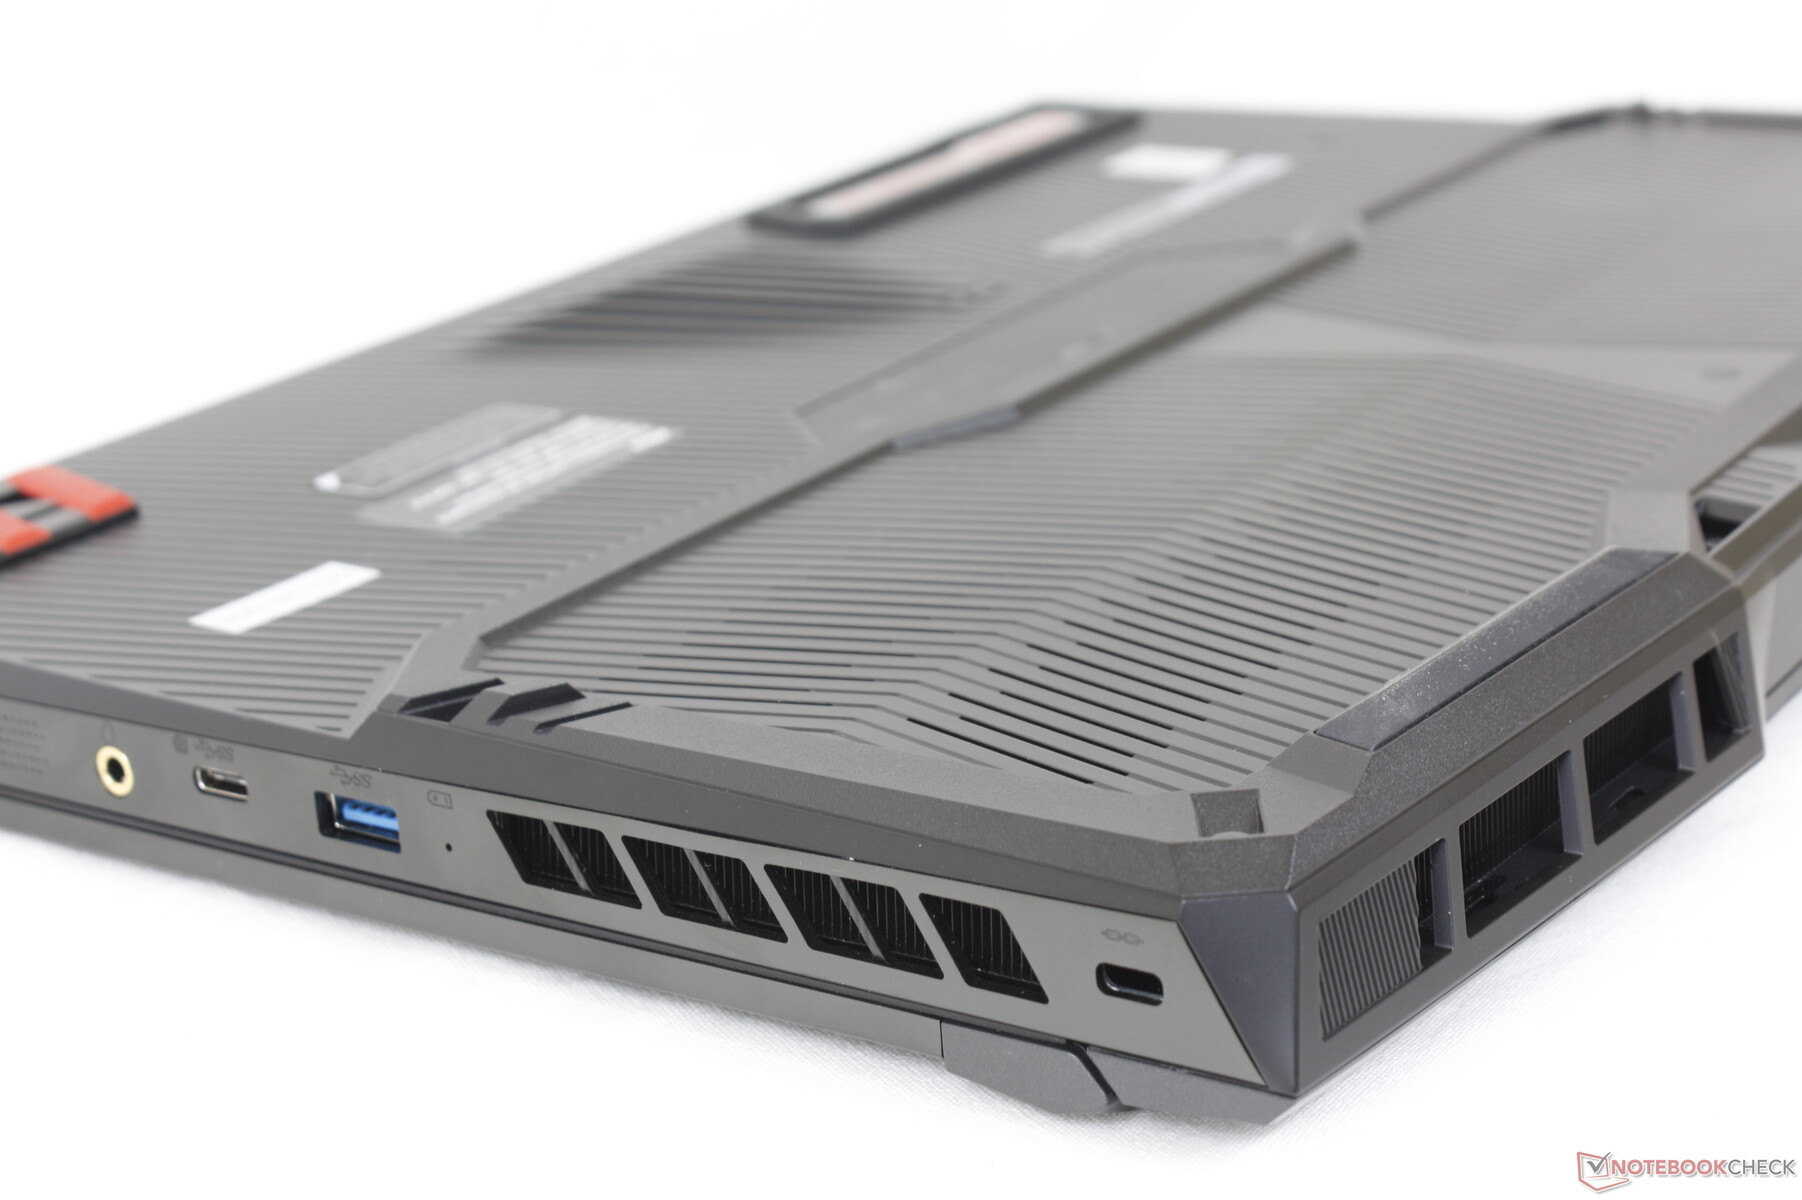
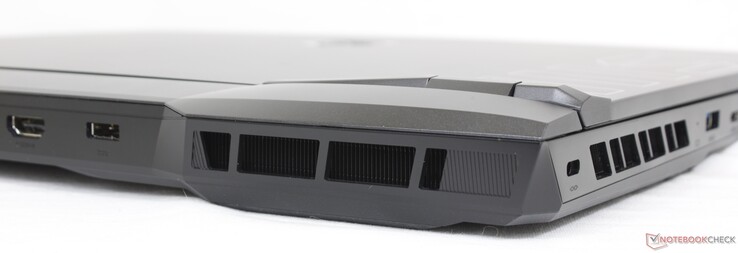
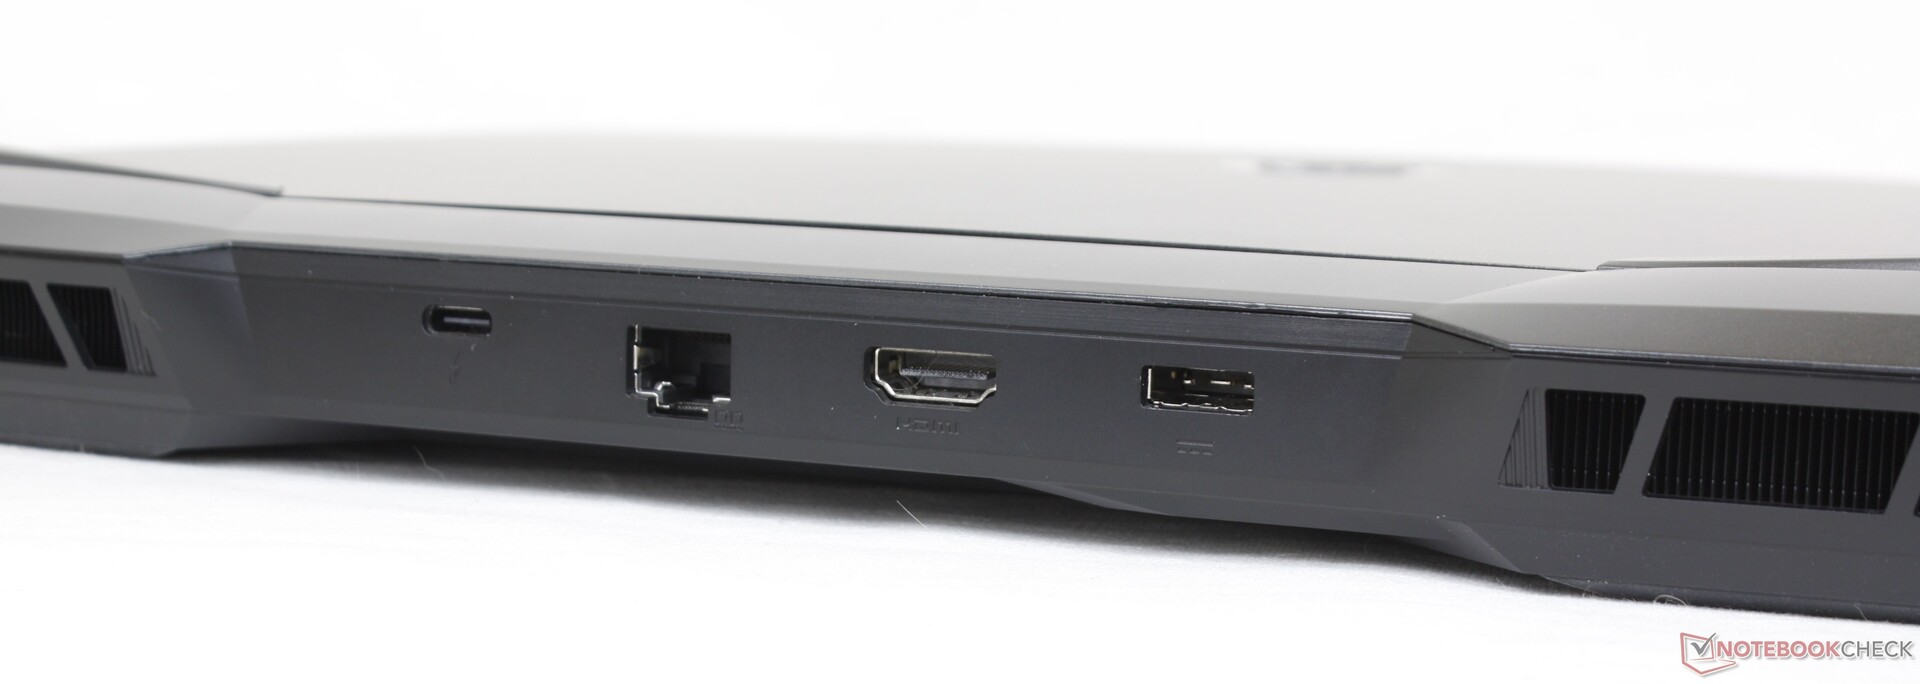
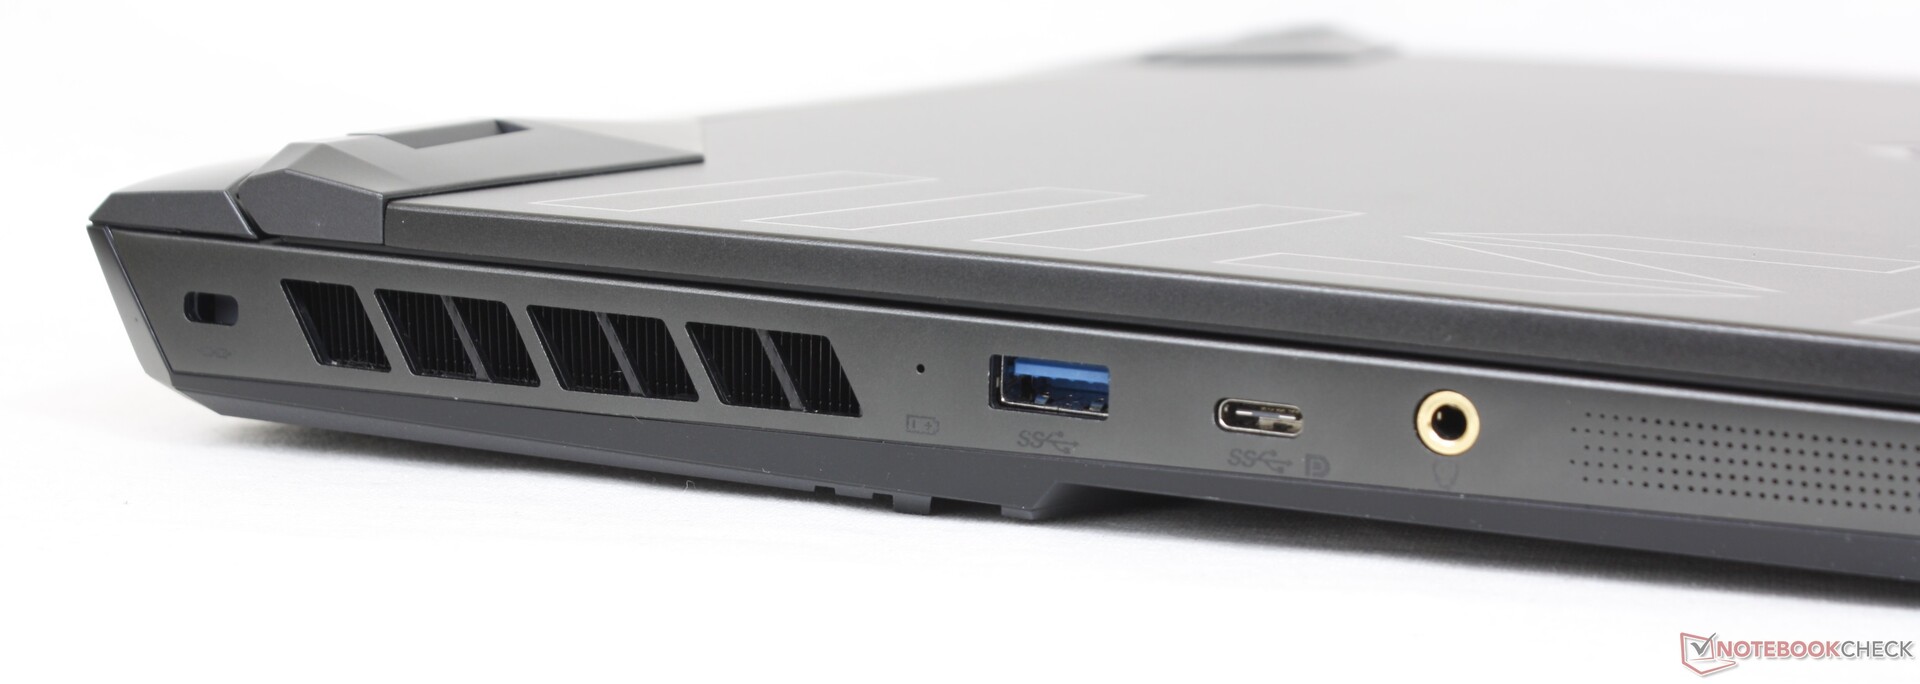
Anslutningsmöjligheter - Ingen Mini-DisplayPort längre
I GE67 har den dedikerade mini-DisplayPort som fanns i GE66 tagits bort. DisplayPort stöds fortfarande via de två USB-C-portarna.
Liksom andra bärbara datorer för spel som bygger på Alder-Lake-H-plattformen, t.ex Asus TUF Gaming F15 FX507ZMkommer Thunderbolt 4-anslutningen att inaktiveras om den körs i diskret grafikläge.
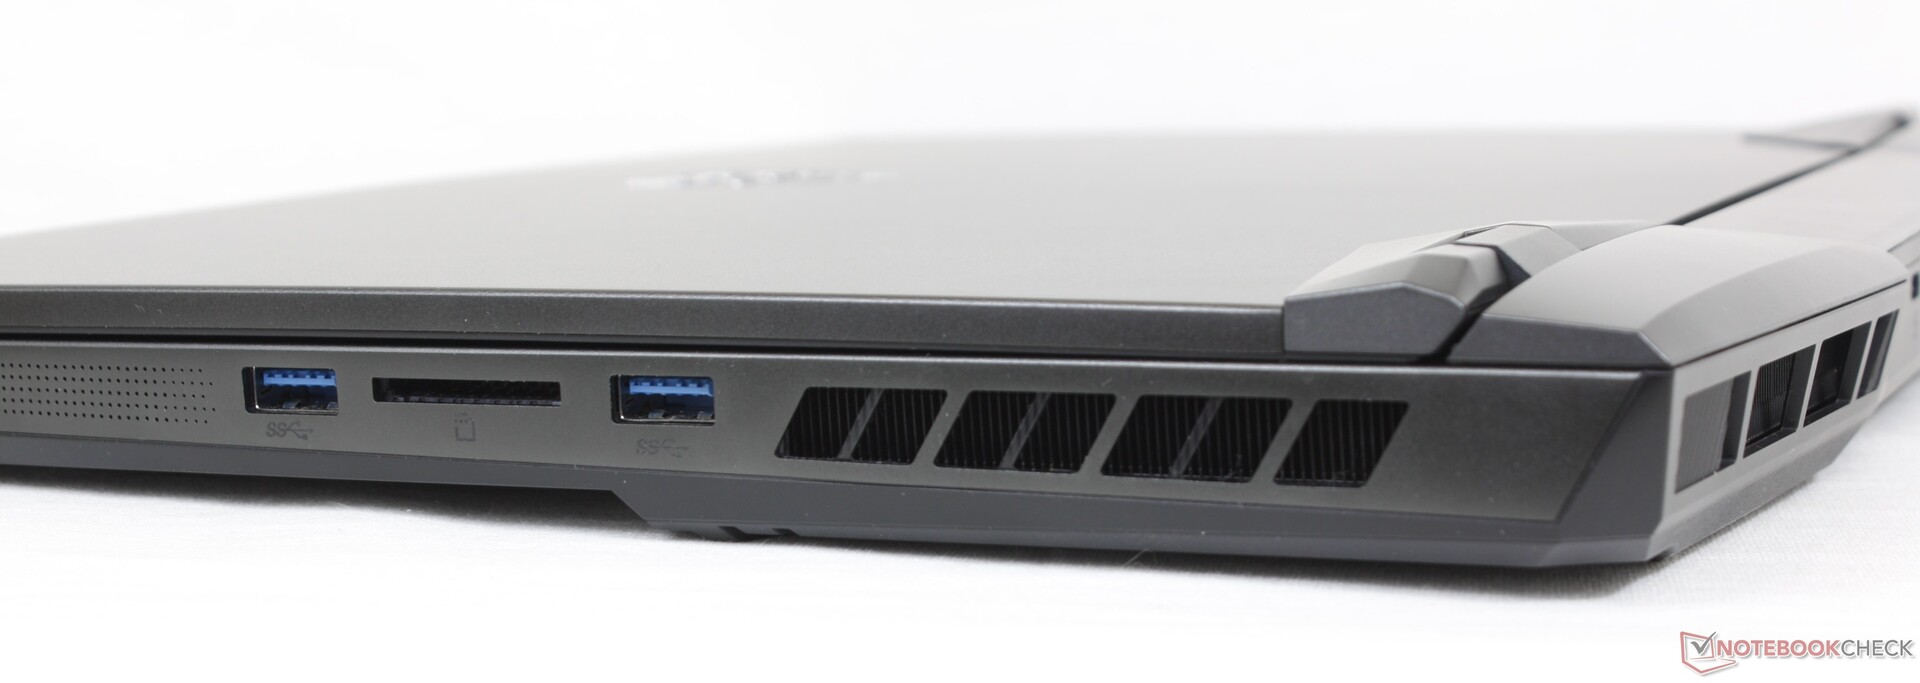
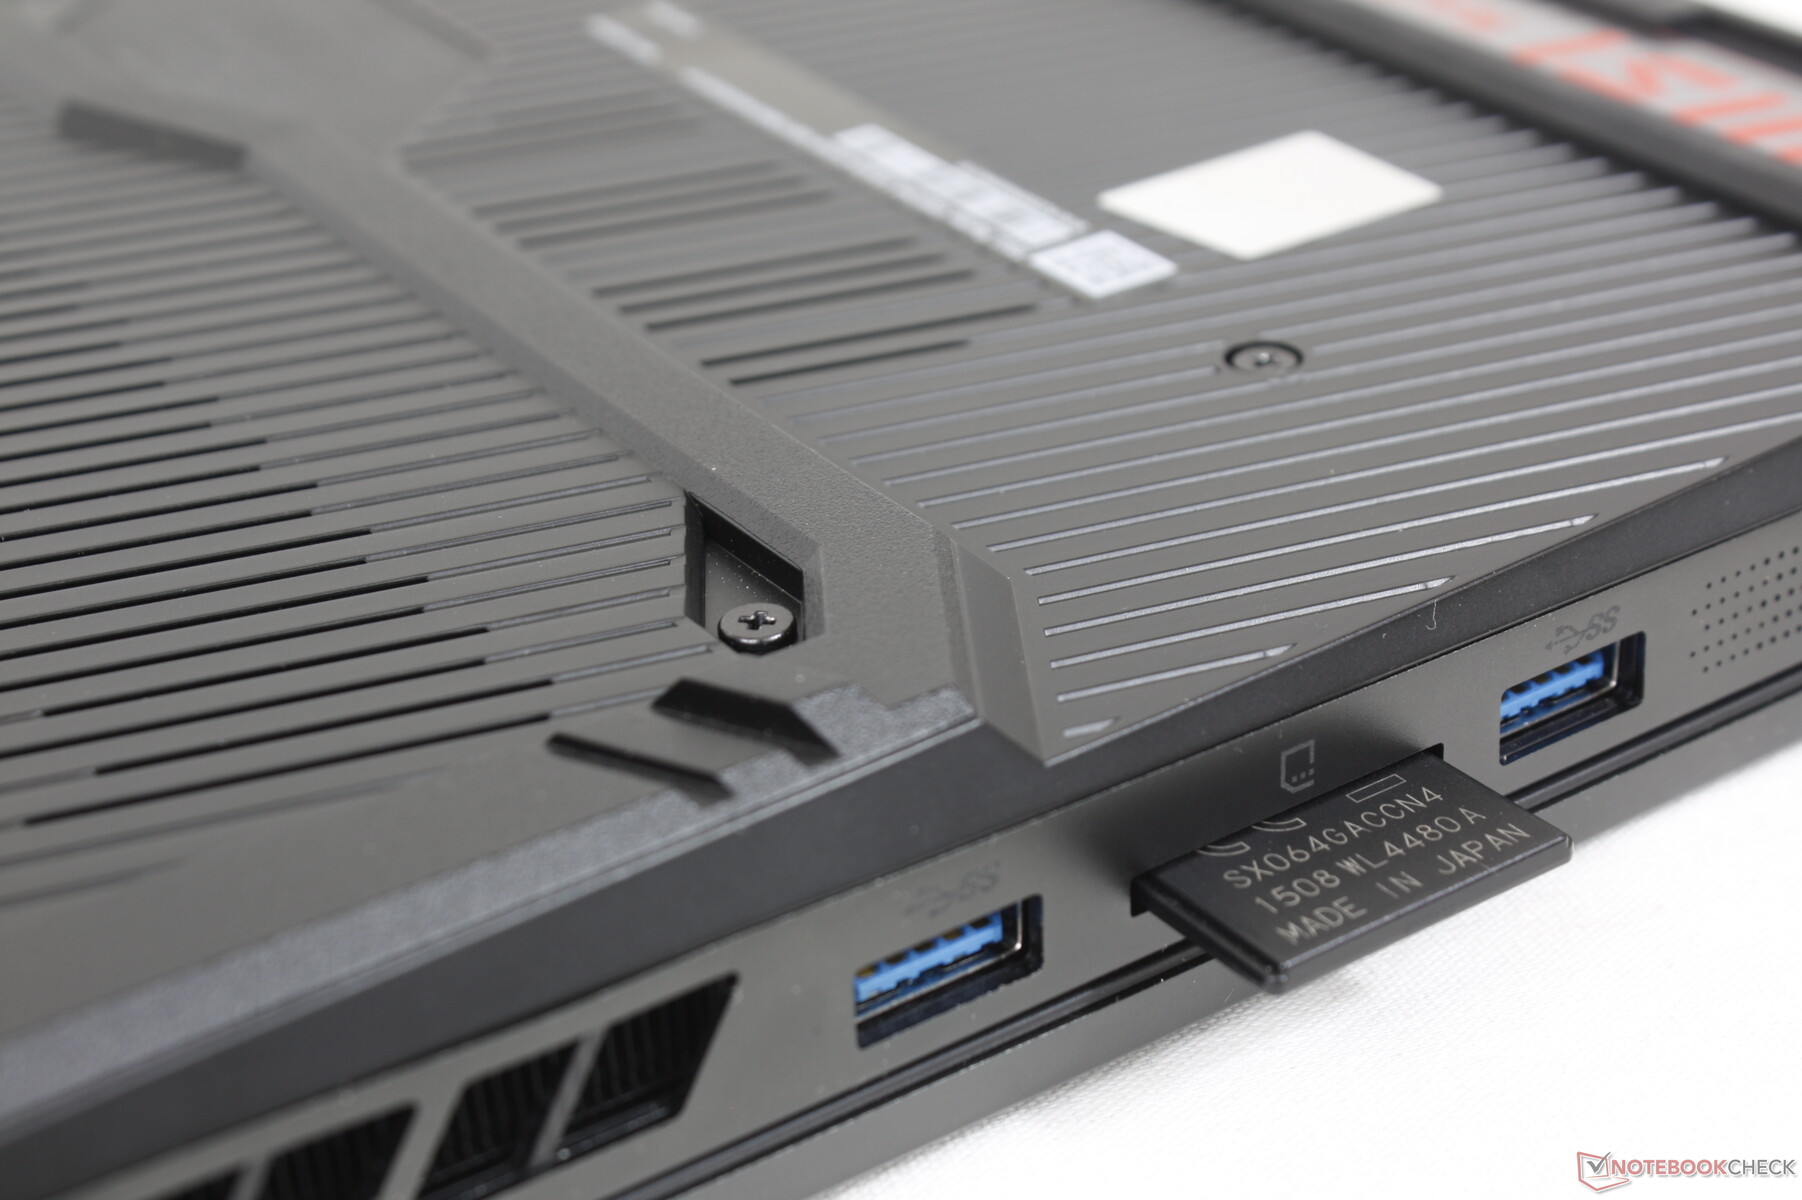
SD-kortläsare
Överföringshastigheten från den integrerade SD-kortläsaren är långsam i förhållande till priset för konfigurationen. Användare kommer att se 2x snabbare prestanda för SD-kortläsare från konkurrerande modeller som Razer Blade 15 eller Asus ROG Zephyrus Duo 16.
| SD Card Reader | |
| average JPG Copy Test (av. of 3 runs) | |
| Razer Blade 15 2022 (Toshiba Exceria Pro SDXC 64 GB UHS-II) | |
| MSI GE67 HX 12UGS (Toshiba Exceria Pro SDXC 64 GB UHS-II) | |
| MSI Raider GE66 12UHS (AV PRO microSD 128 GB V60) | |
| maximum AS SSD Seq Read Test (1GB) | |
| Razer Blade 15 2022 (Toshiba Exceria Pro SDXC 64 GB UHS-II) | |
| MSI GE67 HX 12UGS (Toshiba Exceria Pro SDXC 64 GB UHS-II) | |
Kommunikation
| Networking | |
| iperf3 transmit AX12 | |
| Razer Blade 15 2022 | |
| MSI Vector GP66 12UGS | |
| Alienware m15 R6, i7-11800H RTX 3080 | |
| iperf3 receive AX12 | |
| Razer Blade 15 2022 | |
| MSI Vector GP66 12UGS | |
| Alienware m15 R6, i7-11800H RTX 3080 | |
| iperf3 receive AXE11000 6GHz | |
| Asus ROG Strix Scar 15 G533ZW-LN106WS | |
| MSI GE67 HX 12UGS | |
| iperf3 transmit AXE11000 6GHz | |
| Asus ROG Strix Scar 15 G533ZW-LN106WS | |
| MSI GE67 HX 12UGS | |
Webbkamera
Det finns inga förändringar i webbkameran med 2 MP, vilket också innebär att det fortfarande inte finns någon fysisk sekretessbrytare eller ens stöd för Windows Hello. Användare kan istället stänga av webbkameran elektroniskt via F4-tangenten.
Observera att aktivitetslampan för webbkameran alltid blinkar när webbkameran är aktiv. Detta är särskilt irriterande under videosamtal och vi kan inte hitta något alternativ för att stänga av den blinkande lampan.


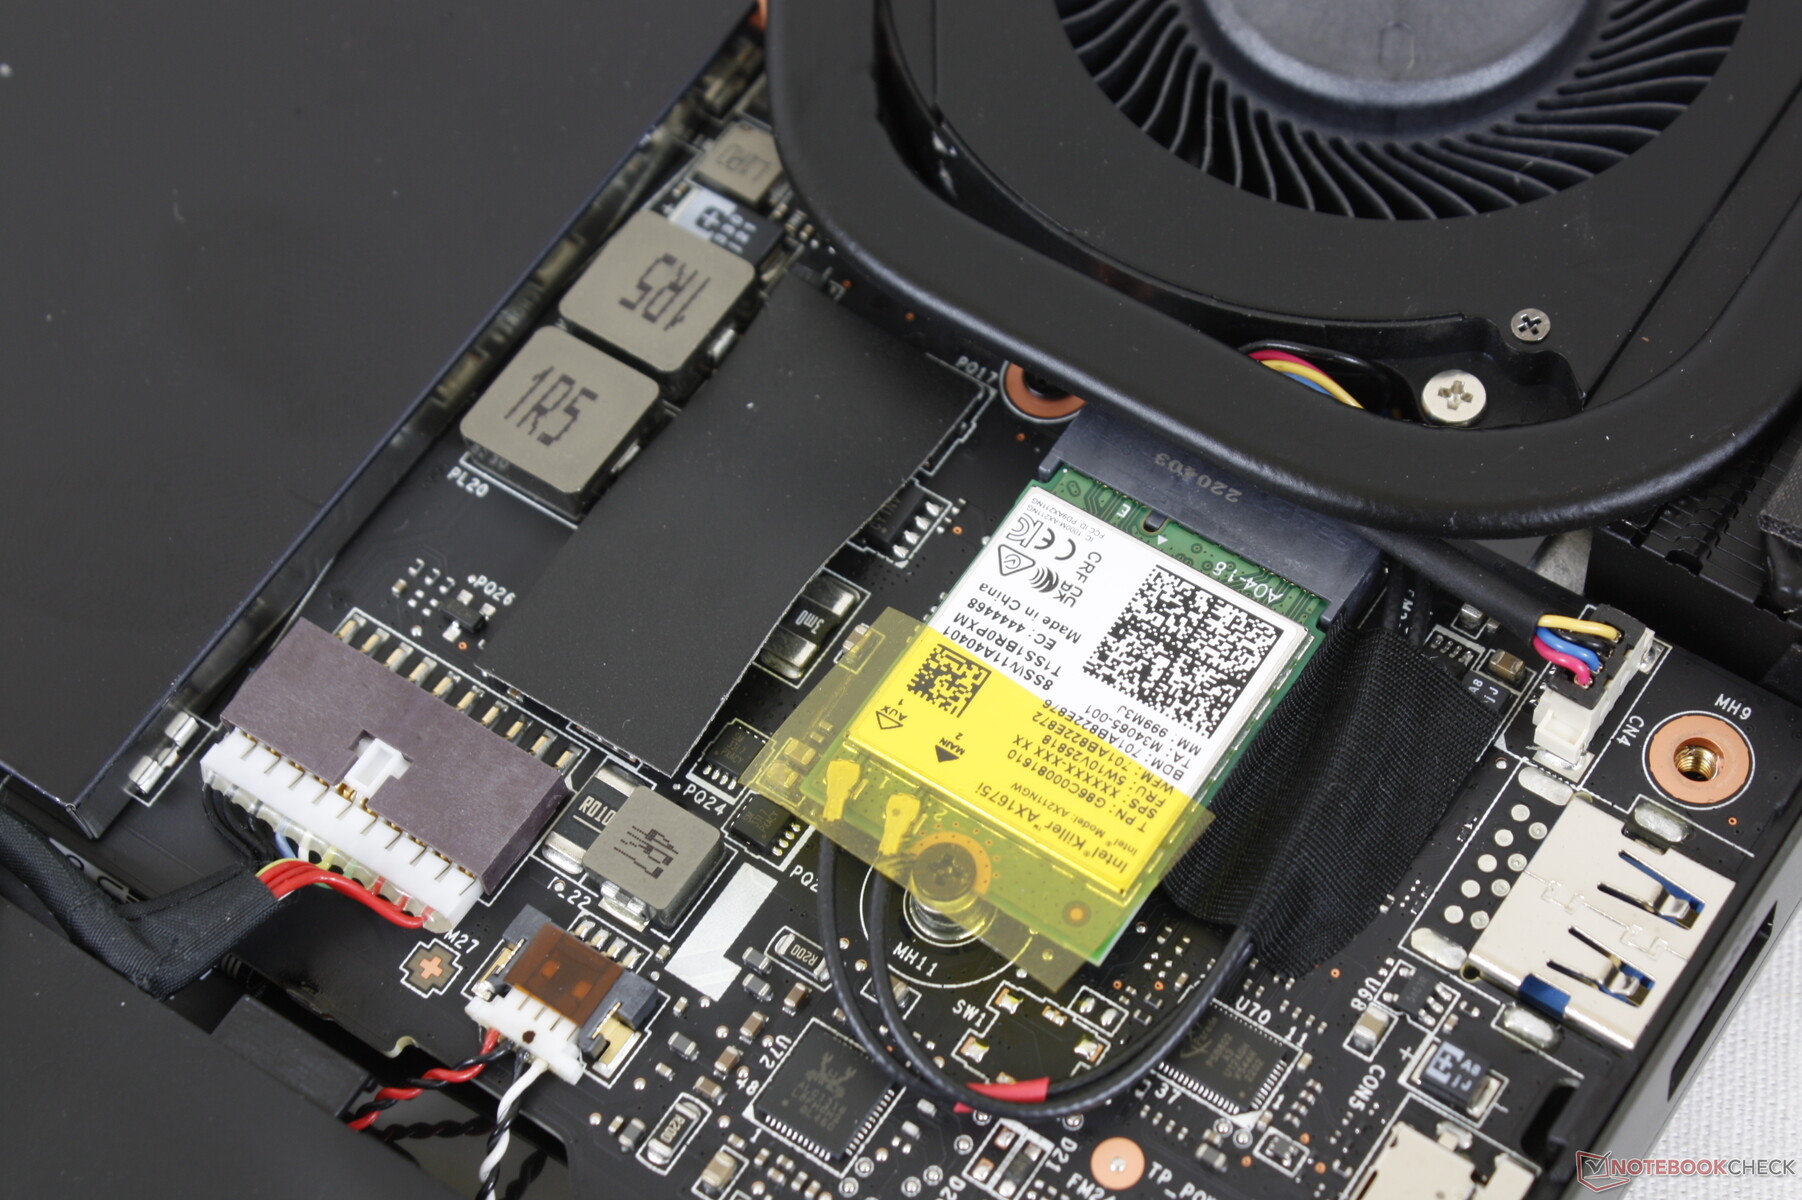
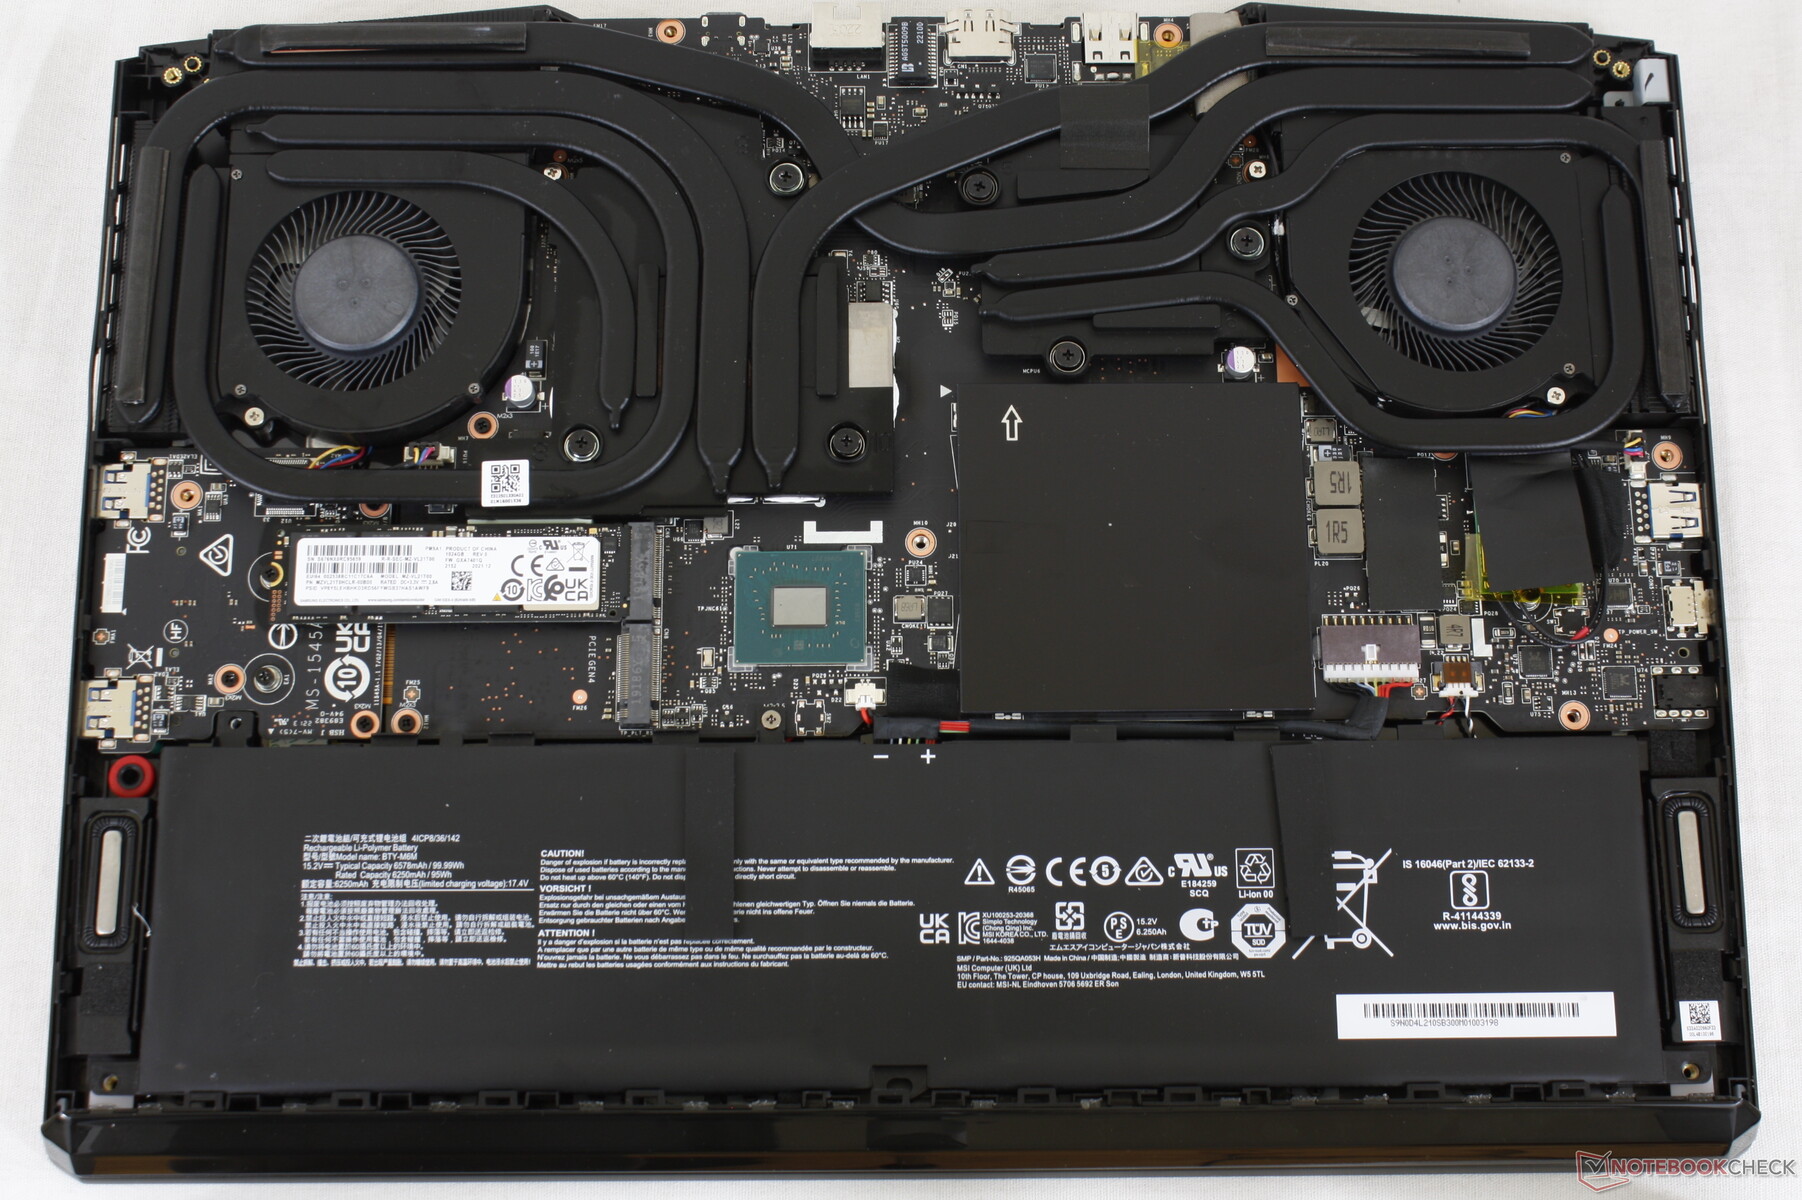
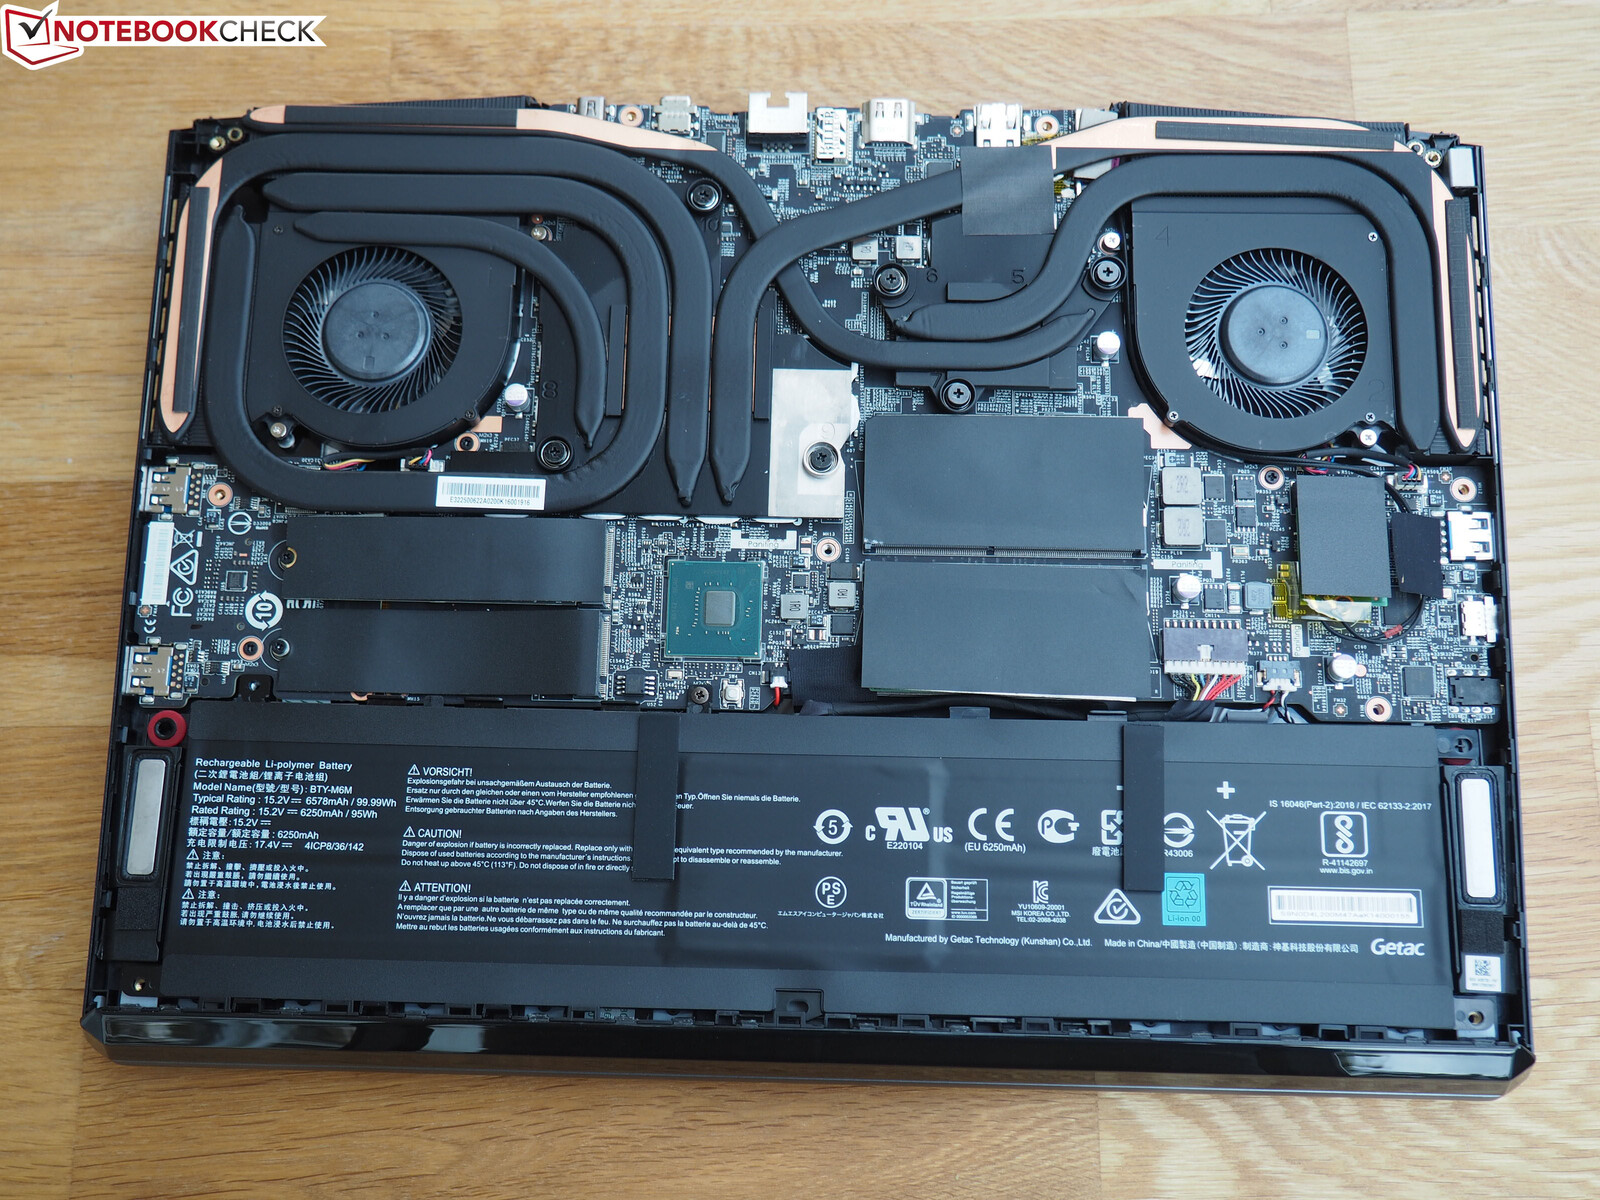
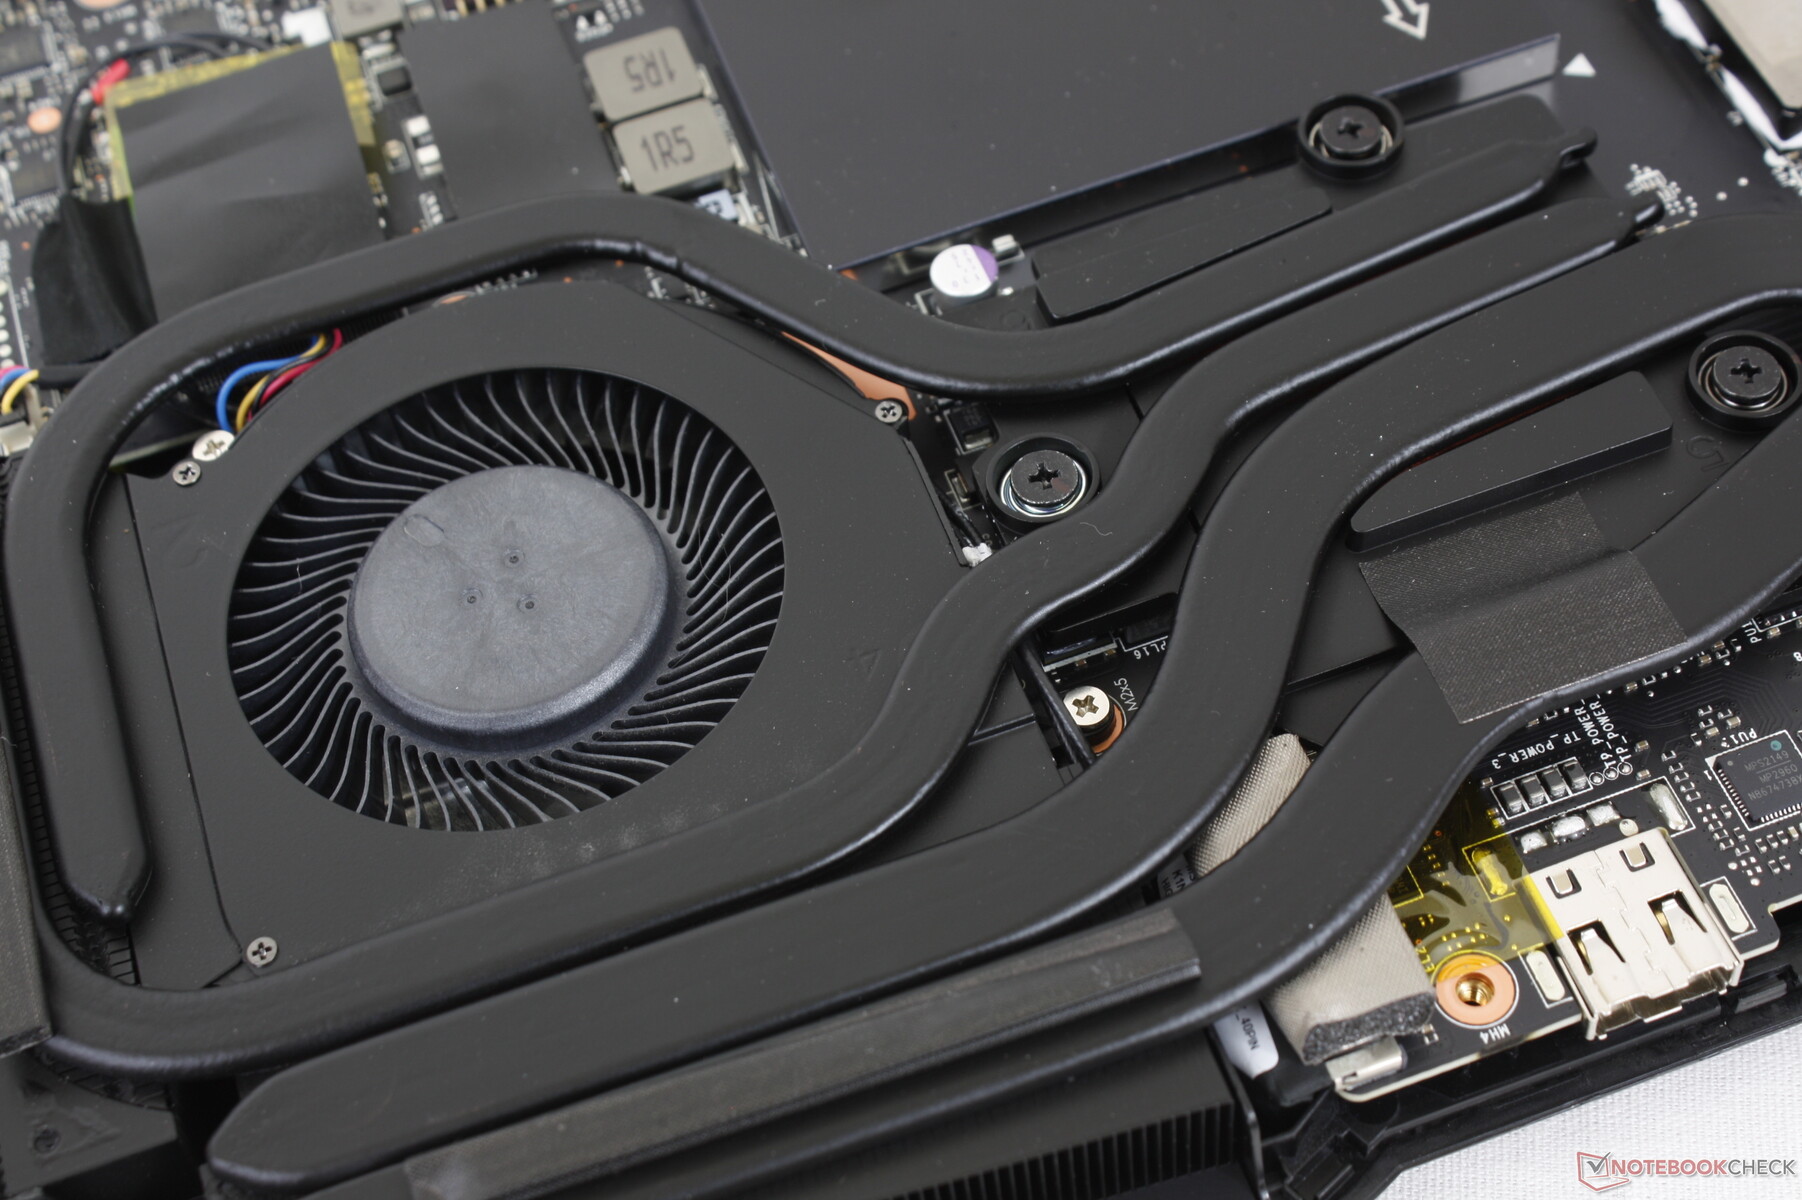
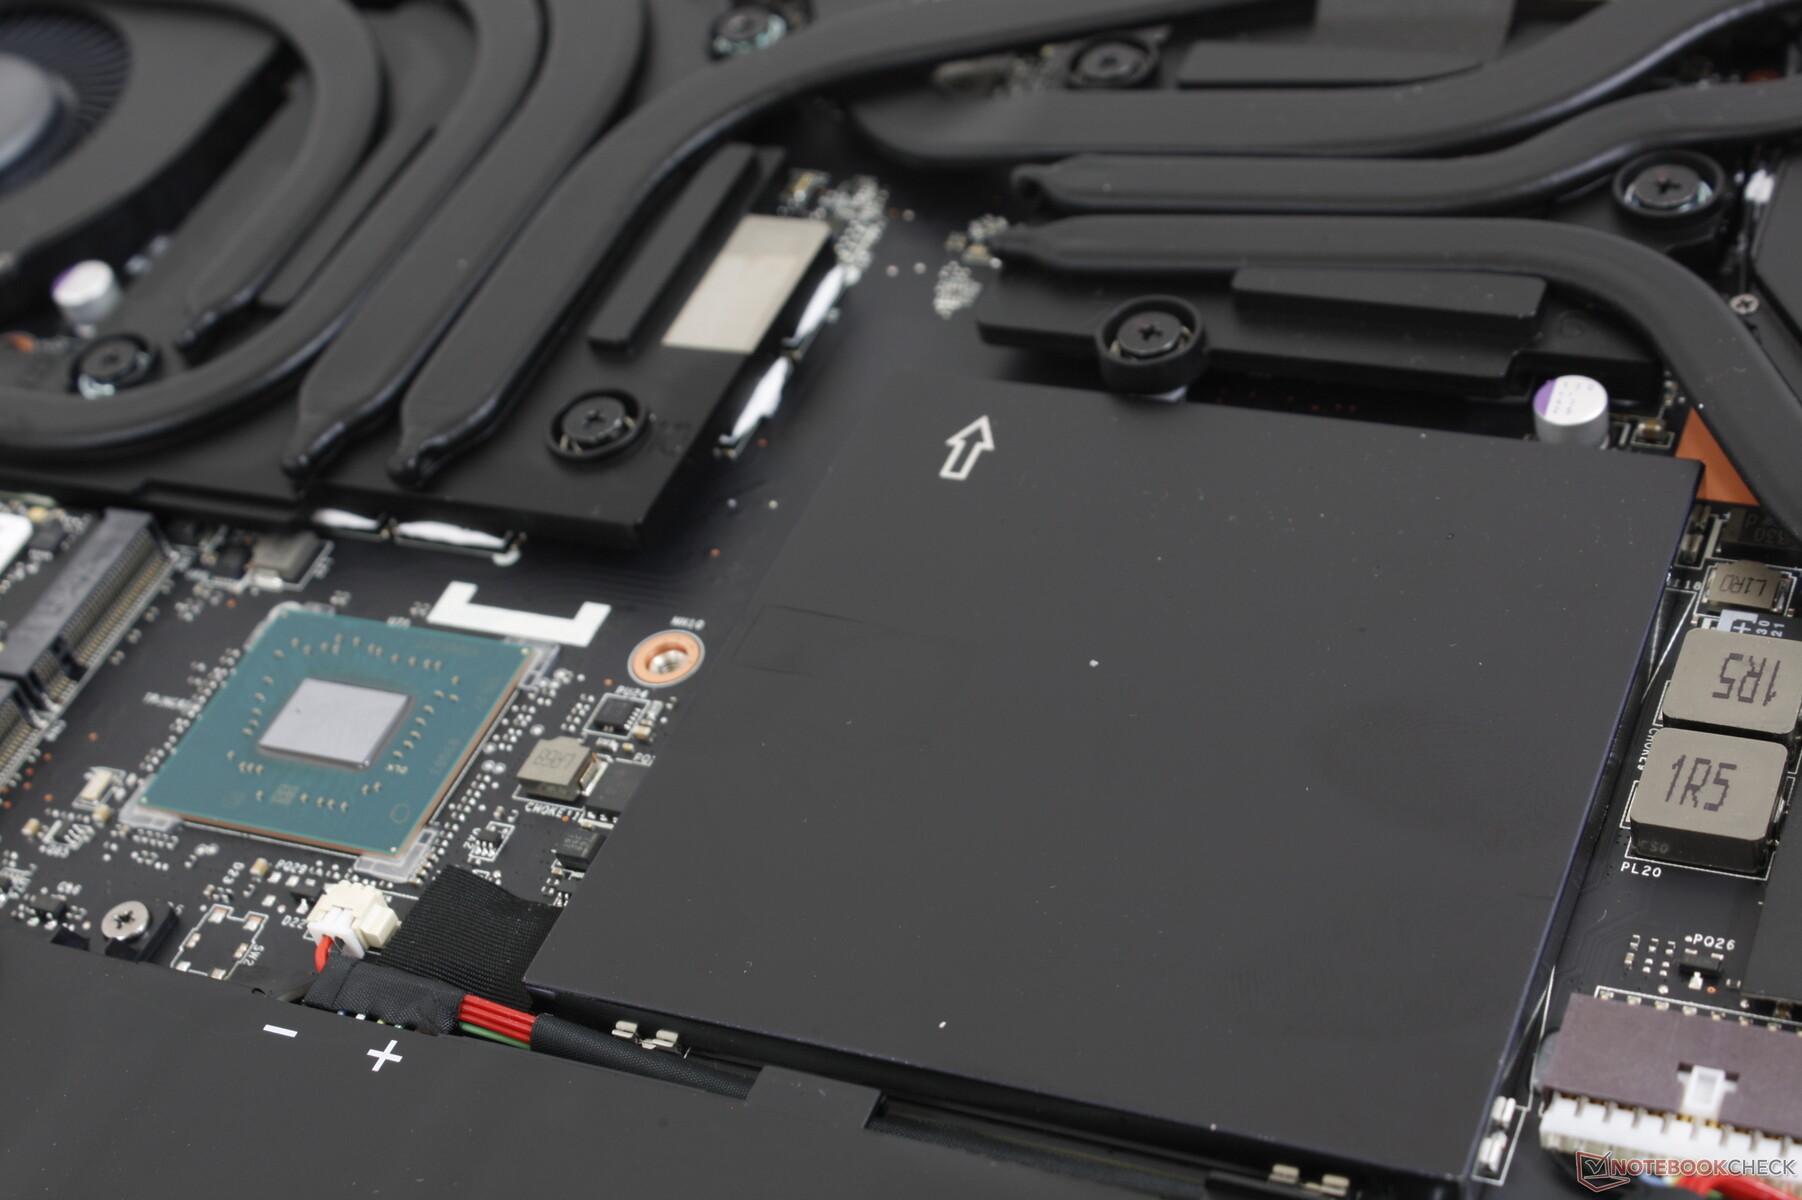
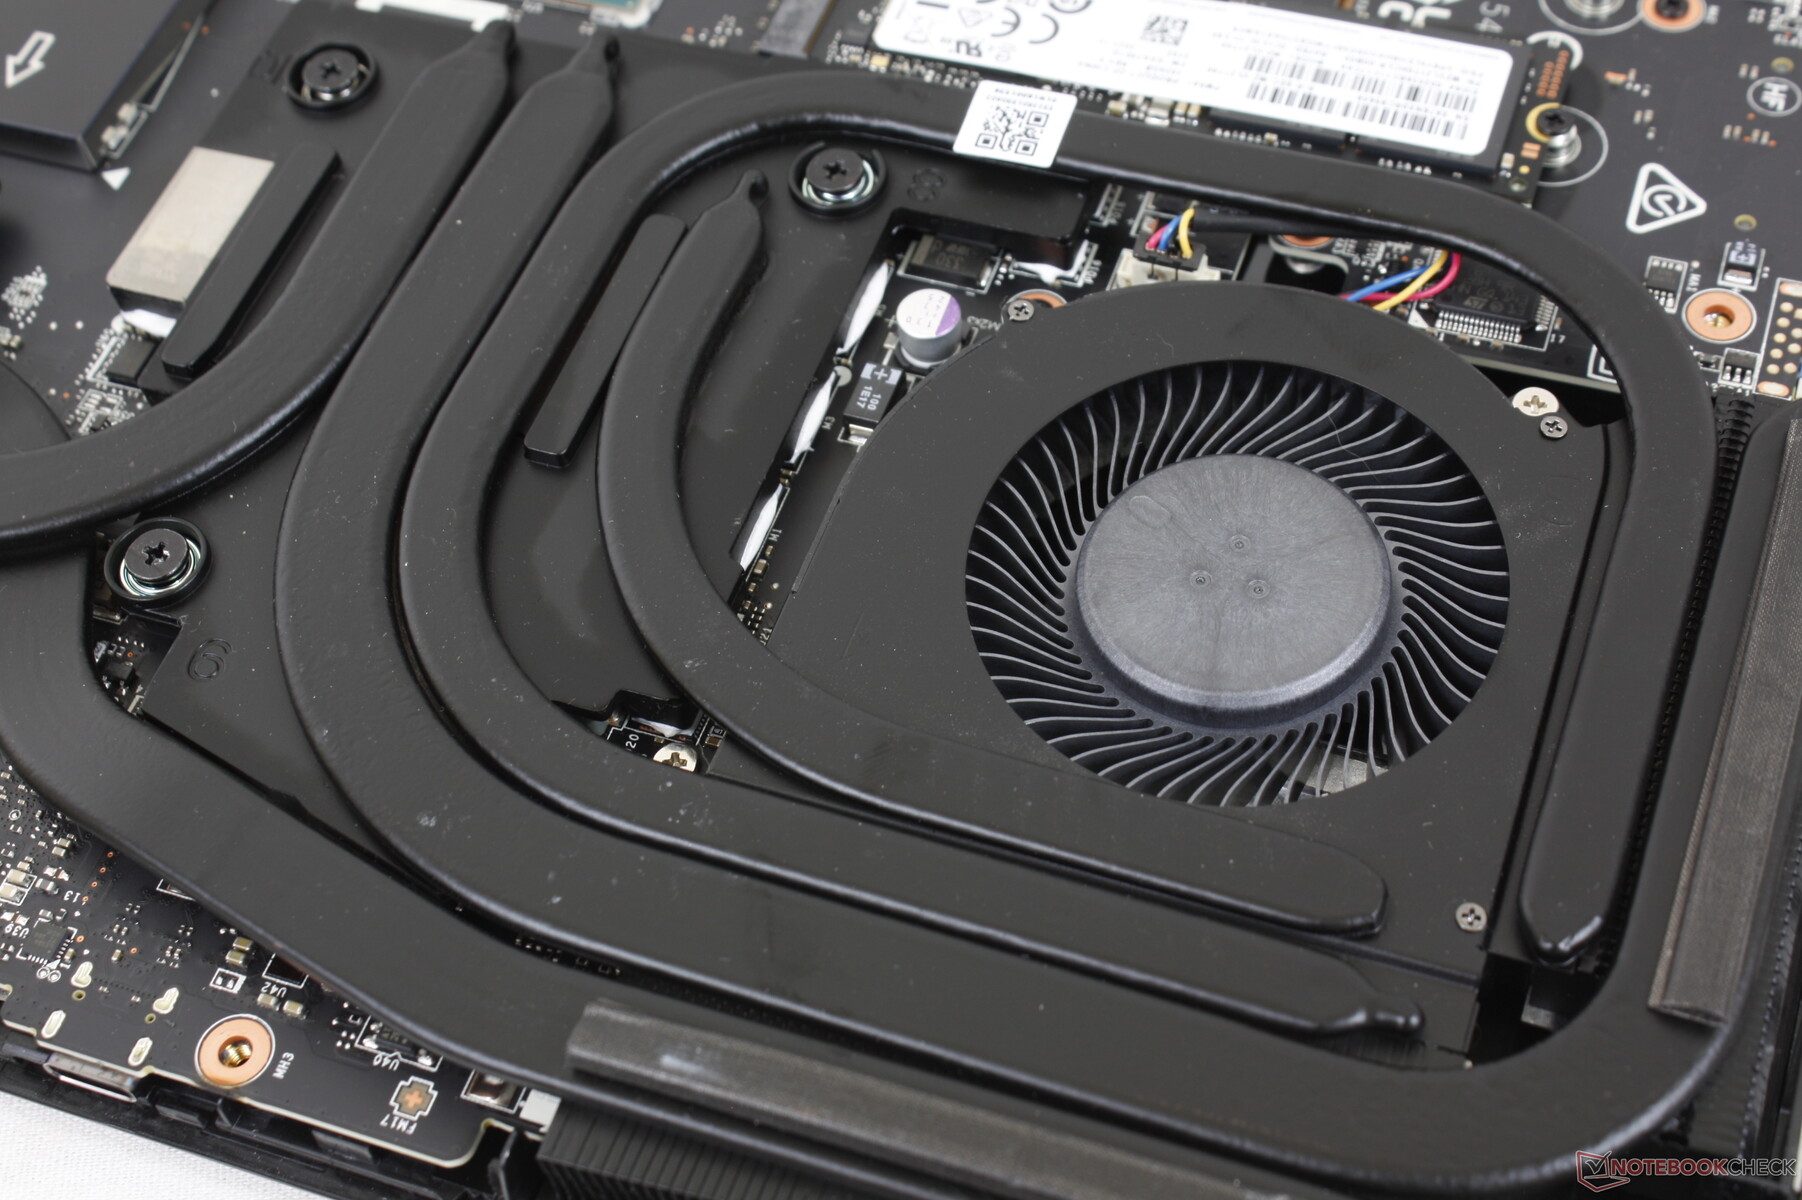
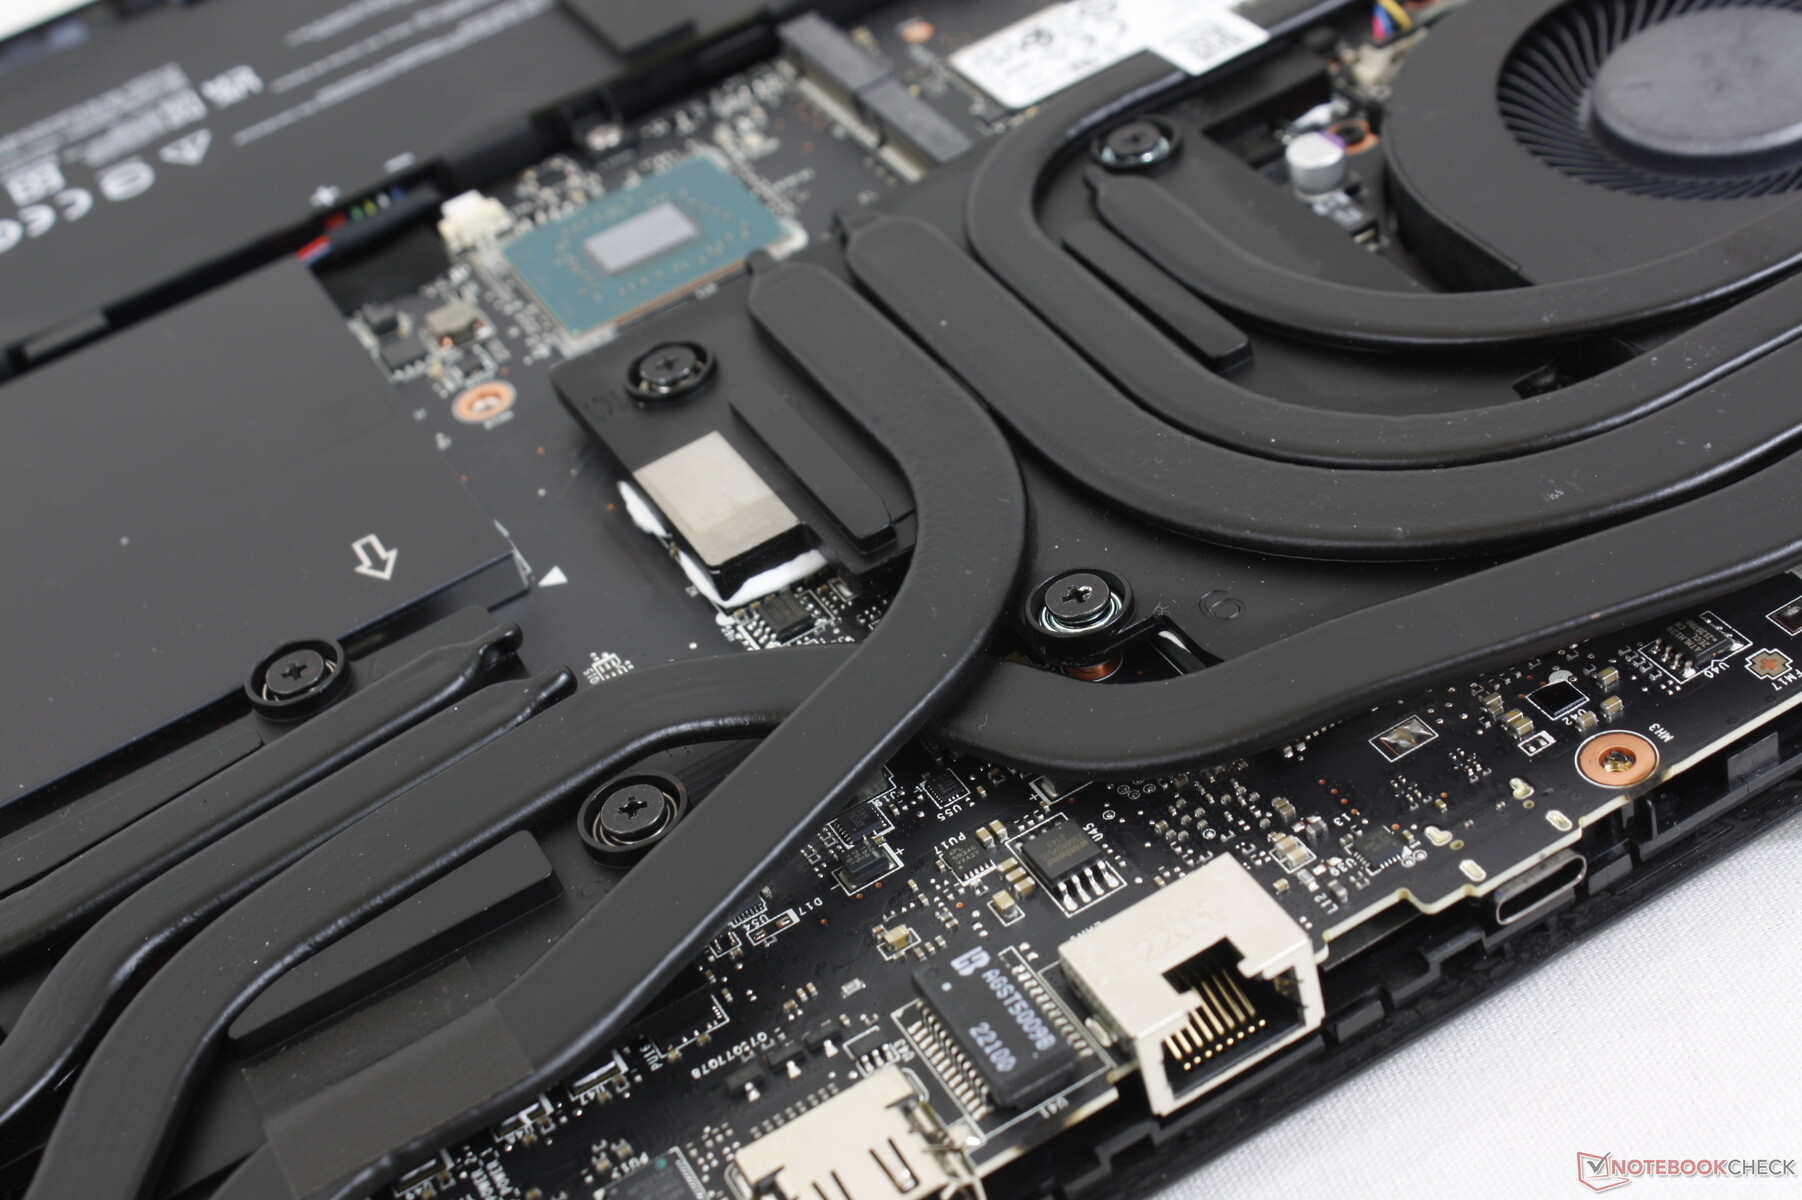
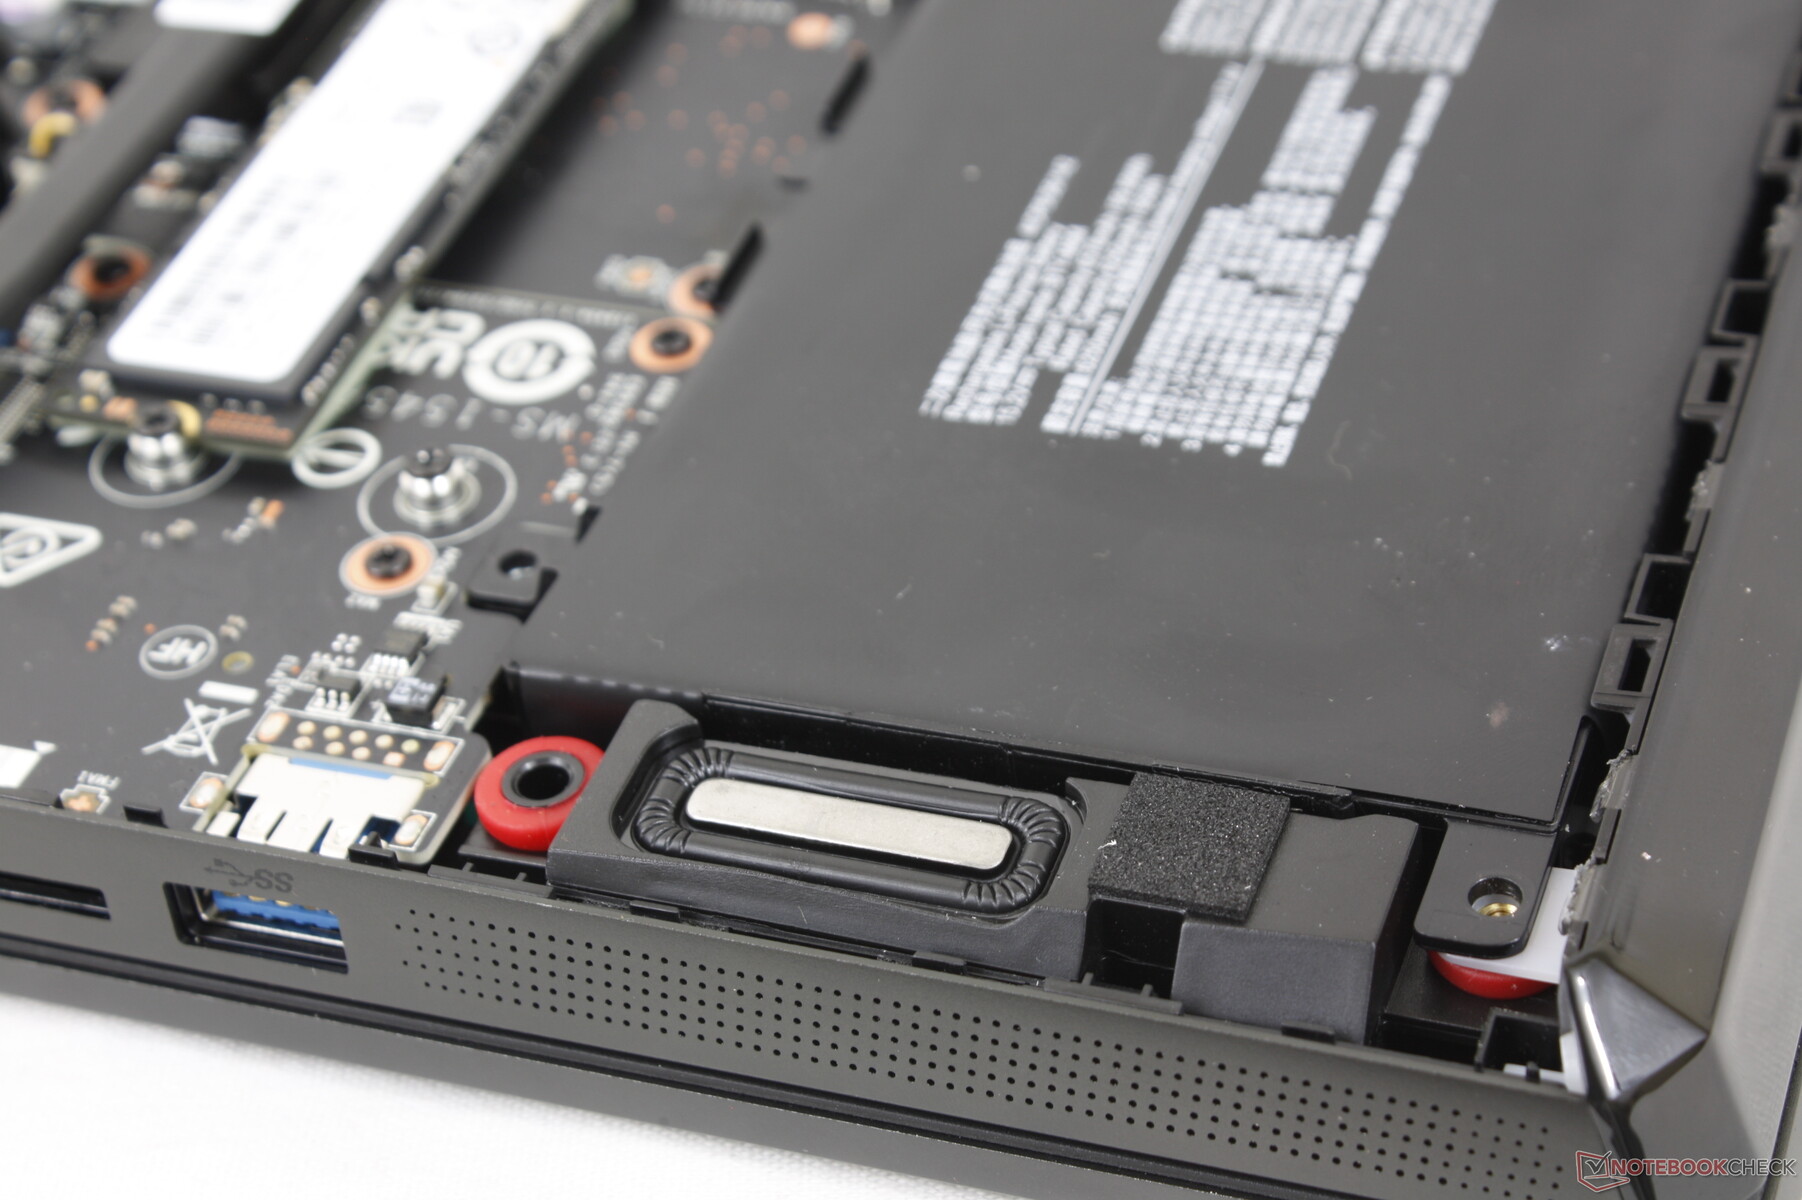
Underhåll
För att ta bort den nedre panelen krävs en Philips-skruvmejsel och en platt kant. Jämfört med GE66 har GE67 ett extra värmerör över CPU:n som visas nedan för att förbättra kylningen.
Tillbehör och garanti
I lådan finns en stor sammetstorkduk, en nätadapter och pappersarbete. Den vanliga ettåriga tillverkargarantin gäller om den köps i USA.
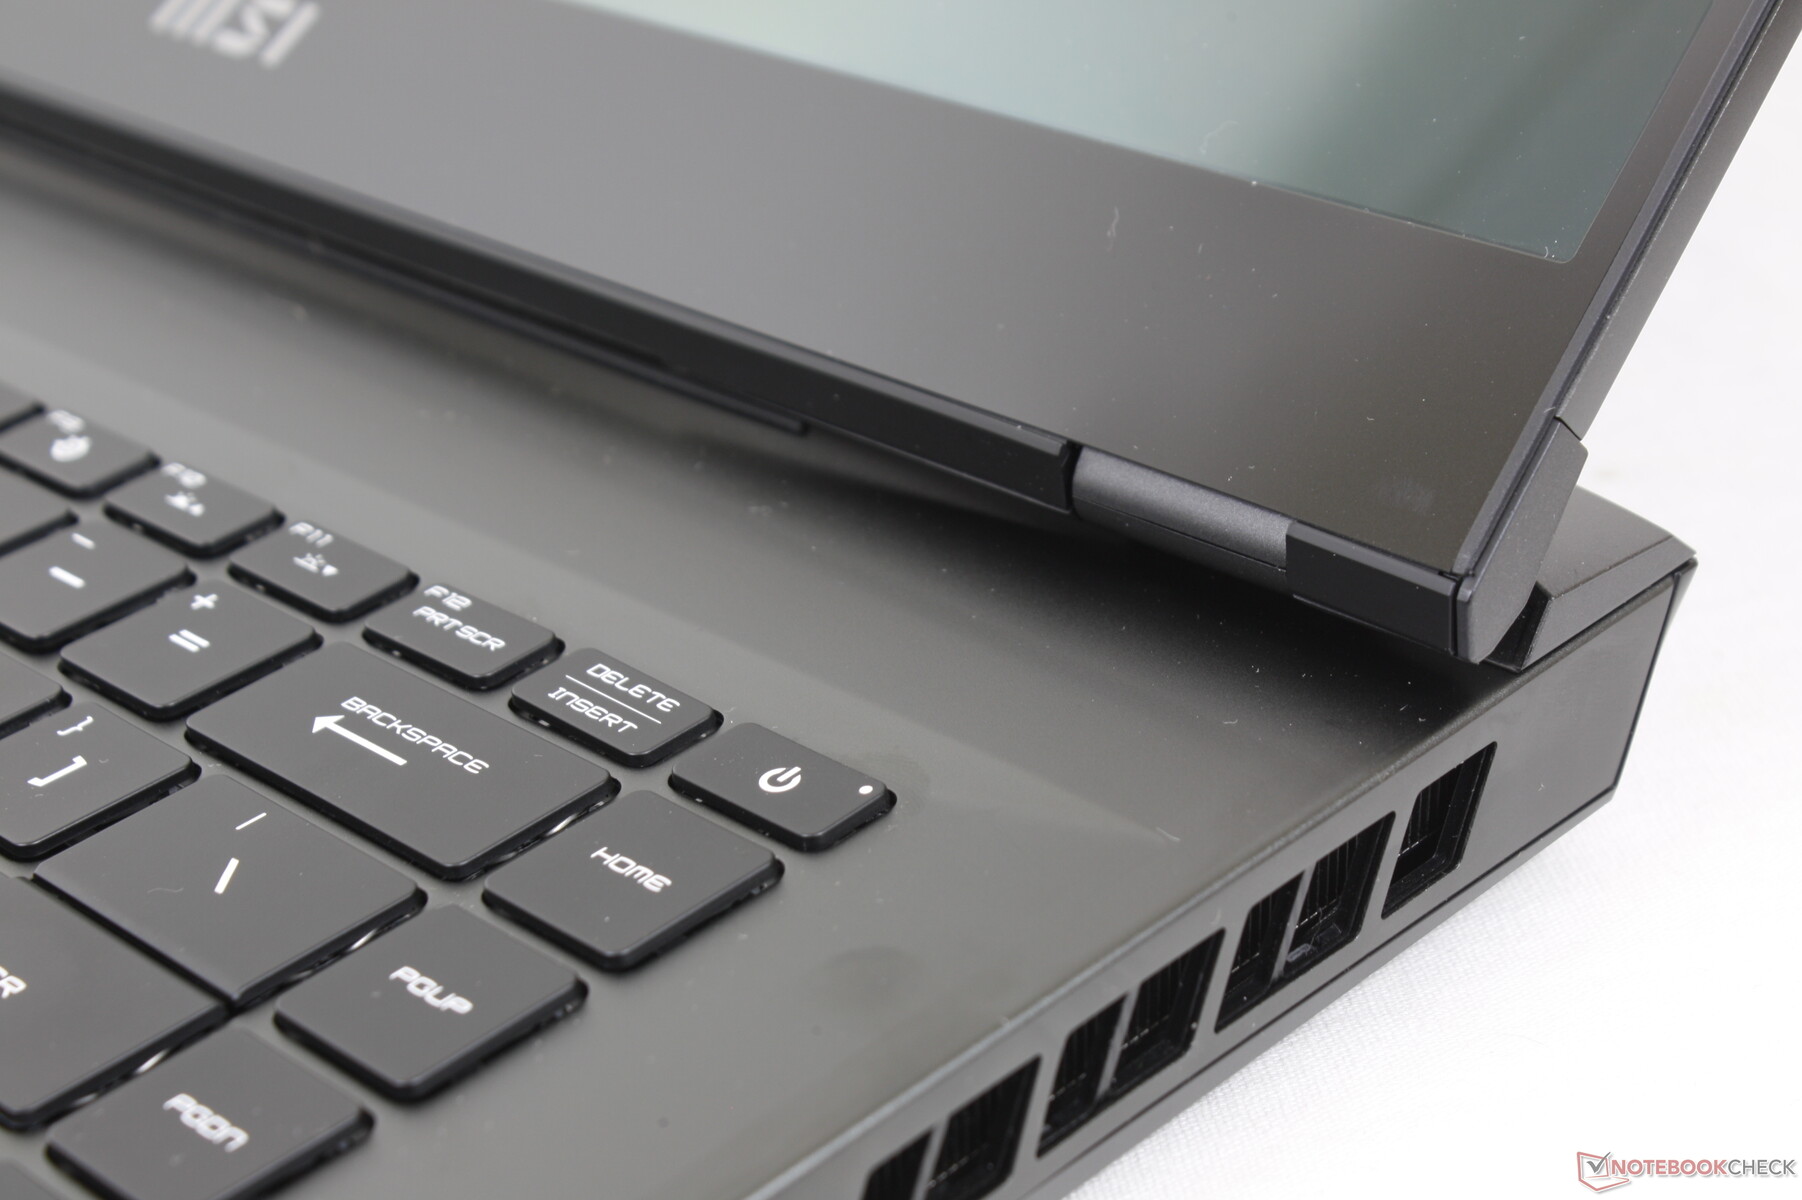
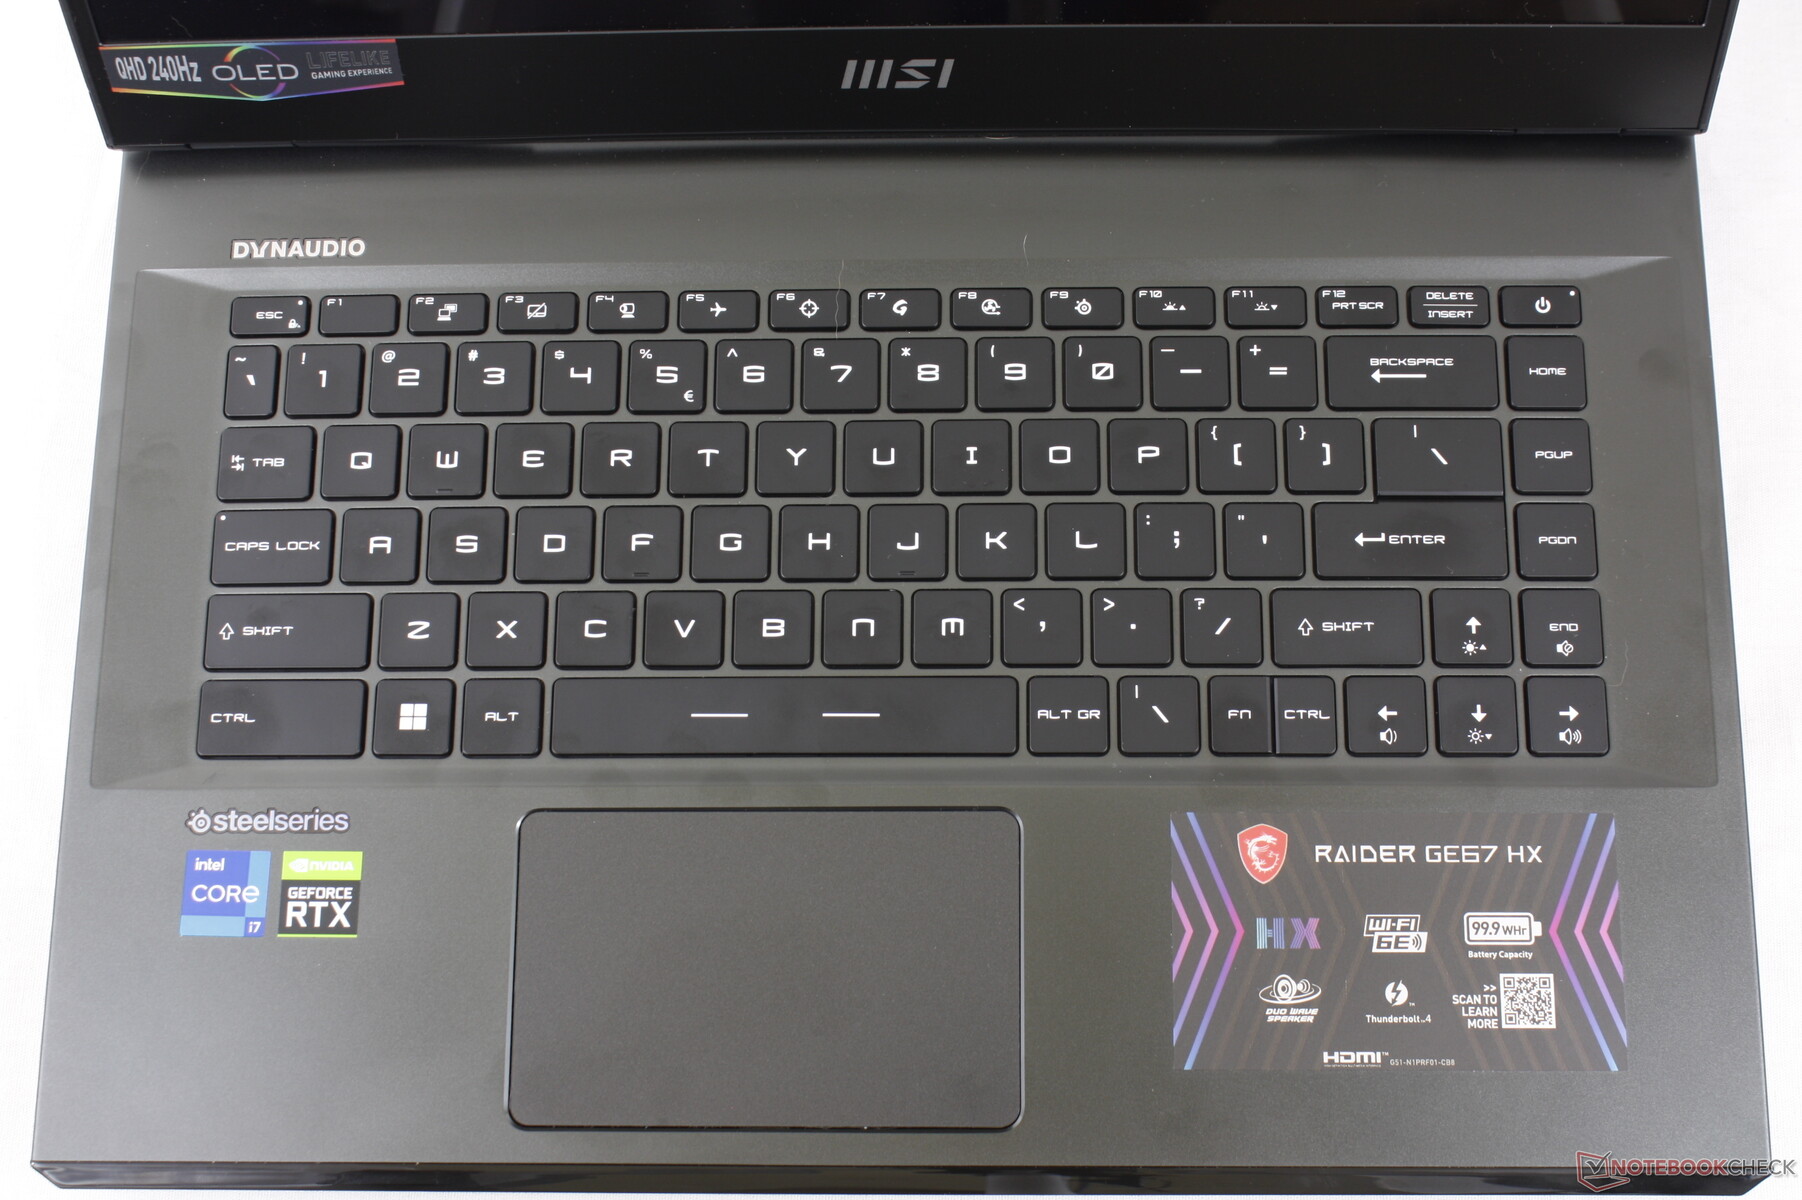
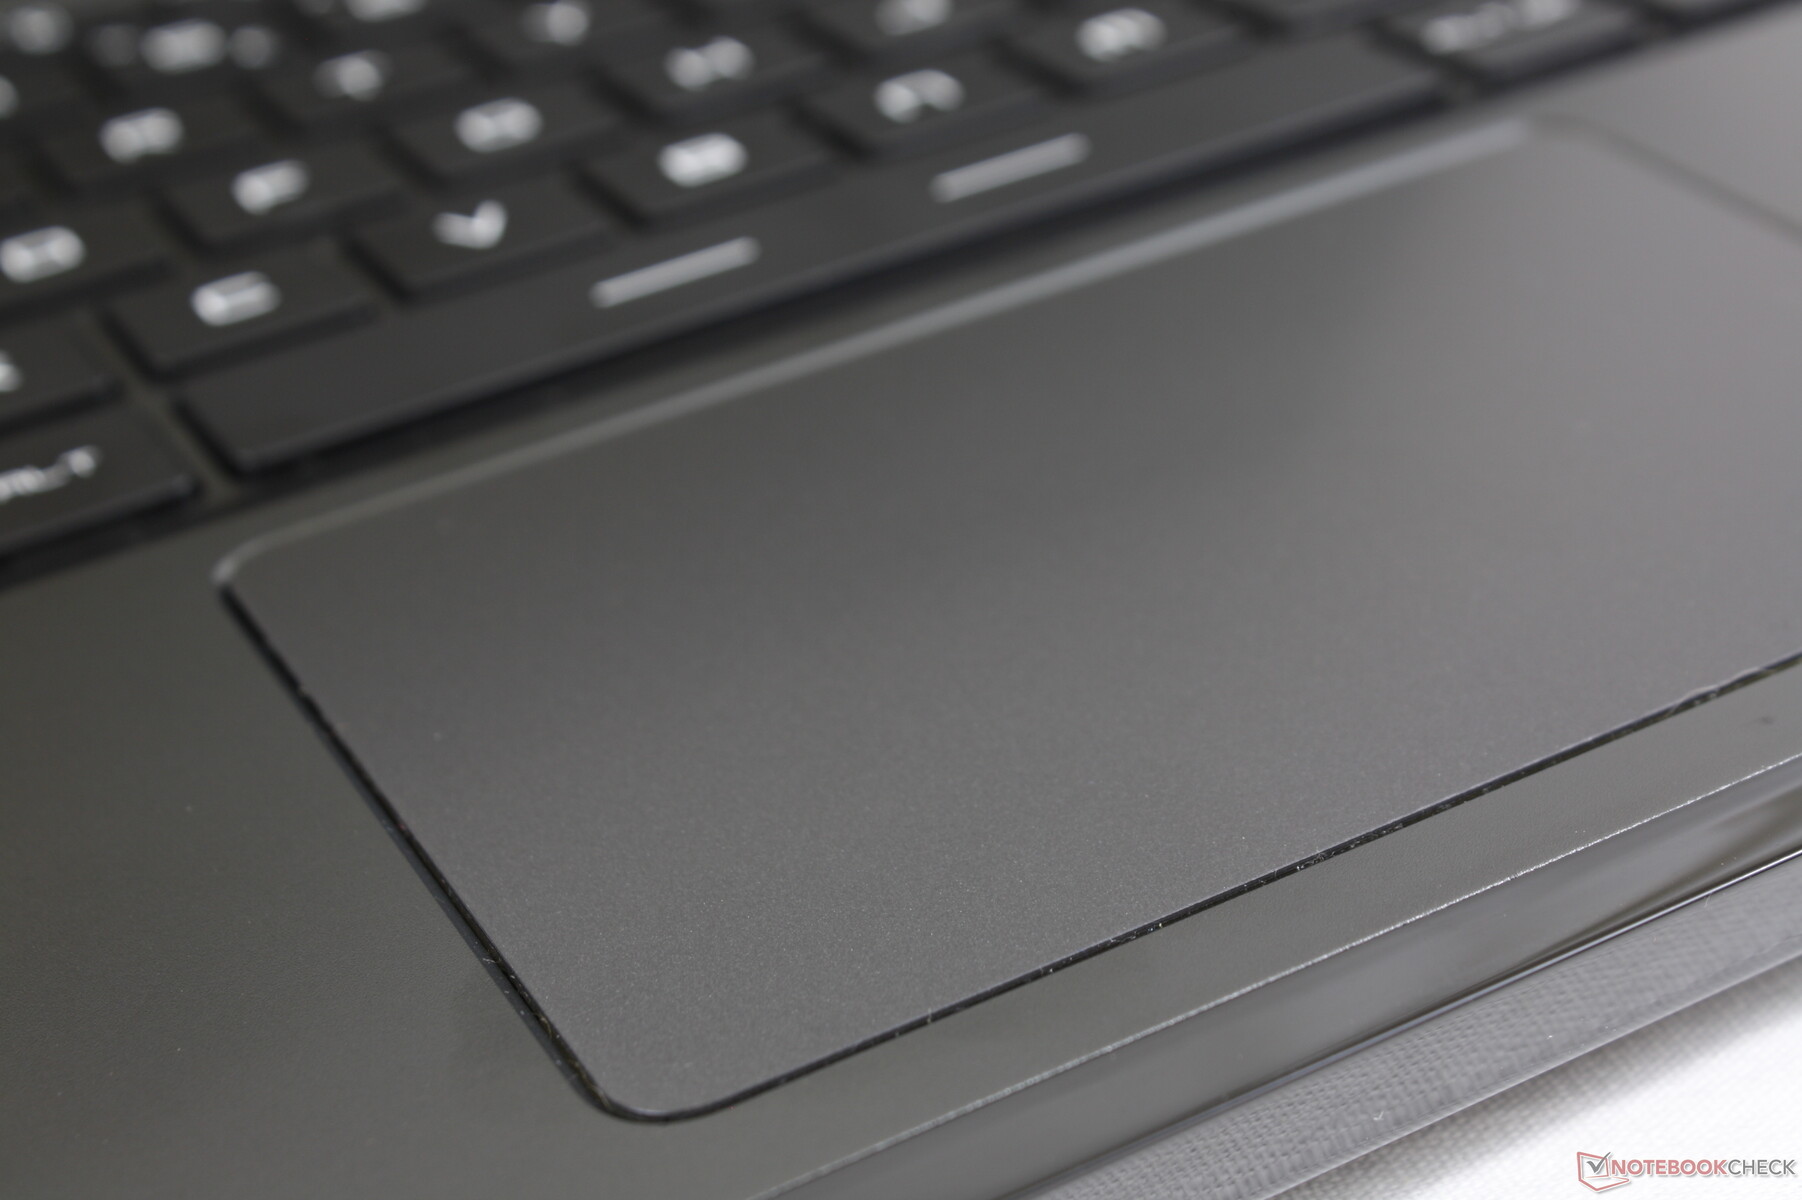
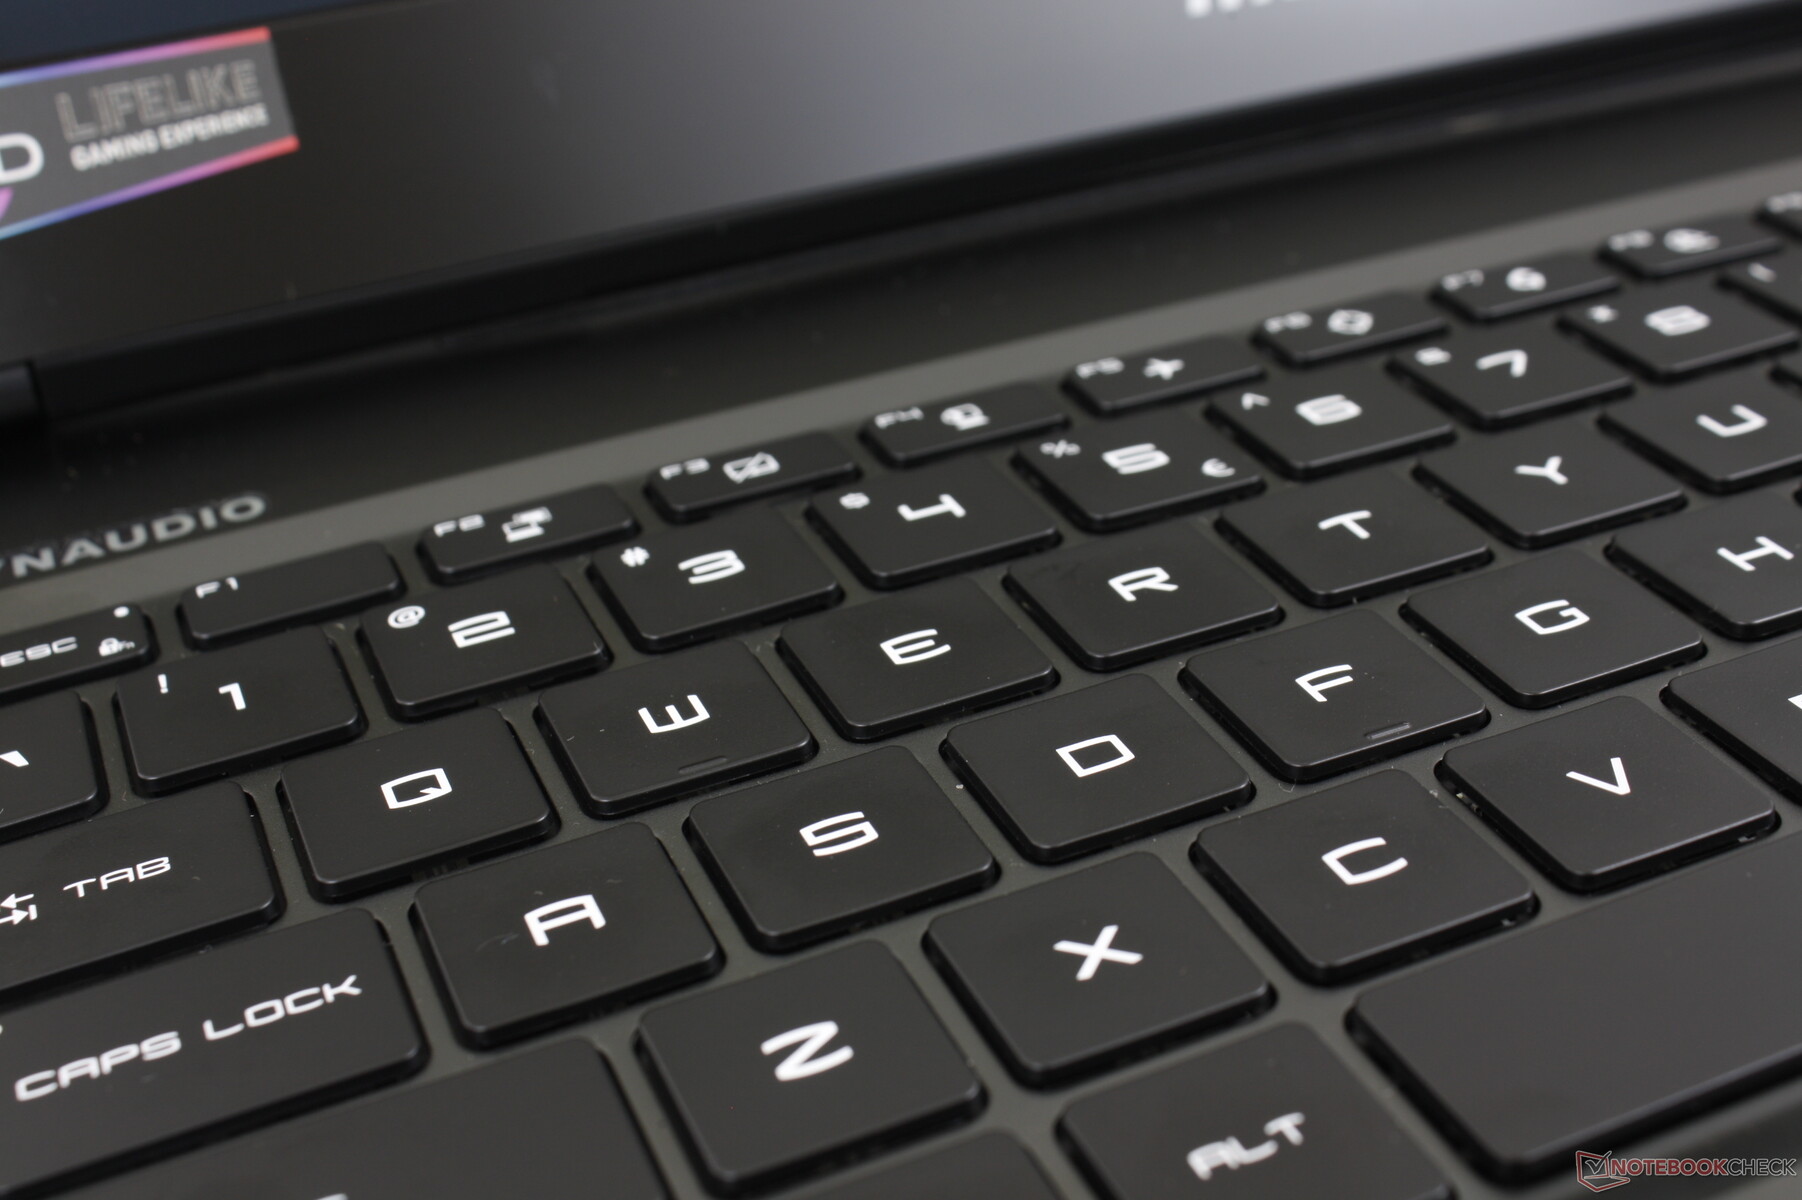
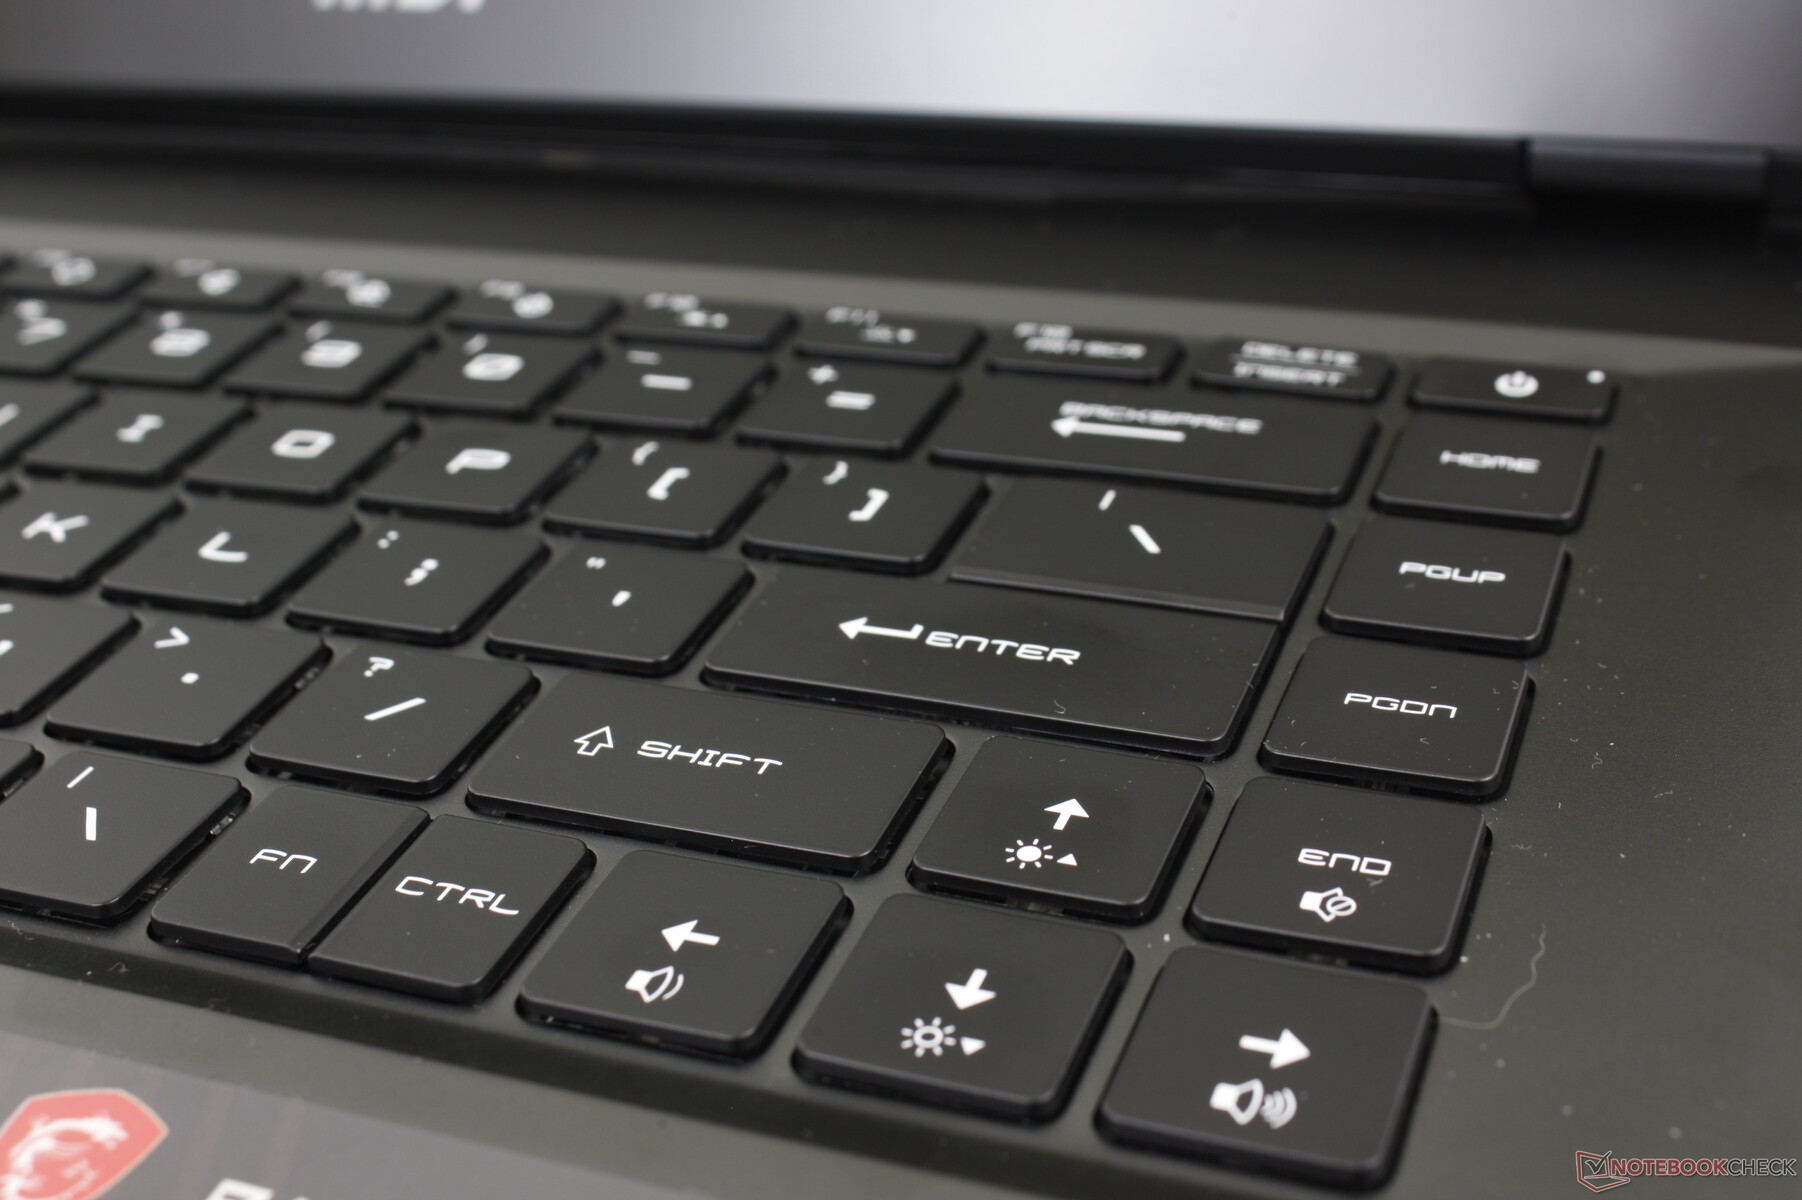
Inmatningsenheter - Inga större förändringar från GE66
Tangentbord och pekplatta
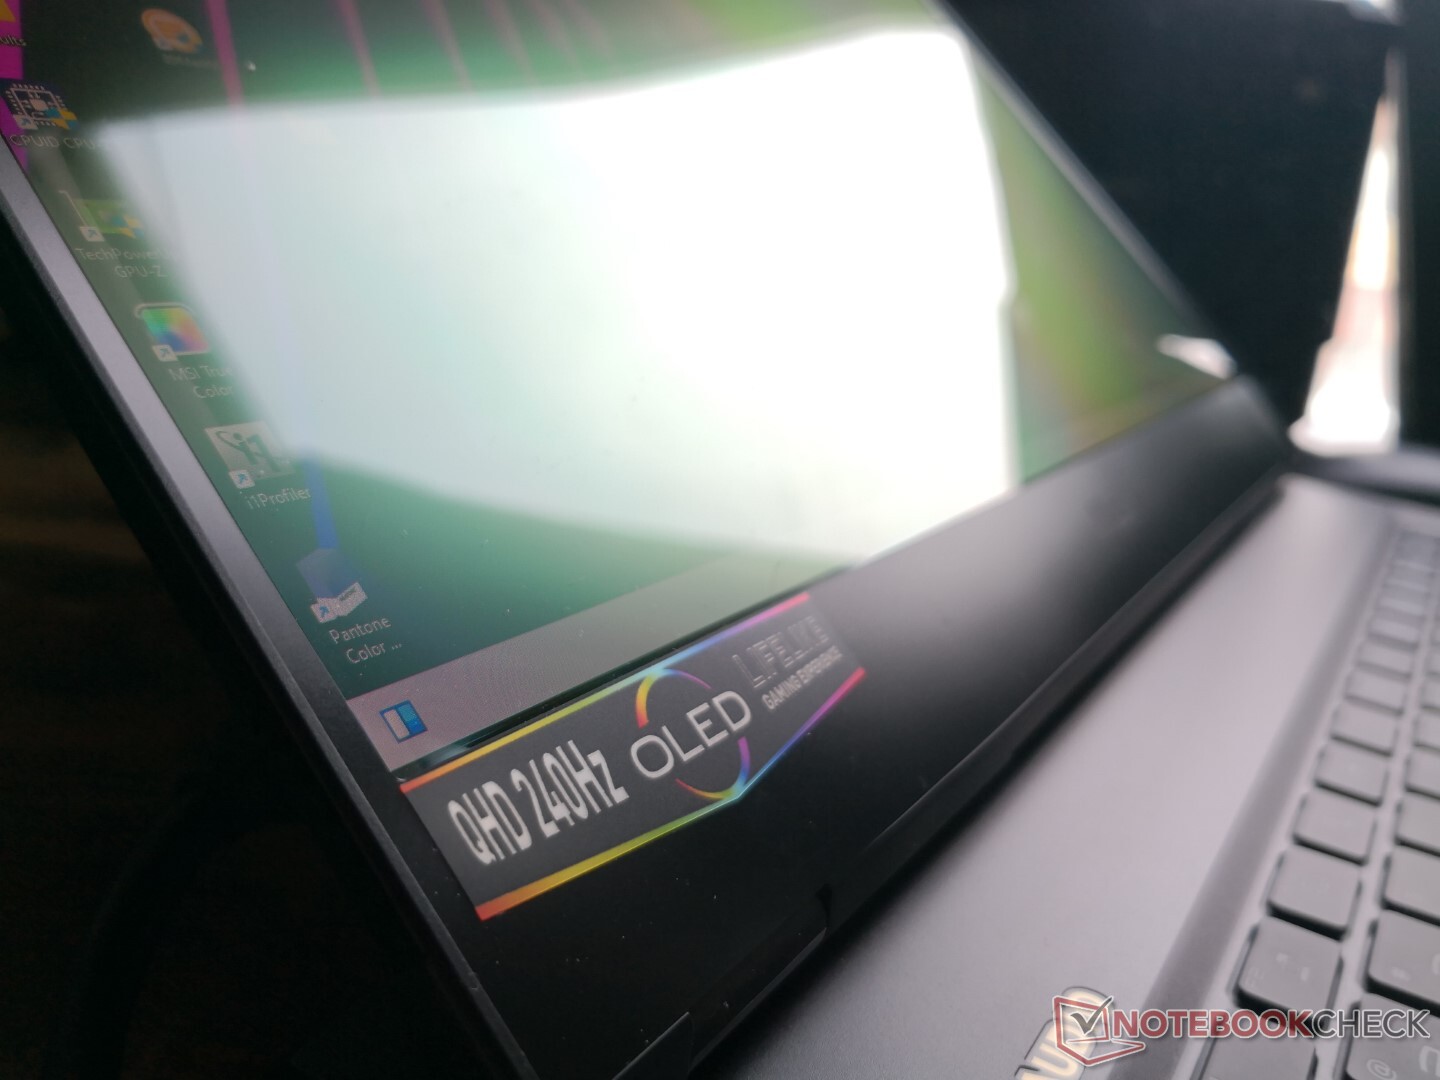
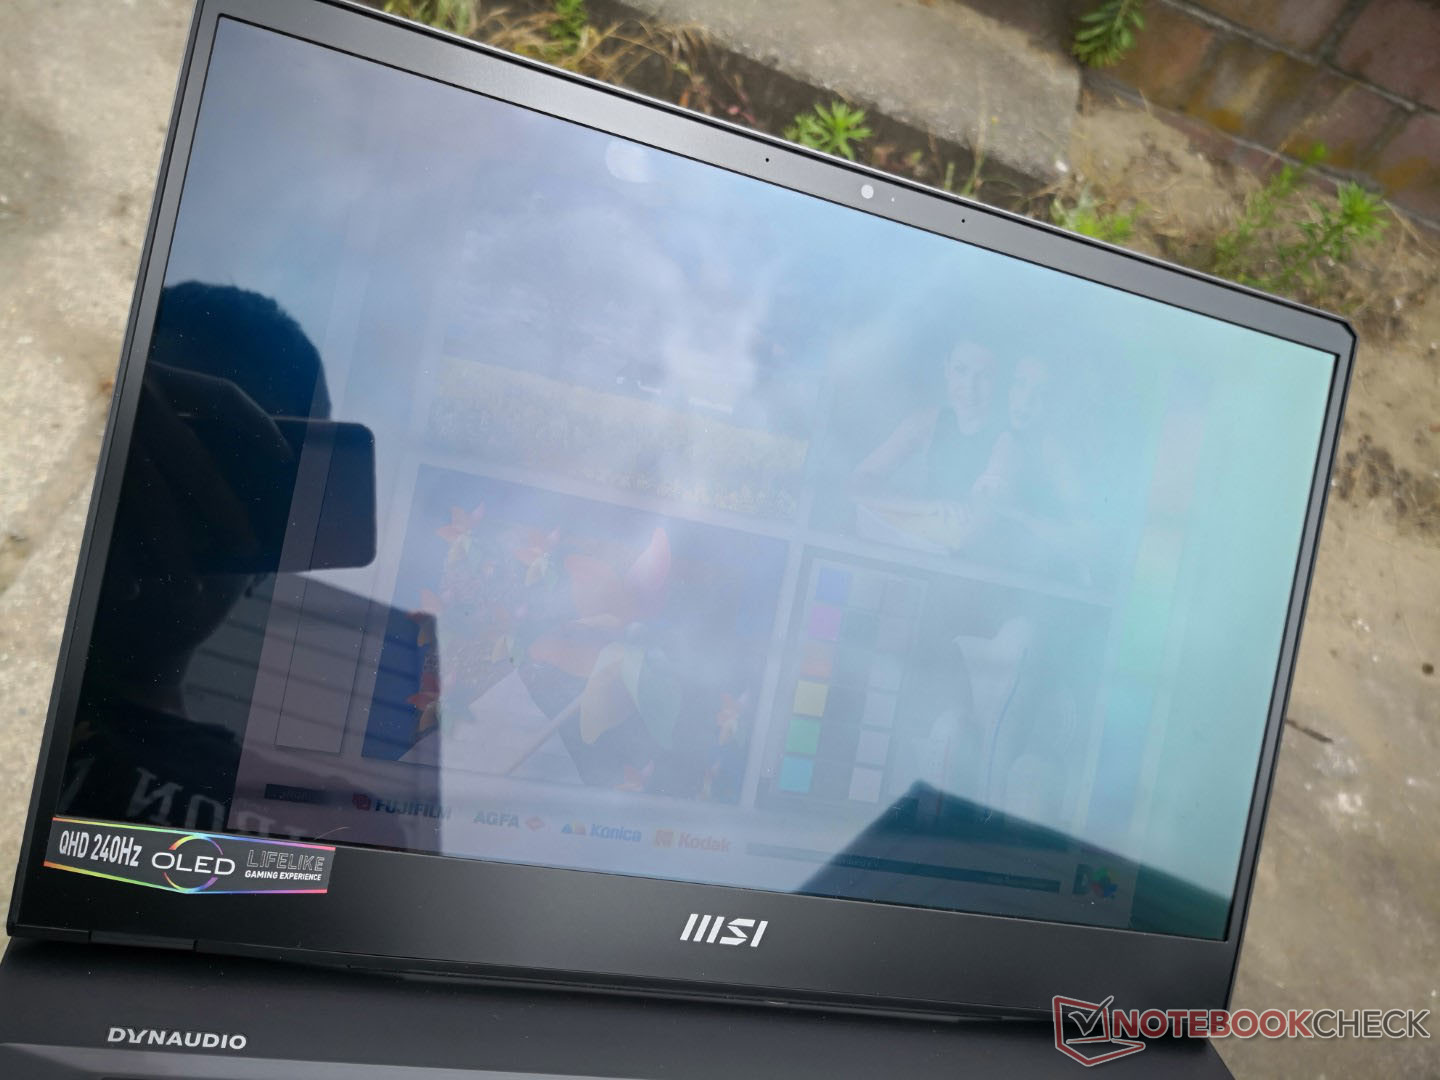
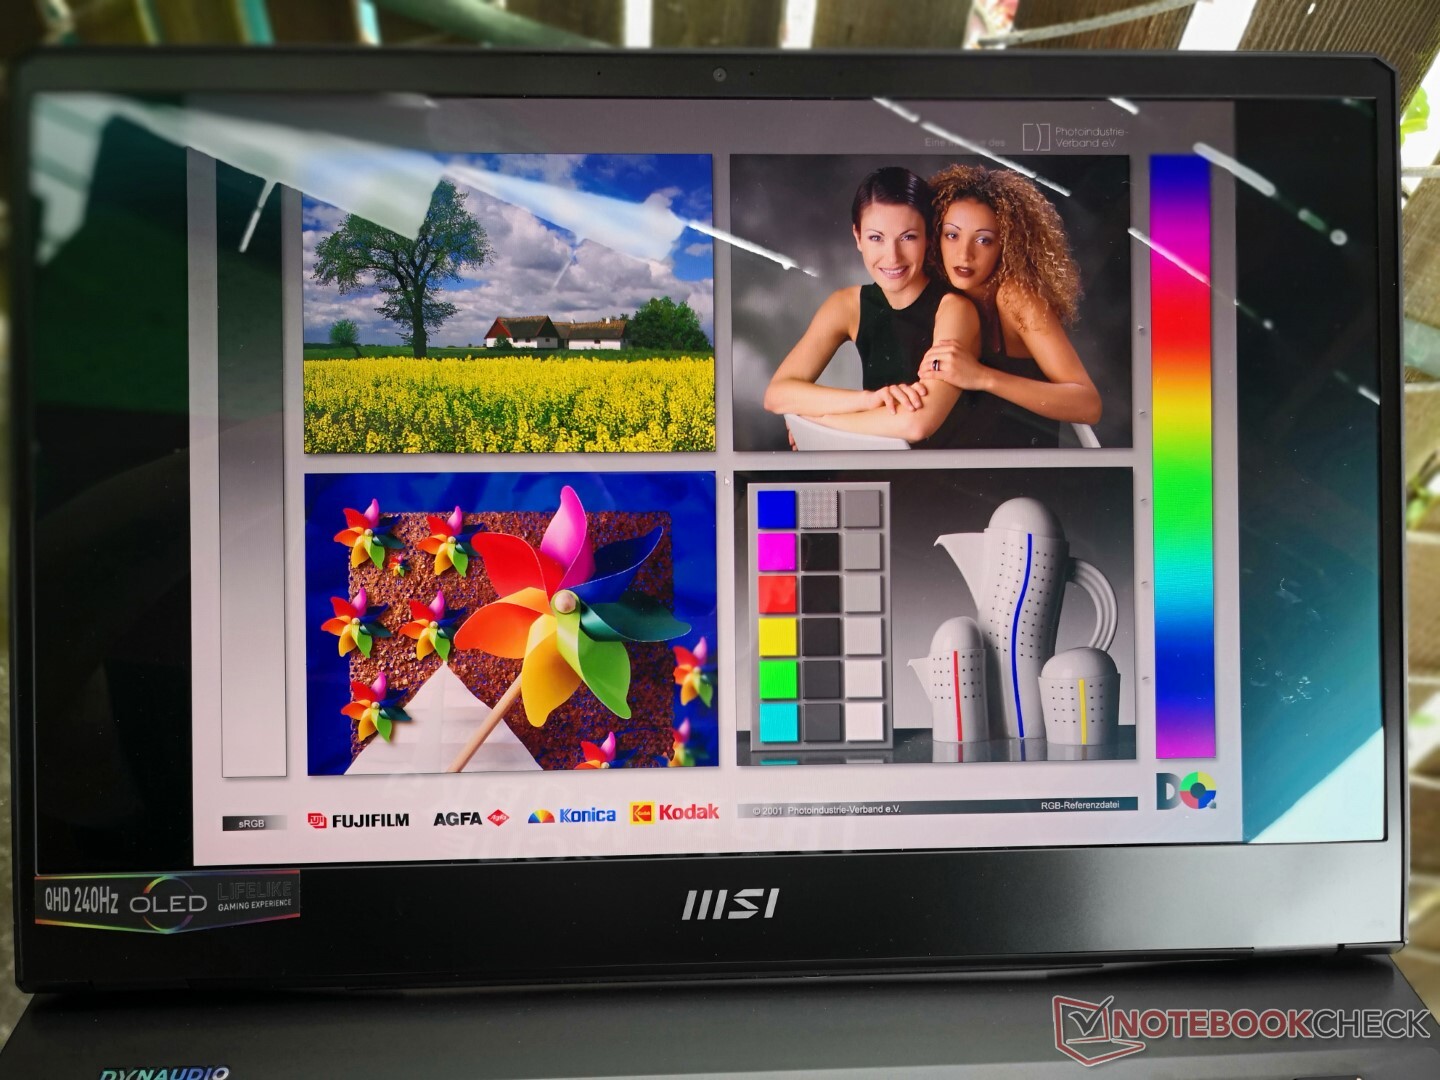
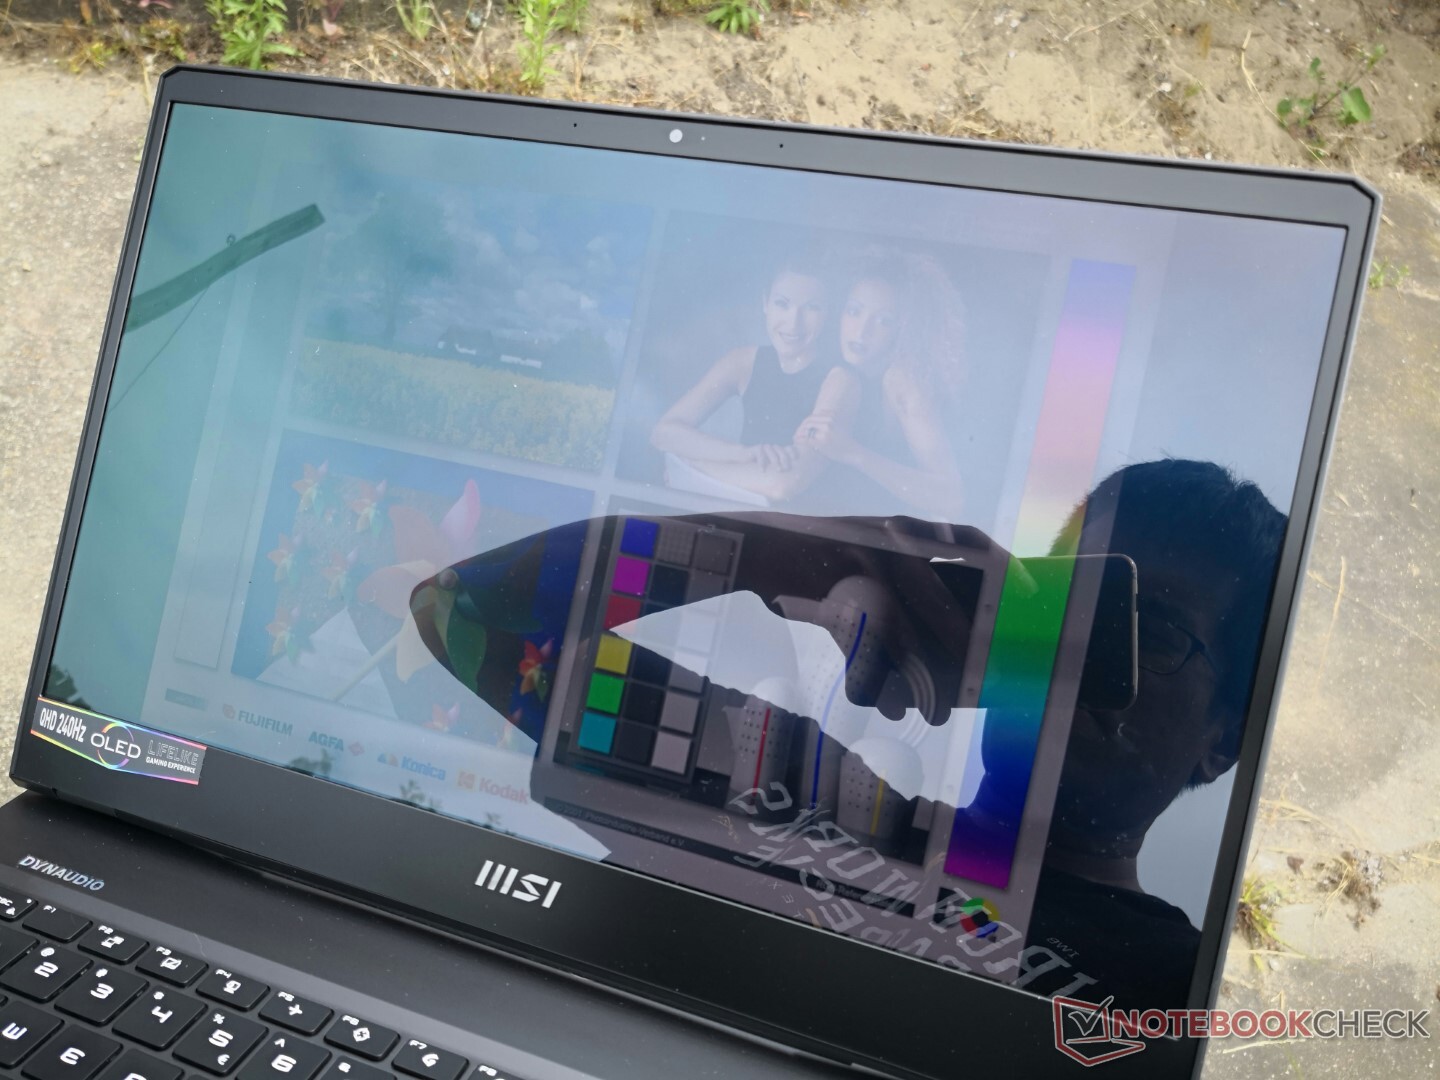
Skärm - Nästan perfekt för spel
MSI GE67 och MSI GE67 Razer Blade 15 är två av de första bärbara datorerna som erbjuder QHD OLED 240 Hz-skärmar. Även om detta kan låta utmärkt på pappret finns det några asterisker att tänka på
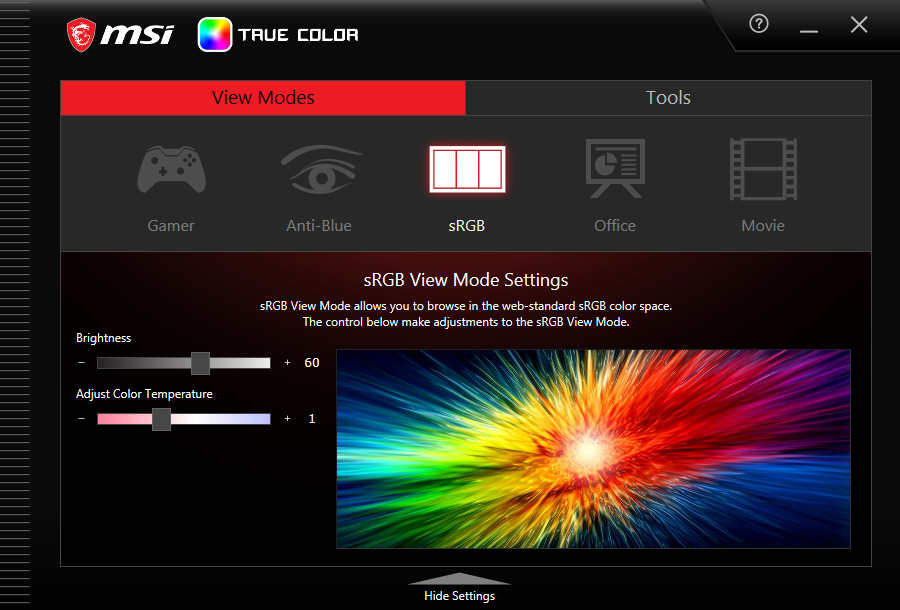
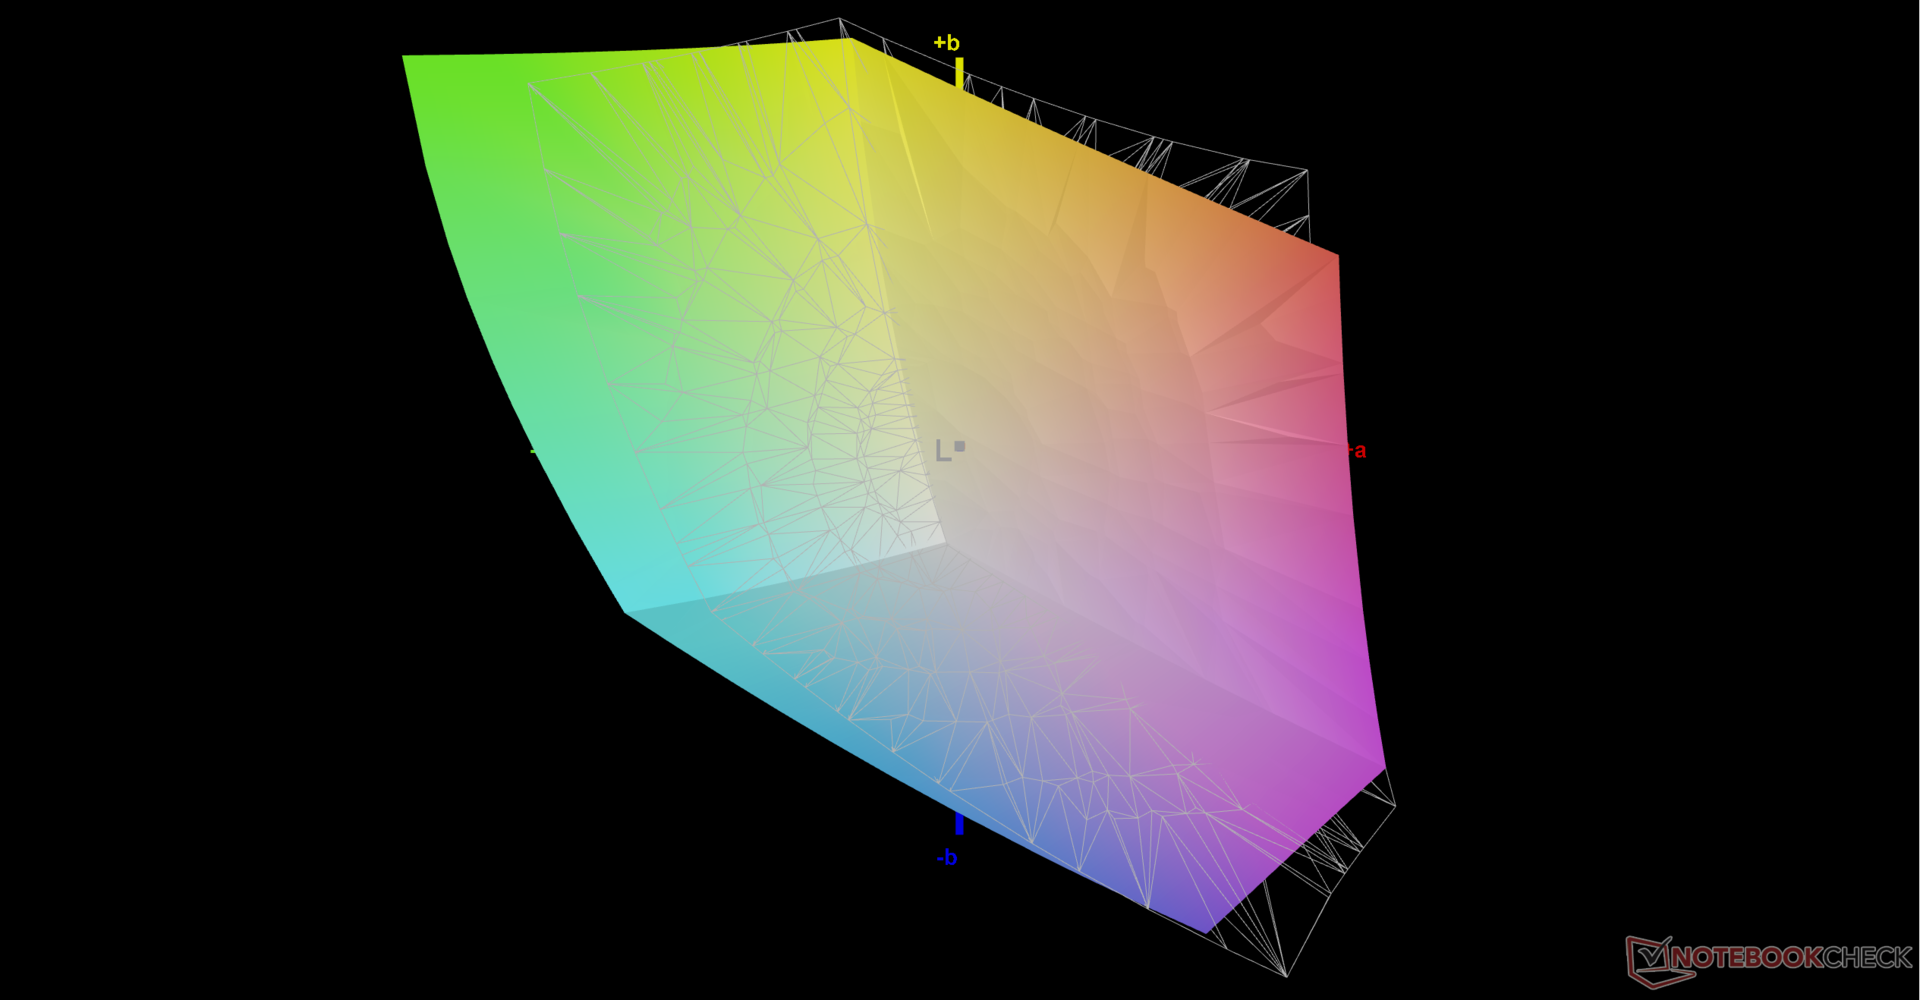
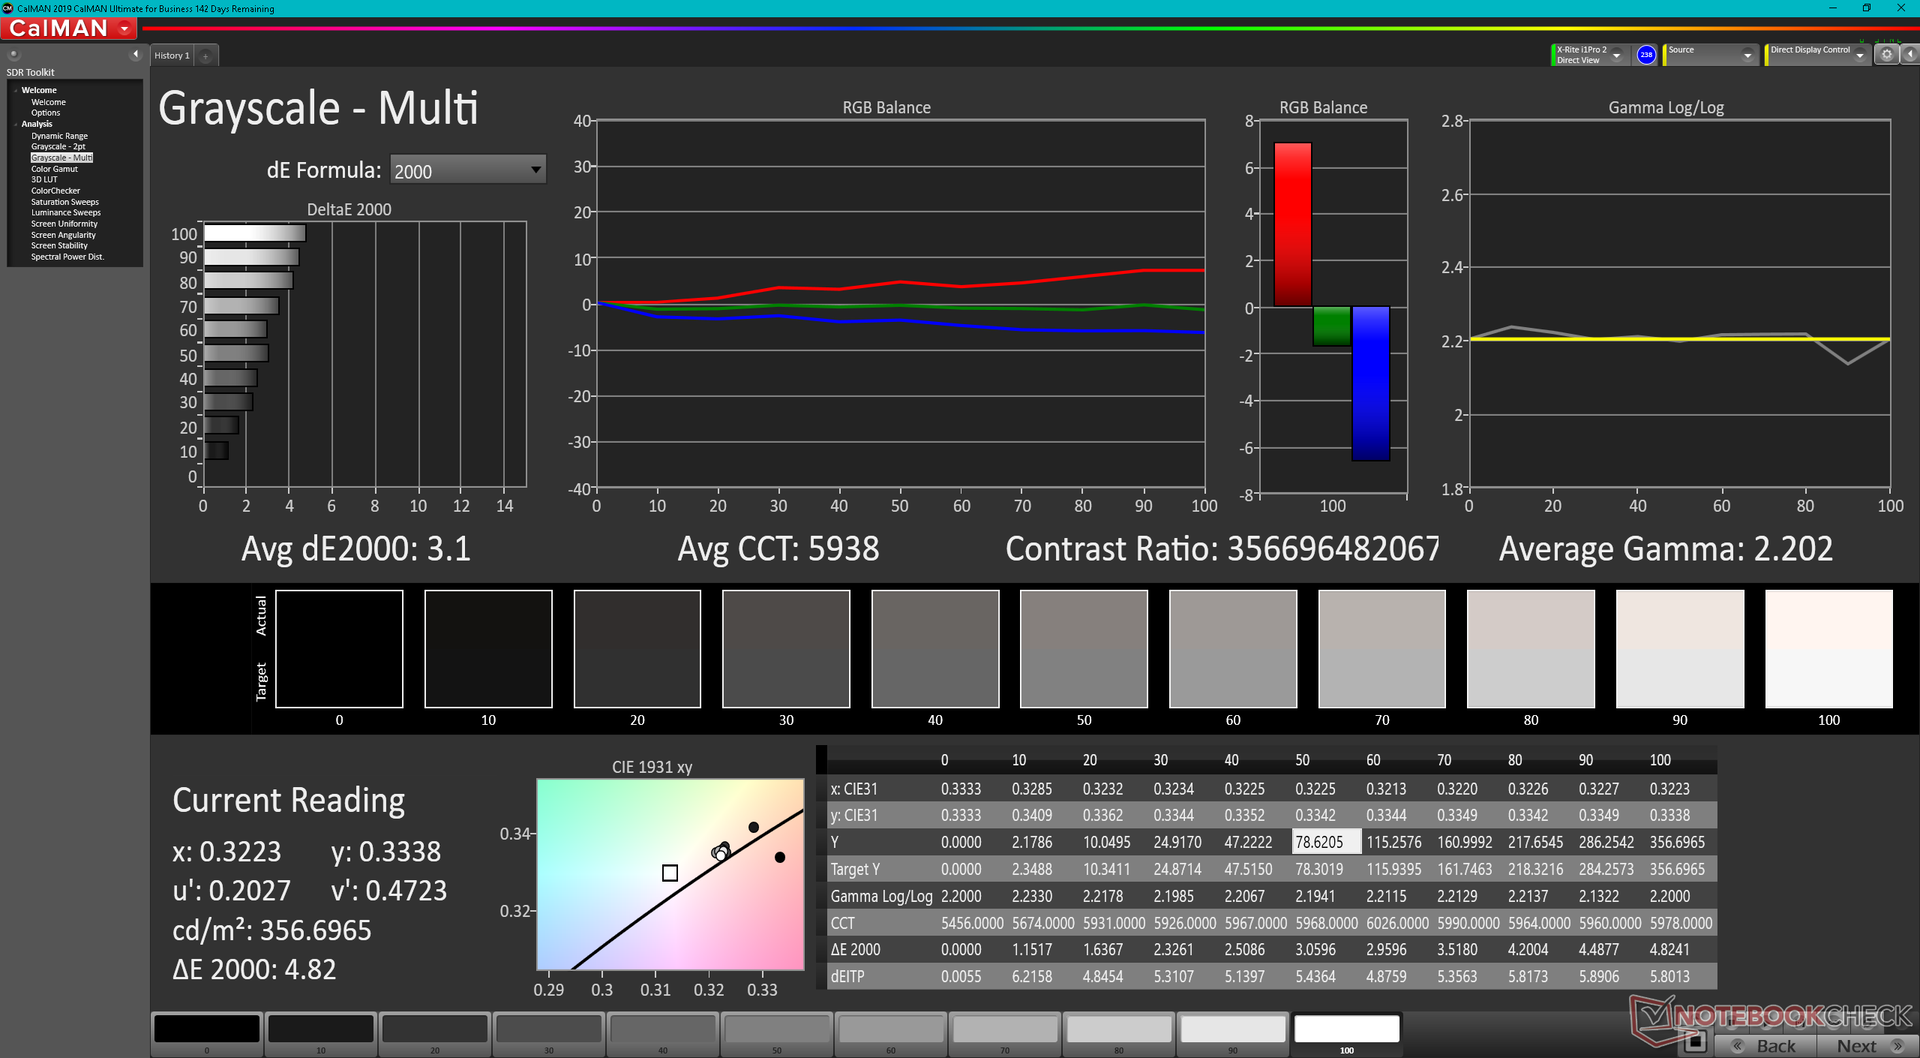
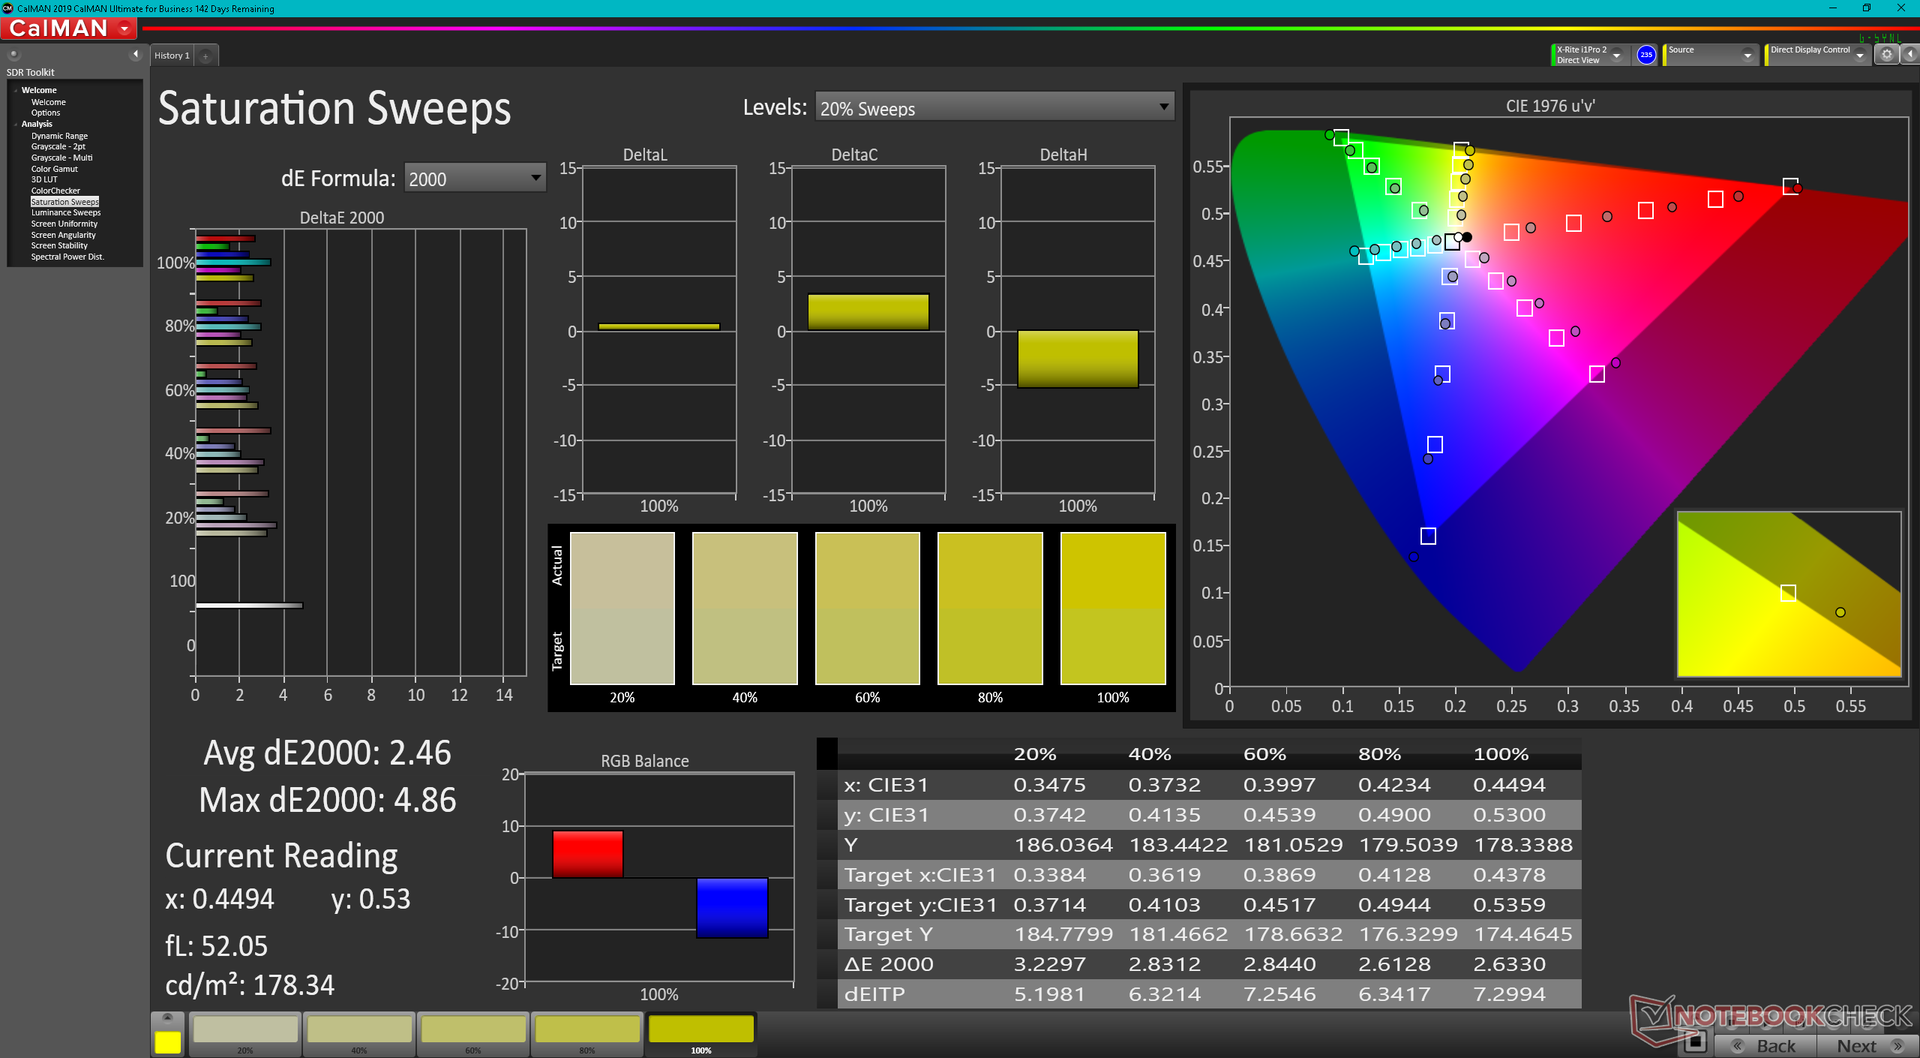
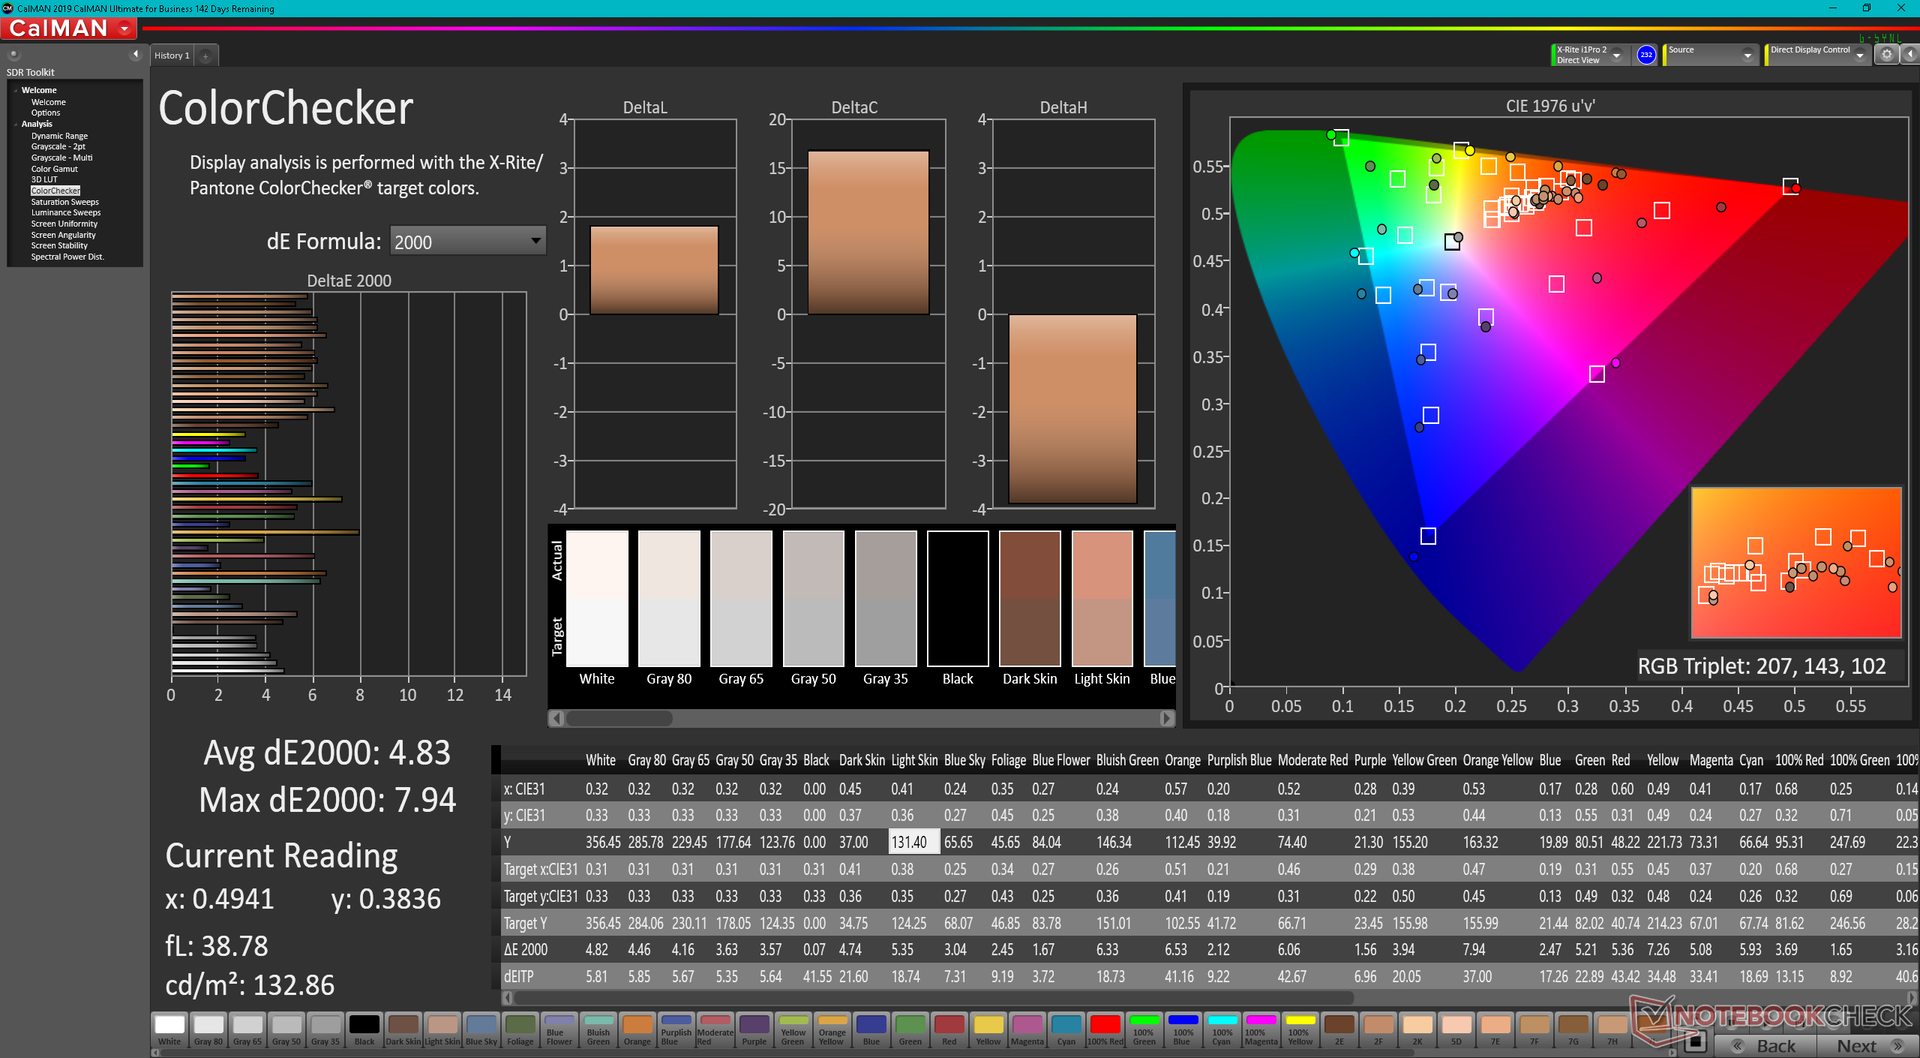
För det första är GE67-skärmen inte kalibrerad på fabriken även om OLED-panelen annonserar full DCI-P3-täckning. Faktum är att vi bara kan registrera en täckning på bara 72 procent och MSI True Color-programvaran i sig har inget DCI-P3-alternativ att välja mellan. När MSI pressades för en kommentar svarade MSI att DCI-P3-läget är "mer för videoredaktörer och på vår serie bärbara datorer Creator" och att GE67 implementerar Display P3-läget istället
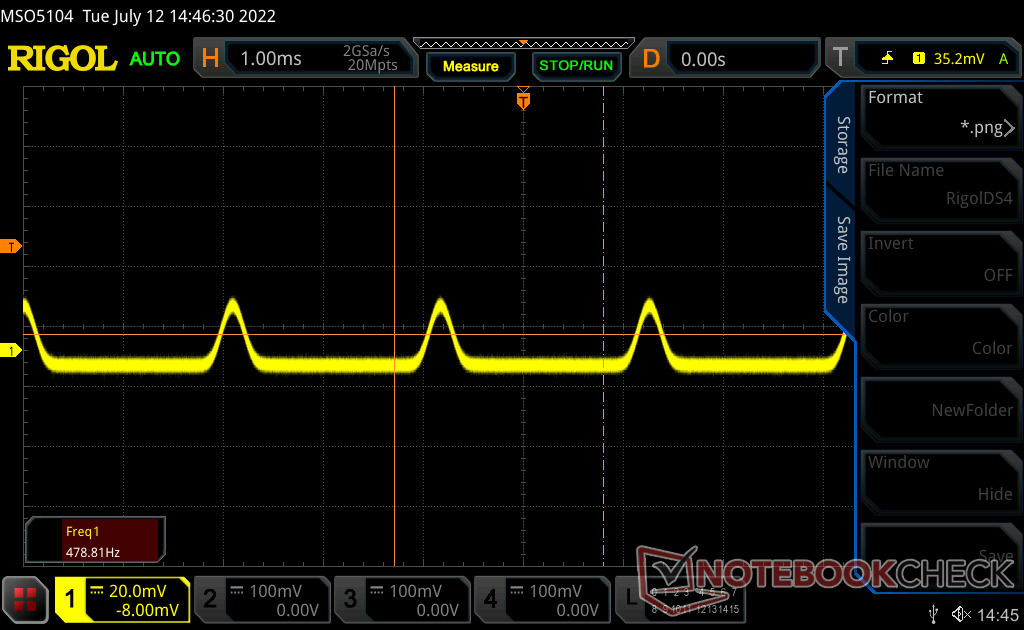
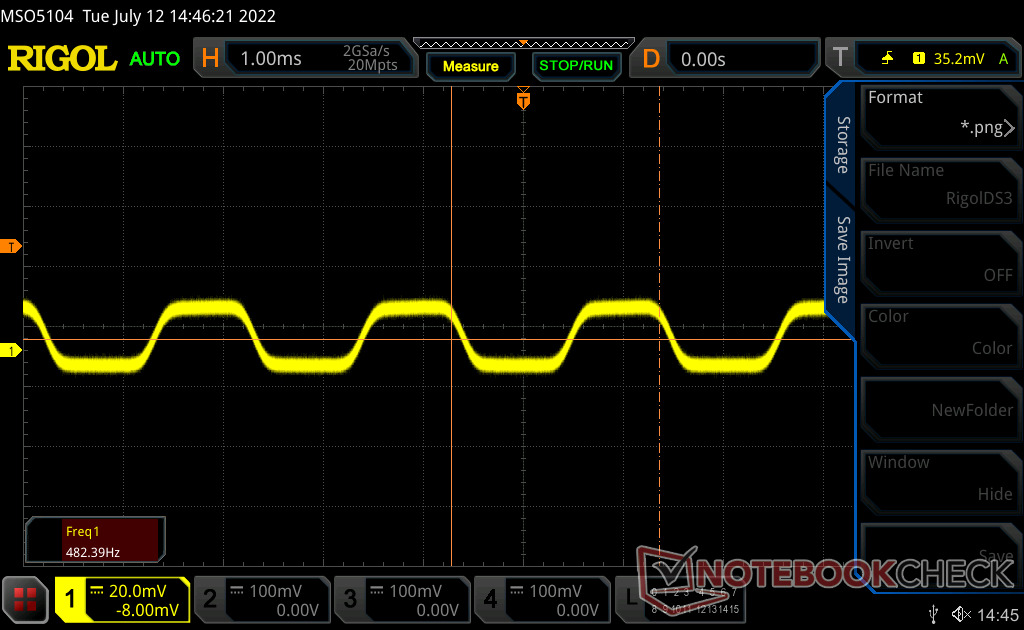
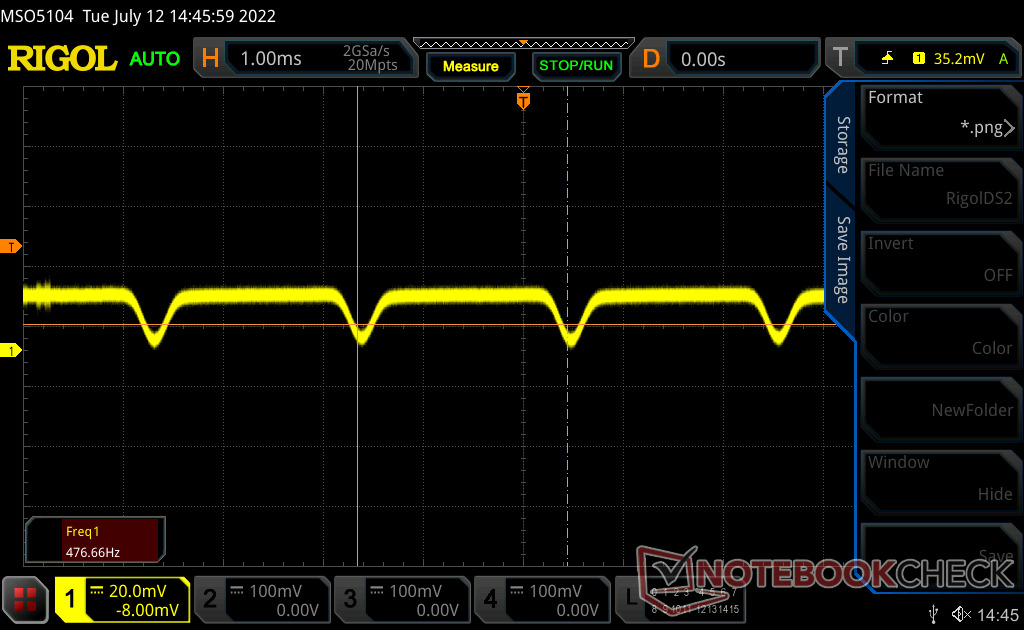
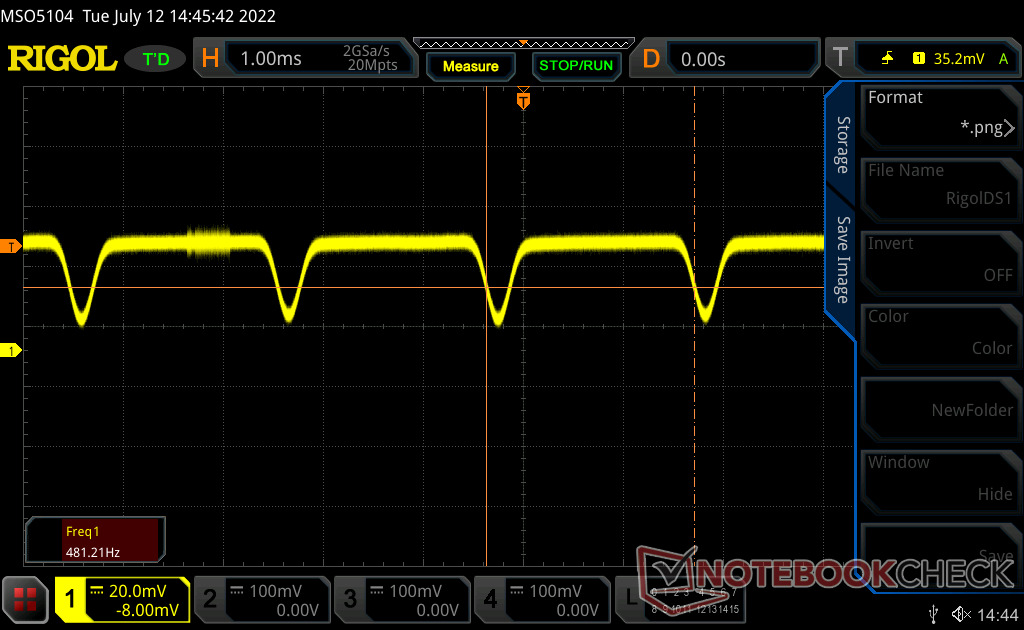
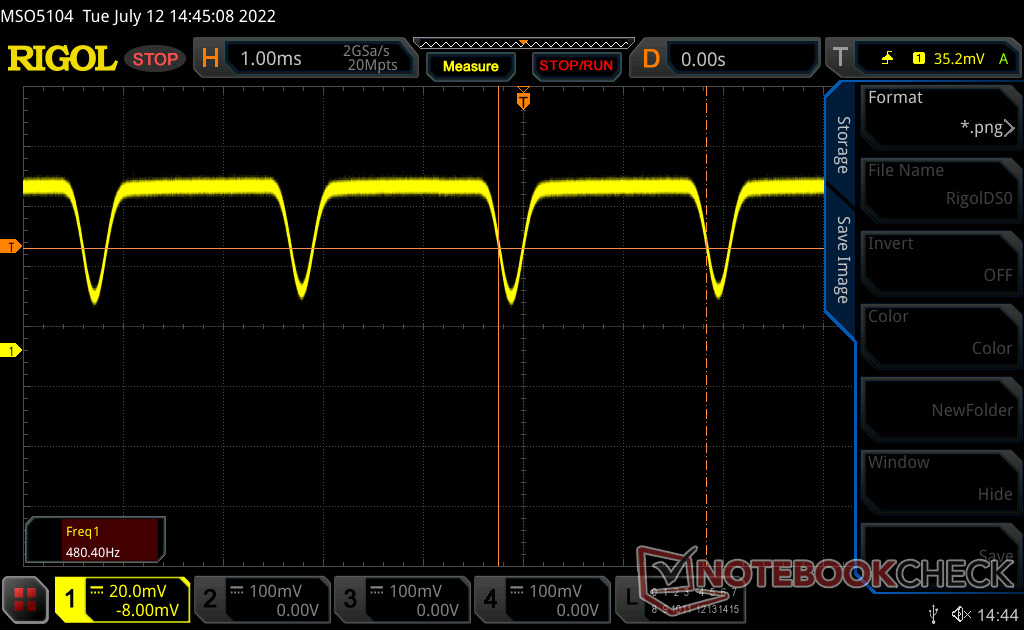
För det andra uppvisar panelen flimmer vid 480 Hz på alla ljusstyrkanivåer inklusive inställningen 100 procent. Vi har registrerat liknande resultat på många senaste Asus Vivobook och Zenbook OLED laptops också. Om dina ögon är känsliga för flimmer på skärmen kan det vara bäst att sänka ljusstyrkan eller undvika att använda GE67 under långa perioder
Och slutligen har den interna skärmen inte stöd för G-Sync eller adaptiv synkronisering
Bortsett från ovanstående nackdelar erbjuder QHD OLED 240 Hz-panelen definitivt en av de smidigaste OLED-upplevelser vi sett när vi spelar. Äldre OLED-paneler var begränsade till 60 Hz, vilket visserligen är helt okej för redigeringsändamål, men skulle vara oattraktivt för entusiastspelare. MSI har gjutet skärmen för speländamål och mindre för redigering eller proffs här.
| |||||||||||||||||||||||||
Distribution av ljusstyrkan: 99 %
Mitt på batteriet: 356.1 cd/m²
Kontrast: ∞:1 (Svärta: 0 cd/m²)
ΔE ColorChecker Calman: 4.83 | ∀{0.5-29.43 Ø4.71}
ΔE Greyscale Calman: 3.1 | ∀{0.09-98 Ø4.96}
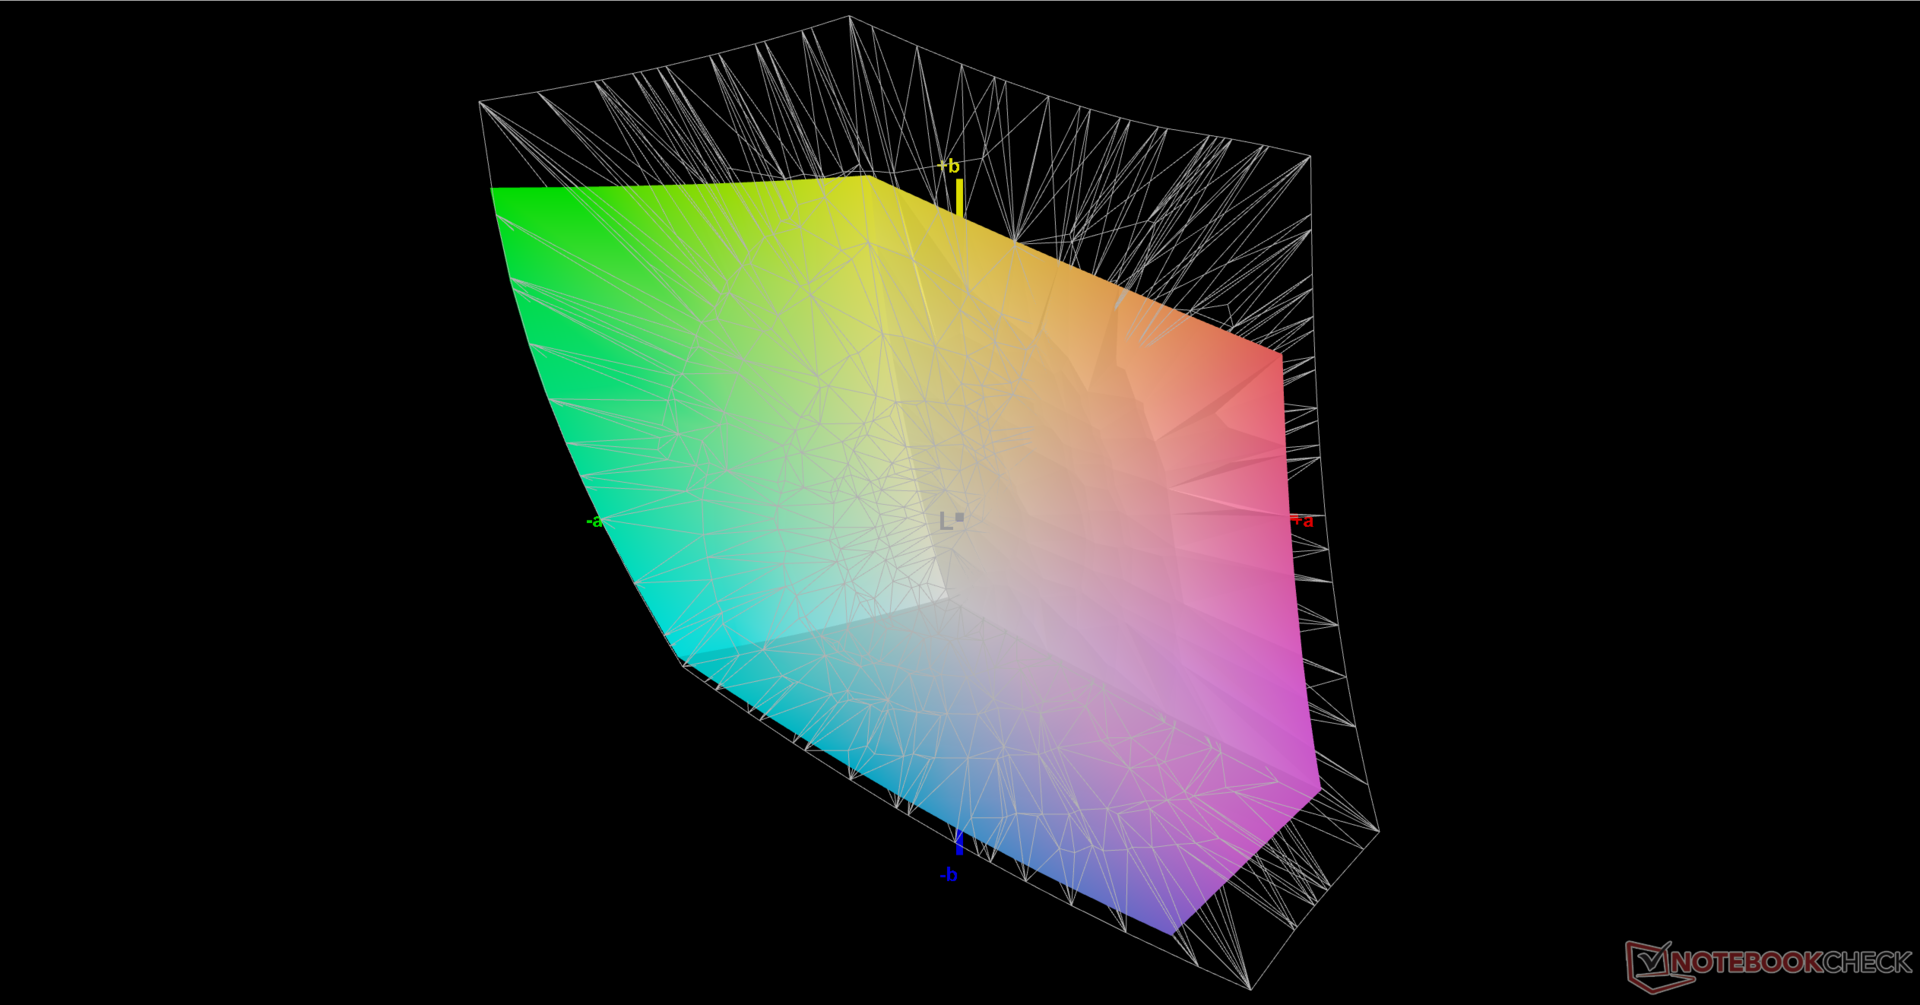
75.2% AdobeRGB 1998 (Argyll 3D)
89.7% sRGB (Argyll 3D)
71.7% Display P3 (Argyll 3D)
Gamma: 2.2
CCT: 5938 K
| MSI GE67 HX 12UGS Samsung ATNA562P02-0, OLED, 1920x1080, 15.6" | MSI Raider GE66 12UHS AUO51EB, IPS, 3840x2160, 15.6" | MSI Vector GP66 12UGS BOE NE156FHM-NZ3, IPS, 1920x1080, 15.6" | Asus ROG Strix Scar 15 G533ZW-LN106WS BOE CQ NE156QHM-NZ2, IPS-level, 2560x1440, 15.6" | Alienware m15 R6, i7-11800H RTX 3080 AU Optronics AUO9092 (B156HAN), IPS, 1920x1080, 15.6" | Razer Blade 15 2022 Sharp LQ156T1JW03, IPS, 2560x1440, 15.6" | |
|---|---|---|---|---|---|---|
| Display | 16% | 2% | 19% | 5% | 21% | |
| Display P3 Coverage (%) | 71.7 | 80.4 12% | 70.1 -2% | 96.2 34% | 74.1 3% | 99.1 38% |
| sRGB Coverage (%) | 89.7 | 98.4 10% | 99.5 11% | 99.9 11% | 99.5 11% | 99.9 11% |
| AdobeRGB 1998 Coverage (%) | 75.2 | 94.7 26% | 72.1 -4% | 84.5 12% | 75.7 1% | 86.8 15% |
| Response Times | -5260% | -2260% | -2134% | -1160% | -4230% | |
| Response Time Grey 50% / Grey 80% * (ms) | 0.25 ? | 18.8 ? -7420% | 5.8 ? -2220% | 7.86 ? -3044% 4.21 ? -1584% | 2.8 -1020% | 14.4 ? -5660% |
| Response Time Black / White * (ms) | 0.4 ? | 12.8 ? -3100% | 9.6 ? -2300% | 7.5 ? -1775% | 5.6 -1300% | 11.6 ? -2800% |
| PWM Frequency (Hz) | 480.4 ? | |||||
| Screen | -1% | 6% | 9% | 6% | 15% | |
| Brightness middle (cd/m²) | 356.1 | 351 -1% | 353.1 -1% | 346 -3% | 359 1% | 286 -20% |
| Brightness (cd/m²) | 358 | 347 -3% | 325 -9% | 329 -8% | 344 -4% | 271 -24% |
| Brightness Distribution (%) | 99 | 90 -9% | 85 -14% | 91 -8% | 85 -14% | 89 -10% |
| Black Level * (cd/m²) | 0.35 | 0.38 | 0.59 | 0.35 | 0.25 | |
| Colorchecker dE 2000 * | 4.83 | 2.54 47% | 2.24 54% | 3.06 37% | 3.3 32% | 2.74 43% |
| Colorchecker dE 2000 max. * | 7.94 | 8.36 -5% | 5 37% | 5.81 27% | 4.84 39% | 5.21 34% |
| Greyscale dE 2000 * | 3.1 | 4.1 -32% | 4 -29% | 3.66 -18% | 1.1 65% | |
| Gamma | 2.2 100% | 2.089 105% | 2.24 98% | 2.12 104% | 2.43 91% | 2.2 100% |
| CCT | 5938 109% | 7036 92% | 6864 95% | 7021 93% | 5896 110% | 6408 101% |
| Contrast (:1) | 1003 | 929 | 586 | 1026 | 1144 | |
| Colorchecker dE 2000 calibrated * | 0.67 | 1.02 | 2.57 | 3.28 | 2.52 | |
| Totalt genomsnitt (program/inställningar) | -1748% /
-952% | -751% /
-407% | -702% /
-573% | -383% /
-206% | -1398% /
-755% |
* ... mindre är bättre
Visa svarstider
| ↔ Svarstid svart till vitt | ||
|---|---|---|
| 0.4 ms ... stiga ↗ och falla ↘ kombinerat | ↗ 0.2 ms stiga | 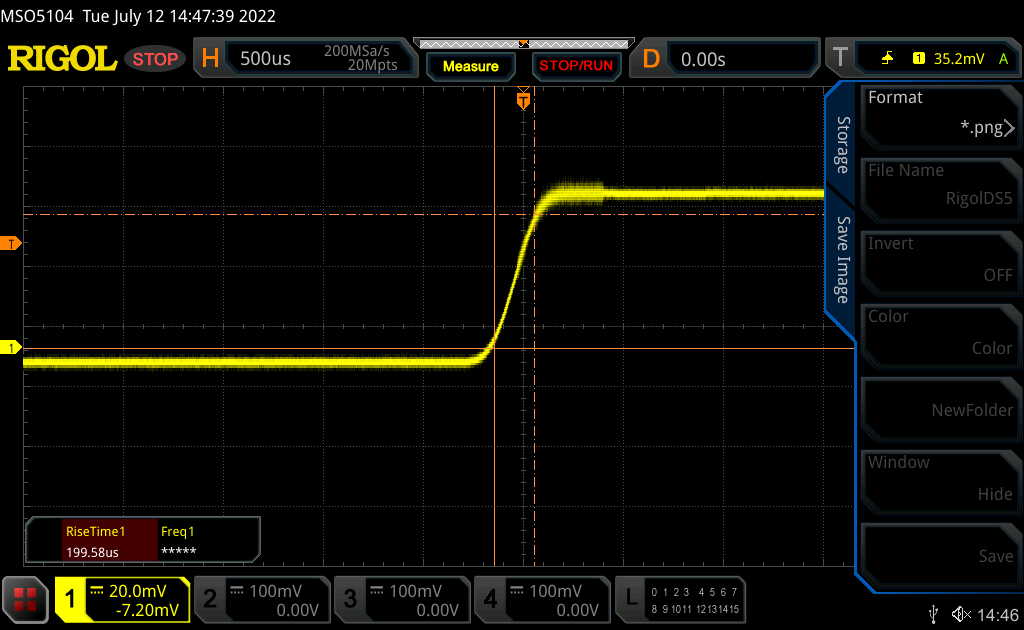 |
| ↘ 0.2 ms hösten | ||
| Skärmen visar väldigt snabba svarsfrekvenser i våra tester och borde vara mycket väl lämpad för fartfyllt spel. I jämförelse sträcker sig alla testade enheter från 0.1 (minst) till 240 (maximalt) ms. » 0 % av alla enheter är bättre. Det betyder att den uppmätta svarstiden är bättre än genomsnittet av alla testade enheter (19.8 ms). | ||
| ↔ Svarstid 50 % grått till 80 % grått | ||
| 0.25 ms ... stiga ↗ och falla ↘ kombinerat | ↗ 0.13 ms stiga | 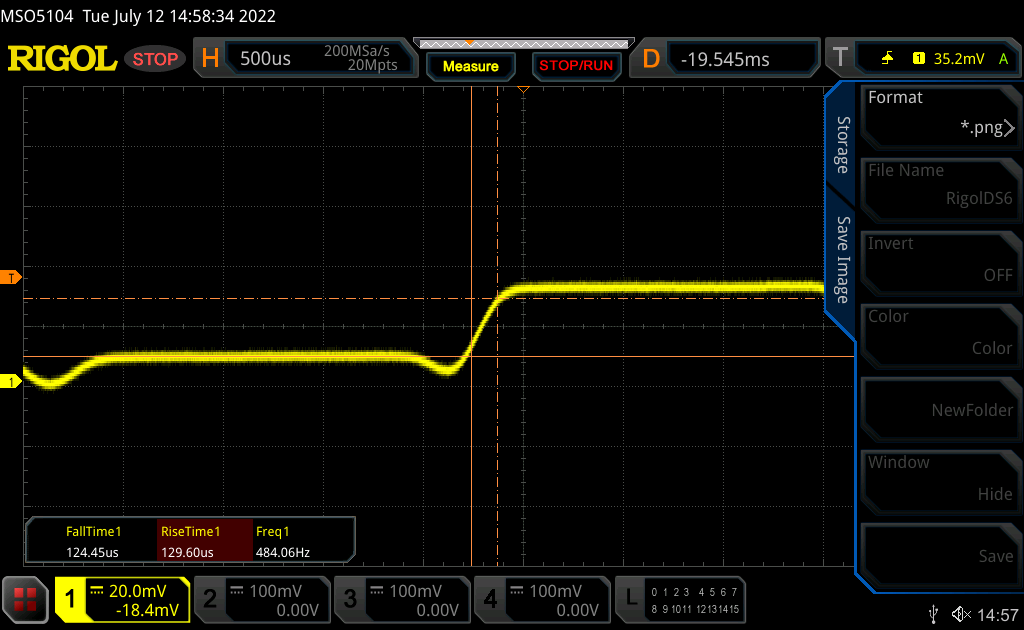 |
| ↘ 0.12 ms hösten | ||
| Skärmen visar väldigt snabba svarsfrekvenser i våra tester och borde vara mycket väl lämpad för fartfyllt spel. I jämförelse sträcker sig alla testade enheter från 0.165 (minst) till 636 (maximalt) ms. » 0 % av alla enheter är bättre. Det betyder att den uppmätta svarstiden är bättre än genomsnittet av alla testade enheter (31 ms). | ||
Skärmflimmer / PWM (Puls-Width Modulation)
| Skärmflimmer / PWM upptäckt | 480.4 Hz | ≤ 100 % ljusstyrka inställning |  |
Displayens bakgrundsbelysning flimrar vid 480.4 Hz (i värsta fall, t.ex. med PWM) Flimrande upptäckt vid en ljusstyrkeinställning på 100 % och lägre. Det ska inte finnas något flimmer eller PWM över denna ljusstyrkeinställning. Frekvensen för 480.4 Hz är relativt hög, så de flesta användare som är känsliga för PWM bör inte märka något flimmer. Det finns dock rapporter om att vissa användare fortfarande är känsliga för PWM vid 500 Hz och högre, så var uppmärksam. Som jämförelse: 52 % av alla testade enheter använder inte PWM för att dämpa skärmen. Om PWM upptäcktes mättes ett medelvärde av 7757 (minst: 5 - maximum: 343500) Hz. | |||

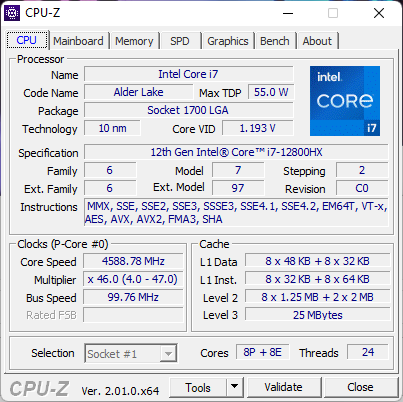
Prestanda - 16 kärnor och 24 trådar
Provningsförhållanden
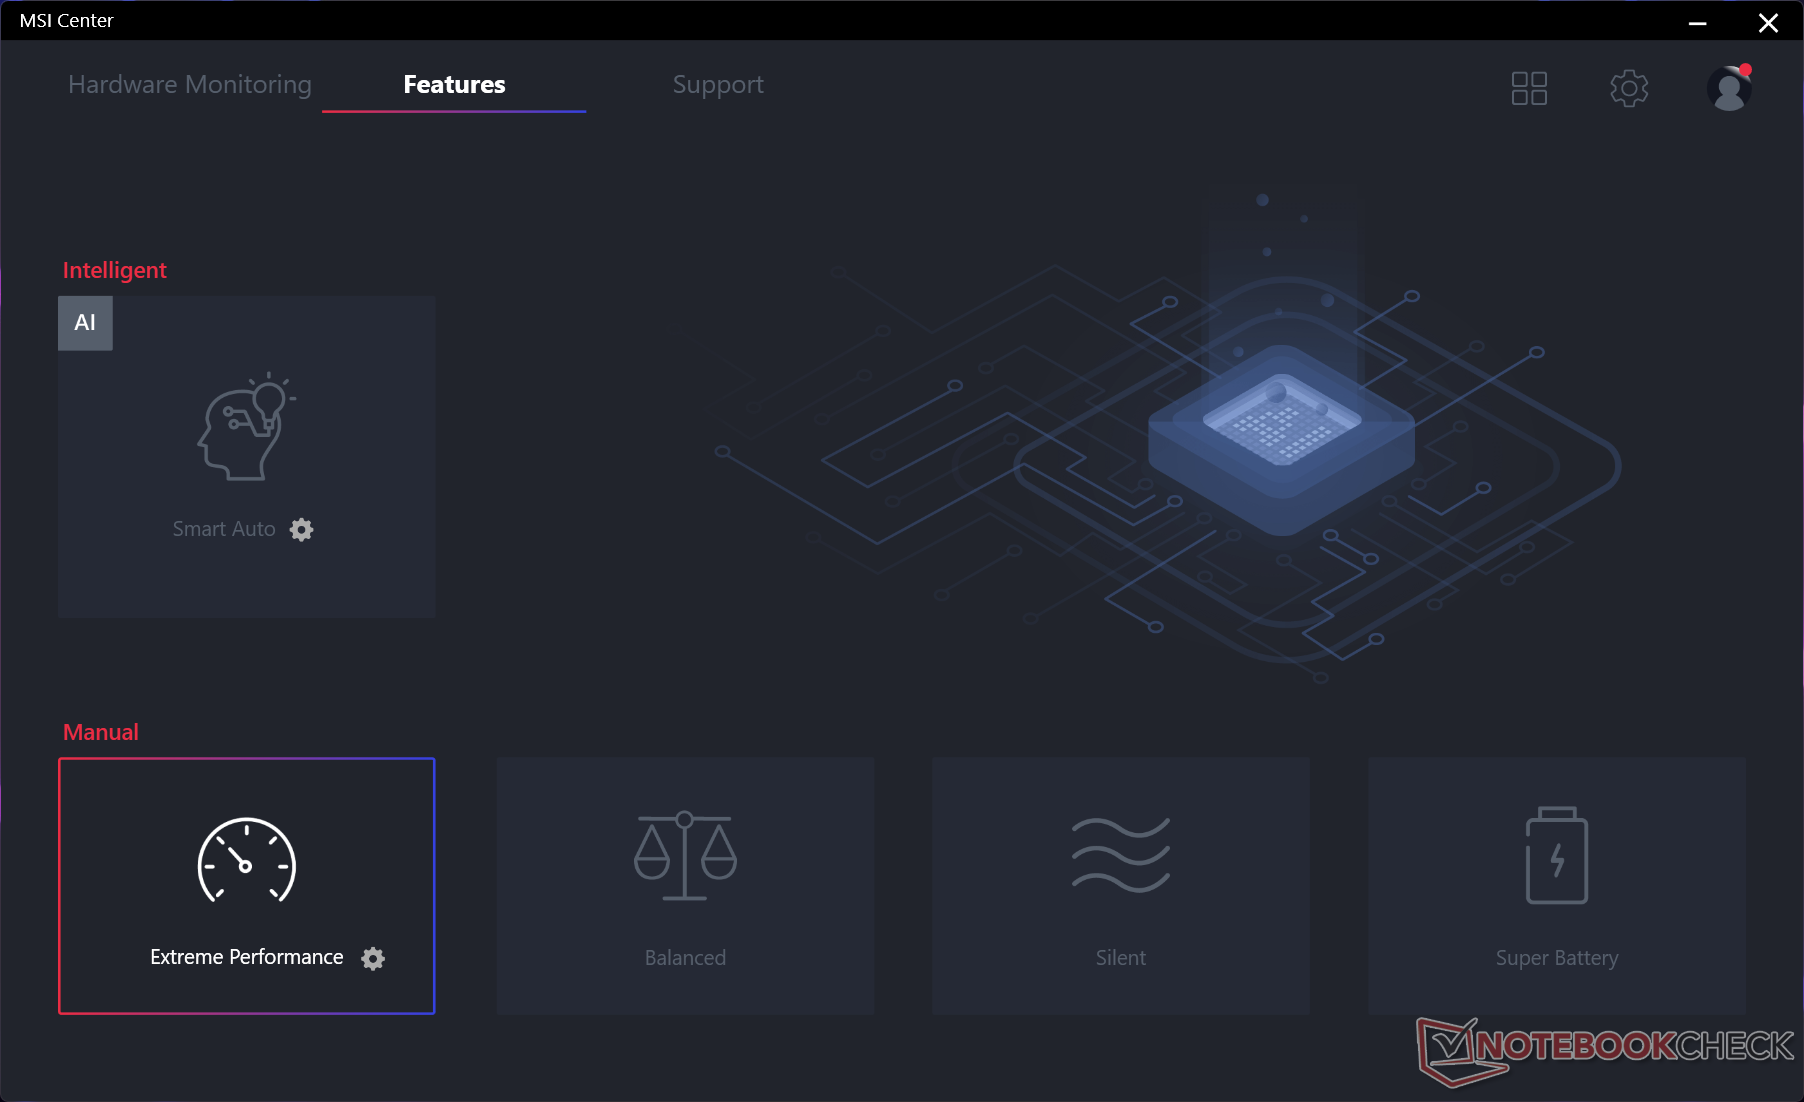
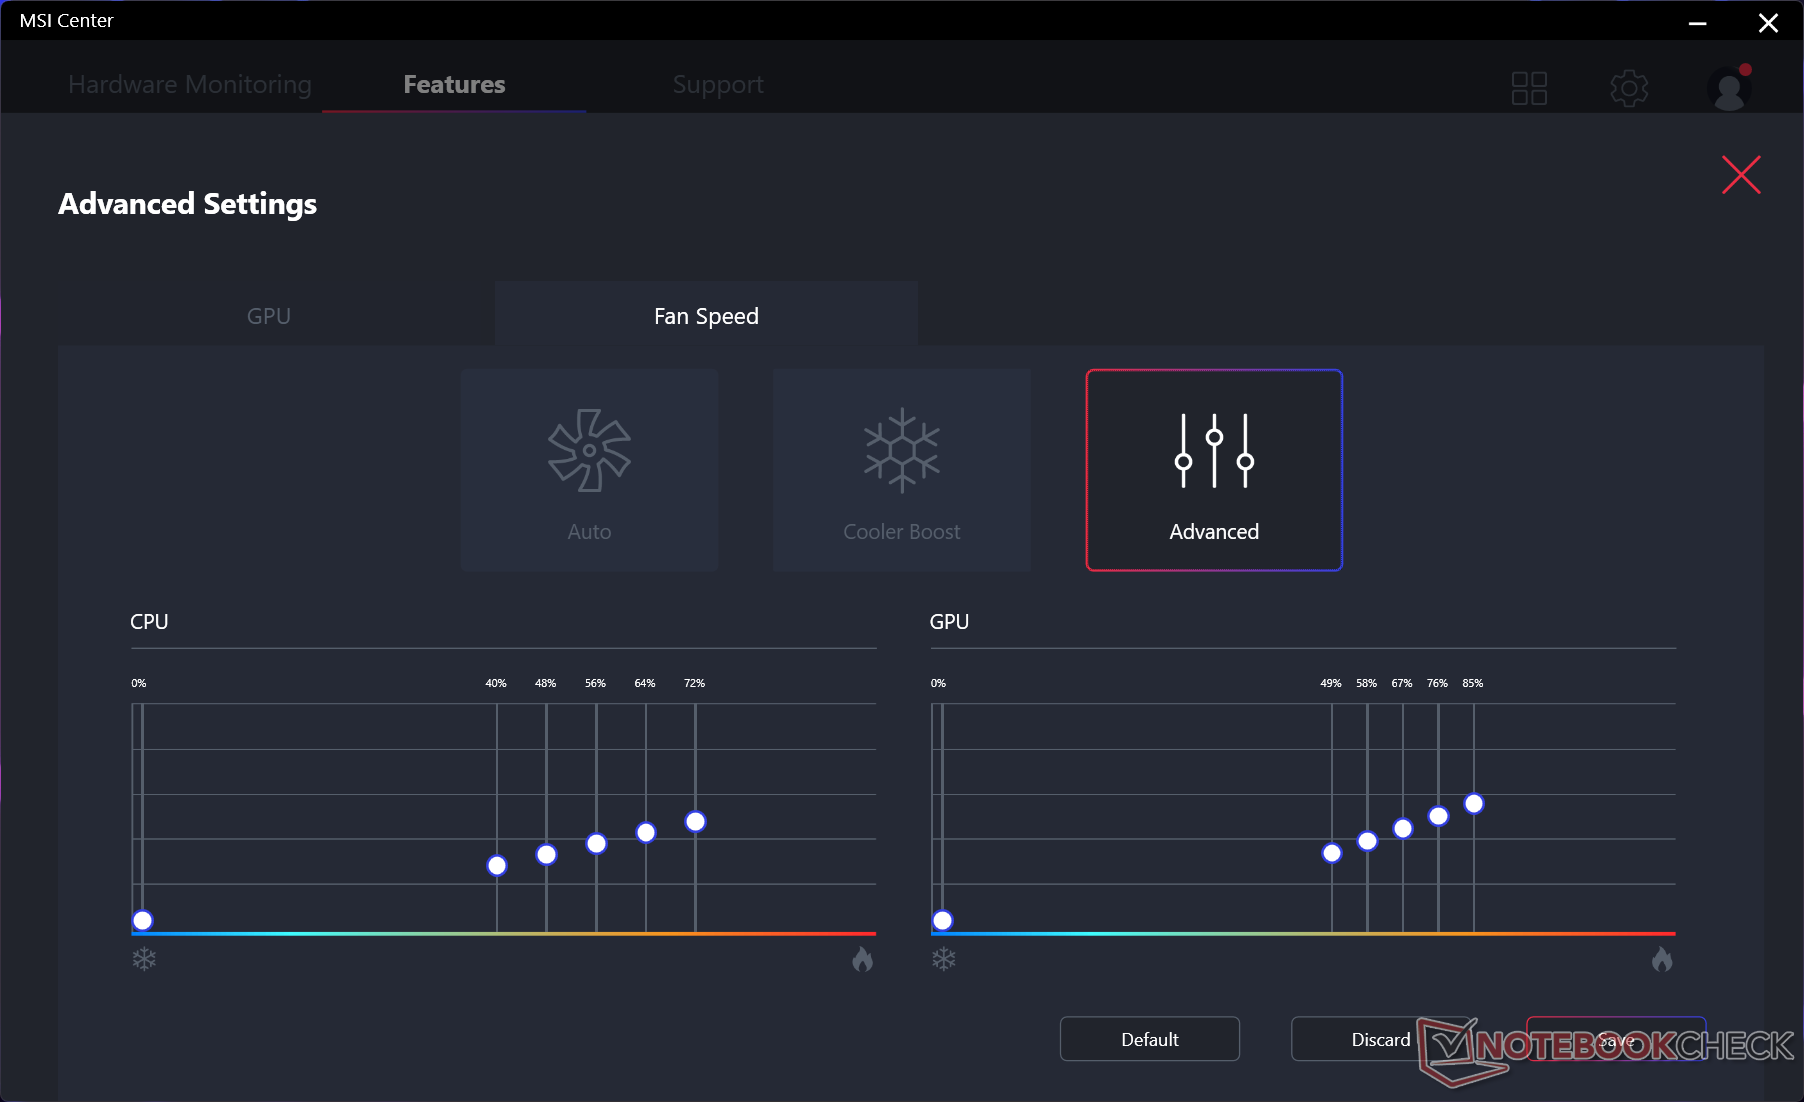
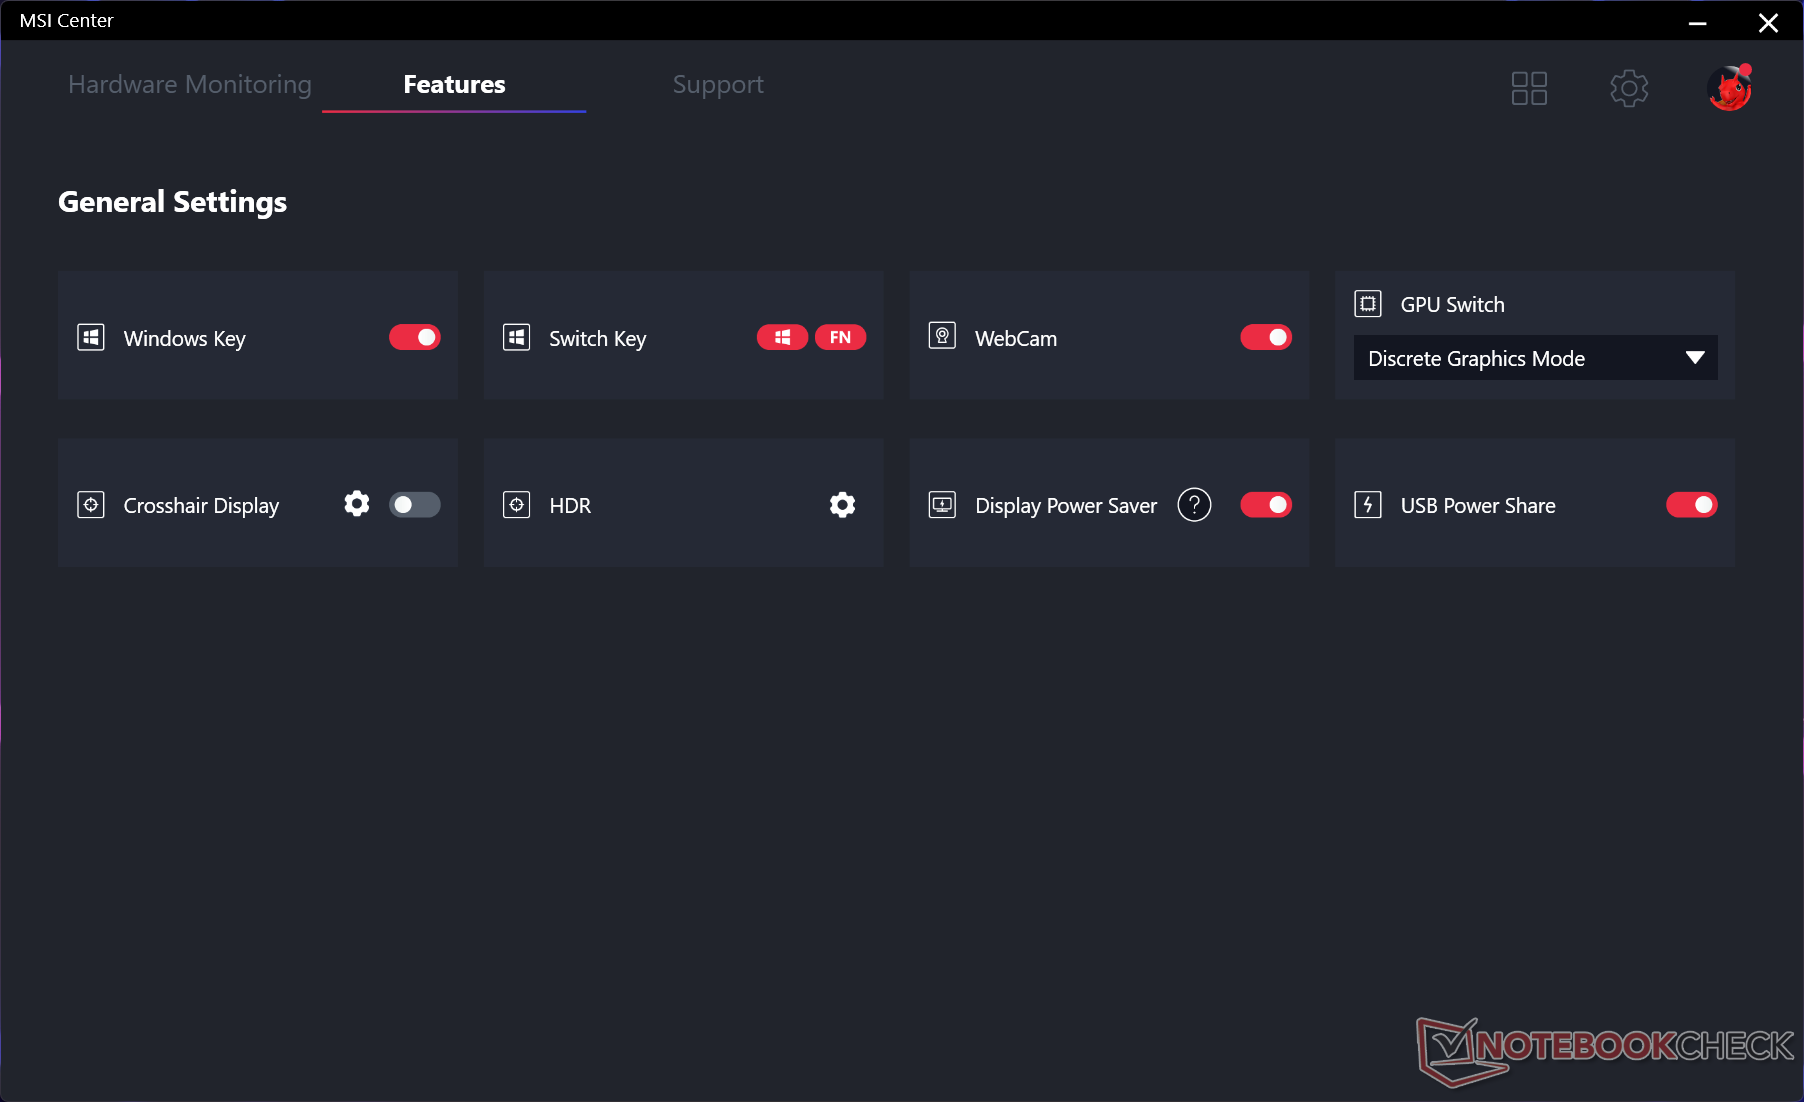
Vi ställde in vår enhet på Performance mode via Windows, Extreme Performance mode via MSI Center och den diskreta GPU:n var aktiv i stället för MSHybrid-läge innan vi körde några benchmarks nedan. Vi rekommenderar att användarna bekantar sig med den förinstallerade MSI Center-programvaran eftersom viktiga prestandafunktioner och hjälpfunktioner växlas upp här.
Processor
Core i7-12800HX är utan tvekan en av höjdpunkterna i GE67 HX. Den råa prestandan för flera trådar är ungefär 25 procent snabbare än denCore i9-12900HK i Q1 2022 GE66 och detta delta är ännu större när man jämför med den 10:e gen Core i9-10980HK i den ursprungliga GE66 från 2020. Den överträffar lätt alla mobila processorer i AMD:s Zen 3-uppsättning. Ryzen 9 5900HXär till exempel 40-45 procent långsammare vid flertrådig belastning
Prestandahållbarheten är också mycket god utan några större nedgångar i klockfrekvensen över tid, även när den stressas under långa perioder
Prestandan för entrådiga enheter är likadan som Core i9-12900HK trots skillnaderna i antal kärnor (16 jämfört med 14) och antal trådar (24 jämfört med 20).
Cinebench R15 Multi Loop
Cinebench R23: Multi Core | Single Core
Cinebench R15: CPU Multi 64Bit | CPU Single 64Bit
Blender: v2.79 BMW27 CPU
7-Zip 18.03: 7z b 4 | 7z b 4 -mmt1
Geekbench 5.5: Multi-Core | Single-Core
HWBOT x265 Benchmark v2.2: 4k Preset
LibreOffice : 20 Documents To PDF
R Benchmark 2.5: Overall mean
| Cinebench R20 / CPU (Multi Core) | |
| Intel Core i9-12900K | |
| MSI GE67 HX 12UGS | |
| Genomsnitt Intel Core i7-12800HX (n=1) | |
| Eurocom Raptor X15 | |
| MSI GE76 Raider | |
| Schenker XMG Neo 15 (i7-12700H, RTX 3080 Ti) | |
| MSI Raider GE66 12UHS | |
| Asus ROG Strix Scar 15 G533zm | |
| Schenker XMG Apex 15 NH57E PS | |
| MSI Delta 15 A5EFK | |
| Eurocom Sky X4C i9-9900KS | |
| Dell G5 15 SE 5505 P89F | |
| Asus Zephyrus S15 GX502L | |
| MSI GE66 Raider 10SFS | |
| Cinebench R20 / CPU (Single Core) | |
| Intel Core i9-12900K | |
| Eurocom Raptor X15 | |
| MSI GE76 Raider | |
| Asus ROG Strix Scar 15 G533zm | |
| MSI Raider GE66 12UHS | |
| Schenker XMG Neo 15 (i7-12700H, RTX 3080 Ti) | |
| MSI GE67 HX 12UGS | |
| Genomsnitt Intel Core i7-12800HX (n=1) | |
| MSI Delta 15 A5EFK | |
| Schenker XMG Apex 15 NH57E PS | |
| Eurocom Sky X4C i9-9900KS | |
| Dell G5 15 SE 5505 P89F | |
| MSI GE66 Raider 10SFS | |
| Asus Zephyrus S15 GX502L | |
| Cinebench R23 / Multi Core | |
| Intel Core i9-12900K | |
| MSI GE67 HX 12UGS | |
| Genomsnitt Intel Core i7-12800HX (n=1) | |
| MSI GE76 Raider | |
| Schenker XMG Neo 15 (i7-12700H, RTX 3080 Ti) | |
| Eurocom Raptor X15 | |
| Asus ROG Strix Scar 15 G533zm | |
| MSI Raider GE66 12UHS | |
| Schenker XMG Apex 15 NH57E PS | |
| MSI Delta 15 A5EFK | |
| Cinebench R23 / Single Core | |
| Intel Core i9-12900K | |
| MSI GE76 Raider | |
| MSI Raider GE66 12UHS | |
| MSI GE67 HX 12UGS | |
| Genomsnitt Intel Core i7-12800HX (n=1) | |
| Schenker XMG Neo 15 (i7-12700H, RTX 3080 Ti) | |
| Eurocom Raptor X15 | |
| Asus ROG Strix Scar 15 G533zm | |
| MSI Delta 15 A5EFK | |
| Schenker XMG Apex 15 NH57E PS | |
| Cinebench R15 / CPU Multi 64Bit | |
| Intel Core i9-12900K | |
| MSI GE67 HX 12UGS | |
| Genomsnitt Intel Core i7-12800HX (n=1) | |
| Asus ROG Strix Scar 15 G533zm | |
| MSI GE76 Raider | |
| Schenker XMG Neo 15 (i7-12700H, RTX 3080 Ti) | |
| MSI Raider GE66 12UHS | |
| MSI Delta 15 A5EFK | |
| Schenker XMG Apex 15 NH57E PS | |
| Dell G5 15 SE 5505 P89F | |
| Eurocom Sky X4C i9-9900KS | |
| MSI GE66 Raider 10SFS | |
| Asus Zephyrus S15 GX502L | |
| Cinebench R15 / CPU Single 64Bit | |
| Intel Core i9-12900K | |
| Asus ROG Strix Scar 15 G533zm | |
| MSI GE76 Raider | |
| MSI Raider GE66 12UHS | |
| Schenker XMG Neo 15 (i7-12700H, RTX 3080 Ti) | |
| MSI GE67 HX 12UGS | |
| Genomsnitt Intel Core i7-12800HX (n=1) | |
| MSI Delta 15 A5EFK | |
| Schenker XMG Apex 15 NH57E PS | |
| Eurocom Sky X4C i9-9900KS | |
| MSI GE66 Raider 10SFS | |
| Asus Zephyrus S15 GX502L | |
| Dell G5 15 SE 5505 P89F | |
| Blender / v2.79 BMW27 CPU | |
| MSI GE66 Raider 10SFS | |
| Dell G5 15 SE 5505 P89F | |
| Asus Zephyrus S15 GX502L | |
| Eurocom Sky X4C i9-9900KS | |
| Schenker XMG Apex 15 NH57E PS | |
| MSI Delta 15 A5EFK | |
| MSI Raider GE66 12UHS | |
| Eurocom Raptor X15 | |
| MSI GE76 Raider | |
| Schenker XMG Neo 15 (i7-12700H, RTX 3080 Ti) | |
| Asus ROG Strix Scar 15 G533zm | |
| MSI GE67 HX 12UGS | |
| Genomsnitt Intel Core i7-12800HX (n=1) | |
| Intel Core i9-12900K | |
| 7-Zip 18.03 / 7z b 4 | |
| Intel Core i9-12900K | |
| MSI GE67 HX 12UGS | |
| Genomsnitt Intel Core i7-12800HX (n=1) | |
| Asus ROG Strix Scar 15 G533zm | |
| MSI GE76 Raider | |
| Schenker XMG Neo 15 (i7-12700H, RTX 3080 Ti) | |
| MSI Raider GE66 12UHS | |
| Eurocom Raptor X15 | |
| MSI Delta 15 A5EFK | |
| Schenker XMG Apex 15 NH57E PS | |
| Eurocom Sky X4C i9-9900KS | |
| Dell G5 15 SE 5505 P89F | |
| Asus Zephyrus S15 GX502L | |
| MSI GE66 Raider 10SFS | |
| 7-Zip 18.03 / 7z b 4 -mmt1 | |
| Intel Core i9-12900K | |
| Eurocom Raptor X15 | |
| MSI GE76 Raider | |
| Asus ROG Strix Scar 15 G533zm | |
| MSI Raider GE66 12UHS | |
| Schenker XMG Neo 15 (i7-12700H, RTX 3080 Ti) | |
| MSI Delta 15 A5EFK | |
| Eurocom Sky X4C i9-9900KS | |
| MSI GE67 HX 12UGS | |
| Genomsnitt Intel Core i7-12800HX (n=1) | |
| Schenker XMG Apex 15 NH57E PS | |
| MSI GE66 Raider 10SFS | |
| Asus Zephyrus S15 GX502L | |
| Dell G5 15 SE 5505 P89F | |
| Geekbench 5.5 / Multi-Core | |
| Intel Core i9-12900K | |
| MSI GE67 HX 12UGS | |
| Genomsnitt Intel Core i7-12800HX (n=1) | |
| MSI Raider GE66 12UHS | |
| MSI GE76 Raider | |
| Asus ROG Strix Scar 15 G533zm | |
| Schenker XMG Neo 15 (i7-12700H, RTX 3080 Ti) | |
| Eurocom Raptor X15 | |
| Eurocom Sky X4C i9-9900KS | |
| MSI Delta 15 A5EFK | |
| Schenker XMG Apex 15 NH57E PS | |
| MSI GE66 Raider 10SFS | |
| Dell G5 15 SE 5505 P89F | |
| Asus Zephyrus S15 GX502L | |
| Geekbench 5.5 / Single-Core | |
| Intel Core i9-12900K | |
| Eurocom Raptor X15 | |
| MSI GE76 Raider | |
| MSI Raider GE66 12UHS | |
| Asus ROG Strix Scar 15 G533zm | |
| MSI GE67 HX 12UGS | |
| Genomsnitt Intel Core i7-12800HX (n=1) | |
| Schenker XMG Neo 15 (i7-12700H, RTX 3080 Ti) | |
| MSI Delta 15 A5EFK | |
| Schenker XMG Apex 15 NH57E PS | |
| Eurocom Sky X4C i9-9900KS | |
| MSI GE66 Raider 10SFS | |
| Asus Zephyrus S15 GX502L | |
| Dell G5 15 SE 5505 P89F | |
| HWBOT x265 Benchmark v2.2 / 4k Preset | |
| Intel Core i9-12900K | |
| MSI GE67 HX 12UGS | |
| Genomsnitt Intel Core i7-12800HX (n=1) | |
| Asus ROG Strix Scar 15 G533zm | |
| Schenker XMG Neo 15 (i7-12700H, RTX 3080 Ti) | |
| MSI GE76 Raider | |
| MSI Raider GE66 12UHS | |
| MSI Delta 15 A5EFK | |
| Schenker XMG Apex 15 NH57E PS | |
| Eurocom Sky X4C i9-9900KS | |
| Eurocom Raptor X15 | |
| Asus Zephyrus S15 GX502L | |
| MSI GE66 Raider 10SFS | |
| Dell G5 15 SE 5505 P89F | |
| LibreOffice / 20 Documents To PDF | |
| Dell G5 15 SE 5505 P89F | |
| Schenker XMG Apex 15 NH57E PS | |
| MSI GE66 Raider 10SFS | |
| MSI Delta 15 A5EFK | |
| Schenker XMG Neo 15 (i7-12700H, RTX 3080 Ti) | |
| Asus Zephyrus S15 GX502L | |
| MSI GE67 HX 12UGS | |
| Genomsnitt Intel Core i7-12800HX (n=1) | |
| Intel Core i9-12900K | |
| Asus ROG Strix Scar 15 G533zm | |
| MSI GE76 Raider | |
| Eurocom Raptor X15 | |
| MSI Raider GE66 12UHS | |
| R Benchmark 2.5 / Overall mean | |
| Asus Zephyrus S15 GX502L | |
| Dell G5 15 SE 5505 P89F | |
| MSI GE66 Raider 10SFS | |
| Schenker XMG Apex 15 NH57E PS | |
| MSI Delta 15 A5EFK | |
| MSI GE67 HX 12UGS | |
| Genomsnitt Intel Core i7-12800HX (n=1) | |
| Schenker XMG Neo 15 (i7-12700H, RTX 3080 Ti) | |
| MSI Raider GE66 12UHS | |
| Asus ROG Strix Scar 15 G533zm | |
| MSI GE76 Raider | |
| Intel Core i9-12900K | |
| Eurocom Raptor X15 | |
Cinebench R23: Multi Core | Single Core
Cinebench R15: CPU Multi 64Bit | CPU Single 64Bit
Blender: v2.79 BMW27 CPU
7-Zip 18.03: 7z b 4 | 7z b 4 -mmt1
Geekbench 5.5: Multi-Core | Single-Core
HWBOT x265 Benchmark v2.2: 4k Preset
LibreOffice : 20 Documents To PDF
R Benchmark 2.5: Overall mean
* ... mindre är bättre
AIDA64: FP32 Ray-Trace | FPU Julia | CPU SHA3 | CPU Queen | FPU SinJulia | FPU Mandel | CPU AES | CPU ZLib | FP64 Ray-Trace | CPU PhotoWorxx
| Performance rating | |
| Alienware m15 R6, i7-11800H RTX 3080 | |
| MSI GE67 HX 12UGS | |
| Genomsnitt Intel Core i7-12800HX | |
| Asus ROG Strix Scar 15 G533ZW-LN106WS | |
| MSI Raider GE66 12UHS | |
| MSI Vector GP66 12UGS | |
| Razer Blade 15 2022 | |
| AIDA64 / FP32 Ray-Trace | |
| Alienware m15 R6, i7-11800H RTX 3080 | |
| MSI GE67 HX 12UGS | |
| Genomsnitt Intel Core i7-12800HX (n=1) | |
| Asus ROG Strix Scar 15 G533ZW-LN106WS | |
| MSI Raider GE66 12UHS | |
| MSI Vector GP66 12UGS | |
| Razer Blade 15 2022 | |
| AIDA64 / FPU Julia | |
| Alienware m15 R6, i7-11800H RTX 3080 | |
| MSI GE67 HX 12UGS | |
| Genomsnitt Intel Core i7-12800HX (n=1) | |
| Asus ROG Strix Scar 15 G533ZW-LN106WS | |
| MSI Raider GE66 12UHS | |
| MSI Vector GP66 12UGS | |
| Razer Blade 15 2022 | |
| AIDA64 / CPU SHA3 | |
| Alienware m15 R6, i7-11800H RTX 3080 | |
| MSI GE67 HX 12UGS | |
| Genomsnitt Intel Core i7-12800HX (n=1) | |
| Asus ROG Strix Scar 15 G533ZW-LN106WS | |
| MSI Vector GP66 12UGS | |
| MSI Raider GE66 12UHS | |
| Razer Blade 15 2022 | |
| AIDA64 / CPU Queen | |
| MSI Vector GP66 12UGS | |
| MSI Raider GE66 12UHS | |
| Asus ROG Strix Scar 15 G533ZW-LN106WS | |
| Razer Blade 15 2022 | |
| Alienware m15 R6, i7-11800H RTX 3080 | |
| MSI GE67 HX 12UGS | |
| Genomsnitt Intel Core i7-12800HX (n=1) | |
| AIDA64 / FPU SinJulia | |
| MSI GE67 HX 12UGS | |
| Genomsnitt Intel Core i7-12800HX (n=1) | |
| Asus ROG Strix Scar 15 G533ZW-LN106WS | |
| Alienware m15 R6, i7-11800H RTX 3080 | |
| MSI Vector GP66 12UGS | |
| MSI Raider GE66 12UHS | |
| Razer Blade 15 2022 | |
| AIDA64 / FPU Mandel | |
| Alienware m15 R6, i7-11800H RTX 3080 | |
| MSI GE67 HX 12UGS | |
| Genomsnitt Intel Core i7-12800HX (n=1) | |
| Asus ROG Strix Scar 15 G533ZW-LN106WS | |
| MSI Raider GE66 12UHS | |
| MSI Vector GP66 12UGS | |
| Razer Blade 15 2022 | |
| AIDA64 / CPU AES | |
| Alienware m15 R6, i7-11800H RTX 3080 | |
| MSI GE67 HX 12UGS | |
| Genomsnitt Intel Core i7-12800HX (n=1) | |
| Asus ROG Strix Scar 15 G533ZW-LN106WS | |
| MSI Vector GP66 12UGS | |
| MSI Raider GE66 12UHS | |
| Razer Blade 15 2022 | |
| AIDA64 / CPU ZLib | |
| MSI GE67 HX 12UGS | |
| Genomsnitt Intel Core i7-12800HX (n=1) | |
| Asus ROG Strix Scar 15 G533ZW-LN106WS | |
| MSI Vector GP66 12UGS | |
| MSI Raider GE66 12UHS | |
| Razer Blade 15 2022 | |
| Alienware m15 R6, i7-11800H RTX 3080 | |
| AIDA64 / FP64 Ray-Trace | |
| Alienware m15 R6, i7-11800H RTX 3080 | |
| MSI GE67 HX 12UGS | |
| Genomsnitt Intel Core i7-12800HX (n=1) | |
| Asus ROG Strix Scar 15 G533ZW-LN106WS | |
| MSI Raider GE66 12UHS | |
| MSI Vector GP66 12UGS | |
| Razer Blade 15 2022 | |
| AIDA64 / CPU PhotoWorxx | |
| Razer Blade 15 2022 | |
| MSI Raider GE66 12UHS | |
| Asus ROG Strix Scar 15 G533ZW-LN106WS | |
| MSI GE67 HX 12UGS | |
| Genomsnitt Intel Core i7-12800HX (n=1) | |
| MSI Vector GP66 12UGS | |
| Alienware m15 R6, i7-11800H RTX 3080 | |
Systemets prestanda
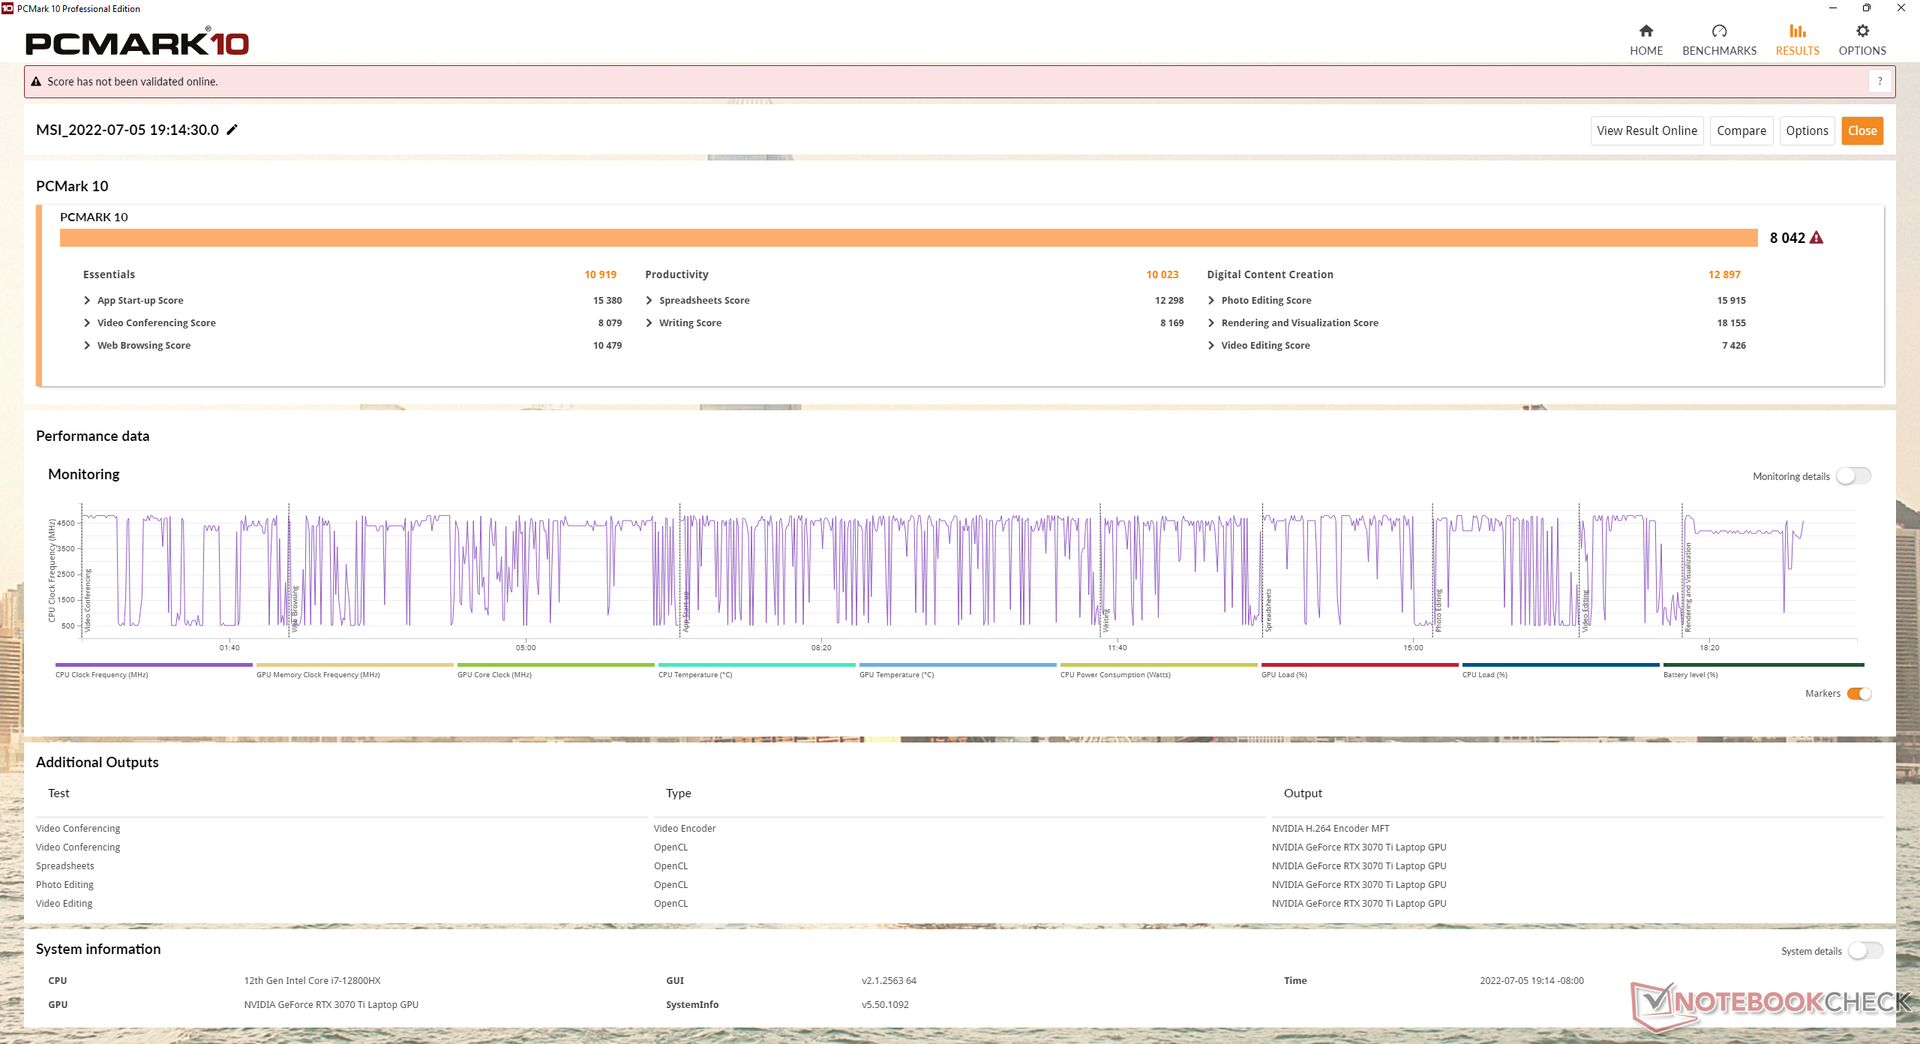
PCMark 10-resultaten är några av de högsta i vår databas med resultat som liknar dem vi observerade på den äldre GE66 som körs med den långsammare Core i9-12900HK men snabbare GeForce RTX 3080 Ti.
Intressant nog skulle delbetyget för skapande av digitalt innehåll sjunka från 12897 poäng till endast 9568 poäng i MSHybrid-läget.
CrossMark: Overall | Productivity | Creativity | Responsiveness
| PCMark 10 / Score | |
| MSI Raider GE66 12UHS | |
| MSI GE67 HX 12UGS | |
| Genomsnitt Intel Core i7-12800HX, NVIDIA GeForce RTX 3070 Ti Laptop GPU (n=1) | |
| MSI Vector GP66 12UGS | |
| Asus ROG Strix Scar 15 G533ZW-LN106WS | |
| Razer Blade 15 2022 | |
| Alienware m15 R6, i7-11800H RTX 3080 | |
| PCMark 10 / Essentials | |
| MSI Raider GE66 12UHS | |
| MSI Vector GP66 12UGS | |
| MSI GE67 HX 12UGS | |
| Genomsnitt Intel Core i7-12800HX, NVIDIA GeForce RTX 3070 Ti Laptop GPU (n=1) | |
| Razer Blade 15 2022 | |
| Asus ROG Strix Scar 15 G533ZW-LN106WS | |
| Alienware m15 R6, i7-11800H RTX 3080 | |
| PCMark 10 / Productivity | |
| Asus ROG Strix Scar 15 G533ZW-LN106WS | |
| MSI Raider GE66 12UHS | |
| MSI Vector GP66 12UGS | |
| MSI GE67 HX 12UGS | |
| Genomsnitt Intel Core i7-12800HX, NVIDIA GeForce RTX 3070 Ti Laptop GPU (n=1) | |
| Razer Blade 15 2022 | |
| Alienware m15 R6, i7-11800H RTX 3080 | |
| PCMark 10 / Digital Content Creation | |
| MSI GE67 HX 12UGS | |
| Genomsnitt Intel Core i7-12800HX, NVIDIA GeForce RTX 3070 Ti Laptop GPU (n=1) | |
| MSI Raider GE66 12UHS | |
| MSI Vector GP66 12UGS | |
| Razer Blade 15 2022 | |
| Asus ROG Strix Scar 15 G533ZW-LN106WS | |
| Alienware m15 R6, i7-11800H RTX 3080 | |
| CrossMark / Overall | |
| Asus ROG Strix Scar 15 G533ZW-LN106WS | |
| MSI GE67 HX 12UGS | |
| Genomsnitt Intel Core i7-12800HX, NVIDIA GeForce RTX 3070 Ti Laptop GPU (n=1) | |
| CrossMark / Productivity | |
| Asus ROG Strix Scar 15 G533ZW-LN106WS | |
| MSI GE67 HX 12UGS | |
| Genomsnitt Intel Core i7-12800HX, NVIDIA GeForce RTX 3070 Ti Laptop GPU (n=1) | |
| CrossMark / Creativity | |
| Asus ROG Strix Scar 15 G533ZW-LN106WS | |
| MSI GE67 HX 12UGS | |
| Genomsnitt Intel Core i7-12800HX, NVIDIA GeForce RTX 3070 Ti Laptop GPU (n=1) | |
| CrossMark / Responsiveness | |
| Asus ROG Strix Scar 15 G533ZW-LN106WS | |
| MSI GE67 HX 12UGS | |
| Genomsnitt Intel Core i7-12800HX, NVIDIA GeForce RTX 3070 Ti Laptop GPU (n=1) | |
| PCMark 10 Score | 8042 poäng | |
Hjälp | ||
| AIDA64 / Memory Copy | |
| MSI Raider GE66 12UHS | |
| Razer Blade 15 2022 | |
| Asus ROG Strix Scar 15 G533ZW-LN106WS | |
| MSI GE67 HX 12UGS | |
| Genomsnitt Intel Core i7-12800HX (n=1) | |
| MSI Vector GP66 12UGS | |
| Alienware m15 R6, i7-11800H RTX 3080 | |
| AIDA64 / Memory Read | |
| MSI Raider GE66 12UHS | |
| Razer Blade 15 2022 | |
| Asus ROG Strix Scar 15 G533ZW-LN106WS | |
| MSI GE67 HX 12UGS | |
| Genomsnitt Intel Core i7-12800HX (n=1) | |
| Alienware m15 R6, i7-11800H RTX 3080 | |
| MSI Vector GP66 12UGS | |
| AIDA64 / Memory Write | |
| Razer Blade 15 2022 | |
| MSI Raider GE66 12UHS | |
| Asus ROG Strix Scar 15 G533ZW-LN106WS | |
| MSI GE67 HX 12UGS | |
| Genomsnitt Intel Core i7-12800HX (n=1) | |
| MSI Vector GP66 12UGS | |
| Alienware m15 R6, i7-11800H RTX 3080 | |
| AIDA64 / Memory Latency | |
| Asus ROG Strix Scar 15 G533ZW-LN106WS | |
| Alienware m15 R6, i7-11800H RTX 3080 | |
| MSI GE67 HX 12UGS | |
| Genomsnitt Intel Core i7-12800HX (n=1) | |
| MSI Raider GE66 12UHS | |
| MSI Vector GP66 12UGS | |
| Razer Blade 15 2022 | |
* ... mindre är bättre
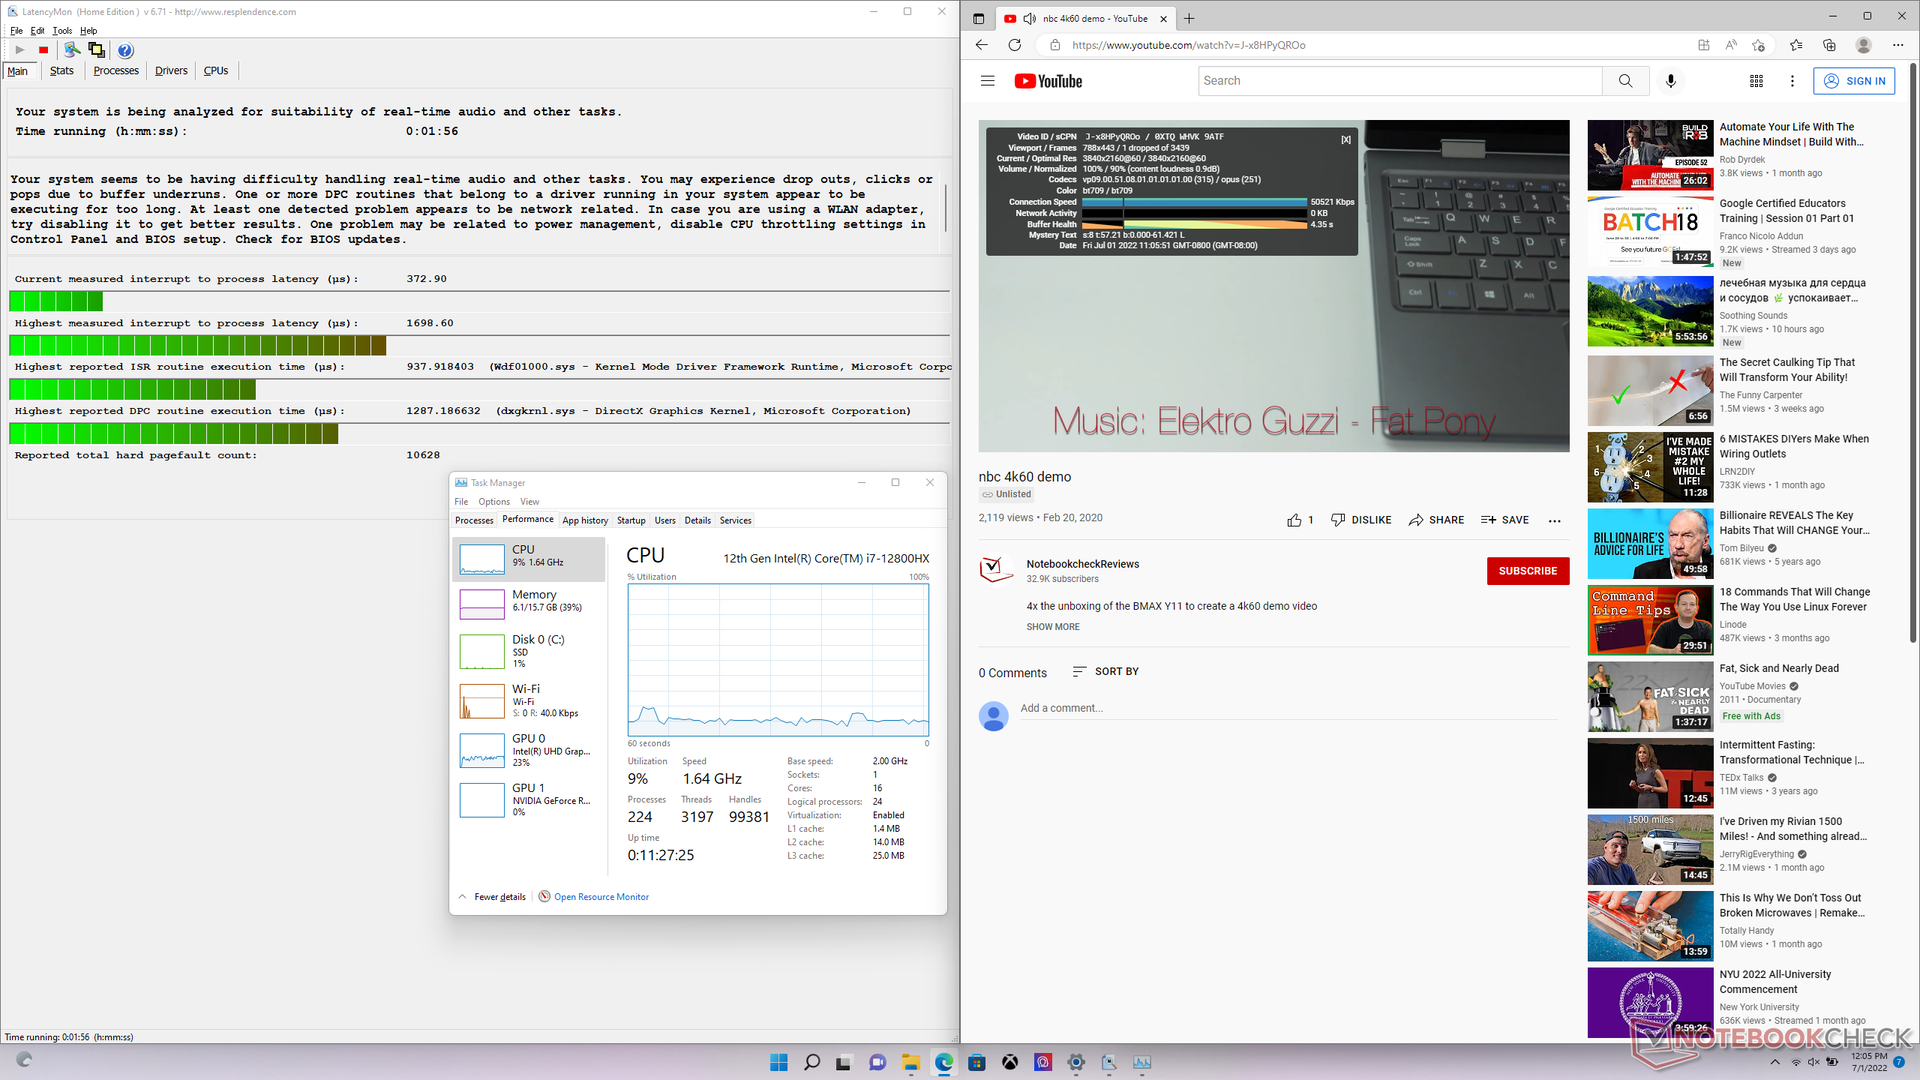
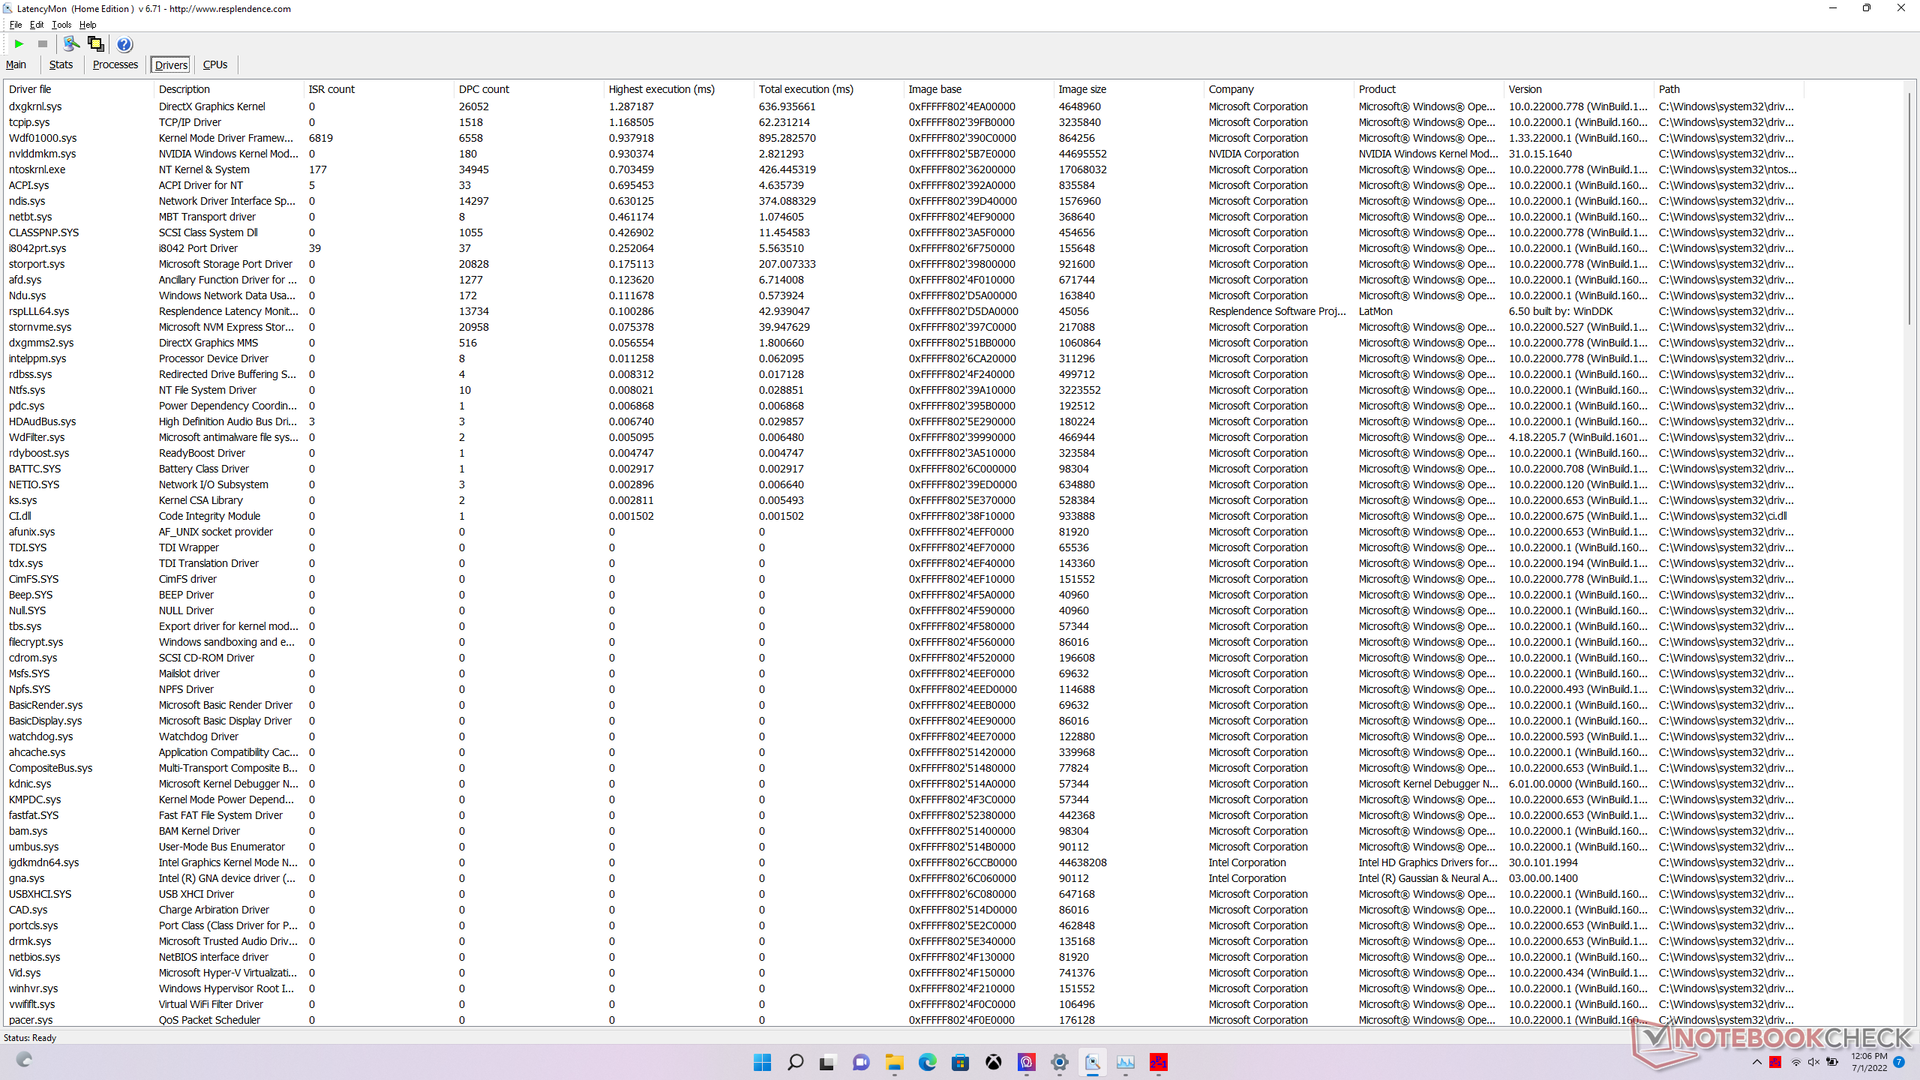
DPC-latenstid
LatencyMon avslöjar mindre DPC-problem när man öppnar flera webbläsarflikar på vår hemsida. uppspelning av 4K-video vid 60 FPS är annars smidig med bara en förlorad bild under vårt 60-sekunders videotest.
| DPC Latencies / LatencyMon - interrupt to process latency (max), Web, Youtube, Prime95 | |
| MSI Raider GE66 12UHS | |
| MSI Vector GP66 12UGS | |
| MSI GE67 HX 12UGS | |
| Razer Blade 15 2022 | |
| Alienware m15 R6, i7-11800H RTX 3080 | |
| Asus ROG Strix Scar 15 G533ZW-LN106WS | |
* ... mindre är bättre
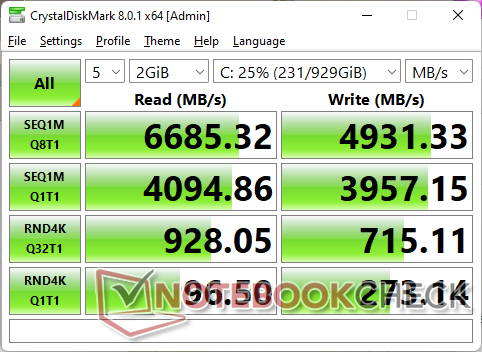
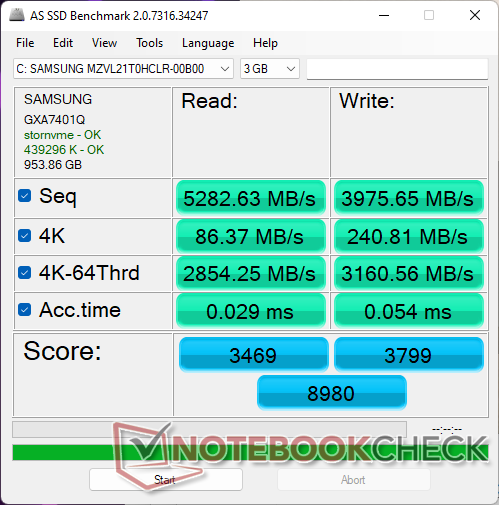
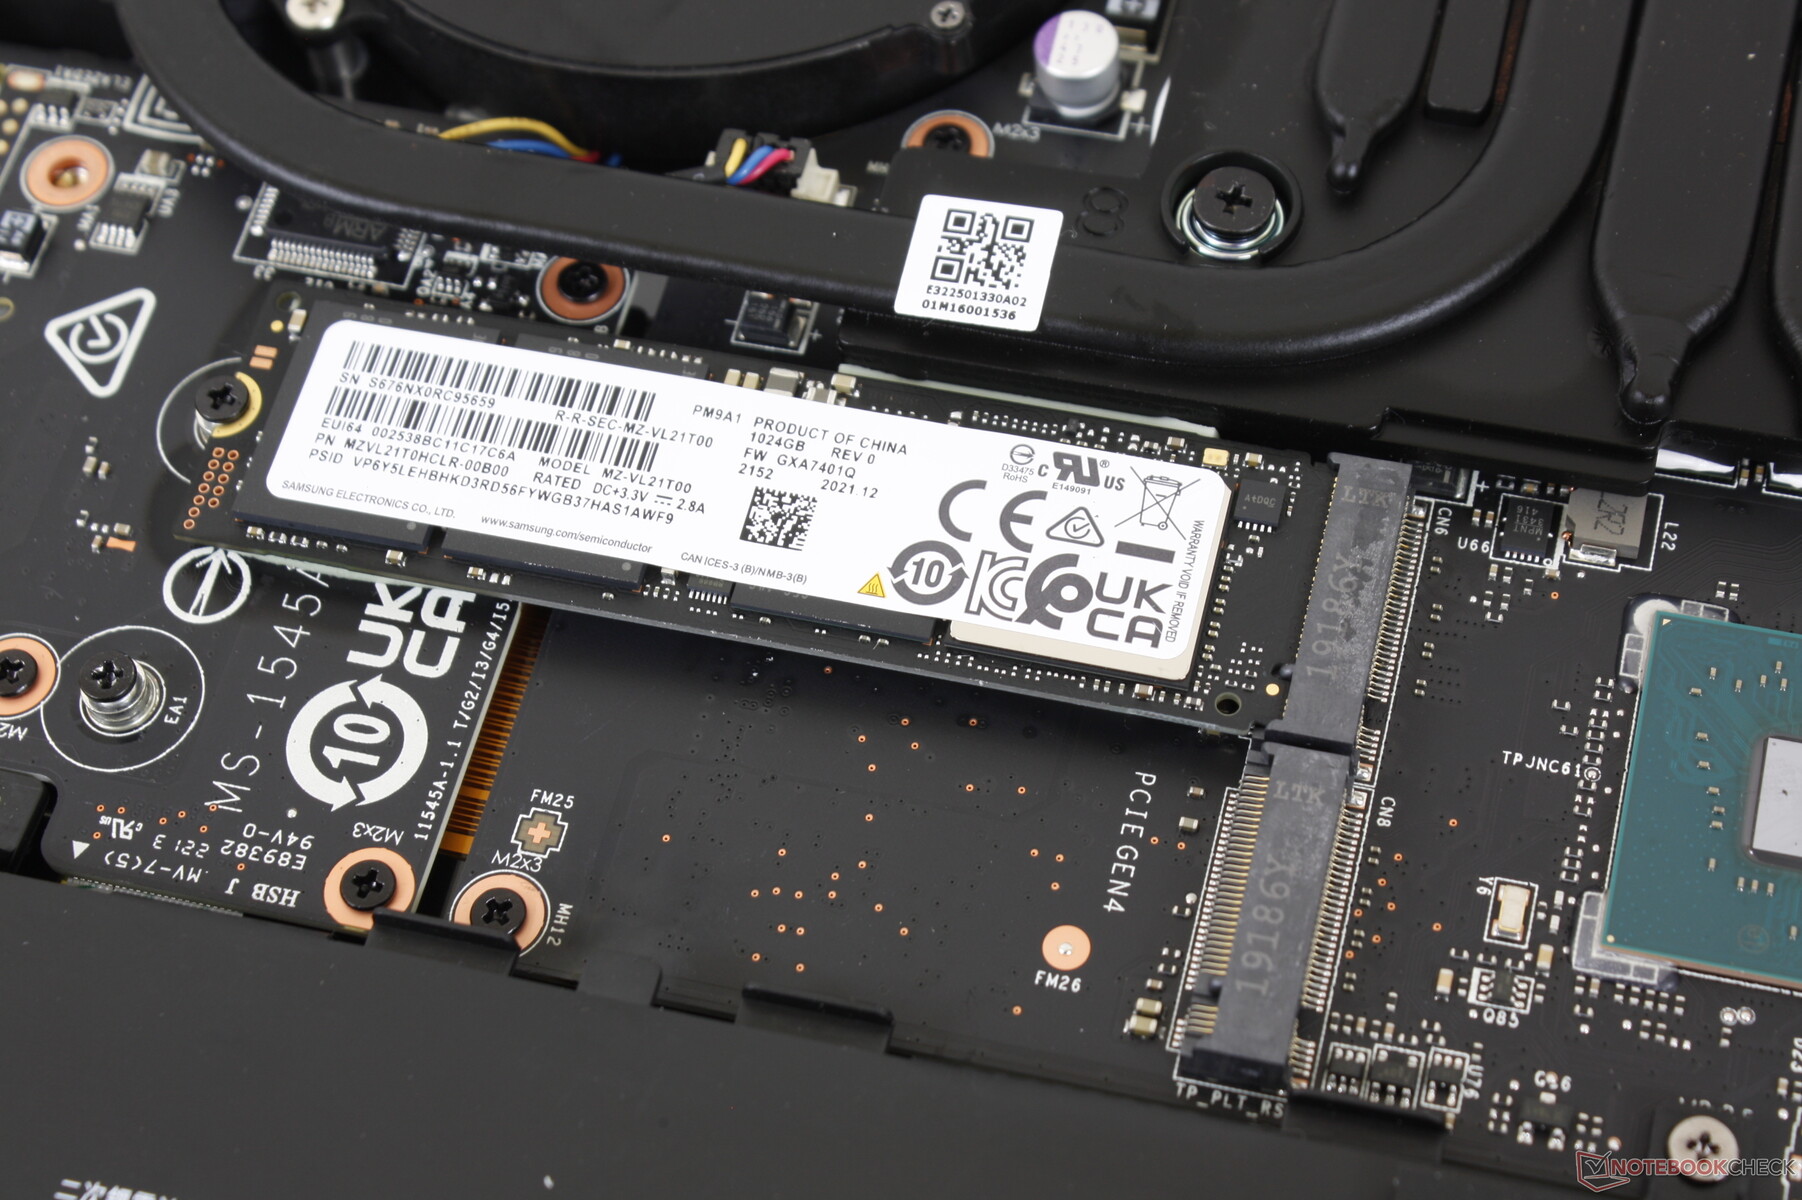
Lagringsenheter - PCIe4 x4 Standard
Vår enhet levereras med en 1 TBSamsung PM9A1 PCIe4 x4 NVMe SSD för sekventiell läs- och skrivhastighet på upp till 7000 MB/s respektive 5100 MB/s. Tyvärr hade vår enhet problem med att bibehålla sin maximala läshastighet under längre perioder, vilket vårt DiskSpd-slingtest nedan visar. Läshastigheten sjönk så småningom till så låga värden som 1500 MB/s, vilket troligen beror på temperaturgränser och bristen på en ordentlig värmespridare över SSD-enheten.

* ... mindre är bättre
Disk Throttling: DiskSpd Read Loop, Queue Depth 8
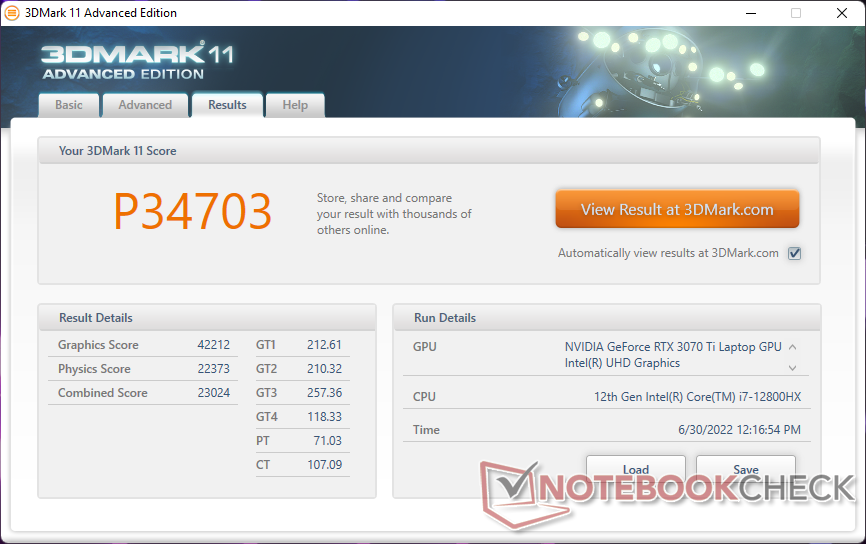
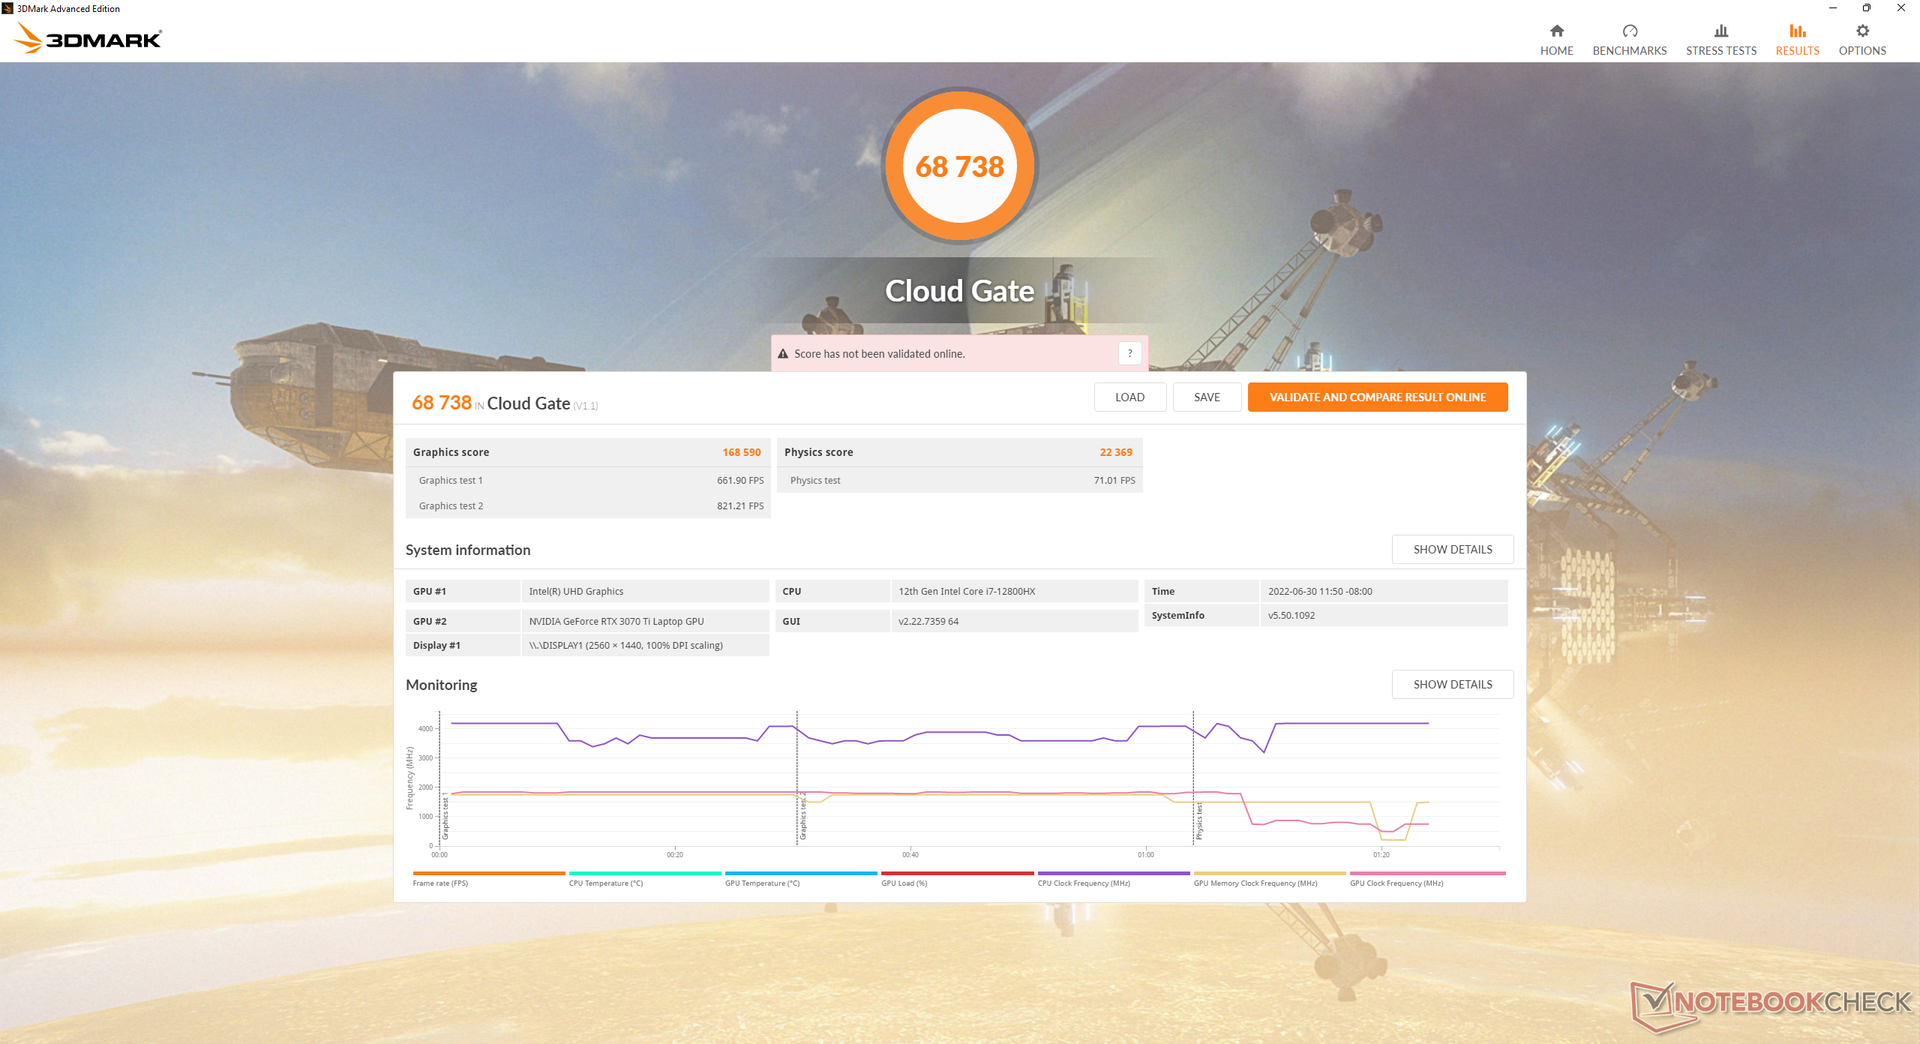
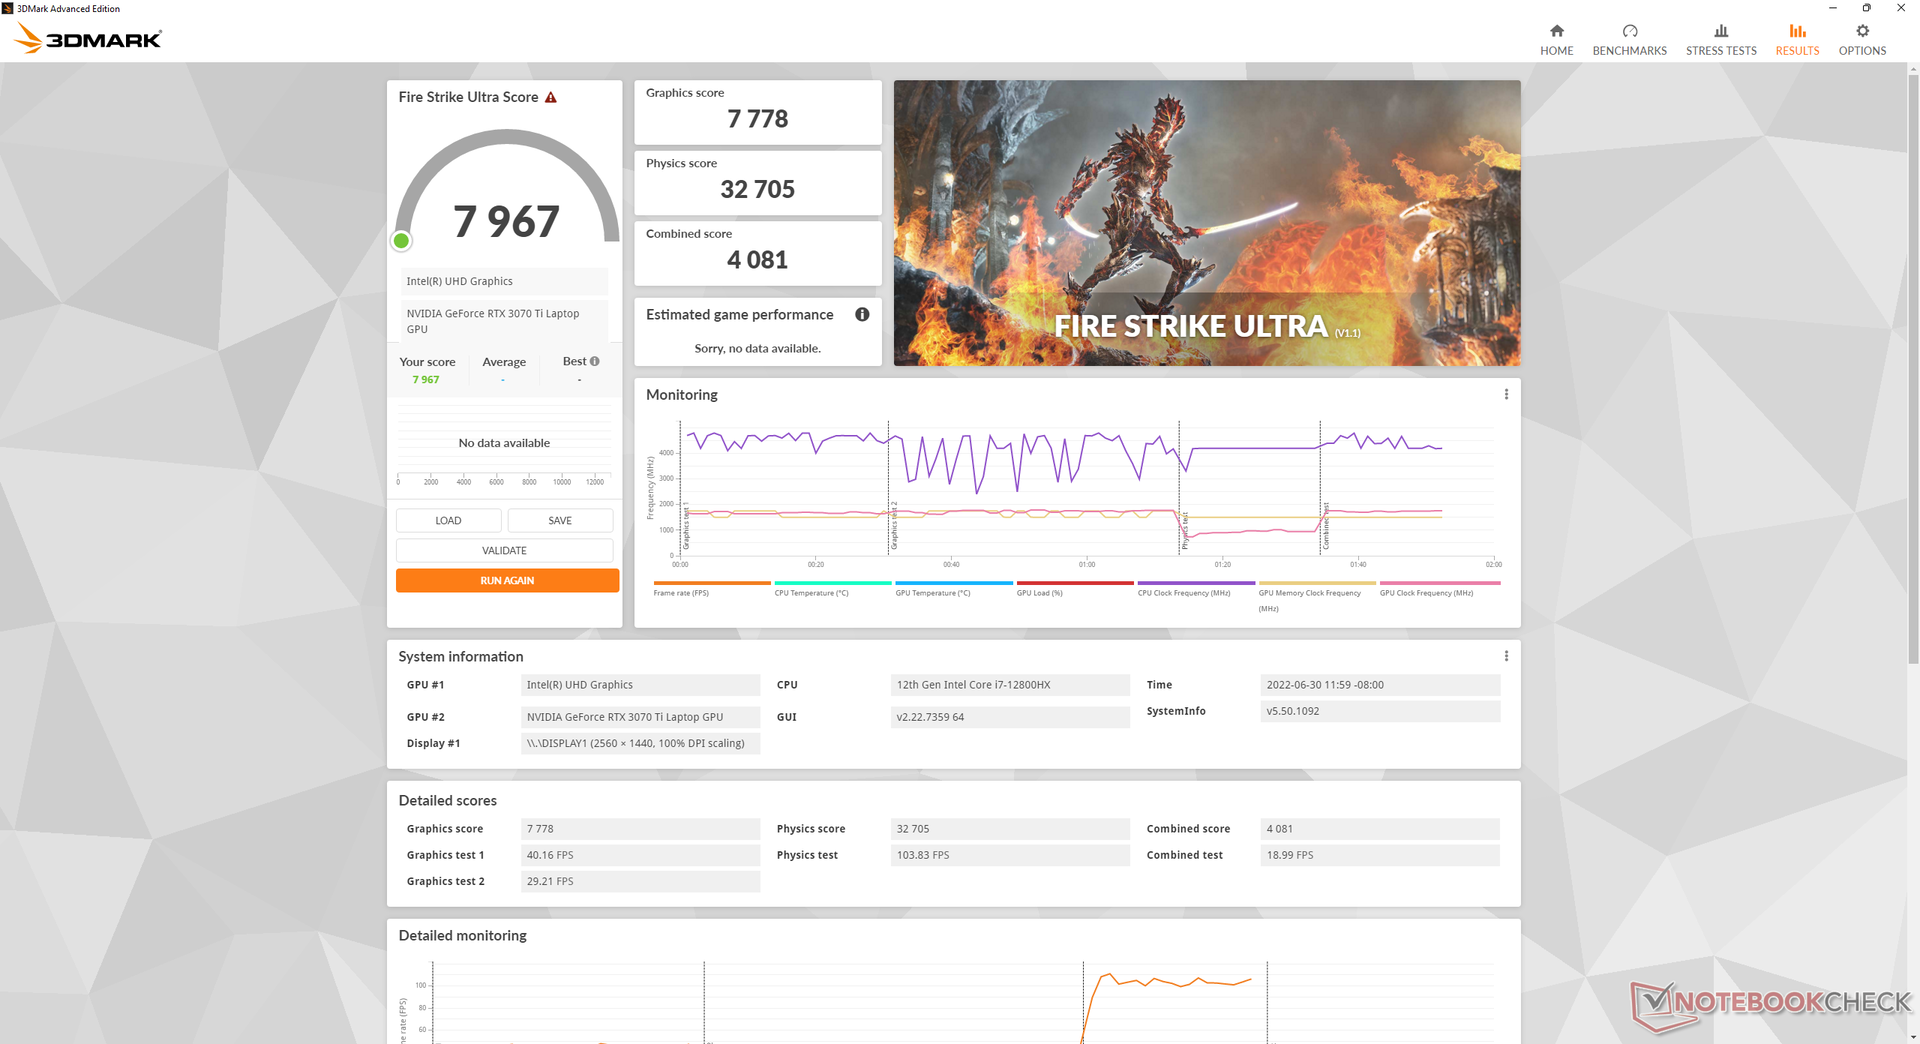
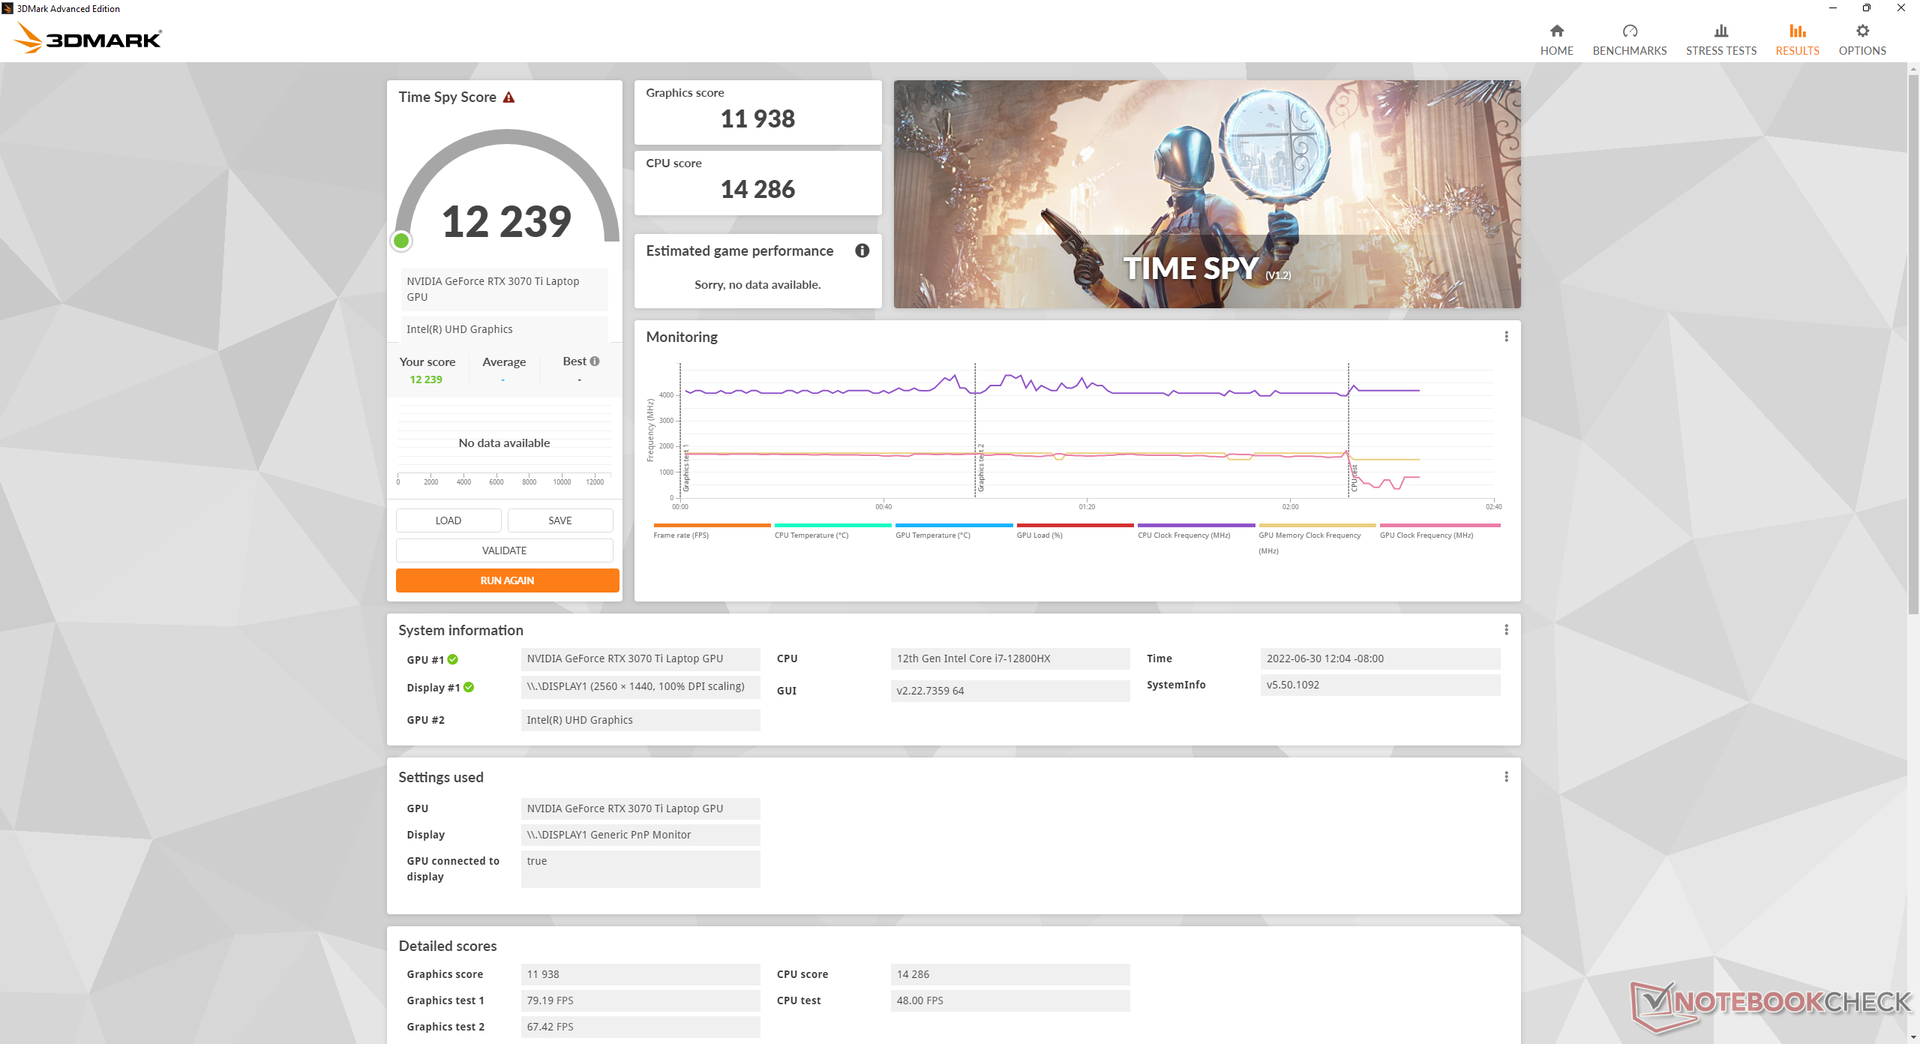
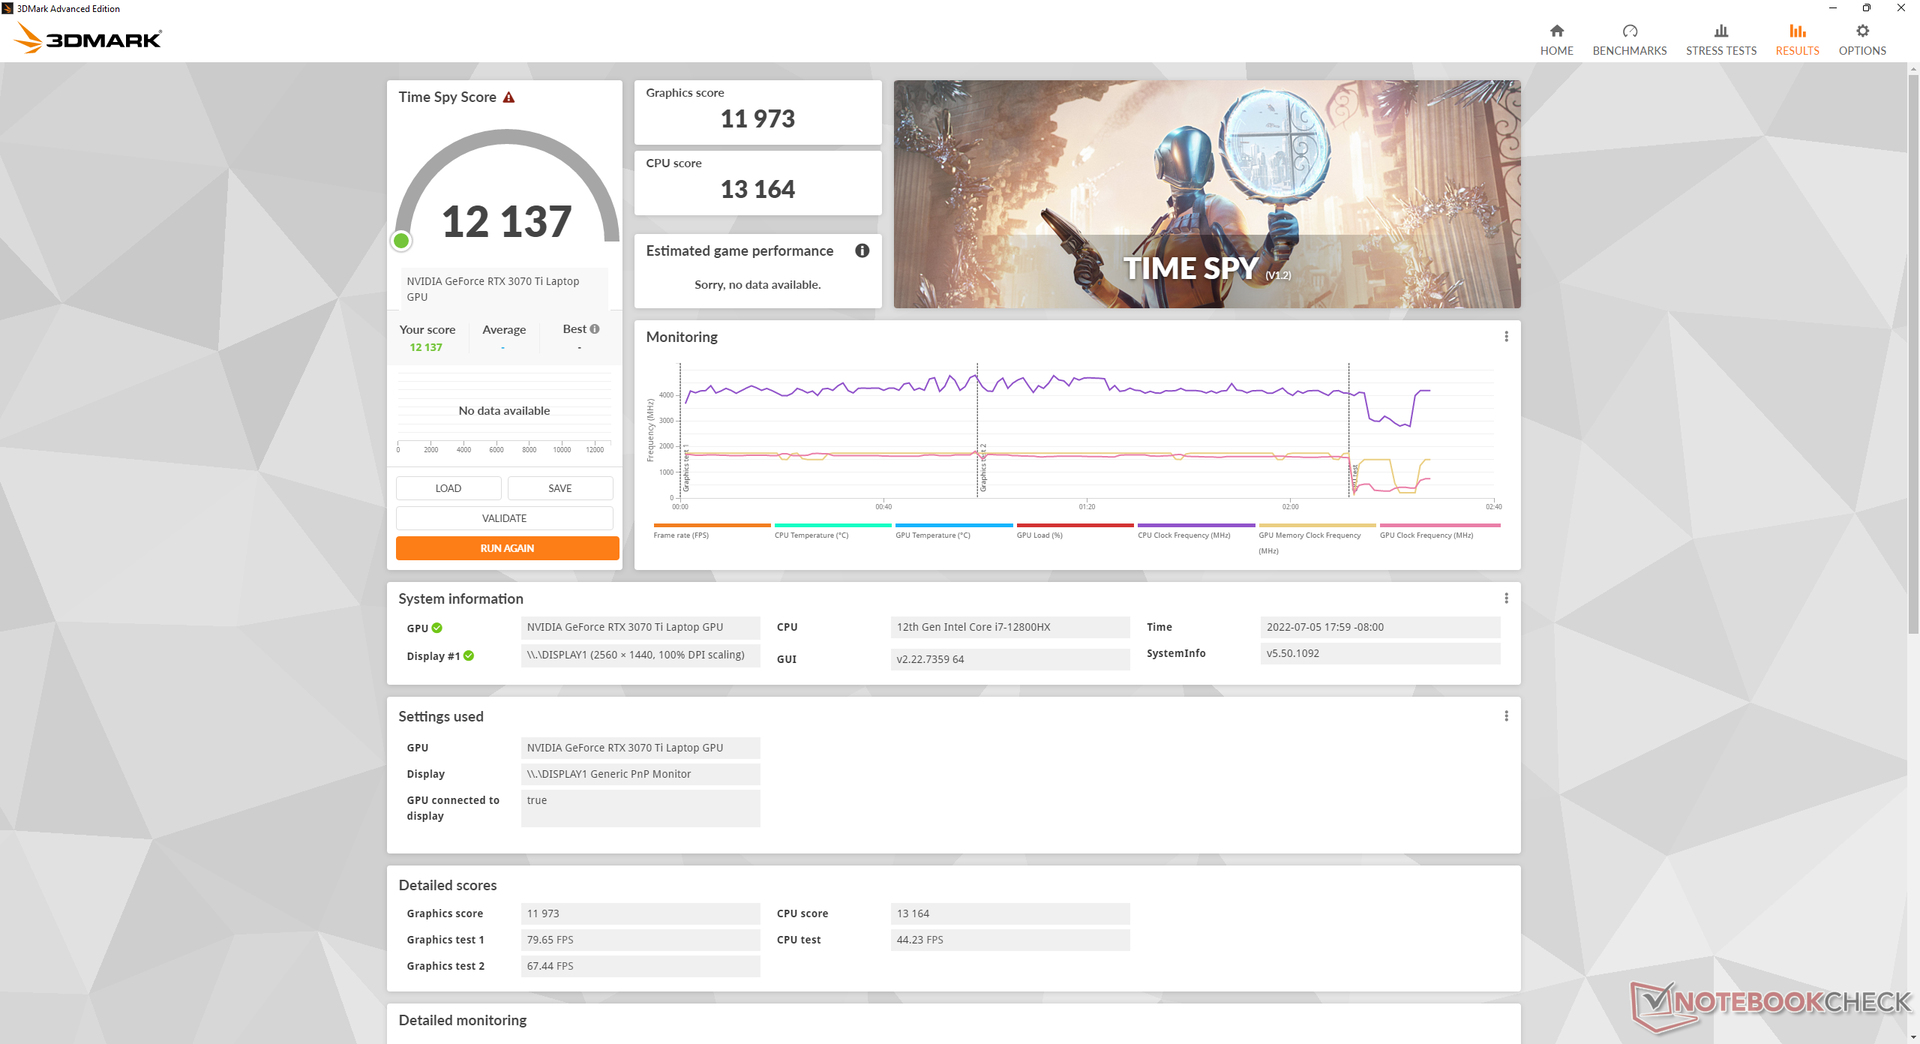
GPU-prestanda - 150 W med 25 W Dynamic Boost
3DMark-resultaten är cirka 12 procent högre än den genomsnittliga bärbara datorn i vår databas med samma mobila GeForce RTX 3070 Ti GPU. De högre siffrorna än väntat kan tillskrivas det höga TGP-målet på 150 W och snabba DDR5 RAM medan majoriteten av bärbara datorer för spel fortfarande körs med 130 W eller lägre GPU:er och/eller långsammare DDR4 RAM. Skillnaderna är tillräckliga för att driva vårt mobila GTX 3070 Ti att prestera på samma sätt som mobile RTX 3080 Ti som körs på det äldre Q1 2022 GE66
.
För speländamål skulle Nvidias GPU prestera nästan identiskt mellan MSHybrid- och diskreta lägen.
| 3DMark 11 - 1280x720 Performance GPU | |
| MSI GeForce RTX 3080 Gaming X Trio | |
| MSI Raider GE66 12UHS | |
| MSI GE67 HX 12UGS | |
| MSI GeForce RTX 3070 Gaming X Trio | |
| MSI GP66 Leopard 11UH-028 | |
| Genomsnitt NVIDIA GeForce RTX 3070 Ti Laptop GPU (13799 - 42569, n=36) | |
| MSI GE63 Raider 8SG | |
| Lenovo Legion 7 15IMH05-81YT001VGE | |
| Asus TUF Gaming F15 FX507ZM | |
| MSI GE66 Raider 10SFS | |
| Schenker XMG Neo 15 Comet Lake | |
| Dell G15 5510-43NHT | |
| Dell G15 5510 | |
| 3DMark 11 Performance | 34703 poäng | |
| 3DMark Cloud Gate Standard Score | 68738 poäng | |
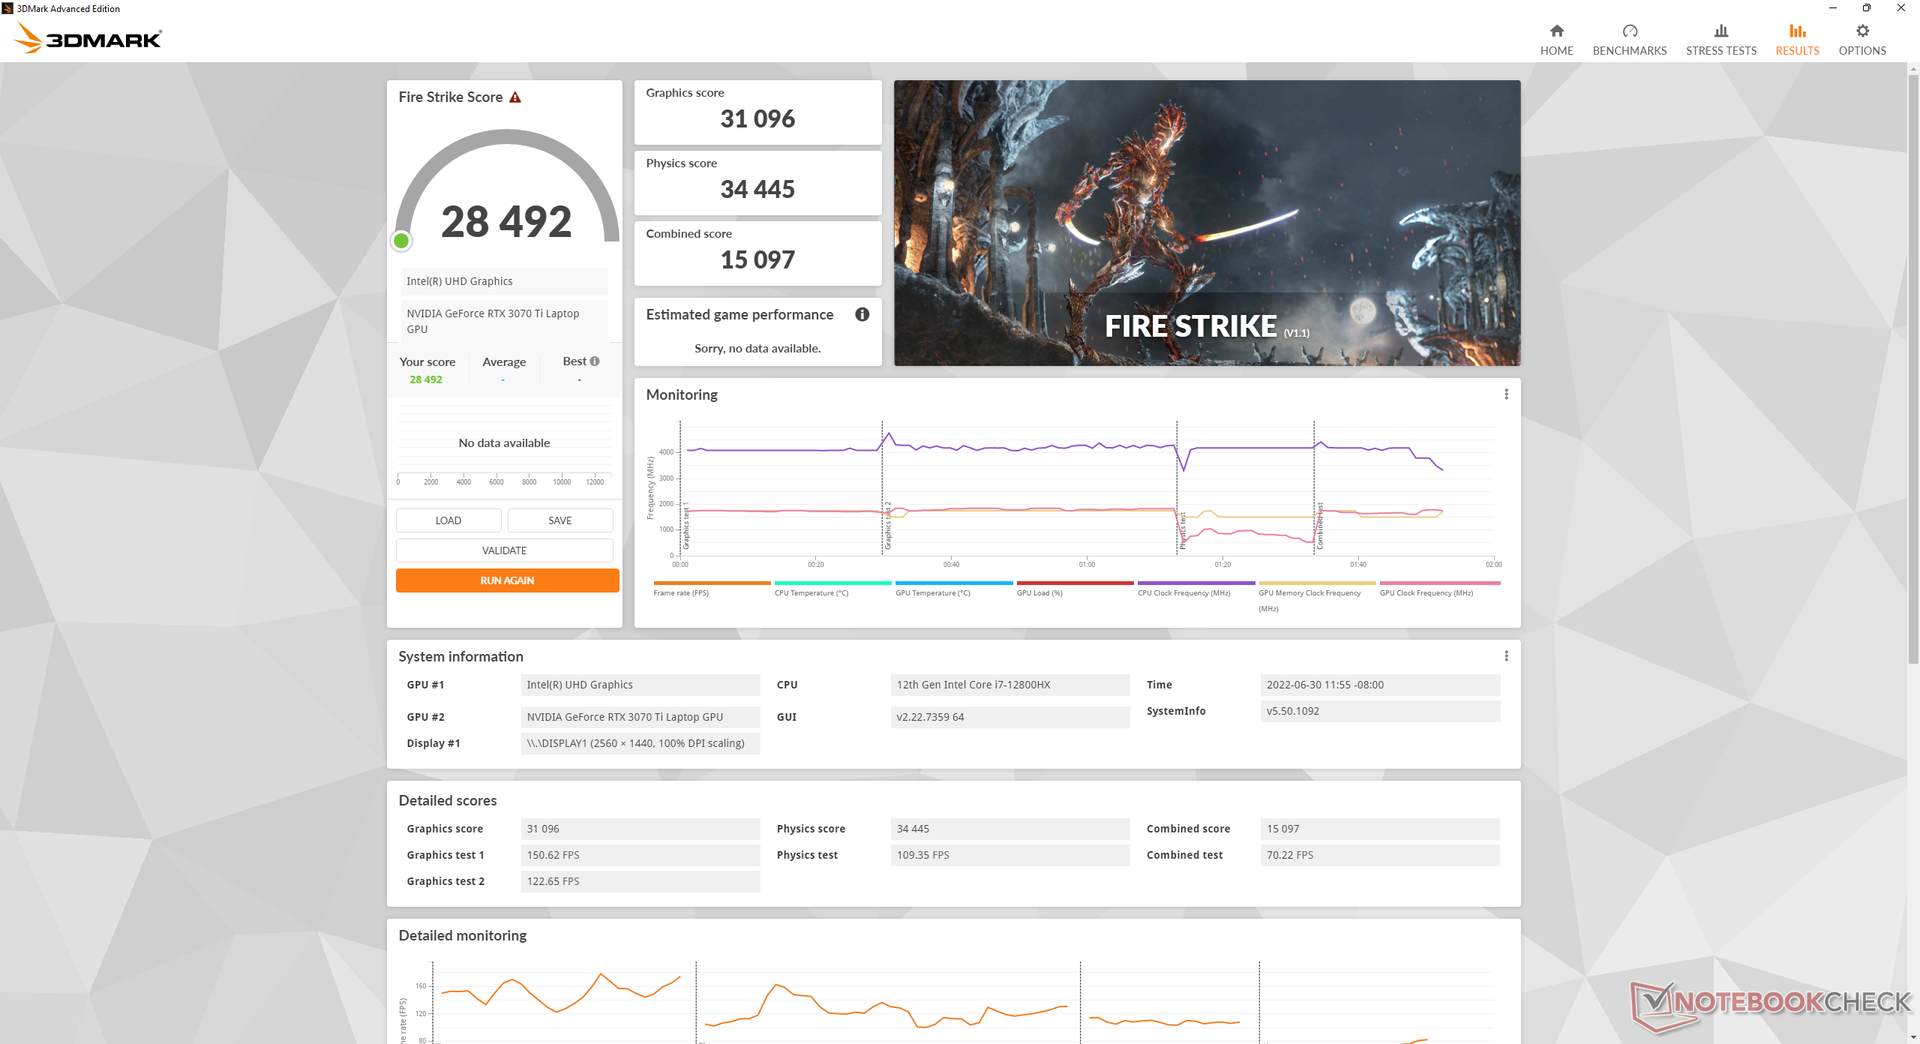
| 3DMark Fire Strike Score | 28492 poäng | |
| 3DMark Time Spy Score | 12239 poäng | |
Hjälp | ||
Witcher 3 FPS Chart
| låg | med. | hög | ultra | QHD | 4K | |
|---|---|---|---|---|---|---|
| GTA V (2015) | 186.8 | 184.7 | 178.1 | 122 | 108.7 | |
| The Witcher 3 (2015) | 426.4 | 329 | 223.3 | 112.7 | ||
| Dota 2 Reborn (2015) | 181.2 | 165.6 | 155.3 | 147.7 | 148.9 | |
| Final Fantasy XV Benchmark (2018) | 201 | 162.6 | 122.4 | 93 | ||
| X-Plane 11.11 (2018) | 145.5 | 133.4 | 105.9 | |||
| Strange Brigade (2018) | 453 | 288 | 235 | 207 | 154.1 | |
| Cyberpunk 2077 1.6 (2022) | 141.2 | 133.2 | 106 | 88.1 | 56.4 |
Utsläpp
Systembrus
Fläktljudet är beroende av de fem förinställda effektprofilerna som nämns i testförhållandena ovan. När enheten går på tomgång på skrivbordet utan några pågående program kan den förbli tyst med 22,9 dB(A) även när den är inställd på profilen Extreme Performance. Små krav som webbsurfning eller videoströmning ger dock upphov till ett fläktljud i det hörbara 30-34 dB(A) intervallet oavsett profilinställning. Att köra den första benchmark-scenen i 3DMark 06 i läget Balanced skulle ge ett fläktljud på 44 dB(A), vilket liknar det vi registrerade på GE66 eller Razer Blade 15.
Om Witcher 3 körs i balanserat läge och Extreme Performance-läge skulle fläktljudet vara 49,8 dB(A) respektive 55,7 dB(A). Vi anser att allt i 50 dB(A)-intervallet är mycket högt, till den grad att hörlurar rekommenderas när man spelar. Ändå är det här intervallet tyvärr vanligt på många bärbara datorer för entusiastspelare, inklusive Vector GP66, Asus ROG Strix Scar 15 eller Alienware m15 R6. Om Cooler Boost (dvs. läget för maximalt fläktljud) är aktivt blir fläktljudet ännu högre, 57,4 dB(A). Användare måste spela i läget Extreme Performance på GE67 för att maximera TGP, vilket vårt avsnitt om stresstest nedan visar. GE66 var inte lika högljudd under liknande förhållanden.
Ljudnivå
| Låg belastning |
| 22.9 / 22.9 / 22.9 dB(A) |
| Hög belastning |
| 44.4 / 57.4 dB(A) |
 | ||
30 dB tyst 40 dB(A) hörbar 50 dB(A) högt ljud |
||
min: | ||
| MSI GE67 HX 12UGS GeForce RTX 3070 Ti Laptop GPU, i7-12800HX, Samsung PM9A1 MZVL21T0HCLR | MSI Raider GE66 12UHS GeForce RTX 3080 Ti Laptop GPU, i9-12900HK, Samsung PM9A1 MZVL22T0HBLB | MSI Vector GP66 12UGS GeForce RTX 3070 Ti Laptop GPU, i9-12900H | Asus ROG Strix Scar 15 G533ZW-LN106WS GeForce RTX 3070 Ti Laptop GPU, i9-12900H, Samsung PM9A1 MZVL22T0HBLB | Alienware m15 R6, i7-11800H RTX 3080 GeForce RTX 3080 Laptop GPU, i7-11800H, Samsung PM9A1 MZVL21T0HCLR | Razer Blade 15 2022 GeForce RTX 3080 Ti Laptop GPU, i7-12800H, SSSTC CA6-8D1024 | |
|---|---|---|---|---|---|---|
| Noise | -14% | -2% | -36% | -2% | -5% | |
| av / miljö * (dB) | 22.7 | 26 -15% | 22.9 -1% | 26.86 -18% | 23 -1% | 25.4 -12% |
| Idle Minimum * (dB) | 22.9 | 27 -18% | 23.4 -2% | 39.07 -71% | 23 -0% | 26.2 -14% |
| Idle Average * (dB) | 22.9 | 30 -31% | 23.4 -2% | 39.07 -71% | 23 -0% | 26.2 -14% |
| Idle Maximum * (dB) | 22.9 | 39 -70% | 27.4 -20% | 39.07 -71% | 30 -31% | 28.4 -24% |
| Load Average * (dB) | 44.4 | 45 -1% | 36 19% | 53.34 -20% | 41.26 7% | 44.7 -1% |
| Witcher 3 ultra * (dB) | 55.7 | 45 19% | 58.2 -4% | 56.6 -2% | 53.4 4% | 44.7 20% |
| Load Maximum * (dB) | 57.4 | 47 18% | 58 -1% | 56.6 1% | 53.37 7% | 51.9 10% |
* ... mindre är bättre
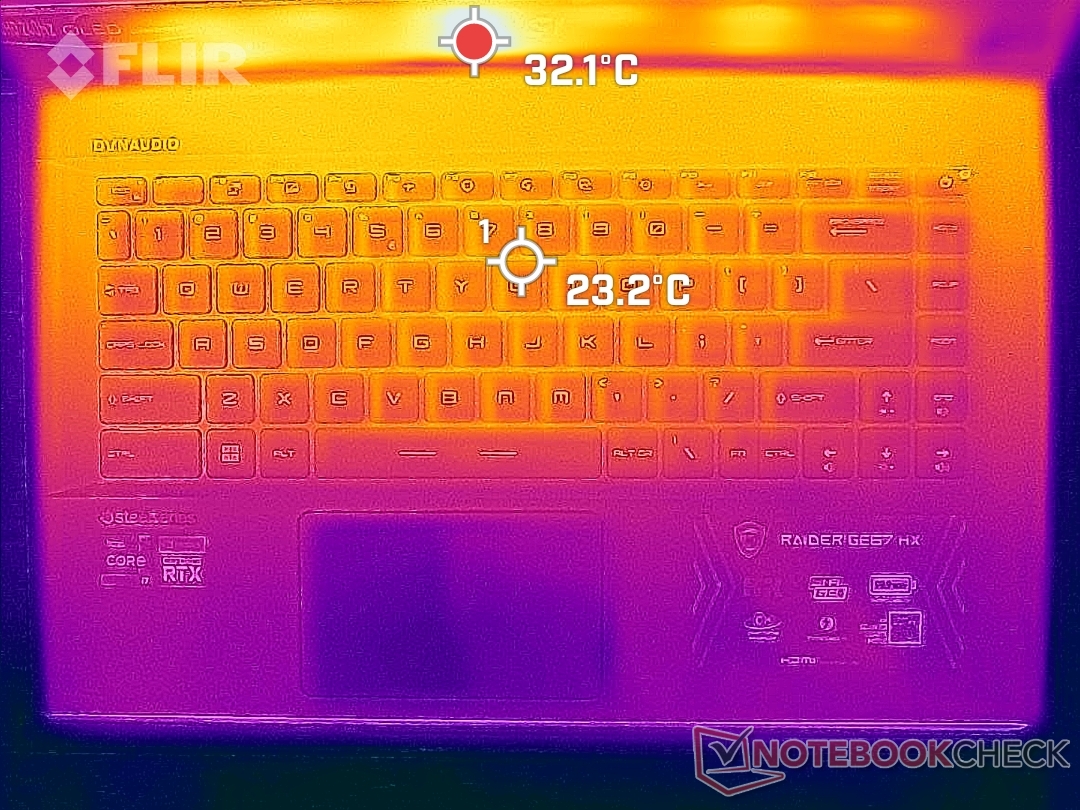
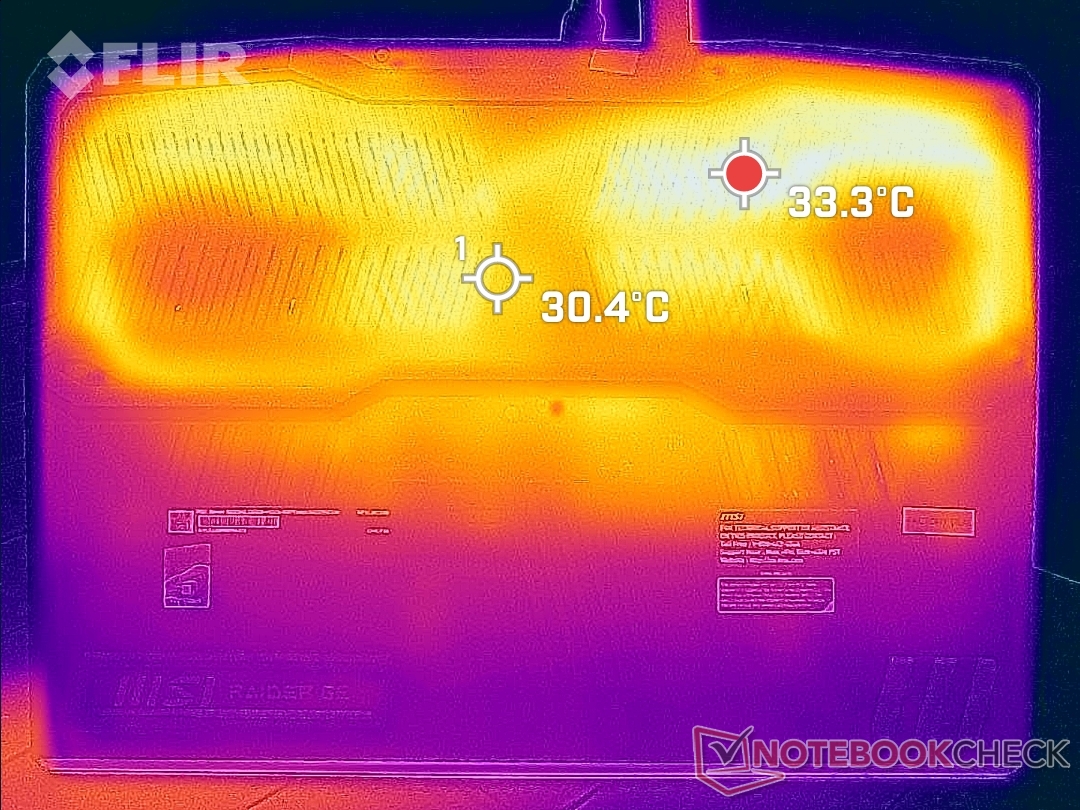
Temperatur
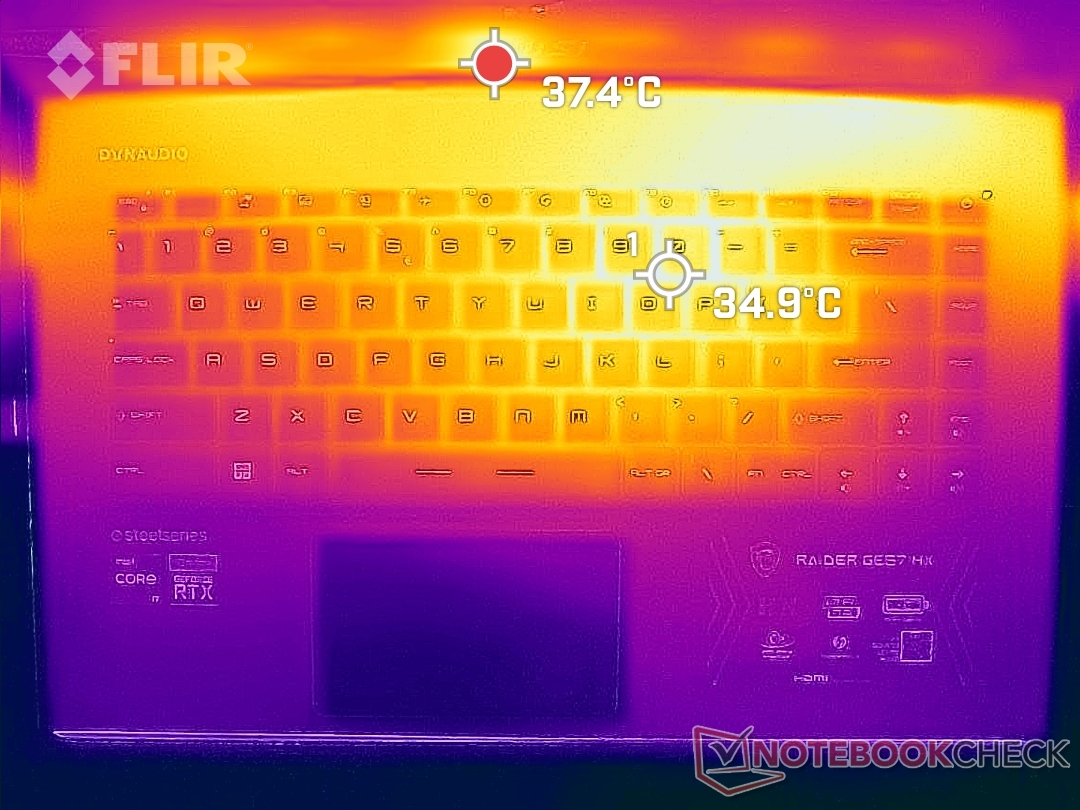
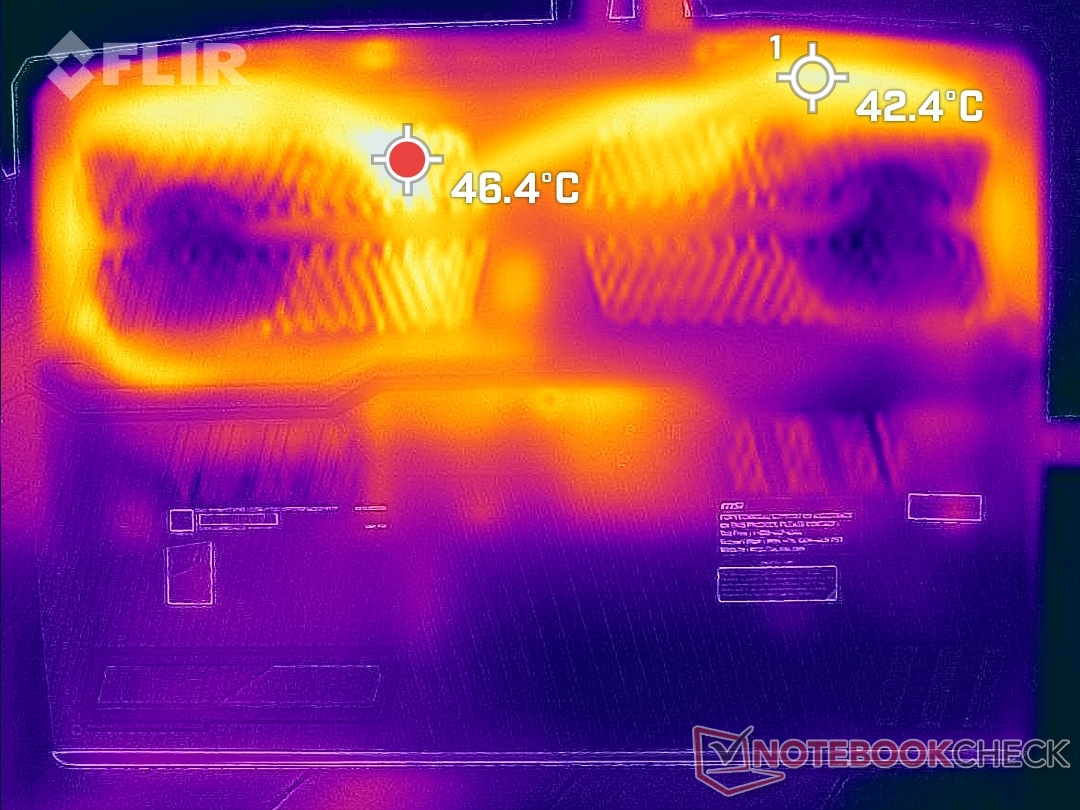
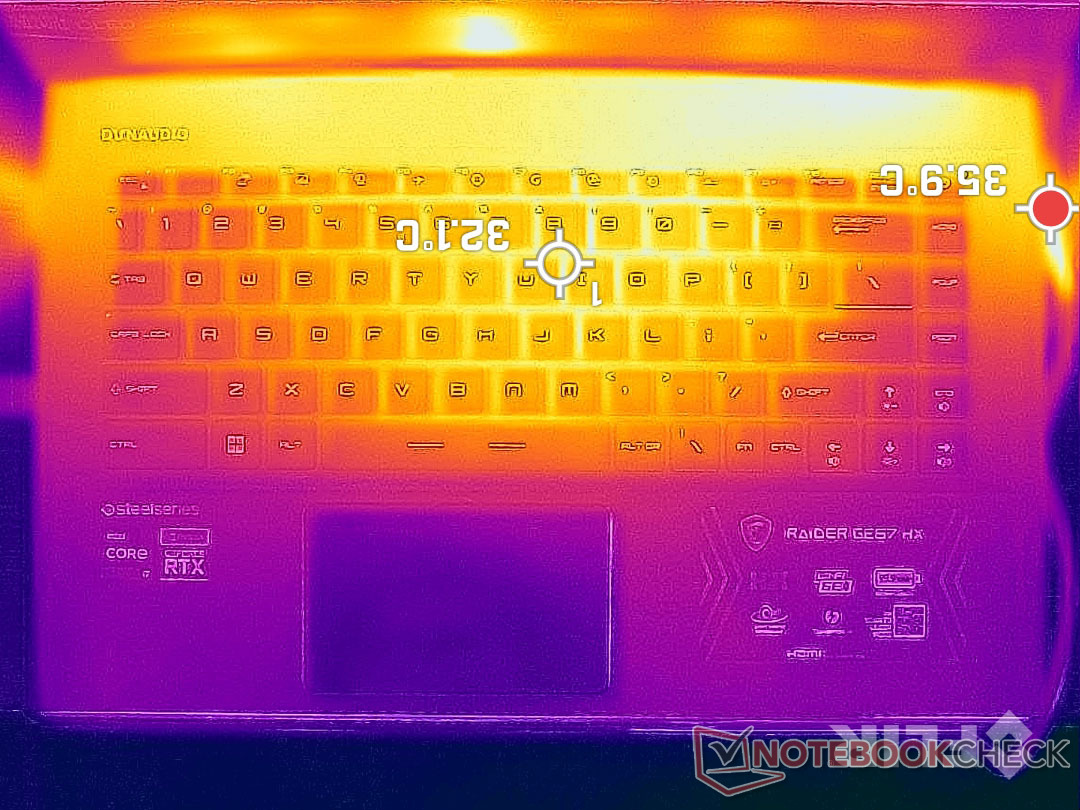
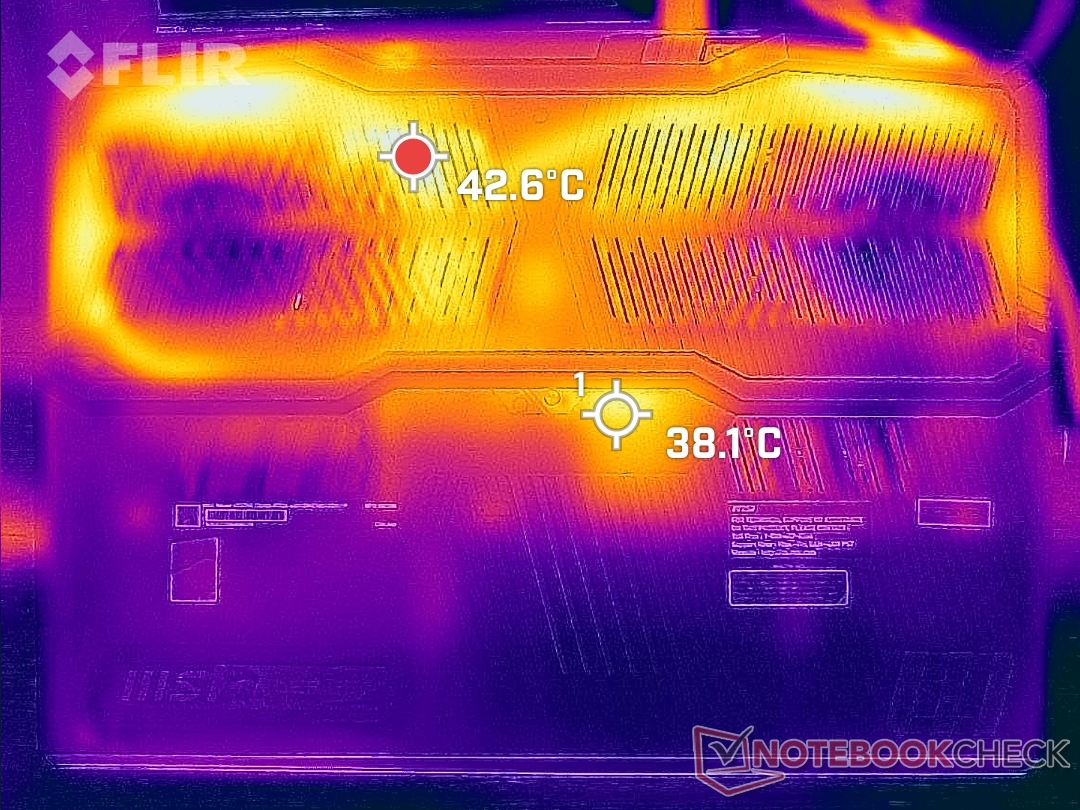
Yttemperaturerna är svalare än vad vi observerade på den äldre GE66. Vid spelande kan heta punkter på tangentbordsdäcket och bottenpanelen nå 35 C respektive 46 C. Dessa zoner ligger mot baksidan av chassit, vilket framgår av temperaturkartorna nedan.
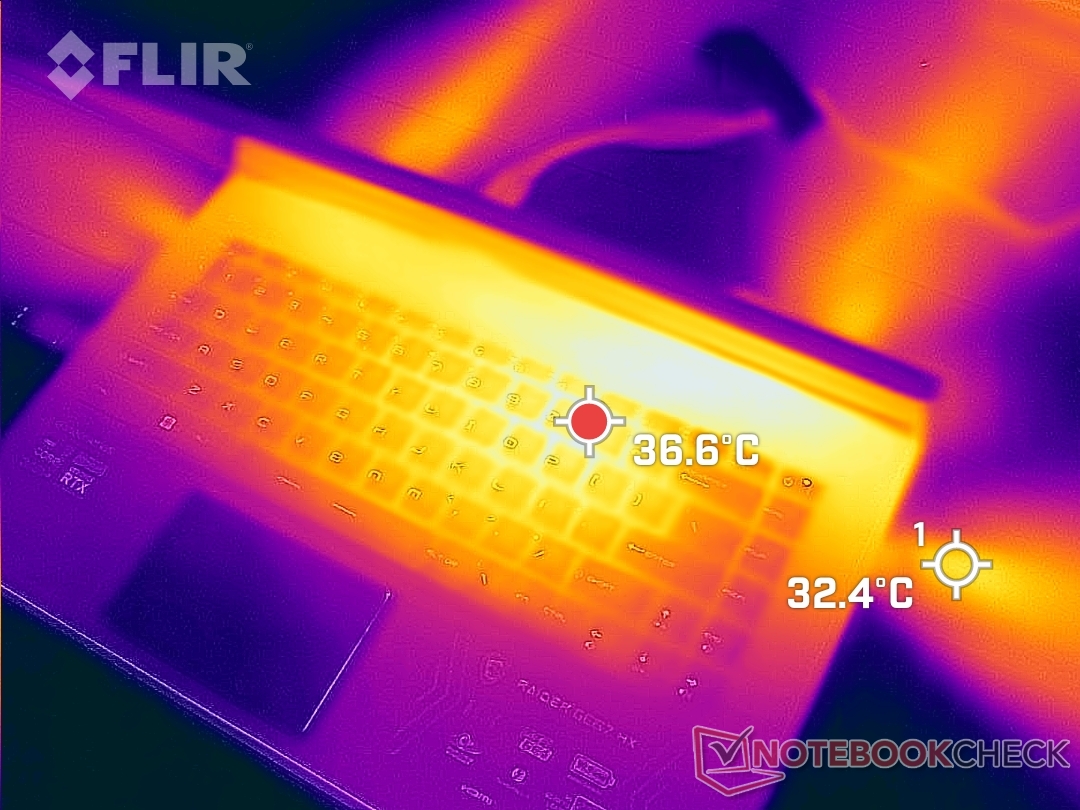
(+) Den maximala temperaturen på ovansidan är 34.4 °C / 94 F, jämfört med genomsnittet av 40.4 °C / 105 F , allt från 21.2 till 68.8 °C för klassen Gaming.
(±) Botten värms upp till maximalt 42 °C / 108 F, jämfört med genomsnittet av 43.2 °C / 110 F
(+) Vid tomgångsbruk är medeltemperaturen för ovansidan 21.4 °C / 71 F, jämfört med enhetsgenomsnittet på 33.9 °C / ### class_avg_f### F.
(+) När du spelar The Witcher 3 är medeltemperaturen för ovansidan 27.9 °C / 82 F, jämfört med enhetsgenomsnittet på 33.9 °C / ## #class_avg_f### F.
(+) Handledsstöden och pekplattan är kallare än hudtemperaturen med maximalt 20.4 °C / 68.7 F och är därför svala att ta på.
(+) Medeltemperaturen för handledsstödsområdet på liknande enheter var 28.8 °C / 83.8 F (+8.4 °C / 15.1 F).
| MSI GE67 HX 12UGS Intel Core i7-12800HX, NVIDIA GeForce RTX 3070 Ti Laptop GPU | MSI Raider GE66 12UHS Intel Core i9-12900HK, NVIDIA GeForce RTX 3080 Ti Laptop GPU | MSI Vector GP66 12UGS Intel Core i9-12900H, NVIDIA GeForce RTX 3070 Ti Laptop GPU | Asus ROG Strix Scar 15 G533ZW-LN106WS Intel Core i9-12900H, NVIDIA GeForce RTX 3070 Ti Laptop GPU | Alienware m15 R6, i7-11800H RTX 3080 Intel Core i7-11800H, NVIDIA GeForce RTX 3080 Laptop GPU | Razer Blade 15 2022 Intel Core i7-12800H, NVIDIA GeForce RTX 3080 Ti Laptop GPU | |
|---|---|---|---|---|---|---|
| Heat | -36% | -19% | -29% | -45% | -32% | |
| Maximum Upper Side * (°C) | 34.4 | 54 -57% | 40.2 -17% | 42.6 -24% | 61 -77% | 50 -45% |
| Maximum Bottom * (°C) | 42 | 65 -55% | 43.8 -4% | 50.2 -20% | 58 -38% | 47 -12% |
| Idle Upper Side * (°C) | 24 | 30 -25% | 34.8 -45% | 36.2 -51% | 38 -58% | 37.4 -56% |
| Idle Bottom * (°C) | 33.2 | 35 -5% | 37 -11% | 40.2 -21% | 36 -8% | 38.4 -16% |
* ... mindre är bättre
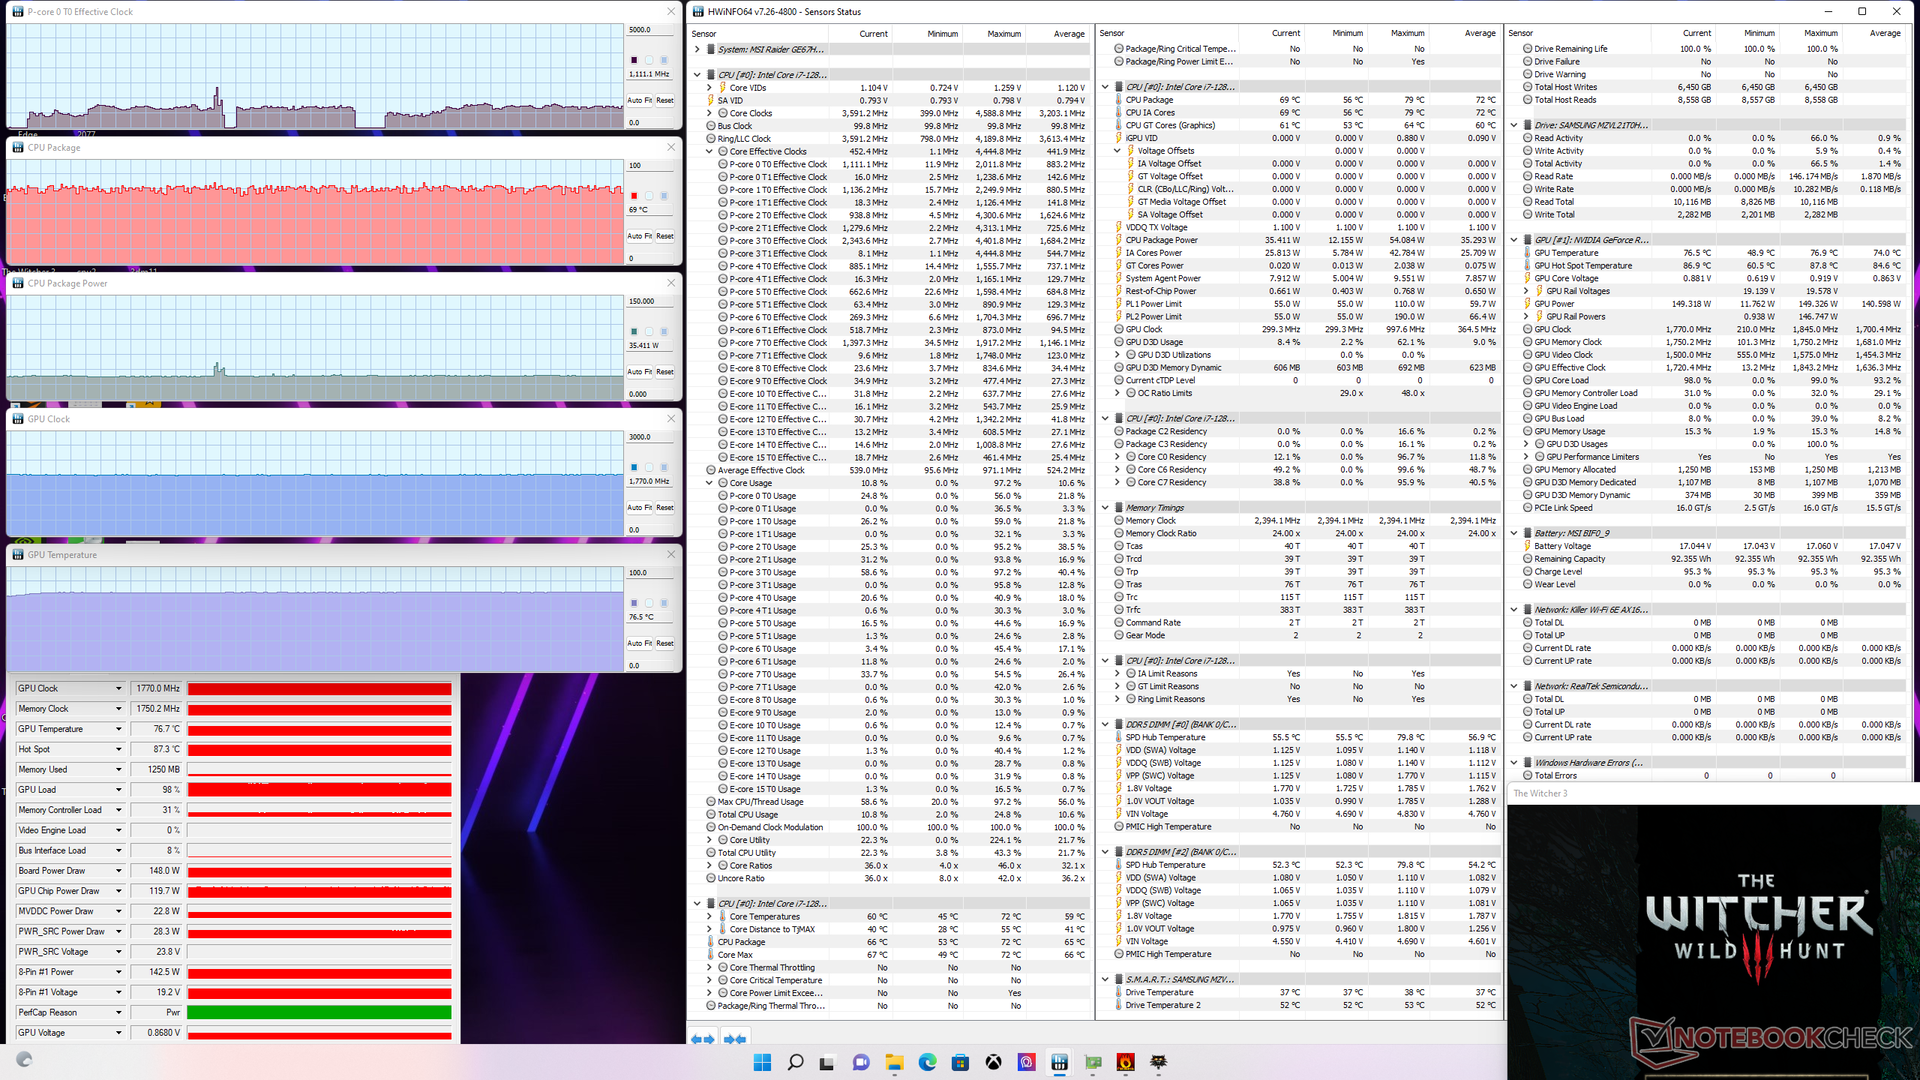
Stresstest
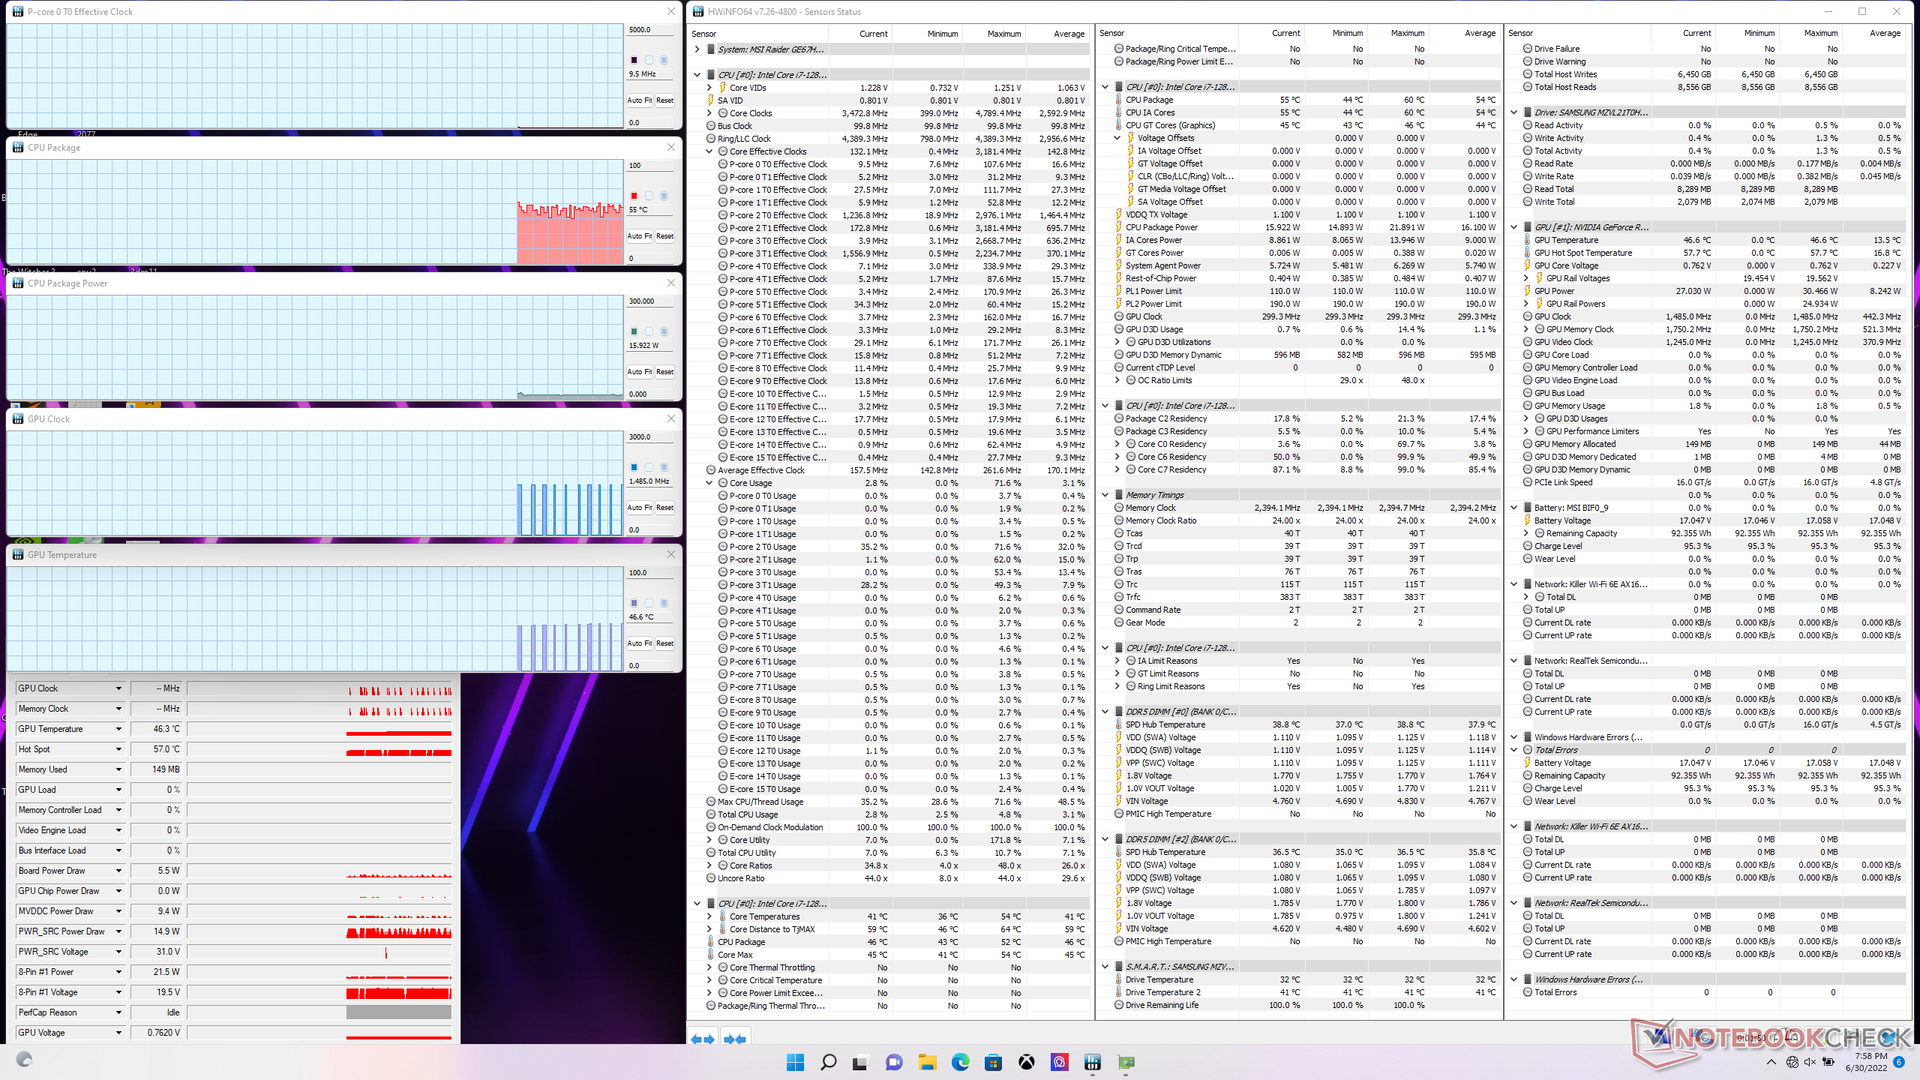
När CPU:n utsattes för Prime95 ökade den till 4,2 GHz fram till cirka 90 sekunder senare, då kärnans temperatur nådde 96 C. Därefter sjönk klockfrekvensen till 3,4-3,7 GHz för att bibehålla en svalare kärntemperatur på cirka 87 C. CPU-paketets strömförbrukning var så hög som 140 W under de första 90 sekunderna av testet, innan den stabiliserades på 110 W. Som jämförelse kan nämnas att Core i7-12900HK i den äldre GE66 stabiliserades på bara 45 W under liknande förhållanden.
GPU-kortets strömförbrukning skulle nå en topp på 148 W i läget Extreme Performance jämfört med ~135 W i läget Balanced power profile. Du kommer att vilja aktivera Extreme Performance-läget för att maximera GPU-potentialen som ett resultat. Genomsnittliga CPU- och GPU-temperaturer är rimliga på 69 C respektive 77 C, jämfört med 71 C och 70 C på Vector GP66 som kommer med samma GeForce RTX 3070 Ti GPU men en långsammare 11th gen CPU.
Det är värt att notera att vi bara kunde nå ett GPU-kort med en strömförbrukning på endast 148 W trots MSI:s annonsering om 150 W + 25 W Dynamic Boost även när vi körde i läget Extreme Performance, åtminstone enligt GPU-Z.
Att köra på batterier påverkar prestandan. Ett Fire Strike -test på batteridrift skulle ge fysik- och grafikpoäng på 22492 respektive 11614 poäng, jämfört med 34445 och 31096 poäng när det är på nätström.
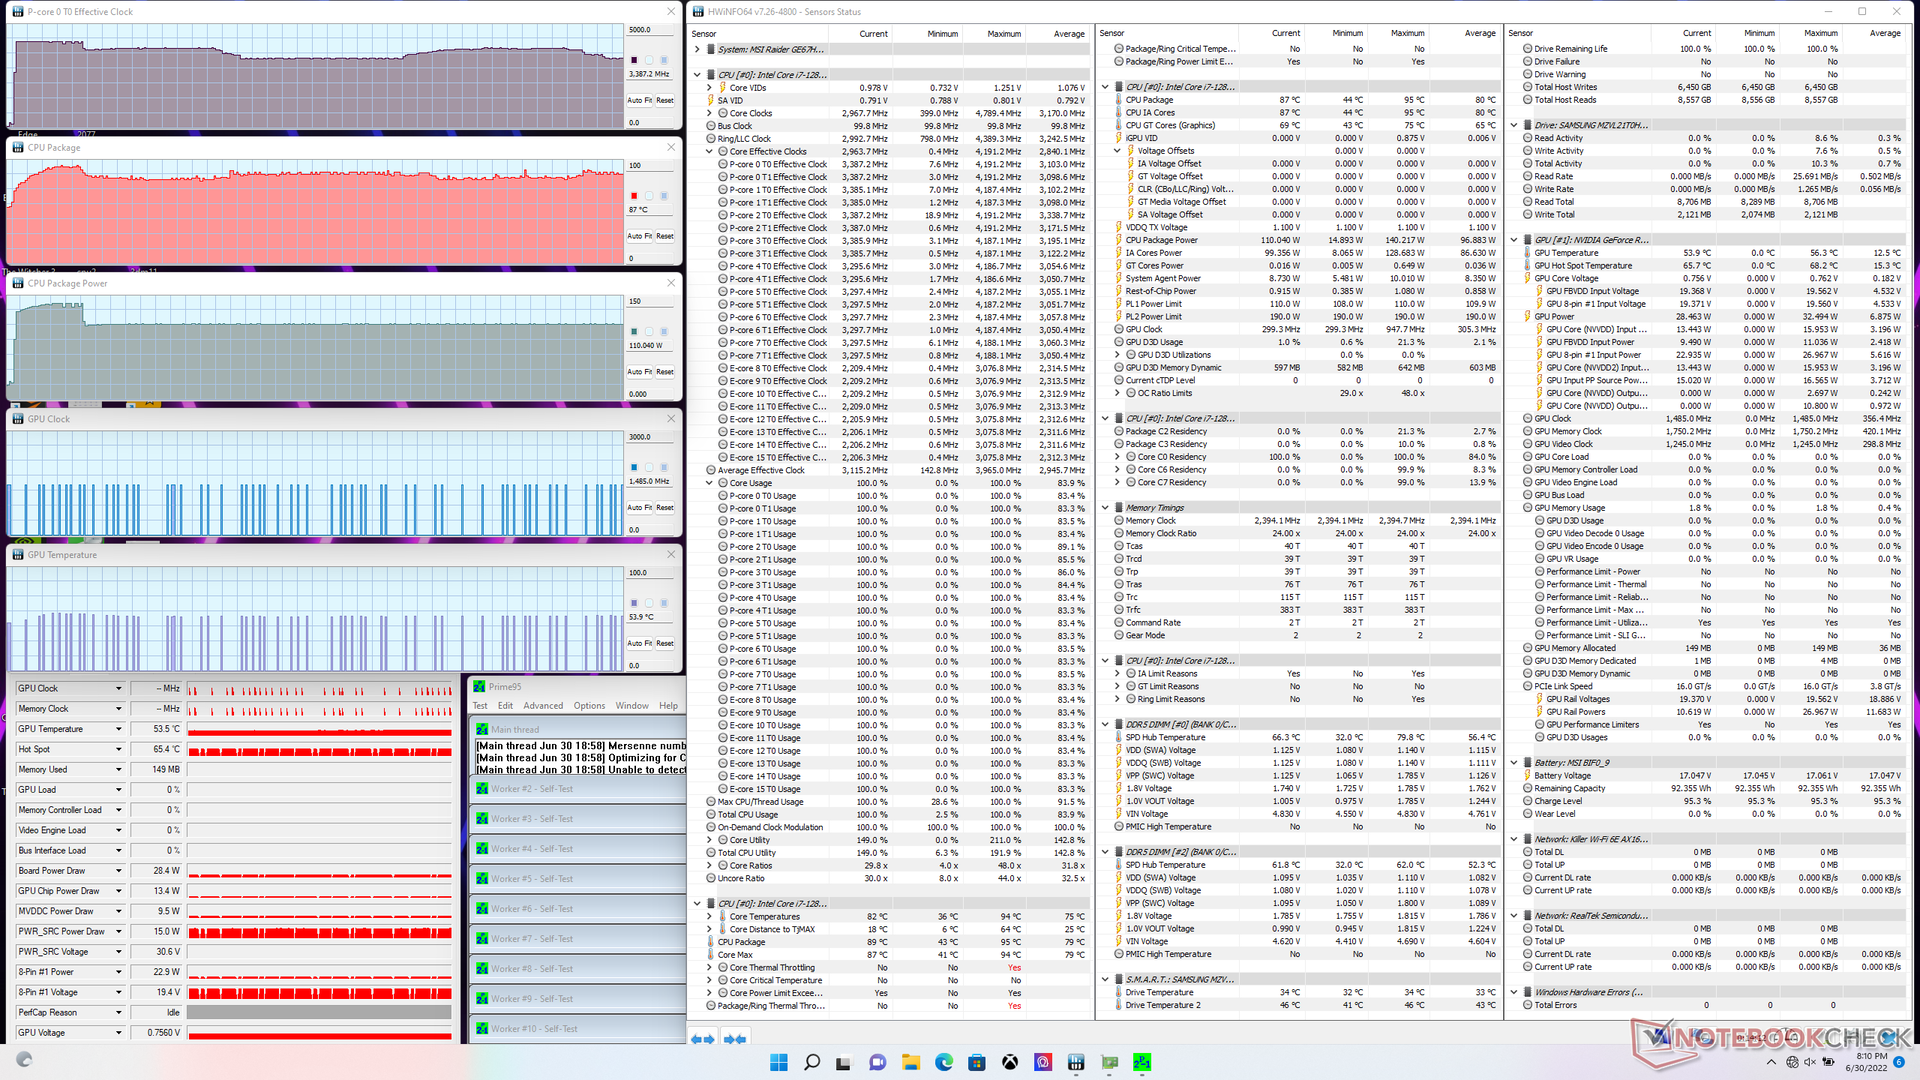
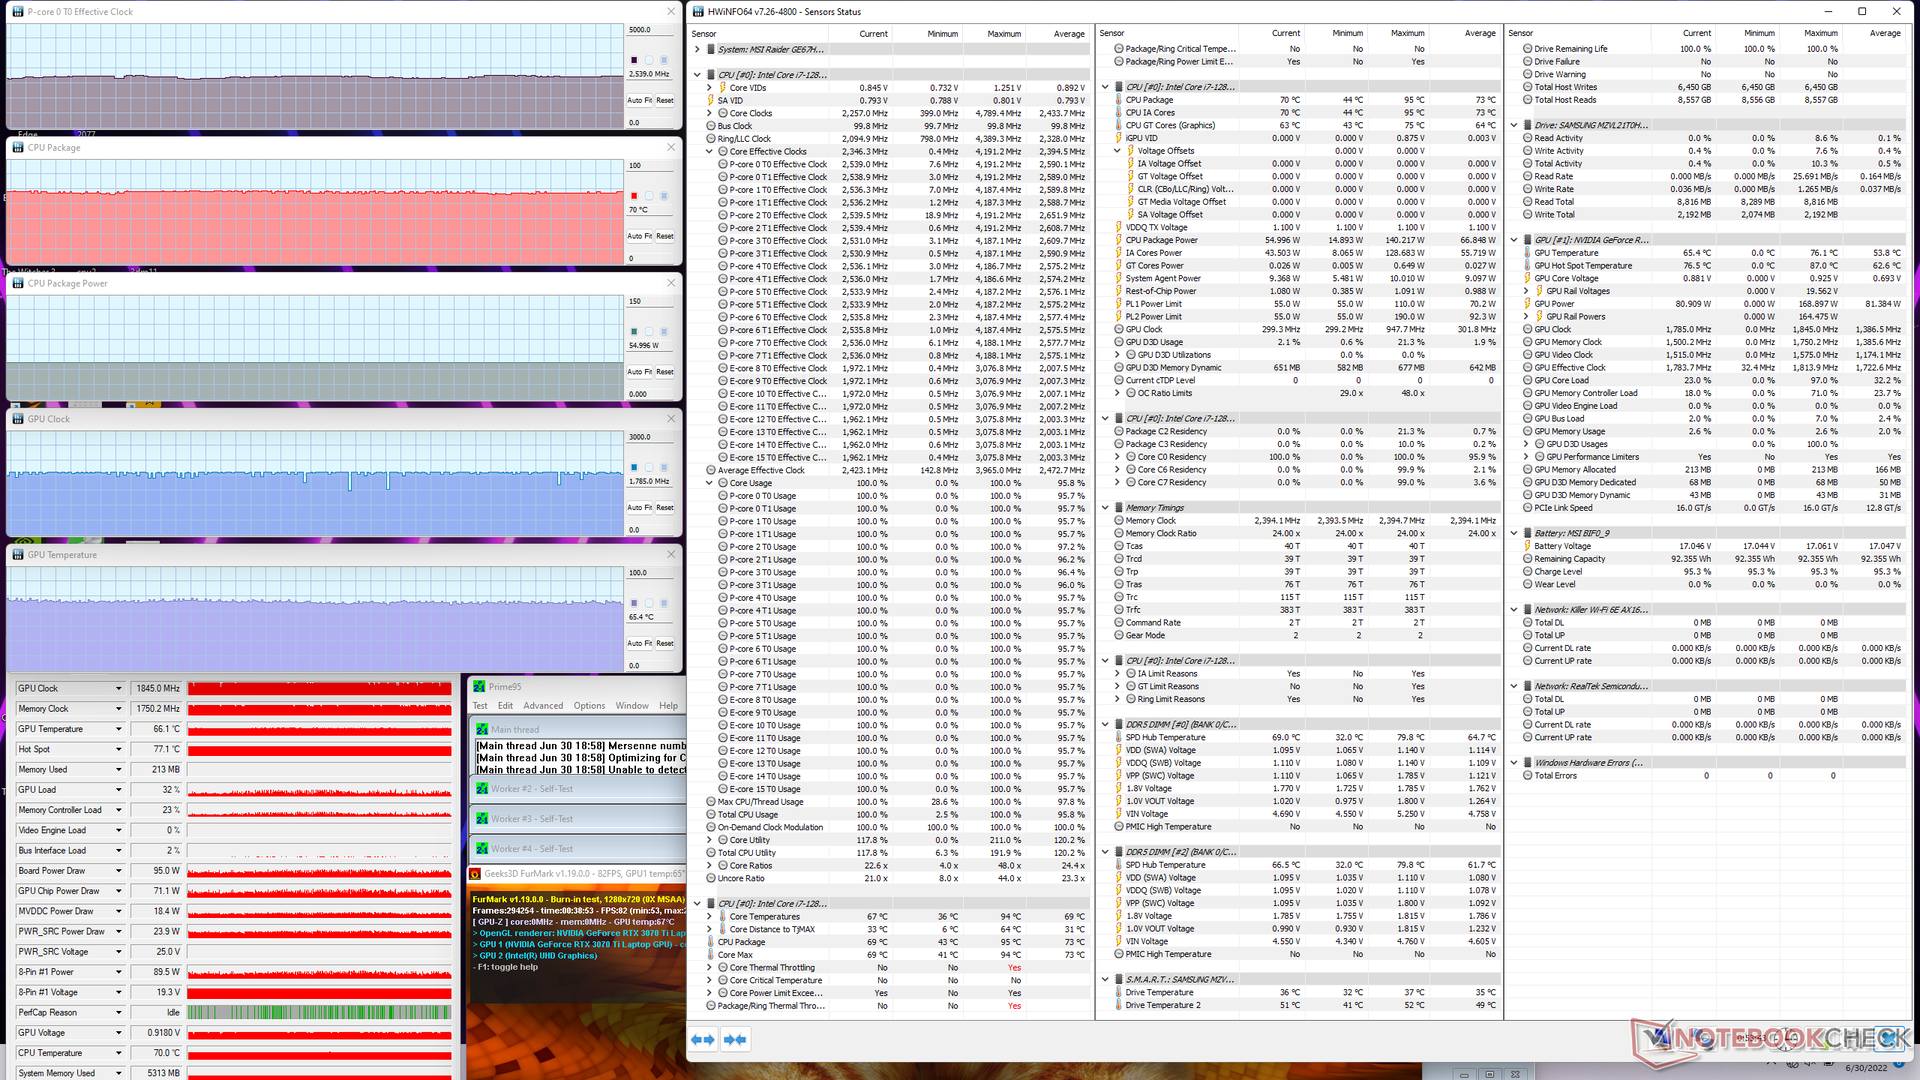
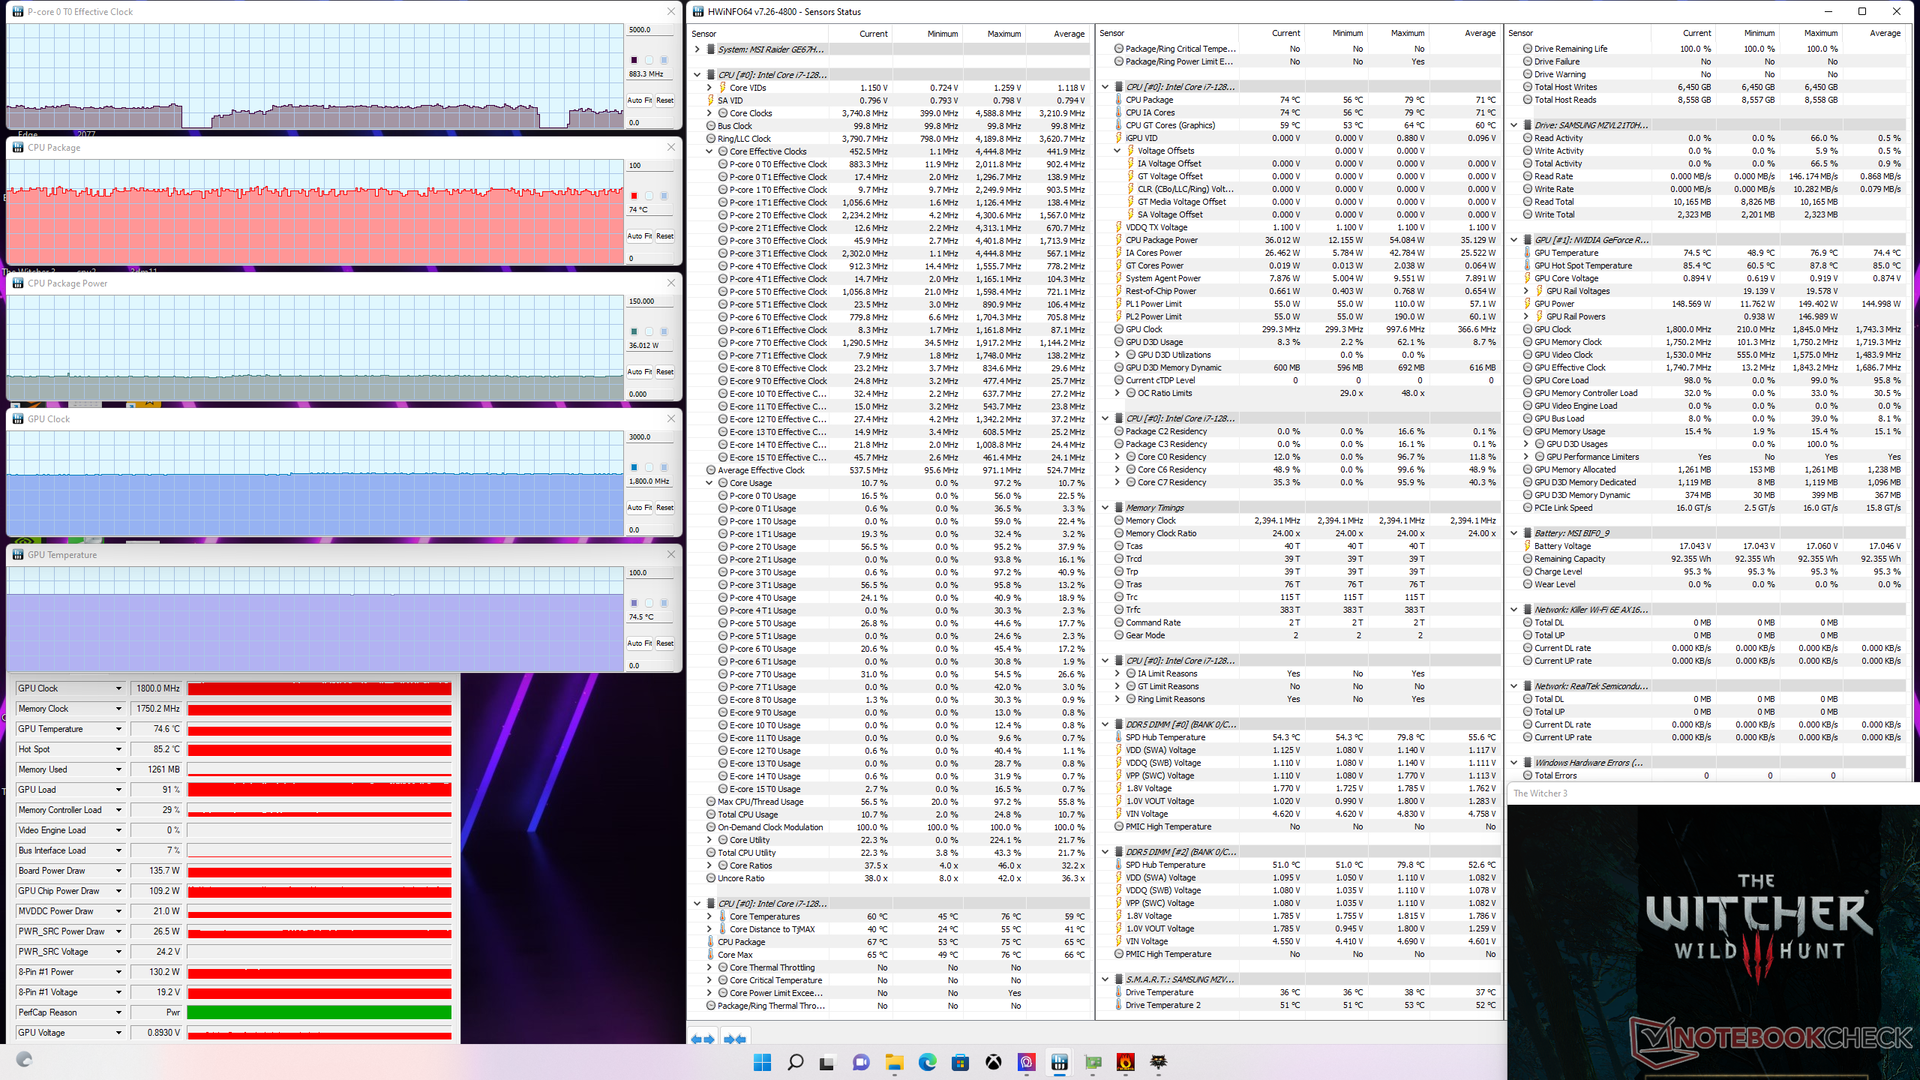
| CPU-klocka (GHz) | GPU-klocka (MHz) | Genomsnittlig CPU-temperatur (°C) | Genomsnittlig GPU-temperatur (°C) | |
| Systemets tomgång | -- | -- | 55 | 47 |
| Prime95 Stress | 3.4 - 3.7 | -- | 87 | 54 |
| Prime95 + FurMark Stress | 2,6 | 1845 | 70 | 65 |
| Witcher 3 Stress (balanserat läge) | 0,9 | 1800 | 74 | 75 |
| Witcher 3 Stress (Extreme Performance mode) | 1,1 | 1770 | 69 | 77 |
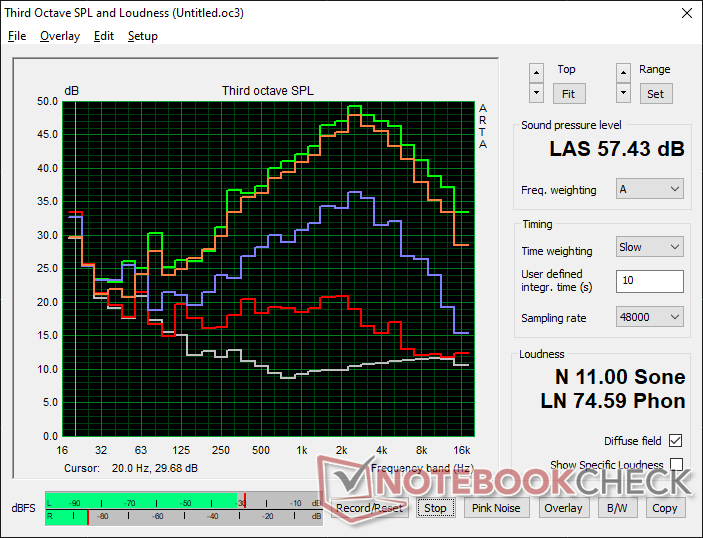
Högtalare
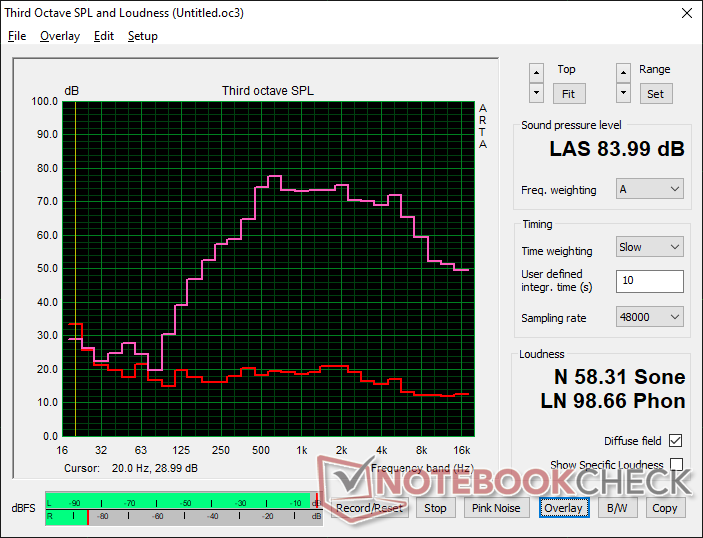
MSI GE67 HX 12UGS ljudanalys
(+) | högtalare kan spela relativt högt (84 dB)
Bas 100 - 315 Hz
(-) | nästan ingen bas - i genomsnitt 17.9% lägre än medianen
(±) | linjäriteten för basen är genomsnittlig (13.7% delta till föregående frekvens)
Mellan 400 - 2000 Hz
(±) | högre mellan - i genomsnitt 7.9% högre än median
(+) | mids är linjära (6.6% delta till föregående frekvens)
Högsta 2 - 16 kHz
(±) | högre toppar - i genomsnitt 5.5% högre än medianen
(±) | linjäriteten för toppar är genomsnittlig (8.6% delta till föregående frekvens)
Totalt 100 - 16 000 Hz
(±) | linjäriteten för det totala ljudet är genomsnittlig (22.1% skillnad mot median)
Jämfört med samma klass
» 79% av alla testade enheter i den här klassen var bättre, 6% liknande, 15% sämre
» Den bästa hade ett delta på 6%, genomsnittet var 18%, sämst var 132%
Jämfört med alla testade enheter
» 64% av alla testade enheter var bättre, 6% liknande, 30% sämre
» Den bästa hade ett delta på 4%, genomsnittet var 23%, sämst var 134%
Apple MacBook Pro 16 2021 M1 Pro ljudanalys
(+) | högtalare kan spela relativt högt (84.7 dB)
Bas 100 - 315 Hz
(+) | bra bas - bara 3.8% från medianen
(+) | basen är linjär (5.2% delta till föregående frekvens)
Mellan 400 - 2000 Hz
(+) | balanserad mellan - endast 1.3% från medianen
(+) | mids är linjära (2.1% delta till föregående frekvens)
Högsta 2 - 16 kHz
(+) | balanserade toppar - endast 1.9% från medianen
(+) | toppar är linjära (2.7% delta till föregående frekvens)
Totalt 100 - 16 000 Hz
(+) | det totala ljudet är linjärt (4.6% skillnad mot median)
Jämfört med samma klass
» 0% av alla testade enheter i den här klassen var bättre, 0% liknande, 100% sämre
» Den bästa hade ett delta på 5%, genomsnittet var 17%, sämst var 45%
Jämfört med alla testade enheter
» 0% av alla testade enheter var bättre, 0% liknande, 100% sämre
» Den bästa hade ett delta på 4%, genomsnittet var 23%, sämst var 134%
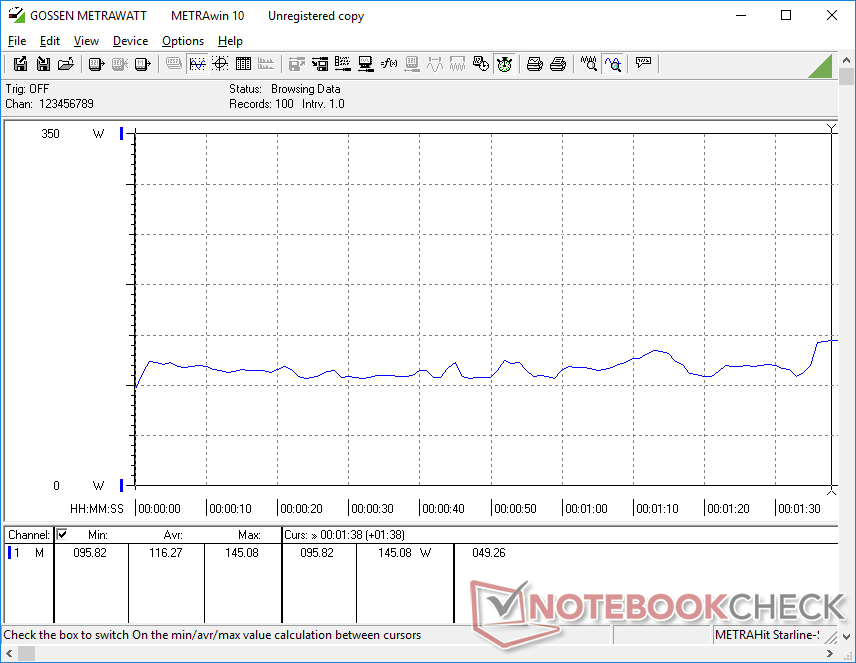
Energihantering - hög förbrukning och tunga kraftpaket
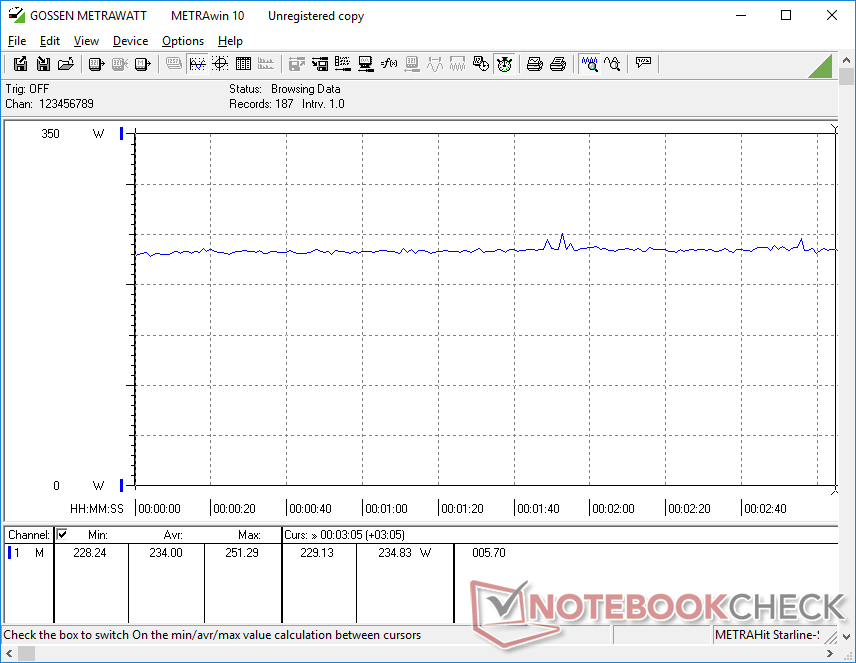
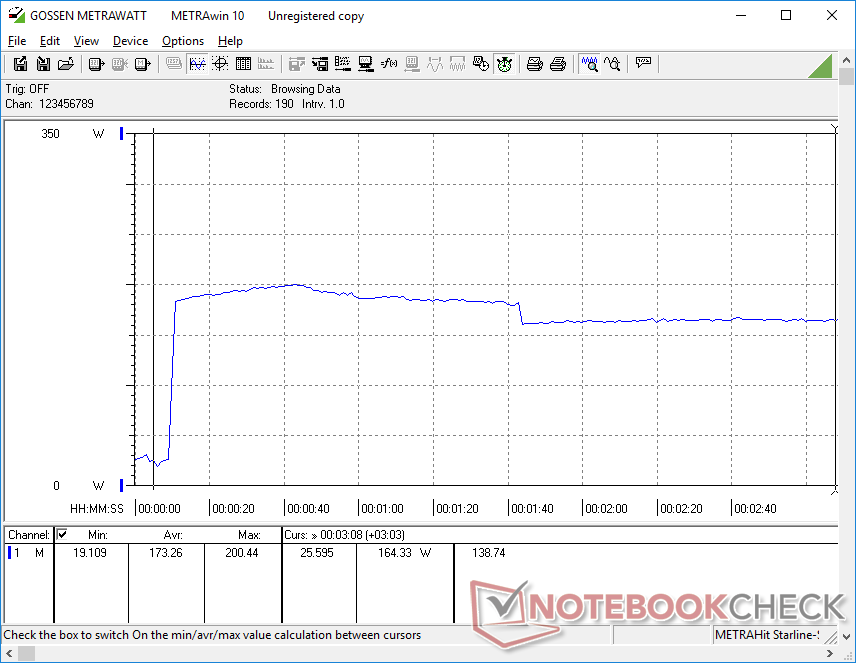
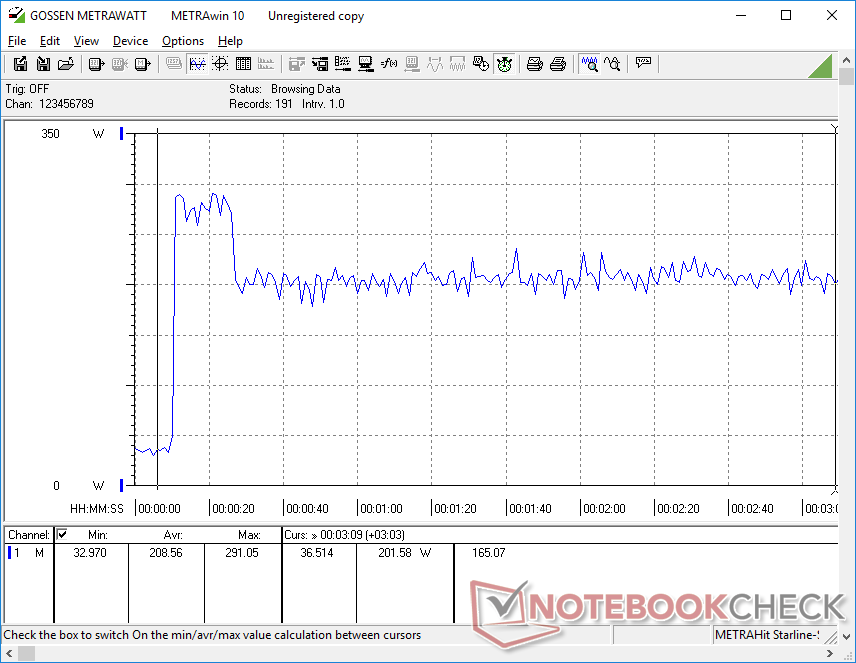
Effektförbrukning
Förbrukningen är märkbart högre än vad vi noterade på den äldre Core i9-12900HK GE66, särskilt när vi kör CPU-tunga program. Prime95, till exempel, skulle förbruka cirka 165 W på vår GE67 jämfört med endast 90 W på GE66, vilket motsvarar en ökning med 83 procent. Det är ett högt pris att betala för den 35-40-procentiga ökningen i rå prestanda för flera trådar mellan Core i9-12900HK och Core i7-12800HX
Körning av Witcher 3 skulle förbruka cirka 237 W, vilket återigen är högre än de 202 W som vi registrerade på GE66. Även om man jämför med andra bärbara datorer med hög prestanda för spel som Asus ROG Strix Scar 15 eller Asus ROG Strix Scar 15 Alienware m15 R6skulle GE67 vara mer energikrävande vid båda tillfällena
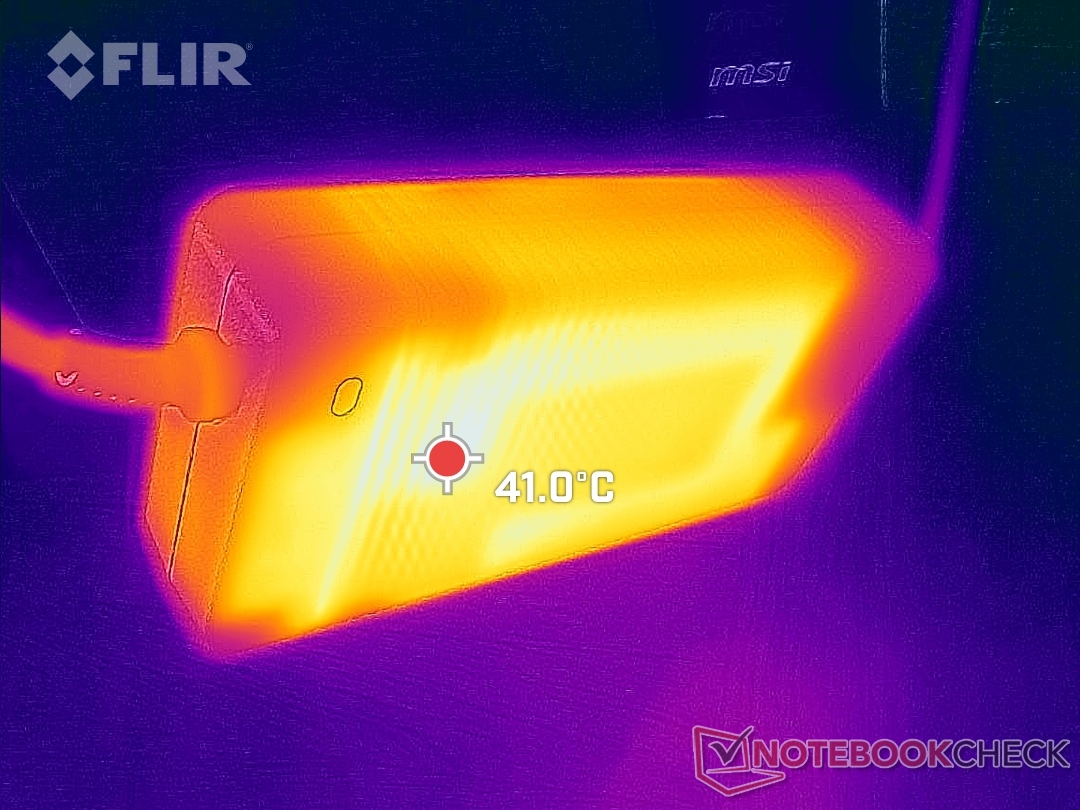
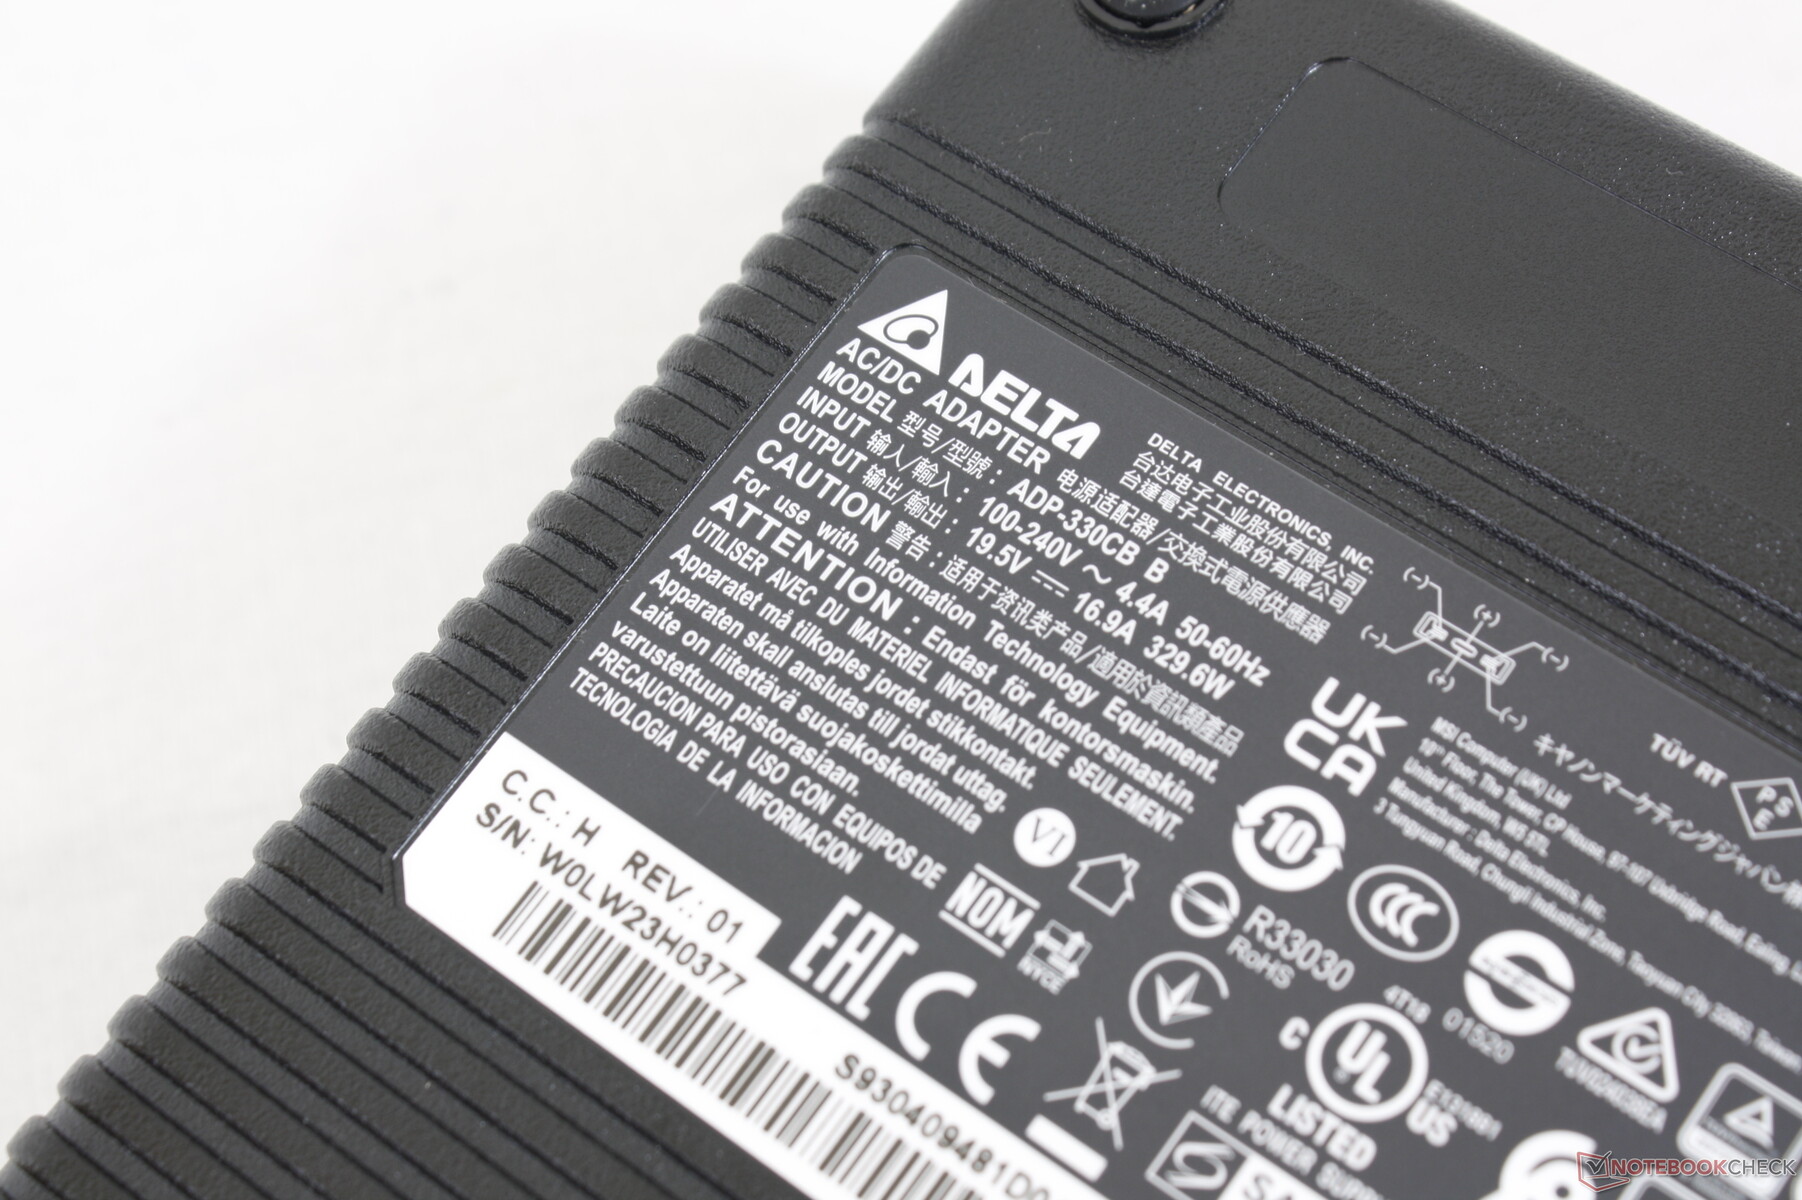
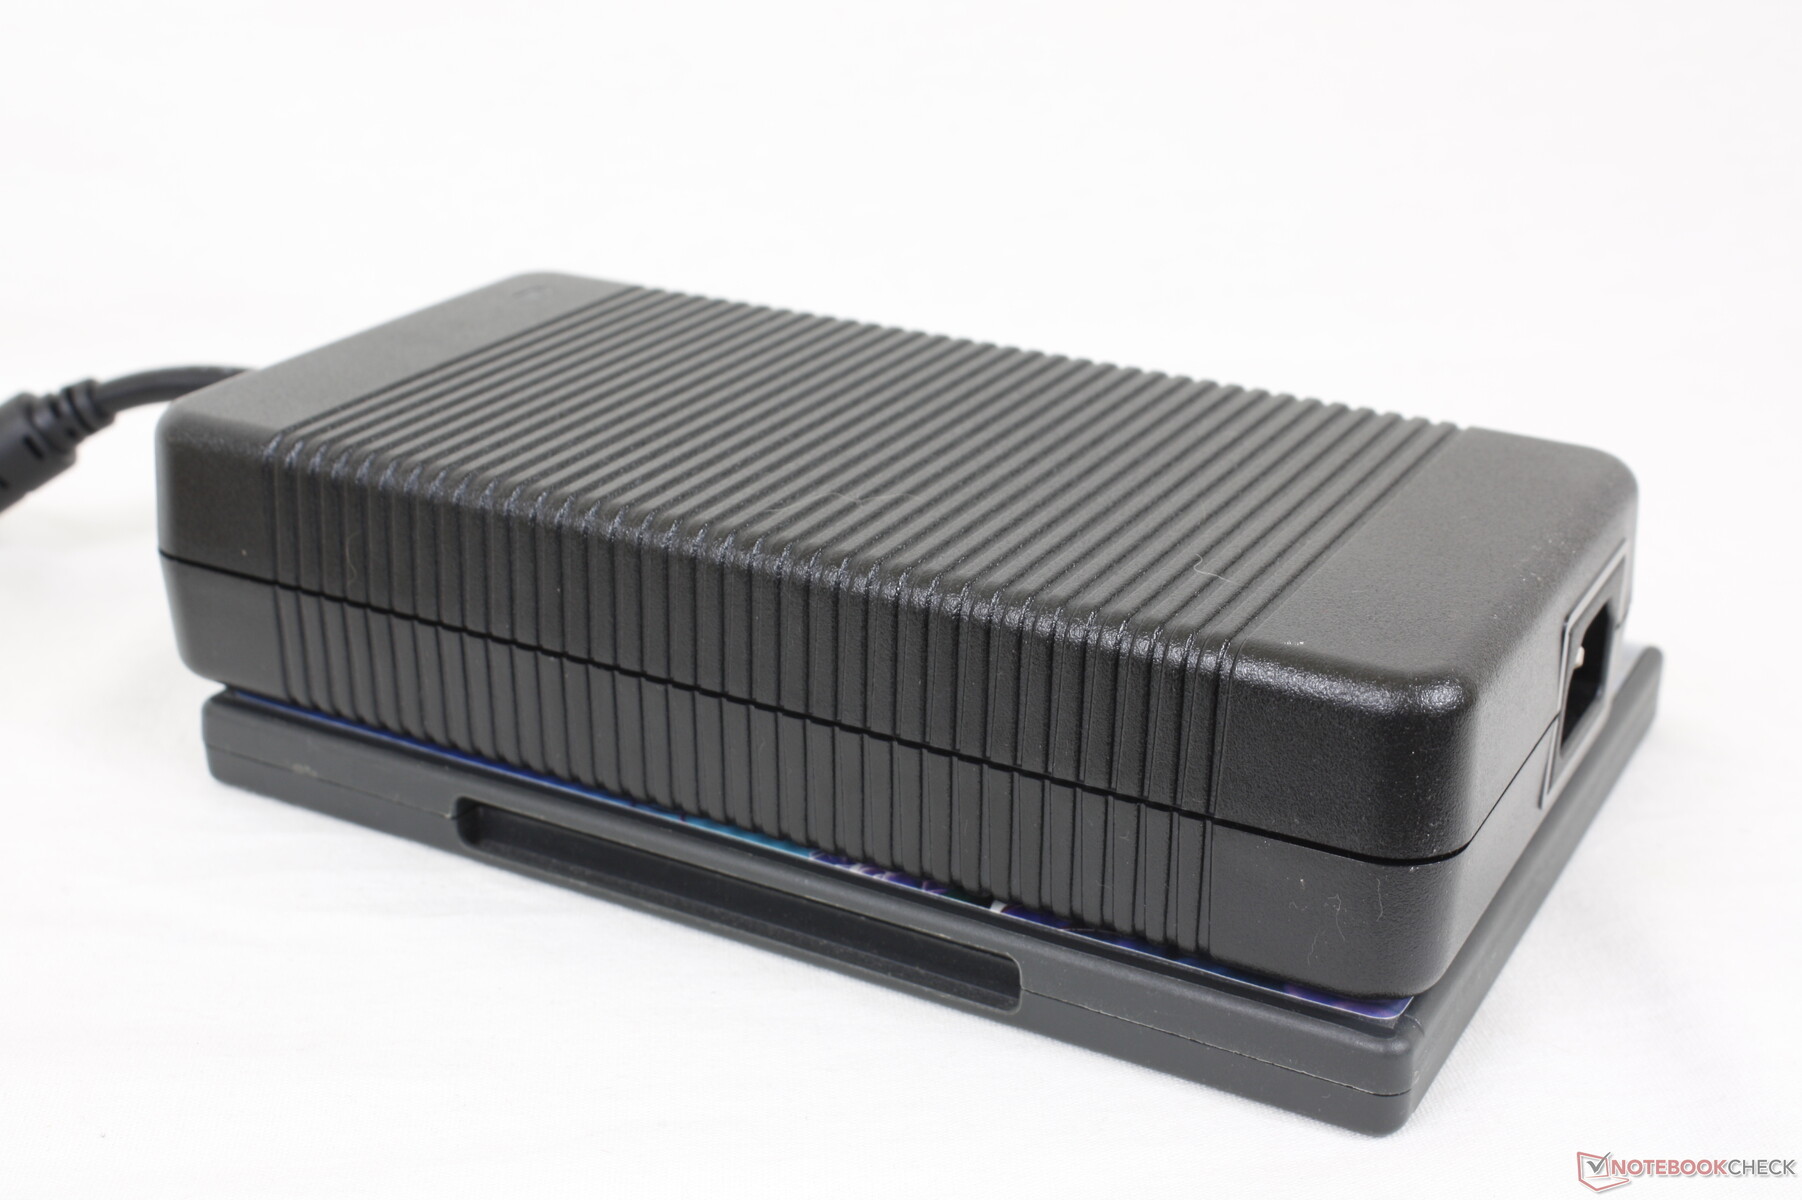
Vi kan registrera ett maximalt uttag på 291 W från den massiva (~20 x 9,8 x 4,3 cm) och tunga (1,3 kg) 330 W-strömklossen när vi körde både Prime95 och FurMark samtidigt. Observera att de flesta andra bärbara datorer för spel levereras med 280 W eller mindre nätadapter.
| Av/Standby | |
| Låg belastning | |
| Hög belastning |
|
Förklaring:
min: | |
| MSI GE67 HX 12UGS i7-12800HX, GeForce RTX 3070 Ti Laptop GPU, Samsung PM9A1 MZVL21T0HCLR, OLED, 1920x1080, 15.6" | MSI Raider GE66 12UHS i9-12900HK, GeForce RTX 3080 Ti Laptop GPU, Samsung PM9A1 MZVL22T0HBLB, IPS, 3840x2160, 15.6" | MSI Vector GP66 12UGS i9-12900H, GeForce RTX 3070 Ti Laptop GPU, , IPS, 1920x1080, 15.6" | Asus ROG Strix Scar 15 G533ZW-LN106WS i9-12900H, GeForce RTX 3070 Ti Laptop GPU, Samsung PM9A1 MZVL22T0HBLB, IPS-level, 2560x1440, 15.6" | Alienware m15 R6, i7-11800H RTX 3080 i7-11800H, GeForce RTX 3080 Laptop GPU, Samsung PM9A1 MZVL21T0HCLR, IPS, 1920x1080, 15.6" | Razer Blade 15 2022 i7-12800H, GeForce RTX 3080 Ti Laptop GPU, SSSTC CA6-8D1024, IPS, 2560x1440, 15.6" | |
|---|---|---|---|---|---|---|
| Power Consumption | 5% | -15% | 21% | 12% | -35% | |
| Idle Minimum * (Watt) | 16.1 | 16 1% | 17.5 -9% | 7.56 53% | 14 13% | 33.2 -106% |
| Idle Average * (Watt) | 17.1 | 19 -11% | 20.1 -18% | 13.5 21% | 18 -5% | 36.4 -113% |
| Idle Maximum * (Watt) | 26.6 | 26 2% | 47.3 -78% | 16.87 37% | 29 -9% | 37.6 -41% |
| Load Average * (Watt) | 116.3 | 110 5% | 107.3 8% | 128.9 -11% | 93 20% | 116.7 -0% |
| Witcher 3 ultra * (Watt) | 237 | 202 15% | 225 5% | 196.2 17% | 190 20% | 172 27% |
| Load Maximum * (Watt) | 291.1 | 242 17% | 277.7 5% | 274.86 6% | 203 30% | 228.6 21% |
* ... mindre är bättre
Power Consumption Witcher 3 / Stresstest
Power Consumption external Monitor
Batteritid - faktiskt inte dåligt
Batterikapaciteten är den största tillåtna på 99,9 Wh, eftersom en högre kapacitet skulle strida mot FAA:s säkerhetsbestämmelser för litiumbatterier. Användare kan förvänta sig WLAN-driftstider på cirka 5,5 timmar när de ställer in den balanserade strömprofilen, vilket liknar vad vi noterade på GE66 trots skillnader i prestanda.
Laddningen från tomt till fullt batteri går långsamt på 2 till 2,5 timmar. Systemet kan inte laddas via USB-C till skillnad från Razer Blade-serien eller de flesta Asus ROG-modeller.
| MSI GE67 HX 12UGS i7-12800HX, GeForce RTX 3070 Ti Laptop GPU, 99.9 Wh | MSI Raider GE66 12UHS i9-12900HK, GeForce RTX 3080 Ti Laptop GPU, 99 Wh | MSI Vector GP66 12UGS i9-12900H, GeForce RTX 3070 Ti Laptop GPU, 65 Wh | Asus ROG Strix Scar 15 G533ZW-LN106WS i9-12900H, GeForce RTX 3070 Ti Laptop GPU, 90 Wh | Alienware m15 R6, i7-11800H RTX 3080 i7-11800H, GeForce RTX 3080 Laptop GPU, 84 Wh | Razer Blade 15 2022 i7-12800H, GeForce RTX 3080 Ti Laptop GPU, 80 Wh | |
|---|---|---|---|---|---|---|
| Batteridrifttid | -9% | -19% | -4% | -18% | -12% | |
| Reader / Idle (h) | 8.4 | 7.9 -6% | ||||
| WiFi v1.3 (h) | 5.6 | 5.7 2% | 5.7 2% | 8.4 50% | 5 -11% | 4.9 -12% |
| Load (h) | 2.1 | 1.7 -19% | 1 -52% | 0.9 -57% | 1.6 -24% | |
| H.264 (h) | 7.1 | 8.5 | 5.6 | |||
| Witcher 3 ultra (h) | 1.2 |
För
Emot
Slutsats - Högre prestanda, högre elräkningar
Prestandafördelarna med Core i7-12800HX är obestridliga. Jämfört med Ryzen 7 5800H eller till och med Core i9-12900Hkan Intel HX CPU:n erbjuda upp till 80 procent snabbare prestanda för flera trådar än den förstnämnda och 30 till 60 procent snabbare prestanda än den sistnämnda. Vinsterna är tillräckligt betydande för att kunna gå före de stationära processorerna i skrivbordsklassen Core i7-12700K i många fall. Entusiaster och spelare som vet att de kan dra nytta av processorn, till exempel för högre bildfrekvenser vid spel, kommer att finna mycket att gilla med vad GE67 kan erbjuda.
All den extra prestandan är dock inte gratis. Medan GE66 skulle levereras med en smalare 280 W AC-adapter, levereras GE67 med en skrymmande 330 W AC-adapter bara för att rymma den strömhungriga Intel 12th gen HX CPU. Strömförbrukningen är utan tvekan högre som ett resultat. Vissa användare kan tycka att dessa nackdelar är värda att ta hänsyn till de enorma CPU-vinsterna, men det är ändå något att ha i åtanke om man utgår från prestanda per watt.
GE67 är en av de snabbaste bärbara speldatorerna på 15,6-tum tack vare en Core i7-12800HX CPU och en 150 W GeForce RTX GPU. Den är också en av de mest energikrävande eftersom den kräver en stor 330 W strömkloss för att fungera.
När det gäller QHD OLED 240 Hz-skärmen är det lätt den bästa OLED-panelen som för närvarande finns tillgänglig för speländamål och den passar mycket bra ihop med HX-CPU:n och 150 W GeForce RTX 3070 Ti GPU:n. Dess implementering på GE67 är dock inte avsedd för professionell redigering, och flimret kan påverka en minoritet av användarna.
Pris och tillgänglighet
MSI GE67 är ännu inte allmänt tillgänglig på Amazon eller Best Buy i skrivande stund. Men butiker som XoticPC och EXcaliberPC har SKU:er i lager som börjar på 2 500 USD.
MSI GE67 HX 12UGS
- 08/30/2022 v7 (old)
Allen Ngo
Price comparison

