MSI Stealth 14 Studio recension - En dyr gaminglaptop som har gjort för många kompromisser
MSI Stealth 14 Studio är en kompakt men kraftfull 14-tums gaminglaptop som även riktar sig till innehållsskapare - eller andra användare som vill ha bra prestanda i ett litet fodral. Tillverkaren har förlitat sig på sitt beprövade recept och kombinerat Intel Raptor Lake-chips från H45-serien med de nya RTX 4000-laptops från Nvidia. Vår testenhet är en Stealth 14 Studio A13VE-029, och för 1 699,99 USD erbjuder den enCore i7-13700H, denGeForce RTX 4050 bärbar dator16 GB RAM-minne samt en 1 TB NVMe SSD. Den har en matt IPS-panel (2.560 x 1.600 pixlar) med en uppdateringsfrekvens på 240 Hz. Som tillval kan Stealth 14 Studio köpas medRTX 4070 bärbar datoroch 32 GB RAM-minne.
Potentiella konkurrenter i jämförelse
Gradering | Datum | Modell | Vikt | Höjd | Storlek | Upplösning | Pris |
|---|---|---|---|---|---|---|---|
| 85.4 % v7 (old) | 07/2023 | MSI Stealth 14 Studio A13V i7-13700H, GeForce RTX 4050 Laptop GPU | 1.7 kg | 19 mm | 14.00" | 2560x1600 | |
| 89.4 % v7 (old) | 05/2023 | Gigabyte Aero 14 OLED BMF i7-13700H, GeForce RTX 4050 Laptop GPU | 1.4 kg | 17 mm | 14.00" | 2880x1800 | |
| 88.8 % v7 (old) | 10/2022 | Schenker Vision 14 2022 RTX 3050 Ti i7-12700H, GeForce RTX 3050 Ti Laptop GPU | 1.3 kg | 16.6 mm | 14.00" | 2880x1800 | |
| 86.8 % v7 (old) | 03/2022 | Asus ROG Flow Z13 GZ301ZE i9-12900H, GeForce RTX 3050 Ti Laptop GPU | 1.2 kg | 12 mm | 13.40" | 1920x1200 | |
| 86.7 % v7 (old) | 03/2022 | Alienware x14 i7 RTX 3060 i7-12700H, GeForce RTX 3060 Laptop GPU | 1.8 kg | 14.5 mm | 14.00" | 1920x1080 | |
| 89.4 % v7 (old) | 05/2022 | Razer Blade 14 Ryzen 9 6900HX R9 6900HX, GeForce RTX 3070 Ti Laptop GPU | 1.8 kg | 16.8 mm | 14.00" | 2560x1440 | |
| 86 % v7 (old) | 11/2022 | Acer Predator Triton 300 SE i9-12900H, GeForce RTX 3060 Laptop GPU | 1.7 kg | 19.8 mm | 14.00" | 2880x1800 |
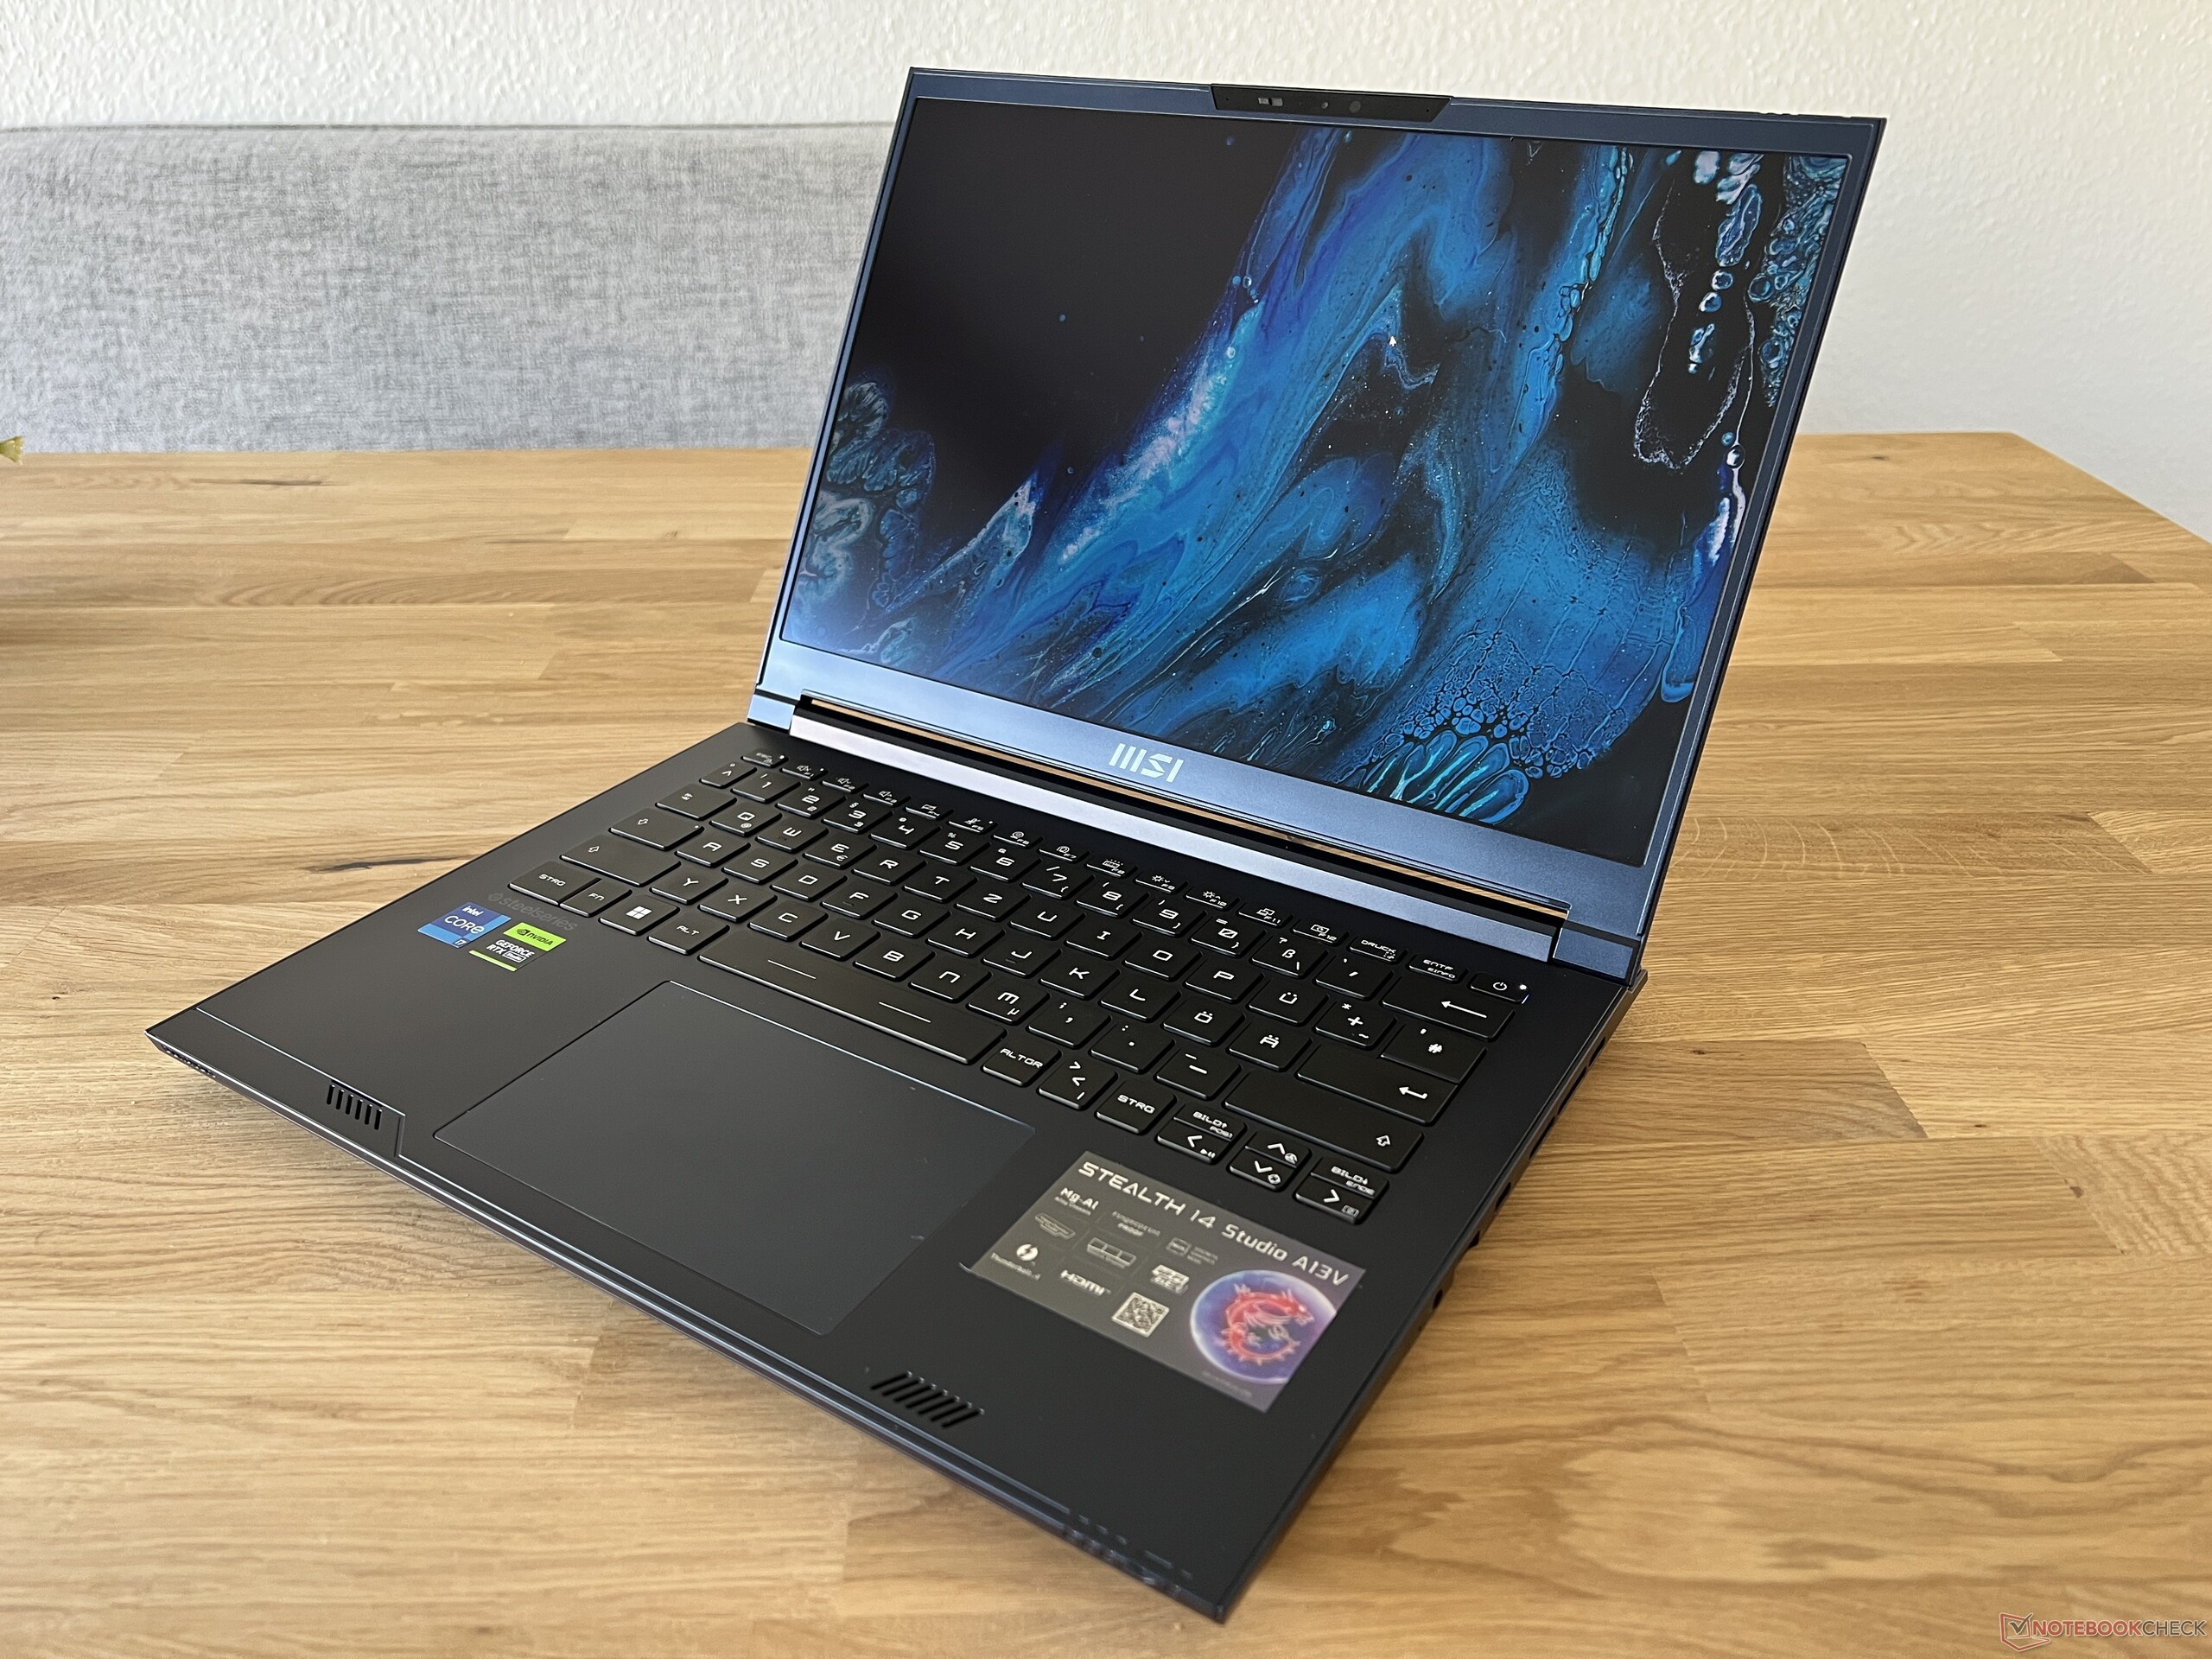
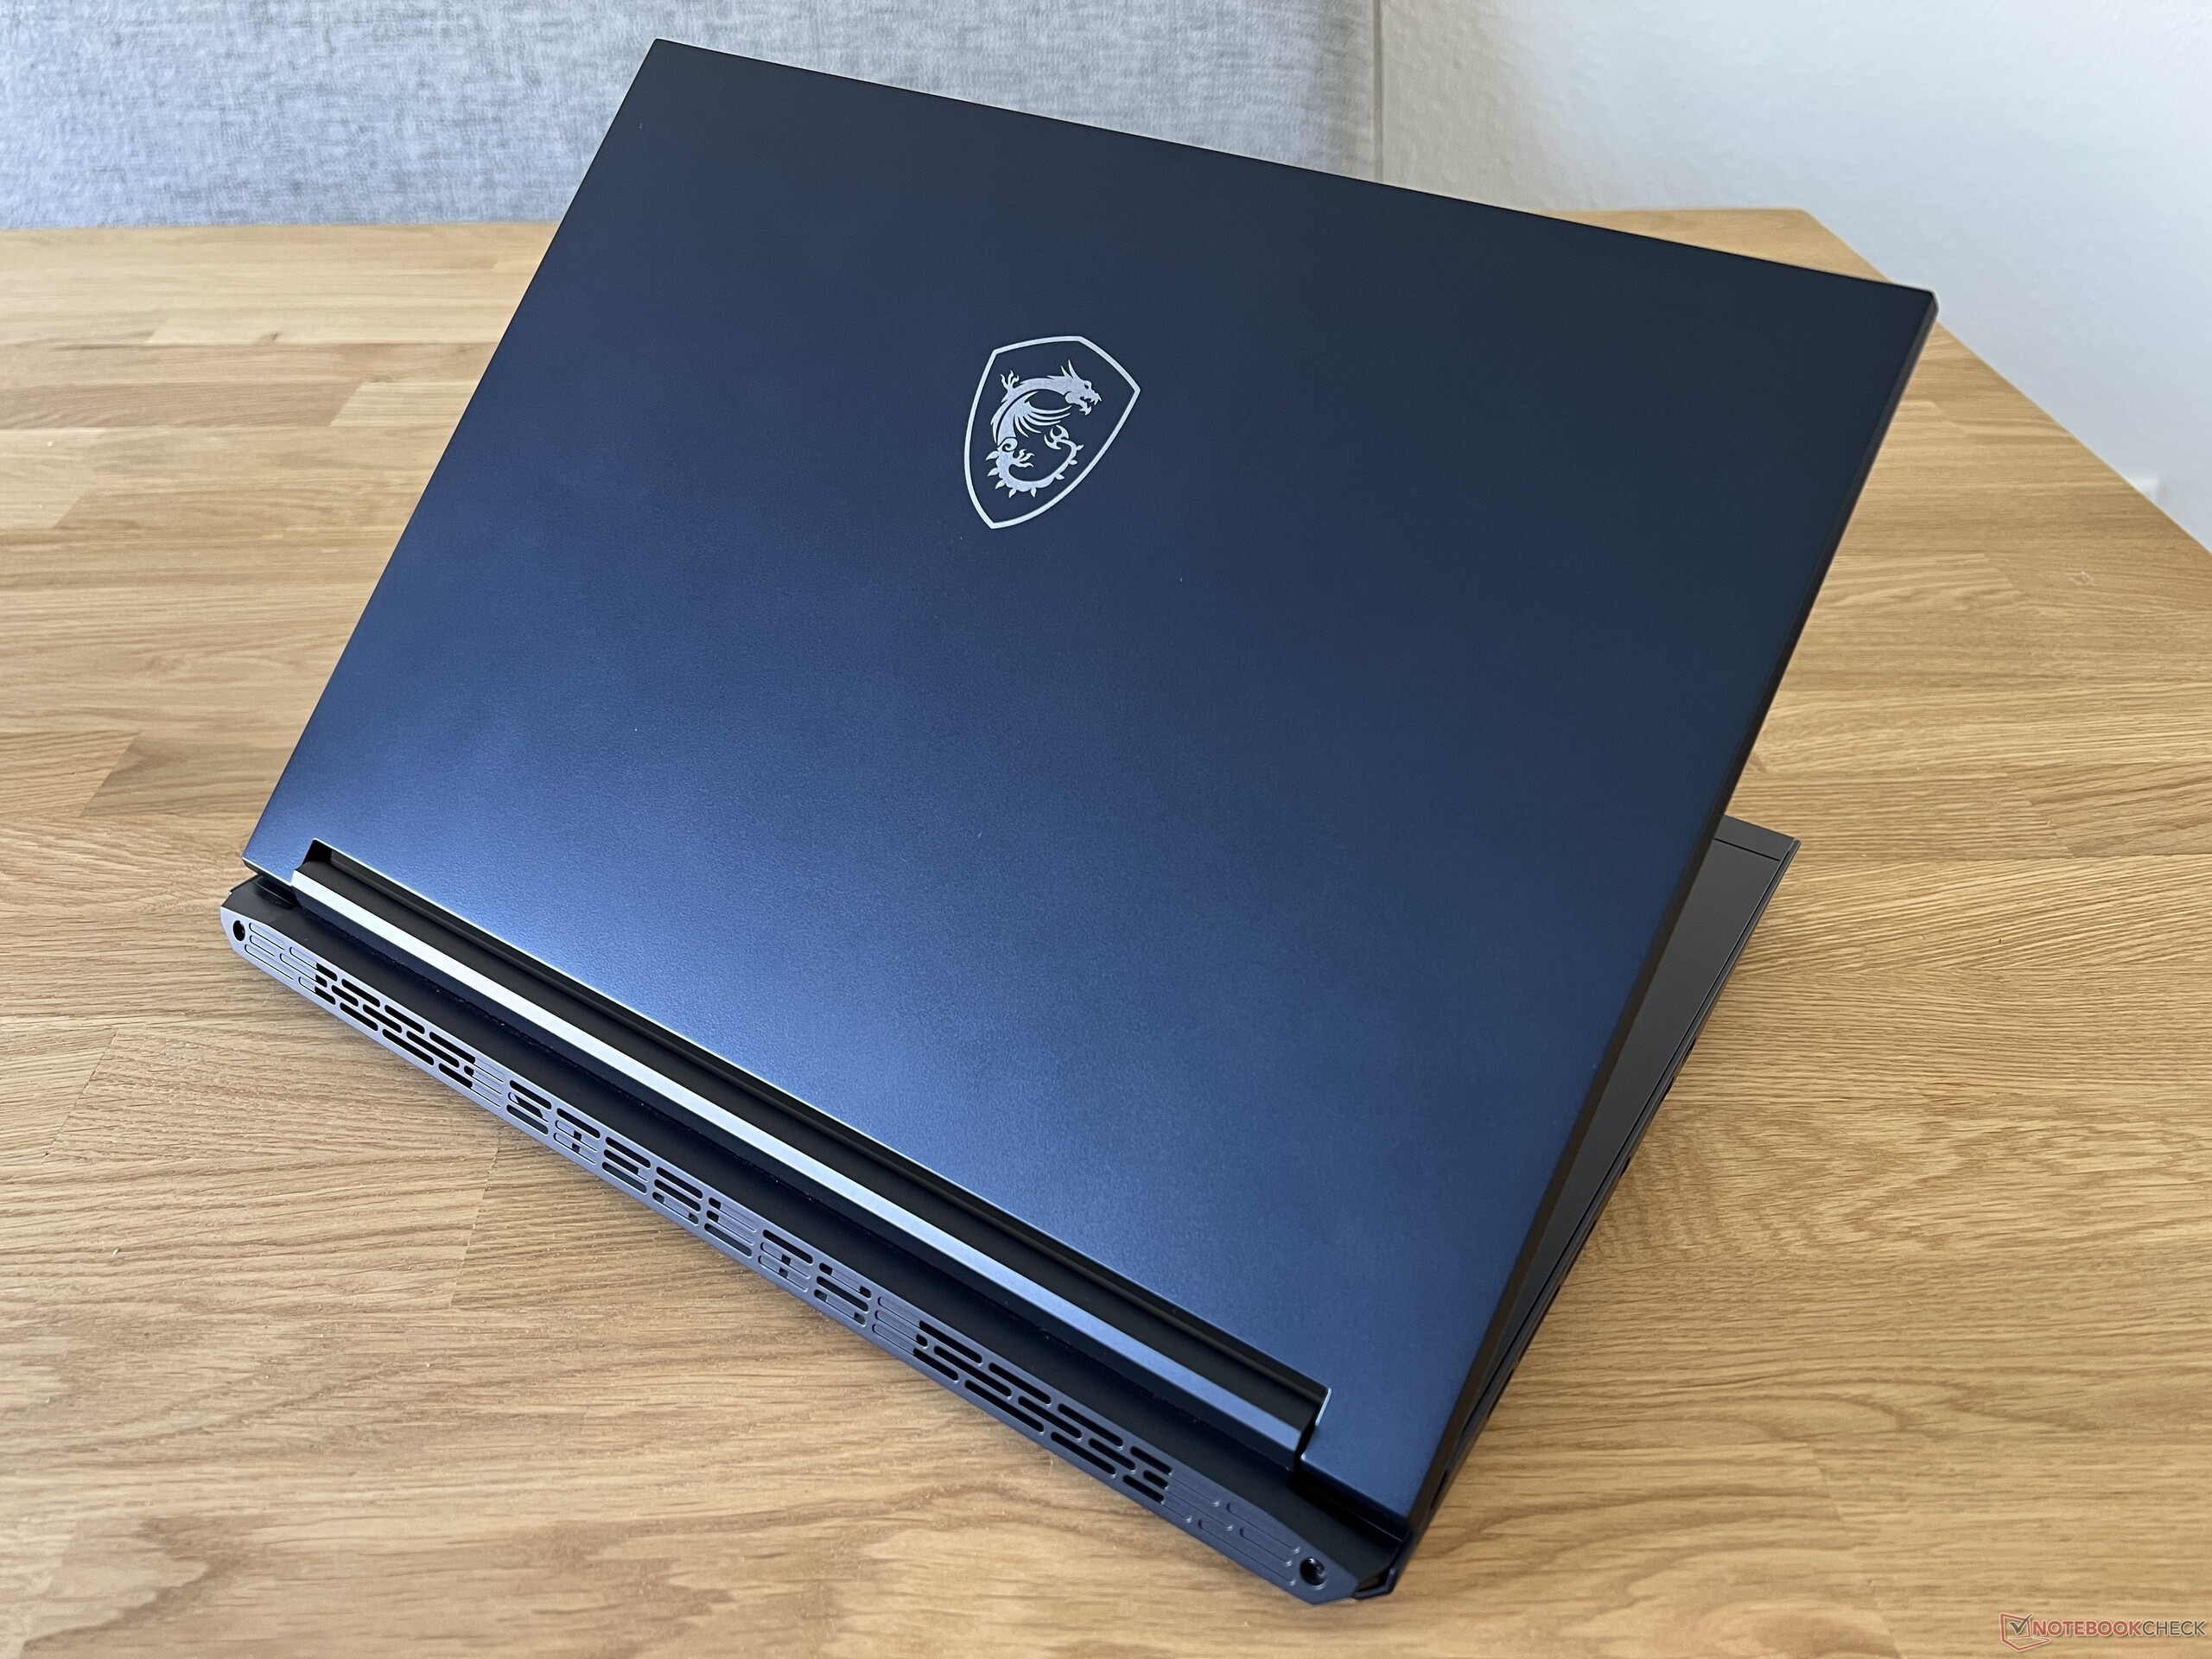
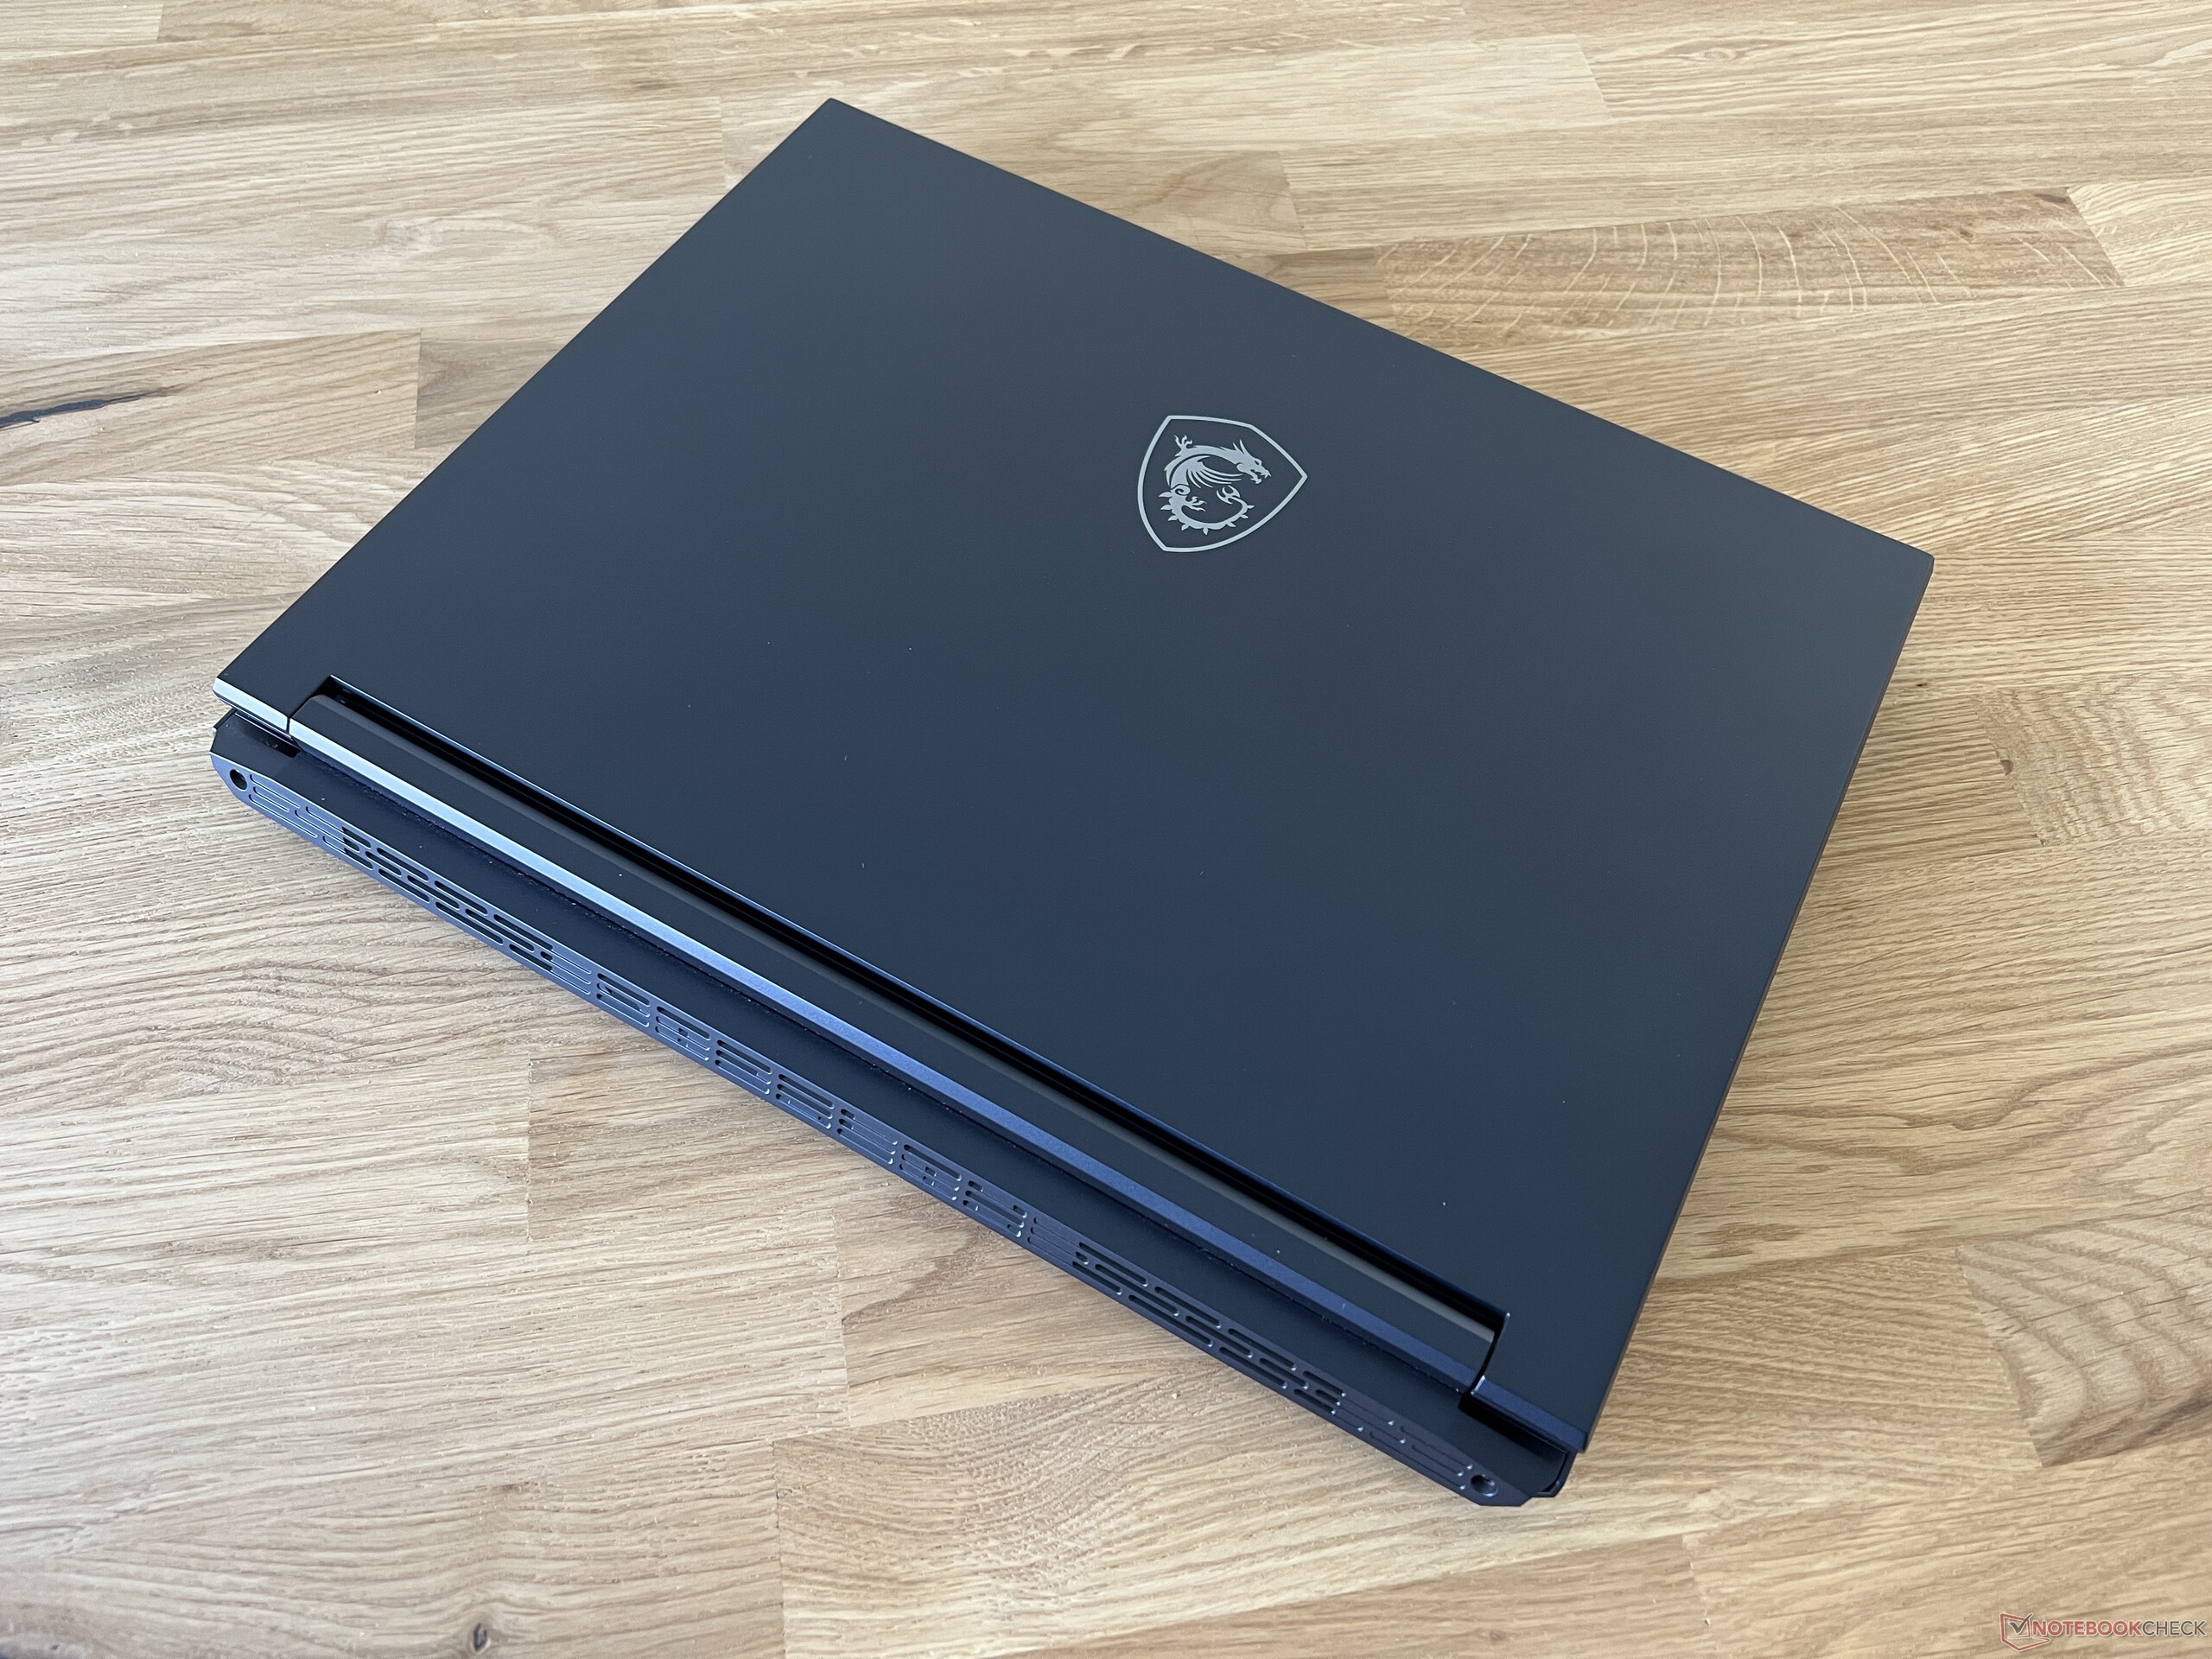
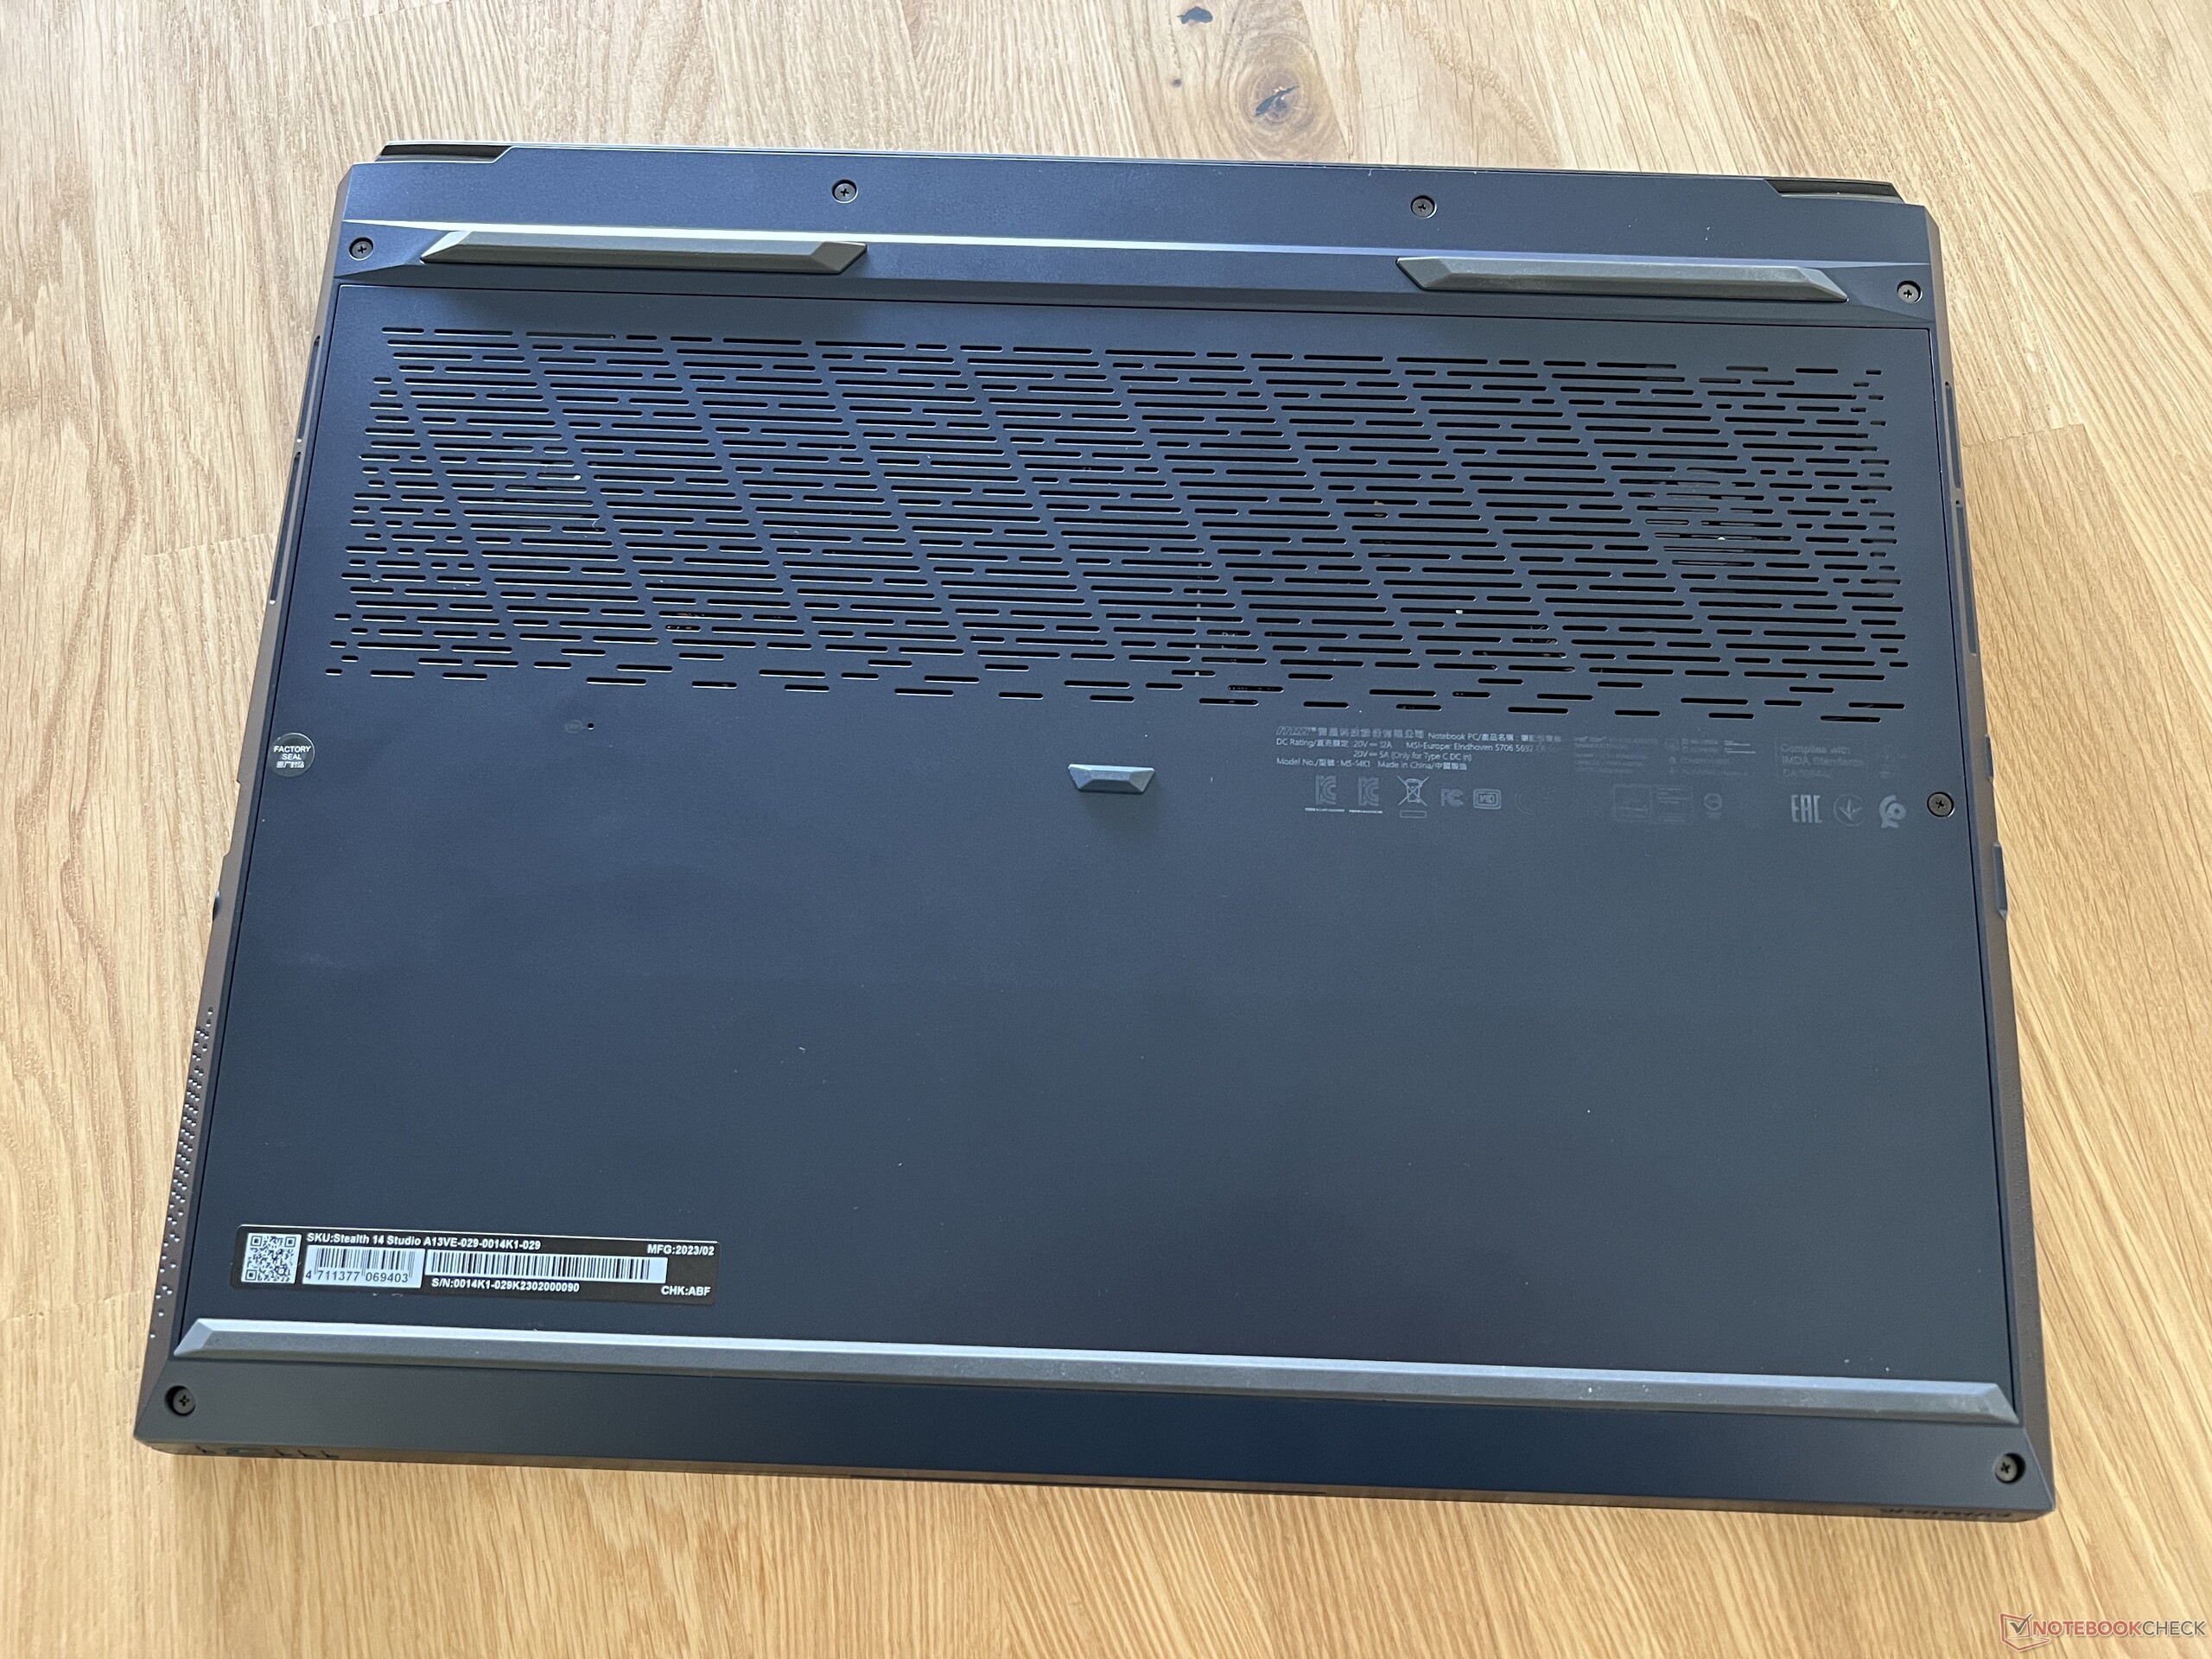
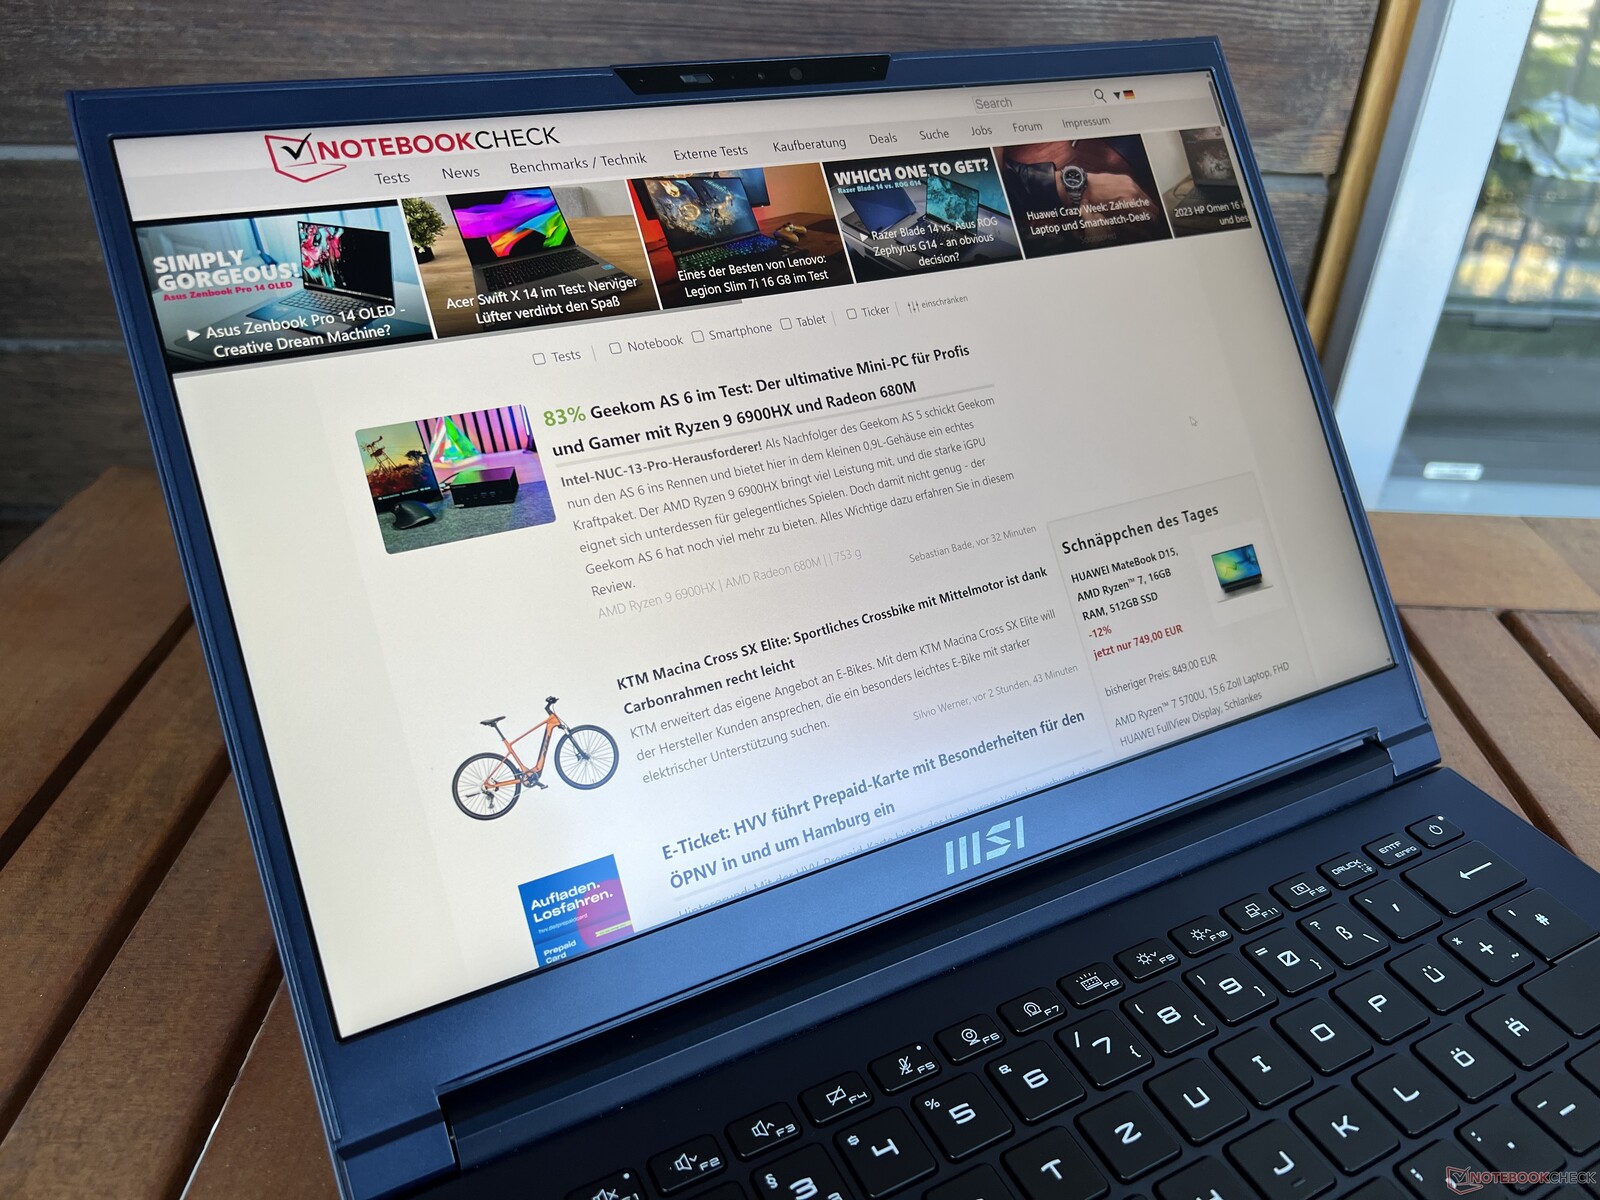
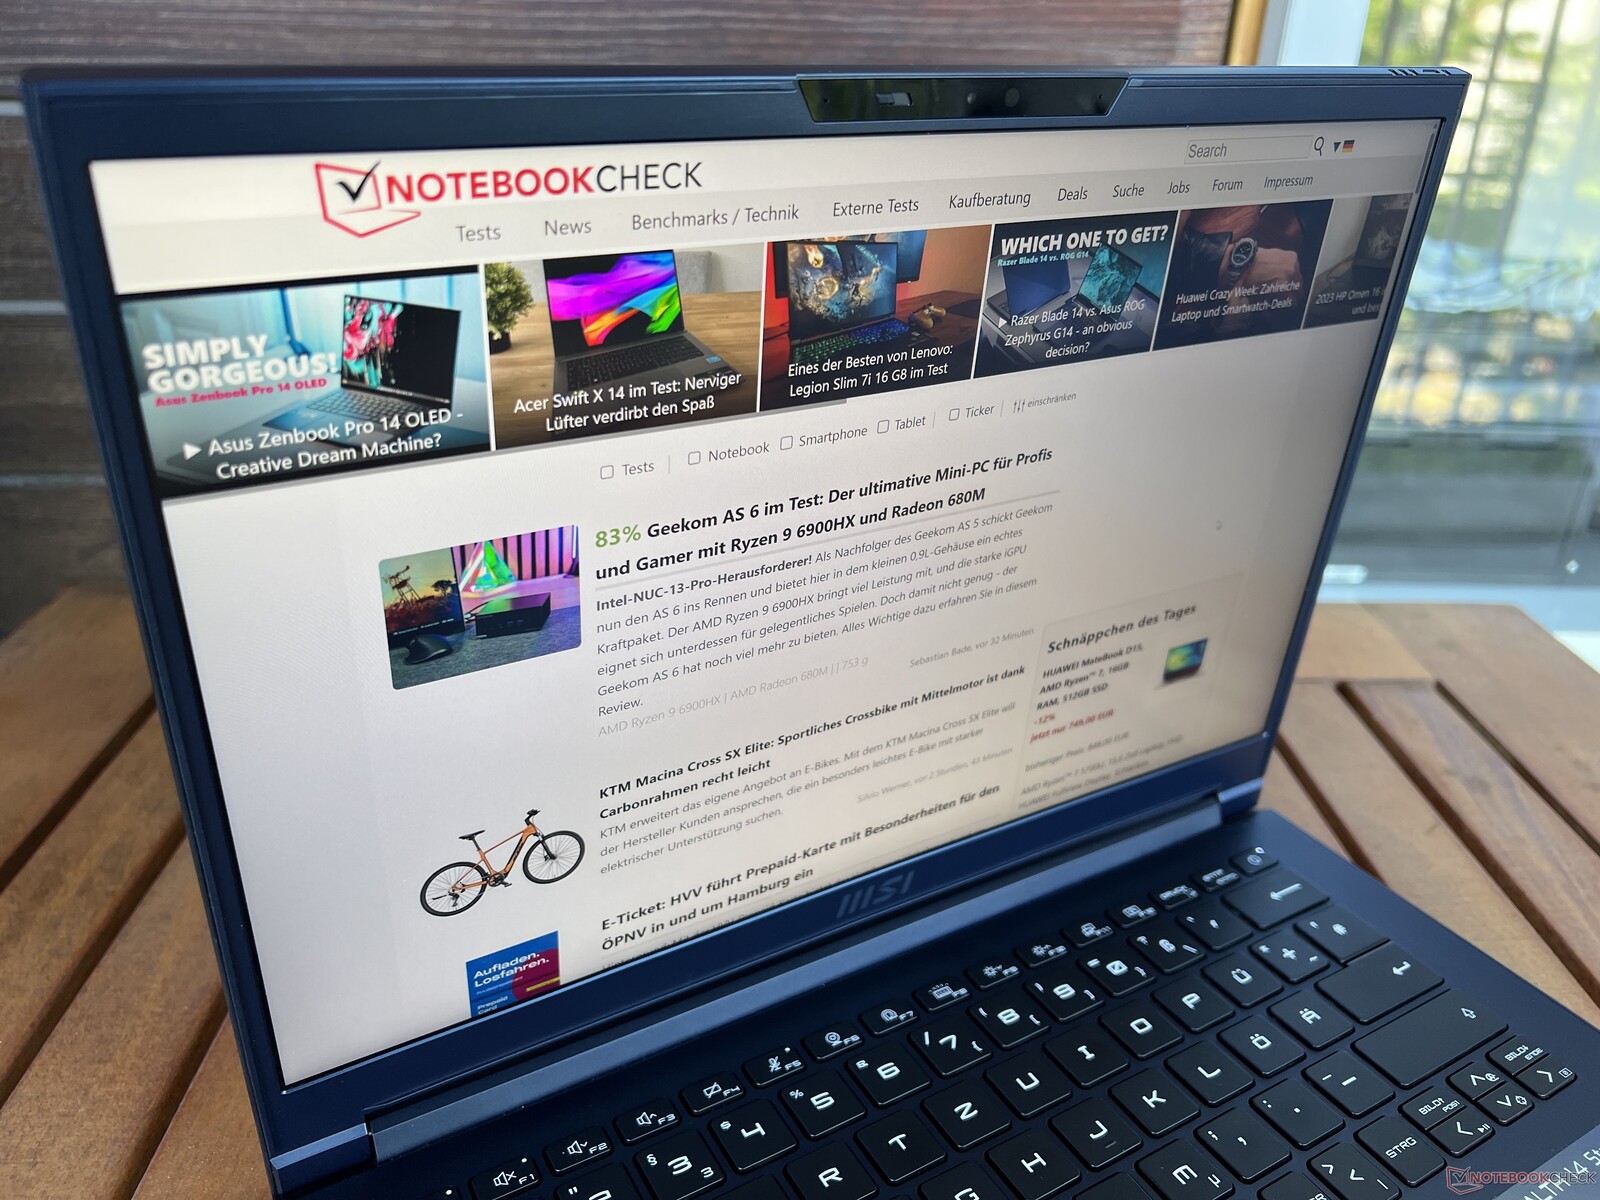
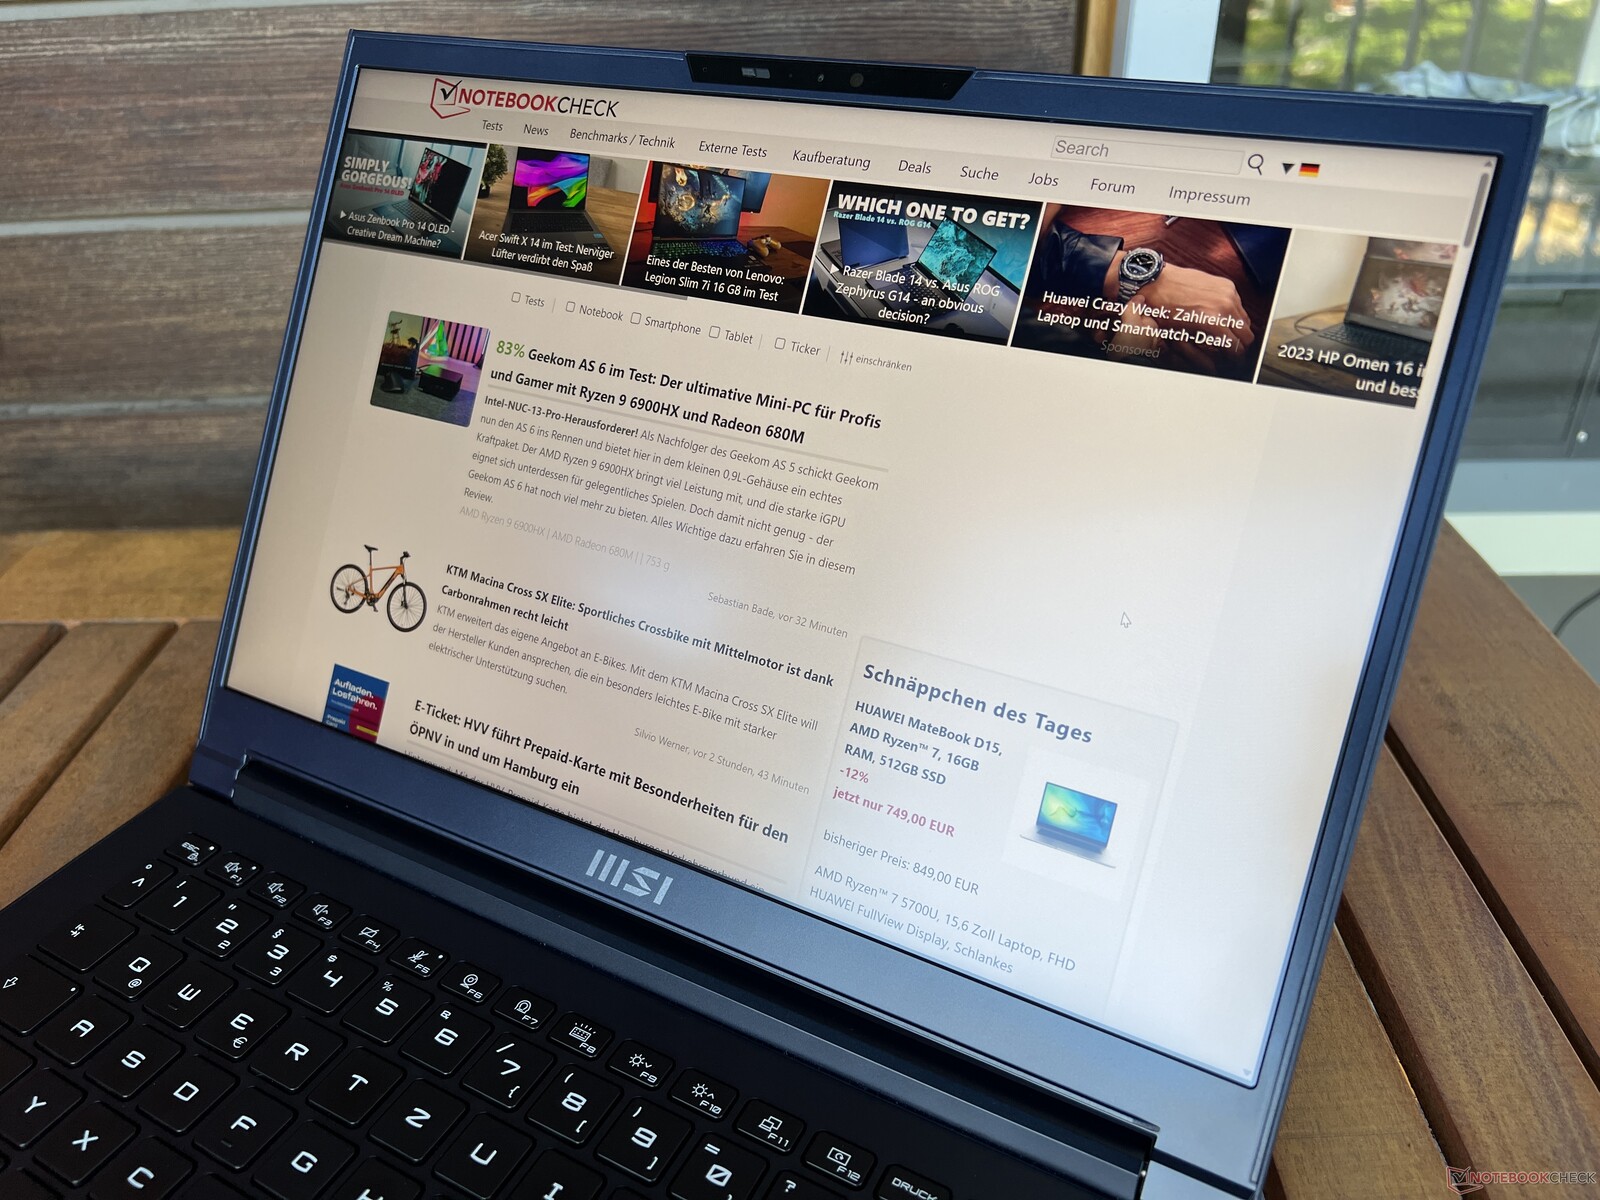
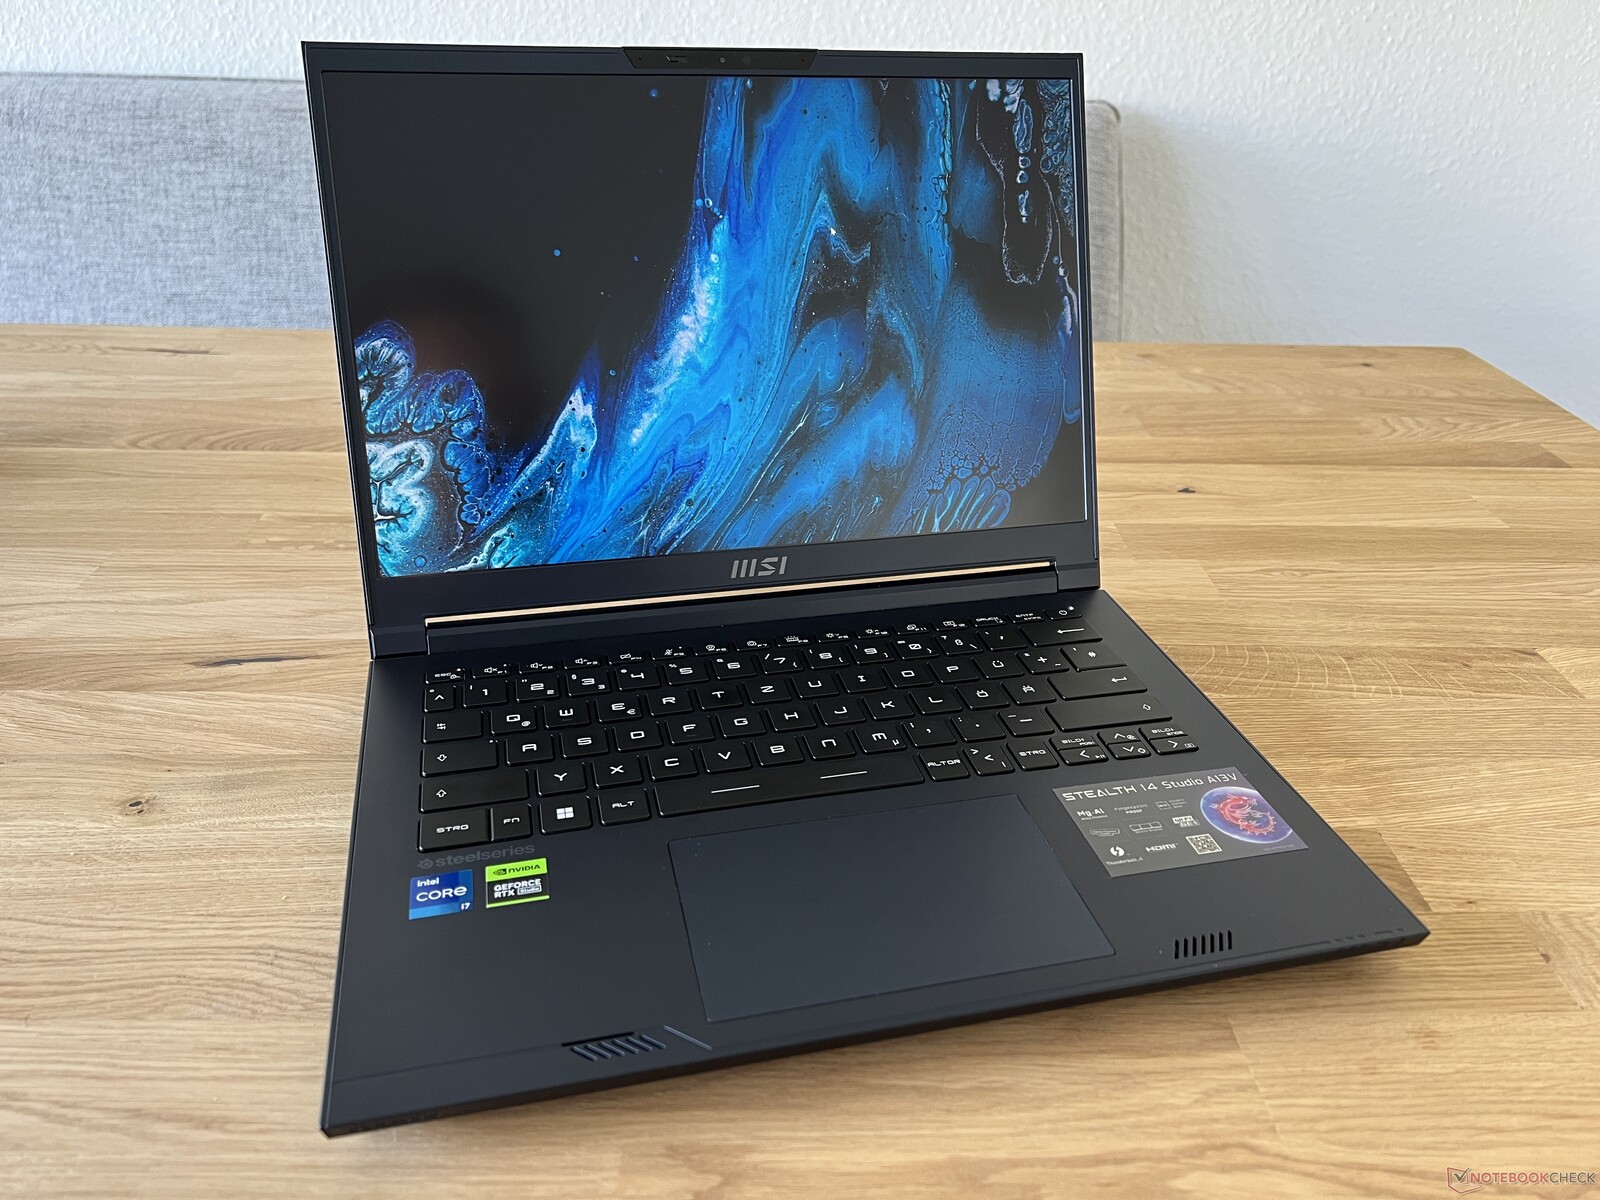
Fodral - Blå eller vit metall
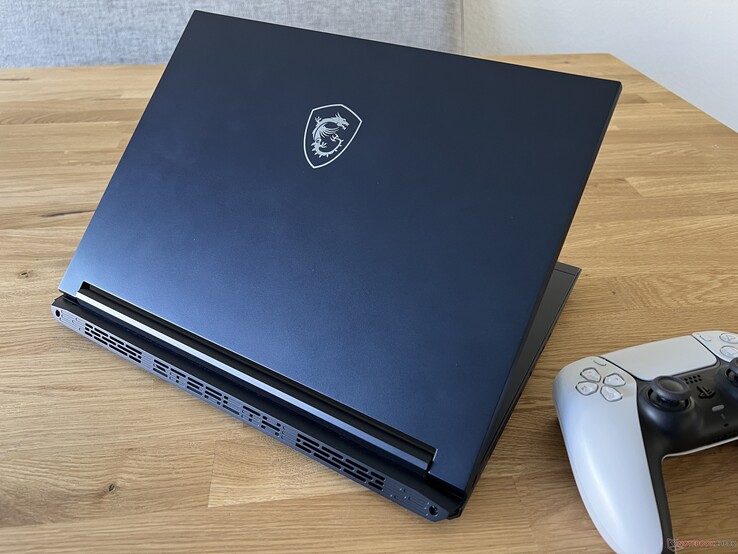
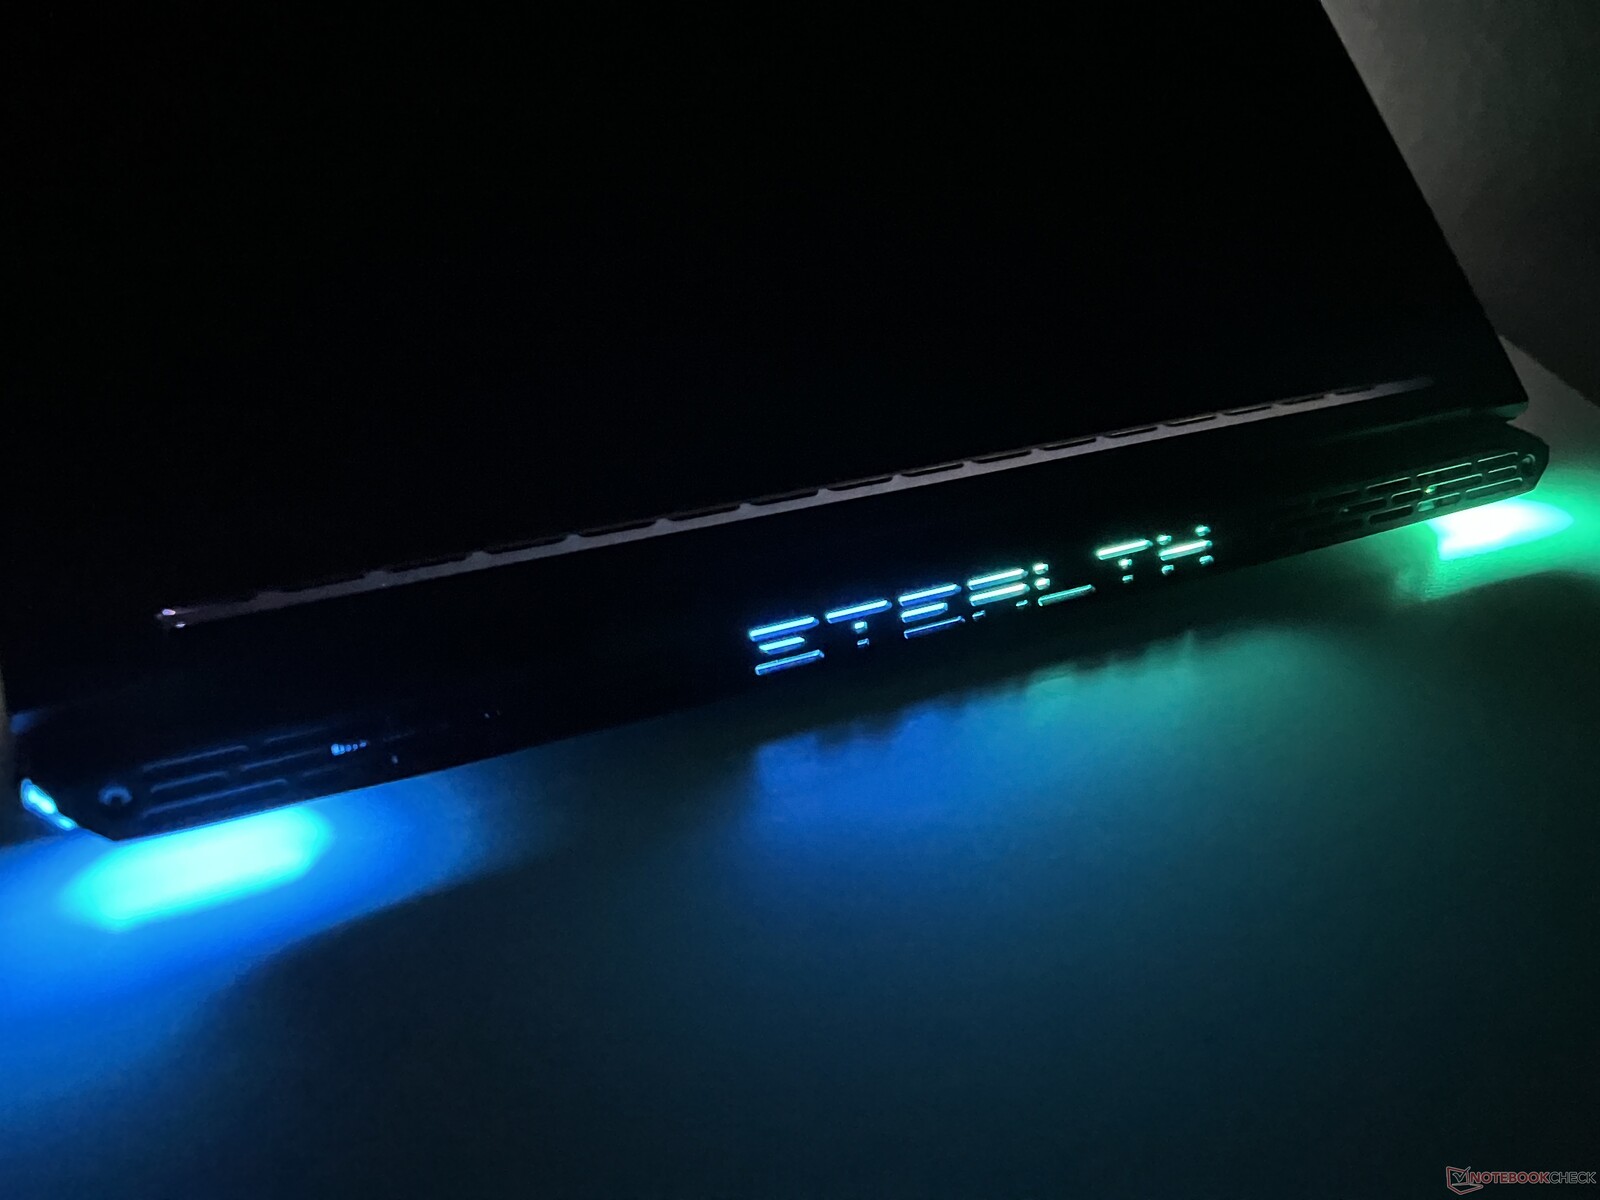
MSI erbjuder Stealth 14 Studio i antingen mörkblått eller vitt. Vi testar den blå modellen som ser ganska elegant ut men har en tendens att visa ganska många fingeravtrycksmärken. För en gaminglaptop är denna design faktiskt ganska reserverad - draklogotypen på locket är det enda som drar uppmärksamhet till enhetsserien. På baksidan finns det några extra belysningselement (som du kan aktivera via MSI Center) - båda hörnen, liksom Stealth-logotypen, kan belysas. Tyvärr kan du inte ändra belysningens färg eller intensitet.
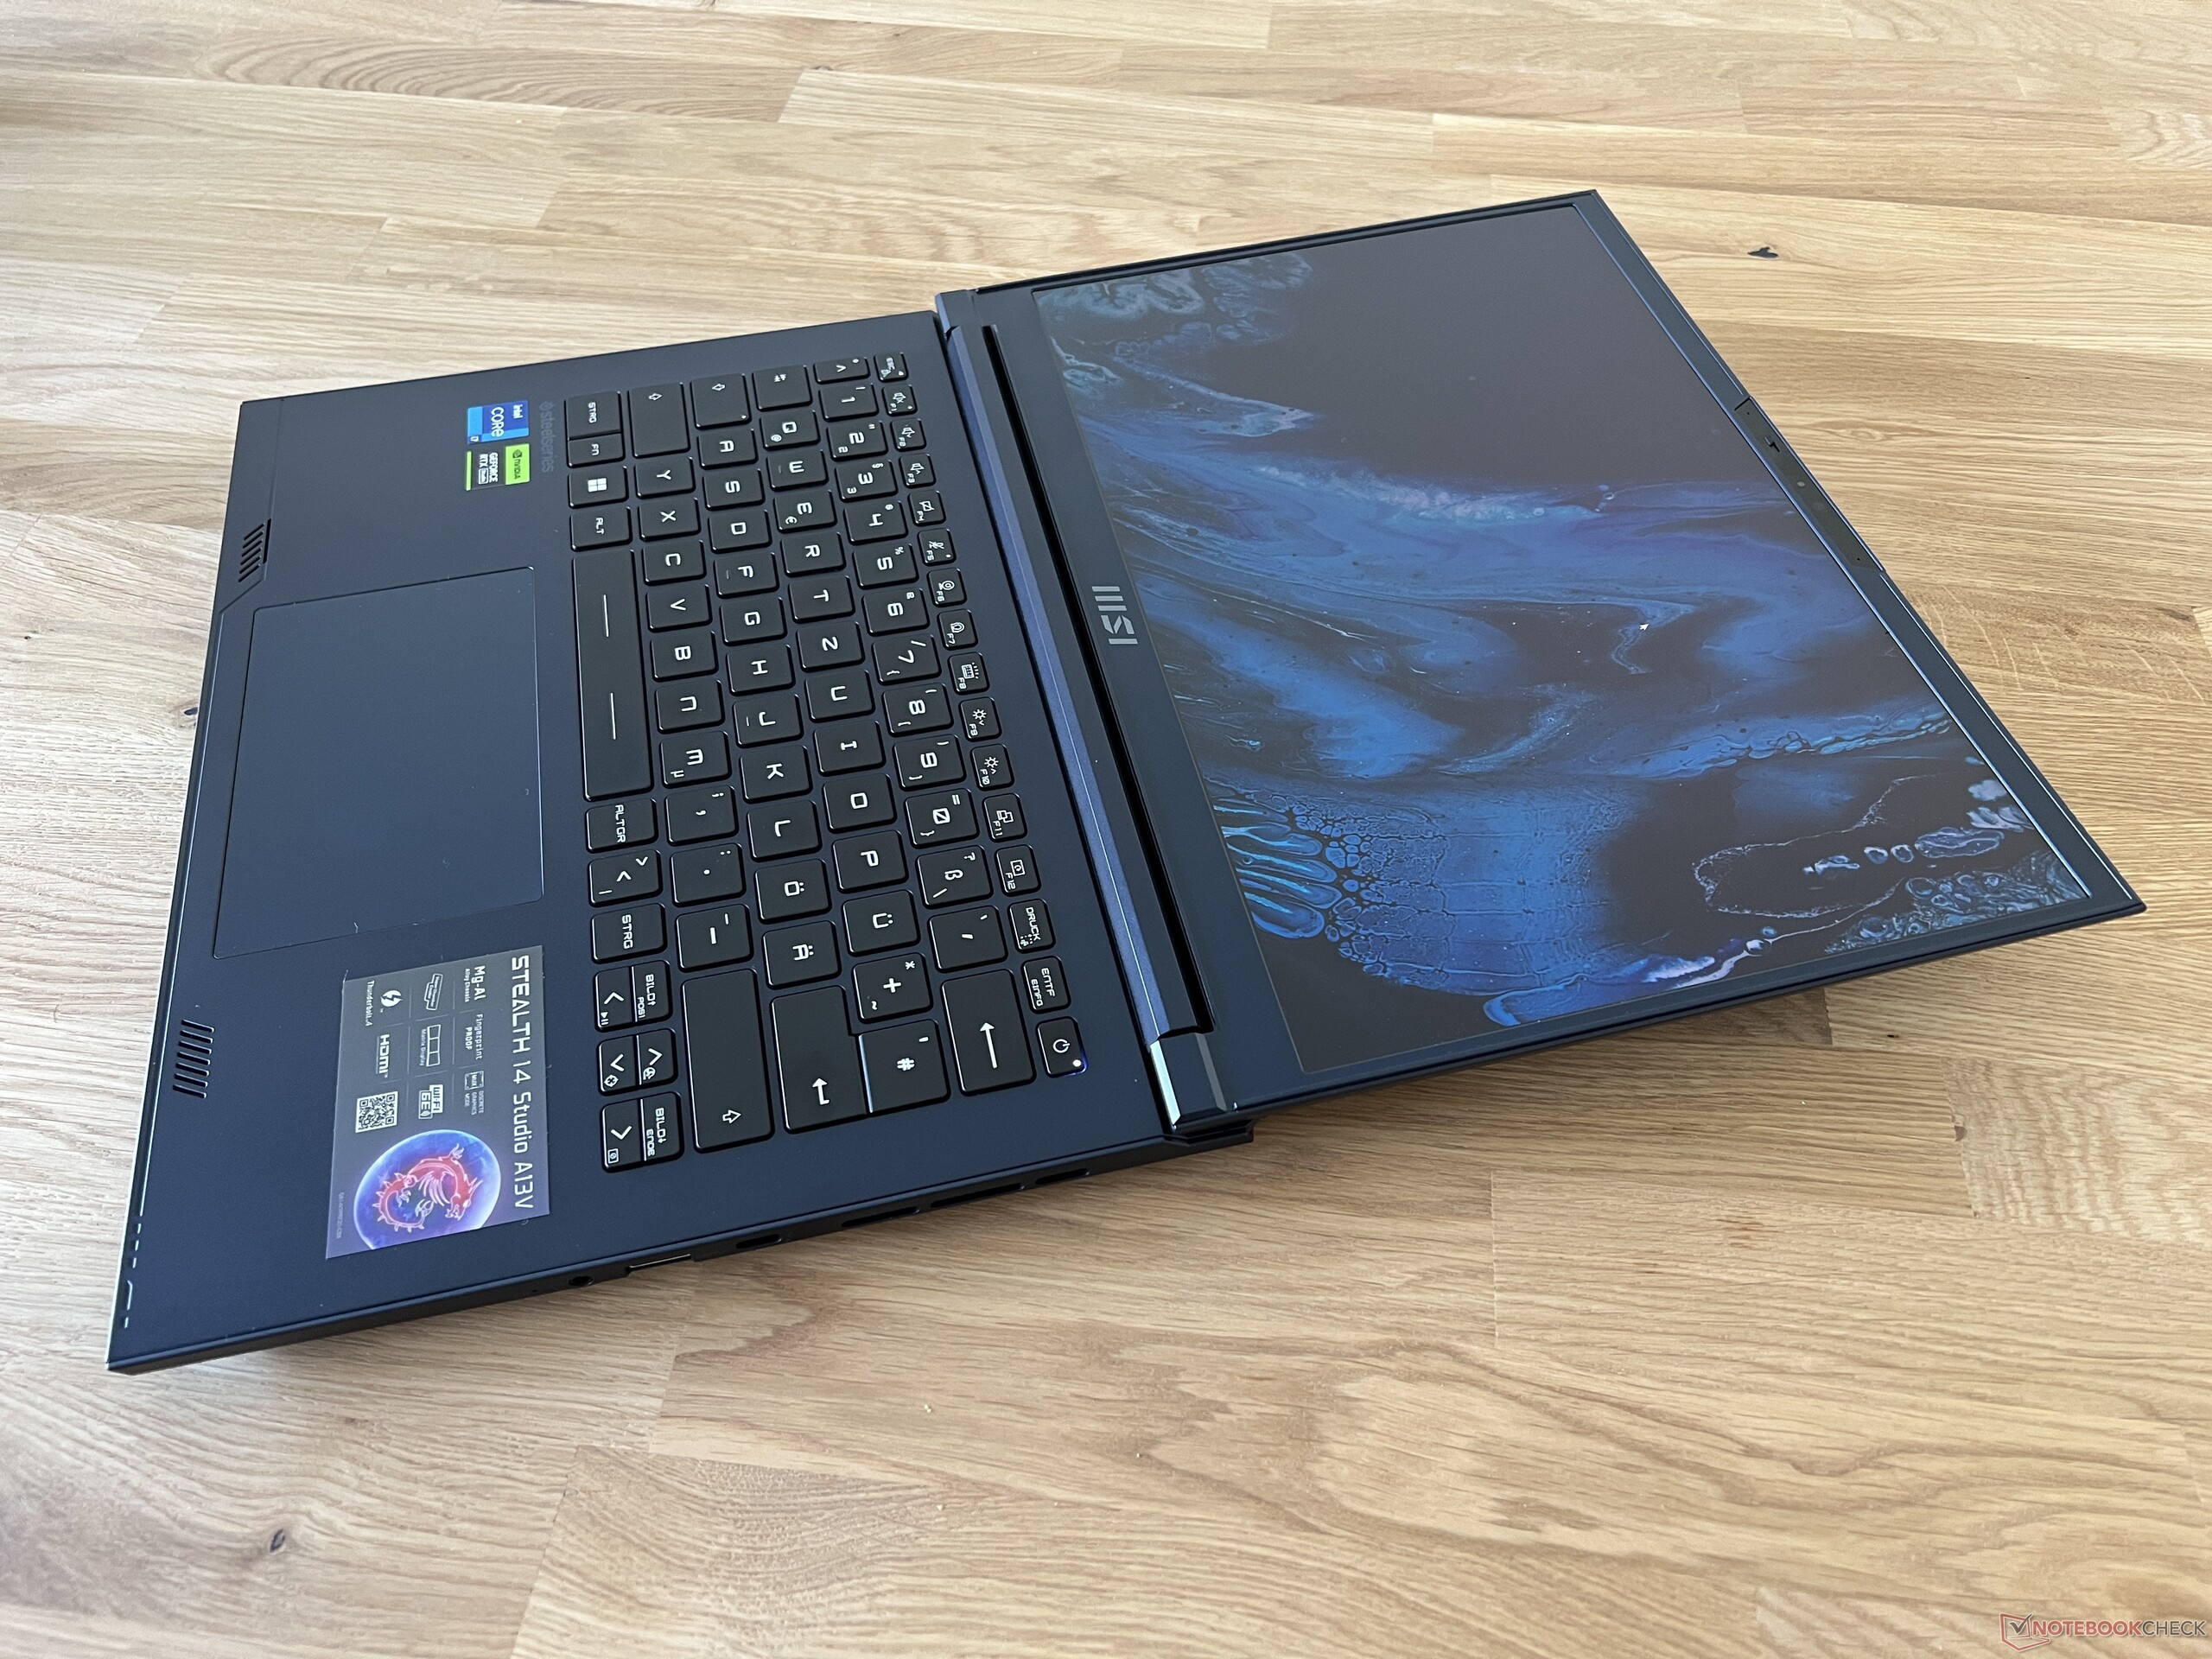
Höljet är tillverkat av en magnesium-aluminiumlegering och basenheten är extremt stabil. Den kan inte böjas eller vridas och det finns inga knarrande ljud. Detsamma kan tyvärr inte sägas om enhetens lock, som är betydligt mer flexibelt och till och med kan böjas något, vilket leder till hörbara knarrande ljud. Vanligtvis är dessa problem sedan länge bortglömda på moderna enheter, så du måste definitivt vara försiktig så att du inte plockar upp den bärbara datorn i skärmen för att undvika att orsaka permanent skada. Båda gångjärnen är väljusterade och tillåter en maximal öppningsvinkel på 180 grader. Ramarna är ganska tjocka för att vara en modern enhet - dess förhållande mellan skärm och kropp ligger bara på 73 %.
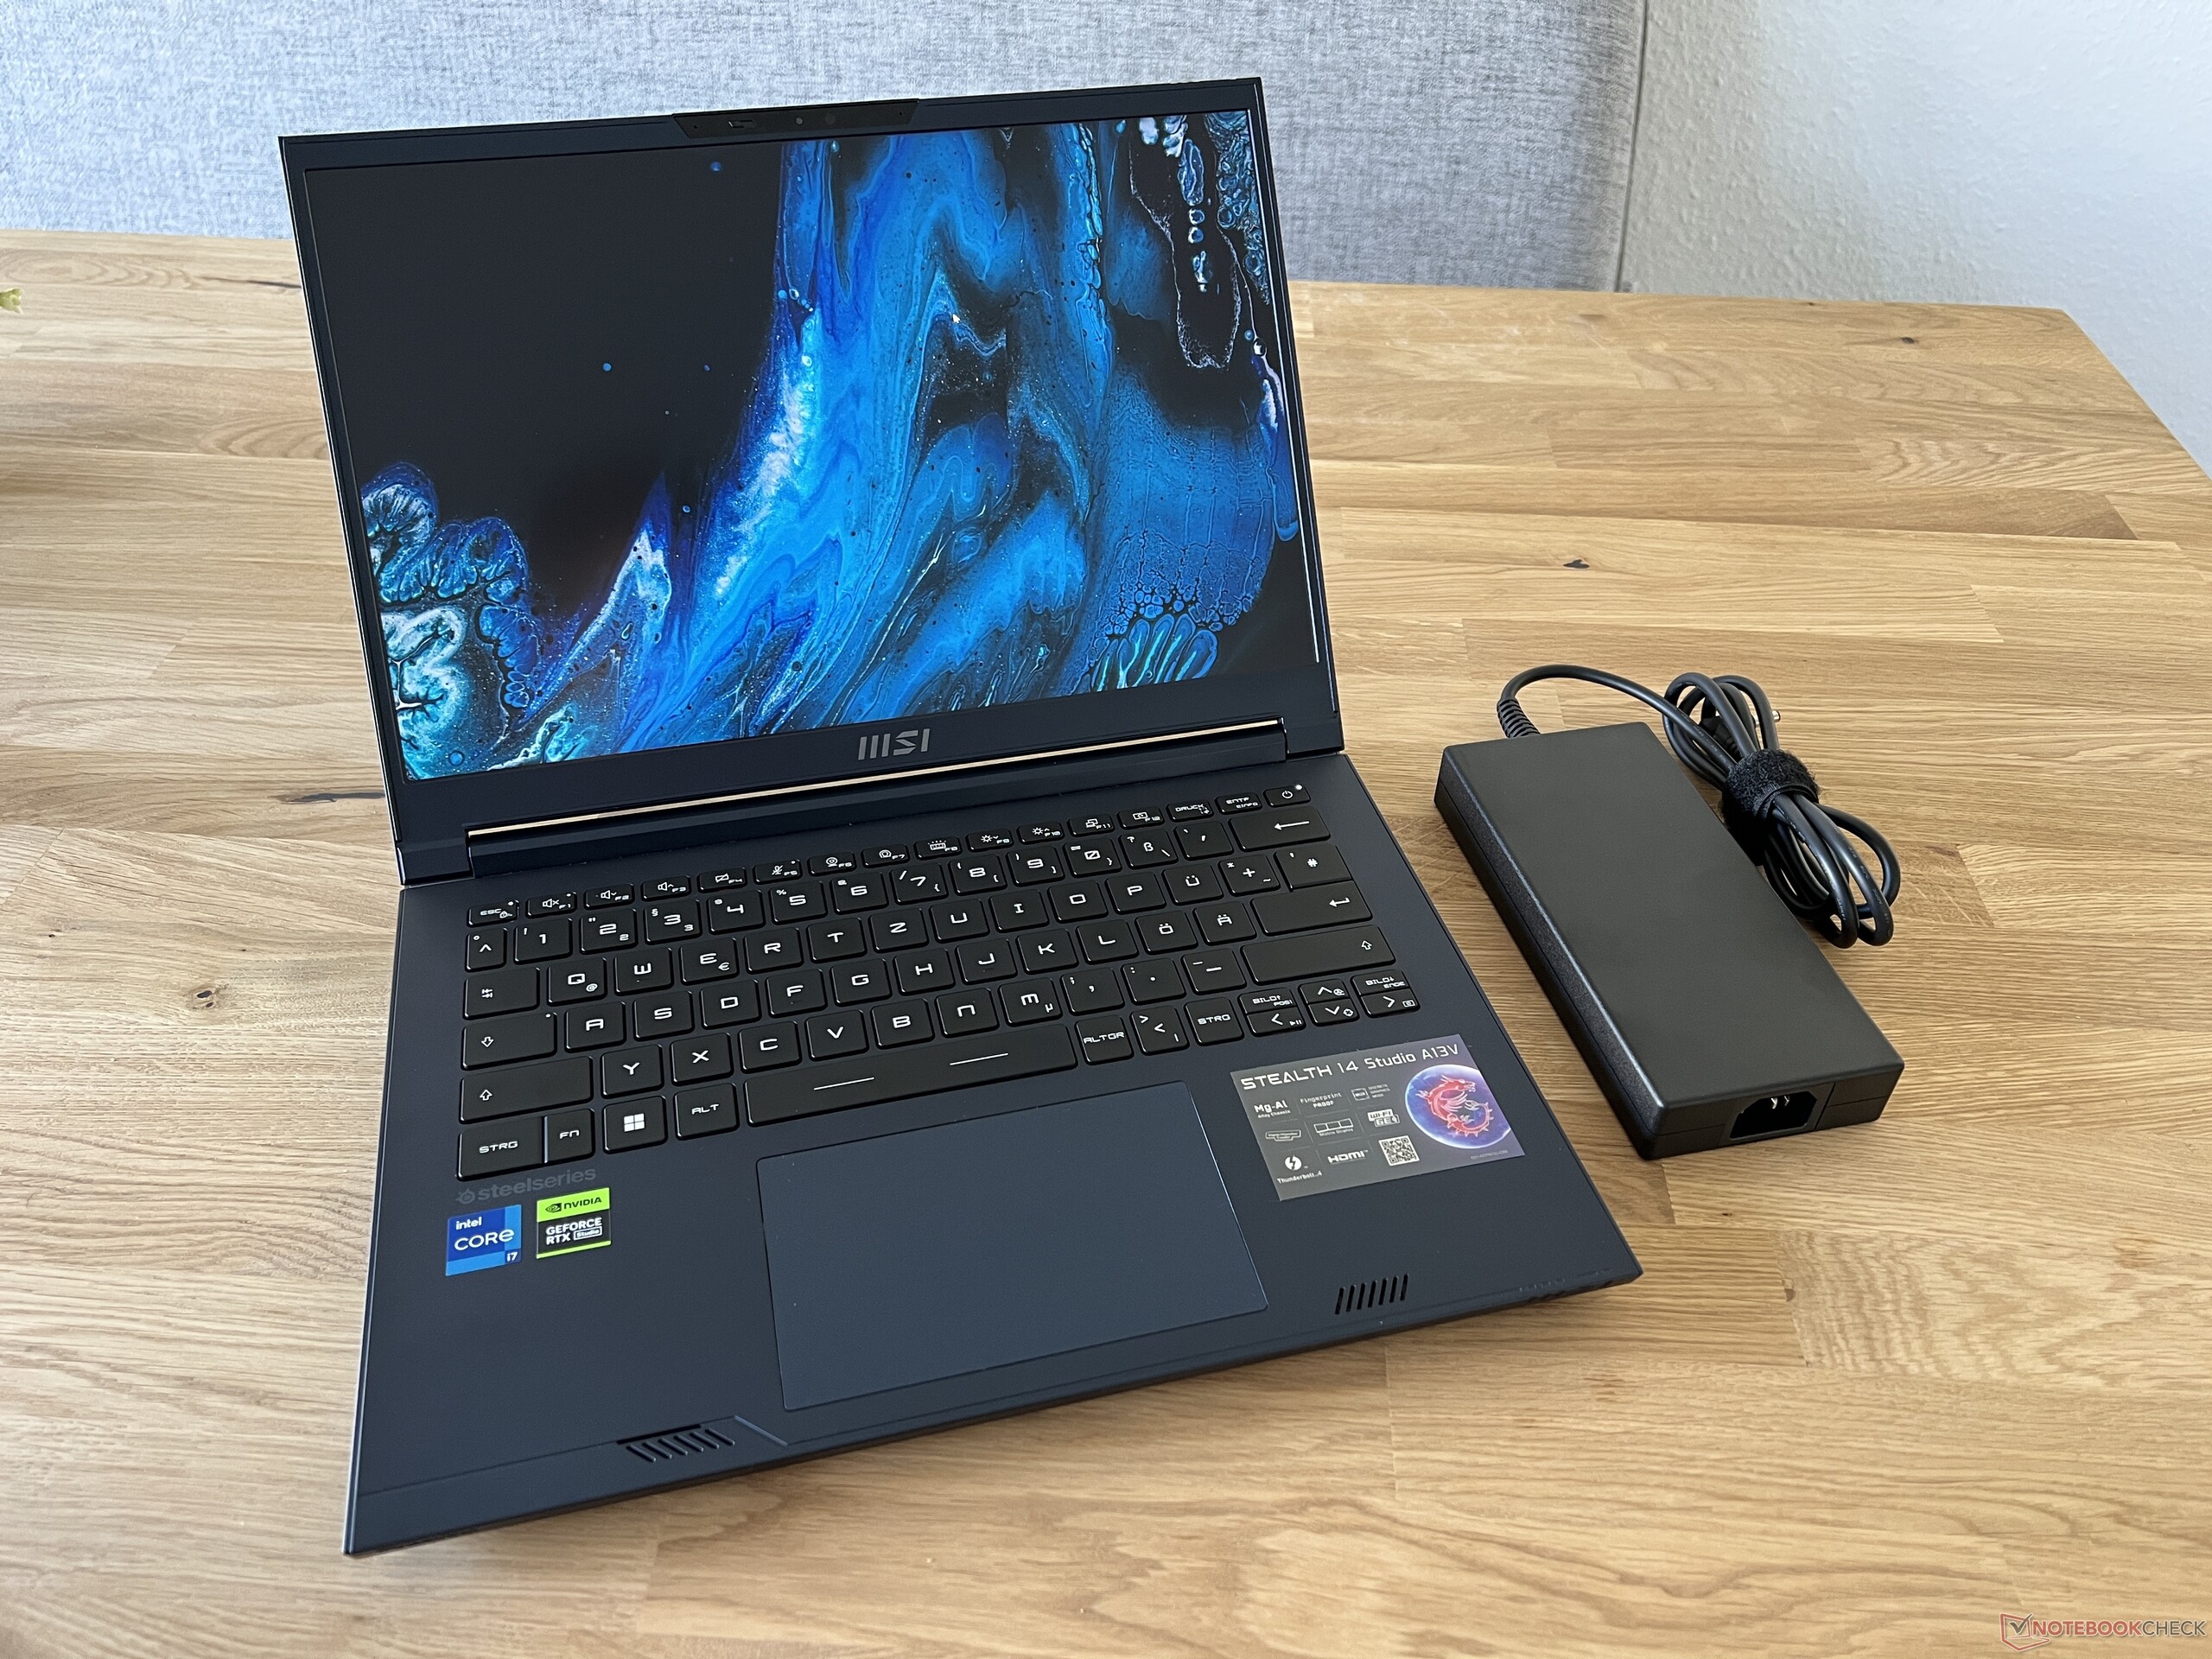
Stealth 14 Studio är en av de största enheterna i vår jämförelsegrupp - endastAlienware x14tar upp ännu mer utrymme. Med en vikt på drygt 1,7 kg är den ungefär genomsnittlig. Strömförsörjningen på 240 watt lägger till ytterligare 700 gram på vågen.
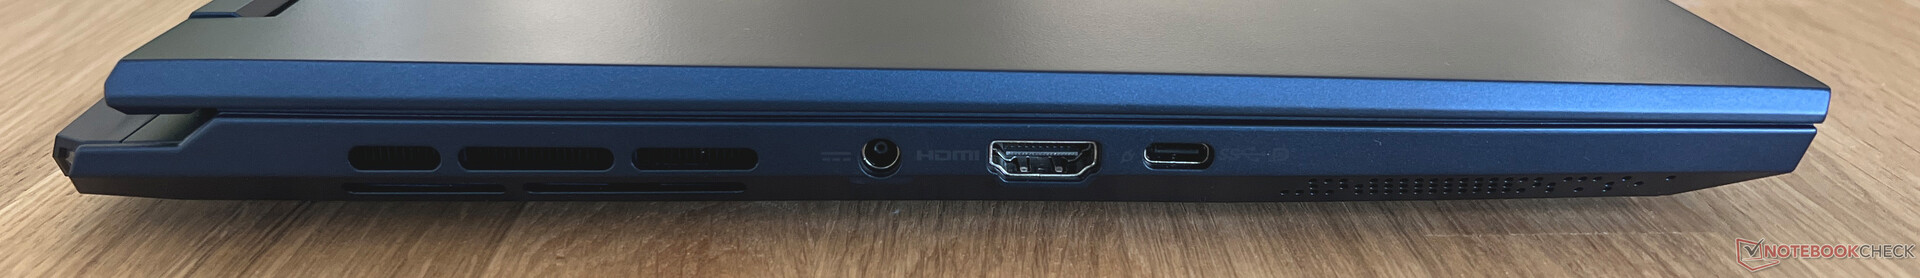
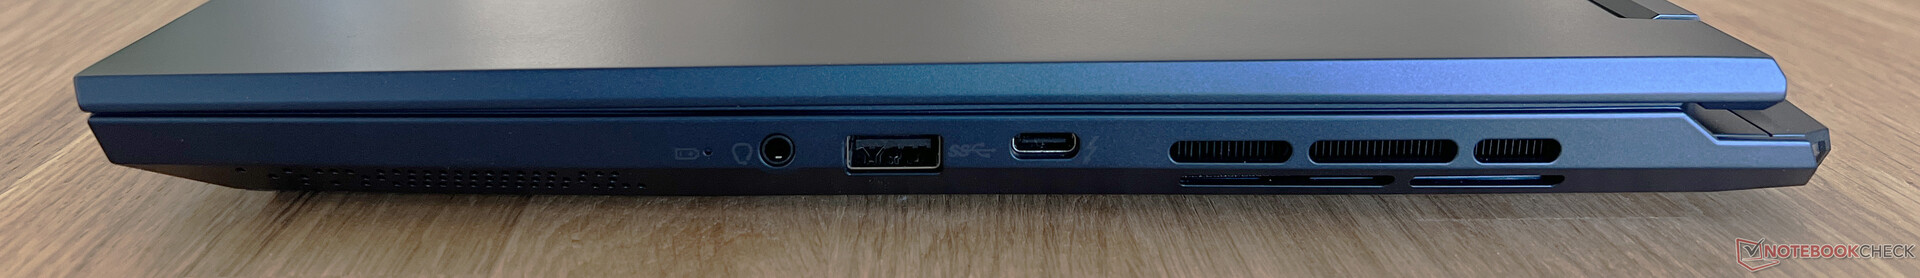
Anslutningsmöjligheter - Thunderbolt 4, men ingen SD-kortläsare
Stealth 14 Studios portar finns i mitten på båda sidor av enheten, även om det bara finns tre på varje sida. Du kommer bara att kunna hitta de mest nödvändiga anslutningarna, men den bärbara datorns portar är åtminstone uppdaterade, eftersom de inkluderar Thunderbolt 4 och HDMI 2.1. En SD-kortläsare och Ethernet-port ingår tyvärr inte - istället måste du förlita dig på en adapter.
Kommunikation
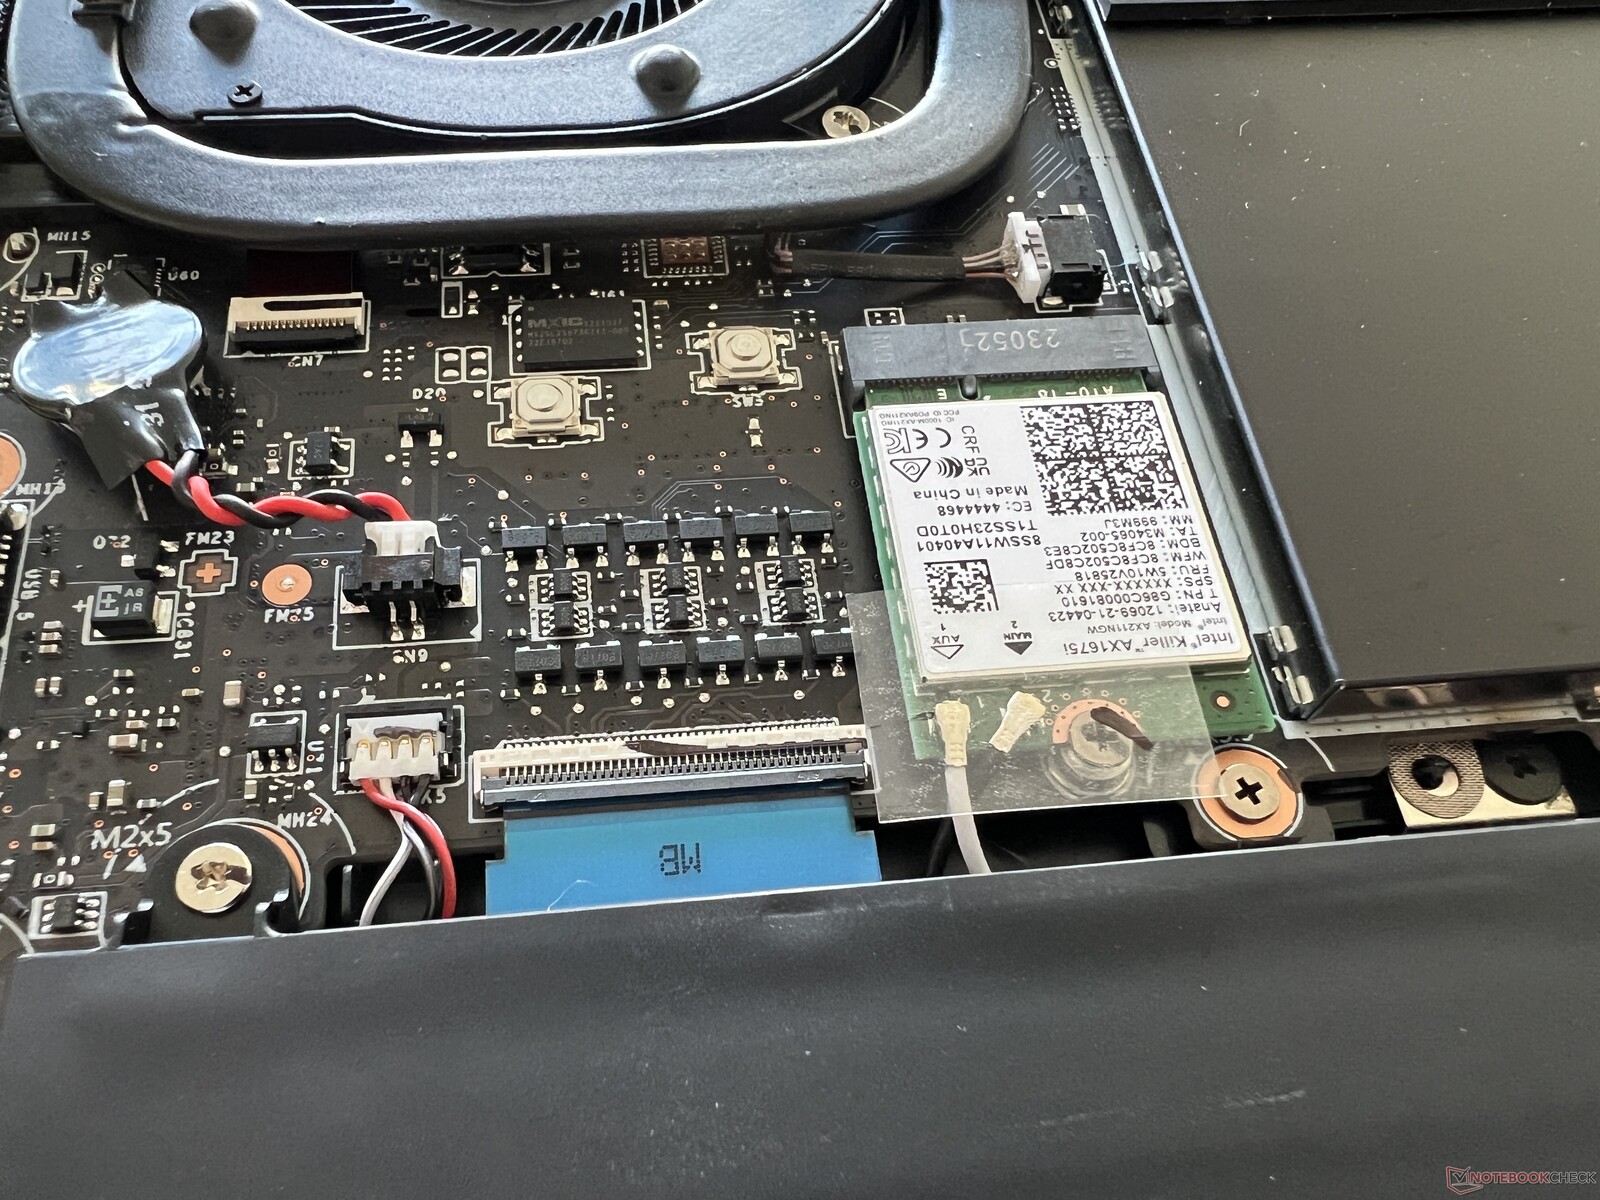
Den bärbara datorn förlitar sig på en Killer AX1675i som sin WLAN-modul, som också stöder moderna 6-GHz-anslutningar (Wi-Fi 6E). Med hjälp av vår referensrouter från Asus uppmätte vi bra (men inte fantastiska) överföringsresultat. Vid daglig användning bör detta inte leda till några problem och vi hade heller aldrig några problem med signalstabiliteten i vårt test.
| Networking | |
| MSI Stealth 14 Studio A13V | |
| iperf3 transmit AXE11000 | |
| iperf3 receive AXE11000 | |
| Gigabyte Aero 14 OLED BMF | |
| iperf3 transmit AXE11000 | |
| iperf3 receive AXE11000 | |
| iperf3 transmit AXE11000 6GHz | |
| iperf3 receive AXE11000 6GHz | |
| Schenker Vision 14 2022 RTX 3050 Ti | |
| iperf3 transmit AXE11000 | |
| iperf3 receive AXE11000 | |
| Asus ROG Flow Z13 GZ301ZE | |
| iperf3 transmit AX12 | |
| iperf3 receive AX12 | |
| Alienware x14 i7 RTX 3060 | |
| iperf3 transmit AX12 | |
| iperf3 receive AX12 | |
| Razer Blade 14 Ryzen 9 6900HX | |
| iperf3 transmit AX12 | |
| iperf3 receive AX12 | |
| Acer Predator Triton 300 SE | |
| iperf3 transmit AXE11000 6GHz | |
| iperf3 receive AXE11000 6GHz | |
Webbkamera
Något överraskande är Stealth 14 Studios magra 720p-webbkamera som kämpar för att leverera en anständig bild även i bra ljusförhållanden. Dessutom finns en IR-modul installerad - ansiktsigenkänning stöds via Windows Hello.


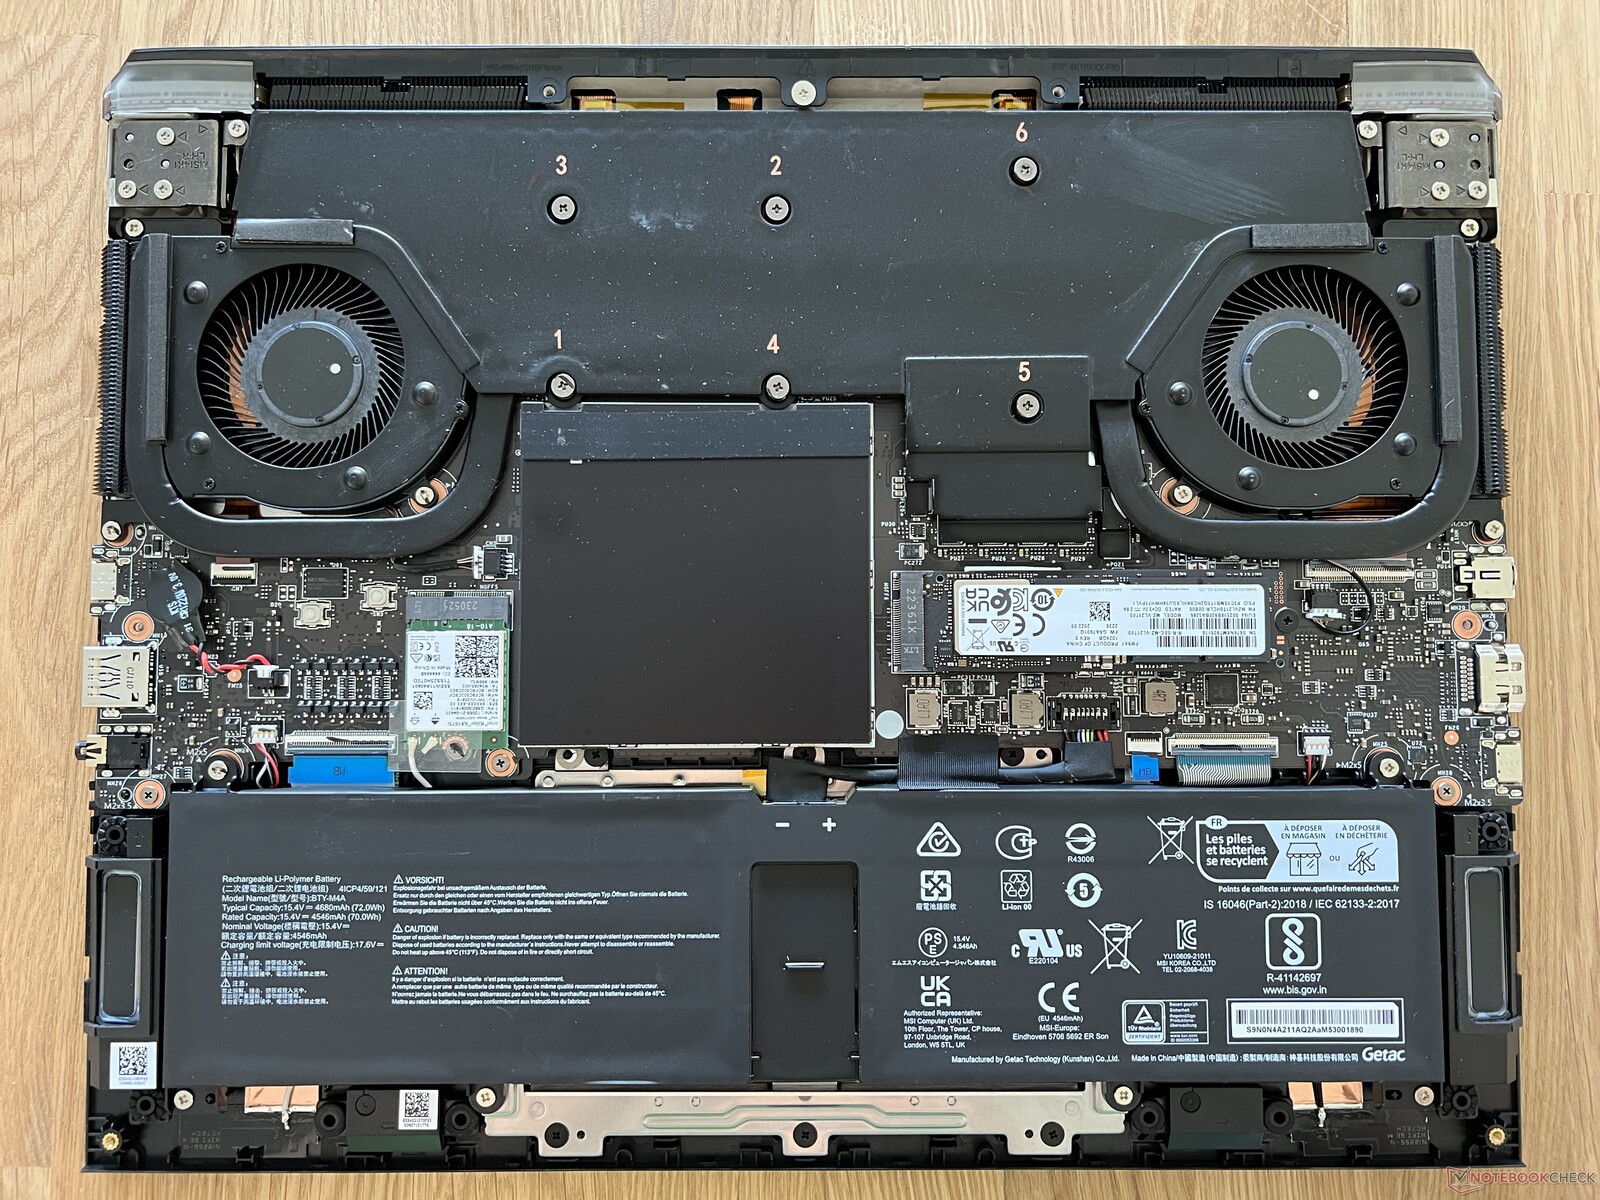
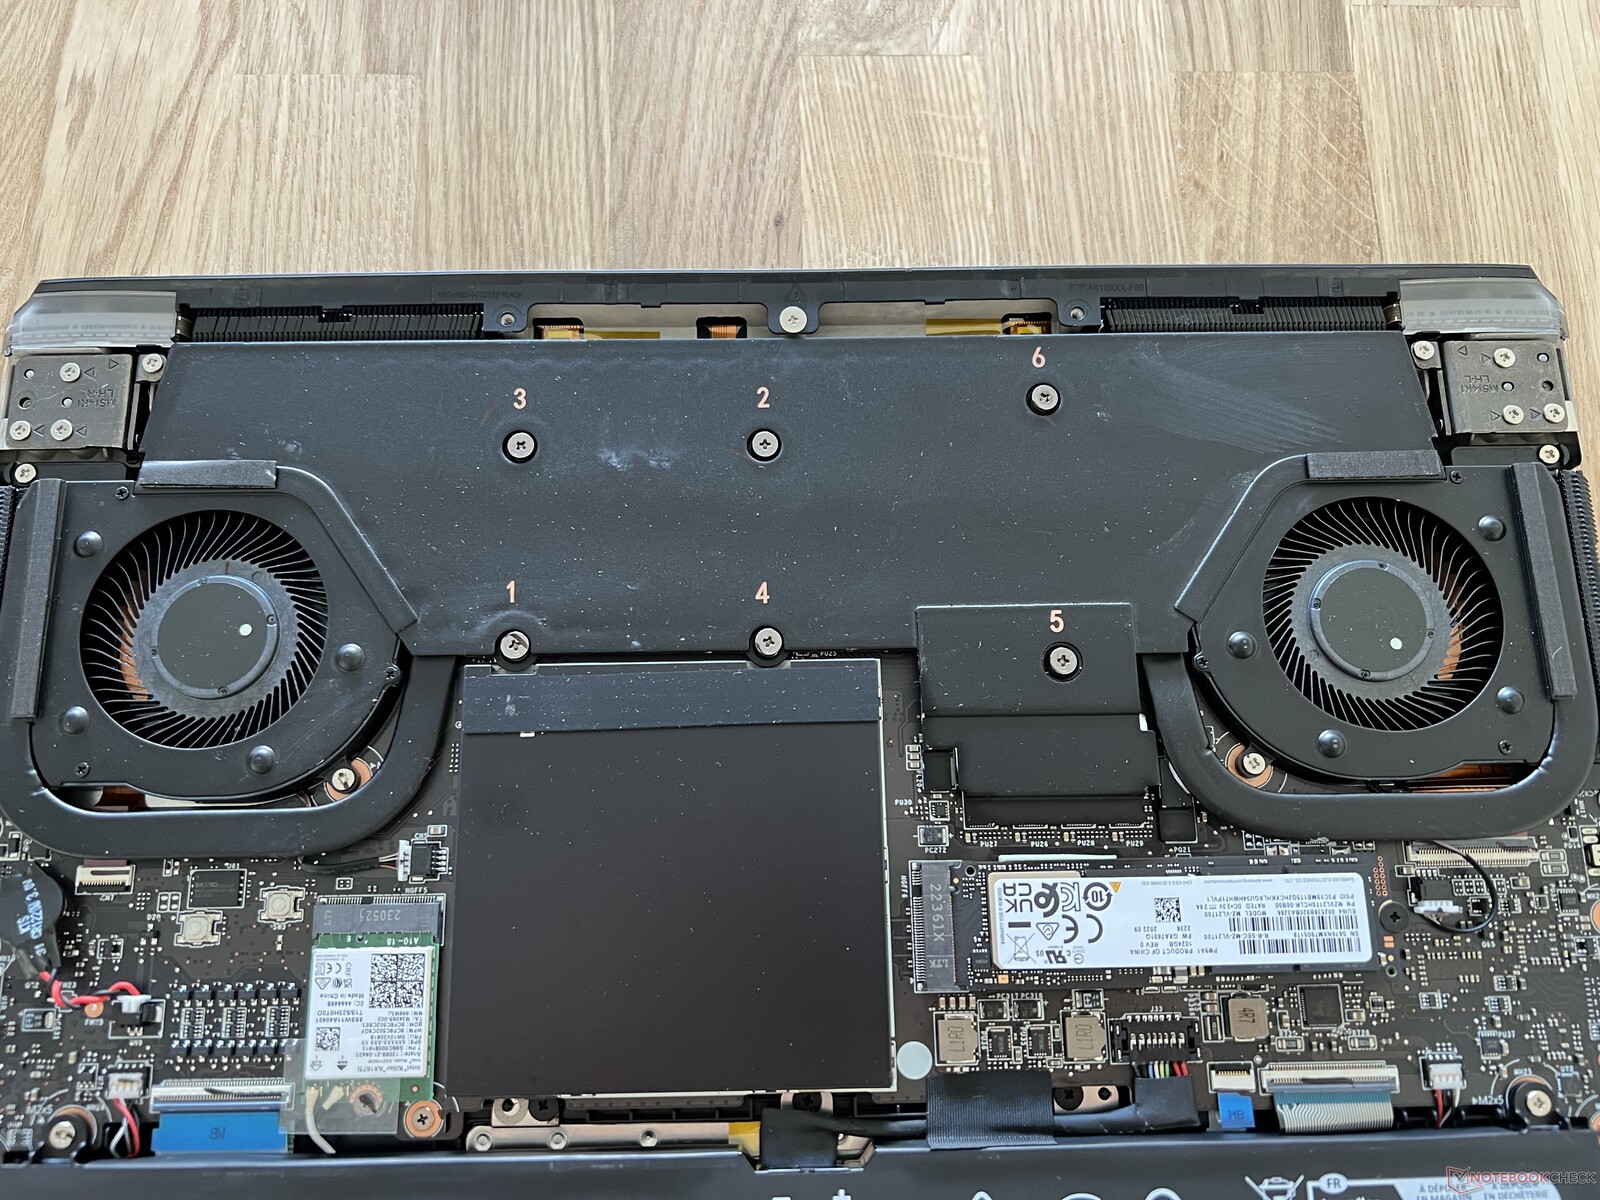
Underhåll
För att komma åt den bärbara datorns komponenter måste du ta isär hela den nedre delen av fodralet. En av de korsade skruvarna är täckt av en försegling, åtminstone i Tyskland (där vi utför detta test), lämplig användning av detta bör inte påverka din garanti. Inuti kan du rengöra fläktarna och byta ut WLAN-modulen och M.2 2280 SSD. Teoretiskt sett kan du också byta ut RAM-modulen, men det extra locket var fäst så tätt att vi inte kunde ta bort det (och ville inte orsaka någon skada på vårt testexemplar). Det finns förmodligen en extra limkudde som håller den på plats, vilket gör det extra svårt för användaren att ta bort den.
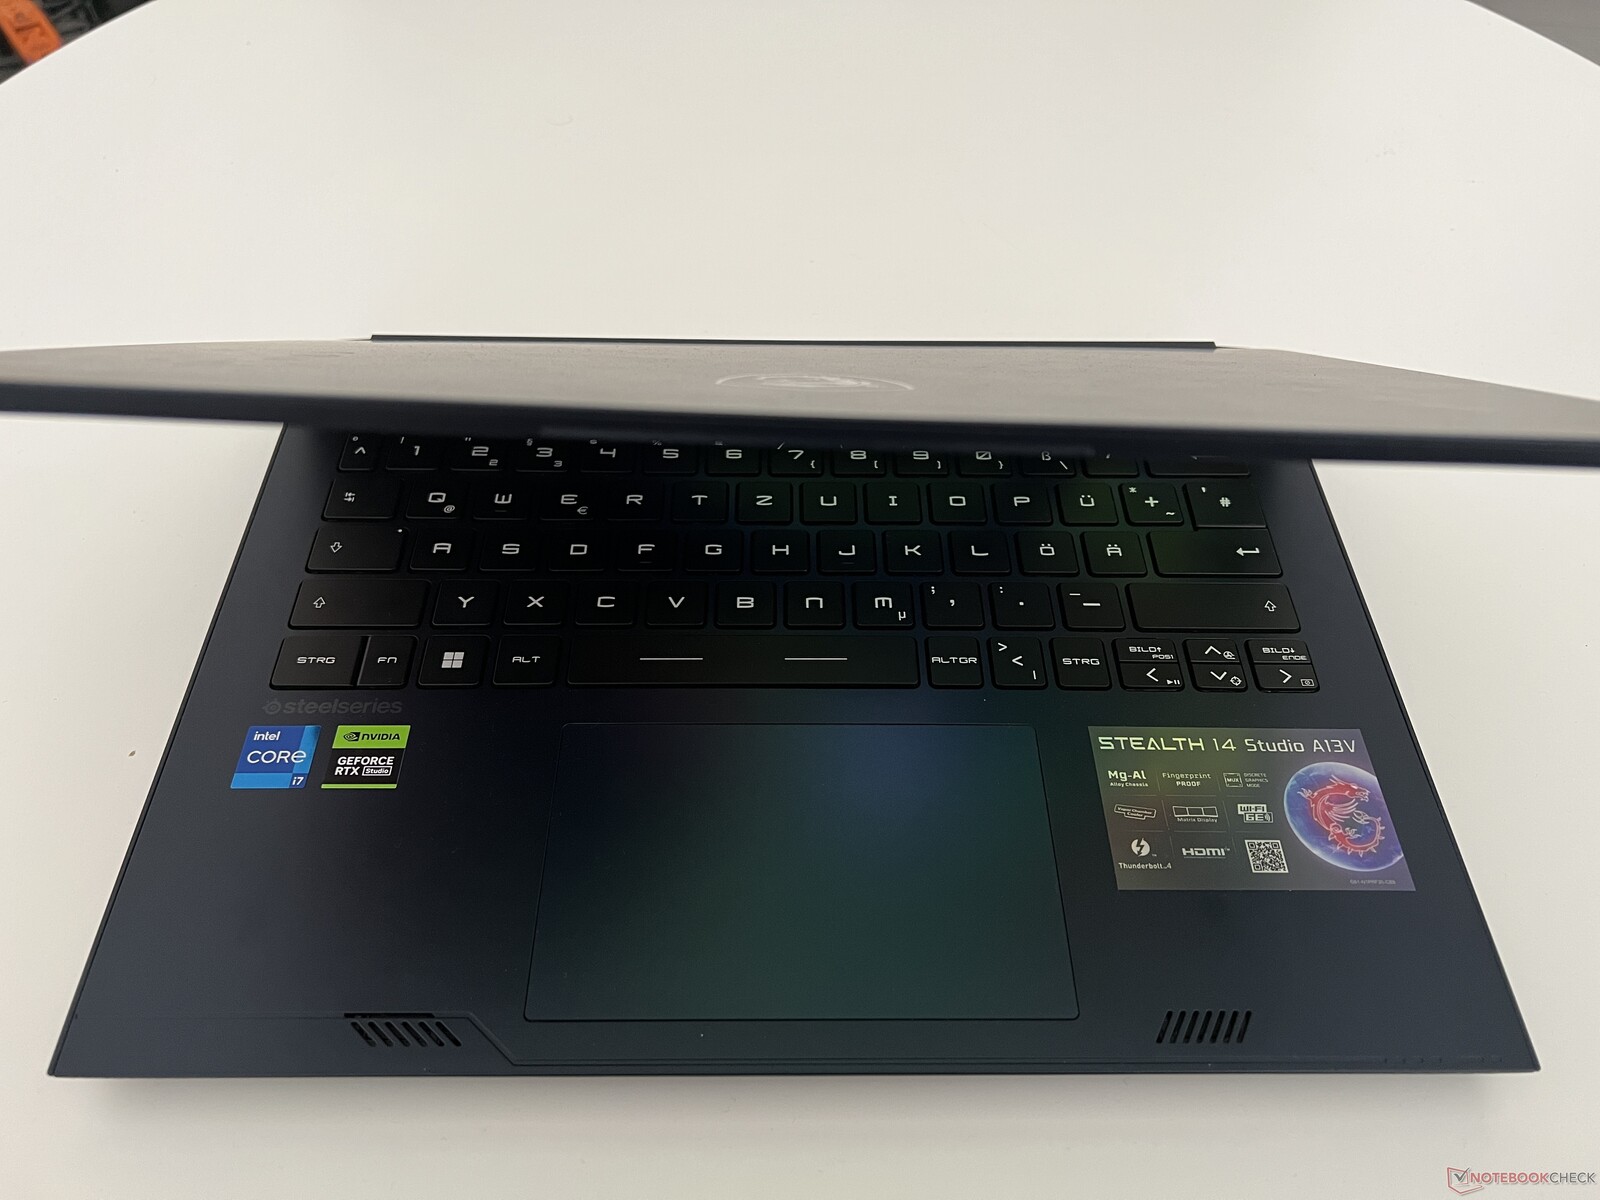
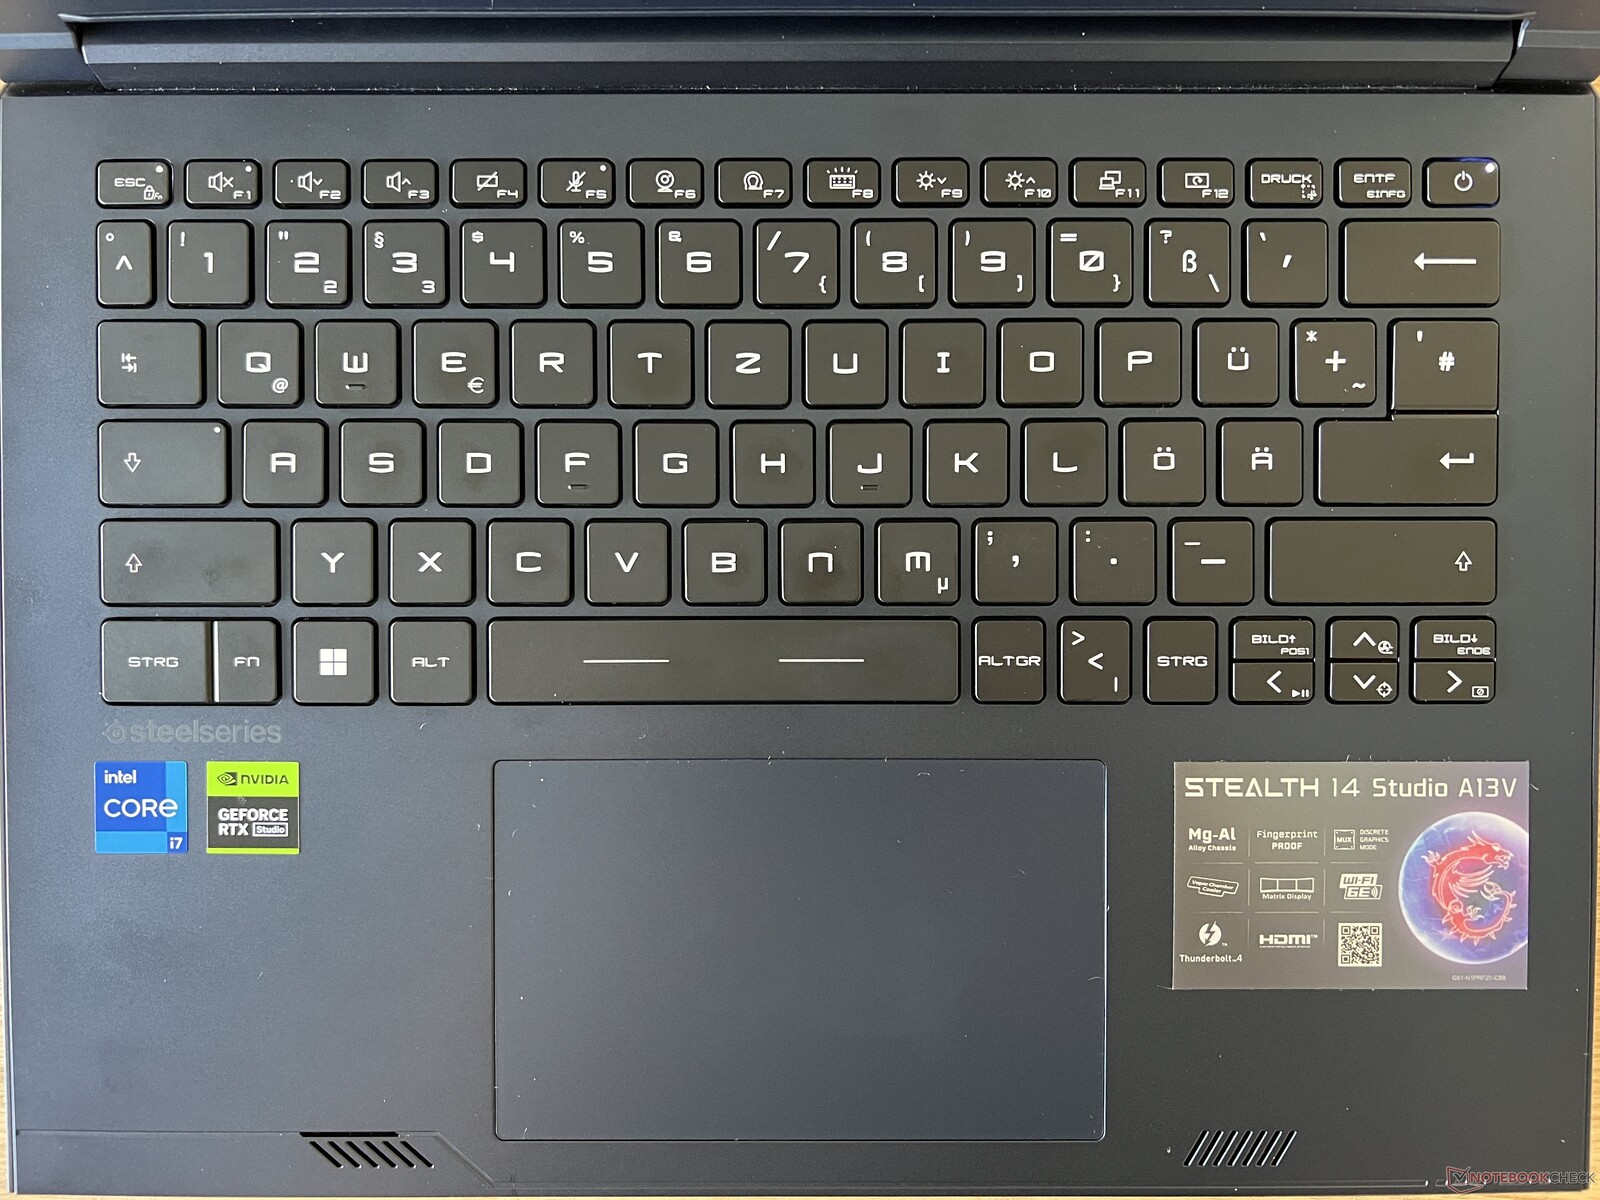
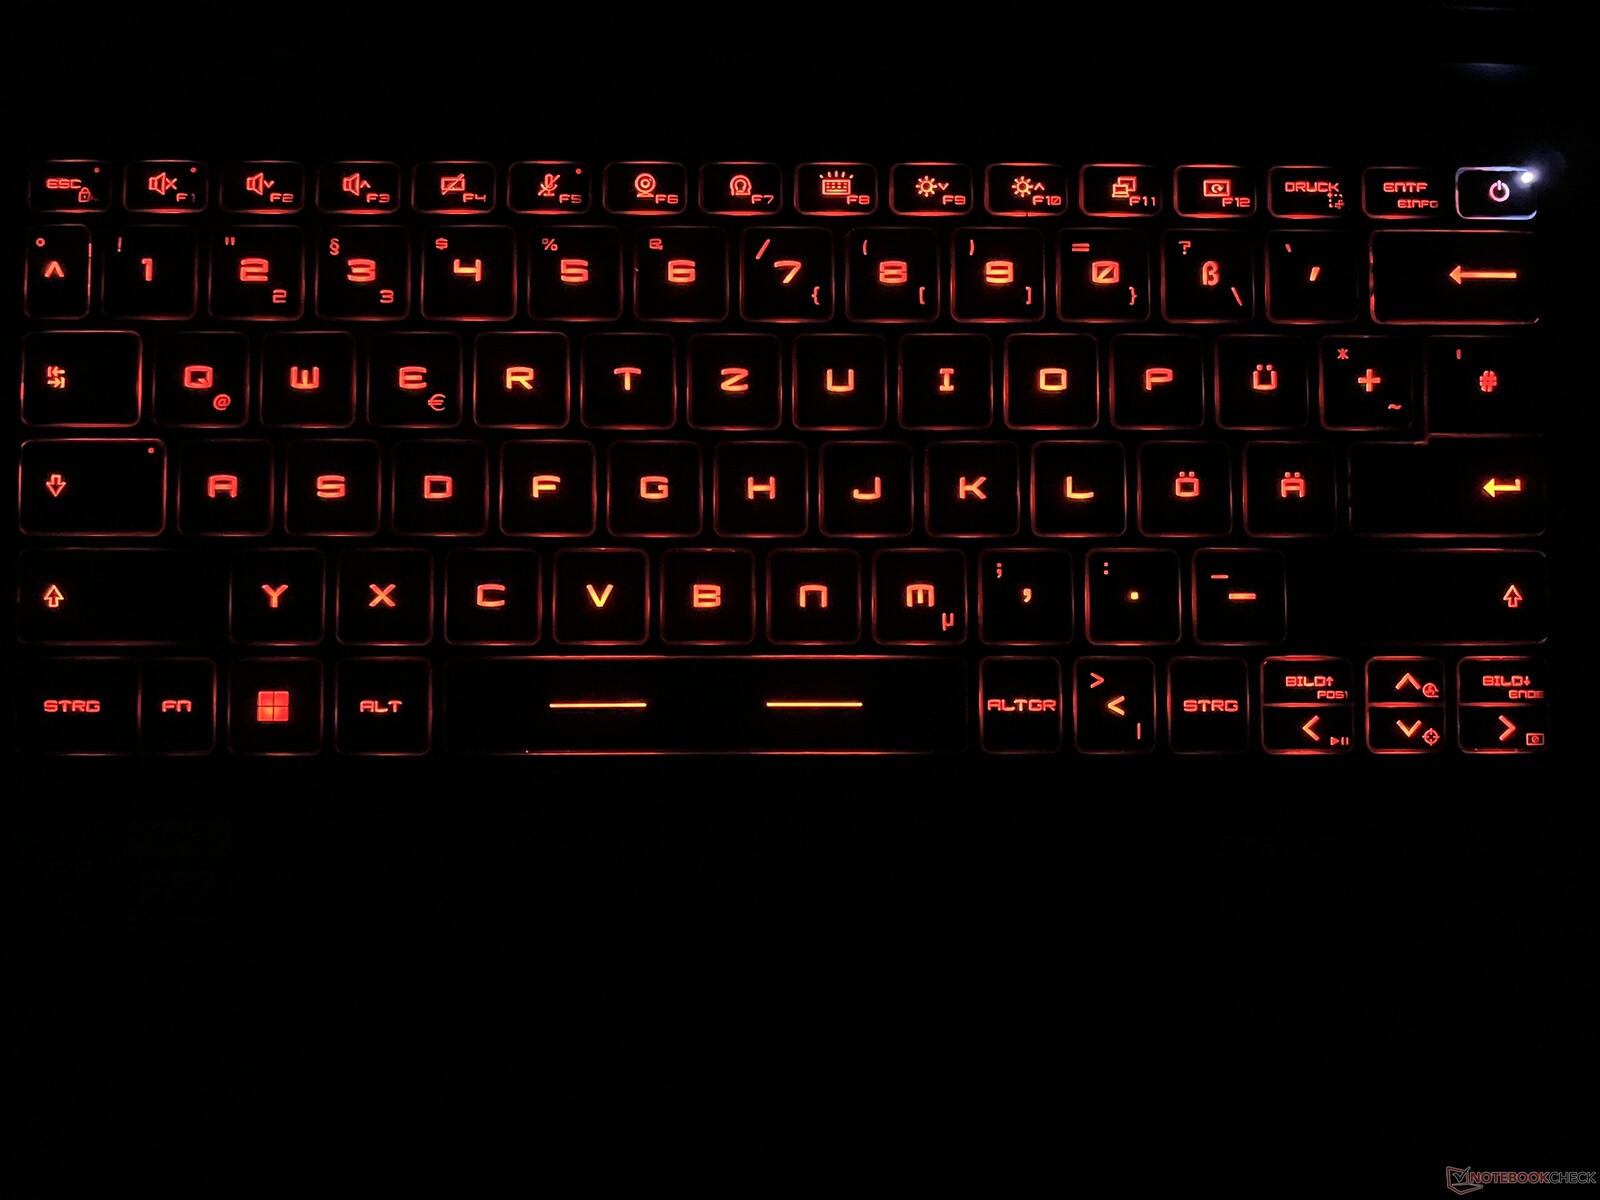
Inmatningsenheter - Ett tangentbord med individuellt belysta tangenter
Tangentbordet kan räknas som en av Stealth 14 Studios brister, eftersom dess tangentlyft är mycket grunt och tangenterna har en ganska skakig känsla. Trots detta blir det ganska exakt att trycka på tangenterna och vi noterade inga falska inmatningar. Du måste bara vänja dig vid layouten, eftersom den har en enradig enter-tangent och tangenten "|<>" är placerad på ett lite ovanligt ställe. De fyra piltangenterna är också ganska små, men det finns åtminstone "bild upp"- och "bild ner"-tangenter. Varje enskild tangents belysning kan justeras med hjälp av Steelseries programvara, men det är inte särskilt intuitivt.
Den släta klickplattan (12 x 7,5 cm) fungerar bra i vardagen, men vi rekommenderar att du bara knackar på den för att mata in kommandon. Om du faktiskt trycker ned den nedre delen av plattan resulterar det i ett mycket högt och billigt klickljud.
Display - En snabb 240-Hz panel
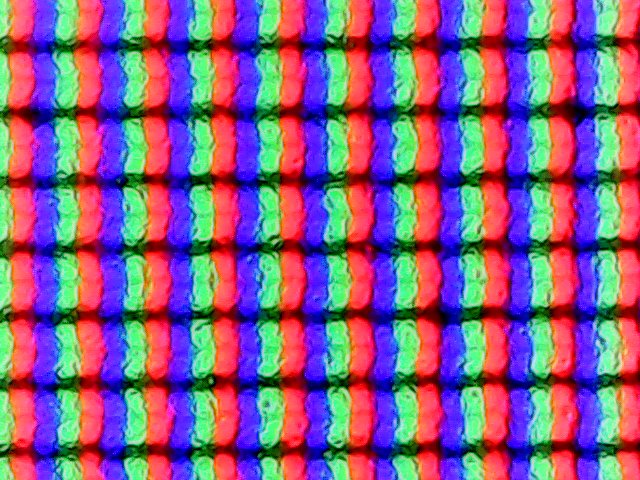
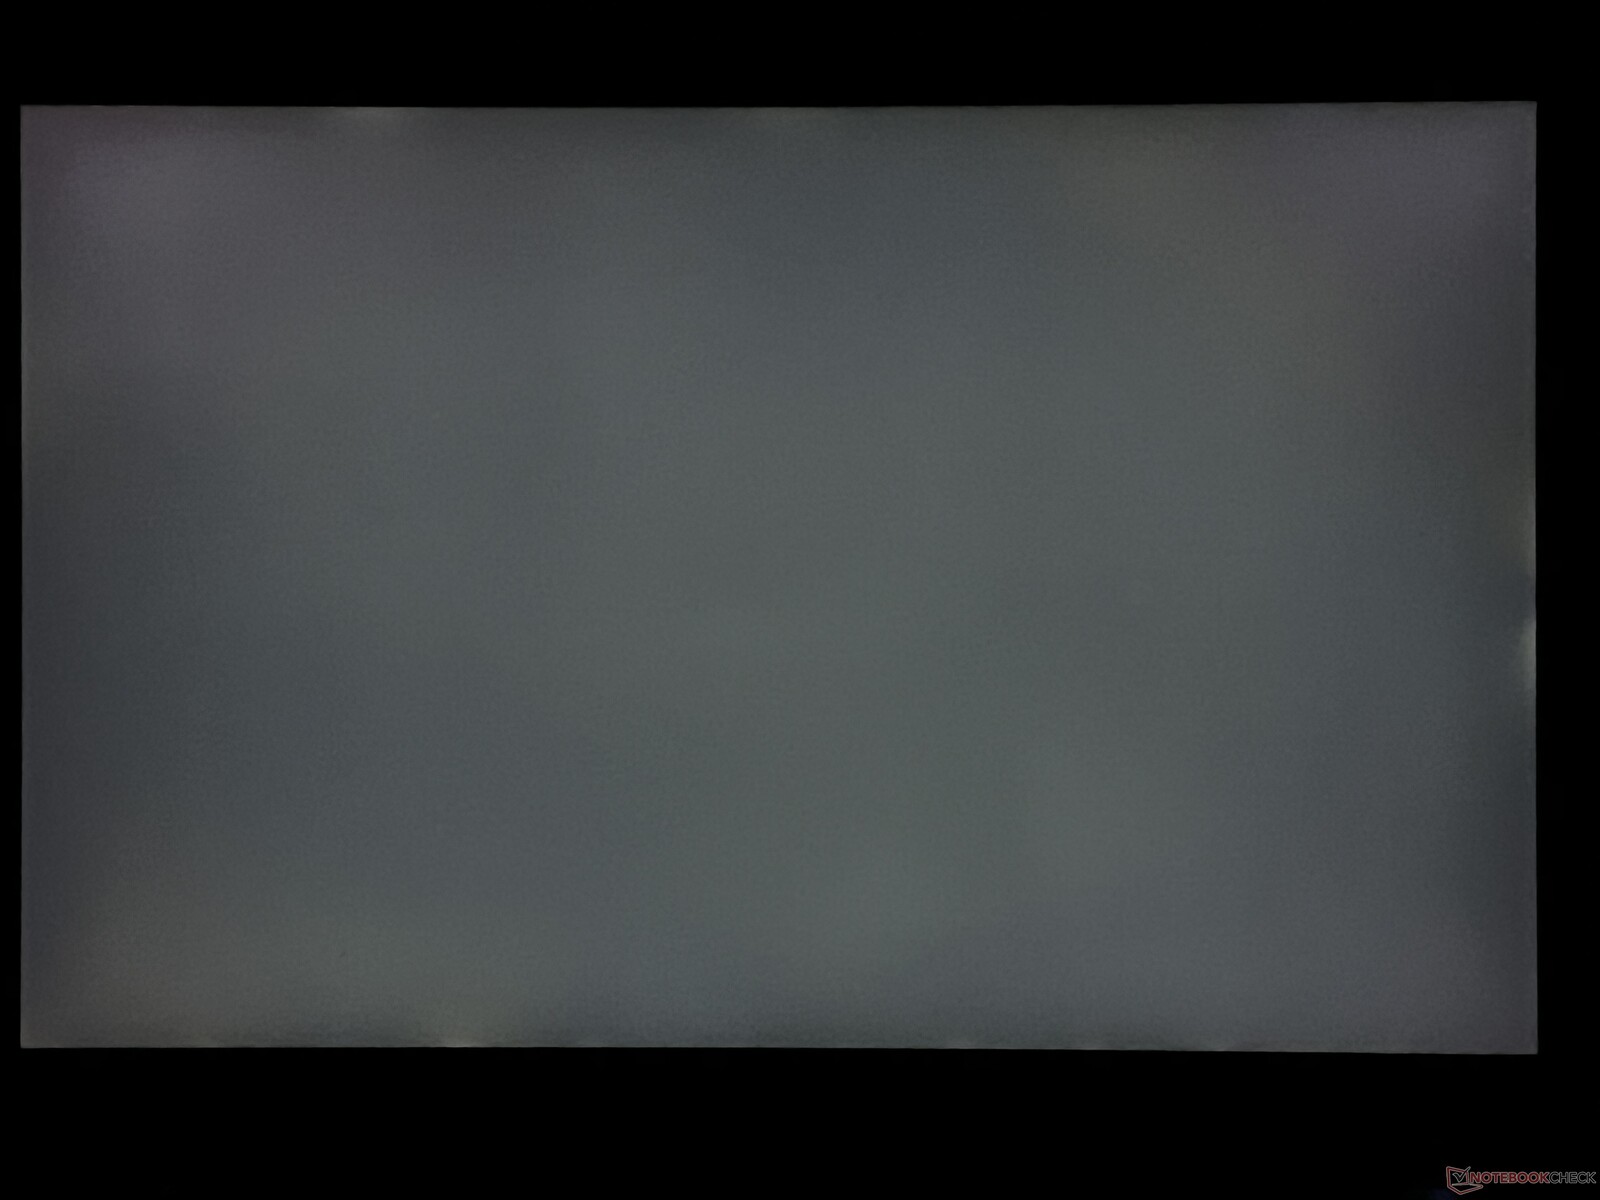
MSI har valt en 14-tums IPS-panel med en upplösning på 2 560 x 1 600 pixlar. Den främsta höjdpunkten med denna är dess 240 Hz uppdateringsfrekvens samt dess snabba reaktionstider - även om vi subjektivt inte var helt imponerade av dess bildkvalitet. Skärpan är bra, men mörka områden ser alltid lite ut som om de har en grå slöja hängande över sig.
Detta beror på skärmens höga svartvärde på 0,43 cd/m², vilket - även i kombination med dess anständiga ljusstyrka på cirka 400 cd/m² - leder till ett mediokert kontrastförhållande på under 1.000:1. Skärmen är inte på något sätt dålig, men särskilt i tider med Mini-LED och OLED lämnar den installerade panelen mycket att önska subjektivt. Backlight bleeding verkar inte vara ett alltför stort problem och vi noterade inte något PWM-flimmer.
| |||||||||||||||||||||||||
Distribution av ljusstyrkan: 89 %
Mitt på batteriet: 422 cd/m²
Kontrast: 974:1 (Svärta: 0.43 cd/m²)
ΔE ColorChecker Calman: 2.3 | ∀{0.5-29.43 Ø4.73}
calibrated: 0.9
ΔE Greyscale Calman: 3.3 | ∀{0.09-98 Ø4.97}
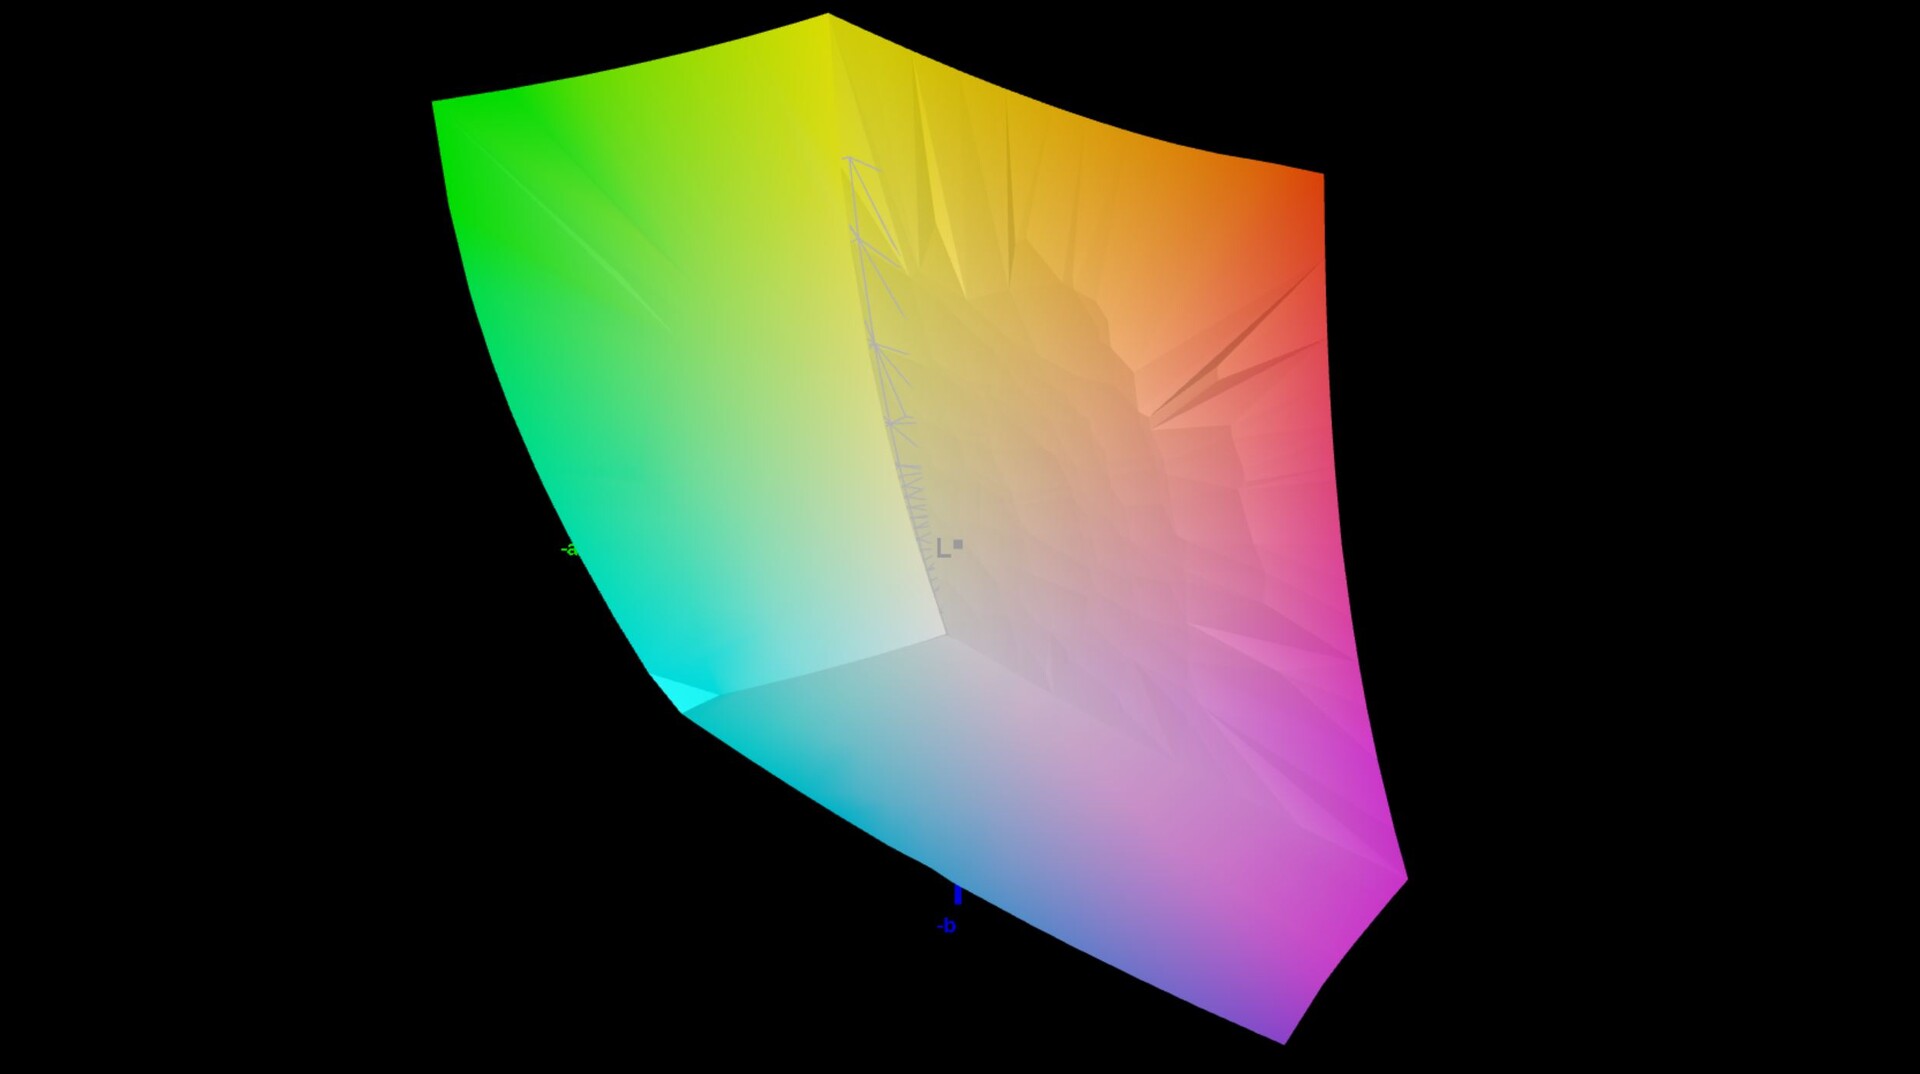
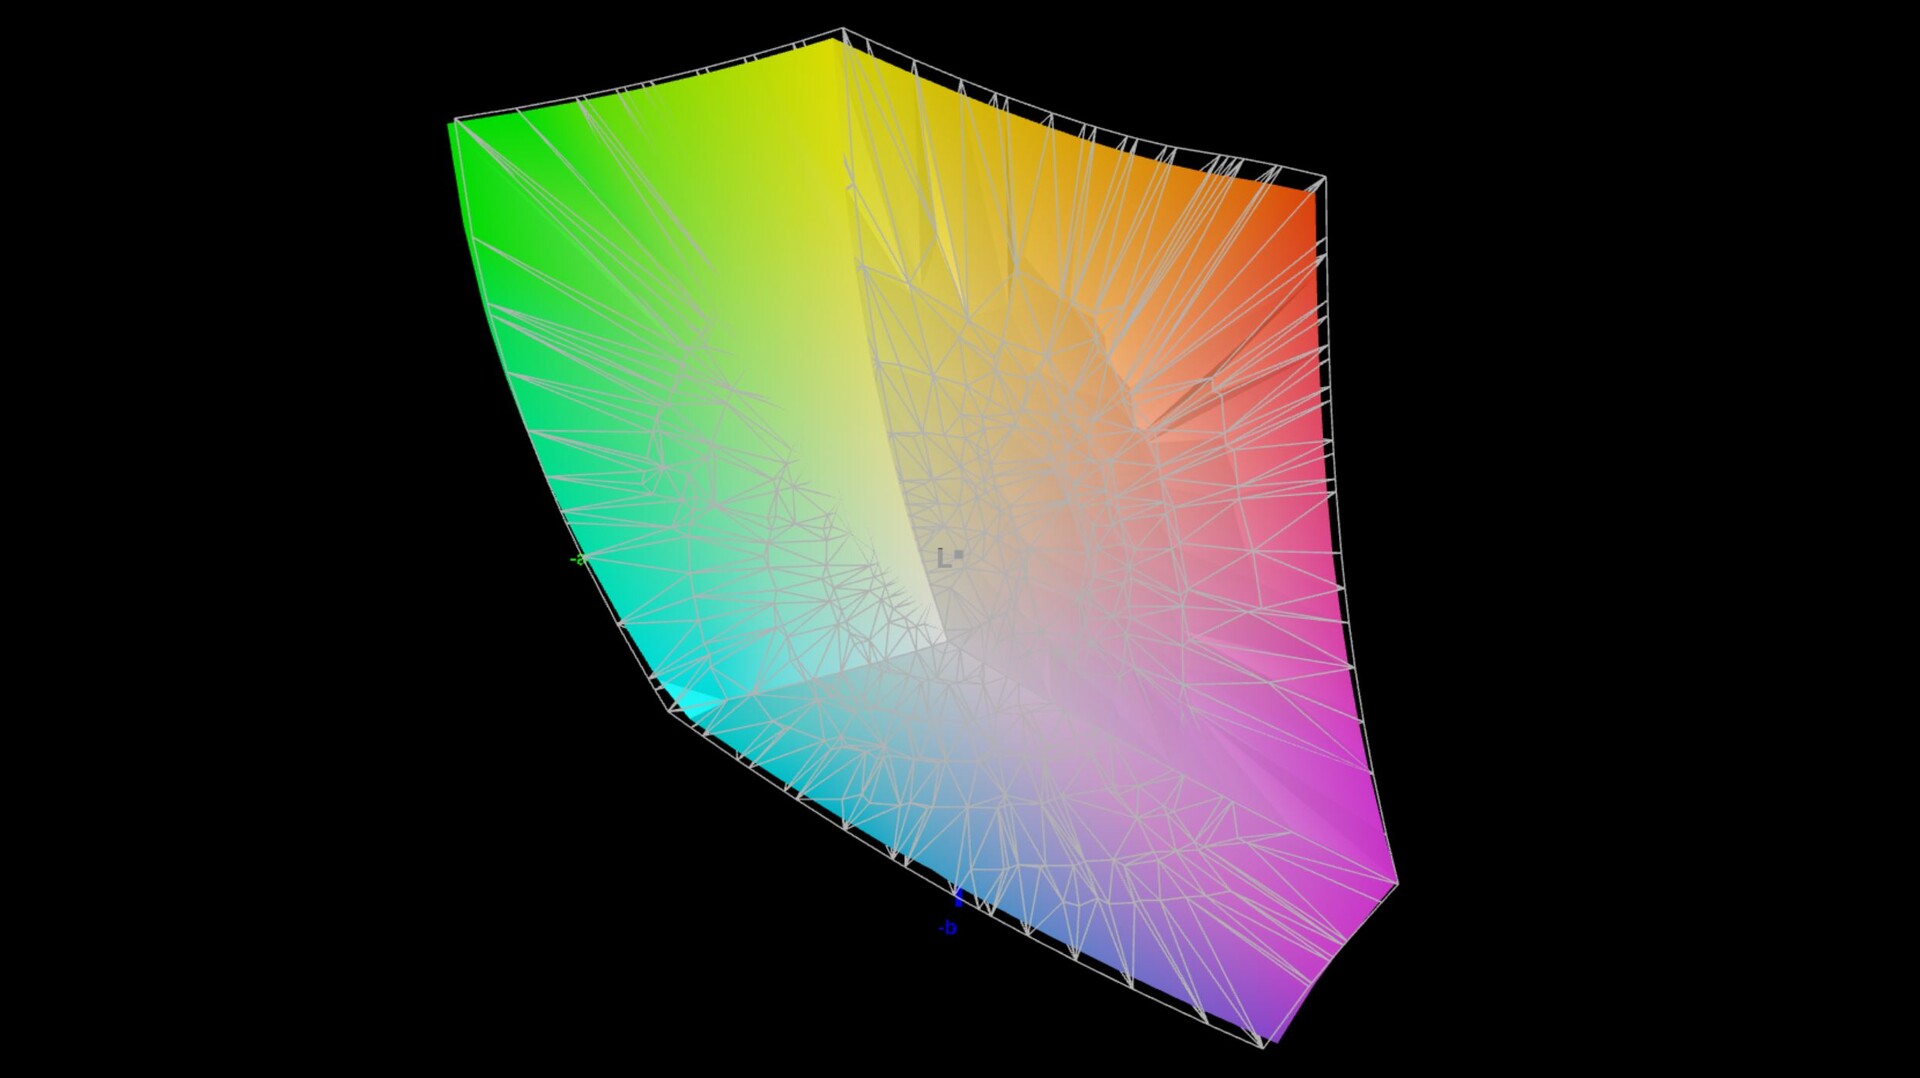
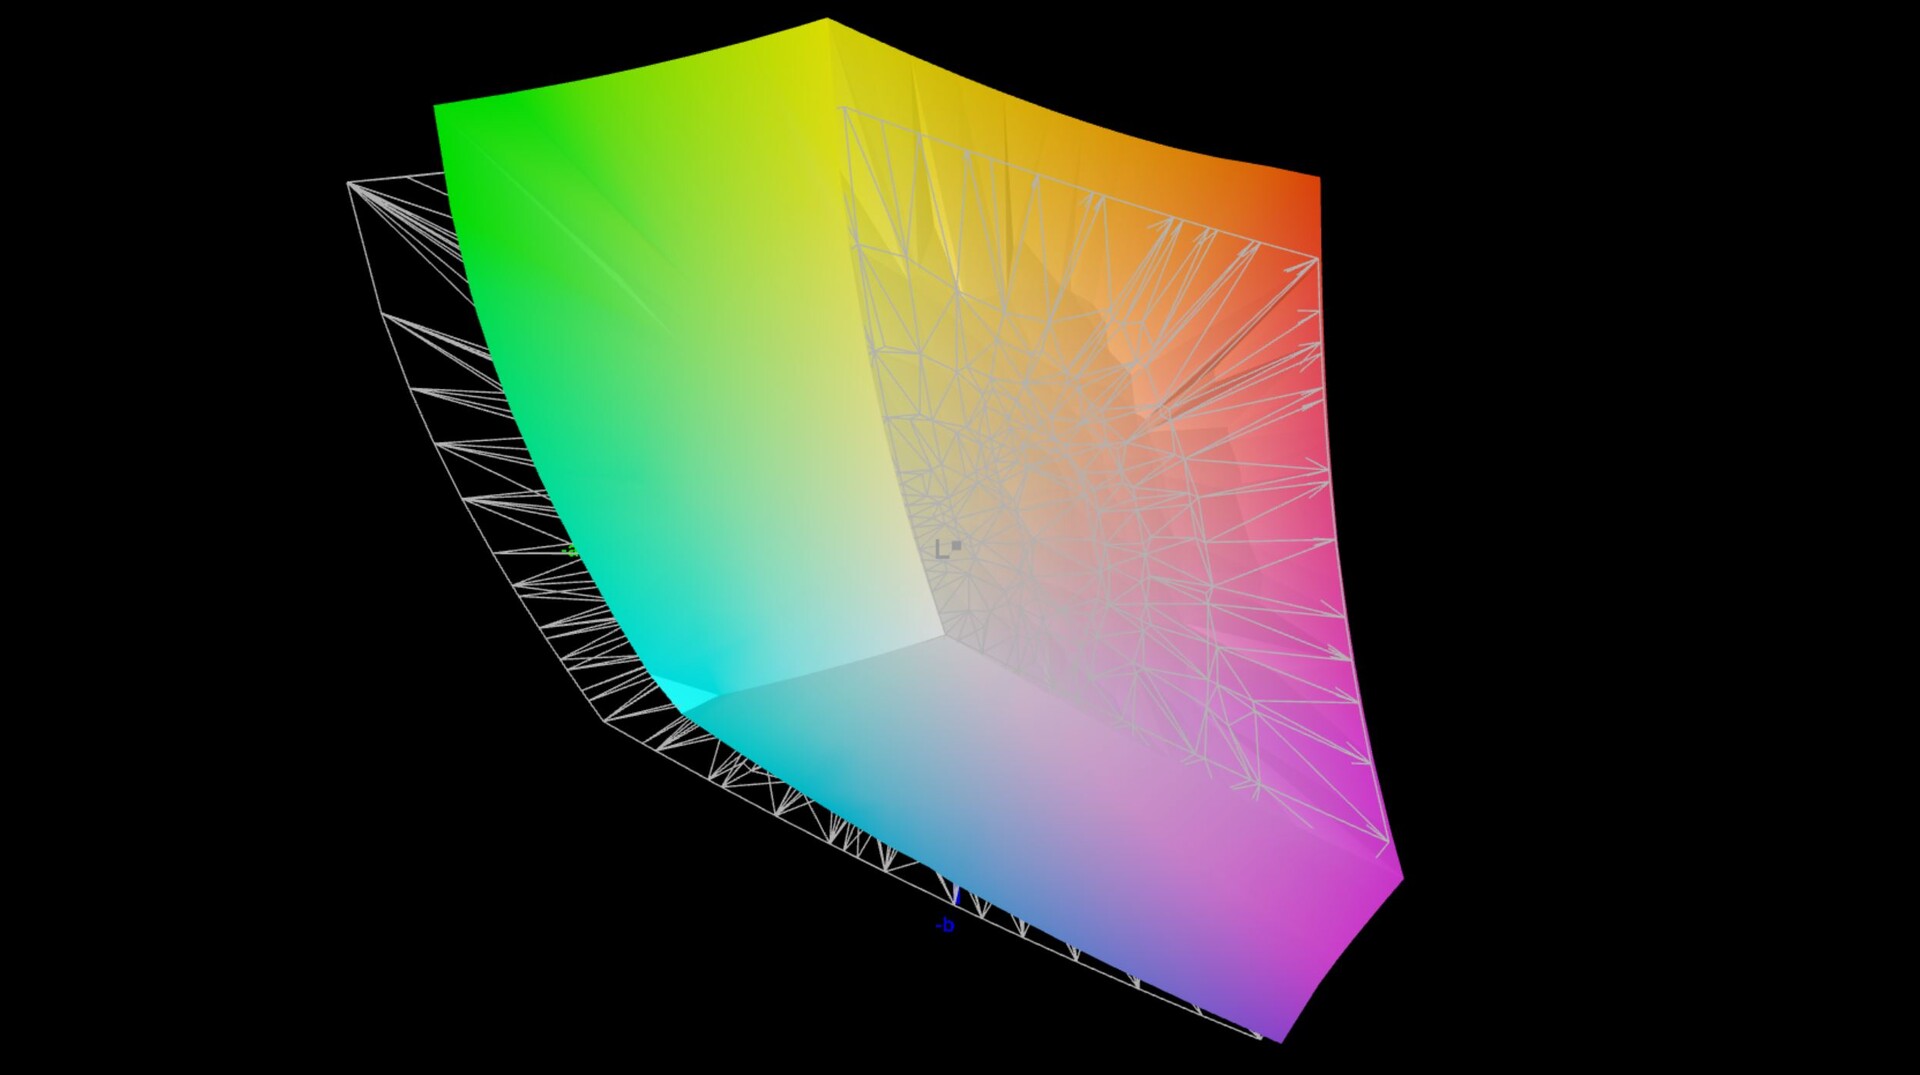
85.3% AdobeRGB 1998 (Argyll 3D)
99.6% sRGB (Argyll 3D)
96.2% Display P3 (Argyll 3D)
Gamma: 2.14
CCT: 6550 K
| MSI Stealth 14 Studio A13V B140QAN06.T, IPS, 2560x1600, 14" | Gigabyte Aero 14 OLED BMF Samsung SDC4192 (ATNA40YK14-0), OLED, 2880x1800, 14" | Schenker Vision 14 2022 RTX 3050 Ti MNE007ZA1-1, IPS, 2880x1800, 14" | Asus ROG Flow Z13 GZ301ZE LQ134N1JW54, IPS, 1920x1200, 13.4" | Alienware x14 i7 RTX 3060 SHP154D, IPS, 1920x1080, 14" | Razer Blade 14 Ryzen 9 6900HX TL140BDXP02-0, IPS, 2560x1440, 14" | Acer Predator Triton 300 SE Samsung ATNA40YK07-0, OLED, 2880x1800, 14" | |
|---|---|---|---|---|---|---|---|
| Display | 3% | -12% | -17% | 2% | 0% | 7% | |
| Display P3 Coverage (%) | 96.2 | 99.8 4% | 74.1 -23% | 67.5 -30% | 99.6 4% | 97.2 1% | 99.9 4% |
| sRGB Coverage (%) | 99.6 | 100 0% | 97.4 -2% | 97.1 -3% | 100 0% | 99.9 0% | 100 0% |
| AdobeRGB 1998 Coverage (%) | 85.3 | 88.7 4% | 75.3 -12% | 69.3 -19% | 87.6 3% | 85.7 0% | 99 16% |
| Response Times | 58% | -312% | -452% | -53% | -184% | 76% | |
| Response Time Grey 50% / Grey 80% * (ms) | 5.5 ? | 2.4 ? 56% | 31.5 ? -473% | 44 ? -700% | 9.6 ? -75% | 16.8 ? -205% | 1.36 ? 75% |
| Response Time Black / White * (ms) | 5.8 ? | 2.4 ? 59% | 14.5 ? -150% | 17.6 ? -203% | 7.6 ? -31% | 15.2 ? -162% | 1.36 ? 77% |
| PWM Frequency (Hz) | 300 | 367.6 ? | |||||
| Screen | 71% | -11% | 18% | 5% | 11% | -13% | |
| Brightness middle (cd/m²) | 419 | 423 1% | 421 0% | 515 23% | 434 4% | 354 -16% | 414.3 -1% |
| Brightness (cd/m²) | 402 | 427 6% | 416 3% | 476 18% | 411 2% | 328 -18% | 416 3% |
| Brightness Distribution (%) | 89 | 98 10% | 89 0% | 87 -2% | 89 0% | 86 -3% | 99 11% |
| Black Level * (cd/m²) | 0.43 | 0.1 77% | 0.28 35% | 0.35 19% | 0.25 42% | 0.37 14% | |
| Contrast (:1) | 974 | 4230 334% | 1504 54% | 1471 51% | 1736 78% | 957 -2% | |
| Colorchecker dE 2000 * | 2.3 | 0.55 76% | 3.2 -39% | 1.6 30% | 3 -30% | 1.66 28% | 4.68 -103% |
| Colorchecker dE 2000 max. * | 5.8 | 1.15 80% | 5.5 5% | 4 31% | 7.1 -22% | 3.83 34% | 7.78 -34% |
| Colorchecker dE 2000 calibrated * | 0.9 | 1.15 -28% | 2 -122% | 1.2 -33% | 0.7 22% | ||
| Greyscale dE 2000 * | 3.3 | 0.69 79% | 4.4 -33% | 2.5 24% | 5.1 -55% | 1.6 52% | 1.8 45% |
| Gamma | 2.14 103% | 2.42 91% | 2.22 99% | 2.2 100% | 2.19 100% | 2.23 99% | 2.22 99% |
| CCT | 6550 99% | 6479 100% | 6384 102% | 6939 94% | 6204 105% | 6542 99% | 6207 105% |
| Totalt genomsnitt (program/inställningar) | 44% /
54% | -112% /
-54% | -150% /
-57% | -15% /
-4% | -58% /
-21% | 23% /
8% |
* ... mindre är bättre
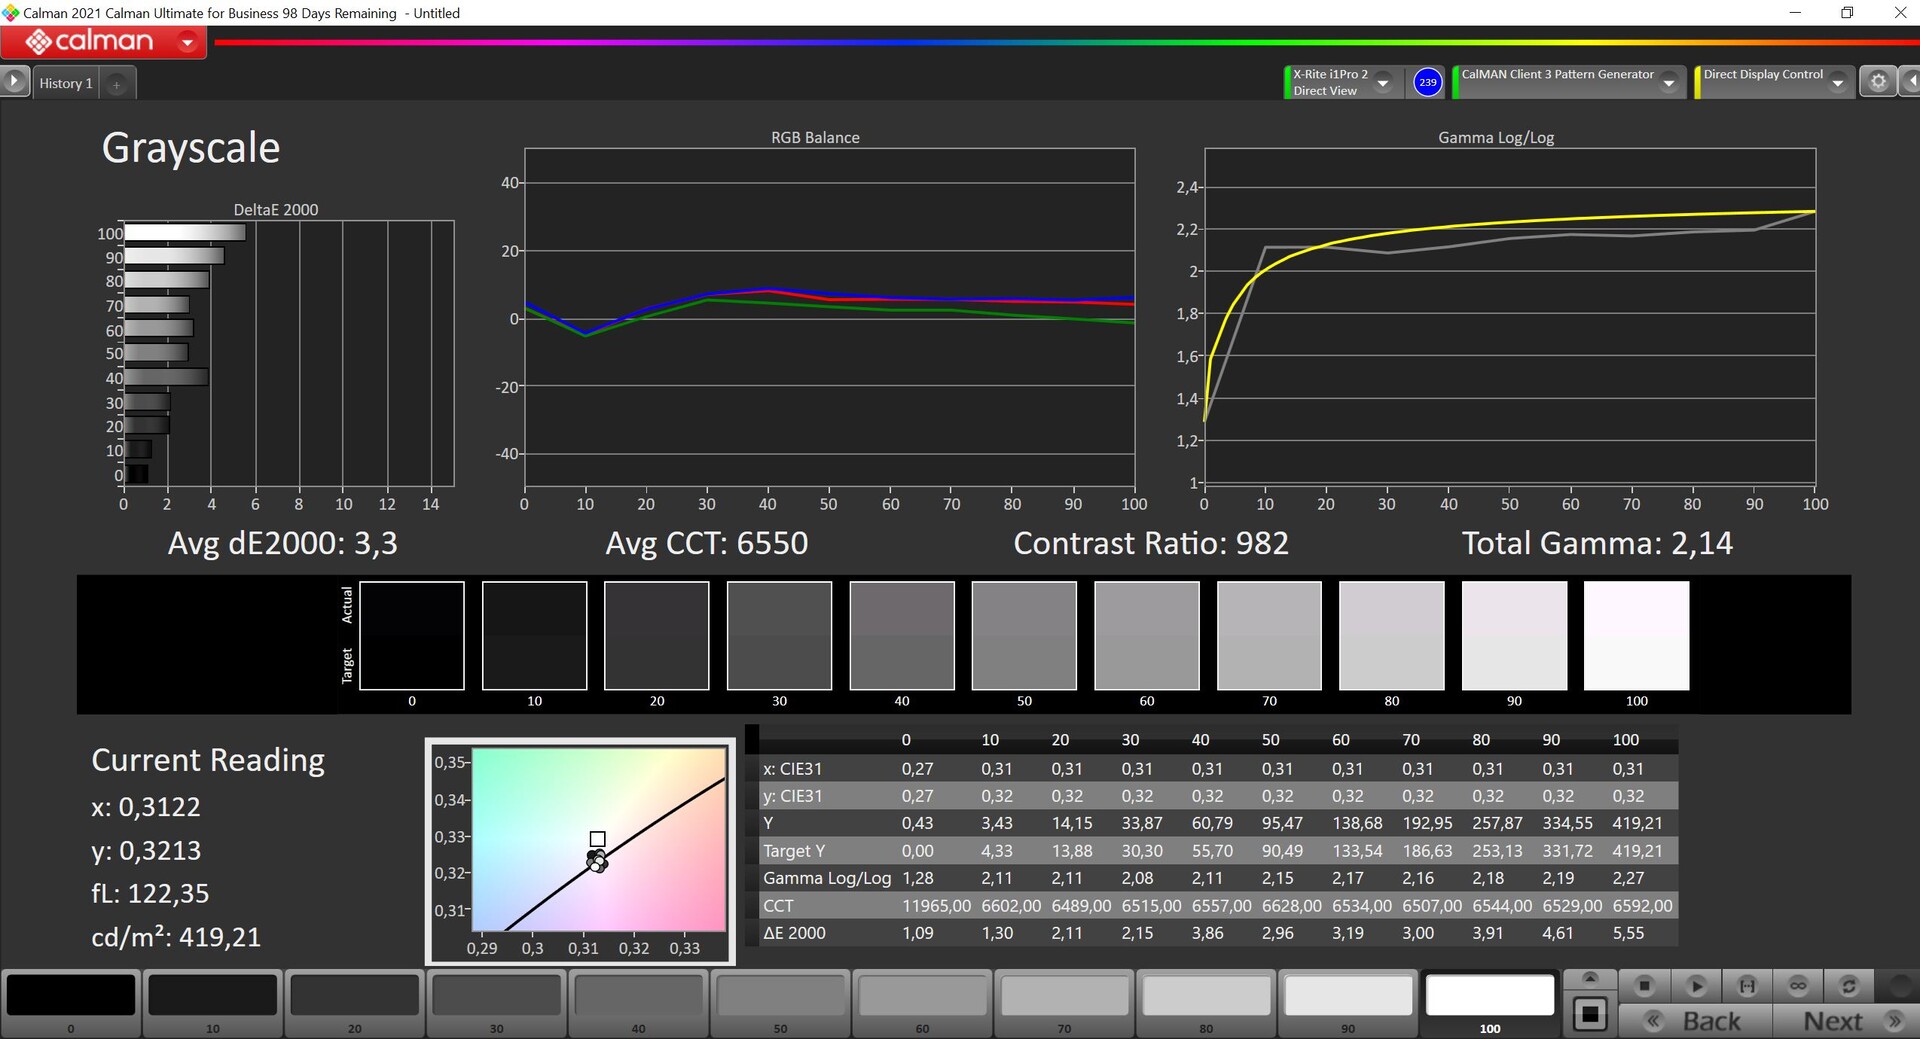
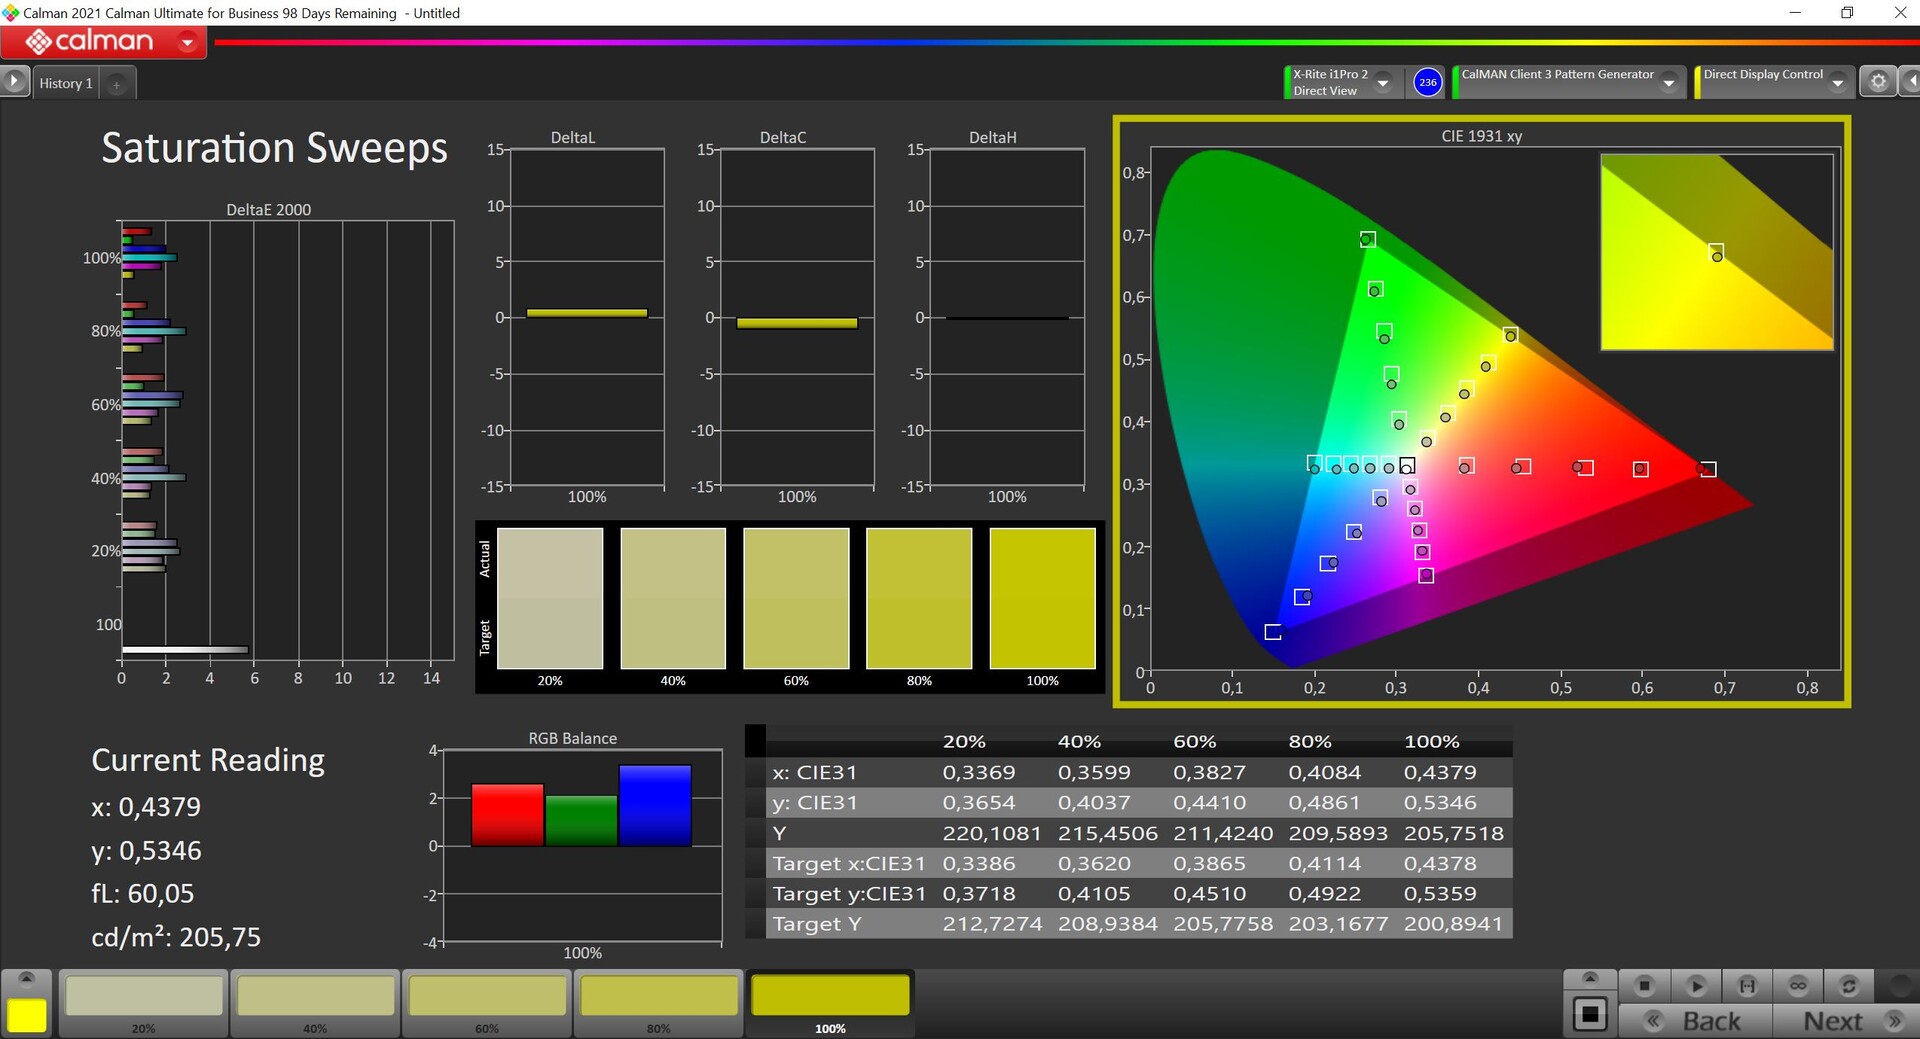
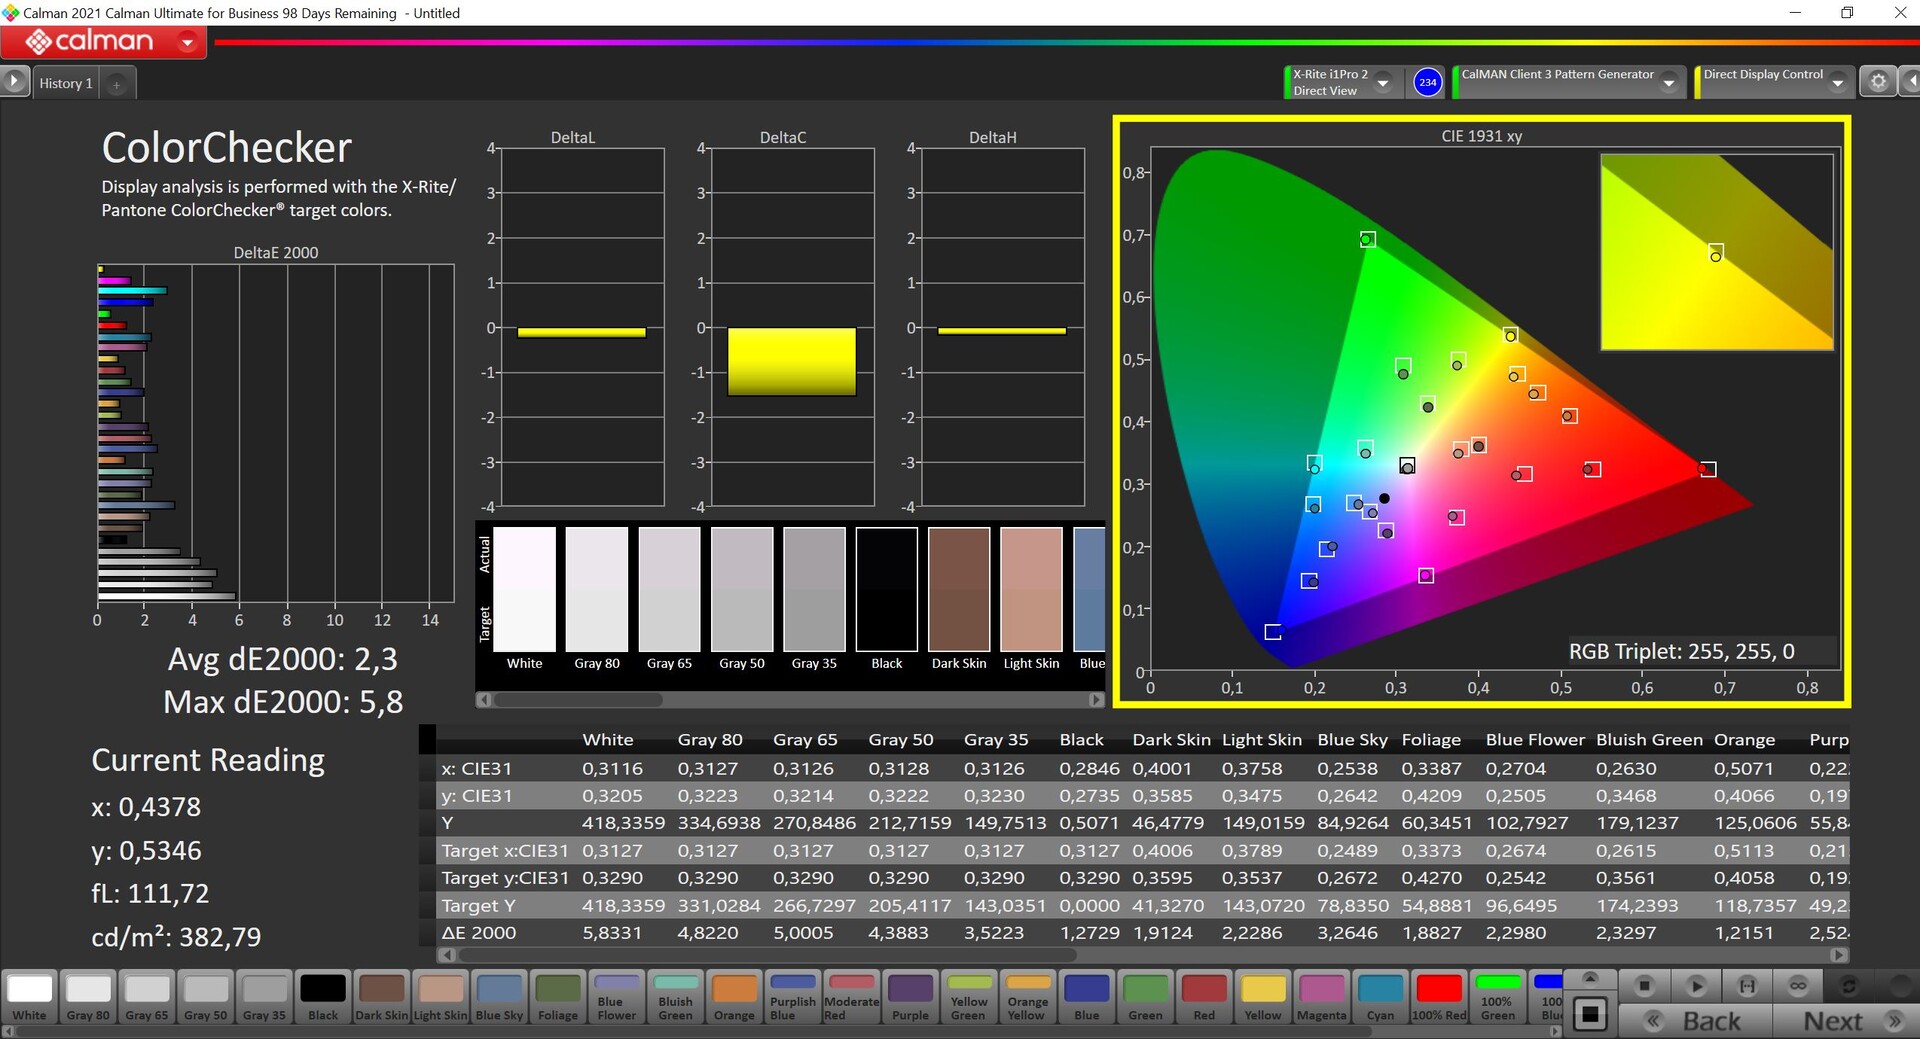
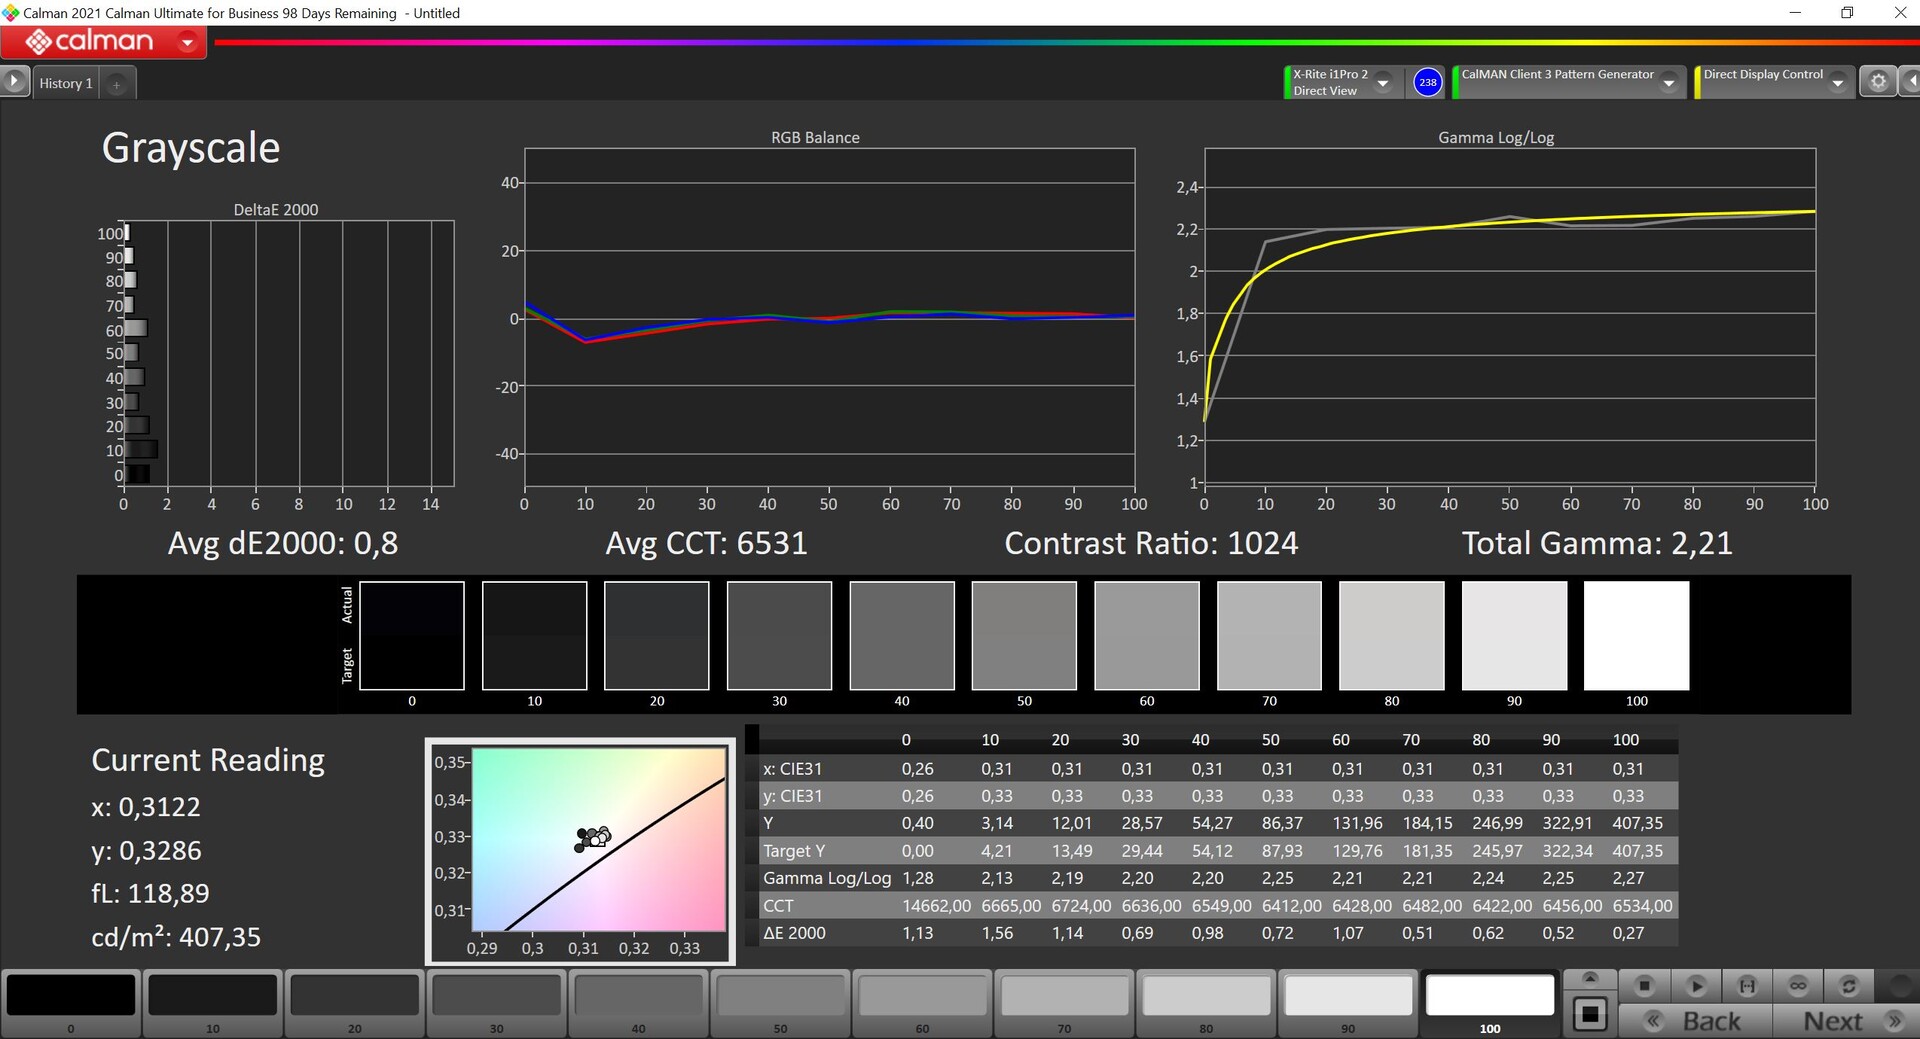
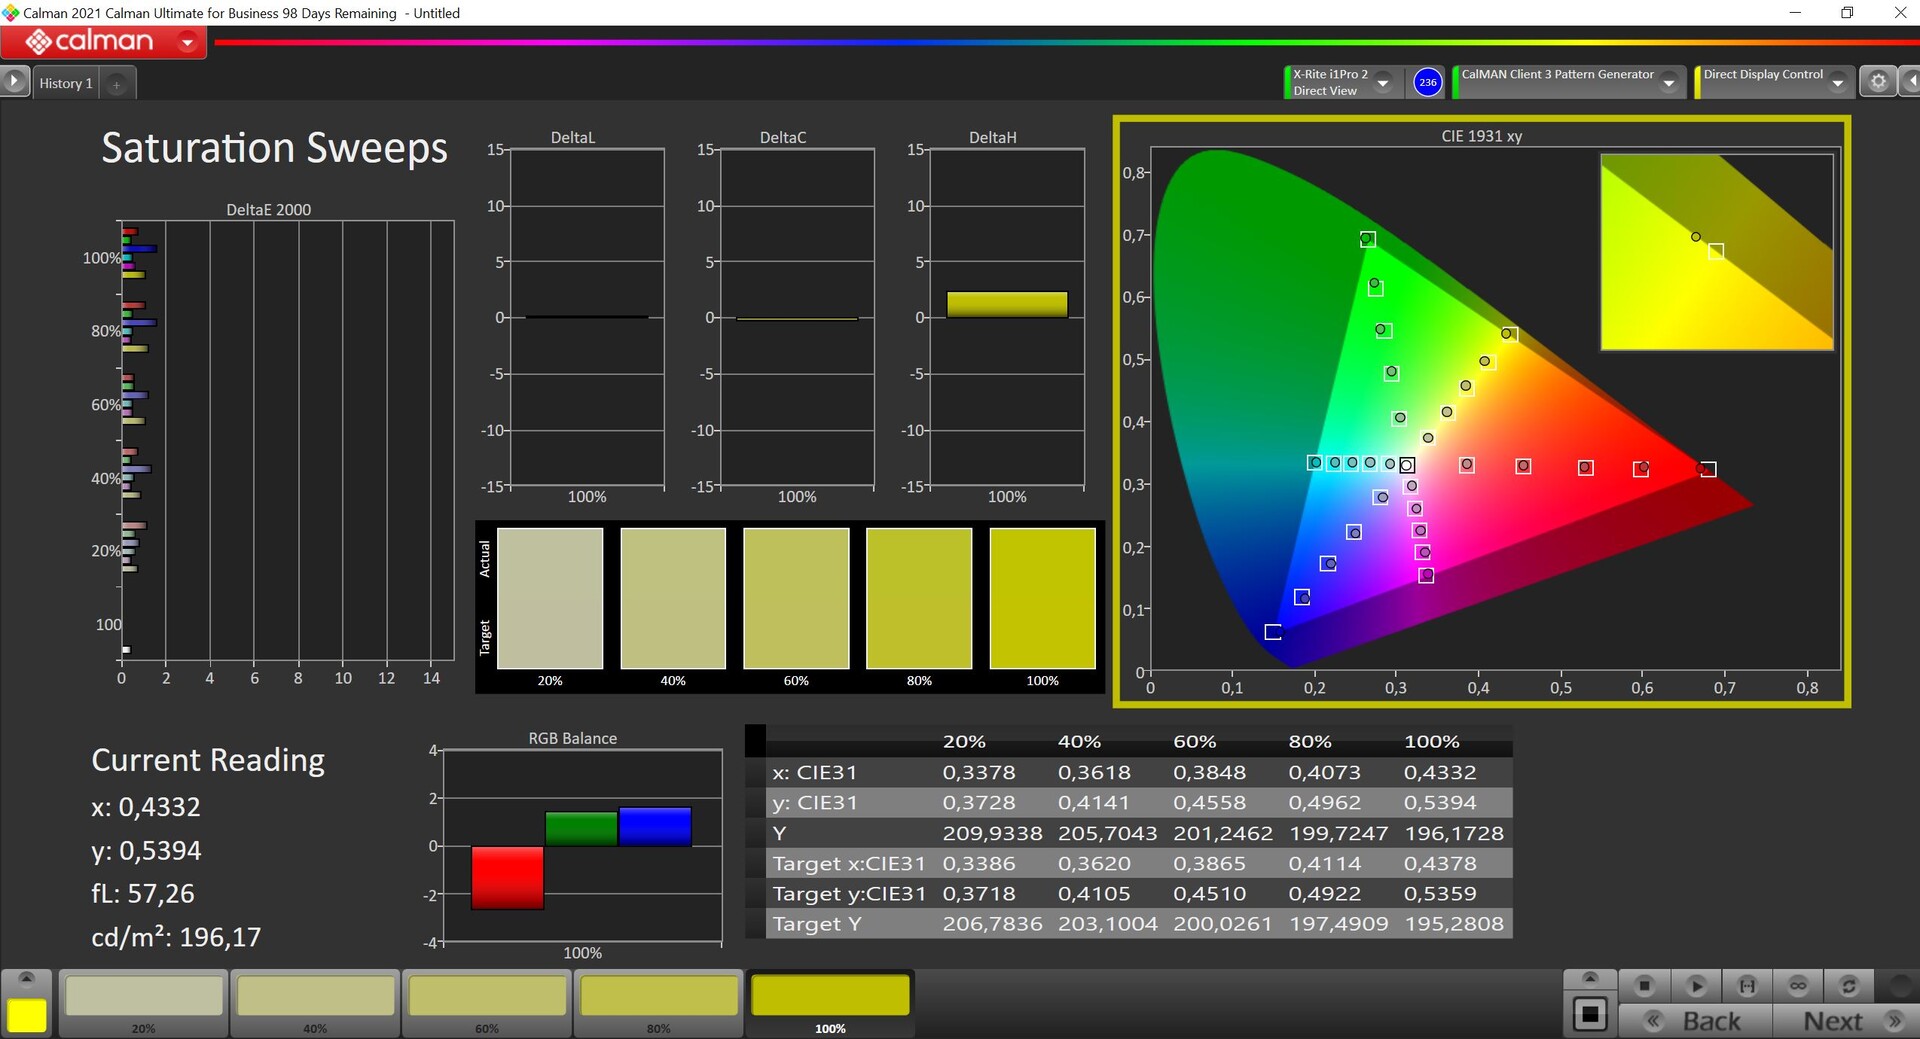
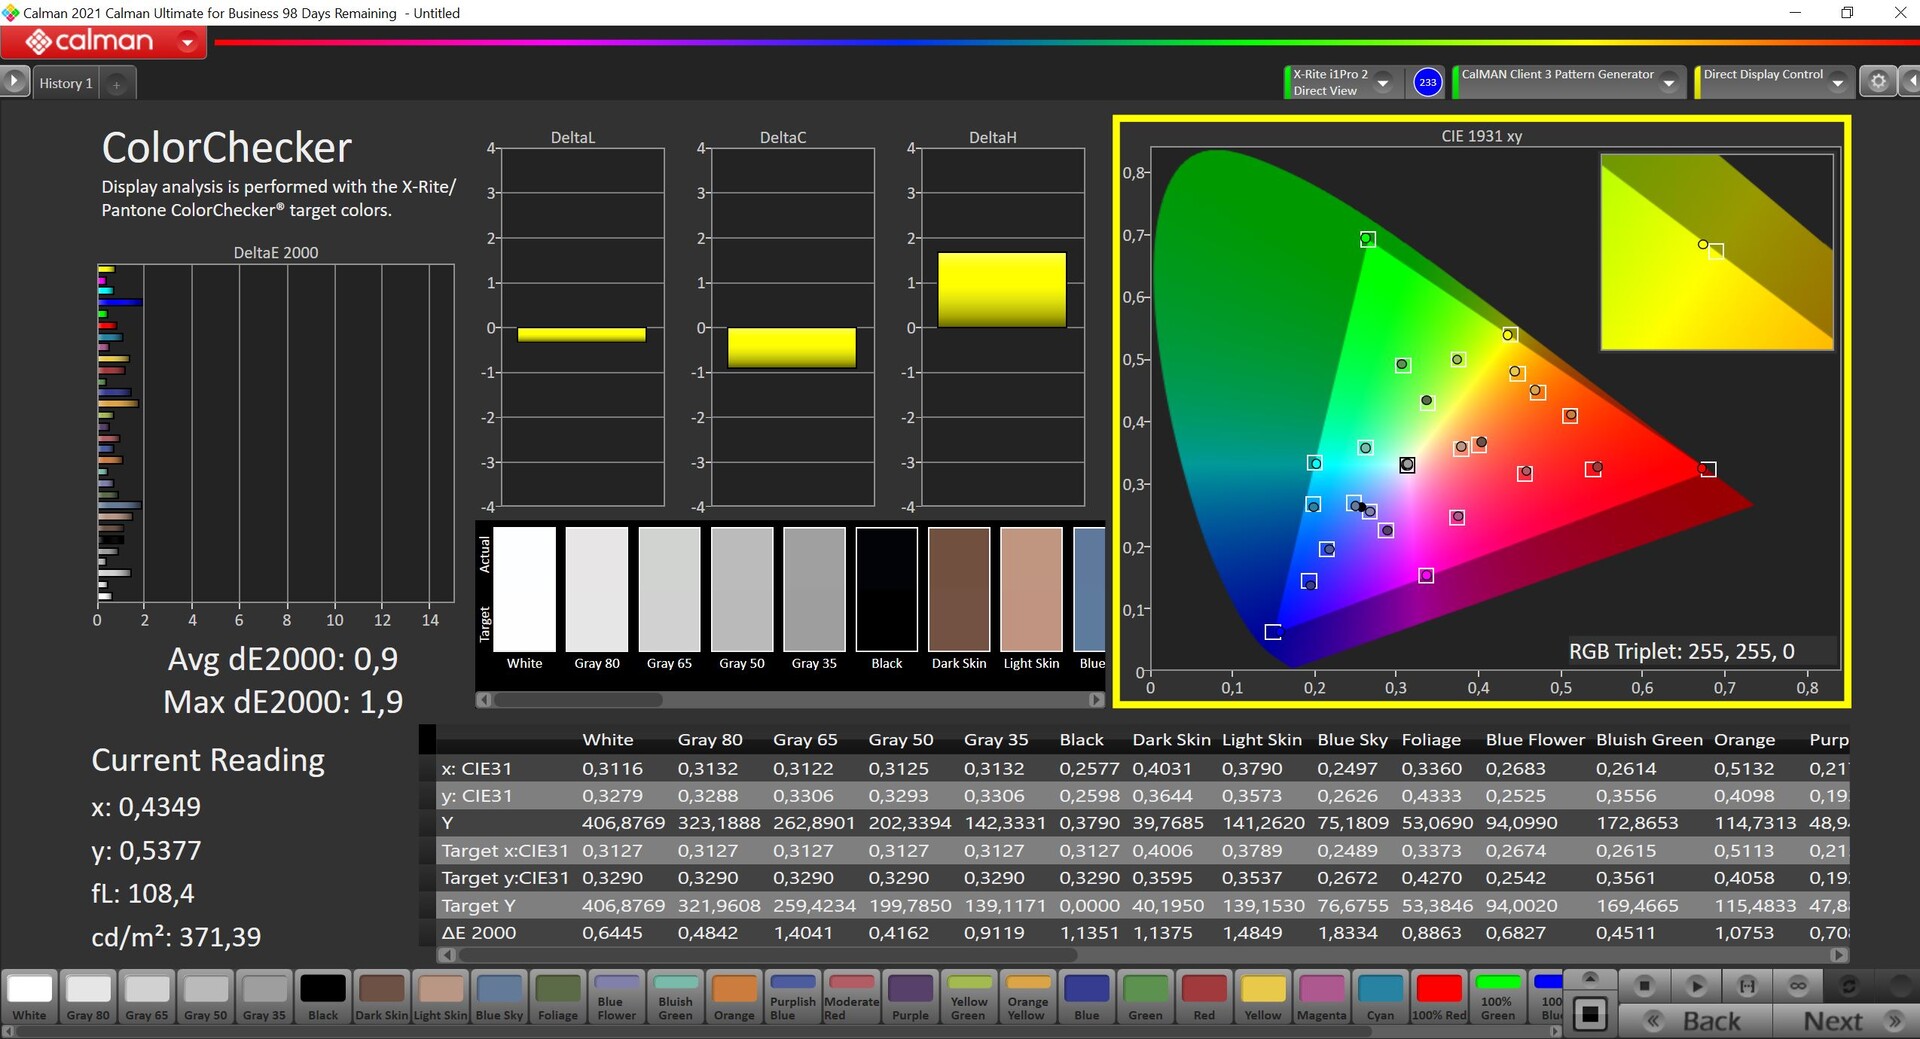
MSI erbjuder flera olika färgprofiler via sin TrueColor-programvara och vi valde läget Display P3 för våra mätningar med professionell CalMAN-programvara (X-Rite i1 Pro2). Det är det läge som är aktiverat som standard. De färger vi mätte låg under den viktiga DeltaE 2000-avvikelsen på 3 jämfört med P3-referensen, men de grå tonerna tycktes visa en liten lila nyans. Med hjälp av vår egen kalibrering (du kan ladda ner vår profil gratis ovan) lyckades vi enkelt få detta under kontroll. P3-färgrymden kunde återges nästan helt och hållet.
Visa svarstider
| ↔ Svarstid svart till vitt | ||
|---|---|---|
| 5.8 ms ... stiga ↗ och falla ↘ kombinerat | ↗ 2.1 ms stiga | 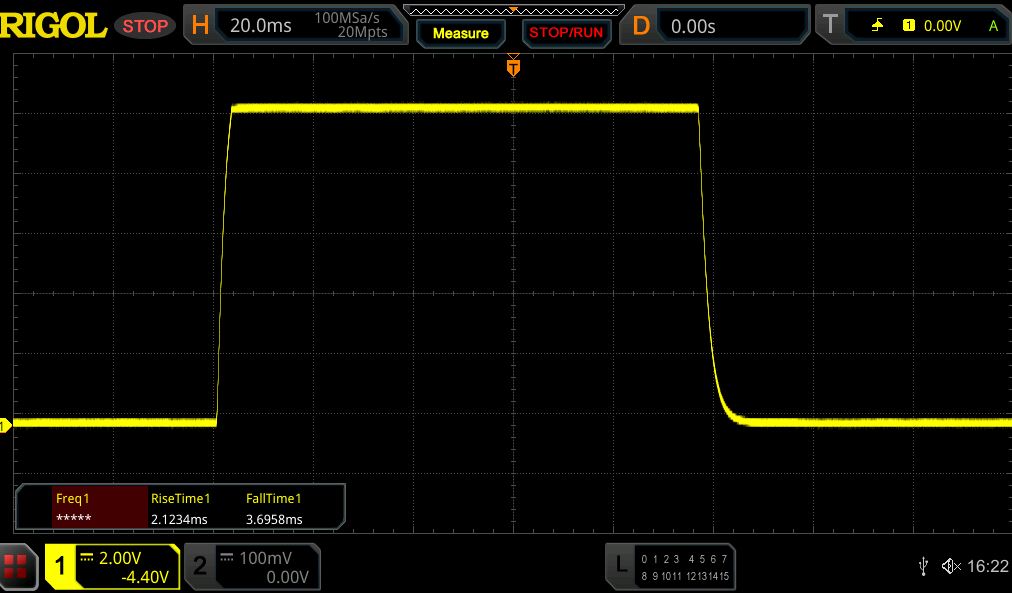 |
| ↘ 3.7 ms hösten | ||
| Skärmen visar väldigt snabba svarsfrekvenser i våra tester och borde vara mycket väl lämpad för fartfyllt spel. I jämförelse sträcker sig alla testade enheter från 0.1 (minst) till 240 (maximalt) ms. » 18 % av alla enheter är bättre. Det betyder att den uppmätta svarstiden är bättre än genomsnittet av alla testade enheter (19.9 ms). | ||
| ↔ Svarstid 50 % grått till 80 % grått | ||
| 5.5 ms ... stiga ↗ och falla ↘ kombinerat | ↗ 2.7 ms stiga | 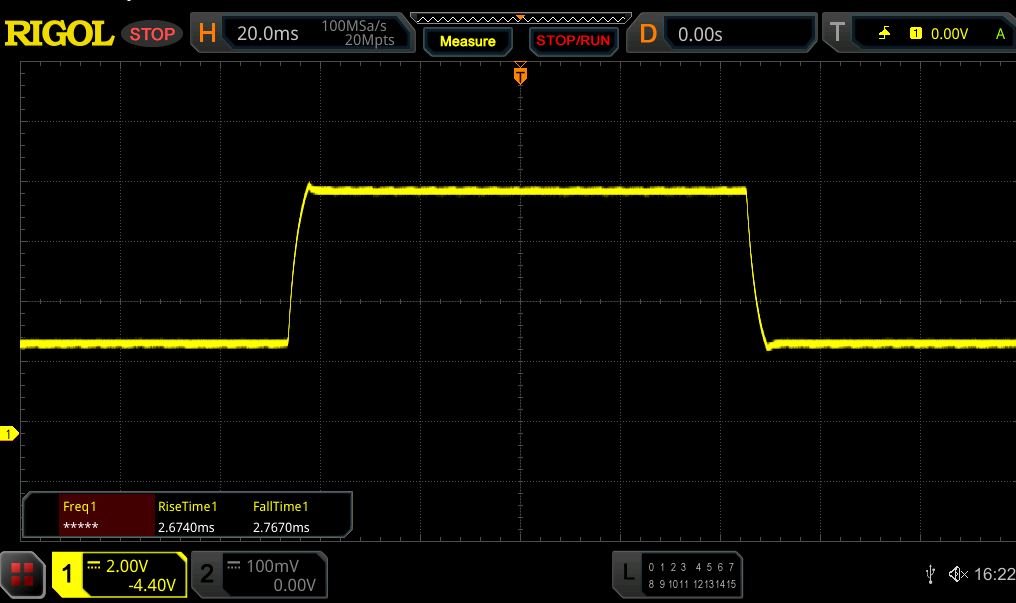 |
| ↘ 2.8 ms hösten | ||
| Skärmen visar väldigt snabba svarsfrekvenser i våra tester och borde vara mycket väl lämpad för fartfyllt spel. I jämförelse sträcker sig alla testade enheter från 0.165 (minst) till 636 (maximalt) ms. » 18 % av alla enheter är bättre. Det betyder att den uppmätta svarstiden är bättre än genomsnittet av alla testade enheter (31.1 ms). | ||
Skärmflimmer / PWM (Puls-Width Modulation)
| Skärmflimmer / PWM upptäcktes inte |  | ||
Som jämförelse: 52 % av alla testade enheter använder inte PWM för att dämpa skärmen. Om PWM upptäcktes mättes ett medelvärde av 7801 (minst: 5 - maximum: 343500) Hz. | |||
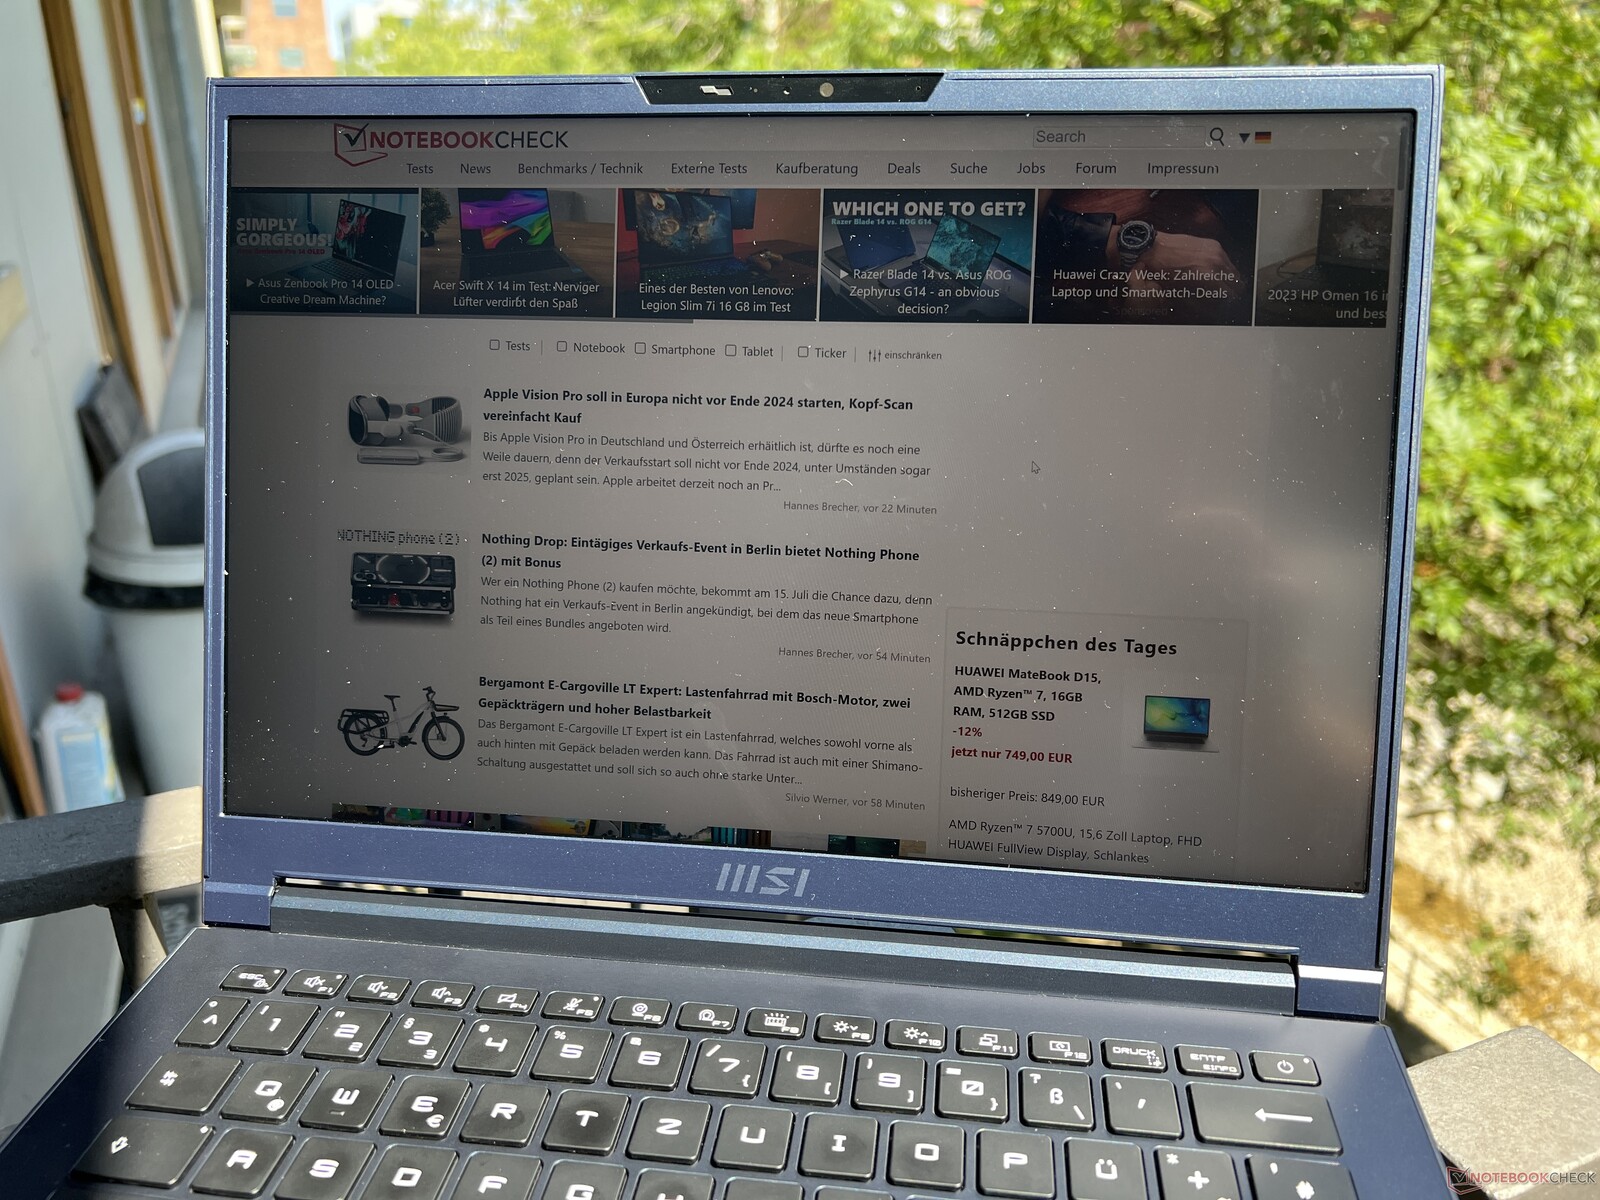
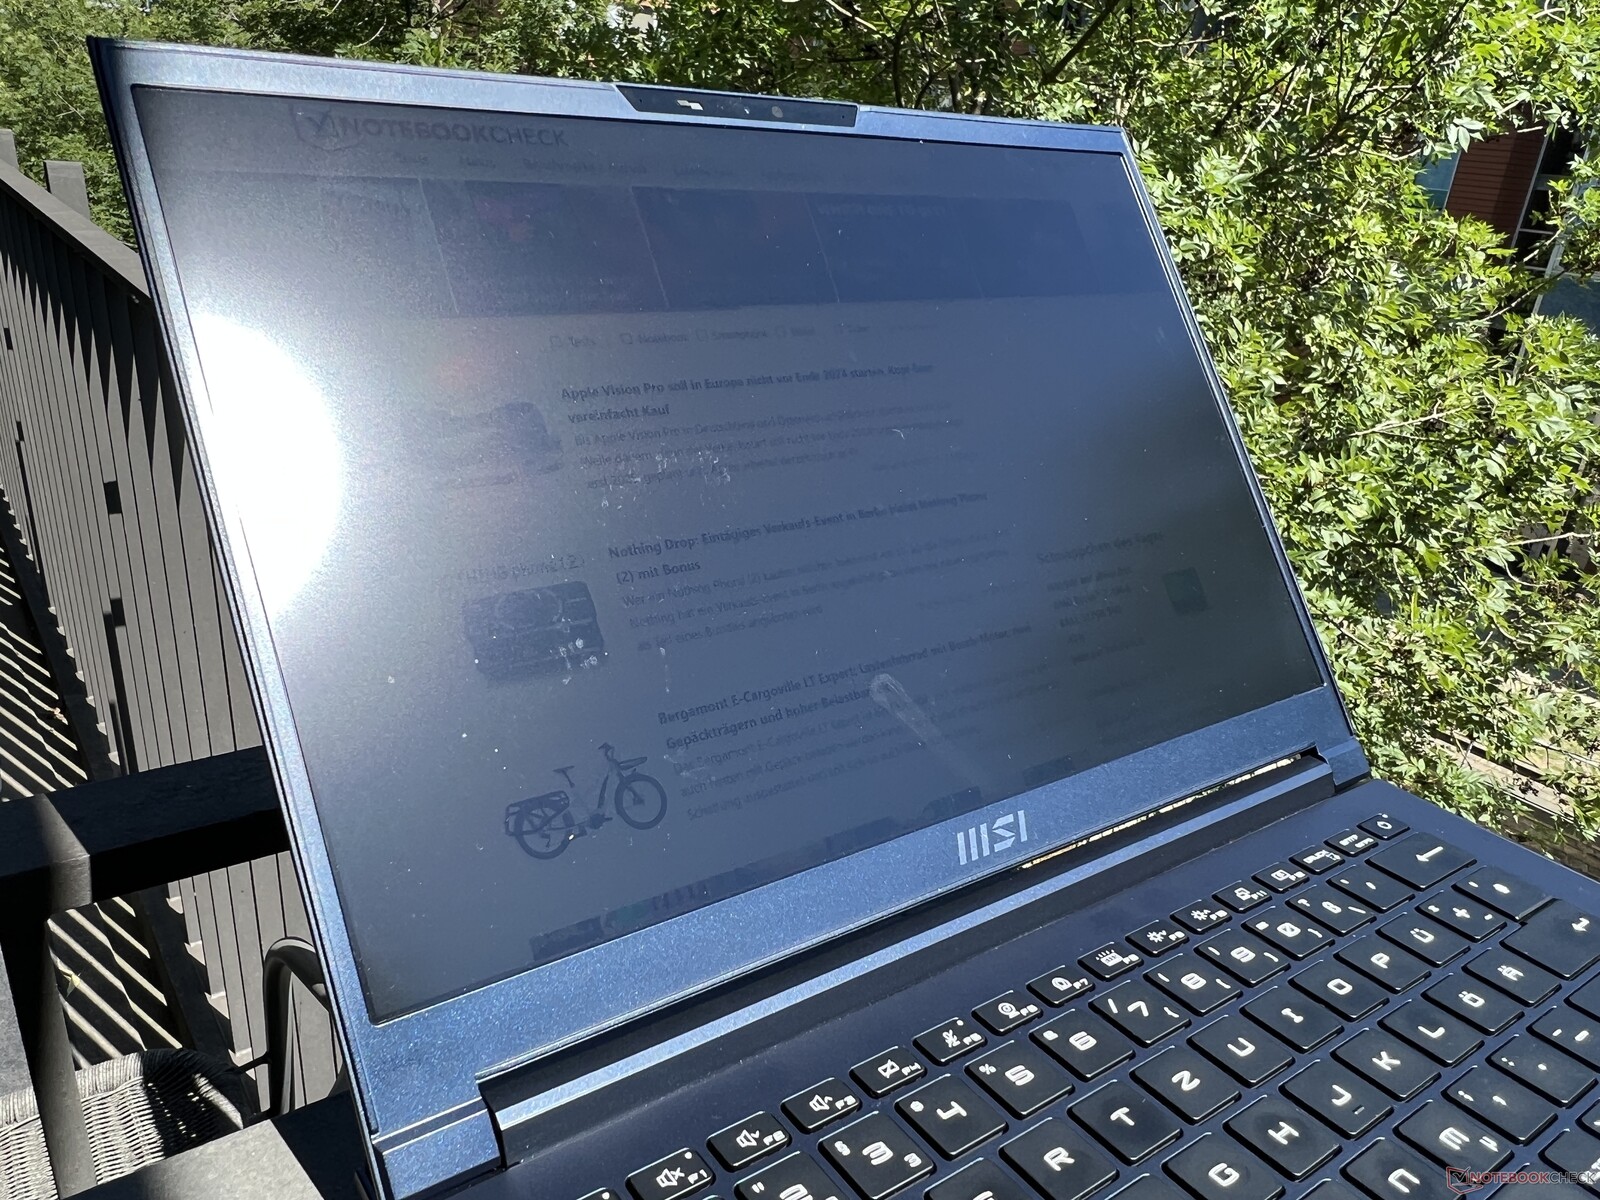
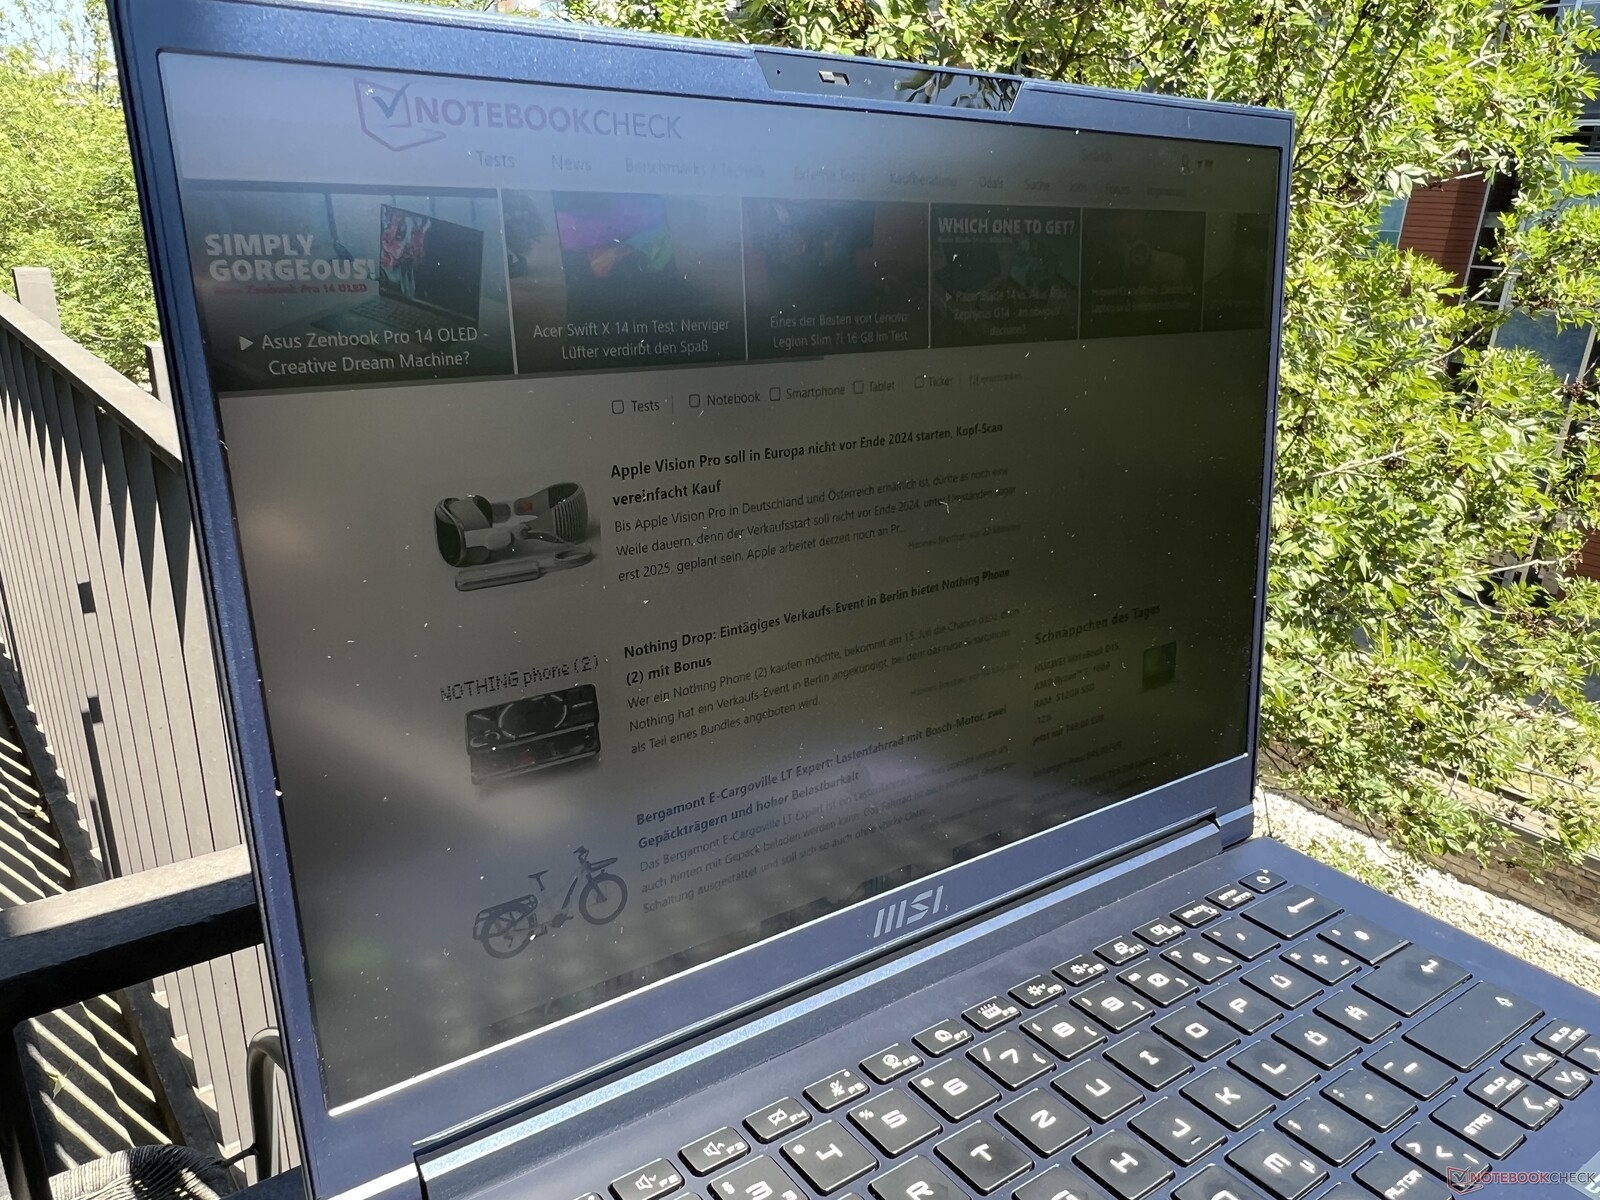
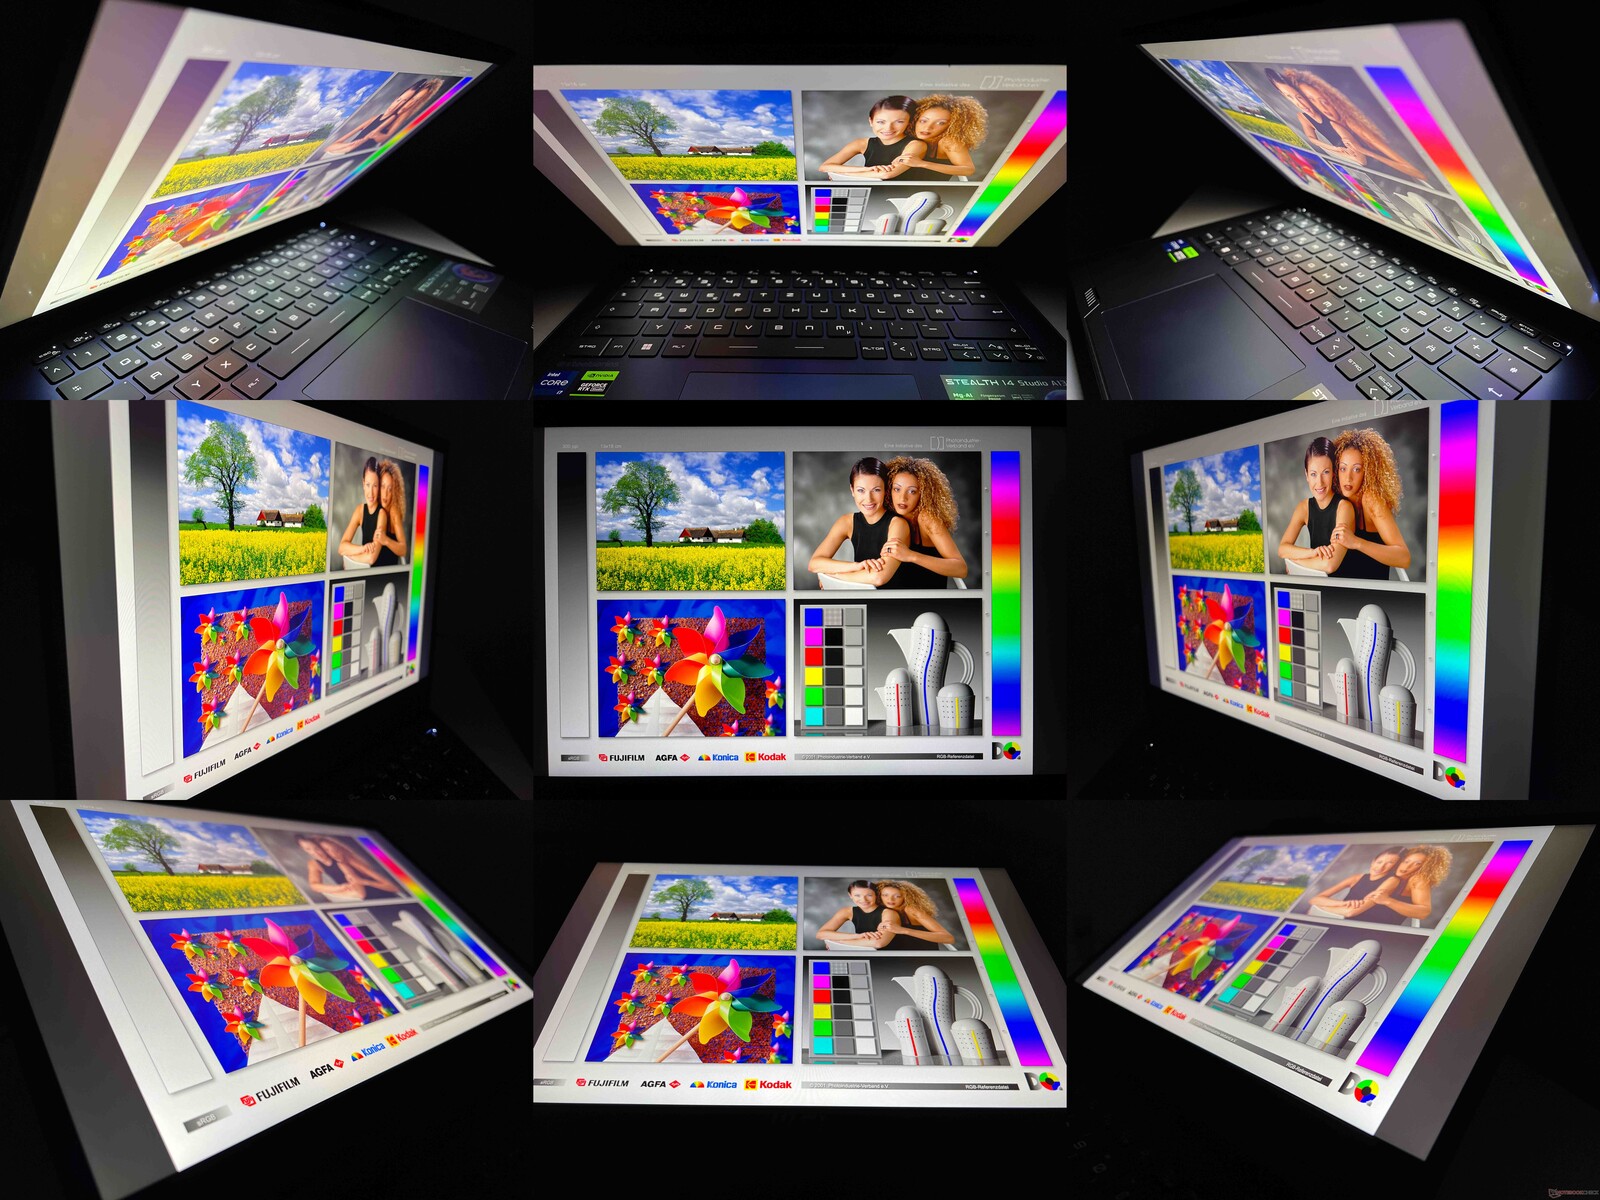
Så länge du inte ställer upp Stealth 14 Studio i direkt solljus bör du inte ha några problem med att läsa på den matta skärmen utomhus - inte ens under ganska ljusa dagar. Betraktningsvinkelstabiliteten är bra, men den kan bli bättre. Särskilt när du tittar diagonalt ovanifrån blir bilden snabbt för ljus och förlorar en hel del kontrast.
Prestanda - Raptor Lake och en RTX 4050 bärbar dator
Villkor för testning
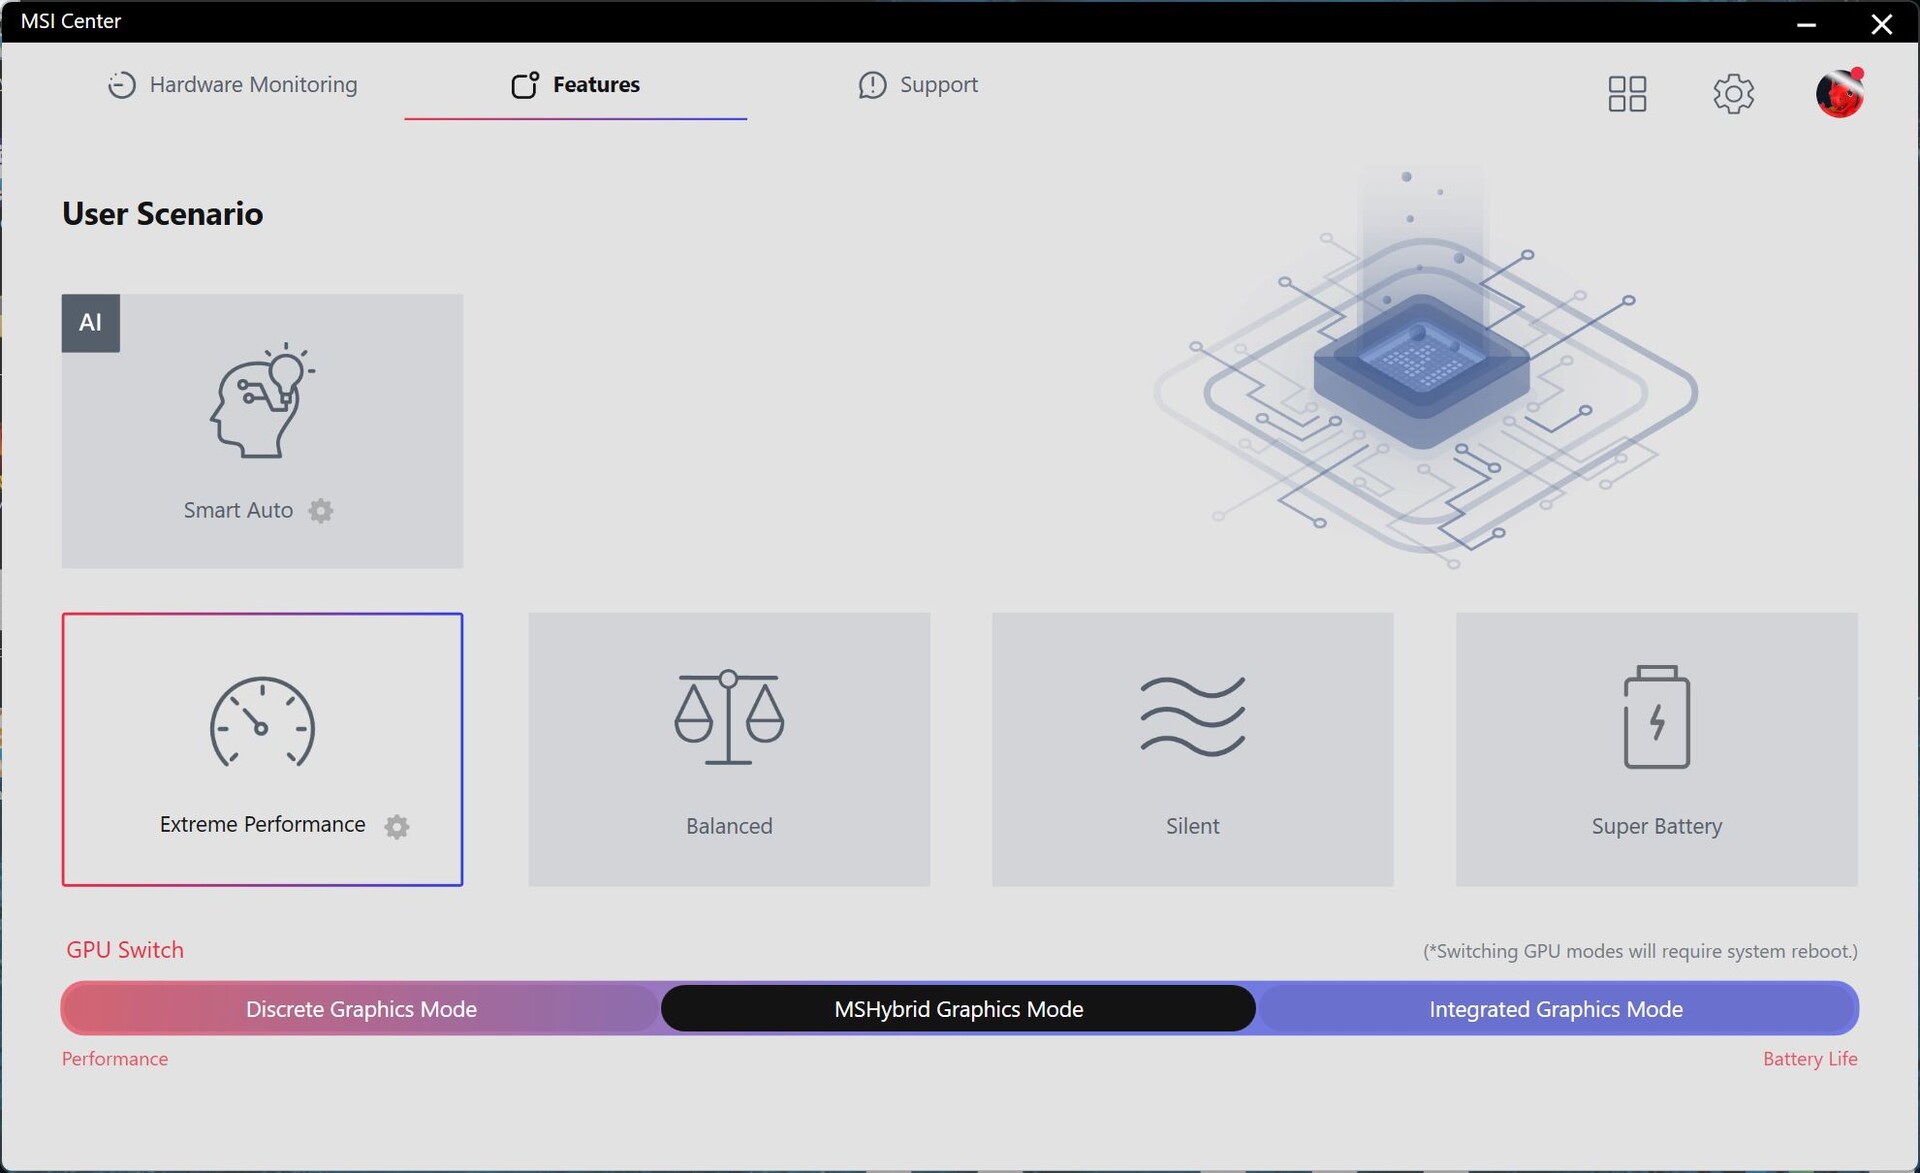
Det finns olika energiprofiler att välja mellan i det förinstallerade MSI Center. Smart Auto-läget är tänkt att dynamiskt anpassa prestandanivåerna i enlighet med den bärbara datorns krav med hjälp av några olika parametrar - i vårt test verkade resultaten inte alltid vara konsekventa. Som ett resultat bestämde vi oss för att använda energiläget Extreme Performance för våra riktmärken och mätningar, för att maximera prestandanivåerna - särskilt under perioder med kombinerad CPU/GPU-belastning. Vi använde profilen Balanserad för våra batteritester. Samtidigt var MSI:s Hybrid Graphics Mode alltid aktiverat, vilket växlar till den dedikerade Nvidia GPU:n vid behov. En MUX-kontroll är tillgänglig, men växling kräver en omstart. När det gäller priset skulle vi gärna ha sett att Advanced Optimus-tekniken användes här.
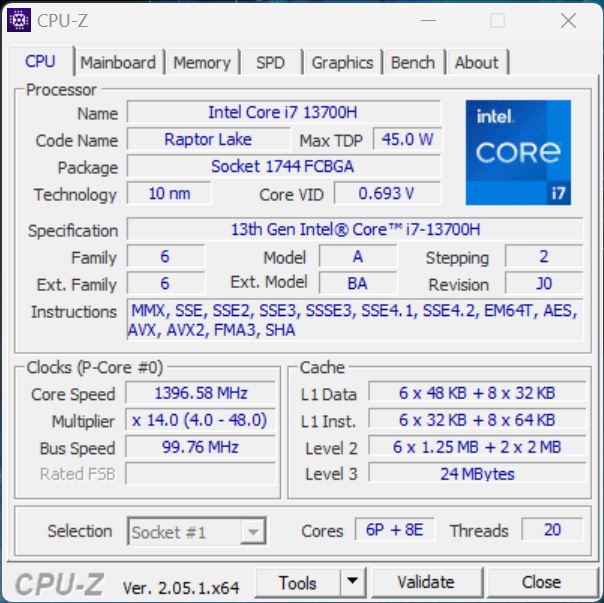
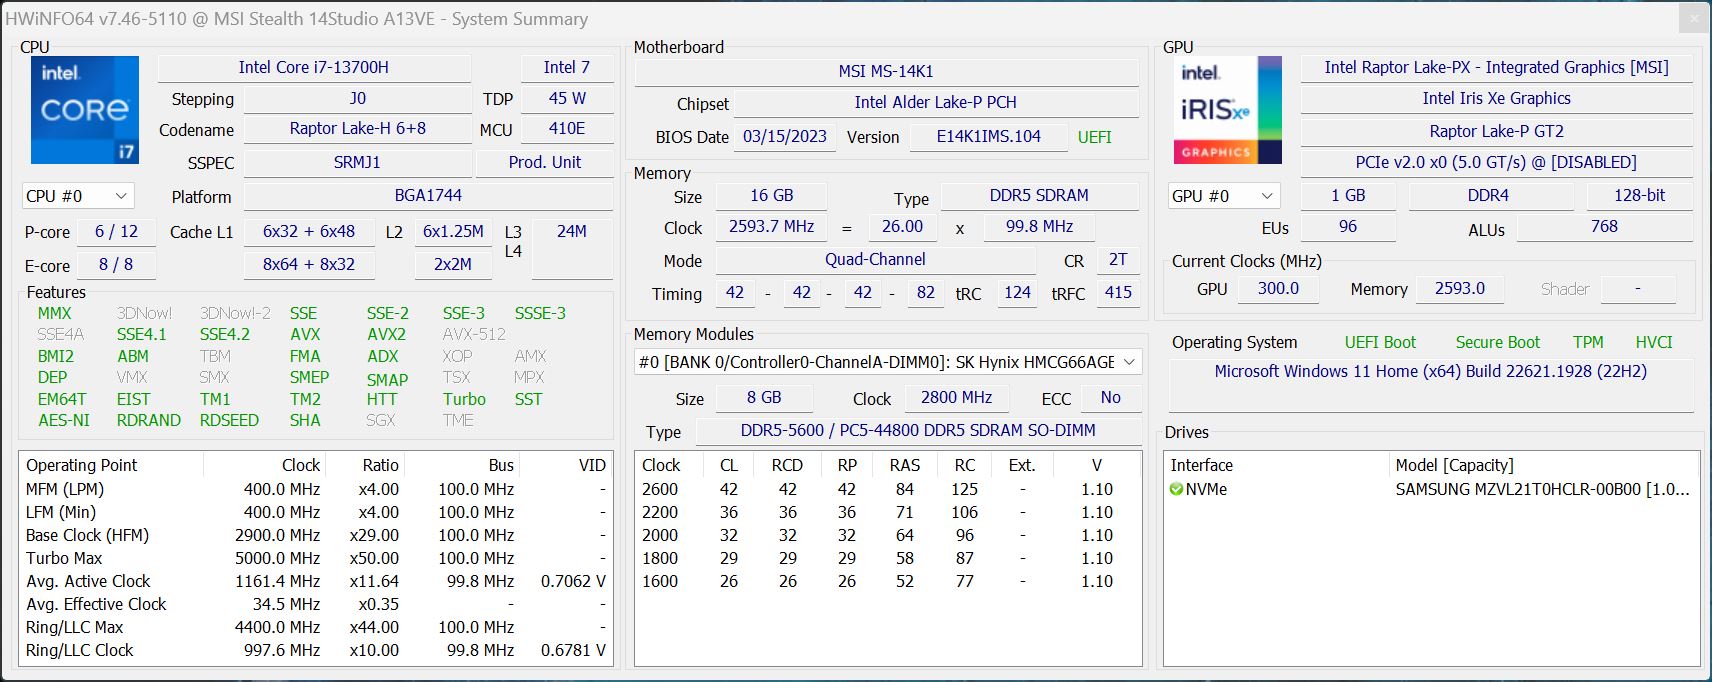
Processor - Core i7-13700H
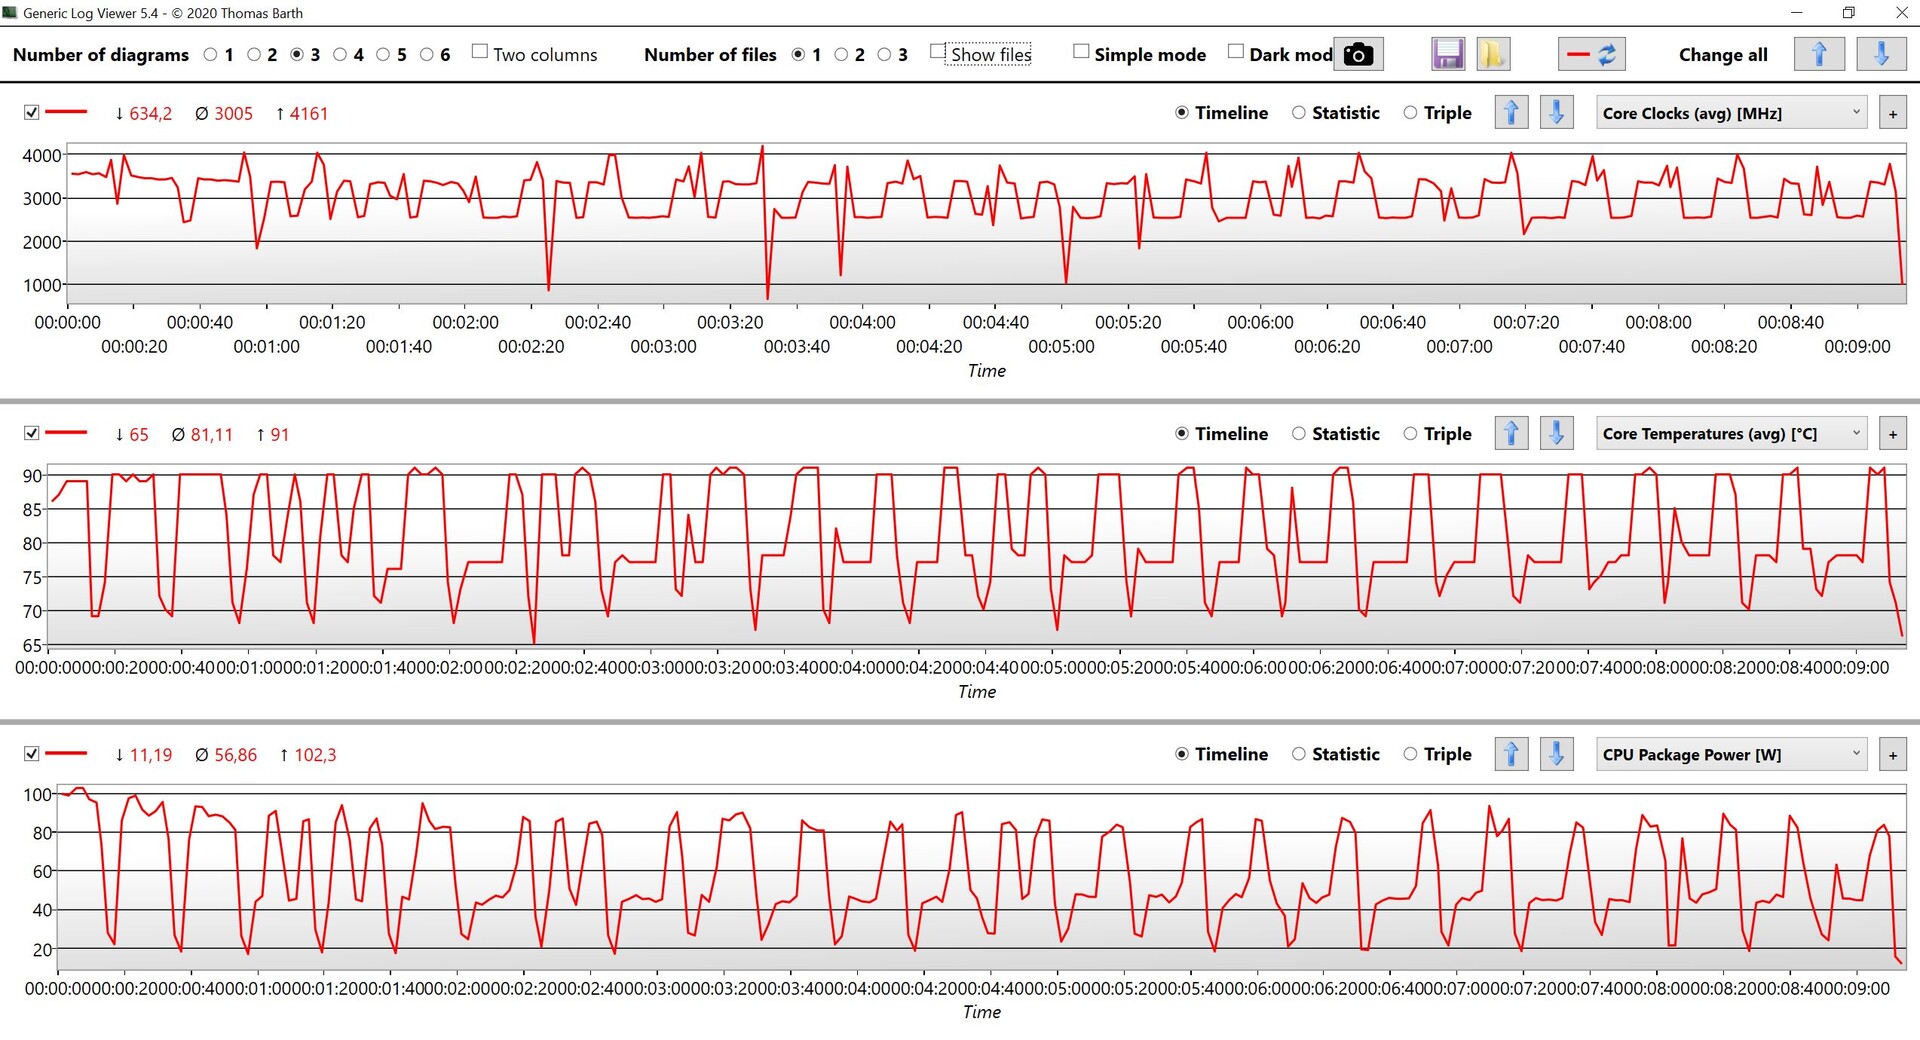
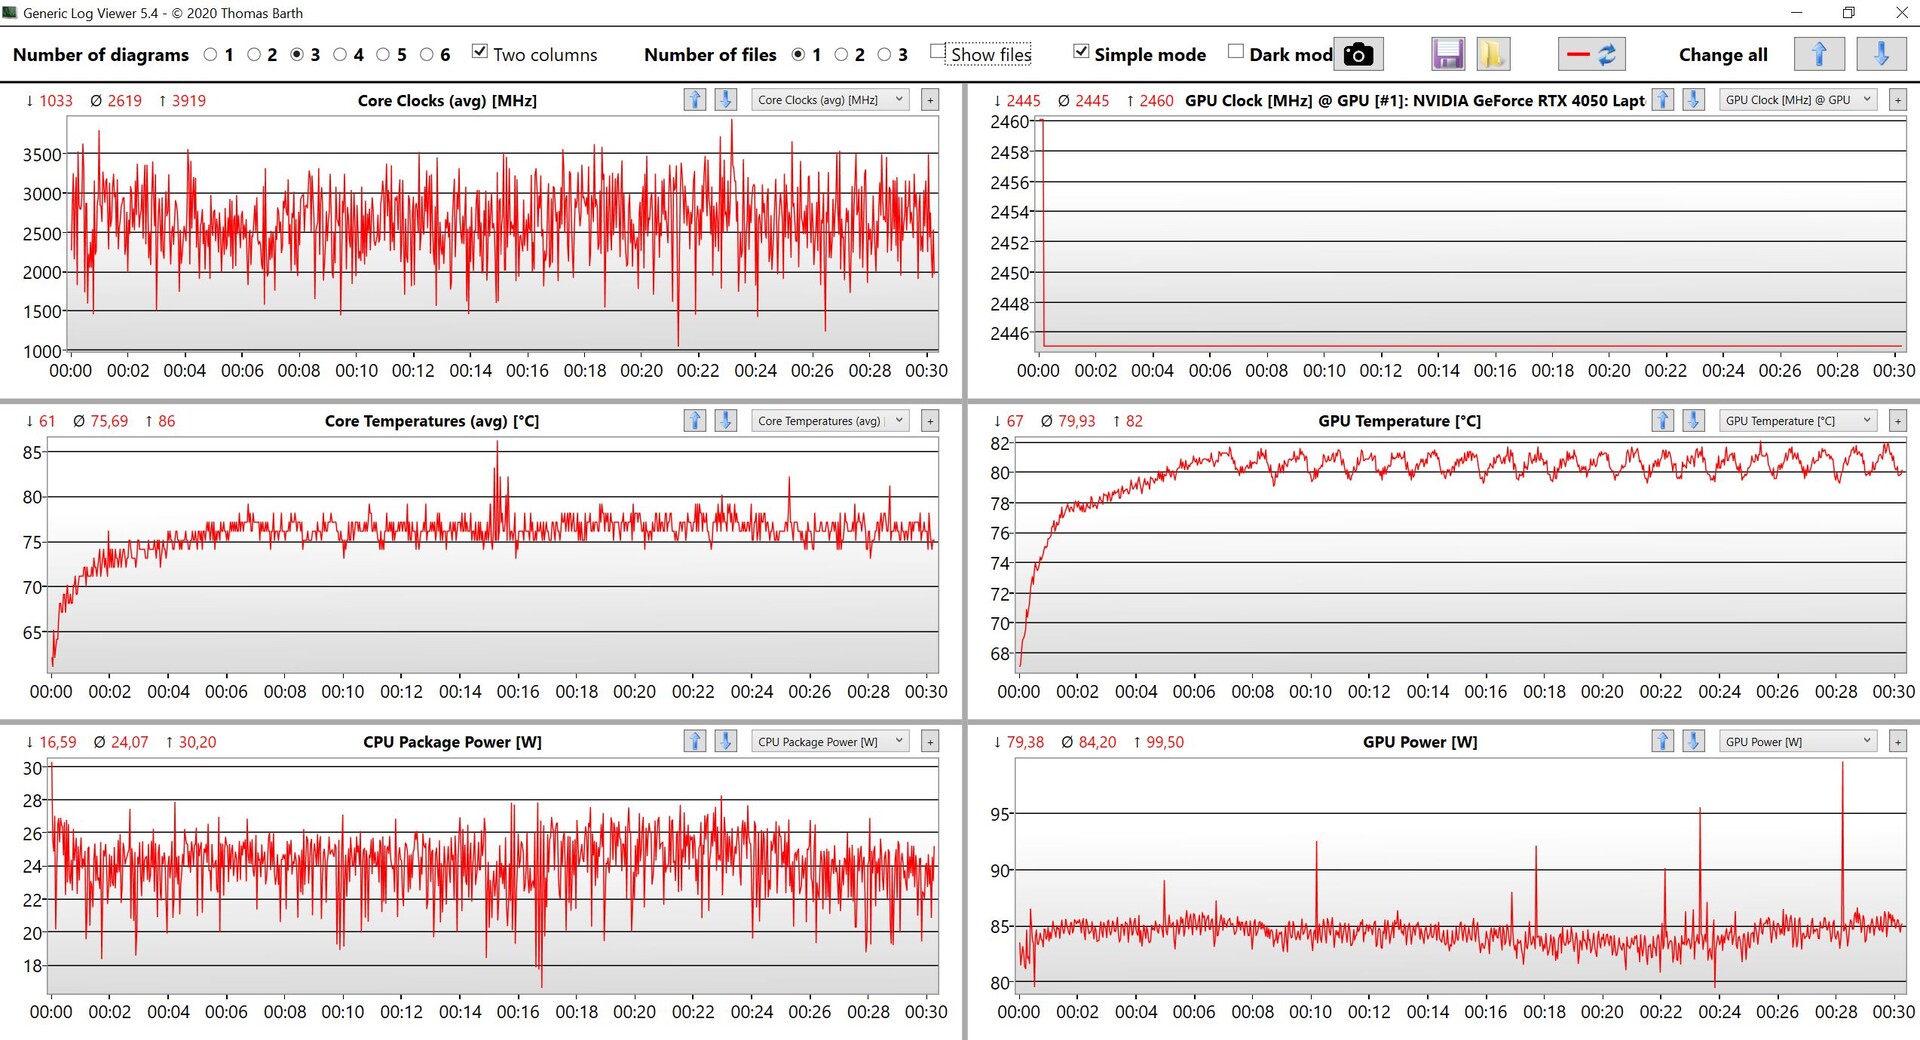
Stealth 14 Studio är utrustad med Intels nuvarande bröd-och-bröd-processor, deras Core i7-13700H- som är utformad för bärbara datorer för multimedia och spel. Den har 6 snabba prestandakärnor och 8 effektivitetskärnor, vilket innebär att den kan bearbeta totalt 20 trådar samtidigt. Jämfört med sin föregångare visar den bara små förbättringar, inklusive en något högre turboklocka. Dess effektutbyte är mycket bra, eftersom processorn förbrukar mycket energi. Vi uppmätte toppar på 115 watt och under kontinuerlig belastning förbrukar den bärbara datorn fortfarande lite mer än 80 watt - även om vi uppmätte vissa fluktuationer. I single-core-testerna uppfyllde den bärbara datorns prestanda inte riktigt våra förväntningar.
Vid batterianvändning reduceras prestandan för flerkärnighet avsevärt, eftersom processorn bara förbrukar maximalt 35 watt - vilket leder till ett underskott på cirka 33 %. Fler CPU-riktmärken kan hittas här.
Cinebench R15 Multi continuous test
Cinebench R23: Multi Core | Single Core
Cinebench R20: CPU (Multi Core) | CPU (Single Core)
Cinebench R15: CPU Multi 64Bit | CPU Single 64Bit
Blender: v2.79 BMW27 CPU
7-Zip 18.03: 7z b 4 | 7z b 4 -mmt1
Geekbench 5.5: Multi-Core | Single-Core
HWBOT x265 Benchmark v2.2: 4k Preset
LibreOffice : 20 Documents To PDF
R Benchmark 2.5: Overall mean
| CPU Performance rating | |
| Genomsnitt av klass Gaming | |
| Asus ROG Flow Z13 GZ301ZE | |
| Acer Predator Triton 300 SE | |
| Alienware x14 i7 RTX 3060 | |
| Gigabyte Aero 14 OLED BMF | |
| MSI Stealth 14 Studio A13V | |
| Genomsnitt Intel Core i7-13700H | |
| Schenker Vision 14 2022 RTX 3050 Ti | |
| Razer Blade 14 Ryzen 9 6900HX | |
| Cinebench R23 / Multi Core | |
| Genomsnitt av klass Gaming (10488 - 40970, n=113, senaste 2 åren) | |
| MSI Stealth 14 Studio A13V | |
| Acer Predator Triton 300 SE | |
| Alienware x14 i7 RTX 3060 | |
| Asus ROG Flow Z13 GZ301ZE | |
| Genomsnitt Intel Core i7-13700H (5890 - 20034, n=29) | |
| Schenker Vision 14 2022 RTX 3050 Ti | |
| Gigabyte Aero 14 OLED BMF | |
| Razer Blade 14 Ryzen 9 6900HX | |
| Cinebench R23 / Single Core | |
| Genomsnitt av klass Gaming (1166 - 2356, n=113, senaste 2 åren) | |
| Asus ROG Flow Z13 GZ301ZE | |
| Acer Predator Triton 300 SE | |
| Gigabyte Aero 14 OLED BMF | |
| Genomsnitt Intel Core i7-13700H (1323 - 1914, n=29) | |
| Alienware x14 i7 RTX 3060 | |
| Schenker Vision 14 2022 RTX 3050 Ti | |
| MSI Stealth 14 Studio A13V | |
| Razer Blade 14 Ryzen 9 6900HX | |
| Cinebench R20 / CPU (Multi Core) | |
| Genomsnitt av klass Gaming (4029 - 16108, n=112, senaste 2 åren) | |
| MSI Stealth 14 Studio A13V | |
| Acer Predator Triton 300 SE | |
| Alienware x14 i7 RTX 3060 | |
| Genomsnitt Intel Core i7-13700H (2322 - 7674, n=29) | |
| Schenker Vision 14 2022 RTX 3050 Ti | |
| Asus ROG Flow Z13 GZ301ZE | |
| Razer Blade 14 Ryzen 9 6900HX | |
| Gigabyte Aero 14 OLED BMF | |
| Cinebench R20 / CPU (Single Core) | |
| Genomsnitt av klass Gaming (442 - 895, n=112, senaste 2 åren) | |
| Asus ROG Flow Z13 GZ301ZE | |
| Acer Predator Triton 300 SE | |
| Gigabyte Aero 14 OLED BMF | |
| Schenker Vision 14 2022 RTX 3050 Ti | |
| Genomsnitt Intel Core i7-13700H (508 - 741, n=29) | |
| Alienware x14 i7 RTX 3060 | |
| MSI Stealth 14 Studio A13V | |
| Razer Blade 14 Ryzen 9 6900HX | |
| Cinebench R15 / CPU Multi 64Bit | |
| Genomsnitt av klass Gaming (1578 - 6271, n=113, senaste 2 åren) | |
| Asus ROG Flow Z13 GZ301ZE | |
| MSI Stealth 14 Studio A13V | |
| Alienware x14 i7 RTX 3060 | |
| Gigabyte Aero 14 OLED BMF | |
| Genomsnitt Intel Core i7-13700H (905 - 2982, n=29) | |
| Acer Predator Triton 300 SE | |
| Razer Blade 14 Ryzen 9 6900HX | |
| Schenker Vision 14 2022 RTX 3050 Ti | |
| Cinebench R15 / CPU Single 64Bit | |
| Genomsnitt av klass Gaming (188.8 - 343, n=112, senaste 2 åren) | |
| Asus ROG Flow Z13 GZ301ZE | |
| Acer Predator Triton 300 SE | |
| Gigabyte Aero 14 OLED BMF | |
| Schenker Vision 14 2022 RTX 3050 Ti | |
| Genomsnitt Intel Core i7-13700H (213 - 278, n=29) | |
| Alienware x14 i7 RTX 3060 | |
| Razer Blade 14 Ryzen 9 6900HX | |
| MSI Stealth 14 Studio A13V | |
| Blender / v2.79 BMW27 CPU | |
| Schenker Vision 14 2022 RTX 3050 Ti | |
| Gigabyte Aero 14 OLED BMF | |
| Genomsnitt Intel Core i7-13700H (169 - 555, n=29) | |
| Alienware x14 i7 RTX 3060 | |
| Razer Blade 14 Ryzen 9 6900HX | |
| Asus ROG Flow Z13 GZ301ZE | |
| Acer Predator Triton 300 SE | |
| MSI Stealth 14 Studio A13V | |
| Genomsnitt av klass Gaming (80 - 330, n=110, senaste 2 åren) | |
| 7-Zip 18.03 / 7z b 4 | |
| Genomsnitt av klass Gaming (33491 - 148086, n=111, senaste 2 åren) | |
| MSI Stealth 14 Studio A13V | |
| Alienware x14 i7 RTX 3060 | |
| Acer Predator Triton 300 SE | |
| Asus ROG Flow Z13 GZ301ZE | |
| Razer Blade 14 Ryzen 9 6900HX | |
| Genomsnitt Intel Core i7-13700H (27322 - 76344, n=29) | |
| Gigabyte Aero 14 OLED BMF | |
| Schenker Vision 14 2022 RTX 3050 Ti | |
| 7-Zip 18.03 / 7z b 4 -mmt1 | |
| Genomsnitt av klass Gaming (4199 - 7436, n=111, senaste 2 åren) | |
| Asus ROG Flow Z13 GZ301ZE | |
| Gigabyte Aero 14 OLED BMF | |
| Genomsnitt Intel Core i7-13700H (4825 - 6238, n=29) | |
| Razer Blade 14 Ryzen 9 6900HX | |
| Schenker Vision 14 2022 RTX 3050 Ti | |
| Alienware x14 i7 RTX 3060 | |
| Acer Predator Triton 300 SE | |
| MSI Stealth 14 Studio A13V | |
| Geekbench 5.5 / Multi-Core | |
| Genomsnitt av klass Gaming (6460 - 27010, n=111, senaste 2 åren) | |
| Asus ROG Flow Z13 GZ301ZE | |
| Alienware x14 i7 RTX 3060 | |
| MSI Stealth 14 Studio A13V | |
| Acer Predator Triton 300 SE | |
| Genomsnitt Intel Core i7-13700H (6165 - 14215, n=29) | |
| Schenker Vision 14 2022 RTX 3050 Ti | |
| Gigabyte Aero 14 OLED BMF | |
| Razer Blade 14 Ryzen 9 6900HX | |
| Geekbench 5.5 / Single-Core | |
| Genomsnitt av klass Gaming (986 - 2474, n=111, senaste 2 åren) | |
| Asus ROG Flow Z13 GZ301ZE | |
| Gigabyte Aero 14 OLED BMF | |
| Acer Predator Triton 300 SE | |
| Alienware x14 i7 RTX 3060 | |
| Genomsnitt Intel Core i7-13700H (1362 - 1919, n=29) | |
| Schenker Vision 14 2022 RTX 3050 Ti | |
| MSI Stealth 14 Studio A13V | |
| Razer Blade 14 Ryzen 9 6900HX | |
| HWBOT x265 Benchmark v2.2 / 4k Preset | |
| Genomsnitt av klass Gaming (11.5 - 44.3, n=111, senaste 2 åren) | |
| Acer Predator Triton 300 SE | |
| MSI Stealth 14 Studio A13V | |
| Razer Blade 14 Ryzen 9 6900HX | |
| Alienware x14 i7 RTX 3060 | |
| Asus ROG Flow Z13 GZ301ZE | |
| Genomsnitt Intel Core i7-13700H (6.72 - 21.2, n=29) | |
| Gigabyte Aero 14 OLED BMF | |
| Schenker Vision 14 2022 RTX 3050 Ti | |
| LibreOffice / 20 Documents To PDF | |
| MSI Stealth 14 Studio A13V | |
| Razer Blade 14 Ryzen 9 6900HX | |
| Genomsnitt av klass Gaming (19 - 88.8, n=111, senaste 2 åren) | |
| Genomsnitt Intel Core i7-13700H (31.3 - 62.4, n=29) | |
| Schenker Vision 14 2022 RTX 3050 Ti | |
| Asus ROG Flow Z13 GZ301ZE | |
| Acer Predator Triton 300 SE | |
| Gigabyte Aero 14 OLED BMF | |
| Alienware x14 i7 RTX 3060 | |
| R Benchmark 2.5 / Overall mean | |
| MSI Stealth 14 Studio A13V | |
| Razer Blade 14 Ryzen 9 6900HX | |
| Genomsnitt Intel Core i7-13700H (0.4308 - 0.607, n=29) | |
| Schenker Vision 14 2022 RTX 3050 Ti | |
| Alienware x14 i7 RTX 3060 | |
| Gigabyte Aero 14 OLED BMF | |
| Genomsnitt av klass Gaming (0.3439 - 0.759, n=112, senaste 2 åren) | |
| Acer Predator Triton 300 SE | |
| Asus ROG Flow Z13 GZ301ZE | |
* ... mindre är bättre
AIDA64: FP32 Ray-Trace | FPU Julia | CPU SHA3 | CPU Queen | FPU SinJulia | FPU Mandel | CPU AES | CPU ZLib | FP64 Ray-Trace | CPU PhotoWorxx
| Performance rating | |
| Genomsnitt av klass Gaming | |
| Razer Blade 14 Ryzen 9 6900HX | |
| Acer Predator Triton 300 SE | |
| MSI Stealth 14 Studio A13V | |
| Gigabyte Aero 14 OLED BMF | |
| Genomsnitt Intel Core i7-13700H | |
| Alienware x14 i7 RTX 3060 | |
| Schenker Vision 14 2022 RTX 3050 Ti | |
| Asus ROG Flow Z13 GZ301ZE | |
| AIDA64 / FP32 Ray-Trace | |
| Genomsnitt av klass Gaming (10227 - 85542, n=110, senaste 2 åren) | |
| MSI Stealth 14 Studio A13V | |
| Razer Blade 14 Ryzen 9 6900HX | |
| Acer Predator Triton 300 SE | |
| Genomsnitt Intel Core i7-13700H (4986 - 18908, n=29) | |
| Gigabyte Aero 14 OLED BMF | |
| Schenker Vision 14 2022 RTX 3050 Ti | |
| Alienware x14 i7 RTX 3060 | |
| Asus ROG Flow Z13 GZ301ZE | |
| AIDA64 / FPU Julia | |
| Genomsnitt av klass Gaming (51376 - 238426, n=110, senaste 2 åren) | |
| Razer Blade 14 Ryzen 9 6900HX | |
| MSI Stealth 14 Studio A13V | |
| Acer Predator Triton 300 SE | |
| Genomsnitt Intel Core i7-13700H (25360 - 92359, n=29) | |
| Gigabyte Aero 14 OLED BMF | |
| Schenker Vision 14 2022 RTX 3050 Ti | |
| Alienware x14 i7 RTX 3060 | |
| Asus ROG Flow Z13 GZ301ZE | |
| AIDA64 / CPU SHA3 | |
| Genomsnitt av klass Gaming (2180 - 9817, n=110, senaste 2 åren) | |
| MSI Stealth 14 Studio A13V | |
| Acer Predator Triton 300 SE | |
| Razer Blade 14 Ryzen 9 6900HX | |
| Genomsnitt Intel Core i7-13700H (1339 - 4224, n=29) | |
| Gigabyte Aero 14 OLED BMF | |
| Alienware x14 i7 RTX 3060 | |
| Schenker Vision 14 2022 RTX 3050 Ti | |
| Asus ROG Flow Z13 GZ301ZE | |
| AIDA64 / CPU Queen | |
| Genomsnitt av klass Gaming (49785 - 173351, n=101, senaste 2 åren) | |
| Acer Predator Triton 300 SE | |
| Gigabyte Aero 14 OLED BMF | |
| MSI Stealth 14 Studio A13V | |
| Asus ROG Flow Z13 GZ301ZE | |
| Razer Blade 14 Ryzen 9 6900HX | |
| Alienware x14 i7 RTX 3060 | |
| Genomsnitt Intel Core i7-13700H (59324 - 107159, n=29) | |
| Schenker Vision 14 2022 RTX 3050 Ti | |
| AIDA64 / FPU SinJulia | |
| Genomsnitt av klass Gaming (4424 - 33636, n=110, senaste 2 åren) | |
| Razer Blade 14 Ryzen 9 6900HX | |
| MSI Stealth 14 Studio A13V | |
| Acer Predator Triton 300 SE | |
| Alienware x14 i7 RTX 3060 | |
| Asus ROG Flow Z13 GZ301ZE | |
| Genomsnitt Intel Core i7-13700H (4800 - 11050, n=29) | |
| Gigabyte Aero 14 OLED BMF | |
| Schenker Vision 14 2022 RTX 3050 Ti | |
| AIDA64 / FPU Mandel | |
| Genomsnitt av klass Gaming (25115 - 128721, n=110, senaste 2 åren) | |
| Razer Blade 14 Ryzen 9 6900HX | |
| MSI Stealth 14 Studio A13V | |
| Acer Predator Triton 300 SE | |
| Genomsnitt Intel Core i7-13700H (12321 - 45118, n=29) | |
| Gigabyte Aero 14 OLED BMF | |
| Schenker Vision 14 2022 RTX 3050 Ti | |
| Alienware x14 i7 RTX 3060 | |
| Asus ROG Flow Z13 GZ301ZE | |
| AIDA64 / CPU AES | |
| Razer Blade 14 Ryzen 9 6900HX | |
| Acer Predator Triton 300 SE | |
| Gigabyte Aero 14 OLED BMF | |
| Genomsnitt av klass Gaming (39258 - 247074, n=110, senaste 2 åren) | |
| Alienware x14 i7 RTX 3060 | |
| Asus ROG Flow Z13 GZ301ZE | |
| MSI Stealth 14 Studio A13V | |
| Genomsnitt Intel Core i7-13700H (28769 - 151254, n=29) | |
| Schenker Vision 14 2022 RTX 3050 Ti | |
| AIDA64 / CPU ZLib | |
| Genomsnitt av klass Gaming (574 - 2531, n=110, senaste 2 åren) | |
| MSI Stealth 14 Studio A13V | |
| Acer Predator Triton 300 SE | |
| Alienware x14 i7 RTX 3060 | |
| Schenker Vision 14 2022 RTX 3050 Ti | |
| Genomsnitt Intel Core i7-13700H (389 - 1215, n=29) | |
| Asus ROG Flow Z13 GZ301ZE | |
| Razer Blade 14 Ryzen 9 6900HX | |
| Gigabyte Aero 14 OLED BMF | |
| AIDA64 / FP64 Ray-Trace | |
| Genomsnitt av klass Gaming (5509 - 45446, n=110, senaste 2 åren) | |
| MSI Stealth 14 Studio A13V | |
| Razer Blade 14 Ryzen 9 6900HX | |
| Acer Predator Triton 300 SE | |
| Genomsnitt Intel Core i7-13700H (2540 - 10135, n=29) | |
| Gigabyte Aero 14 OLED BMF | |
| Schenker Vision 14 2022 RTX 3050 Ti | |
| Alienware x14 i7 RTX 3060 | |
| Asus ROG Flow Z13 GZ301ZE | |
| AIDA64 / CPU PhotoWorxx | |
| Gigabyte Aero 14 OLED BMF | |
| Acer Predator Triton 300 SE | |
| Alienware x14 i7 RTX 3060 | |
| Genomsnitt av klass Gaming (12271 - 89891, n=110, senaste 2 åren) | |
| Asus ROG Flow Z13 GZ301ZE | |
| Genomsnitt Intel Core i7-13700H (12872 - 52727, n=29) | |
| MSI Stealth 14 Studio A13V | |
| Schenker Vision 14 2022 RTX 3050 Ti | |
| Razer Blade 14 Ryzen 9 6900HX | |
Systemets prestanda
Subjektivt (och föga förvånande) lämnade denna komponent ett stort intryck på oss när det gäller dess prestanda - även om vår testenhet bara uppnådde genomsnittliga resultat under de syntetiska riktmärkena. Vi noterade inga problem under testet.
CrossMark: Overall | Productivity | Creativity | Responsiveness
| PCMark 10 / Score | |
| Genomsnitt av klass Gaming (5828 - 11574, n=96, senaste 2 åren) | |
| Acer Predator Triton 300 SE | |
| Razer Blade 14 Ryzen 9 6900HX | |
| Gigabyte Aero 14 OLED BMF | |
| Genomsnitt Intel Core i7-13700H, NVIDIA GeForce RTX 4050 Laptop GPU (6822 - 7556, n=7) | |
| Alienware x14 i7 RTX 3060 | |
| MSI Stealth 14 Studio A13V | |
| Schenker Vision 14 2022 RTX 3050 Ti | |
| Asus ROG Flow Z13 GZ301ZE | |
| PCMark 10 / Essentials | |
| Gigabyte Aero 14 OLED BMF | |
| Acer Predator Triton 300 SE | |
| Razer Blade 14 Ryzen 9 6900HX | |
| Genomsnitt Intel Core i7-13700H, NVIDIA GeForce RTX 4050 Laptop GPU (10283 - 11549, n=7) | |
| Asus ROG Flow Z13 GZ301ZE | |
| Genomsnitt av klass Gaming (8810 - 12600, n=100, senaste 2 åren) | |
| Schenker Vision 14 2022 RTX 3050 Ti | |
| Alienware x14 i7 RTX 3060 | |
| MSI Stealth 14 Studio A13V | |
| PCMark 10 / Productivity | |
| Genomsnitt av klass Gaming (6845 - 18766, n=98, senaste 2 åren) | |
| Acer Predator Triton 300 SE | |
| Asus ROG Flow Z13 GZ301ZE | |
| Alienware x14 i7 RTX 3060 | |
| Gigabyte Aero 14 OLED BMF | |
| Genomsnitt Intel Core i7-13700H, NVIDIA GeForce RTX 4050 Laptop GPU (8368 - 9836, n=7) | |
| Razer Blade 14 Ryzen 9 6900HX | |
| Schenker Vision 14 2022 RTX 3050 Ti | |
| MSI Stealth 14 Studio A13V | |
| PCMark 10 / Digital Content Creation | |
| Genomsnitt av klass Gaming (7602 - 19657, n=98, senaste 2 åren) | |
| Razer Blade 14 Ryzen 9 6900HX | |
| Acer Predator Triton 300 SE | |
| MSI Stealth 14 Studio A13V | |
| Genomsnitt Intel Core i7-13700H, NVIDIA GeForce RTX 4050 Laptop GPU (9527 - 10643, n=7) | |
| Alienware x14 i7 RTX 3060 | |
| Gigabyte Aero 14 OLED BMF | |
| Schenker Vision 14 2022 RTX 3050 Ti | |
| Asus ROG Flow Z13 GZ301ZE | |
| CrossMark / Overall | |
| Asus ROG Flow Z13 GZ301ZE | |
| Genomsnitt av klass Gaming (1366 - 2409, n=98, senaste 2 åren) | |
| Acer Predator Triton 300 SE | |
| Alienware x14 i7 RTX 3060 | |
| Gigabyte Aero 14 OLED BMF | |
| MSI Stealth 14 Studio A13V | |
| Genomsnitt Intel Core i7-13700H, NVIDIA GeForce RTX 4050 Laptop GPU (1205 - 1937, n=9) | |
| Schenker Vision 14 2022 RTX 3050 Ti | |
| CrossMark / Productivity | |
| Asus ROG Flow Z13 GZ301ZE | |
| Acer Predator Triton 300 SE | |
| Genomsnitt av klass Gaming (1386 - 2254, n=98, senaste 2 åren) | |
| Alienware x14 i7 RTX 3060 | |
| Gigabyte Aero 14 OLED BMF | |
| Genomsnitt Intel Core i7-13700H, NVIDIA GeForce RTX 4050 Laptop GPU (1158 - 1877, n=9) | |
| MSI Stealth 14 Studio A13V | |
| Schenker Vision 14 2022 RTX 3050 Ti | |
| CrossMark / Creativity | |
| Genomsnitt av klass Gaming (1343 - 2729, n=98, senaste 2 åren) | |
| Asus ROG Flow Z13 GZ301ZE | |
| Acer Predator Triton 300 SE | |
| Alienware x14 i7 RTX 3060 | |
| Gigabyte Aero 14 OLED BMF | |
| MSI Stealth 14 Studio A13V | |
| Genomsnitt Intel Core i7-13700H, NVIDIA GeForce RTX 4050 Laptop GPU (1293 - 2044, n=9) | |
| Schenker Vision 14 2022 RTX 3050 Ti | |
| CrossMark / Responsiveness | |
| Asus ROG Flow Z13 GZ301ZE | |
| Acer Predator Triton 300 SE | |
| Alienware x14 i7 RTX 3060 | |
| Gigabyte Aero 14 OLED BMF | |
| Genomsnitt av klass Gaming (1226 - 2334, n=98, senaste 2 åren) | |
| Genomsnitt Intel Core i7-13700H, NVIDIA GeForce RTX 4050 Laptop GPU (1097 - 1929, n=9) | |
| MSI Stealth 14 Studio A13V | |
| Schenker Vision 14 2022 RTX 3050 Ti | |
| PCMark 10 Score | 6924 poäng | |
Hjälp | ||
| AIDA64 / Memory Copy | |
| Gigabyte Aero 14 OLED BMF | |
| Alienware x14 i7 RTX 3060 | |
| Asus ROG Flow Z13 GZ301ZE | |
| Acer Predator Triton 300 SE | |
| Genomsnitt av klass Gaming (21750 - 129946, n=110, senaste 2 åren) | |
| Genomsnitt Intel Core i7-13700H (24334 - 78081, n=29) | |
| MSI Stealth 14 Studio A13V | |
| Razer Blade 14 Ryzen 9 6900HX | |
| Schenker Vision 14 2022 RTX 3050 Ti | |
| AIDA64 / Memory Read | |
| Gigabyte Aero 14 OLED BMF | |
| Alienware x14 i7 RTX 3060 | |
| Acer Predator Triton 300 SE | |
| Genomsnitt av klass Gaming (22956 - 118858, n=110, senaste 2 åren) | |
| Asus ROG Flow Z13 GZ301ZE | |
| MSI Stealth 14 Studio A13V | |
| Genomsnitt Intel Core i7-13700H (23681 - 79656, n=29) | |
| Razer Blade 14 Ryzen 9 6900HX | |
| Schenker Vision 14 2022 RTX 3050 Ti | |
| AIDA64 / Memory Write | |
| Gigabyte Aero 14 OLED BMF | |
| Genomsnitt av klass Gaming (22297 - 135096, n=110, senaste 2 åren) | |
| Genomsnitt Intel Core i7-13700H (22986 - 99898, n=29) | |
| Alienware x14 i7 RTX 3060 | |
| Acer Predator Triton 300 SE | |
| Asus ROG Flow Z13 GZ301ZE | |
| Razer Blade 14 Ryzen 9 6900HX | |
| MSI Stealth 14 Studio A13V | |
| Schenker Vision 14 2022 RTX 3050 Ti | |
| AIDA64 / Memory Latency | |
| Alienware x14 i7 RTX 3060 | |
| Genomsnitt av klass Gaming (75.3 - 259, n=110, senaste 2 åren) | |
| Asus ROG Flow Z13 GZ301ZE | |
| Acer Predator Triton 300 SE | |
| Genomsnitt Intel Core i7-13700H (82.4 - 136.8, n=29) | |
| Gigabyte Aero 14 OLED BMF | |
| Schenker Vision 14 2022 RTX 3050 Ti | |
| MSI Stealth 14 Studio A13V | |
| Razer Blade 14 Ryzen 9 6900HX | |
* ... mindre är bättre
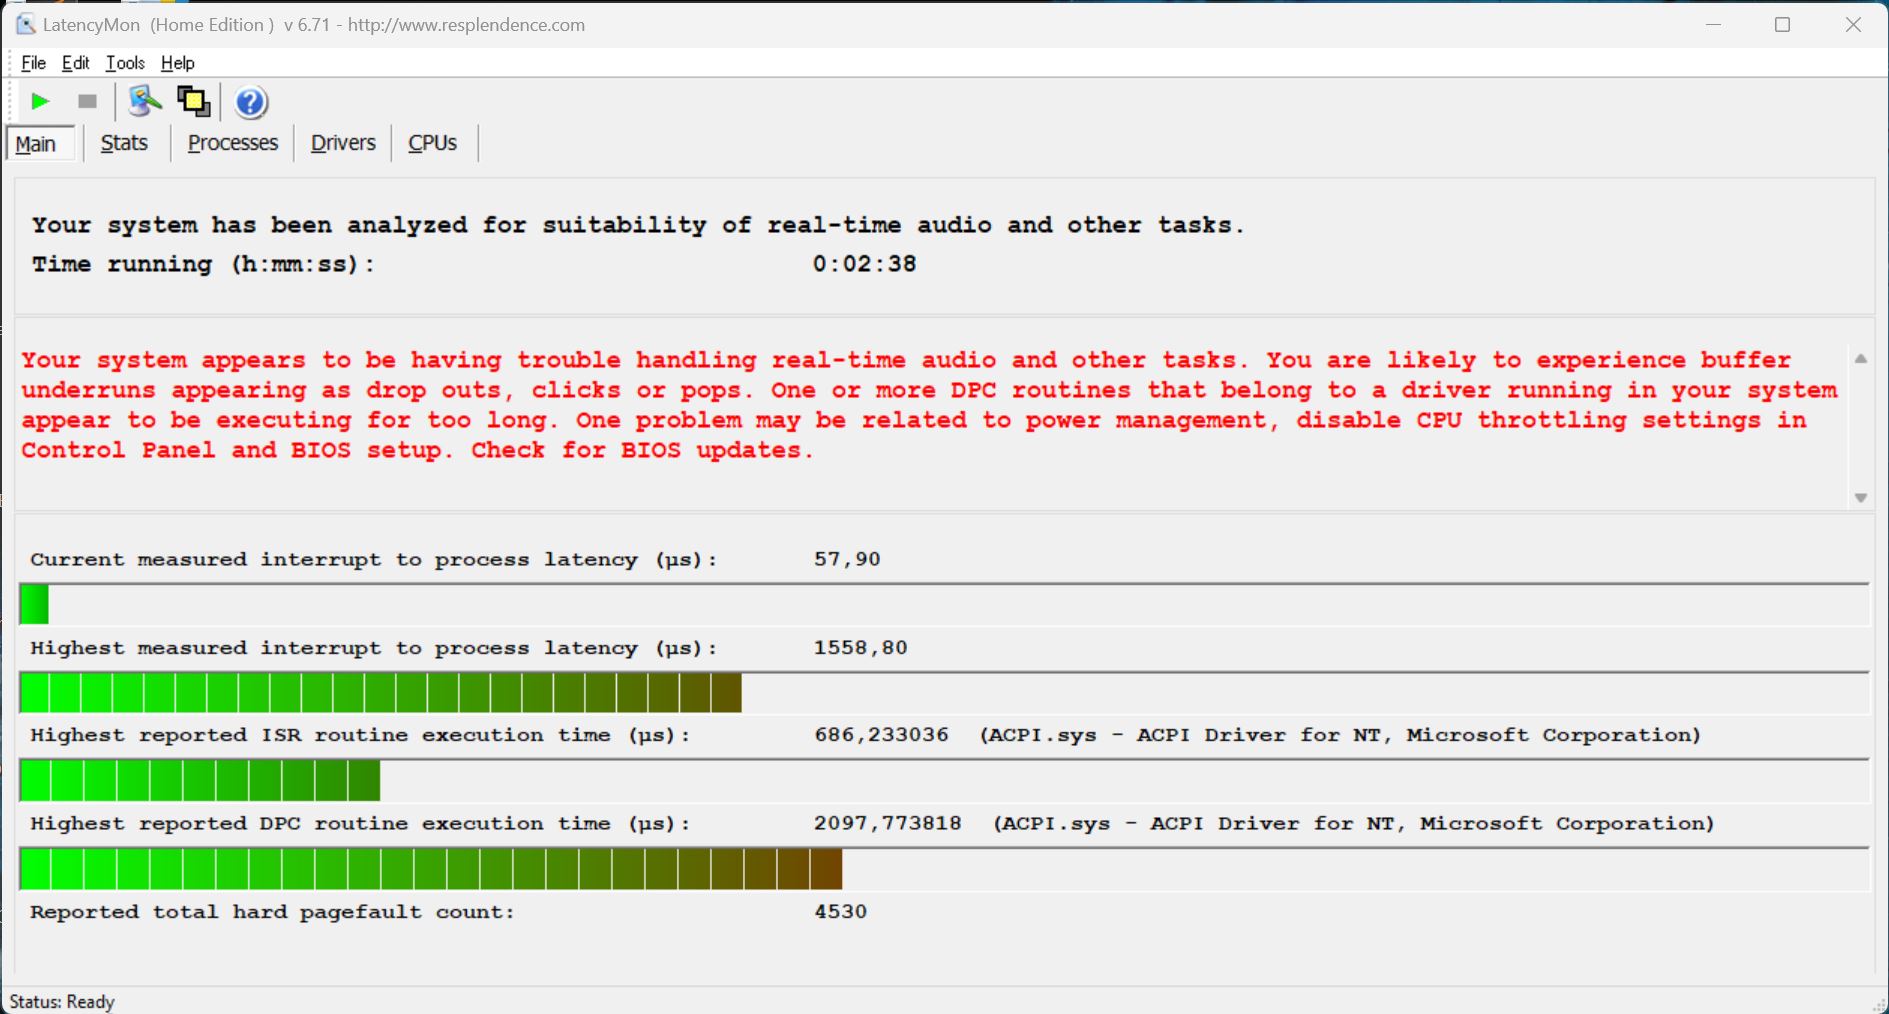
DPC-fördröjning
Vår testenhet är endast delvis lämplig för realtidsljudanvändning med den nuvarande BIOS-versionen, eftersom vårt standardiserade latens-test (surfning på internet, 4K YouTube-uppspelning, CPU-belastning) flaggade för några mindre problem.
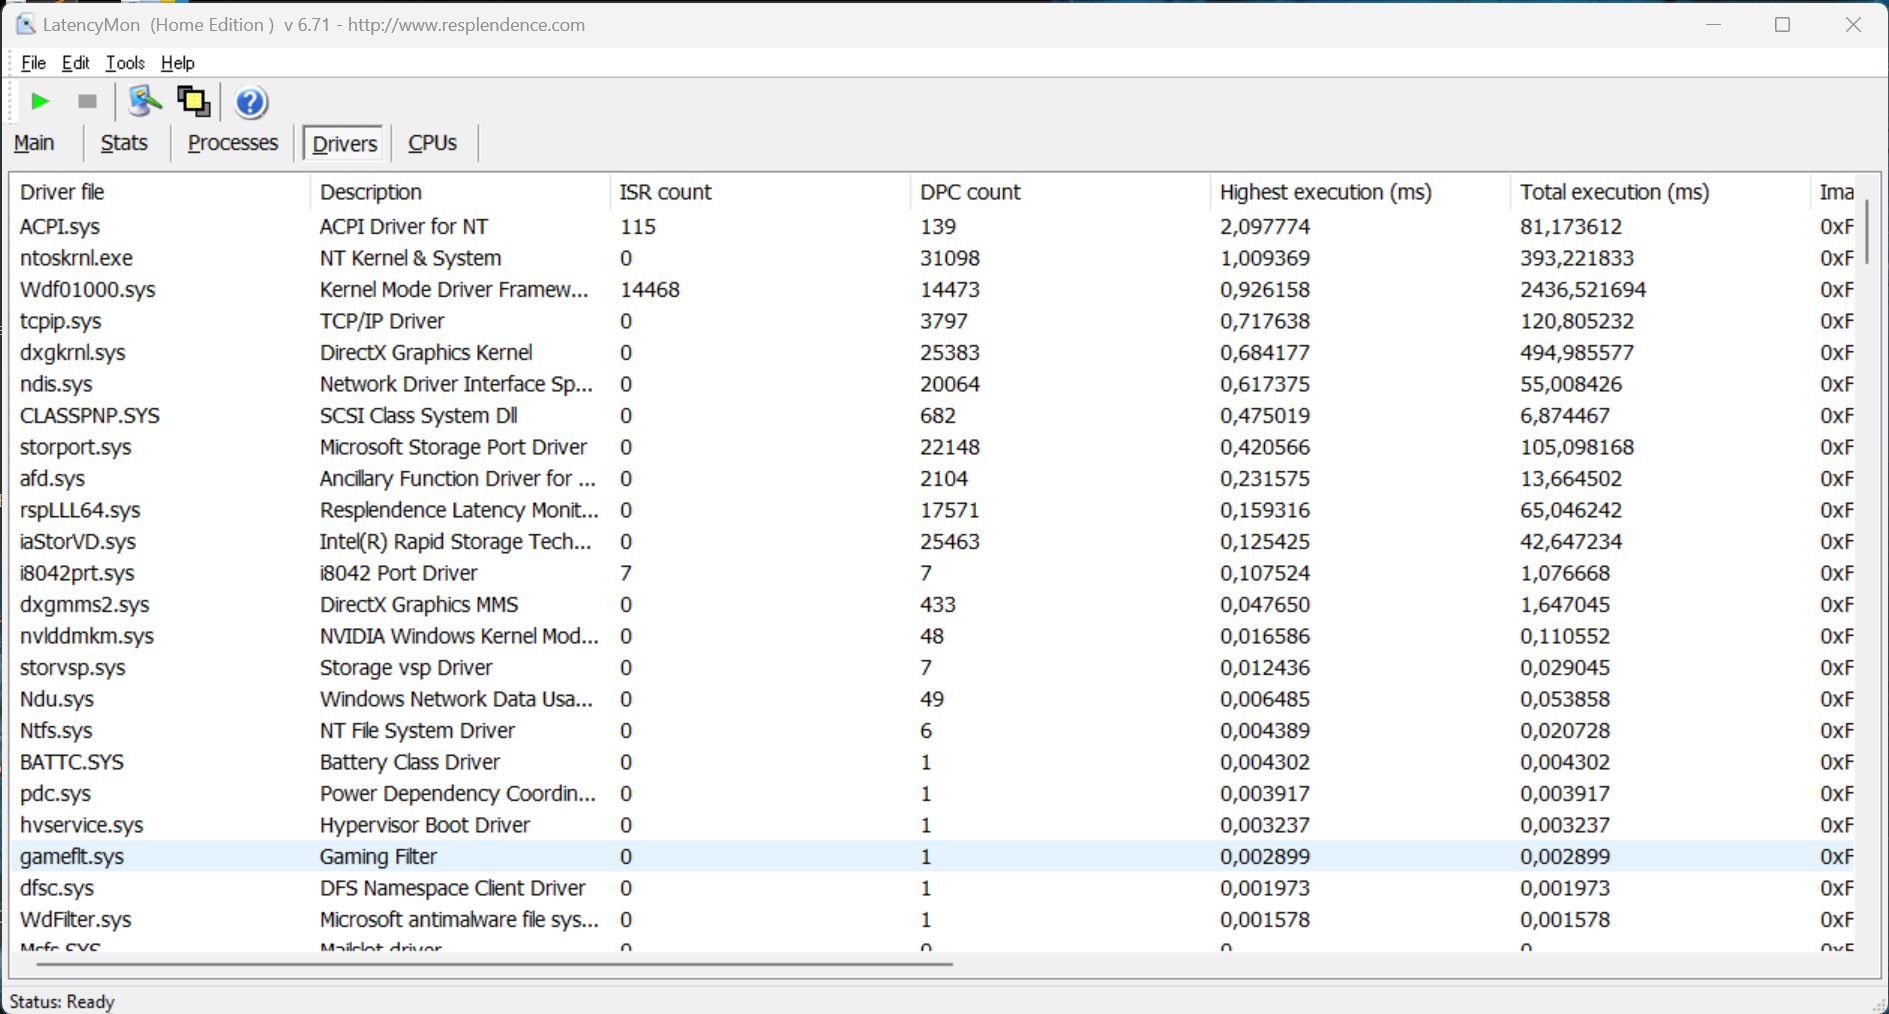
| DPC Latencies / LatencyMon - interrupt to process latency (max), Web, Youtube, Prime95 | |
| Acer Predator Triton 300 SE | |
| Gigabyte Aero 14 OLED BMF | |
| MSI Stealth 14 Studio A13V | |
| Asus ROG Flow Z13 GZ301ZE | |
| Razer Blade 14 Ryzen 9 6900HX | |
| Alienware x14 i7 RTX 3060 | |
| Schenker Vision 14 2022 RTX 3050 Ti | |
* ... mindre är bättre
Lagringsenheter
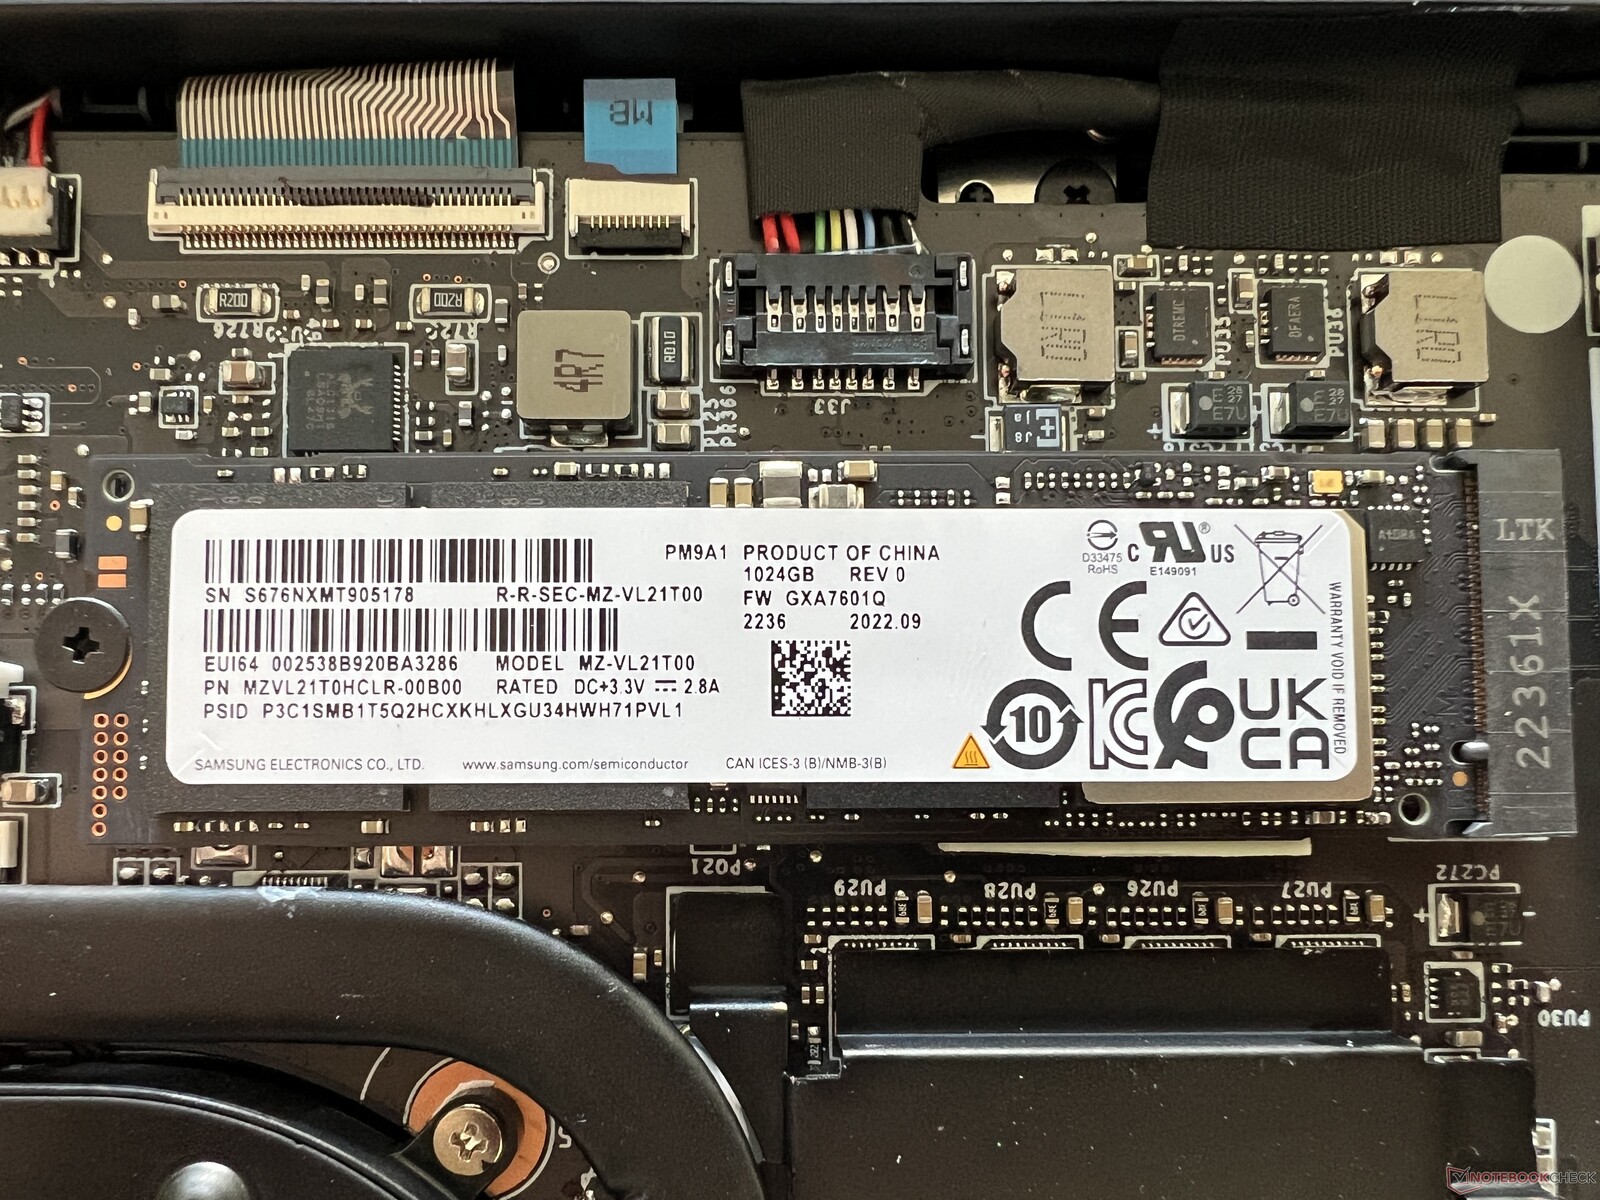
Vårt testexemplar är utrustat med 1-TB-versionen av Samsung PM9A1. Detta är en snabb PCIe 4.0-enhet och överföringshastigheterna i våra riktmärken var ganska bra, med resultat på upp till 7 GB/s - men dess prestanda förblev inte stabil. Efter några minuter var SSD-enheten tvungen att strypa sin prestanda med cirka 50 %, vilket egentligen inte borde vara så märkbart vid daglig användning. Det faktum att SSD-enheten är placerad precis bredvid värmeröret kan säkert inte vara bra för SSD-enhetens temperaturer. Ytterligare SSD-benchmarks kan hittashär.

* ... mindre är bättre
Reading continuous performance: DiskSpd Read Loop, Queue Depth 8
Grafikkort - GeForce RTX 4050 Laptop
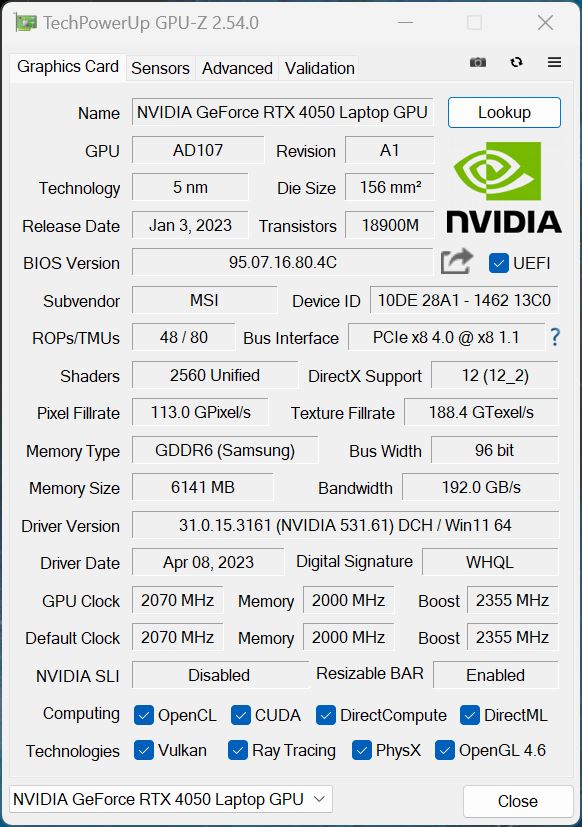
Som redan nämnts kan Stealth 14 Studio ha en MUX-kontroll med vilken du helt kan inaktivera den integrerade GPU, men detta kräver en omstart som kan bli irriterande under daglig användning vid någon tidpunkt. Vi skulle ha föredragit att se Nvidias Advanced Optimus-teknik. Som ett resultat förlitade vi oss på den normala metoden för att byta grafik via Optimus. DenGeForce RTX 4050 bärbar datorär Nvidias nya mellanklass-GPU och i motsats till många andra aktuella bärbara multimediadatorer (oftast med TGP på mellan 40 och 50 watt) används en av de snabbaste varianterna, med en TGP på 90 watt.
Därefter var den bärbara datorns riktmärkesresultat därefter bra och ungefär på samma nivå somRTX 3060iAcer Predator Triton 300 SE. Vi inkluderade också ytterligare modeller medRTX 4060ochRTX 4070 bärbar datoroch som har liknande TGP-värden i vår jämförelse, så att vi kunde få en bättre uppfattning om hur bra de snabbare modellerna av Stealth 14 Studio skulle kunna prestera. I allmänhet kan du förvänta dig cirka 20 - 35 % bättre grafikprestanda.
Under kontinuerlig belastning förblev grafikprestandan stabil, men under batterianvändning förbrukade GPU:n endast 35 watt, vilket innebär att GPU-prestandan i genomsnitt sjunker med cirka 35 % om du inte är ansluten till ett eluttag. Ytterligare GPU-riktmärken finns i vår teknikavsnitt.
| 3DMark 11 Performance | 26475 poäng | |
| 3DMark Cloud Gate Standard Score | 48584 poäng | |
| 3DMark Fire Strike Score | 19121 poäng | |
| 3DMark Time Spy Score | 7845 poäng | |
Hjälp | ||
| Blender / v3.3 Classroom OPTIX/RTX | |
| Schenker Vision 14 2022 RTX 3050 Ti | |
| Acer Predator Triton 300 SE | |
| Gigabyte Aero 14 OLED BMF | |
| Genomsnitt NVIDIA GeForce RTX 4050 Laptop GPU (25 - 37, n=40) | |
| MSI Stealth 14 Studio A13V | |
| Genomsnitt av klass Gaming (9 - 32, n=112, senaste 2 åren) | |
| Blender / v3.3 Classroom CUDA | |
| Schenker Vision 14 2022 RTX 3050 Ti | |
| Gigabyte Aero 14 OLED BMF | |
| Acer Predator Triton 300 SE | |
| Genomsnitt NVIDIA GeForce RTX 4050 Laptop GPU (47 - 68, n=39) | |
| Genomsnitt av klass Gaming (15 - 228, n=112, senaste 2 åren) | |
| Blender / v3.3 Classroom CPU | |
| Schenker Vision 14 2022 RTX 3050 Ti | |
| Gigabyte Aero 14 OLED BMF | |
| Genomsnitt NVIDIA GeForce RTX 4050 Laptop GPU (243 - 907, n=40) | |
| Acer Predator Triton 300 SE | |
| MSI Stealth 14 Studio A13V | |
| Genomsnitt av klass Gaming (122 - 565, n=108, senaste 2 åren) | |
* ... mindre är bättre
Spelprestanda
Stealth 14 Studios faktiska spelprestanda ligger före konkurrenten Gigabyte Aero 14, som också är utrustad med RTX 4050 Laptop. I sin tur är den gamlaRTX 3060(t.ex.Alienware x14,Acer Triton 300 SE) har en klar fördel när det gäller att spela spel. Detsamma kan naturligtvis sägas för de snabbare GPU: ernaRTX 4060 bärbar datorochRTX 4070 bärbar dator. I allmänhet kan du spela de flesta spel smidigt i QHD med RTX 4050 Laptop - bara några få mer komplexa spel kan kräva att du sänker inställningarna för detaljer/upplösning eller använder uppsamplingsteknik som DLSS (om spelet stöder detta). Detsamma gäller för strålspårning, för vilket RTX 4050 Laptop annars inte skulle vara tillräckligt kraftfull. Dessutom måste du notera att särskilt i högre upplösningar är den bärbara datorns lilla 6-GB grafikminne inte helt framtidssäkert. På samma sätt som i de rena GPU-testerna förblev Stealth 14 Studios spelprestanda också helt stabil under längre sessioner.
| F1 2021 - 1920x1080 Ultra High Preset + Raytracing AA:T AF:16x | |
| MSI Katana 17 B13VFK (874931) | |
| Asus Zenbook Pro 14 OLED UX6404VI (874931) | |
| MSI Stealth 14 Studio A13V (874931) | |
| Genomsnitt NVIDIA GeForce RTX 4050 Laptop GPU (70.7 - 119.5, n=7) | |
| Alienware x14 i7 RTX 3060 | |
| Schenker Vision 14 2022 RTX 3050 Ti (874931) | |
| Asus ROG Flow Z13 GZ301ZE (843175) | |
| F1 22 - 1920x1080 Ultra High Preset AA:T AF:16x | |
| Razer Blade 14 RTX 4070 (959964) | |
| Genomsnitt av klass Gaming (40.1 - 121.2, n=5, senaste 2 åren) | |
| Asus Zenbook Pro 14 OLED UX6404VI (959964) | |
| MSI Katana 17 B13VFK (946728) | |
| MSI Stealth 14 Studio A13V (959964) | |
| Genomsnitt NVIDIA GeForce RTX 4050 Laptop GPU (10.9 - 56.4, n=24) | |
| Gigabyte Aero 14 OLED BMF (959964) | |
| Schenker Vision 14 2022 RTX 3050 Ti (923650) | |
| Call of Duty Modern Warfare 2 2022 - 1920x1080 Extreme Quality Preset AA:T2X Filmic SM | |
| Razer Blade 14 RTX 4070 | |
| MSI Katana 17 B13VFK | |
| MSI Stealth 14 Studio A13V | |
| Genomsnitt NVIDIA GeForce RTX 4050 Laptop GPU (54 - 77, n=3) | |
Witcher 3 FPS diagram
| låg | med. | hög | ultra | QHD | 4K | |
|---|---|---|---|---|---|---|
| GTA V (2015) | 161.7 | 142.4 | 55.9 | 55.7 | ||
| The Witcher 3 (2015) | 168.5 | 121.7 | 76.7 | |||
| Dota 2 Reborn (2015) | 172.1 | 157.1 | 142.8 | 135.3 | 101.2 | |
| Final Fantasy XV Benchmark (2018) | 180.2 | 116.2 | 82 | 59.7 | ||
| X-Plane 11.11 (2018) | 141.6 | 124.7 | 97.8 | |||
| Strange Brigade (2018) | 277 | 191.9 | 145.3 | 123.1 | 79.8 | |
| Shadow of the Tomb Raider (2018) | 102 | 95 | 86 | 60 | ||
| F1 2021 (2021) | 323 | 245 | 194.5 | 105.4 | 74.3 | |
| Cyberpunk 2077 1.6 (2022) | 72.78 | 60.72 | 57.77 | 37.66 | ||
| F1 22 (2022) | 156.5 | 149.6 | 133.6 | 48.4 | 29.9 | |
| Call of Duty Modern Warfare 2 2022 (2022) | 101 | 75 | 70 | 47 |
Utsläpp - Ångkammare med måttlig framgång
Utsläpp av buller
Den bärbara datorns kylsystem består av en stor ångkammare samt två fläktar som blir särskilt irriterande under daglig användning. Under låg belastning och ibland till och med i viloläge noterade vi surrande ljud upp till nästan 34 dB(A), vilket definitivt kan höras. Ibland noterade vi även korta toppar på mer än 40 dB(A) när fläktarna startade, vilket är helt onödigt. Under belastning var Extreme Performance-läget det mest högljudda, med 51 dB(A) - även om de 47 dB(A) vi uppmätte med Balanced-läget inte är särskilt mycket tystare. Vi rekommenderar definitivt att du använder hörlurar när du spelar. Vi noterade inga andra elektroniska ljud.
| Använd | Tyst | Balanserad | Extrem prestanda |
|---|---|---|---|
| 3DMark 06 | 36,6 dB(A) | 42,2 dB(A) | 42,2 dB(A) |
| Witcher 3 | 42.2 dB(A) | 47,3 dB(A) | 51 dB(A) |
| Stresstest | 42,2 dB(A) | 47,3 dB(A) | 51 dB(A) |
Ljudnivå
| Låg belastning |
| 25.3 / 25 / 33.7 dB(A) |
| Hög belastning |
| 42.2 / 51 dB(A) |
 | ||
30 dB tyst 40 dB(A) hörbar 50 dB(A) högt ljud |
||
min: | ||
| MSI Stealth 14 Studio A13V GeForce RTX 4050 Laptop GPU, i7-13700H, Samsung PM9A1 MZVL21T0HCLR | Gigabyte Aero 14 OLED BMF GeForce RTX 4050 Laptop GPU, i7-13700H, Gigabyte AG470S1TB-SI B10 | Schenker Vision 14 2022 RTX 3050 Ti GeForce RTX 3050 Ti Laptop GPU, i7-12700H, Samsung SSD 980 Pro 1TB MZ-V8P1T0BW | Asus ROG Flow Z13 GZ301ZE GeForce RTX 3050 Ti Laptop GPU, i9-12900H, Micron 2450 1TB MTFDKBK1T0TFK | Alienware x14 i7 RTX 3060 GeForce RTX 3060 Laptop GPU, i7-12700H, WDC PC SN810 1TB | Razer Blade 14 Ryzen 9 6900HX GeForce RTX 3070 Ti Laptop GPU, R9 6900HX, Samsung PM9A1 MZVL21T0HCLR | Acer Predator Triton 300 SE GeForce RTX 3060 Laptop GPU, i9-12900H, Micron 3400 1TB MTFDKBA1T0TFH | |
|---|---|---|---|---|---|---|---|
| Noise | 5% | 5% | 11% | 2% | 15% | -2% | |
| av / miljö * (dB) | 25.3 | 24 5% | 24.4 4% | 24.5 3% | 24.7 2% | 23.3 8% | 23.8 6% |
| Idle Minimum * (dB) | 25.3 | 24 5% | 24.4 4% | 24.5 3% | 24.7 2% | 23.3 8% | 23.8 6% |
| Idle Average * (dB) | 25 | 24 4% | 24.4 2% | 24.5 2% | 24.7 1% | 23.3 7% | 23.8 5% |
| Idle Maximum * (dB) | 33.7 | 35.71 -6% | 27.8 18% | 24.5 27% | 30.9 8% | 23.3 31% | 30.6 9% |
| Load Average * (dB) | 42.2 | 43.3 -3% | 41 3% | 40 5% | 34.7 18% | 44.2 -5% | |
| Witcher 3 ultra * (dB) | 51 | 40.22 21% | 48.2 5% | 41 20% | 51.5 -1% | 42.1 17% | 60.1 -18% |
| Load Maximum * (dB) | 51 | 51.93 -2% | 48.8 4% | 41 20% | 51.5 -1% | 42.1 17% | 60 -18% |
* ... mindre är bättre
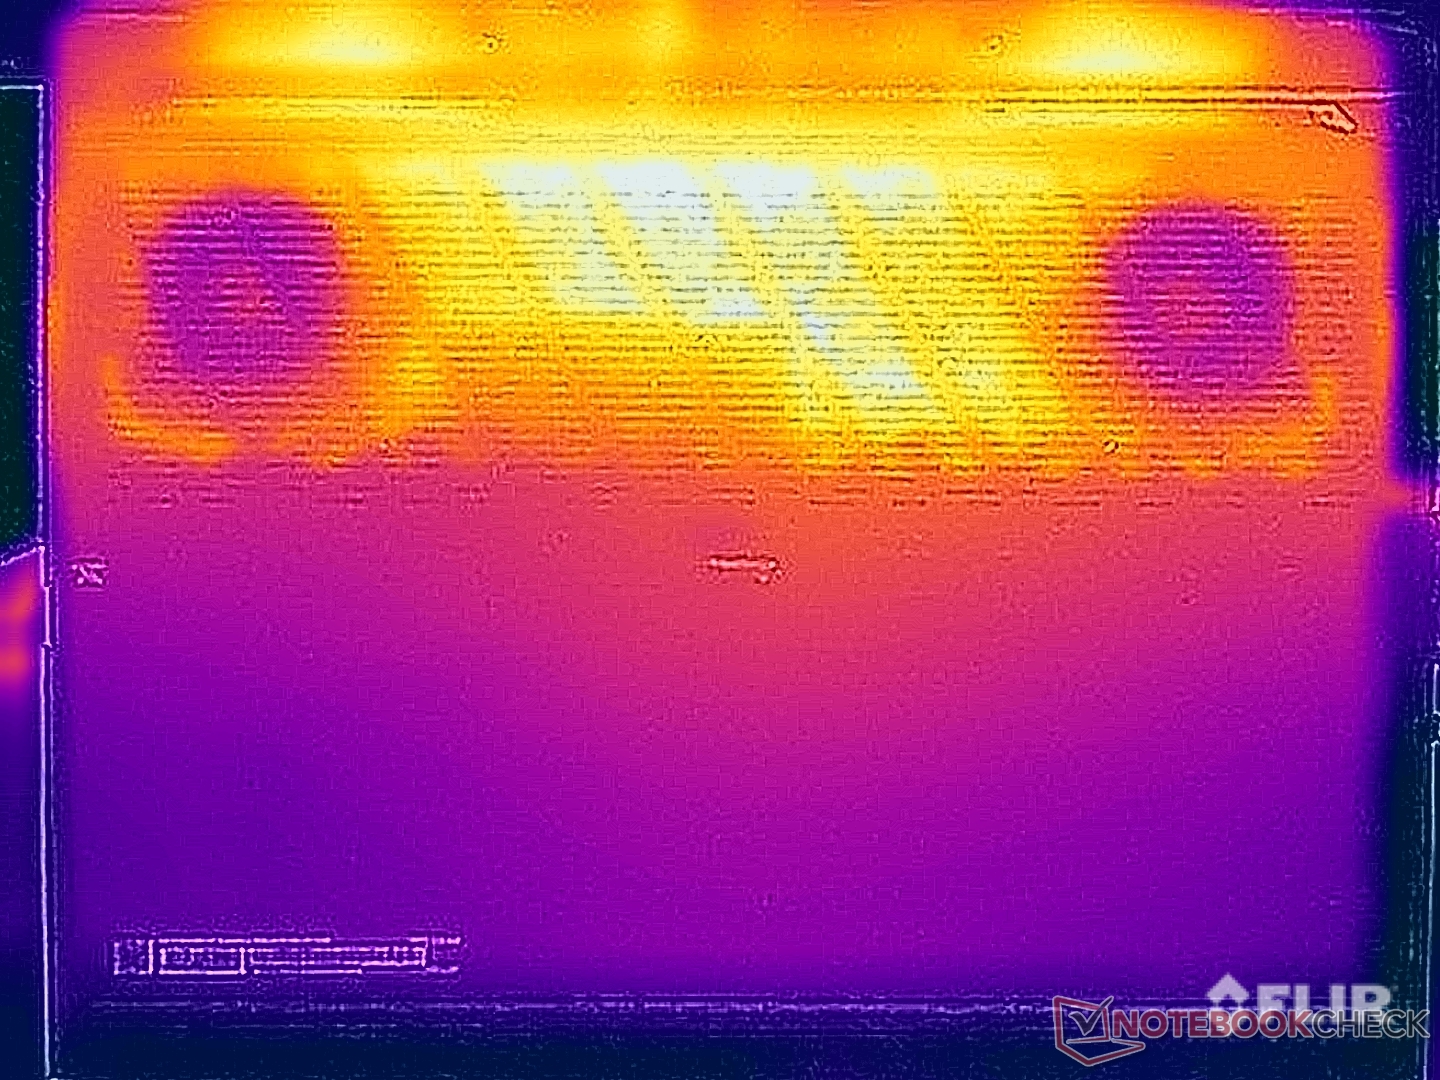
Temperatur
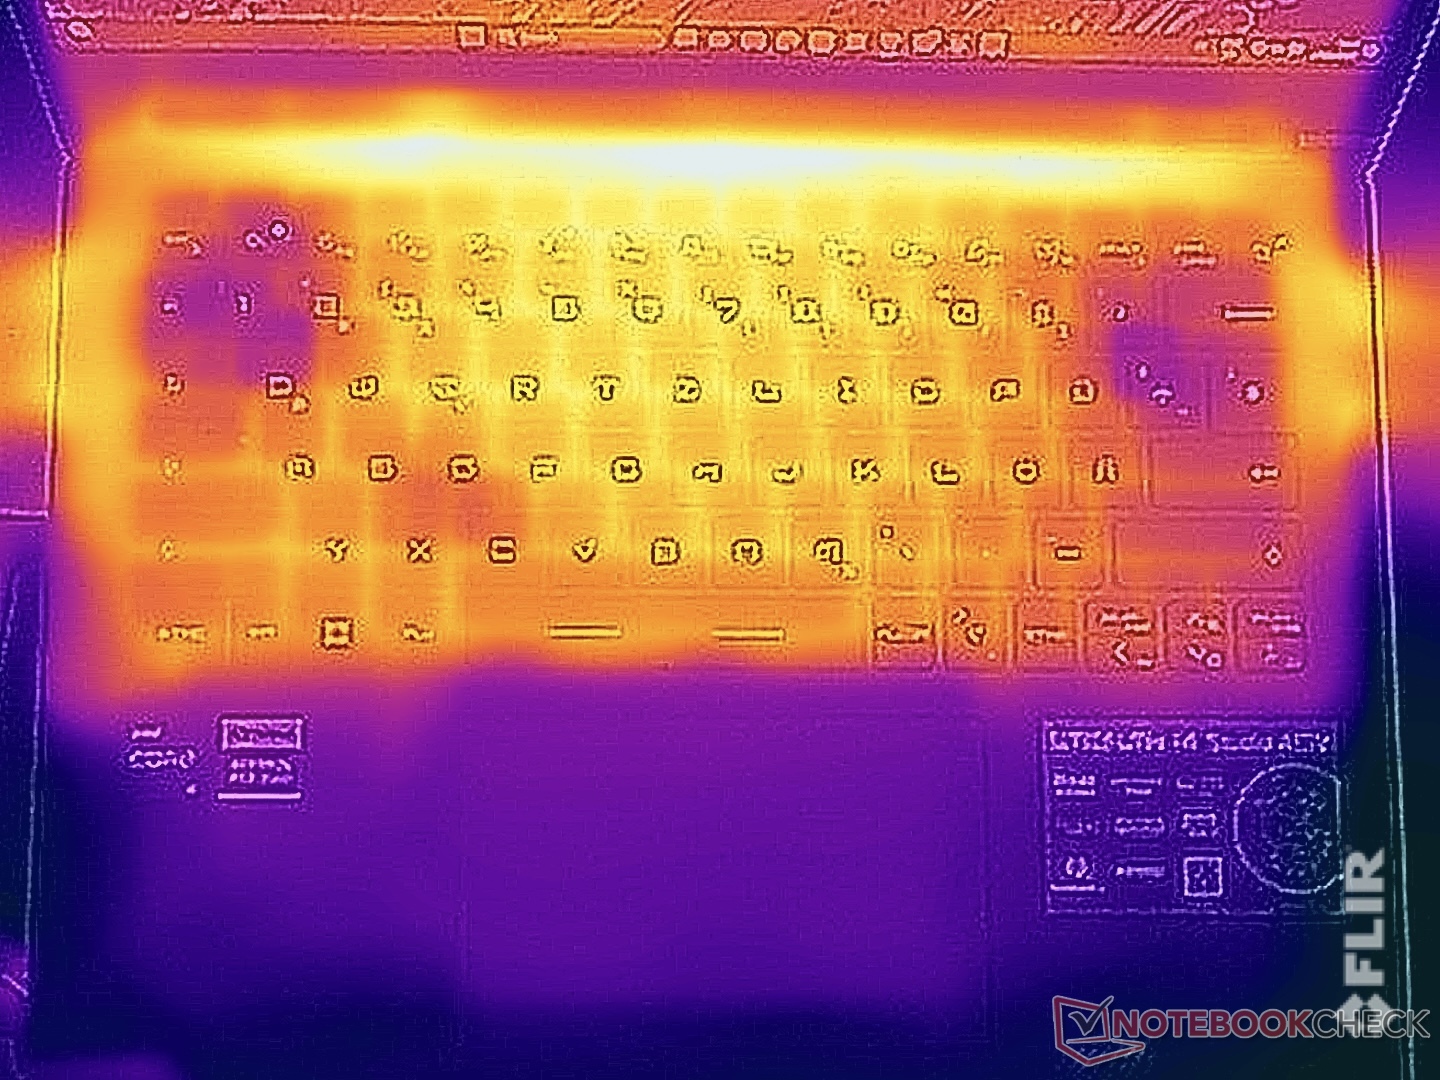
Vi har redan märkt att Stealth 14 Studio blir ganska varm när den är mer inaktiv, särskilt på undersidan av enheten. Under enkla vardagliga uppgifter kan du fortfarande bekvämt klara av att sitta den bärbara datorn på dina lår. Så snart enheten utsätts för större belastning eller när du börjar spela, bör du förmodligen undvika att göra detta, eftersom det snabbt kommer att bli obekvämt. Vi uppmätte över 55 °C på undersidan av enheten. Även tangentbordet värmdes upp och nådde upp till 45 °C, vilket du definitivt kan märka när du spelar spel och efter en längre tid börjar det bli lite obekvämt.
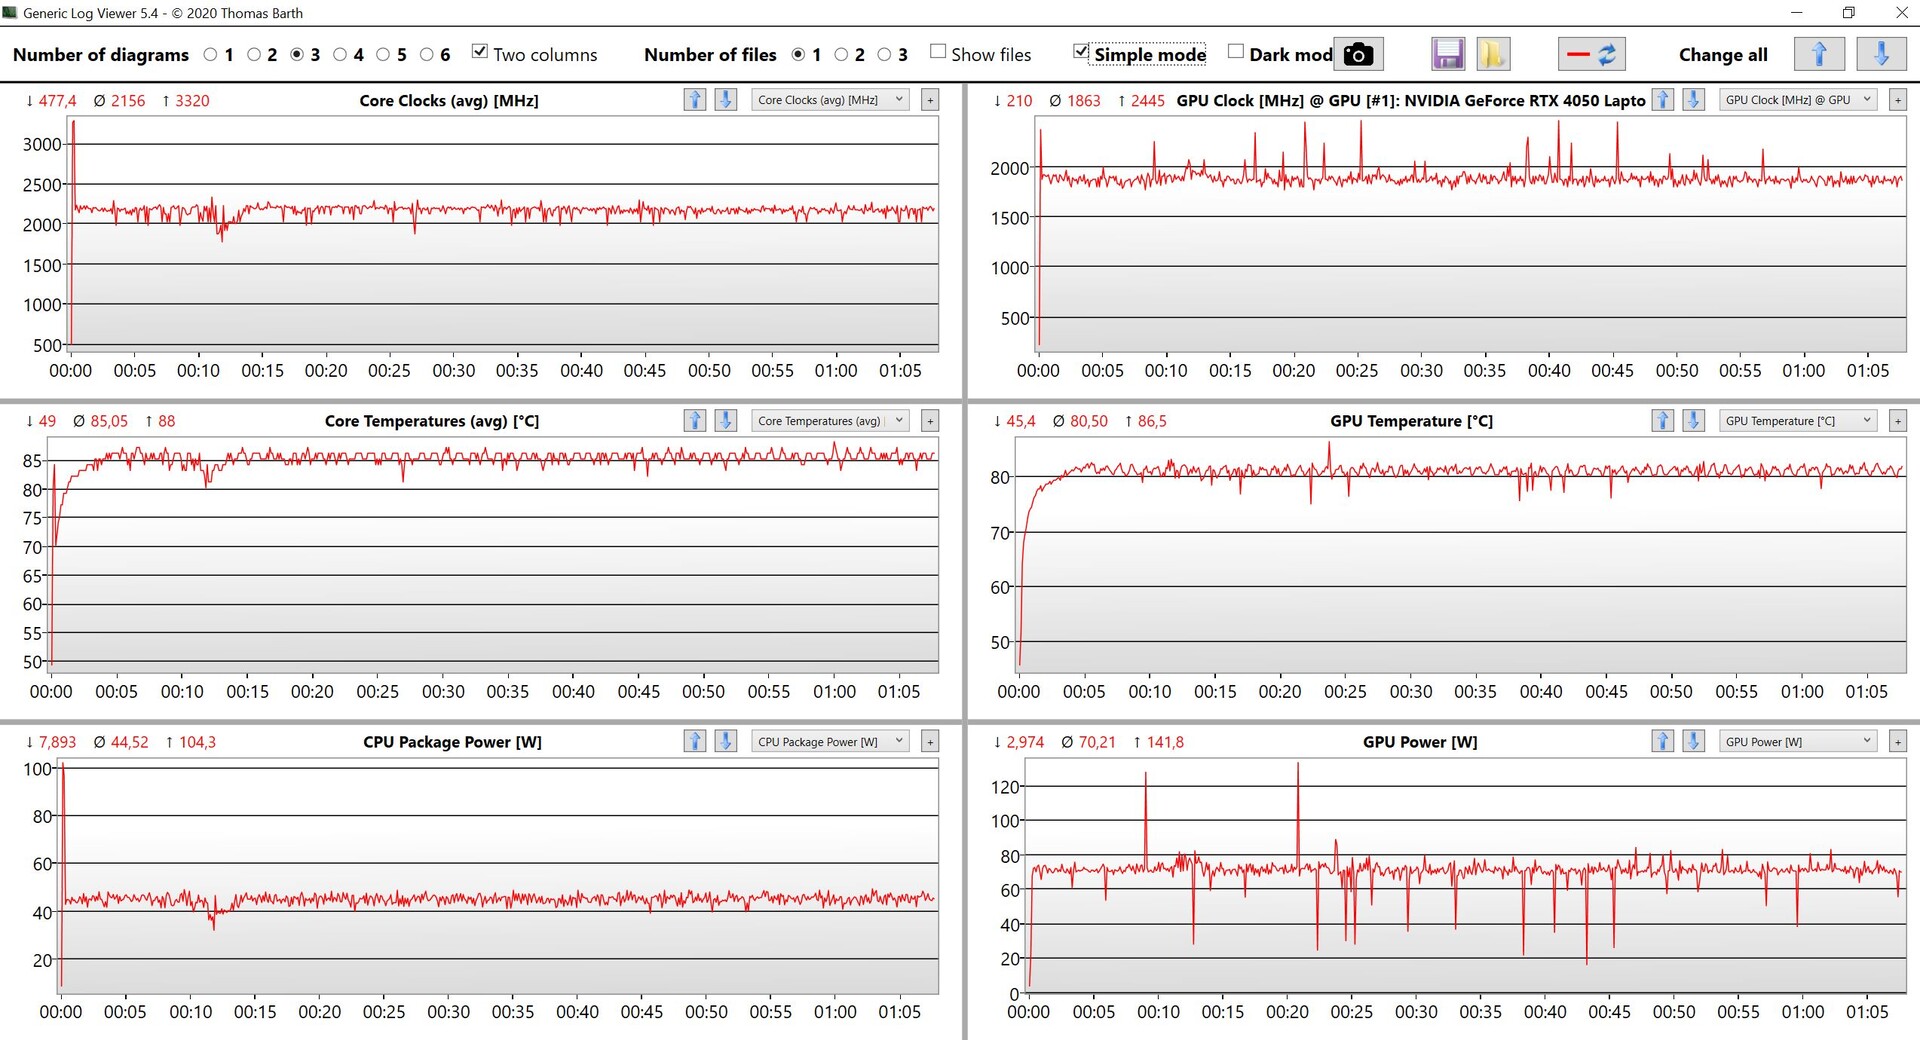
Under stresstestet utjämnades CPU och GPU snabbt till 45 respektive 70 watt, vilket innebär att den bärbara datorn måste kyla 115 watt över tiden. Direkt efter stresstestet noterade vi ingen minskning av prestandan.
(-) Den maximala temperaturen på ovansidan är 46.9 °C / 116 F, jämfört med genomsnittet av 40.4 °C / 105 F , allt från 21.2 till 68.8 °C för klassen Gaming.
(-) Botten värms upp till maximalt 56.1 °C / 133 F, jämfört med genomsnittet av 43.2 °C / 110 F
(+) Vid tomgångsbruk är medeltemperaturen för ovansidan 29.7 °C / 85 F, jämfört med enhetsgenomsnittet på 33.9 °C / ### class_avg_f### F.
(-) När du spelar The Witcher 3 är medeltemperaturen för ovansidan 38.3 °C / 101 F, jämfört med enhetsgenomsnittet på 33.9 °C / ## #class_avg_f### F.
(+) Handledsstöden och pekplattan är kallare än hudtemperaturen med maximalt 27.5 °C / 81.5 F och är därför svala att ta på.
(±) Medeltemperaturen för handledsstödsområdet på liknande enheter var 28.8 °C / 83.8 F (+1.3 °C / 2.3 F).
| MSI Stealth 14 Studio A13V Intel Core i7-13700H, NVIDIA GeForce RTX 4050 Laptop GPU | Gigabyte Aero 14 OLED BMF Intel Core i7-13700H, NVIDIA GeForce RTX 4050 Laptop GPU | Schenker Vision 14 2022 RTX 3050 Ti Intel Core i7-12700H, NVIDIA GeForce RTX 3050 Ti Laptop GPU | Asus ROG Flow Z13 GZ301ZE Intel Core i9-12900H, NVIDIA GeForce RTX 3050 Ti Laptop GPU | Alienware x14 i7 RTX 3060 Intel Core i7-12700H, NVIDIA GeForce RTX 3060 Laptop GPU | Razer Blade 14 Ryzen 9 6900HX AMD Ryzen 9 6900HX, NVIDIA GeForce RTX 3070 Ti Laptop GPU | Acer Predator Triton 300 SE Intel Core i9-12900H, NVIDIA GeForce RTX 3060 Laptop GPU | |
|---|---|---|---|---|---|---|---|
| Heat | 17% | 9% | 13% | 16% | 7% | 17% | |
| Maximum Upper Side * (°C) | 46.9 | 42 10% | 48.4 -3% | 45.3 3% | 51.3 -9% | 40.6 13% | 43 8% |
| Maximum Bottom * (°C) | 56.1 | 52 7% | 57.1 -2% | 48.3 14% | 44.4 21% | 42.6 24% | 46.4 17% |
| Idle Upper Side * (°C) | 33.8 | 26 23% | 28.1 17% | 29.2 14% | 27.2 20% | 38 -12% | 28.2 17% |
| Idle Bottom * (°C) | 37.9 | 27 29% | 29 23% | 30 21% | 26.6 30% | 37 2% | 28.4 25% |
* ... mindre är bättre
Högtalare
MSI har utrustat Stealth 14 Studio med fyra högtalare inklusive deras Nahimic Audio-programvara. Denna programvara erbjuder olika profiler som kan anpassas ytterligare (till exempel med mer bas eller mer uttalad sång) och vi skulle definitivt rekommendera att använda denna programvara. Allt som allt noterade vi bra resultat och definitivt bättre än jämförelseenheterna - de enda enheterna som MSI-laptopen inte kunde komma i närheten av var några av de bärbara multimediadatorerna med riktigt bra ljudsystem. Tyvärr är högtalarna inte riktigt de bästa för spel ändå, eftersom den bärbara datorns högljudda fläktar dränker nästan allt.
MSI Stealth 14 Studio A13V ljudanalys
(±) | högtalarljudstyrkan är genomsnittlig men bra (81 dB)
Bas 100 - 315 Hz
(±) | reducerad bas - i genomsnitt 11.2% lägre än medianen
(+) | basen är linjär (6.7% delta till föregående frekvens)
Mellan 400 - 2000 Hz
(+) | balanserad mellan - endast 1.6% från medianen
(+) | mids är linjära (2.9% delta till föregående frekvens)
Högsta 2 - 16 kHz
(±) | högre toppar - i genomsnitt 5.3% högre än medianen
(±) | linjäriteten för toppar är genomsnittlig (7.5% delta till föregående frekvens)
Totalt 100 - 16 000 Hz
(+) | det totala ljudet är linjärt (11.9% skillnad mot median)
Jämfört med samma klass
» 12% av alla testade enheter i den här klassen var bättre, 4% liknande, 84% sämre
» Den bästa hade ett delta på 6%, genomsnittet var 18%, sämst var 132%
Jämfört med alla testade enheter
» 9% av alla testade enheter var bättre, 2% liknande, 89% sämre
» Den bästa hade ett delta på 4%, genomsnittet var 24%, sämst var 134%
Acer Predator Triton 300 SE ljudanalys
(±) | högtalarljudstyrkan är genomsnittlig men bra (79.9 dB)
Bas 100 - 315 Hz
(±) | reducerad bas - i genomsnitt 10.3% lägre än medianen
(±) | linjäriteten för basen är genomsnittlig (9.7% delta till föregående frekvens)
Mellan 400 - 2000 Hz
(±) | högre mellan - i genomsnitt 5% högre än median
(+) | mids är linjära (4% delta till föregående frekvens)
Högsta 2 - 16 kHz
(±) | högre toppar - i genomsnitt 5.5% högre än medianen
(±) | linjäriteten för toppar är genomsnittlig (7.6% delta till föregående frekvens)
Totalt 100 - 16 000 Hz
(±) | linjäriteten för det totala ljudet är genomsnittlig (15.1% skillnad mot median)
Jämfört med samma klass
» 32% av alla testade enheter i den här klassen var bättre, 6% liknande, 62% sämre
» Den bästa hade ett delta på 6%, genomsnittet var 18%, sämst var 132%
Jämfört med alla testade enheter
» 21% av alla testade enheter var bättre, 4% liknande, 75% sämre
» Den bästa hade ett delta på 4%, genomsnittet var 24%, sämst var 134%
Energihantering - Liten uthållighet
Strömförbrukning
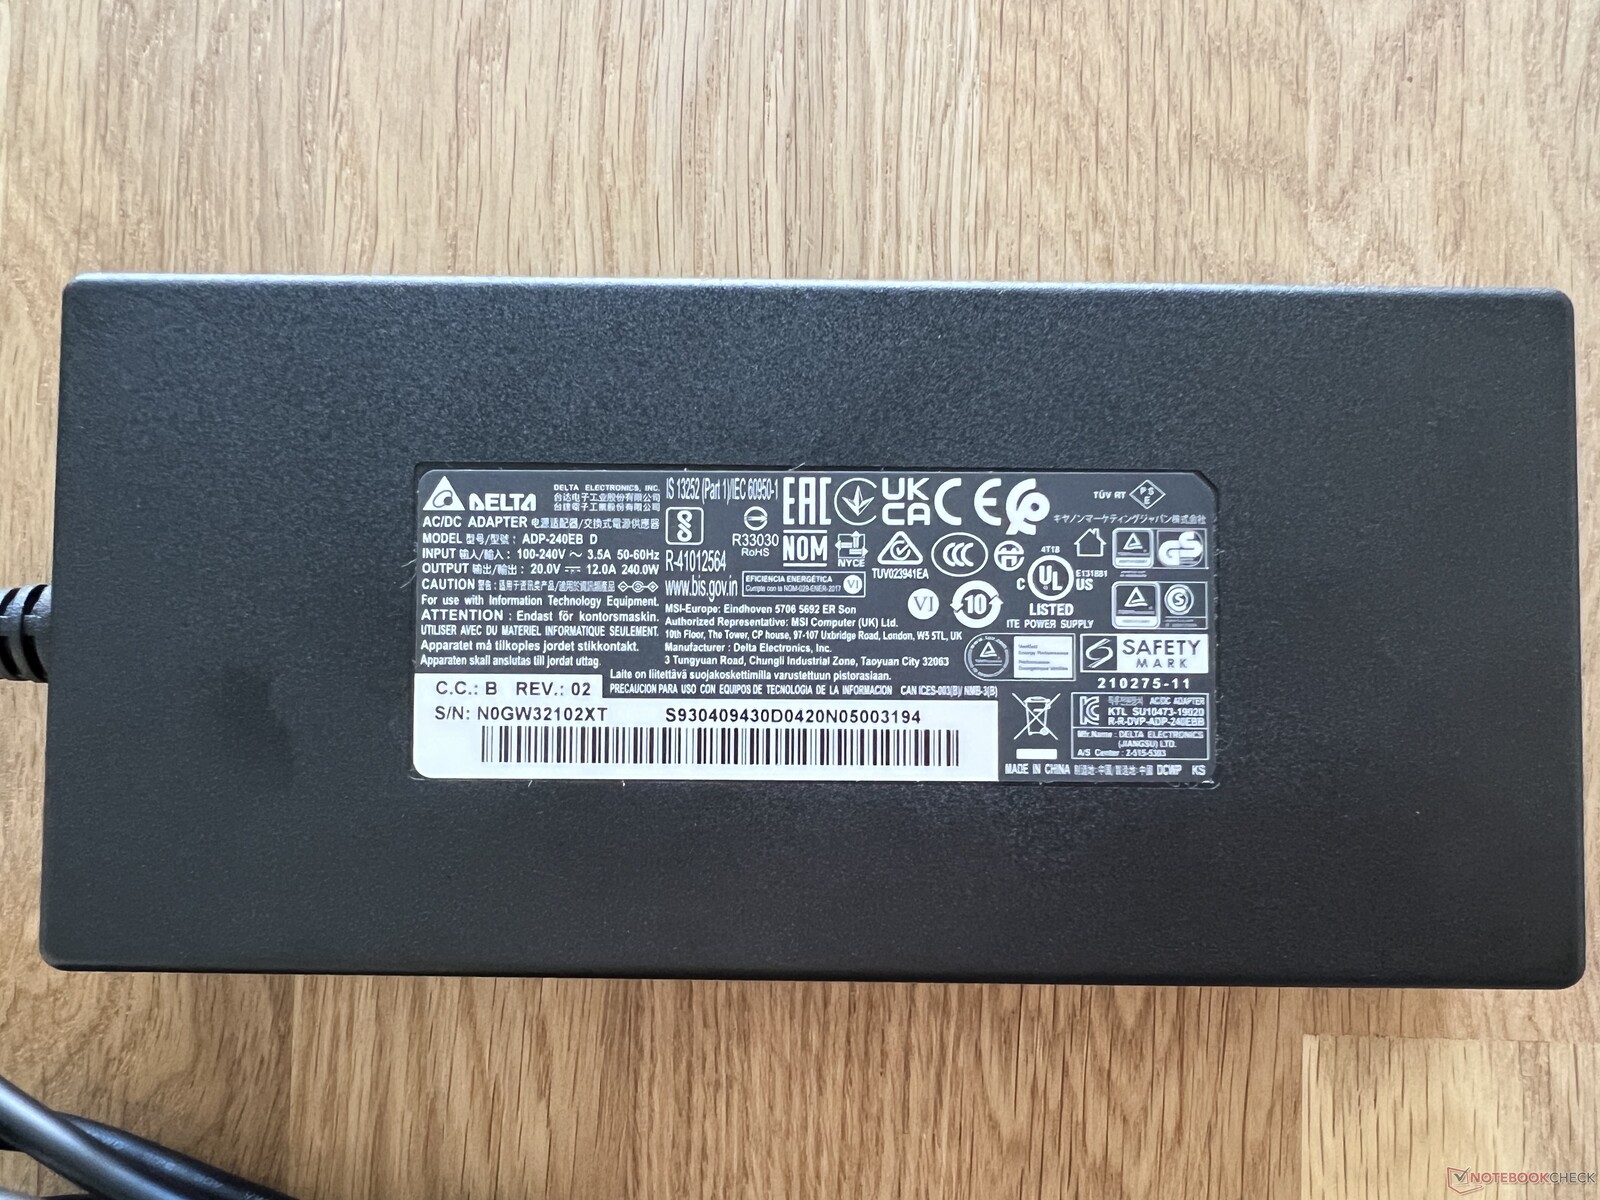
Speciellt i viloläge blev vi förvånade över hur mycket ström enheten använder trots sin grafikväxling. Vi märkte definitivt en stor nackdel jämfört med konkurrenterna i denna aspekt. Vid full ljusstyrka uppmätte vi cirka 20 watt i viloläge, vilket är mycket för en kompakt 14-tums enhet med en ljusstyrka på 400 cd / m². MSI-laptopen använder också mycket under spel; tillverkaren kan verkligen göra med att ta en titt på detta. Under vårt stresstest uppmätte vi maximalt 200 watt - detta planade snabbt ut på cirka 150 watt. Som ett resultat är den medföljande 240-watts strömförsörjningen helt tillräcklig - kanske till och med lite för kraftfull.
| Av/Standby | |
| Låg belastning | |
| Hög belastning |
|
Förklaring:
min: | |
| MSI Stealth 14 Studio A13V i7-13700H, GeForce RTX 4050 Laptop GPU, Samsung PM9A1 MZVL21T0HCLR, IPS, 2560x1600, 14" | Gigabyte Aero 14 OLED BMF i7-13700H, GeForce RTX 4050 Laptop GPU, Gigabyte AG470S1TB-SI B10, OLED, 2880x1800, 14" | Schenker Vision 14 2022 RTX 3050 Ti i7-12700H, GeForce RTX 3050 Ti Laptop GPU, Samsung SSD 980 Pro 1TB MZ-V8P1T0BW, IPS, 2880x1800, 14" | Asus ROG Flow Z13 GZ301ZE i9-12900H, GeForce RTX 3050 Ti Laptop GPU, Micron 2450 1TB MTFDKBK1T0TFK, IPS, 1920x1200, 13.4" | Alienware x14 i7 RTX 3060 i7-12700H, GeForce RTX 3060 Laptop GPU, WDC PC SN810 1TB, IPS, 1920x1080, 14" | Razer Blade 14 Ryzen 9 6900HX R9 6900HX, GeForce RTX 3070 Ti Laptop GPU, Samsung PM9A1 MZVL21T0HCLR, IPS, 2560x1440, 14" | Acer Predator Triton 300 SE i9-12900H, GeForce RTX 3060 Laptop GPU, Micron 3400 1TB MTFDKBA1T0TFH, OLED, 2880x1800, 14" | Genomsnitt NVIDIA GeForce RTX 4050 Laptop GPU | Genomsnitt av klass Gaming | |
|---|---|---|---|---|---|---|---|---|---|
| Power Consumption | 41% | 35% | 34% | 24% | -15% | 9% | 8% | -18% | |
| Idle Minimum * (Watt) | 10.4 | 7.4 29% | 7.5 28% | 8.8 15% | 7.9 24% | 10.2 2% | 7.6 27% | 9.95 ? 4% | 13.3 ? -28% |
| Idle Average * (Watt) | 19.1 | 8.3 57% | 10.4 46% | 12.1 37% | 11.1 42% | 26 -36% | 12.3 36% | 15.8 ? 17% | 19 ? 1% |
| Idle Maximum * (Watt) | 19.4 | 8.7 55% | 11.4 41% | 12.7 35% | 11.8 39% | 26.7 -38% | 17.6 9% | 20.1 ? -4% | 24.5 ? -26% |
| Load Average * (Watt) | 95.9 | 76 21% | 83.3 13% | 72.3 25% | 107.4 -12% | 89.3 7% | 111 -16% | 88 ? 8% | 108.1 ? -13% |
| Witcher 3 ultra * (Watt) | 141.6 | 70 51% | 92.7 35% | 77.3 45% | 111 22% | 158.7 -12% | 117.1 17% | ||
| Load Maximum * (Watt) | 203 | 132 35% | 110.3 46% | 103.1 49% | 140.4 31% | 227.5 -12% | 245.8 -21% | 176.3 ? 13% | 254 ? -25% |
* ... mindre är bättre
Power consumption Witcher 3 / stress test
Power consumption with external monitor
Körtider
Trots sin 72-Wh batterikapacitet är MSI-laptopens drifttider inte särskilt bra, inte ens i 60-Hz-läge. Med en anpassad ljusstyrka på 150 cd/m² (vilket innebär cirka 36 % av vårt testexemplars ljusstyrka) slutade vårt WLAN-test efter drygt 6 timmar. Vid 240 Hz varade testet inte ens i 5 timmar. När vi upprepade testet med datorns fulla ljusstyrka varade det bara i 5 timmar vid 60 Hz och 4 timmar vid 240 Hz. Även videotestet med 150 cd/m² och 60 Hz varade bara i drygt 6,5 timmar. För en kompakt 14-tums enhet med ett relativt stort batteri och grafikomvandling är detta ett nedslående resultat. Det tar cirka 2 timmar att ladda enheten helt, och 75 % av dess kapacitet uppnås efter 45 minuter. Den bärbara datorn kan också laddas via USB-C när du är på språng.
| MSI Stealth 14 Studio A13V i7-13700H, GeForce RTX 4050 Laptop GPU, 72 Wh | Gigabyte Aero 14 OLED BMF i7-13700H, GeForce RTX 4050 Laptop GPU, 63 Wh | Schenker Vision 14 2022 RTX 3050 Ti i7-12700H, GeForce RTX 3050 Ti Laptop GPU, 99.8 Wh | Asus ROG Flow Z13 GZ301ZE i9-12900H, GeForce RTX 3050 Ti Laptop GPU, 56 Wh | Alienware x14 i7 RTX 3060 i7-12700H, GeForce RTX 3060 Laptop GPU, 80 Wh | Razer Blade 14 Ryzen 9 6900HX R9 6900HX, GeForce RTX 3070 Ti Laptop GPU, 62 Wh | Acer Predator Triton 300 SE i9-12900H, GeForce RTX 3060 Laptop GPU, 76 Wh | Genomsnitt av klass Gaming | |
|---|---|---|---|---|---|---|---|---|
| Batteridrifttid | 23% | 68% | -7% | 17% | 42% | 3% | 20% | |
| H.264 (h) | 6.6 | 11.1 68% | 6 -9% | 9.4 42% | 8.26 ? 25% | |||
| WiFi v1.3 (h) | 6.3 | 7.6 21% | 10.1 60% | 5.6 -11% | 8.9 41% | 9.5 51% | 6.2 -2% | 7.01 ? 11% |
| Load (h) | 1.2 | 1.5 25% | 2.1 75% | 1.2 0% | 0.8 -33% | 1.6 33% | 1.3 8% | 1.47 ? 23% |
| Reader / Idle (h) | 11.3 | 12.2 | 8.1 | 8.71 ? | ||||
| Witcher 3 ultra (h) | 0.8 | 0.8 |
För
Emot
Slutsats - MSI Stealth 14 Studio lämnade blandade intryck

MSI Stealth 14 Studio är en kraftfull men ändå kompakt bärbar dator för spelare och kreativa användare. Under vårt test hade vi några negativa punkter att notera som visar sig vara ett problem för en bärbar dator som kostar 1 699,99 USD. För det första är enheten "bara" utrustad med den lillaRTX 4050 bärbar datorutan Advanced Optimus - denna prestanda är helt enkelt otillräcklig för priset. Medan dess effektuttag är bra i teorin, imponerade inte kylsystemet på oss vid daglig användning. Högljudda fläktar under maximal belastning är förväntat, men det förvirrar oss varför fläktarna alltid verkar vara igång hörbart - vi noterade till och med ljudspikar på över 40 dB(A) när vi använde de svagare strömlägena. Detta är helt enkelt i vägen när du använder den bärbara datorn. Generellt sett är dess strömförbrukning också mycket hög (trots dess grafikomkoppling), vilket i sin tur också bidrar till kortare drifttider.
Den bärbara datorns fodral lämnade också ett ganska blandat intryck på oss - i jämförelse med dess extremt stabila basenhet kan skärmlocket vridas ganska mycket och du måste vara riktigt försiktig för att inte orsaka någon permanent skada. Vi har också några negativa saker att notera om tangentbordet. Medan dess individuella tangentbelysning är trevlig (även om programvaran för att kontrollera detta är allt annat än intuitiv), är dess tangentlyft mycket grunt och i allmänhet har det en ganska skakig känsla.
MSI Stealth 14 Studio vill vara den perfekta kompakta allrounddatorn som erbjuder bra prestanda för spelare och kreativa användare. Tyvärr - även om spelprestandan är bra - har den bärbara datorn alldeles för många brister som irriterande fläktar, ett mediokert tangentbord och ett flexibelt skärmlock. För 1 699,99 USD är detta helt enkelt inte tillräckligt.
Enhetens skärm är också ett tveeggat svärd, eftersom den har positiva aspekter som snabba reaktionshastigheter, en uppdateringsfrekvens på 240 Hz och bra färgprecision. Å andra sidan är dess svartvärde ganska högt. Detta leder till att svart innehåll avbildas som mer av en mörkgrå färg, och kontrastnivåerna är inte alltid så bra. Naturligtvis är detta gnäll på den högsta av nivåer, men totalt sett ser det subjektivt bara inte lika bra ut som OLED eller till och med mycket bra IPS/mini LED-paneler. I slutet av dagen har MSI-laptopen helt enkelt för många svagheter - med hänsyn till dess premiumpris - för att vi ska kunna rekommendera den med tillförsikt.
Pris och tillgänglighet
MSI Stealth 14 Studio kan köpas från Best Buy för 1 699,99 USD.
MSI Stealth 14 Studio A13V
- 07/12/2023 v7 (old)
Andreas Osthoff
Genomskinlighet
Valet av enheter som ska granskas görs av vår redaktion. Testprovet gavs till författaren som ett lån av tillverkaren eller återförsäljaren för denna recension. Långivaren hade inget inflytande på denna recension och inte heller fick tillverkaren en kopia av denna recension innan publiceringen. Det fanns ingen skyldighet att publicera denna recension. Som ett oberoende medieföretag är Notebookcheck inte föremål för auktoritet från tillverkare, återförsäljare eller förlag.
This is how Notebookcheck is testingEvery year, Notebookcheck independently reviews hundreds of laptops and smartphones using standardized procedures to ensure that all results are comparable. We have continuously developed our test methods for around 20 years and set industry standards in the process. In our test labs, high-quality measuring equipment is utilized by experienced technicians and editors. These tests involve a multi-stage validation process. Our complex rating system is based on hundreds of well-founded measurements and benchmarks, which maintains objectivity.
Price comparison

