Utlåtande - Höjer standarden
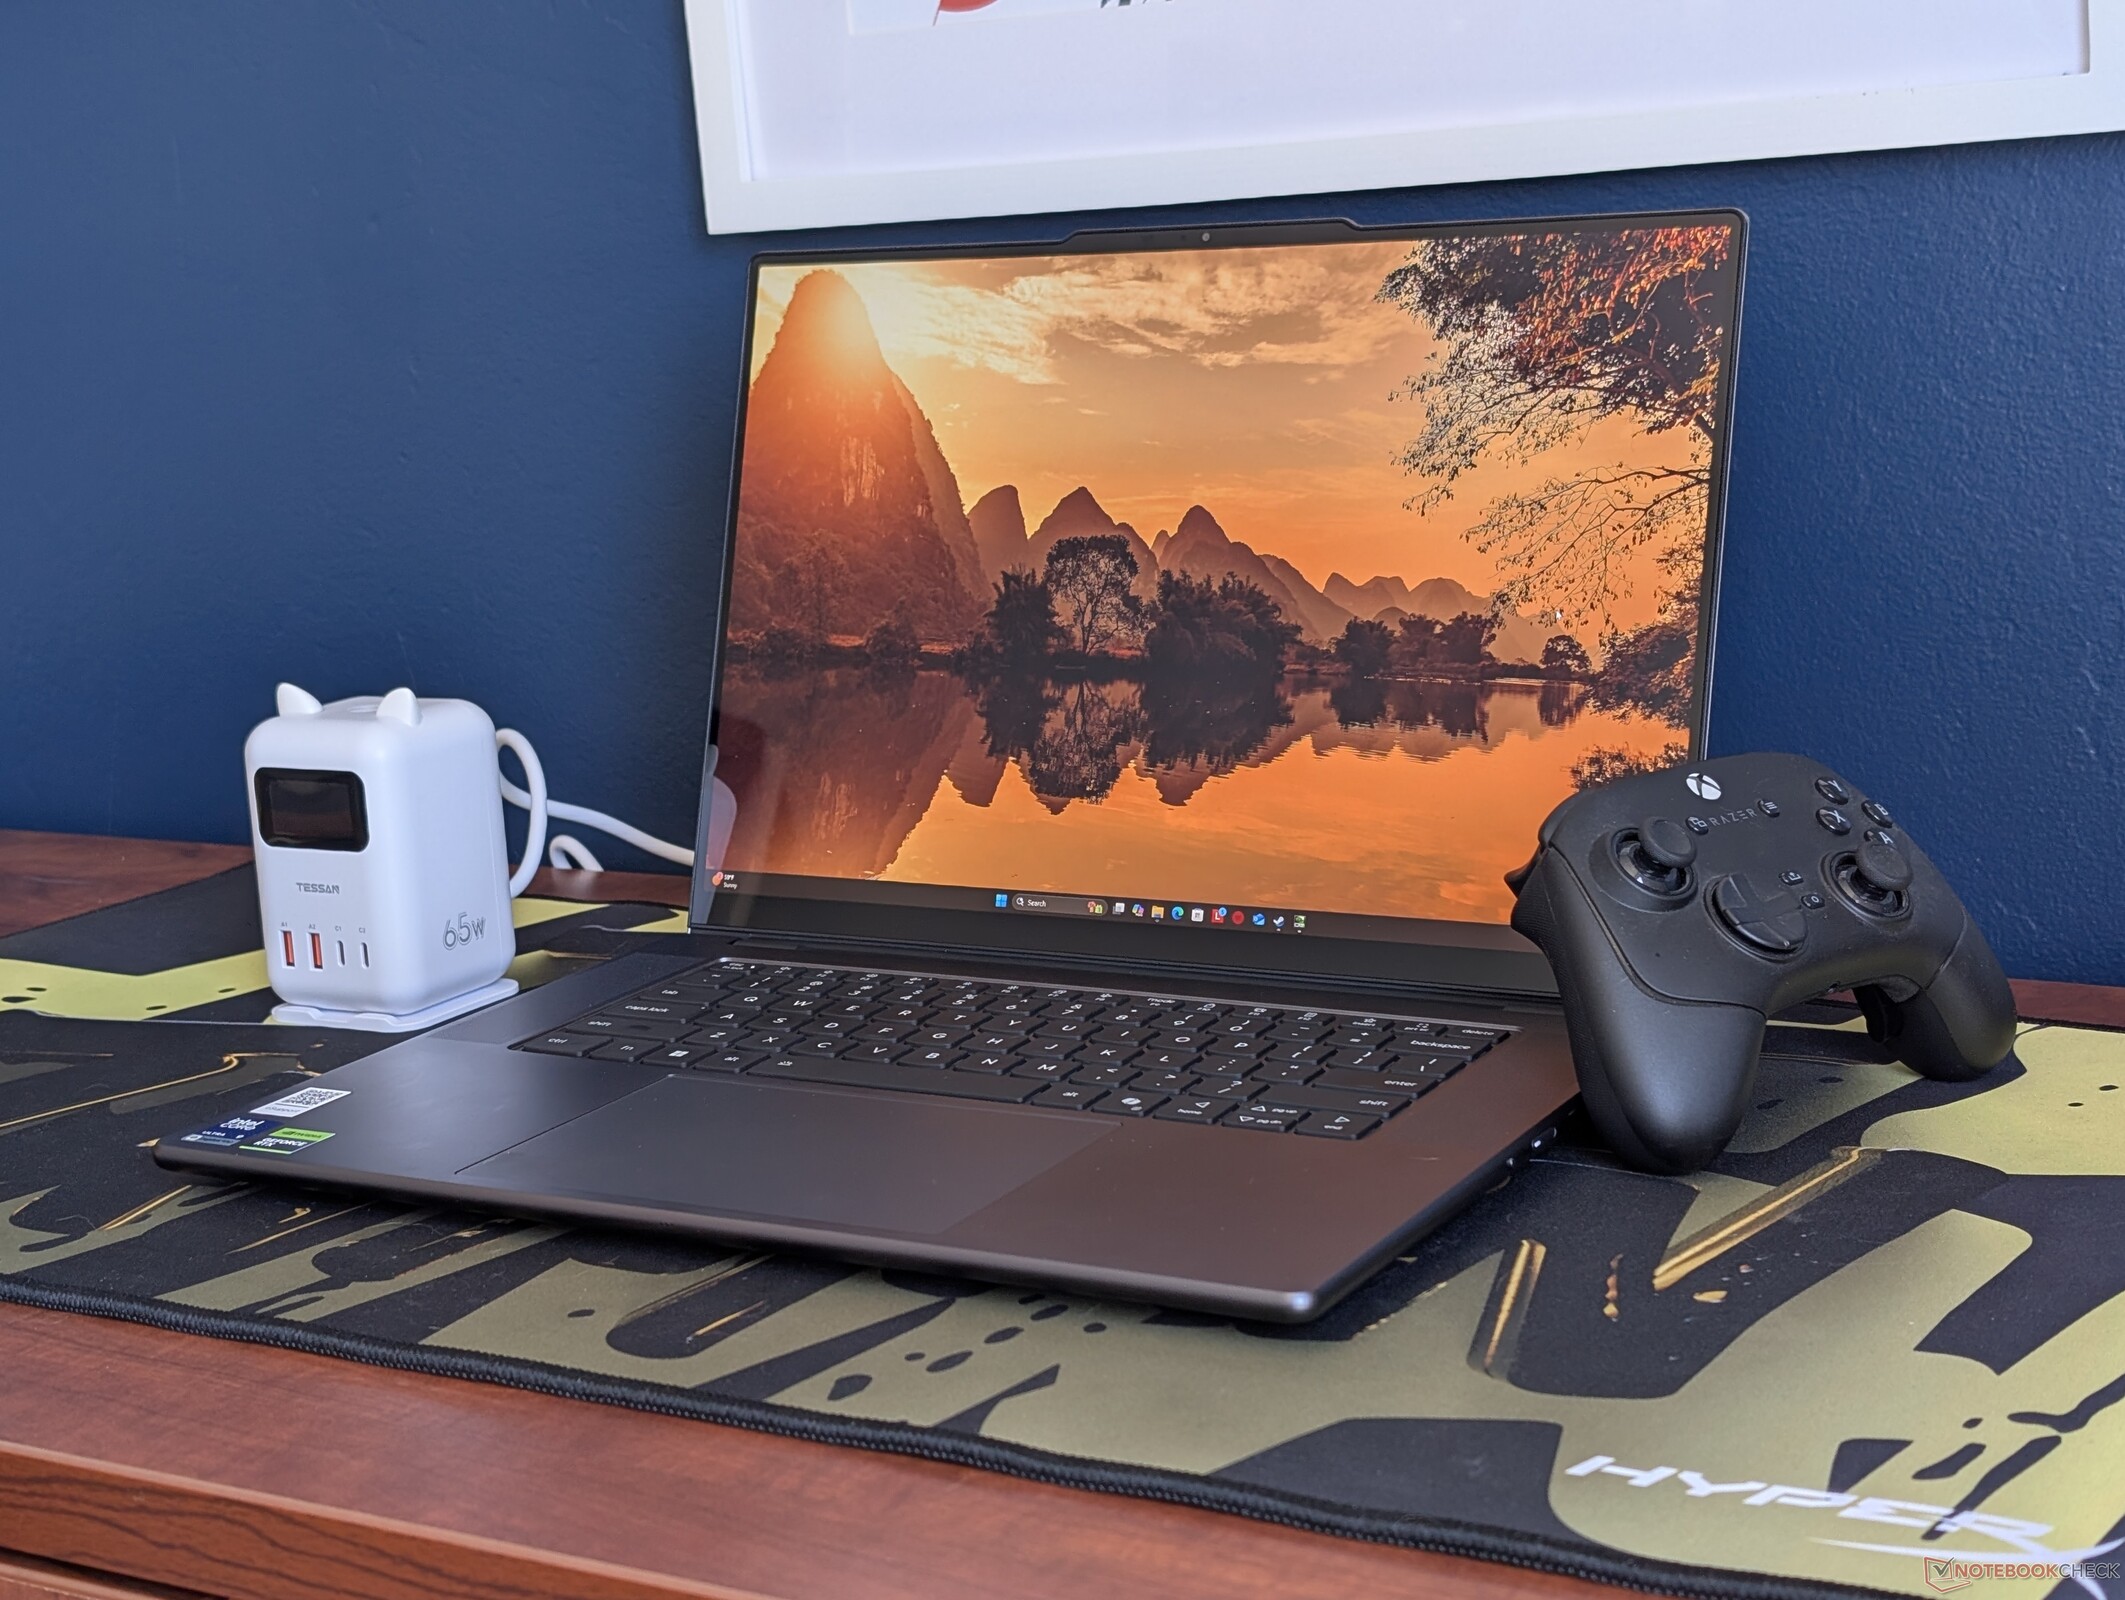
Till skillnad från många traditionella skaldatorer på marknaden har Lenovo Pro 9 16 G11 Aura inte mindre än en Core Ultra 9-processor, GeForce RTX GPU och en OLED-pekskärm för en förstklassig användarupplevelse oavsett konfigurationsnivå. Den har en av de ljusstarkaste pekskärmarna i sin storleksklass och verkar uppfylla alla krav som man kan ställa på ett multimediakraftverk, inklusive en integrerad kortläsare, ett stort urval av portar, bra ljud och stöd för flera interna SSD-enheter. Vi kan inte säga detsamma om den nya Dell XPS 16 som har utelämnat några av dessa funktioner för sin senaste redesign.
Även om vi uppskattar att 2026-modellen är något tunnare och lättare än 2025-modellenerbjuder den annars inte många prestandaförbättringar eftersom den nya Core Ultra 9 386H presterar nästan samma som förra årets Core Ultra 9 285H. Både GPU- och bildskärmsalternativen förblir desamma, vilket inte heller ger några förbättringar av användarupplevelsen. Att numpadet försvinner till förmån för större högtalargaller kan också påverka vissa användningsscenarier som är beroende av det.
De mest anmärkningsvärda nackdelarna med modellen är fläktljudet i prestandaläget och både tyngre vikt och kortare batteritid jämfört med konkurrenterna, trots uppgraderingen av batterikapaciteten. Att klämma in så många funktioner och portar har uppenbarligen sina konsekvenser när det gäller bärbarhet. Användare som kan klara sig utan diskret grafik eller en snygg OLED-skärm kommer att hitta Panther Lake XPS 16 eller MSI Prestige 16 att vara mycket tystare, snyggare och mer resevänliga alternativ. Å andra sidan, om du verkligen behöver diskret grafik, är den här Lenovo-datorn fortfarande en av våra favorit 16-tums multimediamaskiner som finns tillgängliga två år i rad.
För
Emot
Pris och tillgänglighet
Lenovo Pro 9 16IPH11 levereras nu från $2800 för baskonfigurationen 1800p RTX 5050 upp till över $3100 för 2000p RTX 5060-konfigurationen som granskats.
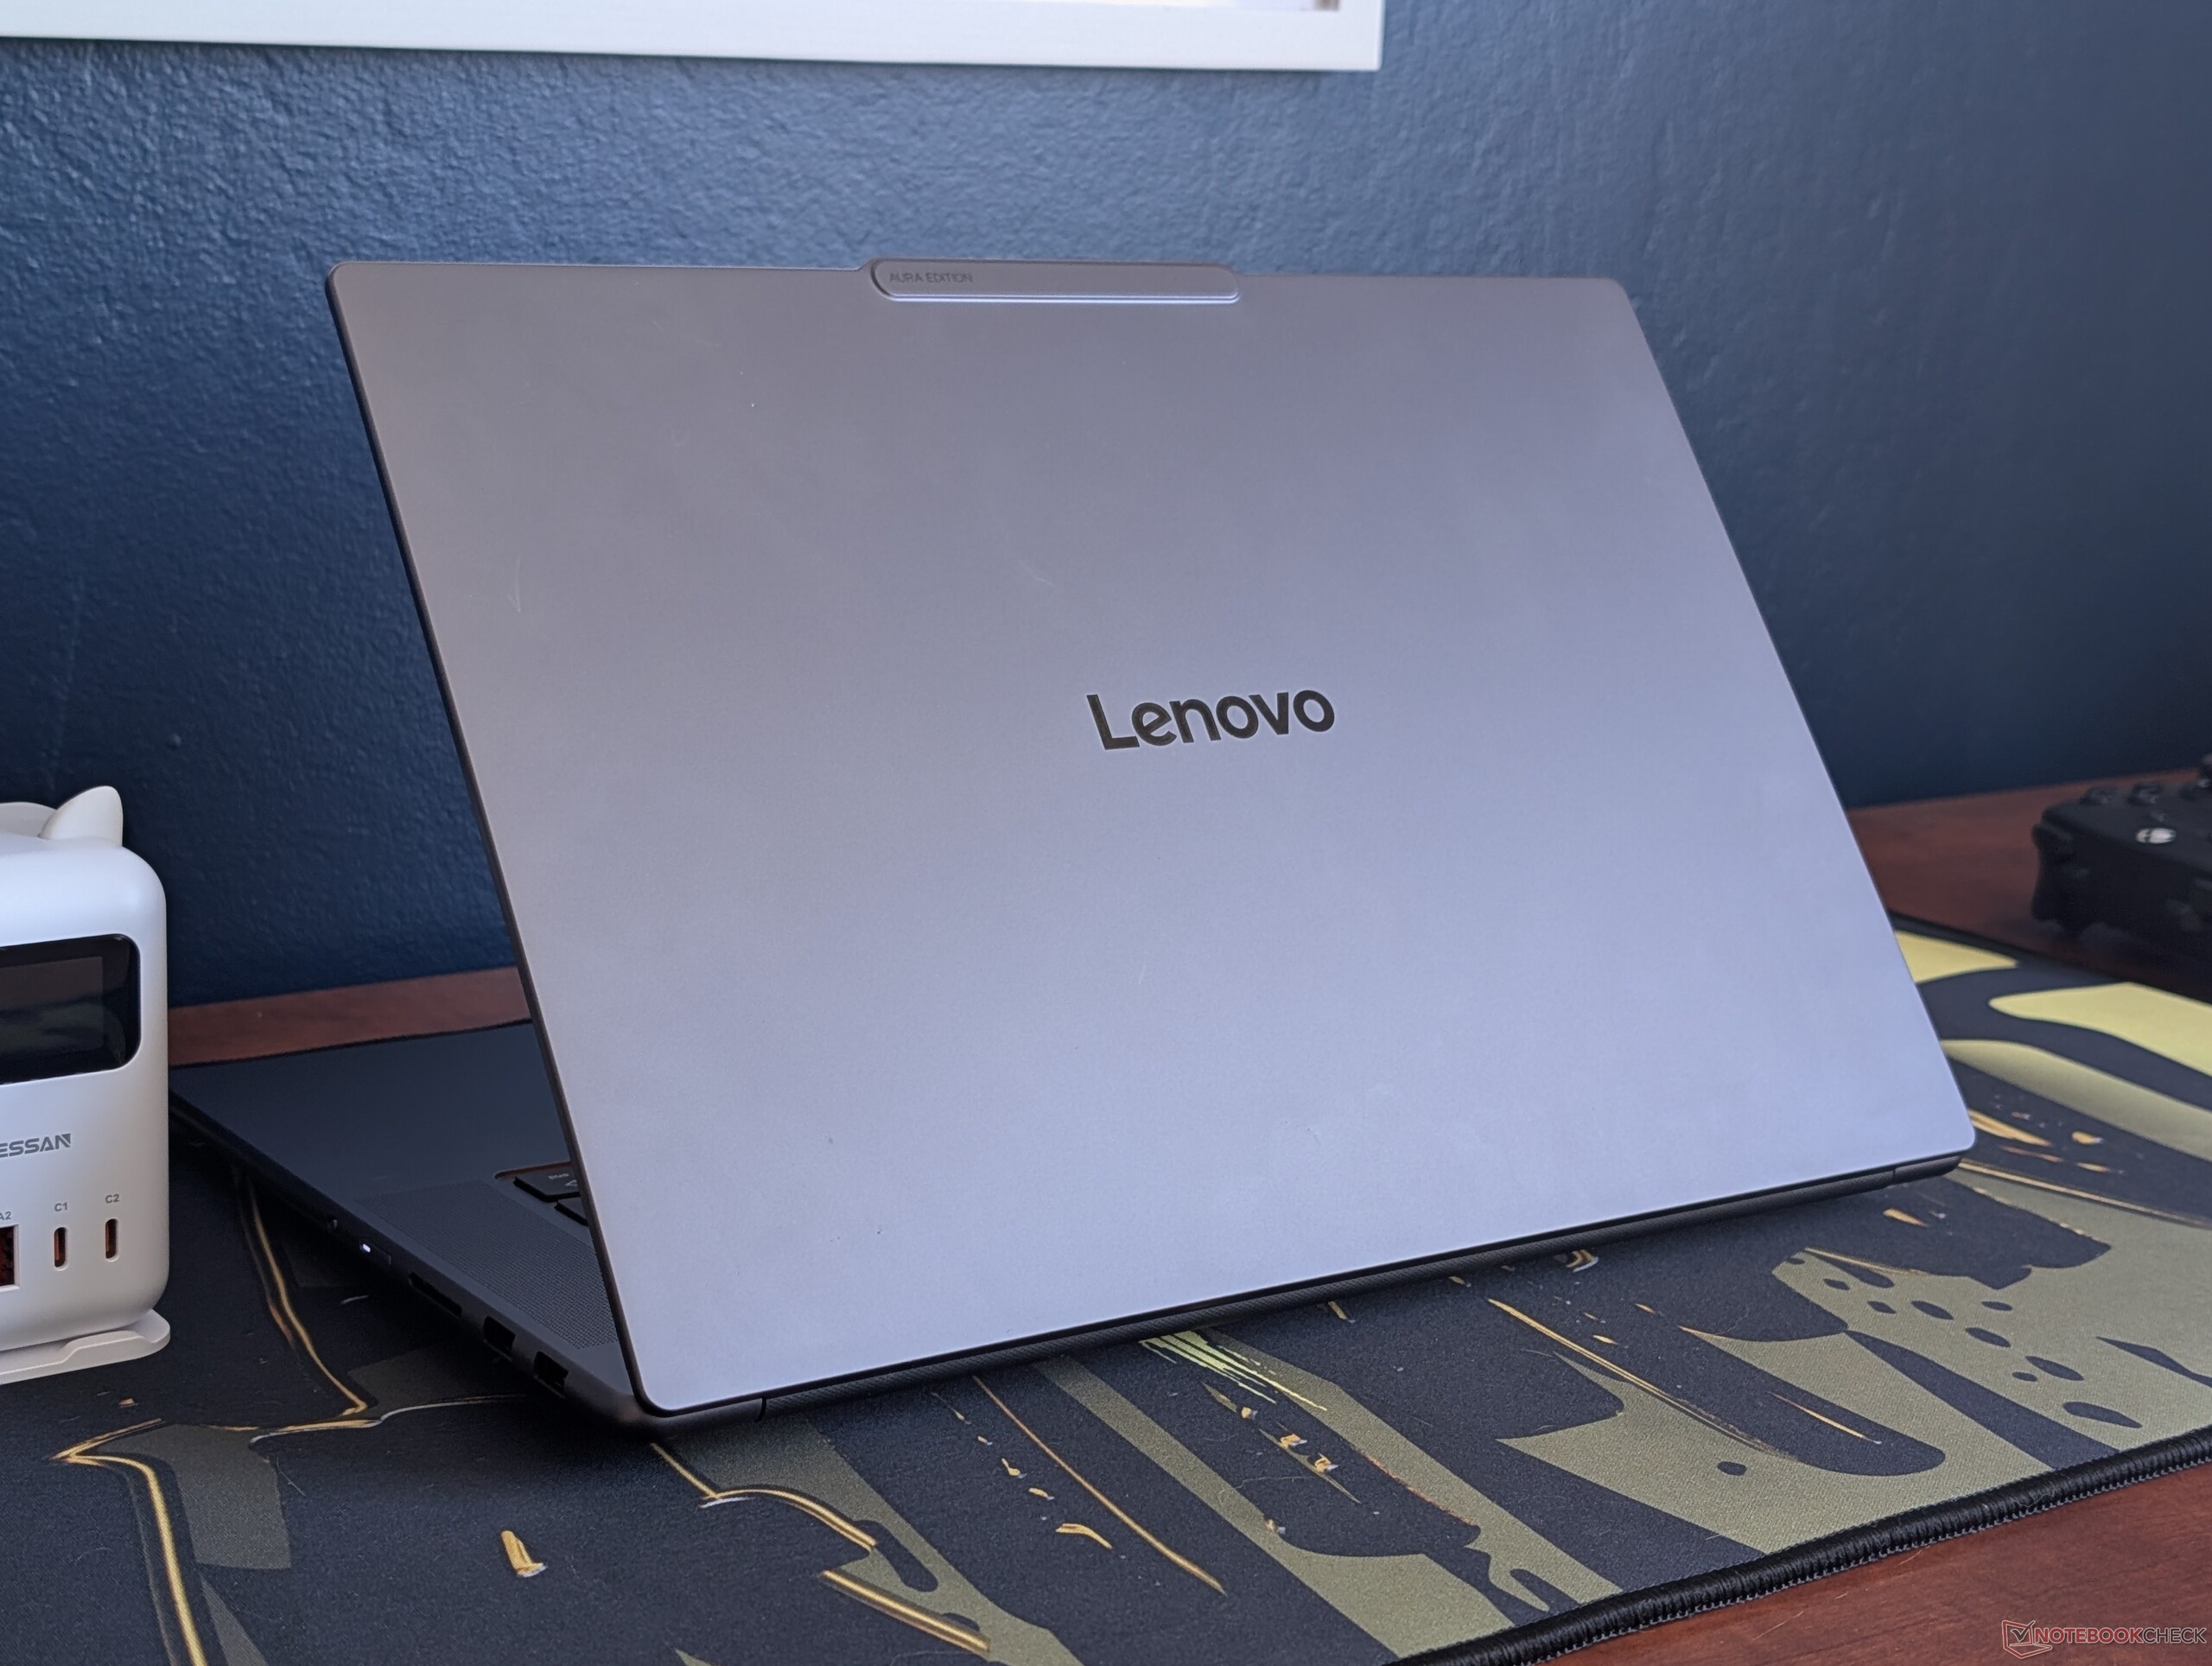
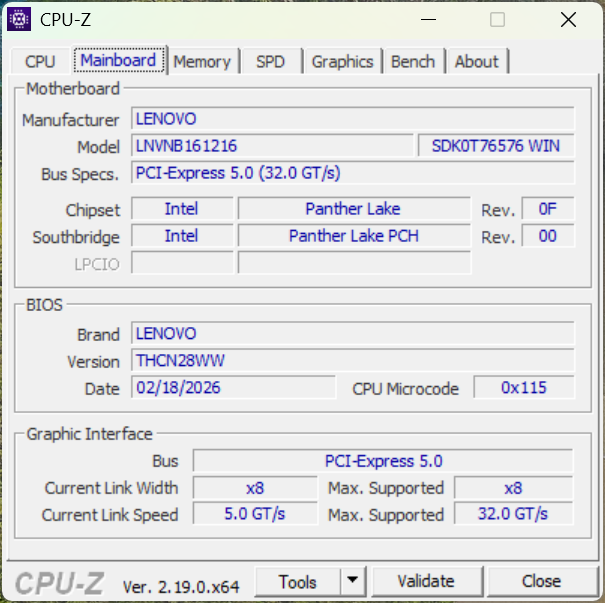
Lenovo Pro 9 16IPH11 (marknadsförs som Lenovo Pro 9i Aura Edition 16 G11) är en direkt efterföljare till förra årets Yoga Pro 9i 16IAH G10 Aura. Tillverkaren har både släppt Yoga-namnet samtidigt som den externa designen har uppdaterats.
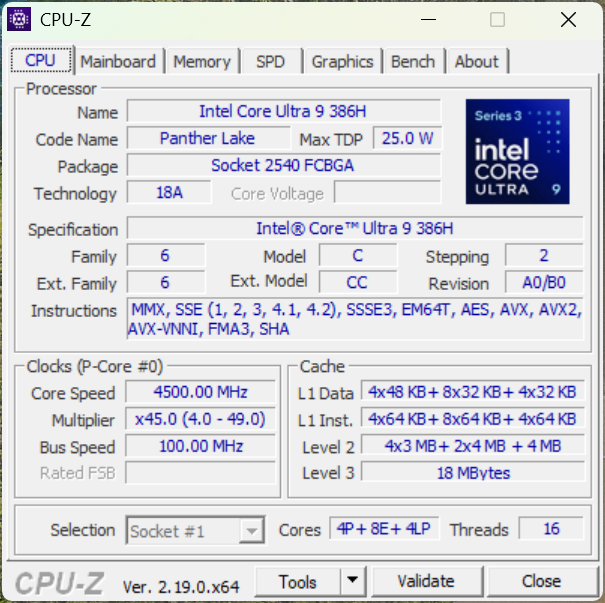
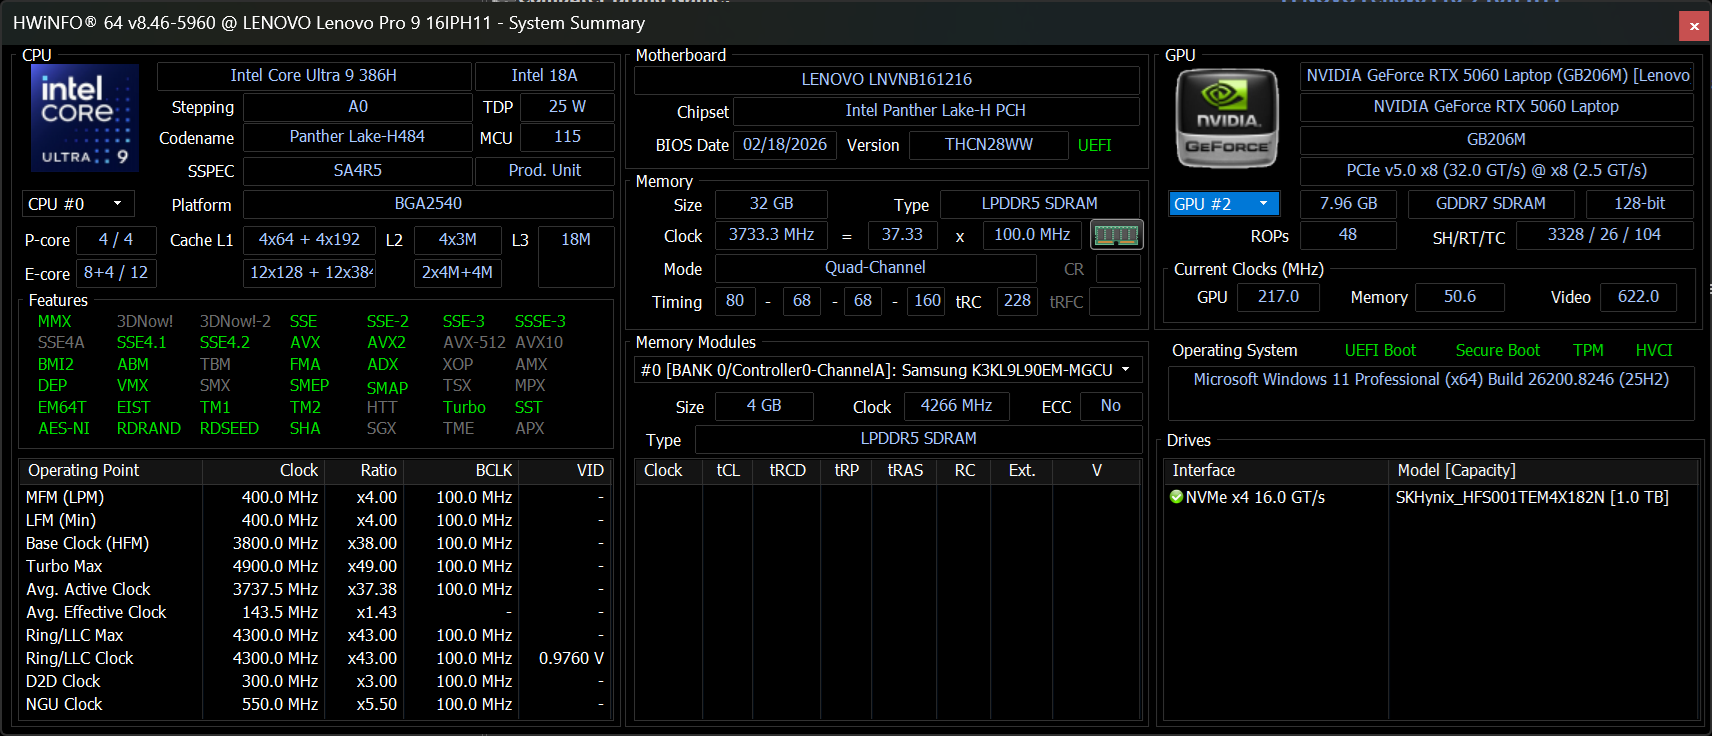
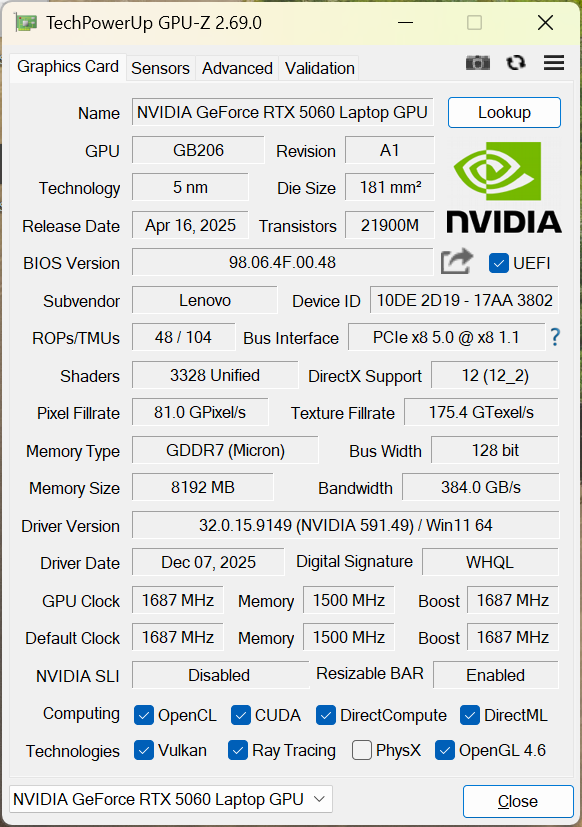
Vår testenhet är toppkonfigurationen utrustad med 100 W GeForce RTX 5060 GPU och 3200 x 2000 Tandem OLED-pekskärm för cirka $ 3100. Lägre SKU:er kommer med RTX 5050 eller 2880 x 1800 OLED istället, men alla alternativ levereras med samma Core Ultra 9 386H Panther Lake CPU.
Denna flaggskeppsmodell från Lenovo konkurrerar direkt med andra avancerade 16-tums multimediamaskiner, inklusive MSI Prestige 16 AI Evo, Asus ZenBook 16-serienoch den nya Dell XPS 16.
Fler Lenovo recensioner:
Specifikationer
Fallet
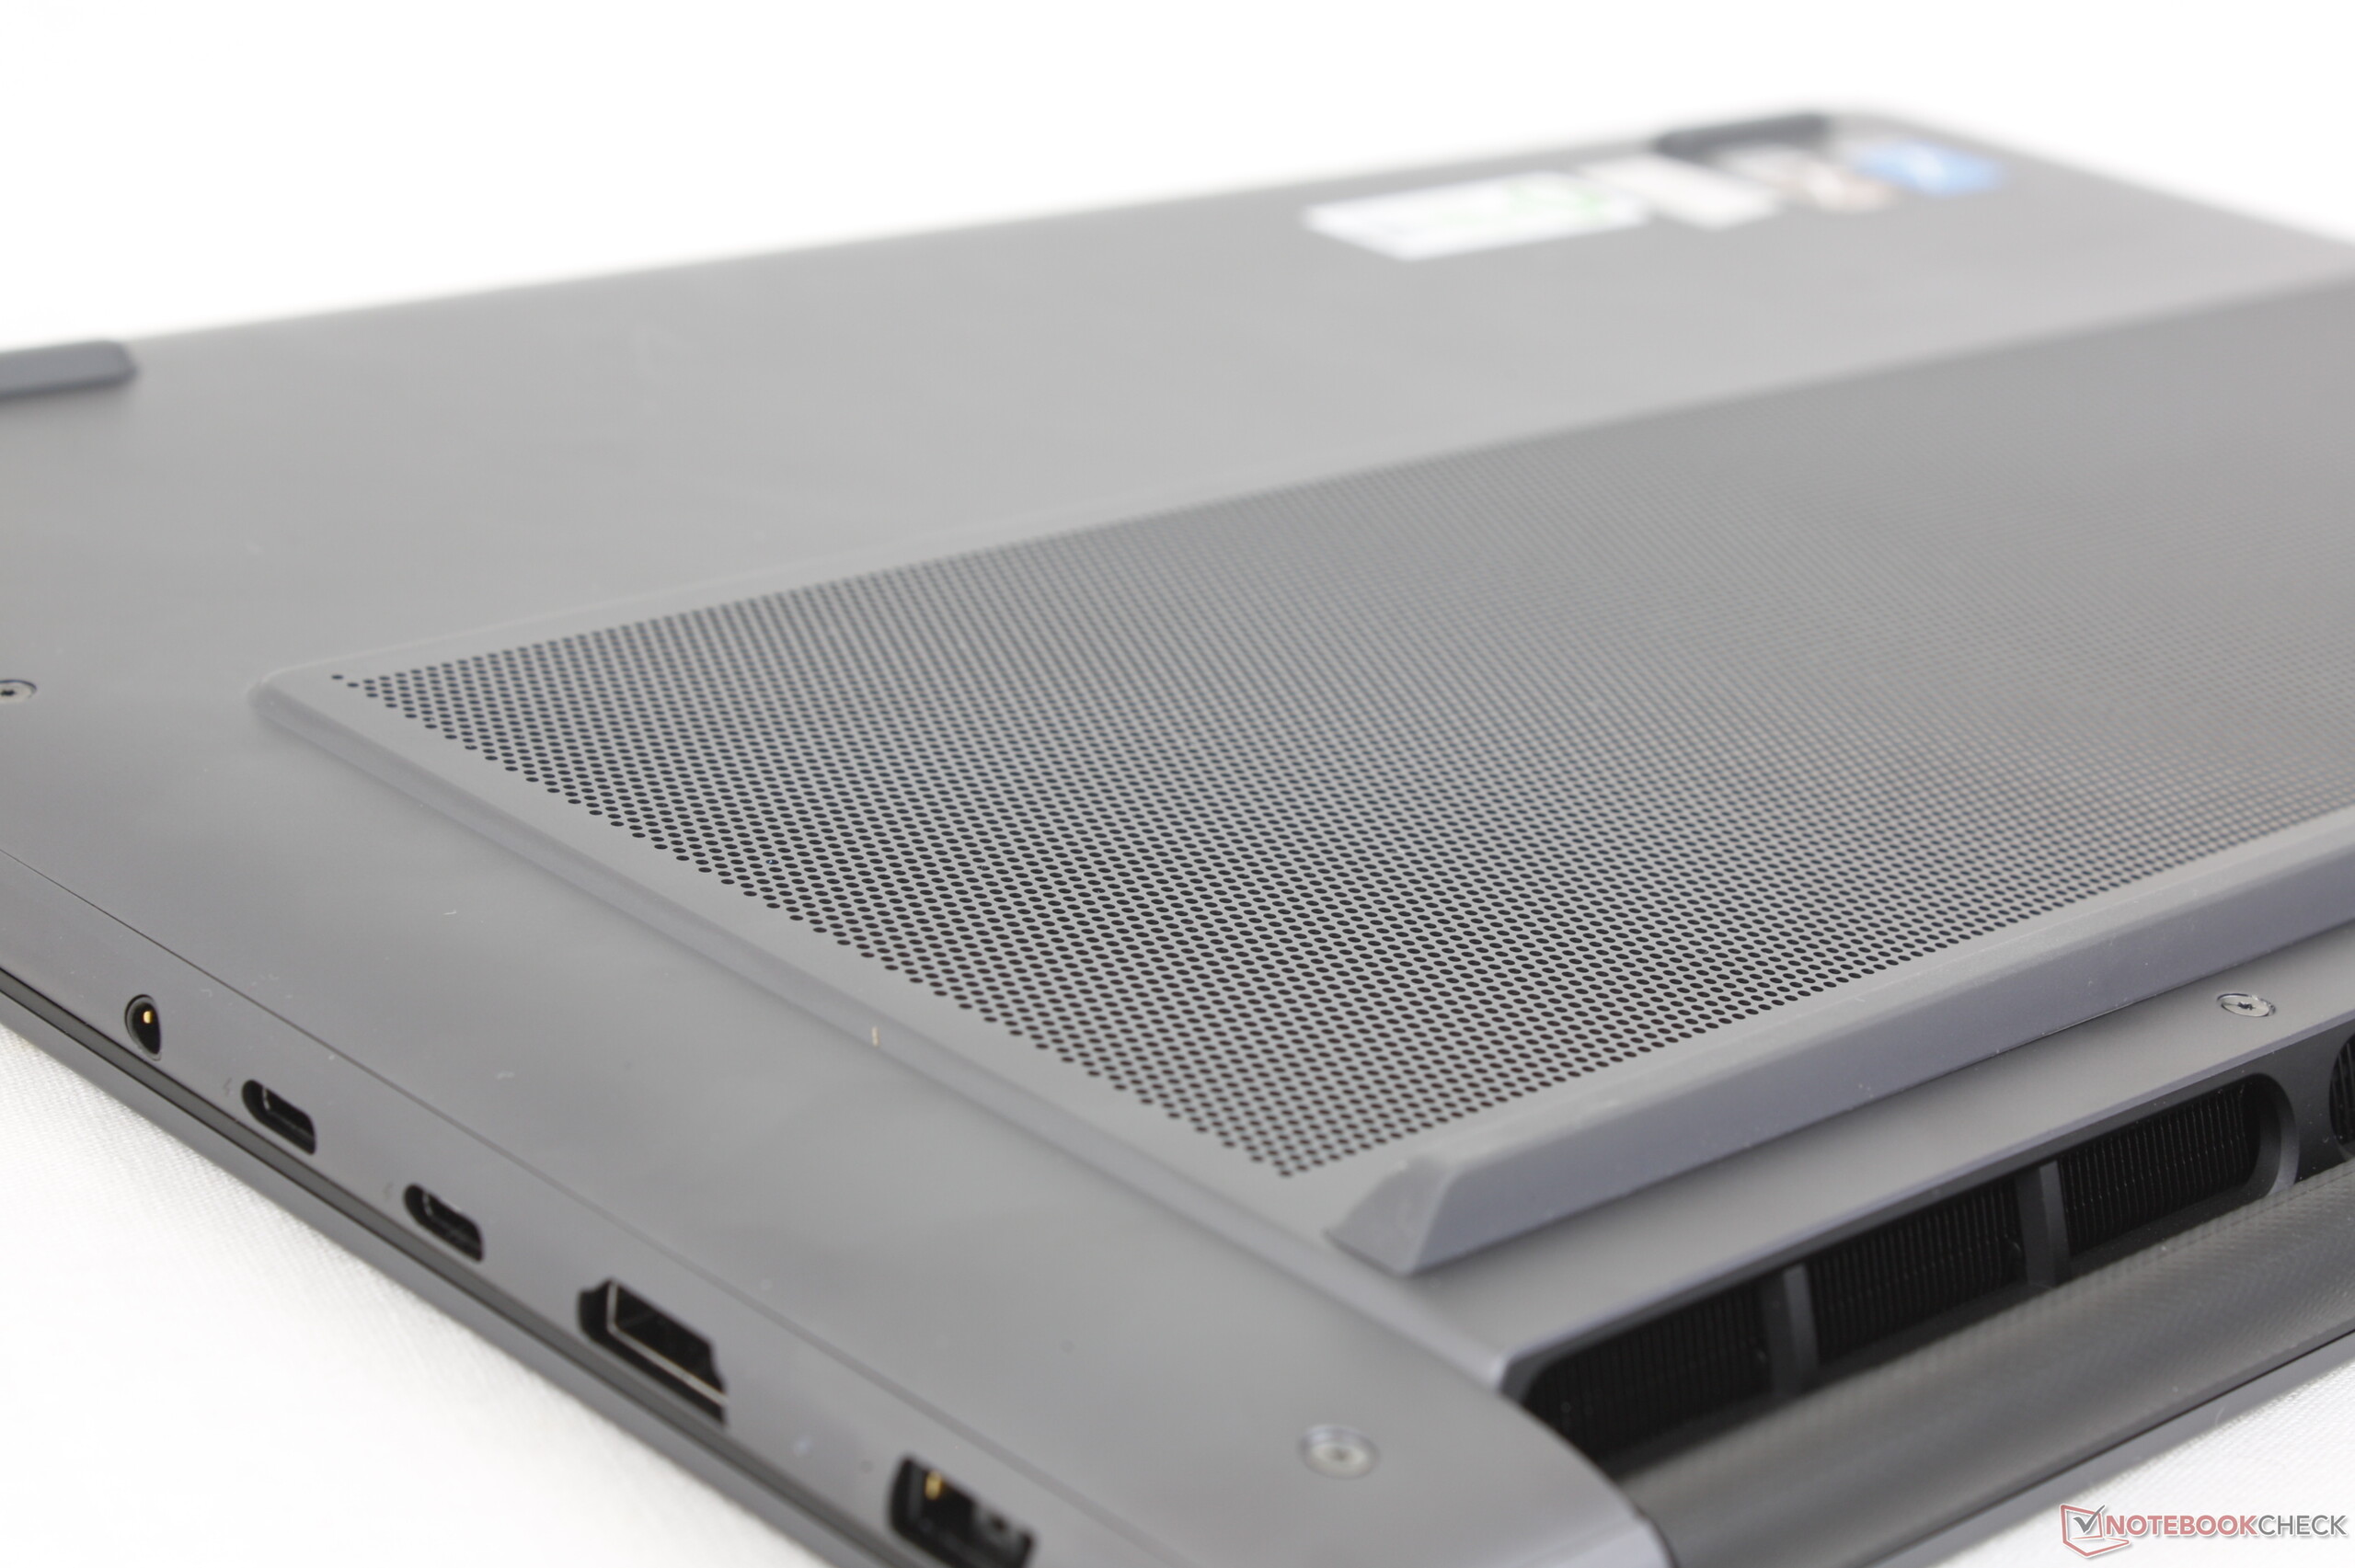
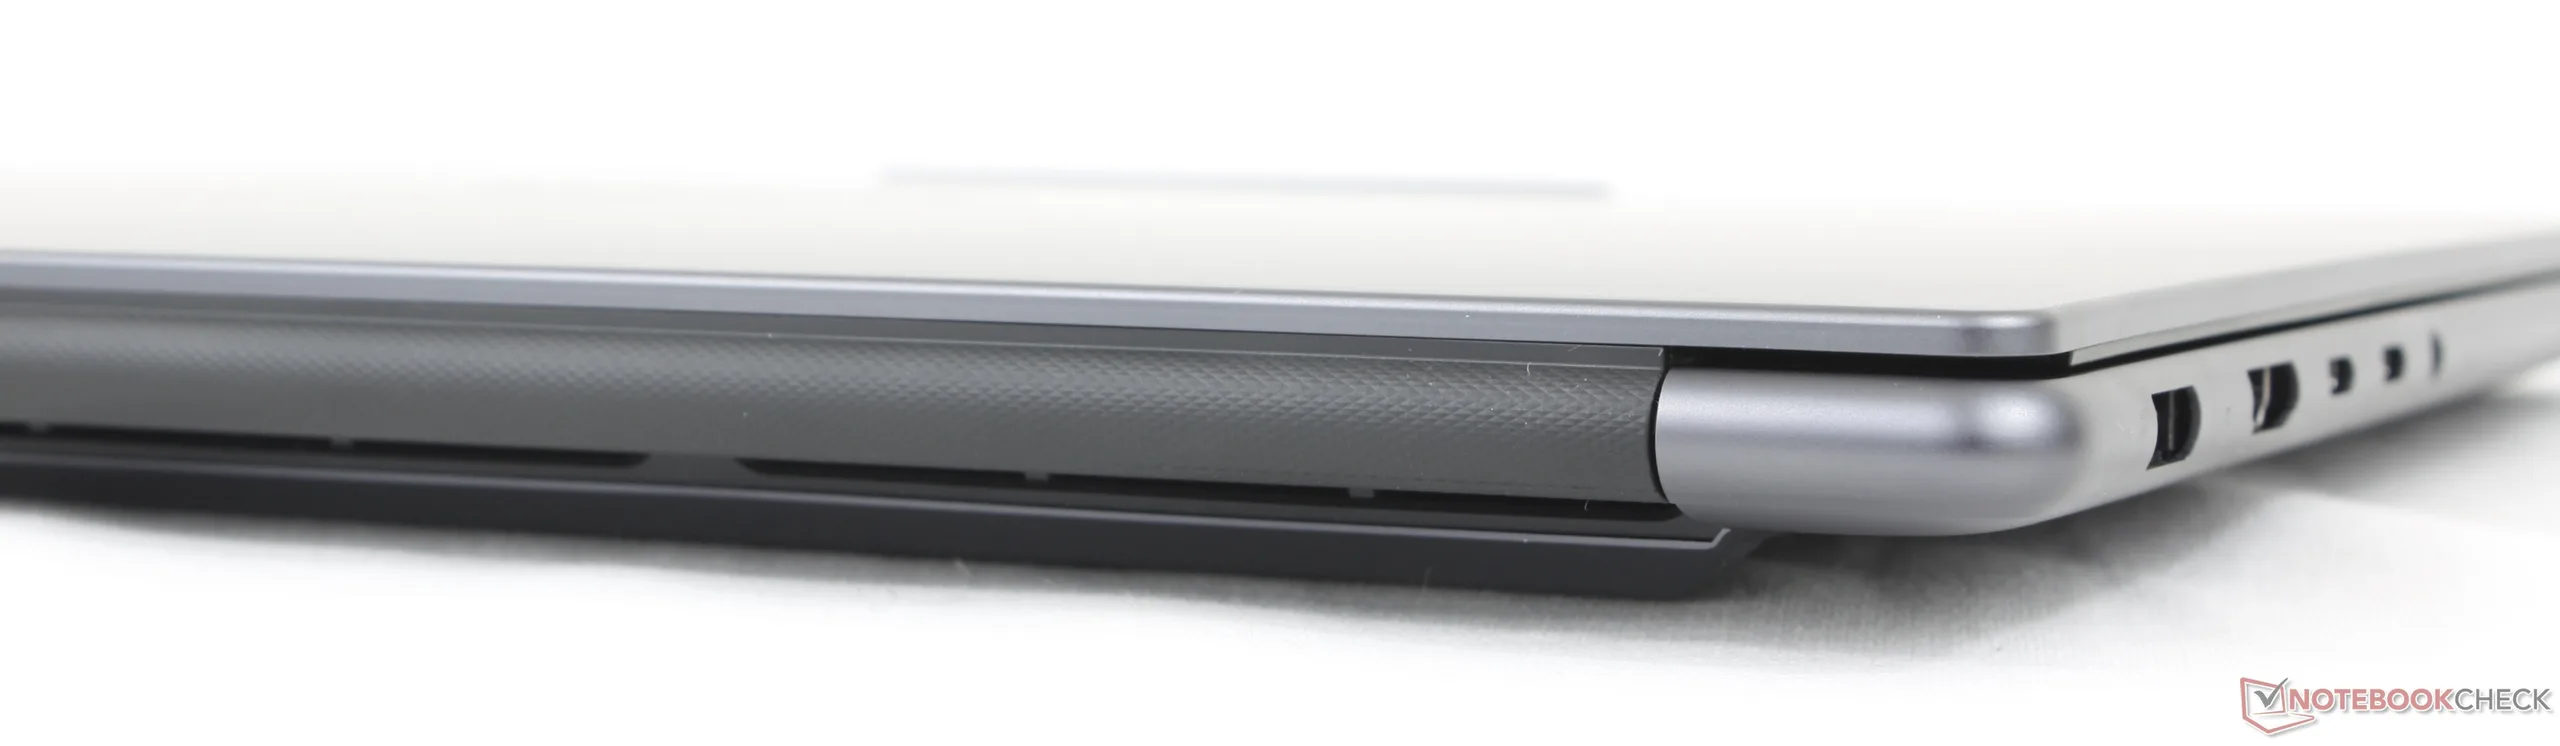
Lenovo har gjort flera externa förändringar från förra årets design. Den mest anmärkningsvärda är borttagandet av numpad till förmån för större uppåtgående högtalargaller längs sidorna av tangentbordet. Dessutom är det nedre D-locket inte längre helt platt eftersom ventilationsgallren nu är något upphöjda. Den laseretsade "Yoga"-etiketten som var så framträdande på förra årets modell har också tagits bort eftersom Lenovo vill betona "Pro"-namngivningen istället.
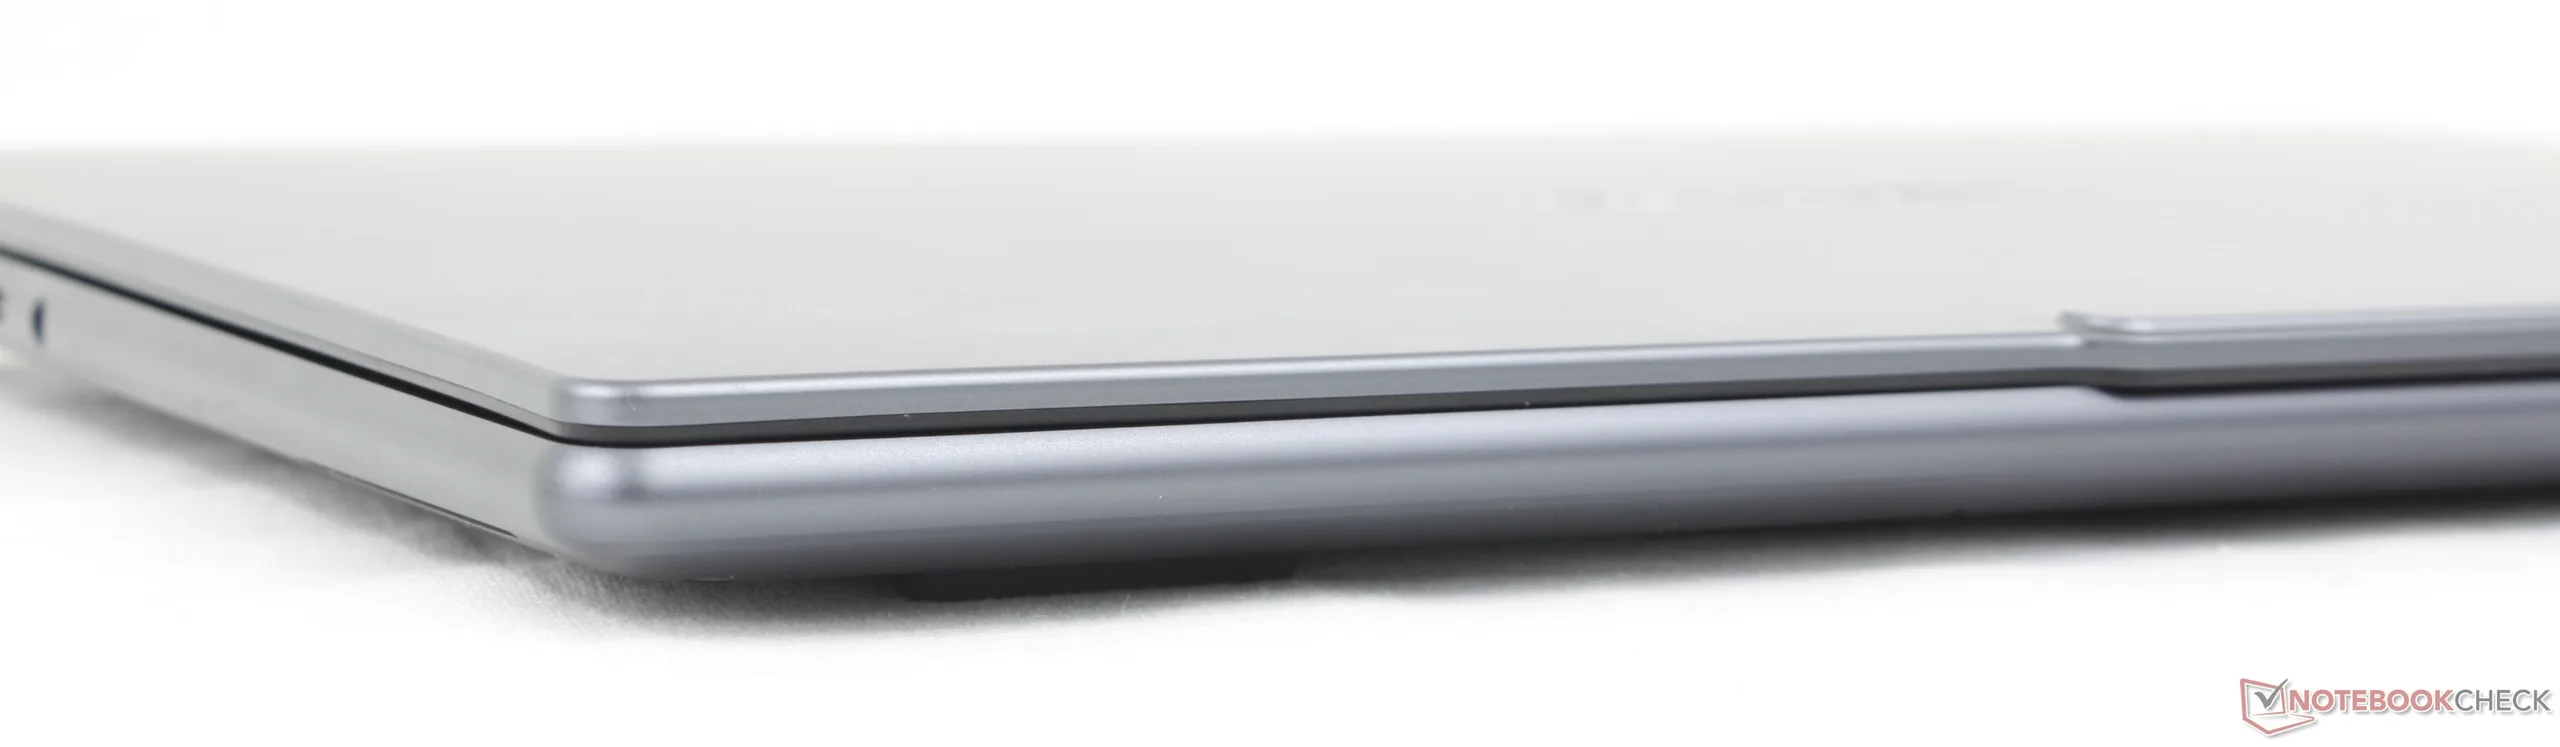
Den nya modellen är något tunnare, mindre och lättare än föregående generation men med i övrigt samma anodiserade aluminiummaterial för en liknande kvalitetsnivå.
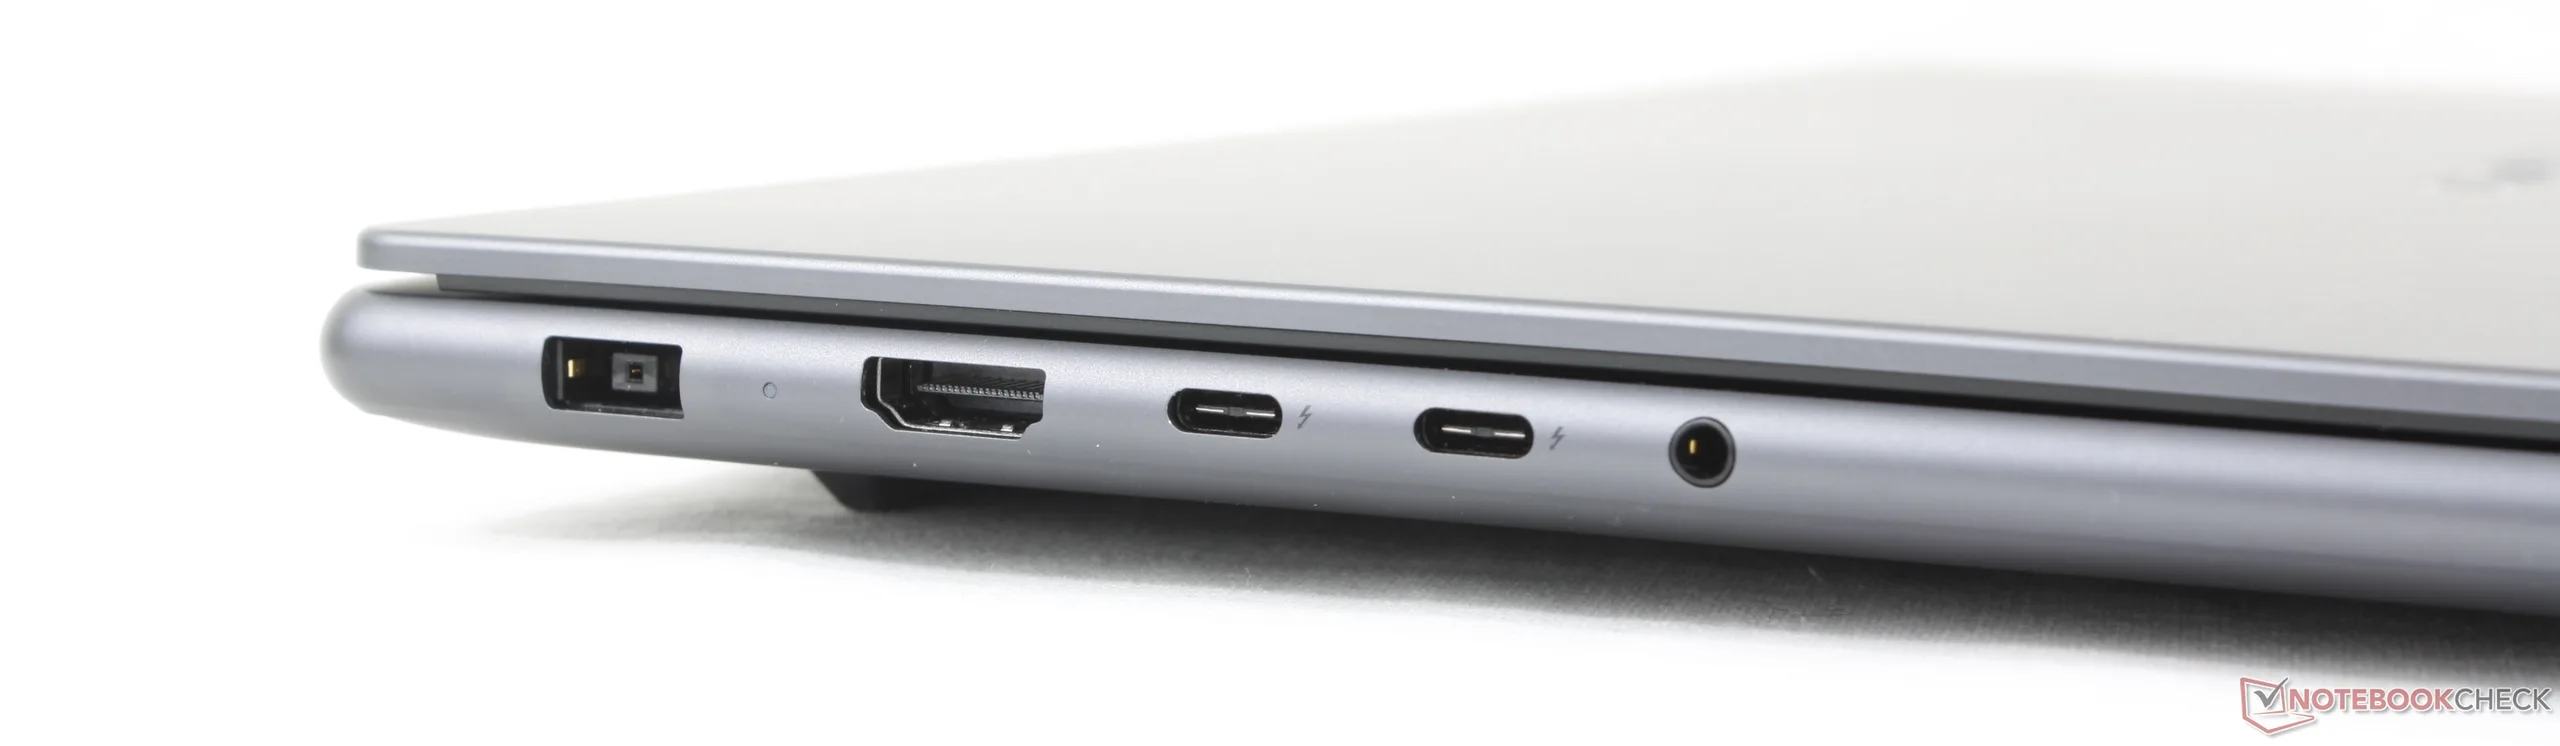
Anslutningsmöjligheter
Trots alla de fysiska förändringar som nämns ovan är portarna desamma som tidigare.

SD-kortläsare
| SD Card Reader | |
| average JPG Copy Test (av. of 3 runs) | |
| Lenovo Pro 9 16IPH11 (Toshiba Exceria Pro SDXC 64 GB UHS-II) | |
| Asus ProArt P16 H7606WP (Angelbird AV Pro V60) | |
| MSI Prestige 16 AI Evo B2HMG (Angelbird AV Pro V60) | |
| Lenovo Yoga Pro 9 16IAH10 RTX 5050 (Angelbird AV Pro V60) | |
| maximum AS SSD Seq Read Test (1GB) | |
| Asus ProArt P16 H7606WP (Angelbird AV Pro V60) | |
| Lenovo Pro 9 16IPH11 (Toshiba Exceria Pro SDXC 64 GB UHS-II) | |
| Lenovo Yoga Pro 9 16IAH10 RTX 5050 (Angelbird AV Pro V60) | |
| MSI Prestige 16 AI Evo B2HMG (Angelbird AV Pro V60) | |
Kommunikation
Webbkamera


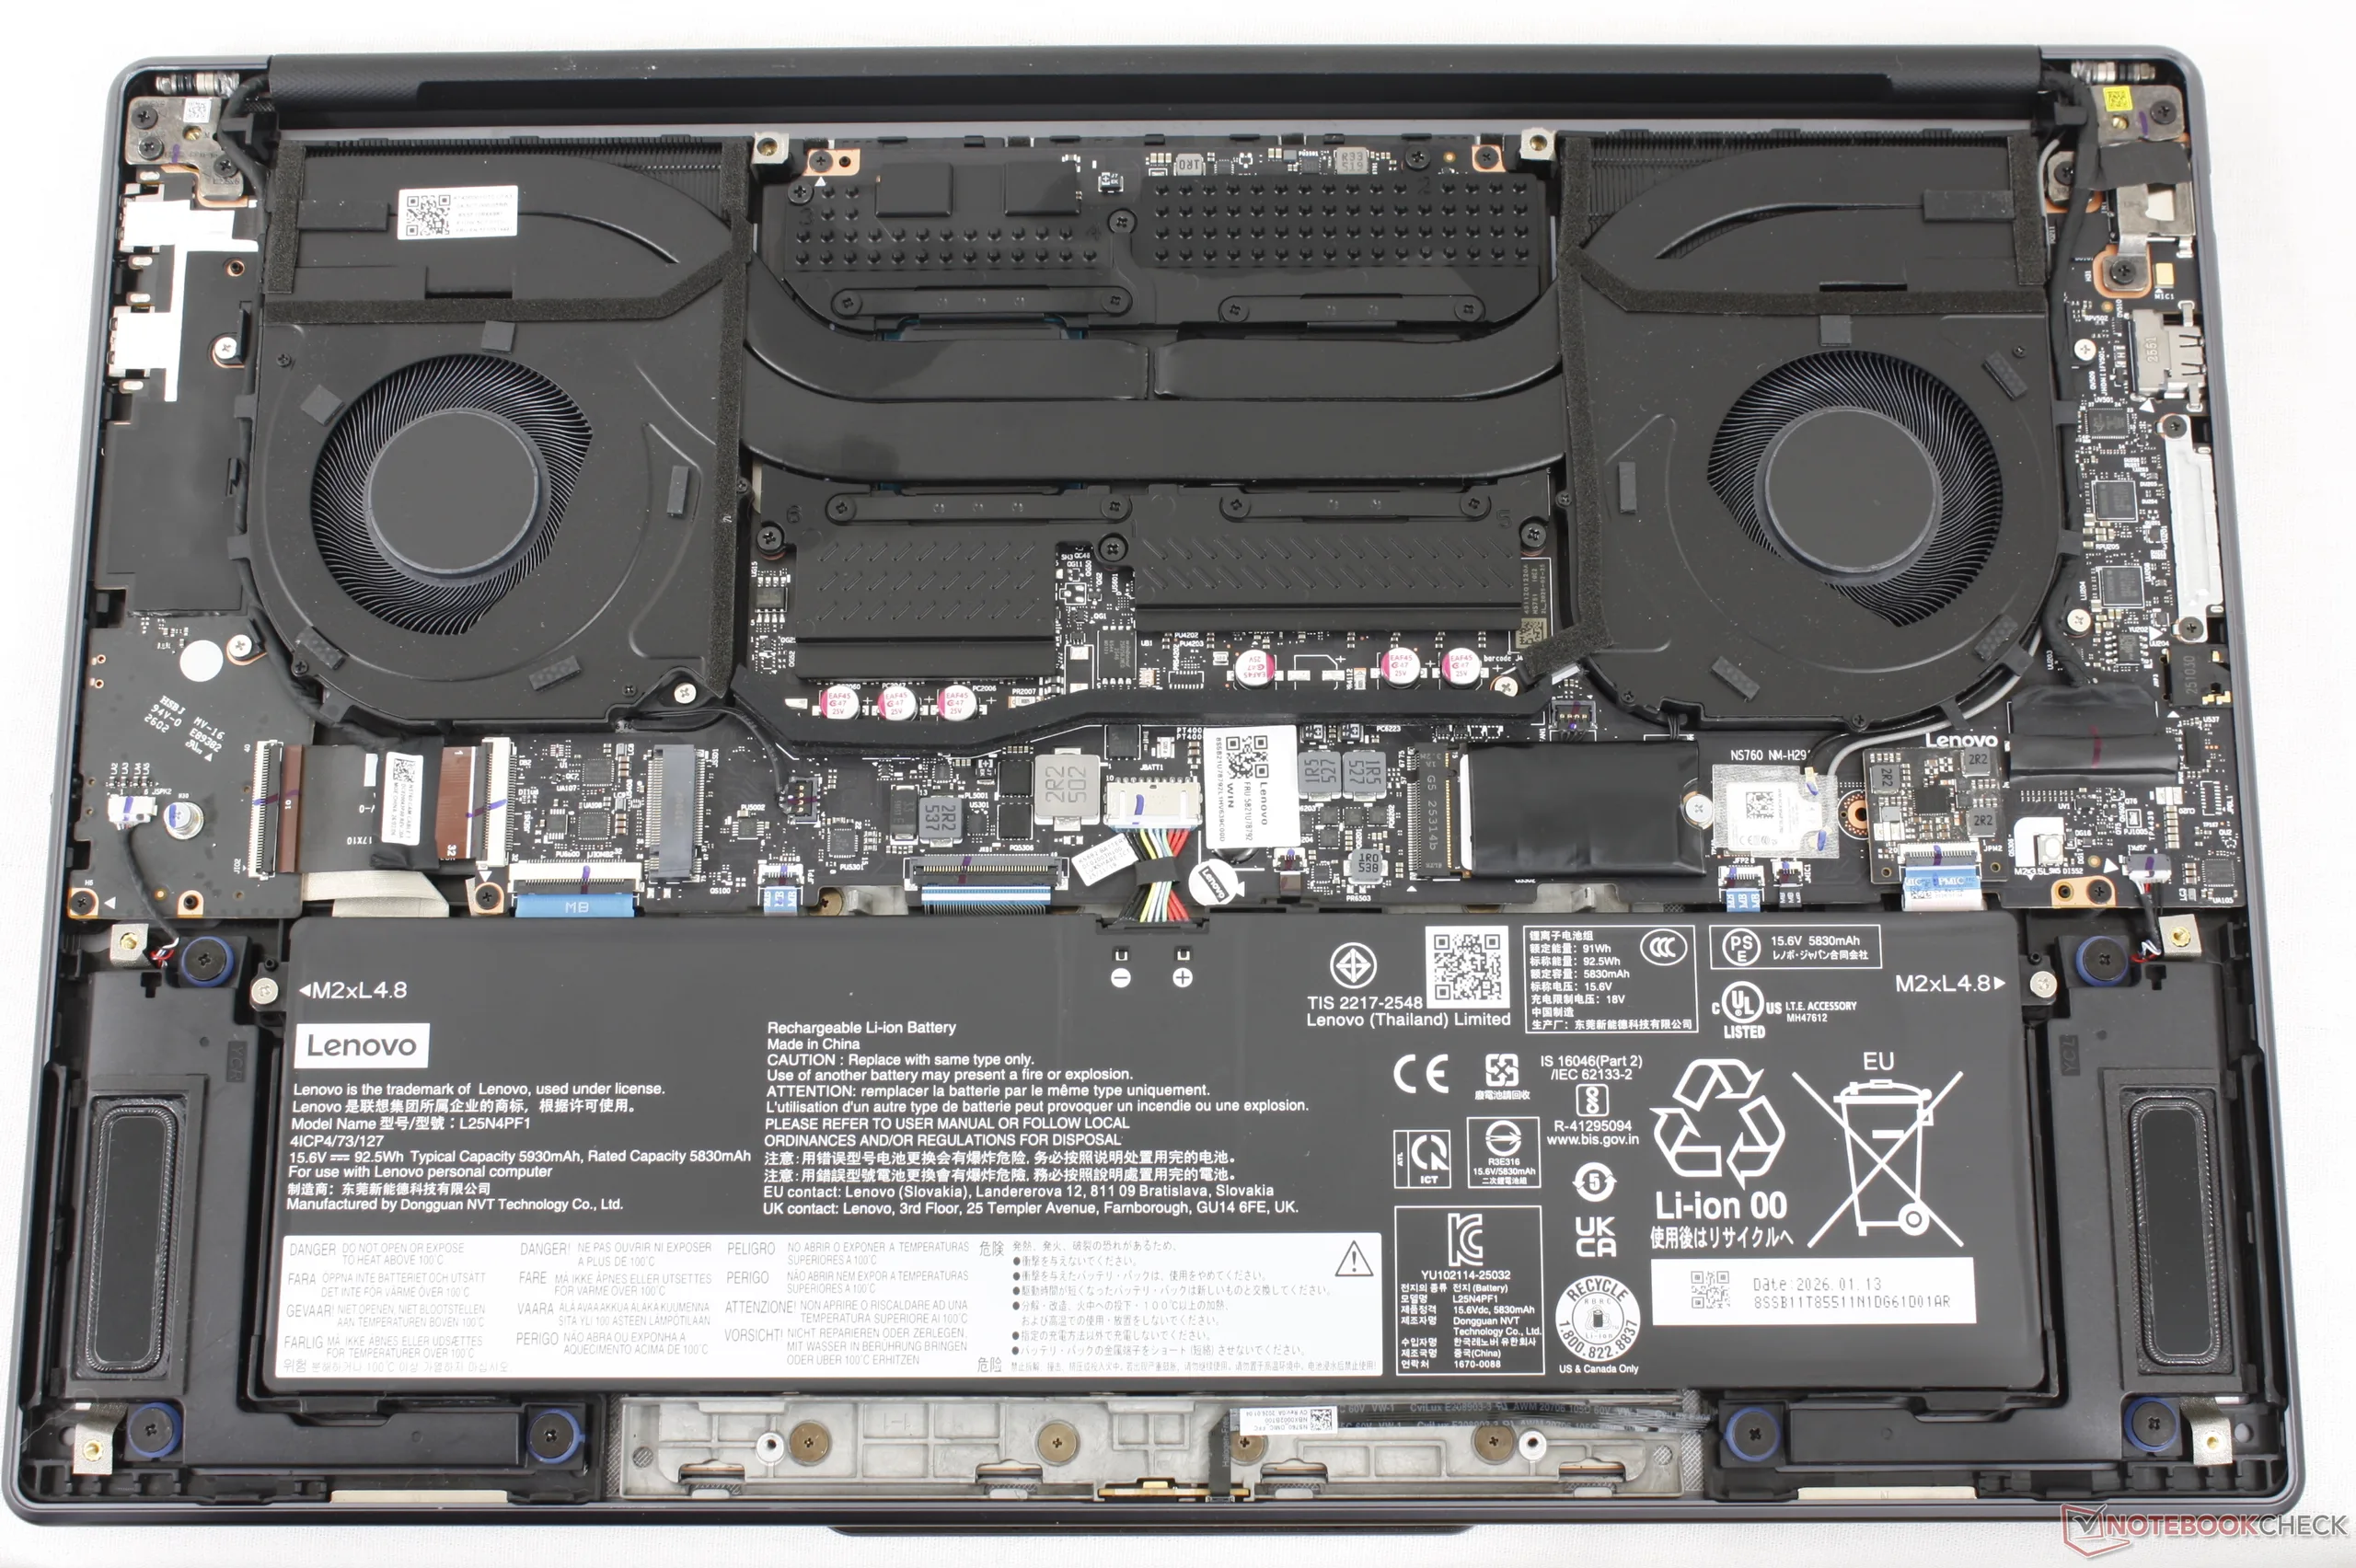
Underhåll
Interndelarna har genomgått mindre förändringar. Den mest anmärkningsvärda är den något större batterikapaciteten (84 Wh till 93 Wh), men SSD-uppgraderingsalternativen är annars desamma som tidigare.

Hållbarhet
Lenovo lämnar inga uppgifter om återvunna material som använts vid tillverkningen. Förpackningen är i övrigt fri från plast och helt återvinningsbar.
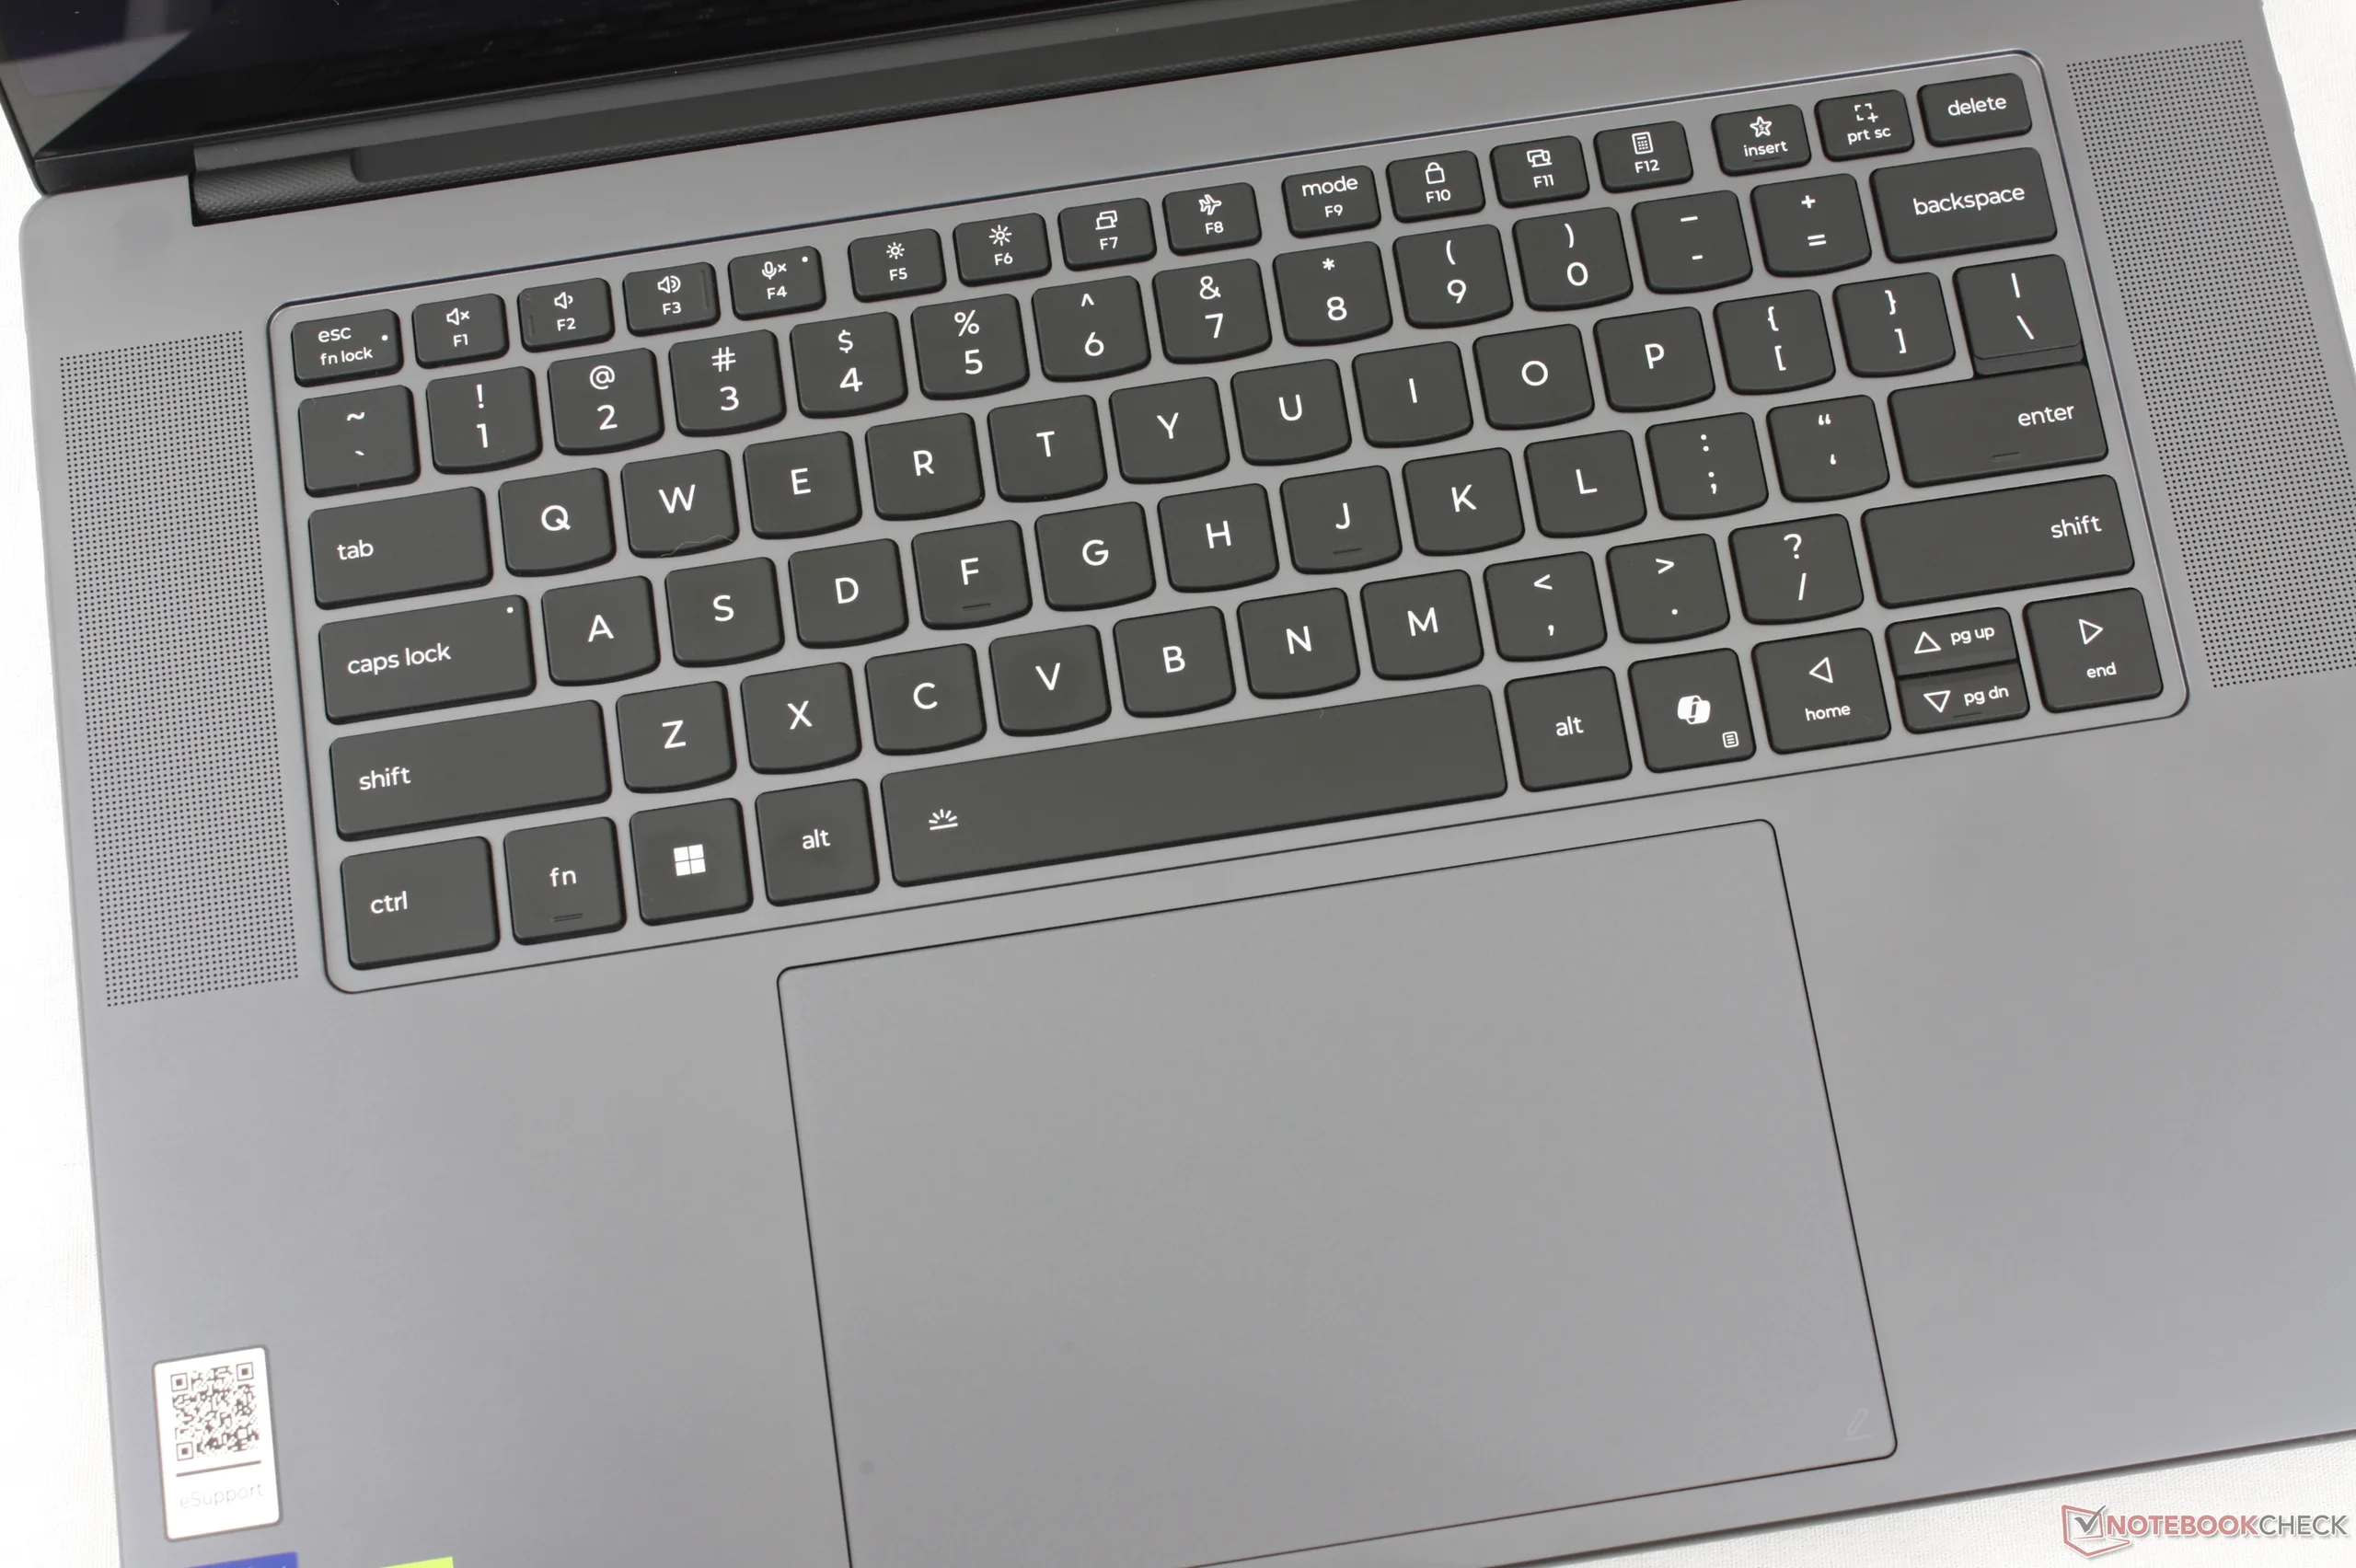
Inmatningsenheter
Tangenternas typsnitt och tryck har ändrats från förra årets modell och är nu större, centrerade och i allmänhet lättare att se. Tangenternas känsla är i övrigt densamma, inklusive 1,5 mm slaglängd och relativt skarp återkoppling, vilket ger en liknande skrivupplevelse trots avsaknaden av ett numeriskt tangentbord.
Display

De två pekskärmsalternativen är desamma som tidigare:
- 2880 x 1800, OLED, 500 nits SDR (1100 nits HDR), 100% DCI-P3, 120 Hz, Gorilla Glass 3
- 3200 x 2000, Tandem OLED, 1000 nits SDR (1600 nits HDR), 100% DCI-P3, 120 Hz, Gorilla Glass 3
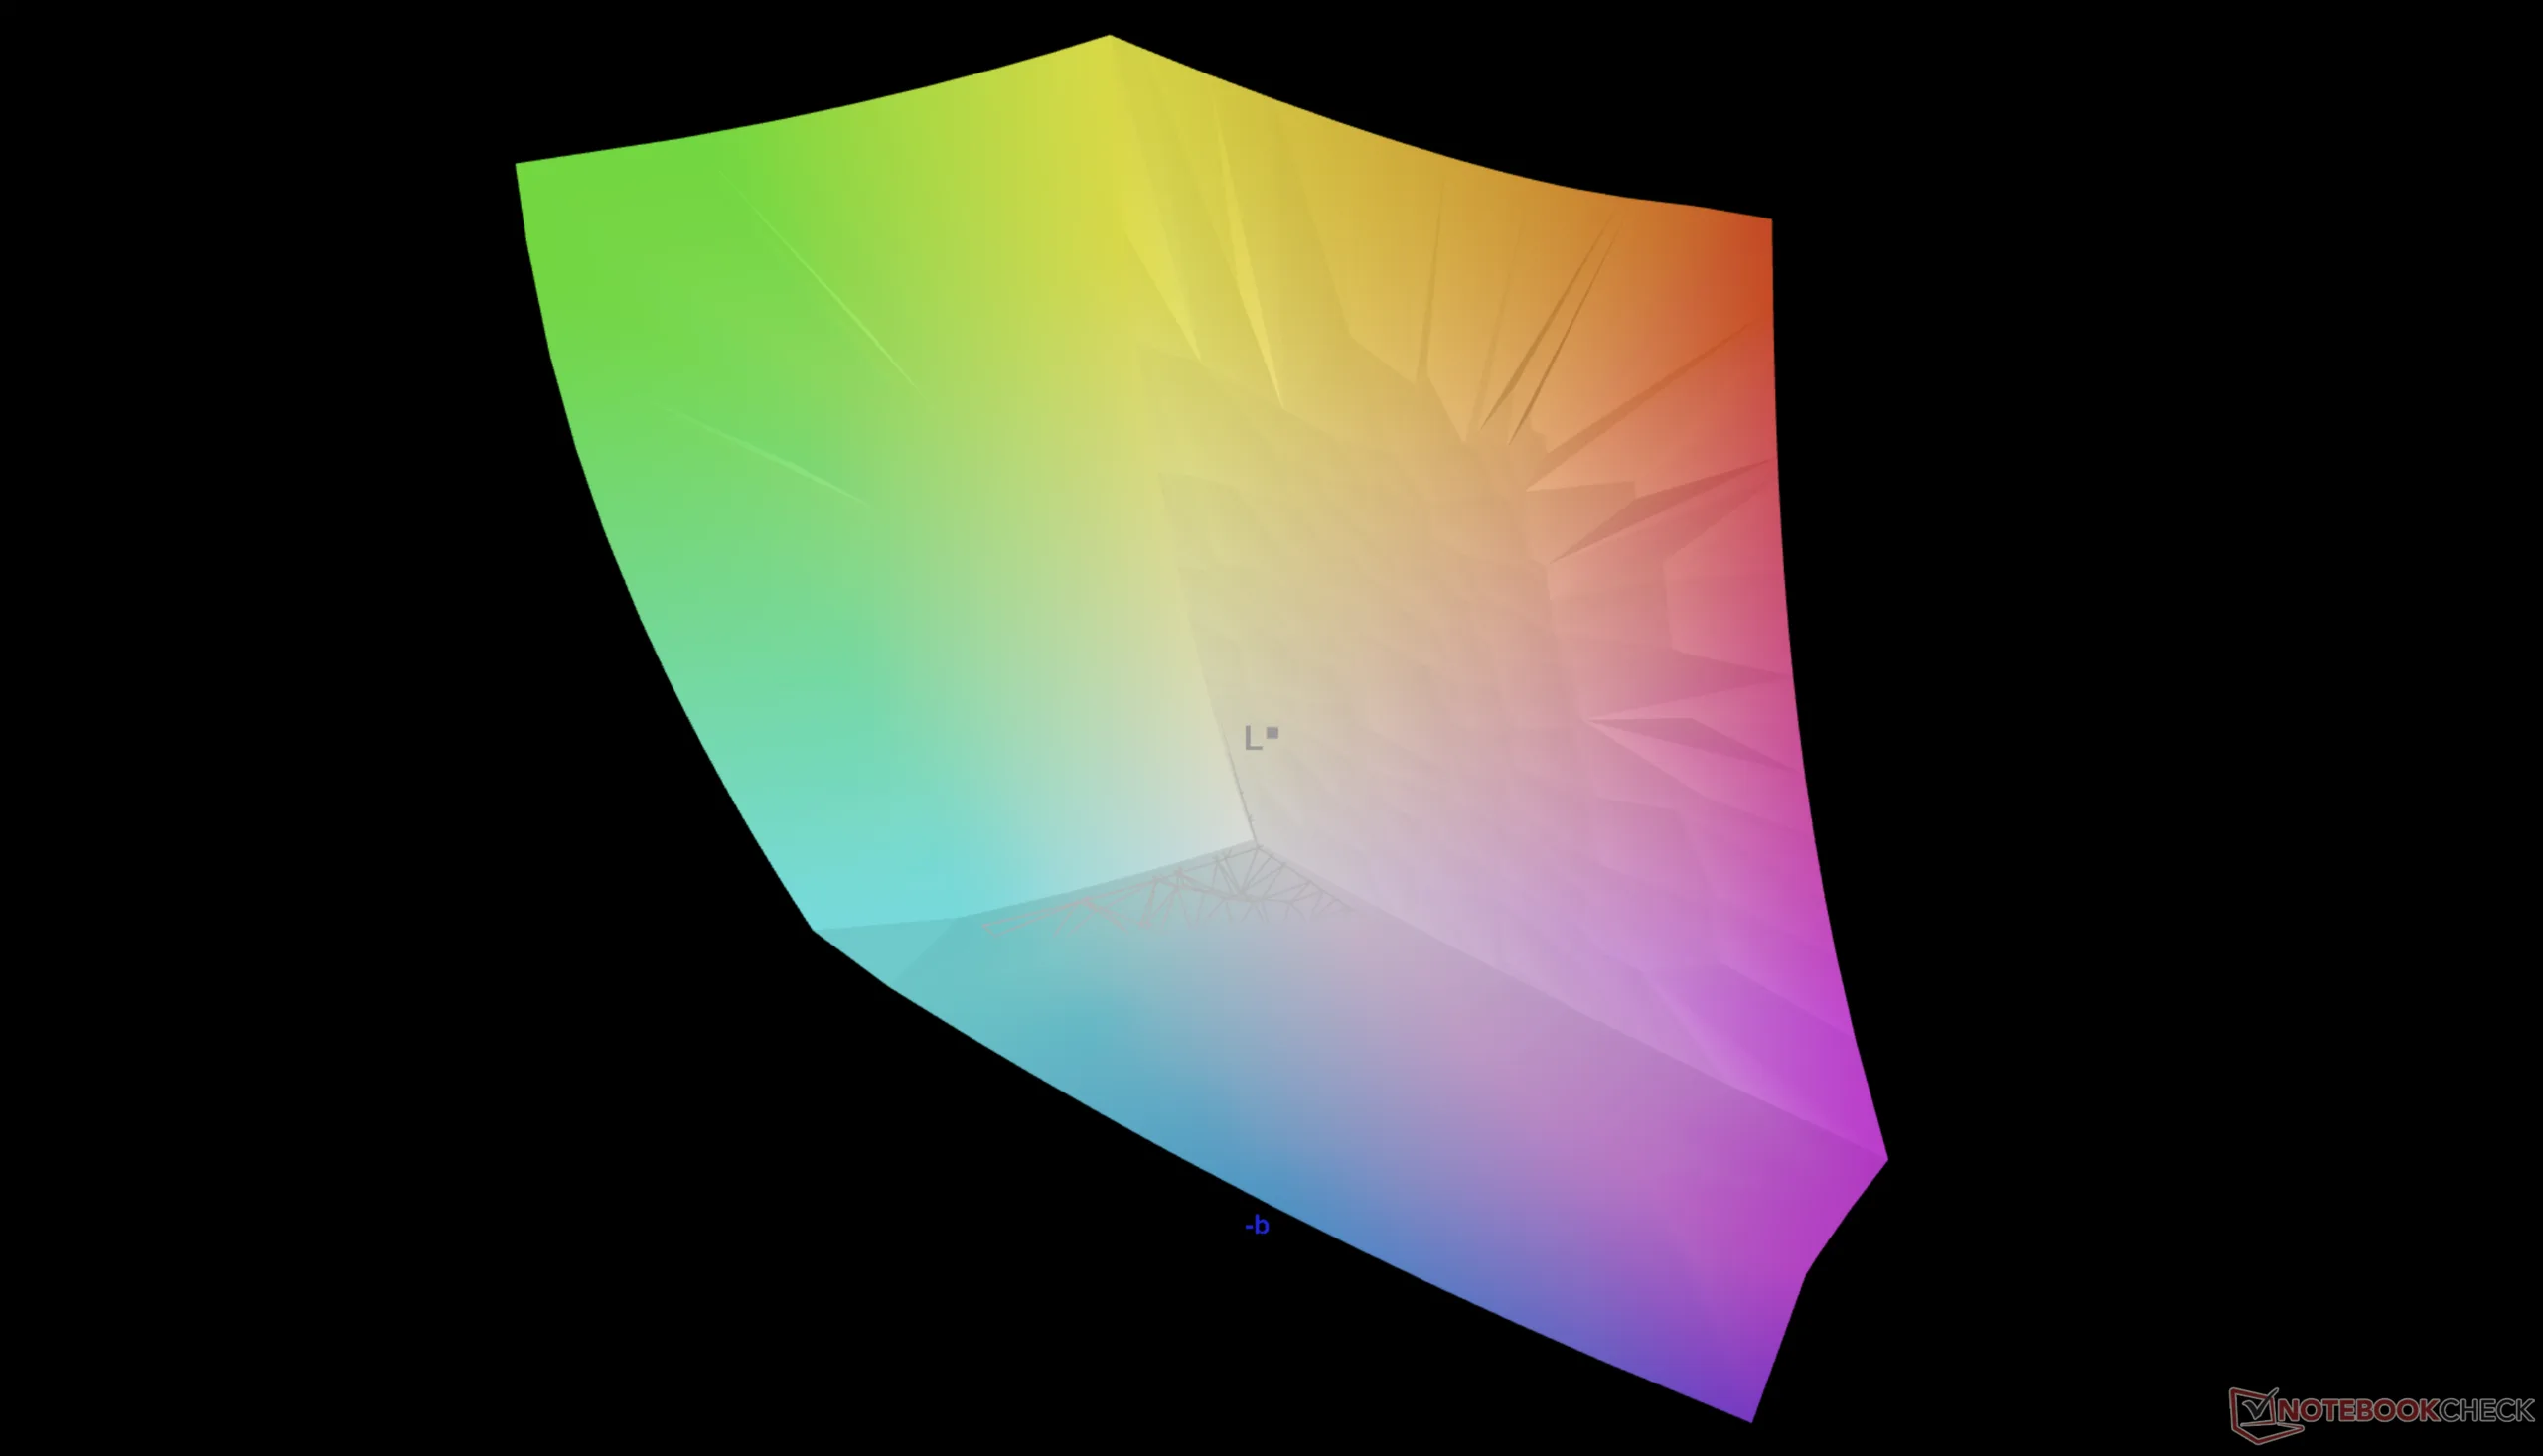
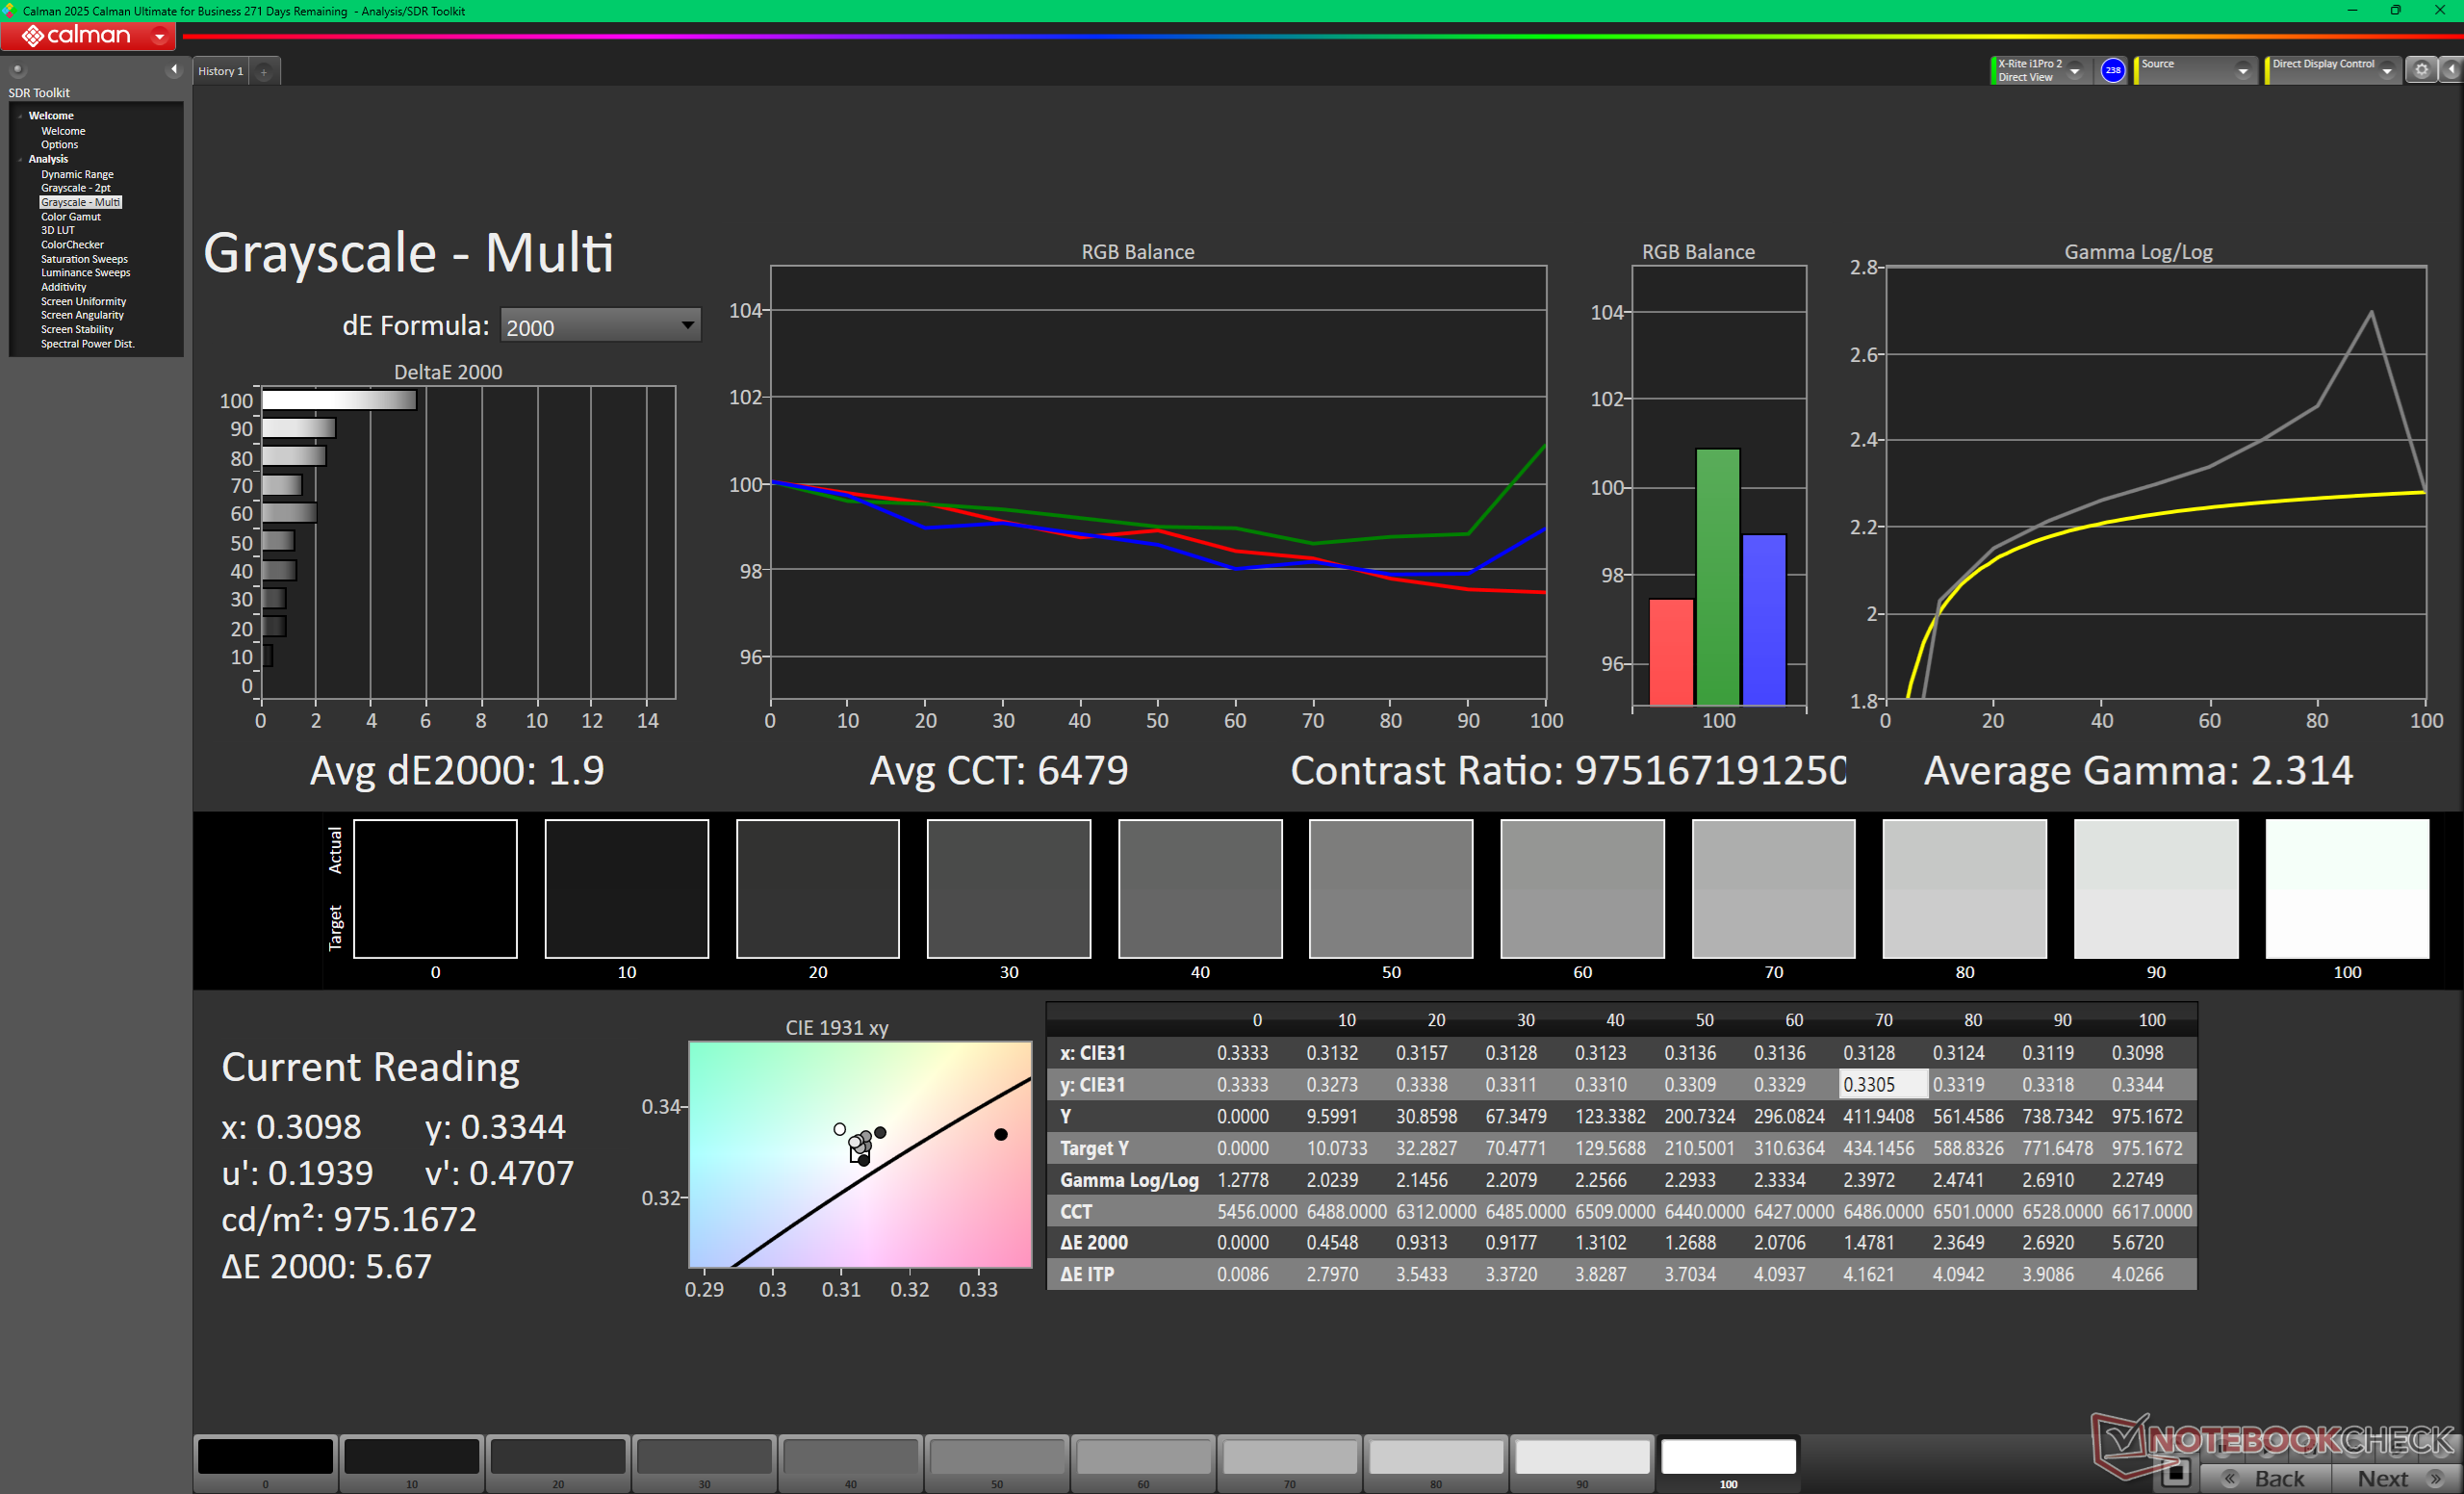
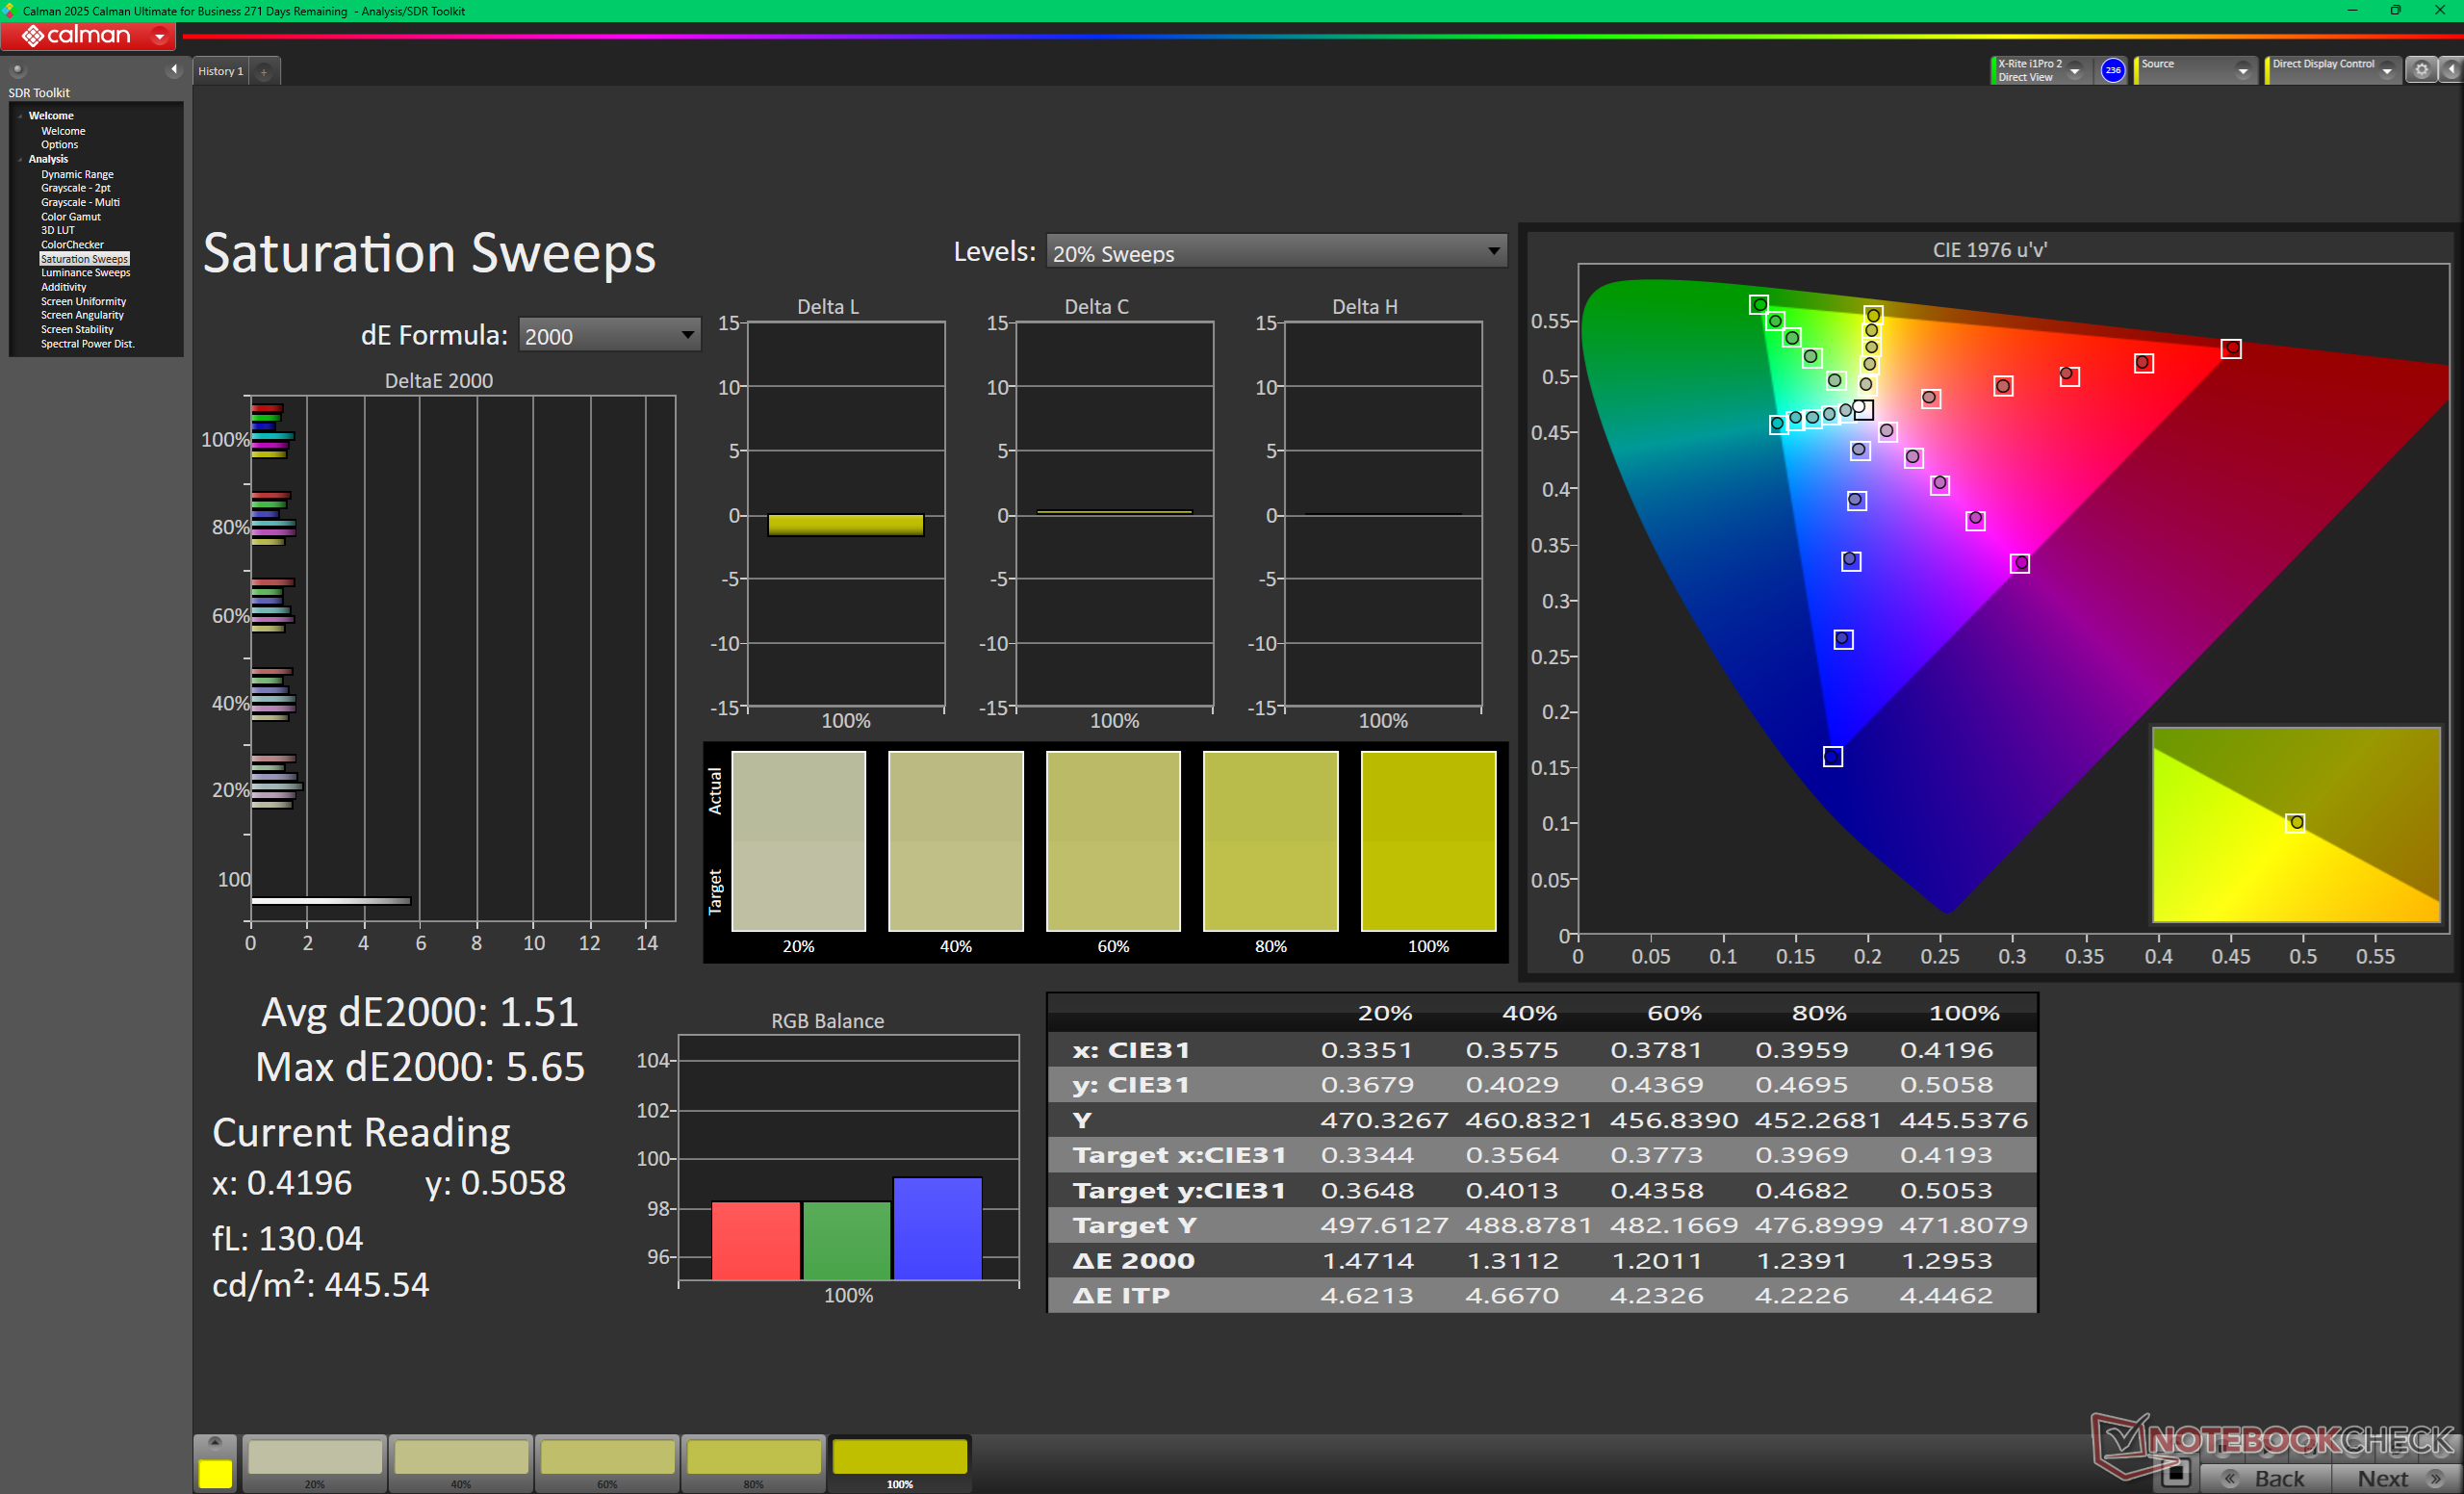
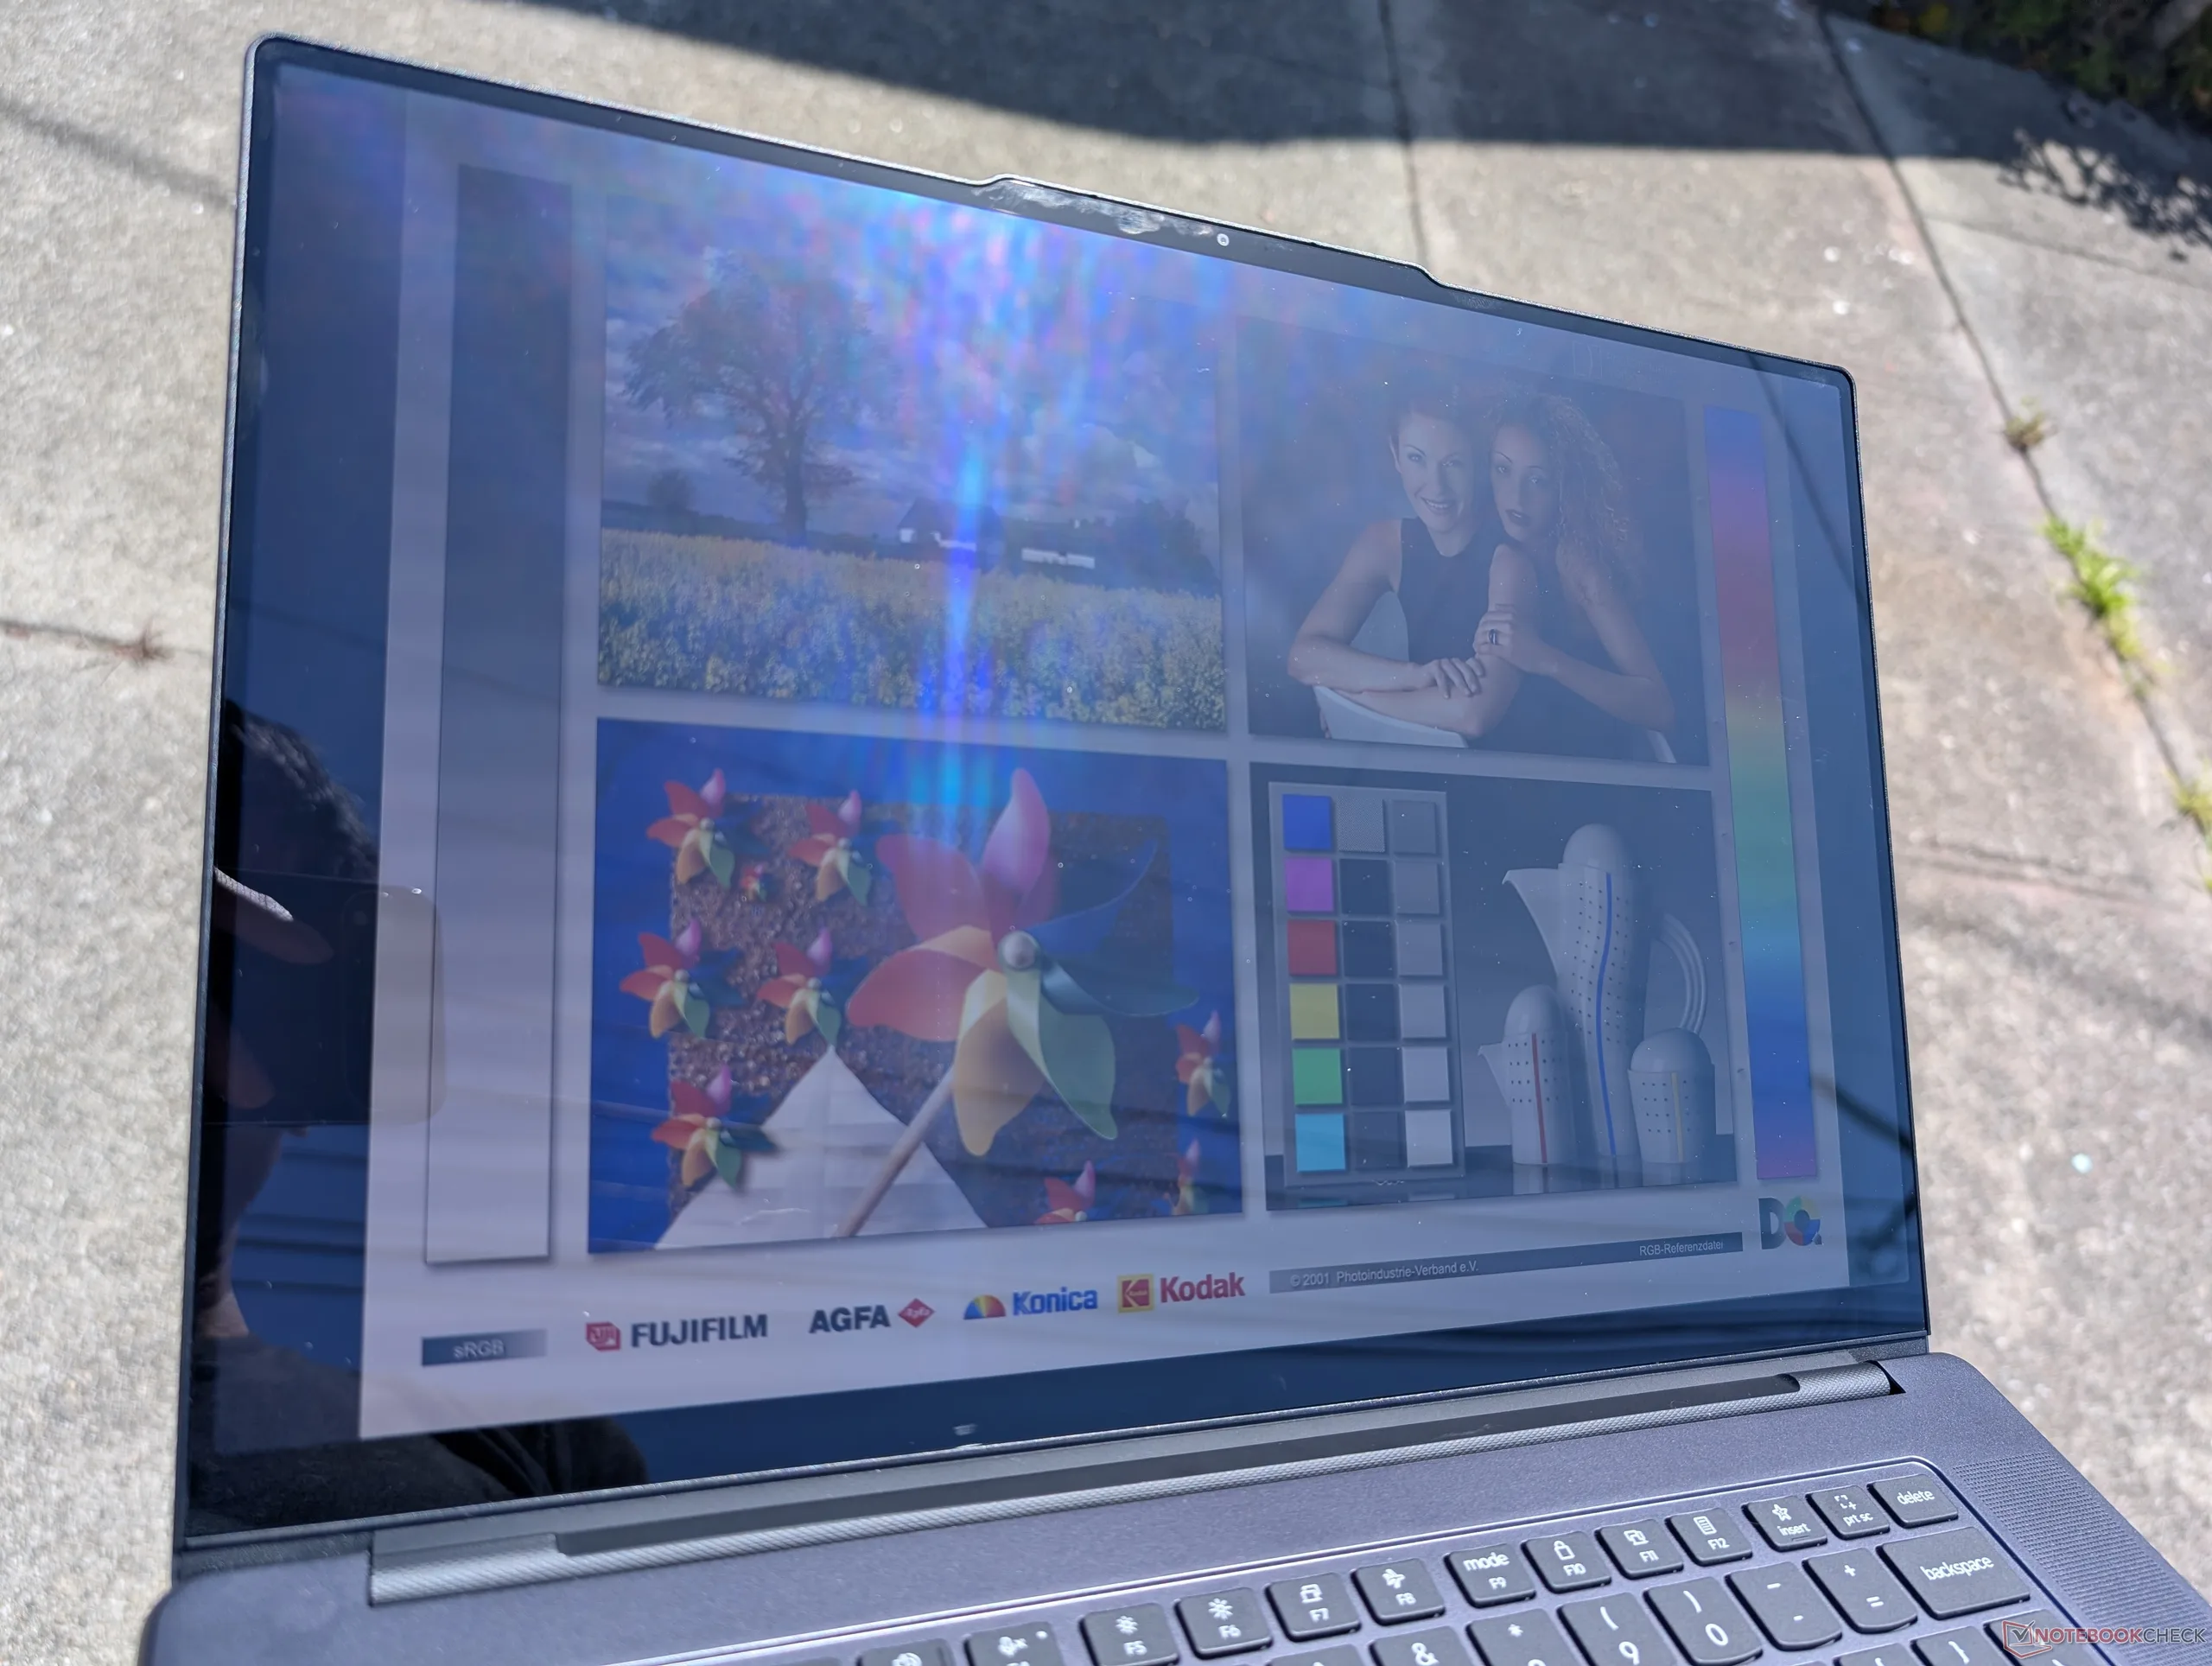
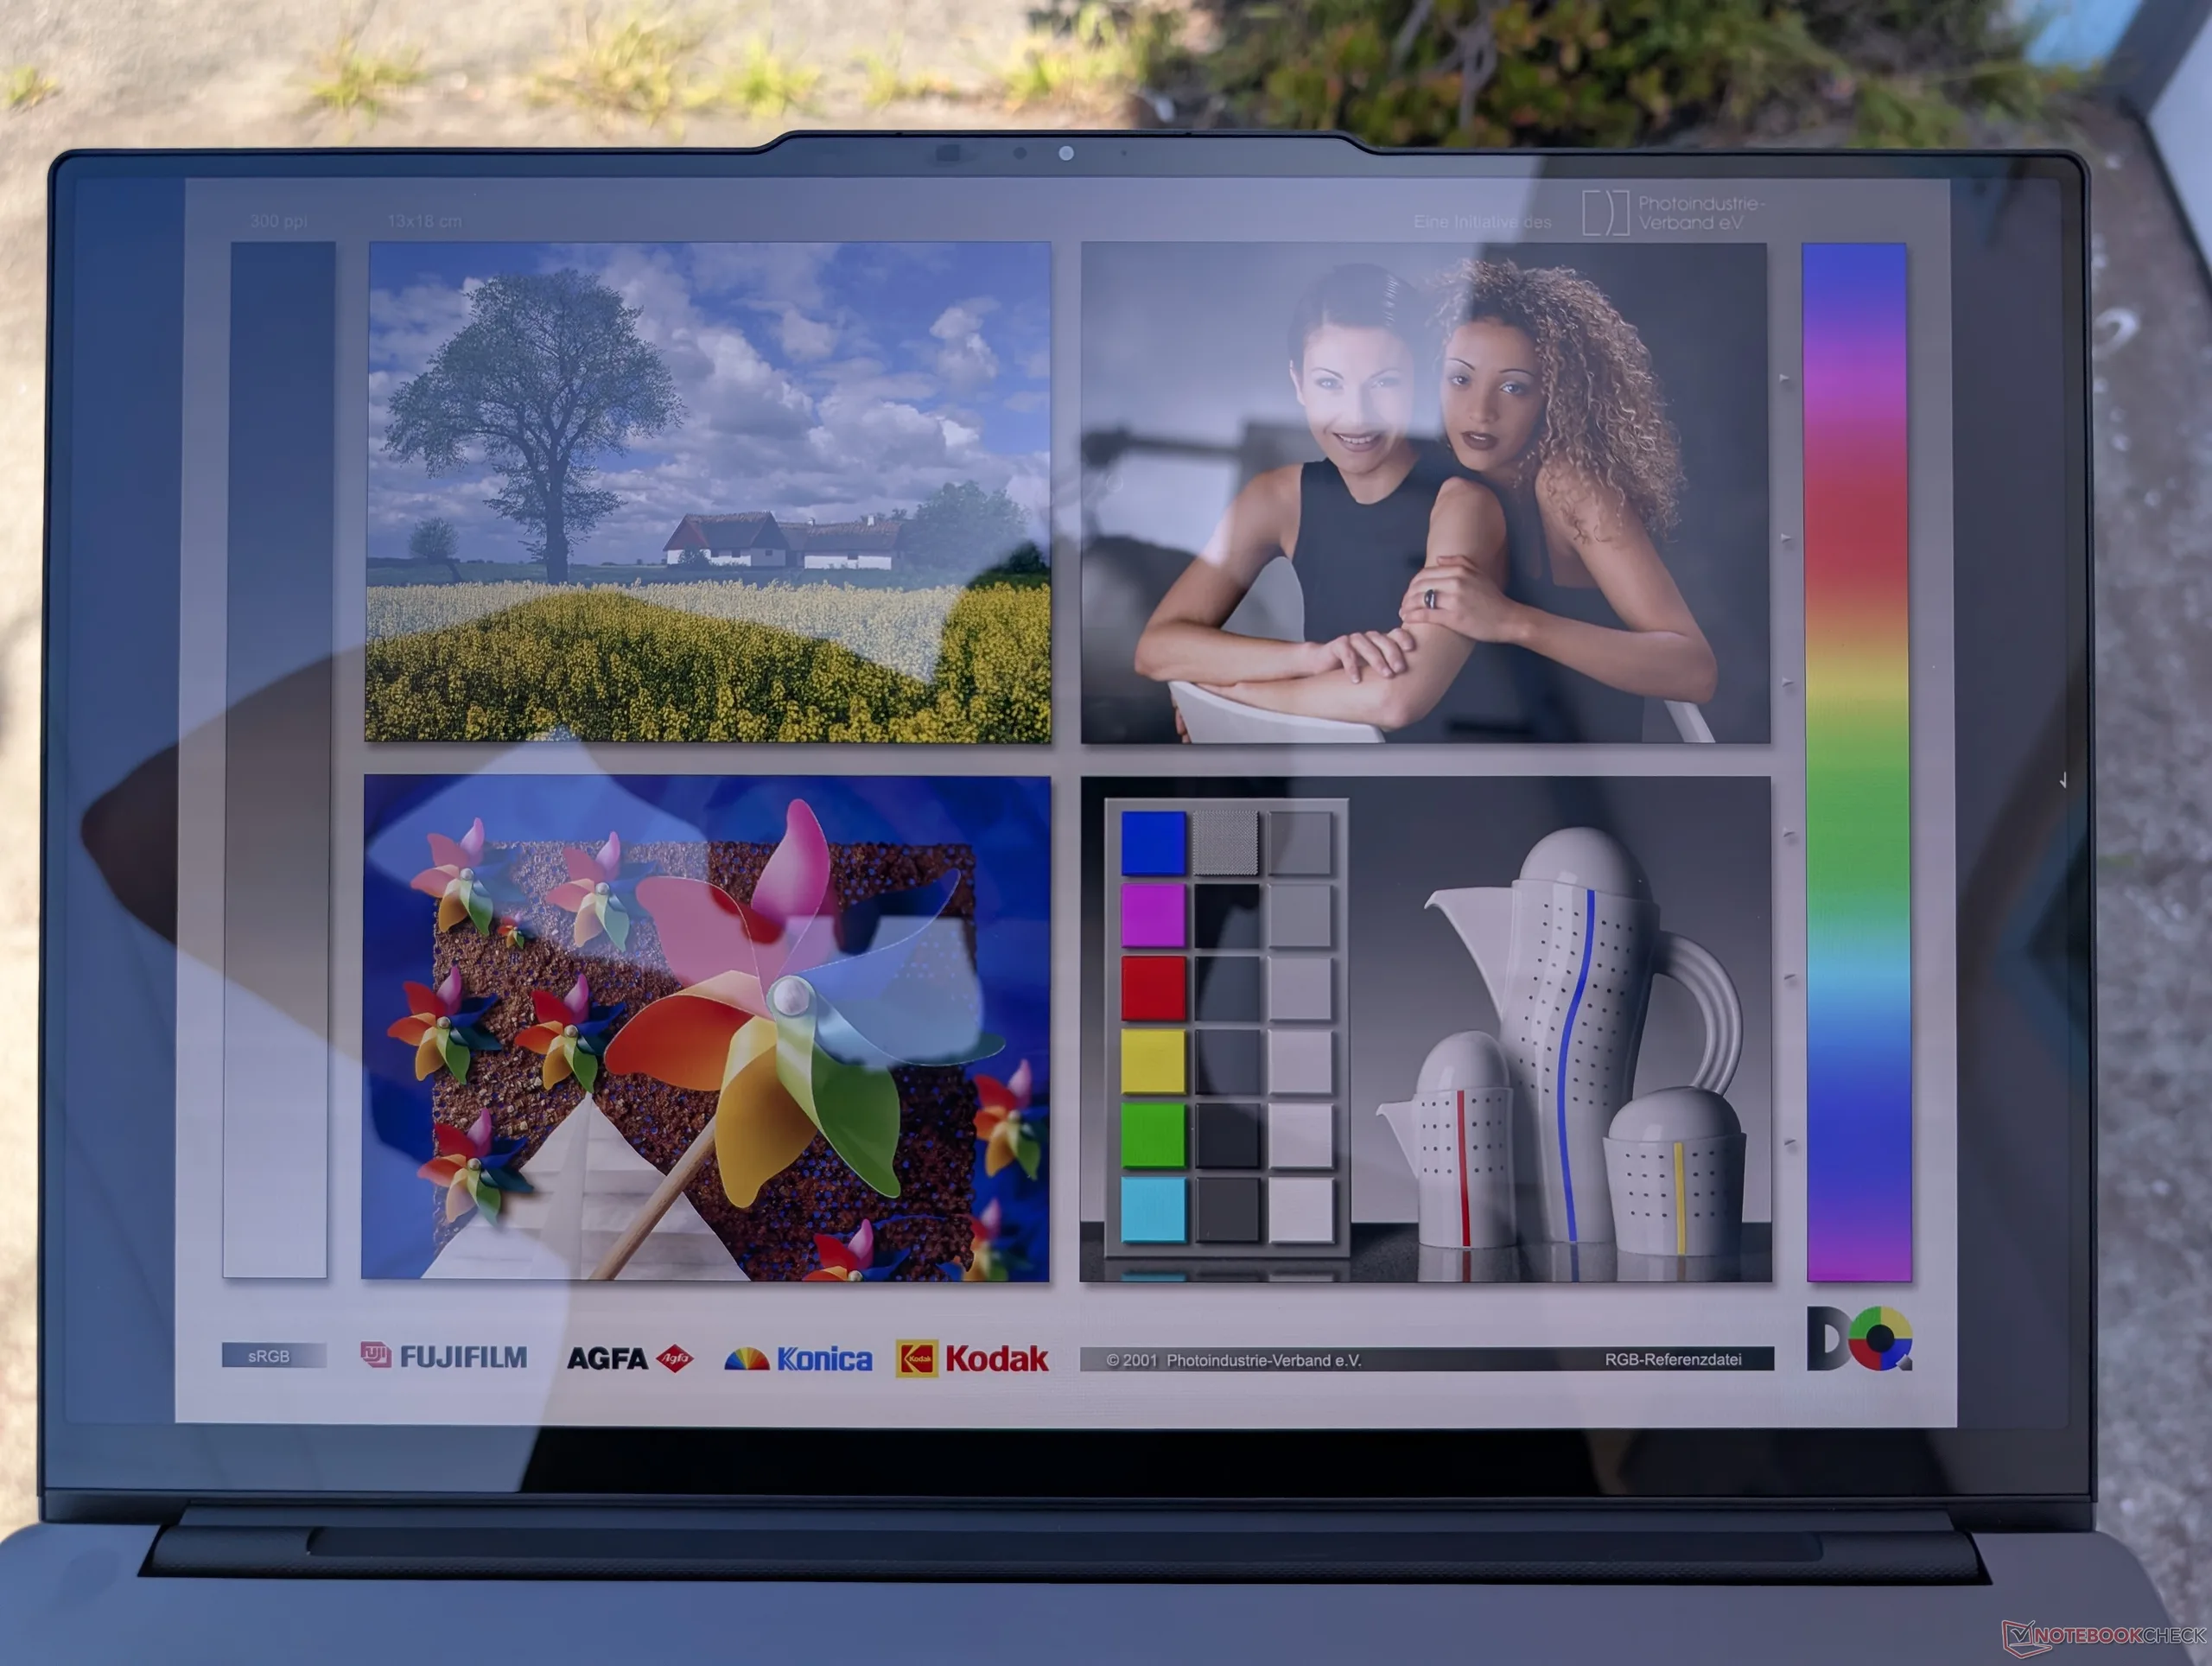
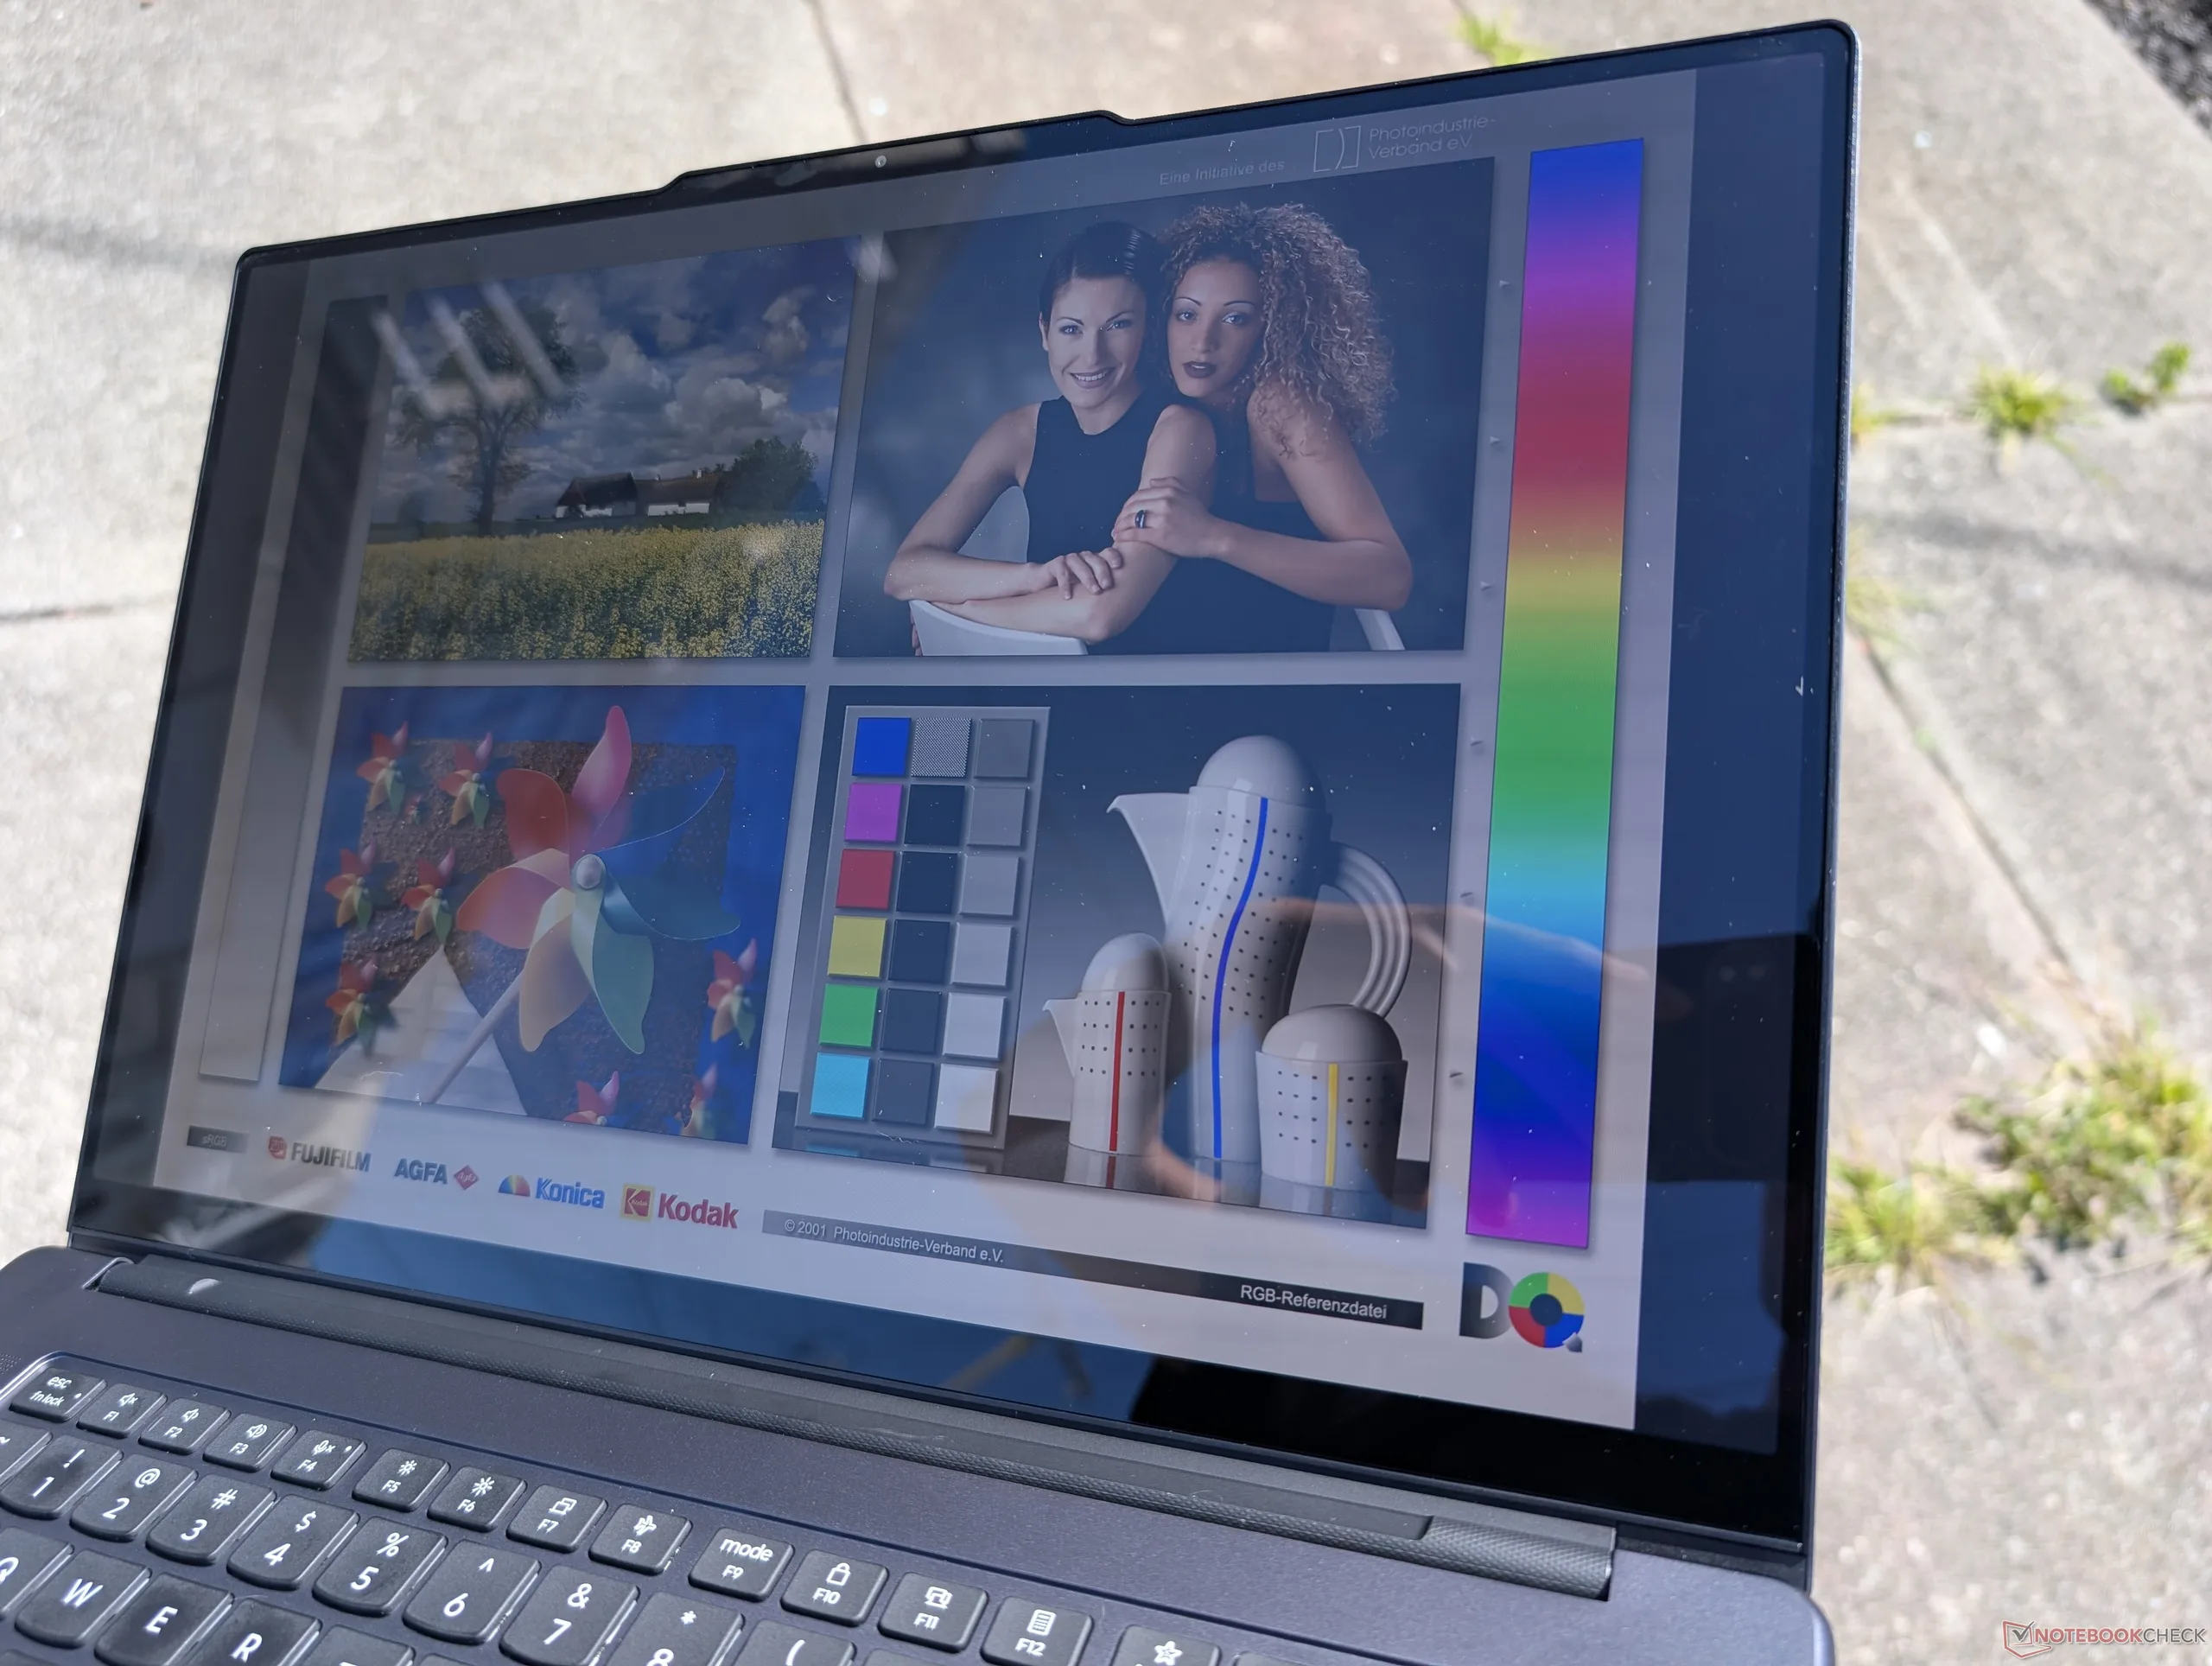
Tandem OLED-skärmen på vår enhet är exakt samma Samsung ATNA60KA04-0-panel som finns på 2025 Yoga Pro 9i 16 för samma visningsupplevelse. Våra egna mätningar visar en maximal ljusstyrka i mitten på 931 nits i SDR-läge och 1480 nits i HDR-läge, vilket gör detta till en av de ljusstarkaste skärmarna på en 16-tums bärbar dator.
Kom ihåg att även om Advanced Optimus stöds, så är G-Sync fortfarande utelämnat eftersom Pro 9-serien inte primärt är avsedd för spel.
| |||||||||||||||||||||||||
Distribution av ljusstyrkan: 94 %
Mitt på batteriet: 930.9 cd/m²
Kontrast: ∞:1 (Svärta: 0 cd/m²)
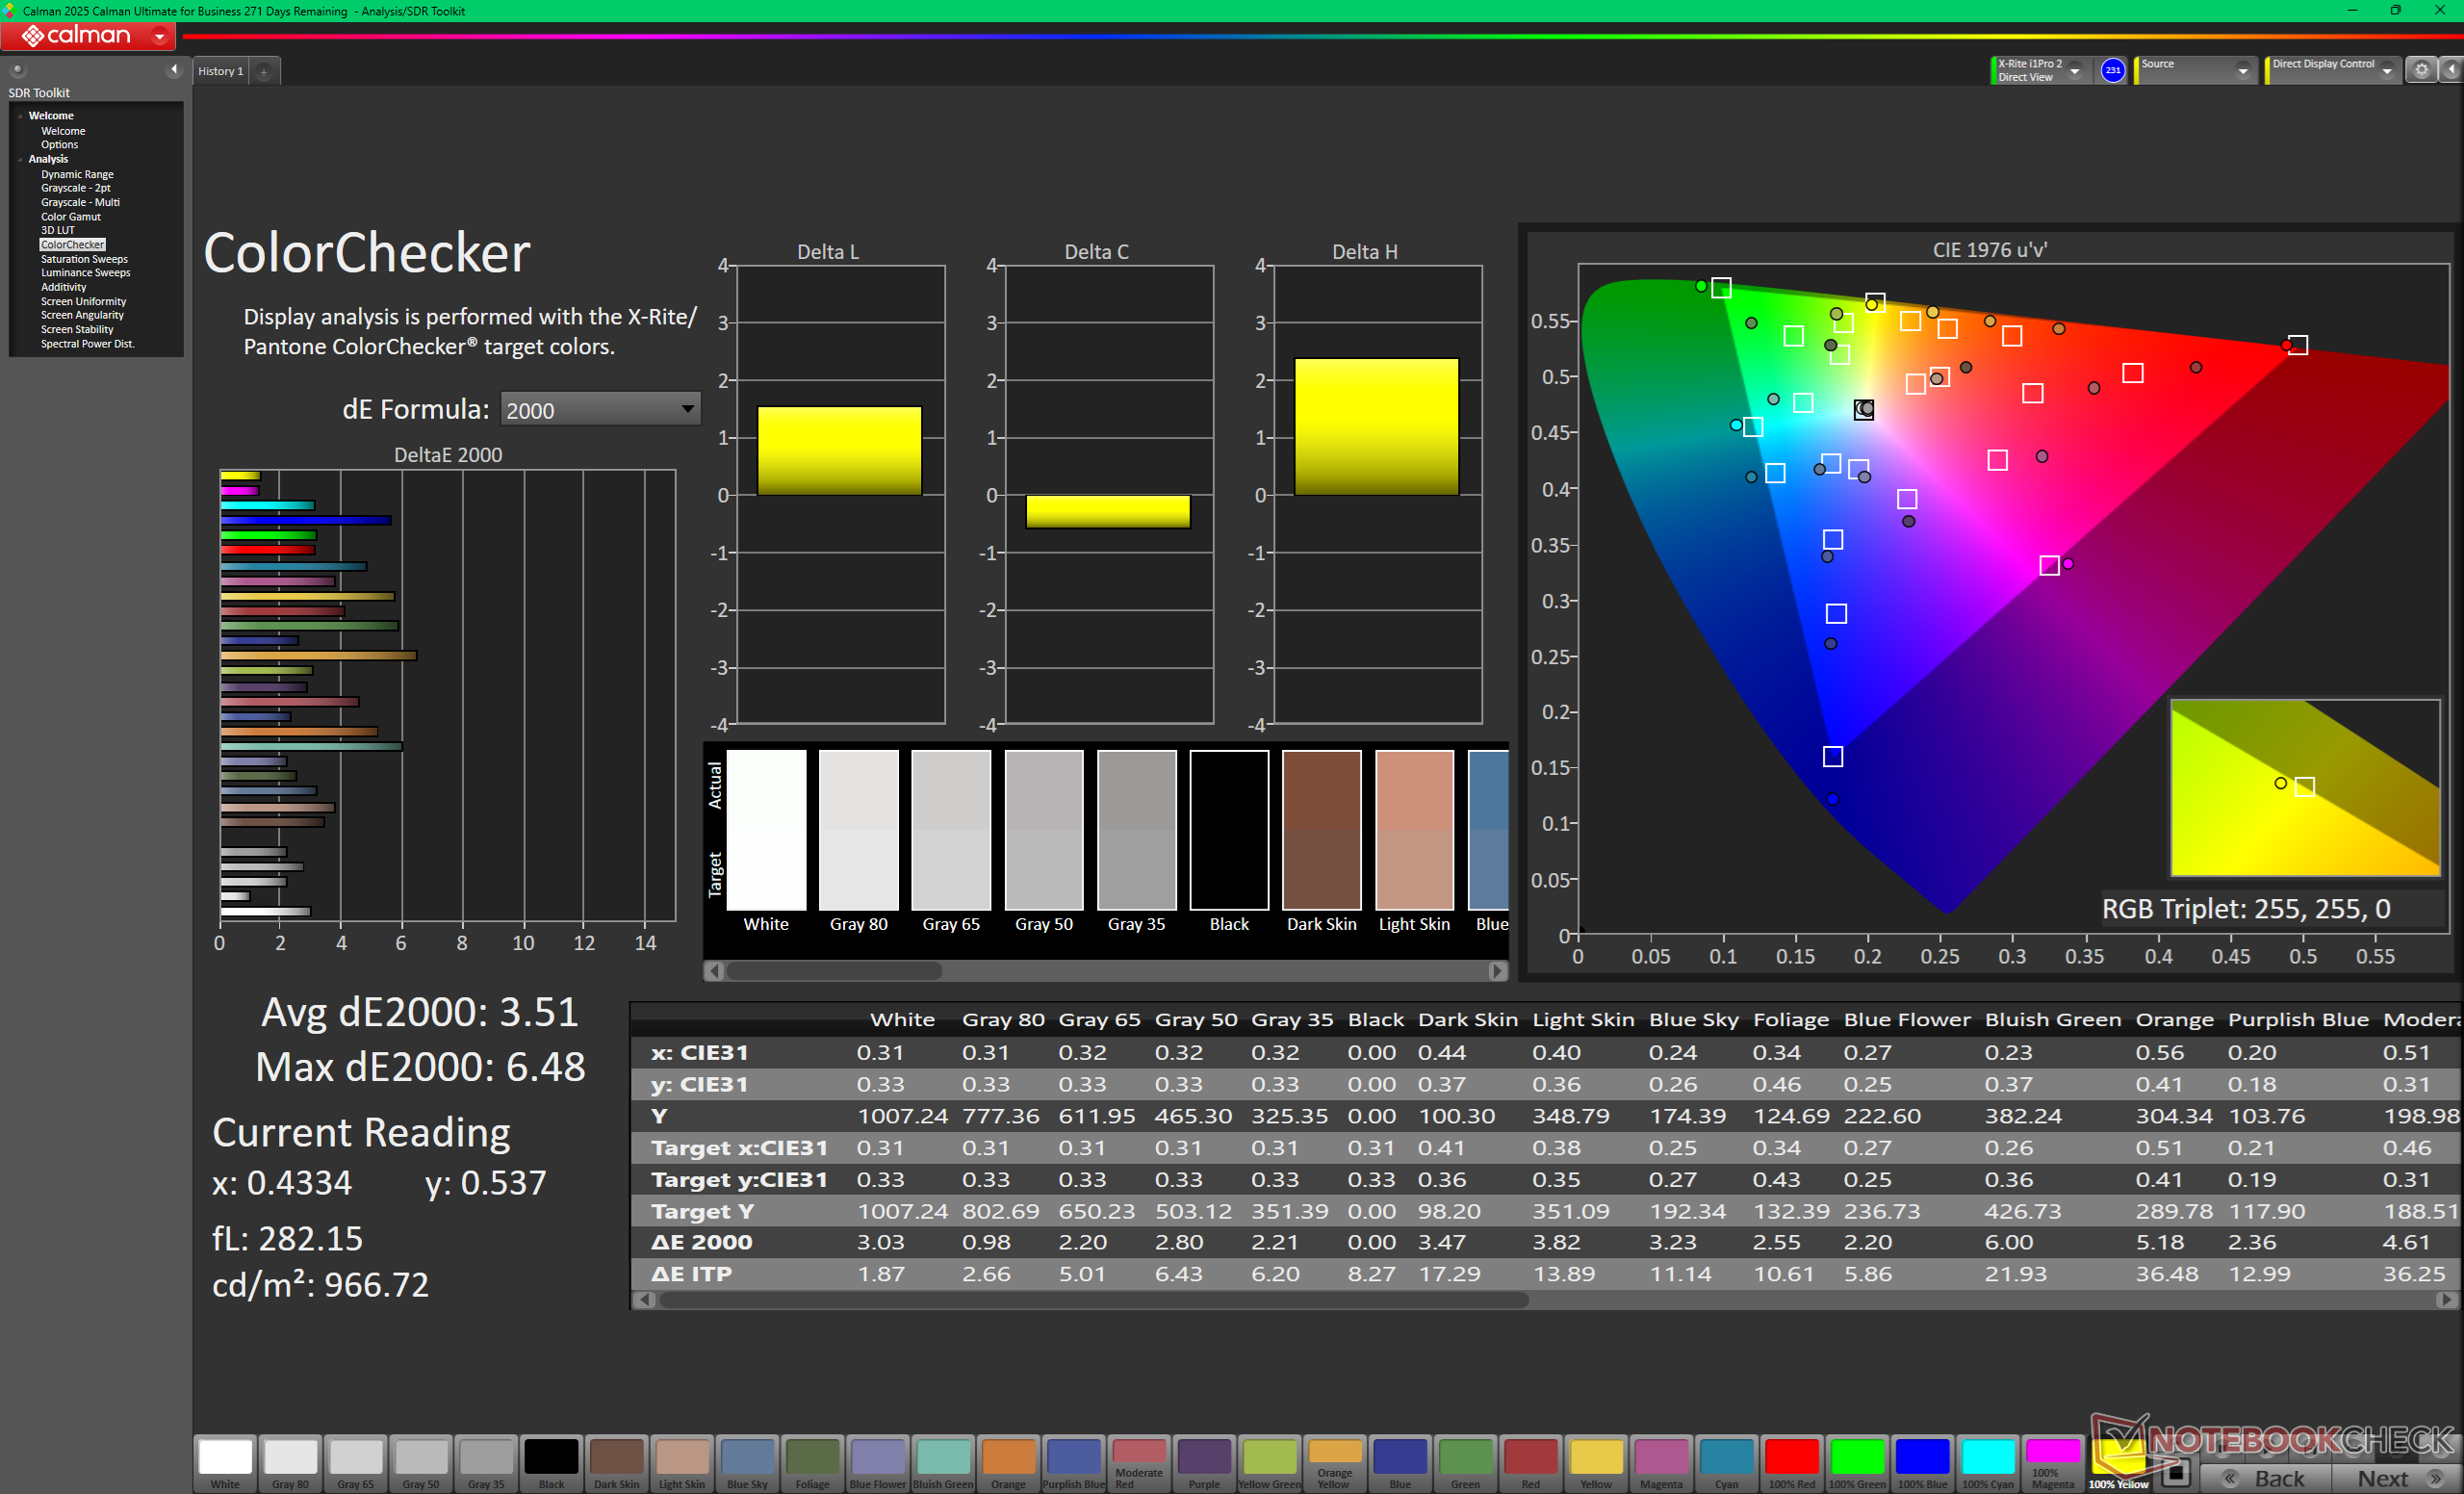
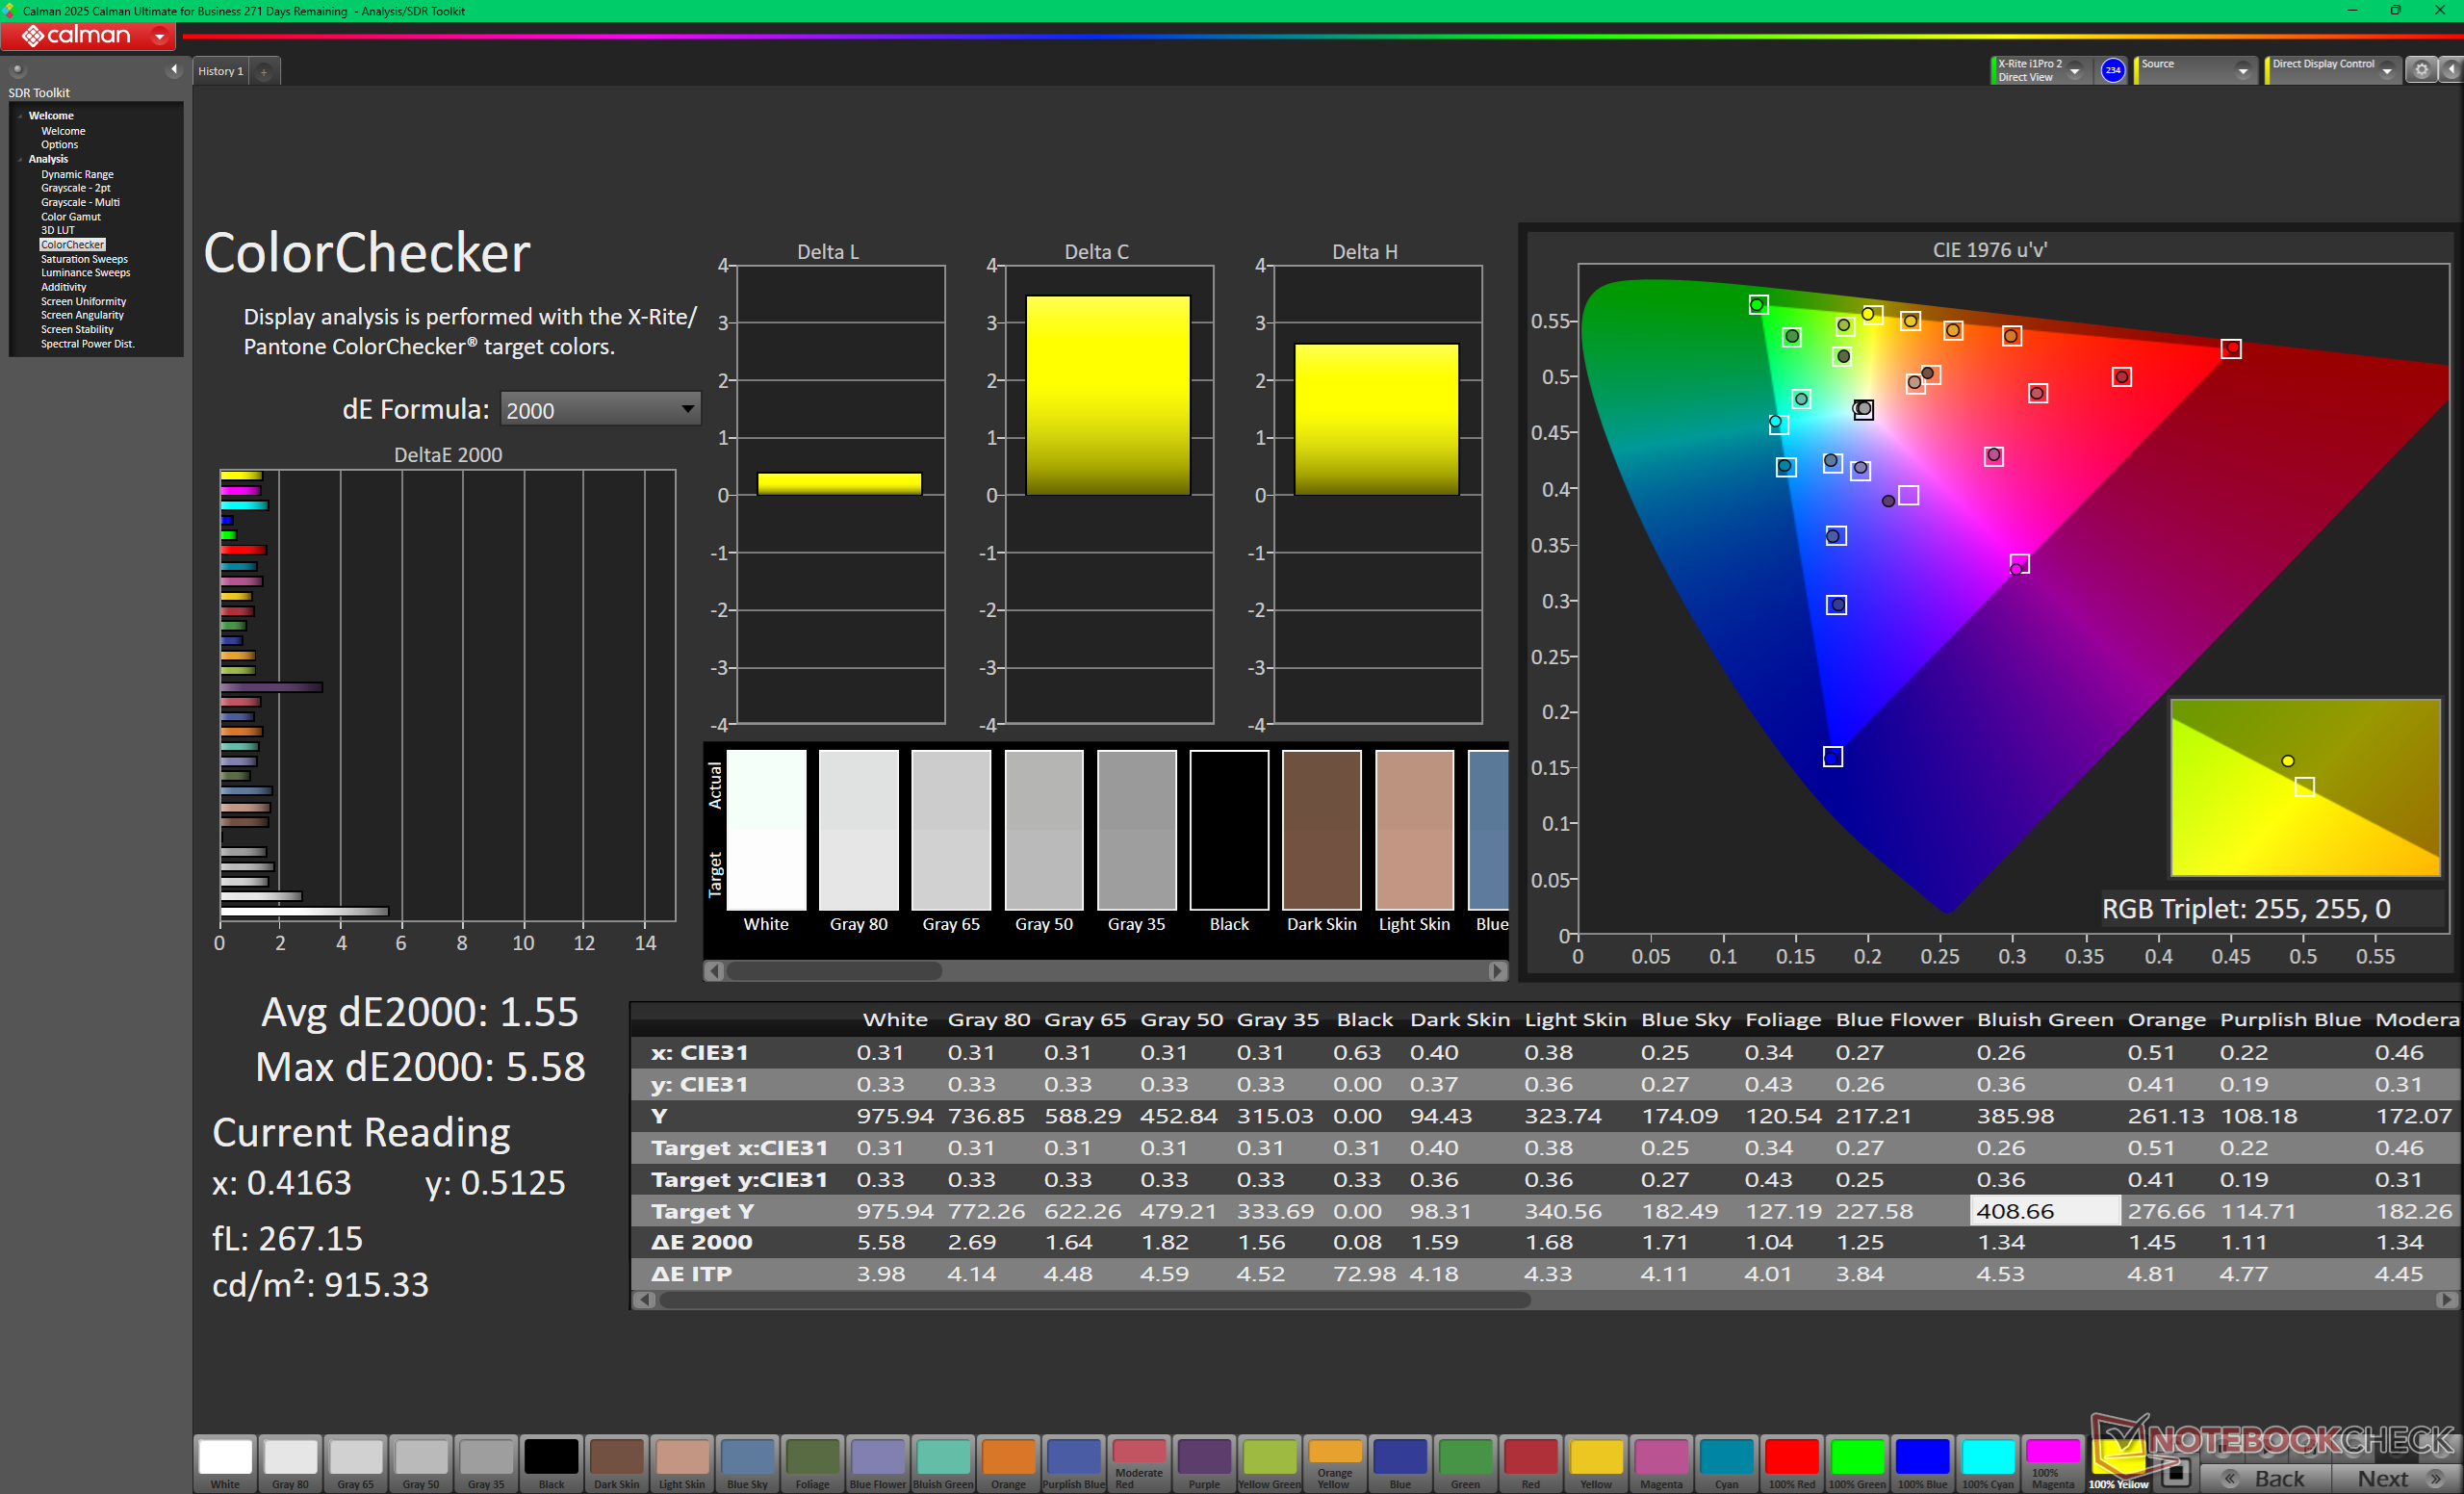
ΔE ColorChecker Calman: 3.51 | ∀{0.5-29.43 Ø4.71}
calibrated: 1.55
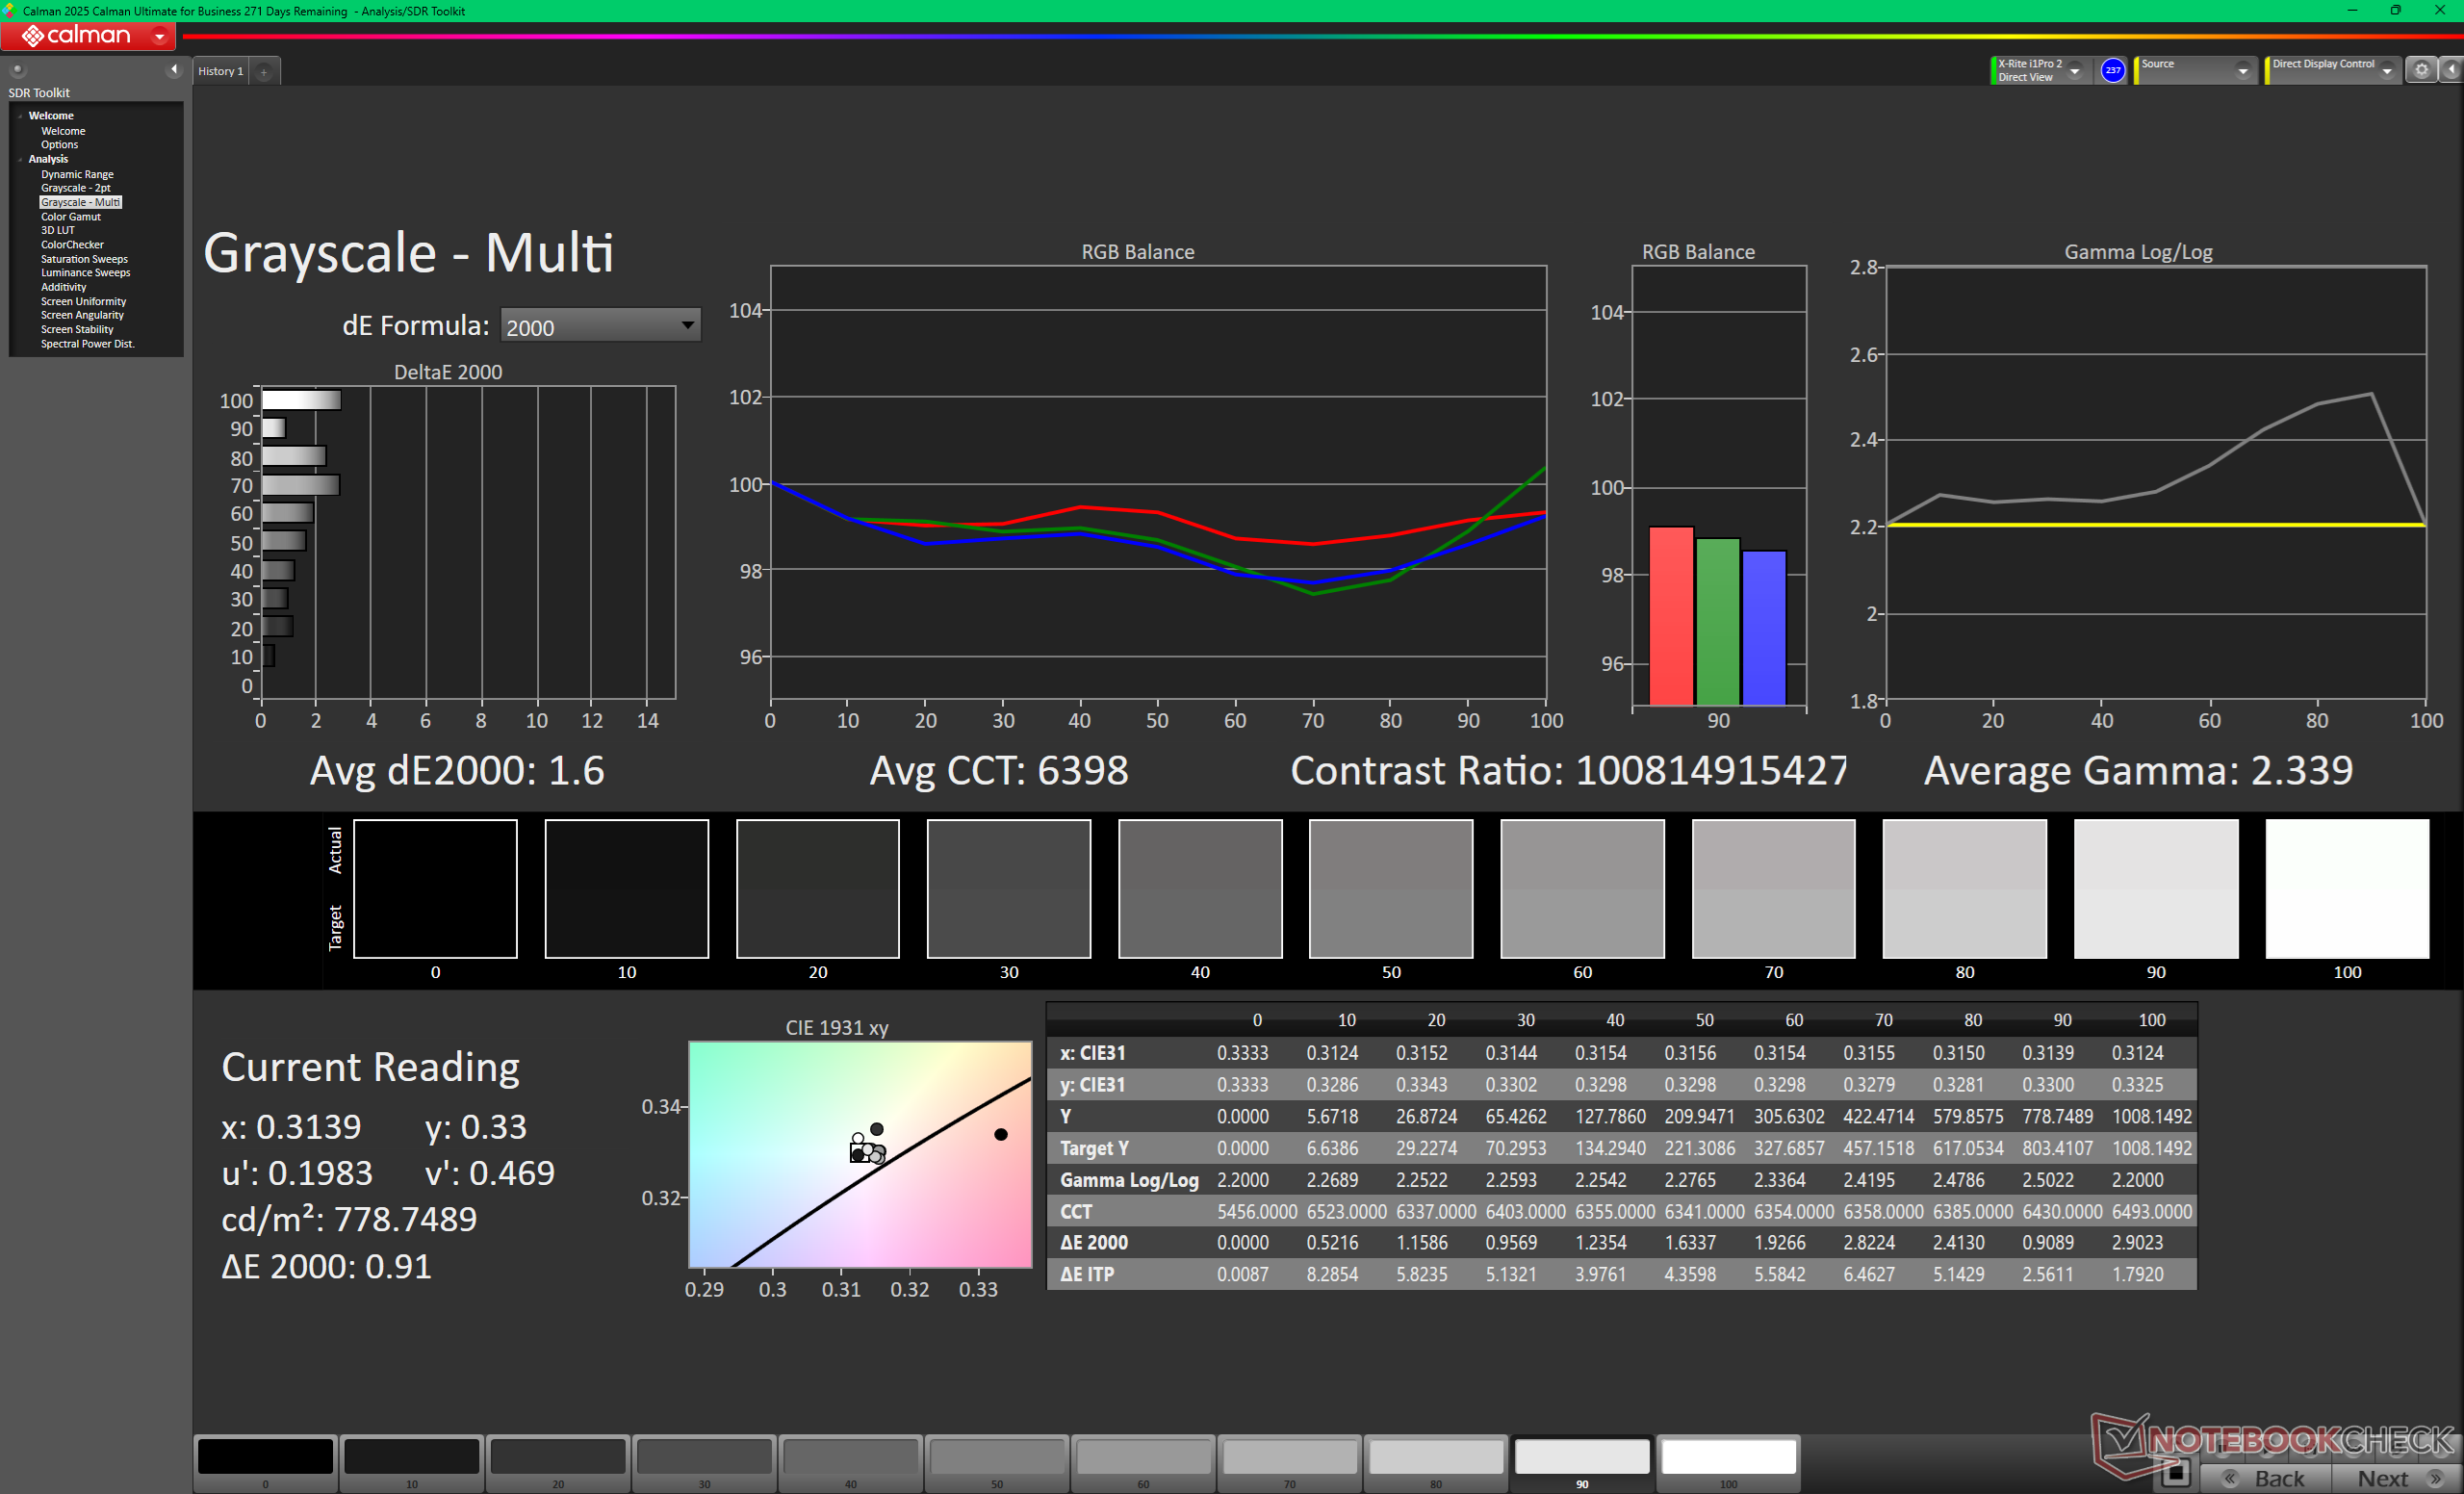
ΔE Greyscale Calman: 1.6 | ∀{0.09-98 Ø4.96}
95.7% AdobeRGB 1998 (Argyll 3D)
100% sRGB (Argyll 3D)
98.8% Display P3 (Argyll 3D)
Gamma: 2.34
CCT: 6398 K
| Lenovo Pro 9 16IPH11 Samsung ATNA60KA04-0, Tandem OLED, 3200x2000, 16", 120 Hz | Lenovo Yoga Pro 9 16IAH10 RTX 5050 ATNA60HR04-0, OLED, 2880x1800, 16", 120 Hz | Dell XPS 16 Core Ultra X7 358H LG Philips 160WV1, OLED, 3200x2000, 16", 120 Hz | MSI Prestige 16 AI Evo B2HMG B160QAN03_R, IPS, 2560x1600, 16", 60 Hz | HP Omen Transcend 16-u1095ng ATNA60DL02-0 (SDC41A4), OLED, 2560x1600, 16", 240 Hz | Asus ProArt P16 H7606WP ATNA60CL10-0, OLED, 2880x1800, 16", 120 Hz | |
|---|---|---|---|---|---|---|
| Display | 1% | -5% | 1% | -2% | ||
| Display P3 Coverage (%) | 98.8 | 99.5 1% | 96.4 -2% | 99.8 1% | 99.5 1% | |
| sRGB Coverage (%) | 100 | 100 0% | 99.7 0% | 100 0% | 100 0% | |
| AdobeRGB 1998 Coverage (%) | 95.7 | 96.5 1% | 84.3 -12% | 97 1% | 89.5 -6% | |
| Response Times | -131% | -39% | -5878% | 71% | -17% | |
| Response Time Grey 50% / Grey 80% * (ms) | 0.58 ? | 0.65 ? -12% | 51.5 ? -8779% | 0.2 ? 66% | 0.63 ? -9% | |
| Response Time Black / White * (ms) | 0.79 ? | 0.87 ? -10% | 24.3 ? -2976% | 0.2 ? 75% | 0.63 ? 20% | |
| PWM Frequency (Hz) | 1173.2 | 1200 | 240.2 ? | 120 ? | 480 ? | |
| PWM Amplitude * (%) | 16 | 37 -131% | 31 -94% | 26 -63% | ||
| Screen | -26% | -15% | -92% | -29% | 8% | |
| Brightness middle (cd/m²) | 930.9 | 471.7 -49% | 395.4 -58% | 471 -49% | 390 -58% | 362 -61% |
| Brightness (cd/m²) | 947 | 474 -50% | 392 -59% | 455 -52% | 392 -59% | 363 -62% |
| Brightness Distribution (%) | 94 | 98 4% | 95 1% | 92 -2% | 98 4% | 99 5% |
| Black Level * (cd/m²) | 0.2 | 0.02 | ||||
| Colorchecker dE 2000 * | 3.51 | 3.53 -1% | 3.69 -5% | 5.8 -65% | 1.94 45% | 0.8 77% |
| Colorchecker dE 2000 max. * | 6.48 | 6.31 3% | 7.94 -23% | 10.8 -67% | 4.26 34% | 1.8 72% |
| Colorchecker dE 2000 calibrated * | 1.55 | 0.68 56% | 1.9 -23% | 4.21 -172% | ||
| Greyscale dE 2000 * | 1.6 | 2.6 -63% | 1.9 -19% | 7.8 -388% | 1.5 6% | 1.3 19% |
| Gamma | 2.34 94% | 2.24 98% | 2.28 96% | 2.07 106% | 2.221 99% | 2.2 100% |
| CCT | 6398 102% | 6292 103% | 6274 104% | 7262 90% | 6395 102% | 6741 96% |
| Contrast (:1) | 2355 | 19500 | ||||
| Totalt genomsnitt (program/inställningar) | -79% /
-41% | -18% /
-17% | -1992% /
-1035% | 14% /
-5% | -4% /
-1% |
* ... mindre är bättre

Visa svarstider
| ↔ Svarstid svart till vitt | ||
|---|---|---|
| 0.79 ms ... stiga ↗ och falla ↘ kombinerat | ↗ 0.37 ms stiga | 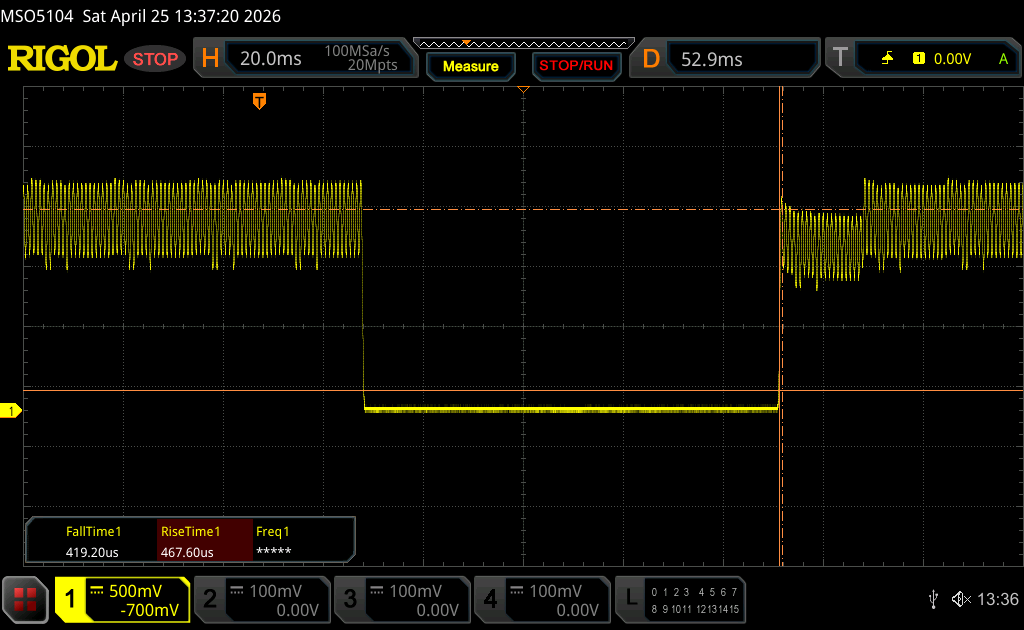 |
| ↘ 0.42 ms hösten | ||
| Skärmen visar väldigt snabba svarsfrekvenser i våra tester och borde vara mycket väl lämpad för fartfyllt spel. I jämförelse sträcker sig alla testade enheter från 0.1 (minst) till 240 (maximalt) ms. » 2 % av alla enheter är bättre. Det betyder att den uppmätta svarstiden är bättre än genomsnittet av alla testade enheter (19.8 ms). | ||
| ↔ Svarstid 50 % grått till 80 % grått | ||
| 0.58 ms ... stiga ↗ och falla ↘ kombinerat | ↗ 0.3 ms stiga | 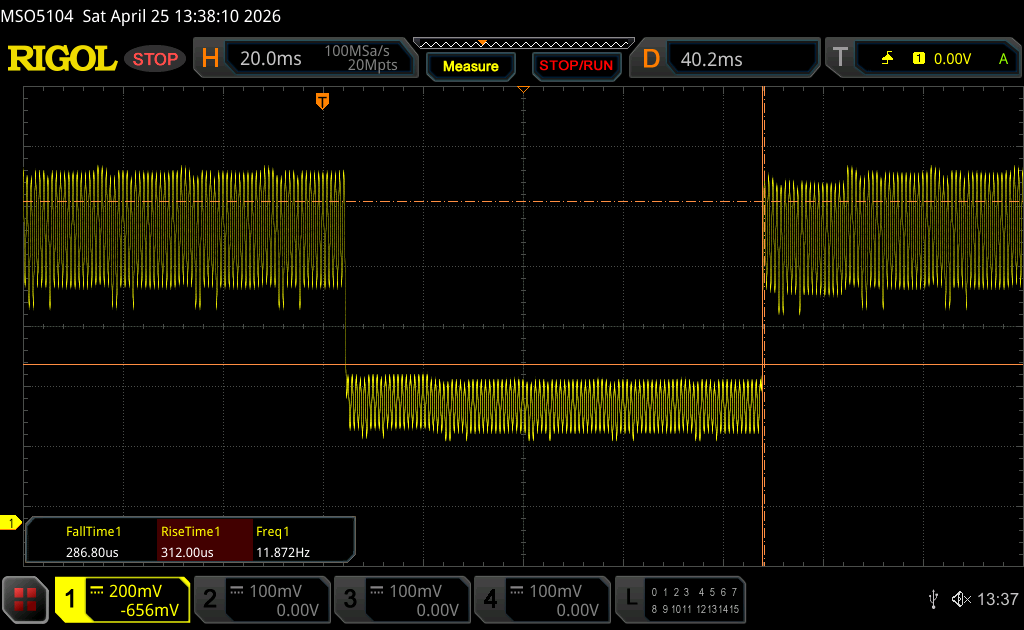 |
| ↘ 0.28 ms hösten | ||
| Skärmen visar väldigt snabba svarsfrekvenser i våra tester och borde vara mycket väl lämpad för fartfyllt spel. I jämförelse sträcker sig alla testade enheter från 0.165 (minst) till 636 (maximalt) ms. » 1 % av alla enheter är bättre. Det betyder att den uppmätta svarstiden är bättre än genomsnittet av alla testade enheter (31 ms). | ||
Skärmflimmer / PWM (Puls-Width Modulation)
| Skärmflimmer / PWM upptäckt | 1173.2 Hz Amplitude: 16 % |  | |
Displayens bakgrundsbelysning flimrar vid 1173.2 Hz (i värsta fall, t.ex. med PWM) . Frekvensen för 1173.2 Hz är ganska hög, så de flesta användare som är känsliga för PWM bör inte märka något flimmer. Som jämförelse: 52 % av alla testade enheter använder inte PWM för att dämpa skärmen. Om PWM upptäcktes mättes ett medelvärde av 7757 (minst: 5 - maximum: 343500) Hz. | |||


Prestanda
Testförhållanden
Vi ställde in Windows på prestandaläge och läge för diskret grafik innan vi körde nedanstående benchmarks.
Processor
Den nya Core Ultra 9 386H ger tyvärr små eller inga prestandafördelar jämfört med den tidigare generationen Core Ultra 9 285H vilket framgår av våra jämförelsediagram nedan. Faktum är att den nya processorn till och med har mindre L2- och L3-cache än sin föregångare. Den kompenserar dock för detta med förbättrad tillverkningseffektivitet (1,8 nm jämfört med 5 nm) och snabbare integrerad NPU-prestanda (50 jämfört med 13 TOPS).
Cinebench R15 Multi Loop
Cinebench R23: Multi Core | Single Core
Cinebench R20: CPU (Multi Core) | CPU (Single Core)
Cinebench R15: CPU Multi 64Bit | CPU Single 64Bit
Blender: v2.79 BMW27 CPU
7-Zip 18.03: 7z b 4 | 7z b 4 -mmt1
Geekbench 6.7: Multi-Core | Single-Core
Geekbench 5.5: Multi-Core | Single-Core
HWBOT x265 Benchmark v2.2: 4k Preset
LibreOffice : 20 Documents To PDF
R Benchmark 2.5: Overall mean
* ... mindre är bättre
AIDA64: FP32 Ray-Trace | FPU Julia | CPU SHA3 | CPU Queen | FPU SinJulia | FPU Mandel | CPU AES | CPU ZLib | FP64 Ray-Trace | CPU PhotoWorxx | CPU CheckMate
| Performance rating | |
| Asus ProArt P16 H7606WP -1! | |
| Lenovo Pro 9 16IPH11 -1! | |
| Lenovo Yoga Pro 9 16IAH10 RTX 5050 -1! | |
| HP Omen Transcend 16-u1095ng -1! | |
| Genomsnitt Intel Core Ultra 9 386H -1! | |
| Dell XPS 16 Core Ultra X7 358H -1! | |
| MSI Prestige 16 AI Evo B2HMG -1! | |
| AIDA64 / FP32 Ray-Trace | |
| Asus ProArt P16 H7606WP (v6.92.6600) | |
| Lenovo Yoga Pro 9 16IAH10 RTX 5050 (v6.92.6600) | |
| Lenovo Pro 9 16IPH11 (v8.20.8100) | |
| MSI Prestige 16 AI Evo B2HMG (v6.92.6600) | |
| Genomsnitt Intel Core Ultra 9 386H (10001 - 21727, n=8) | |
| HP Omen Transcend 16-u1095ng (v6.92.6600) | |
| Dell XPS 16 Core Ultra X7 358H (v8.20.8100) | |
| AIDA64 / FPU Julia | |
| Asus ProArt P16 H7606WP (v6.92.6600) | |
| Lenovo Yoga Pro 9 16IAH10 RTX 5050 (v6.92.6600) | |
| Lenovo Pro 9 16IPH11 (v8.20.8100) | |
| Genomsnitt Intel Core Ultra 9 386H (53370 - 113595, n=8) | |
| MSI Prestige 16 AI Evo B2HMG (v6.92.6600) | |
| HP Omen Transcend 16-u1095ng (v6.92.6600) | |
| Dell XPS 16 Core Ultra X7 358H (v8.20.8100) | |
| AIDA64 / CPU SHA3 | |
| Asus ProArt P16 H7606WP (v6.92.6600) | |
| Lenovo Pro 9 16IPH11 (v8.20.8100) | |
| Lenovo Yoga Pro 9 16IAH10 RTX 5050 (v6.92.6600) | |
| Genomsnitt Intel Core Ultra 9 386H (2776 - 5604, n=8) | |
| MSI Prestige 16 AI Evo B2HMG (v6.92.6600) | |
| HP Omen Transcend 16-u1095ng (v6.92.6600) | |
| Dell XPS 16 Core Ultra X7 358H (v8.20.8100) | |
| AIDA64 / CPU Queen | |
| HP Omen Transcend 16-u1095ng (v6.92.6600) | |
| Asus ProArt P16 H7606WP (v6.92.6600) | |
| MSI Prestige 16 AI Evo B2HMG (v6.92.6600) | |
| Lenovo Yoga Pro 9 16IAH10 RTX 5050 (v6.92.6600) | |
| AIDA64 / FPU SinJulia | |
| Asus ProArt P16 H7606WP (v6.92.6600) | |
| HP Omen Transcend 16-u1095ng (v6.92.6600) | |
| Lenovo Yoga Pro 9 16IAH10 RTX 5050 (v6.92.6600) | |
| MSI Prestige 16 AI Evo B2HMG (v6.92.6600) | |
| Lenovo Pro 9 16IPH11 (v8.20.8100) | |
| Dell XPS 16 Core Ultra X7 358H (v8.20.8100) | |
| Genomsnitt Intel Core Ultra 9 386H (5314 - 7332, n=8) | |
| AIDA64 / FPU Mandel | |
| Asus ProArt P16 H7606WP (v6.92.6600) | |
| Lenovo Yoga Pro 9 16IAH10 RTX 5050 (v6.92.6600) | |
| Lenovo Pro 9 16IPH11 (v8.20.8100) | |
| Genomsnitt Intel Core Ultra 9 386H (28414 - 61578, n=8) | |
| MSI Prestige 16 AI Evo B2HMG (v6.92.6600) | |
| Dell XPS 16 Core Ultra X7 358H (v8.20.8100) | |
| HP Omen Transcend 16-u1095ng (v6.92.6600) | |
| AIDA64 / CPU AES | |
| Asus ProArt P16 H7606WP (v6.92.6600) | |
| HP Omen Transcend 16-u1095ng (v6.92.6600) | |
| Lenovo Yoga Pro 9 16IAH10 RTX 5050 (v6.92.6600) | |
| Lenovo Pro 9 16IPH11 (v8.20.8100) | |
| MSI Prestige 16 AI Evo B2HMG (v6.92.6600) | |
| Genomsnitt Intel Core Ultra 9 386H (46362 - 72112, n=8) | |
| Dell XPS 16 Core Ultra X7 358H (v8.20.8100) | |
| AIDA64 / CPU ZLib | |
| Asus ProArt P16 H7606WP (v6.92.6600) | |
| HP Omen Transcend 16-u1095ng (v6.92.6600) | |
| Lenovo Yoga Pro 9 16IAH10 RTX 5050 (v6.92.6600) | |
| Lenovo Pro 9 16IPH11 (v8.20.8100) | |
| Genomsnitt Intel Core Ultra 9 386H (669 - 1271, n=8) | |
| MSI Prestige 16 AI Evo B2HMG (v6.92.6600) | |
| Dell XPS 16 Core Ultra X7 358H (v8.20.8100) | |
| AIDA64 / FP64 Ray-Trace | |
| Asus ProArt P16 H7606WP (v6.92.6600) | |
| Lenovo Yoga Pro 9 16IAH10 RTX 5050 (v6.92.6600) | |
| Lenovo Pro 9 16IPH11 (v8.20.8100) | |
| MSI Prestige 16 AI Evo B2HMG (v6.92.6600) | |
| Genomsnitt Intel Core Ultra 9 386H (5138 - 11627, n=8) | |
| HP Omen Transcend 16-u1095ng (v6.92.6600) | |
| Dell XPS 16 Core Ultra X7 358H (v8.20.8100) | |
| AIDA64 / CPU PhotoWorxx | |
| Dell XPS 16 Core Ultra X7 358H (v8.20.8100) | |
| Genomsnitt Intel Core Ultra 9 386H (54042 - 89891, n=8) | |
| Lenovo Pro 9 16IPH11 (v8.20.8100) | |
| Lenovo Yoga Pro 9 16IAH10 RTX 5050 (v6.92.6600) | |
| MSI Prestige 16 AI Evo B2HMG (v6.92.6600) | |
| HP Omen Transcend 16-u1095ng (v6.92.6600) | |
| Asus ProArt P16 H7606WP (v6.92.6600) | |
| AIDA64 / CPU CheckMate | |
| Lenovo Pro 9 16IPH11 (v8.20.8100) | |
| Genomsnitt Intel Core Ultra 9 386H (4051 - 4858, n=7) | |
| Dell XPS 16 Core Ultra X7 358H (v8.20.8100) | |
Systemets prestanda
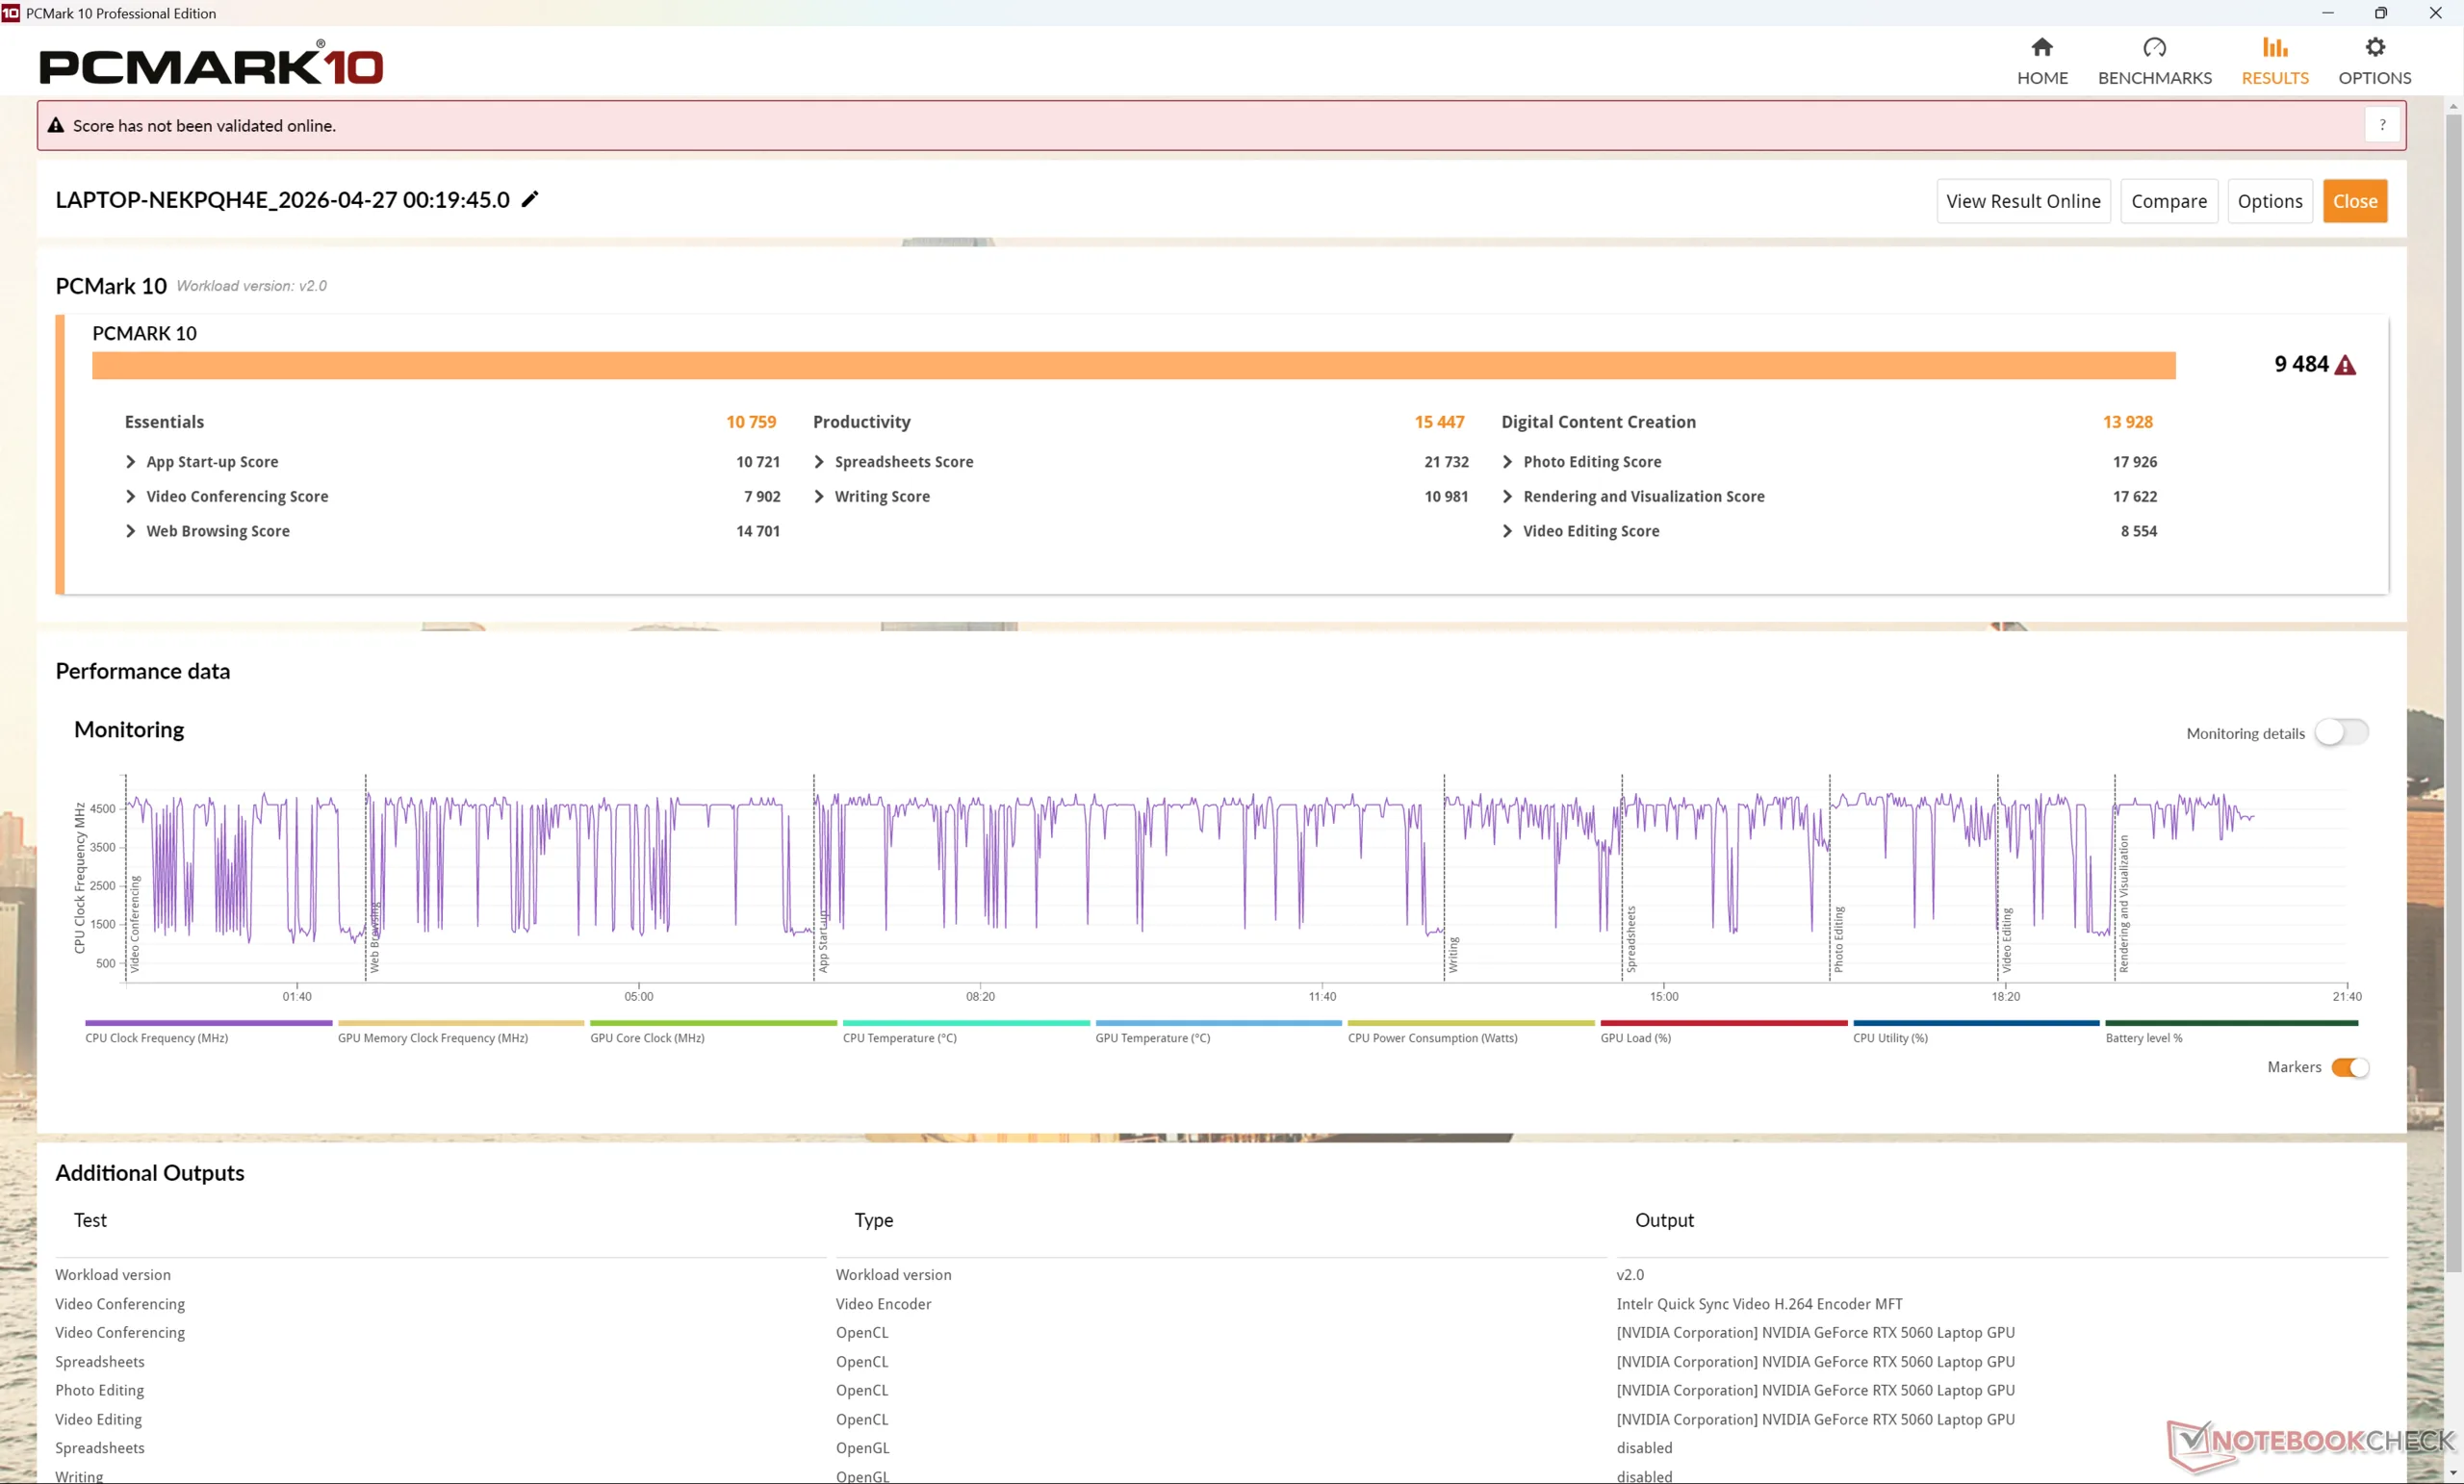
PCMark 10: Score | Essentials | Productivity | Digital Content Creation
CrossMark: Overall | Productivity | Creativity | Responsiveness
WebXPRT 3: Overall
WebXPRT 4: Overall
Mozilla Kraken 1.1: Total
Geekbench AI: Half Precision GPU 1.7 | Single Precision GPU 1.7 | Quantized GPU 1.7
| Performance rating | |
| Genomsnitt Intel Core Ultra 9 386H, NVIDIA GeForce RTX 5060 Laptop | |
| Lenovo Pro 9 16IPH11 | |
| Lenovo Yoga Pro 9 16IAH10 RTX 5050 | |
| MSI Prestige 16 AI Evo B2HMG -3! | |
| Dell XPS 16 Core Ultra X7 358H | |
| Asus ProArt P16 H7606WP -3! | |
| HP Omen Transcend 16-u1095ng -8! | |
| PCMark 10 / Score | |
| Dell XPS 16 Core Ultra X7 358H | |
| Lenovo Yoga Pro 9 16IAH10 RTX 5050 | |
| Lenovo Pro 9 16IPH11 | |
| Genomsnitt Intel Core Ultra 9 386H, NVIDIA GeForce RTX 5060 Laptop (9465 - 9484, n=2) | |
| Asus ProArt P16 H7606WP | |
| HP Omen Transcend 16-u1095ng | |
| MSI Prestige 16 AI Evo B2HMG | |
| PCMark 10 / Essentials | |
| MSI Prestige 16 AI Evo B2HMG | |
| Dell XPS 16 Core Ultra X7 358H | |
| Genomsnitt Intel Core Ultra 9 386H, NVIDIA GeForce RTX 5060 Laptop (10759 - 10841, n=2) | |
| Lenovo Yoga Pro 9 16IAH10 RTX 5050 | |
| Lenovo Pro 9 16IPH11 | |
| Asus ProArt P16 H7606WP | |
| HP Omen Transcend 16-u1095ng | |
| PCMark 10 / Productivity | |
| Lenovo Yoga Pro 9 16IAH10 RTX 5050 | |
| Dell XPS 16 Core Ultra X7 358H | |
| Lenovo Pro 9 16IPH11 | |
| Genomsnitt Intel Core Ultra 9 386H, NVIDIA GeForce RTX 5060 Laptop (15199 - 15447, n=2) | |
| HP Omen Transcend 16-u1095ng | |
| MSI Prestige 16 AI Evo B2HMG | |
| Asus ProArt P16 H7606WP | |
| PCMark 10 / Digital Content Creation | |
| Asus ProArt P16 H7606WP | |
| Genomsnitt Intel Core Ultra 9 386H, NVIDIA GeForce RTX 5060 Laptop (13928 - 13963, n=2) | |
| Lenovo Pro 9 16IPH11 | |
| Dell XPS 16 Core Ultra X7 358H | |
| Lenovo Yoga Pro 9 16IAH10 RTX 5050 | |
| MSI Prestige 16 AI Evo B2HMG | |
| HP Omen Transcend 16-u1095ng | |
| CrossMark / Overall | |
| MSI Prestige 16 AI Evo B2HMG | |
| Genomsnitt Intel Core Ultra 9 386H, NVIDIA GeForce RTX 5060 Laptop (2108 - 2164, n=2) | |
| Dell XPS 16 Core Ultra X7 358H | |
| Lenovo Pro 9 16IPH11 | |
| Lenovo Yoga Pro 9 16IAH10 RTX 5050 | |
| Asus ProArt P16 H7606WP | |
| CrossMark / Productivity | |
| MSI Prestige 16 AI Evo B2HMG | |
| Genomsnitt Intel Core Ultra 9 386H, NVIDIA GeForce RTX 5060 Laptop (1917 - 1973, n=2) | |
| Lenovo Pro 9 16IPH11 | |
| Dell XPS 16 Core Ultra X7 358H | |
| Lenovo Yoga Pro 9 16IAH10 RTX 5050 | |
| Asus ProArt P16 H7606WP | |
| CrossMark / Creativity | |
| Dell XPS 16 Core Ultra X7 358H | |
| Lenovo Pro 9 16IPH11 | |
| Genomsnitt Intel Core Ultra 9 386H, NVIDIA GeForce RTX 5060 Laptop (2442 - 2500, n=2) | |
| MSI Prestige 16 AI Evo B2HMG | |
| Lenovo Yoga Pro 9 16IAH10 RTX 5050 | |
| Asus ProArt P16 H7606WP | |
| CrossMark / Responsiveness | |
| MSI Prestige 16 AI Evo B2HMG | |
| Genomsnitt Intel Core Ultra 9 386H, NVIDIA GeForce RTX 5060 Laptop (1682 - 1988, n=2) | |
| Dell XPS 16 Core Ultra X7 358H | |
| Lenovo Pro 9 16IPH11 | |
| Lenovo Yoga Pro 9 16IAH10 RTX 5050 | |
| Asus ProArt P16 H7606WP | |
| WebXPRT 3 / Overall | |
| MSI Prestige 16 AI Evo B2HMG | |
| HP Omen Transcend 16-u1095ng | |
| Asus ProArt P16 H7606WP | |
| Lenovo Pro 9 16IPH11 | |
| Lenovo Yoga Pro 9 16IAH10 RTX 5050 | |
| Genomsnitt Intel Core Ultra 9 386H, NVIDIA GeForce RTX 5060 Laptop (310 - 326, n=2) | |
| Dell XPS 16 Core Ultra X7 358H | |
| WebXPRT 4 / Overall | |
| MSI Prestige 16 AI Evo B2HMG | |
| Lenovo Yoga Pro 9 16IAH10 RTX 5050 | |
| Lenovo Pro 9 16IPH11 | |
| Dell XPS 16 Core Ultra X7 358H | |
| Genomsnitt Intel Core Ultra 9 386H, NVIDIA GeForce RTX 5060 Laptop (298 - 302, n=2) | |
| Asus ProArt P16 H7606WP | |
| Mozilla Kraken 1.1 / Total | |
| Dell XPS 16 Core Ultra X7 358H | |
| Asus ProArt P16 H7606WP | |
| Genomsnitt Intel Core Ultra 9 386H, NVIDIA GeForce RTX 5060 Laptop (442 - 446, n=2) | |
| Lenovo Pro 9 16IPH11 | |
| HP Omen Transcend 16-u1095ng | |
| Lenovo Yoga Pro 9 16IAH10 RTX 5050 | |
| MSI Prestige 16 AI Evo B2HMG | |
| Geekbench AI / Half Precision GPU 1.7 | |
| Lenovo Yoga Pro 9 16IAH10 RTX 5050 | |
| Lenovo Pro 9 16IPH11 | |
| Genomsnitt Intel Core Ultra 9 386H, NVIDIA GeForce RTX 5060 Laptop (n=1) | |
| Dell XPS 16 Core Ultra X7 358H | |
| Geekbench AI / Single Precision GPU 1.7 | |
| Lenovo Pro 9 16IPH11 | |
| Genomsnitt Intel Core Ultra 9 386H, NVIDIA GeForce RTX 5060 Laptop (n=1) | |
| Lenovo Yoga Pro 9 16IAH10 RTX 5050 | |
| Dell XPS 16 Core Ultra X7 358H | |
| Geekbench AI / Quantized GPU 1.7 | |
| Lenovo Pro 9 16IPH11 | |
| Genomsnitt Intel Core Ultra 9 386H, NVIDIA GeForce RTX 5060 Laptop (n=1) | |
| Lenovo Yoga Pro 9 16IAH10 RTX 5050 | |
| Dell XPS 16 Core Ultra X7 358H | |
* ... mindre är bättre
| PCMark 10 Score | 9484 poäng | |
Hjälp | ||
| AIDA64 / Memory Copy | |
| Dell XPS 16 Core Ultra X7 358H | |
| Genomsnitt Intel Core Ultra 9 386H (75437 - 129946, n=8) | |
| Lenovo Pro 9 16IPH11 | |
| Lenovo Yoga Pro 9 16IAH10 RTX 5050 | |
| MSI Prestige 16 AI Evo B2HMG | |
| Asus ProArt P16 H7606WP | |
| HP Omen Transcend 16-u1095ng | |
| AIDA64 / Memory Read | |
| Dell XPS 16 Core Ultra X7 358H | |
| Genomsnitt Intel Core Ultra 9 386H (81021 - 118858, n=8) | |
| Lenovo Pro 9 16IPH11 | |
| Asus ProArt P16 H7606WP | |
| Lenovo Yoga Pro 9 16IAH10 RTX 5050 | |
| HP Omen Transcend 16-u1095ng | |
| MSI Prestige 16 AI Evo B2HMG | |
| AIDA64 / Memory Write | |
| Dell XPS 16 Core Ultra X7 358H | |
| Genomsnitt Intel Core Ultra 9 386H (75959 - 135096, n=8) | |
| Lenovo Yoga Pro 9 16IAH10 RTX 5050 | |
| Lenovo Pro 9 16IPH11 | |
| Asus ProArt P16 H7606WP | |
| HP Omen Transcend 16-u1095ng | |
| MSI Prestige 16 AI Evo B2HMG | |
| AIDA64 / Memory Latency | |
| MSI Prestige 16 AI Evo B2HMG | |
| Lenovo Yoga Pro 9 16IAH10 RTX 5050 | |
| Asus ProArt P16 H7606WP | |
| Lenovo Pro 9 16IPH11 | |
| Genomsnitt Intel Core Ultra 9 386H (87.2 - 116.9, n=8) | |
| HP Omen Transcend 16-u1095ng | |
| Dell XPS 16 Core Ultra X7 358H | |
* ... mindre är bättre
DPC-fördröjning
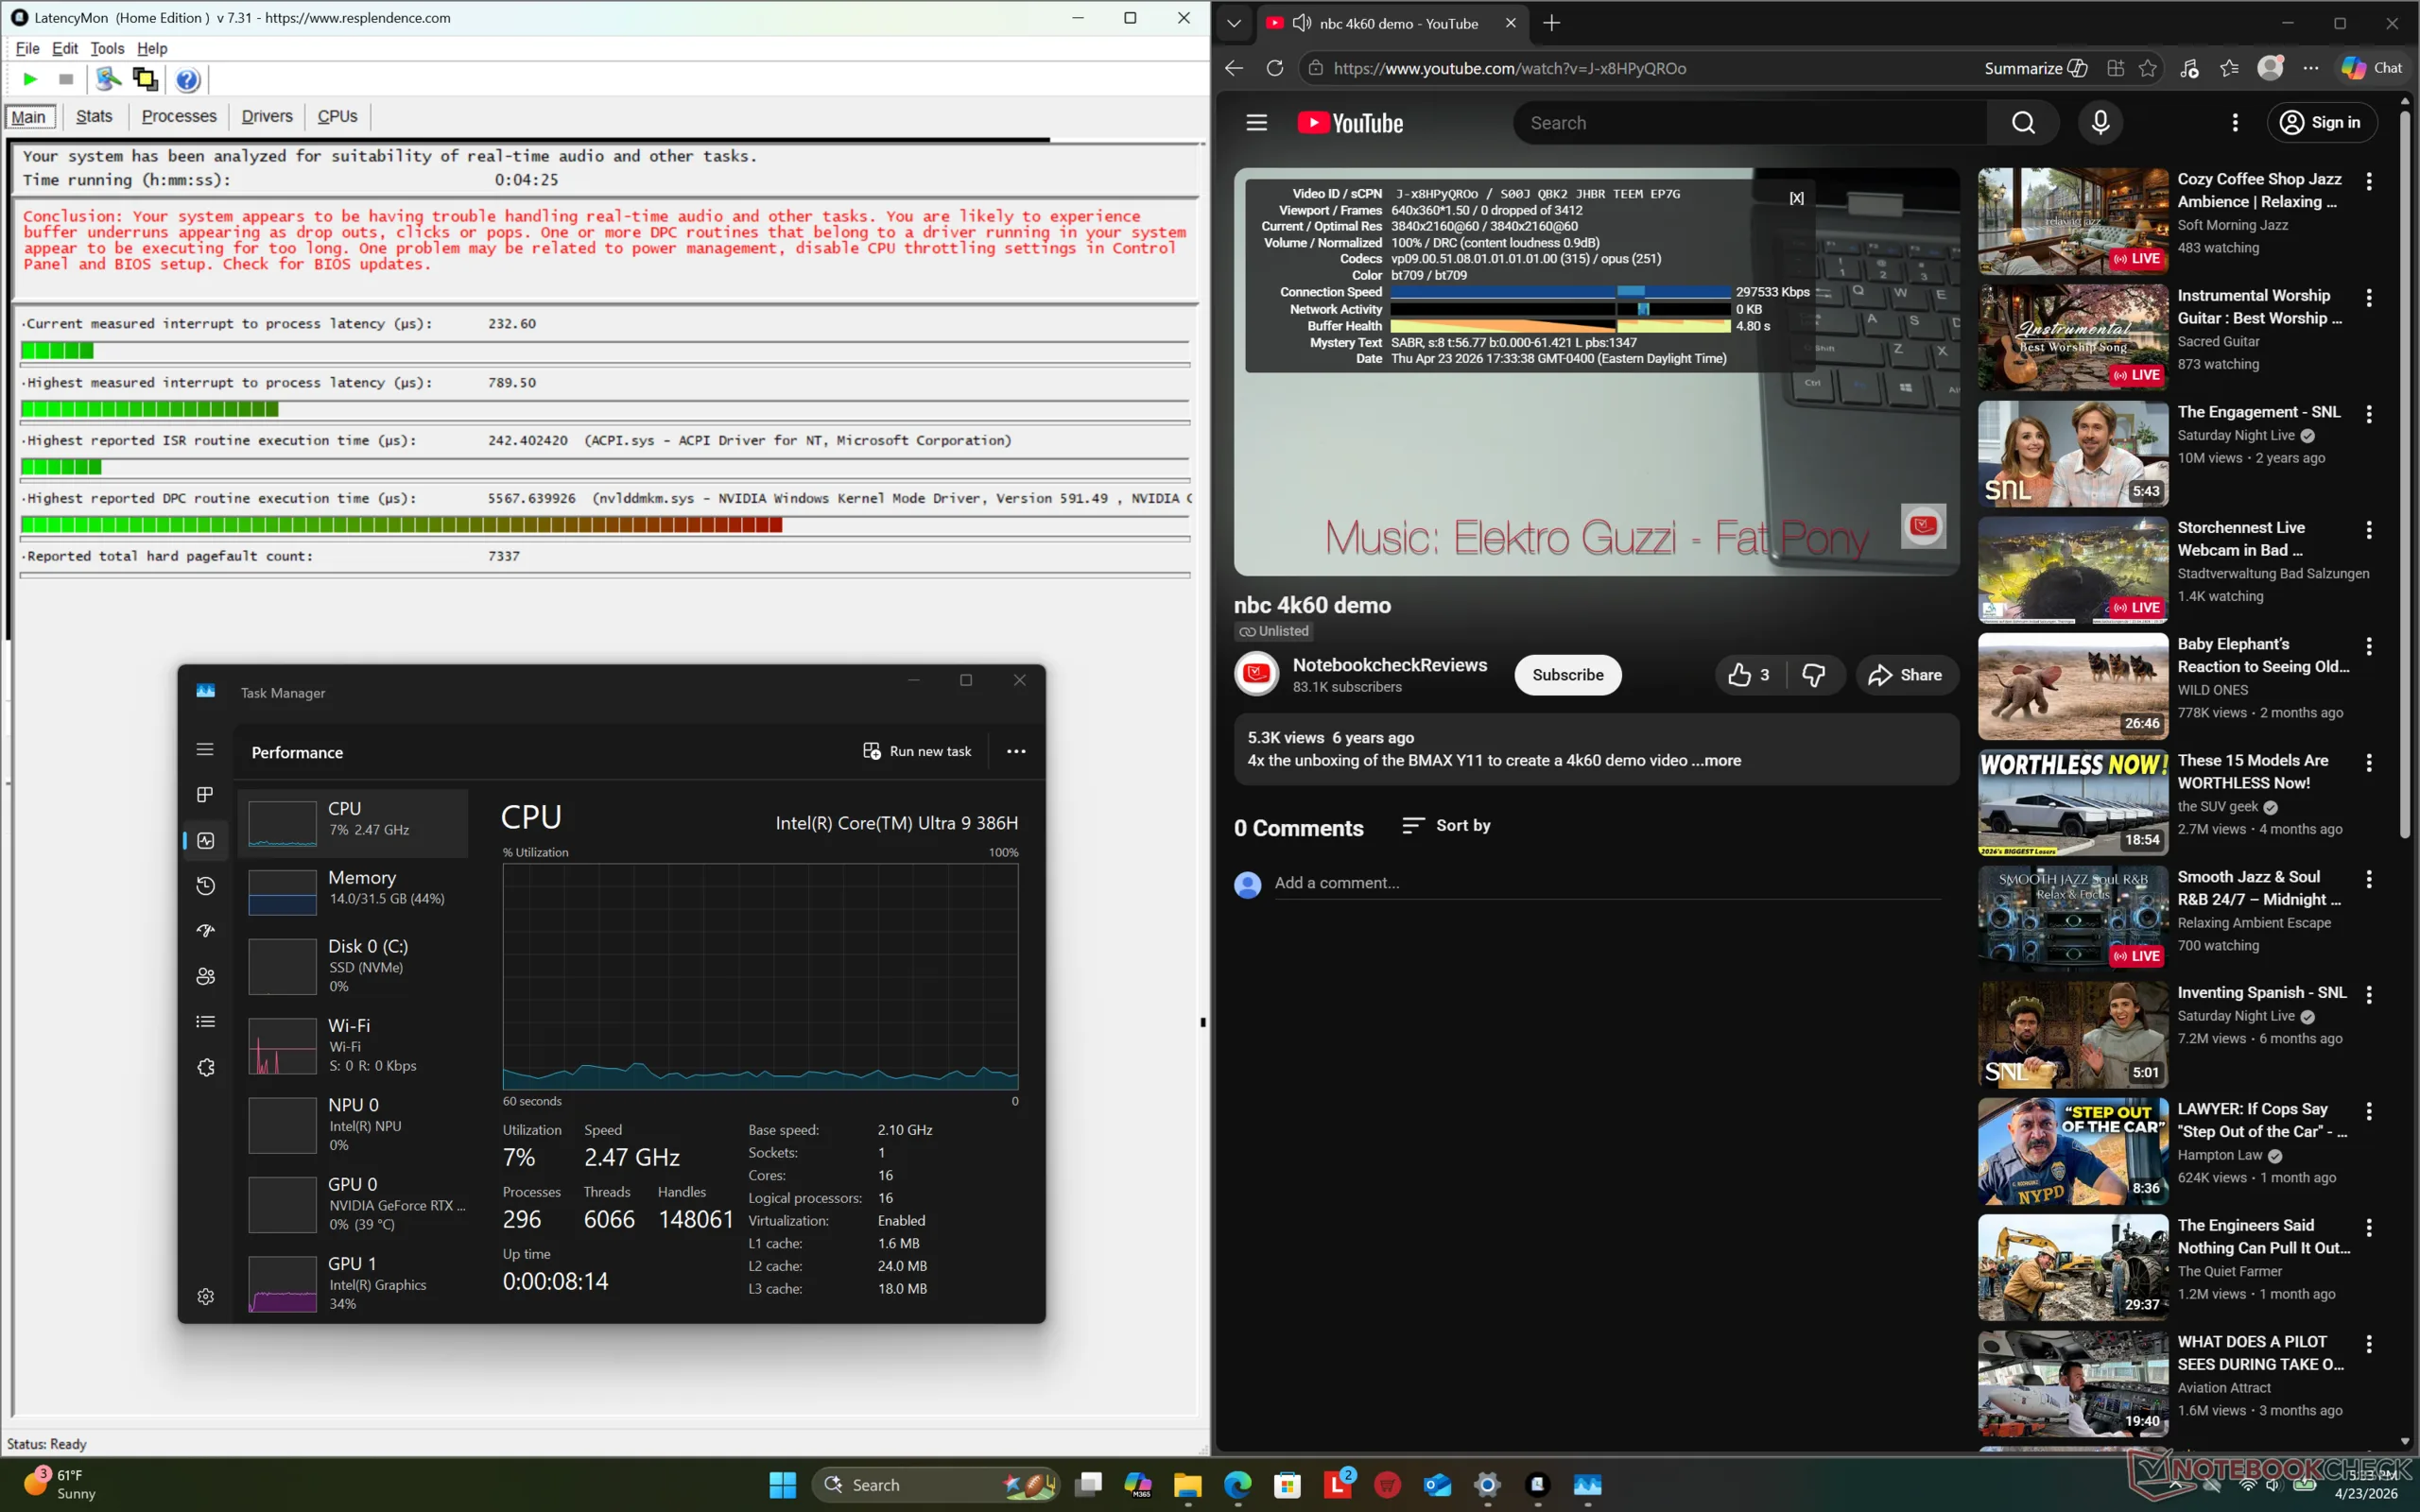
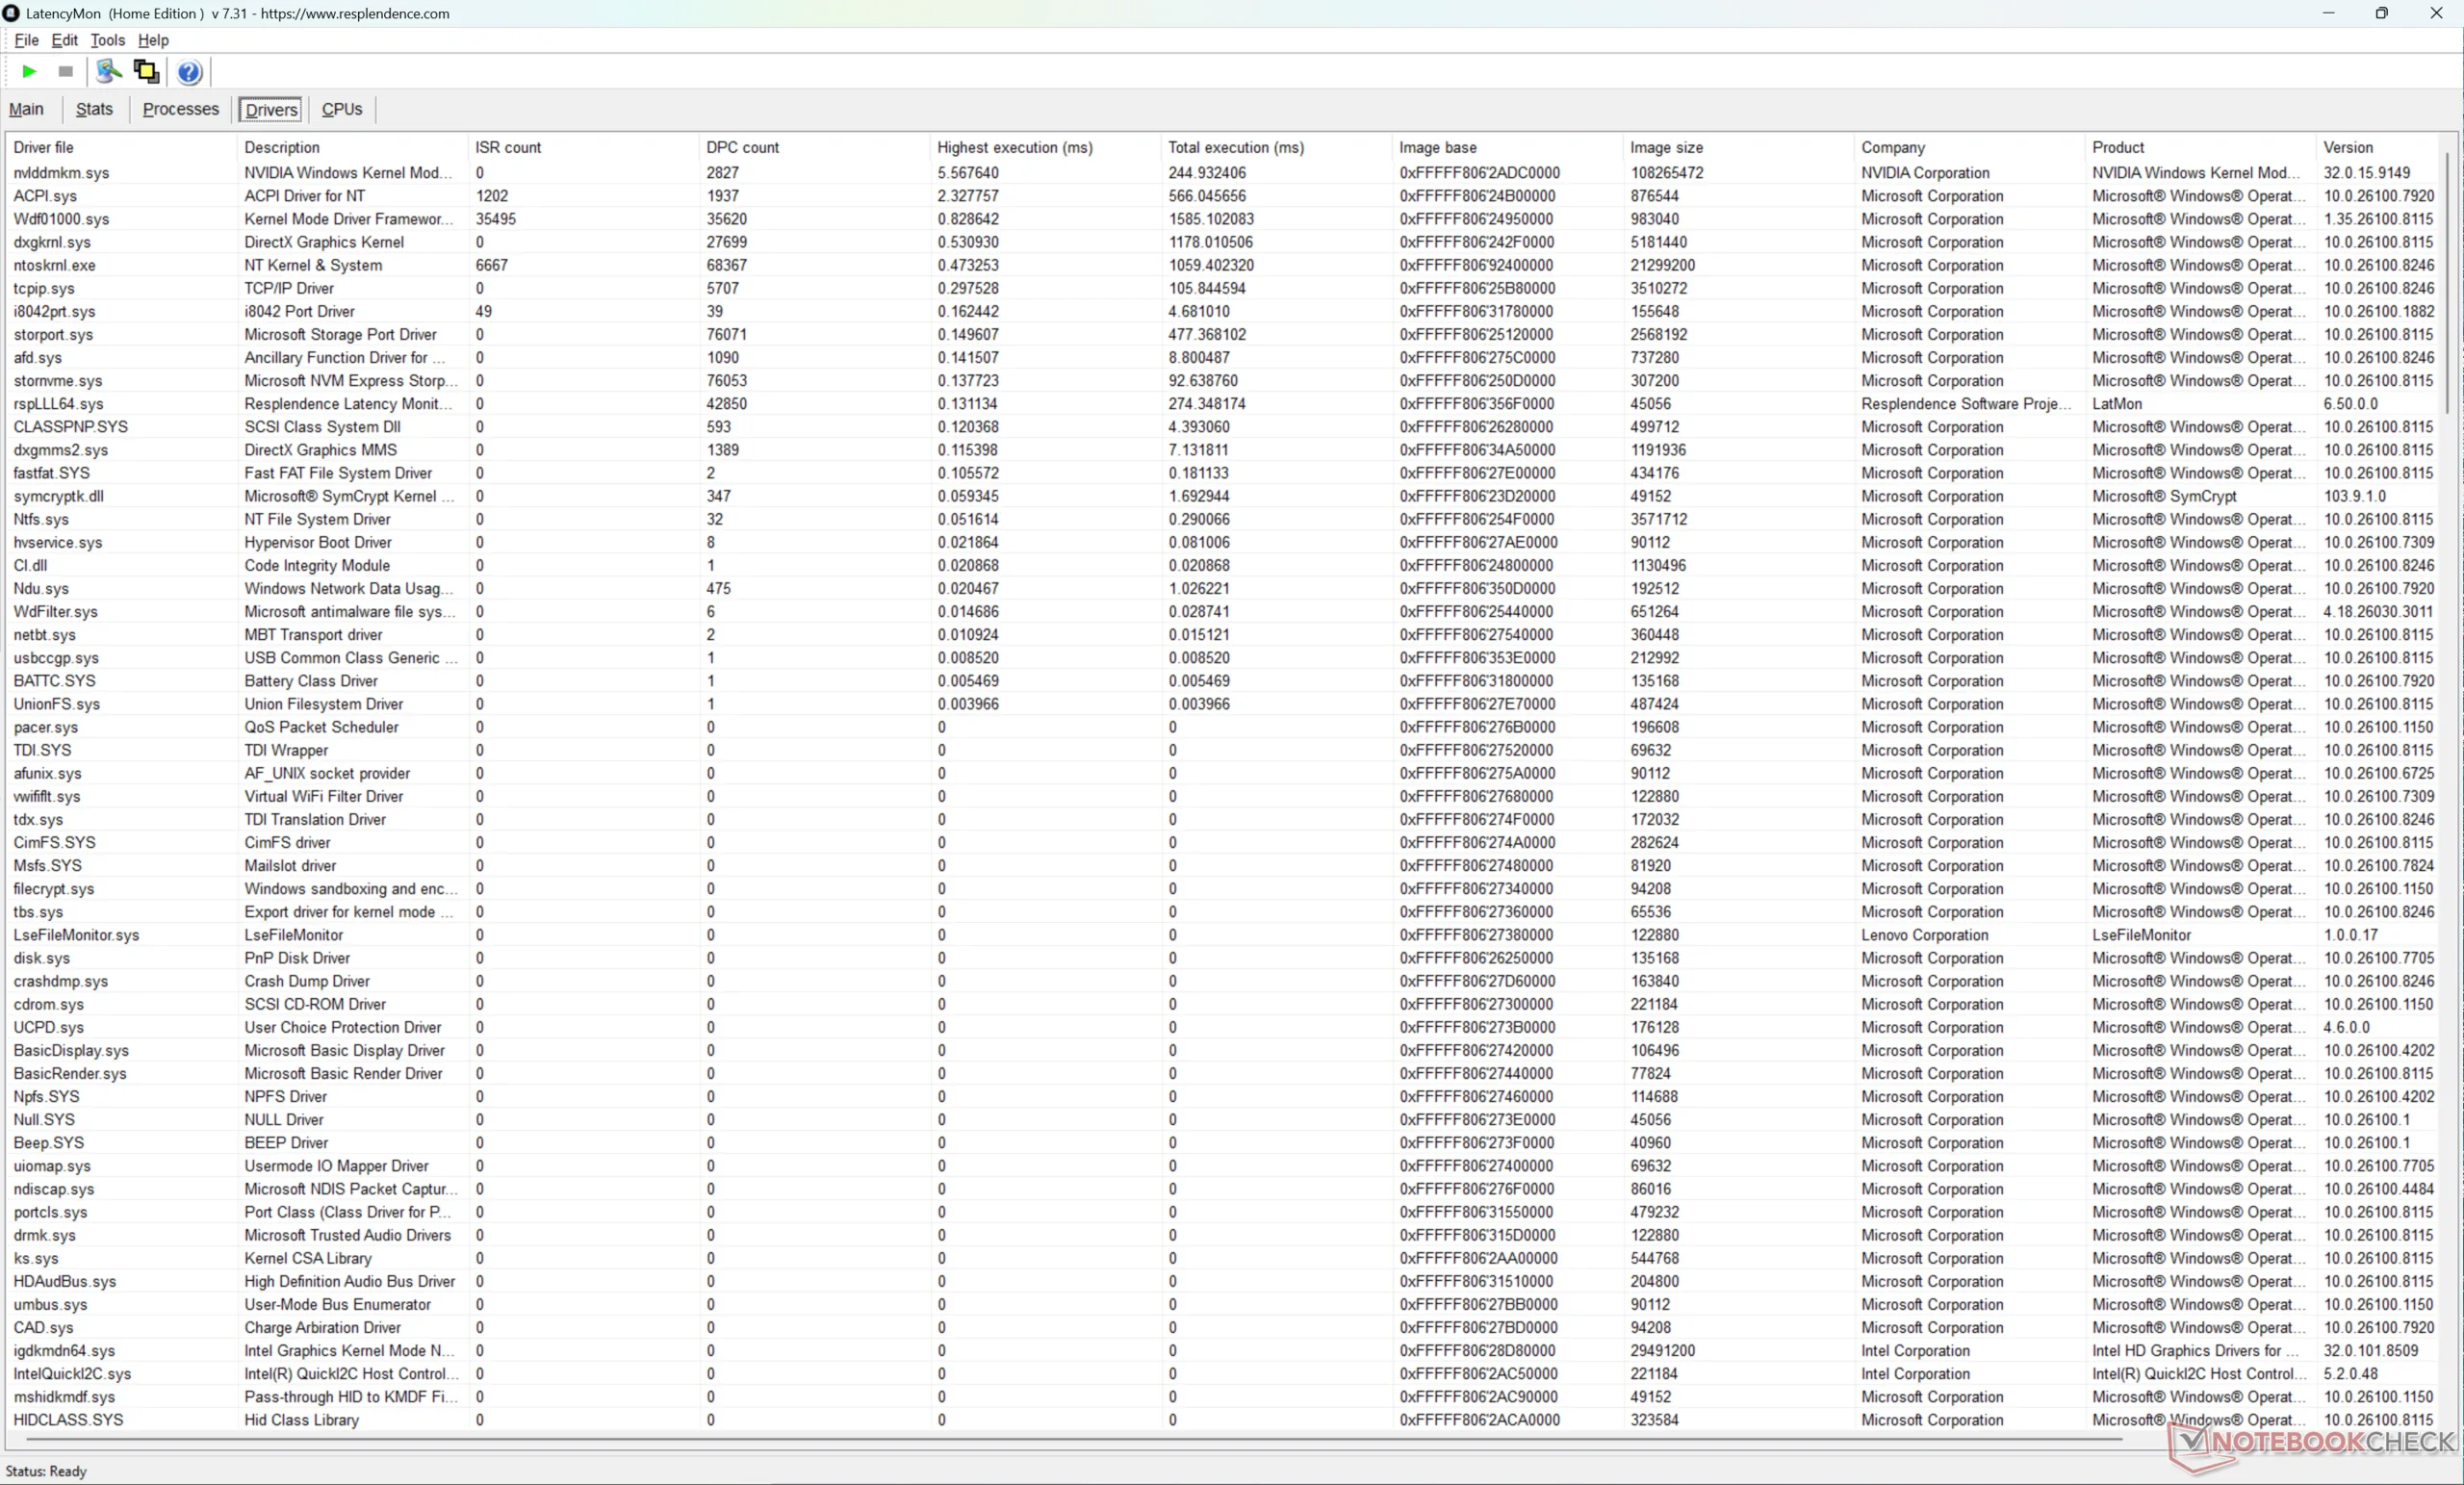
| DPC Latencies / LatencyMon - interrupt to process latency (max), Web, Youtube, Prime95 | |
| Lenovo Yoga Pro 9 16IAH10 RTX 5050 | |
| MSI Prestige 16 AI Evo B2HMG | |
| HP Omen Transcend 16-u1095ng | |
| Lenovo Pro 9 16IPH11 | |
| Asus ProArt P16 H7606WP | |
| Dell XPS 16 Core Ultra X7 358H | |
* ... mindre är bättre
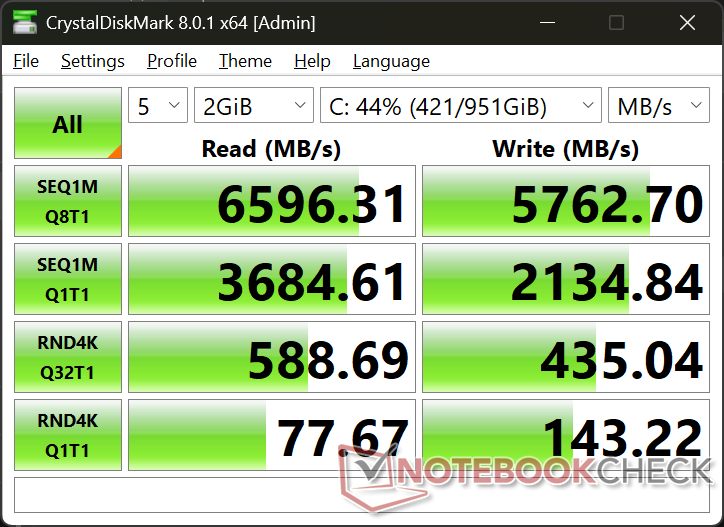
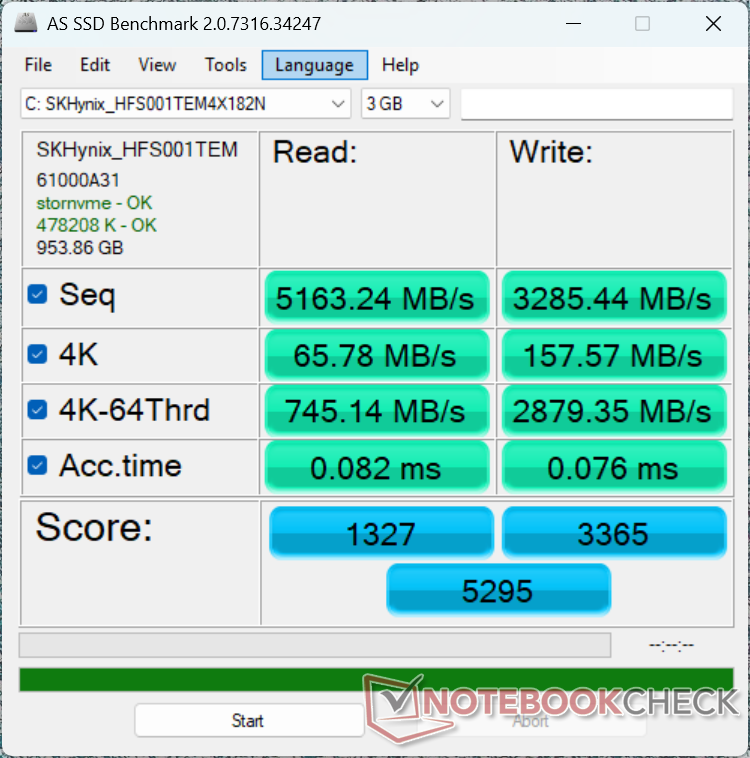
Lagringsenheter
Systemet stöder upp till två PCIe4 x4 NVMe SSD-enheter utan några problem med strypning. Observera att PCIe5 SSD-hastigheter inte stöds och att en av de två M.2 SSD-enheterna måste vara av den kortare 2242-sorten.

| Drive Performance rating - Percent | |
| MSI Prestige 16 AI Evo B2HMG | |
| HP Omen Transcend 16-u1095ng | |
| Lenovo Yoga Pro 9 16IAH10 RTX 5050 | |
| Asus ProArt P16 H7606WP | |
| Lenovo Pro 9 16IPH11 | |
| Dell XPS 16 Core Ultra X7 358H | |
* ... mindre är bättre
Diskbegränsning: DiskSpd läsloop, ködjup 8
GPU-prestanda
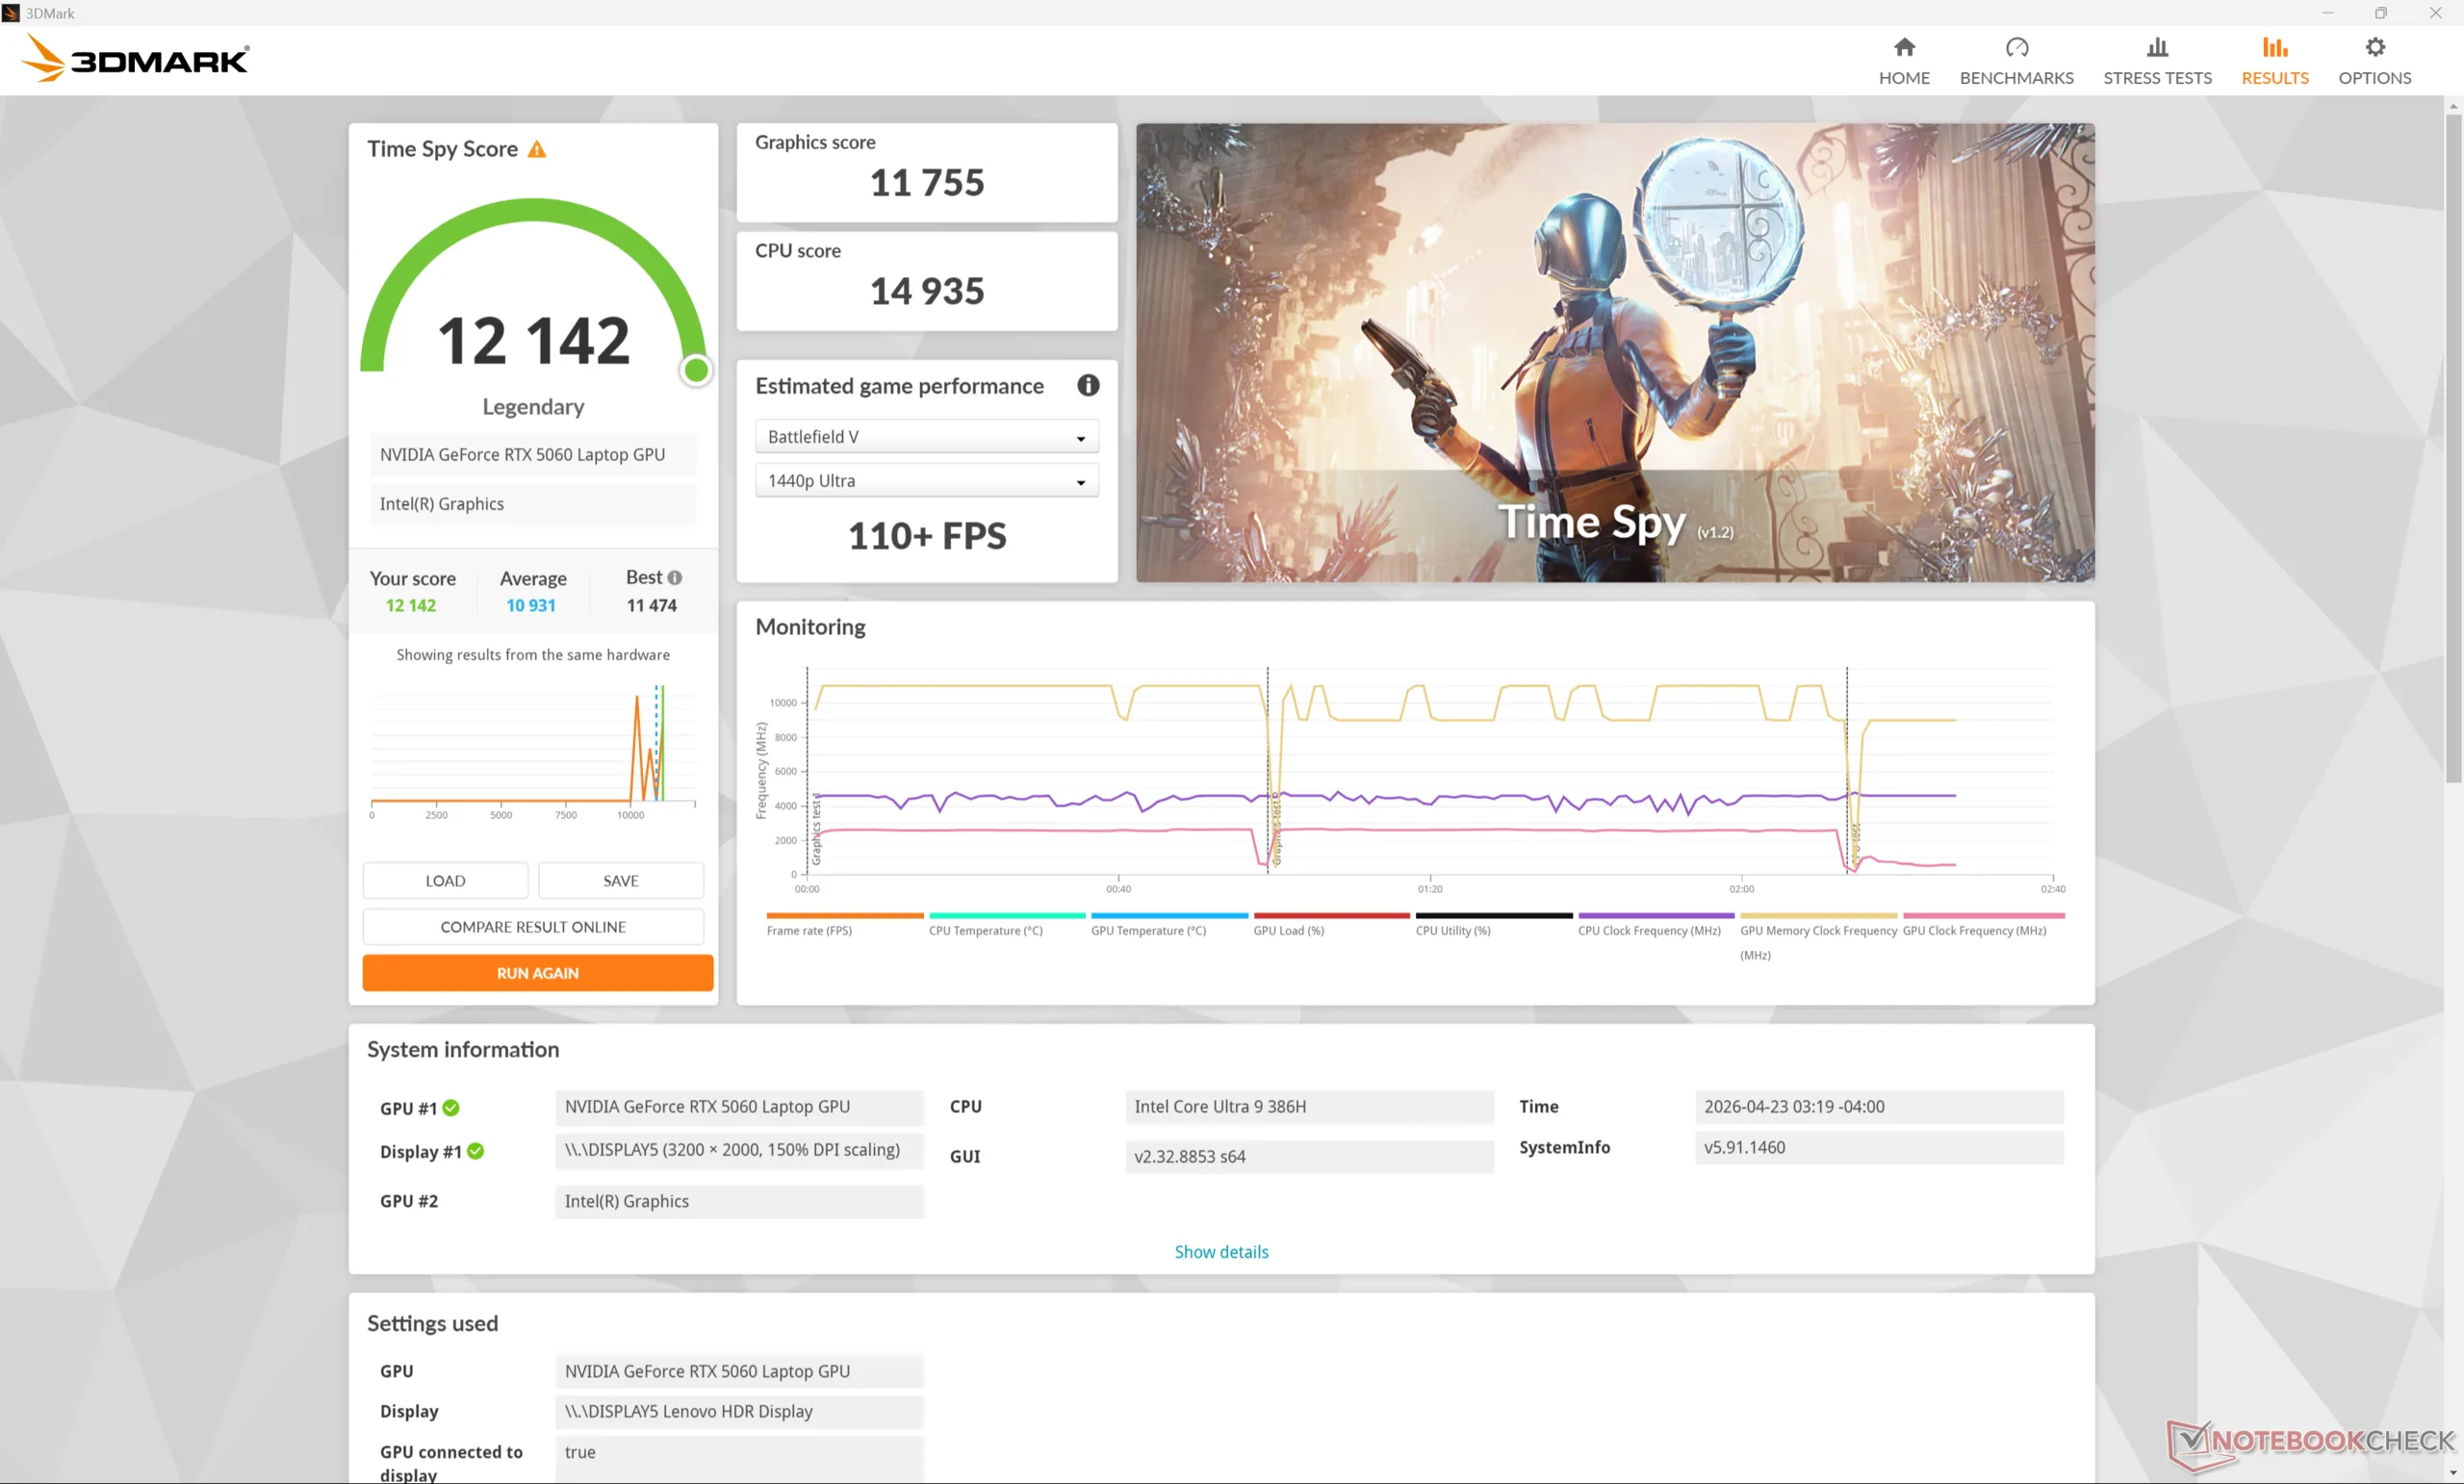
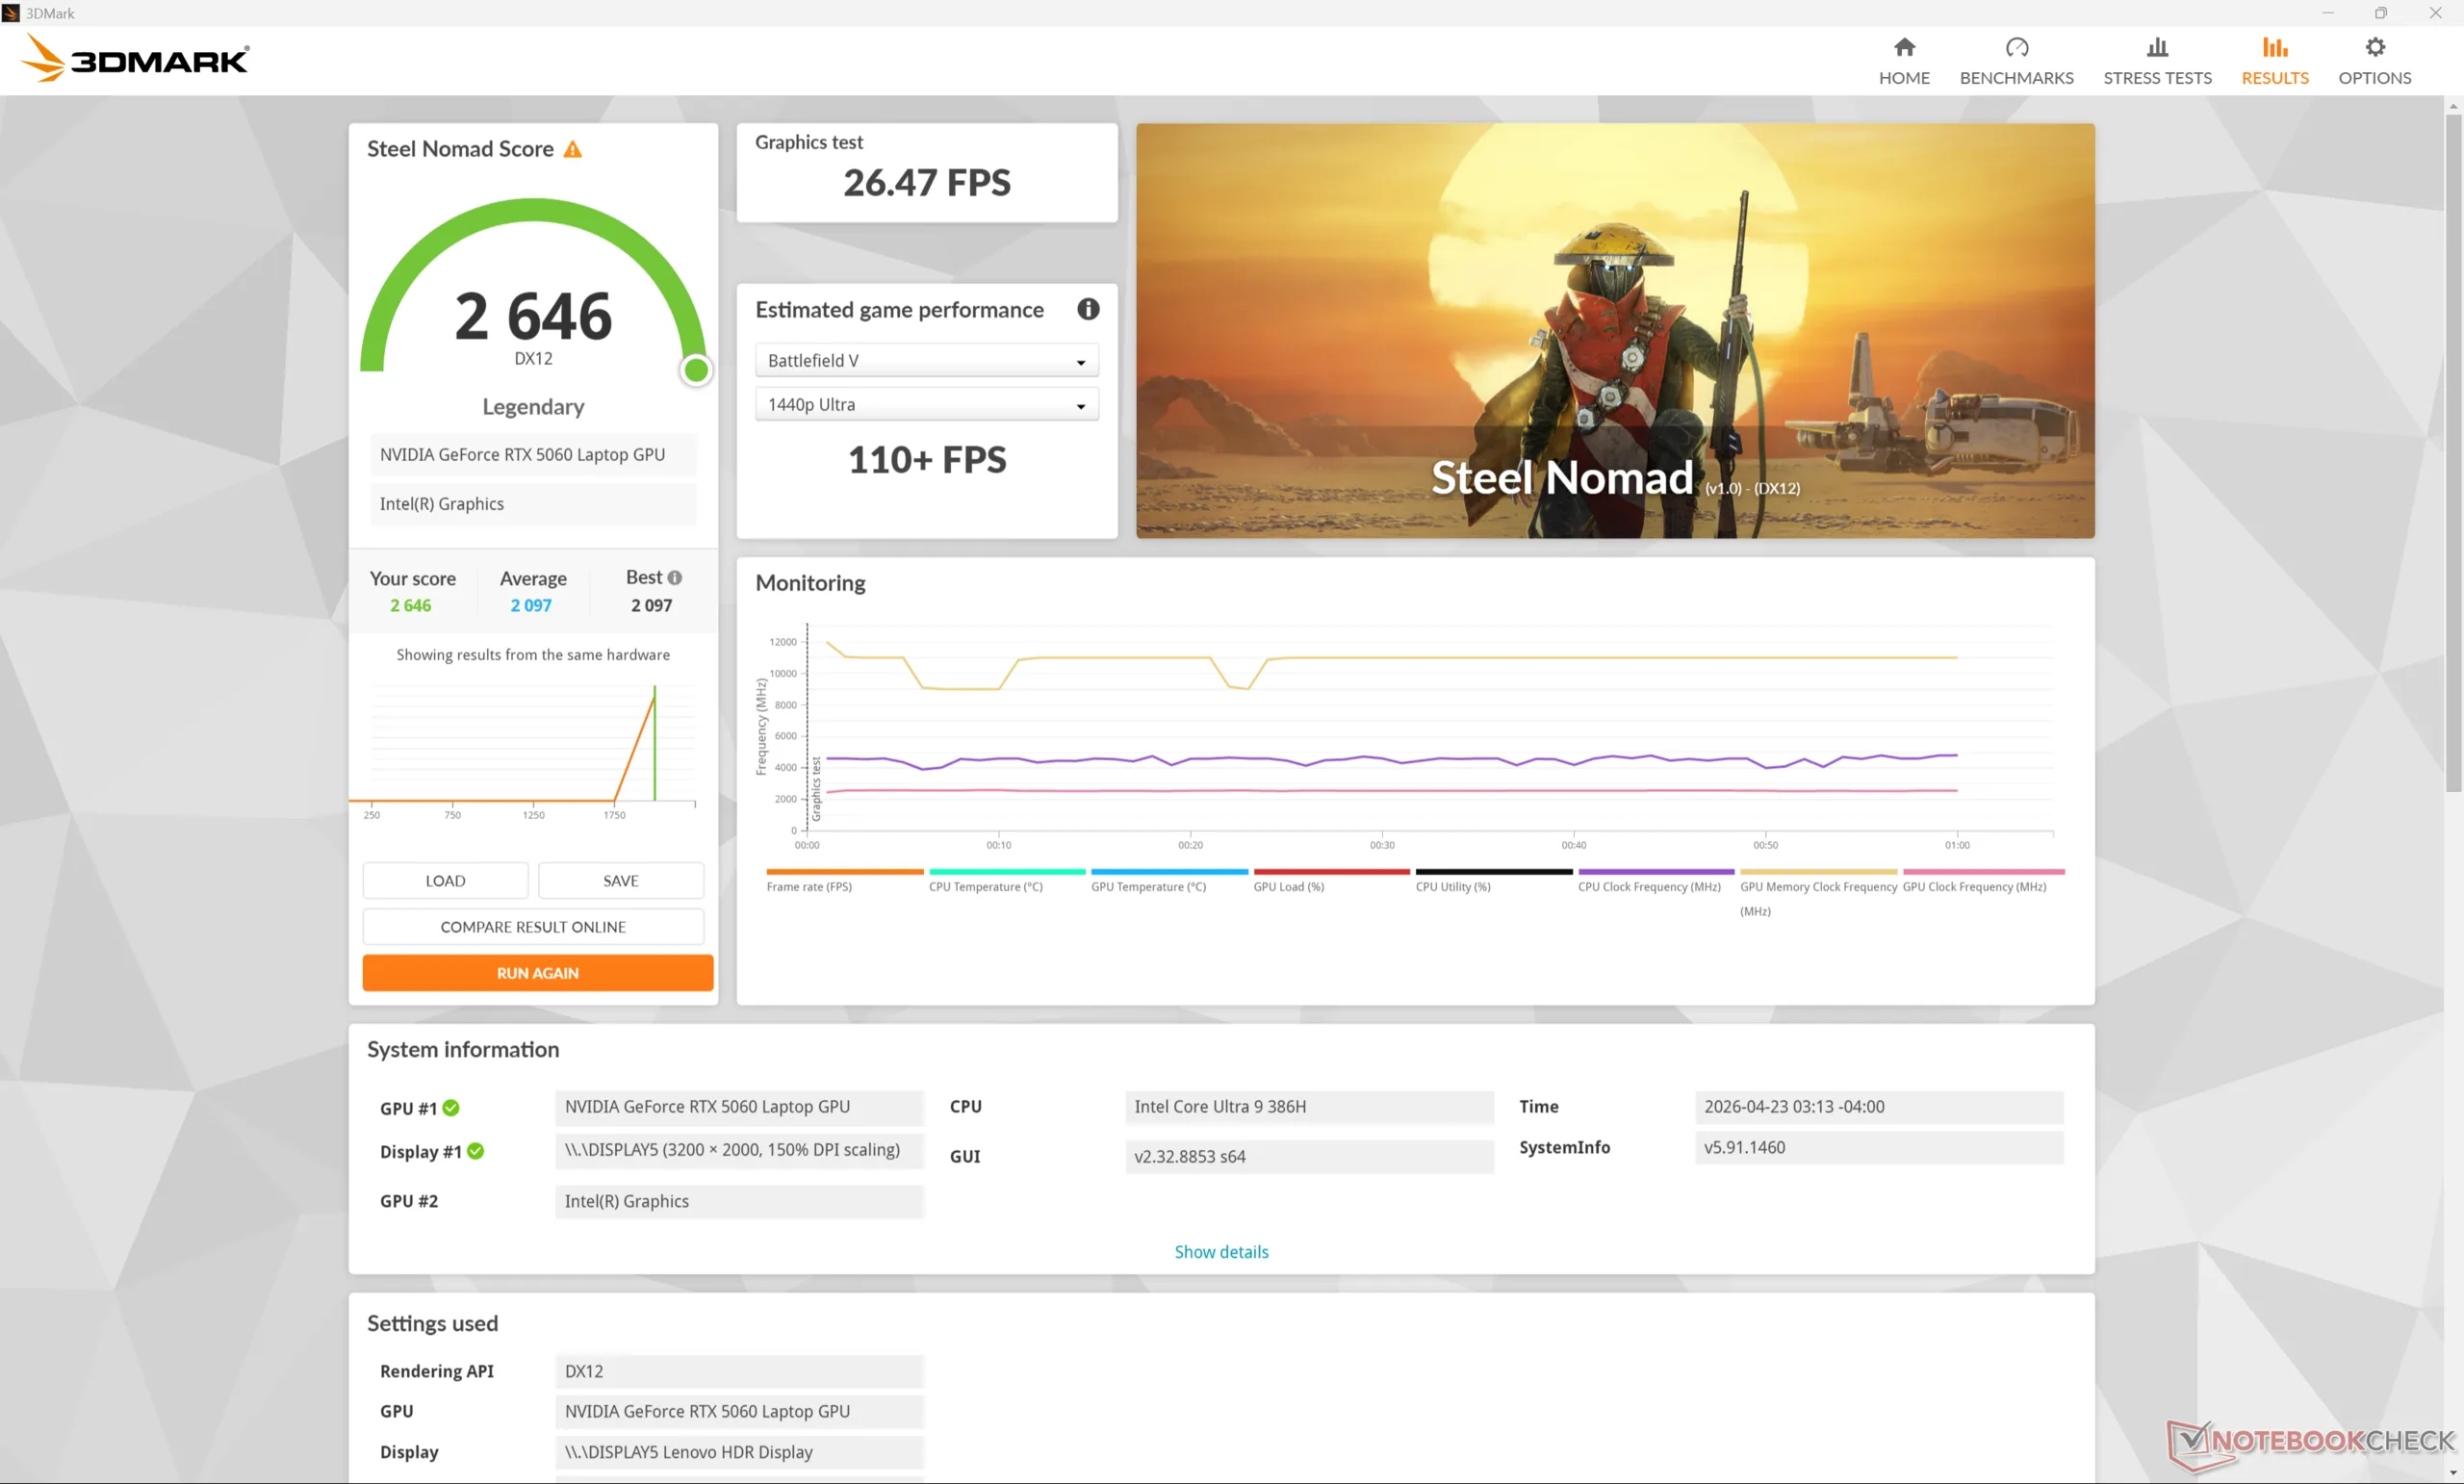
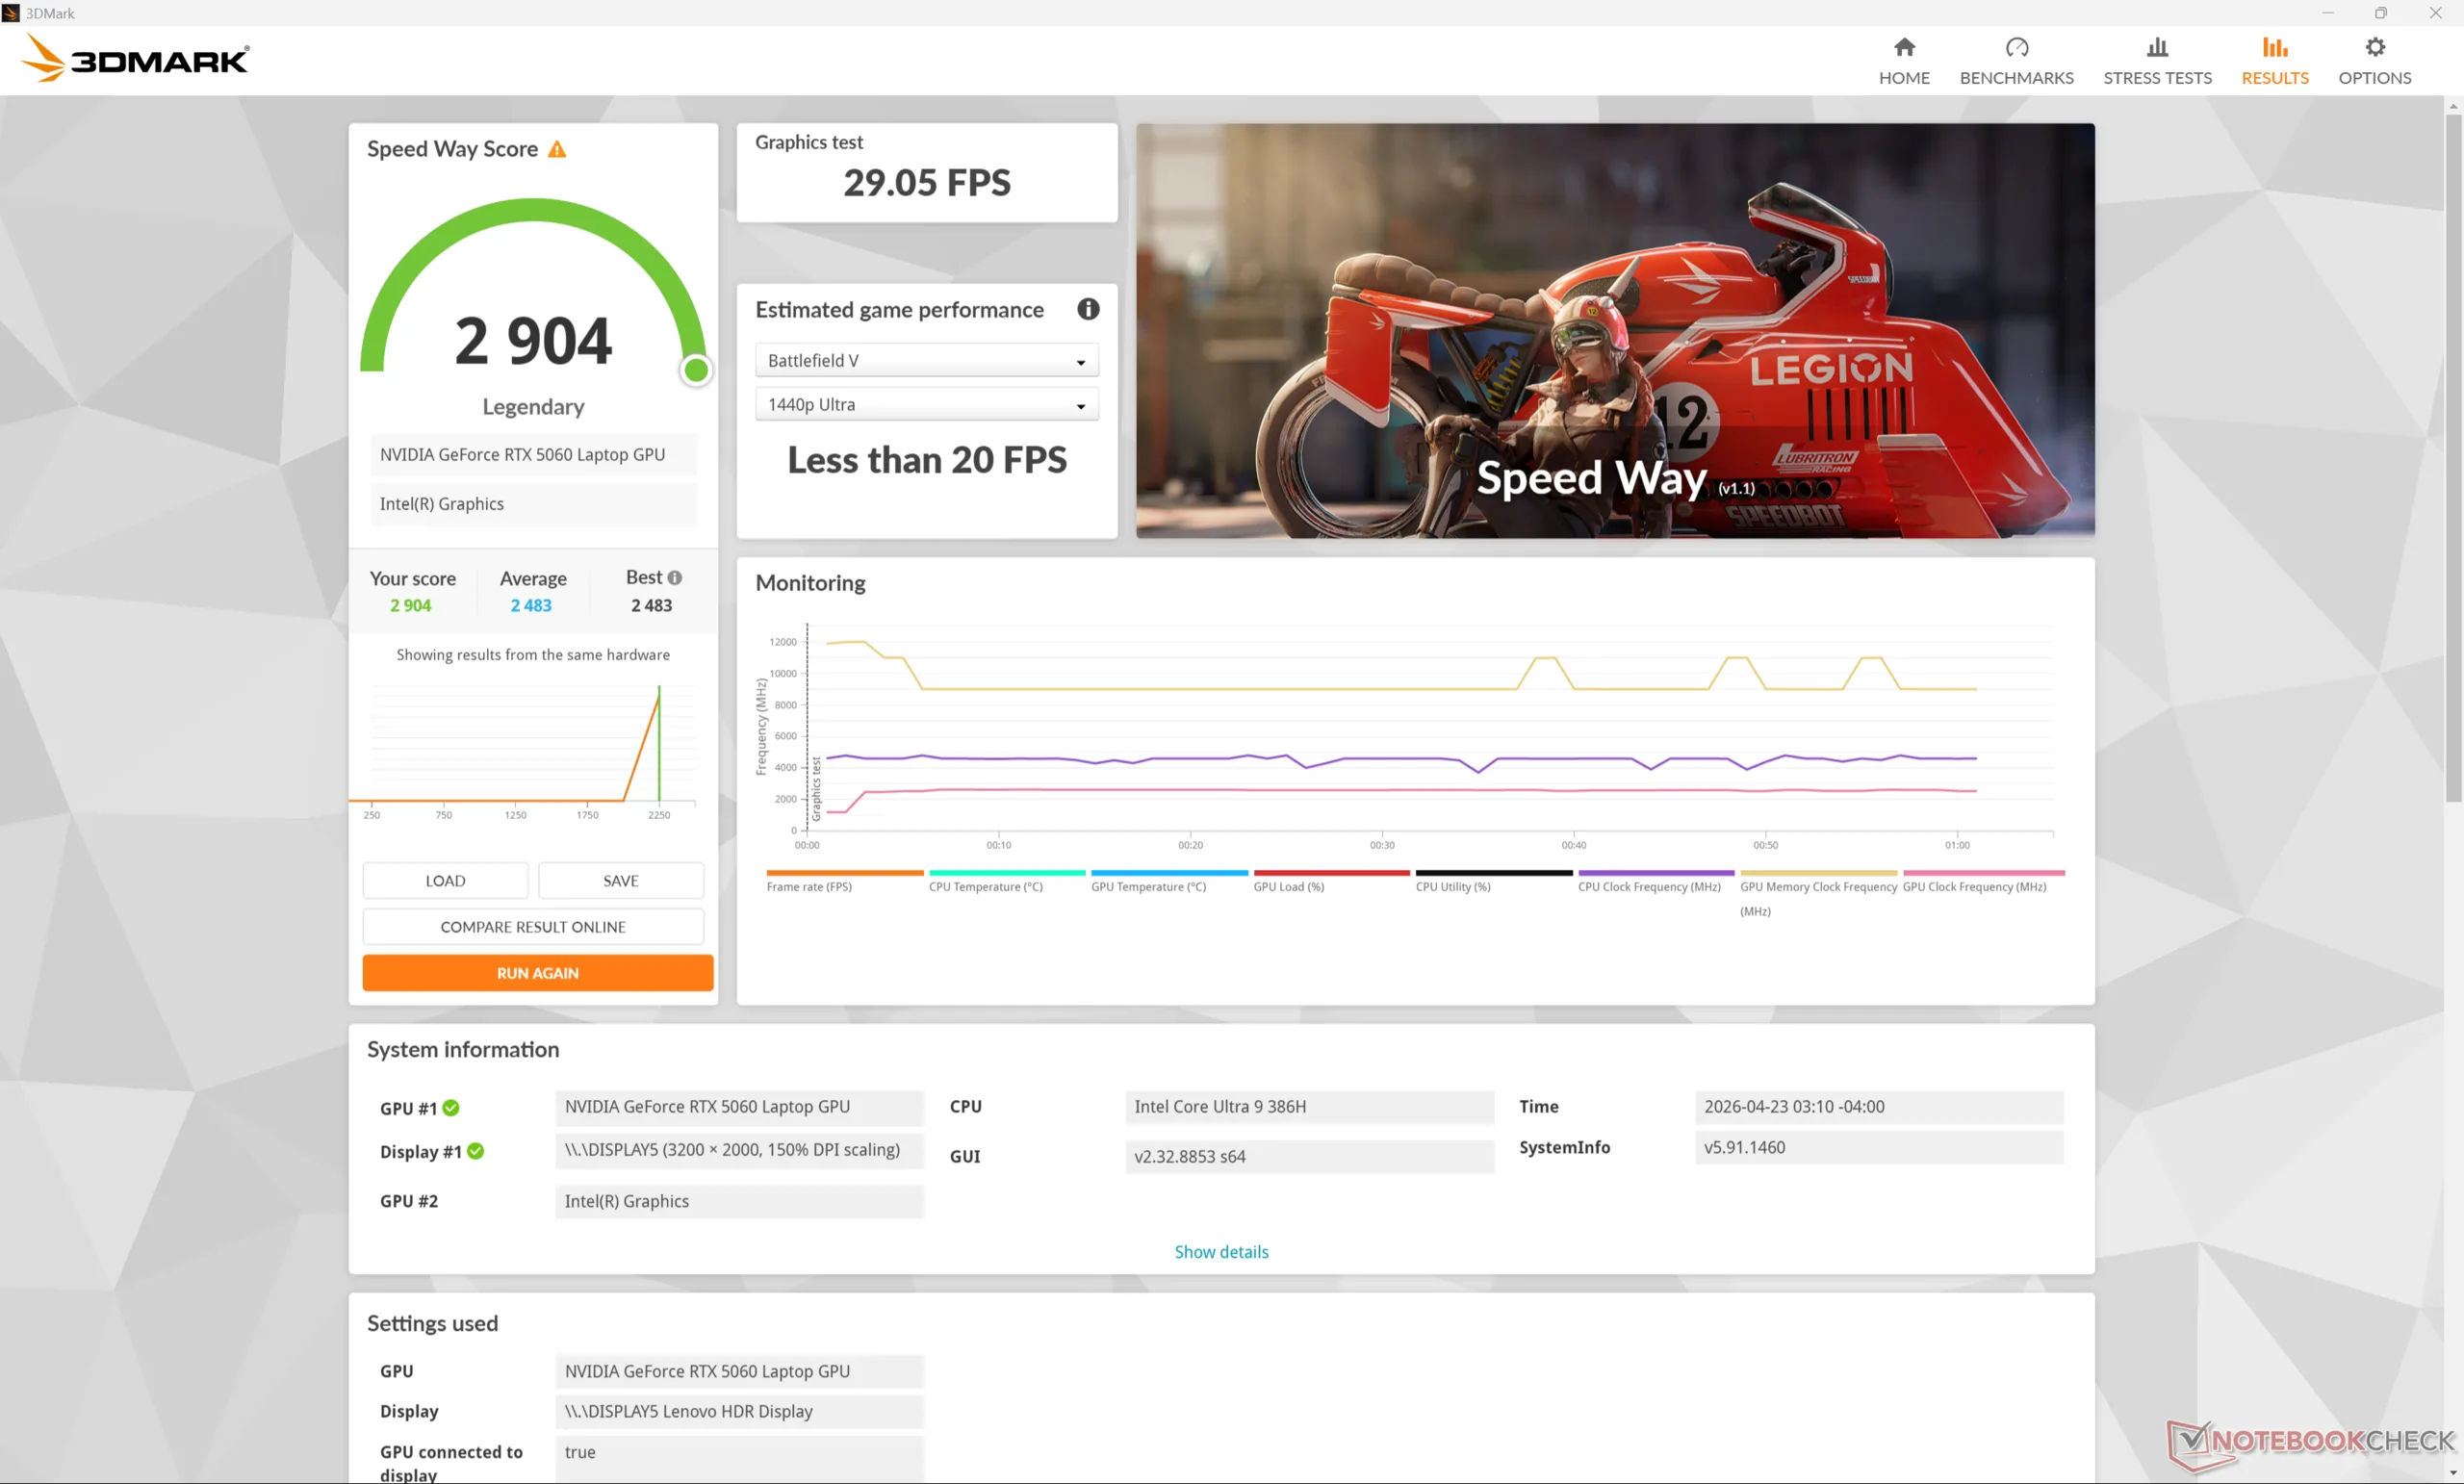
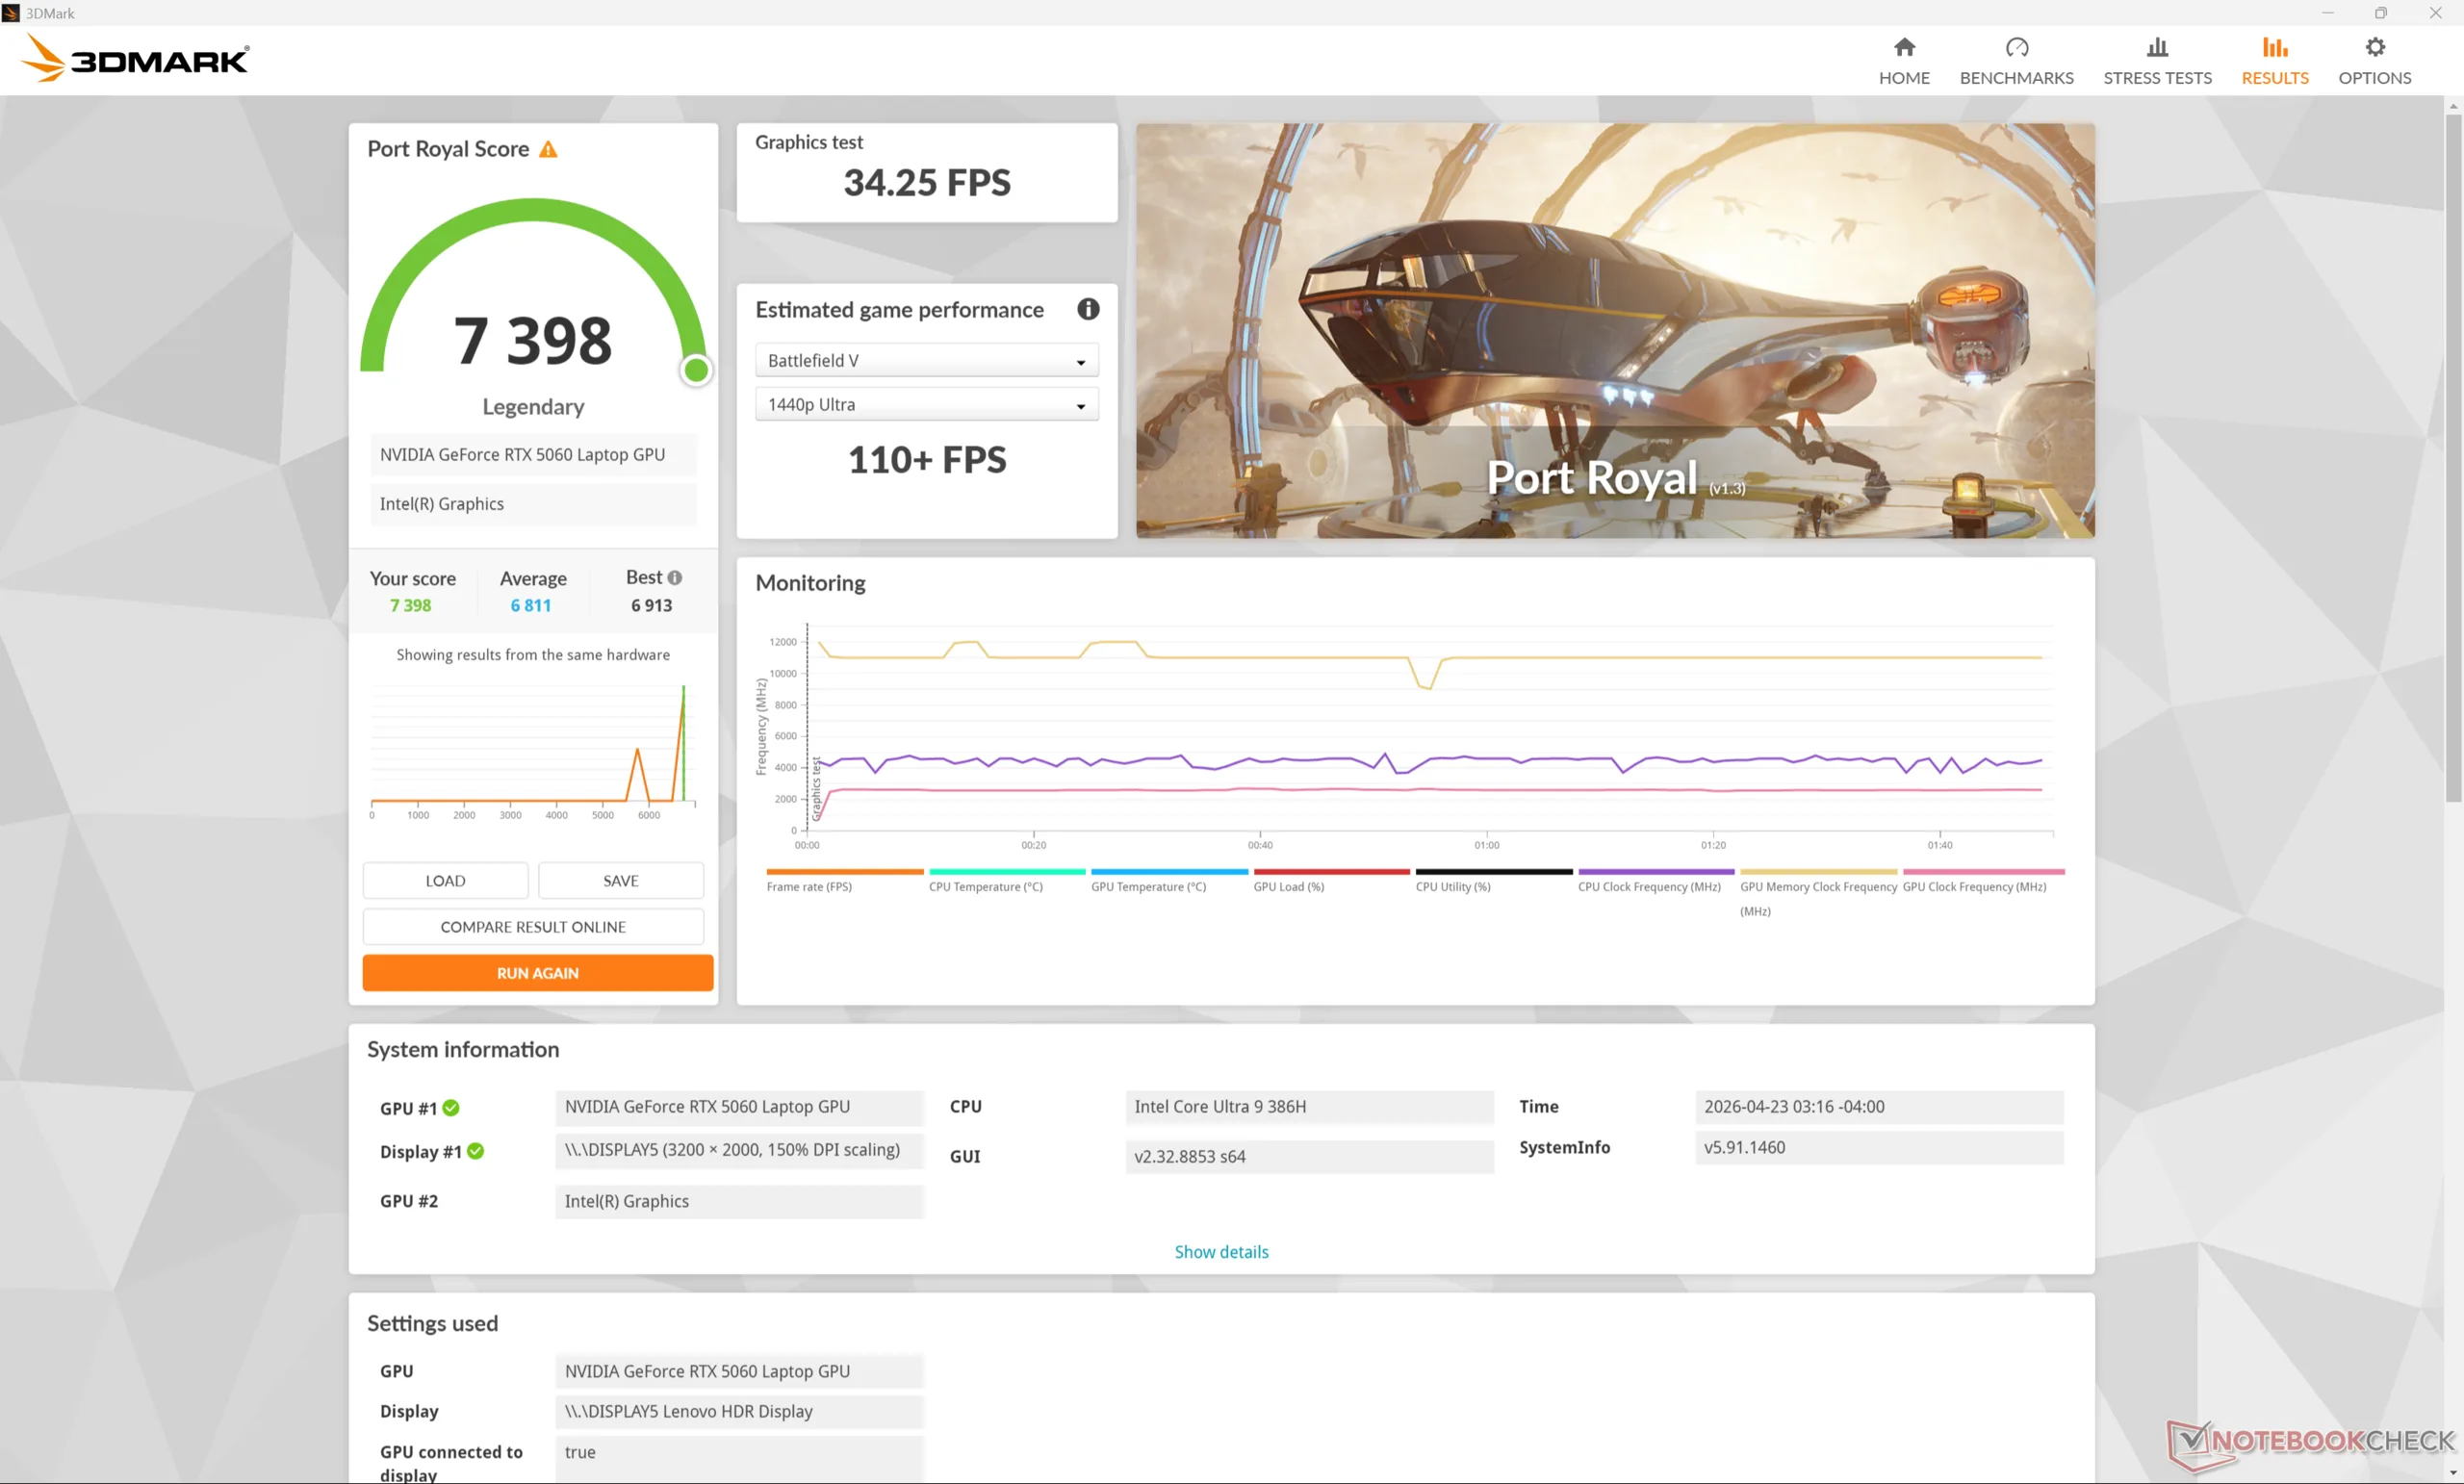
Den mobil GeForce RTX 5060 presterar där vi förväntar oss att den ska göra i förhållande till andra bärbara datorer med samma GPU. Den råa grafikprestandan ligger något efter den speloptimerade Legion 7 16 AGP11 utrustad med samma RTX 5060 med bara några få procentenheter.
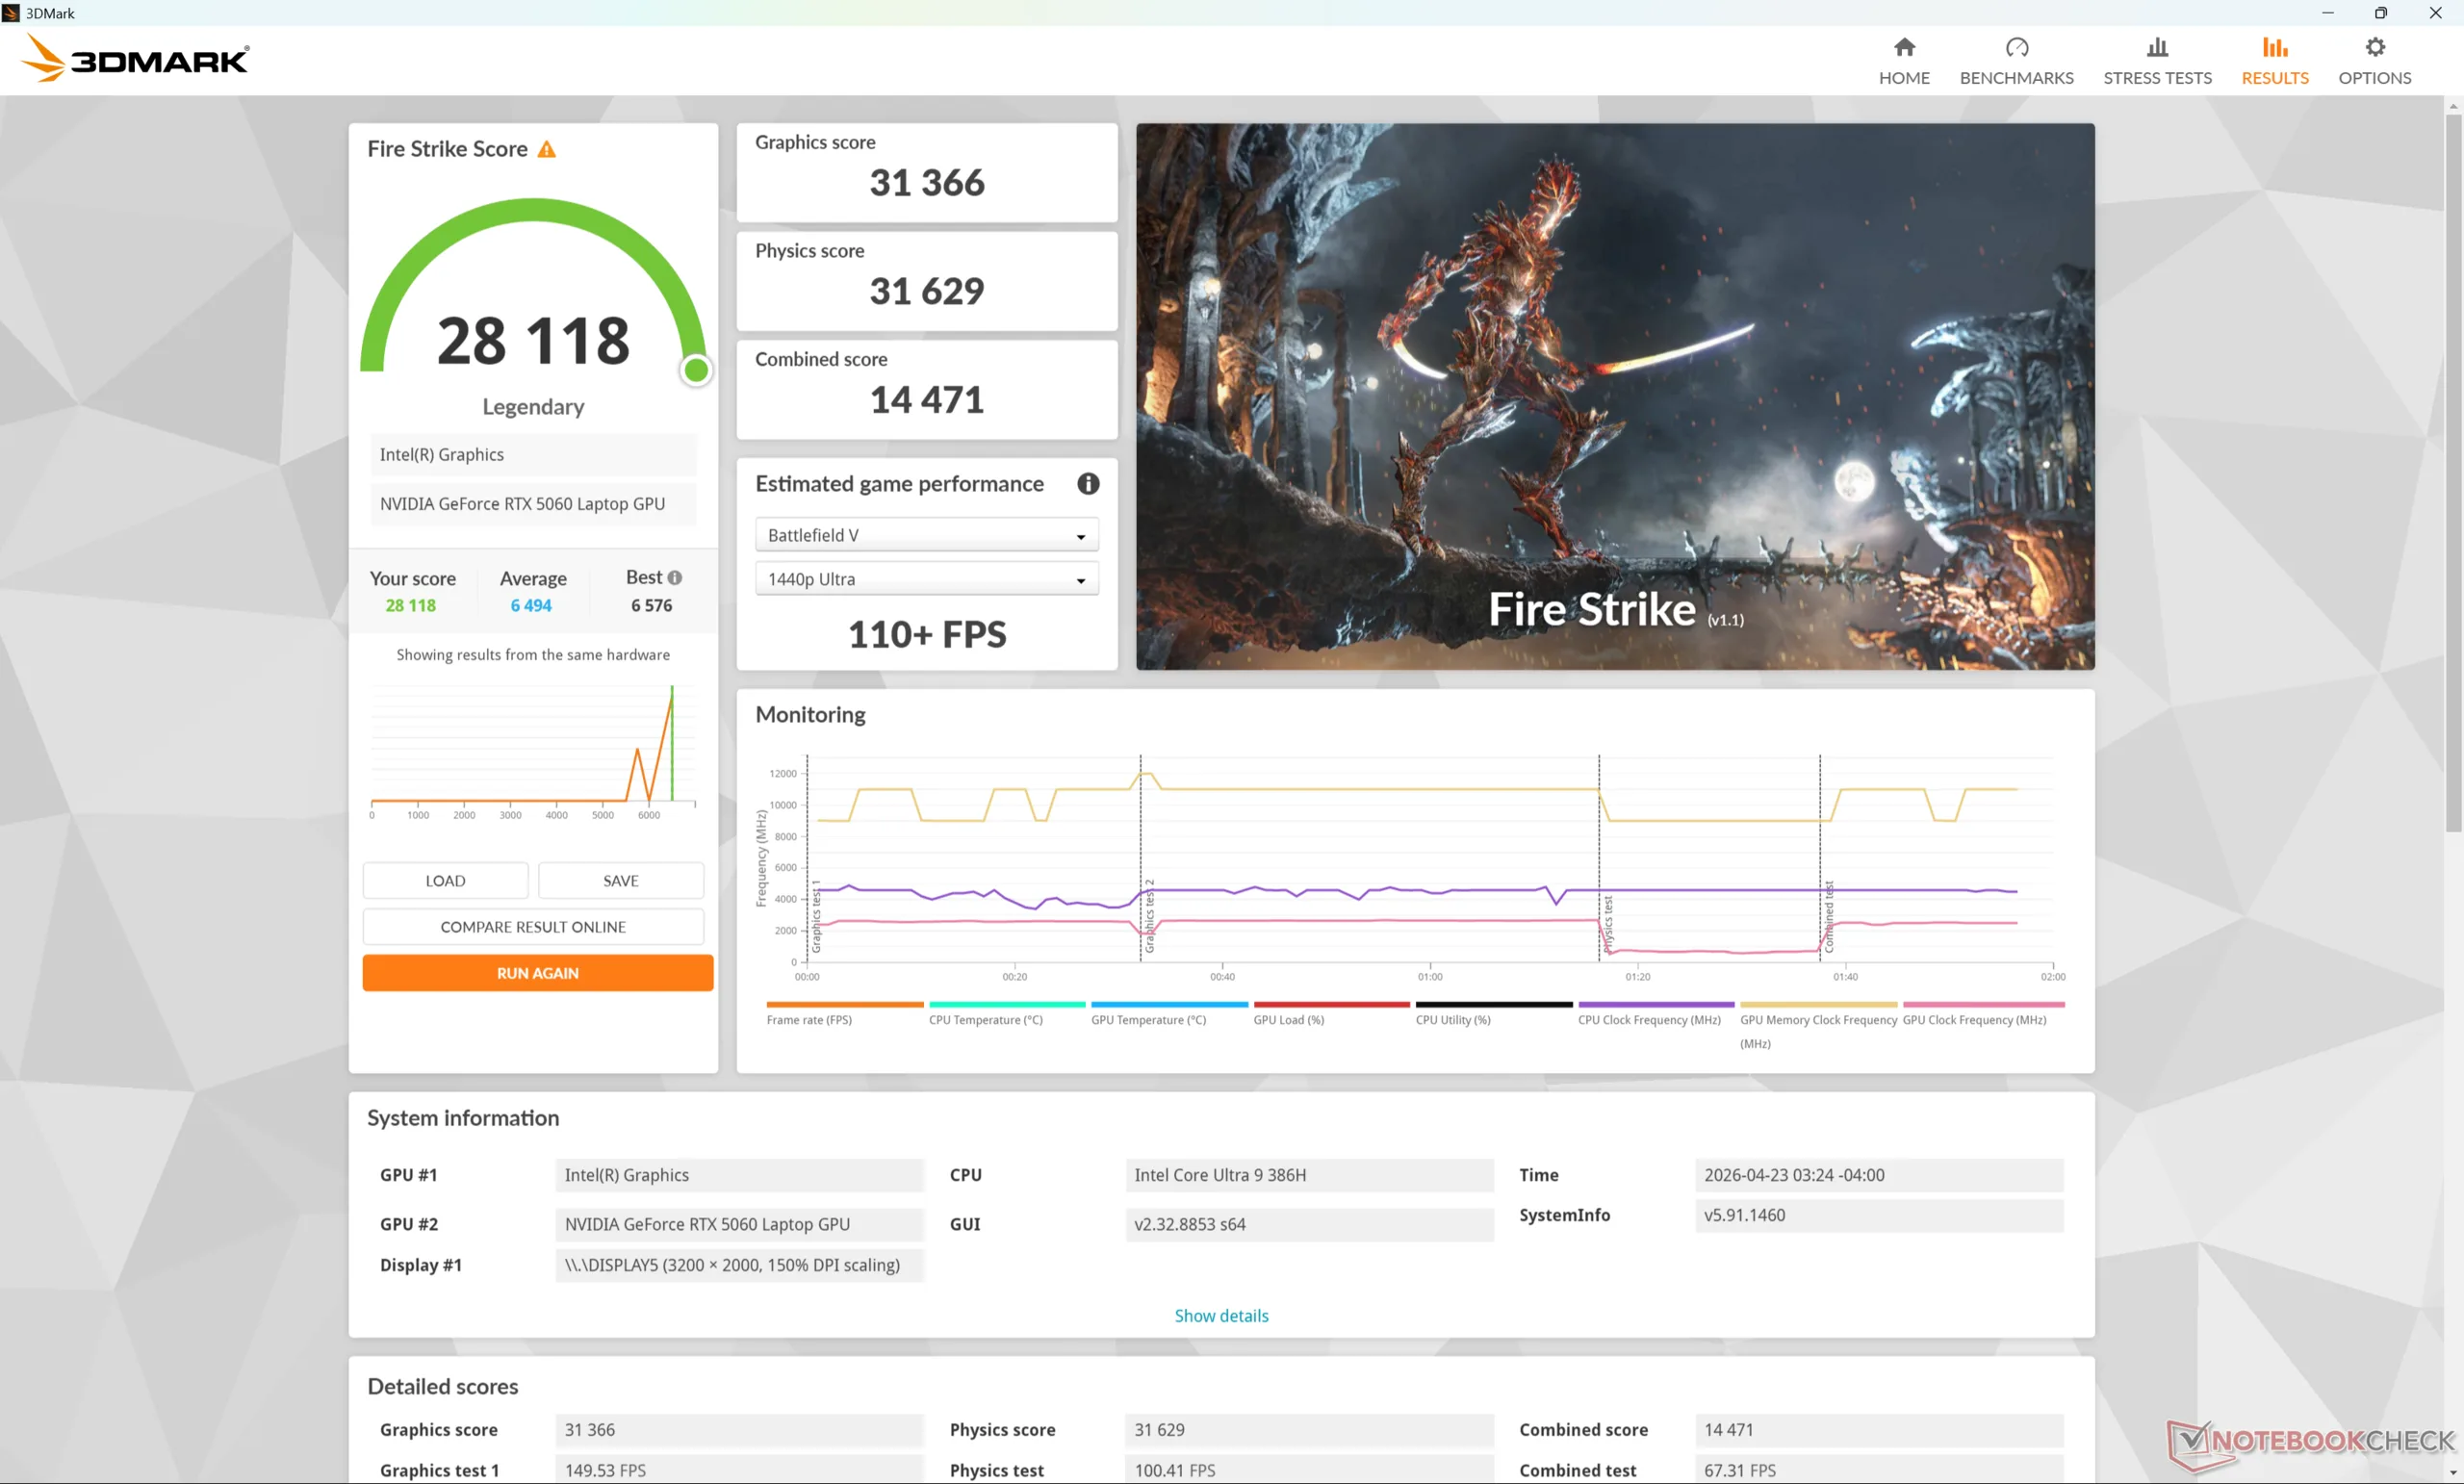
Att köra systemet i balanserat läge istället för prestandaläge skulle påverka grafikprestandan med upp till 10 procent, vilket framgår av vår resultattabell Time Spy nedan.
En nedgradering till RTX 5050-konfigurationen från vårt RTX 5060 förväntas minska grafikprestandan med så mycket som 20 till 25 procent.
| Effektprofil | Grafikpoäng | Fysikpoäng | Kombinerad poäng |
| Prestanda-läge | 11755 | 14935 | 12142 |
| Balanserat läge | 10676 (-9%) | 15025 (-0%) | 11160 (-8%) |
| Batteridrift | 9886 (-16%) | 12811 (-14%) | 10236 (-16%) |
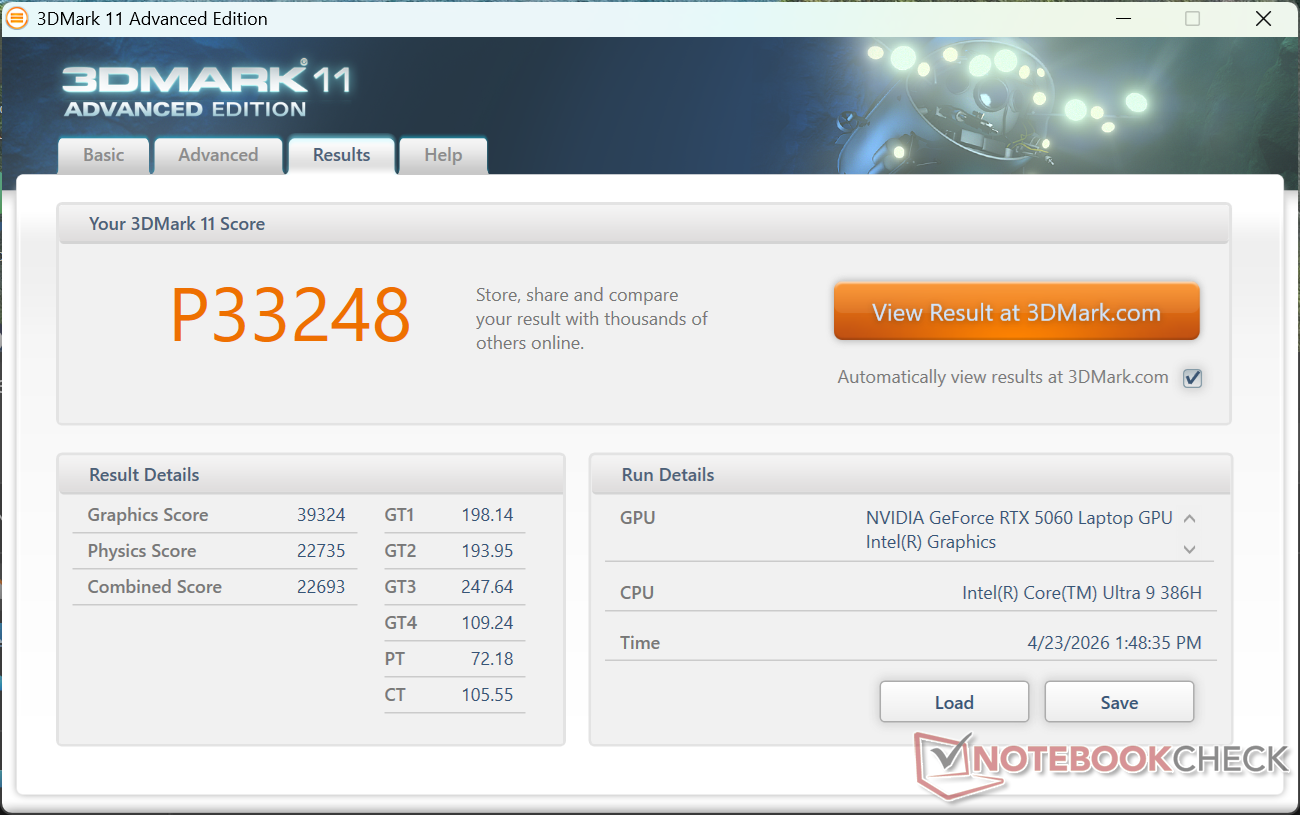
| 3DMark 11 Performance | 33248 poäng | |
| 3DMark Cloud Gate Standard Score | 61799 poäng | |
| 3DMark Fire Strike Score | 28118 poäng | |
| 3DMark Time Spy Score | 12142 poäng | |
| 3DMark Steel Nomad Score | 2646 poäng | |
Hjälp | ||
* ... mindre är bättre
| Cyberpunk 2077 - 1920x1080 Ultra Preset (FSR off) | |
| Asus ProArt P16 H7606WP | |
| Lenovo Pro 9 16IPH11 | |
| Lenovo Yoga Pro 9 16IAH10 RTX 5050 | |
| Dell XPS 16 Core Ultra X7 358H | |
| MSI Prestige 16 AI Evo B2HMG | |
| Baldur's Gate 3 - 1920x1080 Ultra Preset AA:T | |
| Asus ProArt P16 H7606WP | |
| Lenovo Pro 9 16IPH11 | |
| Lenovo Yoga Pro 9 16IAH10 RTX 5050 | |
| Dell XPS 16 Core Ultra X7 358H | |
| MSI Prestige 16 AI Evo B2HMG | |
| GTA V - 1920x1080 Highest AA:4xMSAA + FX AF:16x | |
| Lenovo Pro 9 16IPH11 | |
| Lenovo Yoga Pro 9 16IAH10 RTX 5050 | |
| Asus ProArt P16 H7606WP | |
| HP Omen Transcend 16-u1095ng | |
| Dell XPS 16 Core Ultra X7 358H | |
| MSI Prestige 16 AI Evo B2HMG | |
| Final Fantasy XV Benchmark - 1920x1080 High Quality | |
| Asus ProArt P16 H7606WP | |
| Lenovo Pro 9 16IPH11 | |
| Lenovo Yoga Pro 9 16IAH10 RTX 5050 | |
| HP Omen Transcend 16-u1095ng | |
| Dell XPS 16 Core Ultra X7 358H | |
| MSI Prestige 16 AI Evo B2HMG | |
| Strange Brigade - 1920x1080 ultra AA:ultra AF:16 | |
| Asus ProArt P16 H7606WP | |
| Lenovo Pro 9 16IPH11 | |
| HP Omen Transcend 16-u1095ng | |
| Lenovo Yoga Pro 9 16IAH10 RTX 5050 | |
| Dell XPS 16 Core Ultra X7 358H | |
| MSI Prestige 16 AI Evo B2HMG | |
| Dota 2 Reborn - 1920x1080 ultra (3/3) best looking | |
| HP Omen Transcend 16-u1095ng | |
| Lenovo Yoga Pro 9 16IAH10 RTX 5050 | |
| Lenovo Pro 9 16IPH11 | |
| Asus ProArt P16 H7606WP | |
| Dell XPS 16 Core Ultra X7 358H | |
| MSI Prestige 16 AI Evo B2HMG | |
| X-Plane 11.11 - 1920x1080 high (fps_test=3) | |
| HP Omen Transcend 16-u1095ng | |
| Lenovo Yoga Pro 9 16IAH10 RTX 5050 | |
| Asus ProArt P16 H7606WP | |
| Dell XPS 16 Core Ultra X7 358H | |
| MSI Prestige 16 AI Evo B2HMG | |
| Black Myth: Wukong | |
| 1920x1080 high TSR 100 | |
| Genomsnitt NVIDIA GeForce RTX 5060 Laptop (50 - 58, n=2) | |
| Lenovo Pro 9 16IPH11 | |
| Dell XPS 16 Core Ultra X7 358H | |
| 1920x1080 cinematic TSR 100 | |
| Genomsnitt NVIDIA GeForce RTX 5060 Laptop (28 - 32, n=3) | |
| Lenovo Pro 9 16IPH11 | |
| Dell XPS 16 Core Ultra X7 358H | |
| 2560x1440 cinematic TSR 100 | |
| Genomsnitt NVIDIA GeForce RTX 5060 Laptop (21 - 23, n=3) | |
| Lenovo Pro 9 16IPH11 | |
| 2560x1440 cinematic DLSS 68 | |
| Genomsnitt NVIDIA GeForce RTX 5060 Laptop (32 - 36, n=2) | |
| Lenovo Pro 9 16IPH11 | |
| 2560x1440 cinematic RT: Very High DLSS 68 FG | |
| Lenovo Pro 9 16IPH11 | |
| Genomsnitt NVIDIA GeForce RTX 5060 Laptop (31 - 37, n=2) | |
| F1 24 | |
| 1920x1080 Ultra High Preset AA:T AF:16x | |
| Asus ProArt P16 H7606WP | |
| Lenovo Legion 7 16 AGP11 | |
| Genomsnitt NVIDIA GeForce RTX 5060 Laptop (68.2 - 77.5, n=8) | |
| Lenovo Pro 9 16IPH11 | |
| Lenovo Yoga Pro 9 16IAH10 RTX 5050 | |
| Dell XPS 16 Core Ultra X7 358H | |
| MSI Venture 16 AI A2HMTG | |
| 2560x1440 Ultra High Preset AA:T AF:16x | |
| Asus ProArt P16 H7606WP | |
| Lenovo Legion 7 16 AGP11 | |
| Genomsnitt NVIDIA GeForce RTX 5060 Laptop (39 - 49.1, n=8) | |
| Lenovo Pro 9 16IPH11 | |
| Lenovo Yoga Pro 9 16IAH10 RTX 5050 | |
| 2560x1440 Ultra High Preset + Quality DLSS AF:16x | |
| Lenovo Legion 7 16 AGP11 | |
| Lenovo Pro 9 16IPH11 | |
| Genomsnitt NVIDIA GeForce RTX 5060 Laptop (65 - 74.5, n=7) | |
| Lenovo Yoga Pro 9 16IAH10 RTX 5050 | |
| Monster Hunter Wilds | |
| 1920x1080 high, no upscaling | |
| Lenovo Pro 9 16IPH11 | |
| Genomsnitt NVIDIA GeForce RTX 5060 Laptop (49.7 - 58.8, n=2) | |
| 1920x1080 ultra, RT: high, no upscaling | |
| Lenovo Pro 9 16IPH11 | |
| Genomsnitt NVIDIA GeForce RTX 5060 Laptop (16.6 - 36.5, n=3) | |
| 2560x1440 ultra, RT: high, no upscaling | |
| Lenovo Pro 9 16IPH11 | |
| Genomsnitt NVIDIA GeForce RTX 5060 Laptop (13.9 - 20.9, n=2) | |
Cyberpunk 2077 ultra FPS-diagram
| låg | med. | hög | ultra | QHD DLSS | QHD | |
|---|---|---|---|---|---|---|
| GTA V (2015) | 185.8 | 183.5 | 179.4 | 133.6 | 110.7 | |
| Dota 2 Reborn (2015) | 172.5 | 156.7 | 151.6 | 142.4 | ||
| Final Fantasy XV Benchmark (2018) | 187.9 | 170.4 | 124.1 | 92.3 | ||
| X-Plane 11.11 (2018) | 113 | 102.9 | ||||
| Strange Brigade (2018) | 482 | 314 | 214 | 217 | 125.5 | |
| Baldur's Gate 3 (2023) | 164.6 | 137.8 | 119.9 | 117.8 | 117.5 | 79.4 |
| Cyberpunk 2077 (2023) | 132.3 | 108.2 | 92.3 | 83.3 | 63.2 | 53.4 |
| F1 24 (2024) | 249 | 249 | 207 | 69.5 | 69.3 | 42.8 |
| Black Myth: Wukong (2024) | 85 | 64 | 50 | 28 | 32 | 21 |
| Monster Hunter Wilds (2025) | 74.2 | 63 | 58.8 | 34.8 | 20.9 |
Utsläpp
Systembuller
Fläktljudets tak och beteende matchar förra årets Yoga Pro 9 16IAH10 eftersom det inte finns några större förändringar på moderkortet. Kanske viktigast av allt är att fläktljudet när Cyberpunk 2077 körs ligger runt 41 dB(A) i balanserat läge eller 50 dB(A) i prestandaläge. Den tidigare nämnda 10-procentiga nedgången i grafikprestanda när du spelar i balanserat läge kan vara en rimlig kompromiss för de mycket tystare fläktarna.
Ljudnivå
| Låg belastning |
| 23.5 / 24 / 24 dB(A) |
| Hög belastning |
| 32.3 / 50.1 dB(A) |
 | ||
30 dB tyst 40 dB(A) hörbar 50 dB(A) högt ljud |
||
min: | ||
| Lenovo Pro 9 16IPH11 Ultra 9 386H, GeForce RTX 5060 Laptop | Lenovo Yoga Pro 9 16IAH10 RTX 5050 Ultra 9 285H, GeForce RTX 5050 Laptop | Dell XPS 16 Core Ultra X7 358H Ultra X7 358H, Arc B390 Panther Lake iGPU | MSI Prestige 16 AI Evo B2HMG Ultra 9 285H, Arc 140T | HP Omen Transcend 16-u1095ng i9-14900HX, GeForce RTX 4070 Laptop GPU | Asus ProArt P16 H7606WP Ryzen AI 9 HX 370, GeForce RTX 5070 Laptop | |
|---|---|---|---|---|---|---|
| Noise | -5% | 0% | 1% | -19% | -16% | |
| av / miljö * (dB) | 23 | 24.6 -7% | 23.3 -1% | 23.6 -3% | 24 -4% | 23.5 -2% |
| Idle Minimum * (dB) | 23.5 | 24.6 -5% | 23.4 -0% | 23.6 -0% | 29 -23% | 26.7 -14% |
| Idle Average * (dB) | 24 | 24.6 -3% | 23.4 2% | 23.6 2% | 30 -25% | 26.7 -11% |
| Idle Maximum * (dB) | 24 | 26.8 -12% | 25.8 -8% | 26.2 -9% | 31 -29% | 31.1 -30% |
| Load Average * (dB) | 32.3 | 32.8 -2% | 38 -18% | 37.1 -15% | 45 -39% | 44.8 -39% |
| Cyberpunk 2077 ultra * (dB) | 50.1 | 51.8 -3% | 38.1 24% | 42.1 16% | 53.7 -7% | |
| Load Maximum * (dB) | 50.1 | 51.8 -3% | 48.6 3% | 42.1 16% | 47 6% | 53.7 -7% |
| Witcher 3 ultra * (dB) | 44 |
* ... mindre är bättre
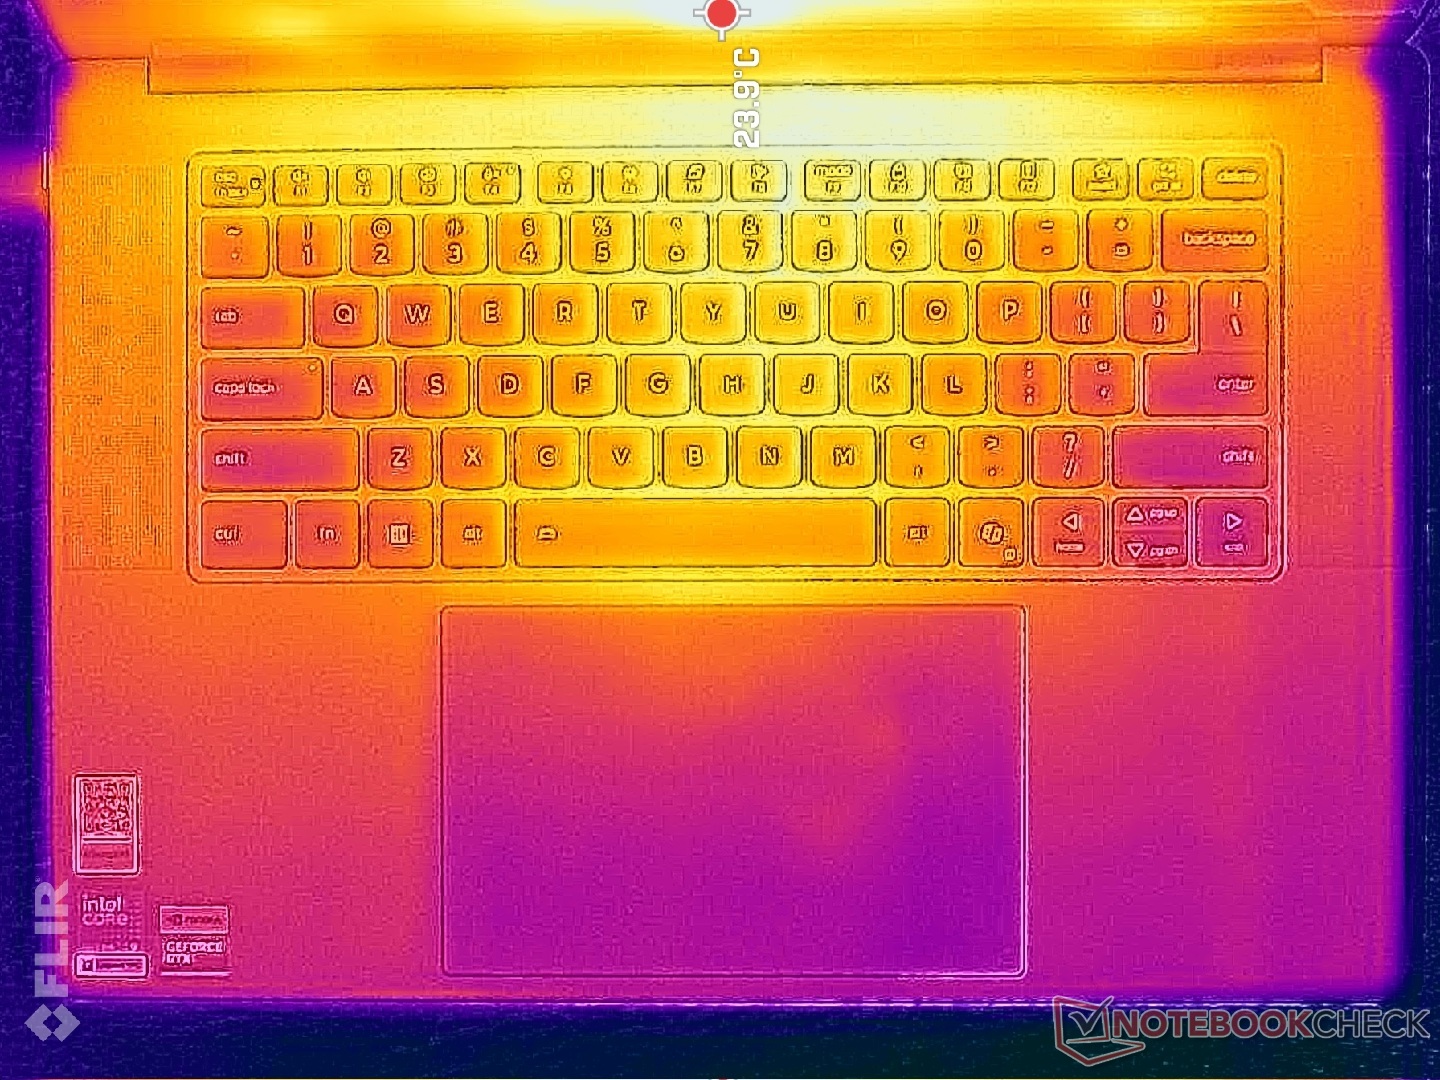
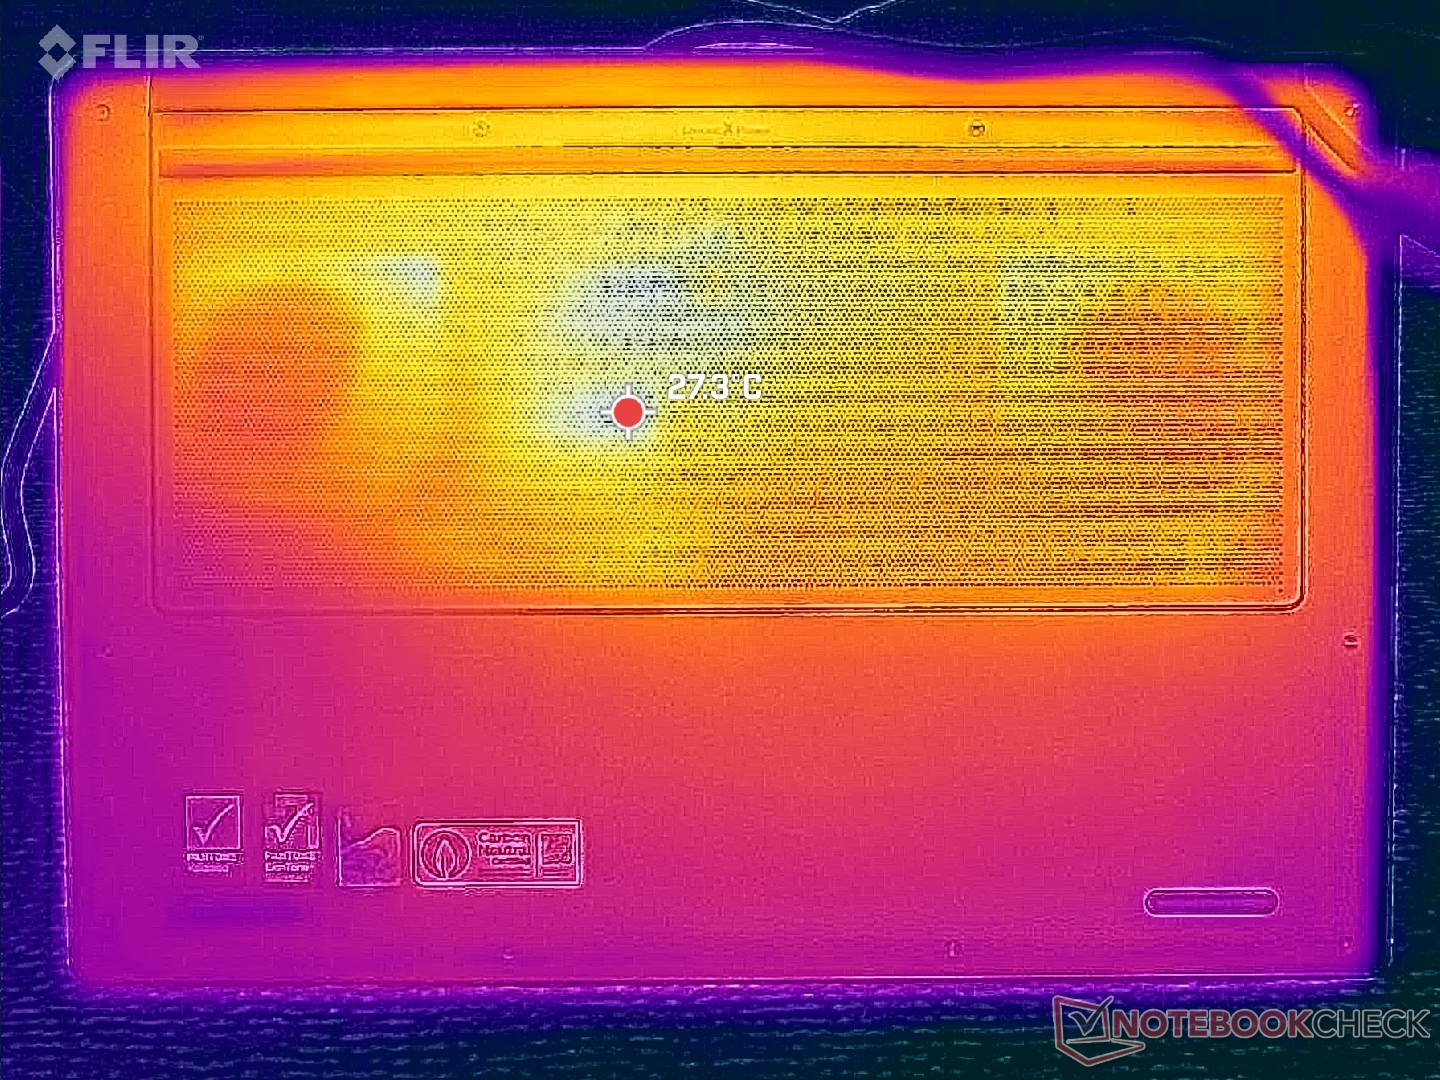
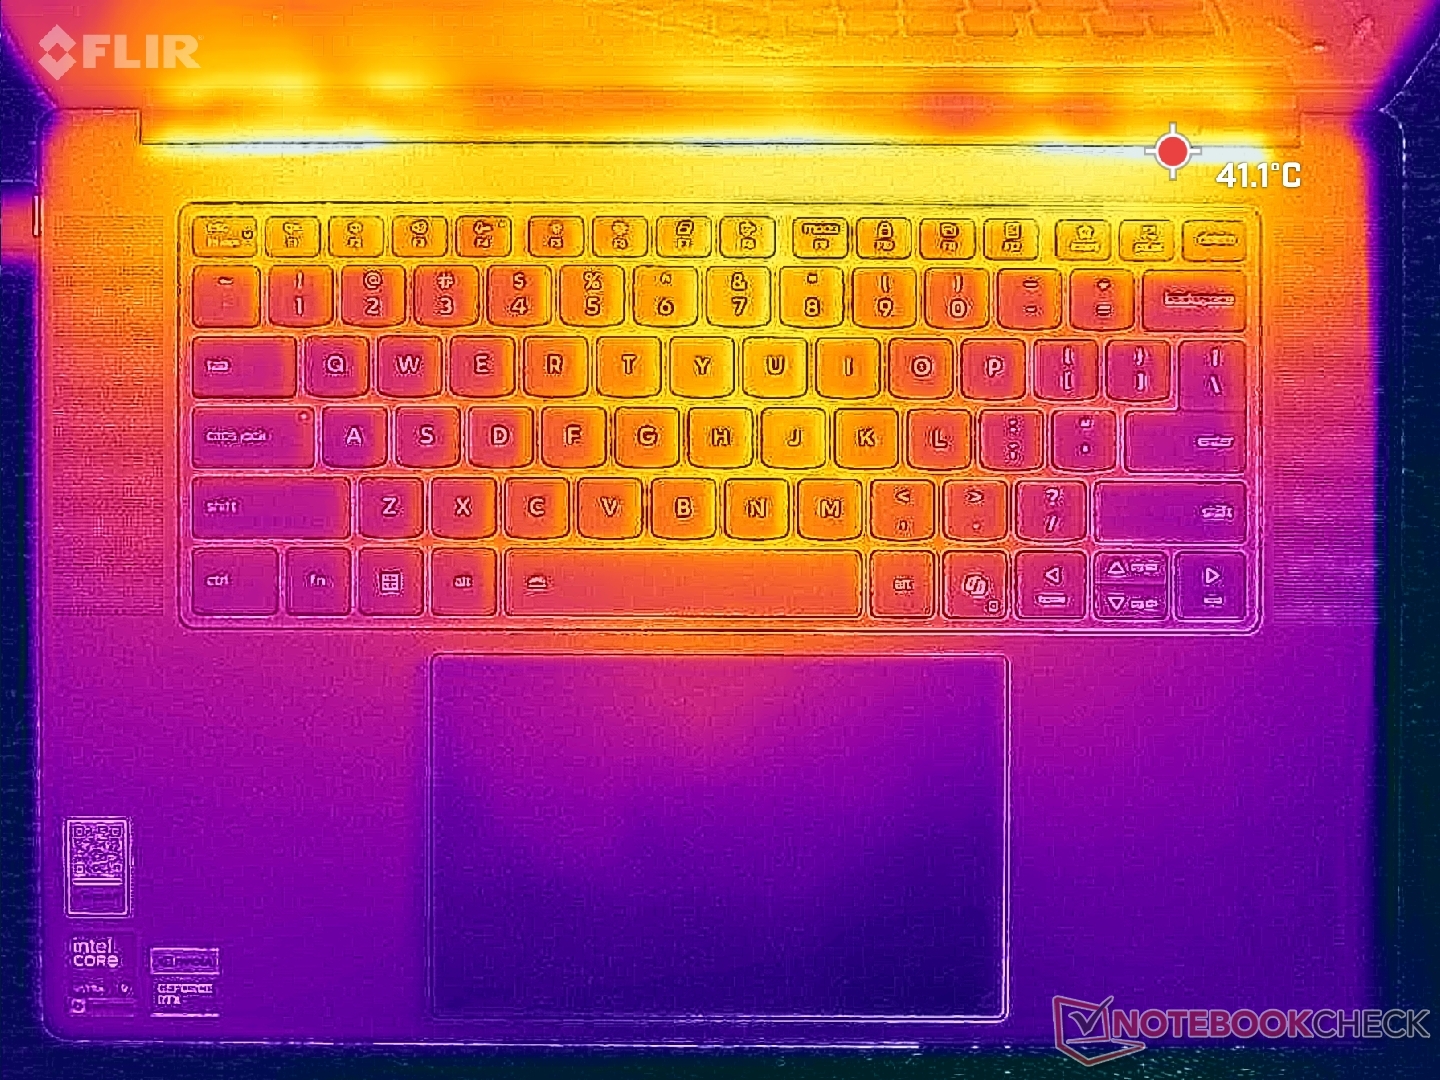
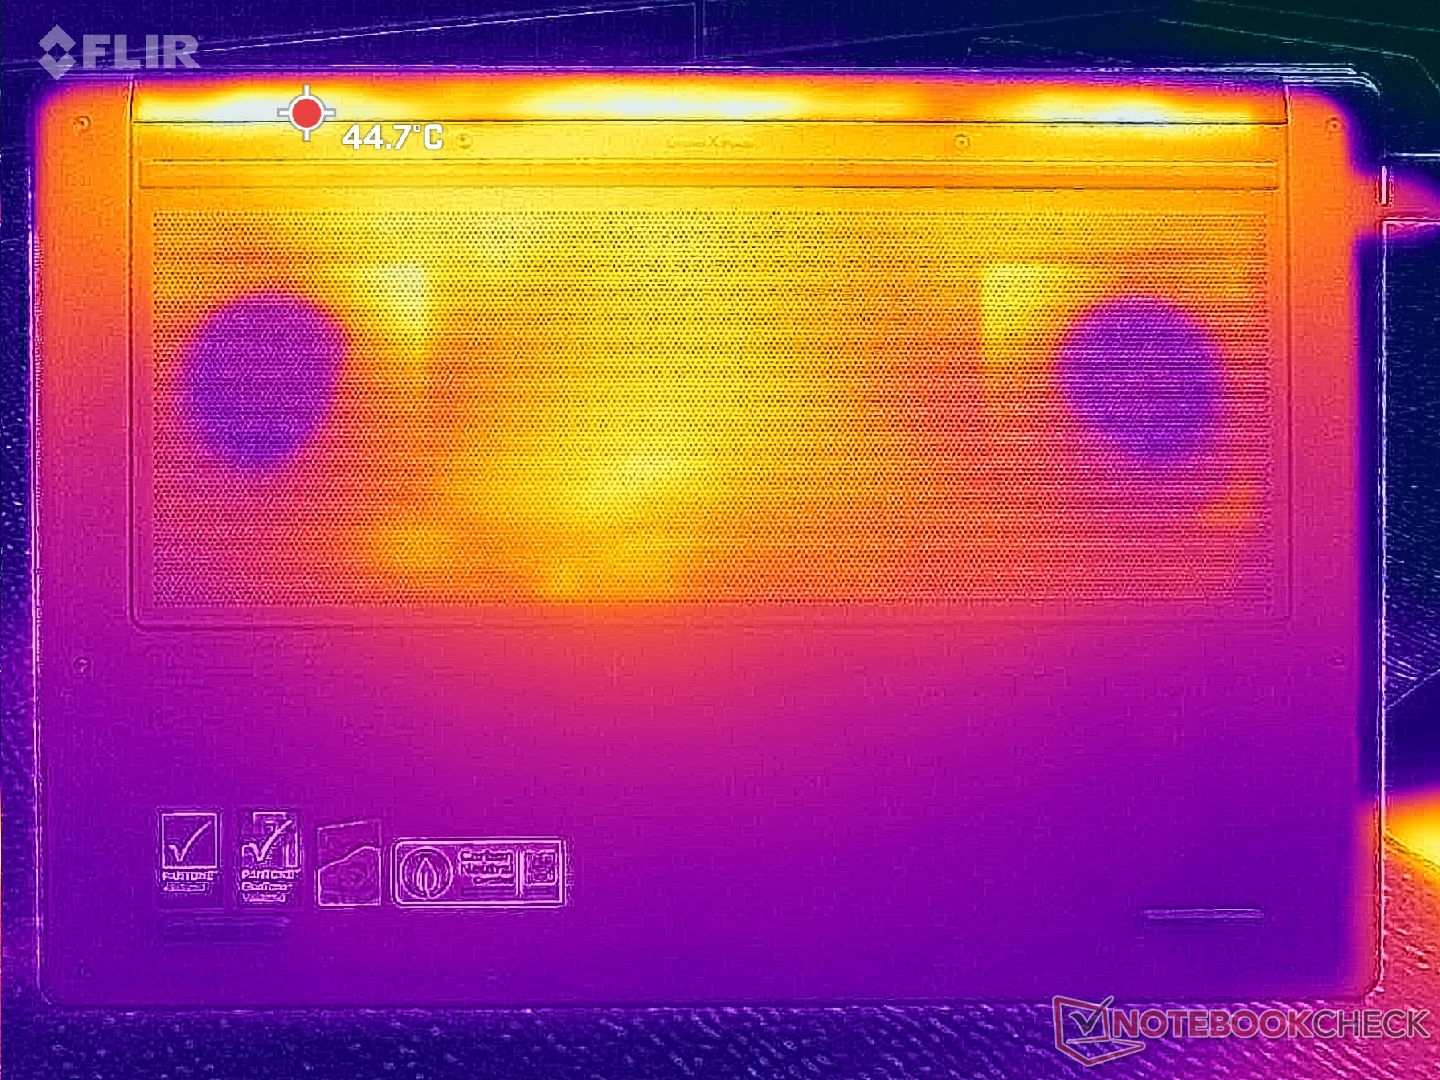
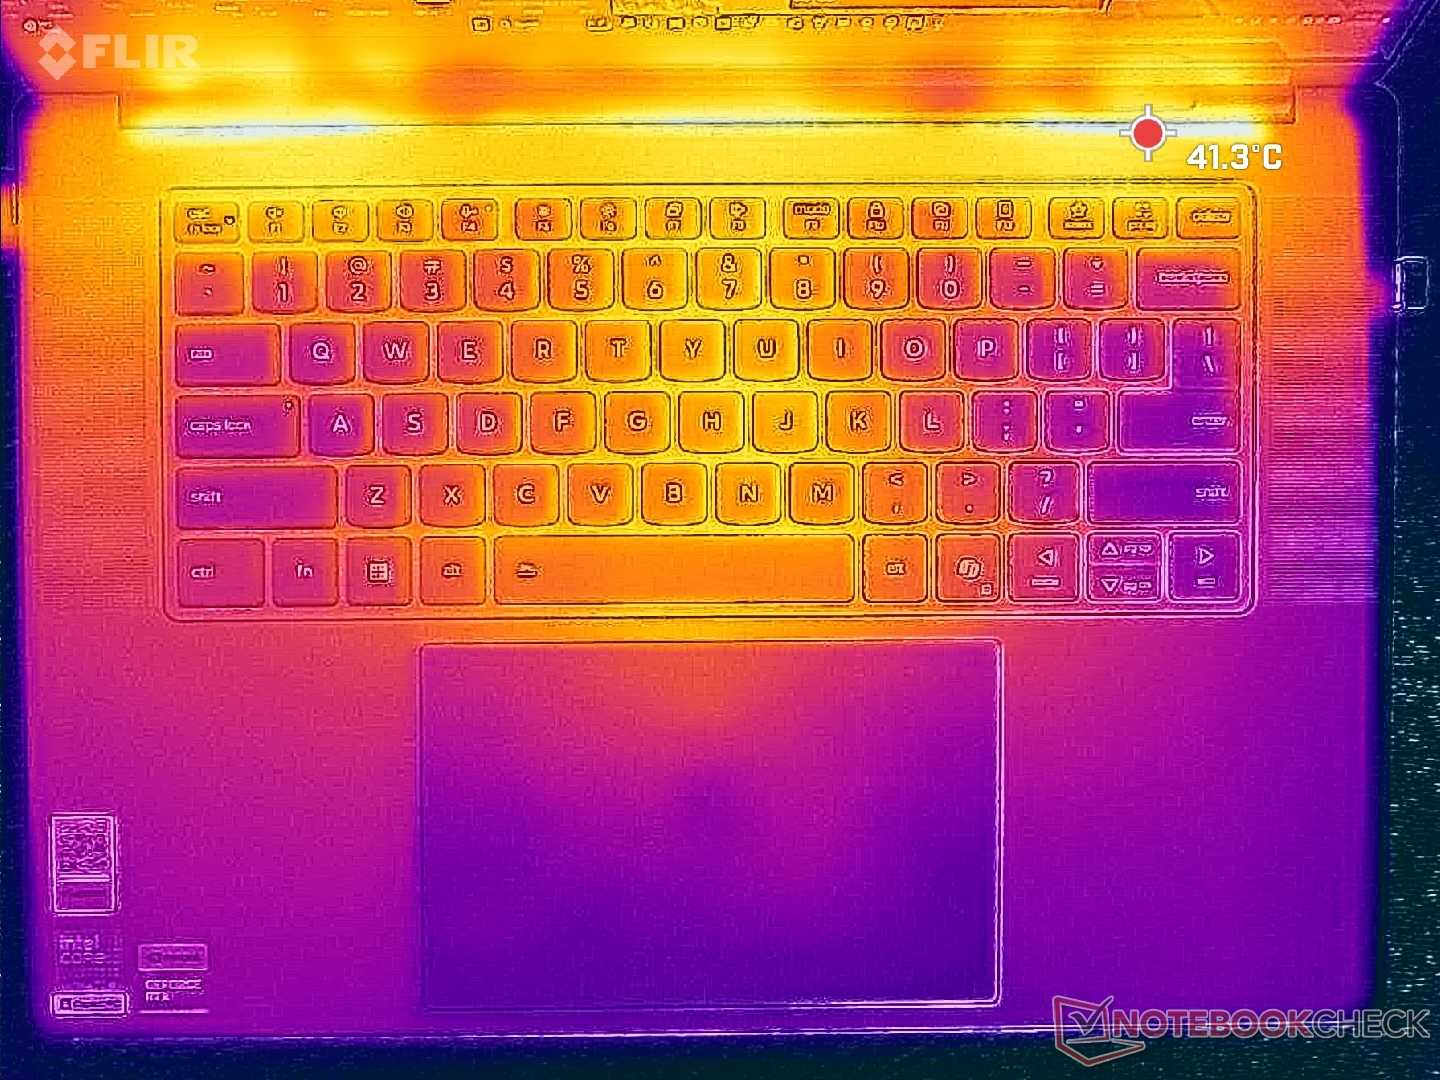
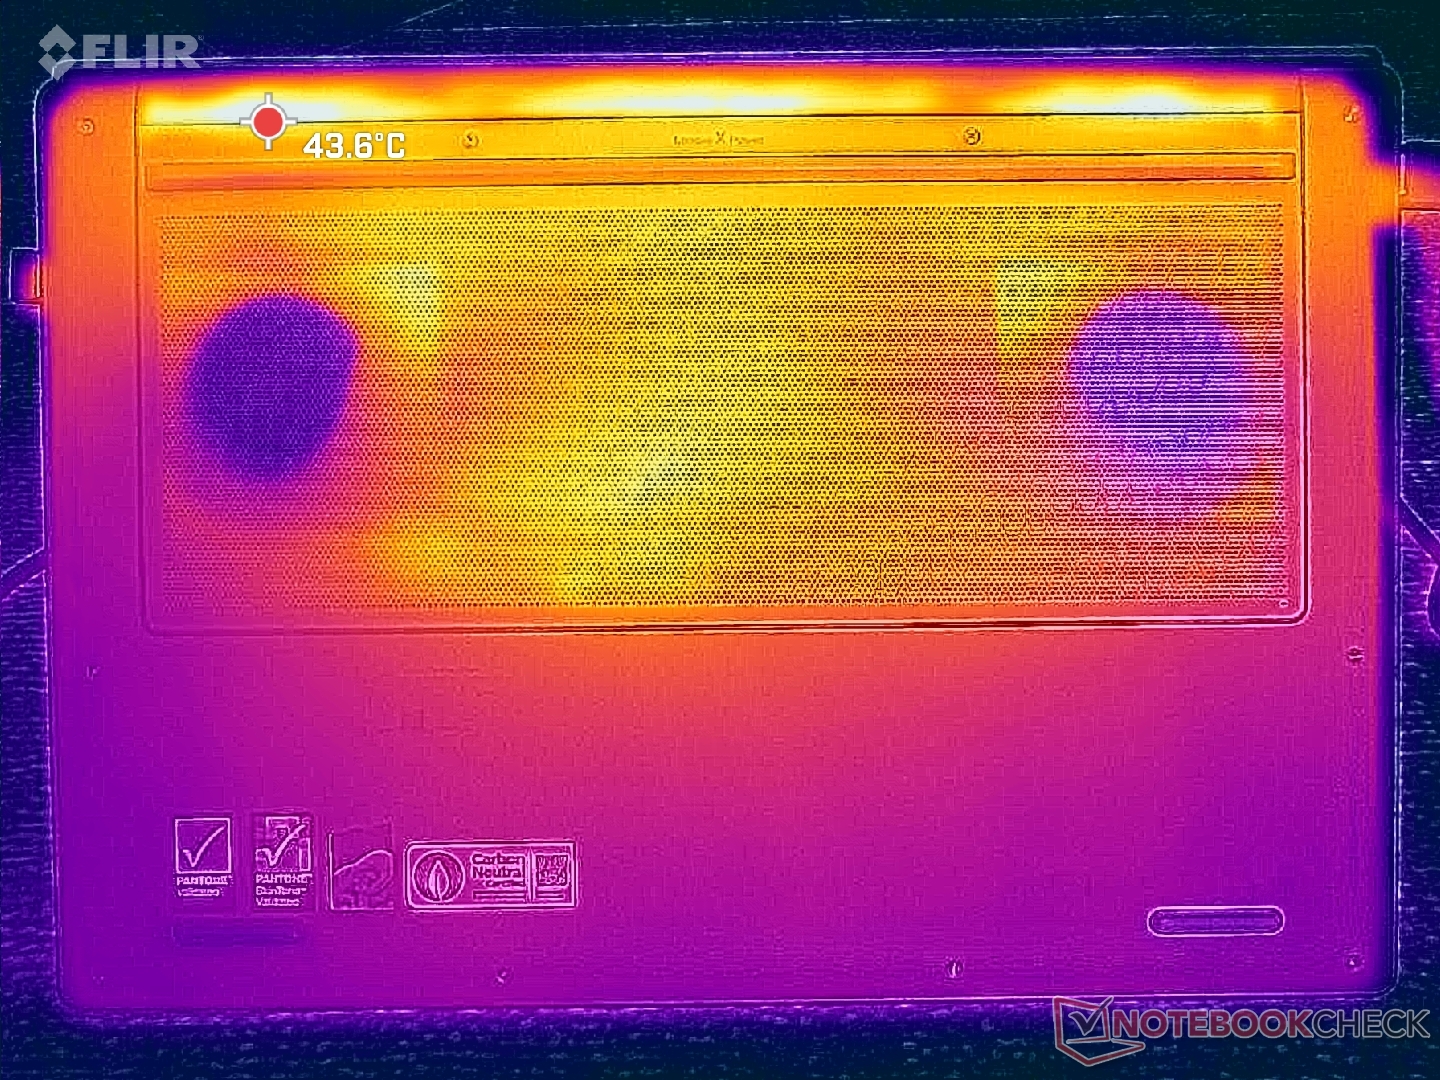
Temperatur
Yttemperaturerna är märkbart svalare trots de mindre dimensionerna än den utgående modellen. När vi körde Cyberpunk 2077, till exempel, toppade hot spots på vår enhet på endast 38 C och 41 C jämfört med 42 C och 49 C på Yoga Pro 9i 16IAH G10 Aura med samma Nvidia GPU.
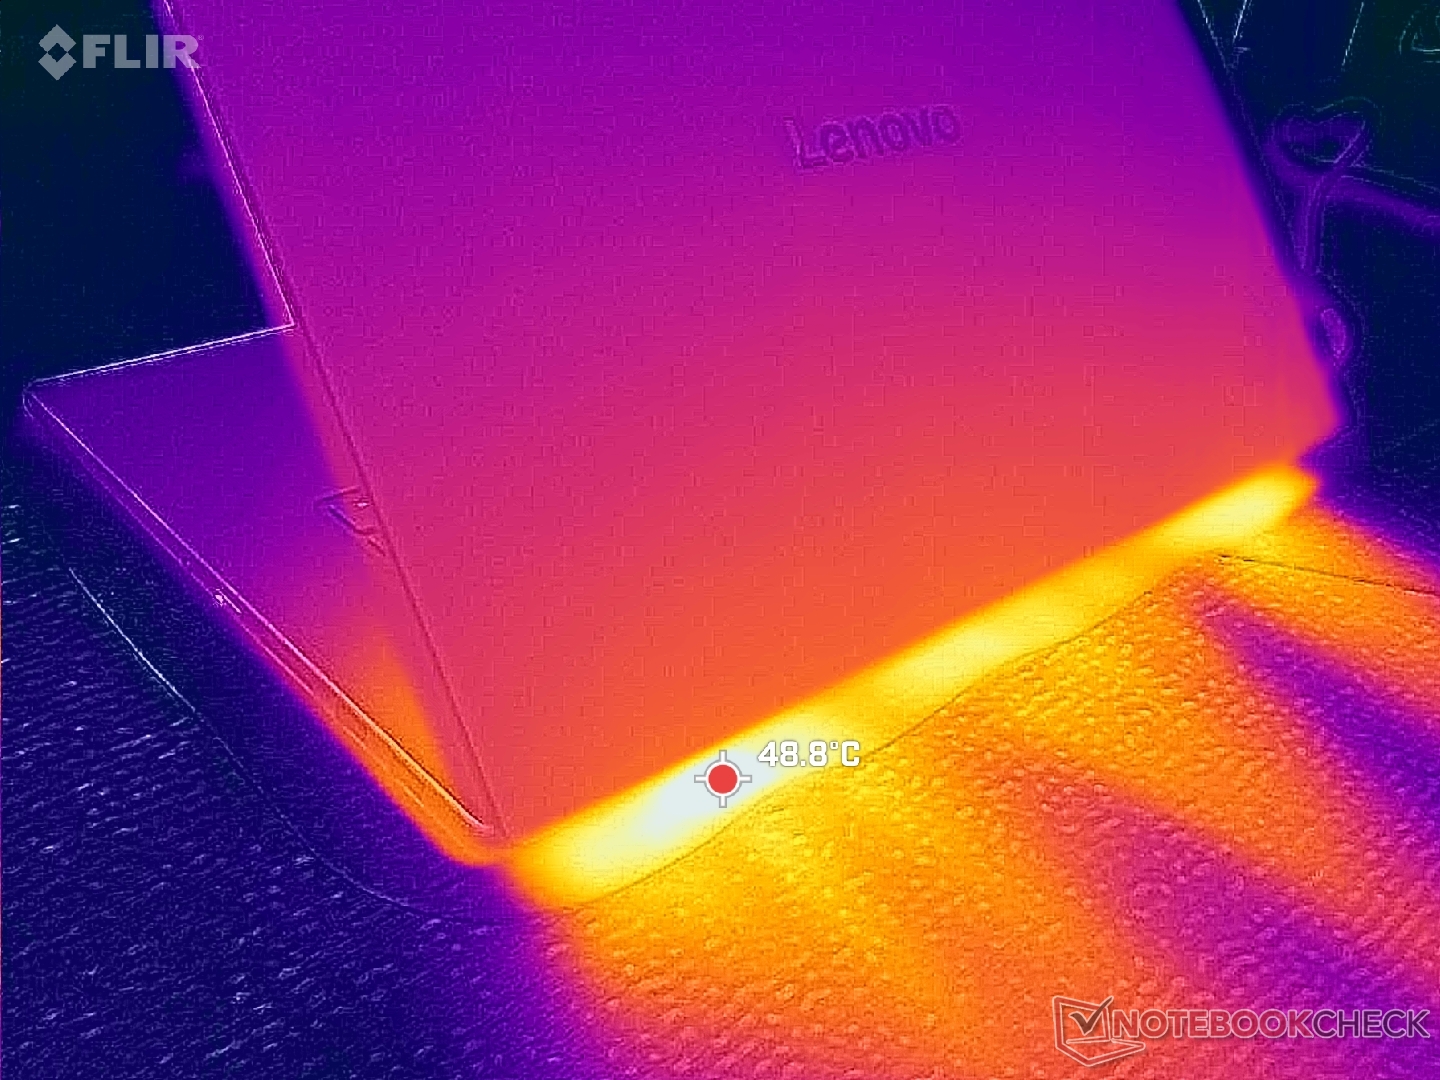
(+) Den maximala temperaturen på ovansidan är 37.8 °C / 100 F, jämfört med genomsnittet av 36.8 °C / 98 F , allt från 21 till 71 °C för klassen Multimedia.
(+) Botten värms upp till maximalt 38.2 °C / 101 F, jämfört med genomsnittet av 39.1 °C / 102 F
(+) Vid tomgångsbruk är medeltemperaturen för ovansidan 27.1 °C / 81 F, jämfört med enhetsgenomsnittet på 31.3 °C / ### class_avg_f### F.
(+) 3: The average temperature for the upper side is 31.7 °C / 89 F, compared to the average of 31.3 °C / 88 F for the class Multimedia.
(+) Handledsstöden och pekplattan är kallare än hudtemperaturen med maximalt 29.4 °C / 84.9 F och är därför svala att ta på.
(±) Medeltemperaturen för handledsstödsområdet på liknande enheter var 28.7 °C / 83.7 F (-0.7 °C / -1.2 F).
| Lenovo Pro 9 16IPH11 Ultra 9 386H, GeForce RTX 5060 Laptop | Lenovo Yoga Pro 9 16IAH10 RTX 5050 Ultra 9 285H, GeForce RTX 5050 Laptop | Dell XPS 16 Core Ultra X7 358H Ultra X7 358H, Arc B390 Panther Lake iGPU | MSI Prestige 16 AI Evo B2HMG Ultra 9 285H, Arc 140T | HP Omen Transcend 16-u1095ng i9-14900HX, GeForce RTX 4070 Laptop GPU | Asus ProArt P16 H7606WP Ryzen AI 9 HX 370, GeForce RTX 5070 Laptop | |
|---|---|---|---|---|---|---|
| Heat | 1% | 9% | -7% | -22% | -5% | |
| Maximum Upper Side * (°C) | 37.8 | 34.4 9% | 40.6 -7% | 48.1 -27% | 49 -30% | 47 -24% |
| Maximum Bottom * (°C) | 38.2 | 41.4 -8% | 39.8 -4% | 51.6 -35% | 63 -65% | 47.4 -24% |
| Idle Upper Side * (°C) | 30.4 | 28.6 6% | 23.2 24% | 25.9 15% | 30 1% | 26.1 14% |
| Idle Bottom * (°C) | 31 | 31.8 -3% | 23.8 23% | 25.2 19% | 29 6% | 26.4 15% |
* ... mindre är bättre
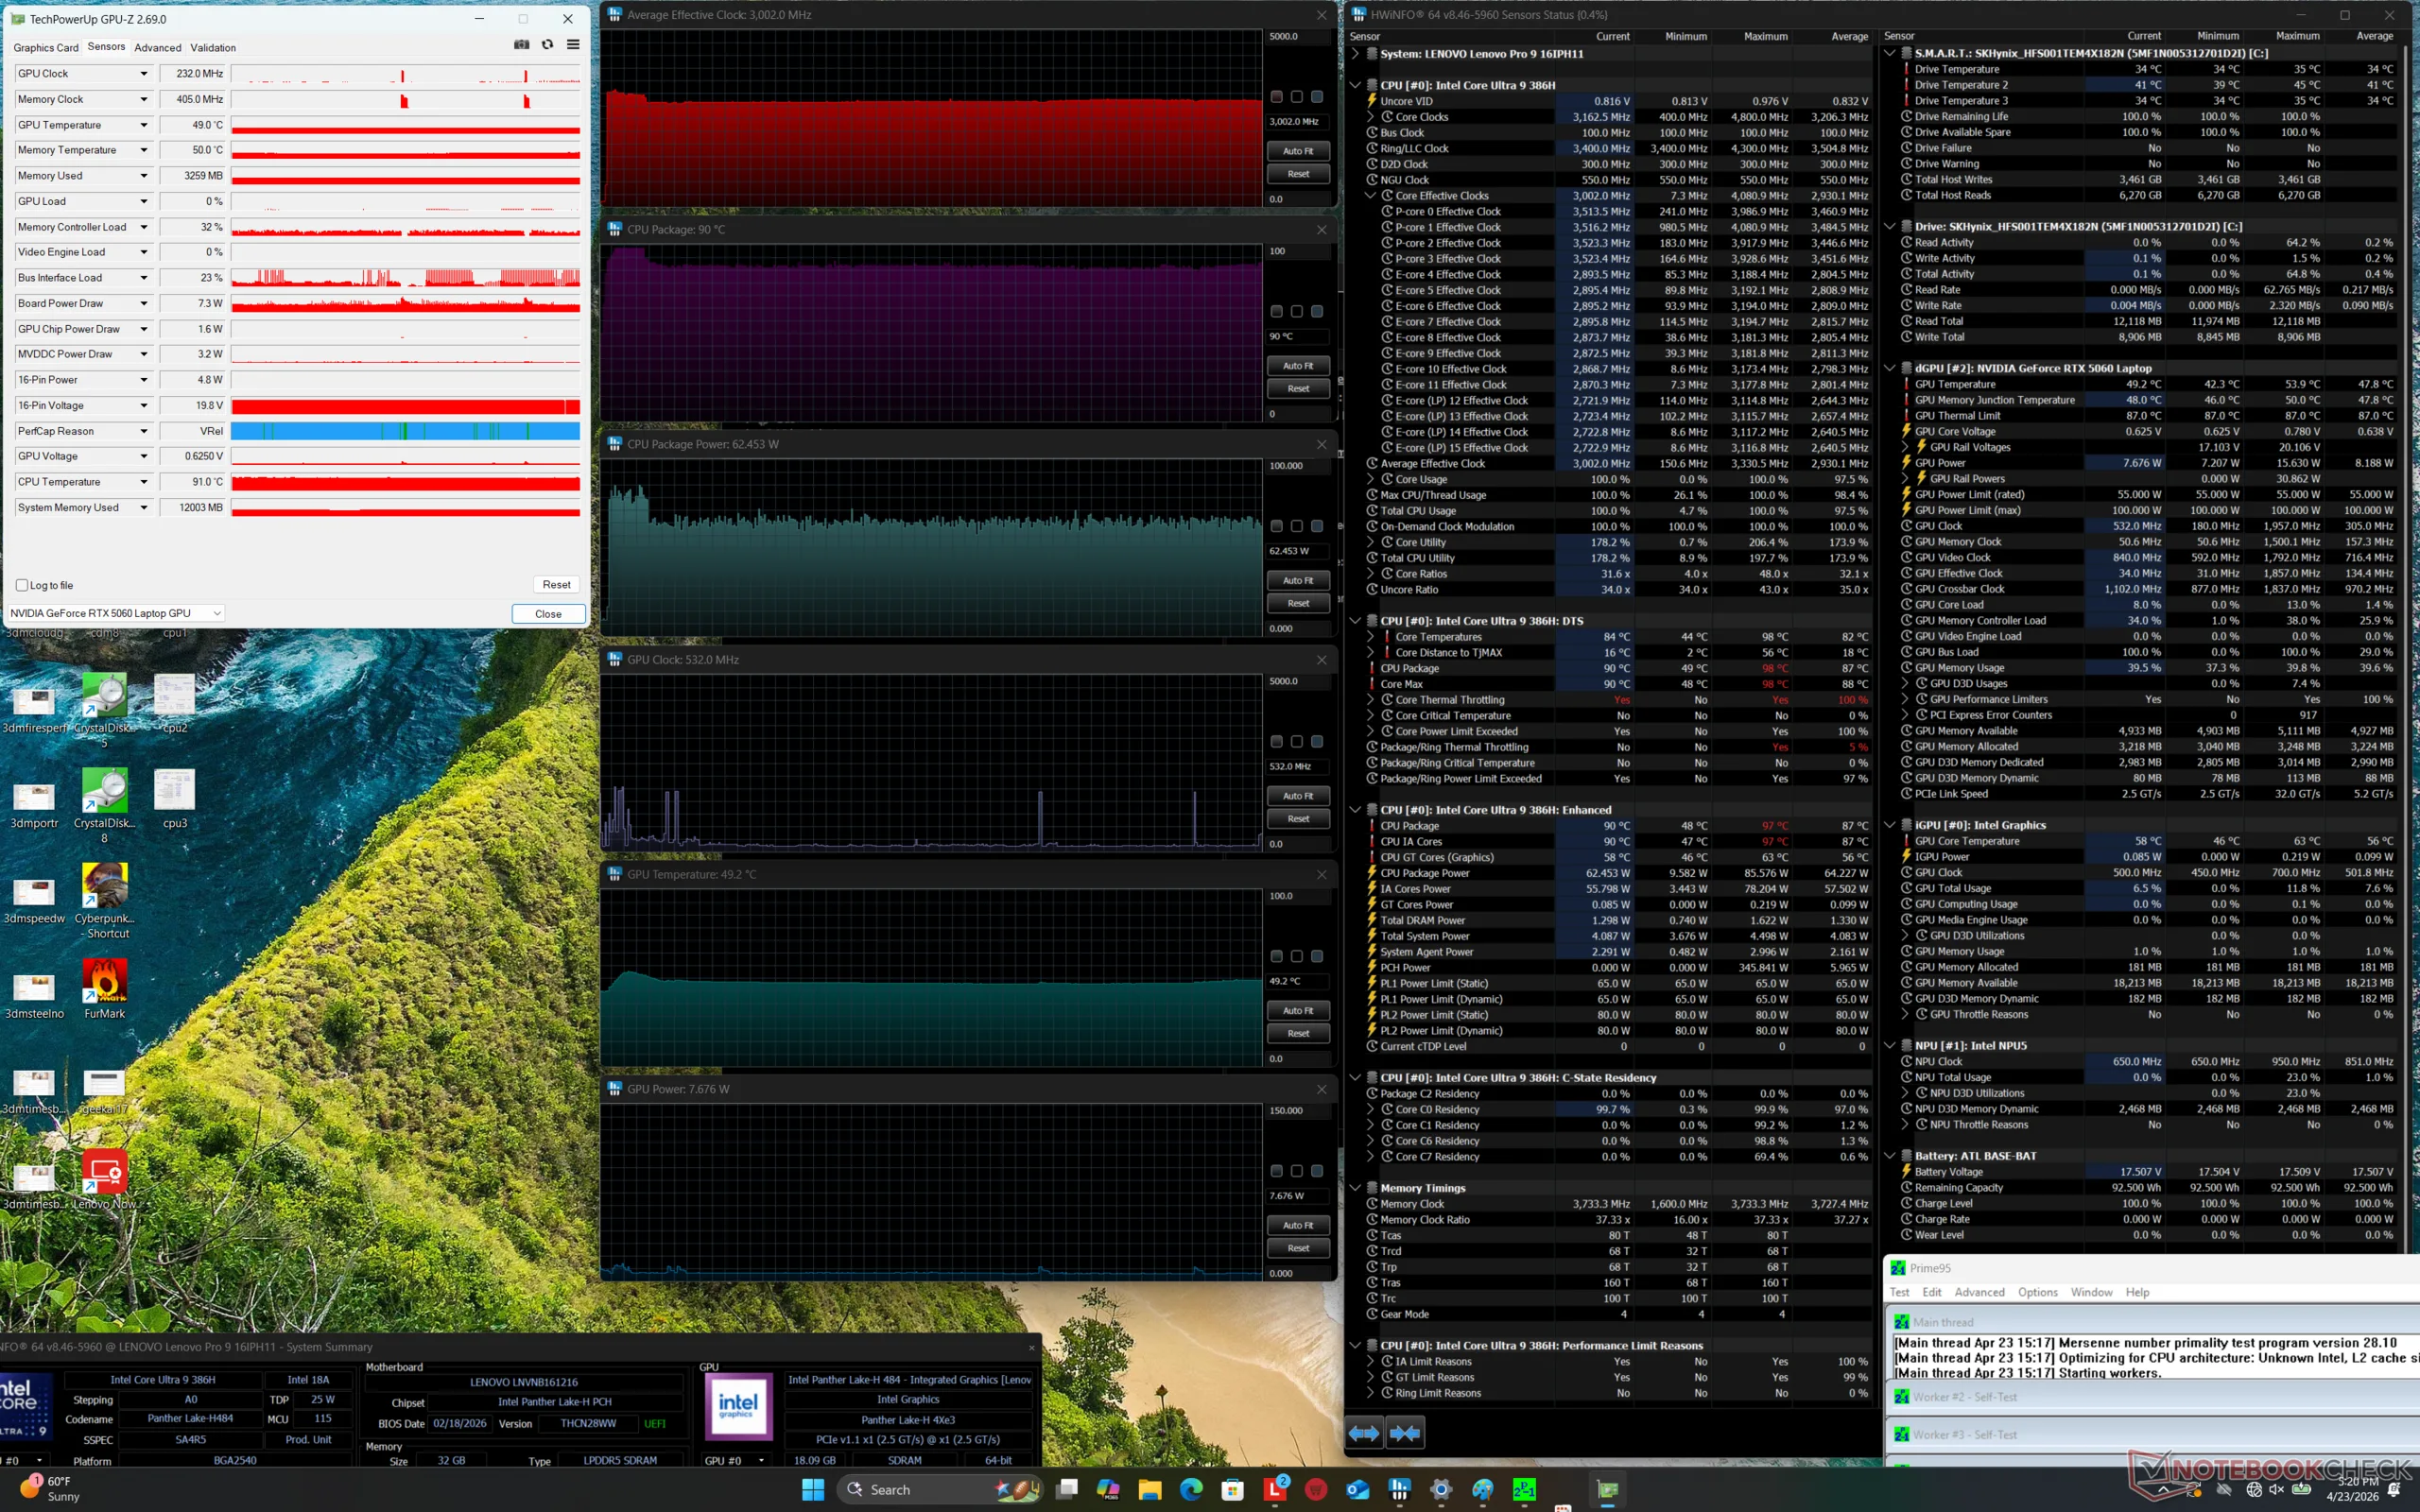
Stresstest
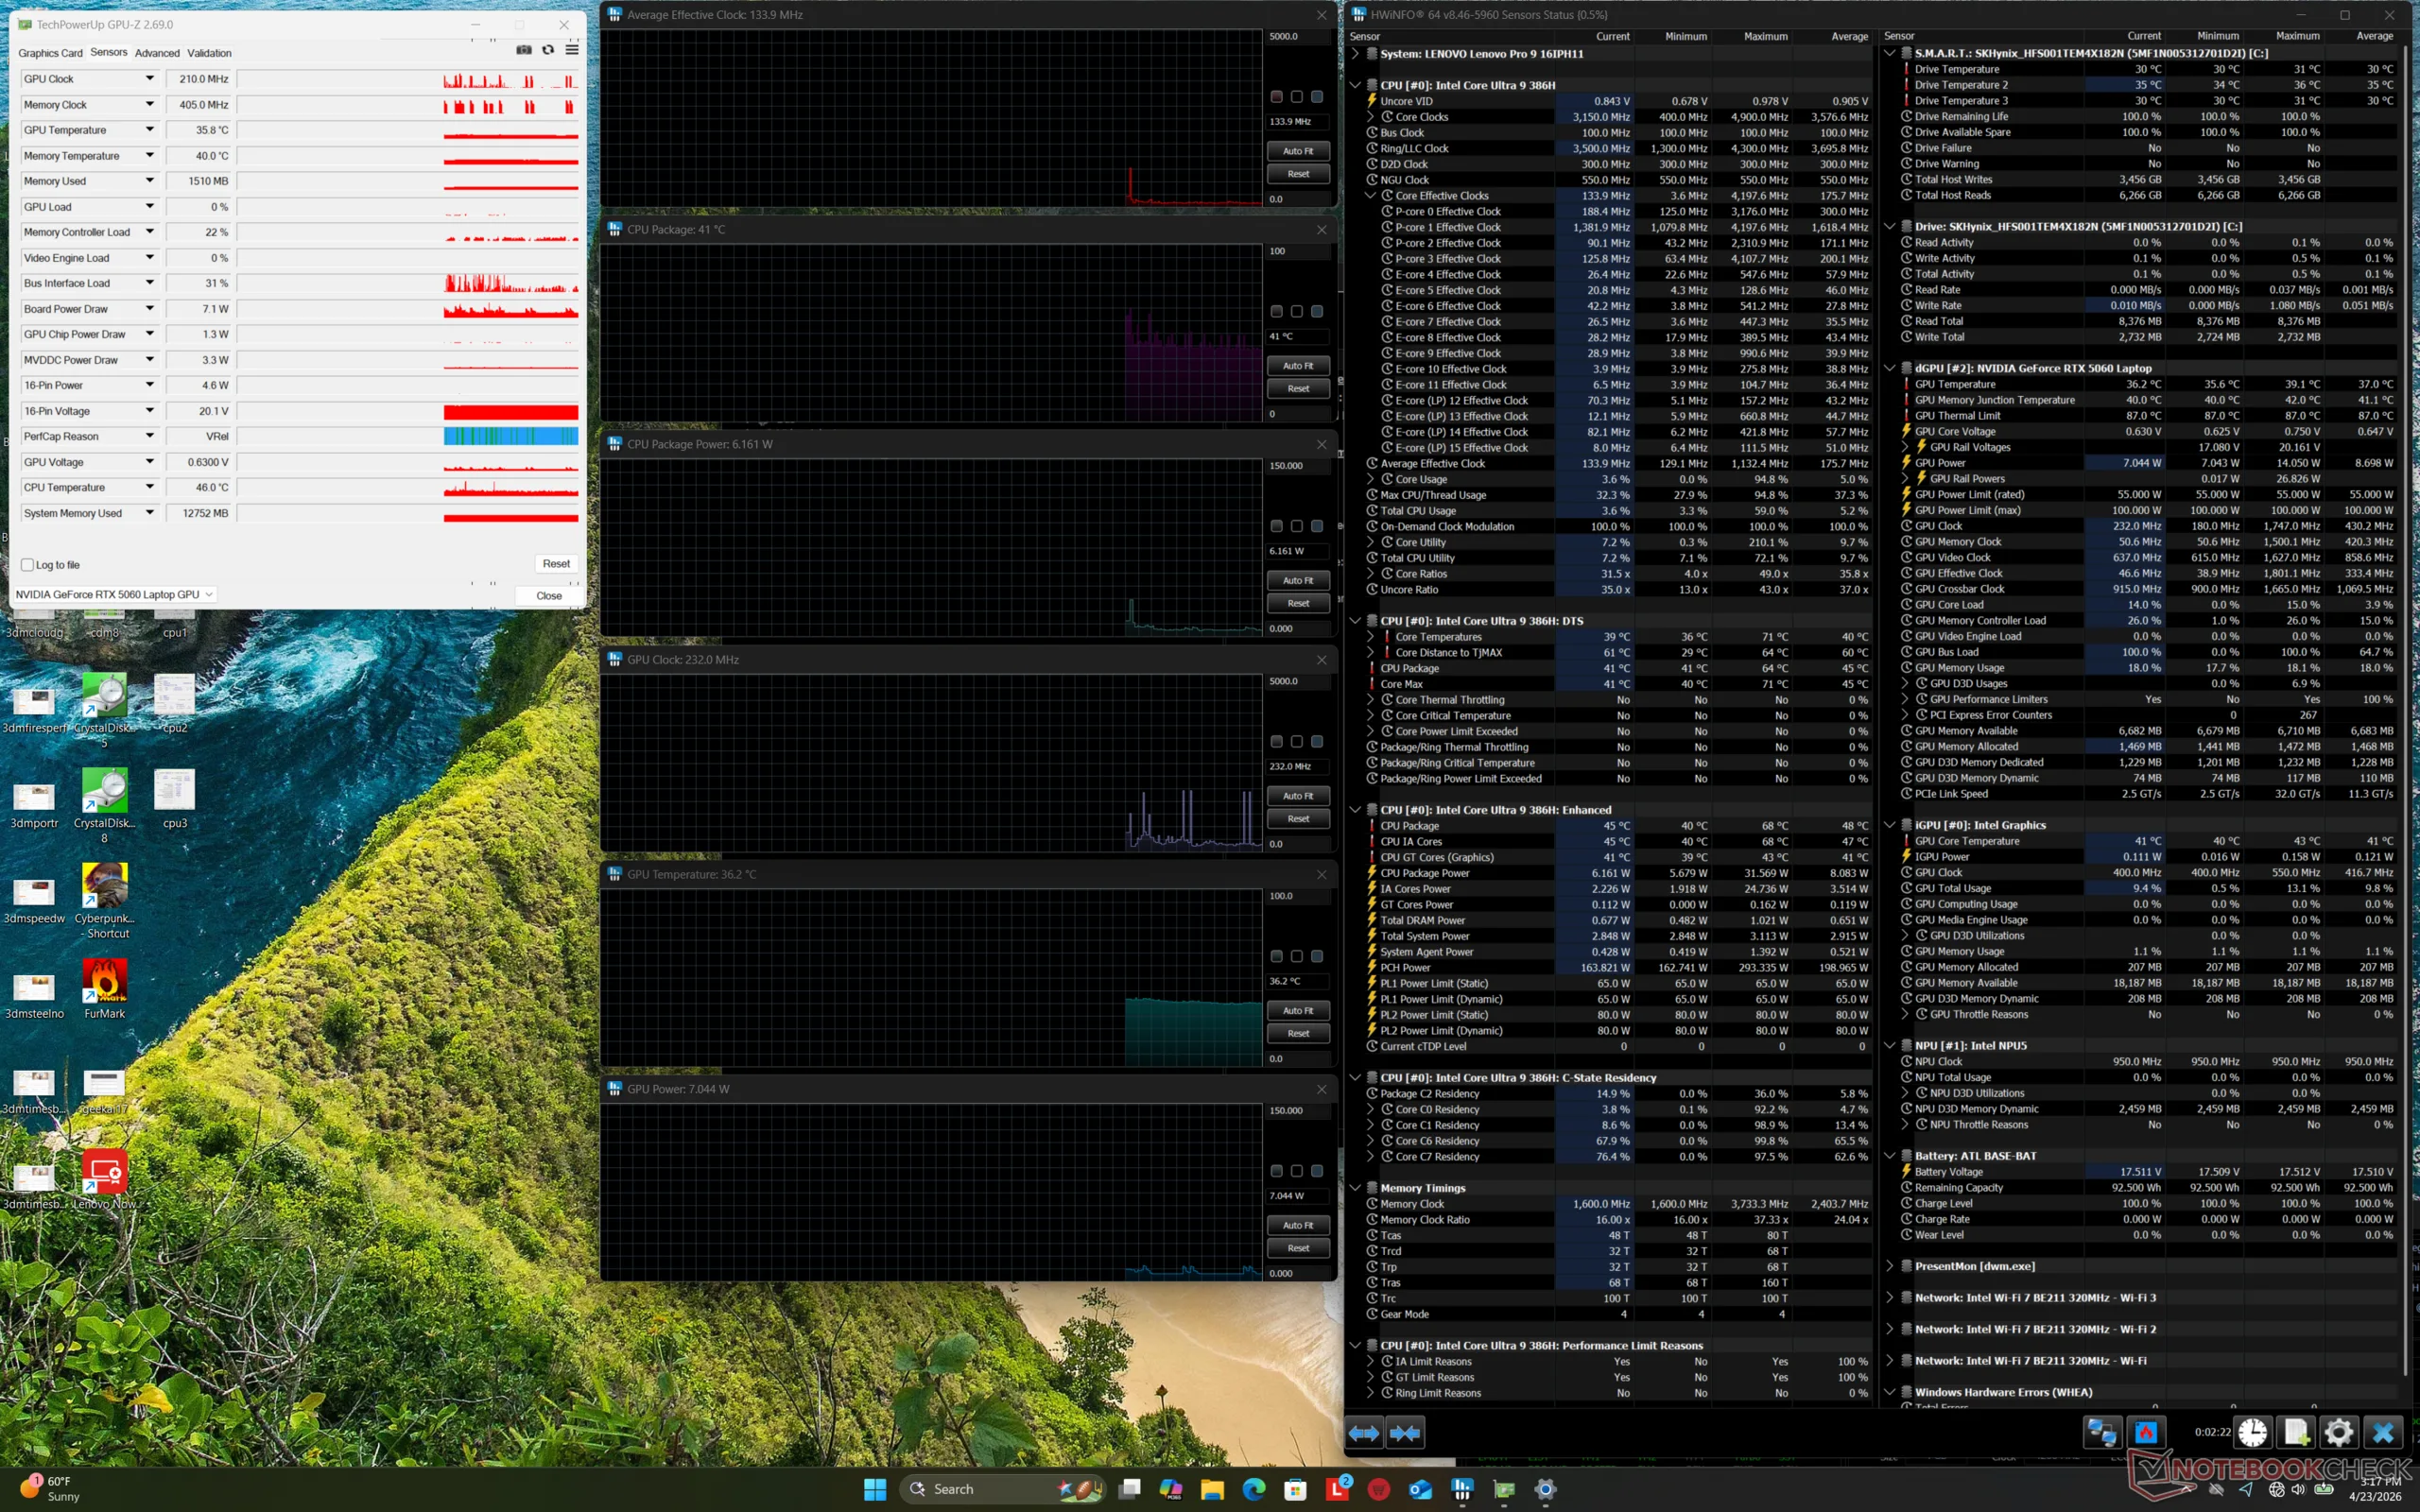
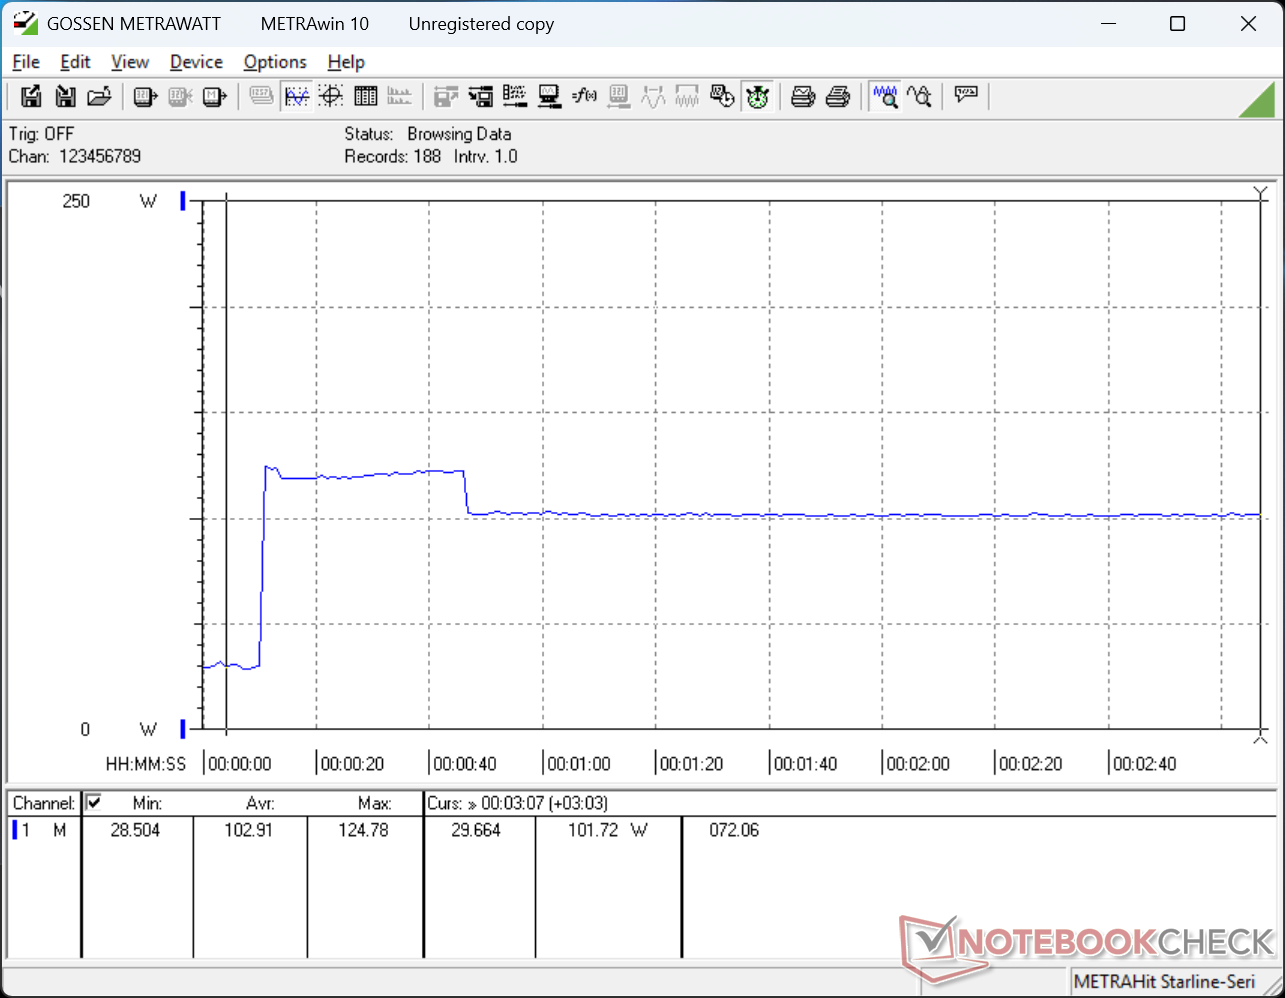
Processorn ökade till 3,3 GHz, 98 C och 86 W när Prime95-stress initierades innan den sjönk och stabiliserades på 3,0 GHz, 90 C och 62 W cirka 30 sekunder senare.
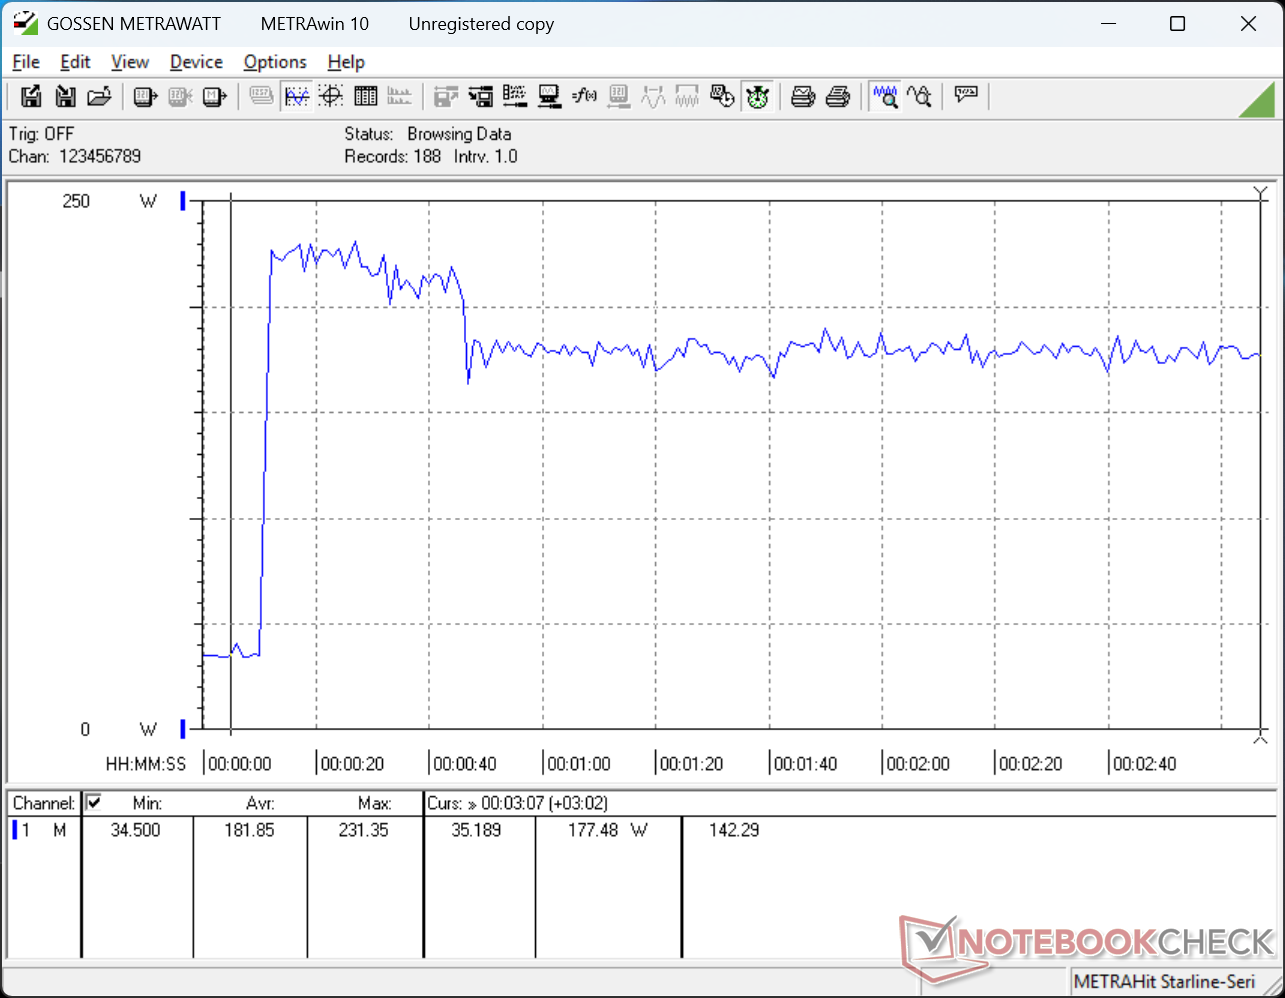
Kärntemperatur och klockfrekvenser förändrades drastiskt mellan lägena Balanserad och Prestanda, vilket visas av skärmdumparna nedan. När man kör Cyberpunk 2077, till exempel, skulle GPU: n i genomsnitt 2647 MHz, 75 C och 91 W om den var inställd på Performance-läge eller 2340 MHz, 68 C och 67 W om den var inställd på Balanced-läge. Den överlag långsammare prestandan i balanserat läge stämmer överens med våra Time SPy-observationer i GPU-sektionen ovan.
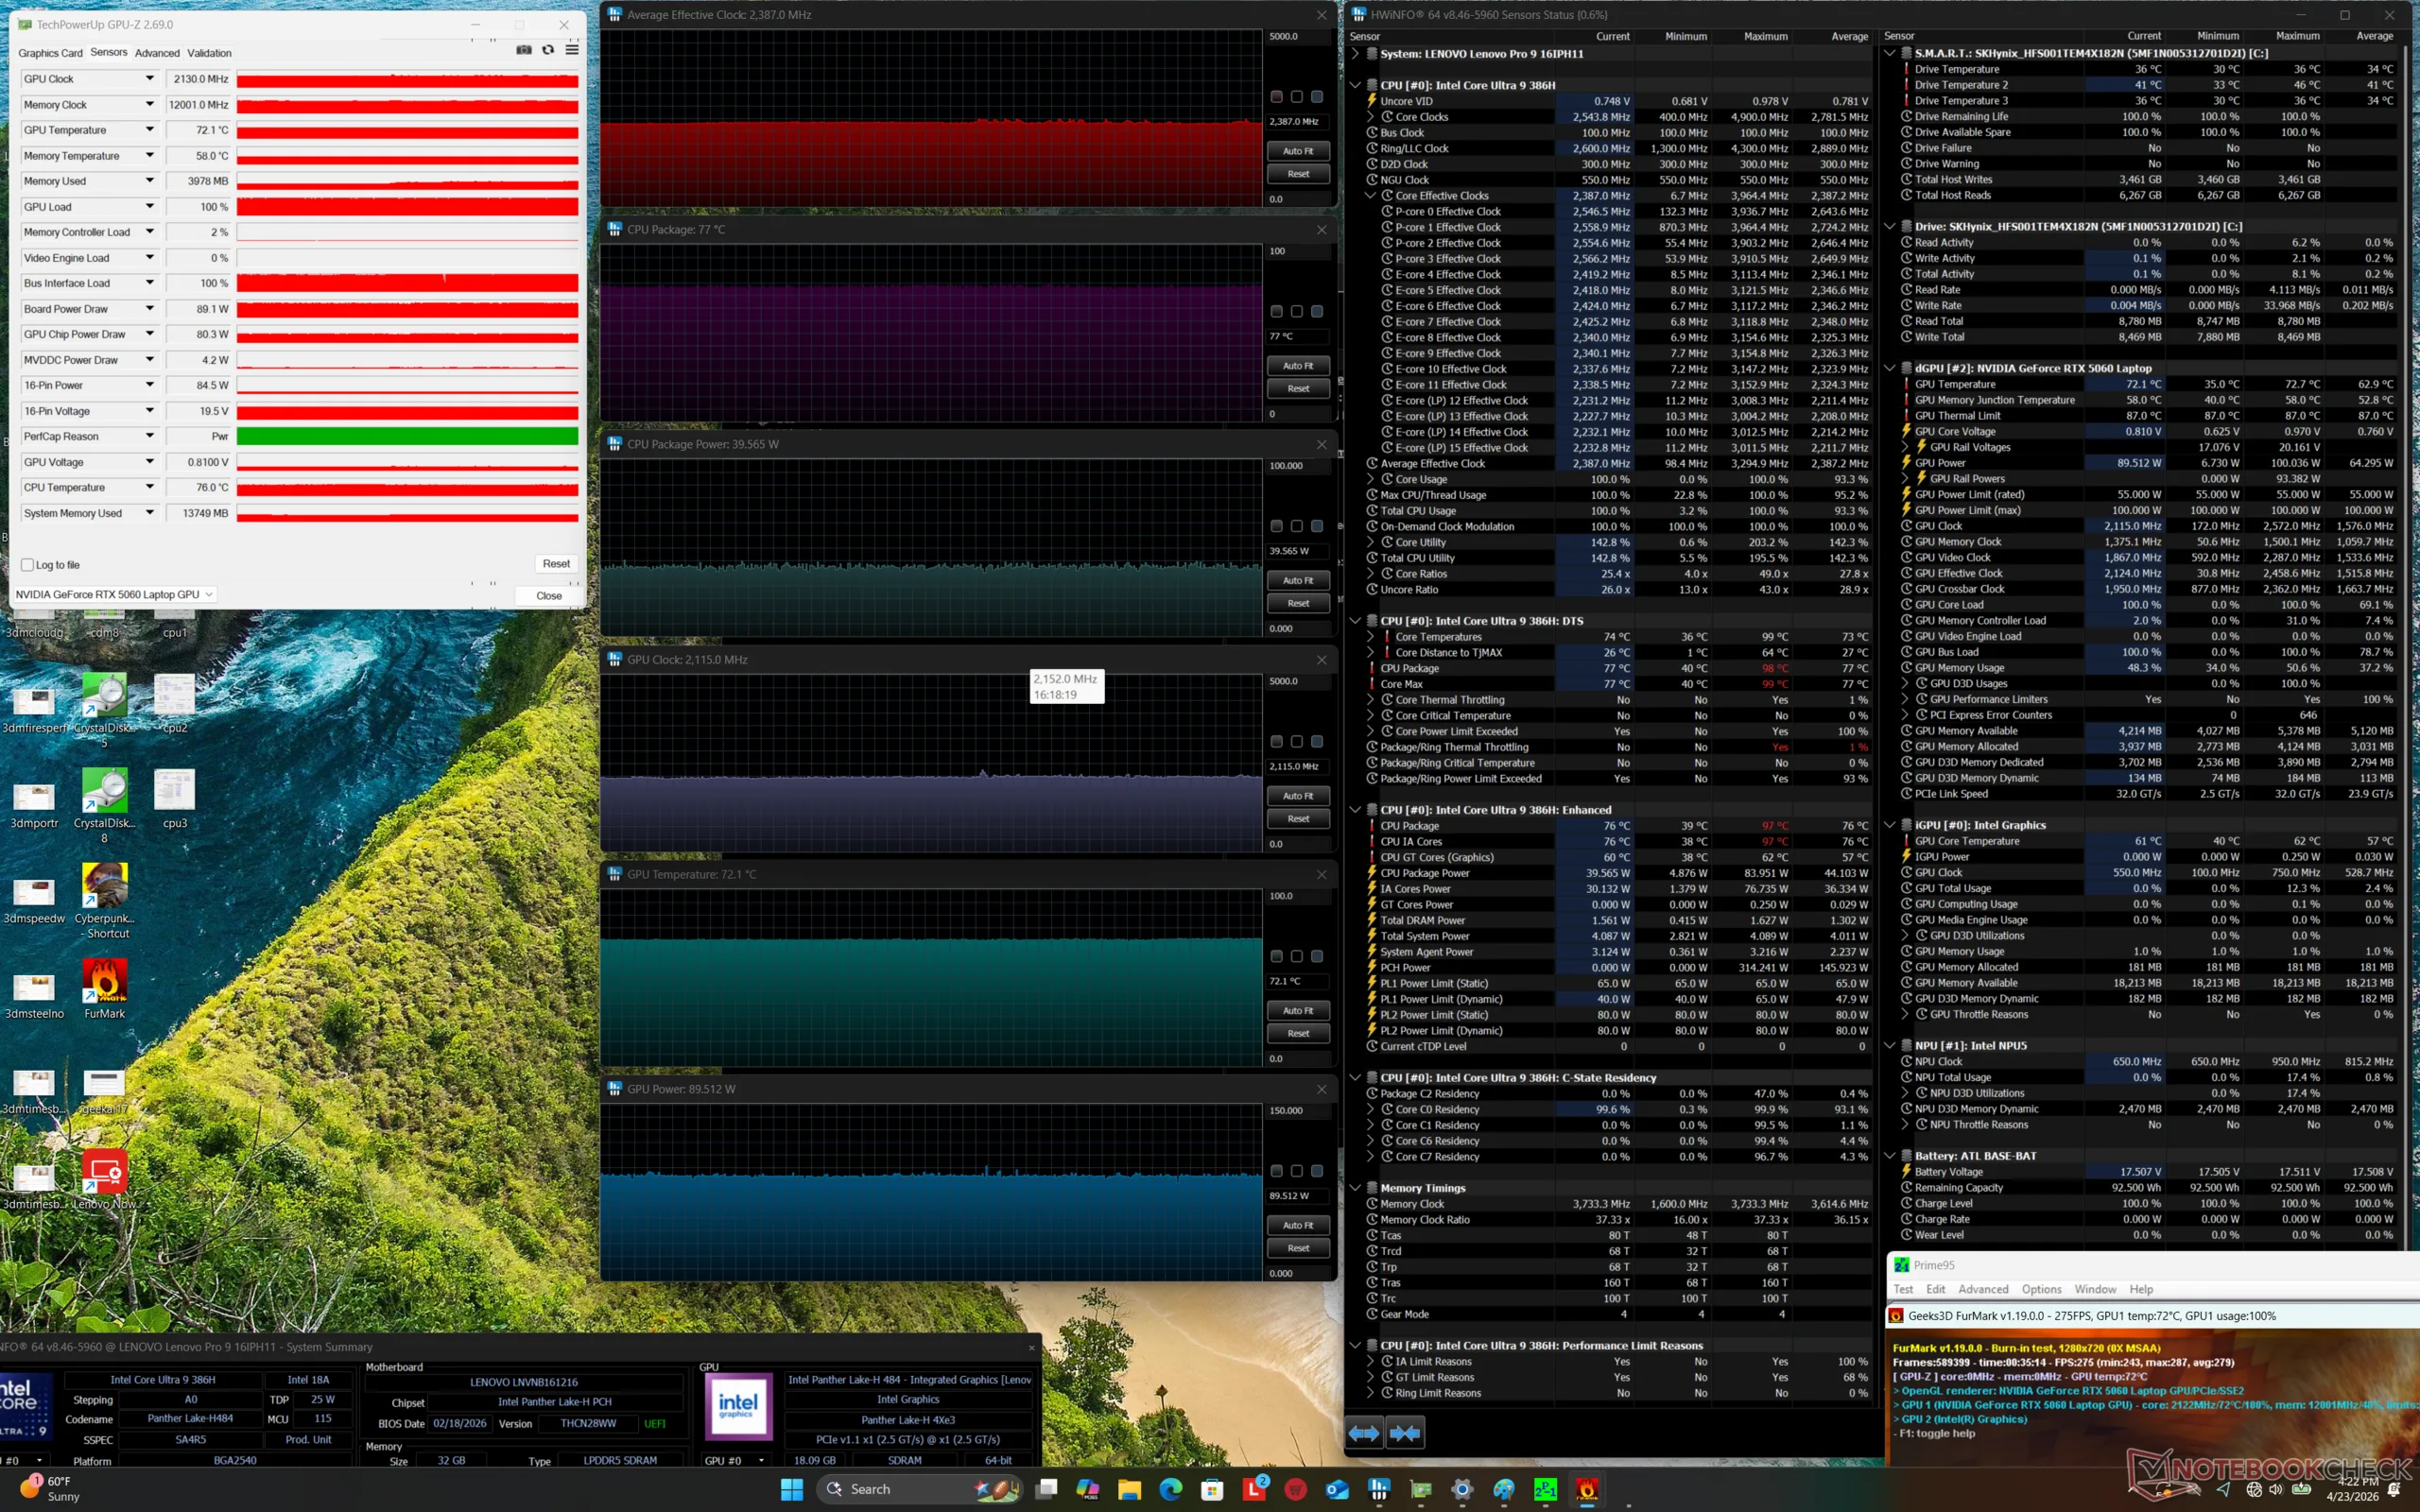
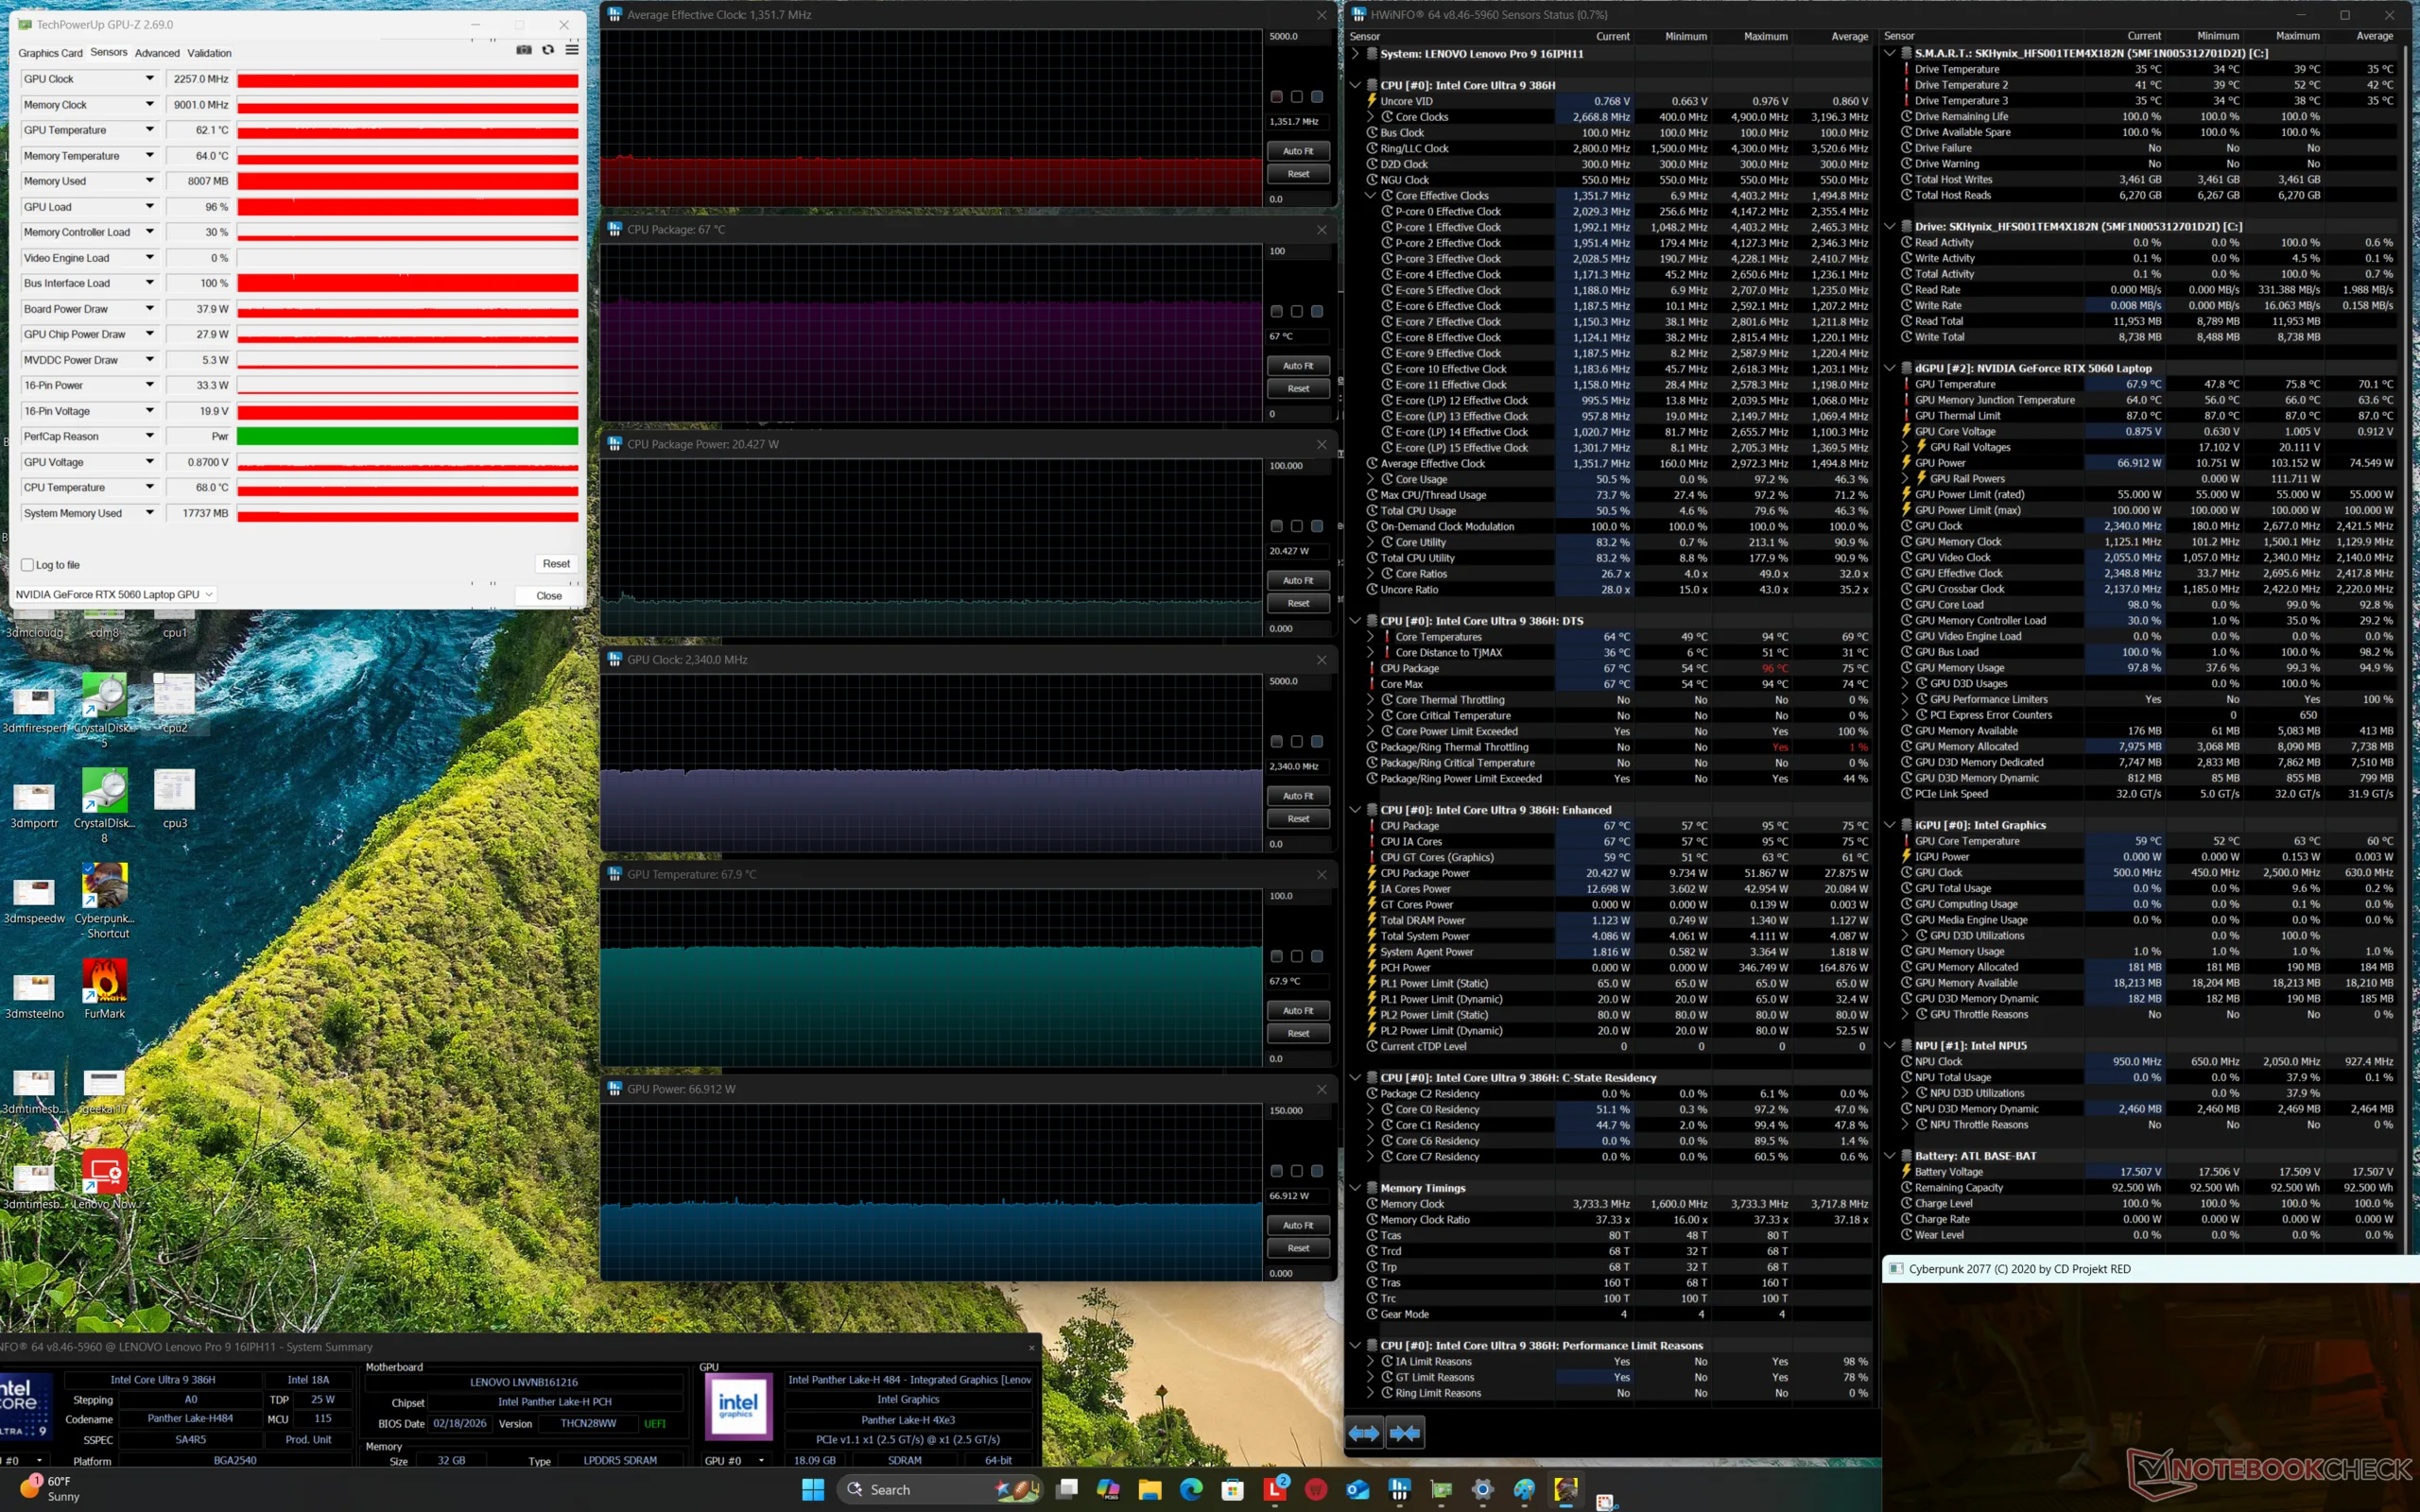
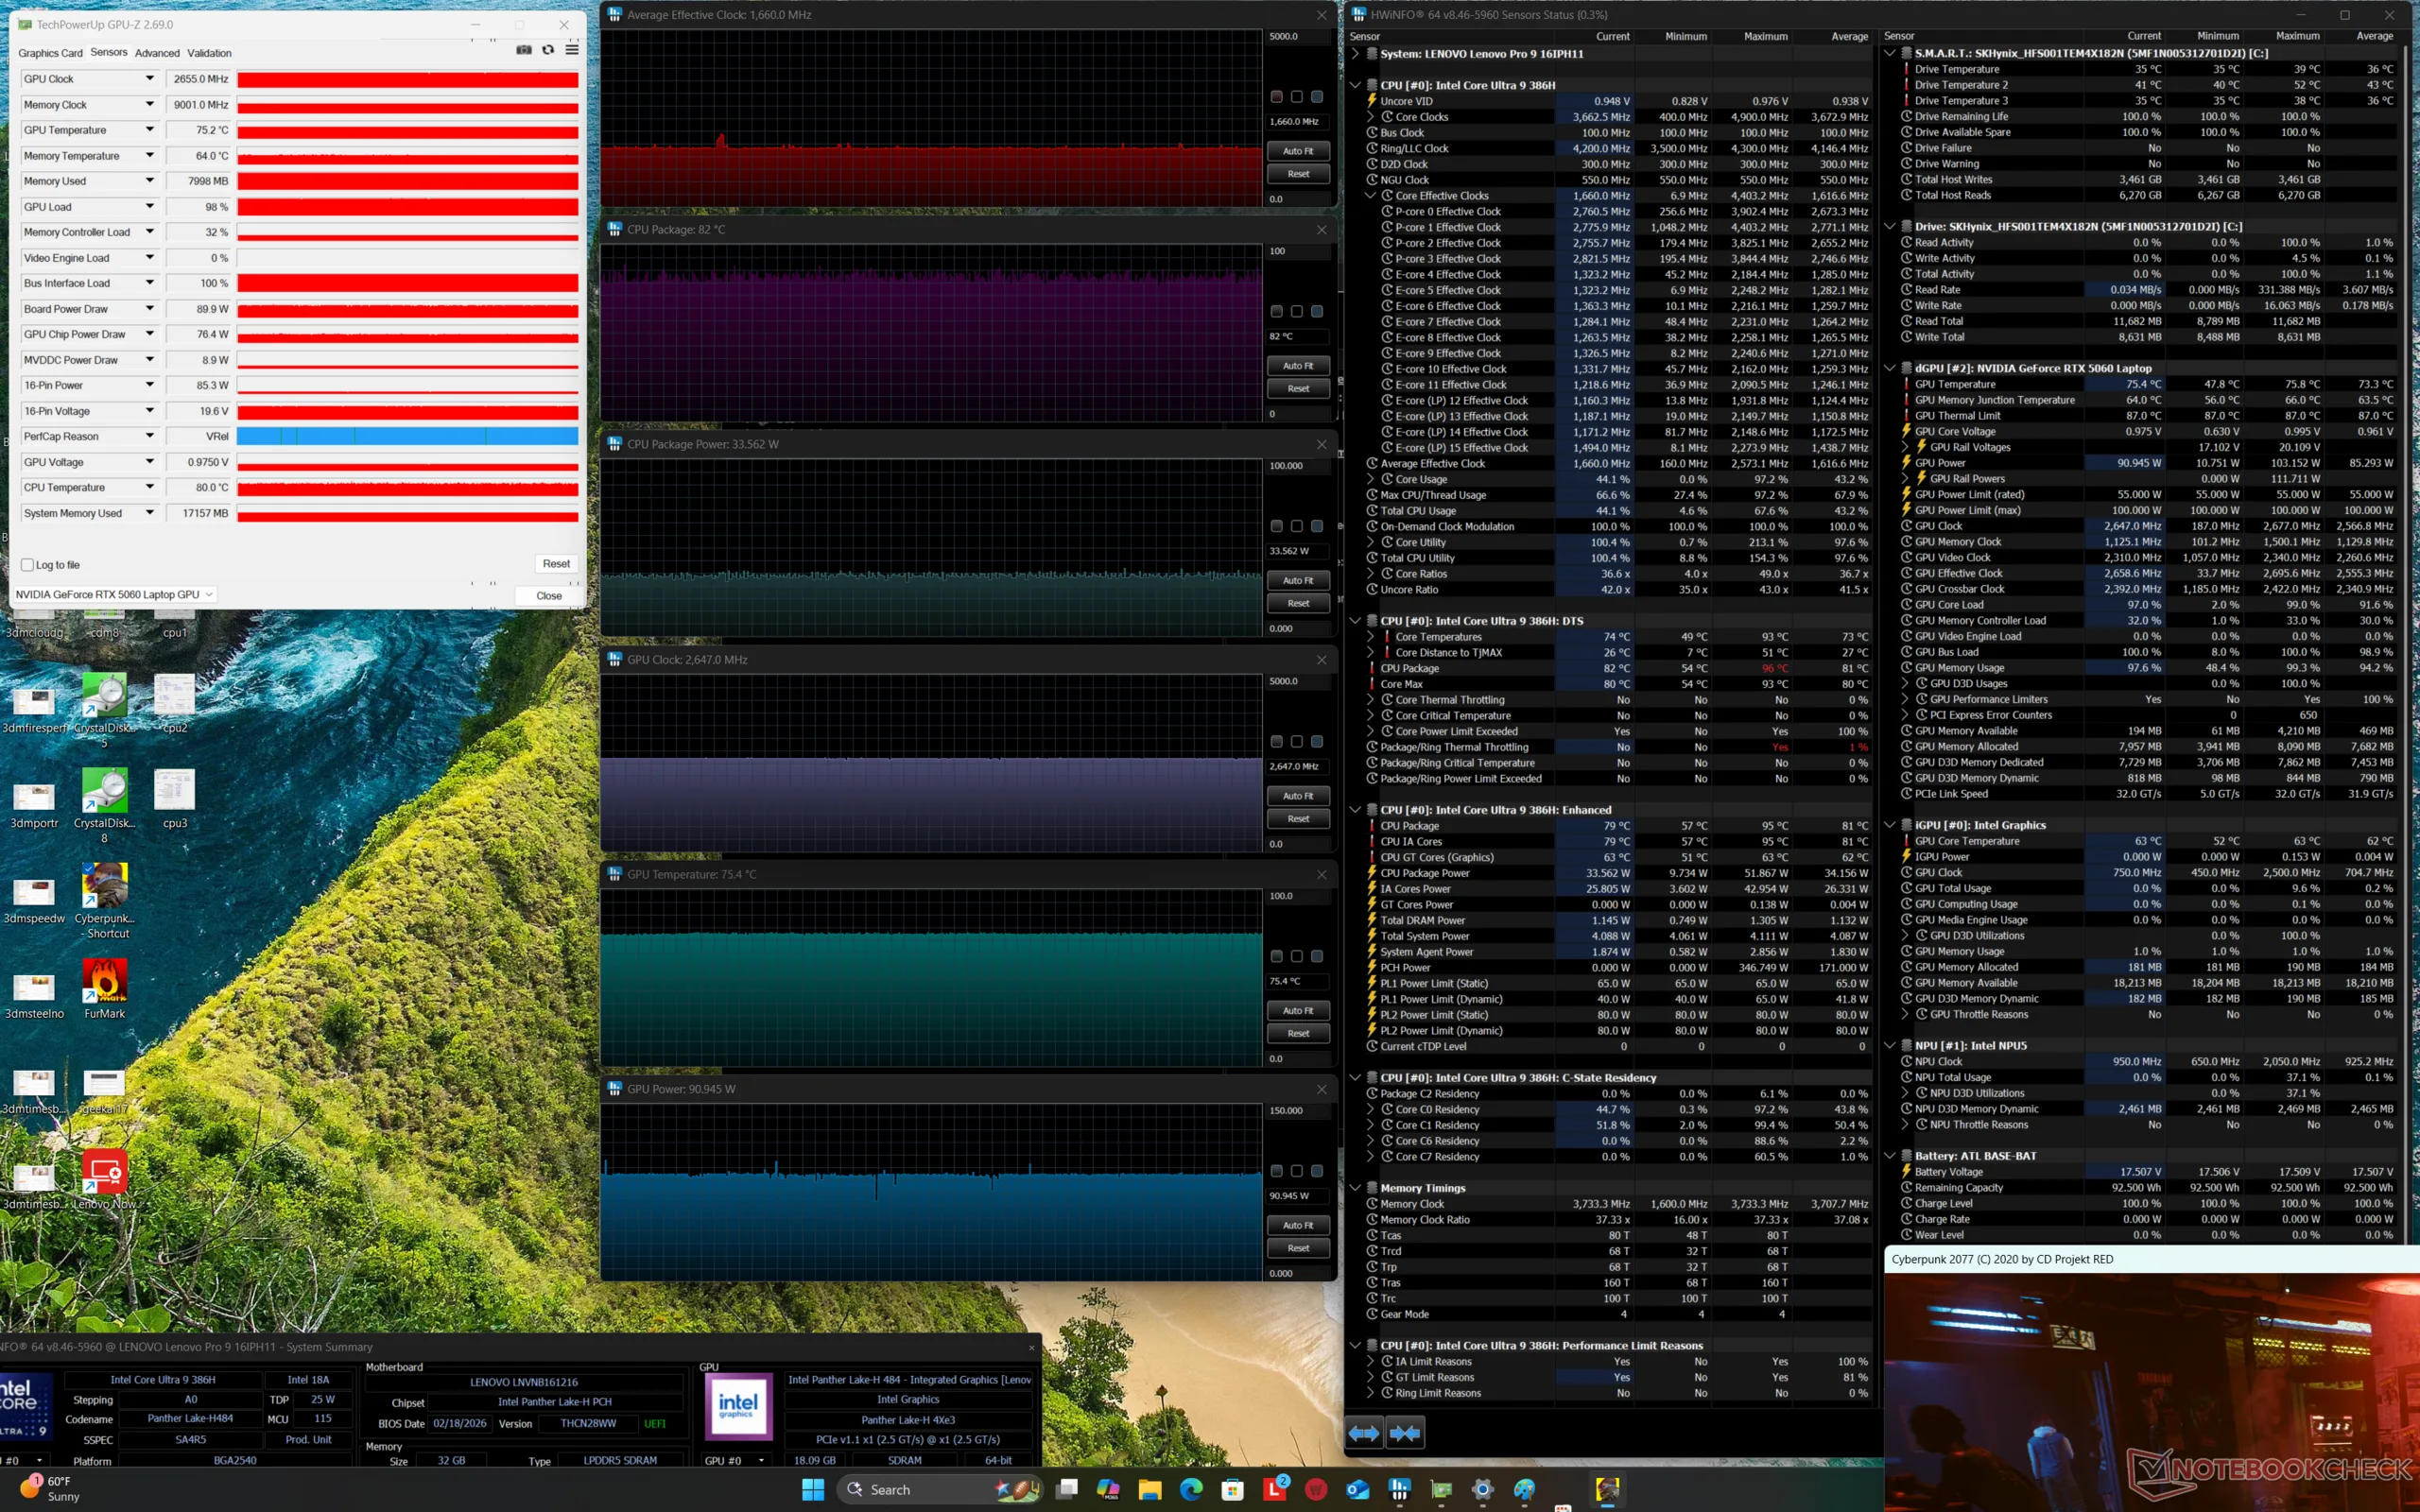
| Genomsnittlig CPU-klocka (GHz) | GPU-klocka (MHz) | Genomsnittlig CPU-temperatur (°C) | Genomsnittlig GPU-temperatur (°C) | |
| System i viloläge | -- | 232 | 41 | 36 |
| Prime95 Stress | 3.0 | -- | 90 | 49 |
| Prime95 + FurMark Stress | 2.4 | 2115 | 77 | 72 |
| Cyberpunk 2077 Stress (Balanserat läge) | 1.4 | 2340 | 67 | 68 |
| Cyberpunk 2077 Stress (Performance-läge) | 1.7 | 2647 | 82 | 75 |
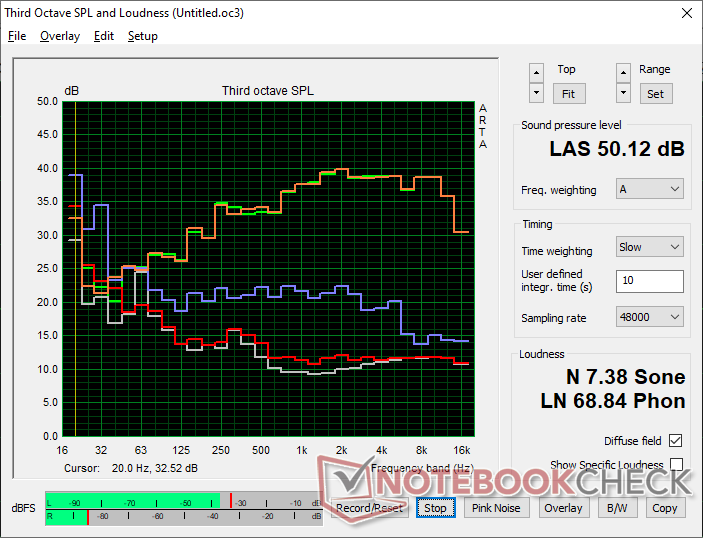
Högtalare
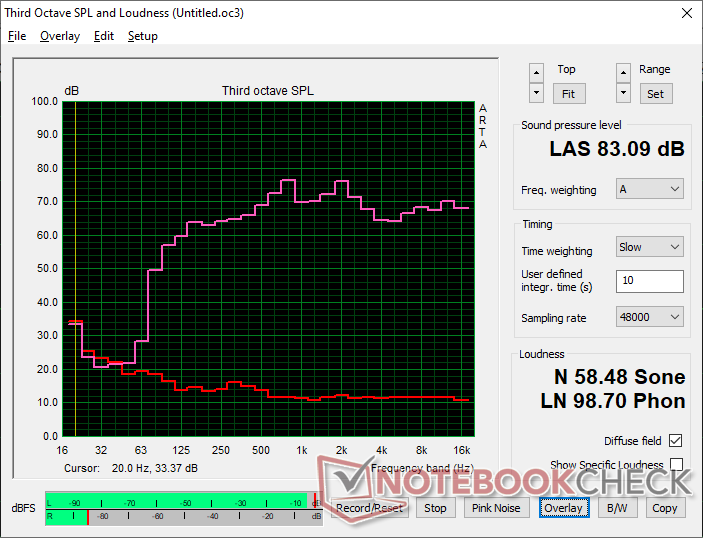
Lenovo Pro 9 16IPH11 ljudanalys
(+) | högtalare kan spela relativt högt (83.1 dB)
Bas 100 - 315 Hz
(±) | reducerad bas - i genomsnitt 5.7% lägre än medianen
(+) | basen är linjär (5.1% delta till föregående frekvens)
Mellan 400 - 2000 Hz
(+) | balanserad mellan - endast 4.2% från medianen
(+) | mids är linjära (5.4% delta till föregående frekvens)
Högsta 2 - 16 kHz
(+) | balanserade toppar - endast 1.8% från medianen
(+) | toppar är linjära (4.4% delta till föregående frekvens)
Totalt 100 - 16 000 Hz
(+) | det totala ljudet är linjärt (7.7% skillnad mot median)
Jämfört med samma klass
» 6% av alla testade enheter i den här klassen var bättre, 2% liknande, 91% sämre
» Den bästa hade ett delta på 5%, genomsnittet var 17%, sämst var 45%
Jämfört med alla testade enheter
» 1% av alla testade enheter var bättre, 0% liknande, 98% sämre
» Den bästa hade ett delta på 4%, genomsnittet var 23%, sämst var 134%
Apple MacBook Pro 16 2021 M1 Pro ljudanalys
(+) | högtalare kan spela relativt högt (84.7 dB)
Bas 100 - 315 Hz
(+) | bra bas - bara 3.8% från medianen
(+) | basen är linjär (5.2% delta till föregående frekvens)
Mellan 400 - 2000 Hz
(+) | balanserad mellan - endast 1.3% från medianen
(+) | mids är linjära (2.1% delta till föregående frekvens)
Högsta 2 - 16 kHz
(+) | balanserade toppar - endast 1.9% från medianen
(+) | toppar är linjära (2.7% delta till föregående frekvens)
Totalt 100 - 16 000 Hz
(+) | det totala ljudet är linjärt (4.6% skillnad mot median)
Jämfört med samma klass
» 0% av alla testade enheter i den här klassen var bättre, 0% liknande, 100% sämre
» Den bästa hade ett delta på 5%, genomsnittet var 17%, sämst var 45%
Jämfört med alla testade enheter
» 0% av alla testade enheter var bättre, 0% liknande, 100% sämre
» Den bästa hade ett delta på 4%, genomsnittet var 23%, sämst var 134%
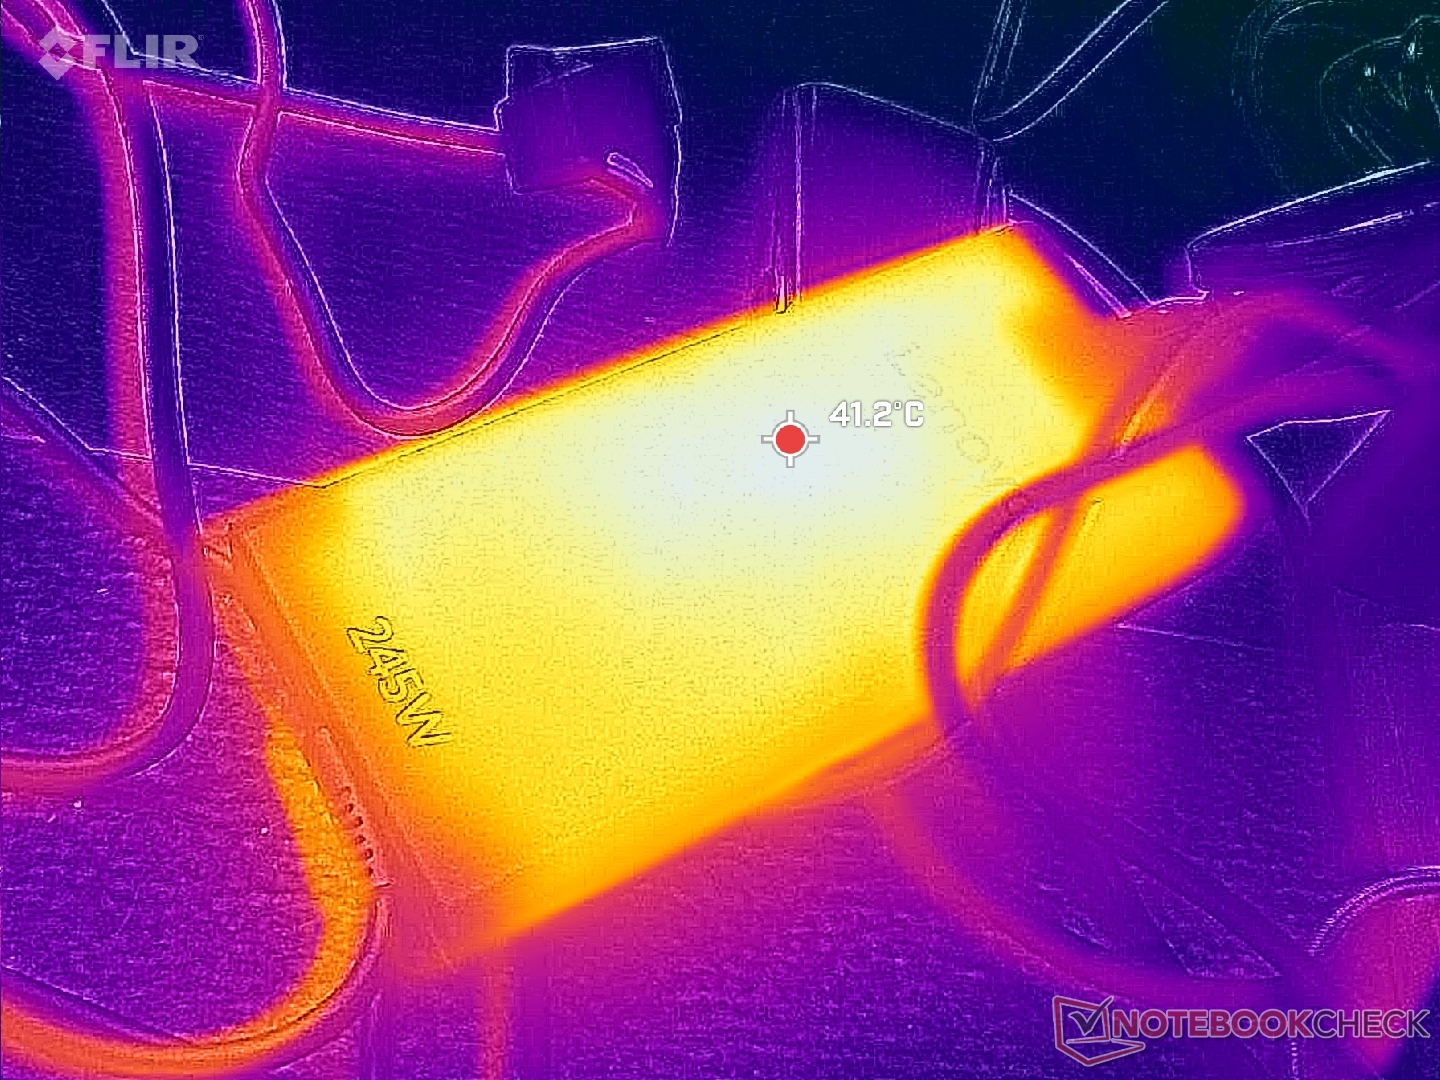
Energiförvaltning
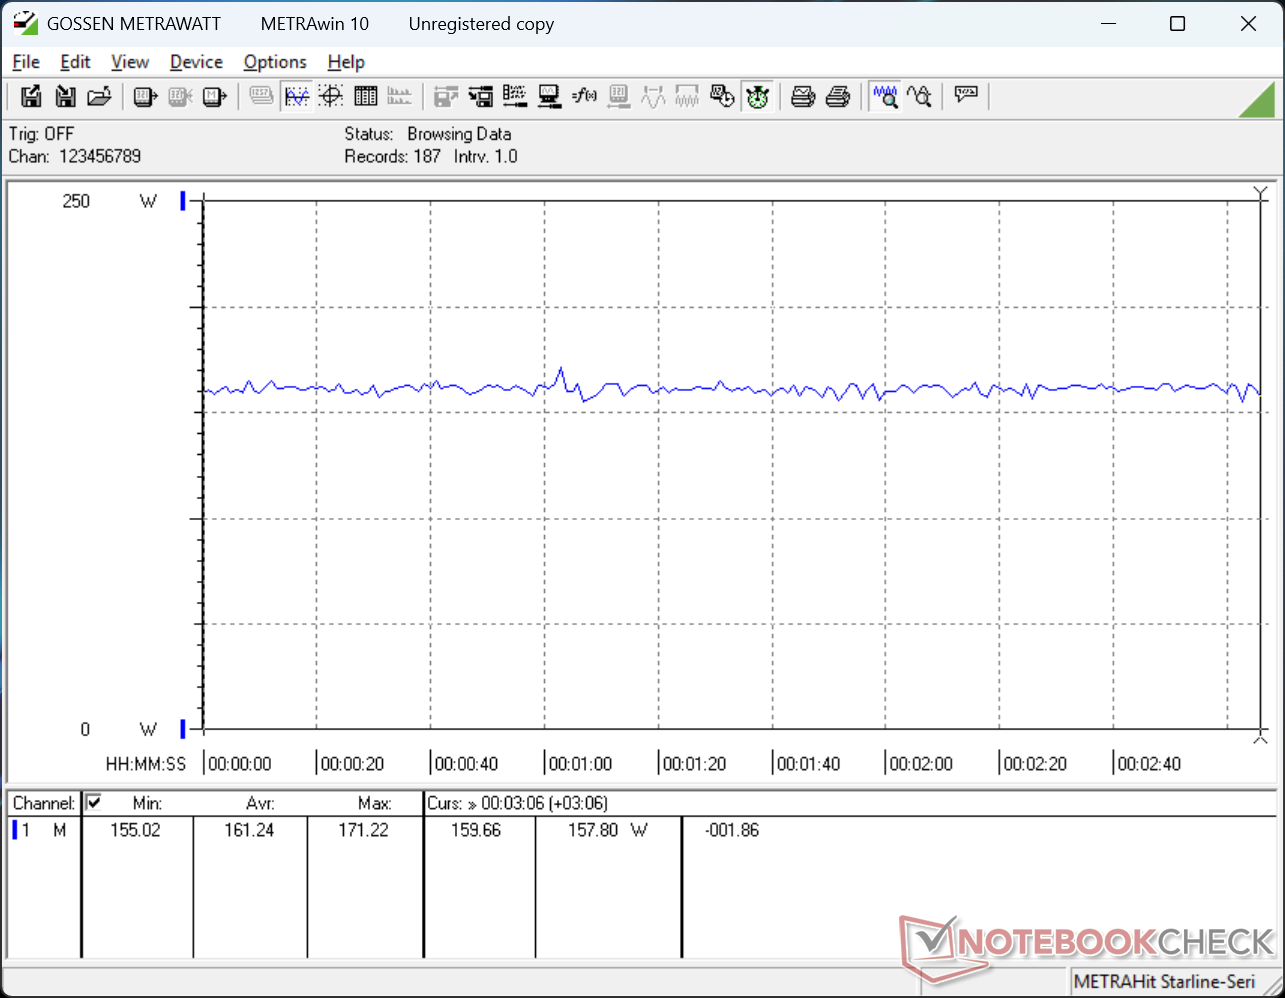
Strömförbrukning
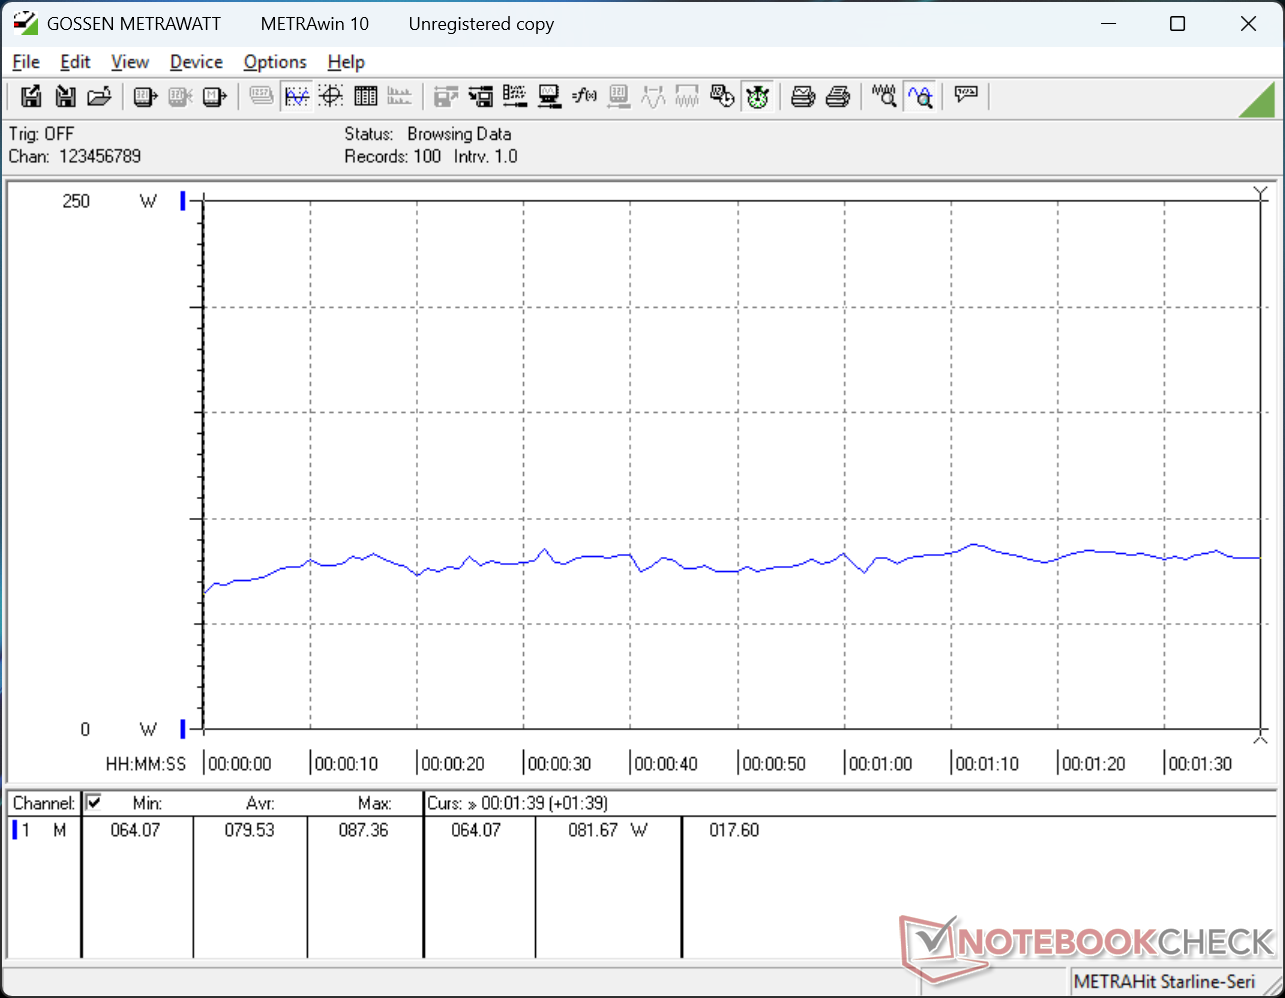
Lenovos system är en mycket krävande maskin med ett högt minimum på 15 W även i den svagaste ljusstyrkan med Optimus aktiv, upp till 46 W i den starkaste ljusstyrkan med dGPU aktiv. När vi kör högre belastningar som spel skulle vår enhet förbruka lika mycket ström som Asus ProArt P16 som är utrustad med den snabbare Ryzen AI 9 HX 370-processorn och RTX 5070 GPU.
| Av/Standby | |
| Låg belastning | |
| Hög belastning |
|
Förklaring:
min: | |
| Lenovo Pro 9 16IPH11 Ultra 9 386H, GeForce RTX 5060 Laptop, SK hynix PVC10 HFS001TEM4X182N, Tandem OLED, 3200x2000, 16" | Lenovo Yoga Pro 9 16IAH10 RTX 5050 Ultra 9 285H, GeForce RTX 5050 Laptop, WD PC SN7100S SDFPMSL-1T00-1101, OLED, 2880x1800, 16" | Dell XPS 16 Core Ultra X7 358H Ultra X7 358H, Arc B390 Panther Lake iGPU, , OLED, 3200x2000, 16" | MSI Prestige 16 AI Evo B2HMG Ultra 9 285H, Arc 140T, Micron 2500 1TB MTFDKBA1T0QGN, IPS, 2560x1600, 16" | HP Omen Transcend 16-u1095ng i9-14900HX, GeForce RTX 4070 Laptop GPU, Kioxia XG8 KXG80ZNV1T02, OLED, 2560x1600, 16" | Asus ProArt P16 H7606WP Ryzen AI 9 HX 370, GeForce RTX 5070 Laptop, WD PC SN740 SDDPNQE-2T00, OLED, 2880x1800, 16" | |
|---|---|---|---|---|---|---|
| Power Consumption | 25% | 66% | 58% | 8% | 20% | |
| Idle Minimum * (Watt) | 15.1 | 6.8 55% | 4 74% | 4.4 71% | 10 34% | 9.9 34% |
| Idle Average * (Watt) | 30.4 | 20.1 34% | 4.4 86% | 9.2 70% | 18 41% | 13.6 55% |
| Idle Maximum * (Watt) | 46.2 | 21.6 53% | 10.2 78% | 9.5 79% | 32 31% | 14 70% |
| Load Average * (Watt) | 79.5 | 87.6 -10% | 44.2 44% | 66.9 16% | 128 -61% | 93.8 -18% |
| Cyberpunk 2077 ultra * (Watt) | 161.2 | 148.2 8% | 62.6 61% | 68.8 57% | 162.1 -1% | |
| Cyberpunk 2077 ultra external monitor * (Watt) | 160.7 | 147.9 8% | 62.4 61% | 67.4 58% | 158.3 1% | |
| Load Maximum * (Watt) | 231.4 | 173.5 25% | 94.6 59% | 102.9 56% | 242 -5% | 229 1% |
| Witcher 3 ultra * (Watt) | 148.4 |
* ... mindre är bättre
Strömförbrukning Cyberpunk / Stresstest
Strömförbrukning extern monitor
Batteritid
Körtiderna är relativt korta även i balanserat läge med iGPU:n aktiv. Det relativt stora 93 Wh-batteripaketet klarar bara 5,5 timmars WLAN-surfning innan det stängs av automatiskt, vilket är flera timmar kortare än många andra multimediamodeller, inklusive Lenovos egen Yoga Pro 9i 16IAH G10 Aura.
(Uppdatering 3 maj 2026: Batteritiden för Wi-Fi-webbsurfning testades igen med skärmens ljusstyrka inställd på 150 nits, 60 Hz fast uppdateringsfrekvens och Nvidia-grafik inställd på Automatisk, vilket gav resultat som ligger närmare förra årets Yoga Pro 9i 16IAH G10 Aura på ~10 timmar. Slutresultatet har också uppdaterats för att återspegla den längre drifttiden)
| Lenovo Pro 9 16IPH11 Ultra 9 386H, GeForce RTX 5060 Laptop, 92.5 Wh | Lenovo Yoga Pro 9 16IAH10 RTX 5050 Ultra 9 285H, GeForce RTX 5050 Laptop, 84 Wh | Dell XPS 16 Core Ultra X7 358H Ultra X7 358H, Arc B390 Panther Lake iGPU, 70 Wh | MSI Prestige 16 AI Evo B2HMG Ultra 9 285H, Arc 140T, 99.9 Wh | HP Omen Transcend 16-u1095ng i9-14900HX, GeForce RTX 4070 Laptop GPU, 97 Wh | Asus ProArt P16 H7606WP Ryzen AI 9 HX 370, GeForce RTX 5070 Laptop, 90 Wh | |
|---|---|---|---|---|---|---|
| Batteridrifttid | 8% | 4% | 67% | -51% | -7% | |
| WiFi v1.3 (h) | 9.9 | 10.7 8% | 10.3 4% | 16.5 67% | 4.9 -51% | 9.2 -7% |
| H.264 (h) | 20.8 | |||||
| Load (h) | 2.4 |
Notebookcheck Betyg
En avancerad multimediamaskin med massor av prestanda och en superljus OLED-pekskärm, men med bristande batteritid.
Lenovo Pro 9 16IPH11
- 05/03/2026 v8
Allen Ngo
 Total Sustainability Score:
 Potentiella konkurrenter i jämförelse
Bild | Modell / recensioner | Pris | Vikt | Höjd | Skärm |
|---|---|---|---|---|---|
1. 91%  | Lenovo Pro 9 16IPH11 Intel Core Ultra 9 386H ⎘ NVIDIA GeForce RTX 5060 Laptop ⎘ 32 GB Minne, 1024 GB SSD | Amazon: Listpris: 3100 USD | 1.9 kg | 17.3 mm | 16.00" 3200x2000 236 PPI Tandem OLED |
2. 88.8%  | Lenovo Yoga Pro 9 16IAH10 RTX 5050 Intel Core Ultra 9 285H ⎘ NVIDIA GeForce RTX 5050 Laptop ⎘ 32 GB Minne, 1024 GB SSD | Amazon: Listpris: 1800 USD | 2 kg | 17.9 mm | 16.00" 2880x1800 212 PPI OLED |
3. 87.2%  | Dell XPS 16 Core Ultra X7 358H Intel Core Ultra X7 358H ⎘ Intel Arc B390 12 Xe3 Panther Lake iGPU ⎘ 32 GB Minne | Amazon: 1. $1,977.99 Dell Premium 16 (Previously ... 2. $2,399.99 Dell Premium 16 (Previously ... 3. $2,595.99 Dell Premium 16 (XPS 16 2025... Listpris: 2350 USD | 1.7 kg | 14.62 mm | 16.00" 3200x2000 236 PPI OLED |
4. 82.8%  | MSI Prestige 16 AI Evo B2HMG Intel Core Ultra 9 285H ⎘ Intel Arc Graphics 140T ⎘ 32 GB Minne, 1024 GB SSD | Amazon: 1. $1,149.49 msi Prestige 13 AI Evo Lapto... 2. $2,299.00 msi Prestige 16 Intel Evo AI... 3. $2,599.00 msi Prestige 16 AI Evo Busin... | 1.6 kg | 18.95 mm | 16.00" 2560x1600 189 PPI IPS |
5. 88.4% v7 (old)  | HP Omen Transcend 16-u1095ng Intel Core i9-14900HX ⎘ NVIDIA GeForce RTX 4070 Laptop GPU ⎘ 32 GB Minne, 1024 GB SSD | Amazon: Listpris: 3000 EUR | 2.3 kg | 20 mm | 16.00" 2560x1600 189 PPI OLED |
6. 89.1%  | Asus ProArt P16 H7606WP AMD Ryzen AI 9 HX 370 ⎘ NVIDIA GeForce RTX 5070 Laptop ⎘ 64 GB Minne, 2048 GB SSD | Amazon: 1. $4,599.00 HIDevolution [2025] ASUS Pro... 2. $4,924.00 HIDevolution [2025] ASUS Pro... 3. $5,649.00 HIDevolution [2025] ASUS Pro... Listpris: 3399€ | 1.8 kg | 17.3 mm | 16.00" 2880x1800 212 PPI OLED |
Genomskinlighet
Valet av enheter som ska granskas görs av vår redaktion. Testprovet gavs till författaren som ett lån av tillverkaren eller återförsäljaren för denna recension. Långivaren hade inget inflytande på denna recension och inte heller fick tillverkaren en kopia av denna recension innan publiceringen. Det fanns ingen skyldighet att publicera denna recension. Som ett oberoende medieföretag är Notebookcheck inte föremål för auktoritet från tillverkare, återförsäljare eller förlag.
This is how Notebookcheck is testingEvery year, Notebookcheck independently reviews hundreds of laptops and smartphones using standardized procedures to ensure that all results are comparable. We have continuously developed our test methods for around 20 years and set industry standards in the process. In our test labs, high-quality measuring equipment is utilized by experienced technicians and editors. These tests involve a multi-stage validation process. Our complex rating system is based on hundreds of well-founded measurements and benchmarks, which maintains objectivity.

