MSI Katana 17 B13V laptop recension: Nvidia GeForce RTX 4060 gör debut
5499 dollar. Det är så mycket som potentiella köpare måste lägga ut för att köpa MSI Titan GT77. Å ena sidan får du den ultimata kraften, men det är inte många som är villiga att spendera så mycket på en bärbar dator. Med några få nedskärningar visar MSI Katana 17 B13VFK att billigare också kan fungera: Med en Raptor Lake CPU och Nvidia GeForce RTX 4060kan den här bärbara speldatorn (för närvarande inte tillgänglig på Amazon och Best Buy) köpas i Tyskland för cirka 1999 euro. Fortfarande mycket pengar men ungefär två tredjedelar billigare. I vår omfattande recension avslöjar vi om prestandan också tar en liknande smäll.
Potentiella konkurrenter i jämförelse
Gradering | Datum | Modell | Vikt | Höjd | Storlek | Upplösning | Pris |
|---|---|---|---|---|---|---|---|
| 82.1 % v7 (old) | 02/2023 | MSI Katana 17 B13VFK i7-13620H, GeForce RTX 4060 Laptop GPU | 2.8 kg | 25.2 mm | 17.30" | 1920x1080 | |
| 89 % v7 (old) | 02/2023 | MSI Titan GT77 HX 13VI i9-13950HX, GeForce RTX 4090 Laptop GPU | 3.5 kg | 23 mm | 17.30" | 3840x2160 | |
| 83.2 % v7 (old) | 01/2023 | MSI Pulse GL76 12UGK i7-12700H, GeForce RTX 3070 Laptop GPU | 2.6 kg | 24.2 mm | 17.30" | 1920x1080 | |
| 83.3 % v7 (old) | 01/2023 | Gigabyte G7 KE i5-12500H, GeForce RTX 3060 Laptop GPU | 2.6 kg | 25 mm | 17.30" | 1920x1080 | |
| 86.9 % v7 (old) | 11/2022 | Asus ROG Strix Scar 17 SE G733CX-LL014W i9-12950HX, GeForce RTX 3080 Ti Laptop GPU | 2.9 kg | 28.3 mm | 17.30" | 2560x1440 | |
| 86.5 % v7 (old) | 11/2022 | Acer Predator Helios 300 (i7-12700H, RTX 3070 Ti) i7-12700H, GeForce RTX 3070 Ti Laptop GPU | 3 kg | 27.65 mm | 17.30" | 2560x1440 |
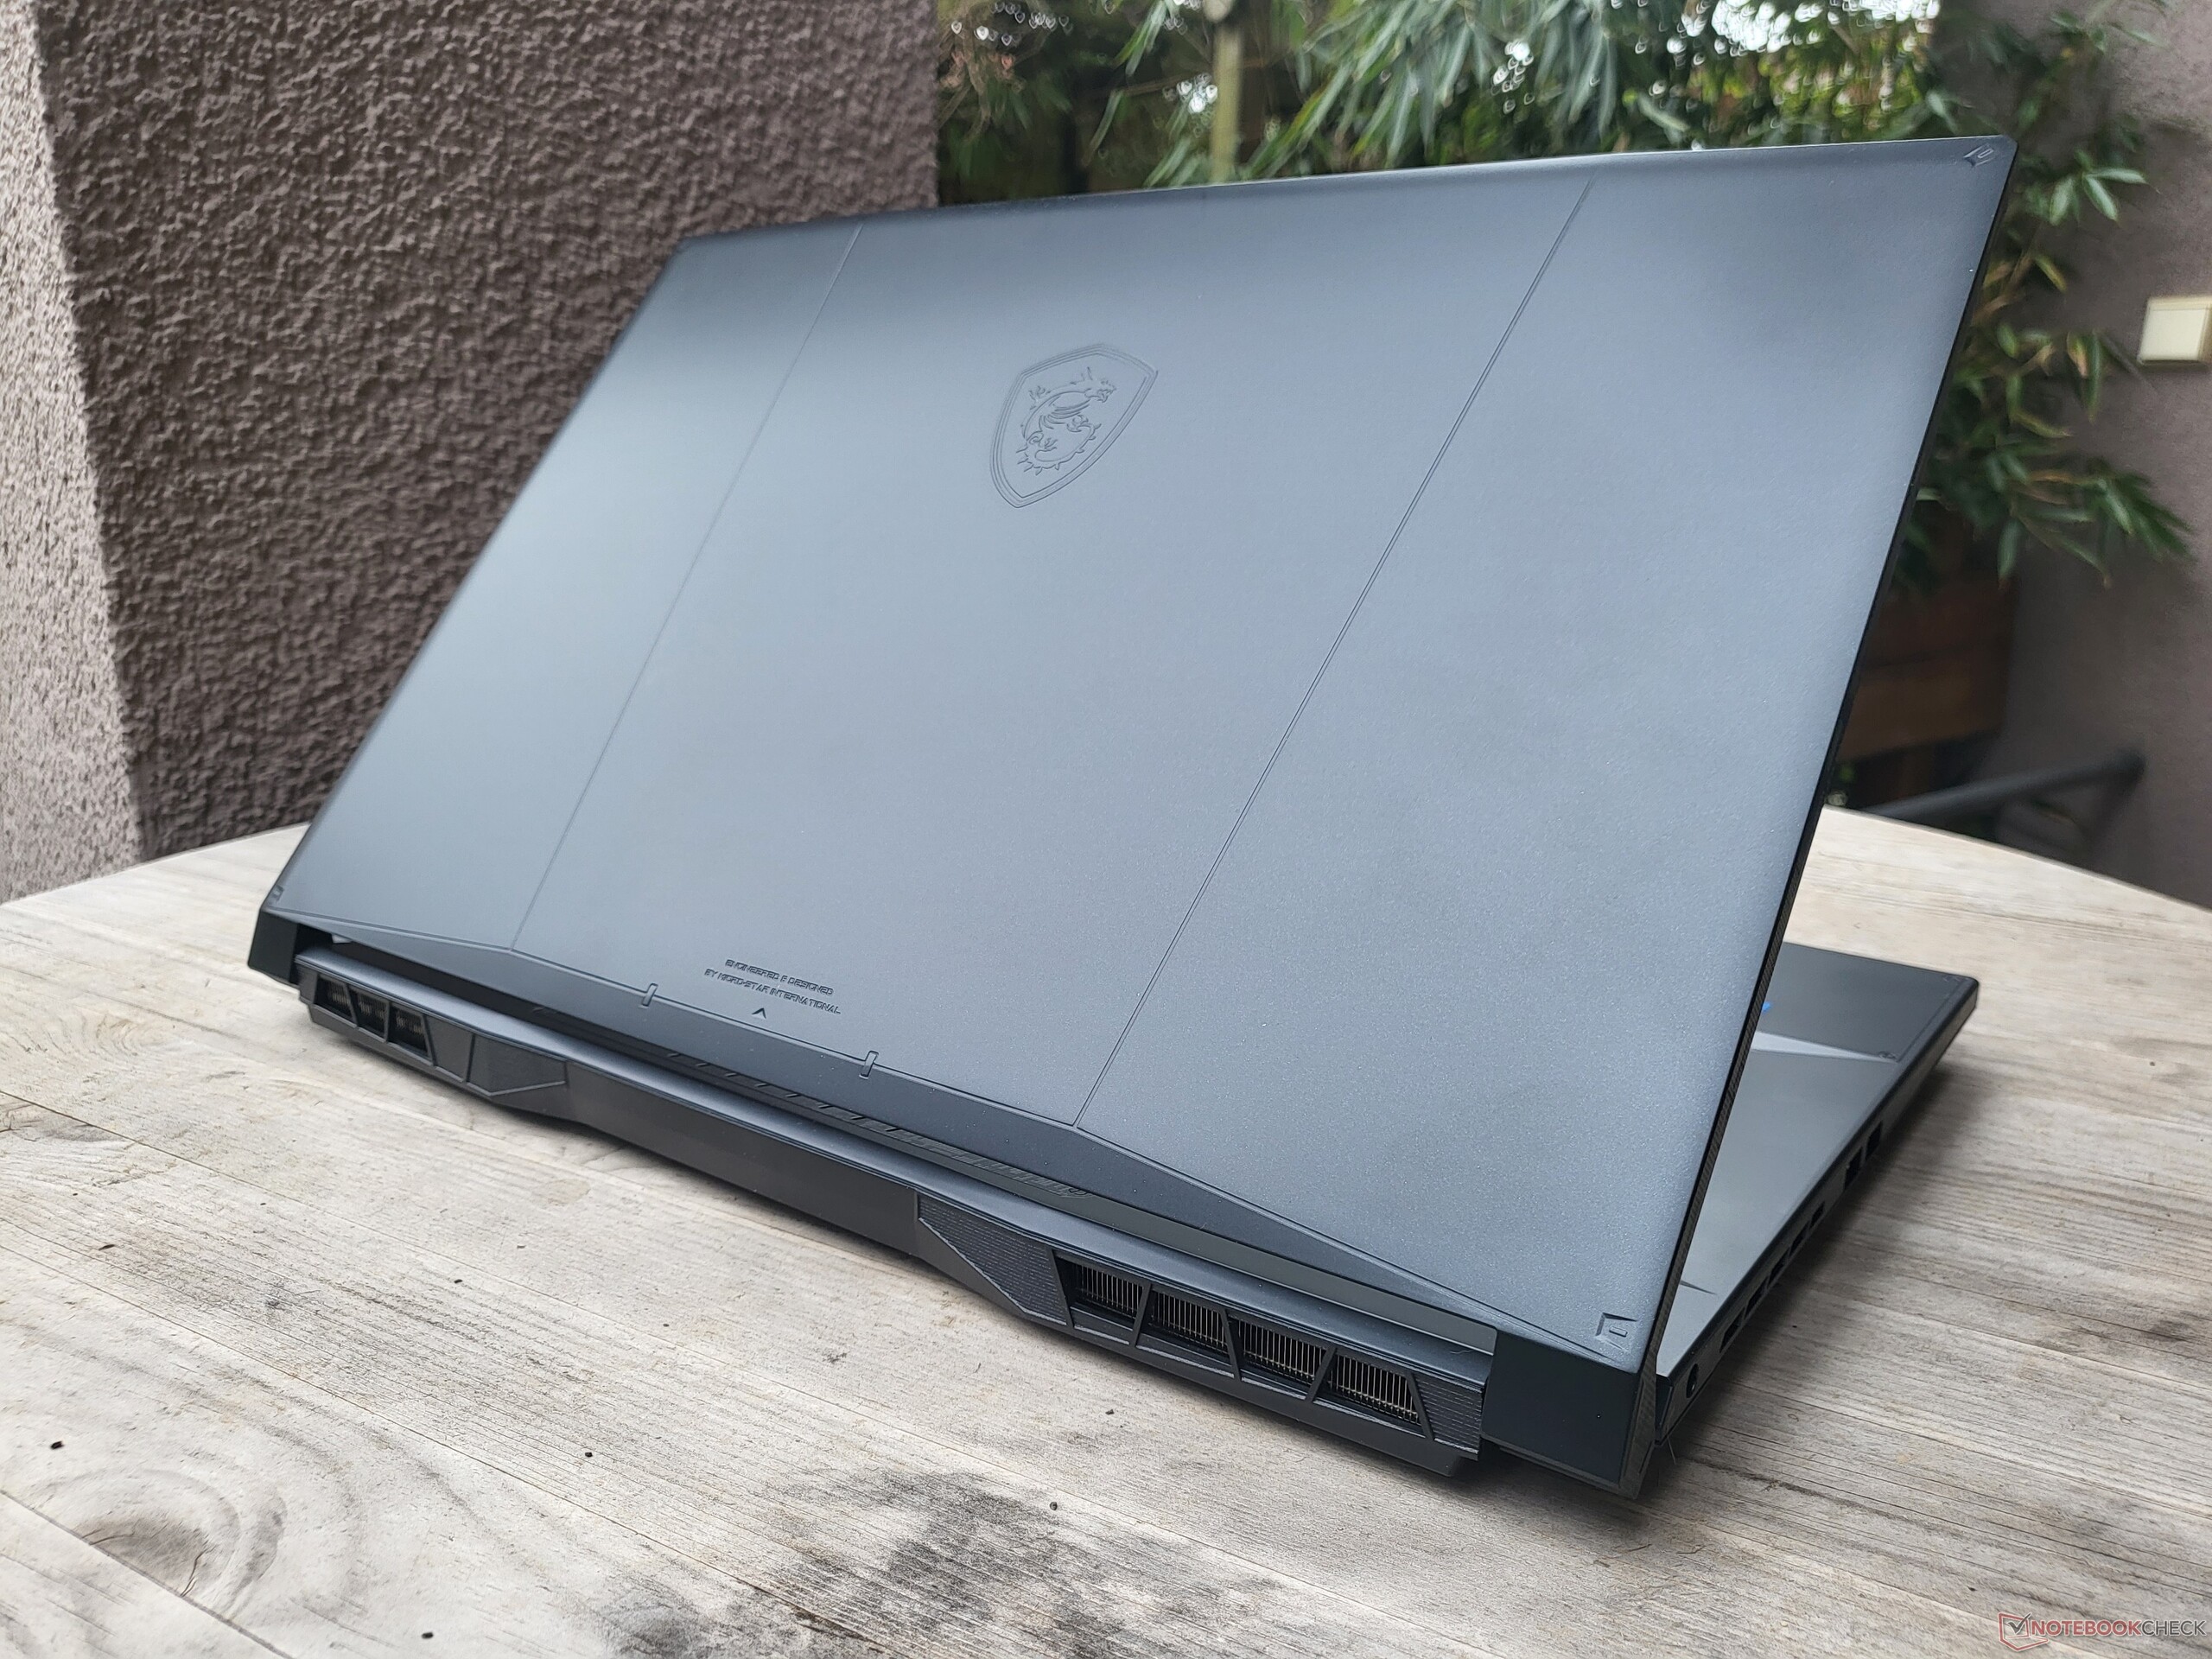
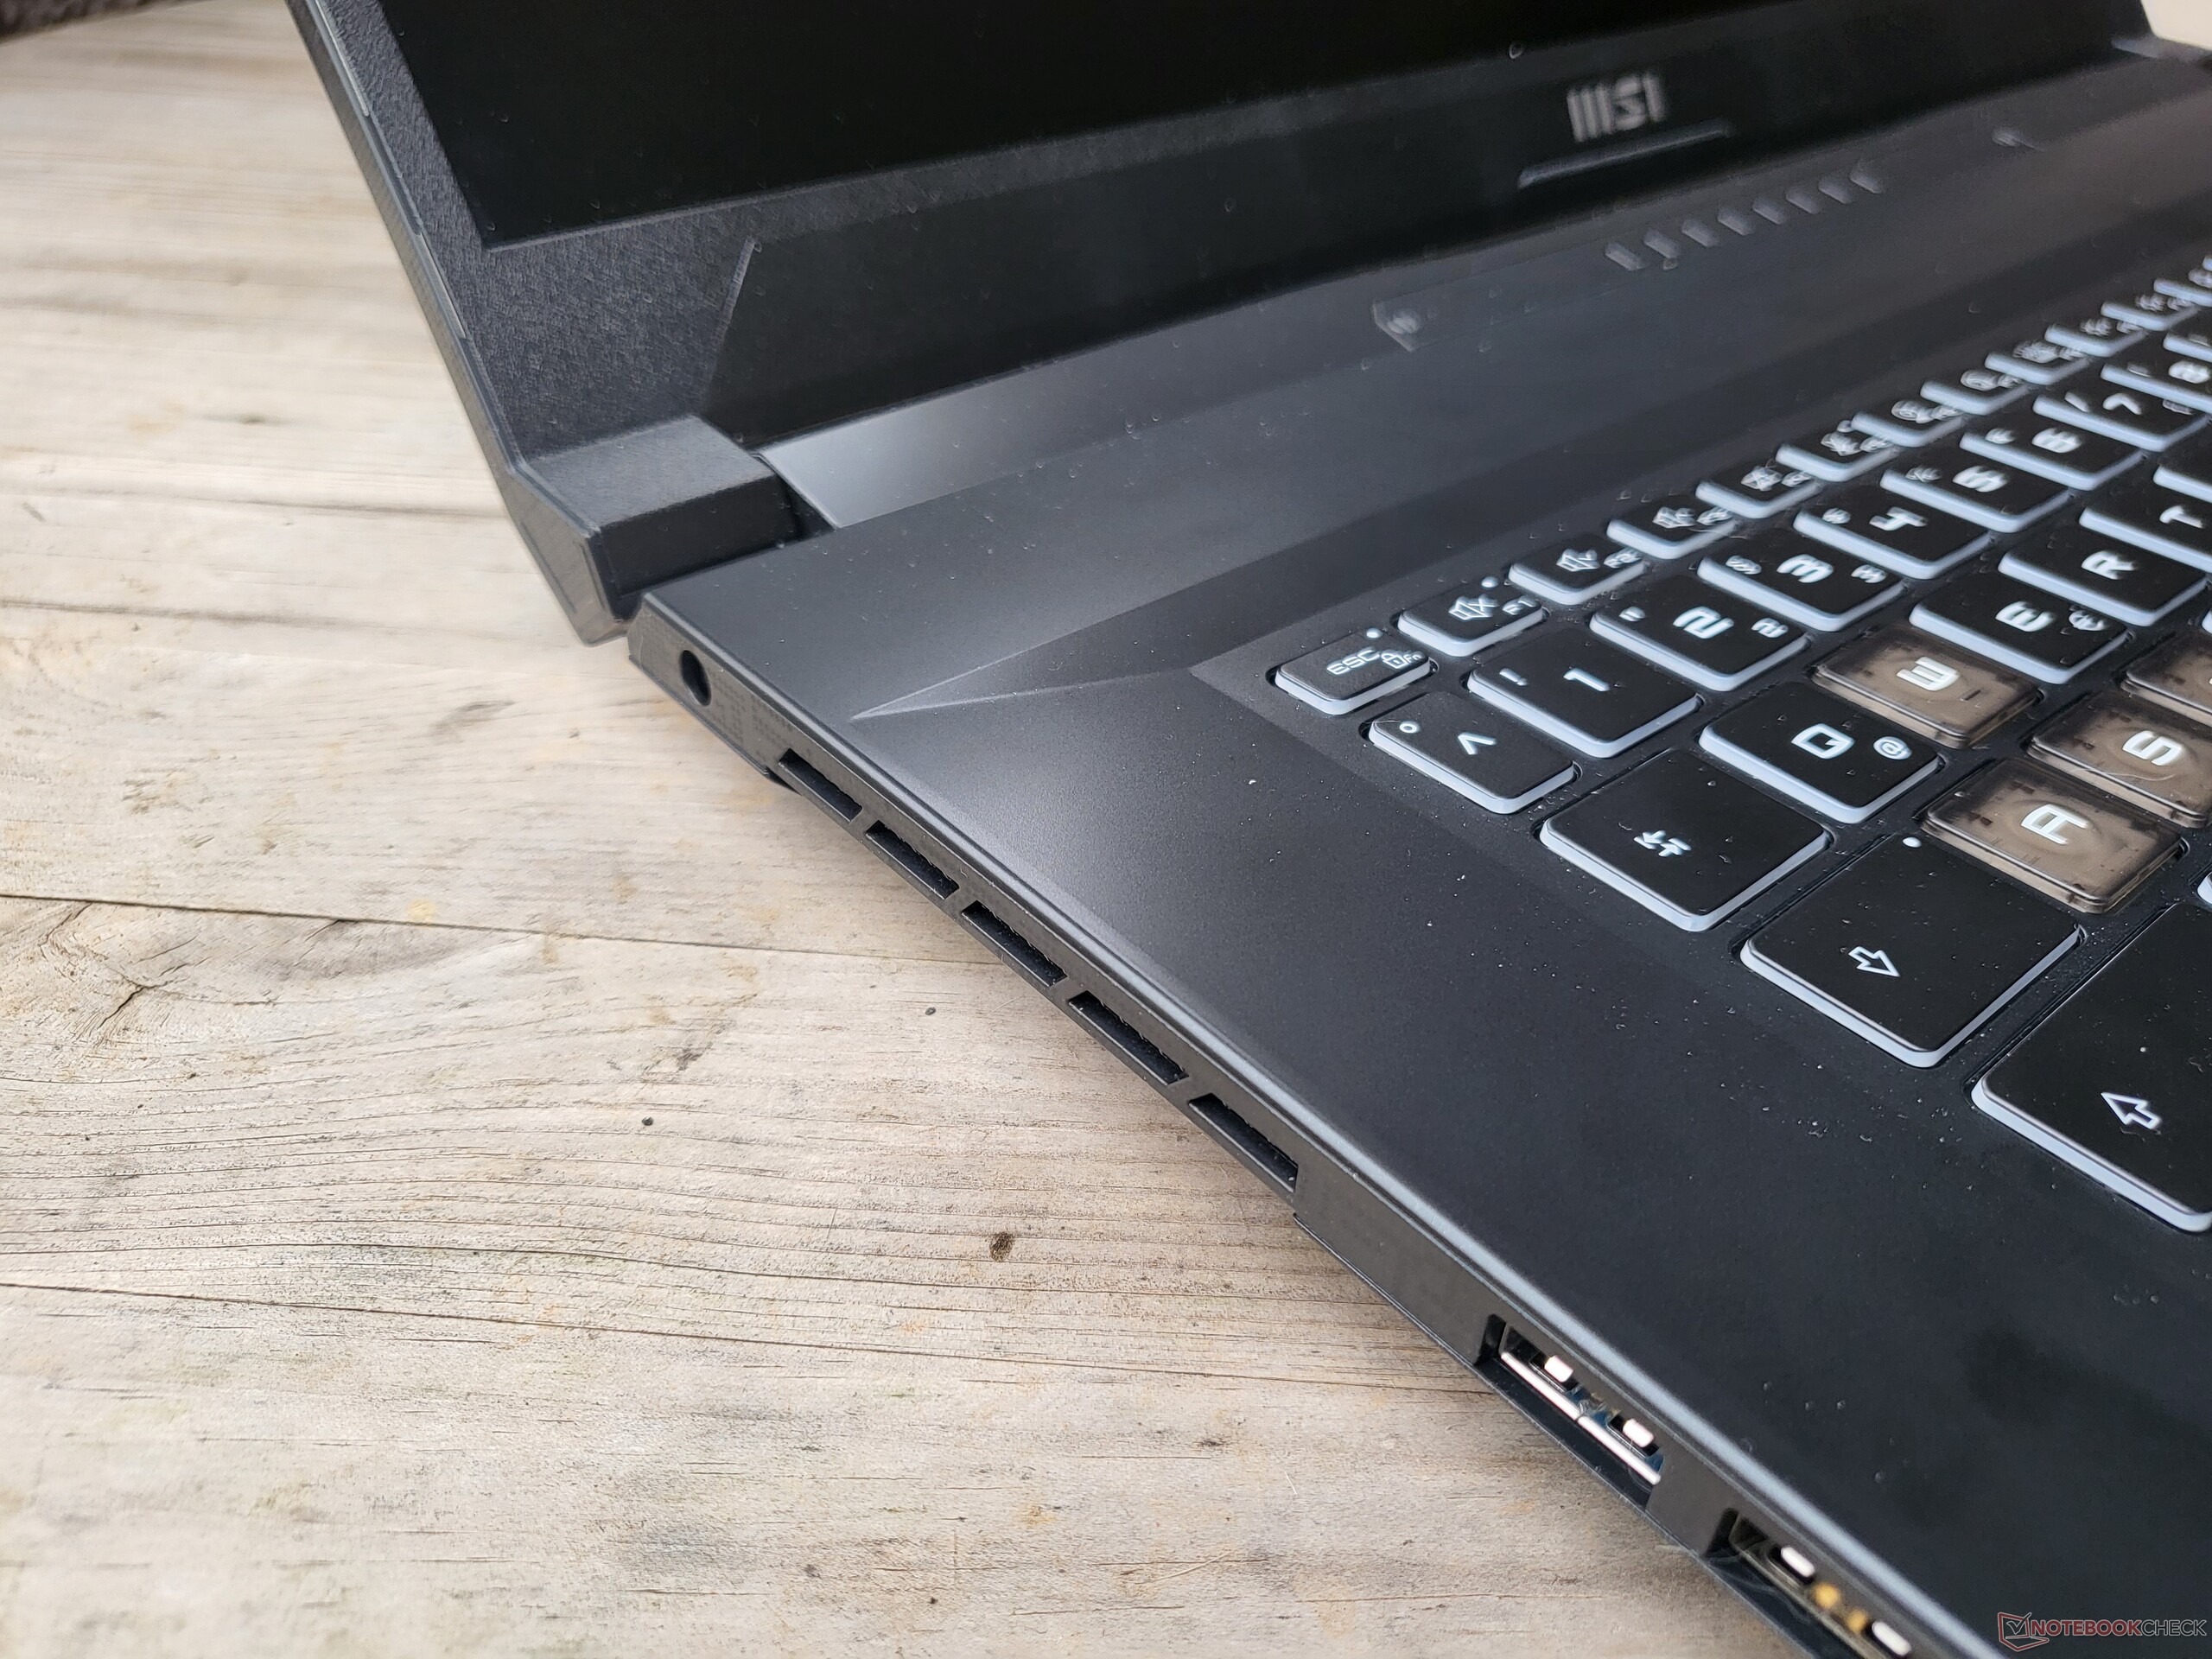
Fall: Ett mattgrått MSI rocket
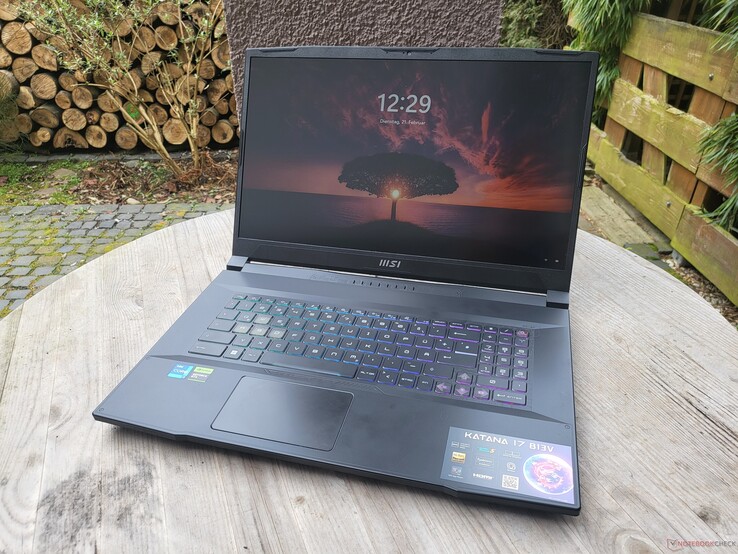
MSI har gett Katana 17 ett typiskt spelutseende. Designspråket kan knappast beskrivas som slätt, men det är något som inte gäller för den bärbara datorns färg: MSI är mörkgrå genomgående. Fast det är bara fallet när enheten är avstängd. När det färgglada, bakgrundsbelysta tangentbordet är aktiverat ser MSI färgmässigt också ut som en bärbar dator för spel.
Utvändigt är den bärbara datorn åtminstone tillverkad av plast. Handflatsstödet och locket känns mjukt vid beröring medan basen av enheten är något grövre. Det är inte nödvändigtvis den högsta kvaliteten men den fyller ändå sitt syfte. Vid lätt tryck är handflatsstödet fast men vid ytterligare tryck böjer det sig lite i mitten. Displaylocket kan vridas något, till skillnad från basen som inte kan vridas alls. För en bärbar dator som ska tillbringa större delen av sin tid på ett skrivbord borde detta inte vara något problem.
De stora gångjärnen gör att enheten kan öppnas i en vinkel på 180 grader och displaylocket kan öppnas med en hand.
När det gäller vikten ligger MSI Katana 17 i mitten av paketet jämfört med sina jämnåriga konkurrenter. I gengäld har den relativt kompakta dimensioner.
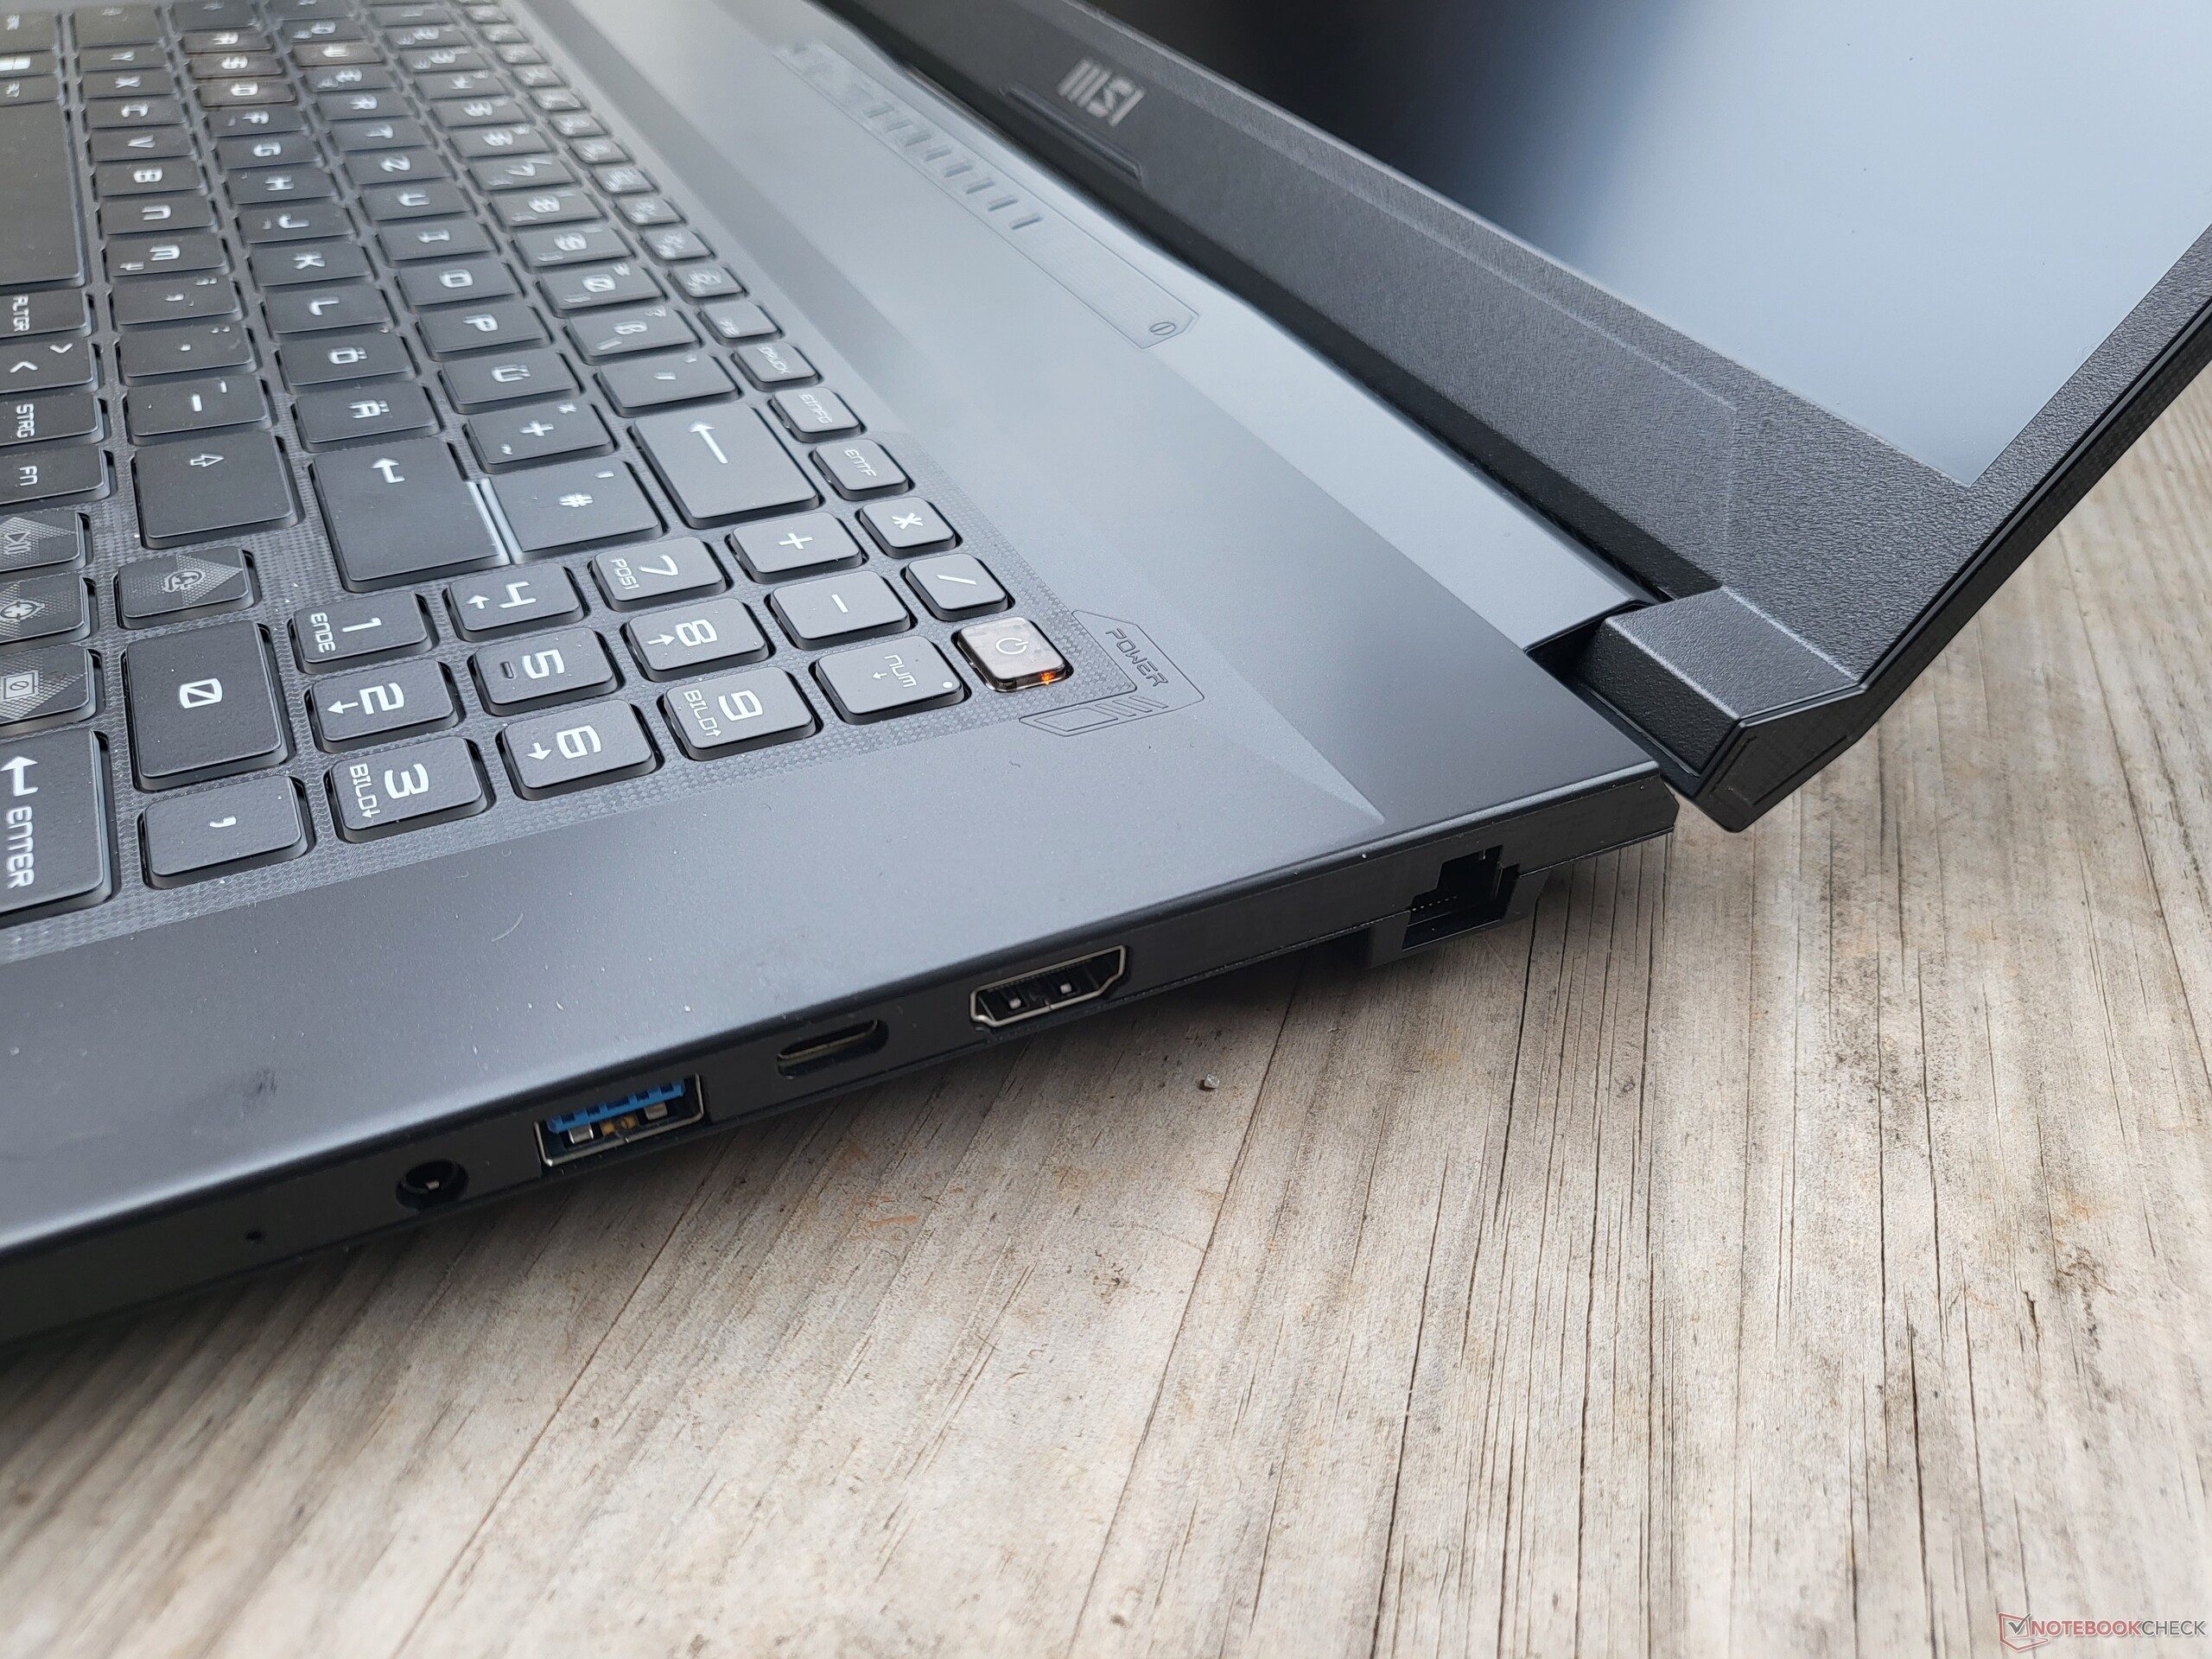
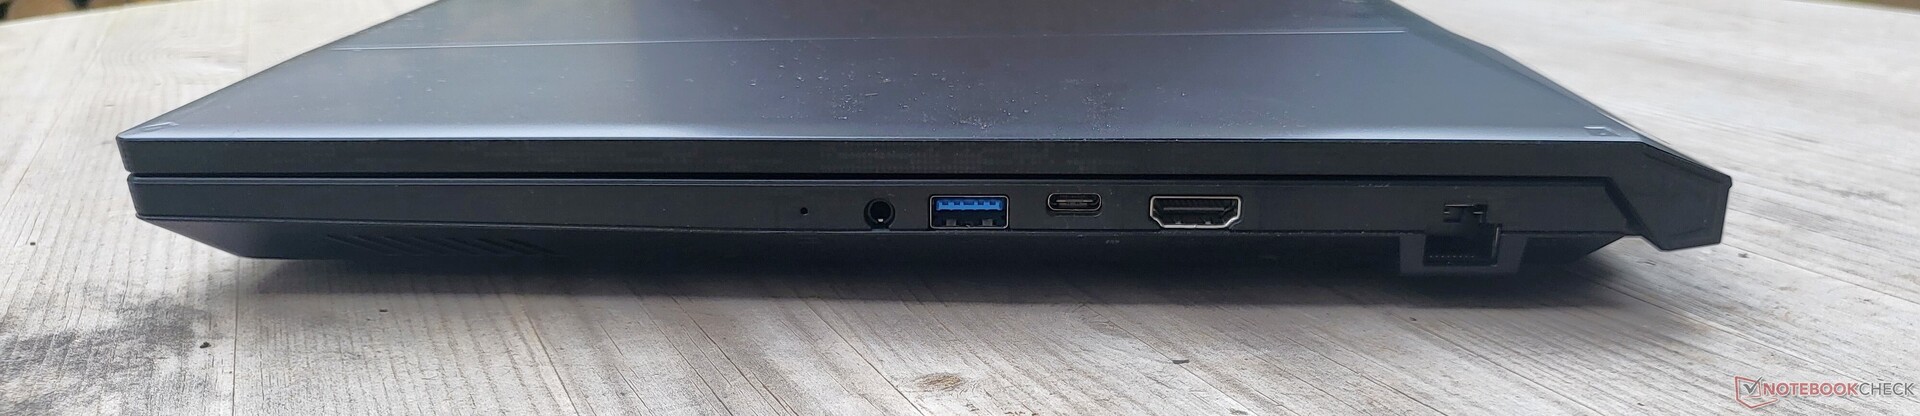
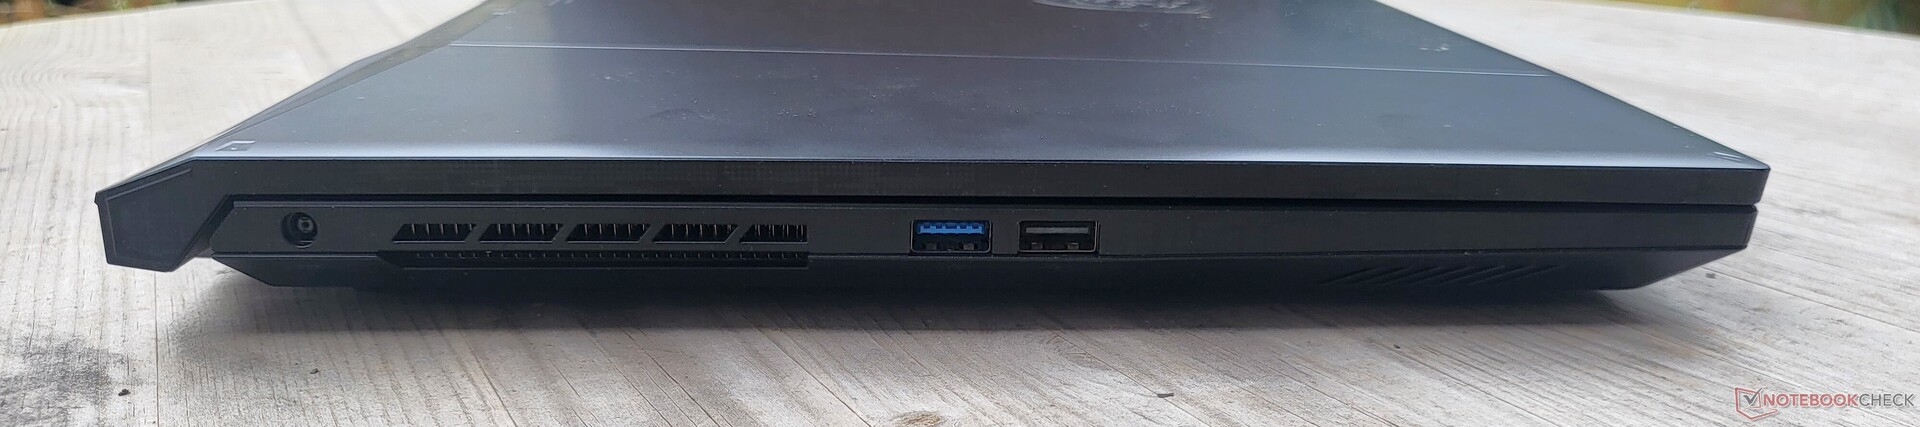
Funktioner: USB 2.0 i stället för Thunderbolt
Utbudet av portar lämnar mycket att önska: USB 2.0 har ingen plats i 2022 och Thunderbolt saknas också i MSI Katana 17. Dessutom saknar vi en SD-kortläsare, men MSI har åtminstone inte snålat med den RJ45-porten.
Kommunikation
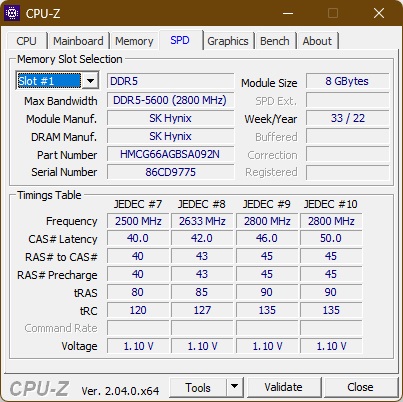
Med Katana 17 B13V har MSI valt en WiFi-lösning från Intel, även om den inte är den mest moderna tekniken. Intel AX201 levererar höga och stabila överföringshastigheter även om den måste klara sig utan den nyare WiFI 6E-standarden.
Webbkamera
Webbkameran i 720p ger en bild som är typisk för bärbara datorer: brusig, urvattnad och utan skärpa.


Tillbehör
MSI Katana 17 B13V levereras med ett 240-watts nätaggregat från Chicony som använder en egen kontakt.
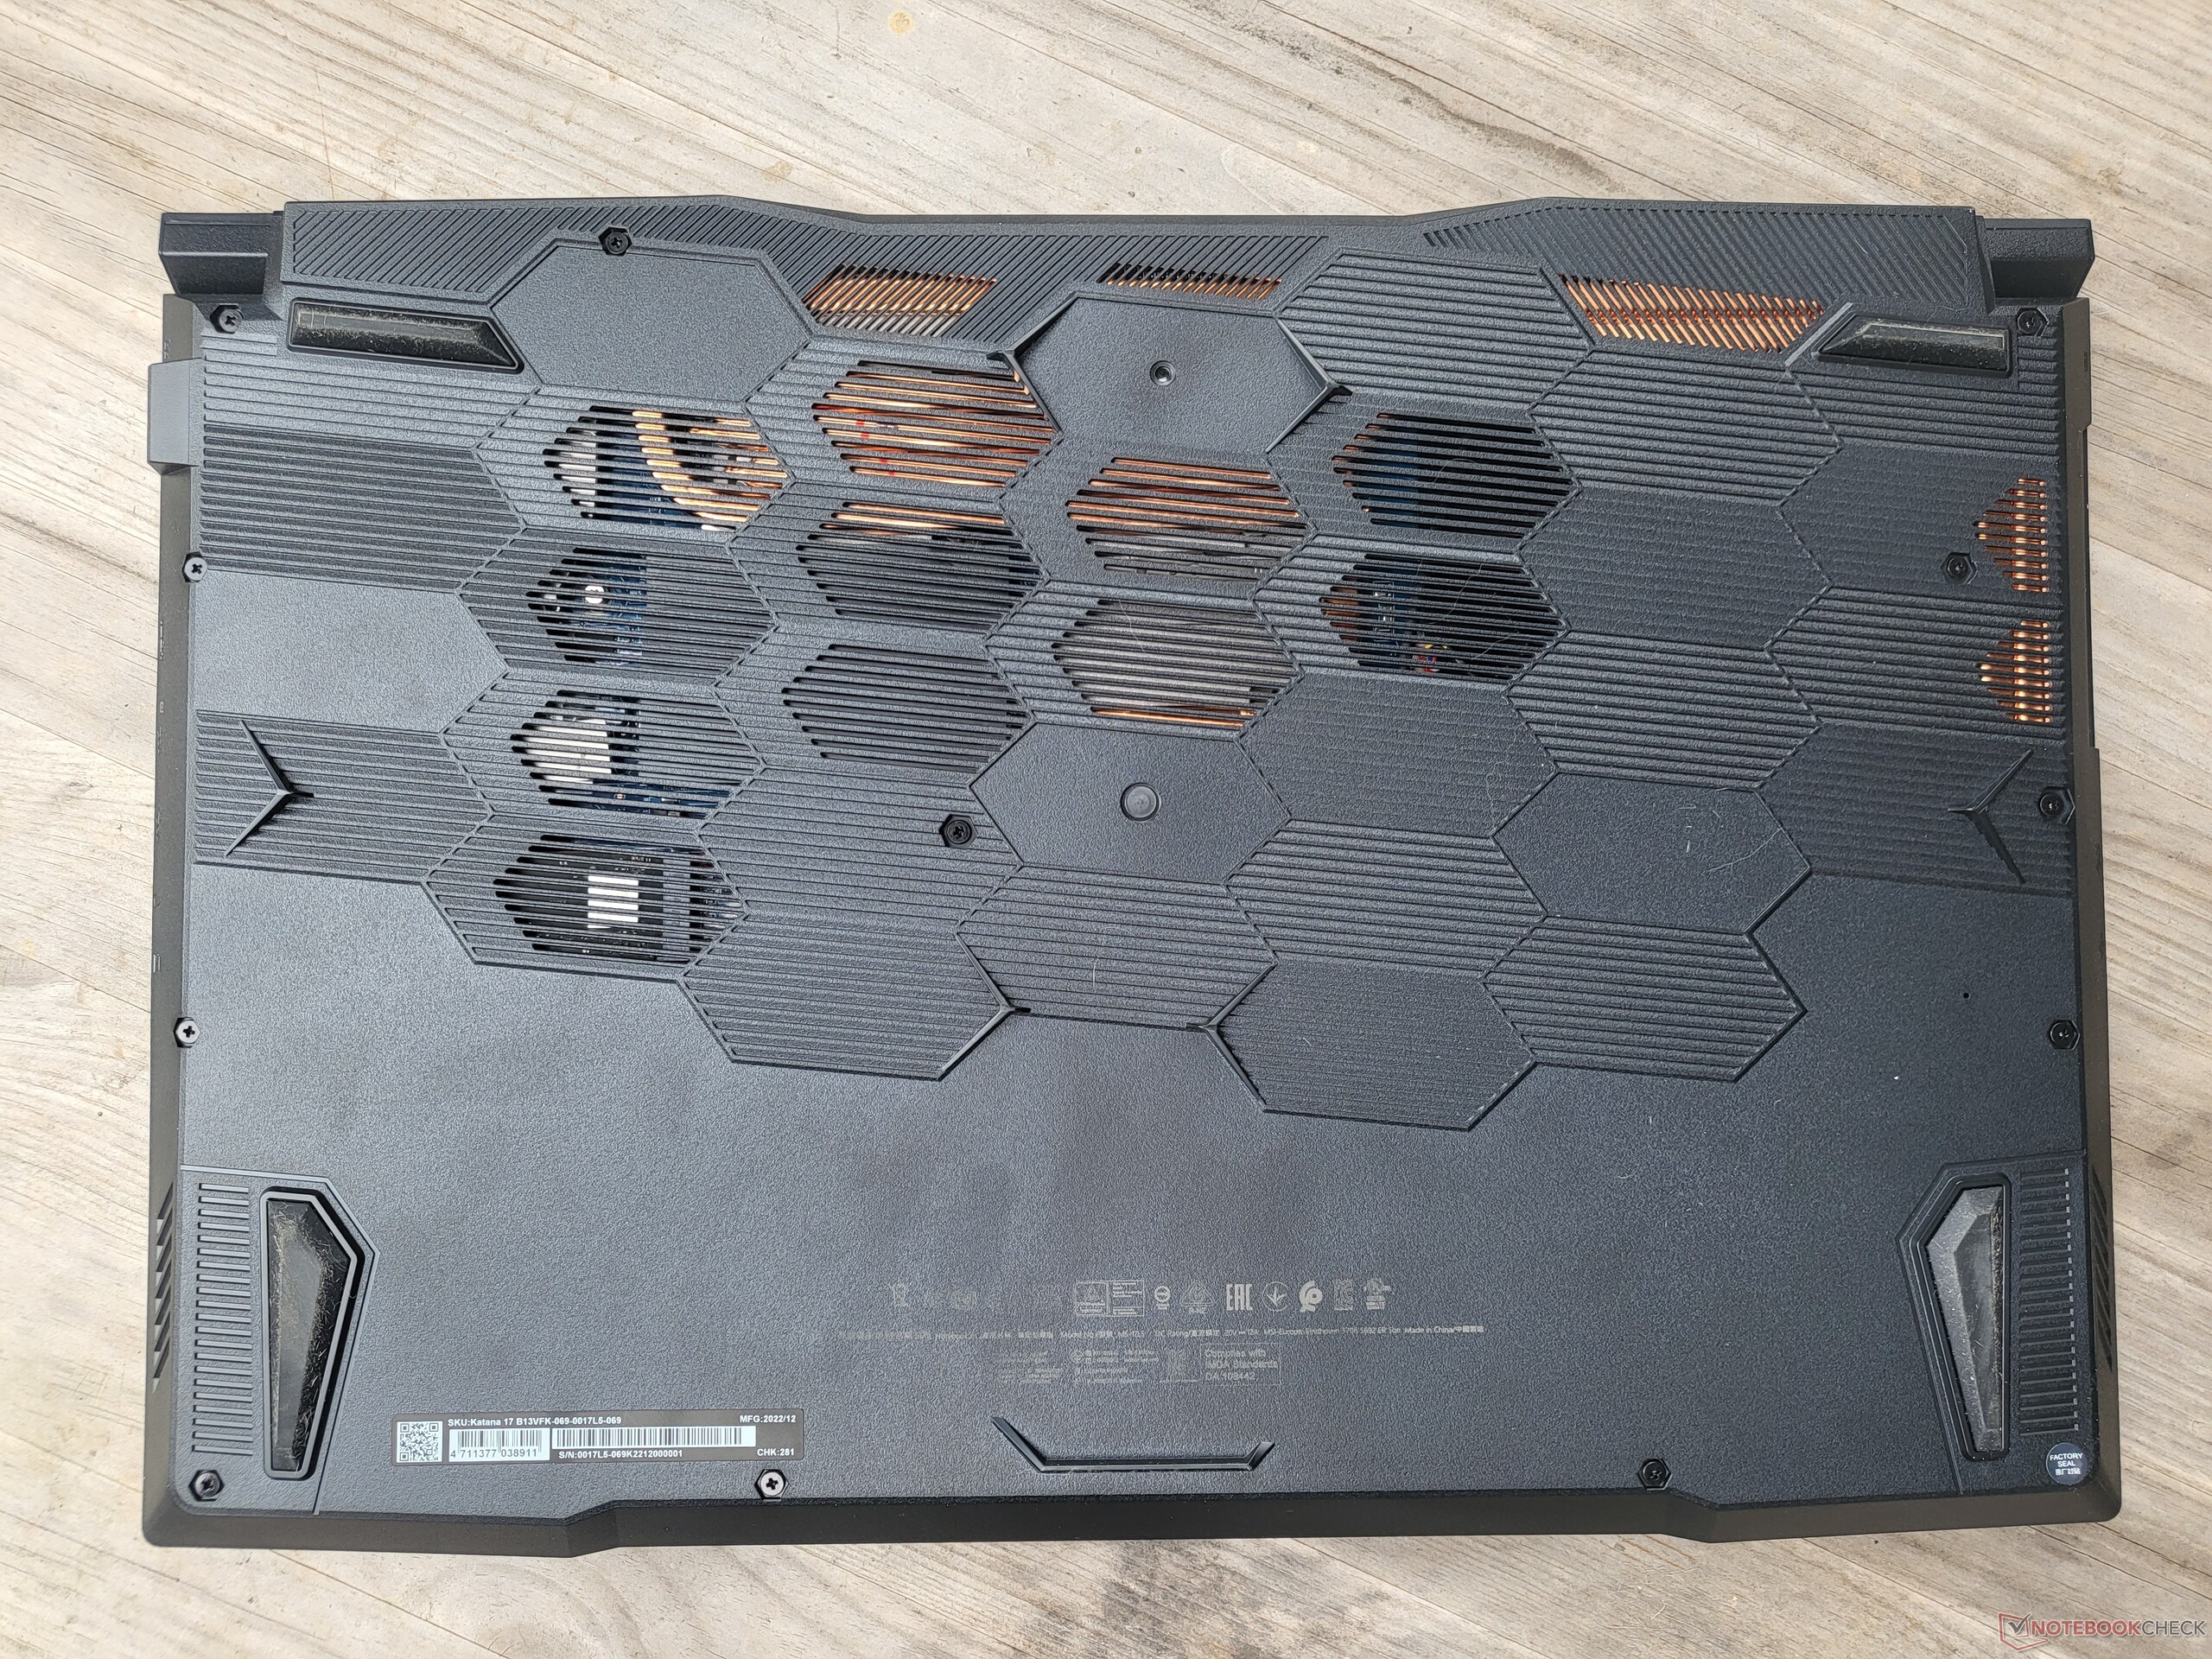
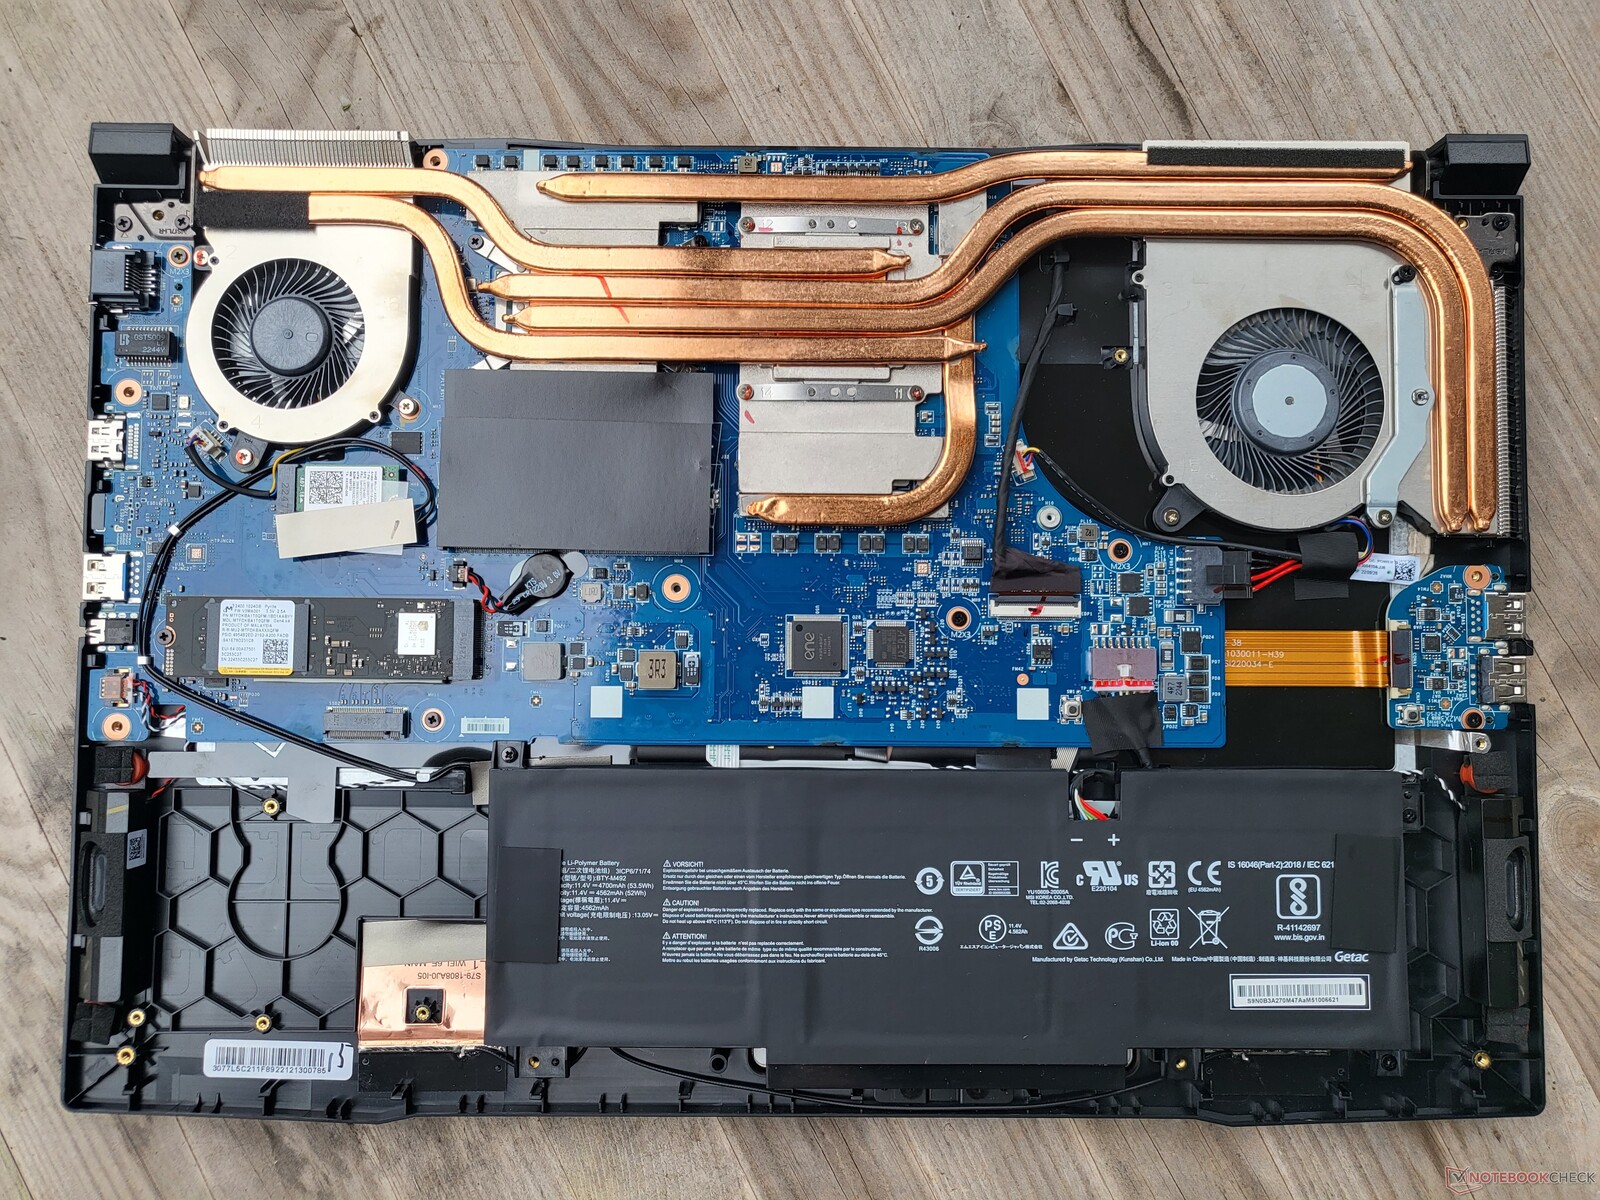
Underhåll
Tretton skruvar och några clips hindrar dig från att komma åt Katanas inre delar. WiFi-modulen, M.2 2280 SSD samt båda RAM-modulerna kan uppgraderas. Dessutom kan du komma åt det stora kylsystemet med två fläktar och även batteriet som är ganska litet för en enhet av den här storleken. Det finns mycket ledigt utrymme bredvid batteriet vilket visar att ett större batteri hade varit möjligt. Intressant nog finns det en vikt på bottenplattan som gör att den bärbara datorn från MSI verkar tyngre - möjligen på grund av det stora, fria utrymmet.
Garanti
Den bärbara datorn från MSI levereras med en tvåårig garanti från inköpsdatumet som inkluderar en Pick-Up & Return-tjänst. Tillverkarens garanti gäller dock endast i Tyskland.
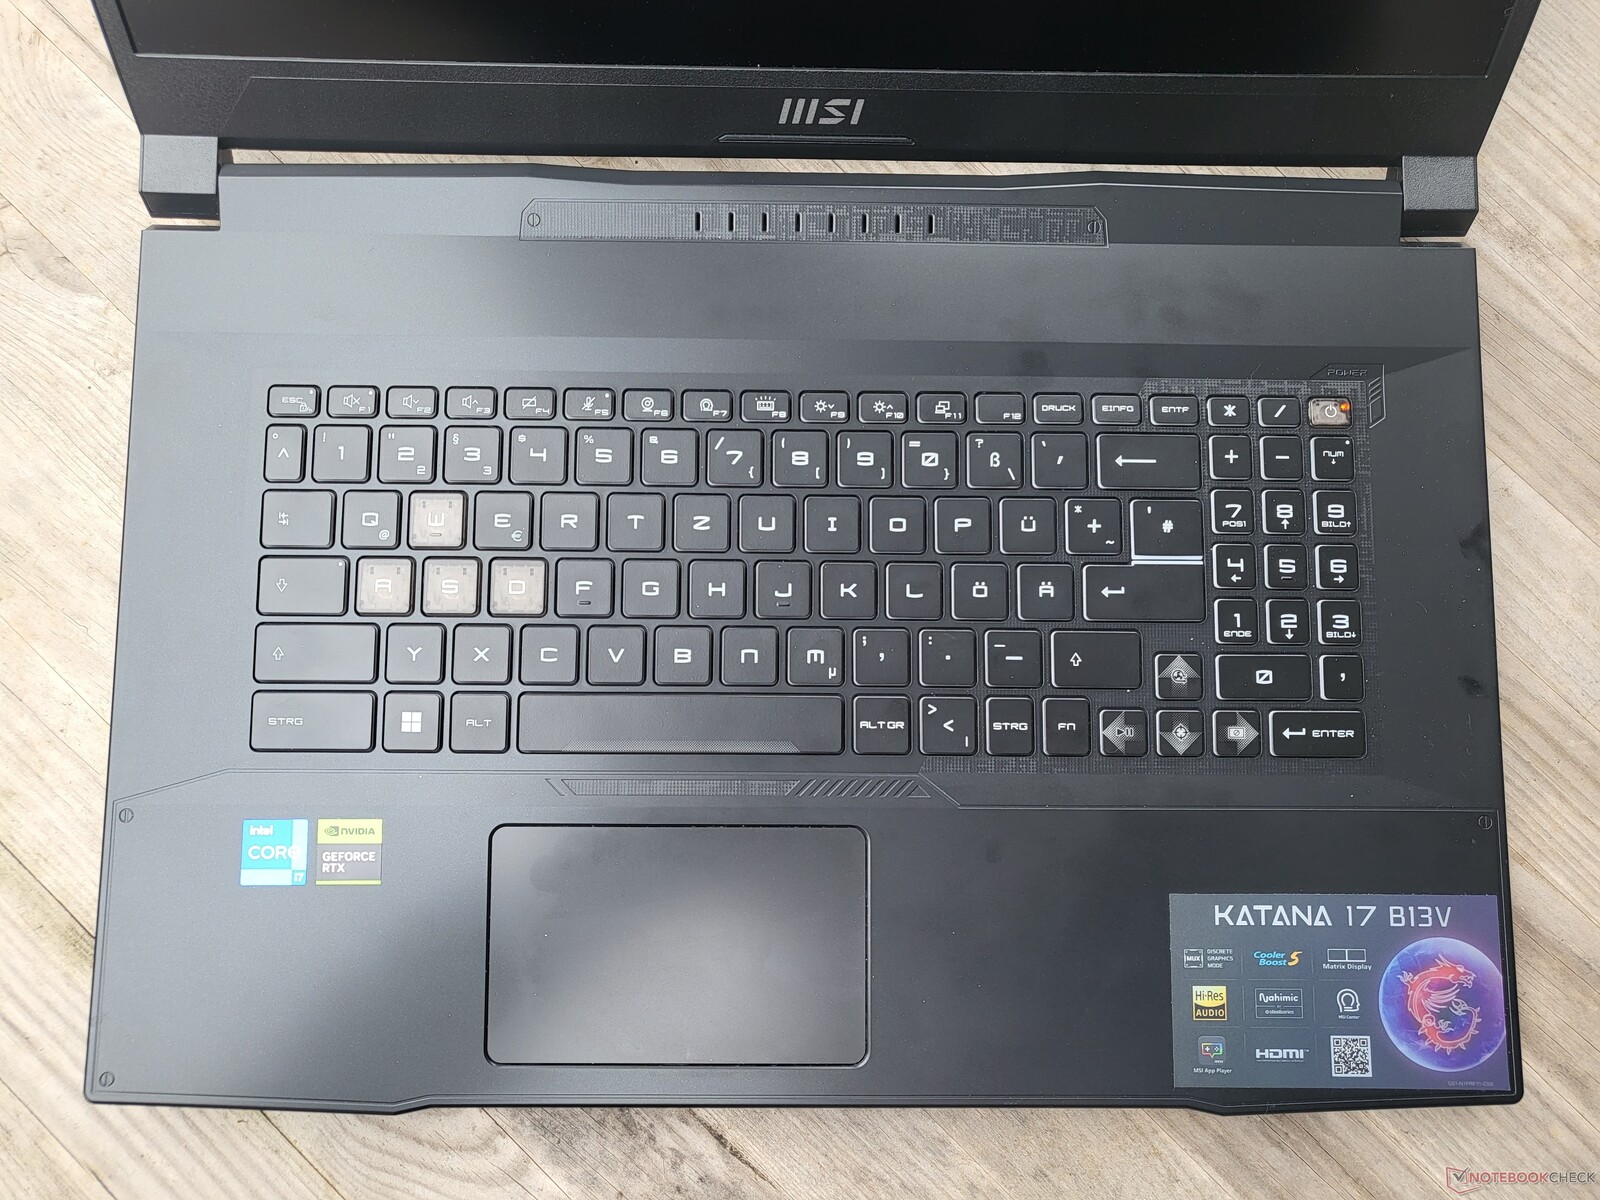
Inmatningsenheter: Bra tangentbord, konstig layout
Tangentbord
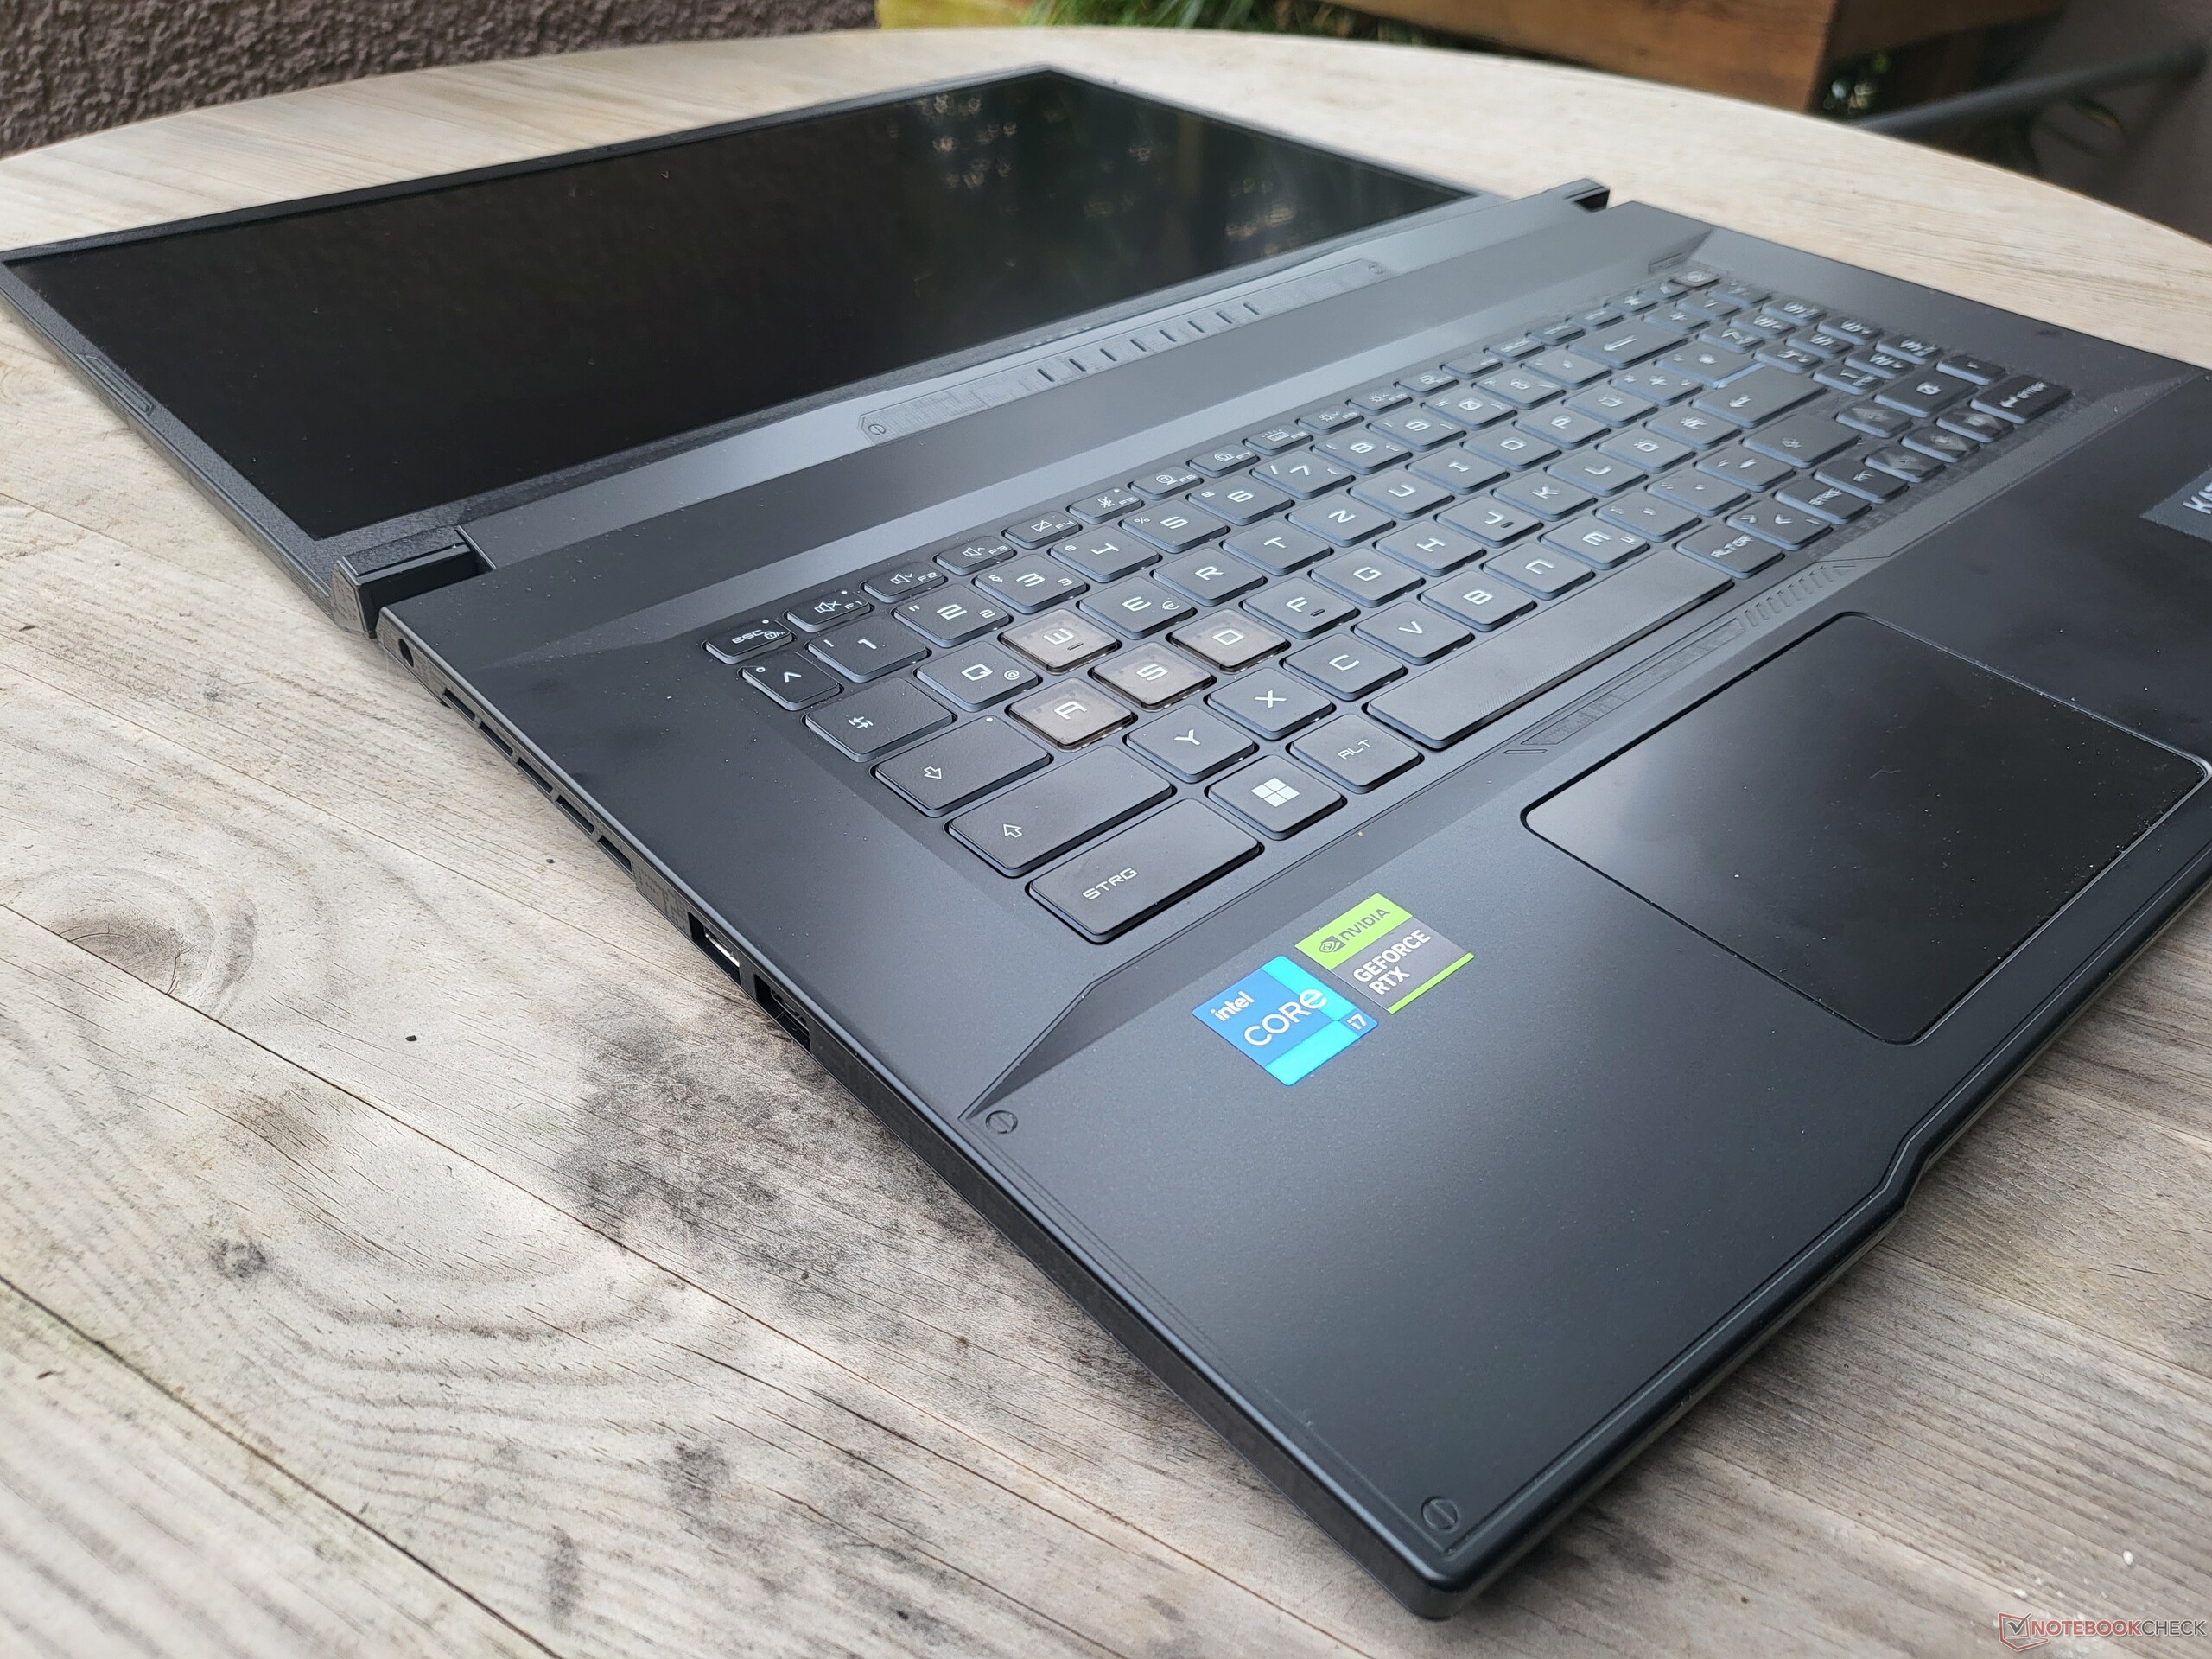
Först och främst de positiva aspekterna: Det chiclet-tangentbordet har RGB-bakgrundsbelysning i flera nivåer (fyra zoner, konfigurerbara) och erbjuder, enligt dagens standard, en mycket generös tangentrörelse på 1,7 mm. MSI har valt ett mycket bra tangentbord för Katana 17 B13V. Skrivupplevelsen är underbar och WASD-tangenternas markering passar bra in i speldesignen - liksom de relativt stora piltangenterna.
Det är dock svårt att förstå varför MSI inte har satsat på ett tangentbord med full bredd. Vissa tangenter är tydligare mindre än normalt, och framför allt den numeriska knappsatsen är pytteliten. Generellt sett står vi här med en mycket ovanlig och besvärlig tangentbordslayout. FN-tangenten befinner sig i en absurd position, den högra shift-tangenten är betydligt mindre, och till råga på allt är det en ANSI-layout med en smal enter-tangent, vilket innebär att #-tangenten är förskjuten. Inget problem för världsmarknaden men mycket ovanligt här i Tyskland.
Pekplatta
MSI Katana 17:s pekplatta mäter 10,5 x 6,5 cm, vilket är för litet enligt dagens standard och även i förhållande till enhetens storlek. För vår smak skulle plastytan kunna vara lite slätare och känns inte heller särskilt premium. Detta gäller åtminstone inte klickmekanismen: Klickplattan ger ett jämnt klick och en högkvalitativ känsla. Det finns inte mycket att klaga på när det gäller mjukvaruimplementeringen, och i det avseendet är det den typiska typen av pekplatta som finns i moderna bärbara Windows-datorer.
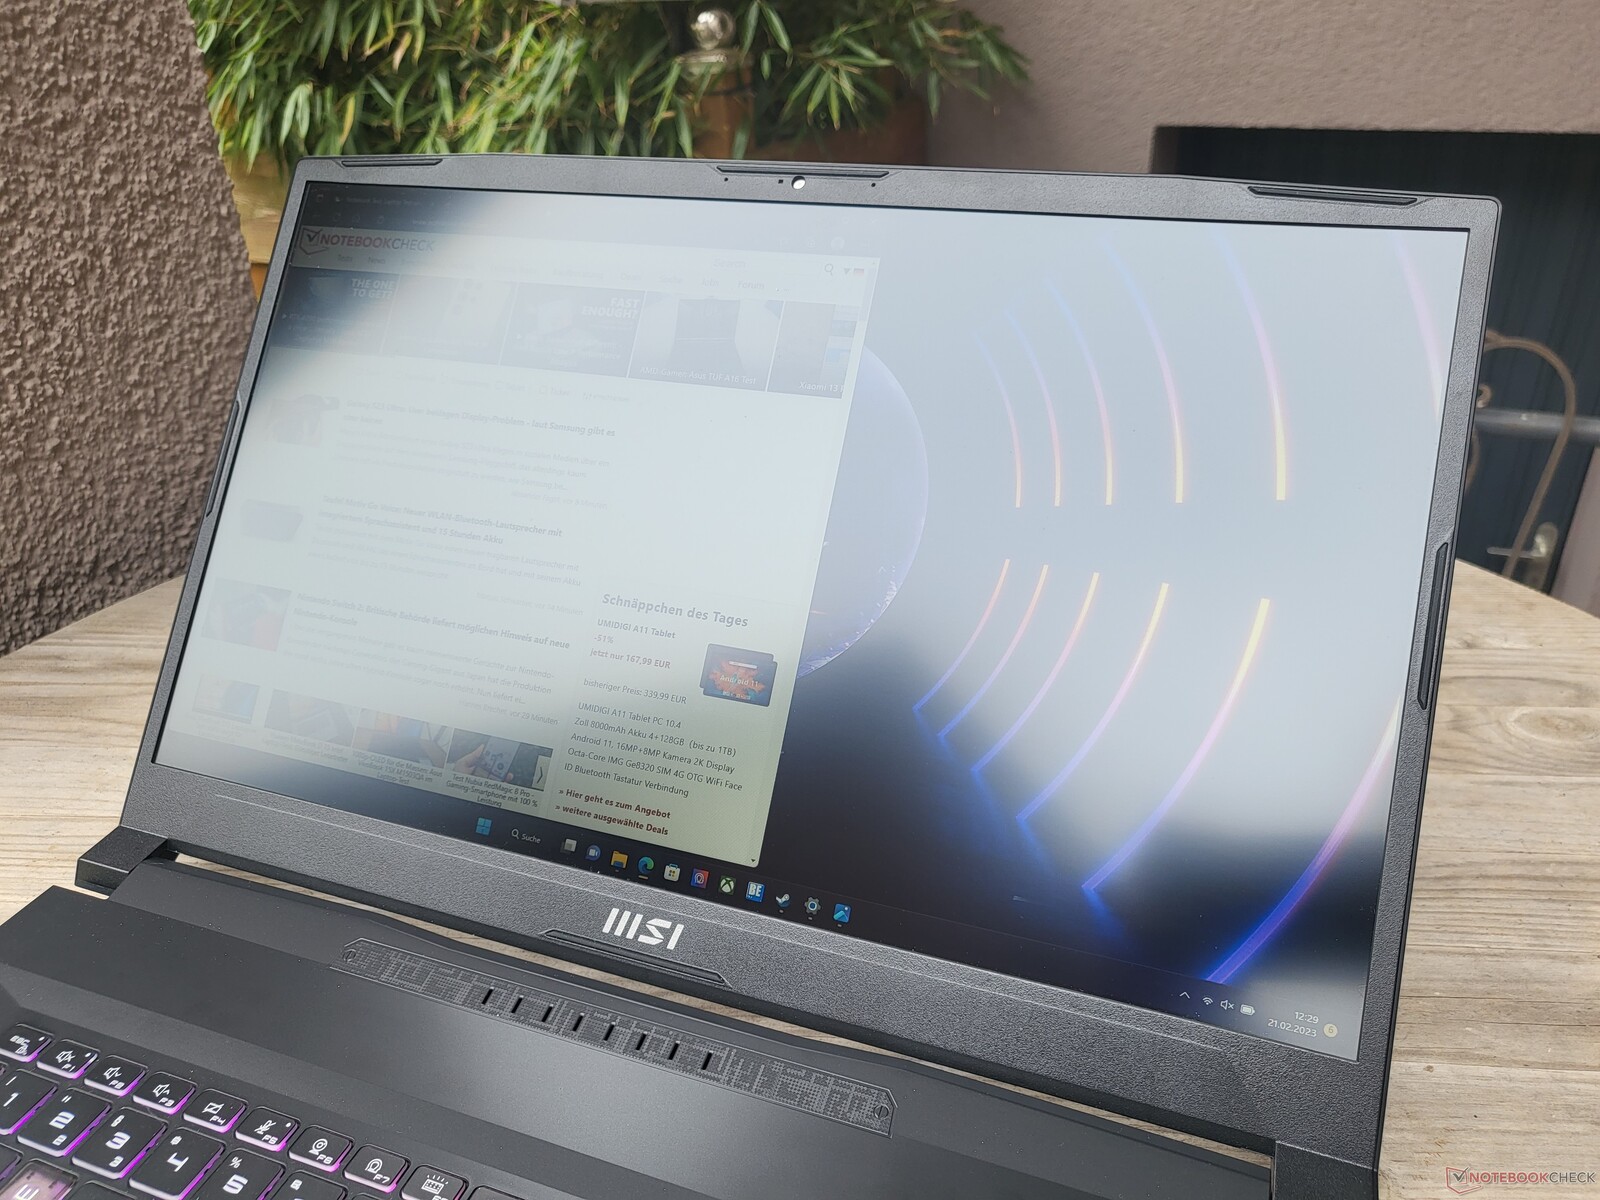
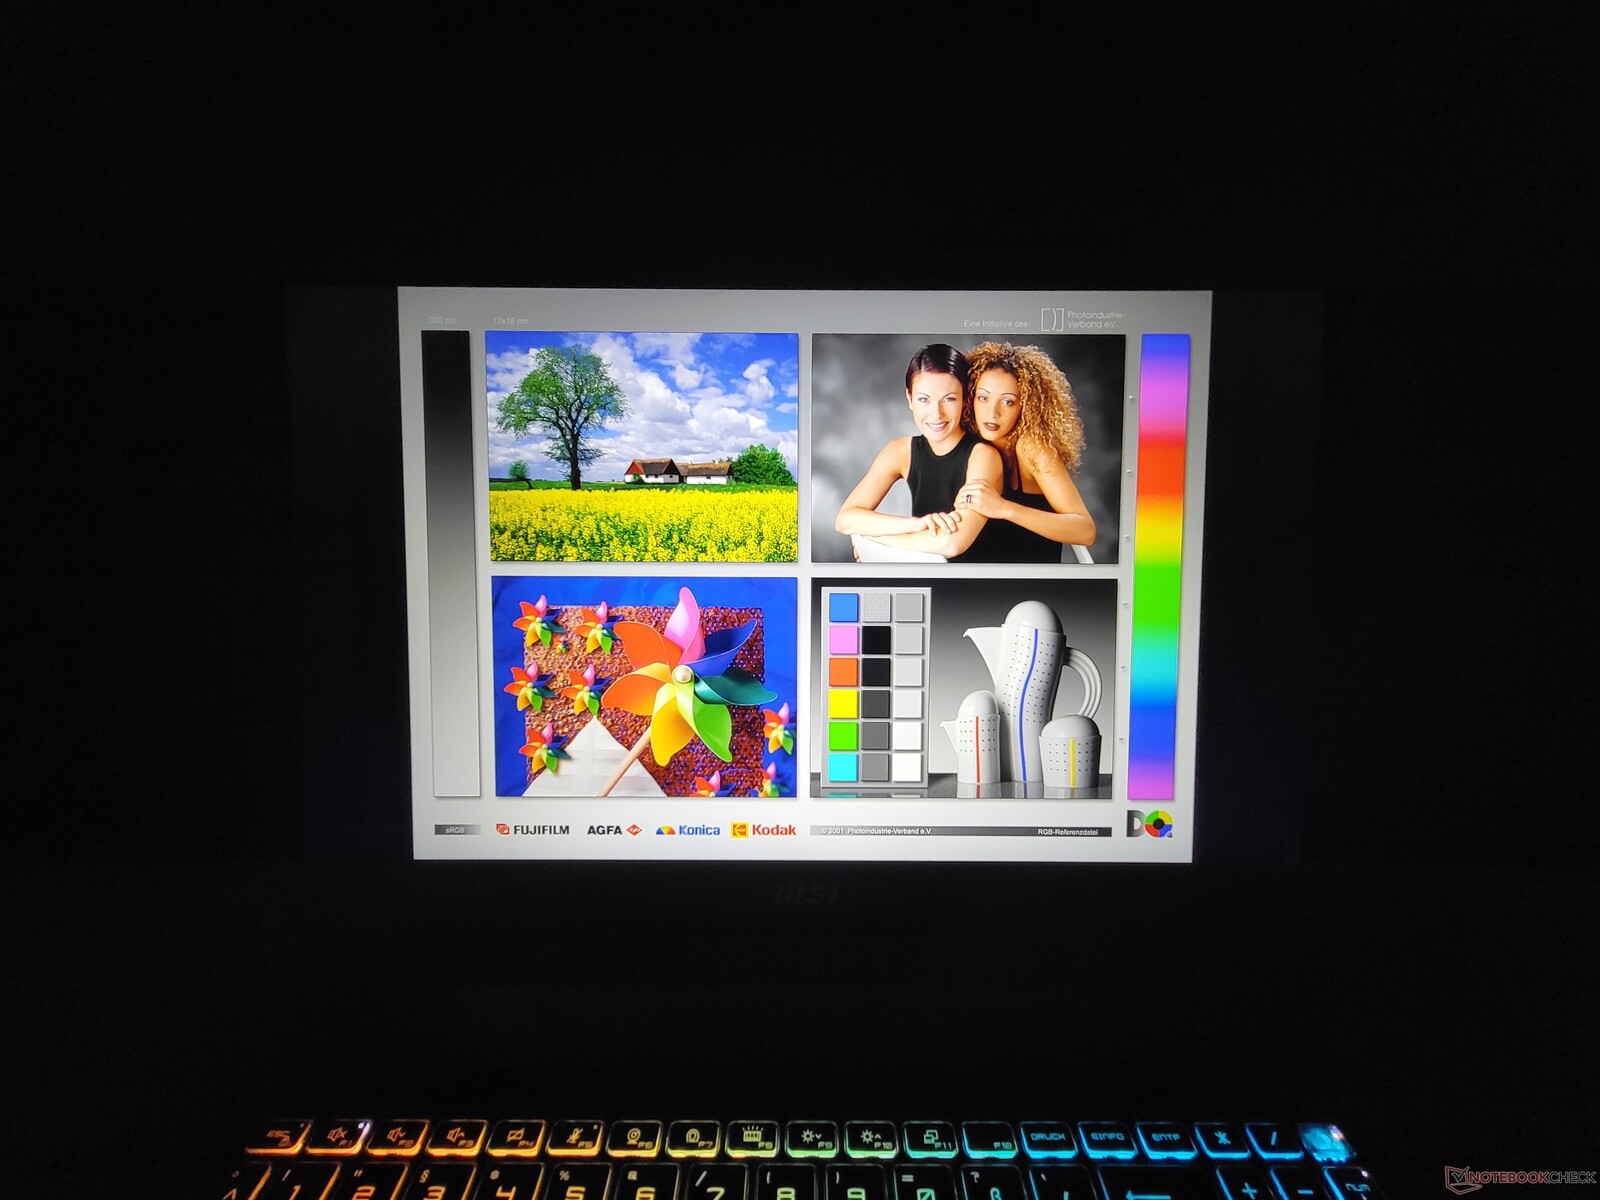
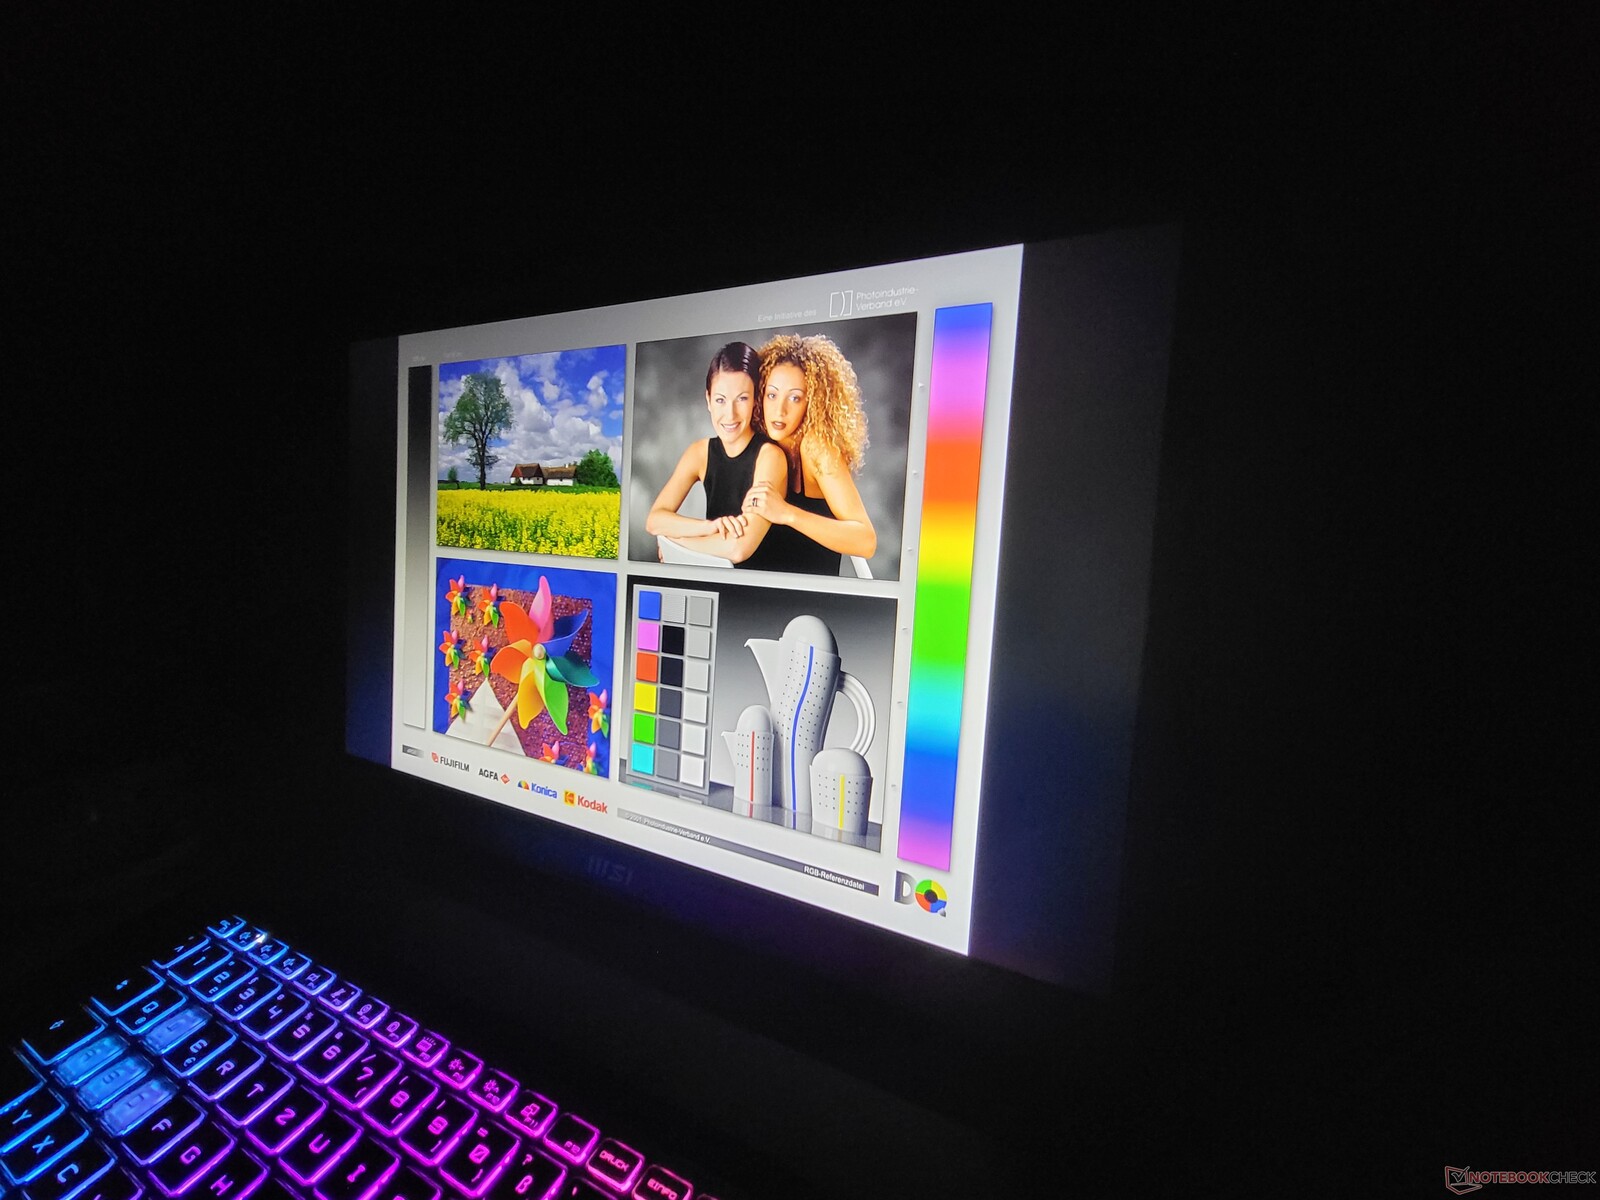
MSI Katana 17:s skärm är dess svagaste länk
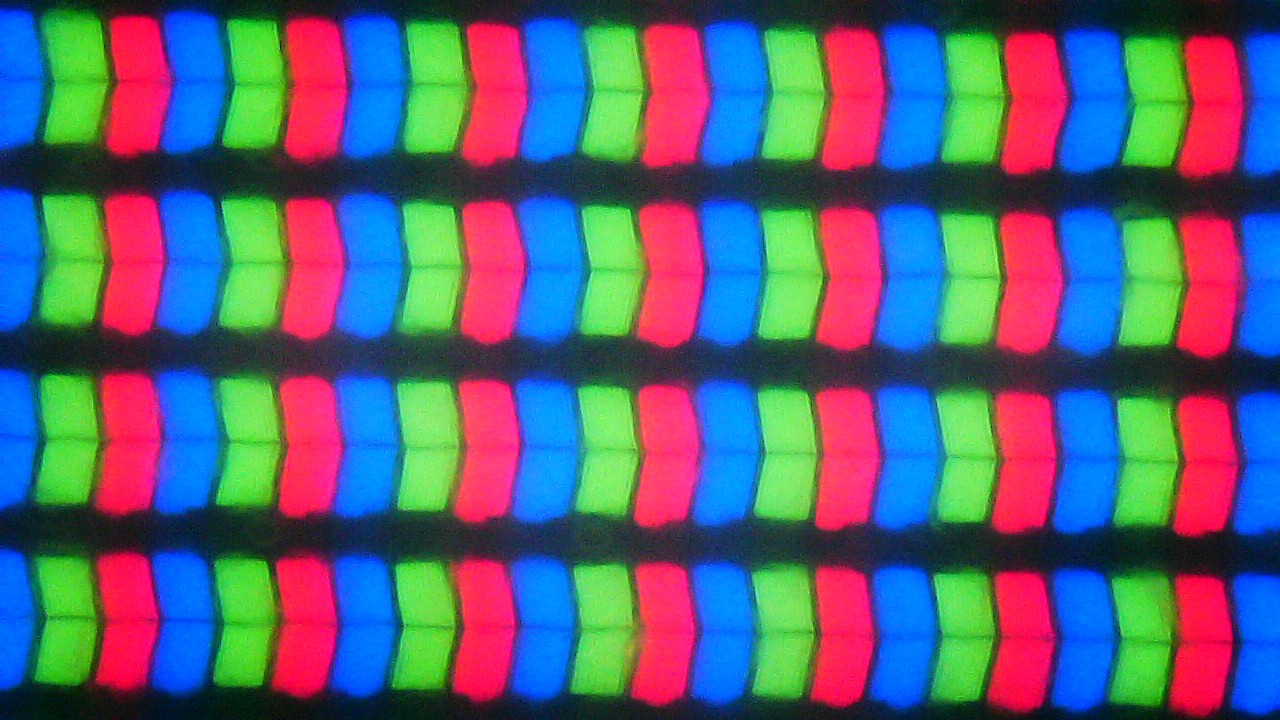
För Katana 17 B13V erbjuder MSI endast ett skärmalternativ och det är en 17,3-tums matt IPS LCD-skärm i 16:9-format. Den enda tillgängliga upplösningen är 1920 x 1080, med andra ord FullHD. Det är en relativt låg upplösning för en bildskärm av den här storleken - även om det åtminstone är en 144 Hz-skärm.
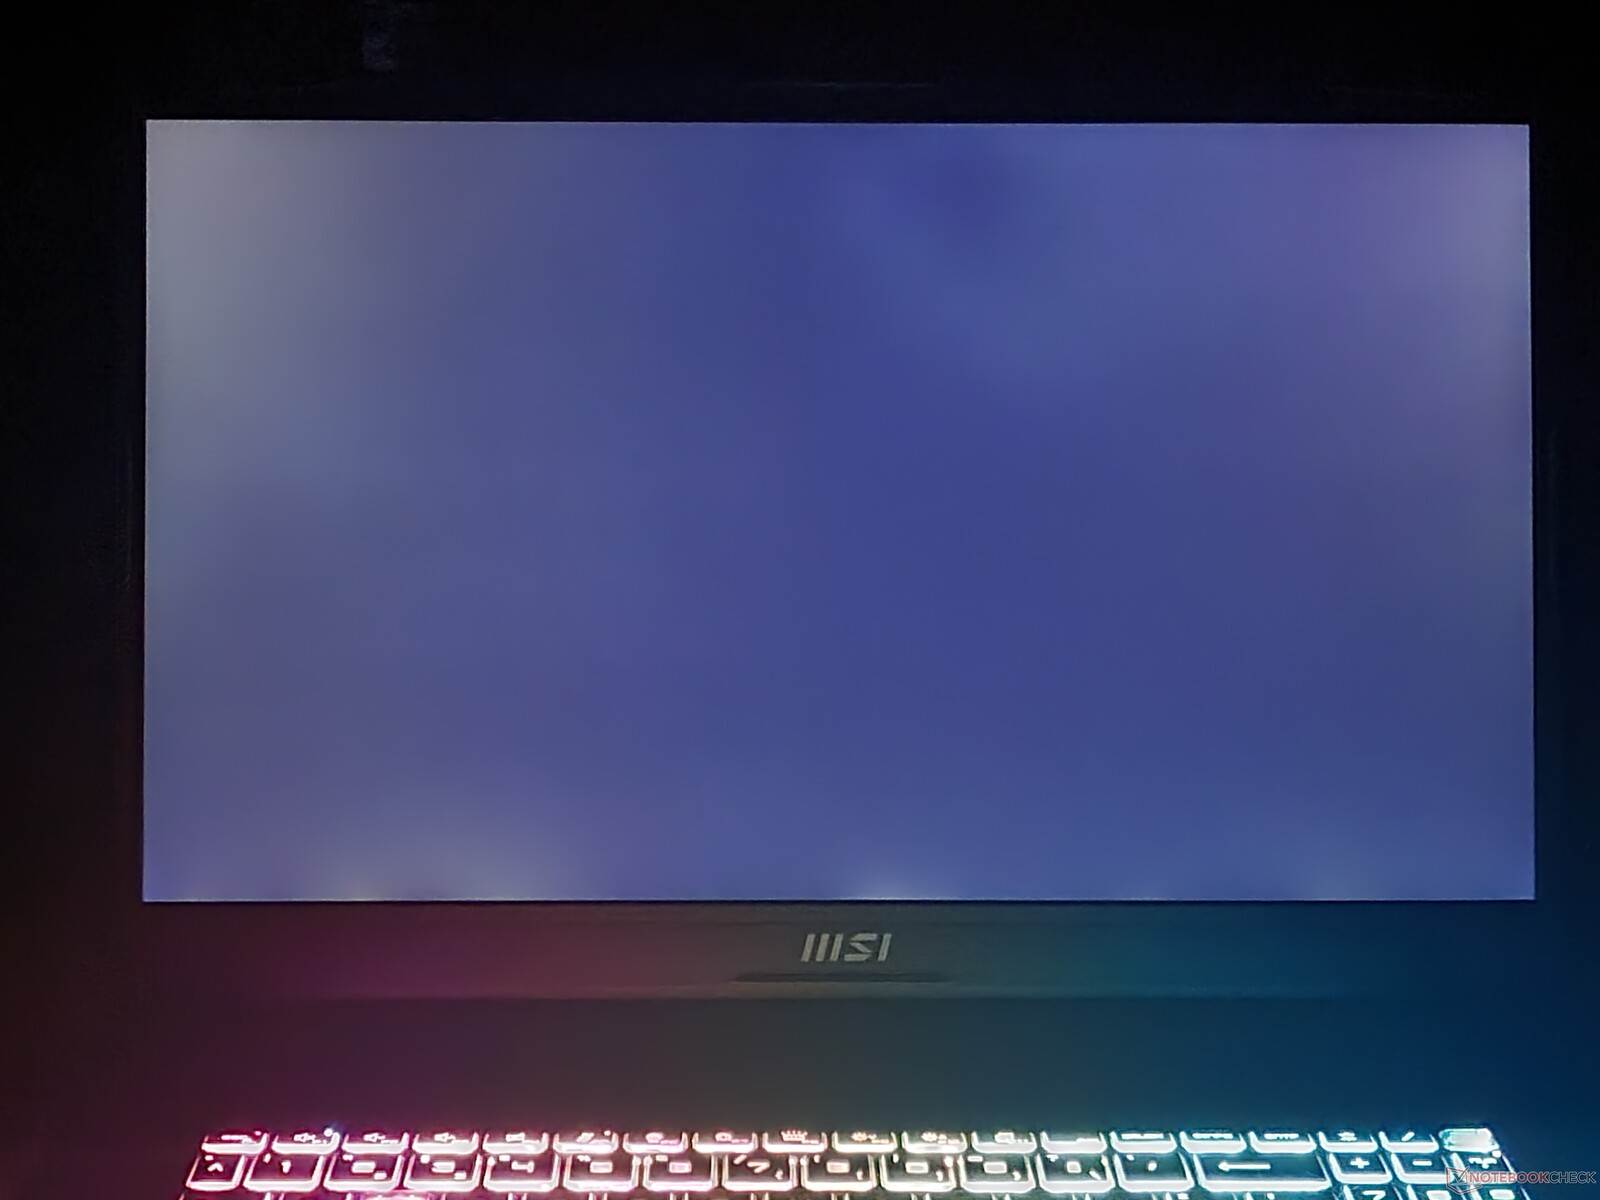
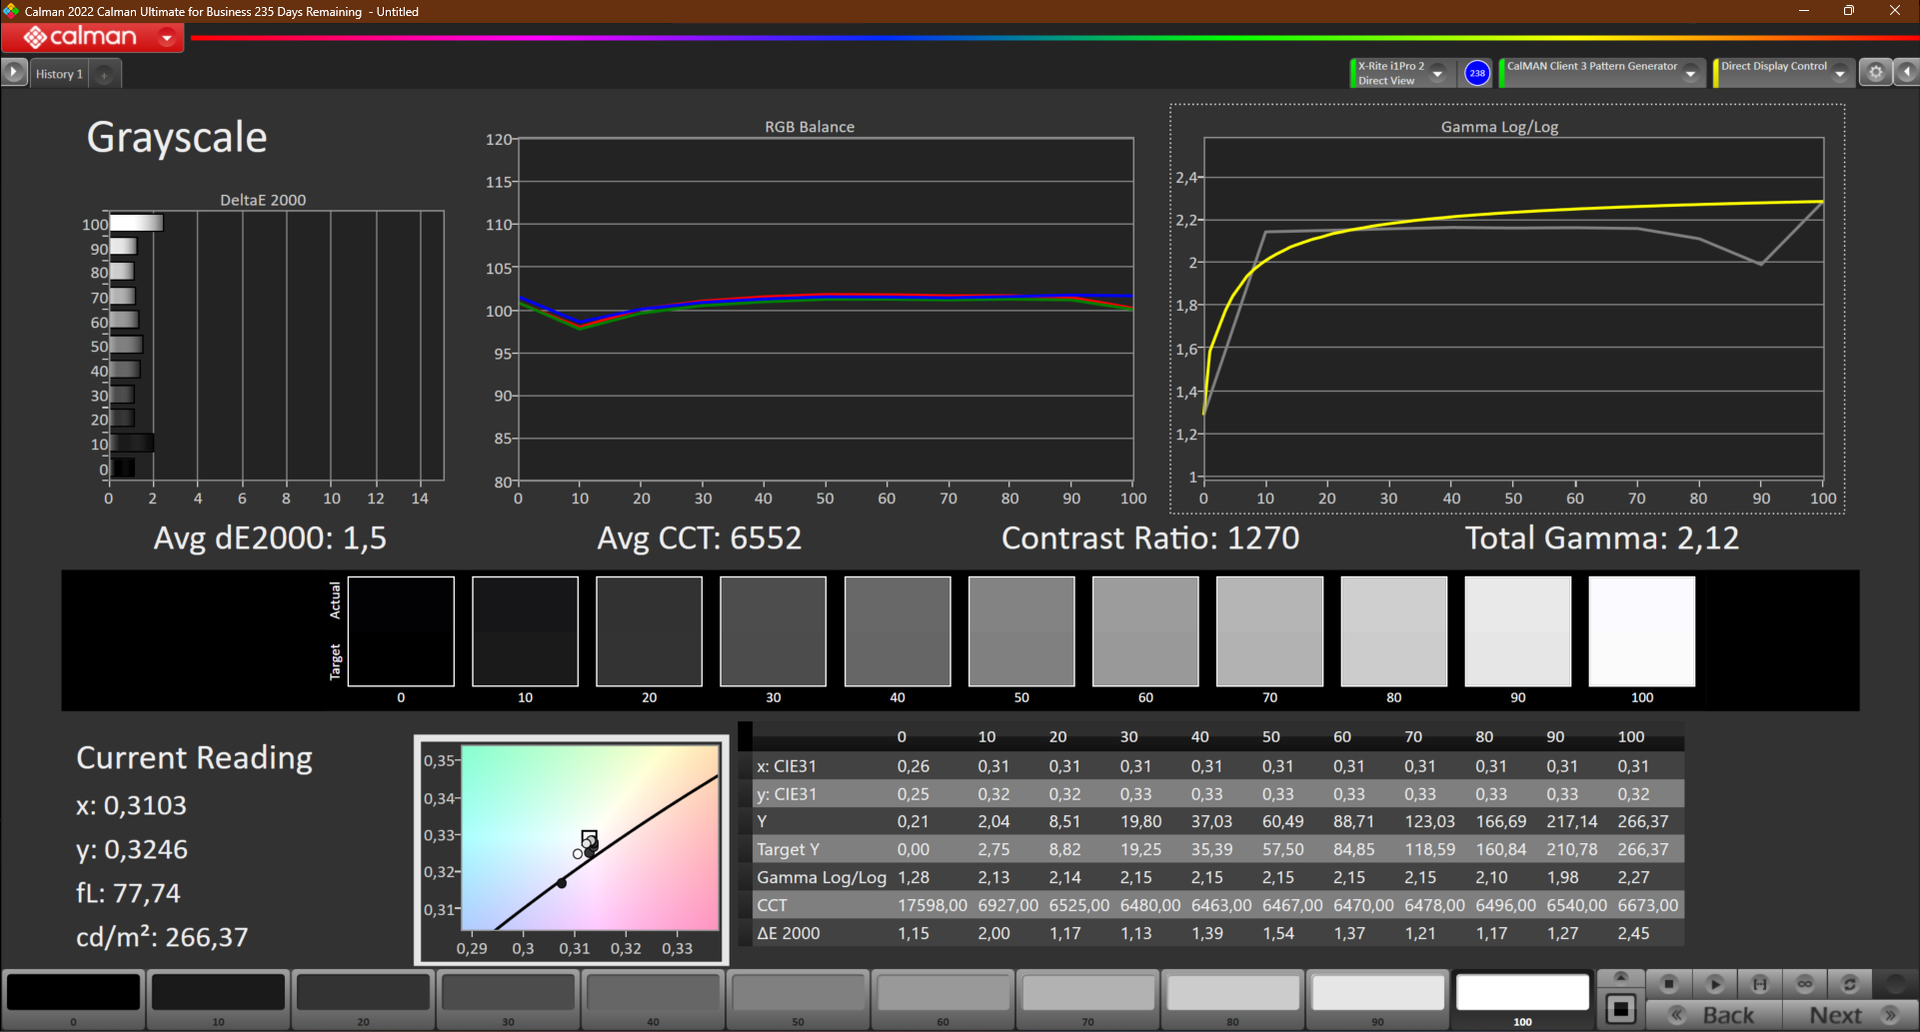
Tyvärr lämnar kvaliteten på AUO:s panel en hel del att önska. Med cirka 256 cd/m² ligger skärmens ljusstyrka efter konkurrenterna. Svarstiderna är också dåliga för en bärbar dator för spel.
| |||||||||||||||||||||||||
Distribution av ljusstyrkan: 93 %
Mitt på batteriet: 267 cd/m²
Kontrast: 1271:1 (Svärta: 0.21 cd/m²)
ΔE ColorChecker Calman: 4.7 | ∀{0.5-29.43 Ø4.71}
calibrated: 4.5
ΔE Greyscale Calman: 1.5 | ∀{0.09-98 Ø4.96}
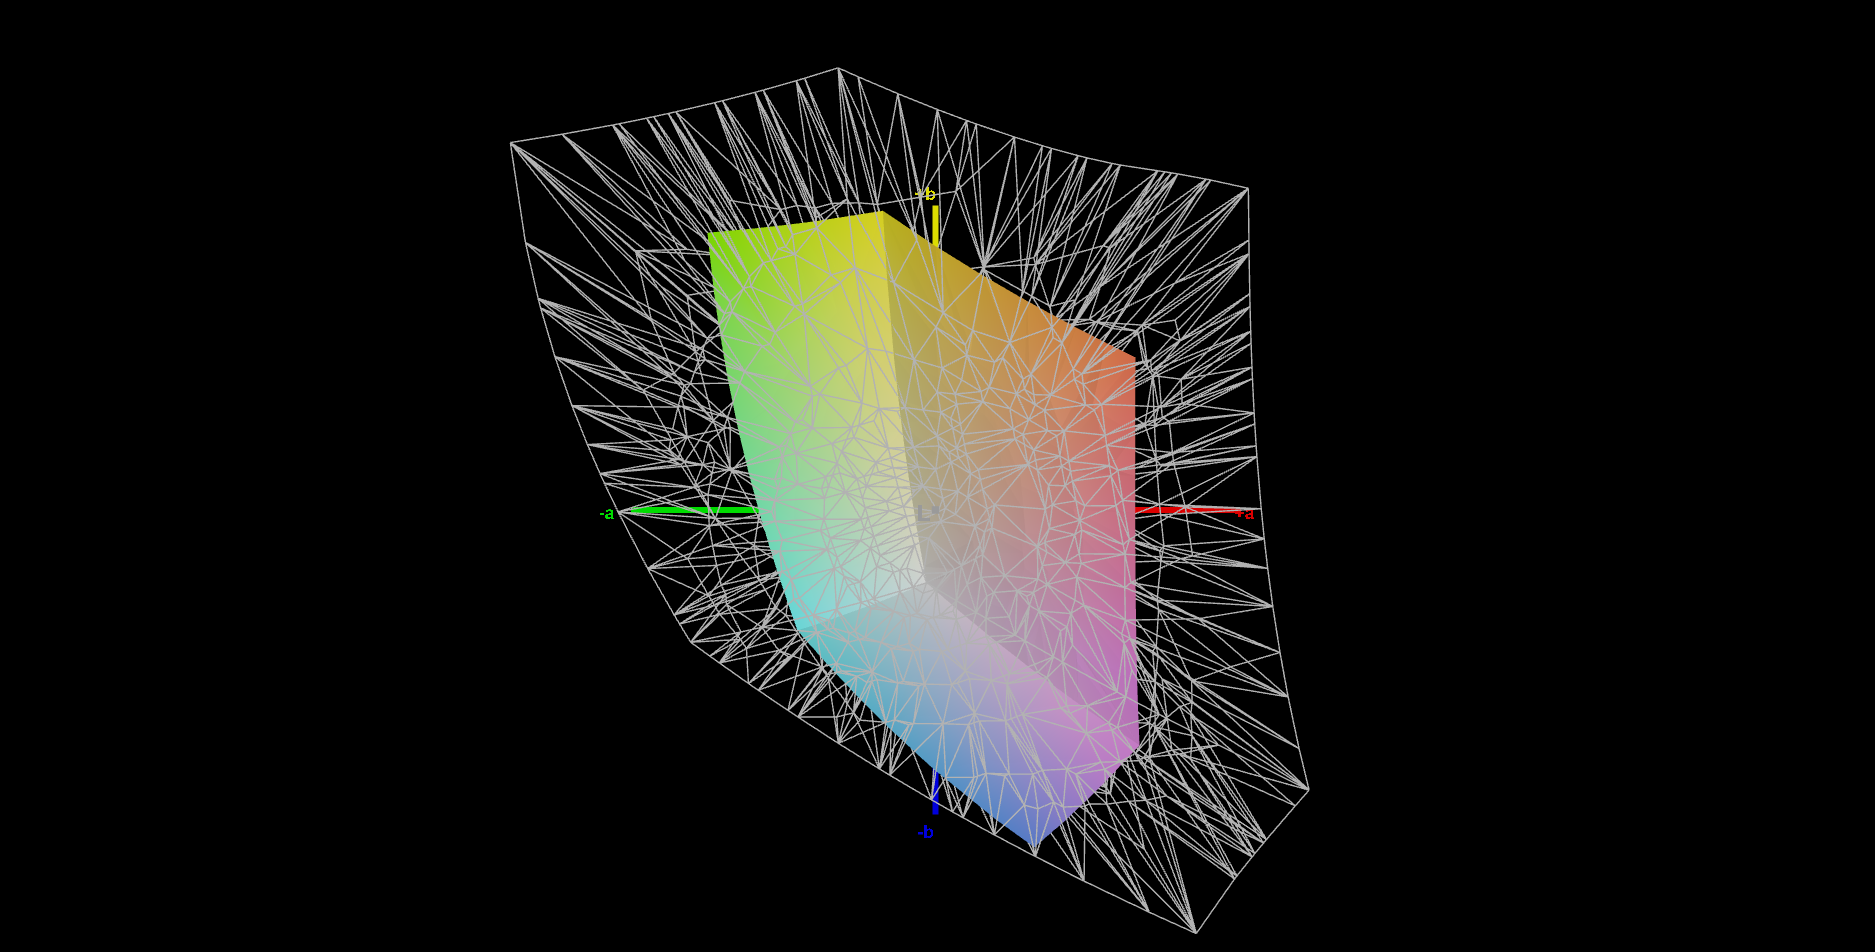
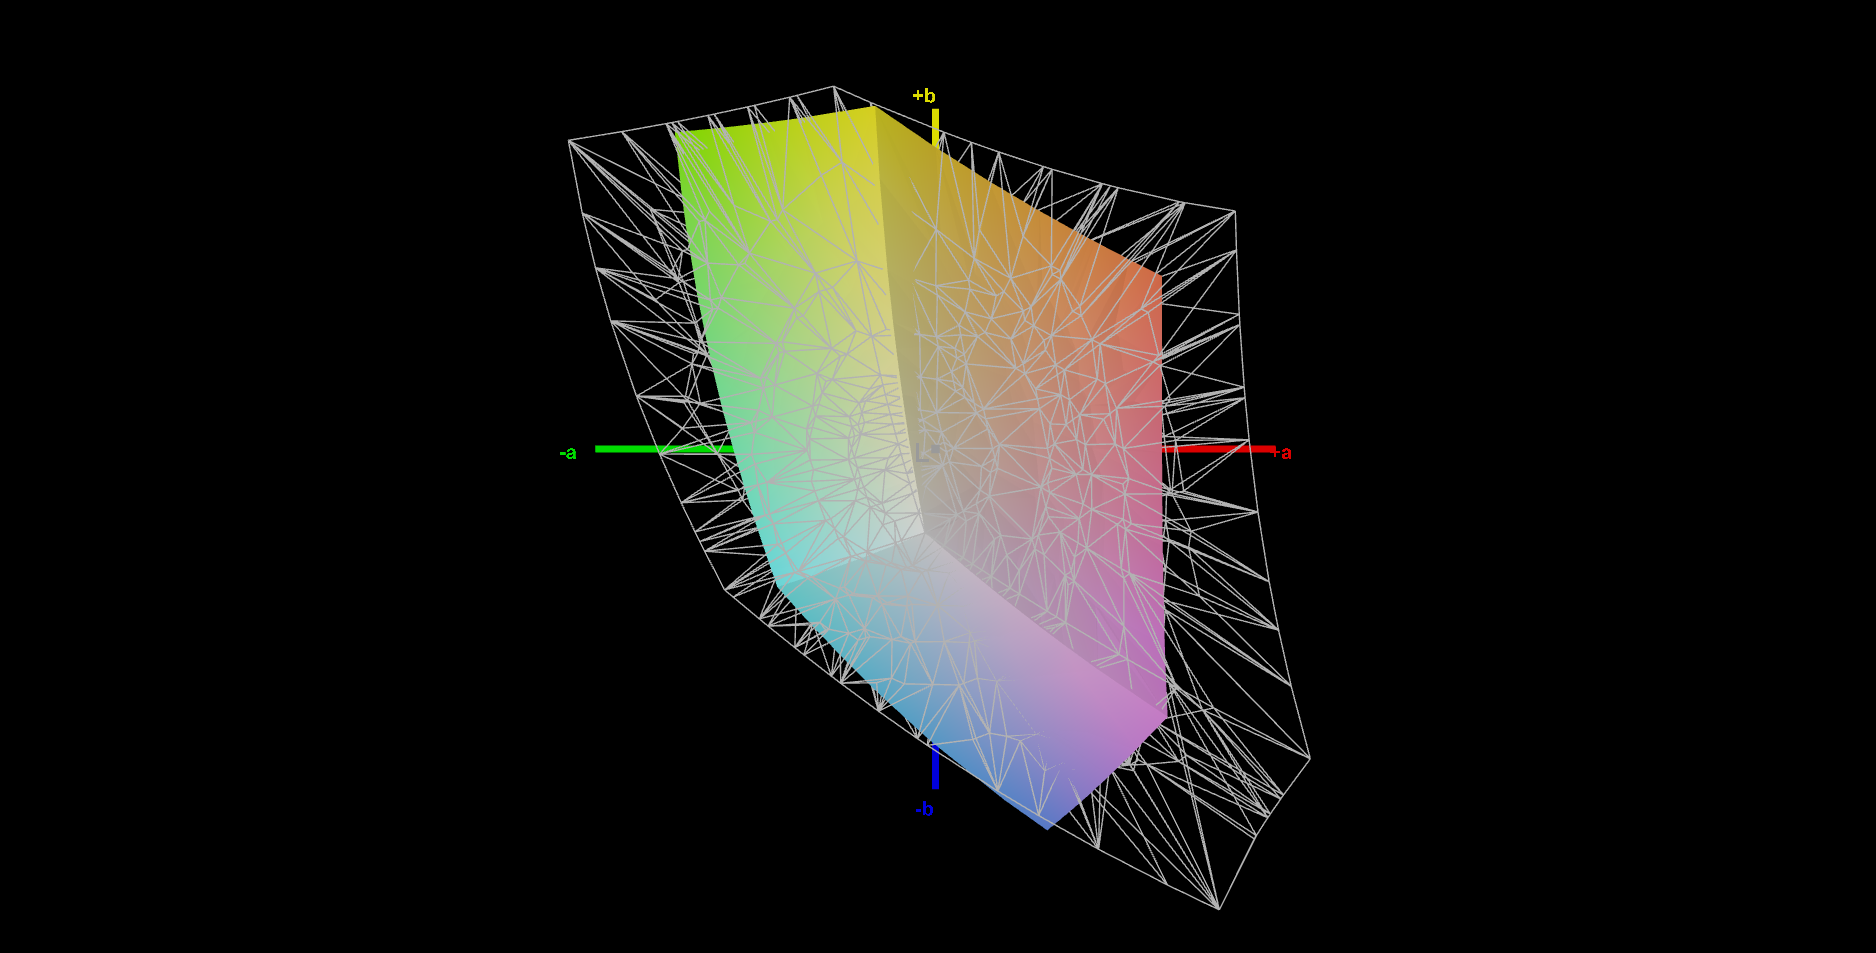
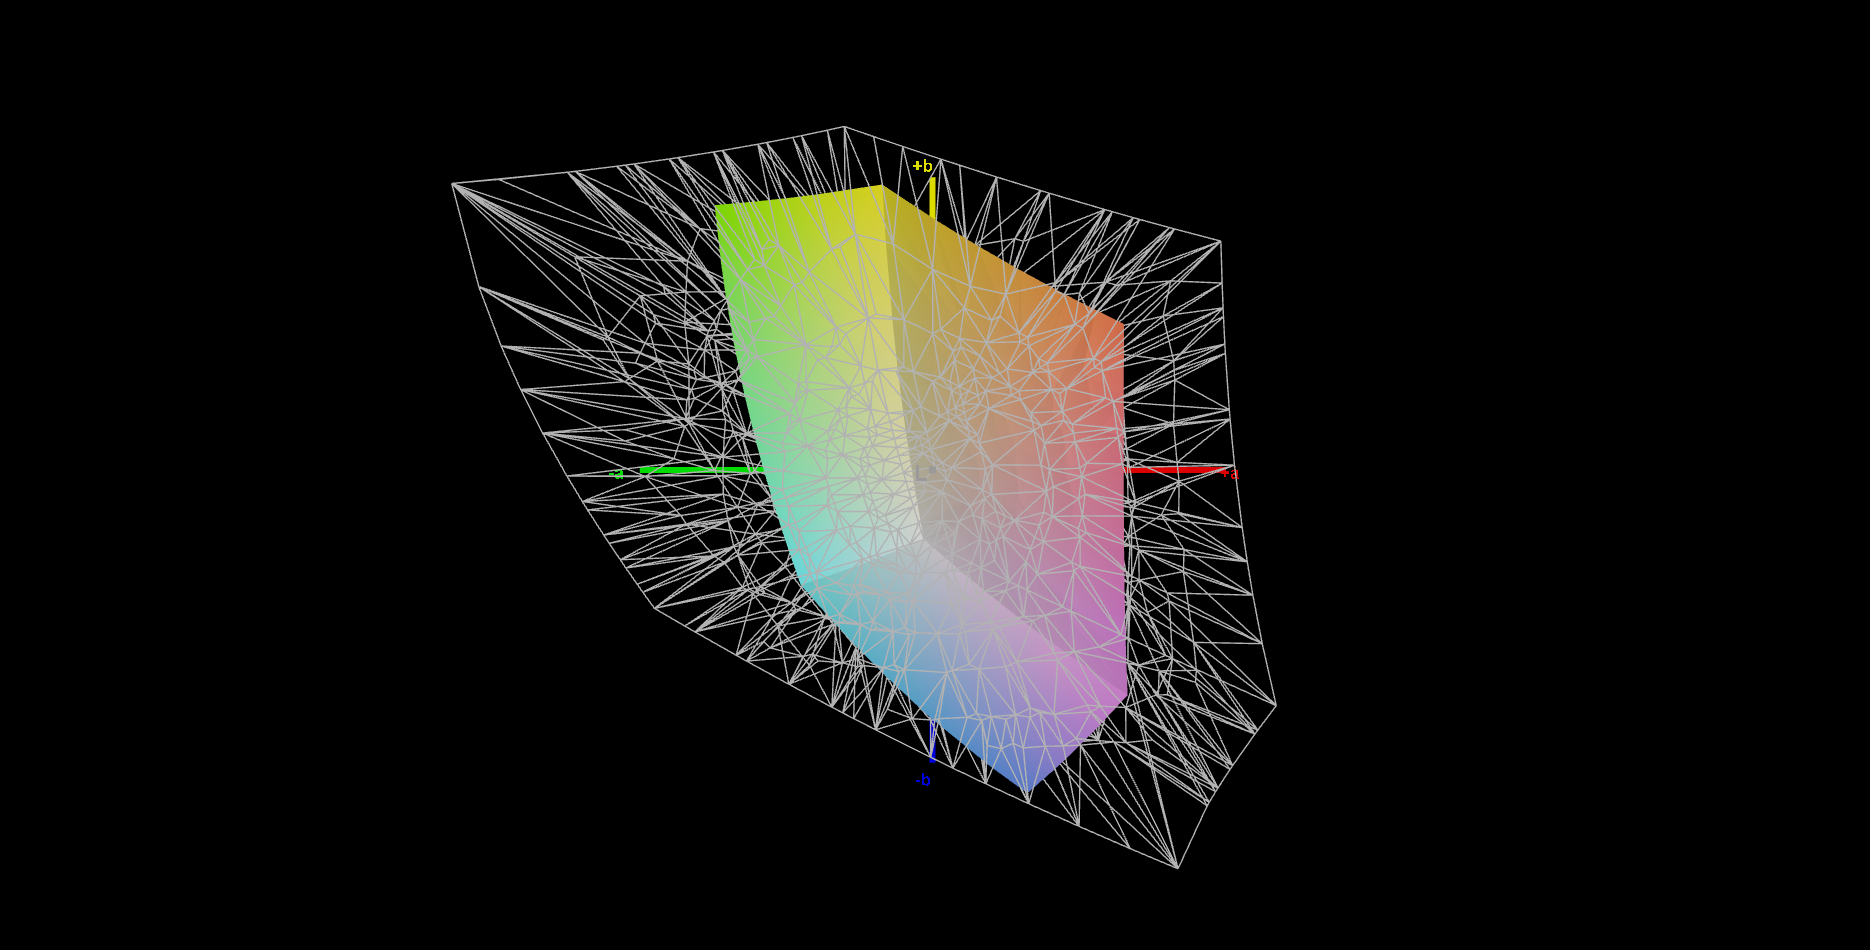
42.2% AdobeRGB 1998 (Argyll 3D)
61% sRGB (Argyll 3D)
40.8% Display P3 (Argyll 3D)
Gamma: 2.12
CCT: 6552 K
| MSI Katana 17 B13VFK B173HAN04.9, IPS LED, 1920x1080, 17.3" | MSI Titan GT77 HX 13VI B173ZAN06.C, Mini-LED, 3840x2160, 17.3" | MSI Pulse GL76 12UGK Sharp LQ173M1JW08, IPS, 1920x1080, 17.3" | Gigabyte G7 KE AU Optronics B173HAN05.1, IPS, 1920x1080, 17.3" | Asus ROG Strix Scar 17 SE G733CX-LL014W NE173QHM-NZ2, IPS, 2560x1440, 17.3" | Acer Predator Helios 300 (i7-12700H, RTX 3070 Ti) BOE0A1A, IPS, 2560x1440, 17.3" | |
|---|---|---|---|---|---|---|
| Display | 105% | 72% | 69% | 101% | 101% | |
| Display P3 Coverage (%) | 40.8 | 94.9 133% | 71.9 76% | 70.4 73% | 97.1 138% | 96.8 137% |
| sRGB Coverage (%) | 61 | 99.9 64% | 99.9 64% | 99.8 64% | 99.9 64% | 99.9 64% |
| AdobeRGB 1998 Coverage (%) | 42.2 | 92.4 119% | 73.7 75% | 71.7 70% | 84.8 101% | 84.8 101% |
| Response Times | -9% | 72% | 77% | 72% | 54% | |
| Response Time Grey 50% / Grey 80% * (ms) | 33 ? | 38.4 ? -16% | 4.6 ? 86% | 5 ? 85% | 5.7 ? 83% | 16.4 ? 50% |
| Response Time Black / White * (ms) | 26 ? | 26.6 ? -2% | 11.2 ? 57% | 8.3 ? 68% | 10.1 ? 61% | 11.2 ? 57% |
| PWM Frequency (Hz) | 2380 ? | |||||
| Screen | 52982% | -21% | 27% | 21% | 4% | |
| Brightness middle (cd/m²) | 267 | 606 127% | 337.7 26% | 307 15% | 320 20% | 366 37% |
| Brightness (cd/m²) | 256 | 602 135% | 331 29% | 301 18% | 303 18% | 340 33% |
| Brightness Distribution (%) | 93 | 93 0% | 82 -12% | 93 0% | 87 -6% | 85 -9% |
| Black Level * (cd/m²) | 0.21 | 0.0001 100% | 0.31 -48% | 0.2 5% | 0.3 -43% | 0.31 -48% |
| Contrast (:1) | 1271 | 6060000 476690% | 1089 -14% | 1535 21% | 1067 -16% | 1181 -7% |
| Colorchecker dE 2000 * | 4.7 | 4.8 -2% | 4.12 12% | 1.32 72% | 1.1 77% | 3.56 24% |
| Colorchecker dE 2000 max. * | 20.4 | 8.2 60% | 8.89 56% | 4.6 77% | 2.7 87% | 5.66 72% |
| Colorchecker dE 2000 calibrated * | 4.5 | 1.8 60% | 0.98 78% | 1.03 77% | 3.31 26% | |
| Greyscale dE 2000 * | 1.5 | 6.5 -333% | 6.3 -320% | 2.1 -40% | 1.1 27% | 2.84 -89% |
| Gamma | 2.12 104% | 2.63 84% | 2.48 89% | 2.247 98% | 2.13 103% | 2.29 96% |
| CCT | 6552 99% | 6596 99% | 6542 99% | 6815 95% | 6599 98% | 6835 95% |
| Totalt genomsnitt (program/inställningar) | 17693% /
34081% | 41% /
12% | 58% /
43% | 65% /
47% | 53% /
32% |
* ... mindre är bättre
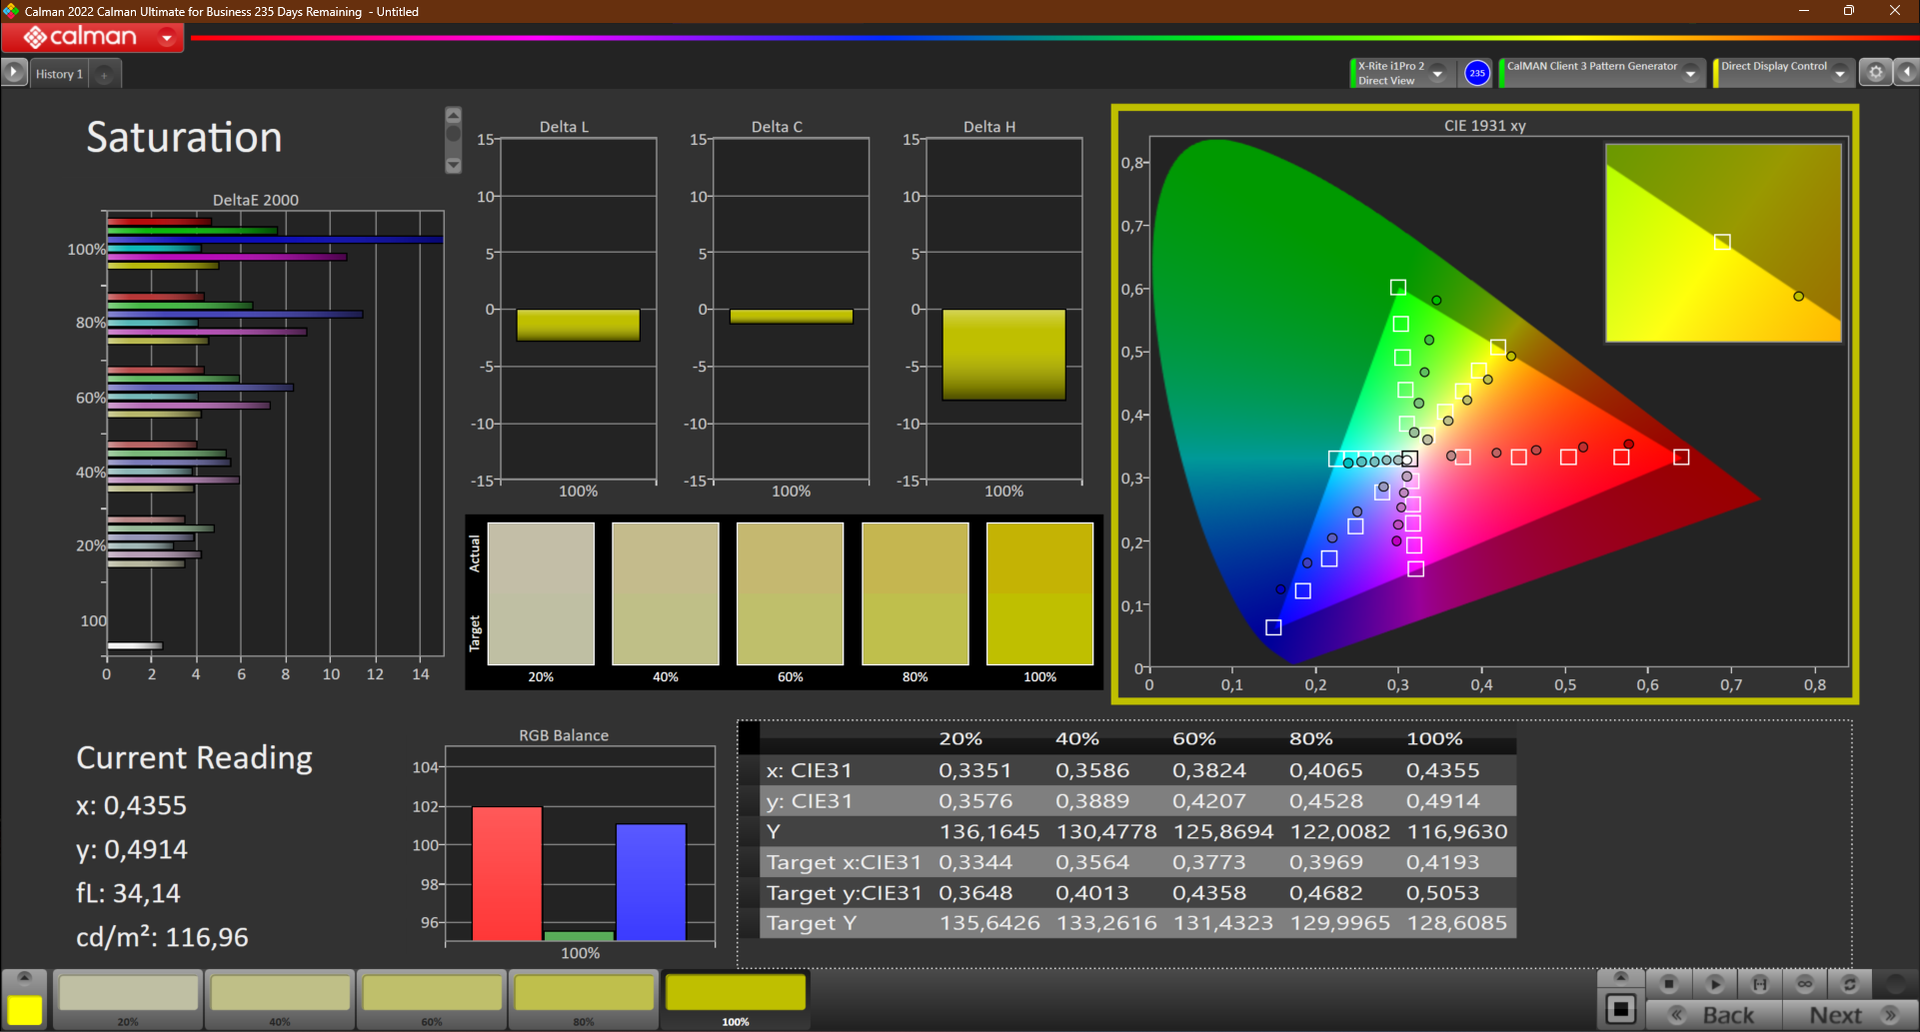
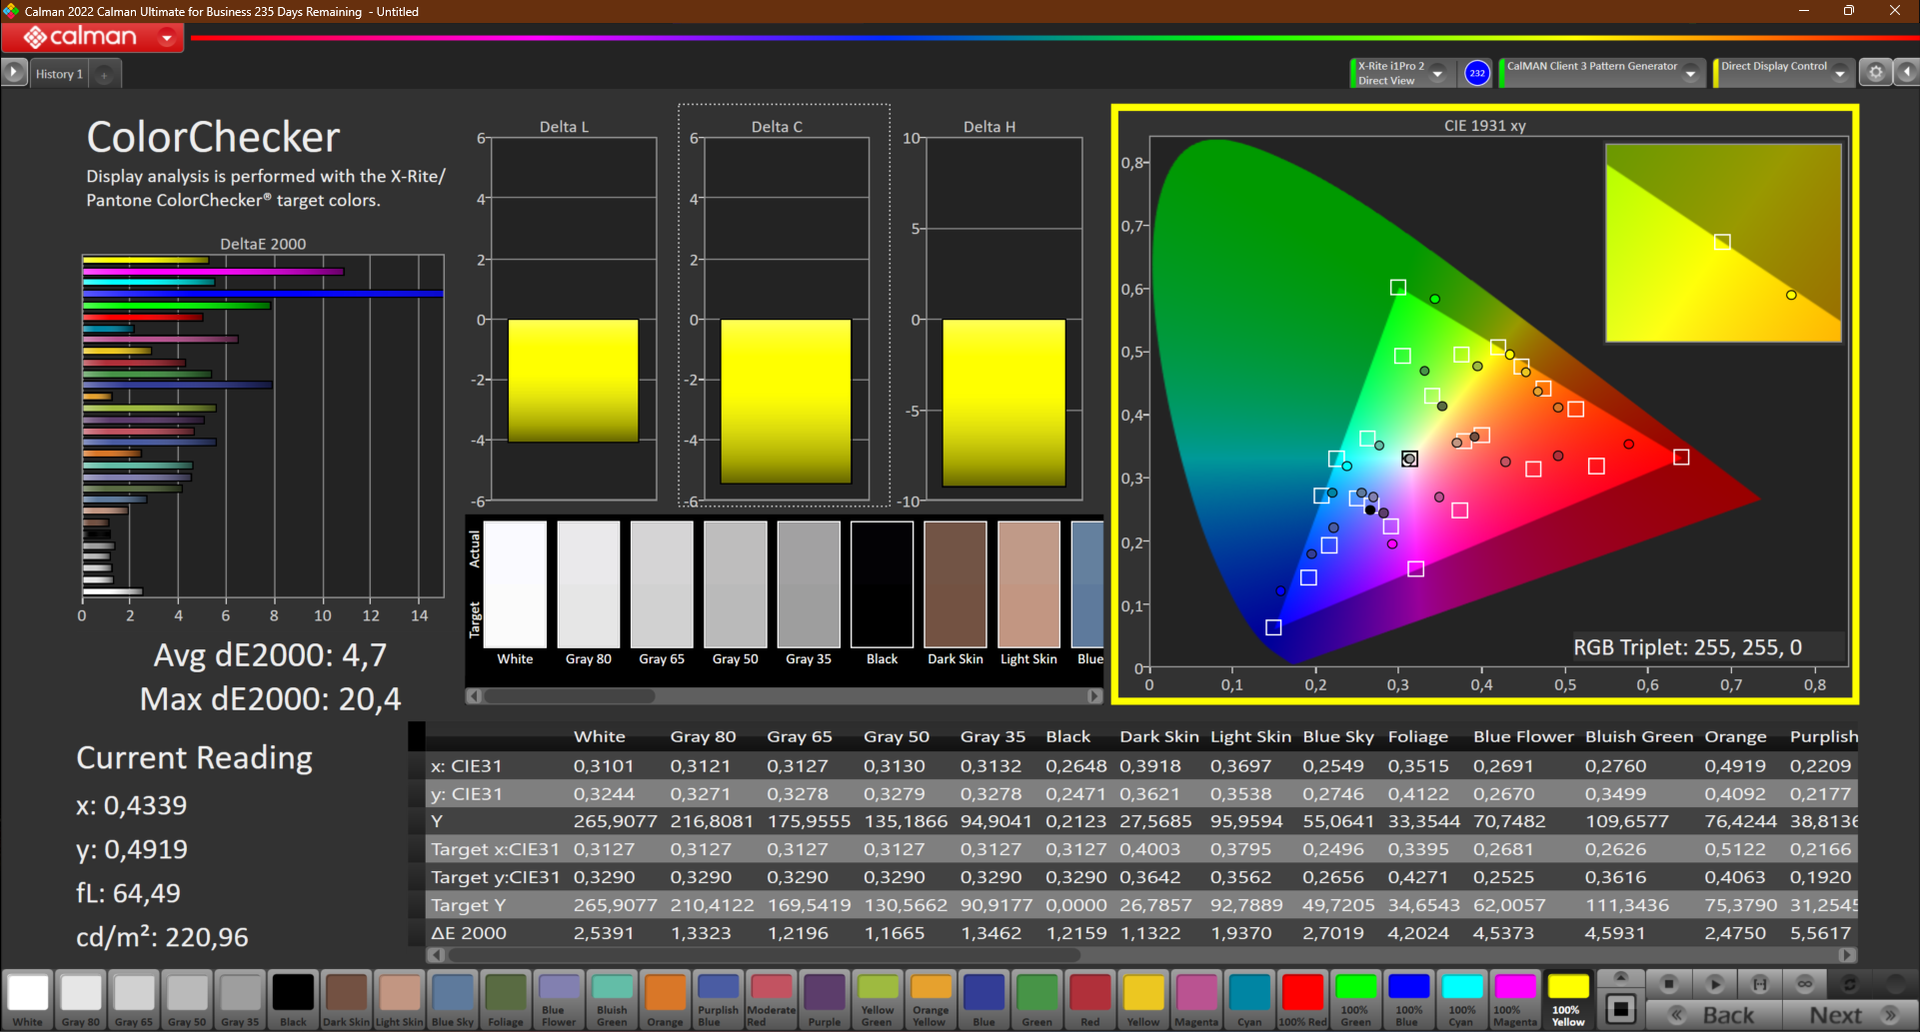
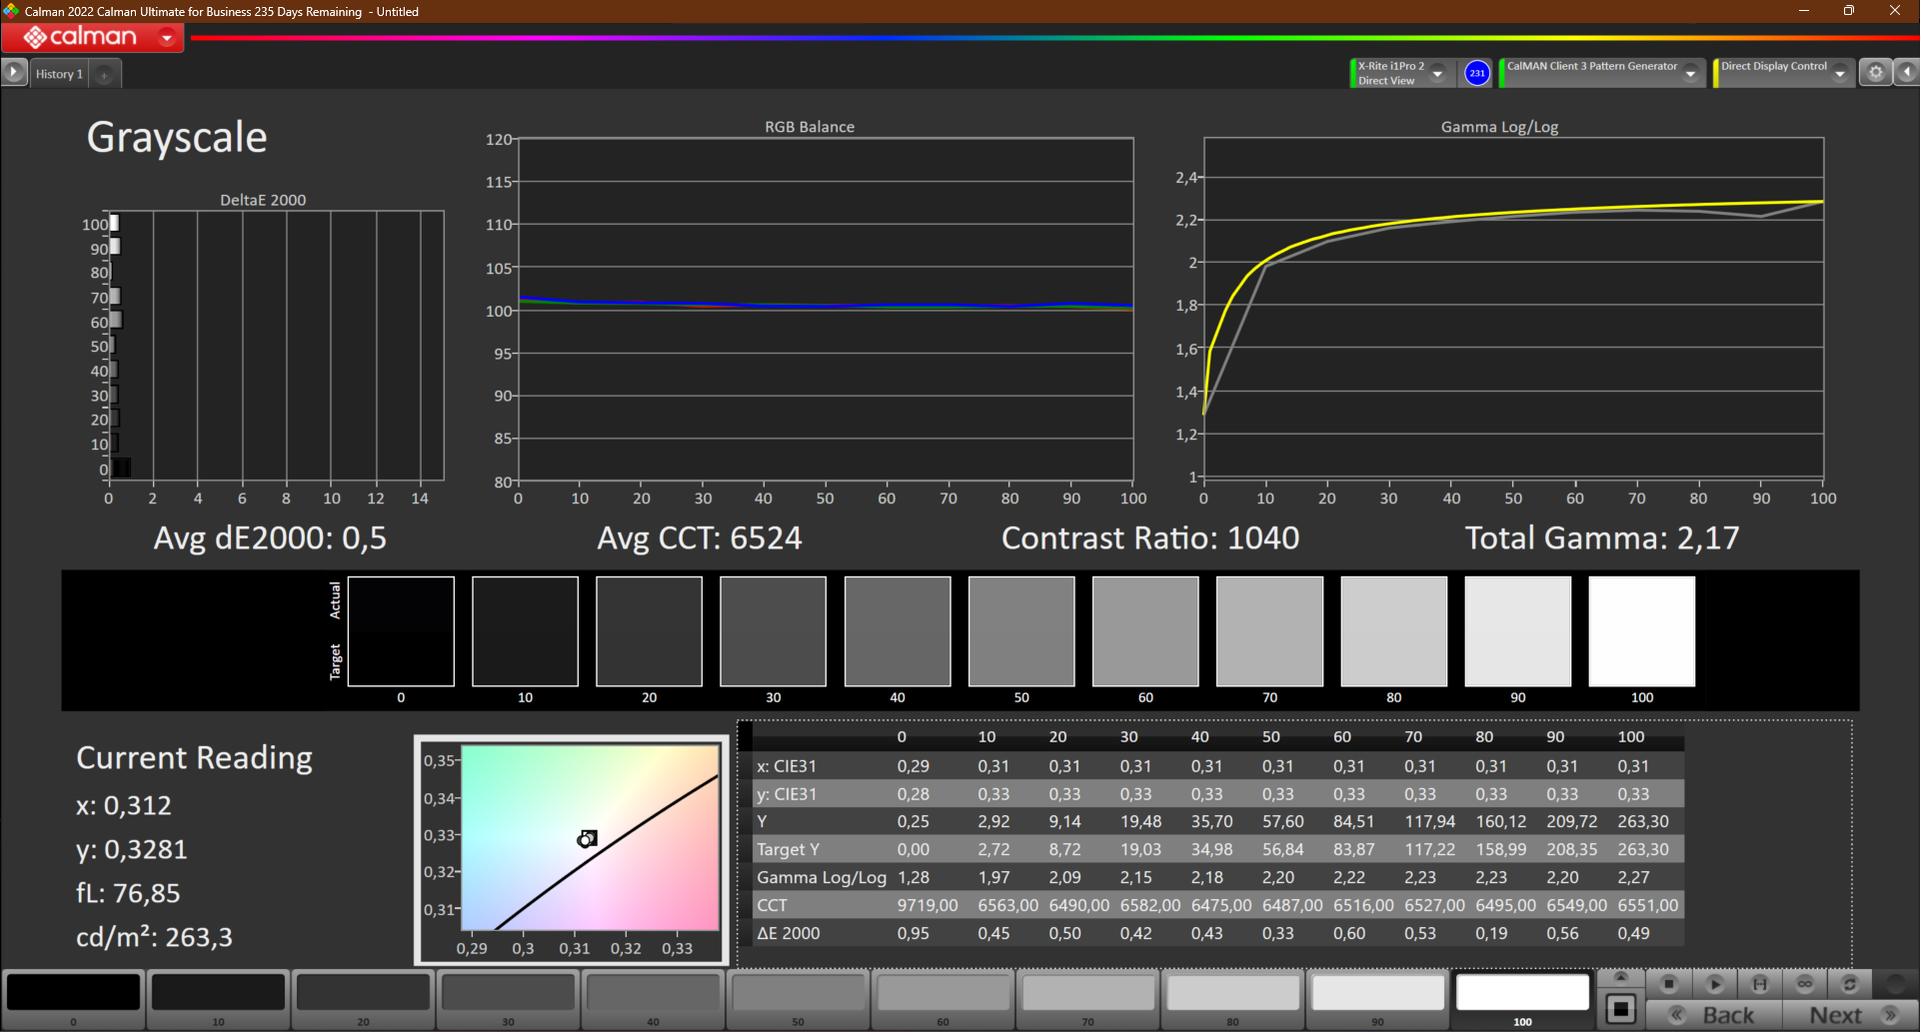
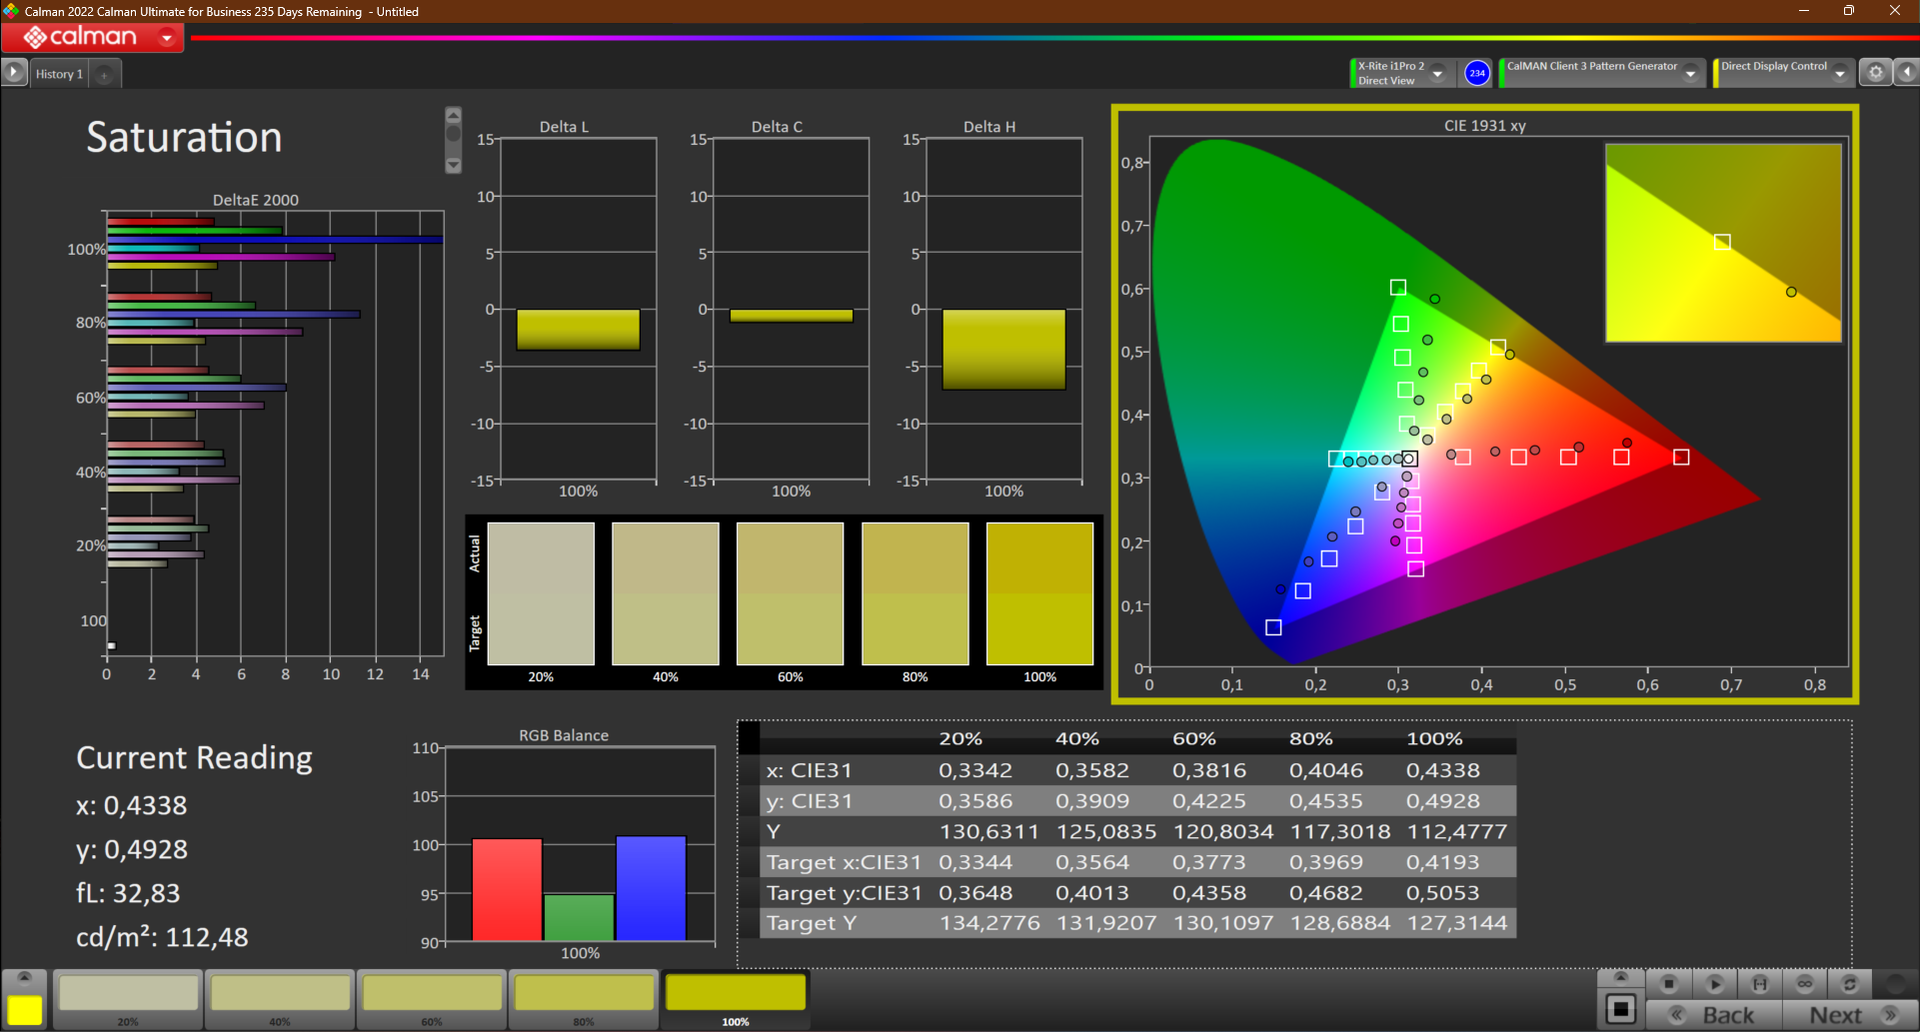
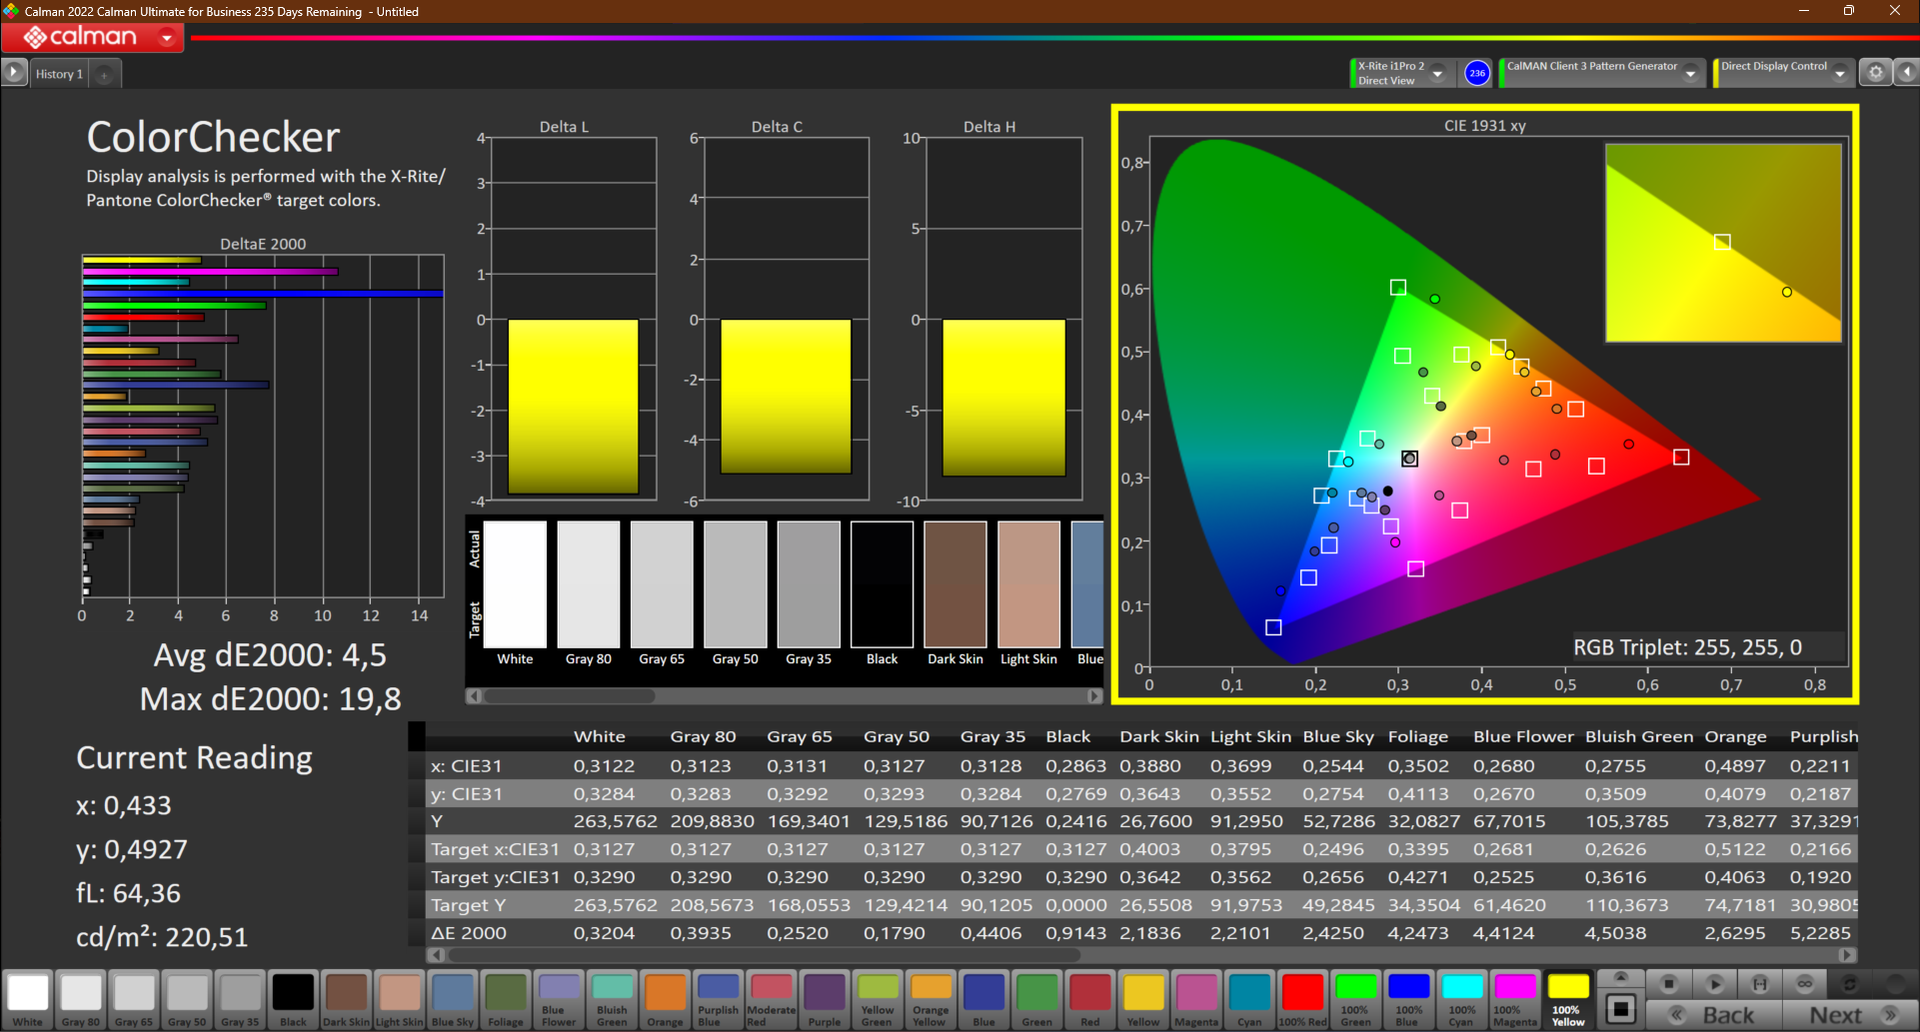
När det gäller färgrepresentation fortsätter skärmens mindre positiva intryck. Även efter kalibrering är panelen långt ifrån att visa korrekta färger. Efter att ha kalibrerat den med i1Profiler och X-Rite i1Pro 2 sjönk DeltaE-Wert endast minimalt från 4,7 till 4,5.
Orsaken till detta kan vara bristen på färgrymdstäckning. Numera är endast 61 % av sRGB-färgrymden ett otillfredsställande resultat - särskilt för en bärbar dator som är inriktad på mediekonsumtion.
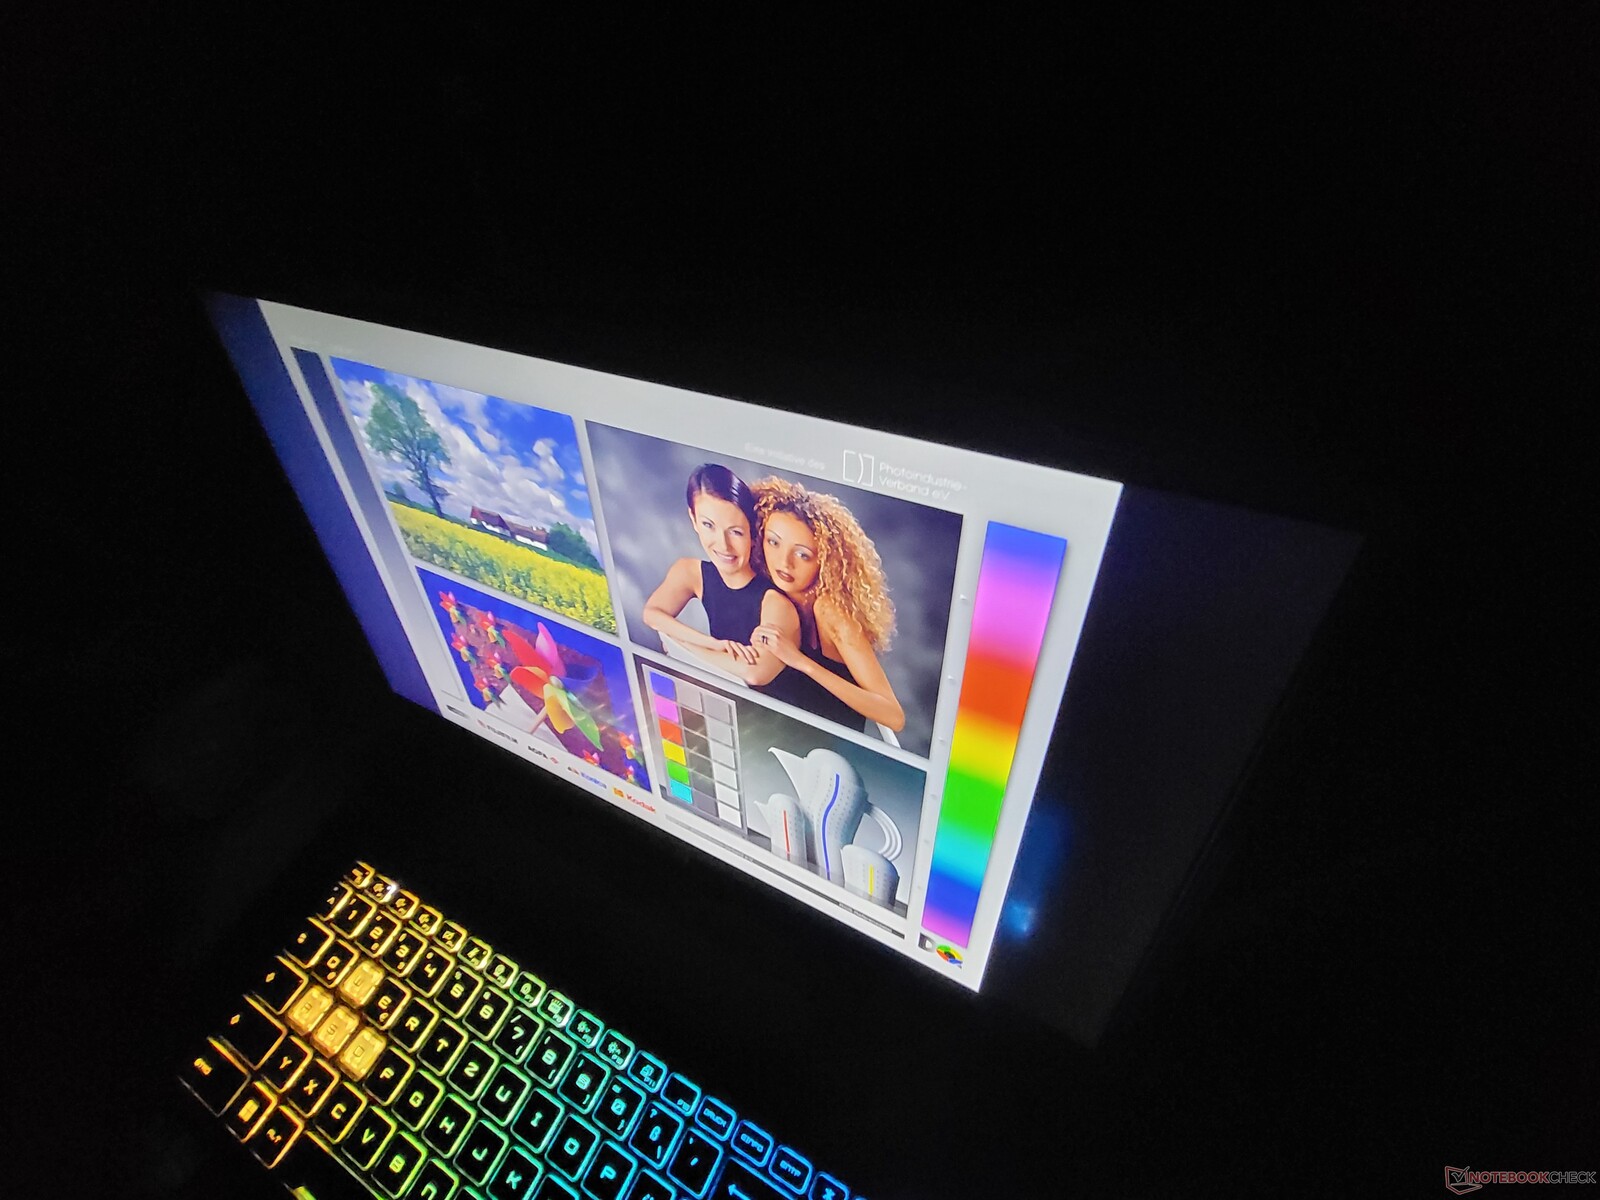
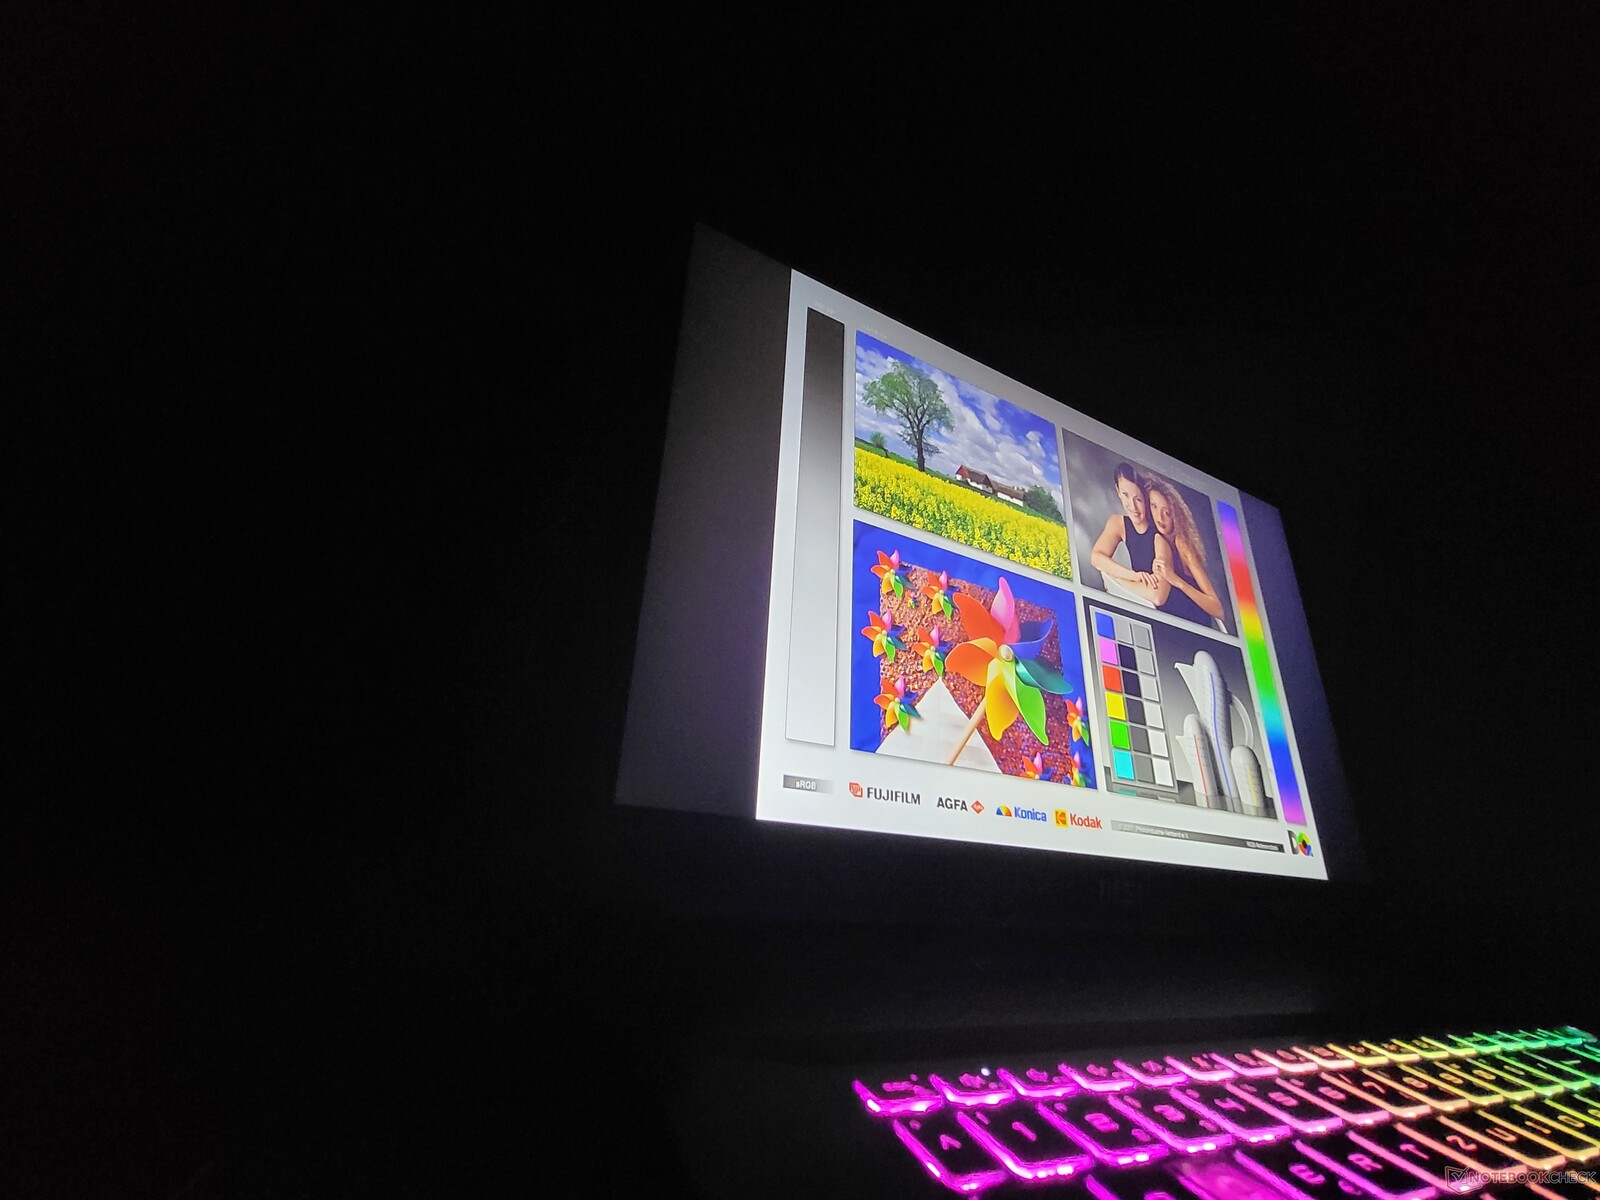
Utomhus är MSI Katana 17-skärmen nästan användbar så länge enheten används i skuggan.
Visa svarstider
| ↔ Svarstid svart till vitt | ||
|---|---|---|
| 26 ms ... stiga ↗ och falla ↘ kombinerat | ↗ 13 ms stiga | 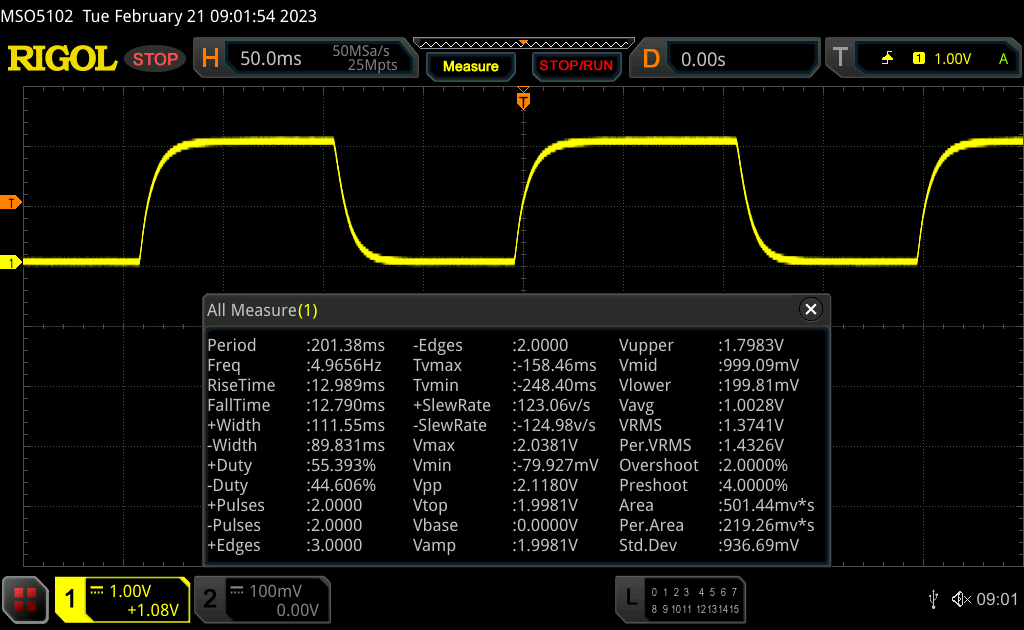 |
| ↘ 13 ms hösten | ||
| Skärmen visar relativt långsamma svarsfrekvenser i våra tester och kan vara för långsam för spelare. I jämförelse sträcker sig alla testade enheter från 0.1 (minst) till 240 (maximalt) ms. » 63 % av alla enheter är bättre. Detta innebär att den uppmätta svarstiden är sämre än genomsnittet av alla testade enheter (19.8 ms). | ||
| ↔ Svarstid 50 % grått till 80 % grått | ||
| 33 ms ... stiga ↗ och falla ↘ kombinerat | ↗ 16 ms stiga | 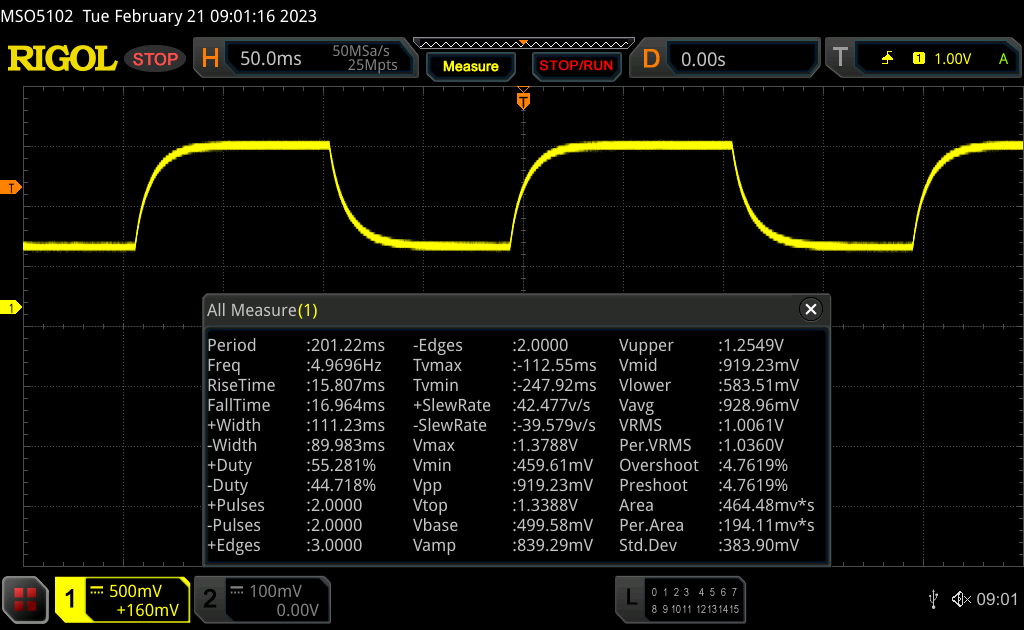 |
| ↘ 17 ms hösten | ||
| Skärmen visar långsamma svarsfrekvenser i våra tester och kommer att vara otillfredsställande för spelare. I jämförelse sträcker sig alla testade enheter från 0.165 (minst) till 636 (maximalt) ms. » 45 % av alla enheter är bättre. Det betyder att den uppmätta svarstiden liknar genomsnittet av alla testade enheter (31 ms). | ||
Skärmflimmer / PWM (Puls-Width Modulation)
| Skärmflimmer / PWM upptäcktes inte | 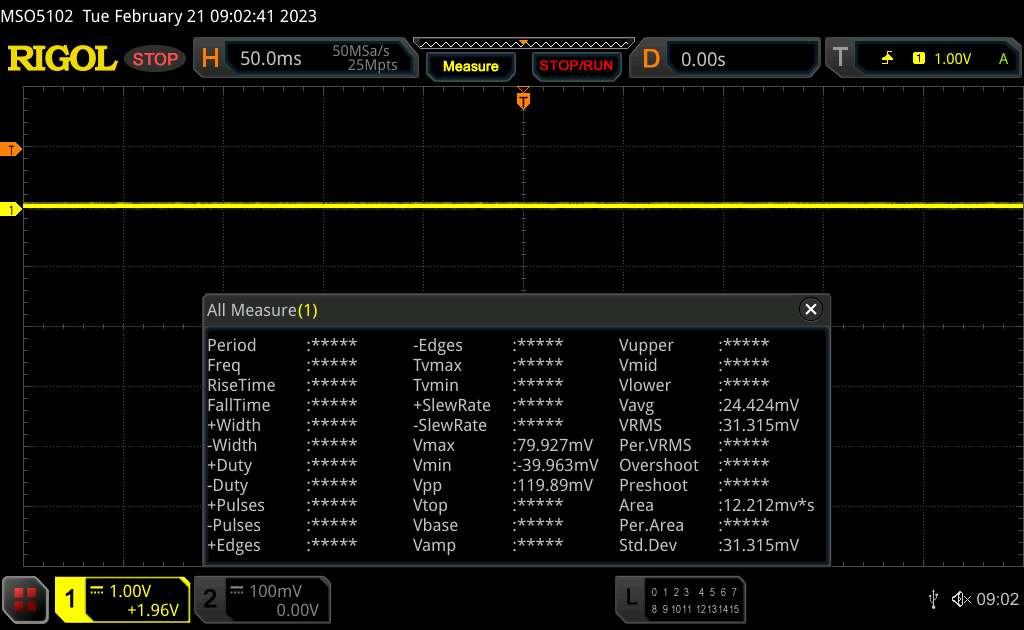 | ||
Som jämförelse: 52 % av alla testade enheter använder inte PWM för att dämpa skärmen. Om PWM upptäcktes mättes ett medelvärde av 7754 (minst: 5 - maximum: 343500) Hz. | |||
Prestanda: Nvidia GeForce RTX 4060:s debut
I Tyskland säljer MSI Katana 17 B13V i två konfigurationer. Båda enheterna har Intel Core i7-13620H, Nvidia GeForce RTX 4060 och 16 GB DDR5 5200 RAM gemensamt. Den enda skillnaden är: Den ena modellen har en 512 GB stor SSD och den andra har en SSD-kapacitet på 1 TB.
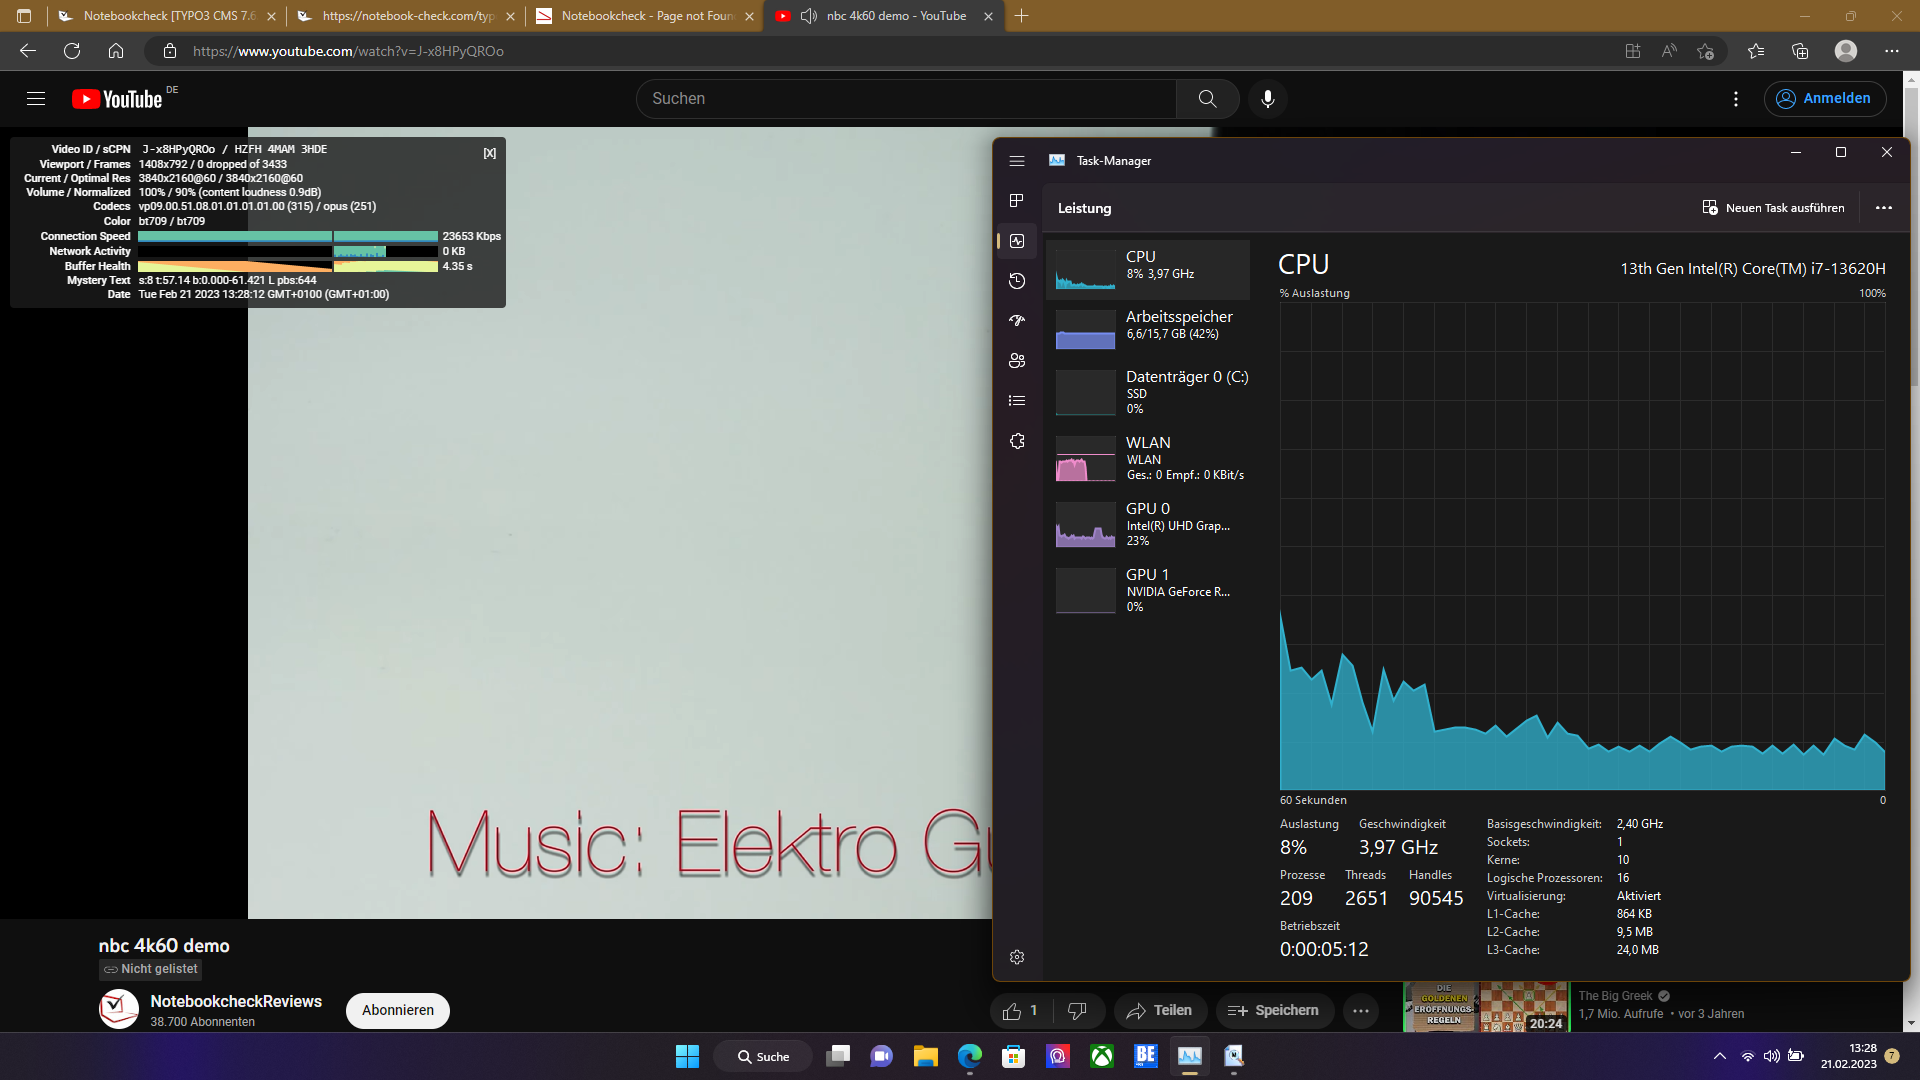
Provningsvillkor
I MSI:s programvara "MSI Center" finns det fyra prestandalägen: Max Performance, Balanced, Silent modes samt Super Battery. Dessutom finns det även ett Auto läge. Vi körde alla våra tester med läget Max Performance där CPU-förbrukningen fluktuerade mellan 70 och 80 watt. Prestandareserverna är liknande i läget Balanced, som användes för batteritestet. I lägena Silent och Super Battery är CPU:n begränsad till 30 respektive 15 watt.
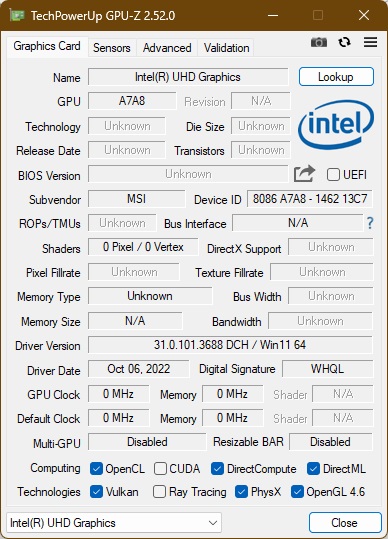
Tack vare Optimus Advanced är det möjligt att växla grafikchipet till ren Nvidia-drift och inaktivera Intel GPU. Vi testade enheten med det normala Optimus-läget.
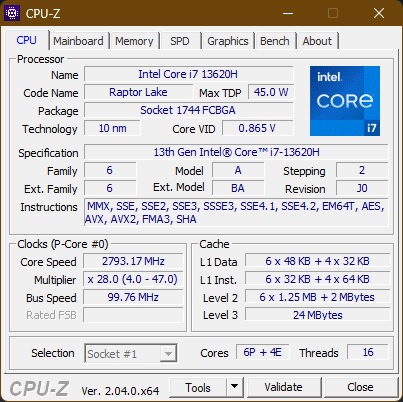
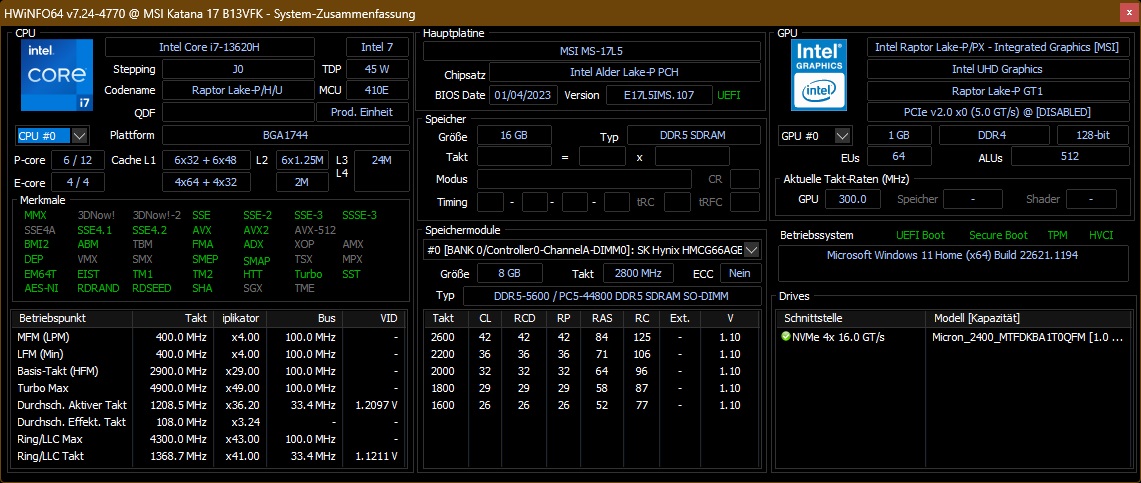
Processor
TheIntel Core i7-13620Här den första i7-modellen i Raptor Lake H-serien. Den har alla sex prestandakärnor men bara fyra av de mindre E-kärnorna. Som H-processor har den en typisk TDP på 45 watt, även om detta kan skilja sig mycket beroende på den bärbara datorn. Alla tio kärnor (16 trådar) har en klockfrekvens som sträcker sig från 1,8 till 4,9 GHz. Du kan hitta ytterligare jämförelser med andra processorer i vår CPU-lista.
MSI har beviljat processorn en maximal effekt på 80 watt. Den resulterande prestandan ligger mellan i7-12700HiMSI Pulse GL76ochi5-12500Hsom finns iGigabyte G7 KE. Med tanke på specifikationerna och de små skillnaderna mellan Alder Lake och Raptor Lake var dessa resultat ändå väntade. Med sina åtta P-kärnor och 16 E-kärnor är Intel Core i9-13950HXklart i täten.
I batteriläge är CPU-prestandan kraftigt begränsad. Med totalt 1399 poäng var Cinebench R15-resultatet cirka 40 procent lägre.
Cinebench R15 Multi Continuous Test
Cinebench R23: Multi Core | Single Core
Cinebench R20: CPU (Multi Core) | CPU (Single Core)
Cinebench R15: CPU Multi 64Bit | CPU Single 64Bit
Blender: v2.79 BMW27 CPU
7-Zip 18.03: 7z b 4 | 7z b 4 -mmt1
Geekbench 5.5: Multi-Core | Single-Core
HWBOT x265 Benchmark v2.2: 4k Preset
LibreOffice : 20 Documents To PDF
R Benchmark 2.5: Overall mean
| CPU Performance rating | |
| MSI Titan GT77 HX 13VI | |
| Genomsnitt av klass Gaming | |
| Asus ROG Strix Scar 17 SE G733CX-LL014W | |
| MSI Pulse GL76 12UGK | |
| MSI Katana 17 B13VFK | |
| Acer Predator Helios 300 (i7-12700H, RTX 3070 Ti) | |
| Genomsnitt Intel Core i7-13620H | |
| Gigabyte G7 KE | |
| Cinebench R23 / Multi Core | |
| MSI Titan GT77 HX 13VI | |
| Genomsnitt av klass Gaming (10488 - 42661, n=107, senaste 2 åren) | |
| Asus ROG Strix Scar 17 SE G733CX-LL014W | |
| Acer Predator Helios 300 (i7-12700H, RTX 3070 Ti) | |
| MSI Pulse GL76 12UGK | |
| MSI Katana 17 B13VFK | |
| Gigabyte G7 KE | |
| Genomsnitt Intel Core i7-13620H (10819 - 15496, n=7) | |
| Cinebench R23 / Single Core | |
| MSI Titan GT77 HX 13VI | |
| Genomsnitt av klass Gaming (1166 - 2415, n=107, senaste 2 åren) | |
| Asus ROG Strix Scar 17 SE G733CX-LL014W | |
| Genomsnitt Intel Core i7-13620H (1716 - 1871, n=7) | |
| MSI Katana 17 B13VFK | |
| Acer Predator Helios 300 (i7-12700H, RTX 3070 Ti) | |
| MSI Pulse GL76 12UGK | |
| Gigabyte G7 KE | |
| Cinebench R20 / CPU (Multi Core) | |
| MSI Titan GT77 HX 13VI | |
| Genomsnitt av klass Gaming (4029 - 16433, n=106, senaste 2 åren) | |
| Asus ROG Strix Scar 17 SE G733CX-LL014W | |
| MSI Pulse GL76 12UGK | |
| MSI Katana 17 B13VFK | |
| Acer Predator Helios 300 (i7-12700H, RTX 3070 Ti) | |
| Genomsnitt Intel Core i7-13620H (4214 - 5905, n=7) | |
| Gigabyte G7 KE | |
| Cinebench R20 / CPU (Single Core) | |
| MSI Titan GT77 HX 13VI | |
| Genomsnitt av klass Gaming (442 - 913, n=106, senaste 2 åren) | |
| Asus ROG Strix Scar 17 SE G733CX-LL014W | |
| Acer Predator Helios 300 (i7-12700H, RTX 3070 Ti) | |
| Genomsnitt Intel Core i7-13620H (657 - 719, n=7) | |
| MSI Katana 17 B13VFK | |
| MSI Pulse GL76 12UGK | |
| Gigabyte G7 KE | |
| Cinebench R15 / CPU Multi 64Bit | |
| MSI Titan GT77 HX 13VI | |
| Genomsnitt av klass Gaming (1578 - 6330, n=105, senaste 2 åren) | |
| Asus ROG Strix Scar 17 SE G733CX-LL014W | |
| Acer Predator Helios 300 (i7-12700H, RTX 3070 Ti) | |
| MSI Pulse GL76 12UGK | |
| MSI Katana 17 B13VFK | |
| Gigabyte G7 KE | |
| Genomsnitt Intel Core i7-13620H (1681 - 2492, n=7) | |
| Cinebench R15 / CPU Single 64Bit | |
| MSI Titan GT77 HX 13VI | |
| Genomsnitt av klass Gaming (188.8 - 350, n=106, senaste 2 åren) | |
| Asus ROG Strix Scar 17 SE G733CX-LL014W | |
| Genomsnitt Intel Core i7-13620H (250 - 269, n=7) | |
| MSI Katana 17 B13VFK | |
| MSI Pulse GL76 12UGK | |
| Acer Predator Helios 300 (i7-12700H, RTX 3070 Ti) | |
| Gigabyte G7 KE | |
| Blender / v2.79 BMW27 CPU | |
| Genomsnitt Intel Core i7-13620H (215 - 297, n=7) | |
| Gigabyte G7 KE | |
| MSI Katana 17 B13VFK | |
| Acer Predator Helios 300 (i7-12700H, RTX 3070 Ti) | |
| MSI Pulse GL76 12UGK | |
| Asus ROG Strix Scar 17 SE G733CX-LL014W | |
| Genomsnitt av klass Gaming (79 - 330, n=104, senaste 2 åren) | |
| MSI Titan GT77 HX 13VI | |
| 7-Zip 18.03 / 7z b 4 | |
| MSI Titan GT77 HX 13VI | |
| Genomsnitt av klass Gaming (33491 - 148086, n=105, senaste 2 åren) | |
| Asus ROG Strix Scar 17 SE G733CX-LL014W | |
| Acer Predator Helios 300 (i7-12700H, RTX 3070 Ti) | |
| MSI Pulse GL76 12UGK | |
| MSI Katana 17 B13VFK | |
| Genomsnitt Intel Core i7-13620H (45092 - 62324, n=7) | |
| Gigabyte G7 KE | |
| 7-Zip 18.03 / 7z b 4 -mmt1 | |
| MSI Titan GT77 HX 13VI | |
| Genomsnitt av klass Gaming (4199 - 7436, n=105, senaste 2 åren) | |
| Asus ROG Strix Scar 17 SE G733CX-LL014W | |
| Genomsnitt Intel Core i7-13620H (5648 - 6326, n=7) | |
| Acer Predator Helios 300 (i7-12700H, RTX 3070 Ti) | |
| MSI Katana 17 B13VFK | |
| MSI Pulse GL76 12UGK | |
| Gigabyte G7 KE | |
| Geekbench 5.5 / Multi-Core | |
| MSI Titan GT77 HX 13VI | |
| Genomsnitt av klass Gaming (6460 - 28263, n=105, senaste 2 åren) | |
| Asus ROG Strix Scar 17 SE G733CX-LL014W | |
| Acer Predator Helios 300 (i7-12700H, RTX 3070 Ti) | |
| MSI Pulse GL76 12UGK | |
| MSI Katana 17 B13VFK | |
| Genomsnitt Intel Core i7-13620H (8112 - 12223, n=7) | |
| Gigabyte G7 KE | |
| Geekbench 5.5 / Single-Core | |
| Genomsnitt av klass Gaming (986 - 2474, n=105, senaste 2 åren) | |
| MSI Titan GT77 HX 13VI | |
| Asus ROG Strix Scar 17 SE G733CX-LL014W | |
| Genomsnitt Intel Core i7-13620H (1703 - 1865, n=7) | |
| MSI Katana 17 B13VFK | |
| Acer Predator Helios 300 (i7-12700H, RTX 3070 Ti) | |
| Gigabyte G7 KE | |
| MSI Pulse GL76 12UGK | |
| HWBOT x265 Benchmark v2.2 / 4k Preset | |
| MSI Titan GT77 HX 13VI | |
| Genomsnitt av klass Gaming (11.5 - 44.4, n=105, senaste 2 åren) | |
| Asus ROG Strix Scar 17 SE G733CX-LL014W | |
| MSI Pulse GL76 12UGK | |
| MSI Katana 17 B13VFK | |
| Gigabyte G7 KE | |
| Acer Predator Helios 300 (i7-12700H, RTX 3070 Ti) | |
| Genomsnitt Intel Core i7-13620H (12.2 - 17.7, n=7) | |
| LibreOffice / 20 Documents To PDF | |
| Acer Predator Helios 300 (i7-12700H, RTX 3070 Ti) | |
| MSI Katana 17 B13VFK | |
| Genomsnitt Intel Core i7-13620H (41.5 - 78.9, n=7) | |
| Genomsnitt av klass Gaming (33.2 - 88.8, n=105, senaste 2 åren) | |
| MSI Titan GT77 HX 13VI | |
| MSI Pulse GL76 12UGK | |
| Gigabyte G7 KE | |
| Asus ROG Strix Scar 17 SE G733CX-LL014W | |
| R Benchmark 2.5 / Overall mean | |
| Gigabyte G7 KE | |
| MSI Pulse GL76 12UGK | |
| Acer Predator Helios 300 (i7-12700H, RTX 3070 Ti) | |
| Genomsnitt Intel Core i7-13620H (0.4438 - 0.4762, n=7) | |
| MSI Katana 17 B13VFK | |
| Genomsnitt av klass Gaming (0.3439 - 0.759, n=106, senaste 2 åren) | |
| Asus ROG Strix Scar 17 SE G733CX-LL014W | |
| MSI Titan GT77 HX 13VI | |
* ... mindre är bättre
AIDA64: FP32 Ray-Trace | FPU Julia | CPU SHA3 | CPU Queen | FPU SinJulia | FPU Mandel | CPU AES | CPU ZLib | FP64 Ray-Trace | CPU PhotoWorxx
| Performance rating | |
| MSI Titan GT77 HX 13VI | |
| Genomsnitt av klass Gaming | |
| Asus ROG Strix Scar 17 SE G733CX-LL014W | |
| Acer Predator Helios 300 (i7-12700H, RTX 3070 Ti) | |
| MSI Pulse GL76 12UGK | |
| Gigabyte G7 KE | |
| MSI Katana 17 B13VFK | |
| Genomsnitt Intel Core i7-13620H | |
| AIDA64 / FP32 Ray-Trace | |
| Genomsnitt av klass Gaming (10227 - 85542, n=105, senaste 2 åren) | |
| MSI Titan GT77 HX 13VI | |
| Asus ROG Strix Scar 17 SE G733CX-LL014W | |
| Acer Predator Helios 300 (i7-12700H, RTX 3070 Ti) | |
| MSI Pulse GL76 12UGK | |
| MSI Katana 17 B13VFK | |
| Gigabyte G7 KE | |
| Genomsnitt Intel Core i7-13620H (10779 - 13601, n=7) | |
| AIDA64 / FPU Julia | |
| MSI Titan GT77 HX 13VI | |
| Genomsnitt av klass Gaming (51376 - 238426, n=105, senaste 2 åren) | |
| Acer Predator Helios 300 (i7-12700H, RTX 3070 Ti) | |
| Asus ROG Strix Scar 17 SE G733CX-LL014W | |
| MSI Pulse GL76 12UGK | |
| MSI Katana 17 B13VFK | |
| Gigabyte G7 KE | |
| Genomsnitt Intel Core i7-13620H (54287 - 67187, n=7) | |
| AIDA64 / CPU SHA3 | |
| MSI Titan GT77 HX 13VI | |
| Genomsnitt av klass Gaming (2180 - 10115, n=105, senaste 2 åren) | |
| Asus ROG Strix Scar 17 SE G733CX-LL014W | |
| Acer Predator Helios 300 (i7-12700H, RTX 3070 Ti) | |
| MSI Pulse GL76 12UGK | |
| Gigabyte G7 KE | |
| MSI Katana 17 B13VFK | |
| Genomsnitt Intel Core i7-13620H (2327 - 2773, n=7) | |
| AIDA64 / CPU Queen | |
| MSI Titan GT77 HX 13VI | |
| Genomsnitt av klass Gaming (49785 - 173351, n=90, senaste 2 åren) | |
| Asus ROG Strix Scar 17 SE G733CX-LL014W | |
| MSI Pulse GL76 12UGK | |
| Acer Predator Helios 300 (i7-12700H, RTX 3070 Ti) | |
| Gigabyte G7 KE | |
| MSI Katana 17 B13VFK | |
| Genomsnitt Intel Core i7-13620H (66885 - 78867, n=7) | |
| AIDA64 / FPU SinJulia | |
| MSI Titan GT77 HX 13VI | |
| Genomsnitt av klass Gaming (4424 - 33636, n=105, senaste 2 åren) | |
| Asus ROG Strix Scar 17 SE G733CX-LL014W | |
| Acer Predator Helios 300 (i7-12700H, RTX 3070 Ti) | |
| MSI Pulse GL76 12UGK | |
| MSI Katana 17 B13VFK | |
| Genomsnitt Intel Core i7-13620H (6737 - 8421, n=7) | |
| Gigabyte G7 KE | |
| AIDA64 / FPU Mandel | |
| Genomsnitt av klass Gaming (25115 - 128721, n=105, senaste 2 åren) | |
| MSI Titan GT77 HX 13VI | |
| Acer Predator Helios 300 (i7-12700H, RTX 3070 Ti) | |
| Asus ROG Strix Scar 17 SE G733CX-LL014W | |
| MSI Pulse GL76 12UGK | |
| MSI Katana 17 B13VFK | |
| Gigabyte G7 KE | |
| Genomsnitt Intel Core i7-13620H (27242 - 32787, n=7) | |
| AIDA64 / CPU AES | |
| Asus ROG Strix Scar 17 SE G733CX-LL014W | |
| MSI Pulse GL76 12UGK | |
| MSI Titan GT77 HX 13VI | |
| Gigabyte G7 KE | |
| Genomsnitt av klass Gaming (39258 - 247074, n=105, senaste 2 åren) | |
| Acer Predator Helios 300 (i7-12700H, RTX 3070 Ti) | |
| Genomsnitt Intel Core i7-13620H (48646 - 85895, n=7) | |
| MSI Katana 17 B13VFK | |
| AIDA64 / CPU ZLib | |
| MSI Titan GT77 HX 13VI | |
| Genomsnitt av klass Gaming (574 - 2531, n=105, senaste 2 åren) | |
| Asus ROG Strix Scar 17 SE G733CX-LL014W | |
| Acer Predator Helios 300 (i7-12700H, RTX 3070 Ti) | |
| MSI Pulse GL76 12UGK | |
| Gigabyte G7 KE | |
| MSI Katana 17 B13VFK | |
| Genomsnitt Intel Core i7-13620H (688 - 835, n=7) | |
| AIDA64 / FP64 Ray-Trace | |
| Genomsnitt av klass Gaming (5509 - 45446, n=105, senaste 2 åren) | |
| MSI Titan GT77 HX 13VI | |
| Acer Predator Helios 300 (i7-12700H, RTX 3070 Ti) | |
| Asus ROG Strix Scar 17 SE G733CX-LL014W | |
| MSI Pulse GL76 12UGK | |
| MSI Katana 17 B13VFK | |
| Gigabyte G7 KE | |
| Genomsnitt Intel Core i7-13620H (5919 - 7364, n=7) | |
| AIDA64 / CPU PhotoWorxx | |
| Genomsnitt av klass Gaming (12271 - 89891, n=105, senaste 2 åren) | |
| Asus ROG Strix Scar 17 SE G733CX-LL014W | |
| MSI Titan GT77 HX 13VI | |
| Acer Predator Helios 300 (i7-12700H, RTX 3070 Ti) | |
| MSI Katana 17 B13VFK | |
| Gigabyte G7 KE | |
| Genomsnitt Intel Core i7-13620H (19421 - 34544, n=7) | |
| MSI Pulse GL76 12UGK | |
Systemprestanda
En snabb SSD, tillsammans med Katana 17:s kraftfulla grafikkrets, resulterar i en mycket bra systemprestanda som naturligtvis ligger något efter de bättre konfigurerade konkurrenterna i syntetiska benchmarks.
CrossMark: Overall | Productivity | Creativity | Responsiveness
| PCMark 10 / Score | |
| MSI Titan GT77 HX 13VI | |
| Genomsnitt av klass Gaming (5828 - 12414, n=93, senaste 2 åren) | |
| Acer Predator Helios 300 (i7-12700H, RTX 3070 Ti) | |
| MSI Pulse GL76 12UGK | |
| Asus ROG Strix Scar 17 SE G733CX-LL014W | |
| MSI Katana 17 B13VFK | |
| Genomsnitt Intel Core i7-13620H, NVIDIA GeForce RTX 4060 Laptop GPU (6678 - 7256, n=3) | |
| Gigabyte G7 KE | |
| PCMark 10 / Essentials | |
| MSI Titan GT77 HX 13VI | |
| MSI Pulse GL76 12UGK | |
| MSI Katana 17 B13VFK | |
| Acer Predator Helios 300 (i7-12700H, RTX 3070 Ti) | |
| Genomsnitt av klass Gaming (8810 - 11935, n=97, senaste 2 åren) | |
| Genomsnitt Intel Core i7-13620H, NVIDIA GeForce RTX 4060 Laptop GPU (9909 - 10809, n=3) | |
| Asus ROG Strix Scar 17 SE G733CX-LL014W | |
| Gigabyte G7 KE | |
| PCMark 10 / Productivity | |
| Genomsnitt av klass Gaming (6845 - 25323, n=95, senaste 2 åren) | |
| Acer Predator Helios 300 (i7-12700H, RTX 3070 Ti) | |
| MSI Pulse GL76 12UGK | |
| Asus ROG Strix Scar 17 SE G733CX-LL014W | |
| MSI Titan GT77 HX 13VI | |
| MSI Katana 17 B13VFK | |
| Genomsnitt Intel Core i7-13620H, NVIDIA GeForce RTX 4060 Laptop GPU (8642 - 9781, n=3) | |
| Gigabyte G7 KE | |
| PCMark 10 / Digital Content Creation | |
| MSI Titan GT77 HX 13VI | |
| Genomsnitt av klass Gaming (7602 - 19954, n=95, senaste 2 åren) | |
| Acer Predator Helios 300 (i7-12700H, RTX 3070 Ti) | |
| MSI Pulse GL76 12UGK | |
| Asus ROG Strix Scar 17 SE G733CX-LL014W | |
| MSI Katana 17 B13VFK | |
| Genomsnitt Intel Core i7-13620H, NVIDIA GeForce RTX 4060 Laptop GPU (9437 - 10204, n=3) | |
| Gigabyte G7 KE | |
| CrossMark / Overall | |
| MSI Titan GT77 HX 13VI | |
| Asus ROG Strix Scar 17 SE G733CX-LL014W | |
| Genomsnitt av klass Gaming (1366 - 2409, n=94, senaste 2 åren) | |
| Genomsnitt Intel Core i7-13620H, NVIDIA GeForce RTX 4060 Laptop GPU (1857 - 1986, n=3) | |
| Acer Predator Helios 300 (i7-12700H, RTX 3070 Ti) | |
| MSI Katana 17 B13VFK | |
| MSI Pulse GL76 12UGK | |
| Gigabyte G7 KE | |
| CrossMark / Productivity | |
| MSI Titan GT77 HX 13VI | |
| Asus ROG Strix Scar 17 SE G733CX-LL014W | |
| Genomsnitt av klass Gaming (1386 - 2254, n=94, senaste 2 åren) | |
| Genomsnitt Intel Core i7-13620H, NVIDIA GeForce RTX 4060 Laptop GPU (1765 - 1908, n=3) | |
| Gigabyte G7 KE | |
| MSI Pulse GL76 12UGK | |
| Acer Predator Helios 300 (i7-12700H, RTX 3070 Ti) | |
| MSI Katana 17 B13VFK | |
| CrossMark / Creativity | |
| MSI Titan GT77 HX 13VI | |
| Asus ROG Strix Scar 17 SE G733CX-LL014W | |
| Genomsnitt av klass Gaming (1343 - 2786, n=94, senaste 2 åren) | |
| Acer Predator Helios 300 (i7-12700H, RTX 3070 Ti) | |
| Genomsnitt Intel Core i7-13620H, NVIDIA GeForce RTX 4060 Laptop GPU (2013 - 2067, n=3) | |
| MSI Katana 17 B13VFK | |
| MSI Pulse GL76 12UGK | |
| Gigabyte G7 KE | |
| CrossMark / Responsiveness | |
| Gigabyte G7 KE | |
| Asus ROG Strix Scar 17 SE G733CX-LL014W | |
| Genomsnitt Intel Core i7-13620H, NVIDIA GeForce RTX 4060 Laptop GPU (1734 - 1989, n=3) | |
| MSI Titan GT77 HX 13VI | |
| MSI Pulse GL76 12UGK | |
| MSI Katana 17 B13VFK | |
| Acer Predator Helios 300 (i7-12700H, RTX 3070 Ti) | |
| Genomsnitt av klass Gaming (1226 - 2334, n=94, senaste 2 åren) | |
| PCMark 10 Score | 7160 poäng | |
Hjälp | ||
| AIDA64 / Memory Copy | |
| Genomsnitt av klass Gaming (21750 - 129946, n=105, senaste 2 åren) | |
| MSI Titan GT77 HX 13VI | |
| Asus ROG Strix Scar 17 SE G733CX-LL014W | |
| Acer Predator Helios 300 (i7-12700H, RTX 3070 Ti) | |
| MSI Katana 17 B13VFK | |
| MSI Pulse GL76 12UGK | |
| Genomsnitt Intel Core i7-13620H (31629 - 53927, n=7) | |
| Gigabyte G7 KE | |
| AIDA64 / Memory Read | |
| Genomsnitt av klass Gaming (22956 - 118858, n=105, senaste 2 åren) | |
| Asus ROG Strix Scar 17 SE G733CX-LL014W | |
| MSI Titan GT77 HX 13VI | |
| MSI Katana 17 B13VFK | |
| Acer Predator Helios 300 (i7-12700H, RTX 3070 Ti) | |
| Genomsnitt Intel Core i7-13620H (35115 - 61853, n=7) | |
| MSI Pulse GL76 12UGK | |
| Gigabyte G7 KE | |
| AIDA64 / Memory Write | |
| Genomsnitt av klass Gaming (22297 - 135096, n=105, senaste 2 åren) | |
| Asus ROG Strix Scar 17 SE G733CX-LL014W | |
| MSI Titan GT77 HX 13VI | |
| Acer Predator Helios 300 (i7-12700H, RTX 3070 Ti) | |
| MSI Katana 17 B13VFK | |
| Gigabyte G7 KE | |
| MSI Pulse GL76 12UGK | |
| Genomsnitt Intel Core i7-13620H (30611 - 54111, n=7) | |
| AIDA64 / Memory Latency | |
| Genomsnitt av klass Gaming (75.3 - 259, n=105, senaste 2 åren) | |
| MSI Katana 17 B13VFK | |
| Genomsnitt Intel Core i7-13620H (75.9 - 108.2, n=7) | |
| MSI Pulse GL76 12UGK | |
| MSI Titan GT77 HX 13VI | |
| Acer Predator Helios 300 (i7-12700H, RTX 3070 Ti) | |
| Gigabyte G7 KE | |
| Asus ROG Strix Scar 17 SE G733CX-LL014W | |
* ... mindre är bättre
DPC-fördröjningar
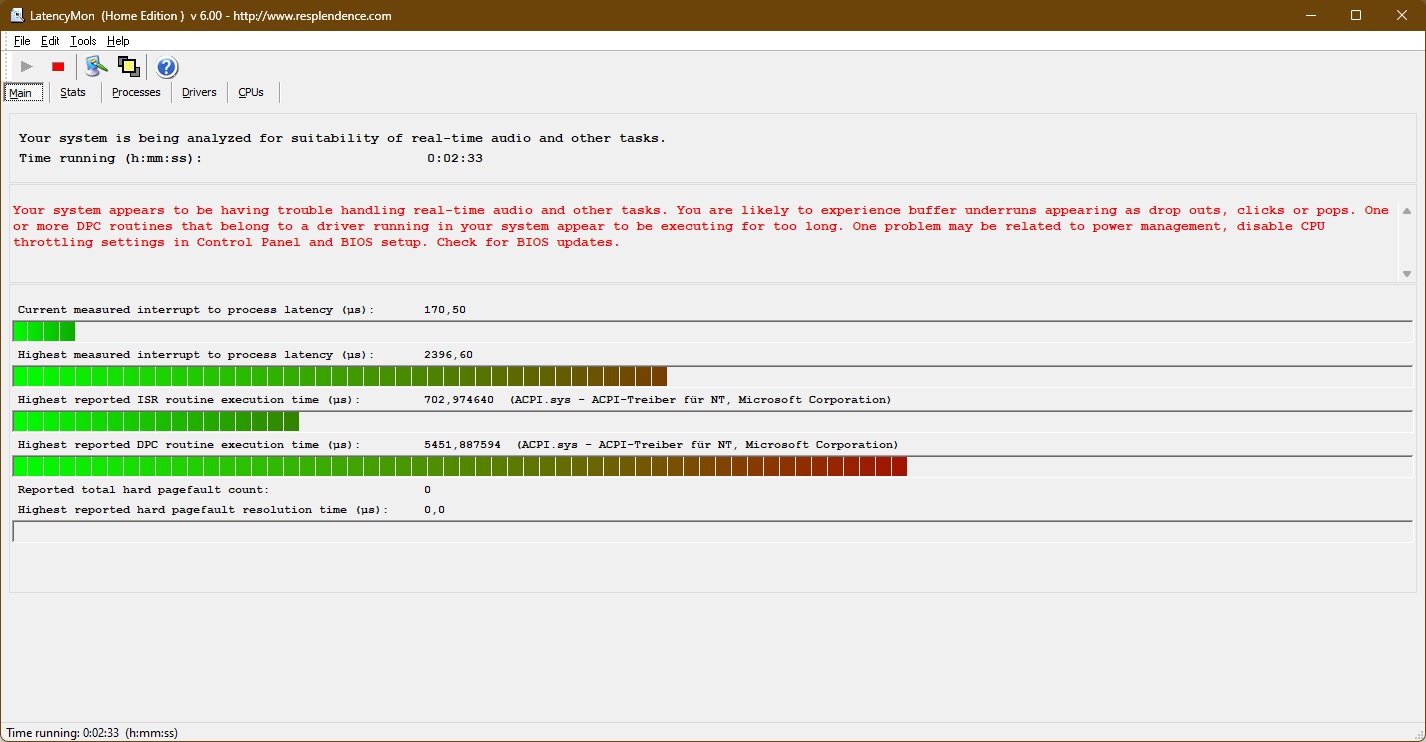
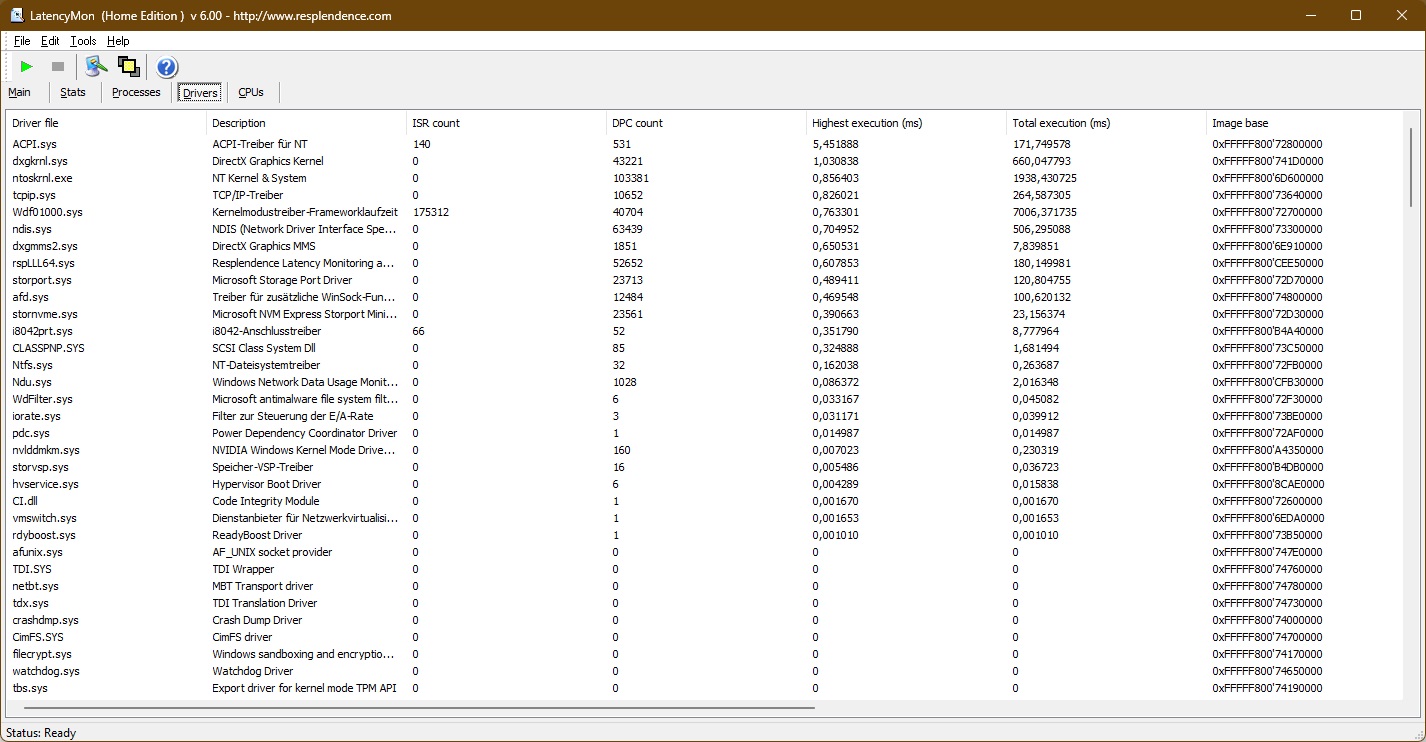
| DPC Latencies / LatencyMon - interrupt to process latency (max), Web, Youtube, Prime95 | |
| MSI Titan GT77 HX 13VI | |
| Asus ROG Strix Scar 17 SE G733CX-LL014W | |
| MSI Katana 17 B13VFK | |
| Gigabyte G7 KE | |
| Acer Predator Helios 300 (i7-12700H, RTX 3070 Ti) | |
| MSI Pulse GL76 12UGK | |
* ... mindre är bättre
Masslagring
Med en kapacitet på en terabyte är Micron 2400 i sig en snabb NVMe PCIe 4.0 SSD, men prestandamässigt kan den inte hålla jämna steg med konkurrenterna. Detta bör dock egentligen inte märkas vid daglig användning.

* ... mindre är bättre
Continuous Performance Read: DiskSpd Read Loop, Queue Depth 8
Grafikkort
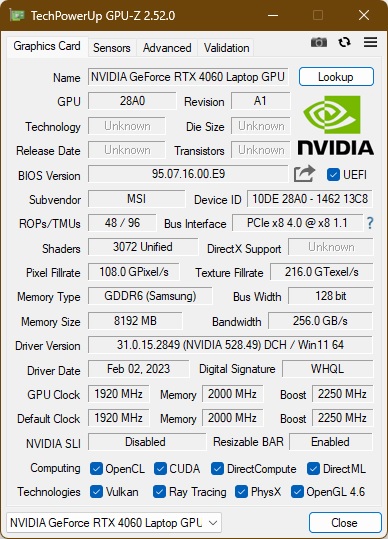
TheNvidia GeForce RTX 4060 är en mellanklass GPU från Nvidias "Ada Lovelace"-generation. De 3072 shader-enheterna är klockade till maximalt 2,25 GHz och GPU:n som installeras här har åtta gigabyte GDDR6 RAM till sitt förfogande. Du kan hitta ytterligare jämförelser med andra grafikkretsar i vår GPU-jämförelselista.
I 3DMark-testerna har den nya GPU:n nosen framför förra generationens Nvidia GeForce RTX 3070- men bara precis. Däremot ärRTX 3070 Tiär marginellt snabbare. Jämfört medNvidia GeForce RTX 3060är RTX 4060 - som här kan förbruka sina maximala 105 watt - cirka 23 % snabbare. Med 115 watt förbrukar Gigabyte G7 KE som finns i 3060 lite mer än 4060. RTX 4060 är klart överträffad av RTX 4060.GeForce RTX 4090och var att vänta. I 3DMark-jämförelser körs det avancerade chipet dubbelt så snabbt. Blender-benchmarkresultaten bekräftar 3DMark-testresultaten.
Precis som med processorn har grafikkortet en prestandagräns i batteriläge. Utan nätaggregat är endast 50 % av GPU-prestandan tillgänglig.
| 3DMark 06 Standard Score | 50607 poäng | |
| 3DMark Vantage P Result | 90275 poäng | |
| 3DMark 11 Performance | 30831 poäng | |
| 3DMark Ice Storm Standard Score | 185655 poäng | |
| 3DMark Cloud Gate Standard Score | 59494 poäng | |
| 3DMark Fire Strike Score | 22497 poäng | |
| 3DMark Time Spy Score | 10345 poäng | |
Hjälp | ||
* ... mindre är bättre
Spelprestanda
I speltesterna klarar sig Nvidia GeForce RTX 4060 bättre än i syntetiska riktmärken. I detta avseende slår den marginellt GeForce RTX 3070 Ti. Precis som RTX 4090 är dock RTX 3080 Ti fortfarande oslagbar. När det gäller spel är skillnaden till flaggskeppet ändå inte så stor, då 4090 fortfarande är cirka 33 % snabbare.
RTX 4060 kan utan problem spela äldre titlar i 4K UHD. Med nya spel är det dock svårare, åtminstone utan implementering av DLSS. Hur som helst är det möjligt att spela i 2,5K.
| The Witcher 3 - 1920x1080 Ultra Graphics & Postprocessing (HBAO+) | |
| MSI Titan GT77 HX 13VI | |
| Genomsnitt av klass Gaming (104.7 - 240, n=7, senaste 2 åren) | |
| Acer Predator Helios 300 (i7-12700H, RTX 3070 Ti) | |
| Asus ROG Strix Scar 17 SE G733CX-LL014W | |
| MSI Katana 17 B13VFK | |
| MSI Pulse GL76 12UGK | |
| Gigabyte G7 KE | |
| Final Fantasy XV Benchmark - 1920x1080 High Quality | |
| MSI Titan GT77 HX 13VI | |
| Genomsnitt av klass Gaming (41 - 215, n=95, senaste 2 åren) | |
| Asus ROG Strix Scar 17 SE G733CX-LL014W | |
| Acer Predator Helios 300 (i7-12700H, RTX 3070 Ti) | |
| MSI Katana 17 B13VFK | |
| MSI Pulse GL76 12UGK | |
| Gigabyte G7 KE | |
Witcher 3 frame rate diagram
| låg | med. | hög | ultra | QHD | 4K DLSS | 4K | |
|---|---|---|---|---|---|---|---|
| GTA V (2015) | 186.1 | 184.7 | 180.2 | 112.1 | 83 | 82.1 | |
| The Witcher 3 (2015) | 435 | 322 | 206 | 104.7 | 62.6 | ||
| Dota 2 Reborn (2015) | 184.6 | 171 | 164.1 | 156.3 | 126 | ||
| Final Fantasy XV Benchmark (2018) | 204 | 135.1 | 96.1 | 70.1 | 40.2 | ||
| X-Plane 11.11 (2018) | 178.6 | 154.9 | 118.9 | 98.9 | |||
| Far Cry 5 (2018) | 134 | 99 | 51 | ||||
| Strange Brigade (2018) | 508 | 270 | 216 | 185.1 | 126.4 | 67.2 | |
| Shadow of the Tomb Raider (2018) | 155.6 | 120.7 | 67.2 | ||||
| Metro Exodus (2019) | 74.3 | 59 | 36.8 | ||||
| Control (2019) | 238 | 119 | 89 | ||||
| Borderlands 3 (2019) | 171.3 | 144.6 | 106.5 | 83.9 | |||
| Death Stranding (2020) | 200 | 158.9 | 150.3 | 146.7 | |||
| Horizon Zero Dawn (2020) | 108.3 | 85.9 | 46.5 | ||||
| Flight Simulator 2020 (2020) | 96.9 | 69.4 | 52.5 | ||||
| Crysis Remastered (2020) | 312 | 224 | 85.9 | 72.5 | |||
| Watch Dogs Legion (2020) | 65 | 44 | 25 | ||||
| Dirt 5 (2020) | 218 | 147.2 | 116.1 | 89.5 | |||
| Assassin´s Creed Valhalla (2020) | 135 | 111 | 96 | ||||
| Yakuza Like a Dragon (2020) | 131.7 | 123.2 | 117.4 | 109.6 | |||
| Hitman 3 (2021) | 267.5 | 197.7 | 172.7 | 163.5 | |||
| Days Gone (2021) | 148 | 131.4 | 100.2 | ||||
| F1 2021 (2021) | 389 | 312 | 244 | 128.9 | 93 | 50.2 | |
| Alan Wake Remastered (2021) | 149.8 | 144.9 | |||||
| Far Cry 6 (2021) | 97.2 | 32.6 | 3.38 | ||||
| Back 4 Blood (2021) | 245 | 197.5 | 188.2 | ||||
| Guardians of the Galaxy (2021) | 134 | 135 | 133 | ||||
| Riders Republic (2021) | 177 | 145 | 122 | 112 | |||
| Forza Horizon 5 (2021) | 137 | 125 | 84 | ||||
| Battlefield 2042 (2021) | 145.6 | 123 | 106.1 | ||||
| Halo Infinite (2021) | 144.9 | 123.6 | 114.2 | ||||
| God of War (2022) | 67.5 | 55.6 | 34.7 | ||||
| Rainbow Six Extraction (2022) | 149.1 | 106 | 52.4 | ||||
| Dying Light 2 (2022) | 64.7 | 43.8 | 23 | ||||
| GRID Legends (2022) | 126.4 | 102.2 | 63.9 | ||||
| Elden Ring (2022) | 59.5 | ||||||
| Cyberpunk 2077 1.6 (2022) | 73.81 | 45.9 | 21.1 | ||||
| Elex 2 (2022) | 115.4 | 115.4 | 113.5 | 96 | |||
| Ghostwire Tokyo (2022) | 68.6 | 65.9 | 36.8 | 29.6 | |||
| Tiny Tina's Wonderlands (2022) | 198.6 | 164.9 | 110 | 85.2 | |||
| Vampire Bloodhunt (2022) | 220 | 201 | 185.7 | ||||
| F1 22 (2022) | 247 | 240 | 179.2 | 65.4 | 41 | 19.7 | |
| The Quarry (2022) | 154.8 | 121.3 | 100.5 | 77.9 | |||
| A Plague Tale Requiem (2022) | 100.7 | 84.9 | 73 | 63.3 | |||
| Uncharted Legacy of Thieves Collection (2022) | 87.9 | 85.1 | 79.1 | 76.9 | |||
| Call of Duty Modern Warfare 2 2022 (2022) | 87 | 59 | 55 | 34 | |||
| Spider-Man Miles Morales (2022) | 77.3 | 59.7 | 35.3 | ||||
| The Callisto Protocol (2022) | 68.9 | 48.6 | 27 | ||||
| Need for Speed Unbound (2022) | 127.4 | 117.2 | 98.9 | 98.6 | |||
| High On Life (2023) | 220 | 165.8 | 125.6 | 99.9 | |||
| The Witcher 3 v4 (2023) | 66.3 | 40.5 | 21.4 | ||||
| Dead Space Remake (2023) | 67 | 43.4 | 20.6 | ||||
| Hogwarts Legacy (2023) | 150 | 126.7 | 107.7 | 91.6 | |||
| Returnal (2023) | |||||||
| Atomic Heart (2023) | 167.3 | 129.2 | 81.6 | 66.8 | |||
| Company of Heroes 3 (2023) | 202.7 | 182.1 | 133.3 | 131.3 | |||
| Sons of the Forest (2023) | 82 | 79.1 | 73.3 | 71.8 |
Utsläpp: Högljudda fläktar, kallt hölje
Bullerutsläpp
När du utför enkla uppgifter går MSI Laptop Katana 17 oftast tyst - men inte alltid. När kylningen pågår, med cirka 40 dB(A), är enheten relativt högljudd. Under belastning stiger detta till maximalt 59 dB(A), vilket är mycket högt för känsliga öron men normalt för spel.
Vi upptäckte inte något spolningsvisslande.
Ljudnivå
| Låg belastning |
| 24.5 / 24.5 / 40 dB(A) |
| Hög belastning |
| 48.3 / 59.1 dB(A) |
 | ||
30 dB tyst 40 dB(A) hörbar 50 dB(A) högt ljud |
||
min: | ||
| MSI Katana 17 B13VFK GeForce RTX 4060 Laptop GPU, i7-13620H, Micron 2400 MTFDKBA1T0QFM | MSI Titan GT77 HX 13VI GeForce RTX 4090 Laptop GPU, i9-13950HX, Samsung PM9A1 MZVL22T0HBLB | MSI Pulse GL76 12UGK GeForce RTX 3070 Laptop GPU, i7-12700H, Micron 3400 1TB MTFDKBA1T0TFH | Gigabyte G7 KE GeForce RTX 3060 Laptop GPU, i5-12500H, Gigabyte AG470S1TB-SI B10 | Asus ROG Strix Scar 17 SE G733CX-LL014W GeForce RTX 3080 Ti Laptop GPU, i9-12950HX, Samsung PM9A1 MZVL22T0HBLB | Acer Predator Helios 300 (i7-12700H, RTX 3070 Ti) GeForce RTX 3070 Ti Laptop GPU, i7-12700H, Samsung PM9A1 MZVL21T0HCLR | |
|---|---|---|---|---|---|---|
| Noise | -2% | 6% | -9% | 16% | -0% | |
| av / miljö * (dB) | 24.5 | 24.6 -0% | 24.1 2% | 27 -10% | 23.9 2% | 23 6% |
| Idle Minimum * (dB) | 24.5 | 29.2 -19% | 26.9 -10% | 27 -10% | 23.9 2% | 23 6% |
| Idle Average * (dB) | 24.5 | 29.2 -19% | 26.9 -10% | 35 -43% | 23.9 2% | 25.92 -6% |
| Idle Maximum * (dB) | 40 | 29.2 27% | 27 32% | 38 5% | 23.9 40% | 40.67 -2% |
| Load Average * (dB) | 48.3 | 50.7 -5% | 43.8 9% | 52 -8% | 34.3 29% | 42.7 12% |
| Witcher 3 ultra * (dB) | 56 | 53.3 5% | 44.7 20% | 56 -0% | 62.48 -12% | |
| Load Maximum * (dB) | 59.1 | 61 -3% | 58.3 1% | 59 -0% | 45.9 22% | 62.67 -6% |
* ... mindre är bättre
Temperatur
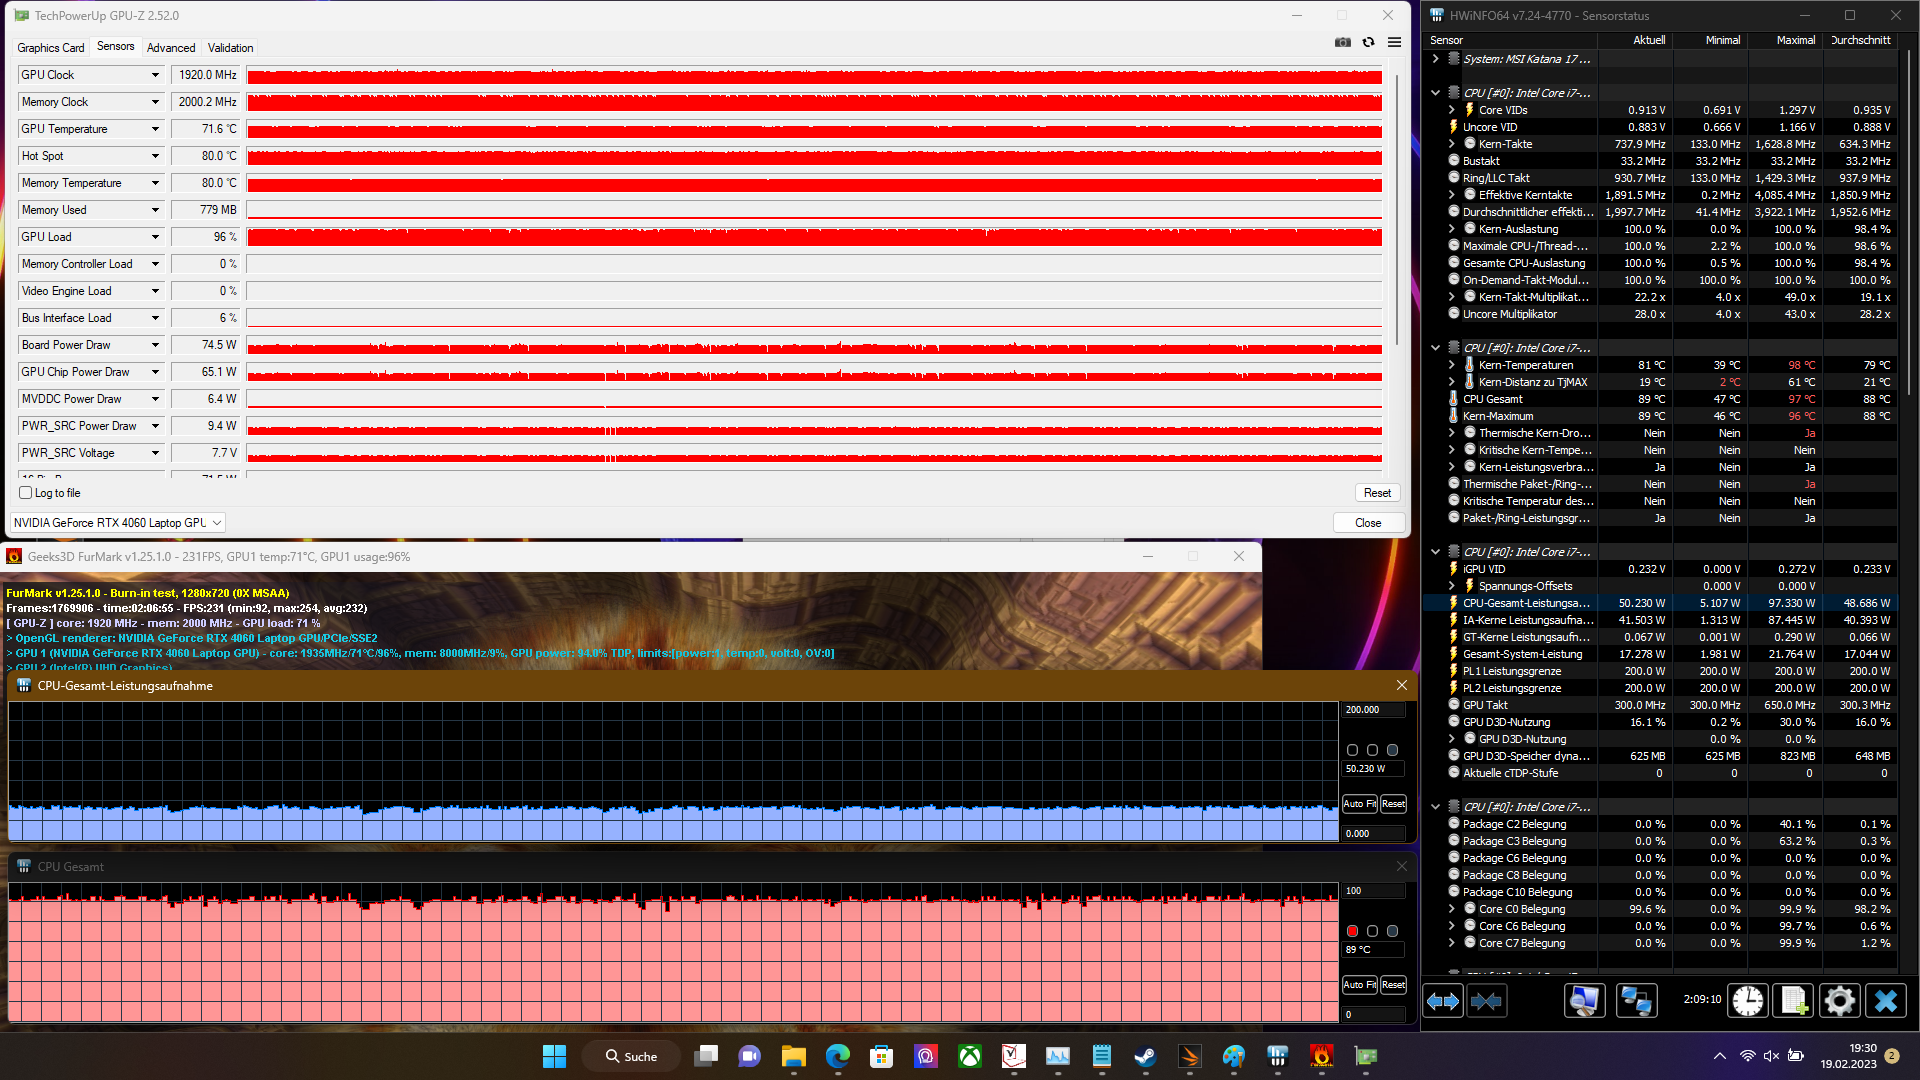
Goda nyheter: Du behöver inte oroa dig för att få svettiga händer när du använder Katana 17 eftersom handflatorna förblir svala, även i stresstester. En maximal temperatur på 45,5 grader Celsius i Witcher 3 -testetär inte heller någon anledning till oro.
I MSI Katana 17 B13V:s stresstester upptäckte vi ingen strypning.
(±) Den maximala temperaturen på ovansidan är 41.6 °C / 107 F, jämfört med genomsnittet av 40.4 °C / 105 F , allt från 21.2 till 68.8 °C för klassen Gaming.
(±) Botten värms upp till maximalt 43.1 °C / 110 F, jämfört med genomsnittet av 43.2 °C / 110 F
(+) Vid tomgångsbruk är medeltemperaturen för ovansidan 27.8 °C / 82 F, jämfört med enhetsgenomsnittet på 33.9 °C / ### class_avg_f### F.
(+) När du spelar The Witcher 3 är medeltemperaturen för ovansidan 31.8 °C / 89 F, jämfört med enhetsgenomsnittet på 33.9 °C / ## #class_avg_f### F.
(+) Handledsstöden och pekplattan är kallare än hudtemperaturen med maximalt 24.2 °C / 75.6 F och är därför svala att ta på.
(+) Medeltemperaturen för handledsstödsområdet på liknande enheter var 28.8 °C / 83.8 F (+4.6 °C / 8.2 F).
| MSI Katana 17 B13VFK Intel Core i7-13620H, NVIDIA GeForce RTX 4060 Laptop GPU | MSI Titan GT77 HX 13VI Intel Core i9-13950HX, NVIDIA GeForce RTX 4090 Laptop GPU | MSI Pulse GL76 12UGK Intel Core i7-12700H, NVIDIA GeForce RTX 3070 Laptop GPU | Gigabyte G7 KE Intel Core i5-12500H, NVIDIA GeForce RTX 3060 Laptop GPU | Asus ROG Strix Scar 17 SE G733CX-LL014W Intel Core i9-12950HX, NVIDIA GeForce RTX 3080 Ti Laptop GPU | Acer Predator Helios 300 (i7-12700H, RTX 3070 Ti) Intel Core i7-12700H, NVIDIA GeForce RTX 3070 Ti Laptop GPU | |
|---|---|---|---|---|---|---|
| Heat | 10% | -5% | -7% | -7% | 2% | |
| Maximum Upper Side * (°C) | 41.6 | 40.6 2% | 44.2 -6% | 52 -25% | 48.8 -17% | 35 16% |
| Maximum Bottom * (°C) | 43.1 | 41.1 5% | 45.2 -5% | 54 -25% | 52.4 -22% | 53 -23% |
| Idle Upper Side * (°C) | 32 | 26.2 18% | 35.4 -11% | 28 12% | 30.4 5% | 29 9% |
| Idle Bottom * (°C) | 35.8 | 30.3 15% | 35 2% | 32 11% | 34.1 5% | 34 5% |
* ... mindre är bättre
Högtalare
MSI Katana 17:s högtalare är relativt högljudda men saknar bas. Istället bör spelare ta till ett bra headset som gör fläktljud ohörbart.
MSI Katana 17 B13VFK ljudanalys
(±) | högtalarljudstyrkan är genomsnittlig men bra (78.5 dB)
Bas 100 - 315 Hz
(-) | nästan ingen bas - i genomsnitt 17.7% lägre än medianen
(±) | linjäriteten för basen är genomsnittlig (11.7% delta till föregående frekvens)
Mellan 400 - 2000 Hz
(±) | högre mellan - i genomsnitt 6.8% högre än median
(+) | mids är linjära (6.7% delta till föregående frekvens)
Högsta 2 - 16 kHz
(+) | balanserade toppar - endast 3.2% från medianen
(±) | linjäriteten för toppar är genomsnittlig (7.2% delta till föregående frekvens)
Totalt 100 - 16 000 Hz
(±) | linjäriteten för det totala ljudet är genomsnittlig (19.4% skillnad mot median)
Jämfört med samma klass
» 67% av alla testade enheter i den här klassen var bättre, 7% liknande, 26% sämre
» Den bästa hade ett delta på 6%, genomsnittet var 18%, sämst var 132%
Jämfört med alla testade enheter
» 48% av alla testade enheter var bättre, 7% liknande, 45% sämre
» Den bästa hade ett delta på 4%, genomsnittet var 23%, sämst var 134%
Acer Predator Helios 300 (i7-12700H, RTX 3070 Ti) ljudanalys
(±) | högtalarljudstyrkan är genomsnittlig men bra (73.83 dB)
Bas 100 - 315 Hz
(±) | reducerad bas - i genomsnitt 12.7% lägre än medianen
(±) | linjäriteten för basen är genomsnittlig (11.2% delta till föregående frekvens)
Mellan 400 - 2000 Hz
(±) | högre mellan - i genomsnitt 5.5% högre än median
(±) | linjäriteten för mids är genomsnittlig (7.9% delta till föregående frekvens)
Högsta 2 - 16 kHz
(+) | balanserade toppar - endast 2.1% från medianen
(+) | toppar är linjära (3.5% delta till föregående frekvens)
Totalt 100 - 16 000 Hz
(±) | linjäriteten för det totala ljudet är genomsnittlig (15.8% skillnad mot median)
Jämfört med samma klass
» 37% av alla testade enheter i den här klassen var bättre, 7% liknande, 56% sämre
» Den bästa hade ett delta på 6%, genomsnittet var 18%, sämst var 132%
Jämfört med alla testade enheter
» 24% av alla testade enheter var bättre, 5% liknande, 70% sämre
» Den bästa hade ett delta på 4%, genomsnittet var 23%, sämst var 134%
Energihantering: MSI:s strömkrävande spelmaskin
Effektförbrukning
Den minimala förbrukningen på cirka 12,2 watt är relativt hög men typisk för ett spelsystem. Jämfört med konkurrenterna är förbrukningen dock fortfarande relativt låg.
Nätaggregatet på 240 watt är tillräckligt stort för att klara av en maximal effektförbrukning på 212 watt.
| Av/Standby | |
| Låg belastning | |
| Hög belastning |
|
Förklaring:
min: | |
| MSI Katana 17 B13VFK i7-13620H, GeForce RTX 4060 Laptop GPU, Micron 2400 MTFDKBA1T0QFM, IPS LED, 1920x1080, 17.3" | MSI Titan GT77 HX 13VI i9-13950HX, GeForce RTX 4090 Laptop GPU, Samsung PM9A1 MZVL22T0HBLB, Mini-LED, 3840x2160, 17.3" | MSI Pulse GL76 12UGK i7-12700H, GeForce RTX 3070 Laptop GPU, Micron 3400 1TB MTFDKBA1T0TFH, IPS, 1920x1080, 17.3" | Gigabyte G7 KE i5-12500H, GeForce RTX 3060 Laptop GPU, Gigabyte AG470S1TB-SI B10, IPS, 1920x1080, 17.3" | Asus ROG Strix Scar 17 SE G733CX-LL014W i9-12950HX, GeForce RTX 3080 Ti Laptop GPU, Samsung PM9A1 MZVL22T0HBLB, IPS, 2560x1440, 17.3" | Acer Predator Helios 300 (i7-12700H, RTX 3070 Ti) i7-12700H, GeForce RTX 3070 Ti Laptop GPU, Samsung PM9A1 MZVL21T0HCLR, IPS, 2560x1440, 17.3" | Genomsnitt NVIDIA GeForce RTX 4060 Laptop GPU | Genomsnitt av klass Gaming | |
|---|---|---|---|---|---|---|---|---|
| Power Consumption | -55% | -14% | -22% | -61% | -41% | -7% | -29% | |
| Idle Minimum * (Watt) | 12.2 | 14 -15% | 12.4 -2% | 15 -23% | 19.3 -58% | 15 -23% | 11.5 ? 6% | 13 ? -7% |
| Idle Average * (Watt) | 14.9 | 21.6 -45% | 13.1 12% | 17 -14% | 26.5 -78% | 20 -34% | 16 ? -7% | 19 ? -28% |
| Idle Maximum * (Watt) | 15.8 | 24.8 -57% | 25.3 -60% | 24 -52% | 27.1 -72% | 22.3 -41% | 20.3 ? -28% | 24.6 ? -56% |
| Load Average * (Watt) | 85.22 | 122.5 -44% | 105.4 -24% | 111 -30% | 141 -65% | 133 -56% | 92.9 ? -9% | 110.7 ? -30% |
| Witcher 3 ultra * (Watt) | 151.1 | 265 -75% | 150 1% | 174.1 -15% | 225 -49% | 231 -53% | ||
| Load Maximum * (Watt) | 212.8 | 418 -96% | 240.5 -13% | 208 2% | 307.9 -45% | 290 -36% | 210 ? 1% | 259 ? -22% |
* ... mindre är bättre
Power consumption Witcher 3 / stress test
Power consumption with an external monitor
Batteriets livslängd
MSI Katana 17:s lilla batteri har endast en kapacitet på 53,5 watttimmar. Därför ska man inte förvänta sig någon bra batteritid när det gäller ett så kraftfullt system. Batteriet höll i knappa tre timmar i WiFi-testerna, vilket innebär att den bärbara datorn från MSI inte är lämplig för mobil användning.
| MSI Katana 17 B13VFK i7-13620H, GeForce RTX 4060 Laptop GPU, 53.5 Wh | MSI Titan GT77 HX 13VI i9-13950HX, GeForce RTX 4090 Laptop GPU, 99.9 Wh | MSI Pulse GL76 12UGK i7-12700H, GeForce RTX 3070 Laptop GPU, 90 Wh | Gigabyte G7 KE i5-12500H, GeForce RTX 3060 Laptop GPU, 54 Wh | Asus ROG Strix Scar 17 SE G733CX-LL014W i9-12950HX, GeForce RTX 3080 Ti Laptop GPU, 90 Wh | Acer Predator Helios 300 (i7-12700H, RTX 3070 Ti) i7-12700H, GeForce RTX 3070 Ti Laptop GPU, 90 Wh | Genomsnitt av klass Gaming | |
|---|---|---|---|---|---|---|---|
| Batteridrifttid | 62% | 107% | 57% | 45% | 94% | 98% | |
| WiFi v1.3 (h) | 2.9 | 5.3 83% | 5.9 103% | 5.3 83% | 4.2 45% | 6 107% | 7.11 ? 145% |
| Load (h) | 1 | 1.4 40% | 2.1 110% | 1.3 30% | 1.8 80% | 1.502 ? 50% | |
| H.264 (h) | 6 | 2.2 | 5.9 | 8.32 ? | |||
| Reader / Idle (h) | 7.3 | 7.1 | 8.27 ? |
För
Emot
Slutsats: MSI Katana 17 B13V är ett bra spelsystem

Den bärbara datorn MSI Katana 17 B13V imponerade på oss inom sitt huvudsakliga kompetensområde - spel. TheNvidia GeForce RTX 4060säkerställer höga prestandanivåer som kan konkurrera med föregående generations RTX 3070 Ti. Förutom den snabba GPU:n kommer MSI med en 144 Hz-skärm samt ett RGB-tangentbord och ger en mycket bra skrivupplevelse. Trots den kraft som finns till hands förblir den bärbara datorn jämförelsevis sval.
Framför allt är det skärmen som är den främsta kritikpunkten: Den är inte särskilt ljusstark och har dålig färgrymdstäckning samt höga svarstider. Dessutom är en USB-2.0-port något som 2023 verkligen kan klara sig utan. Utöver detta tyckte vi också att tangentbordslayouten var dåligt utförd eftersom tangenter som FN har flyttats till ganska ovanliga platser. Dålig batteritid är att förvänta från en bärbar dator för spel men är ändå värd att kritisera ändå.
GeForce RTX 4060: MSI 17 Katana B13V:s attraktionskraft står och faller med GPU:n.
På det hela taget har MSI Katana 17 fått ett bra betyg och är med RTX 4060 definitivt ett intressant val för gamers. I tider av inflation gäller detta dock även för den tidigare generationens enheter som t.ex.Gigabyte G7 KEmed ett RTX 3060. Prismedvetna kunder kan spara mycket pengar på en av förra generationens modeller.
Pris och tillgänglighet
När denna recension publiceras är MSI Katana 17 B14V för närvarande inte tillgänglig på Amazon och Best Buy. Den tidigare generationens modell (3070Ti) kan dock för närvarande köpas på Amazon för för cirka 1499 dollar.
MSI Katana 17 B13VFK
- 02/21/2023 v7 (old)
Benjamin Herzig
Genomskinlighet
Valet av enheter som ska granskas görs av vår redaktion. Testprovet gavs till författaren som ett lån av tillverkaren eller återförsäljaren för denna recension. Långivaren hade inget inflytande på denna recension och inte heller fick tillverkaren en kopia av denna recension innan publiceringen. Det fanns ingen skyldighet att publicera denna recension. Som ett oberoende medieföretag är Notebookcheck inte föremål för auktoritet från tillverkare, återförsäljare eller förlag.
This is how Notebookcheck is testingEvery year, Notebookcheck independently reviews hundreds of laptops and smartphones using standardized procedures to ensure that all results are comparable. We have continuously developed our test methods for around 20 years and set industry standards in the process. In our test labs, high-quality measuring equipment is utilized by experienced technicians and editors. These tests involve a multi-stage validation process. Our complex rating system is based on hundreds of well-founded measurements and benchmarks, which maintains objectivity.
Price comparison

