Test: Dell Latitude 7310 Core i7 - Snyggare utseende, samma prestanda (Sammanfattning)
Gradering | Datum | Modell | Vikt | Höjd | Storlek | Upplösning | Pris |
|---|---|---|---|---|---|---|---|
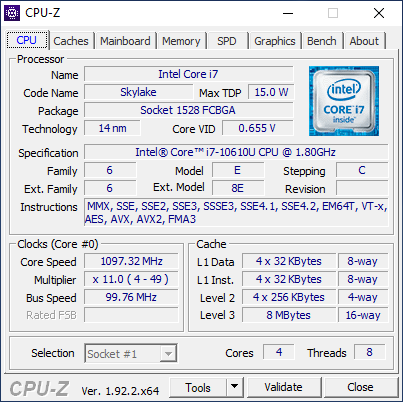
| 89.4 % v7 (old) | 07/2020 | Dell Latitude 7310 i7-10610U, UHD Graphics 620 | 1.2 kg | 18.3 mm | 13.30" | 1920x1080 | |
| 88.8 % v7 (old) | 10/2019 | Lenovo ThinkPad X395 R3 PRO 3300U, Vega 6 | 1.3 kg | 16.9 mm | 13.30" | 1920x1080 | |
| 86 % v7 (old) | HP EliteBook 735 G6 7KN29EA R5 PRO 3500U, Vega 8 | 1.5 kg | 17.7 mm | 13.30" | 1920x1080 | ||
| 92.1 % v7 (old) | 06/2020 | Apple MacBook Pro 13 2020 2GHz i5 10th-Gen i5-1038NG7, Iris Plus Graphics G7 (Ice Lake 64 EU) | 1.4 kg | 15.6 mm | 13.30" | 2560x1600 | |
| 82.6 % v7 (old) | 09/2020 | HP ProBook 455 G7-175W8EA R7 4700U, Vega 7 | 1.8 kg | 19 mm | 15.60" | 1920x1080 |
| SD Card Reader | |
| average JPG Copy Test (av. of 3 runs) | |
| Dell Latitude 7300-P99G (Toshiba Exceria Pro M501 microSDXC 64GB) | |
| Dell Latitude 7310 (Toshiba Exceria Pro M501 64 GB UHS-II) | |
| Lenovo ThinkPad X395 | |
| Asus ZenBook S13 UX392FN (Toshiba Exceria Pro M501 64 GB UHS-II) | |
| maximum AS SSD Seq Read Test (1GB) | |
| Dell Latitude 7310 (Toshiba Exceria Pro M501 64 GB UHS-II) | |
| Dell Latitude 7300-P99G (Toshiba Exceria Pro M501 microSDXC 64GB) | |
| Lenovo ThinkPad X395 | |
| Asus ZenBook S13 UX392FN (Toshiba Exceria Pro M501 64 GB UHS-II) | |
| Networking | |
| iperf3 transmit AX12 | |
| Asus Zephyrus G14 GA401IV | |
| Dell Latitude 7310 | |
| Dell XPS 13 9300 4K UHD | |
| Dell Latitude 7410 | |
| iperf3 receive AX12 | |
| Dell XPS 13 9300 4K UHD | |
| Asus Zephyrus G14 GA401IV | |
| Dell Latitude 7410 | |
| Dell Latitude 7310 | |


| |||||||||||||||||||||||||
Distribution av ljusstyrkan: 89 %
Mitt på batteriet: 332.7 cd/m²
Kontrast: 1331:1 (Svärta: 0.25 cd/m²)
ΔE ColorChecker Calman: 2.15 | ∀{0.5-29.43 Ø4.71}
calibrated: 1.09
ΔE Greyscale Calman: 2.5 | ∀{0.09-98 Ø4.96}
99.4% sRGB (Argyll 1.6.3 3D)
64.1% AdobeRGB 1998 (Argyll 1.6.3 3D)
72.4% AdobeRGB 1998 (Argyll 3D)
99.3% sRGB (Argyll 3D)
71.8% Display P3 (Argyll 3D)
Gamma: 2.3
CCT: 6347 K
| Dell Latitude 7310 AU Optronics B133HAN, IPS, 13.3", 1920x1080 | Dell Latitude 7300-P99G B133HAK, IPS LED, 13.3", 1920x1080 | Asus ZenBook S13 UX392FN Tianma XM, IPS, 13.9", 1920x1080 | Lenovo ThinkPad X395 LP133WF7-SPB1, IPS, 13.3", 1920x1080 | HP EliteBook 735 G6 7KN29EA CMN139E, IPS LED, 13.3", 1920x1080 | Apple MacBook Pro 13 2020 2GHz i5 10th-Gen APPA03D, IPS, 13.3", 2560x1600 | |
|---|---|---|---|---|---|---|
| Display | -9% | -5% | -8% | -40% | 19% | |
| Display P3 Coverage (%) | 71.8 | 64.6 -10% | 67.5 -6% | 64.1 -11% | 41.53 -42% | 98.8 38% |
| sRGB Coverage (%) | 99.3 | 91.5 -8% | 95.8 -4% | 95.2 -4% | 61.7 -38% | 99.9 1% |
| AdobeRGB 1998 Coverage (%) | 72.4 | 65.5 -10% | 69 -5% | 65.8 -9% | 43 -41% | 86.4 19% |
| Response Times | 5% | -1% | -23% | 8% | -13% | |
| Response Time Grey 50% / Grey 80% * (ms) | 40.8 ? | 39 ? 4% | 47.2 ? -16% | 55 ? -35% | 38 ? 7% | 46 ? -13% |
| Response Time Black / White * (ms) | 28.8 ? | 27 ? 6% | 24.8 ? 14% | 32 ? -11% | 26.4 ? 8% | 32.4 ? -13% |
| PWM Frequency (Hz) | 26040 | 113600 ? | ||||
| Screen | -66% | -0% | -9% | -114% | 17% | |
| Brightness middle (cd/m²) | 332.7 | 341 2% | 466 40% | 356 7% | 294 -12% | 512 54% |
| Brightness (cd/m²) | 329 | 306 -7% | 462 40% | 336 2% | 277 -16% | 491 49% |
| Brightness Distribution (%) | 89 | 79 -11% | 90 1% | 88 -1% | 87 -2% | 91 2% |
| Black Level * (cd/m²) | 0.25 | 0.31 -24% | 0.33 -32% | 0.16 36% | 0.18 28% | 0.32 -28% |
| Contrast (:1) | 1331 | 1100 -17% | 1412 6% | 2225 67% | 1633 23% | 1600 20% |
| Colorchecker dE 2000 * | 2.15 | 6.43 -199% | 1.93 10% | 3.6 -67% | 6.8 -216% | 1.7 21% |
| Colorchecker dE 2000 max. * | 3.89 | 10.33 -166% | 4.26 -10% | 5.5 -41% | 23.8 -512% | 3.4 13% |
| Colorchecker dE 2000 calibrated * | 1.09 | 2.36 -117% | 1.99 -83% | 1.11 -2% | 4.8 -340% | 1 8% |
| Greyscale dE 2000 * | 2.5 | 6.9 -176% | 1.7 32% | 4.7 -88% | 5.9 -136% | 1.9 24% |
| Gamma | 2.3 96% | 2.23 99% | 2.15 102% | 2.92 75% | 1.96 112% | 2.19 100% |
| CCT | 6347 102% | 8338 78% | 6382 102% | 6222 104% | 6979 93% | 6817 95% |
| Color Space (Percent of AdobeRGB 1998) (%) | 64.1 | 59 -8% | 62.2 -3% | 61 -5% | 39.6 -38% | 77.4 21% |
| Color Space (Percent of sRGB) (%) | 99.4 | 91 -8% | 95.7 -4% | 96 -3% | 61.5 -38% | 99.9 1% |
| Totalt genomsnitt (program/inställningar) | -23% /
-47% | -2% /
-1% | -13% /
-10% | -49% /
-85% | 8% /
14% |
* ... mindre är bättre
Visa svarstider
| ↔ Svarstid svart till vitt | ||
|---|---|---|
| 28.8 ms ... stiga ↗ och falla ↘ kombinerat | ↗ 14.8 ms stiga | 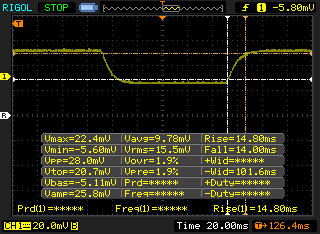 |
| ↘ 14 ms hösten | ||
| Skärmen visar relativt långsamma svarsfrekvenser i våra tester och kan vara för långsam för spelare. I jämförelse sträcker sig alla testade enheter från 0.1 (minst) till 240 (maximalt) ms. » 76 % av alla enheter är bättre. Detta innebär att den uppmätta svarstiden är sämre än genomsnittet av alla testade enheter (19.8 ms). | ||
| ↔ Svarstid 50 % grått till 80 % grått | ||
| 40.8 ms ... stiga ↗ och falla ↘ kombinerat | ↗ 22.4 ms stiga | 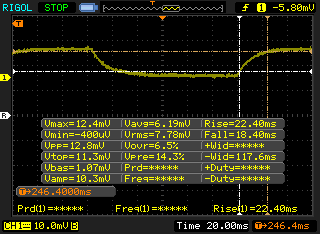 |
| ↘ 18.4 ms hösten | ||
| Skärmen visar långsamma svarsfrekvenser i våra tester och kommer att vara otillfredsställande för spelare. I jämförelse sträcker sig alla testade enheter från 0.165 (minst) till 636 (maximalt) ms. » 64 % av alla enheter är bättre. Detta innebär att den uppmätta svarstiden är sämre än genomsnittet av alla testade enheter (31 ms). | ||
Skärmflimmer / PWM (Puls-Width Modulation)
| Skärmflimmer / PWM upptäcktes inte | 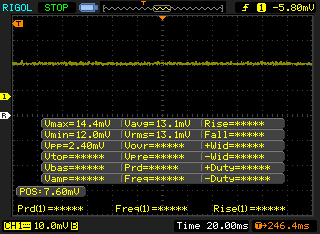 | ||
Som jämförelse: 52 % av alla testade enheter använder inte PWM för att dämpa skärmen. Om PWM upptäcktes mättes ett medelvärde av 7757 (minst: 5 - maximum: 343500) Hz. | |||
Cinebench R15: CPU Multi 64Bit | CPU Single 64Bit
Blender: v2.79 BMW27 CPU
7-Zip 18.03: 7z b 4 -mmt1 | 7z b 4
Geekbench 5.5: Single-Core | Multi-Core
HWBOT x265 Benchmark v2.2: 4k Preset
LibreOffice : 20 Documents To PDF
R Benchmark 2.5: Overall mean
| Cinebench R15 / CPU Multi 64Bit | |
| Dell XPS 13 7390 Core i7-10710U | |
| HP ProBook 455 G7-175W8EA | |
| HP Envy x360 13-ay0010nr | |
| Dell XPS 13 9300 4K UHD | |
| Lenovo ThinkPad X1 Carbon 2020-20UAS04T00 | |
| Dell Latitude 7300-P99G | |
| Dell XPS 13 9300 i5 FHD | |
| Dell XPS 13 9300 i5 FHD | |
| Genomsnitt Intel Core i7-10610U (548 - 738, n=6) | |
| Acer Swift 3 SF314-42-R27B | |
| Dell Latitude 7310 | |
| HP EliteBook x360 830 G6 | |
| Lenovo ThinkPad L13 Yoga 20R6S00800 | |
| Dell XPS 13 7390 2-in-1 Core i3 | |
| Lenovo ThinkPad 13 20J1005TPB | |
| Cinebench R15 / CPU Single 64Bit | |
| Dell Latitude 7300-P99G | |
| Lenovo ThinkPad X1 Carbon 2020-20UAS04T00 | |
| Dell XPS 13 9300 4K UHD | |
| HP ProBook 455 G7-175W8EA | |
| Dell XPS 13 7390 Core i7-10710U | |
| Dell Latitude 7310 | |
| Genomsnitt Intel Core i7-10610U (133 - 200, n=6) | |
| HP Envy x360 13-ay0010nr | |
| Dell XPS 13 9300 i5 FHD | |
| Acer Swift 3 SF314-42-R27B | |
| Lenovo ThinkPad L13 Yoga 20R6S00800 | |
| HP EliteBook x360 830 G6 | |
| Dell XPS 13 7390 2-in-1 Core i3 | |
| Lenovo ThinkPad 13 20J1005TPB | |
| Geekbench 5.5 / Single-Core | |
| Dell XPS 13 9300 4K UHD | |
| Dell Latitude 7310 | |
| Dell XPS 13 9300 i5 FHD | |
| Genomsnitt Intel Core i7-10610U (1155 - 1261, n=6) | |
| Lenovo ThinkPad X1 Carbon 2020-20UAS04T00 | |
| HP ProBook 455 G7-175W8EA | |
| Lenovo ThinkPad L13 Yoga 20R6S00800 | |
| HP Envy x360 13-ay0010nr | |
| Acer Swift 3 SF314-42-R27B | |
| Geekbench 5.5 / Multi-Core | |
| Dell XPS 13 9300 4K UHD | |
| HP ProBook 455 G7-175W8EA | |
| HP Envy x360 13-ay0010nr | |
| Dell XPS 13 9300 i5 FHD | |
| Lenovo ThinkPad L13 Yoga 20R6S00800 | |
| Genomsnitt Intel Core i7-10610U (3731 - 4622, n=6) | |
| Lenovo ThinkPad X1 Carbon 2020-20UAS04T00 | |
| Dell Latitude 7310 | |
| Acer Swift 3 SF314-42-R27B | |
| LibreOffice / 20 Documents To PDF | |
| HP ProBook 455 G7-175W8EA | |
| Dell XPS 13 9300 4K UHD | |
| Genomsnitt Intel Core i7-10610U (56.1 - 106, n=6) | |
| Acer Swift 3 SF314-42-R27B | |
| HP Envy x360 13-ay0010nr | |
| Dell Latitude 7310 | |
| Lenovo ThinkPad X1 Carbon 2020-20UAS04T00 | |
| R Benchmark 2.5 / Overall mean | |
| Dell XPS 13 9300 i5 FHD | |
| Genomsnitt Intel Core i7-10610U (0.637 - 0.855, n=6) | |
| Lenovo ThinkPad L13 Yoga 20R6S00800 | |
| Acer Swift 3 SF314-42-R27B | |
| Dell XPS 13 9300 4K UHD | |
| Lenovo ThinkPad X1 Carbon 2020-20UAS04T00 | |
| Dell Latitude 7310 | |
| HP ProBook 455 G7-175W8EA | |
| HP Envy x360 13-ay0010nr | |
Cinebench R15: CPU Multi 64Bit | CPU Single 64Bit
Blender: v2.79 BMW27 CPU
7-Zip 18.03: 7z b 4 -mmt1 | 7z b 4
Geekbench 5.5: Single-Core | Multi-Core
HWBOT x265 Benchmark v2.2: 4k Preset
LibreOffice : 20 Documents To PDF
R Benchmark 2.5: Overall mean
* ... mindre är bättre
| PCMark 10 | |
| Score | |
| Dell Latitude 7310 | |
| Genomsnitt Intel Core i7-10610U, Intel UHD Graphics 620 (4120 - 4437, n=4) | |
| Dell Latitude 7300-P99G | |
| Lenovo ThinkPad X395 | |
| HP EliteBook 735 G6 7KN29EA | |
| Apple MacBook Pro 13 2020 2GHz i5 10th-Gen | |
| Essentials | |
| Dell Latitude 7310 | |
| Dell Latitude 7300-P99G | |
| Genomsnitt Intel Core i7-10610U, Intel UHD Graphics 620 (8541 - 9667, n=4) | |
| Apple MacBook Pro 13 2020 2GHz i5 10th-Gen | |
| Lenovo ThinkPad X395 | |
| HP EliteBook 735 G6 7KN29EA | |
| Productivity | |
| Dell Latitude 7310 | |
| Genomsnitt Intel Core i7-10610U, Intel UHD Graphics 620 (6710 - 7607, n=4) | |
| Dell Latitude 7300-P99G | |
| Lenovo ThinkPad X395 | |
| HP EliteBook 735 G6 7KN29EA | |
| Apple MacBook Pro 13 2020 2GHz i5 10th-Gen | |
| Digital Content Creation | |
| Genomsnitt Intel Core i7-10610U, Intel UHD Graphics 620 (3156 - 3344, n=4) | |
| Apple MacBook Pro 13 2020 2GHz i5 10th-Gen | |
| Dell Latitude 7310 | |
| Lenovo ThinkPad X395 | |
| HP EliteBook 735 G6 7KN29EA | |
| Dell Latitude 7300-P99G | |
| PCMark 8 | |
| Home Score Accelerated v2 | |
| Dell Latitude 7300-P99G | |
| Apple MacBook Pro 13 2020 2GHz i5 10th-Gen | |
| Dell Latitude 7310 | |
| Genomsnitt Intel Core i7-10610U, Intel UHD Graphics 620 (3334 - 3783, n=4) | |
| HP EliteBook 735 G6 7KN29EA | |
| Lenovo ThinkPad X395 | |
| Work Score Accelerated v2 | |
| Dell Latitude 7310 | |
| Dell Latitude 7300-P99G | |
| Genomsnitt Intel Core i7-10610U, Intel UHD Graphics 620 (4528 - 5232, n=4) | |
| HP EliteBook 735 G6 7KN29EA | |
| Lenovo ThinkPad X395 | |
| Apple MacBook Pro 13 2020 2GHz i5 10th-Gen | |
| PCMark 8 Home Score Accelerated v2 | 3783 poäng | |
| PCMark 8 Work Score Accelerated v2 | 5232 poäng | |
| PCMark 10 Score | 4437 poäng | |
Hjälp | ||
| DPC Latencies / LatencyMon - interrupt to process latency (max), Web, Youtube, Prime95 | |
| Dell XPS 13 9300 4K UHD | |
| HP EliteBook 735 G6 7KN29EA | |
| Dell XPS 13 9300 i5 FHD | |
| HP Envy x360 13-ay0010nr | |
| HP ProBook 455 G7-175W8EA | |
| Acer Swift 3 SF314-42-R27B | |
| Dell Latitude 7410 | |
| Dell Latitude 7310 | |
* ... mindre är bättre
| Dell Latitude 7310 Samsung SSD PM981a MZVLB512HBJQ | Dell Latitude 7300-P99G Samsung SSD PM981 MZVLB512HAJQ | Asus ZenBook S13 UX392FN WDC PC SN520 SDAPNUW-512G | HP EliteBook 735 G6 7KN29EA WDC PC SN520 SDAPNUW-256G | Apple MacBook Pro 13 2020 2GHz i5 10th-Gen Apple SSD SM0512F | |
|---|---|---|---|---|---|
| AS SSD | 21% | -4% | -53% | -70% | |
| Seq Read (MB/s) | 2054 | 2749 34% | 1224 -40% | 1499 -27% | 1300 -37% |
| Seq Write (MB/s) | 1575 | 1367 -13% | 907 -42% | 1172 -26% | 1518 -4% |
| 4K Read (MB/s) | 52.1 | 49.94 -4% | 41.46 -20% | 35.42 -32% | 14.09 -73% |
| 4K Write (MB/s) | 137.3 | 137.6 0% | 126.2 -8% | 77.2 -44% | 24.25 -82% |
| 4K-64 Read (MB/s) | 618 | 987 60% | 1021 65% | 463.6 -25% | 725 17% |
| 4K-64 Write (MB/s) | 1317 | 1465 11% | 1251 -5% | 413.3 -69% | 169.6 -87% |
| Access Time Read * (ms) | 0.044 | 0.042 5% | 0.053 -20% | 0.133 -202% | 0.172 -291% |
| Access Time Write * (ms) | 0.083 | 0.029 65% | 0.027 67% | 0.049 41% | 0.155 -87% |
| Score Read (Points) | 876 | 1312 50% | 1185 35% | 649 -26% | 869 -1% |
| Score Write (Points) | 1611 | 1739 8% | 1468 -9% | 608 -62% | 346 -79% |
| Score Total (Points) | 2927 | 3662 25% | 3250 11% | 1582 -46% | 1667 -43% |
| Copy ISO MB/s (MB/s) | 2297 | 2761 20% | 1404 -39% | 1249 -46% | |
| Copy Program MB/s (MB/s) | 540 | 622 15% | 402.4 -25% | 53.5 -90% | |
| Copy Game MB/s (MB/s) | 1288 | 1584 23% | 902 -30% | 201.3 -84% | |
| CrystalDiskMark 5.2 / 6 | 2% | -14% | -41% | -38% | |
| Write 4K (MB/s) | 135.2 | 141.1 4% | 149.2 10% | 116 -14% | 28.16 -79% |
| Read 4K (MB/s) | 50.7 | 46.37 -9% | 47.18 -7% | 39.81 -21% | 17.5 -65% |
| Write Seq (MB/s) | 2155 | 1994 -7% | 750 -65% | 1300 -40% | 1195 -45% |
| Read Seq (MB/s) | 2504 | 2275 -9% | 1137 -55% | 803 -68% | 1470 -41% |
| Write 4K Q32T1 (MB/s) | 395.6 | 493.3 25% | 749 89% | 187.6 -53% | 205 -48% |
| Read 4K Q32T1 (MB/s) | 394.5 | 429 9% | 478.7 21% | 305.9 -22% | 692 75% |
| Write Seq Q32T1 (MB/s) | 2987 | 2992 0% | 1453 -51% | 1299 -57% | 1475 -51% |
| Read Seq Q32T1 (MB/s) | 3564 | 3562 0% | 1713 -52% | 1741 -51% | 1920 -46% |
| Write 4K Q8T8 (MB/s) | 409.1 | ||||
| Read 4K Q8T8 (MB/s) | 1137 | ||||
| Totalt genomsnitt (program/inställningar) | 12% /
14% | -9% /
-8% | -47% /
-48% | -54% /
-56% |
* ... mindre är bättre

Kontinuerlig inläsning: DiskSpd Read Loop, Queue Depth 8
| 3DMark 11 Performance | 2197 poäng | |
| 3DMark Cloud Gate Standard Score | 8989 poäng | |
| 3DMark Fire Strike Score | 1209 poäng | |
| 3DMark Time Spy Score | 476 poäng | |
Hjälp | ||
| låg | med. | hög | ultra | |
|---|---|---|---|---|
| The Witcher 3 (2015) | 20.7 | 10.9 | ||
| Dota 2 Reborn (2015) | 84.5 | 49.3 | 22.8 | 20.3 |
| X-Plane 11.11 (2018) | 13.2 | 10.7 | 11.2 |
| Dell Latitude 7310 UHD Graphics 620, i7-10610U, Samsung SSD PM981a MZVLB512HBJQ | Dell Latitude 7300-P99G UHD Graphics 620, i7-8665U, Samsung SSD PM981 MZVLB512HAJQ | Asus ZenBook S13 UX392FN GeForce MX150, i7-8565U, WDC PC SN520 SDAPNUW-512G | Lenovo ThinkPad X395 Vega 6, R3 PRO 3300U, Samsung SSD PM981a MZVLB256HBHQ | HP EliteBook 735 G6 7KN29EA Vega 8, R5 PRO 3500U, WDC PC SN520 SDAPNUW-256G | Apple MacBook Pro 13 2020 2GHz i5 10th-Gen Iris Plus Graphics G7 (Ice Lake 64 EU), i5-1038NG7, Apple SSD SM0512F | |
|---|---|---|---|---|---|---|
| Noise | -2% | -5% | -2% | -1% | -4% | |
| av / miljö * (dB) | 29 | 30 -3% | 28.1 3% | 30.2 -4% | 29.6 -2% | 29.6 -2% |
| Idle Minimum * (dB) | 29 | 30 -3% | 28.1 3% | 30.2 -4% | 29.6 -2% | 29.6 -2% |
| Idle Average * (dB) | 29 | 30 -3% | 28.1 3% | 30.2 -4% | 29.6 -2% | 29.6 -2% |
| Idle Maximum * (dB) | 29 | 30 -3% | 29 -0% | 30.2 -4% | 30.9 -7% | 29.6 -2% |
| Load Average * (dB) | 30.1 | 35 -16% | 41.1 -37% | 34.3 -14% | 33.9 -13% | 34.4 -14% |
| Load Maximum * (dB) | 41.3 | 35 15% | 41.1 -0% | 34.3 17% | 33.9 18% | 42.1 -2% |
| Witcher 3 ultra * (dB) | 41.1 | 36.1 |
* ... mindre är bättre
Ljudnivå
| Låg belastning |
| 29 / 29 / 29 dB(A) |
| Hög belastning |
| 30.1 / 41.3 dB(A) |
 | ||
30 dB tyst 40 dB(A) hörbar 50 dB(A) högt ljud |
||
min: | ||
(-) Den maximala temperaturen på ovansidan är 45.2 °C / 113 F, jämfört med genomsnittet av 34.3 °C / 94 F , allt från 21.2 till 62.5 °C för klassen Office.
(-) Botten värms upp till maximalt 52.8 °C / 127 F, jämfört med genomsnittet av 36.8 °C / 98 F
(+) Vid tomgångsbruk är medeltemperaturen för ovansidan 26.3 °C / 79 F, jämfört med enhetsgenomsnittet på 29.5 °C / ### class_avg_f### F.
(+) Handledsstöden och pekplattan är kallare än hudtemperaturen med maximalt 27.2 °C / 81 F och är därför svala att ta på.
(±) Medeltemperaturen för handledsstödsområdet på liknande enheter var 27.5 °C / 81.5 F (+0.3 °C / 0.5 F).
Dell Latitude 7310 ljudanalys
(+) | högtalare kan spela relativt högt (84 dB)
Bas 100 - 315 Hz
(-) | nästan ingen bas - i genomsnitt 16.2% lägre än medianen
(±) | linjäriteten för basen är genomsnittlig (11.5% delta till föregående frekvens)
Mellan 400 - 2000 Hz
(+) | balanserad mellan - endast 2.8% från medianen
(+) | mids är linjära (4.4% delta till föregående frekvens)
Högsta 2 - 16 kHz
(+) | balanserade toppar - endast 2.5% från medianen
(+) | toppar är linjära (4% delta till föregående frekvens)
Totalt 100 - 16 000 Hz
(+) | det totala ljudet är linjärt (12.4% skillnad mot median)
Jämfört med samma klass
» 5% av alla testade enheter i den här klassen var bättre, 2% liknande, 93% sämre
» Den bästa hade ett delta på 7%, genomsnittet var 21%, sämst var 53%
Jämfört med alla testade enheter
» 11% av alla testade enheter var bättre, 2% liknande, 87% sämre
» Den bästa hade ett delta på 4%, genomsnittet var 23%, sämst var 134%
Apple MacBook 12 (Early 2016) 1.1 GHz ljudanalys
(+) | högtalare kan spela relativt högt (83.6 dB)
Bas 100 - 315 Hz
(±) | reducerad bas - i genomsnitt 11.3% lägre än medianen
(±) | linjäriteten för basen är genomsnittlig (14.2% delta till föregående frekvens)
Mellan 400 - 2000 Hz
(+) | balanserad mellan - endast 2.4% från medianen
(+) | mids är linjära (5.5% delta till föregående frekvens)
Högsta 2 - 16 kHz
(+) | balanserade toppar - endast 2% från medianen
(+) | toppar är linjära (4.5% delta till föregående frekvens)
Totalt 100 - 16 000 Hz
(+) | det totala ljudet är linjärt (10.2% skillnad mot median)
Jämfört med samma klass
» 7% av alla testade enheter i den här klassen var bättre, 2% liknande, 90% sämre
» Den bästa hade ett delta på 5%, genomsnittet var 18%, sämst var 53%
Jämfört med alla testade enheter
» 5% av alla testade enheter var bättre, 1% liknande, 94% sämre
» Den bästa hade ett delta på 4%, genomsnittet var 23%, sämst var 134%
| Av/Standby | |
| Låg belastning | |
| Hög belastning |
|
Förklaring:
min: | |
| Dell Latitude 7310 i7-10610U, UHD Graphics 620, Samsung SSD PM981a MZVLB512HBJQ, IPS, 1920x1080, 13.3" | Dell Latitude 7300-P99G i7-8665U, UHD Graphics 620, Samsung SSD PM981 MZVLB512HAJQ, IPS LED, 1920x1080, 13.3" | Asus ZenBook S13 UX392FN i7-8565U, GeForce MX150, WDC PC SN520 SDAPNUW-512G, IPS, 1920x1080, 13.9" | Lenovo ThinkPad X395 R3 PRO 3300U, Vega 6, Samsung SSD PM981a MZVLB256HBHQ, IPS, 1920x1080, 13.3" | HP EliteBook 735 G6 7KN29EA R5 PRO 3500U, Vega 8, WDC PC SN520 SDAPNUW-256G, IPS LED, 1920x1080, 13.3" | Apple MacBook Pro 13 2020 2GHz i5 10th-Gen i5-1038NG7, Iris Plus Graphics G7 (Ice Lake 64 EU), Apple SSD SM0512F, IPS, 2560x1600, 13.3" | |
|---|---|---|---|---|---|---|
| Power Consumption | -26% | -46% | -29% | -53% | -60% | |
| Idle Minimum * (Watt) | 2.7 | 2.5 7% | 3.4 -26% | 4 -48% | 5.6 -107% | 3.8 -41% |
| Idle Average * (Watt) | 4.4 | 6.6 -50% | 6.3 -43% | 6.3 -43% | 8.1 -84% | 8.6 -95% |
| Idle Maximum * (Watt) | 4.8 | 8.7 -81% | 10.4 -117% | 9.3 -94% | 9.6 -100% | 10.3 -115% |
| Load Average * (Watt) | 33.4 | 35.4 -6% | 51 -53% | 34 -2% | 34.3 -3% | 52.1 -56% |
| Load Maximum * (Watt) | 69.7 | 68.1 2% | 62.7 10% | 42 40% | 48.6 30% | 65.2 6% |
| Witcher 3 ultra * (Watt) | 39 | 48.2 |
* ... mindre är bättre
| Dell Latitude 7310 i7-10610U, UHD Graphics 620, 52 Wh | Dell Latitude 7300-P99G i7-8665U, UHD Graphics 620, 60 Wh | Asus ZenBook S13 UX392FN i7-8565U, GeForce MX150, 50 Wh | Lenovo ThinkPad X395 R3 PRO 3300U, Vega 6, 48 Wh | HP EliteBook 735 G6 7KN29EA R5 PRO 3500U, Vega 8, 50 Wh | Apple MacBook Pro 13 2020 2GHz i5 10th-Gen i5-1038NG7, Iris Plus Graphics G7 (Ice Lake 64 EU), 58 Wh | |
|---|---|---|---|---|---|---|
| Batteridrifttid | -4% | -21% | 16% | -35% | -4% | |
| Reader / Idle (h) | 37.4 | 28.5 -24% | 18.4 -51% | |||
| WiFi v1.3 (h) | 12.6 | 10.8 -14% | 8.4 -33% | 10.9 -13% | 8.2 -35% | 12.1 -4% |
| Load (h) | 1.8 | 1.9 6% | 1.7 -6% | 3.8 111% |
För
Emot
Läs den fullständiga versionen av den här recensionen på engelska här.
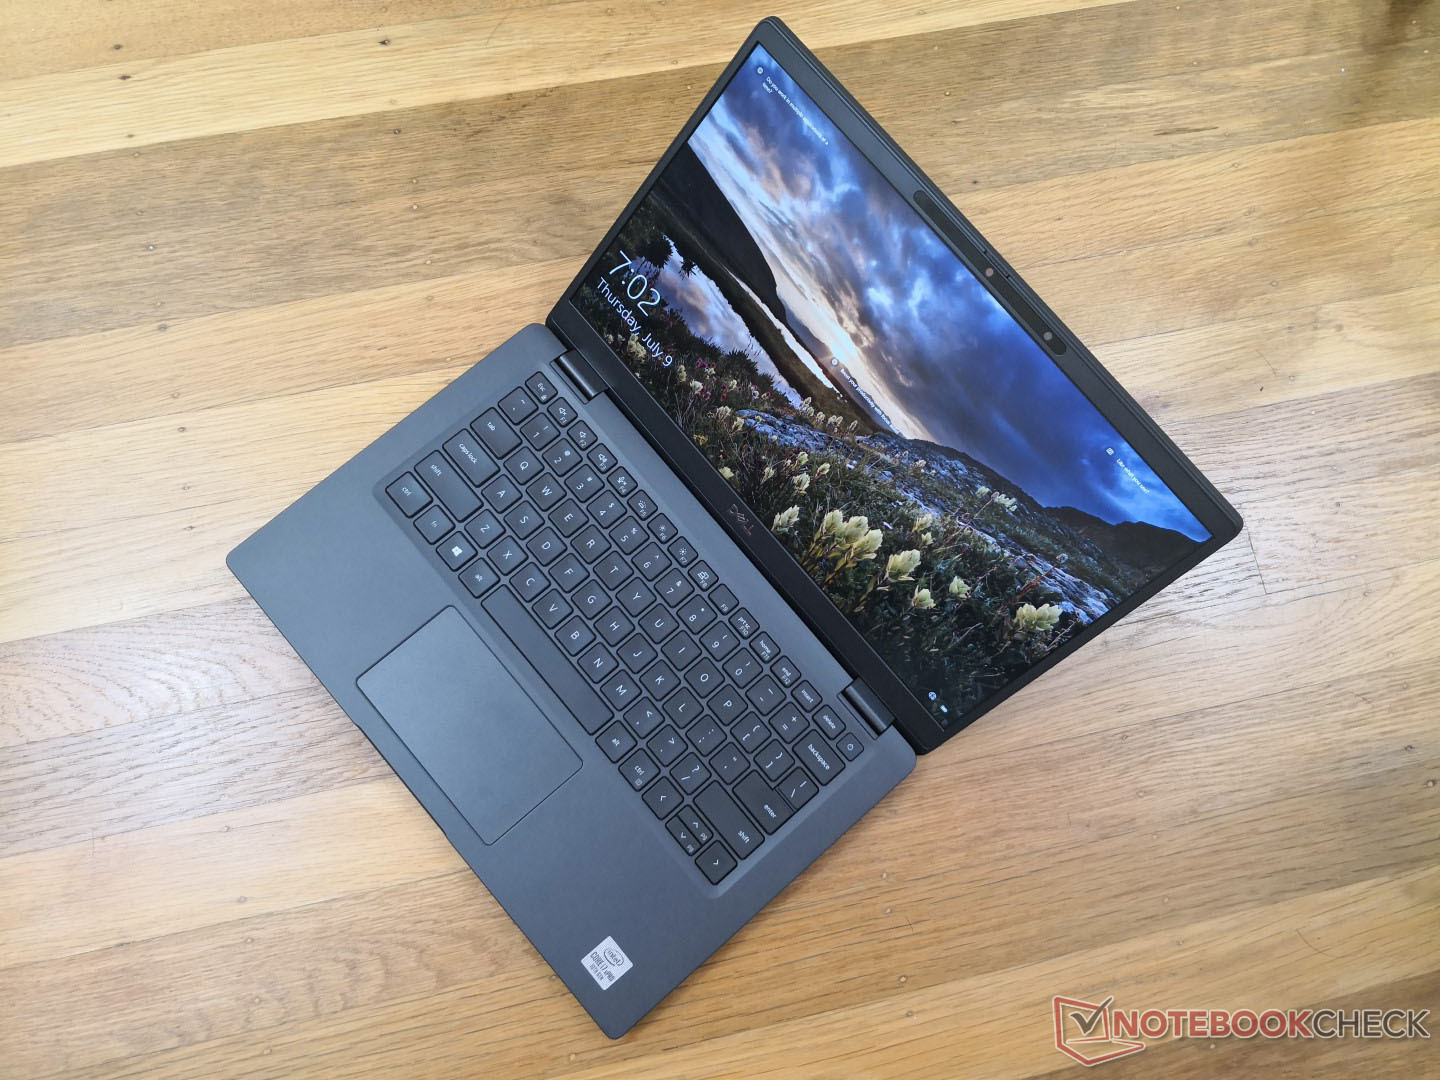
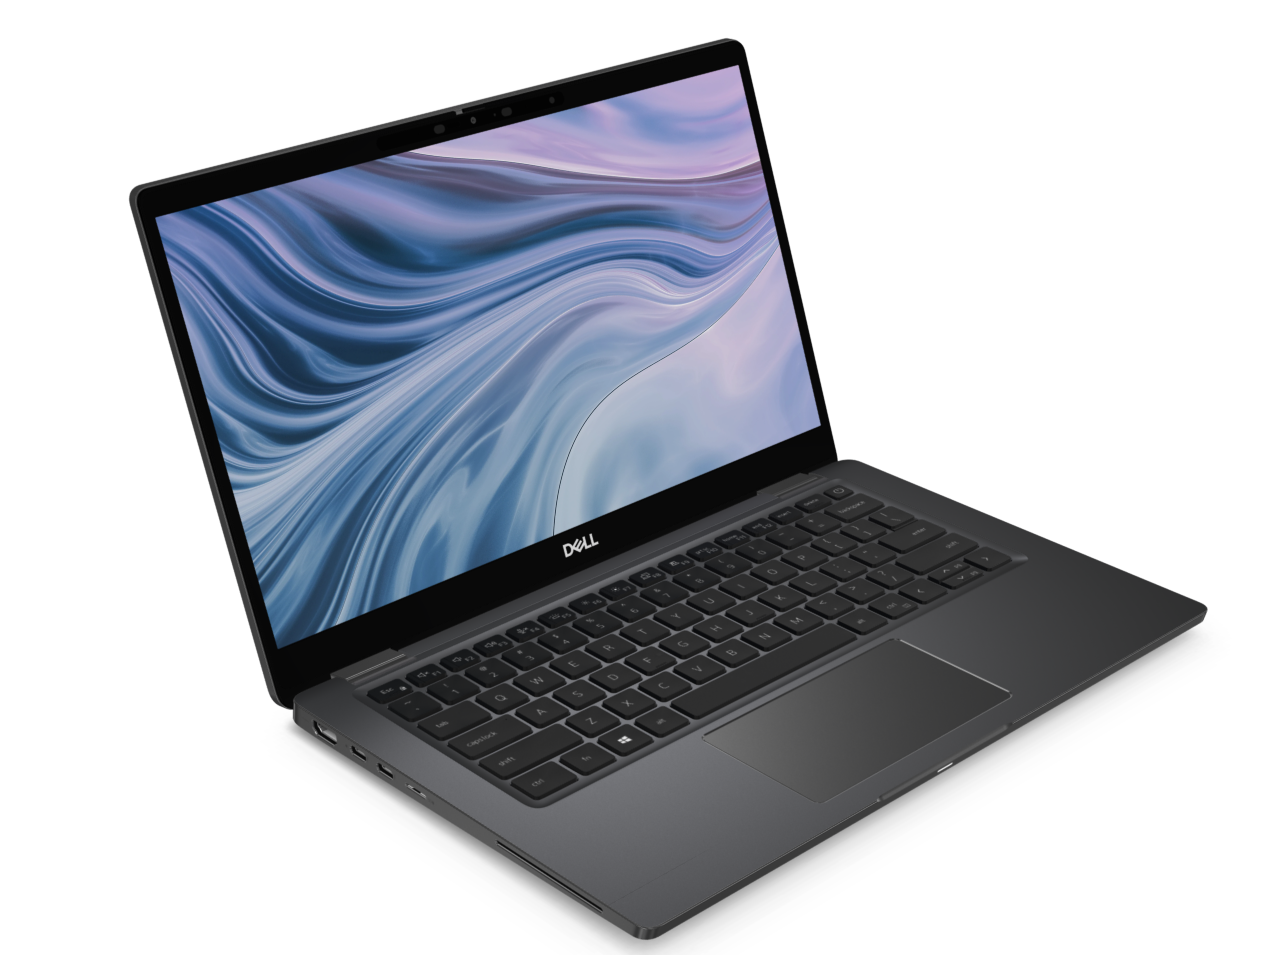
Som om förra årets Latitude 7300 inte var tillräckligt kompakt: Latitude 7310 är nu ännu mindre, lättare och diskretare för att kunna passa in i princip vilken kontors- eller arbetsmiljö som helst. Bortsett från en svampig klickplatta är det få saker man inte kan uppskatta med Dells senaste toppskikts-laptop.
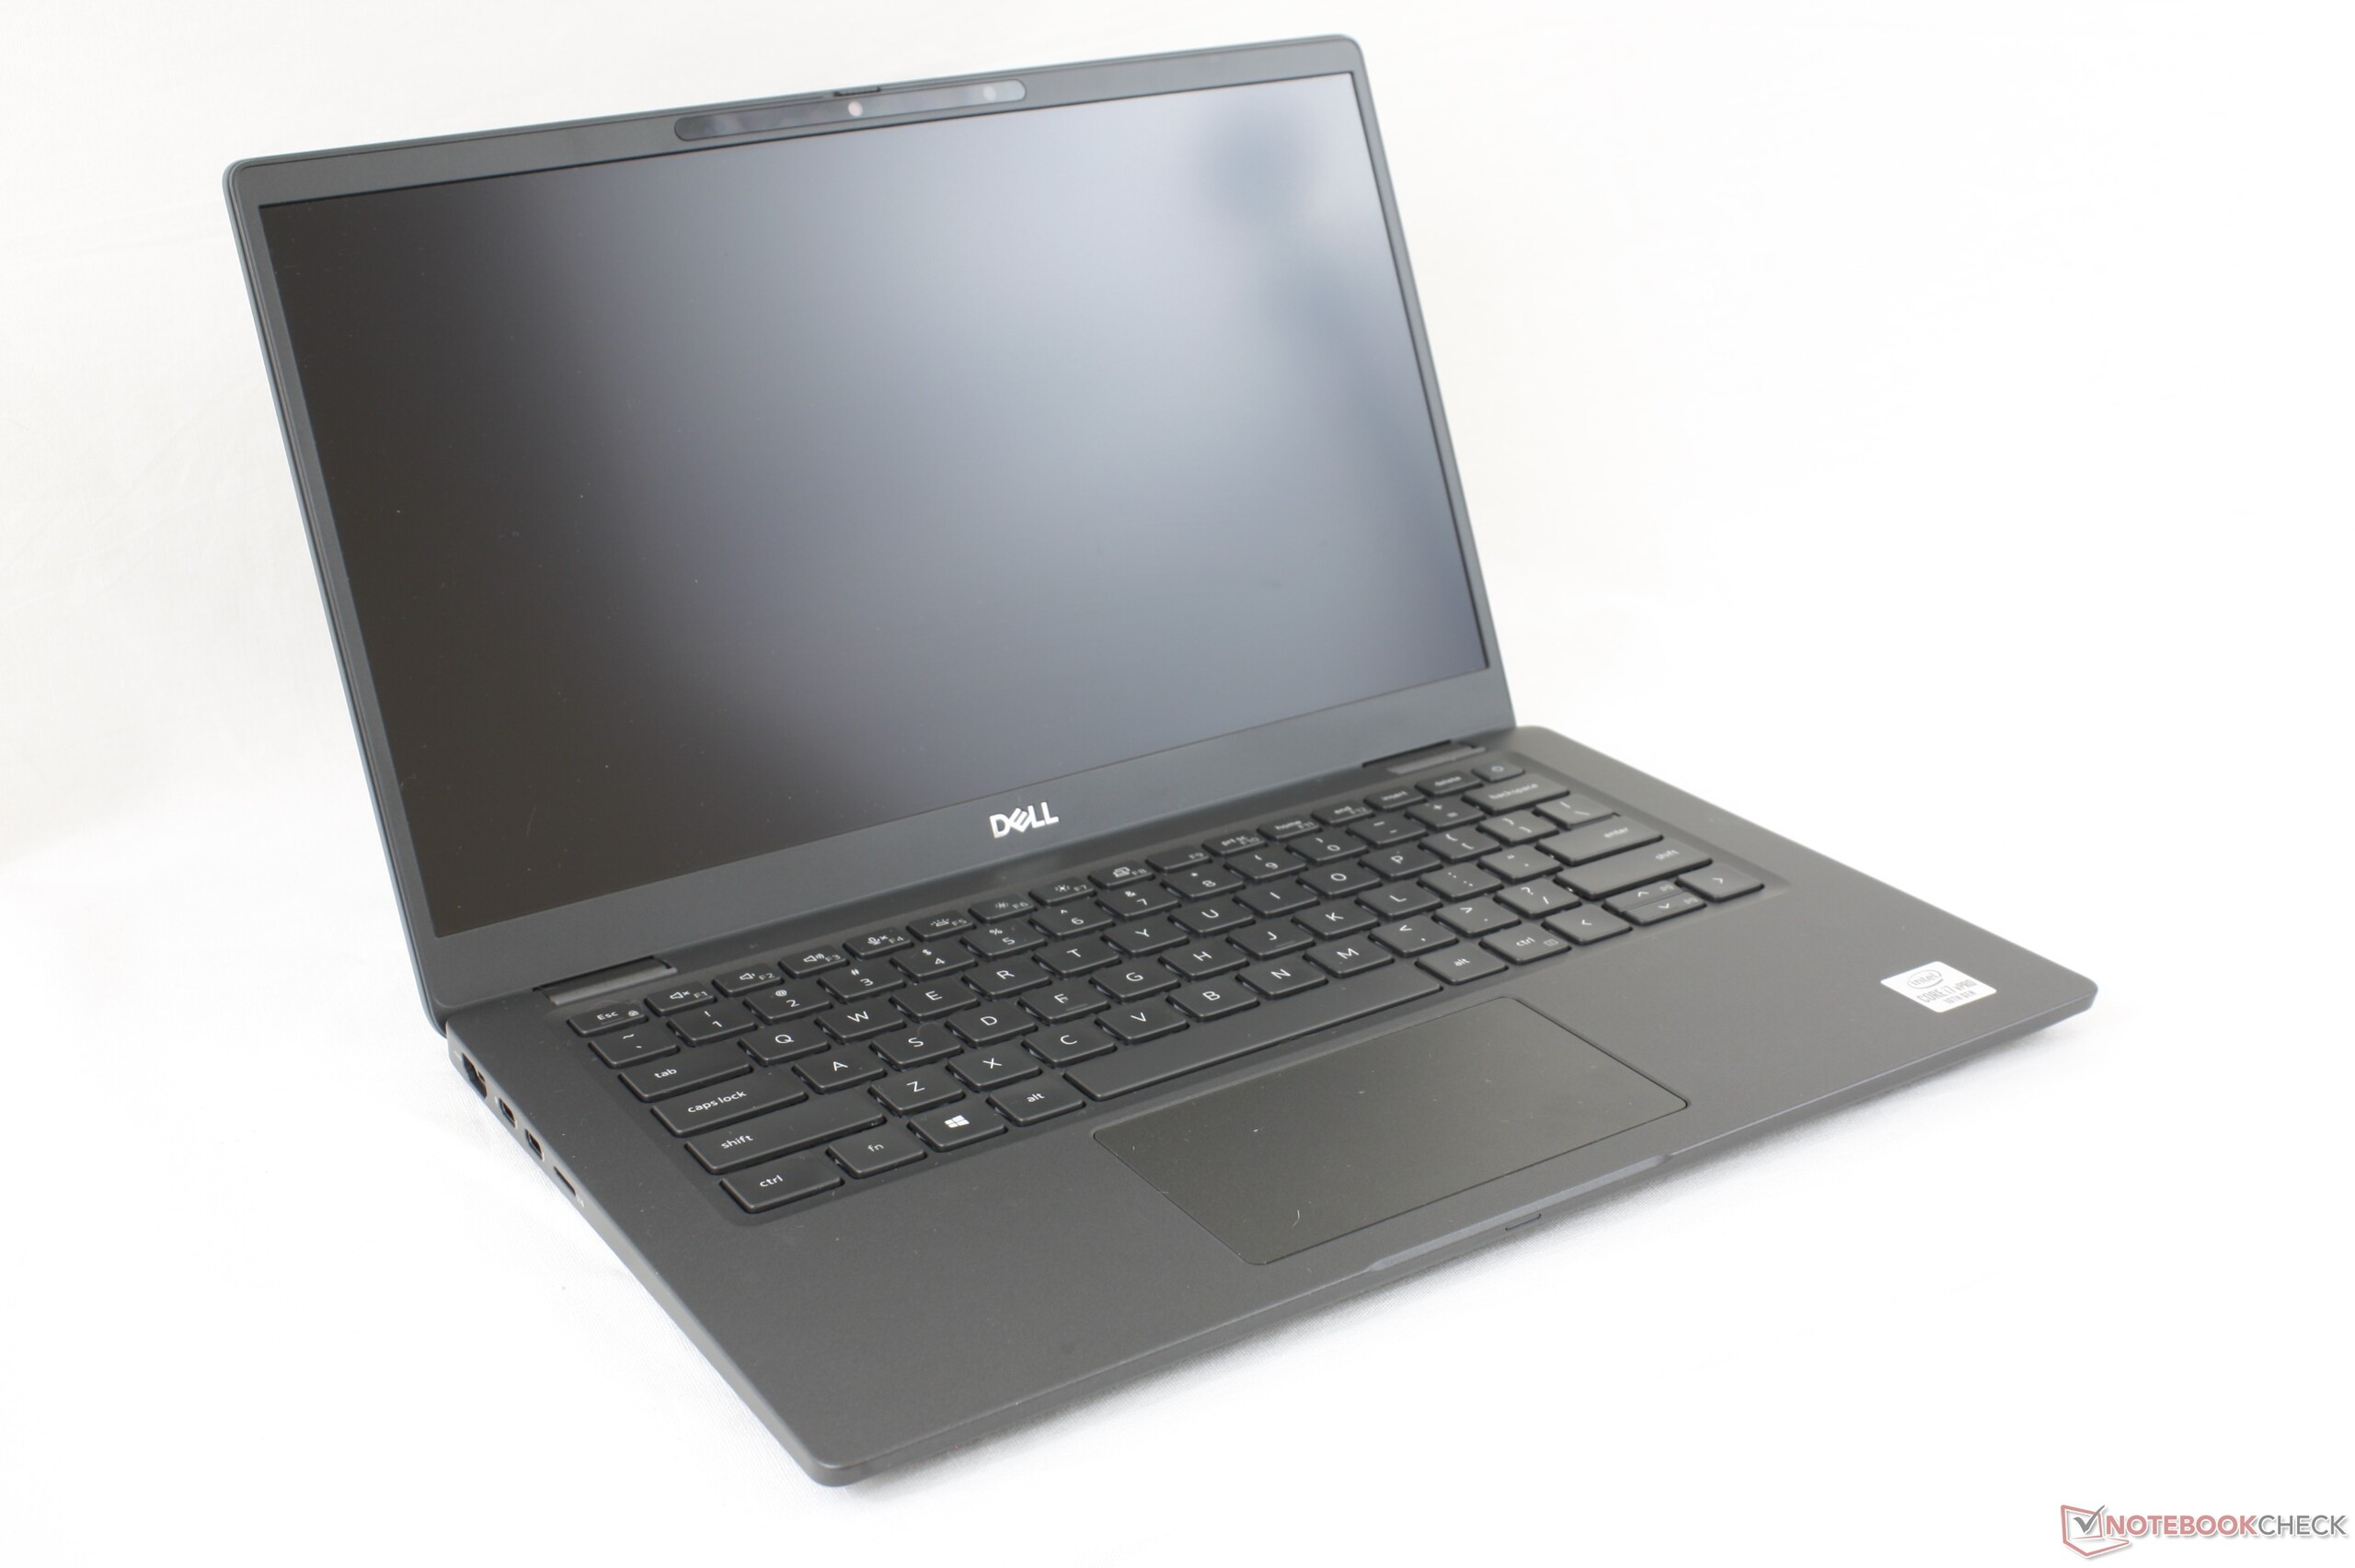
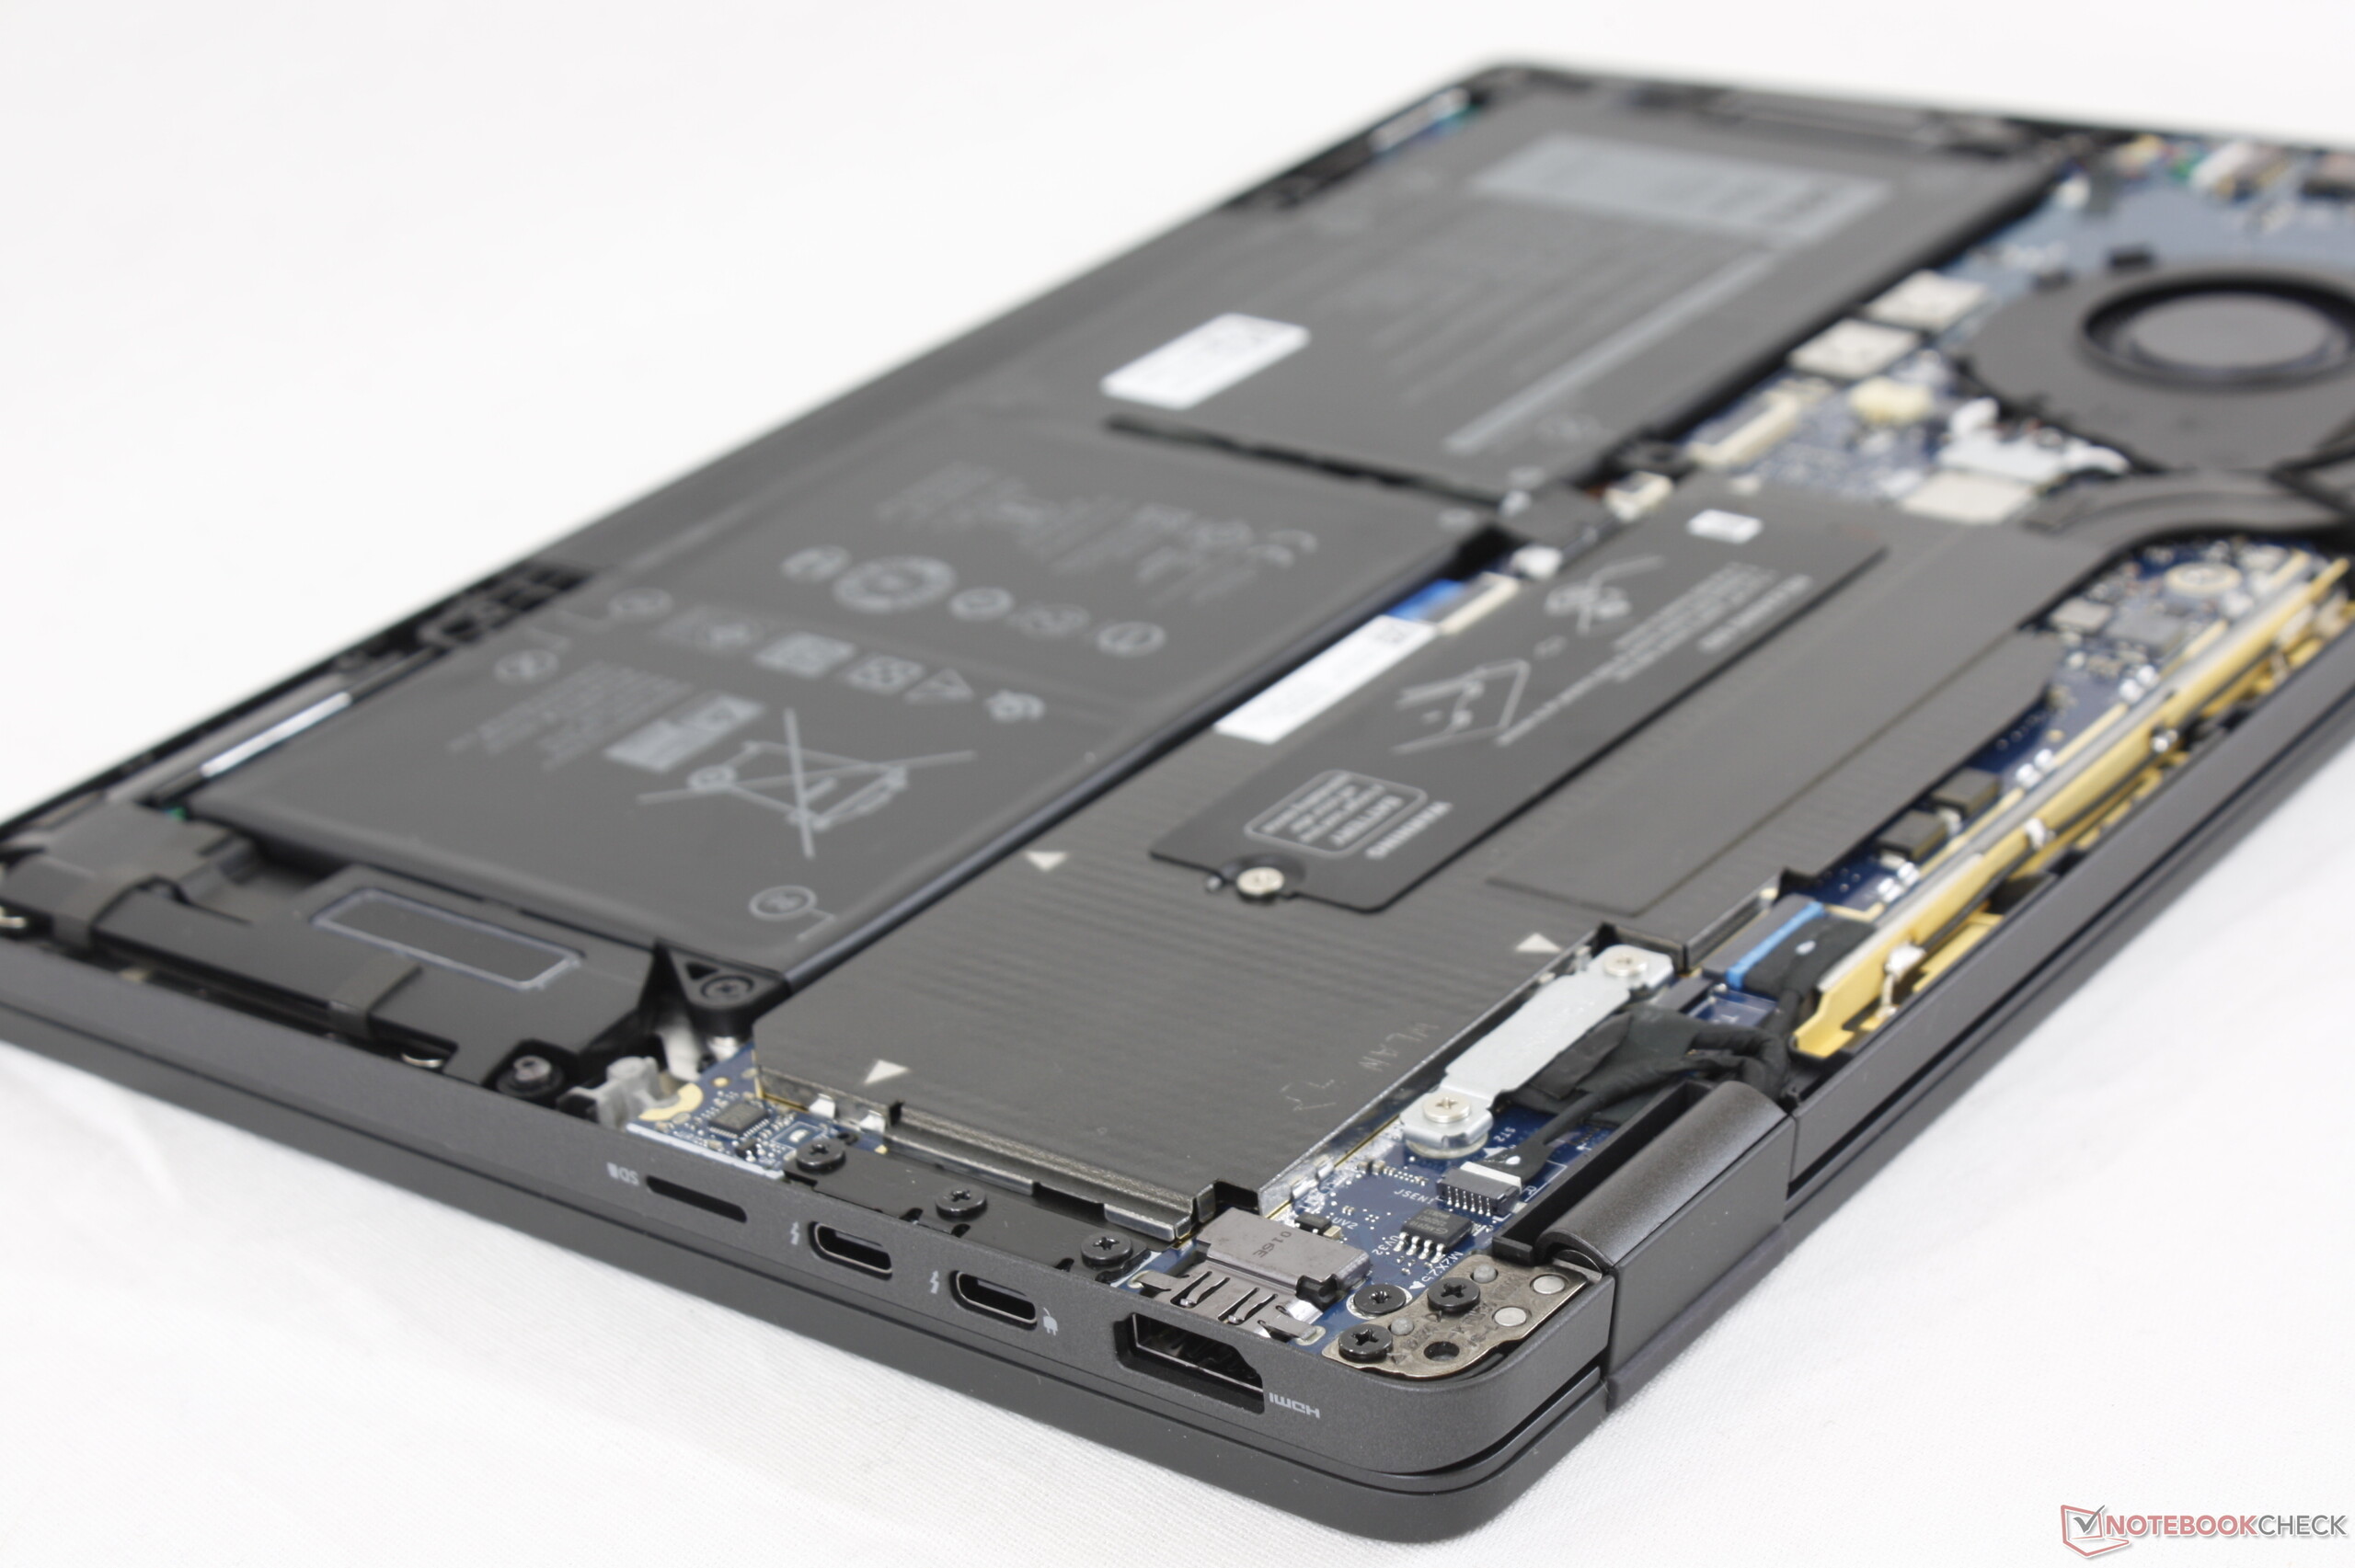
Det som däremot stör oss är att vissa funktioner saknas. En TrackPoint och dedikerade musknappar hade till exempel verkligen gjort det lättare och mer exakt att klicka eller styra pekaren. Användare som föredrar taktila musknappar och möjligheten att uppgradera RAM och WLAN har starka anledningar att föredra Latitude 7300 framför 7310. Dessutom hade ett alternativ för en skärm på 500 nit eller mer gjort den bättre att använda utomhus eller som resekamrat.
Det blir också tydligt att den saknar bättre processoralternativ än en fyrkärnig Comet Lake-U. Även om den inte direkt riktar sig åt högprestanda-kunder börjar konkurrenterna erbjuda betydligt snabbare AMD Ryzen-processor med samma eller liknande energiförbrukning, vilket ger överlägsen prestanda per Watt. Faktum att Latitude 7300 kan prestera på nästan samma nivå som Latitude 7310 hjälper inte heller.
Latitude 7310 är en förfinad version av Latitude 7300. Det tappar en del funktioner på vägen, men en tjusigare och portablare design kan vara värt det för den som ofta är på resande fot.
Dell Latitude 7310
- 07/13/2020 v7 (old)
Allen Ngo
Price comparison
