Läs den fullständiga versionen av den här recensionen på engelska här.
Dell har gjort nästan allt rätt med nya Latitude 7390. För inte mer än 14 000 kronor för modellen vi testat får man ett välavrundat paket som bara har ett fåtal brister.
| SD Card Reader | |
| average JPG Copy Test (av. of 3 runs) | |
| Dell Latitude 7390 (Toshiba Exceria Pro M501) | |
| Dell Latitude 13 7380 (Toshiba Exceria Pro SDXC 64 GB UHS-II) | |
| Toshiba Portege X30-D (PT274U-01N001) (Toshiba Exceria Pro M401) | |
| Genomsnitt av klass Office (19.8 - 198.5, n=22, senaste 2 åren) | |
| Asus Zenbook UX3430UQ-GV012T (Toshiba Exceria Pro SDXC 64 GB UHS-II) | |
| maximum AS SSD Seq Read Test (1GB) | |
| Dell Latitude 7390 (Toshiba Exceria Pro M501) | |
| Toshiba Portege X30-D (PT274U-01N001) (Toshiba Exceria Pro M401) | |
| Dell Latitude 13 7380 (Toshiba Exceria Pro SDXC 64 GB UHS-II) | |
| Genomsnitt av klass Office (27.4 - 249, n=21, senaste 2 åren) | |
| Asus Zenbook UX3430UQ-GV012T | |
| Networking | |
| iperf3 transmit AX12 | |
| Asus Zenbook UX3430UQ-GV012T | |
| Dell Latitude 13 7380 | |
| Dell Latitude 7390 | |
| Toshiba Portege X30-D (PT274U-01N001) | |
| HP EliteBook x360 1030 G2 | |
| iperf3 receive AX12 | |
| Toshiba Portege X30-D (PT274U-01N001) | |
| HP EliteBook x360 1030 G2 | |
| Dell Latitude 7390 | |
| Dell Latitude 13 7380 | |
| Asus Zenbook UX3430UQ-GV012T | |
| |||||||||||||||||||||||||
| Dell Latitude 7390 AU Optronics AUO462D / B133HAN [DELL P/N:F7VDJ], , 1920x1080, 13.3" | Asus Zenbook UX3430UQ-GV012T Chi Mei CMN14D2 / N140HCE-EN1, , 1920x1080, 14" | HP EliteBook x360 1030 G2 CMN1374, , 1920x1080, 13.3" | Toshiba Portege X30-D (PT274U-01N001) Toshiba TOS508F, , 1920x1080, 13.3" | Dell Latitude 13 7380 LGD0589, , 1920x1080, 13.3" | |
|---|---|---|---|---|---|
| Display | 6% | -1% | 2% | 1% | |
| Display P3 Coverage (%) | 65.1 | 67.1 3% | 65.5 1% | 66.4 2% | 65.5 1% |
| sRGB Coverage (%) | 90.8 | 98.7 9% | 88.8 -2% | 93.5 3% | 91.8 1% |
| AdobeRGB 1998 Coverage (%) | 65.9 | 69.3 5% | 64.9 -2% | 66.6 1% | 65.8 0% |
| Response Times | 19% | 5% | 21% | 23% | |
| Response Time Grey 50% / Grey 80% * (ms) | 48.8 ? | 40 ? 18% | 55.2 ? -13% | 36.8 ? 25% | 34 ? 30% |
| Response Time Black / White * (ms) | 35.2 ? | 28 ? 20% | 27.2 ? 23% | 29.6 ? 16% | 29.6 ? 16% |
| PWM Frequency (Hz) | |||||
| Screen | 1% | -19% | 7% | -25% | |
| Brightness middle (cd/m²) | 329 | 353 7% | 262 -20% | 332.6 1% | 317 -4% |
| Brightness (cd/m²) | 316 | 366 16% | 256 -19% | 323 2% | 295 -7% |
| Brightness Distribution (%) | 92 | 88 -4% | 83 -10% | 86 -7% | 87 -5% |
| Black Level * (cd/m²) | 0.25 | 0.34 -36% | 0.25 -0% | 0.28 -12% | 0.3 -20% |
| Contrast (:1) | 1316 | 1038 -21% | 1048 -20% | 1188 -10% | 1057 -20% |
| Colorchecker dE 2000 * | 4.3 | 2.88 33% | 5.13 -19% | 2.6 40% | 6.3 -47% |
| Colorchecker dE 2000 max. * | 7.8 | 6.61 15% | 9.46 -21% | 6.7 14% | 10.4 -33% |
| Colorchecker dE 2000 calibrated * | 2.5 | ||||
| Greyscale dE 2000 * | 3.6 | 4.24 -18% | 6.23 -73% | 2.5 31% | 7.8 -117% |
| Gamma | 2.43 91% | 2.38 92% | 2.45 90% | 2.12 104% | 1.81 122% |
| CCT | 6928 94% | 7380 88% | 6413 101% | 6720 97% | 7120 91% |
| Color Space (Percent of AdobeRGB 1998) (%) | 59.1 | 64 8% | 57.84 -2% | 62 5% | 61 3% |
| Color Space (Percent of sRGB) (%) | 90.6 | 99 9% | 88.57 -2% | 94 4% | 92 2% |
| Totalt genomsnitt (program/inställningar) | 9% /
4% | -5% /
-12% | 10% /
8% | -0% /
-13% |
* ... mindre är bättre
| ↔ Svarstid svart till vitt | ||
|---|---|---|
| 35.2 ms ... stiga ↗ och falla ↘ kombinerat | ↗ 21.2 ms stiga | 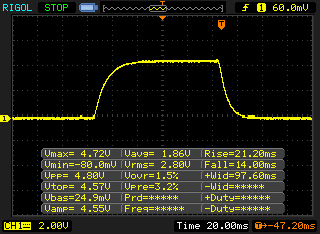 |
| ↘ 14 ms hösten | ||
| Skärmen visar långsamma svarsfrekvenser i våra tester och kommer att vara otillfredsställande för spelare. I jämförelse sträcker sig alla testade enheter från 0.1 (minst) till 240 (maximalt) ms. » 93 % av alla enheter är bättre. Detta innebär att den uppmätta svarstiden är sämre än genomsnittet av alla testade enheter (19.8 ms). | ||
| ↔ Svarstid 50 % grått till 80 % grått | ||
| 48.8 ms ... stiga ↗ och falla ↘ kombinerat | ↗ 24.8 ms stiga | 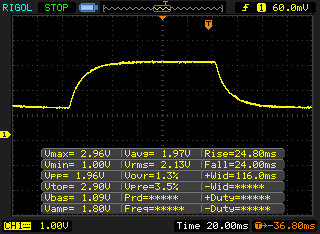 |
| ↘ 24 ms hösten | ||
| Skärmen visar långsamma svarsfrekvenser i våra tester och kommer att vara otillfredsställande för spelare. I jämförelse sträcker sig alla testade enheter från 0.165 (minst) till 636 (maximalt) ms. » 84 % av alla enheter är bättre. Detta innebär att den uppmätta svarstiden är sämre än genomsnittet av alla testade enheter (31 ms). | ||
| Skärmflimmer / PWM upptäcktes inte | 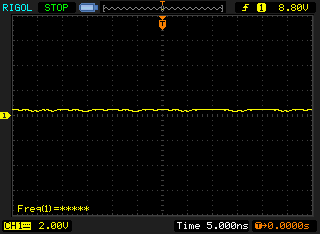 | ||
Som jämförelse: 52 % av alla testade enheter använder inte PWM för att dämpa skärmen. Om PWM upptäcktes mättes ett medelvärde av 7754 (minst: 5 - maximum: 343500) Hz. | |||
| Cinebench R15 | |
| CPU Single 64Bit | |
| Genomsnitt av klass Office (99.5 - 316, n=77, senaste 2 åren) | |
| Dell Latitude 13 7380 | |
| Dell Latitude 7390 | |
| Genomsnitt Intel Core i5-8350U (128 - 153, n=8) | |
| HP EliteBook x360 1030 G2 | |
| Asus Zenbook UX3430UQ-GV012T | |
| Toshiba Portege X30-D (PT274U-01N001) | |
| CPU Multi 64Bit | |
| Genomsnitt av klass Office (250 - 3380, n=77, senaste 2 åren) | |
| Dell Latitude 7390 | |
| Genomsnitt Intel Core i5-8350U (346 - 631, n=8) | |
| Dell Latitude 13 7380 | |
| HP EliteBook x360 1030 G2 | |
| Asus Zenbook UX3430UQ-GV012T | |
| Toshiba Portege X30-D (PT274U-01N001) | |
| PCMark 8 | |
| Home Score Accelerated v2 | |
| Genomsnitt av klass Office (n=1senaste 2 åren) | |
| Asus Zenbook UX3430UQ-GV012T | |
| Dell Latitude 13 7380 | |
| HP EliteBook x360 1030 G2 | |
| Dell Latitude 7390 | |
| Genomsnitt Intel Core i5-8350U, Intel UHD Graphics 620 (3063 - 3776, n=7) | |
| Toshiba Portege X30-D (PT274U-01N001) | |
| Work Score Accelerated v2 | |
| Genomsnitt av klass Office (n=1senaste 2 åren) | |
| Dell Latitude 13 7380 | |
| Toshiba Portege X30-D (PT274U-01N001) | |
| Asus Zenbook UX3430UQ-GV012T | |
| HP EliteBook x360 1030 G2 | |
| Dell Latitude 7390 | |
| Genomsnitt Intel Core i5-8350U, Intel UHD Graphics 620 (4200 - 4906, n=6) | |
| PCMark 8 Home Score Accelerated v2 | 3600 poäng | |
| PCMark 8 Work Score Accelerated v2 | 4768 poäng | |
| PCMark 10 Score | 3577 poäng | |
Hjälp | ||
| Dell Latitude 7390 SK hynix SC311 M.2 | Asus Zenbook UX3430UQ-GV012T SanDisk SD8SN8U512G1002 | HP EliteBook x360 1030 G2 Sandisk SD8TN8U-256G-1006 | Toshiba Portege X30-D (PT274U-01N001) Samsung PM961 MZVLW256HEHP | Genomsnitt SK hynix SC311 M.2 | |
|---|---|---|---|---|---|
| CrystalDiskMark 3.0 | 5% | -1% | 129% | 1% | |
| Read Seq (MB/s) | 493.4 | 500 1% | 467.1 -5% | 1270 157% | 494 ? 0% |
| Write Seq (MB/s) | 413.4 | 457.4 11% | 443.6 7% | 1213 193% | 401 ? -3% |
| Read 512 (MB/s) | 354.6 | 345.6 -3% | 312.3 -12% | 858 142% | 365 ? 3% |
| Write 512 (MB/s) | 322.6 | 415 29% | 372.5 15% | 763 137% | 323 ? 0% |
| Read 4k (MB/s) | 27.63 | 28.34 3% | 29.43 7% | 40.9 48% | 27.2 ? -2% |
| Write 4k (MB/s) | 64.7 | 56.8 -12% | 56.5 -13% | 143.6 122% | 68.3 ? 6% |
| Read 4k QD32 (MB/s) | 284.4 | 311.3 9% | 311.3 9% | 626 120% | 284 ? 0% |
| Write 4k QD32 (MB/s) | 254.5 | 251.1 -1% | 225.2 -12% | 536 111% | 267 ? 5% |

| 3DMark 11 - 1280x720 Performance GPU | |
| Genomsnitt av klass Office (2551 - 18313, n=72, senaste 2 åren) | |
| Asus Zenbook UX3430UQ-GV012T | |
| Genomsnitt Intel UHD Graphics 620 (1144 - 3432, n=244) | |
| Dell Latitude 13 7380 | |
| Dell Latitude 7390 | |
| HP EliteBook x360 1030 G2 | |
| Toshiba Portege X30-D (PT274U-01N001) | |
| 3DMark | |
| 1280x720 Cloud Gate Standard Graphics | |
| Genomsnitt av klass Office (11640 - 118515, n=38, senaste 2 åren) | |
| Genomsnitt Intel UHD Graphics 620 (6205 - 16400, n=225) | |
| Asus Zenbook UX3430UQ-GV012T | |
| HP EliteBook x360 1030 G2 | |
| Dell Latitude 7390 | |
| Dell Latitude 13 7380 | |
| Toshiba Portege X30-D (PT274U-01N001) | |
| 1920x1080 Fire Strike Graphics | |
| Genomsnitt av klass Office (736 - 21871, n=75, senaste 2 åren) | |
| Asus Zenbook UX3430UQ-GV012T | |
| Genomsnitt Intel UHD Graphics 620 (557 - 2608, n=213) | |
| HP EliteBook x360 1030 G2 | |
| Dell Latitude 7390 | |
| Dell Latitude 13 7380 | |
| Toshiba Portege X30-D (PT274U-01N001) | |
| 3DMark 11 Performance | 1755 poäng | |
| 3DMark Cloud Gate Standard Score | 7618 poäng | |
| 3DMark Fire Strike Score | 901 poäng | |
Hjälp | ||
| låg | med. | hög | ultra | |
|---|---|---|---|---|
| Rise of the Tomb Raider (2016) | 19.6 | |||
| Farming Simulator 17 (2016) | 51.2 | 19.7 | ||
| Final Fantasy XV Benchmark (2018) | 8.8 |
Ljudnivå
| Låg belastning |
| 29.5 / 29.5 / 29.5 dB(A) |
| Hög belastning |
| 32.4 / 39.9 dB(A) |
 | ||
30 dB tyst 40 dB(A) hörbar 50 dB(A) högt ljud |
||
min: | ||
(+) | högtalare kan spela relativt högt (83.1 dB)
Bas 100 - 315 Hz
(-) | nästan ingen bas - i genomsnitt 22.5% lägre än medianen
(±) | linjäriteten för basen är genomsnittlig (10.7% delta till föregående frekvens)
Mellan 400 - 2000 Hz
(±) | högre mellan - i genomsnitt 5% högre än median
(+) | mids är linjära (4.7% delta till föregående frekvens)
Högsta 2 - 16 kHz
(±) | högre toppar - i genomsnitt 5.8% högre än medianen
(+) | toppar är linjära (6% delta till föregående frekvens)
Totalt 100 - 16 000 Hz
(±) | linjäriteten för det totala ljudet är genomsnittlig (20.7% skillnad mot median)
Jämfört med samma klass
» 48% av alla testade enheter i den här klassen var bättre, 10% liknande, 42% sämre
» Den bästa hade ett delta på 7%, genomsnittet var 21%, sämst var 53%
Jämfört med alla testade enheter
» 56% av alla testade enheter var bättre, 8% liknande, 36% sämre
» Den bästa hade ett delta på 4%, genomsnittet var 23%, sämst var 134%
(±) | högtalarljudstyrkan är genomsnittlig men bra (75 dB)
Bas 100 - 315 Hz
(-) | nästan ingen bas - i genomsnitt 18.9% lägre än medianen
(±) | linjäriteten för basen är genomsnittlig (12.2% delta till föregående frekvens)
Mellan 400 - 2000 Hz
(+) | balanserad mellan - endast 3.4% från medianen
(+) | mids är linjära (6.9% delta till föregående frekvens)
Högsta 2 - 16 kHz
(+) | balanserade toppar - endast 2.7% från medianen
(+) | toppar är linjära (5% delta till föregående frekvens)
Totalt 100 - 16 000 Hz
(±) | linjäriteten för det totala ljudet är genomsnittlig (20.4% skillnad mot median)
Jämfört med samma klass
» 65% av alla testade enheter i den här klassen var bättre, 8% liknande, 26% sämre
» Den bästa hade ett delta på 5%, genomsnittet var 18%, sämst var 53%
Jämfört med alla testade enheter
» 54% av alla testade enheter var bättre, 8% liknande, 38% sämre
» Den bästa hade ett delta på 4%, genomsnittet var 23%, sämst var 134%
(+) | högtalare kan spela relativt högt (86.3 dB)
Analysis not possible as minimum curve is missing or too high
(±) | högtalarljudstyrkan är genomsnittlig men bra (77 dB)
Bas 100 - 315 Hz
(-) | nästan ingen bas - i genomsnitt 16.7% lägre än medianen
(±) | linjäriteten för basen är genomsnittlig (14.2% delta till föregående frekvens)
Mellan 400 - 2000 Hz
(+) | balanserad mellan - endast 2.6% från medianen
(+) | mids är linjära (6.8% delta till föregående frekvens)
Högsta 2 - 16 kHz
(+) | balanserade toppar - endast 3.5% från medianen
(±) | linjäriteten för toppar är genomsnittlig (9.3% delta till föregående frekvens)
Totalt 100 - 16 000 Hz
(±) | linjäriteten för det totala ljudet är genomsnittlig (19.7% skillnad mot median)
Jämfört med samma klass
» 41% av alla testade enheter i den här klassen var bättre, 7% liknande, 51% sämre
» Den bästa hade ett delta på 7%, genomsnittet var 21%, sämst var 53%
Jämfört med alla testade enheter
» 50% av alla testade enheter var bättre, 7% liknande, 43% sämre
» Den bästa hade ett delta på 4%, genomsnittet var 23%, sämst var 134%
(-) | inte särskilt höga högtalare (70.9 dB)
Bas 100 - 315 Hz
(±) | reducerad bas - i genomsnitt 12.8% lägre än medianen
(±) | linjäriteten för basen är genomsnittlig (12.8% delta till föregående frekvens)
Mellan 400 - 2000 Hz
(+) | balanserad mellan - endast 1.9% från medianen
(±) | linjäriteten för mids är genomsnittlig (7.2% delta till föregående frekvens)
Högsta 2 - 16 kHz
(+) | balanserade toppar - endast 4.5% från medianen
(±) | linjäriteten för toppar är genomsnittlig (12.1% delta till föregående frekvens)
Totalt 100 - 16 000 Hz
(±) | linjäriteten för det totala ljudet är genomsnittlig (22.8% skillnad mot median)
Jämfört med samma klass
» 63% av alla testade enheter i den här klassen var bättre, 8% liknande, 29% sämre
» Den bästa hade ett delta på 7%, genomsnittet var 21%, sämst var 53%
Jämfört med alla testade enheter
» 68% av alla testade enheter var bättre, 5% liknande, 27% sämre
» Den bästa hade ett delta på 4%, genomsnittet var 23%, sämst var 134%
| Av/Standby | |
| Låg belastning | |
| Hög belastning |
|
Förklaring:
min: | |
| Dell Latitude 7390 i5-8350U, UHD Graphics 620, SK hynix SC311 M.2, IPS, 1920x1080, 13.3" | Asus Zenbook UX3430UQ-GV012T i7-7500U, GeForce 940MX, SanDisk SD8SN8U512G1002, IPS, 1920x1080, 14" | HP EliteBook x360 1030 G2 i5-7300U, HD Graphics 620, Sandisk SD8TN8U-256G-1006, IPS, 1920x1080, 13.3" | Toshiba Portege X30-D (PT274U-01N001) i7-7600U, HD Graphics 620, Samsung PM961 MZVLW256HEHP, IPS, 1920x1080, 13.3" | Dell Latitude 13 7380 i7-7600U, HD Graphics 620, Samsung PM961 MZVLW256HEHP, IPS, 1920x1080, 13.3" | |
|---|---|---|---|---|---|
| Power Consumption | 4% | 7% | -11% | 11% | |
| Idle Minimum * (Watt) | 2.34 | 2.6 -11% | 3.2 -37% | 4.6 -97% | 3.2 -37% |
| Idle Average * (Watt) | 5.6 | 5.9 -5% | 5.5 2% | 7.6 -36% | 5.5 2% |
| Idle Maximum * (Watt) | 6.5 | 6.25 4% | 6.5 -0% | 8.2 -26% | 6.1 6% |
| Load Average * (Watt) | 43 | 42 2% | 29.7 31% | 23.8 45% | 29.5 31% |
| Load Maximum * (Watt) | 67.4 | 46 32% | 41.3 39% | 28 58% | 32 53% |
* ... mindre är bättre
| Dell Latitude 7390 i5-8350U, UHD Graphics 620, 60 Wh | Asus Zenbook UX3430UQ-GV012T i7-7500U, GeForce 940MX, 50 Wh | HP EliteBook x360 1030 G2 i5-7300U, HD Graphics 620, 57 Wh | Toshiba Portege X30-D (PT274U-01N001) i7-7600U, HD Graphics 620, 48 Wh | Dell Latitude 13 7380 i7-7600U, HD Graphics 620, 60 Wh | Genomsnitt av klass Office | |
|---|---|---|---|---|---|---|
| Batteridrifttid | -8% | 48% | -7% | 28% | 11% | |
| Reader / Idle (h) | 27.7 | 21.5 -22% | 23.1 -17% | 15 -46% | 26.6 -4% | 24.5 ? -12% |
| H.264 (h) | 12.5 | 11 -12% | 15.5 ? 24% | |||
| Load (h) | 1.5 | 1.6 7% | 4.1 173% | 2 33% | 2.4 60% | 1.808 ? 21% |
| WiFi v1.3 (h) | 8.8 | 10.5 | 7.2 | 10.5 | 13.2 ? |
Läs den fullständiga versionen av den här recensionen på engelska här.
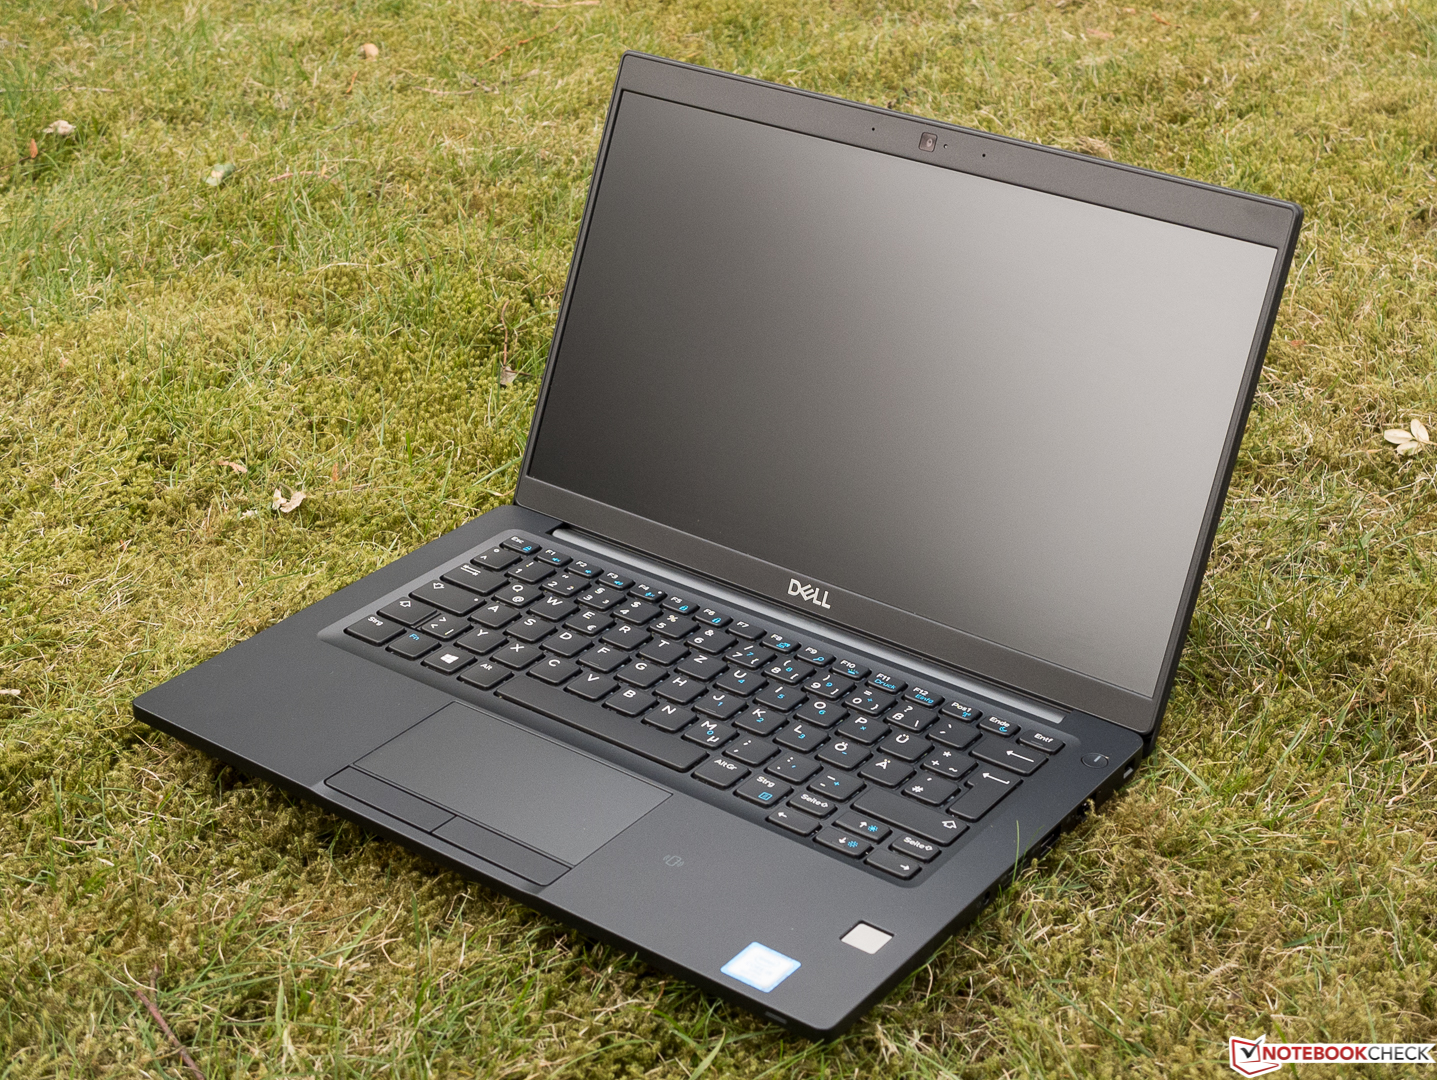
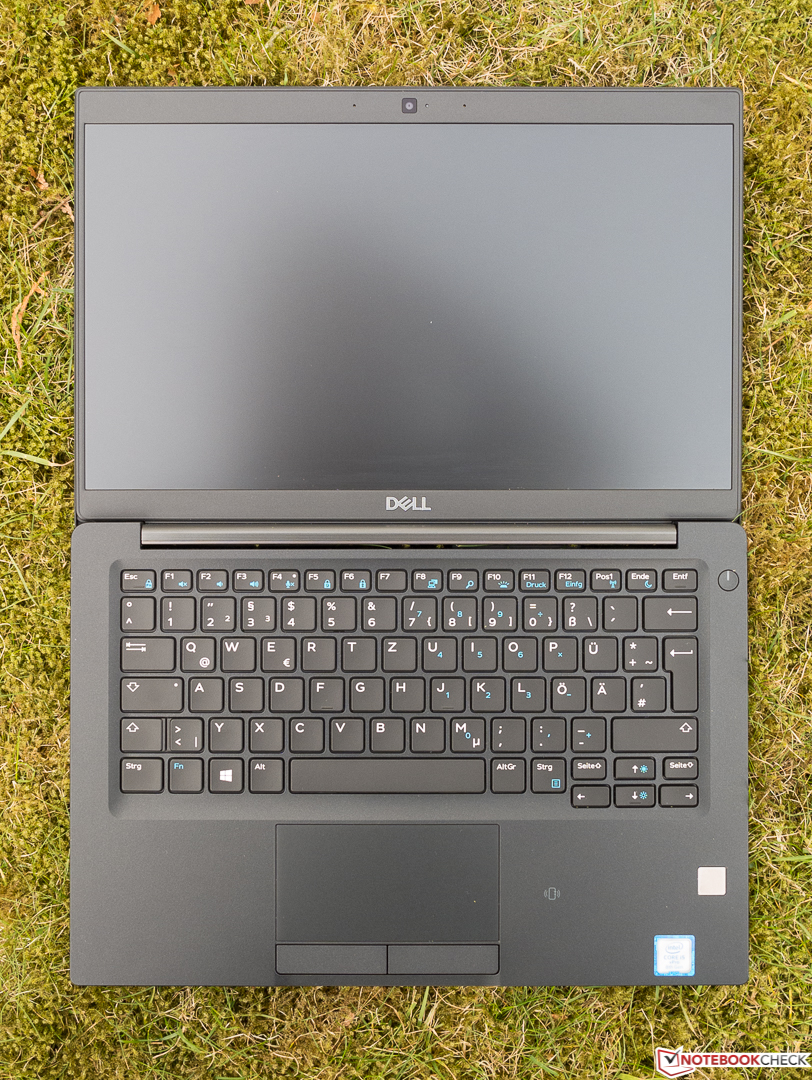
Dell har gjort nästan allt rätt med nya Latitude 7390. För inte mer än 14 000 kronor för modellen vi testat får man ett välavrundat paket som bara har ett fåtal brister.
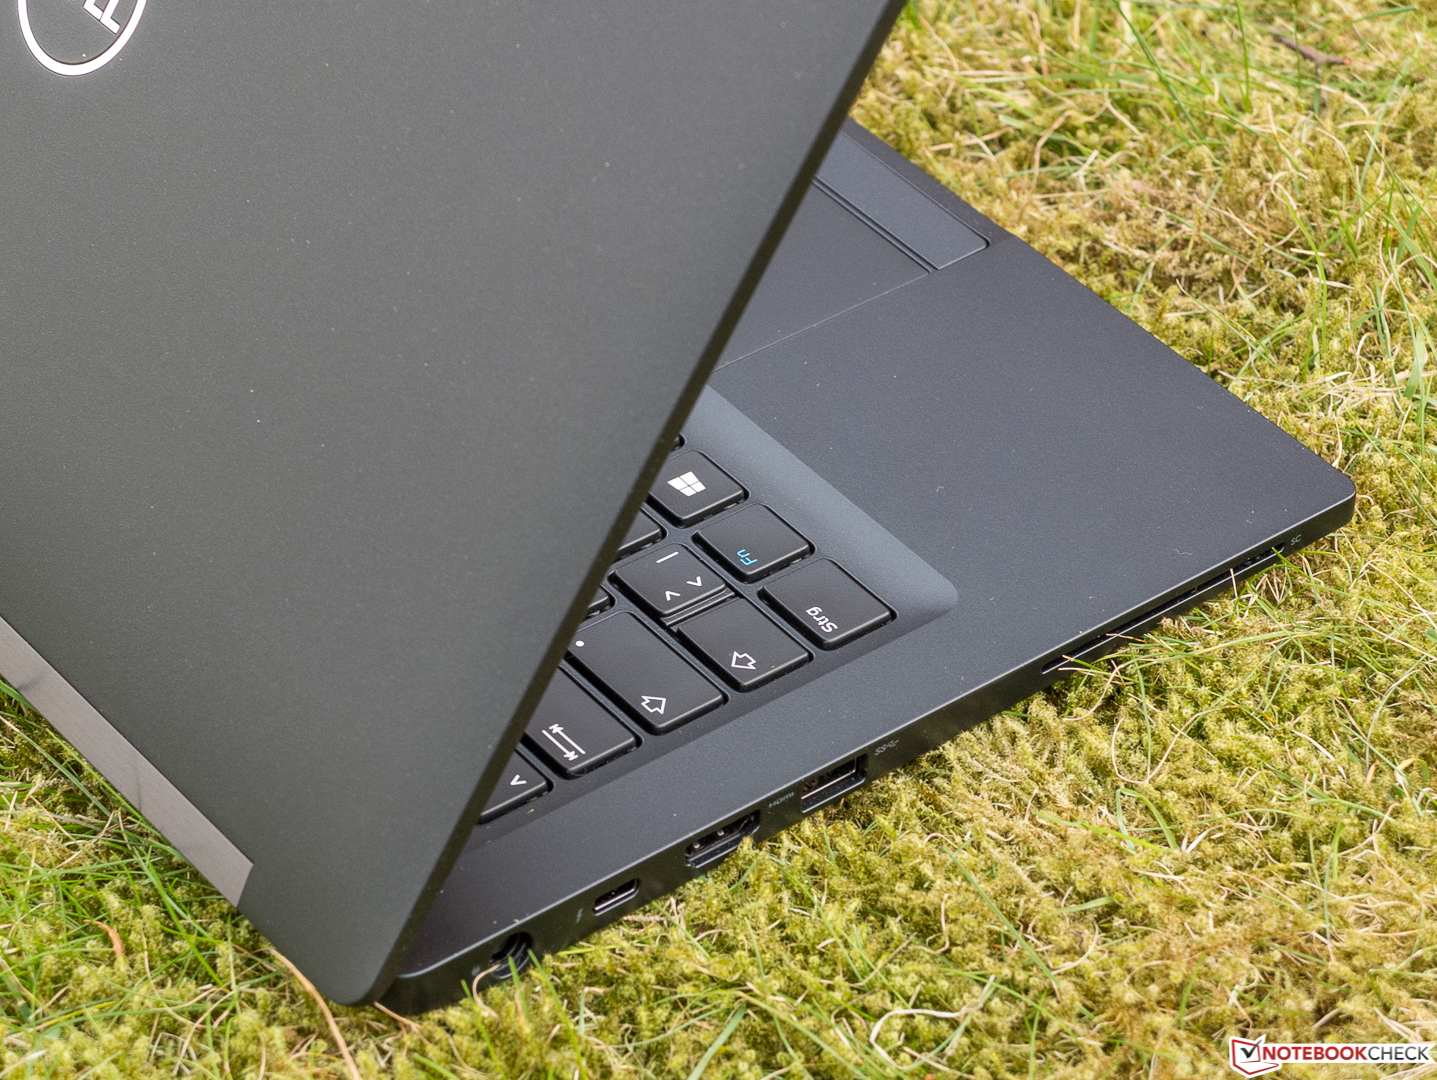
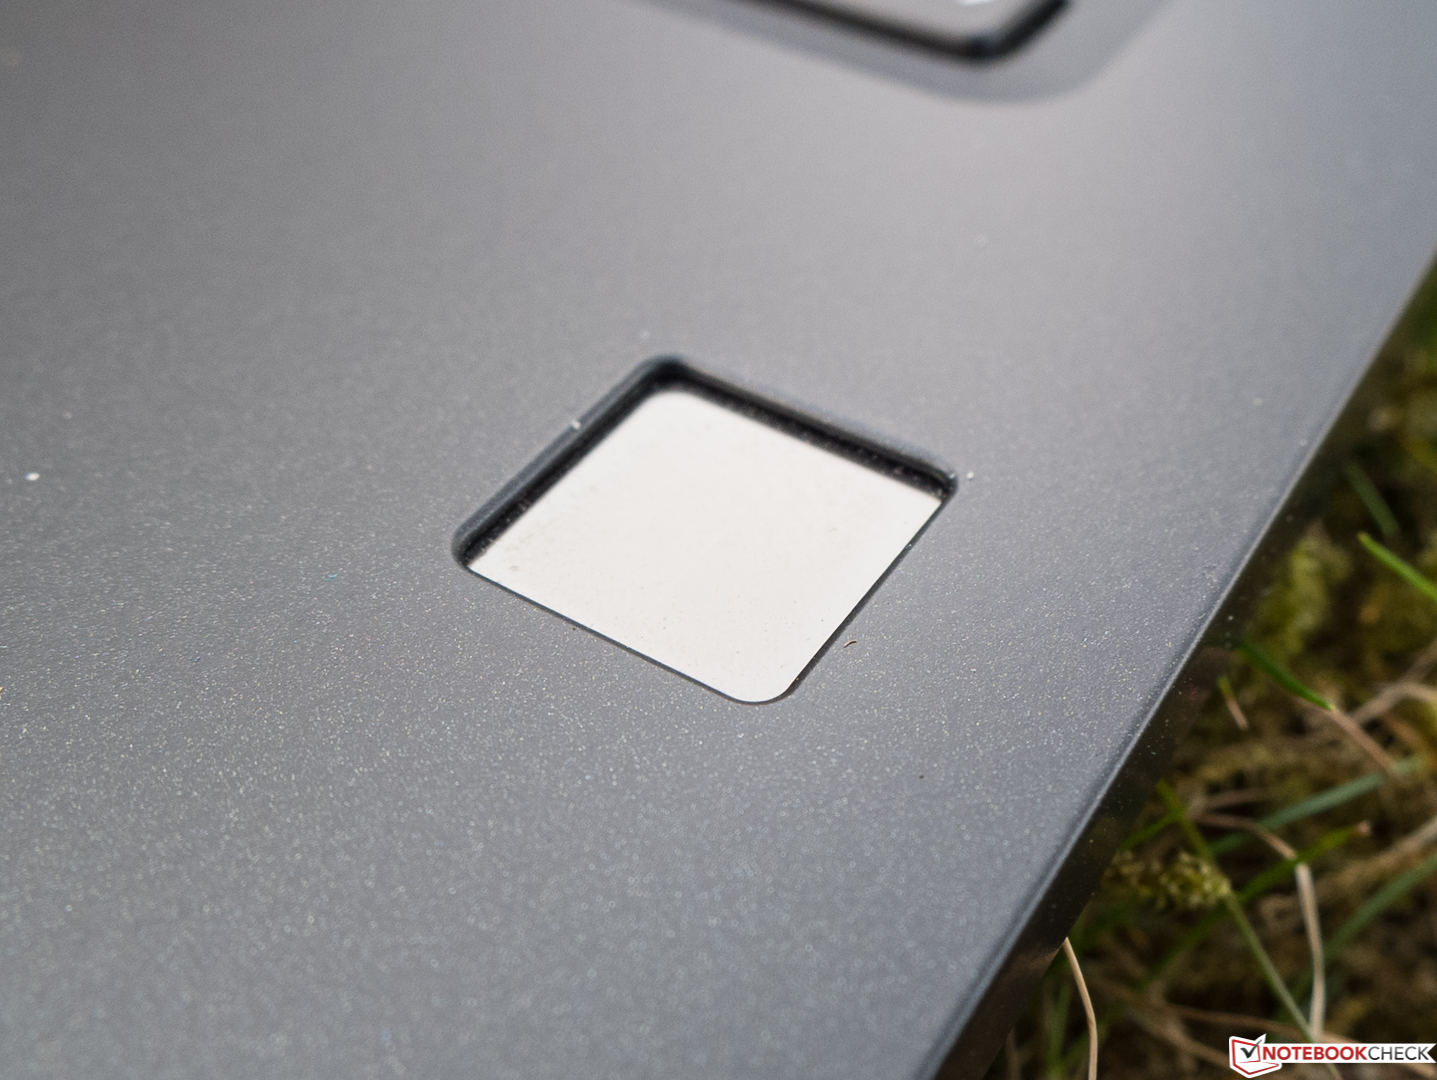
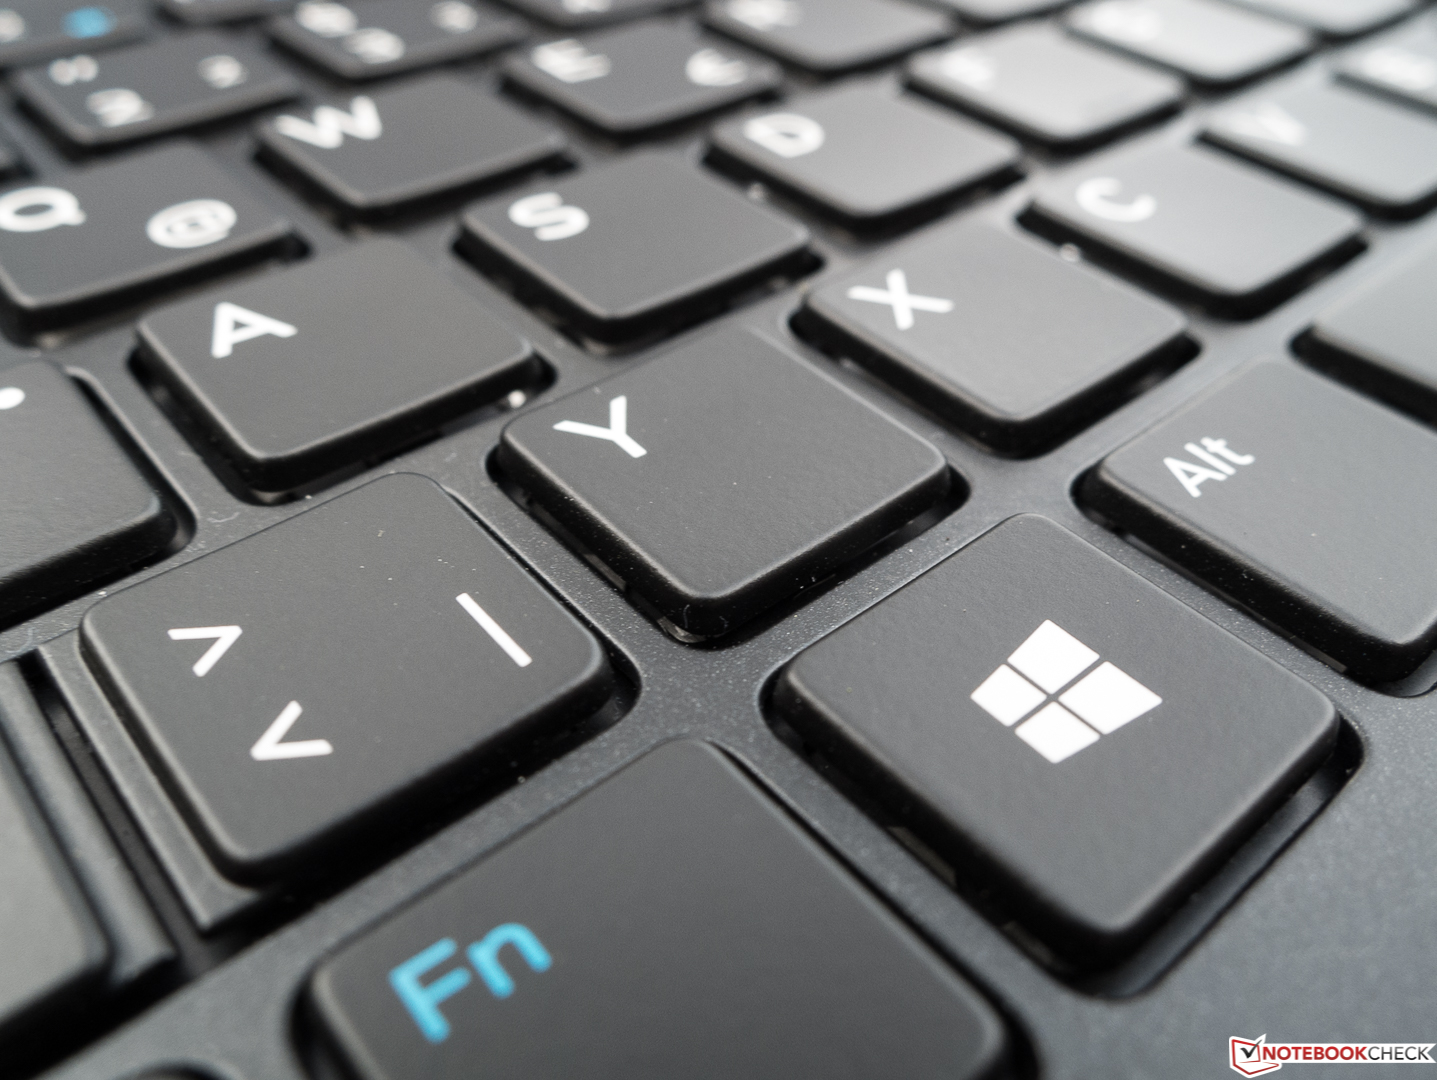
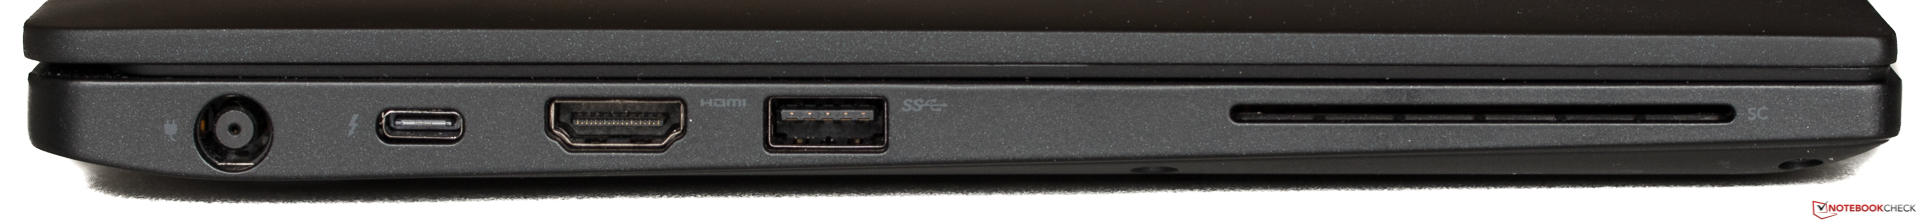
Här borde vi nämna det aningen pyttiga men i övrigt i stort framgångsrika tangentbordet, den tveksamma ersättningen för musknappar, avsaknaden av Thunderbolt 3 och den högljudda mellanslags-tangenten. Det är ett mindre snedsteg att locket får basen att resa sig om det öppnas i en vinkel över 135°. Det enda vi verkligen inte gillade var det vidriga ljudet och den suboptimala fingeravtrycksläsaren.
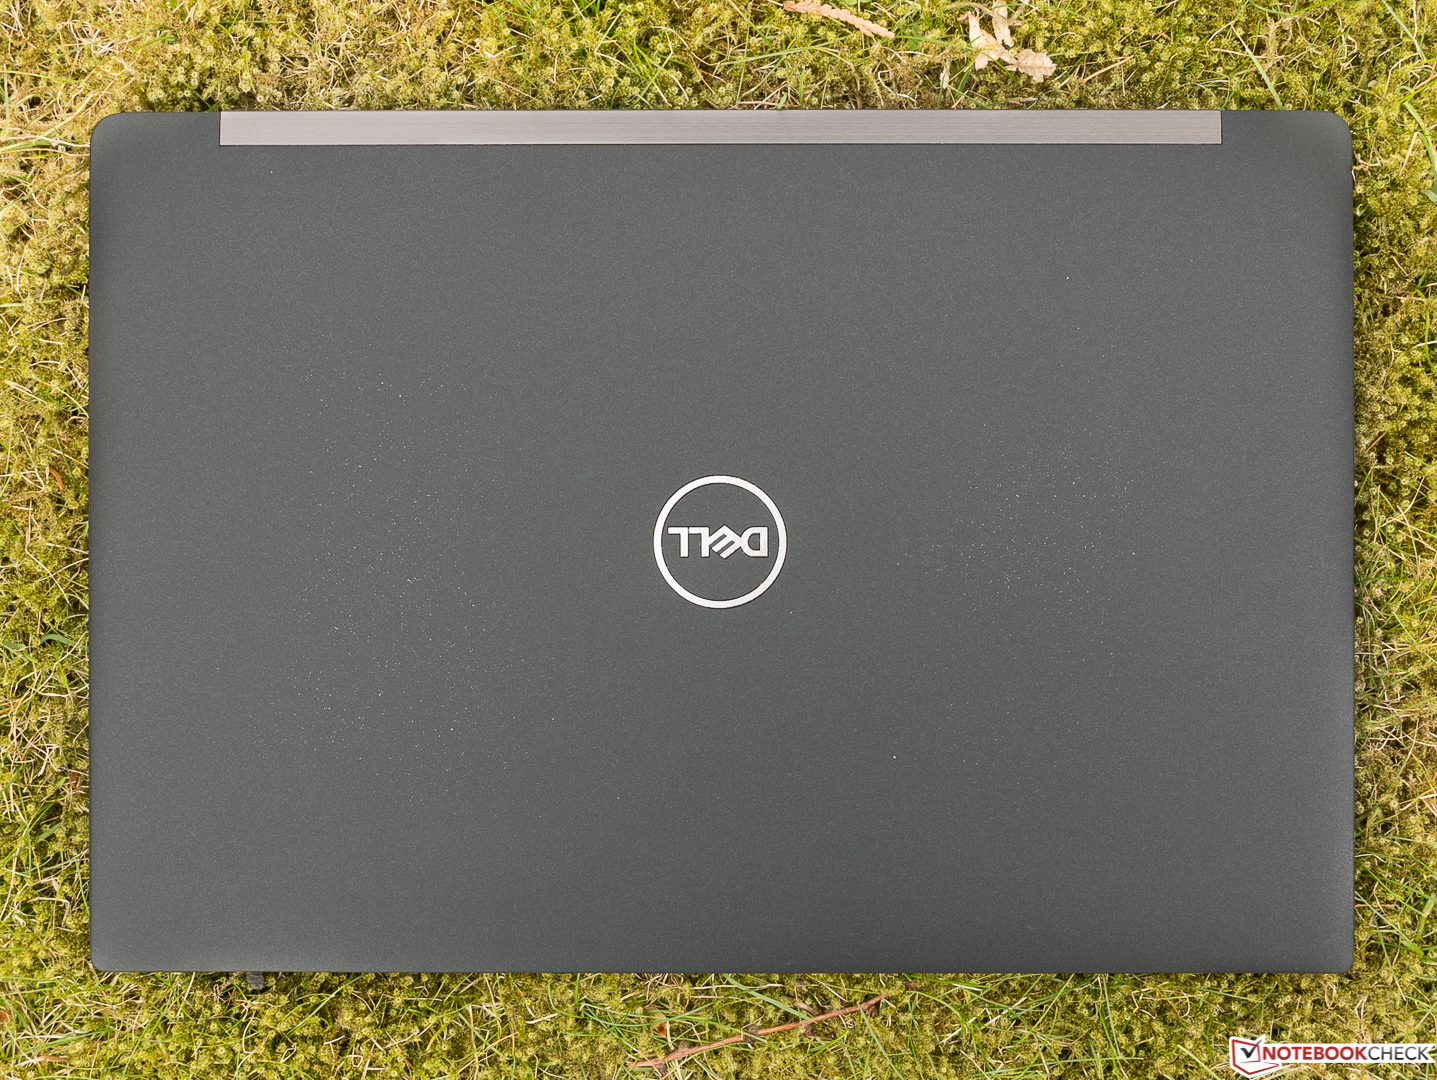
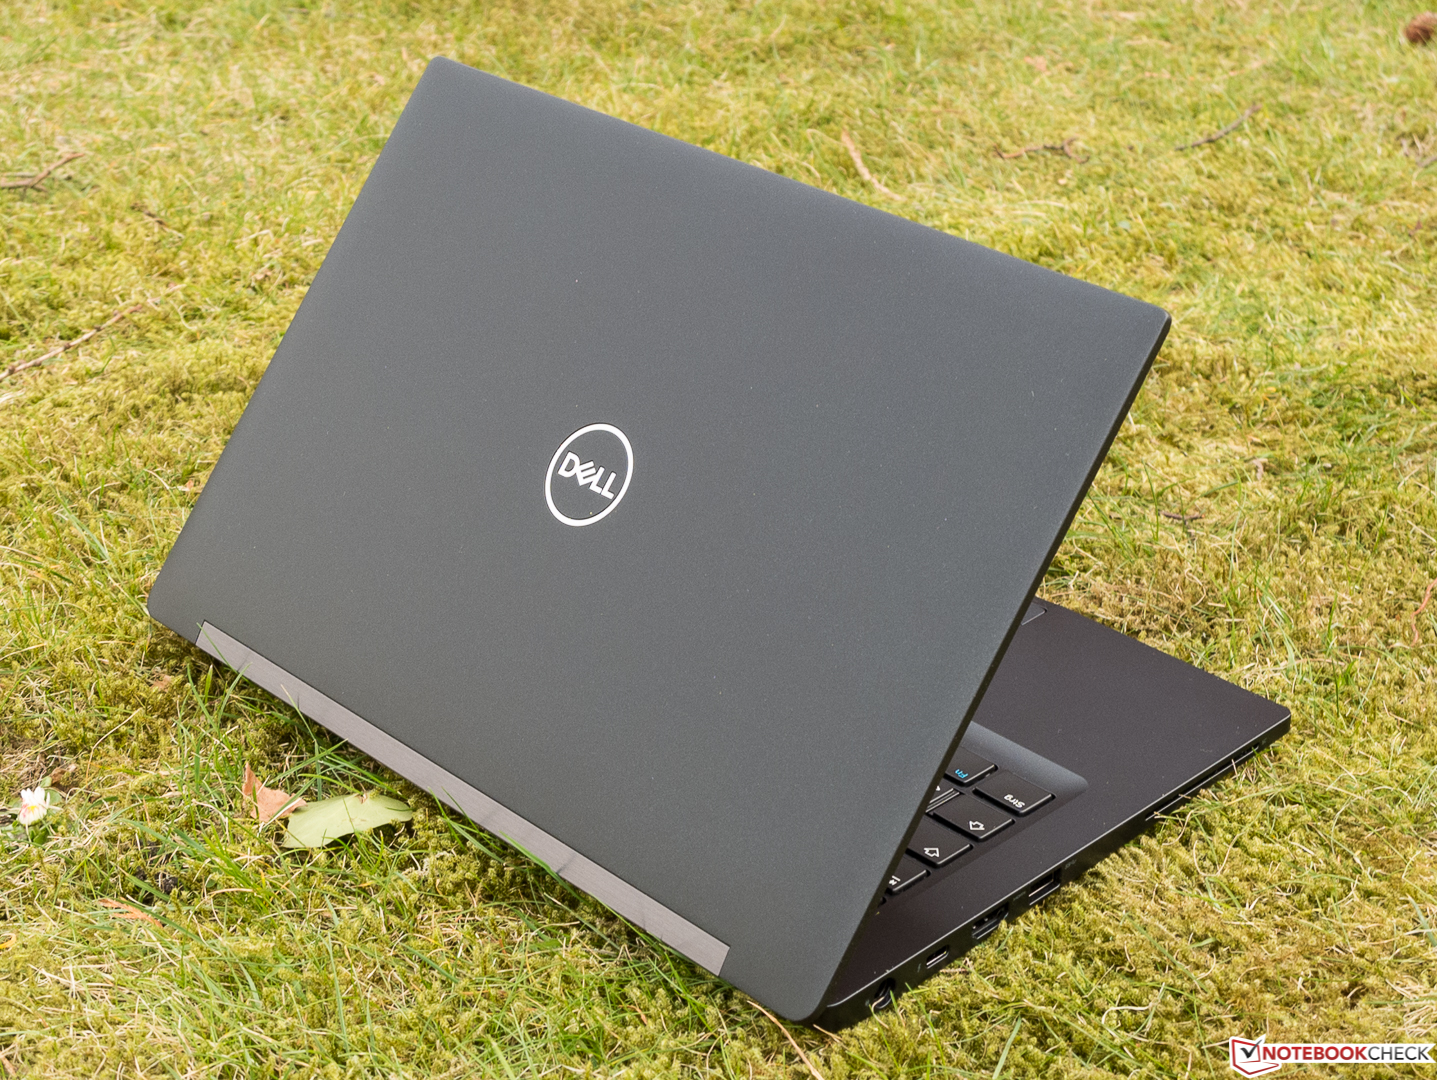
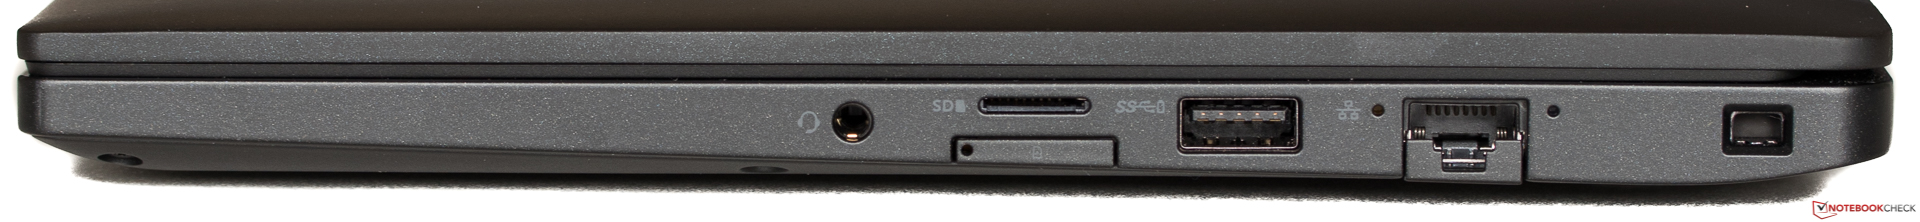
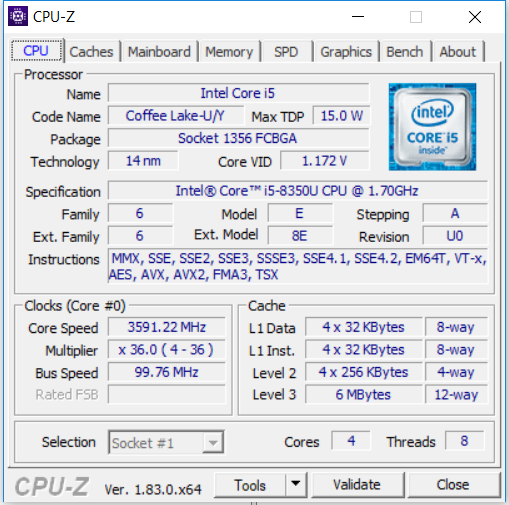
Punkterna på "Fördels"-listan är inte bara många utan också i huvudsak viktigare. Även om Latitude med sin i5-8350U är lite av en överdrift för kontorsarbete så känner vi att mer kraft aldrig kan skada, med tanke på att batteritiden fortfarande är på en hög nivå. Det enkelt designade men högkvalitativa höljet, inmatningsenheterna som går från bra till riktigt bra, den kompletta säkerhetsutrustningen, dom vettiga anslutningarna, skärmen med hög kontrast, Windows 10 Pro och sist men inte minst 3 års garanti tillsammans med tyst drift förtjänar en klar köprekommendation.
Dell Latitude 7390
- 04/05/2018 v6 (old)
Sven Kloevekorn