Test: Dell Inspiron 7390 2-in-1 Black Edition (Sammanfattning)
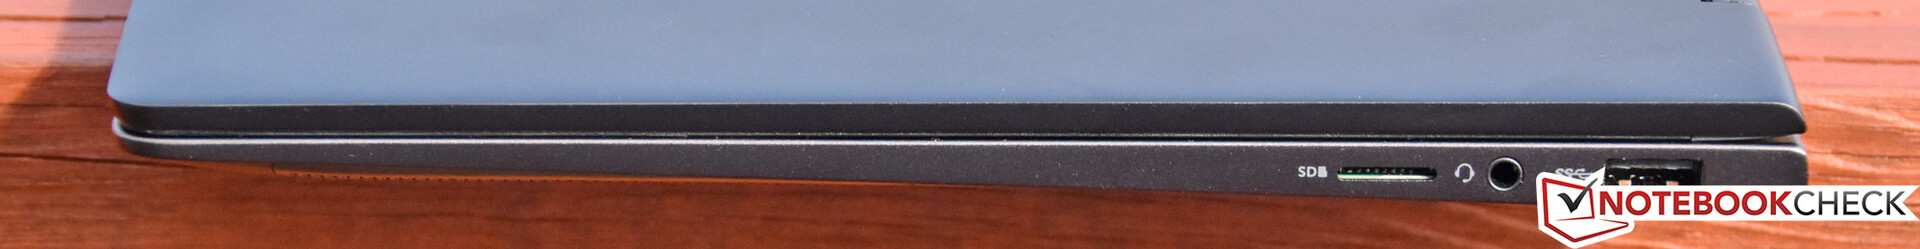
| SD Card Reader | |
| average JPG Copy Test (av. of 3 runs) | |
| Dell Latitude 7400 2-in-1 (Toshiba Exceria Pro M501 UHS-II) | |
| Lenovo ThinkPad X390 Yoga-20NQS05R00 (Toshiba Exceria Pro M501) | |
| HP Envy x360 13-ar0601ng (Toshiba Exceria Pro M501 microSDXC 64GB) | |
| Genomsnitt av klass Convertible (29.4 - 186, n=21, senaste 2 åren) | |
| Dell Inspiron 7390 2-in-1 (Toshiba Exceria Pro M501 UHS-II) | |
| maximum AS SSD Seq Read Test (1GB) | |
| Dell Latitude 7400 2-in-1 (Toshiba Exceria Pro M501 UHS-II) | |
| Genomsnitt av klass Convertible (67.5 - 254, n=20, senaste 2 åren) | |
| HP Envy x360 13-ar0601ng (Toshiba Exceria Pro M501 microSDXC 64GB) | |
| Lenovo ThinkPad X390 Yoga-20NQS05R00 (Toshiba Exceria Pro M501) | |
| Dell Inspiron 13 7386 (Toshiba Exceria Pro M501 microSDXC 64GB) | |
| Dell Inspiron 7390 2-in-1 (Toshiba Exceria Pro M501 UHS-II) | |
| |||||||||||||||||||||||||
Distribution av ljusstyrkan: 94 %
Mitt på batteriet: 329.8 cd/m²
Kontrast: 1268:1 (Svärta: 0.26 cd/m²)
ΔE ColorChecker Calman: 3.05 | ∀{0.5-29.43 Ø4.71}
calibrated: 2.03
ΔE Greyscale Calman: 2.1 | ∀{0.09-98 Ø4.96}
94% sRGB (Argyll 1.6.3 3D)
61% AdobeRGB 1998 (Argyll 1.6.3 3D)
66.5% AdobeRGB 1998 (Argyll 3D)
94.2% sRGB (Argyll 3D)
65.6% Display P3 (Argyll 3D)
Gamma: 2.082
CCT: 6713 K
| Dell Inspiron 7390 2-in-1 AUO252B, IPS, 13.3", 3840x2160 | Lenovo ThinkPad X1 Yoga 2019-20QGS00A00 B140HAN05.8, IPS LED, 14", 1920x1080 | HP Envy x360 13-ar0601ng InfoVision, M133NVF3 R2, IPS, 120 Hz, 13.3", 1920x1080 | Lenovo ThinkPad X390 Yoga-20NQS05R00 LP133WF7-SPA1, IPS LED, 13.3", 1920x1080 | Dell Latitude 7400 2-in-1 SHP14A2, IPS, 14", 1920x1080 | Dell Inspiron 13 7386 Chi Mei CMN1385 / 133DCE / Dell 3GRT6, IPS, 13.3", 3840x2160 | |
|---|---|---|---|---|---|---|
| Display | 3% | -4% | 1% | 5% | 5% | |
| Display P3 Coverage (%) | 65.6 | 67.1 2% | 63 -4% | 65.2 -1% | 68.6 5% | 68.2 4% |
| sRGB Coverage (%) | 94.2 | 98.2 4% | 90.8 -4% | 97 3% | 99.6 6% | 99.8 6% |
| AdobeRGB 1998 Coverage (%) | 66.5 | 68.9 4% | 63.8 -4% | 67.3 1% | 70 5% | 70 5% |
| Response Times | -2% | 40% | 7% | 0% | 10% | |
| Response Time Grey 50% / Grey 80% * (ms) | 56.4 ? | 61.6 ? -9% | 35 ? 38% | 59.2 ? -5% | 56 ? 1% | 57 ? -1% |
| Response Time Black / White * (ms) | 37.6 ? | 35.2 ? 6% | 22 ? 41% | 30.8 ? 18% | 38 ? -1% | 30 ? 20% |
| PWM Frequency (Hz) | 4065 ? | 1667 ? | 26000 ? | |||
| Screen | -14% | -5% | -32% | -0% | -11% | |
| Brightness middle (cd/m²) | 329.8 | 372 13% | 633 92% | 319 -3% | 277.2 -16% | 318 -4% |
| Brightness (cd/m²) | 325 | 368 13% | 675 108% | 306 -6% | 263 -19% | 278 -14% |
| Brightness Distribution (%) | 94 | 88 -6% | 75 -20% | 90 -4% | 83 -12% | 81 -14% |
| Black Level * (cd/m²) | 0.26 | 0.22 15% | 0.55 -112% | 0.15 42% | 0.2 23% | 0.18 31% |
| Contrast (:1) | 1268 | 1691 33% | 1151 -9% | 2127 68% | 1386 9% | 1767 39% |
| Colorchecker dE 2000 * | 3.05 | 4.6 -51% | 3.12 -2% | 6.1 -100% | 2.1 31% | 2.91 5% |
| Colorchecker dE 2000 max. * | 5.01 | 7.8 -56% | 6.37 -27% | 9.7 -94% | 5.91 -18% | 6.11 -22% |
| Colorchecker dE 2000 calibrated * | 2.03 | 0.9 56% | 1.83 10% | 1 51% | 1.03 49% | 2.91 -43% |
| Greyscale dE 2000 * | 2.1 | 5.9 -181% | 3.89 -85% | 8.6 -310% | 3.4 -62% | 4.37 -108% |
| Gamma | 2.082 106% | 2.58 85% | 2.39 92% | 2.62 84% | 2.241 98% | 2.26 97% |
| CCT | 6713 97% | 6516 100% | 6476 100% | 6613 98% | 6030 108% | 6448 101% |
| Color Space (Percent of AdobeRGB 1998) (%) | 61 | 62.7 3% | 59 -3% | 61.9 1% | 64 5% | 70 15% |
| Color Space (Percent of sRGB) (%) | 94 | 97.8 4% | 91 -3% | 96.8 3% | 100 6% | 93 -1% |
| Totalt genomsnitt (program/inställningar) | -4% /
-9% | 10% /
1% | -8% /
-21% | 2% /
1% | 1% /
-5% |
* ... mindre är bättre
Visa svarstider
| ↔ Svarstid svart till vitt | ||
|---|---|---|
| 37.6 ms ... stiga ↗ och falla ↘ kombinerat | ↗ 20.4 ms stiga | 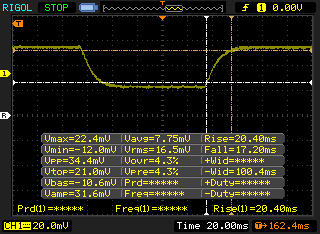 |
| ↘ 17.2 ms hösten | ||
| Skärmen visar långsamma svarsfrekvenser i våra tester och kommer att vara otillfredsställande för spelare. I jämförelse sträcker sig alla testade enheter från 0.1 (minst) till 240 (maximalt) ms. » 95 % av alla enheter är bättre. Detta innebär att den uppmätta svarstiden är sämre än genomsnittet av alla testade enheter (19.8 ms). | ||
| ↔ Svarstid 50 % grått till 80 % grått | ||
| 56.4 ms ... stiga ↗ och falla ↘ kombinerat | ↗ 27.6 ms stiga | 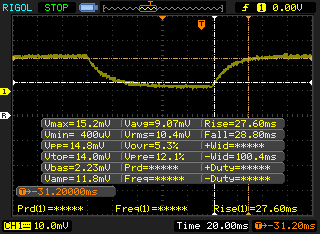 |
| ↘ 28.8 ms hösten | ||
| Skärmen visar långsamma svarsfrekvenser i våra tester och kommer att vara otillfredsställande för spelare. I jämförelse sträcker sig alla testade enheter från 0.165 (minst) till 636 (maximalt) ms. » 93 % av alla enheter är bättre. Detta innebär att den uppmätta svarstiden är sämre än genomsnittet av alla testade enheter (30.9 ms). | ||
Skärmflimmer / PWM (Puls-Width Modulation)
| Skärmflimmer / PWM upptäcktes inte | 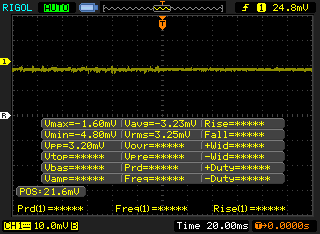 | ||
Som jämförelse: 52 % av alla testade enheter använder inte PWM för att dämpa skärmen. Om PWM upptäcktes mättes ett medelvärde av 7744 (minst: 5 - maximum: 343500) Hz. | |||
| PCMark 8 Home Score Accelerated v2 | 3178 poäng | |
| PCMark 8 Work Score Accelerated v2 | 4333 poäng | |
| PCMark 10 Score | 4038 poäng | |
Hjälp | ||
| Dell Inspiron 7390 2-in-1 Intel Optane Memory H10 with Solid State Storage 32GB + 512GB HBRPEKNX0202A(L/H) | Lenovo ThinkPad X1 Yoga 2019-20QGS00A00 WDC PC SN720 SDAPNTW-512G | HP Envy x360 13-ar0601ng SK Hynix BC501 HFM512GDJTNG | Dell Latitude 7400 2-in-1 Toshiba XG6 KXG60ZNV512G | Dell Inspiron 13 7386 SK Hynix BC501 HFM512GDJTNG | |
|---|---|---|---|---|---|
| AS SSD | 154% | 14% | -14% | 31% | |
| Seq Read (MB/s) | 984 | 2888 193% | 1412 43% | 2289 133% | 1122 14% |
| Seq Write (MB/s) | 320.1 | 2381 644% | 540 69% | 1163 263% | 619 93% |
| 4K Read (MB/s) | 66.2 | 45.66 -31% | 32.24 -51% | 22.29 -66% | 39.58 -40% |
| 4K Write (MB/s) | 128 | 162.4 27% | 74.7 -42% | 28.92 -77% | 108.5 -15% |
| 4K-64 Read (MB/s) | 365.9 | 1276 249% | 567 55% | 415.6 14% | 776 112% |
| 4K-64 Write (MB/s) | 673 | 1432 113% | 700 4% | 199.5 -70% | 671 0% |
| Access Time Read * (ms) | 0.065 | 0.088 -35% | 0.049 25% | 0.122 -88% | 0.045 31% |
| Access Time Write * (ms) | 0.046 | 0.023 50% | 0.048 -4% | 0.143 -211% | 0.033 28% |
| Score Read (Points) | 531 | 1610 203% | 741 40% | 667 26% | 928 75% |
| Score Write (Points) | 833 | 1832 120% | 829 0% | 345 -59% | 841 1% |
| Score Total (Points) | 1628 | 4245 161% | 1913 18% | 1300 -20% | 2228 37% |
| Copy ISO MB/s (MB/s) | 1810 | 521 | 1767 | ||
| Copy Program MB/s (MB/s) | 498.3 | 253.1 | 379.4 | ||
| Copy Game MB/s (MB/s) | 921 | 392.9 | 1055 | ||
| CrystalDiskMark 5.2 / 6 | 78% | -18% | -1% | -17% | |
| Write 4K (MB/s) | 99.7 | 194.3 95% | 88.3 -11% | 35.06 -65% | 97.4 -2% |
| Read 4K (MB/s) | 113.7 | 51.2 -55% | 34.84 -69% | 23.64 -79% | 38.05 -67% |
| Write Seq (MB/s) | 511 | 1773 247% | 740 45% | 1537 201% | 656 28% |
| Read Seq (MB/s) | 1431 | 2512 76% | 985 -31% | 1782 25% | 1043 -27% |
| Write 4K Q32T1 (MB/s) | 313.5 | 431.7 38% | 313.7 0% | 100.3 -68% | 331.5 6% |
| Read 4K Q32T1 (MB/s) | 289.1 | 539 86% | 243.1 -16% | 62.7 -78% | 253.8 -12% |
| Write Seq Q32T1 (MB/s) | 1274 | 2538 99% | 846 -34% | 2698 112% | 879 -31% |
| Read Seq Q32T1 (MB/s) | 2500 | 3489 40% | 1783 -29% | 1073 -57% | 1639 -34% |
| Write 4K Q8T8 (MB/s) | 867 | 305.7 | |||
| Read 4K Q8T8 (MB/s) | 1315 | 698 | |||
| Totalt genomsnitt (program/inställningar) | 116% /
122% | -2% /
1% | -8% /
-9% | 7% /
10% |
* ... mindre är bättre

| 3DMark 11 Performance | 2131 poäng | |
| 3DMark Cloud Gate Standard Score | 8645 poäng | |
| 3DMark Fire Strike Score | 1194 poäng | |
Hjälp | ||
| Metro: Last Light | |
| 1024x768 Low (DX10) AF:4x | |
| Dell Inspiron 7390 2-in-1 | |
| Genomsnitt Intel UHD Graphics 620 (23.3 - 41, n=5) | |
| 1366x768 Medium (DX10) AF:4x | |
| Dell Inspiron 7390 2-in-1 | |
| Genomsnitt Intel UHD Graphics 620 (16.4 - 28, n=4) | |
| 1366x768 High (DX11) AF:16x | |
| Dell Inspiron 7390 2-in-1 | |
| Genomsnitt Intel UHD Graphics 620 (13 - 16, n=3) | |
| 1920x1080 Very High (DX11) AF:16x | |
| Dell Inspiron 7390 2-in-1 | |
| Genomsnitt Intel UHD Graphics 620 (6 - 8, n=3) | |
| Rise of the Tomb Raider | |
| 1024x768 Lowest Preset | |
| HP Envy x360 13-ar0601ng | |
| Lenovo ThinkPad X390 Yoga-20NQS05R00 | |
| Genomsnitt Intel UHD Graphics 620 (10.4 - 110.7, n=82) | |
| Dell Inspiron 7390 2-in-1 | |
| Lenovo ThinkPad X1 Yoga 2019-20QGS00A00 | |
| 1366x768 Medium Preset AF:2x | |
| Lenovo ThinkPad X390 Yoga-20NQS05R00 | |
| Dell Inspiron 7390 2-in-1 | |
| Genomsnitt Intel UHD Graphics 620 (6.5 - 49.3, n=62) | |
| 1920x1080 High Preset AA:FX AF:4x | |
| HP Envy x360 13-ar0601ng | |
| Genomsnitt Intel UHD Graphics 620 (4.9 - 32, n=42) | |
| Dell Inspiron 7390 2-in-1 | |
| 1920x1080 Very High Preset AA:FX AF:16x | |
| Dell Inspiron 7390 2-in-1 | |
| Genomsnitt Intel UHD Graphics 620 (3 - 14.5, n=11) | |
| låg | med. | hög | ultra | |
|---|---|---|---|---|
| BioShock Infinite (2013) | 64 | 33 | 29 | 10 |
| Metro: Last Light (2013) | 35 | 28 | 16 | 8 |
| Rise of the Tomb Raider (2016) | 21 | 13 | 7 | 6 |
| Dell Inspiron 7390 2-in-1 UHD Graphics 620, i7-8565U, Intel Optane Memory H10 with Solid State Storage 32GB + 512GB HBRPEKNX0202A(L/H) | Lenovo ThinkPad X1 Yoga 2019-20QGS00A00 UHD Graphics 620, i7-8565U, WDC PC SN720 SDAPNTW-512G | HP Envy x360 13-ar0601ng Vega 10, R7 3700U, SK Hynix BC501 HFM512GDJTNG | Lenovo ThinkPad X390 Yoga-20NQS05R00 UHD Graphics 620, i7-8565U, Intel SSD Pro 7600p SSDPEKKF512G8L | Dell Latitude 7400 2-in-1 UHD Graphics 620, i7-8665U, Toshiba XG6 KXG60ZNV512G | Dell Inspiron 13 7386 UHD Graphics 620, i7-8565U, SK Hynix BC501 HFM512GDJTNG | |
|---|---|---|---|---|---|---|
| Noise | 3% | -9% | 2% | 10% | 0% | |
| av / miljö * (dB) | 28.2 | 29.3 -4% | 30.5 -8% | 29.2 -4% | 28.2 -0% | 30.3 -7% |
| Idle Minimum * (dB) | 28.2 | 29.3 -4% | 32.2 -14% | 29.2 -4% | 28.2 -0% | 30.4 -8% |
| Idle Average * (dB) | 28.2 | 29.3 -4% | 32.2 -14% | 29.2 -4% | 28.2 -0% | 30.4 -8% |
| Idle Maximum * (dB) | 28.2 | 31.1 -10% | 32.2 -14% | 29.2 -4% | 28.3 -0% | 30.4 -8% |
| Load Average * (dB) | 37.3 | 32.7 12% | 40.8 -9% | 35 6% | 28.2 24% | 34.3 8% |
| Load Maximum * (dB) | 44.4 | 32.7 26% | 41.9 6% | 35 21% | 28.8 35% | 34.2 23% |
* ... mindre är bättre
Ljudnivå
| Låg belastning |
| 28.2 / 28.2 / 28.2 dB(A) |
| Hög belastning |
| 37.3 / 44.4 dB(A) |
 | ||
30 dB tyst 40 dB(A) hörbar 50 dB(A) högt ljud |
||
min: | ||
(±) Den maximala temperaturen på ovansidan är 42 °C / 108 F, jämfört med genomsnittet av 35.4 °C / 96 F , allt från 19.6 till 60 °C för klassen Convertible.
(-) Botten värms upp till maximalt 46.6 °C / 116 F, jämfört med genomsnittet av 36.9 °C / 98 F
(+) Vid tomgångsbruk är medeltemperaturen för ovansidan 28.1 °C / 83 F, jämfört med enhetsgenomsnittet på 30.3 °C / ### class_avg_f### F.
(+) Handledsstöden och pekplattan når maximal hudtemperatur (32.8 °C / 91 F) och är därför inte varma.
(-) Medeltemperaturen för handledsstödsområdet på liknande enheter var 28 °C / 82.4 F (-4.8 °C / -8.6 F).
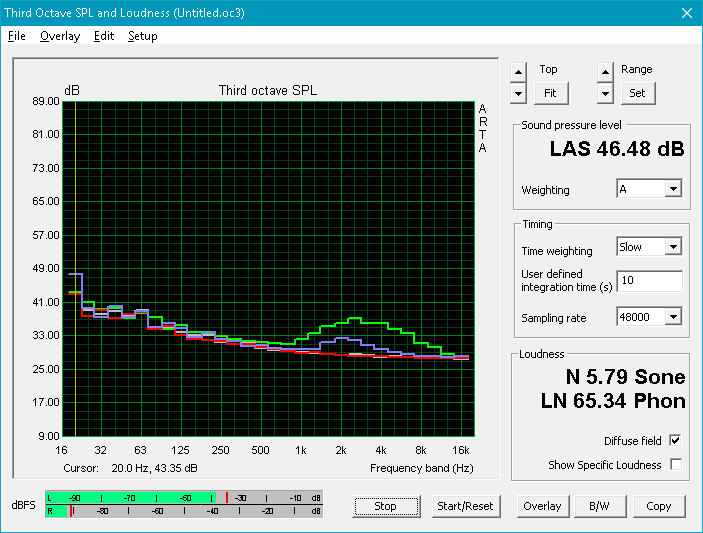
Dell Inspiron 7390 2-in-1 ljudanalys
(+) | högtalare kan spela relativt högt (87.2 dB)
Bas 100 - 315 Hz
(-) | nästan ingen bas - i genomsnitt 20.3% lägre än medianen
(±) | linjäriteten för basen är genomsnittlig (9.5% delta till föregående frekvens)
Mellan 400 - 2000 Hz
(±) | högre mellan - i genomsnitt 5.1% högre än median
(±) | linjäriteten för mids är genomsnittlig (7.6% delta till föregående frekvens)
Högsta 2 - 16 kHz
(+) | balanserade toppar - endast 3.6% från medianen
(±) | linjäriteten för toppar är genomsnittlig (8.2% delta till föregående frekvens)
Totalt 100 - 16 000 Hz
(±) | linjäriteten för det totala ljudet är genomsnittlig (21% skillnad mot median)
Jämfört med samma klass
» 56% av alla testade enheter i den här klassen var bättre, 10% liknande, 34% sämre
» Den bästa hade ett delta på 6%, genomsnittet var 20%, sämst var 57%
Jämfört med alla testade enheter
» 58% av alla testade enheter var bättre, 7% liknande, 35% sämre
» Den bästa hade ett delta på 4%, genomsnittet var 23%, sämst var 134%
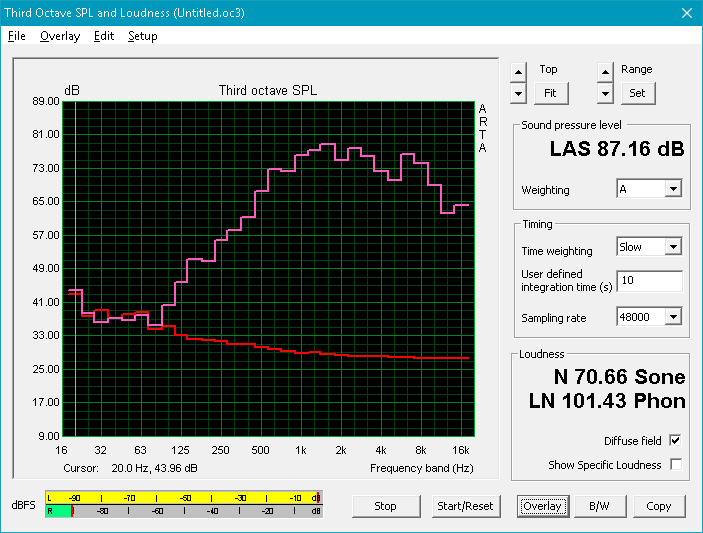
Dell Latitude 7400 2-in-1 ljudanalys
(+) | högtalare kan spela relativt högt (82.9 dB)
Bas 100 - 315 Hz
(-) | nästan ingen bas - i genomsnitt 17.3% lägre än medianen
(±) | linjäriteten för basen är genomsnittlig (11.7% delta till föregående frekvens)
Mellan 400 - 2000 Hz
(+) | balanserad mellan - endast 2% från medianen
(+) | mids är linjära (5.3% delta till föregående frekvens)
Högsta 2 - 16 kHz
(+) | balanserade toppar - endast 2.9% från medianen
(±) | linjäriteten för toppar är genomsnittlig (7.3% delta till föregående frekvens)
Totalt 100 - 16 000 Hz
(±) | linjäriteten för det totala ljudet är genomsnittlig (17.3% skillnad mot median)
Jämfört med samma klass
» 33% av alla testade enheter i den här klassen var bättre, 8% liknande, 59% sämre
» Den bästa hade ett delta på 6%, genomsnittet var 20%, sämst var 57%
Jämfört med alla testade enheter
» 33% av alla testade enheter var bättre, 8% liknande, 59% sämre
» Den bästa hade ett delta på 4%, genomsnittet var 23%, sämst var 134%
| Av/Standby | |
| Låg belastning | |
| Hög belastning |
|
Förklaring:
min: | |
| Dell Inspiron 7390 2-in-1 i7-8565U, UHD Graphics 620, Intel Optane Memory H10 with Solid State Storage 32GB + 512GB HBRPEKNX0202A(L/H), IPS, 3840x2160, 13.3" | Lenovo ThinkPad X1 Yoga 2019-20QGS00A00 i7-8565U, UHD Graphics 620, WDC PC SN720 SDAPNTW-512G, IPS LED, 1920x1080, 14" | HP Envy x360 13-ar0601ng R7 3700U, Vega 10, SK Hynix BC501 HFM512GDJTNG, IPS, 120 Hz, 1920x1080, 13.3" | Lenovo ThinkPad X390 Yoga-20NQS05R00 i7-8565U, UHD Graphics 620, Intel SSD Pro 7600p SSDPEKKF512G8L, IPS LED, 1920x1080, 13.3" | Dell Latitude 7400 2-in-1 i7-8665U, UHD Graphics 620, Toshiba XG6 KXG60ZNV512G, IPS, 1920x1080, 14" | Dell Inspiron 13 7386 i7-8565U, UHD Graphics 620, SK Hynix BC501 HFM512GDJTNG, IPS, 3840x2160, 13.3" | |
|---|---|---|---|---|---|---|
| Power Consumption | 3% | 19% | 2% | 22% | -26% | |
| Idle Minimum * (Watt) | 4.6 | 3.8 17% | 3.2 30% | 3.46 25% | 2.6 43% | 6.5 -41% |
| Idle Average * (Watt) | 7.5 | 6.1 19% | 2.8 63% | 5.88 22% | 4.3 43% | 12.2 -63% |
| Idle Maximum * (Watt) | 7.8 | 9.1 -17% | 12.4 -59% | 9.12 -17% | 5.5 29% | 12.7 -63% |
| Load Average * (Watt) | 37.6 | 38.6 -3% | 24.2 36% | 45.6 -21% | 32 15% | 39 -4% |
| Load Maximum * (Watt) | 65.3 | 64.5 1% | 50 23% | 65.9 -1% | 78.8 -21% | 39 40% |
* ... mindre är bättre
| Dell Inspiron 7390 2-in-1 i7-8565U, UHD Graphics 620, 52 Wh | Lenovo ThinkPad X1 Yoga 2019-20QGS00A00 i7-8565U, UHD Graphics 620, 51 Wh | HP Envy x360 13-ar0601ng R7 3700U, Vega 10, 53 Wh | Lenovo ThinkPad X390 Yoga-20NQS05R00 i7-8565U, UHD Graphics 620, 50 Wh | Dell Latitude 7400 2-in-1 i7-8665U, UHD Graphics 620, 78 Wh | Dell Inspiron 13 7386 i7-8565U, UHD Graphics 620, 38 Wh | |
|---|---|---|---|---|---|---|
| Batteridrifttid | 2% | -0% | -3% | 85% | -39% | |
| Reader / Idle (h) | 12.7 | 10.5 -17% | 6.7 -47% | |||
| WiFi v1.3 (h) | 6.6 | 9 36% | 7.3 11% | 8.2 24% | 12.2 85% | 3.9 -41% |
| Load (h) | 2.1 | 1.4 -33% | 2.2 5% | 1.5 -29% | 1.5 -29% |
För
Emot
Läs den fullständiga versionen av den här recensionen på engelska här.
Dell Inspiron 7390 2-in-1 Black Edition för 12.500 kronor (i vår konfiguration) kan verka väldigt lik sin föregångare, men den åtgärdar faktiskt några av de största problemen vi hade med Inspiron 7386 2-in-1. Bland dessa kan nämnas hög energiförbrukning vid tomgång, som nu nästan halverats och kort batteritid, som nu är 40% längre. Vi noterade heller inget spoltjut på vår recensionsenhet och skärmen är en aning mer ljusstark än innan. Till och med CPU-prestandan är en aning högre än tidigare trots faktum att båda maskinerna drivs av samma chip.
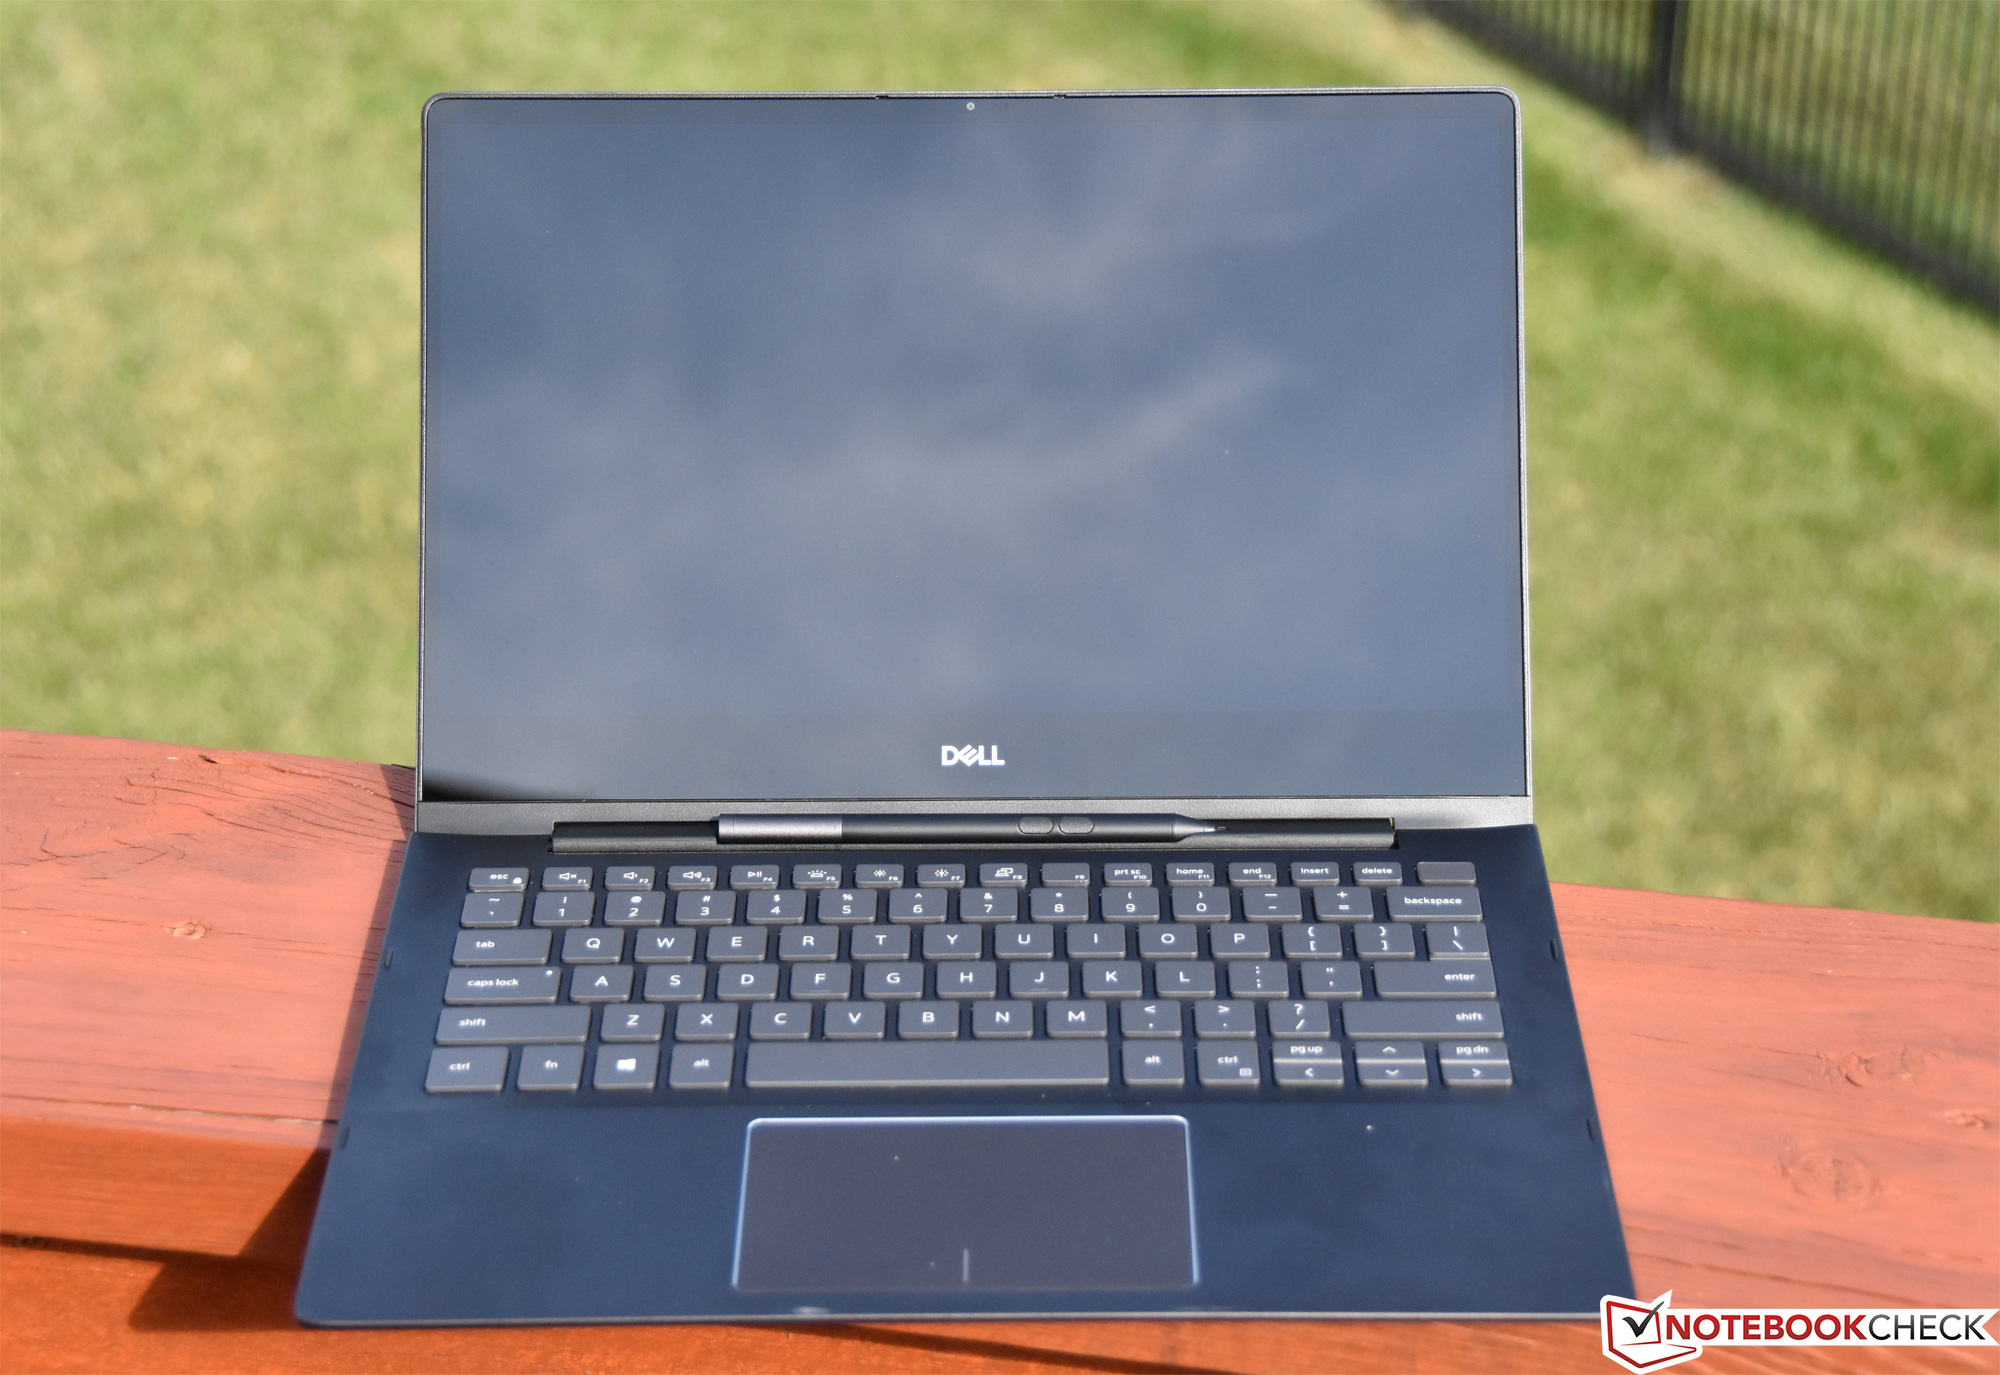
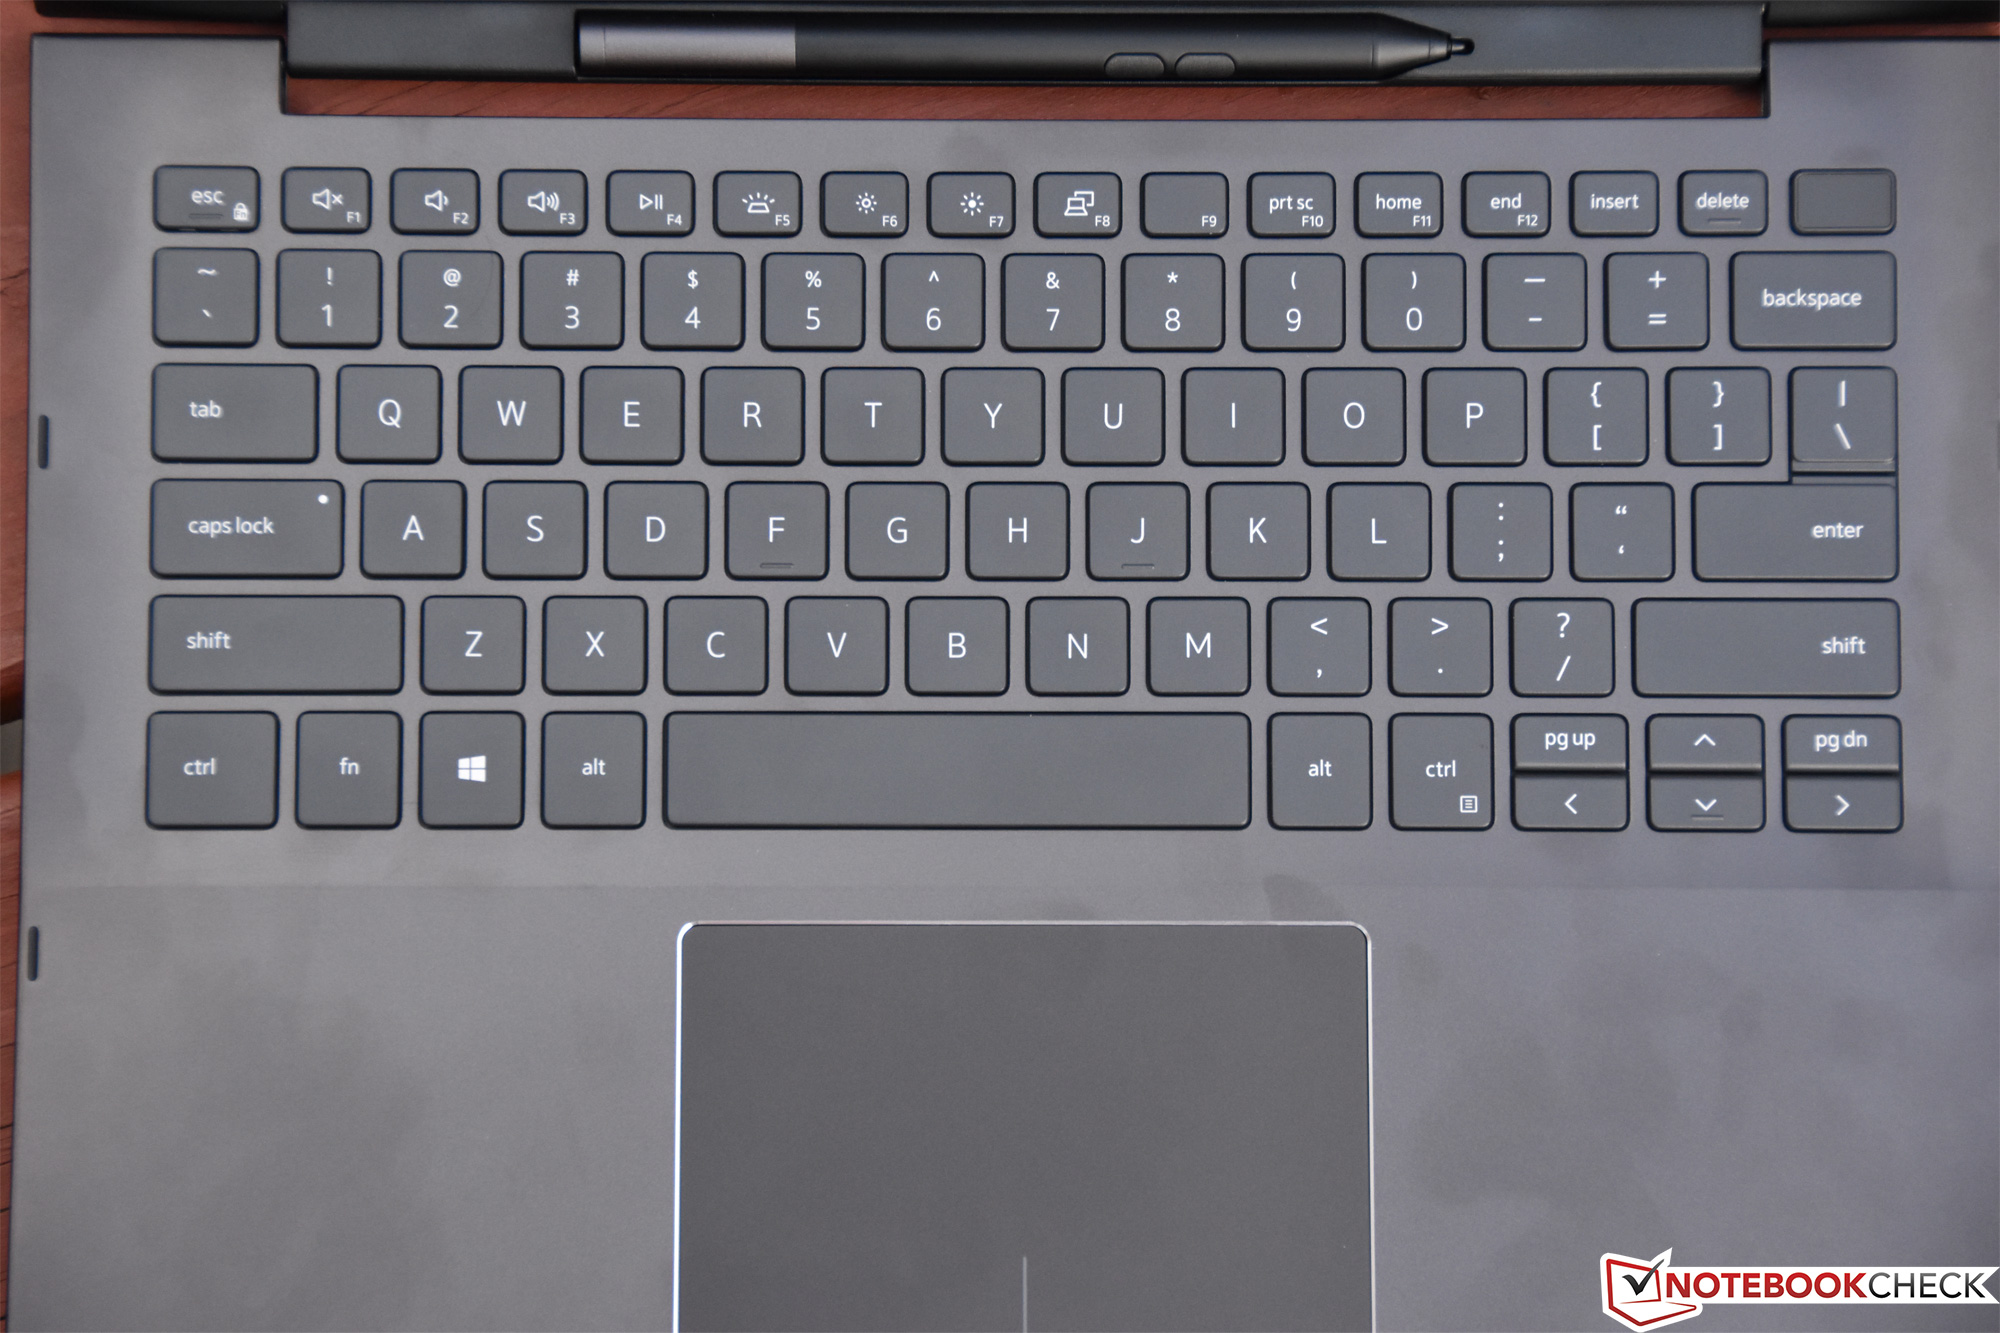
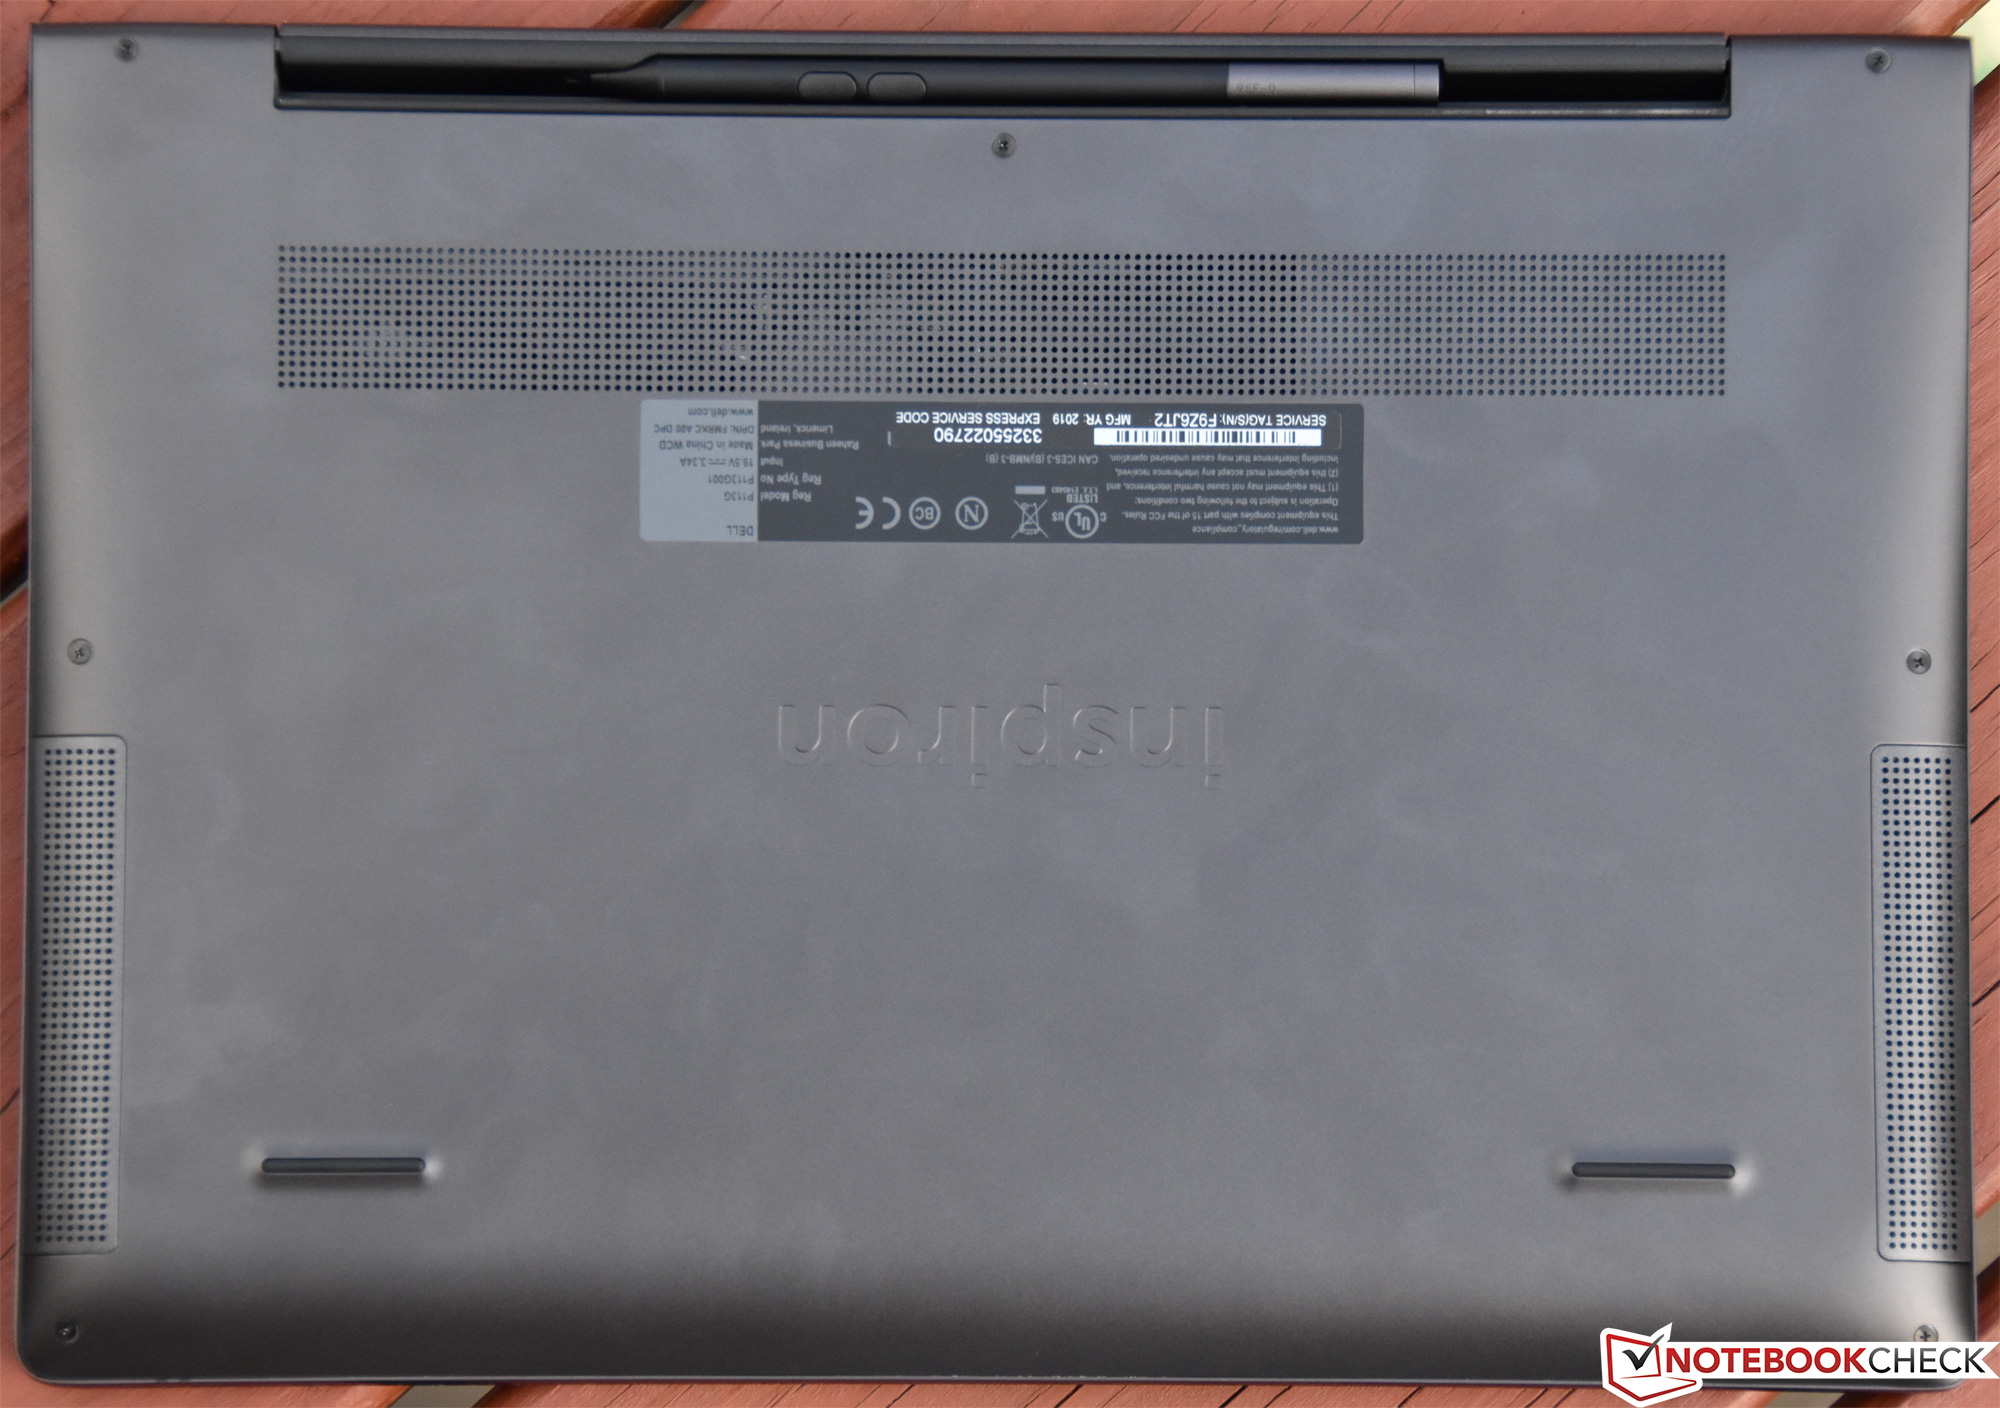
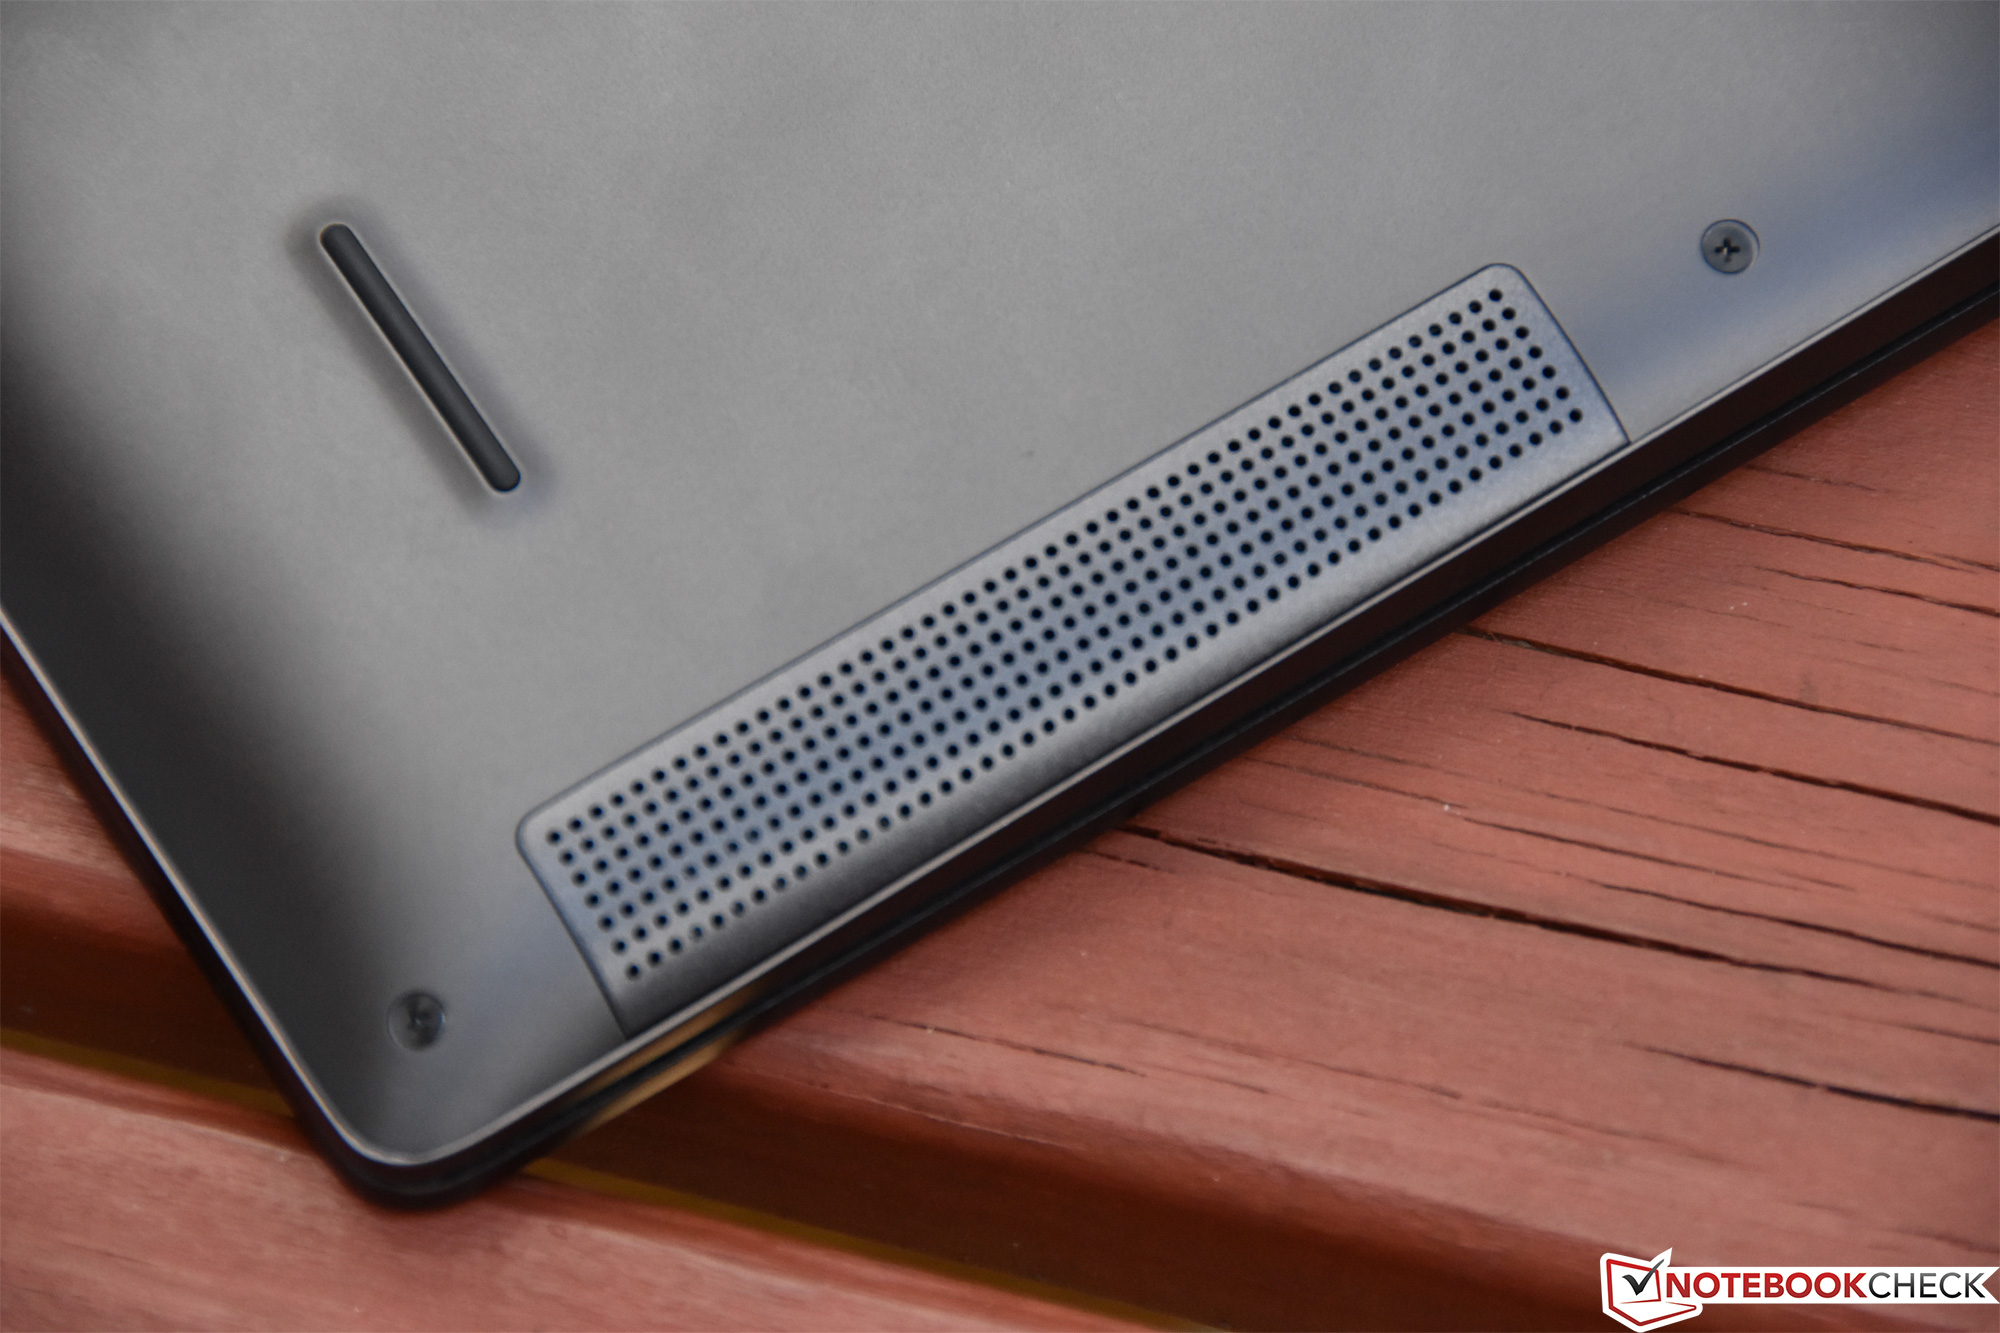
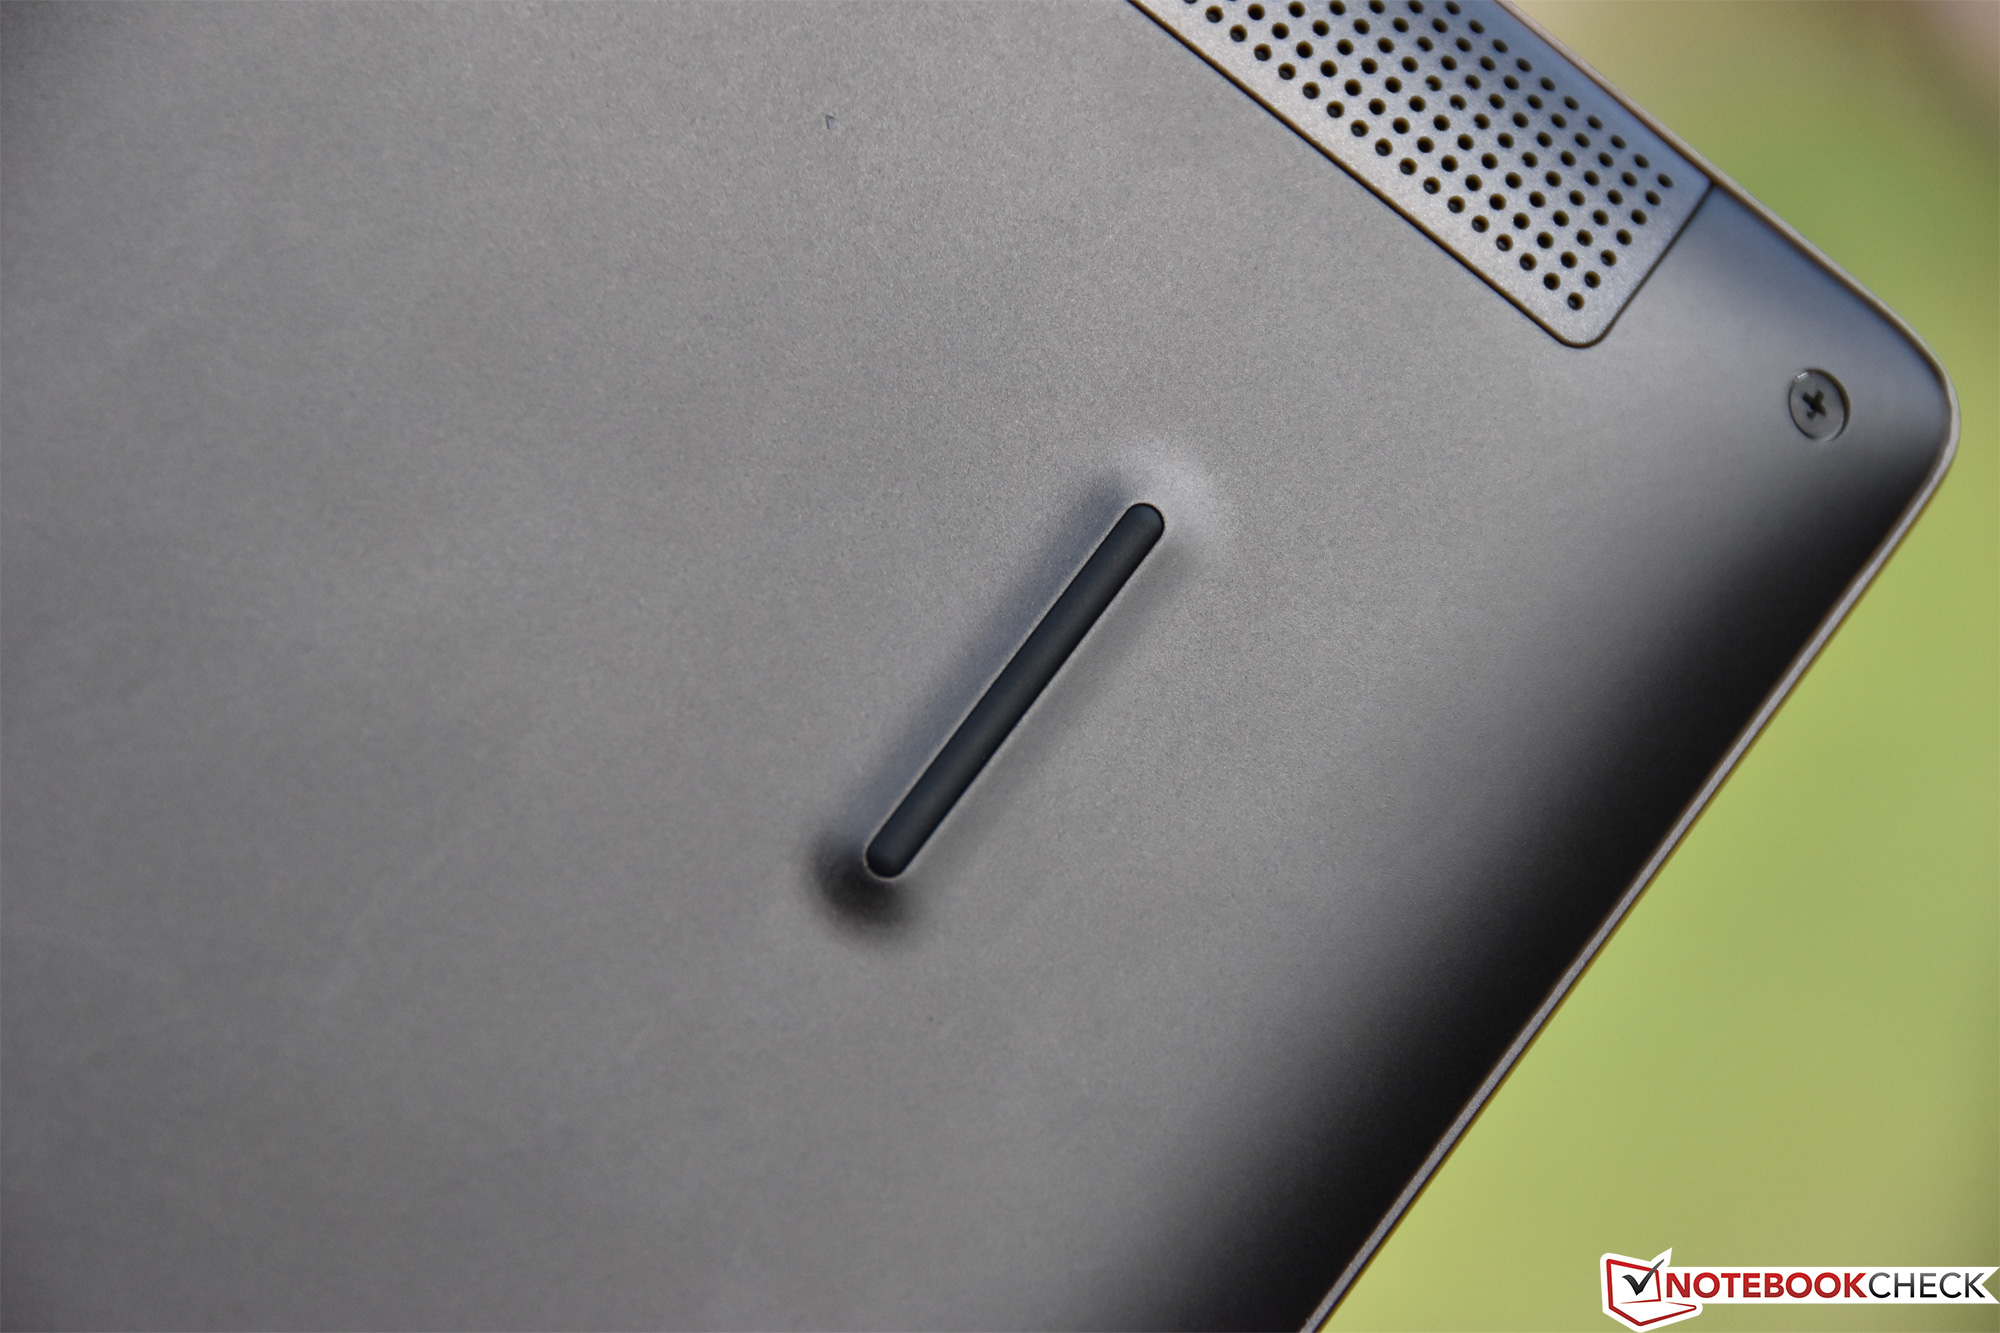
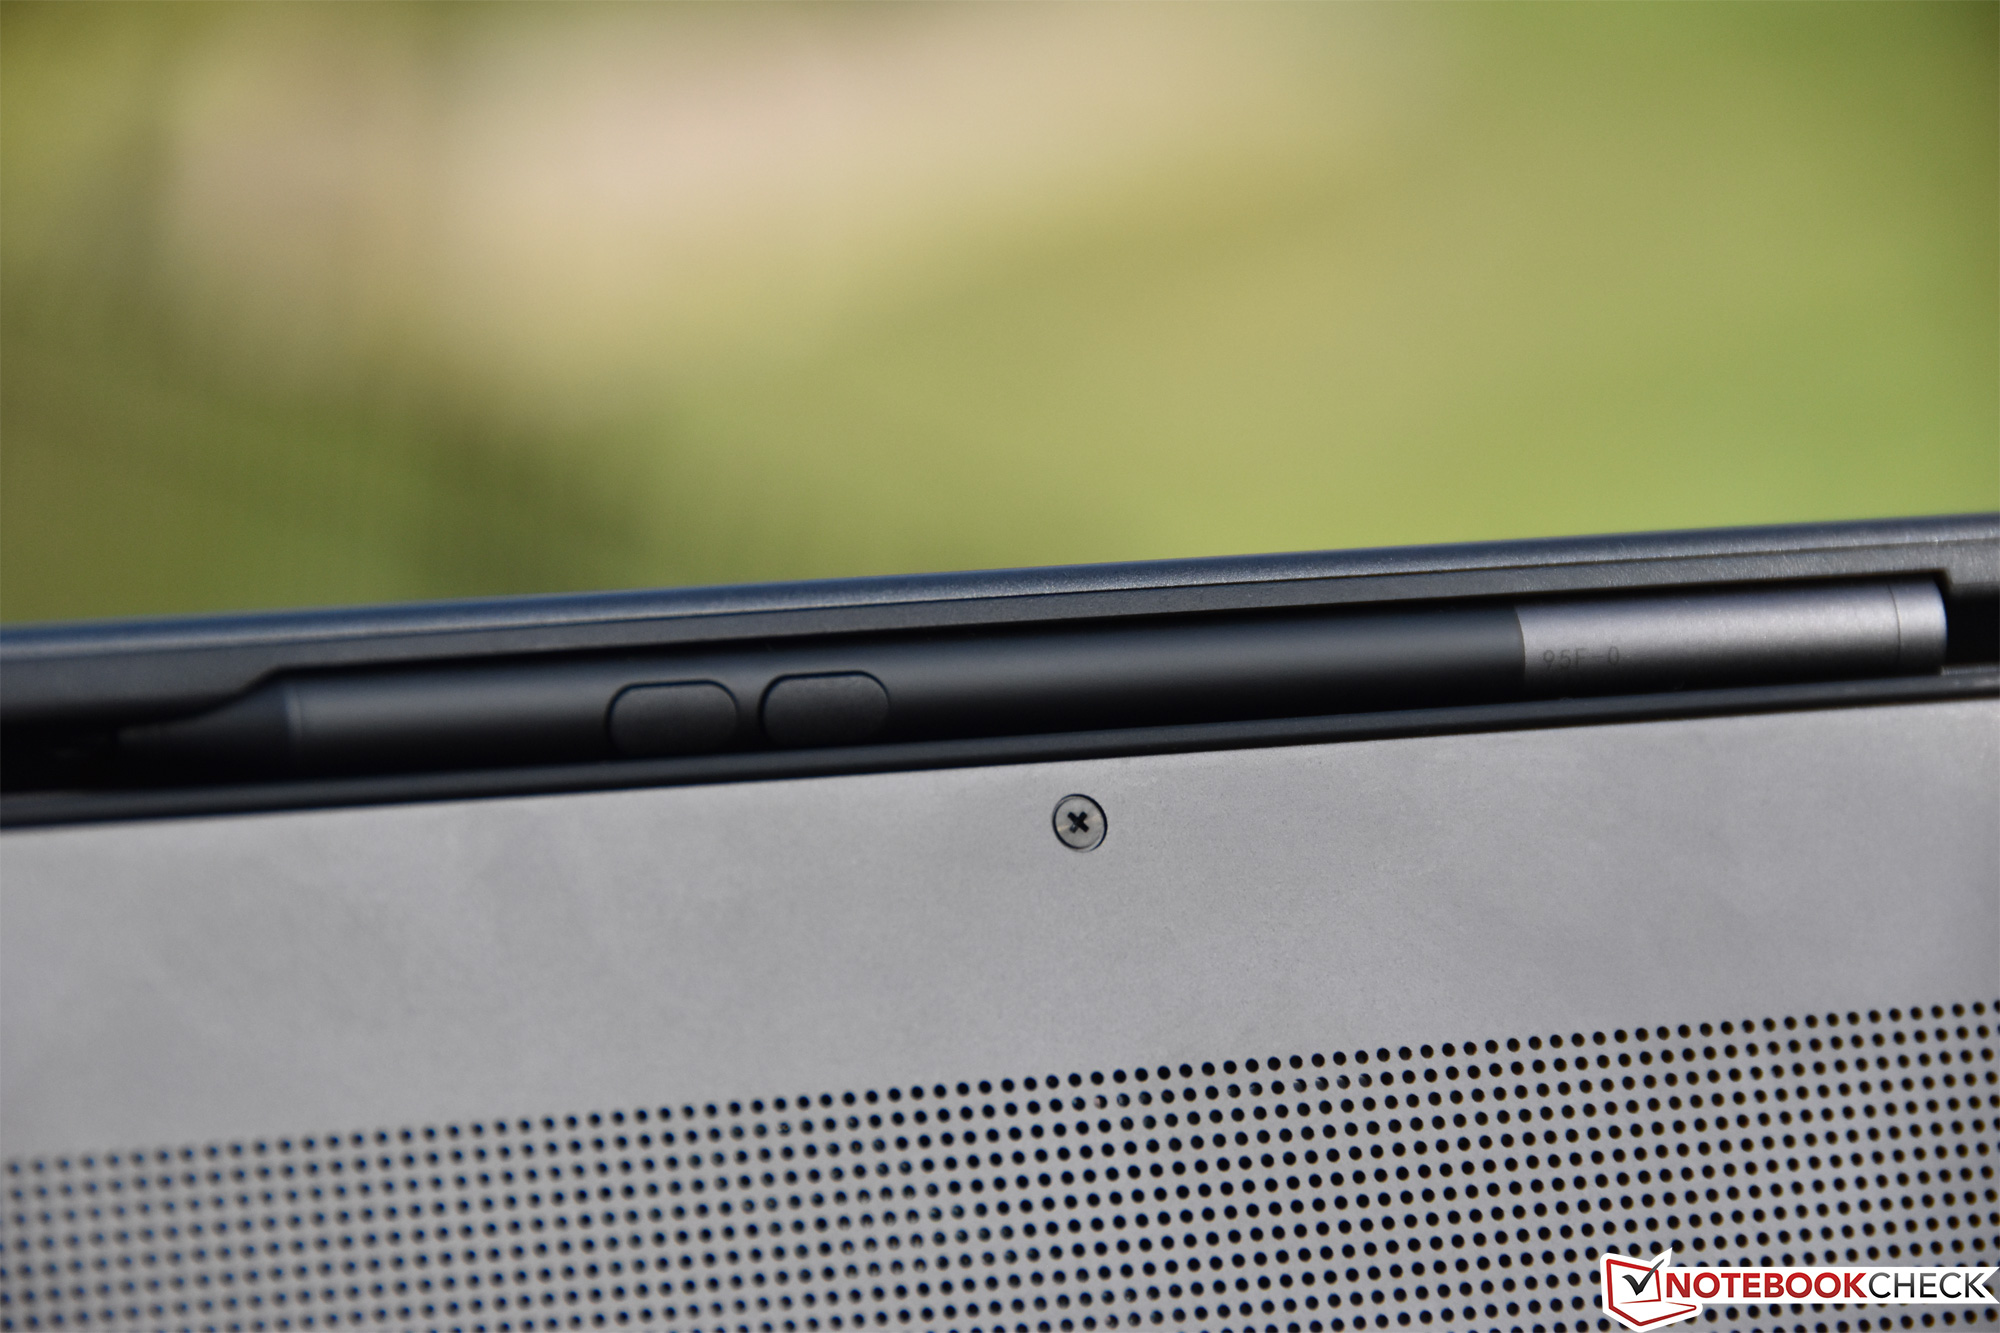
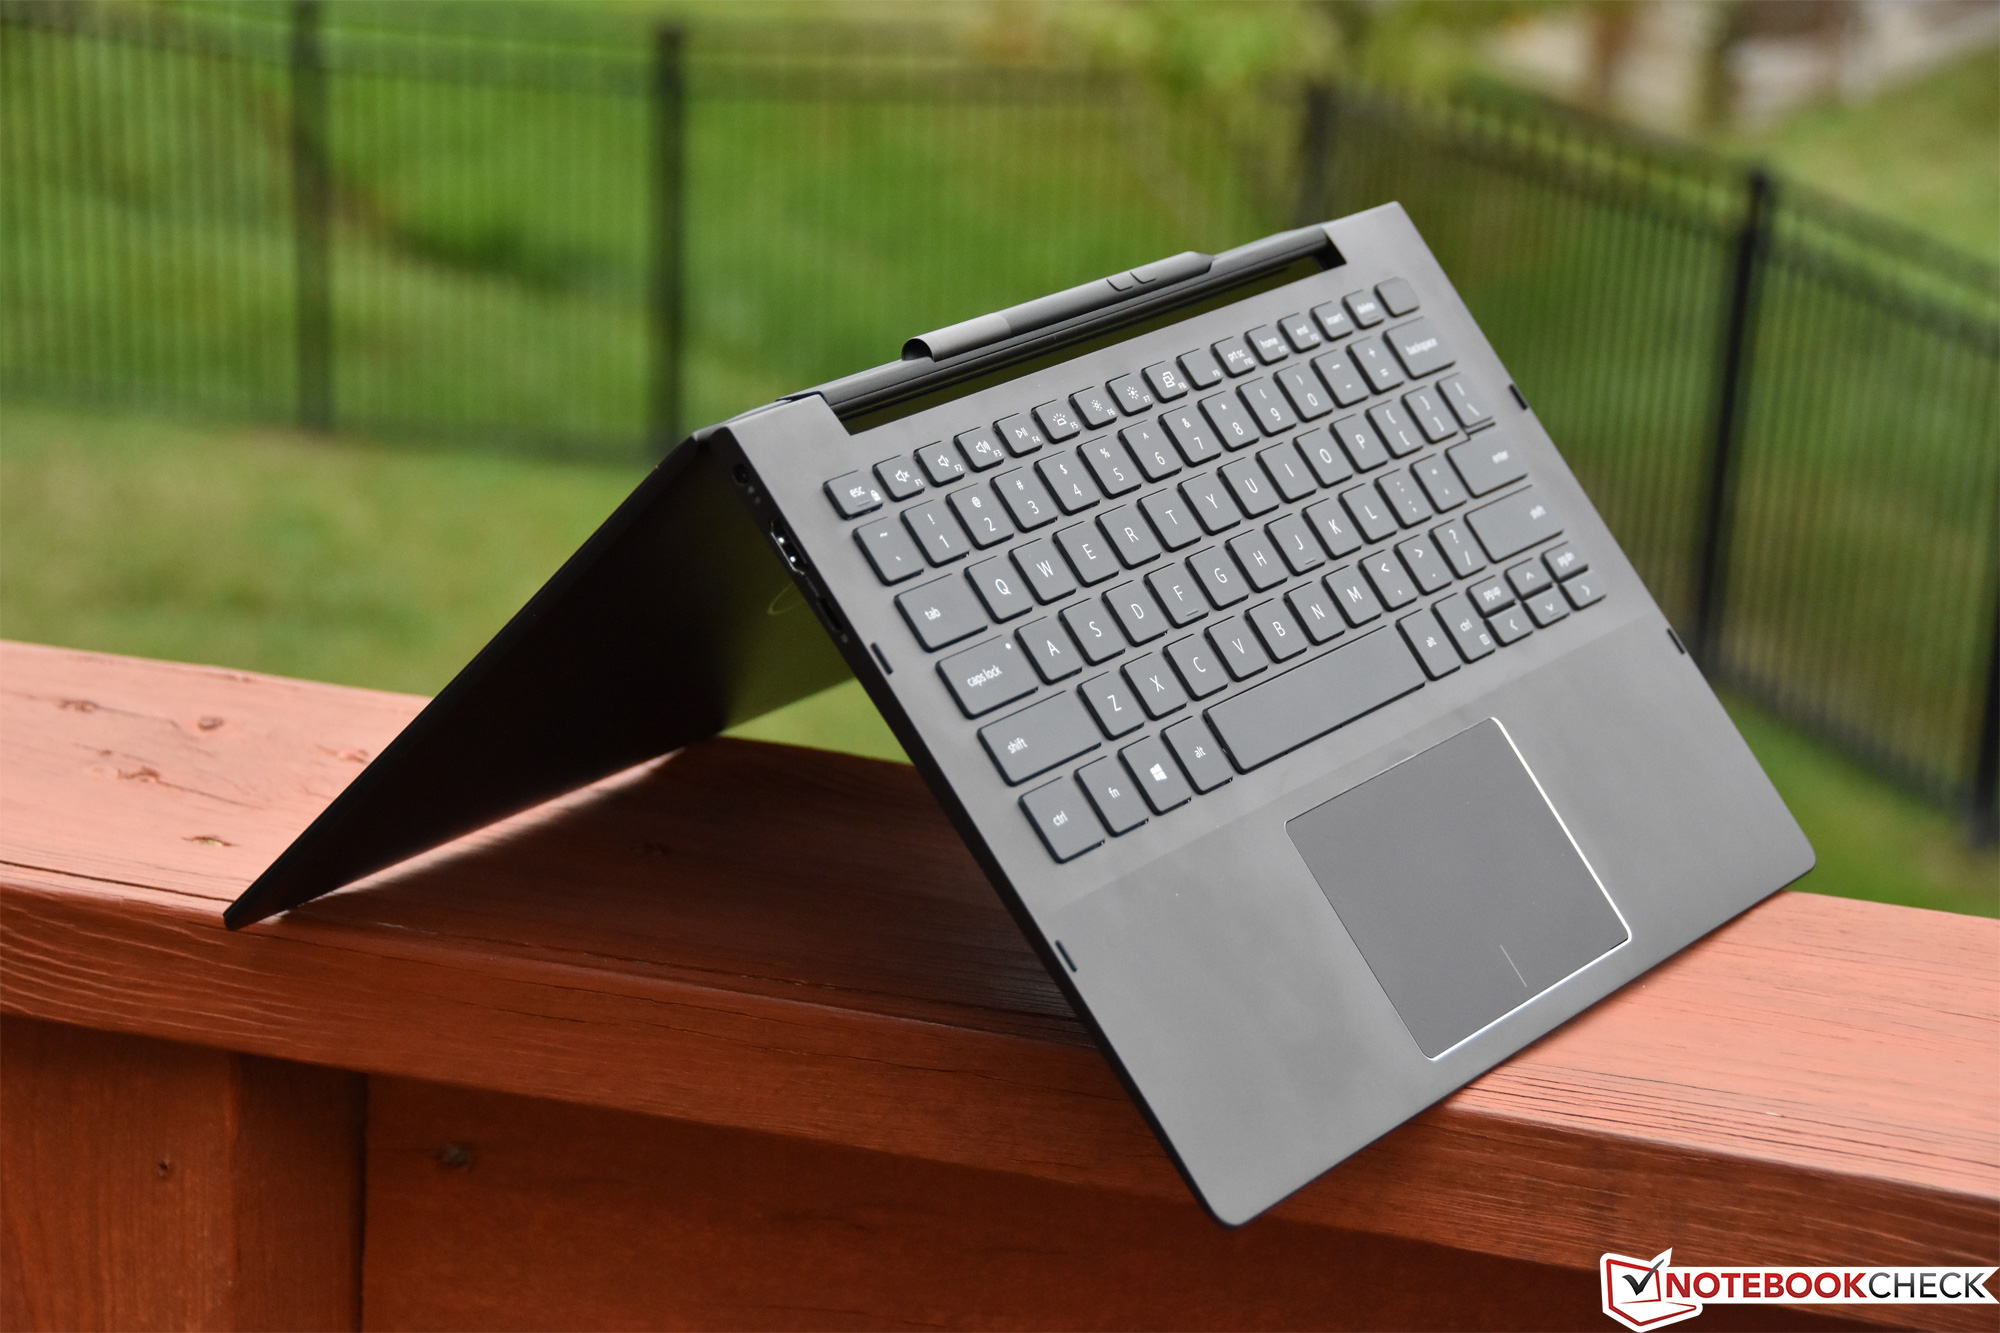
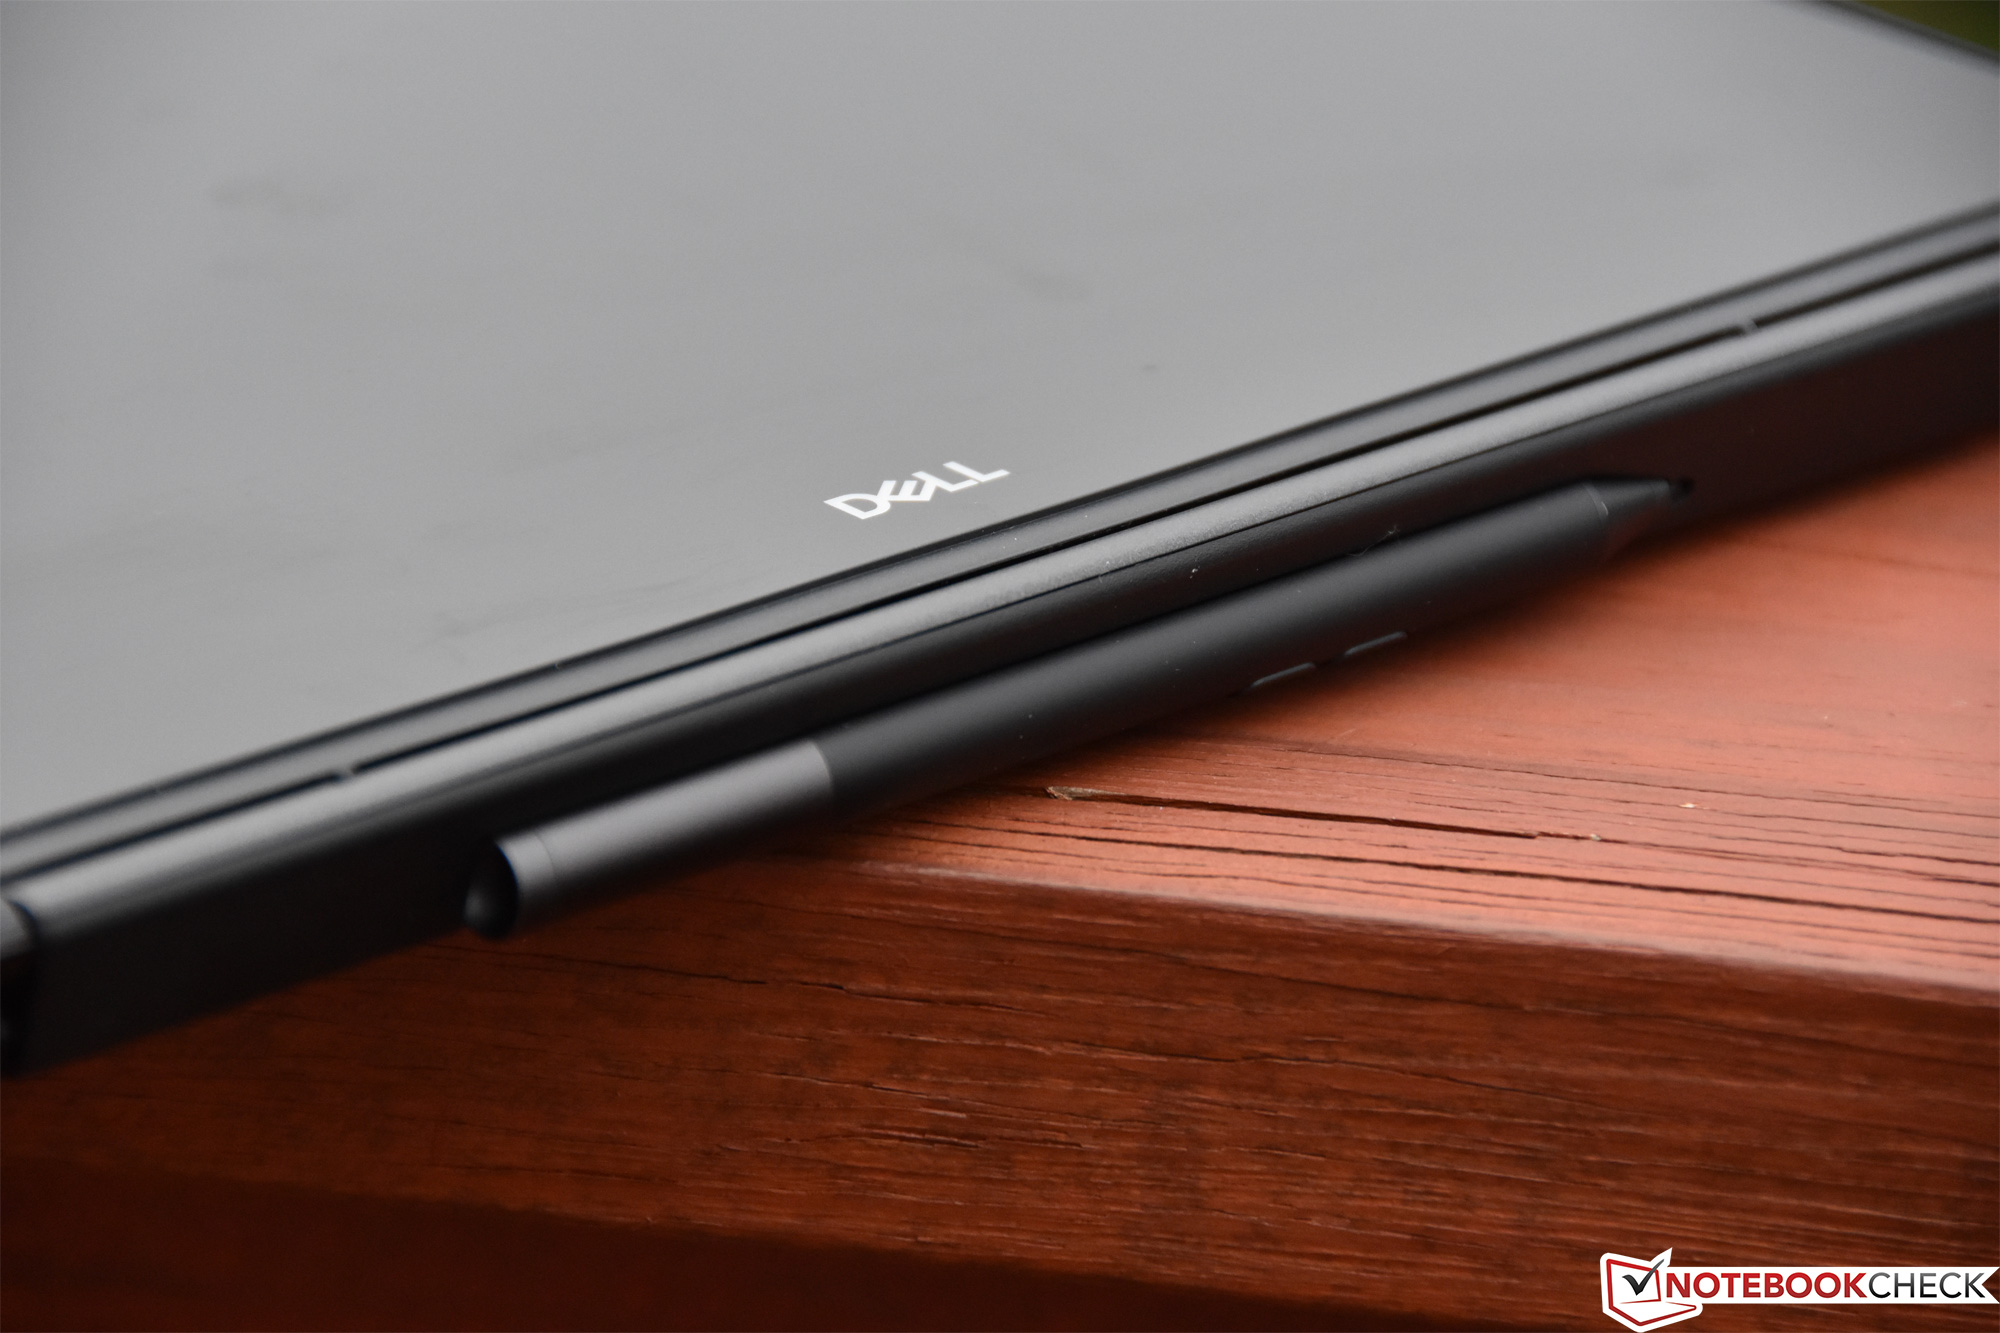
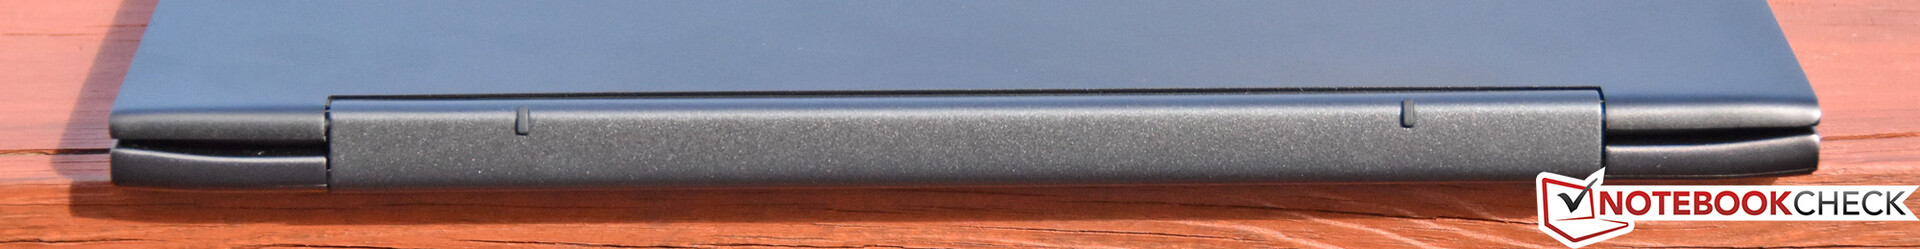
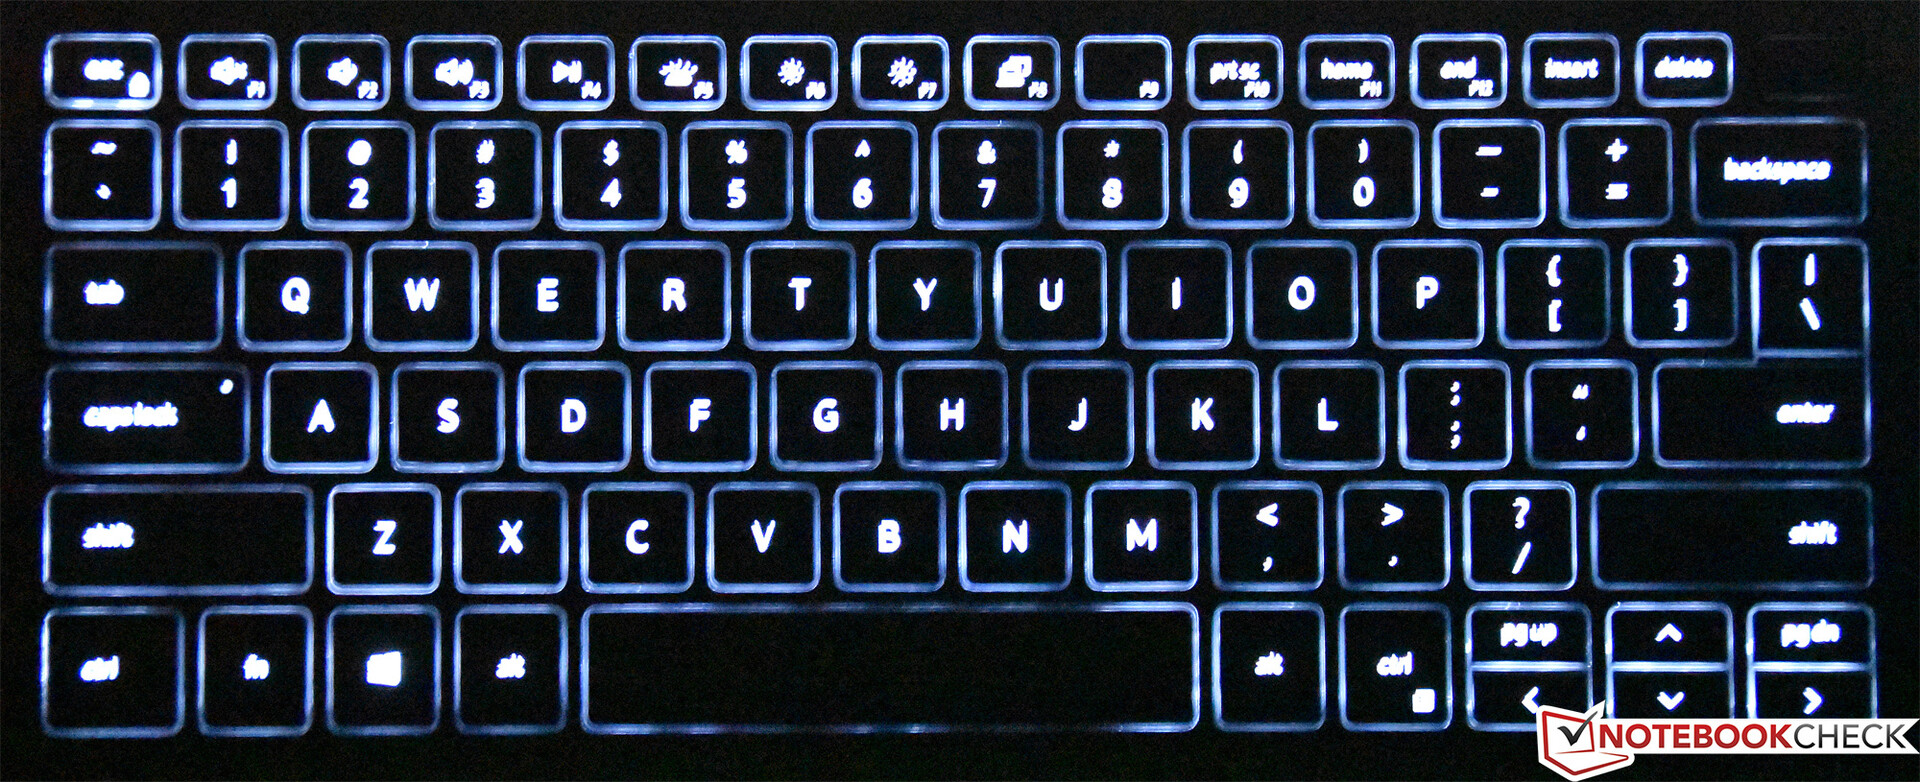
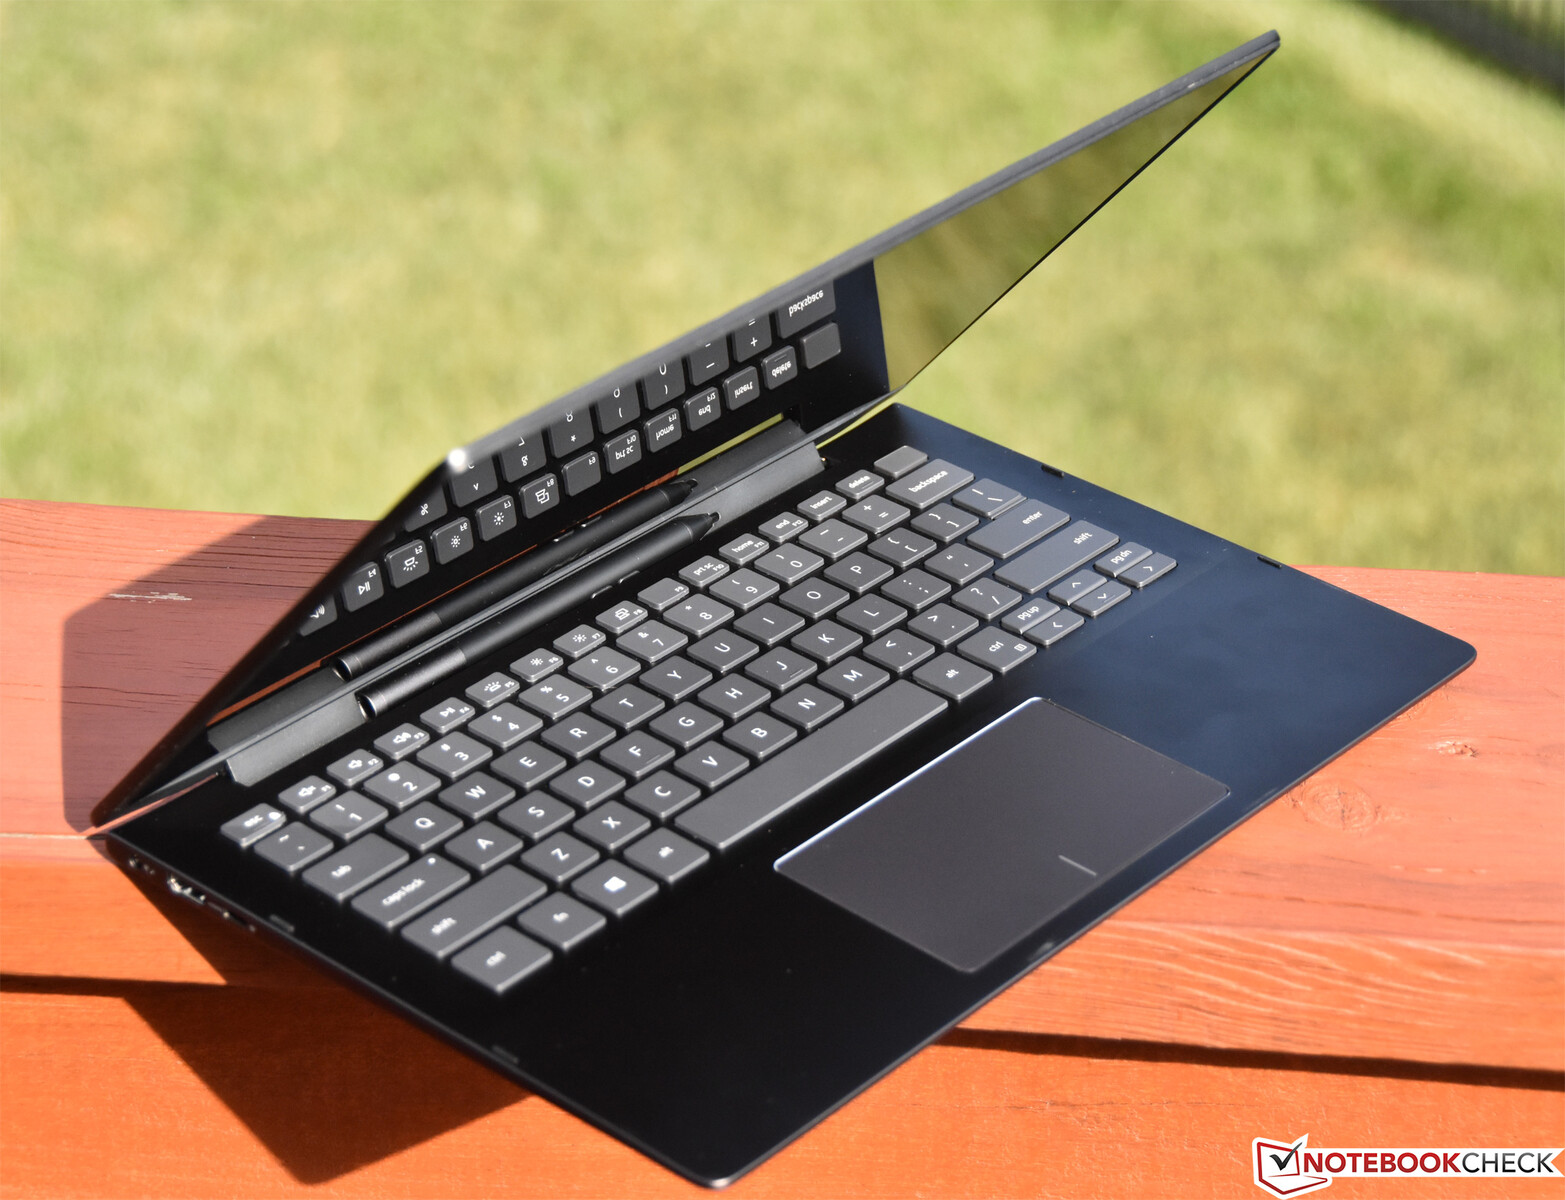
Vidare är UHD-skärmen tilltalande med ganska bra färgåtergivning och bra kalibrering direkt vid leverans. Den nya designen på startknappen (med sin inbyggda fingeravtrycksläsare) och tangentbordets layout fungerade båda bra i vårt tycke. Höljet har en konstruktion och design som är bra för den här klassen och som känns en aning mer robust än vissa av de tunnare metallkonkurrenterna. Till sist är Dells smarta gångjärnsdesign, som innehåller en magnetisk hålighet för Dells Active Pen, en av den smartaste lagringslösningarna vi sett för en stylus i full storlek.
Inspiron 7390 2-in-1 är på många sätt bättre än sin föregångare — som exempel har den mycket bättre batteritid och ännu bättre prestanda. Trots några små brister som rör inmatningsenheterna och det tveksamma värdet av en Core i7 CPU är den ett seriöst alternativ till konkurrenter från andra tillverkare som Lenovo och HP.
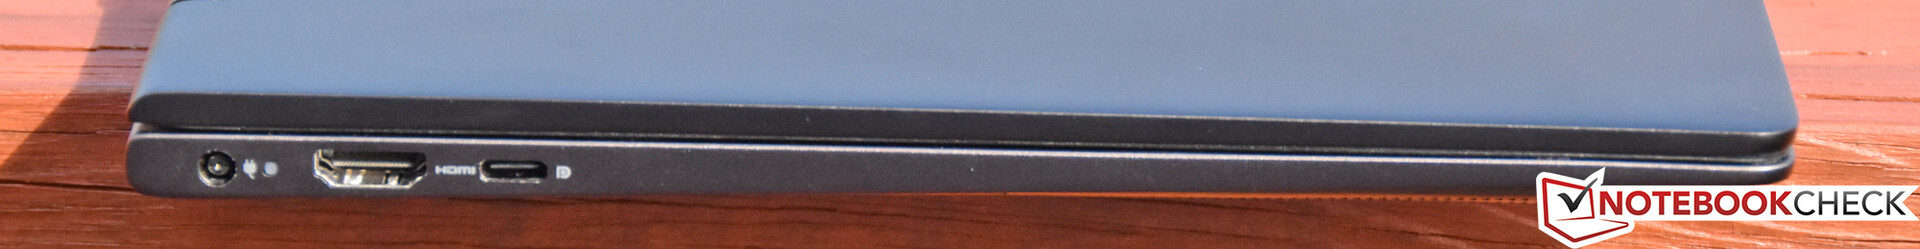
Men en del klagomål återstår. Prestandan är fortfarande en besvikelse i ljuset av resultaten från cTDP Up-konkurrenter som Lenovo’s ThinkBook 13s, som faktiskt är bättre. Portutbudet är tunt och bristen på Thunderbolt 3 och Kensington-lås kommer störa en del användare. Tangentbordet är skapligt men kunde varit bättre rörande återkoppling och den kraft som krävs för anslag. På samma sätt kräver styrplattans inbyggda knappar alldeles för mycket kraft för att aktiveras, vilket gör den ganska uttröttande att använda efter ett tag. Slutligen, även om skärmen definitivt är trevlig, hade det varit bra med ett FHD-alternativ, vilket hade bättrat på batteritiden rejält — den extra ytan kommer de flesta användare inte sakna.
Konkurrenter som är värda att överväga inkluderar ThinkPad X1 Yoga, HP Envy x360 13, ThinkPad X390 Yoga, och — på den dyrare sidan — Latitude 7400 2-in-1. Men bortsett från irritationsmomenten rörande inmatningsenheterna och jämmer över dyrare chip som inte riktigt drar sitt strå till stacken är Inspiron 7390 2-in-1 ett rimligt alternativ till de populära Yoga och x360-serierna och når mycket längre än sin föregångare.
Dell Inspiron 7390 2-in-1
- 08/23/2019 v6 (old)
Steve Schardein
Price comparison
