Test: 2020 HP Envy x360 13 - Ryzen 5 slår en Core i7 (Sammanfattning)
Gradering | Datum | Modell | Vikt | Höjd | Storlek | Upplösning | Pris |
|---|---|---|---|---|---|---|---|
| 85.5 % v7 (old) | 07/2020 | HP Envy x360 13-ay0010nr R5 4500U, Vega 6 | 1.3 kg | 16.4 mm | 13.30" | 1920x1080 | |
| 86.3 % v7 (old) | 10/2019 | Dell XPS 13 7390 2-in-1 Core i7 i7-1065G7, Iris Plus Graphics G7 (Ice Lake 64 EU) | 1.3 kg | 13 mm | 13.40" | 1920x1200 | |
| 88.4 % v7 (old) | 01/2020 | HP Spectre x360 13-aw0013dx i7-1065G7, Iris Plus Graphics G7 (Ice Lake 64 EU) | 1.2 kg | 16.9 mm | 13.30" | 1920x1080 | |
| 86.6 % v6 (old) | 05/2019 | Asus ZenBook S13 UX392FN i7-8565U, GeForce MX150 | 1.1 kg | 12.9 mm | 13.90" | 1920x1080 | |
| 92.1 % v7 (old) | 06/2020 | Apple MacBook Pro 13 2020 2GHz i5 10th-Gen i5-1038NG7, Iris Plus Graphics G7 (Ice Lake 64 EU) | 1.4 kg | 15.6 mm | 13.30" | 2560x1600 |
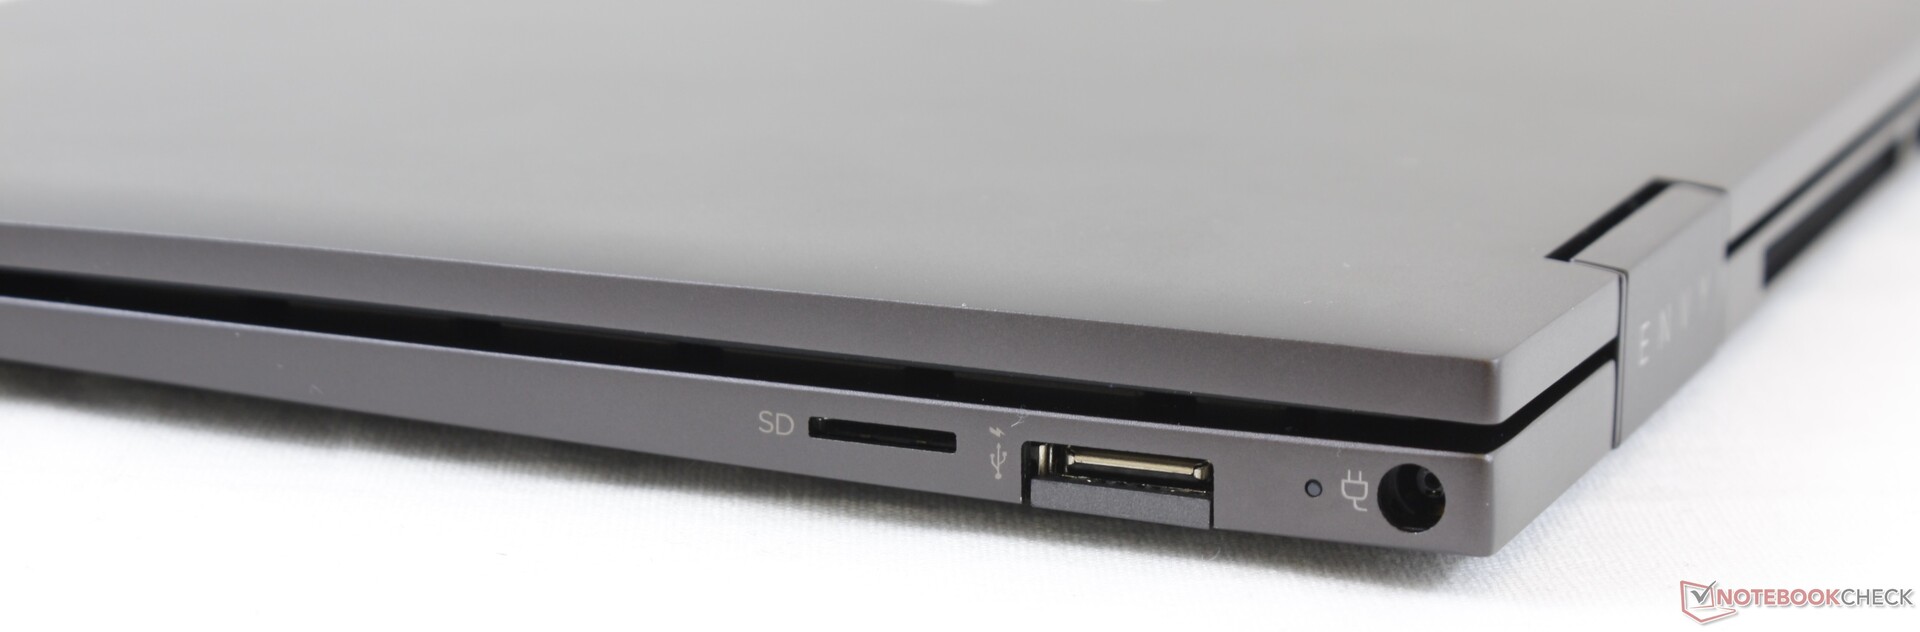
| SD Card Reader | |
| average JPG Copy Test (av. of 3 runs) | |
| HP Spectre x360 13-aw0013dx (Toshiba Exceria Pro M501 microSDXC 64GB) | |
| Dell XPS 13 7390 2-in-1 Core i7 (Toshiba Exceria Pro M501 64 GB UHS-II) | |
| HP Envy x360 13-ay0010nr (Toshiba Exceria Pro M501 64 GB UHS-II) | |
| HP Envy x360 13-ar0601ng (Toshiba Exceria Pro M501 microSDXC 64GB) | |
| Asus ZenBook S13 UX392FN (Toshiba Exceria Pro M501 64 GB UHS-II) | |
| maximum AS SSD Seq Read Test (1GB) | |
| Dell XPS 13 7390 2-in-1 Core i7 (Toshiba Exceria Pro M501 64 GB UHS-II) | |
| HP Spectre x360 13-aw0013dx (Toshiba Exceria Pro M501 microSDXC 64GB) | |
| HP Envy x360 13-ar0601ng (Toshiba Exceria Pro M501 microSDXC 64GB) | |
| HP Envy x360 13-ay0010nr (Toshiba Exceria Pro M501 64 GB UHS-II) | |
| Asus ZenBook S13 UX392FN (Toshiba Exceria Pro M501 64 GB UHS-II) | |


| |||||||||||||||||||||||||
Distribution av ljusstyrkan: 93 %
Mitt på batteriet: 452.6 cd/m²
Kontrast: 1561:1 (Svärta: 0.29 cd/m²)
ΔE ColorChecker Calman: 2.67 | ∀{0.5-29.43 Ø4.72}
calibrated: 1.36
ΔE Greyscale Calman: 2.1 | ∀{0.09-98 Ø4.97}
97.6% sRGB (Argyll 1.6.3 3D)
62.2% AdobeRGB 1998 (Argyll 1.6.3 3D)
67.8% AdobeRGB 1998 (Argyll 3D)
97.4% sRGB (Argyll 3D)
65.9% Display P3 (Argyll 3D)
Gamma: 2.01
CCT: 6505 K
| HP Envy x360 13-ay0010nr IPS, 13.3", 1920x1080 | HP Envy x360 13-ar0601ng InfoVision, M133NVF3 R2, IPS, 120 Hz, 13.3", 1920x1080 | Dell XPS 13 7390 2-in-1 Core i7 Sharp LQ134N1, IPS, 13.4", 1920x1200 | HP Spectre x360 13-aw0013dx AU Optronics AUO5E2D, IPS, 13.3", 1920x1080 | Asus ZenBook S13 UX392FN Tianma XM, IPS, 13.9", 1920x1080 | Apple MacBook Pro 13 2020 2GHz i5 10th-Gen APPA03D, IPS, 13.3", 2560x1600 | |
|---|---|---|---|---|---|---|
| Display | -6% | 4% | 4% | 1% | 27% | |
| Display P3 Coverage (%) | 65.9 | 63 -4% | 69.9 6% | 69.6 6% | 67.5 2% | 98.8 50% |
| sRGB Coverage (%) | 97.4 | 90.8 -7% | 99.2 2% | 98.9 2% | 95.8 -2% | 99.9 3% |
| AdobeRGB 1998 Coverage (%) | 67.8 | 63.8 -6% | 71.5 5% | 71.5 5% | 69 2% | 86.4 27% |
| Response Times | 29% | 5% | -21% | 12% | 2% | |
| Response Time Grey 50% / Grey 80% * (ms) | 47.6 ? | 35 ? 26% | 47.6 ? -0% | 60.8 ? -28% | 47.2 ? 1% | 46 ? 3% |
| Response Time Black / White * (ms) | 32.4 ? | 22 ? 32% | 29.2 ? 10% | 36.8 ? -14% | 24.8 ? 23% | 32.4 ? -0% |
| PWM Frequency (Hz) | 25000 ? | 4065 ? | 2500 ? | 113600 ? | ||
| Screen | -22% | 0% | -36% | -2% | 12% | |
| Brightness middle (cd/m²) | 452.6 | 633 40% | 549.8 21% | 447.4 -1% | 466 3% | 512 13% |
| Brightness (cd/m²) | 438 | 675 54% | 520 19% | 420 -4% | 462 5% | 491 12% |
| Brightness Distribution (%) | 93 | 75 -19% | 86 -8% | 85 -9% | 90 -3% | 91 -2% |
| Black Level * (cd/m²) | 0.29 | 0.55 -90% | 0.39 -34% | 0.31 -7% | 0.33 -14% | 0.32 -10% |
| Contrast (:1) | 1561 | 1151 -26% | 1410 -10% | 1443 -8% | 1412 -10% | 1600 2% |
| Colorchecker dE 2000 * | 2.67 | 3.12 -17% | 2.12 21% | 4.23 -58% | 1.93 28% | 1.7 36% |
| Colorchecker dE 2000 max. * | 4.11 | 6.37 -55% | 3.66 11% | 9.34 -127% | 4.26 -4% | 3.4 17% |
| Colorchecker dE 2000 calibrated * | 1.36 | 1.83 -35% | 1.37 -1% | 1.32 3% | 1.99 -46% | 1 26% |
| Greyscale dE 2000 * | 2.1 | 3.89 -85% | 2.6 -24% | 6.1 -190% | 1.7 19% | 1.9 10% |
| Gamma | 2.01 109% | 2.39 92% | 2.3 96% | 2.11 104% | 2.15 102% | 2.19 100% |
| CCT | 6505 100% | 6476 100% | 6884 94% | 6136 106% | 6382 102% | 6817 95% |
| Color Space (Percent of AdobeRGB 1998) (%) | 62.2 | 59 -5% | 65.4 5% | 64.8 4% | 62.2 0% | 77.4 24% |
| Color Space (Percent of sRGB) (%) | 97.6 | 91 -7% | 99.7 2% | 98.9 1% | 95.7 -2% | 99.9 2% |
| Totalt genomsnitt (program/inställningar) | 0% /
-13% | 3% /
2% | -18% /
-27% | 4% /
0% | 14% /
13% |
* ... mindre är bättre
Visa svarstider
| ↔ Svarstid svart till vitt | ||
|---|---|---|
| 32.4 ms ... stiga ↗ och falla ↘ kombinerat | ↗ 16.4 ms stiga | 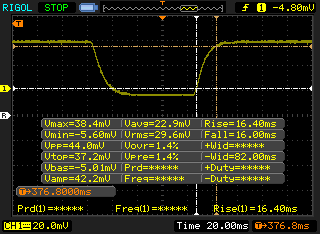 |
| ↘ 16 ms hösten | ||
| Skärmen visar långsamma svarsfrekvenser i våra tester och kommer att vara otillfredsställande för spelare. I jämförelse sträcker sig alla testade enheter från 0.1 (minst) till 240 (maximalt) ms. » 88 % av alla enheter är bättre. Detta innebär att den uppmätta svarstiden är sämre än genomsnittet av alla testade enheter (19.8 ms). | ||
| ↔ Svarstid 50 % grått till 80 % grått | ||
| 47.6 ms ... stiga ↗ och falla ↘ kombinerat | ↗ 24.8 ms stiga | 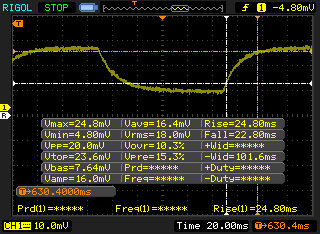 |
| ↘ 22.8 ms hösten | ||
| Skärmen visar långsamma svarsfrekvenser i våra tester och kommer att vara otillfredsställande för spelare. I jämförelse sträcker sig alla testade enheter från 0.165 (minst) till 636 (maximalt) ms. » 82 % av alla enheter är bättre. Detta innebär att den uppmätta svarstiden är sämre än genomsnittet av alla testade enheter (31 ms). | ||
Skärmflimmer / PWM (Puls-Width Modulation)
| Skärmflimmer / PWM upptäckt | 25000 Hz | ≤ 45 % ljusstyrka inställning | 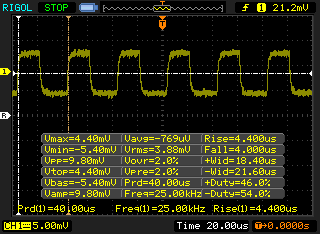 |
Displayens bakgrundsbelysning flimrar vid 25000 Hz (i värsta fall, t.ex. med PWM) Flimrande upptäckt vid en ljusstyrkeinställning på 45 % och lägre. Det ska inte finnas något flimmer eller PWM över denna ljusstyrkeinställning. Frekvensen för 25000 Hz är ganska hög, så de flesta användare som är känsliga för PWM bör inte märka något flimmer. Som jämförelse: 52 % av alla testade enheter använder inte PWM för att dämpa skärmen. Om PWM upptäcktes mättes ett medelvärde av 7769 (minst: 5 - maximum: 343500) Hz. | |||
Cinebench R15: CPU Multi 64Bit | CPU Single 64Bit
Blender: v2.79 BMW27 CPU
7-Zip 18.03: 7z b 4 -mmt1 | 7z b 4
Geekbench 5.5: Single-Core | Multi-Core
HWBOT x265 Benchmark v2.2: 4k Preset
LibreOffice : 20 Documents To PDF
R Benchmark 2.5: Overall mean
| Cinebench R20 / CPU (Multi Core) | |
| Dell XPS 13 7390 Core i7-10710U | |
| Acer Swift 3 SF314-42-R4XJ | |
| Genomsnitt AMD Ryzen 5 4500U (1843 - 2530, n=13) | |
| HP Envy x360 13-ay0010nr | |
| Dell XPS 13 9300 Core i7-1065G7 | |
| MSI GF63 Thin 9SC | |
| Dell XPS 13 9300 i5 FHD | |
| Dell Inspiron 15 5000 5585 | |
| Acer Swift 3 SF314-42-R27B | |
| Lenovo ThinkPad X1 Carbon 2020-20UAS04T00 | |
| Huawei MateBook 13 2020 AMD | |
| HP Envy 13-aq0003ng | |
| Dynabook Portege A30-E-174 | |
| Dell Latitude 13 3390 | |
| Cinebench R20 / CPU (Single Core) | |
| Acer Swift 3 SF314-42-R4XJ | |
| Dell XPS 13 7390 Core i7-10710U | |
| Dell XPS 13 9300 Core i7-1065G7 | |
| Genomsnitt AMD Ryzen 5 4500U (424 - 453, n=12) | |
| Lenovo ThinkPad X1 Carbon 2020-20UAS04T00 | |
| Acer Swift 3 SF314-42-R27B | |
| Dell XPS 13 9300 i5 FHD | |
| HP Envy x360 13-ay0010nr | |
| MSI GF63 Thin 9SC | |
| Dynabook Portege A30-E-174 | |
| Huawei MateBook 13 2020 AMD | |
| HP Envy 13-aq0003ng | |
| Dell Latitude 13 3390 | |
| Dell Inspiron 15 5000 5585 | |
| Cinebench R15 / CPU Multi 64Bit | |
| Dell XPS 13 7390 Core i7-10710U | |
| Acer Swift 3 SF314-42-R4XJ | |
| Genomsnitt AMD Ryzen 5 4500U (715 - 1007, n=18) | |
| HP Envy x360 13-ay0010nr | |
| MSI GF63 Thin 9SC | |
| Dell XPS 13 9300 Core i7-1065G7 | |
| Lenovo ThinkPad X1 Carbon 2020-20UAS04T00 | |
| Dell Inspiron 15 5000 5585 | |
| Dell XPS 13 9300 i5 FHD | |
| Dell XPS 13 9300 i5 FHD | |
| Huawei MateBook 13 2020 AMD | |
| Acer Swift 3 SF314-42-R27B | |
| Dell Latitude 13 3390 | |
| HP Envy 13-aq0003ng | |
| Dynabook Portege A30-E-174 | |
| Cinebench R15 / CPU Single 64Bit | |
| Lenovo ThinkPad X1 Carbon 2020-20UAS04T00 | |
| Dell XPS 13 7390 Core i7-10710U | |
| Dell XPS 13 9300 Core i7-1065G7 | |
| Acer Swift 3 SF314-42-R4XJ | |
| MSI GF63 Thin 9SC | |
| HP Envy x360 13-ay0010nr | |
| Genomsnitt AMD Ryzen 5 4500U (156 - 177, n=13) | |
| HP Envy 13-aq0003ng | |
| Dell XPS 13 9300 i5 FHD | |
| Acer Swift 3 SF314-42-R27B | |
| Dynabook Portege A30-E-174 | |
| Huawei MateBook 13 2020 AMD | |
| Dell Latitude 13 3390 | |
| Dell Inspiron 15 5000 5585 | |
| Geekbench 5.5 / Single-Core | |
| Dell XPS 13 9300 i5 FHD | |
| Lenovo ThinkPad X1 Carbon 2020-20UAS04T00 | |
| Genomsnitt AMD Ryzen 5 4500U (1082 - 1220, n=10) | |
| Acer Swift 3 SF314-42-R4XJ | |
| HP Envy x360 13-ay0010nr | |
| Acer Swift 3 SF314-42-R27B | |
| Huawei MateBook 13 2020 AMD | |
| Geekbench 5.5 / Multi-Core | |
| Acer Swift 3 SF314-42-R4XJ | |
| Genomsnitt AMD Ryzen 5 4500U (4352 - 6234, n=10) | |
| HP Envy x360 13-ay0010nr | |
| Dell XPS 13 9300 i5 FHD | |
| Lenovo ThinkPad X1 Carbon 2020-20UAS04T00 | |
| Acer Swift 3 SF314-42-R27B | |
| Huawei MateBook 13 2020 AMD | |
| HWBOT x265 Benchmark v2.2 / 4k Preset | |
| Acer Swift 3 SF314-42-R4XJ | |
| Genomsnitt AMD Ryzen 5 4500U (5.86 - 7.33, n=10) | |
| HP Envy x360 13-ay0010nr | |
| Dell XPS 13 7390 Core i7-10710U | |
| Lenovo ThinkPad X1 Carbon 2020-20UAS04T00 | |
| Acer Swift 3 SF314-42-R27B | |
| Dell XPS 13 9300 i5 FHD | |
| Dell Latitude 13 3390 | |
| Huawei MateBook 13 2020 AMD | |
| LibreOffice / 20 Documents To PDF | |
| Huawei MateBook 13 2020 AMD | |
| Genomsnitt AMD Ryzen 5 4500U (58.2 - 78, n=11) | |
| Acer Swift 3 SF314-42-R27B | |
| HP Envy x360 13-ay0010nr | |
| Acer Swift 3 SF314-42-R4XJ | |
| Lenovo ThinkPad X1 Carbon 2020-20UAS04T00 | |
| R Benchmark 2.5 / Overall mean | |
| Huawei MateBook 13 2020 AMD | |
| Dell XPS 13 9300 i5 FHD | |
| Acer Swift 3 SF314-42-R27B | |
| Lenovo ThinkPad X1 Carbon 2020-20UAS04T00 | |
| Genomsnitt AMD Ryzen 5 4500U (0.614 - 0.654, n=10) | |
| Acer Swift 3 SF314-42-R4XJ | |
| HP Envy x360 13-ay0010nr | |
Cinebench R15: CPU Multi 64Bit | CPU Single 64Bit
Blender: v2.79 BMW27 CPU
7-Zip 18.03: 7z b 4 -mmt1 | 7z b 4
Geekbench 5.5: Single-Core | Multi-Core
HWBOT x265 Benchmark v2.2: 4k Preset
LibreOffice : 20 Documents To PDF
R Benchmark 2.5: Overall mean
* ... mindre är bättre
| PCMark 8 Home Score Accelerated v2 | 4127 poäng | |
| PCMark 8 Work Score Accelerated v2 | 5249 poäng | |
| PCMark 10 Score | 4884 poäng | |
Hjälp | ||
| DPC Latencies / LatencyMon - interrupt to process latency (max), Web, Youtube, Prime95 | |
| Dell XPS 15 9500 Core i7 4K UHD | |
| Razer Blade Stealth Core i7 GTX 1650 Ti Max-Q 4K | |
| HP Envy x360 13-ay0010nr | |
| Asus VivoBook 17 S712FA-DS76 | |
* ... mindre är bättre
| HP Envy x360 13-ay0010nr Toshiba KBG30ZMV256G | HP Envy x360 13-ar0601ng SK Hynix BC501 HFM512GDJTNG | Dell XPS 13 7390 2-in-1 Core i7 Toshiba BG4 KBG40ZPZ512G | HP Spectre x360 13-aw0013dx Intel Optane Memory H10 with Solid State Storage 32GB + 512GB HBRPEKNX0202A(L/H) | Asus ZenBook S13 UX392FN WDC PC SN520 SDAPNUW-512G | |
|---|---|---|---|---|---|
| AS SSD | 21% | 37% | 18% | 86% | |
| Seq Read (MB/s) | 1135 | 1412 24% | 1801 59% | 1039 -8% | 1224 8% |
| Seq Write (MB/s) | 628 | 540 -14% | 1125 79% | 310.1 -51% | 907 44% |
| 4K Read (MB/s) | 42.49 | 32.24 -24% | 39.7 -7% | 76 79% | 41.46 -2% |
| 4K Write (MB/s) | 96.9 | 74.7 -23% | 67 -31% | 118 22% | 126.2 30% |
| 4K-64 Read (MB/s) | 614 | 567 -8% | 1253 104% | 371.8 -39% | 1021 66% |
| 4K-64 Write (MB/s) | 256.4 | 700 173% | 209 -18% | 469.5 83% | 1251 388% |
| Access Time Read * (ms) | 0.162 | 0.049 70% | 0.069 57% | 0.067 59% | 0.053 67% |
| Access Time Write * (ms) | 0.592 | 0.048 92% | 0.625 -6% | 0.138 77% | 0.027 95% |
| Score Read (Points) | 770 | 741 -4% | 1472 91% | 552 -28% | 1185 54% |
| Score Write (Points) | 416 | 829 99% | 388 -7% | 618 49% | 1468 253% |
| Score Total (Points) | 1567 | 1913 22% | 2583 65% | 1448 -8% | 3250 107% |
| Copy ISO MB/s (MB/s) | 843 | 521 -38% | 1293 53% | 764 -9% | 1404 67% |
| Copy Program MB/s (MB/s) | 367.9 | 253.1 -31% | 560 52% | 465.8 27% | 402.4 9% |
| Copy Game MB/s (MB/s) | 727 | 392.9 -46% | 927 28% | 764 5% | 902 24% |
| CrystalDiskMark 5.2 / 6 | -1% | 46% | 44% | 53% | |
| Write 4K (MB/s) | 94.8 | 88.3 -7% | 106.7 13% | 112.6 19% | 149.2 57% |
| Read 4K (MB/s) | 45.5 | 34.84 -23% | 49.94 10% | 131 188% | 47.18 4% |
| Write Seq (MB/s) | 732 | 740 1% | 1223 67% | 458.9 -37% | 750 2% |
| Read Seq (MB/s) | 959 | 985 3% | 1801 88% | 1355 41% | 1137 19% |
| Write 4K Q32T1 (MB/s) | 224.6 | 313.7 40% | 325.3 45% | 341.3 52% | 749 233% |
| Read 4K Q32T1 (MB/s) | 365.2 | 243.1 -33% | 551 51% | 320.6 -12% | 478.7 31% |
| Write Seq Q32T1 (MB/s) | 864 | 846 -2% | 1224 42% | 1219 41% | 1453 68% |
| Read Seq Q32T1 (MB/s) | 1580 | 1783 13% | 2350 49% | 2462 56% | 1713 8% |
| Write 4K Q8T8 (MB/s) | 305.7 | ||||
| Read 4K Q8T8 (MB/s) | 698 | ||||
| Totalt genomsnitt (program/inställningar) | 10% /
13% | 42% /
40% | 31% /
28% | 70% /
74% |
* ... mindre är bättre

Diskstrypning: DiskSpd Read Loop, Queue Depth 8
| 3DMark 11 Performance | 4563 poäng | |
| 3DMark Cloud Gate Standard Score | 15183 poäng | |
| 3DMark Fire Strike Score | 2589 poäng | |
| 3DMark Time Spy Score | 929 poäng | |
Hjälp | ||
| låg | med. | hög | ultra | |
|---|---|---|---|---|
| The Witcher 3 (2015) | 56.4 | 16.6 | 10.6 | |
| Dota 2 Reborn (2015) | 95.1 | 75.6 | 46.3 | 43.3 |
| X-Plane 11.11 (2018) | 39.1 | 30.1 | 26.8 |
| HP Envy x360 13-ay0010nr Vega 6, R5 4500U, Toshiba KBG30ZMV256G | HP Envy x360 13-ar0601ng Vega 10, R7 3700U, SK Hynix BC501 HFM512GDJTNG | Dell XPS 13 7390 2-in-1 Core i7 Iris Plus Graphics G7 (Ice Lake 64 EU), i7-1065G7, Toshiba BG4 KBG40ZPZ512G | HP Spectre x360 13-aw0013dx Iris Plus Graphics G7 (Ice Lake 64 EU), i7-1065G7, Intel Optane Memory H10 with Solid State Storage 32GB + 512GB HBRPEKNX0202A(L/H) | Asus ZenBook S13 UX392FN GeForce MX150, i7-8565U, WDC PC SN520 SDAPNUW-512G | |
|---|---|---|---|---|---|
| Noise | -8% | 4% | 7% | 1% | |
| av / miljö * (dB) | 28 | 30.5 -9% | 28.1 -0% | 28.5 -2% | 28.1 -0% |
| Idle Minimum * (dB) | 28 | 32.2 -15% | 28.1 -0% | 28.5 -2% | 28.1 -0% |
| Idle Average * (dB) | 28 | 32.2 -15% | 28.1 -0% | 28.5 -2% | 28.1 -0% |
| Idle Maximum * (dB) | 28.5 | 32.2 -13% | 28.1 1% | 28.5 -0% | 29 -2% |
| Load Average * (dB) | 41.1 | 40.8 1% | 31.7 23% | 28.5 31% | 41.1 -0% |
| Load Maximum * (dB) | 43.5 | 41.9 4% | 43.4 -0% | 35.3 19% | 41.1 6% |
| Witcher 3 ultra * (dB) | 43.4 | 35.3 | 41.1 |
* ... mindre är bättre
Ljudnivå
| Låg belastning |
| 28 / 28 / 28.5 dB(A) |
| Hög belastning |
| 41.1 / 43.5 dB(A) |
 | ||
30 dB tyst 40 dB(A) hörbar 50 dB(A) högt ljud |
||
min: | ||
(±) Den maximala temperaturen på ovansidan är 44.8 °C / 113 F, jämfört med genomsnittet av 35.4 °C / 96 F , allt från 19.6 till 60 °C för klassen Convertible.
(±) Botten värms upp till maximalt 43.8 °C / 111 F, jämfört med genomsnittet av 36.9 °C / 98 F
(+) Vid tomgångsbruk är medeltemperaturen för ovansidan 25.9 °C / 79 F, jämfört med enhetsgenomsnittet på 30.3 °C / ### class_avg_f### F.
(±) När du spelar The Witcher 3 är medeltemperaturen för ovansidan 33.4 °C / 92 F, jämfört med enhetsgenomsnittet på 30.3 °C / ## #class_avg_f### F.
(+) Handledsstöden och pekplattan är kallare än hudtemperaturen med maximalt 30.2 °C / 86.4 F och är därför svala att ta på.
(-) Medeltemperaturen för handledsstödsområdet på liknande enheter var 28 °C / 82.4 F (-2.2 °C / -4 F).
| Av/Standby | |
| Låg belastning | |
| Hög belastning |
|
Förklaring:
min: | |
| HP Envy x360 13-ay0010nr R5 4500U, Vega 6, Toshiba KBG30ZMV256G, IPS, 1920x1080, 13.3" | HP Envy x360 13-ar0601ng R7 3700U, Vega 10, SK Hynix BC501 HFM512GDJTNG, IPS, 120 Hz, 1920x1080, 13.3" | Dell XPS 13 7390 2-in-1 Core i7 i7-1065G7, Iris Plus Graphics G7 (Ice Lake 64 EU), Toshiba BG4 KBG40ZPZ512G, IPS, 1920x1200, 13.4" | HP Spectre x360 13-aw0013dx i7-1065G7, Iris Plus Graphics G7 (Ice Lake 64 EU), Intel Optane Memory H10 with Solid State Storage 32GB + 512GB HBRPEKNX0202A(L/H), IPS, 1920x1080, 13.3" | Asus ZenBook S13 UX392FN i7-8565U, GeForce MX150, WDC PC SN520 SDAPNUW-512G, IPS, 1920x1080, 13.9" | Apple MacBook Pro 13 2020 2GHz i5 10th-Gen i5-1038NG7, Iris Plus Graphics G7 (Ice Lake 64 EU), Apple SSD SM0512F, IPS, 2560x1600, 13.3" | |
|---|---|---|---|---|---|---|
| Power Consumption | 1% | 5% | -4% | -23% | -34% | |
| Idle Minimum * (Watt) | 3.9 | 3.2 18% | 2.6 33% | 3.9 -0% | 3.4 13% | 3.8 3% |
| Idle Average * (Watt) | 5.8 | 2.8 52% | 5.3 9% | 6.3 -9% | 6.3 -9% | 8.6 -48% |
| Idle Maximum * (Watt) | 6 | 12.4 -107% | 7 -17% | 6.8 -13% | 10.4 -73% | 10.3 -72% |
| Load Average * (Watt) | 41.5 | 24.2 42% | 43.1 -4% | 32.6 21% | 51 -23% | 52.1 -26% |
| Load Maximum * (Watt) | 50.4 | 50 1% | 49 3% | 59 -17% | 62.7 -24% | 65.2 -29% |
| Witcher 3 ultra * (Watt) | 43.1 | 25.6 | 39 | 48.2 |
* ... mindre är bättre
| HP Envy x360 13-ay0010nr R5 4500U, Vega 6, 51 Wh | HP Envy x360 13-ar0601ng R7 3700U, Vega 10, 53 Wh | Dell XPS 13 7390 2-in-1 Core i7 i7-1065G7, Iris Plus Graphics G7 (Ice Lake 64 EU), 51 Wh | HP Spectre x360 13-aw0013dx i7-1065G7, Iris Plus Graphics G7 (Ice Lake 64 EU), 60 Wh | Asus ZenBook S13 UX392FN i7-8565U, GeForce MX150, 50 Wh | Apple MacBook Pro 13 2020 2GHz i5 10th-Gen i5-1038NG7, Iris Plus Graphics G7 (Ice Lake 64 EU), 58 Wh | |
|---|---|---|---|---|---|---|
| Batteridrifttid | -30% | -24% | 14% | -17% | 3% | |
| Reader / Idle (h) | 31.9 | 10.5 -67% | 37.1 16% | 28.5 -11% | ||
| WiFi v1.3 (h) | 11.8 | 7.3 -38% | 9 -24% | 9.9 -16% | 8.4 -29% | 12.1 3% |
| Load (h) | 1.9 | 2.2 16% | 2.7 42% | 1.7 -11% |
För
Emot
Läs den fullständiga versionen av den här recensionen på engelska här.
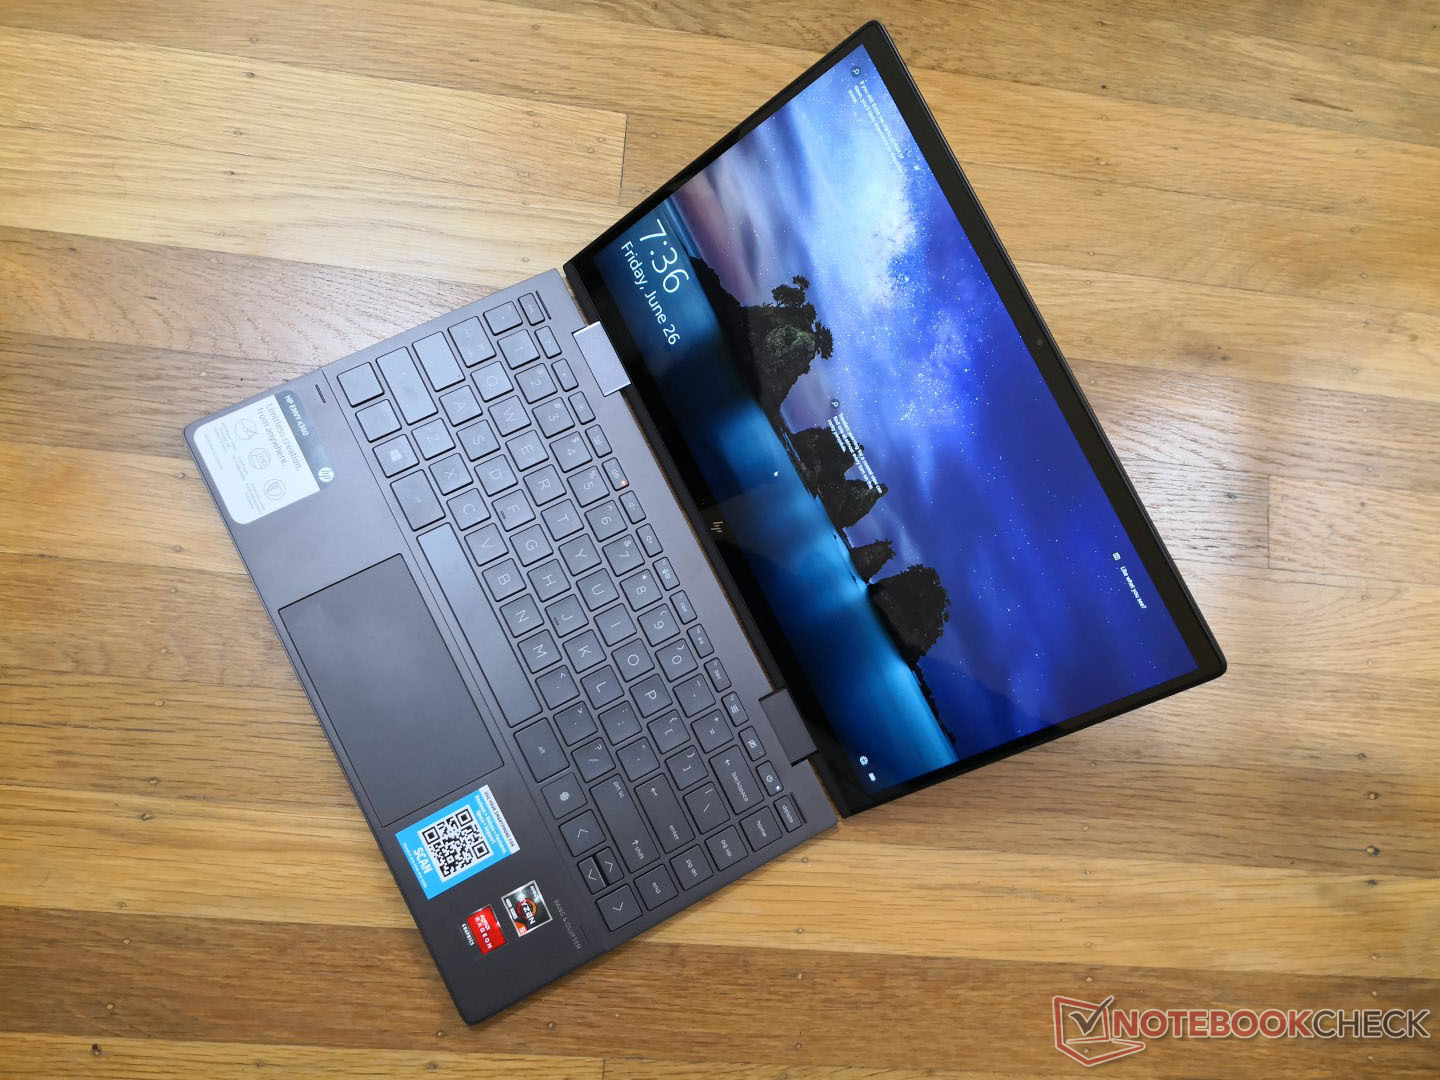
AMD-drivna Envy x360 13 2020 ser både bättre ut och presterar bättre än vad det relativt låga priset kan tänkas antyda. Det är i princip en billigare version av 2019 års Spectre x360 13 som varken offrar chassits kvalitet eller systemets prestanda för att hålla priset lågt. Om du övervägt en äldre omvandlingsbar Envy x360 13 eller Spectre kan det vara värt att ta en titt på den här snabbare, billigare och tunnare Envy 2020-modellen istället.
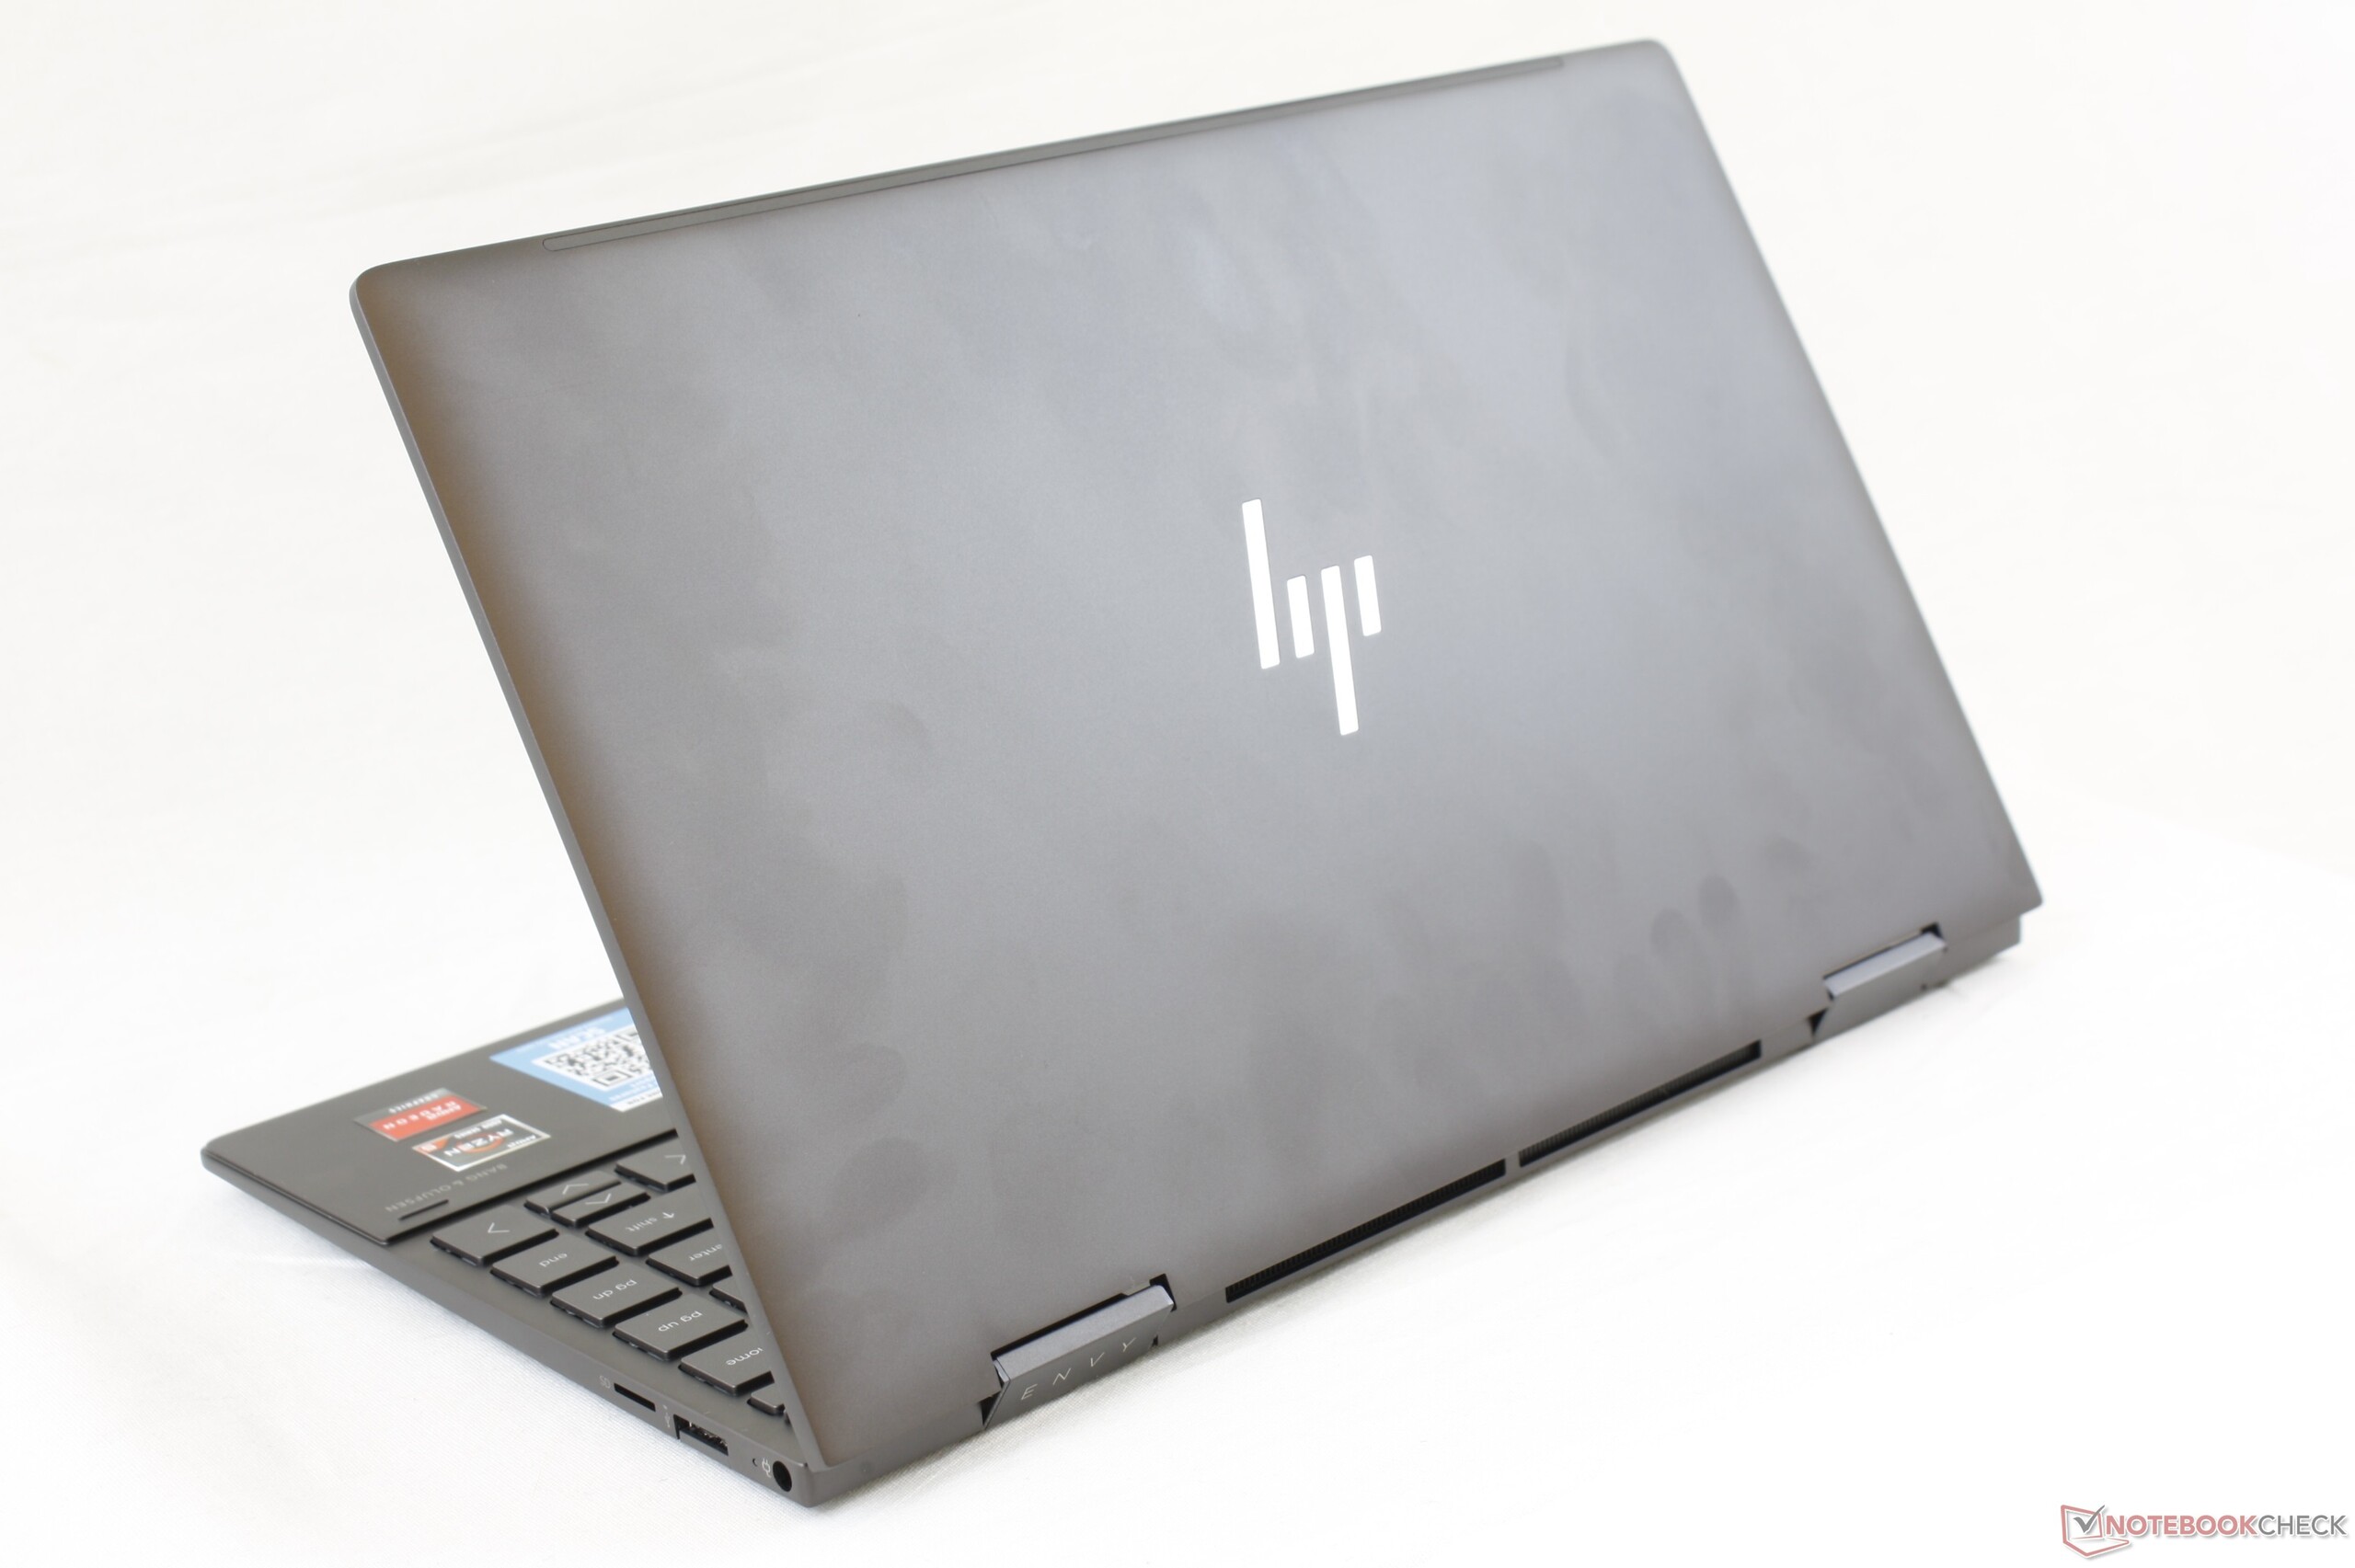
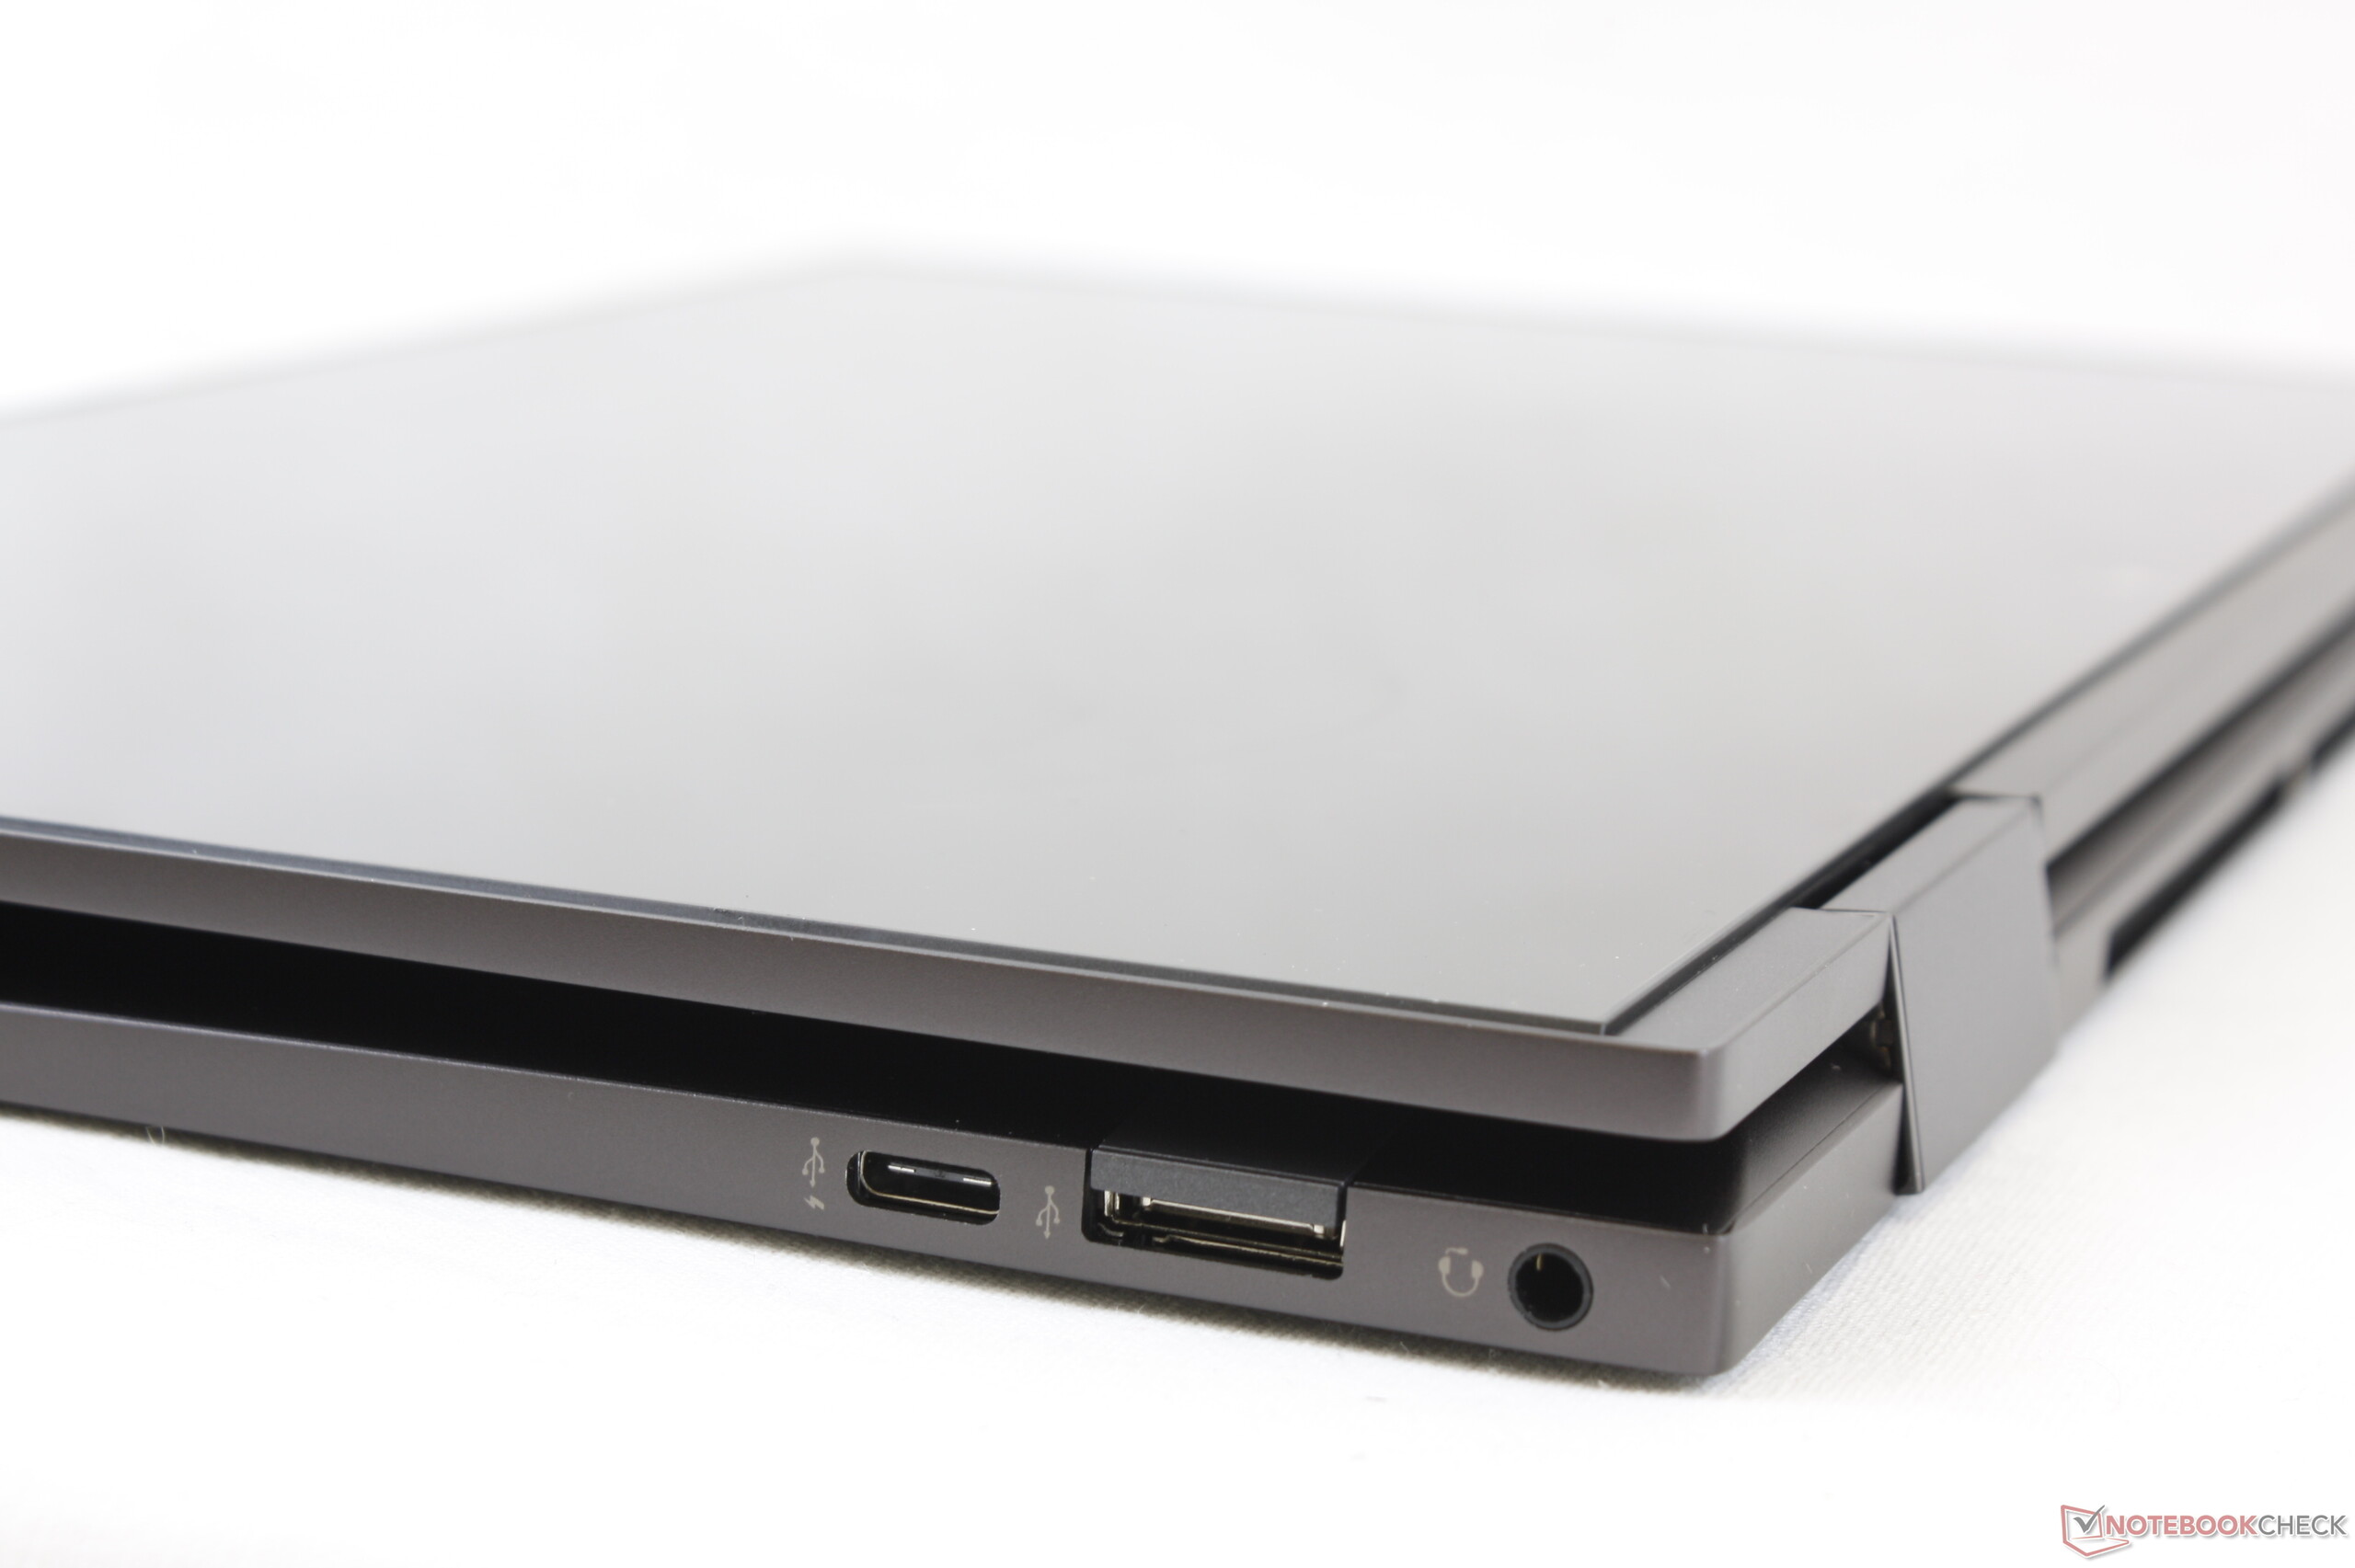
En del hårdvarubegränsningar hindrar Envy x360 13 från att vara den "ultimata" omvandlingsbara datorn på 13.3 tum. Den saknar Thunderbolt 3 och HDMI och datorns RAM går inte att uppgradera, vilket innebär att HP kan ta extra betalt för modellerna med 16 GB DDR4. Vidare tar det tid att vänja sig vid den märkligt placerade fingeravtrycksläsaren och det kändes som att gångjärnen kunde varit fastare. Alternativ som Lenovo Yoga C940 har också inbyggda stylus-hållare, vilket kan vara praktiskt i surfplatte-läge.
När vi recenserade 14-tummaren Yoga C940 förra året kallade vi den för en omvandlingsbar andra skulle vilja slå, men det systemet kostade nästan 15.000 kronor. För under 10.000 kronor går det för tillfället inte att få en omvandlingsbar som balanserar prestanda, vikt, konstruktionskvalitet och pris bättre än 2020 års HP Envy x360 13.
Det är rätt fantastiskt vad ett byte till en AMD-processor kan göra i fråga om pris och prestanda per krona. 2020 års omdesignade Envy x360 13 är märkbart mindre och kompaktare än förra årets modell samtidigt som den är betydligt snabbare.
HP Envy x360 13-ay0010nr
- 06/30/2020 v7 (old)
Allen Ngo
Price comparison
