Test: Dell Latitude 7400 - Inte ens toppskiktet är fritt från svagheter (Sammanfattning)
| SD Card Reader | |
| average JPG Copy Test (av. of 3 runs) | |
| Dell Latitude 7400-8N6DH (Toshiba Exceria Pro M501 64 GB UHS-II) | |
| Dell Latitude 7400 2-in-1 (Toshiba Exceria Pro M501 UHS-II) | |
| Dell Latitude 7490 (Toshiba Exceria Pro M501 UHS-II) | |
| Lenovo ThinkPad T495s-20QKS01E00 (Toshiba Exceria Pro M501 64 GB UHS-II) | |
| Lenovo ThinkPad T490s-20NYS02A00 (Toshiba Exceria Pro M501) | |
| Toshiba Tecra X40-E-10W (Toshiba Exceria Pro M501 microSDXC 64GB) | |
| Genomsnitt av klass Office (22.4 - 198.5, n=22, senaste 2 åren) | |
| maximum AS SSD Seq Read Test (1GB) | |
| Dell Latitude 7400 2-in-1 (Toshiba Exceria Pro M501 UHS-II) | |
| Dell Latitude 7400-8N6DH (Toshiba Exceria Pro M501 64 GB UHS-II) | |
| Dell Latitude 7490 (Toshiba Exceria Pro M501 UHS-II) | |
| Lenovo ThinkPad T495s-20QKS01E00 (Toshiba Exceria Pro M501 64 GB UHS-II) | |
| Lenovo ThinkPad T490s-20NYS02A00 (Toshiba Exceria Pro M501) | |
| Toshiba Tecra X40-E-10W (Toshiba Exceria Pro M501 microSDXC 64GB) | |
| Genomsnitt av klass Office (27.4 - 249, n=20, senaste 2 åren) | |
| |||||||||||||||||||||||||
Distribution av ljusstyrkan: 91 %
Mitt på batteriet: 290 cd/m²
Kontrast: 1806:1 (Svärta: 0.16 cd/m²)
ΔE ColorChecker Calman: 4.7 | ∀{0.5-29.43 Ø4.73}
calibrated: 1.3
ΔE Greyscale Calman: 6.4 | ∀{0.09-98 Ø4.97}
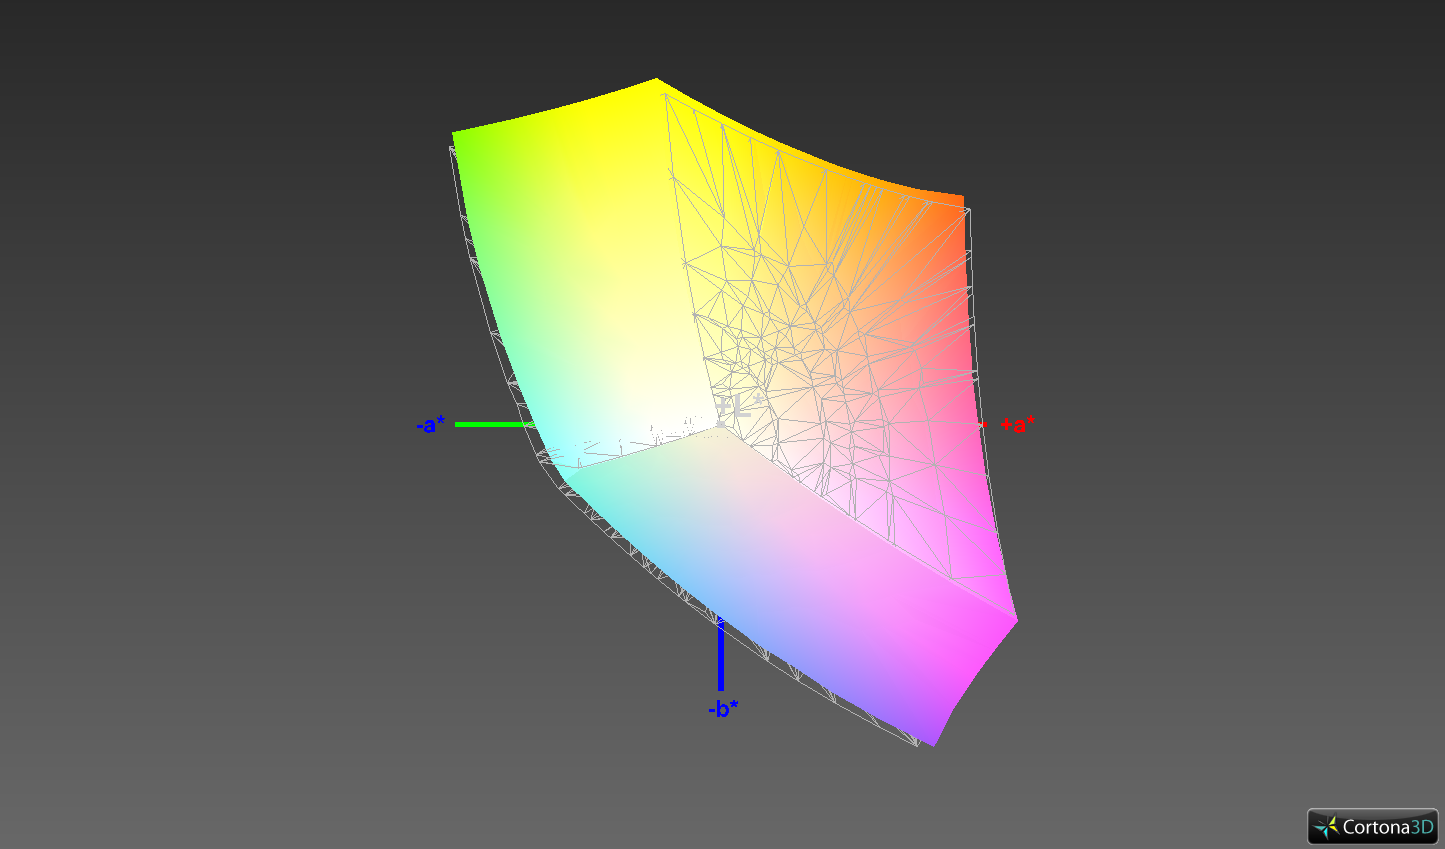
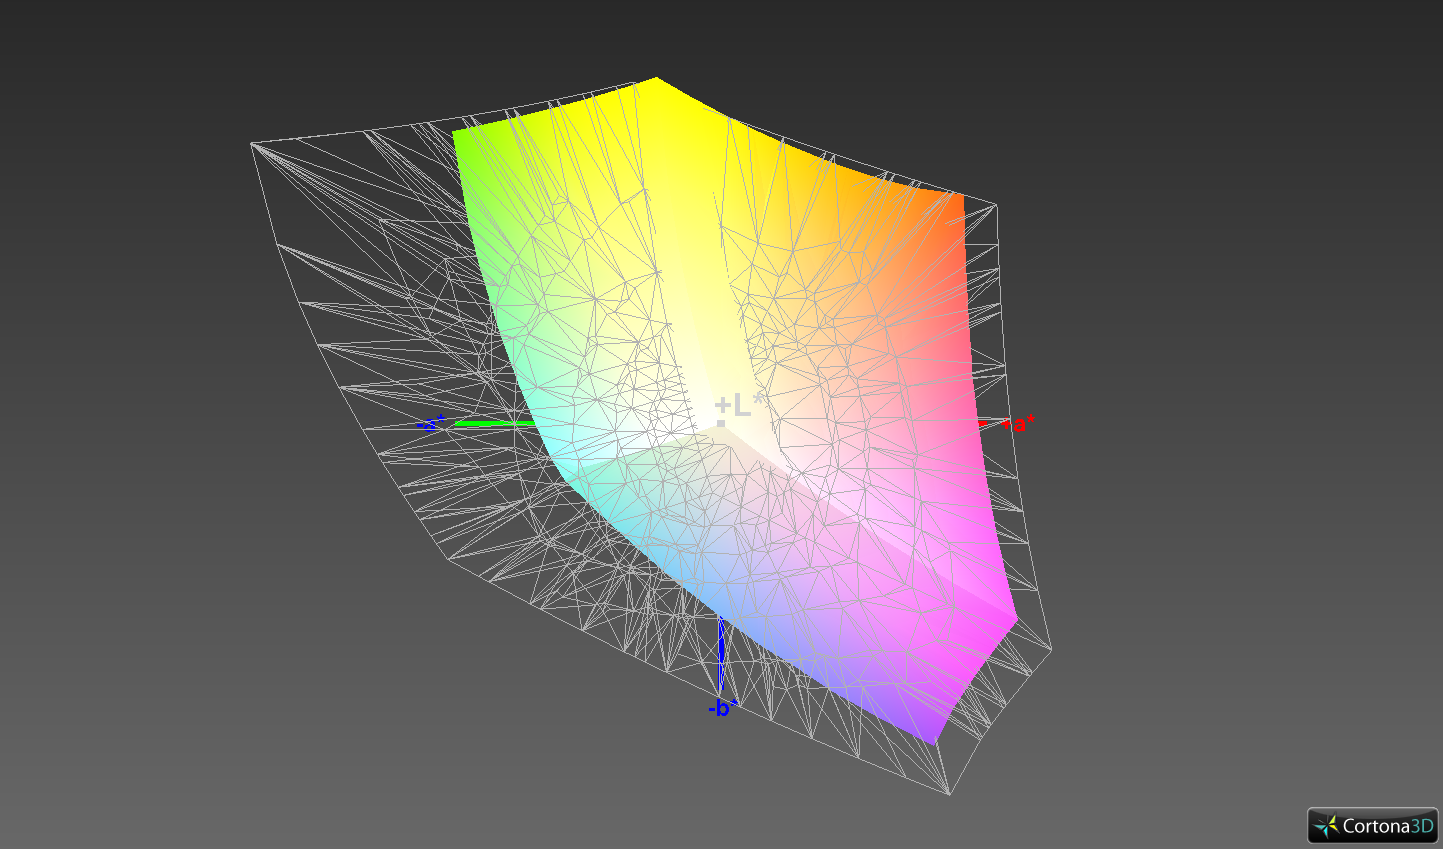
95.1% sRGB (Argyll 1.6.3 3D)
61.2% AdobeRGB 1998 (Argyll 1.6.3 3D)
67.5% AdobeRGB 1998 (Argyll 3D)
95.3% sRGB (Argyll 3D)
66.1% Display P3 (Argyll 3D)
Gamma: 2.54
CCT: 5977 K
| Dell Latitude 7400-8N6DH IPS, 1920x1080, 14" | Dell Latitude 7490 IPS, 1920x1080, 14" | Lenovo ThinkPad X1 Carbon 2019-20QES01L00 IPS, 1920x1080, 14" | HP EliteBook 745 G5 3UN74EA IPS LED, 1920x1080, 14" | HP EliteBook 840 G5-3JX61EA IPS, 1920x1080, 14" | Lenovo ThinkPad T490s-20NYS02A00 IPS, 1920x1080, 14" | Toshiba Tecra X40-E-10W IPS, 1920x1080, 14" | Lenovo ThinkPad X1 Carbon 2019-20QE000VGE IPS, 2560x1440, 14" | |
|---|---|---|---|---|---|---|---|---|
| Display | 1% | -1% | -8% | -8% | 2% | -38% | 7% | |
| Display P3 Coverage (%) | 66.1 | 66.6 1% | 64.5 -2% | 61.3 -7% | 61 -8% | 67.1 2% | 40.55 -39% | 72.5 10% |
| sRGB Coverage (%) | 95.3 | 96.8 2% | 95.8 1% | 87.6 -8% | 87.7 -8% | 97.6 2% | 61 -36% | 97.8 3% |
| AdobeRGB 1998 Coverage (%) | 67.5 | 67.9 1% | 65.7 -3% | 62.3 -8% | 62.1 -8% | 68.5 1% | 41.9 -38% | 73.8 9% |
| Response Times | 24% | 28% | 39% | 39% | -1% | 53% | 41% | |
| Response Time Grey 50% / Grey 80% * (ms) | 62 ? | 41.6 ? 33% | 44.8 ? 28% | 35 ? 44% | 33 ? 47% | 61.6 ? 1% | 22 ? 65% | 33.6 ? 46% |
| Response Time Black / White * (ms) | 37.6 ? | 32 ? 15% | 27.6 ? 27% | 25 ? 34% | 26 ? 31% | 38.8 ? -3% | 22 ? 41% | 24 ? 36% |
| PWM Frequency (Hz) | 3125 ? | 21000 ? | ||||||
| Screen | -14% | 3% | 6% | -7% | 13% | -10% | -17% | |
| Brightness middle (cd/m²) | 289 | 308.6 7% | 381 32% | 421 46% | 655 127% | 391 35% | 266 -8% | 338 17% |
| Brightness (cd/m²) | 286 | 294 3% | 375 31% | 398 39% | 630 120% | 389 36% | 244 -15% | 315 10% |
| Brightness Distribution (%) | 91 | 89 -2% | 94 3% | 86 -5% | 93 2% | 87 -4% | 86 -5% | 88 -3% |
| Black Level * (cd/m²) | 0.16 | 0.23 -44% | 0.24 -50% | 0.27 -69% | 0.56 -250% | 0.23 -44% | 0.2 -25% | 0.43 -169% |
| Contrast (:1) | 1806 | 1342 -26% | 1588 -12% | 1559 -14% | 1170 -35% | 1700 -6% | 1330 -26% | 786 -56% |
| Colorchecker dE 2000 * | 4.7 | 6.07 -29% | 4.6 2% | 4.08 13% | 3.27 30% | 3.4 28% | 4.61 2% | 4 15% |
| Colorchecker dE 2000 max. * | 8.7 | 10.58 -22% | 8.5 2% | 7.48 14% | 5.92 32% | 4.7 46% | 7.46 14% | 7.9 9% |
| Colorchecker dE 2000 calibrated * | 1.3 | 1.67 -28% | 1.2 8% | 3.22 -148% | 1.1 15% | 1.7 -31% | ||
| Greyscale dE 2000 * | 6.4 | 7.3 -14% | 5.1 20% | 2.92 54% | 2.85 55% | 4 37% | 4.31 33% | 6.2 3% |
| Gamma | 2.54 87% | 2.061 107% | 2.52 87% | 2.32 95% | 2.45 90% | 2.49 88% | 2.54 87% | 2.13 103% |
| CCT | 5977 109% | 7269 89% | 7052 92% | 7043 92% | 6065 107% | 6809 95% | 6848 95% | 6787 96% |
| Color Space (Percent of AdobeRGB 1998) (%) | 61.2 | 62 1% | 60.7 -1% | 57 -7% | 57 -7% | 62.4 2% | 39 -36% | 68.1 11% |
| Color Space (Percent of sRGB) (%) | 95.1 | 97 2% | 95.7 1% | 87 -9% | 88 -7% | 97.4 2% | 61 -36% | 97.8 3% |
| Totalt genomsnitt (program/inställningar) | 4% /
-6% | 10% /
5% | 12% /
8% | 8% /
-2% | 5% /
9% | 2% /
-7% | 10% /
-5% |
* ... mindre är bättre
Visa svarstider
| ↔ Svarstid svart till vitt | ||
|---|---|---|
| 37.6 ms ... stiga ↗ och falla ↘ kombinerat | ↗ 21.2 ms stiga | 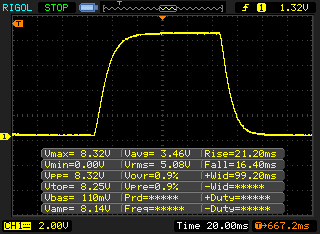 |
| ↘ 16.4 ms hösten | ||
| Skärmen visar långsamma svarsfrekvenser i våra tester och kommer att vara otillfredsställande för spelare. I jämförelse sträcker sig alla testade enheter från 0.1 (minst) till 240 (maximalt) ms. » 95 % av alla enheter är bättre. Detta innebär att den uppmätta svarstiden är sämre än genomsnittet av alla testade enheter (19.9 ms). | ||
| ↔ Svarstid 50 % grått till 80 % grått | ||
| 62 ms ... stiga ↗ och falla ↘ kombinerat | ↗ 29.6 ms stiga | 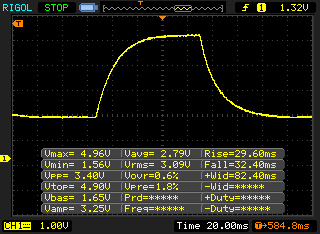 |
| ↘ 32.4 ms hösten | ||
| Skärmen visar långsamma svarsfrekvenser i våra tester och kommer att vara otillfredsställande för spelare. I jämförelse sträcker sig alla testade enheter från 0.165 (minst) till 636 (maximalt) ms. » 97 % av alla enheter är bättre. Detta innebär att den uppmätta svarstiden är sämre än genomsnittet av alla testade enheter (31.1 ms). | ||
Skärmflimmer / PWM (Puls-Width Modulation)
| Skärmflimmer / PWM upptäcktes inte | 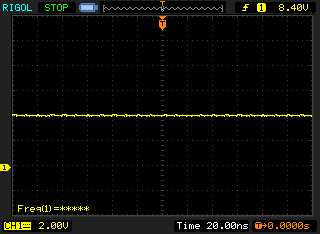 | ||
Som jämförelse: 52 % av alla testade enheter använder inte PWM för att dämpa skärmen. Om PWM upptäcktes mättes ett medelvärde av 7798 (minst: 5 - maximum: 343500) Hz. | |||
| Geekbench 3 | |
| 32 Bit Multi-Core Score | |
| Dell Latitude 7400-8N6DH | |
| Genomsnitt Intel Core i7-8665U (n=1) | |
| HP EliteBook 840 G5-3JX61EA | |
| Toshiba Tecra X40-E-10W | |
| 32 Bit Single-Core Score | |
| HP EliteBook 840 G5-3JX61EA | |
| Dell Latitude 7400-8N6DH | |
| Genomsnitt Intel Core i7-8665U (n=1) | |
| Toshiba Tecra X40-E-10W | |
| Mozilla Kraken 1.1 - Total | |
| HP EliteBook 745 G5 3UN74EA (Edge) | |
| Lenovo ThinkPad T495s-20QKS01E00 (Edge 44.18362.1.0) | |
| Dell Latitude 7490 (Microsoft Edge 42.17134.1.0) | |
| Lenovo ThinkPad T490s-20NYS02A00 (Edge 44) | |
| Dell Latitude 7400 2-in-1 (Microsoft Edge 44.18362.1.0) | |
| Lenovo ThinkPad X1 Carbon 2019-20QE000VGE (Edge 44.18362.1.0) | |
| Genomsnitt Intel Core i7-8665U (1016 - 1136, n=4) | |
| Dell Latitude 7400-8N6DH (Edge 44) | |
| Genomsnitt av klass Office (391 - 1297, n=76, senaste 2 åren) | |
| Octane V2 - Total Score | |
| Genomsnitt av klass Office (49011 - 122119, n=19, senaste 2 åren) | |
| Dell Latitude 7400-8N6DH (Edge 44) | |
| Genomsnitt Intel Core i7-8665U (30142 - 36667, n=4) | |
| Lenovo ThinkPad X1 Carbon 2019-20QE000VGE (Edge 44.18362.1.0) | |
| Lenovo ThinkPad T490s-20NYS02A00 (Edge 44) | |
| Dell Latitude 7400 2-in-1 (Microsoft Edge 44.18362.1.0) | |
| Dell Latitude 7490 (Microsoft Edge 42.17134.1.0) | |
| Lenovo ThinkPad T495s-20QKS01E00 (Edge 44.18362.1.0) | |
| HP EliteBook 745 G5 3UN74EA (Edge) | |
| JetStream 1.1 - 1.1 Total | |
| Lenovo ThinkPad X1 Carbon 2019-20QE000VGE (Edge 44.18362.1.0) | |
| Genomsnitt Intel Core i7-8665U (242 - 290, n=4) | |
| HP EliteBook 840 G5-3JX61EA (Edge 42) | |
| Dell Latitude 7400-8N6DH (Edge 44) | |
| Toshiba Tecra X40-E-10W (Edge 42) | |
| Dell Latitude 7490 (Microsoft Edge 42.17134.1.0) | |
| Lenovo ThinkPad T495s-20QKS01E00 (Edge 44.18362.1.0) | |
| HP EliteBook 745 G5 3UN74EA (Edge) | |
* ... mindre är bättre
| PCMark 8 Home Score Accelerated v2 | 3547 poäng | |
| PCMark 8 Creative Score Accelerated v2 | 3715 poäng | |
| PCMark 8 Work Score Accelerated v2 | 5195 poäng | |
| PCMark 10 Score | 4094 poäng | |
Hjälp | ||

| Dell Latitude 7400-8N6DH Samsung SSD PM981 MZVLB512HAJQ | Lenovo ThinkPad X1 Carbon 2019-20QE000VGE WDC PC SN720 SDAQNTW-512G | HP EliteBook 745 G5 3UN74EA Toshiba XG5 KXG50ZNV256G | HP EliteBook 840 G5-3JX61EA Toshiba KXG50ZNV1T02 | Toshiba Tecra X40-E-10W Samsung PM961 MZVLW256HEHP | Dell Latitude 7490 Toshiba KSG60ZMV256G | Lenovo ThinkPad T490s-20NYS02A00 Intel SSD Pro 7600p SSDPEKKF512G8L | Genomsnitt Samsung SSD PM981 MZVLB512HAJQ | |
|---|---|---|---|---|---|---|---|---|
| CrystalDiskMark 5.2 / 6 | 26% | -32% | -20% | -23% | -60% | -9% | 2% | |
| Write 4K (MB/s) | 118.6 | 196.9 66% | 119.5 1% | 96.1 -19% | 100.1 -16% | 79.4 -33% | 122 3% | 126.7 ? 7% |
| Read 4K (MB/s) | 44.68 | 51.3 15% | 31.9 -29% | 31.12 -30% | 40.03 -10% | 27.37 -39% | 45.56 2% | 44 ? -2% |
| Write Seq (MB/s) | 1866 | 1715 -8% | 351.1 -81% | 919 -51% | 1259 -33% | 343.9 -82% | 1497 -20% | 1617 ? -13% |
| Read Seq (MB/s) | 2173 | 2464 13% | 1665 -23% | 2089 -4% | 1296 -40% | 472.7 -78% | 2385 10% | 1716 ? -21% |
| Write 4K Q32T1 (MB/s) | 330.9 | 429.1 30% | 268.4 -19% | 425.6 29% | 228.1 -31% | 206 -38% | 240.9 -27% | 413 ? 25% |
| Read 4K Q32T1 (MB/s) | 343.1 | 542 58% | 333.1 -3% | 275.3 -20% | 292.9 -15% | 188.3 -45% | 338 -1% | 420 ? 22% |
| Write Seq Q32T1 (MB/s) | 1927 | 2521 31% | 351.8 -82% | 958 -50% | 1286 -33% | 343.3 -82% | 1528 -21% | 2076 ? 8% |
| Read Seq Q32T1 (MB/s) | 3528 | 3481 -1% | 2705 -23% | 3118 -12% | 3411 -3% | 533 -85% | 2915 -17% | 3130 ? -11% |
| 3DMark 06 Standard Score | 11053 poäng | |
| 3DMark 11 Performance | 1979 poäng | |
| 3DMark Ice Storm Standard Score | 61551 poäng | |
| 3DMark Cloud Gate Standard Score | 8736 poäng | |
| 3DMark Fire Strike Score | 1075 poäng | |
| 3DMark Time Spy Score | 448 poäng | |
Hjälp | ||
| låg | med. | hög | ultra | |
|---|---|---|---|---|
| Tomb Raider (2013) | 87.8 | 44.3 | 27 | 12.5 |
| BioShock Infinite (2013) | 60.9 | 34.3 | 26.7 | 8.5 |
| The Witcher 3 (2015) | 15.8 | 9.3 | 5.4 | 3 |
| Dota 2 Reborn (2015) | 73 | 42.9 | 19.5 | 17.3 |
| X-Plane 11.11 (2018) | 23.1 | 15 | 13.4 |
| BioShock Infinite - 1280x720 Very Low Preset | |
| Lenovo ThinkPad T495s-20QKS01E00 | |
| HP EliteBook 745 G5 3UN74EA | |
| Dell Latitude 7400-8N6DH (Dual-Channel) | |
| HP EliteBook 840 G5-3JX61EA | |
| Dell Latitude 7400-8N6DH | |
| Genomsnitt Intel UHD Graphics 620 (18.3 - 90.2, n=187) | |
| Lenovo ThinkPad T490s-20NYS02A00 | |
| Lenovo ThinkPad X1 Carbon 2019-20QE000VGE | |
| Dell Latitude 7400 2-in-1 | |
| Dell Latitude 7490 | |
| Toshiba Tecra X40-E-10W | |
| Tomb Raider - 1024x768 Low Preset | |
| Dell Latitude 7400-8N6DH | |
| Genomsnitt Intel UHD Graphics 620 (24.3 - 114.4, n=18) | |
Ljudnivå
| Låg belastning |
| 28.6 / 28.6 / 29.1 dB(A) |
| Hög belastning |
| 31.5 / 36.9 dB(A) |
 | ||
30 dB tyst 40 dB(A) hörbar 50 dB(A) högt ljud |
||
min: | ||
| Dell Latitude 7400-8N6DH i7-8665U, UHD Graphics 620 | Dell Latitude 7490 i5-8350U, UHD Graphics 620 | Lenovo ThinkPad X1 Carbon 2019-20QE000VGE i7-8665U, UHD Graphics 620 | HP EliteBook 745 G5 3UN74EA R7 2700U, Vega 10 | HP EliteBook 840 G5-3JX61EA i5-8550U, UHD Graphics 620 | Toshiba Tecra X40-E-10W i5-8250U, UHD Graphics 620 | Lenovo ThinkPad T490s-20NYS02A00 i5-8265U, UHD Graphics 620 | |
|---|---|---|---|---|---|---|---|
| Noise | 0% | 3% | -6% | -4% | -13% | -2% | |
| av / miljö * (dB) | 28.6 | 28.2 1% | 28.4 1% | 30.5 -7% | 30.3 -6% | 30.5 -7% | 29.4 -3% |
| Idle Minimum * (dB) | 28.6 | 28.2 1% | 28.4 1% | 30.5 -7% | 30.3 -6% | 30.5 -7% | 29.4 -3% |
| Idle Average * (dB) | 28.6 | 28.2 1% | 28.4 1% | 30.5 -7% | 30.3 -6% | 30.5 -7% | 29.4 -3% |
| Idle Maximum * (dB) | 29.1 | 28.7 1% | 28.6 2% | 30.5 -5% | 30.3 -4% | 31.2 -7% | 30.9 -6% |
| Load Average * (dB) | 31.5 | 29.9 5% | 31.5 -0% | 36 -14% | 33.8 -7% | 43.9 -39% | 33.3 -6% |
| Load Maximum * (dB) | 36.9 | 40.2 -9% | 33.1 10% | 36 2% | 33.8 8% | 40.1 -9% | 33.3 10% |
* ... mindre är bättre
(±) Den maximala temperaturen på ovansidan är 42.4 °C / 108 F, jämfört med genomsnittet av 34.3 °C / 94 F , allt från 21.2 till 62.5 °C för klassen Office.
(-) Botten värms upp till maximalt 47.1 °C / 117 F, jämfört med genomsnittet av 36.8 °C / 98 F
(+) Vid tomgångsbruk är medeltemperaturen för ovansidan 23.9 °C / 75 F, jämfört med enhetsgenomsnittet på 29.5 °C / ### class_avg_f### F.
(+) Handledsstöden och pekplattan är kallare än hudtemperaturen med maximalt 30.7 °C / 87.3 F och är därför svala att ta på.
(-) Medeltemperaturen för handledsstödsområdet på liknande enheter var 27.5 °C / 81.5 F (-3.2 °C / -5.8 F).
| Dell Latitude 7400-8N6DH i7-8665U, UHD Graphics 620 | Dell Latitude 7490 i5-8350U, UHD Graphics 620 | Lenovo ThinkPad X1 Carbon 2019-20QE000VGE i7-8665U, UHD Graphics 620 | HP EliteBook 745 G5 3UN74EA R7 2700U, Vega 10 | HP EliteBook 840 G5-3JX61EA i5-8550U, UHD Graphics 620 | Toshiba Tecra X40-E-10W i5-8250U, UHD Graphics 620 | Lenovo ThinkPad T490s-20NYS02A00 i5-8265U, UHD Graphics 620 | |
|---|---|---|---|---|---|---|---|
| Heat | -23% | -2% | -2% | 18% | -6% | 0% | |
| Maximum Upper Side * (°C) | 42.4 | 45.2 -7% | 47.9 -13% | 38.4 9% | 33.4 21% | 44 -4% | 43.3 -2% |
| Maximum Bottom * (°C) | 47.1 | 51.6 -10% | 45.9 3% | 35.8 24% | 32.7 31% | 47.2 -0% | 45.1 4% |
| Idle Upper Side * (°C) | 24.5 | 31.8 -30% | 24.6 -0% | 29.8 -22% | 22.2 9% | 27.3 -11% | 25 -2% |
| Idle Bottom * (°C) | 25.2 | 36 -43% | 24.4 3% | 29.7 -18% | 22.3 12% | 27.8 -10% | 25 1% |
* ... mindre är bättre
Dell Latitude 7400-8N6DH ljudanalys
(±) | högtalarljudstyrkan är genomsnittlig men bra (78.3 dB)
Bas 100 - 315 Hz
(-) | nästan ingen bas - i genomsnitt 16.5% lägre än medianen
(±) | linjäriteten för basen är genomsnittlig (8% delta till föregående frekvens)
Mellan 400 - 2000 Hz
(+) | balanserad mellan - endast 2.5% från medianen
(±) | linjäriteten för mids är genomsnittlig (7% delta till föregående frekvens)
Högsta 2 - 16 kHz
(±) | högre toppar - i genomsnitt 5.2% högre än medianen
(±) | linjäriteten för toppar är genomsnittlig (7.2% delta till föregående frekvens)
Totalt 100 - 16 000 Hz
(±) | linjäriteten för det totala ljudet är genomsnittlig (17.7% skillnad mot median)
Jämfört med samma klass
» 28% av alla testade enheter i den här klassen var bättre, 6% liknande, 66% sämre
» Den bästa hade ett delta på 7%, genomsnittet var 21%, sämst var 53%
Jämfört med alla testade enheter
» 35% av alla testade enheter var bättre, 8% liknande, 57% sämre
» Den bästa hade ett delta på 4%, genomsnittet var 24%, sämst var 134%
Lenovo ThinkPad X1 Carbon 2019-20QE000VGE ljudanalys
(±) | högtalarljudstyrkan är genomsnittlig men bra (76.8 dB)
Bas 100 - 315 Hz
(±) | reducerad bas - i genomsnitt 11.2% lägre än medianen
(±) | linjäriteten för basen är genomsnittlig (7.1% delta till föregående frekvens)
Mellan 400 - 2000 Hz
(±) | högre mellan - i genomsnitt 5.1% högre än median
(+) | mids är linjära (5.4% delta till föregående frekvens)
Högsta 2 - 16 kHz
(+) | balanserade toppar - endast 2.9% från medianen
(±) | linjäriteten för toppar är genomsnittlig (9.1% delta till föregående frekvens)
Totalt 100 - 16 000 Hz
(±) | linjäriteten för det totala ljudet är genomsnittlig (16.7% skillnad mot median)
Jämfört med samma klass
» 21% av alla testade enheter i den här klassen var bättre, 8% liknande, 71% sämre
» Den bästa hade ett delta på 7%, genomsnittet var 21%, sämst var 53%
Jämfört med alla testade enheter
» 29% av alla testade enheter var bättre, 7% liknande, 64% sämre
» Den bästa hade ett delta på 4%, genomsnittet var 24%, sämst var 134%
| Av/Standby | |
| Låg belastning | |
| Hög belastning |
|
Förklaring:
min: | |
| Dell Latitude 7400-8N6DH i7-8665U, UHD Graphics 620 | Dell Latitude 7490 i5-8350U, UHD Graphics 620 | Lenovo ThinkPad X1 Carbon 2019-20QE000VGE i7-8665U, UHD Graphics 620 | HP EliteBook 745 G5 3UN74EA R7 2700U, Vega 10 | HP EliteBook 840 G5-3JX61EA i5-8550U, UHD Graphics 620 | Toshiba Tecra X40-E-10W i5-8250U, UHD Graphics 620 | Lenovo ThinkPad T490s-20NYS02A00 i5-8265U, UHD Graphics 620 | |
|---|---|---|---|---|---|---|---|
| Power Consumption | 30% | 3% | -6% | -1% | 4% | 10% | |
| Idle Minimum * (Watt) | 3.9 | 2 49% | 3 23% | 4.9 -26% | 3.8 3% | 4.5 -15% | 2.62 33% |
| Idle Average * (Watt) | 6.1 | 4.7 23% | 6.3 -3% | 8.1 -33% | 8.3 -36% | 8.2 -34% | 5.16 15% |
| Idle Maximum * (Watt) | 8.2 | 5.7 30% | 8.9 -9% | 10.6 -29% | 10.7 -30% | 9.3 -13% | 8.7 -6% |
| Load Average * (Watt) | 41 | 38.4 6% | 40.8 -0% | 32.2 21% | 35.5 13% | 30.4 26% | 40 2% |
| Load Maximum * (Watt) | 69.7 | 38.9 44% | 67.5 3% | 42.3 39% | 37 47% | 30.4 56% | 64 8% |
* ... mindre är bättre
| Dell Latitude 7400-8N6DH i7-8665U, UHD Graphics 620, 60 Wh | Lenovo ThinkPad X1 Carbon 2019-20QE000VGE i7-8665U, UHD Graphics 620, 51 Wh | HP EliteBook 745 G5 3UN74EA R7 2700U, Vega 10, 50 Wh | HP EliteBook 840 G5-3JX61EA i5-8550U, UHD Graphics 620, 50 Wh | Toshiba Tecra X40-E-10W i5-8250U, UHD Graphics 620, 48 Wh | Dell Latitude 7490 i5-8350U, UHD Graphics 620, 60 Wh | Dell Latitude 7400 2-in-1 i7-8665U, UHD Graphics 620, 78 Wh | Lenovo ThinkPad X1 Carbon 2019-20QES01L00 i7-8565U, UHD Graphics 620, 51 Wh | Lenovo ThinkPad T490s-20NYS02A00 i5-8265U, UHD Graphics 620, 57 Wh | Lenovo ThinkPad T495s-20QKS01E00 R7 PRO 3700U, Vega 10, 57 Wh | Genomsnitt av klass Office | |
|---|---|---|---|---|---|---|---|---|---|---|---|
| Batteridrifttid | -34% | -42% | -36% | -28% | -22% | 5% | -28% | -15% | -8% | -3% | |
| H.264 (h) | 14.4 | 9.8 -32% | 7.1 -51% | 11.5 -20% | 13.9 -3% | 12.5 -13% | 15 ? 4% | ||||
| WiFi v1.3 (h) | 11.6 | 8.2 -29% | 6.6 -43% | 7.4 -36% | 8.3 -28% | 9.1 -22% | 12.2 5% | 9.4 -19% | 10.1 -13% | 11.3 -3% | 12.9 ? 11% |
| Load (h) | 2.4 | 1.4 -42% | 1.6 -33% | 1.3 -46% | 1.7 -29% | 1.807 ? -25% | |||||
| Reader / Idle (h) | 10.7 | 23.7 ? |
För
Emot
Läs den fullständiga versionen av den här recensionen på engelska här.
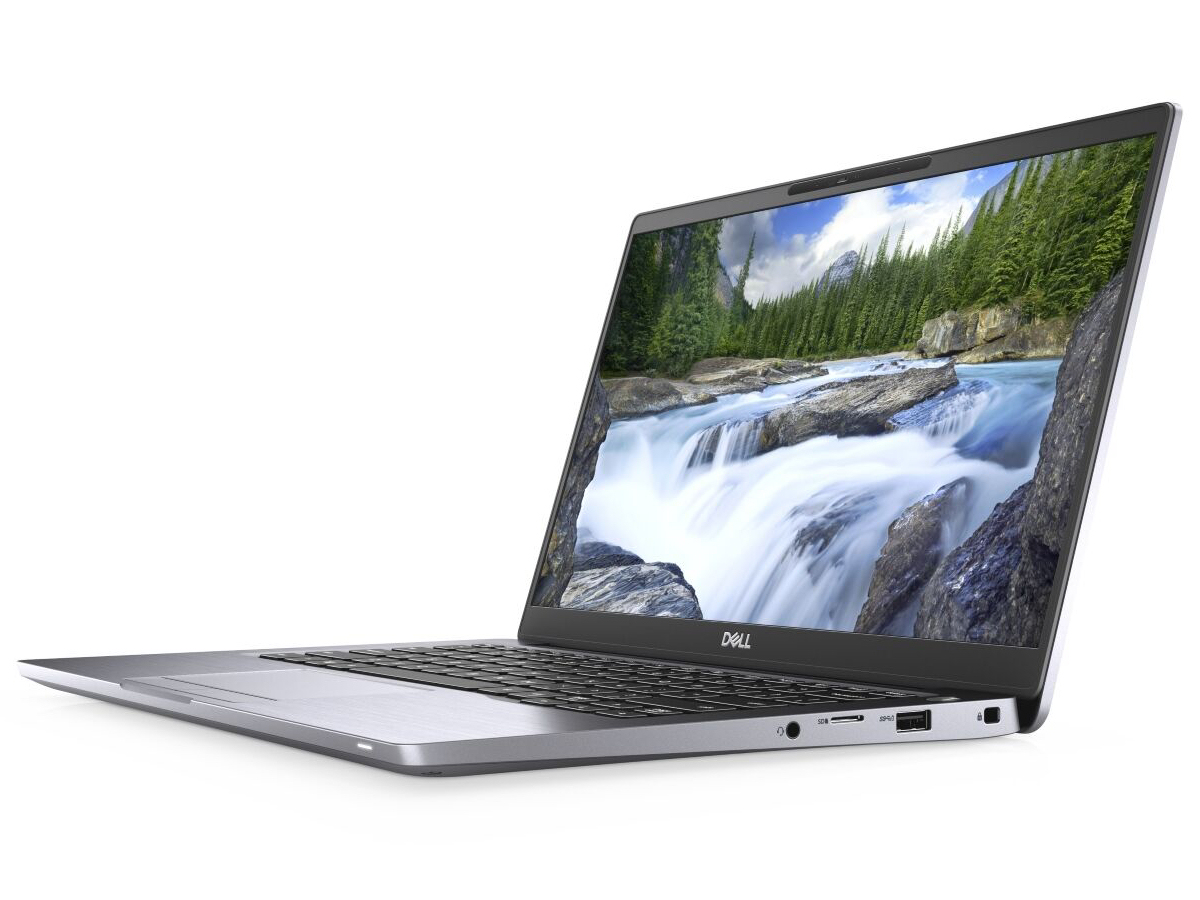
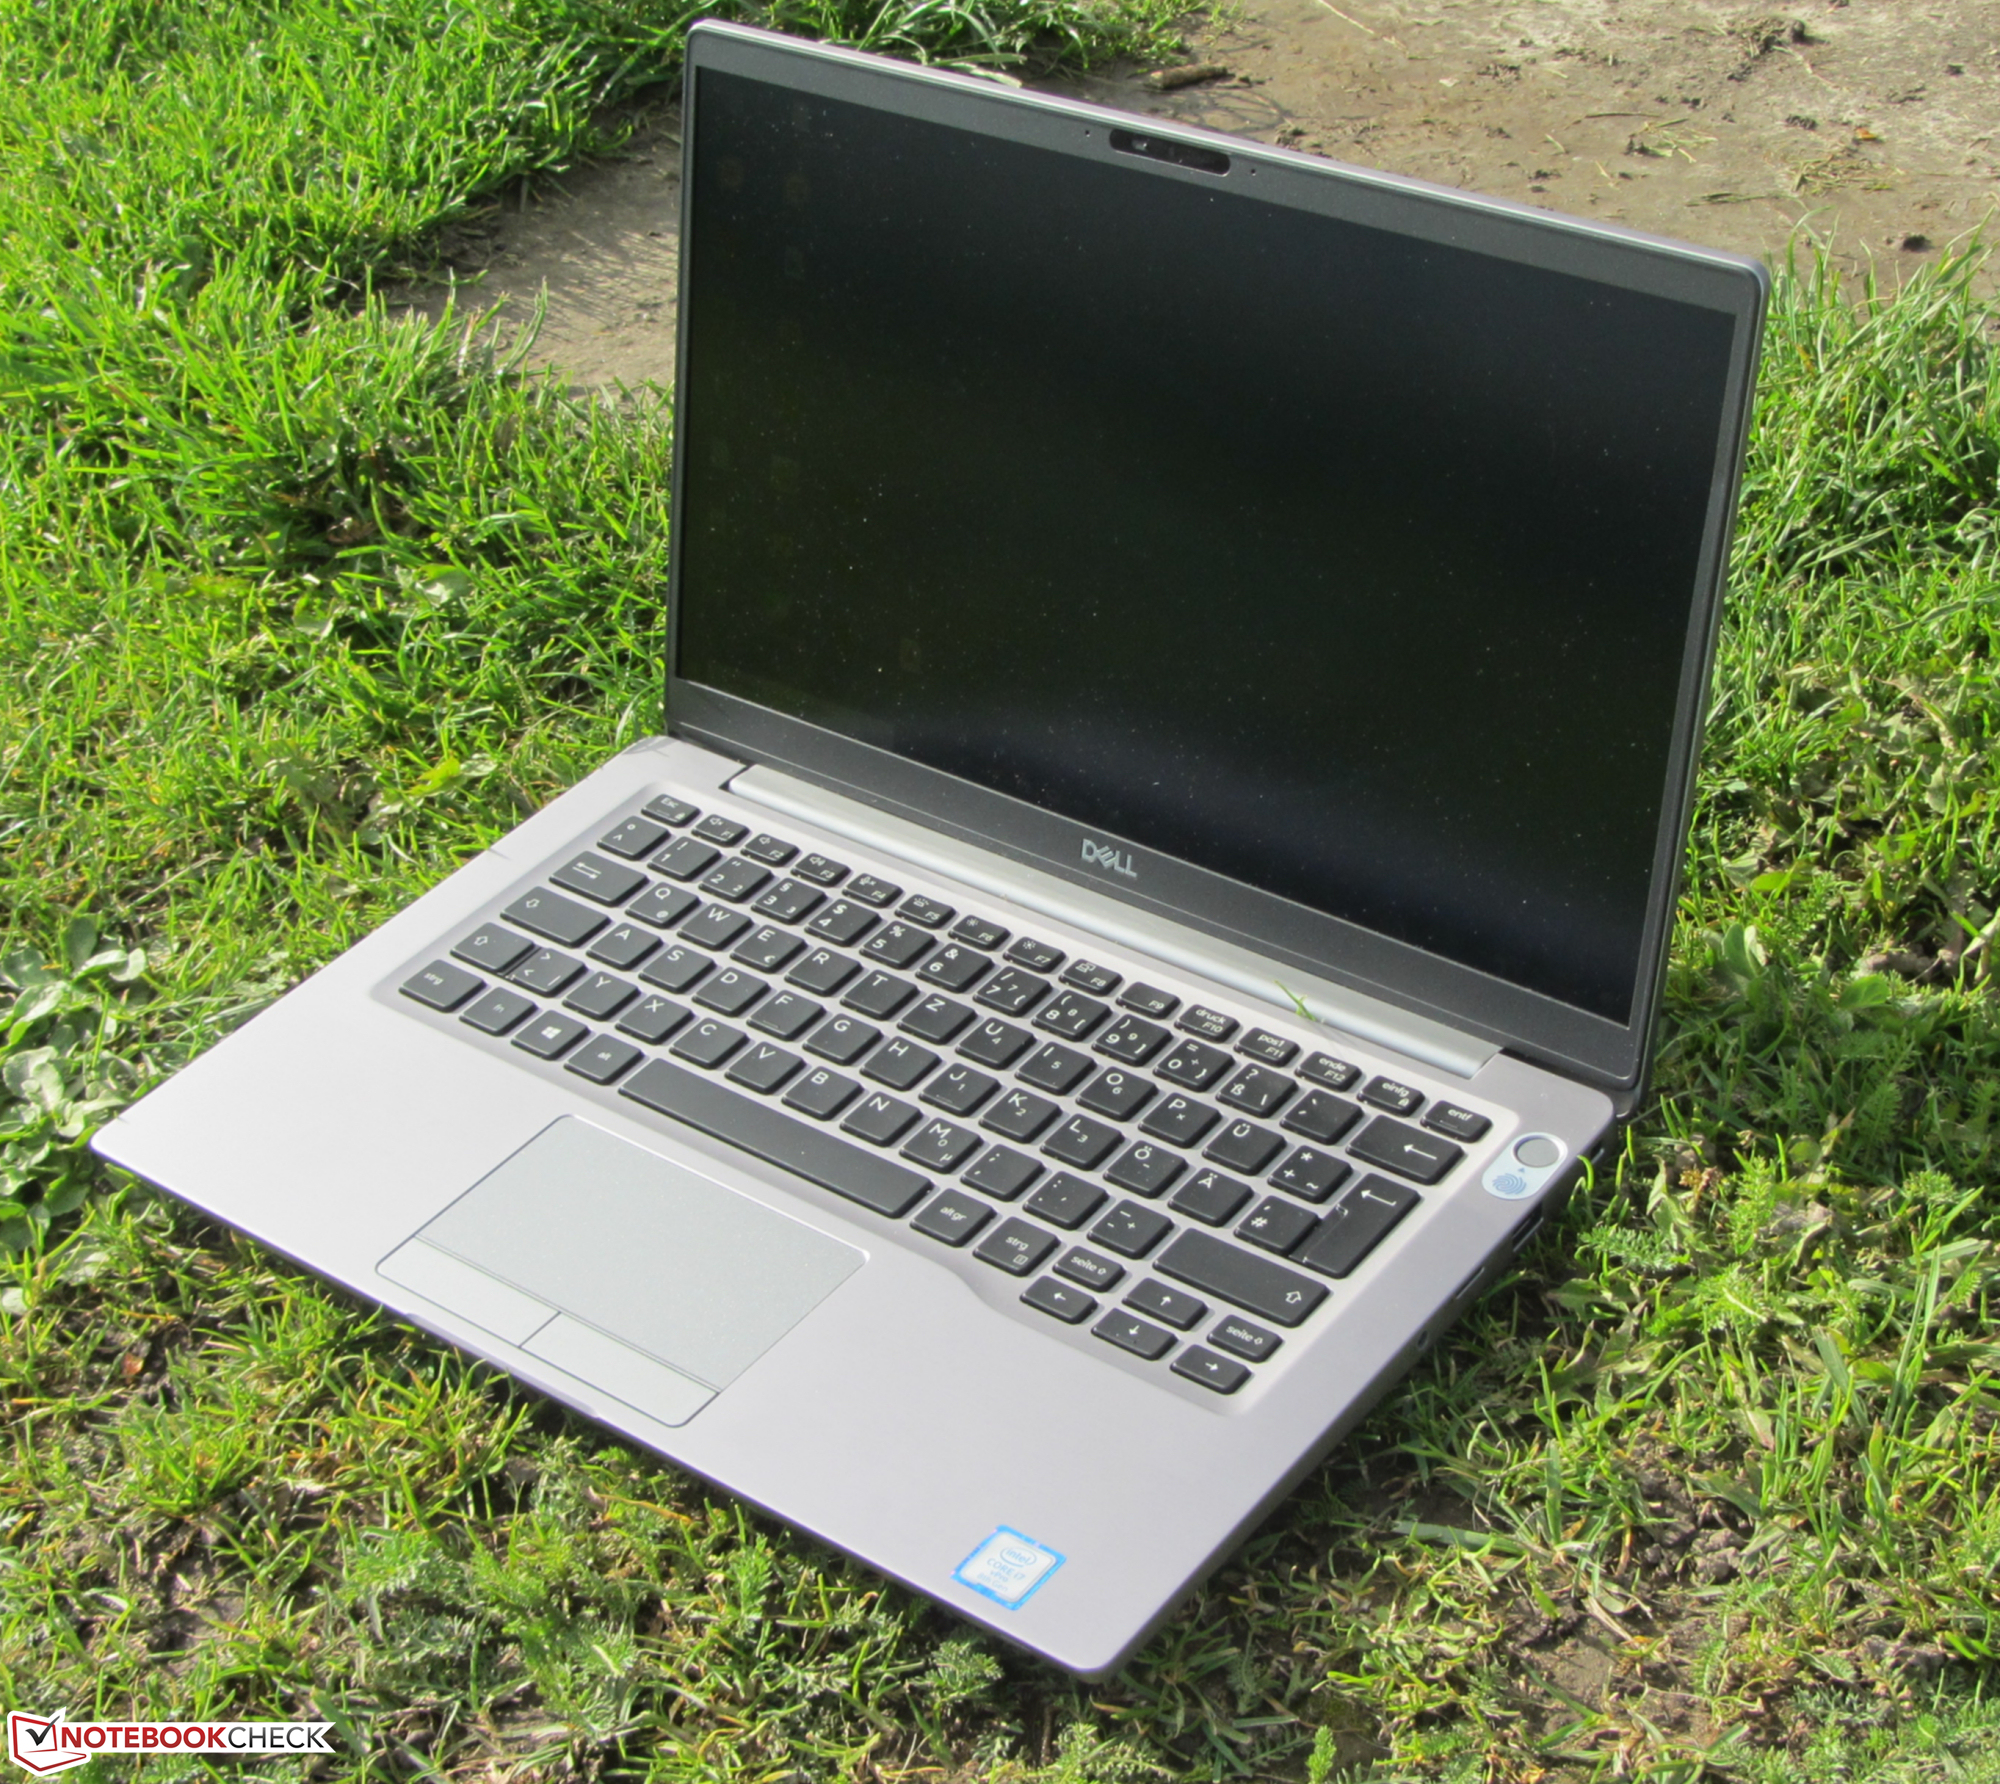
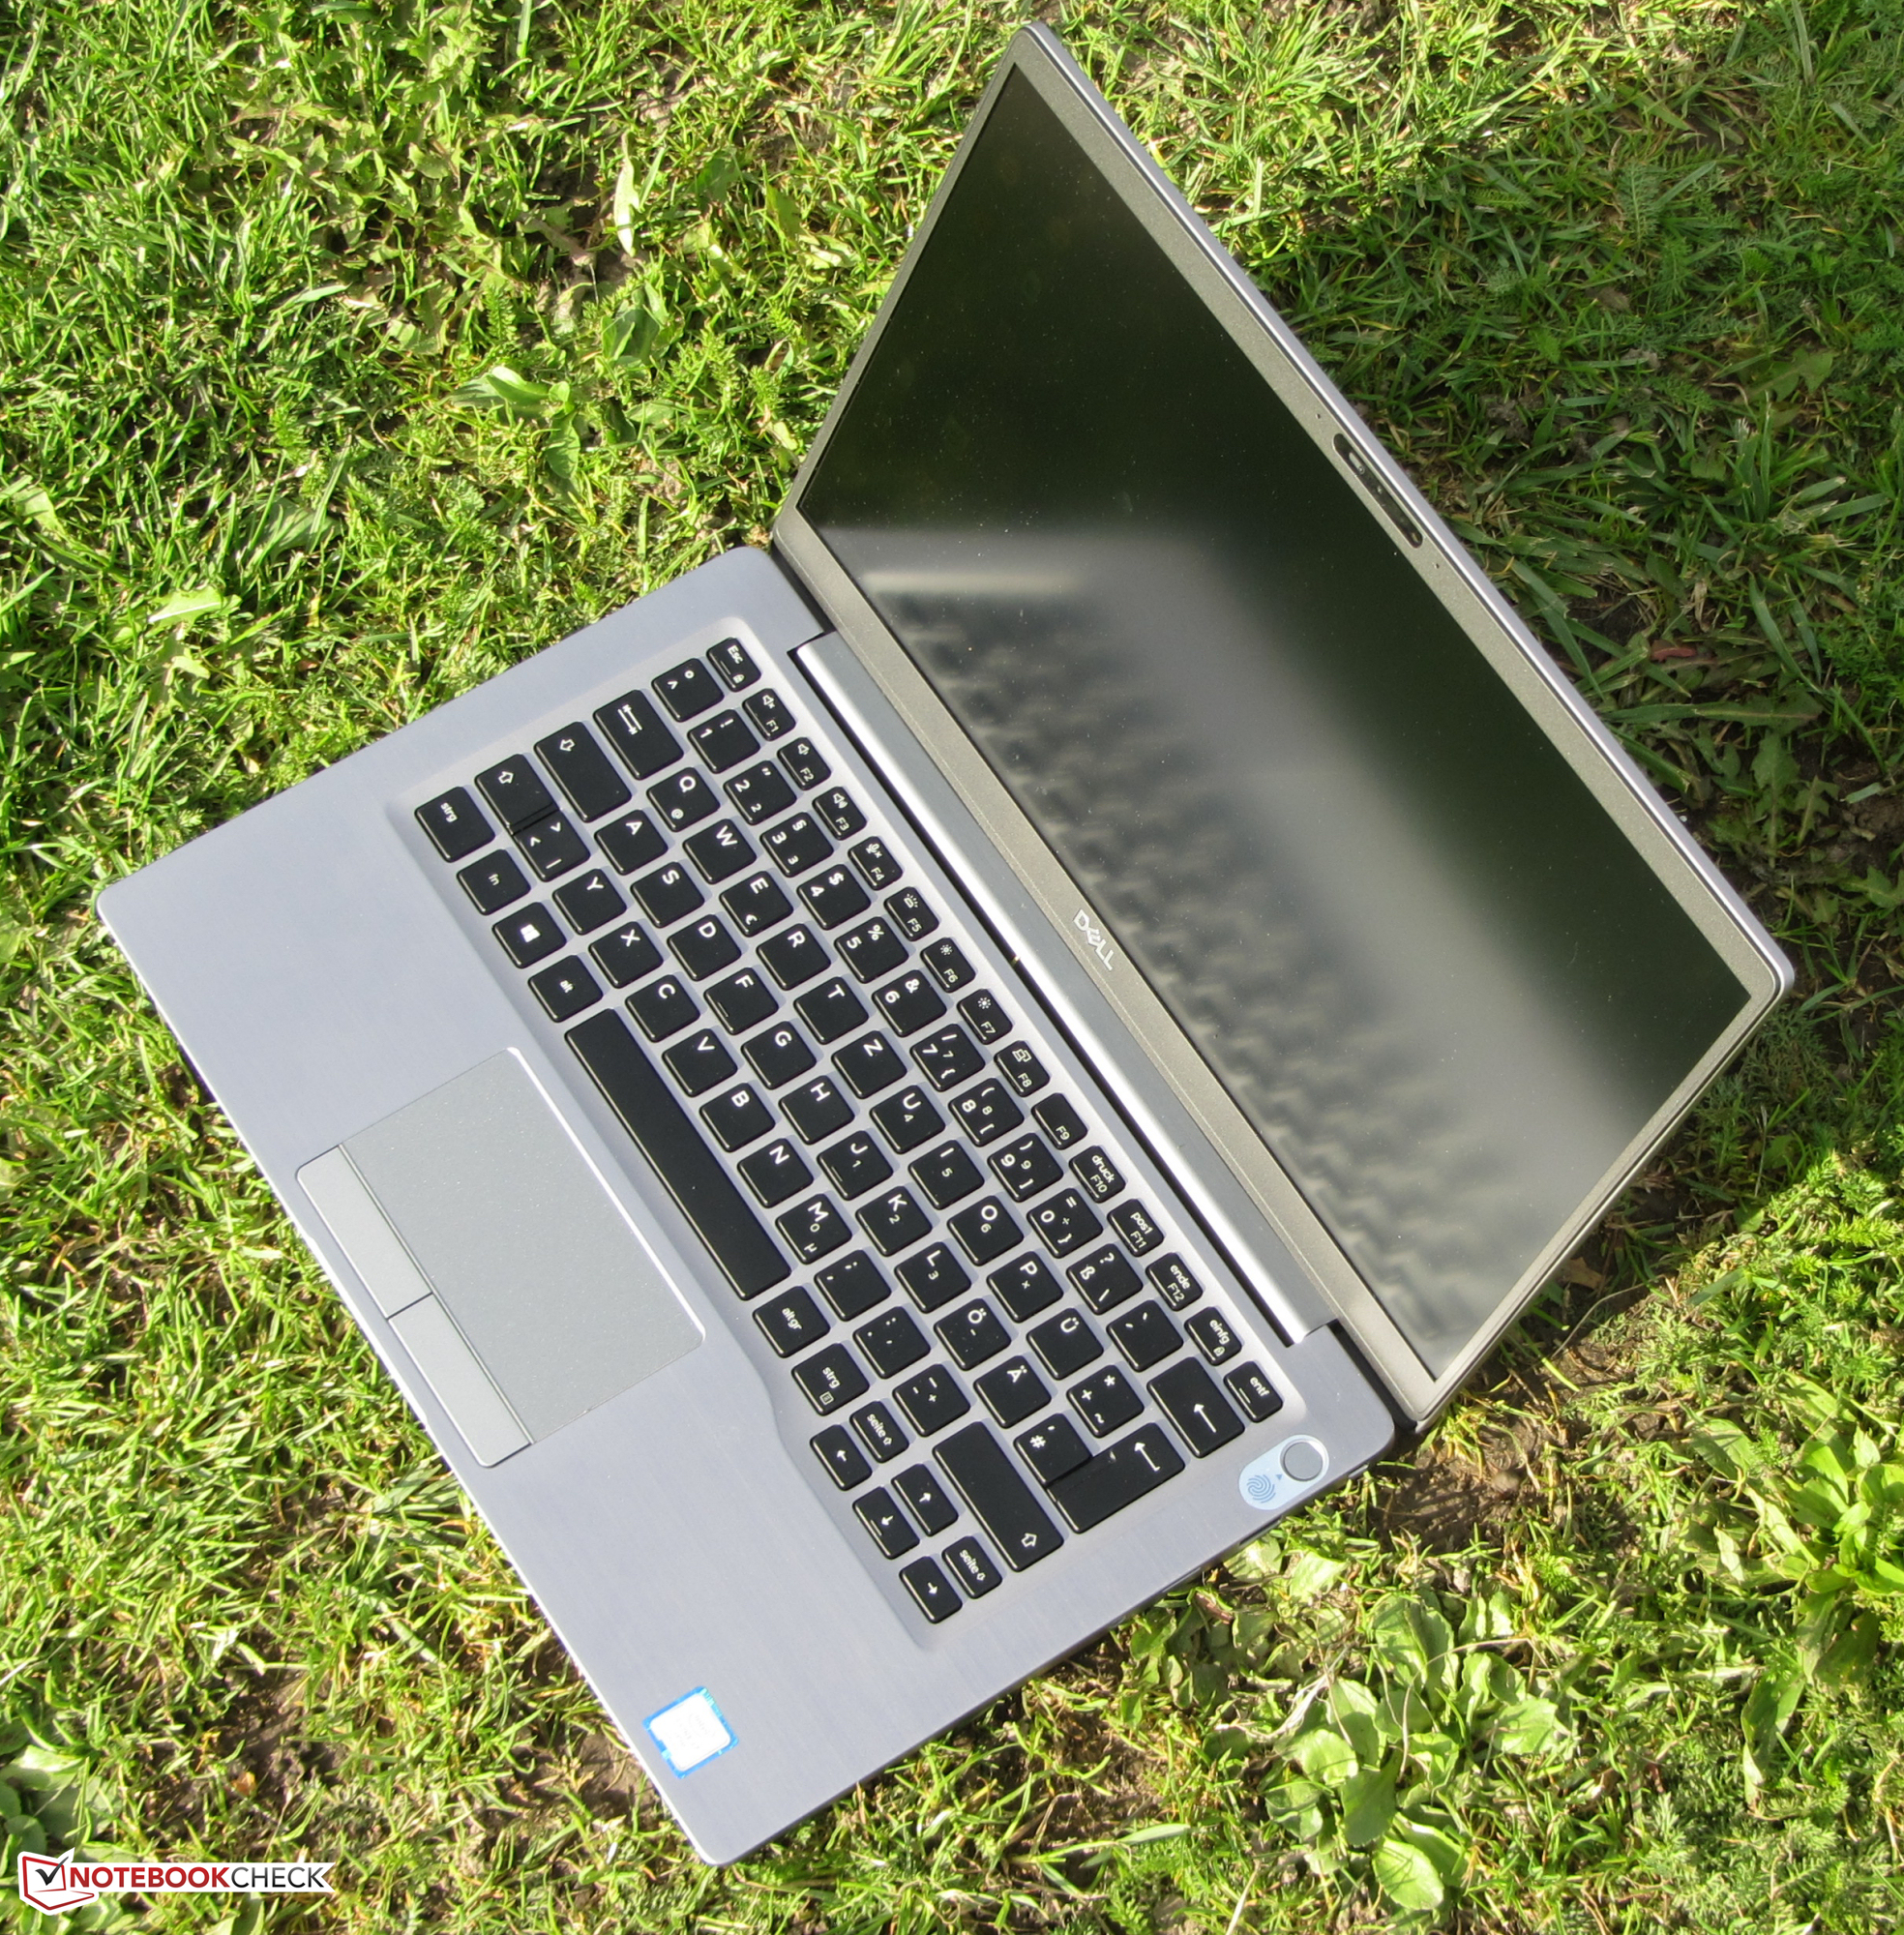
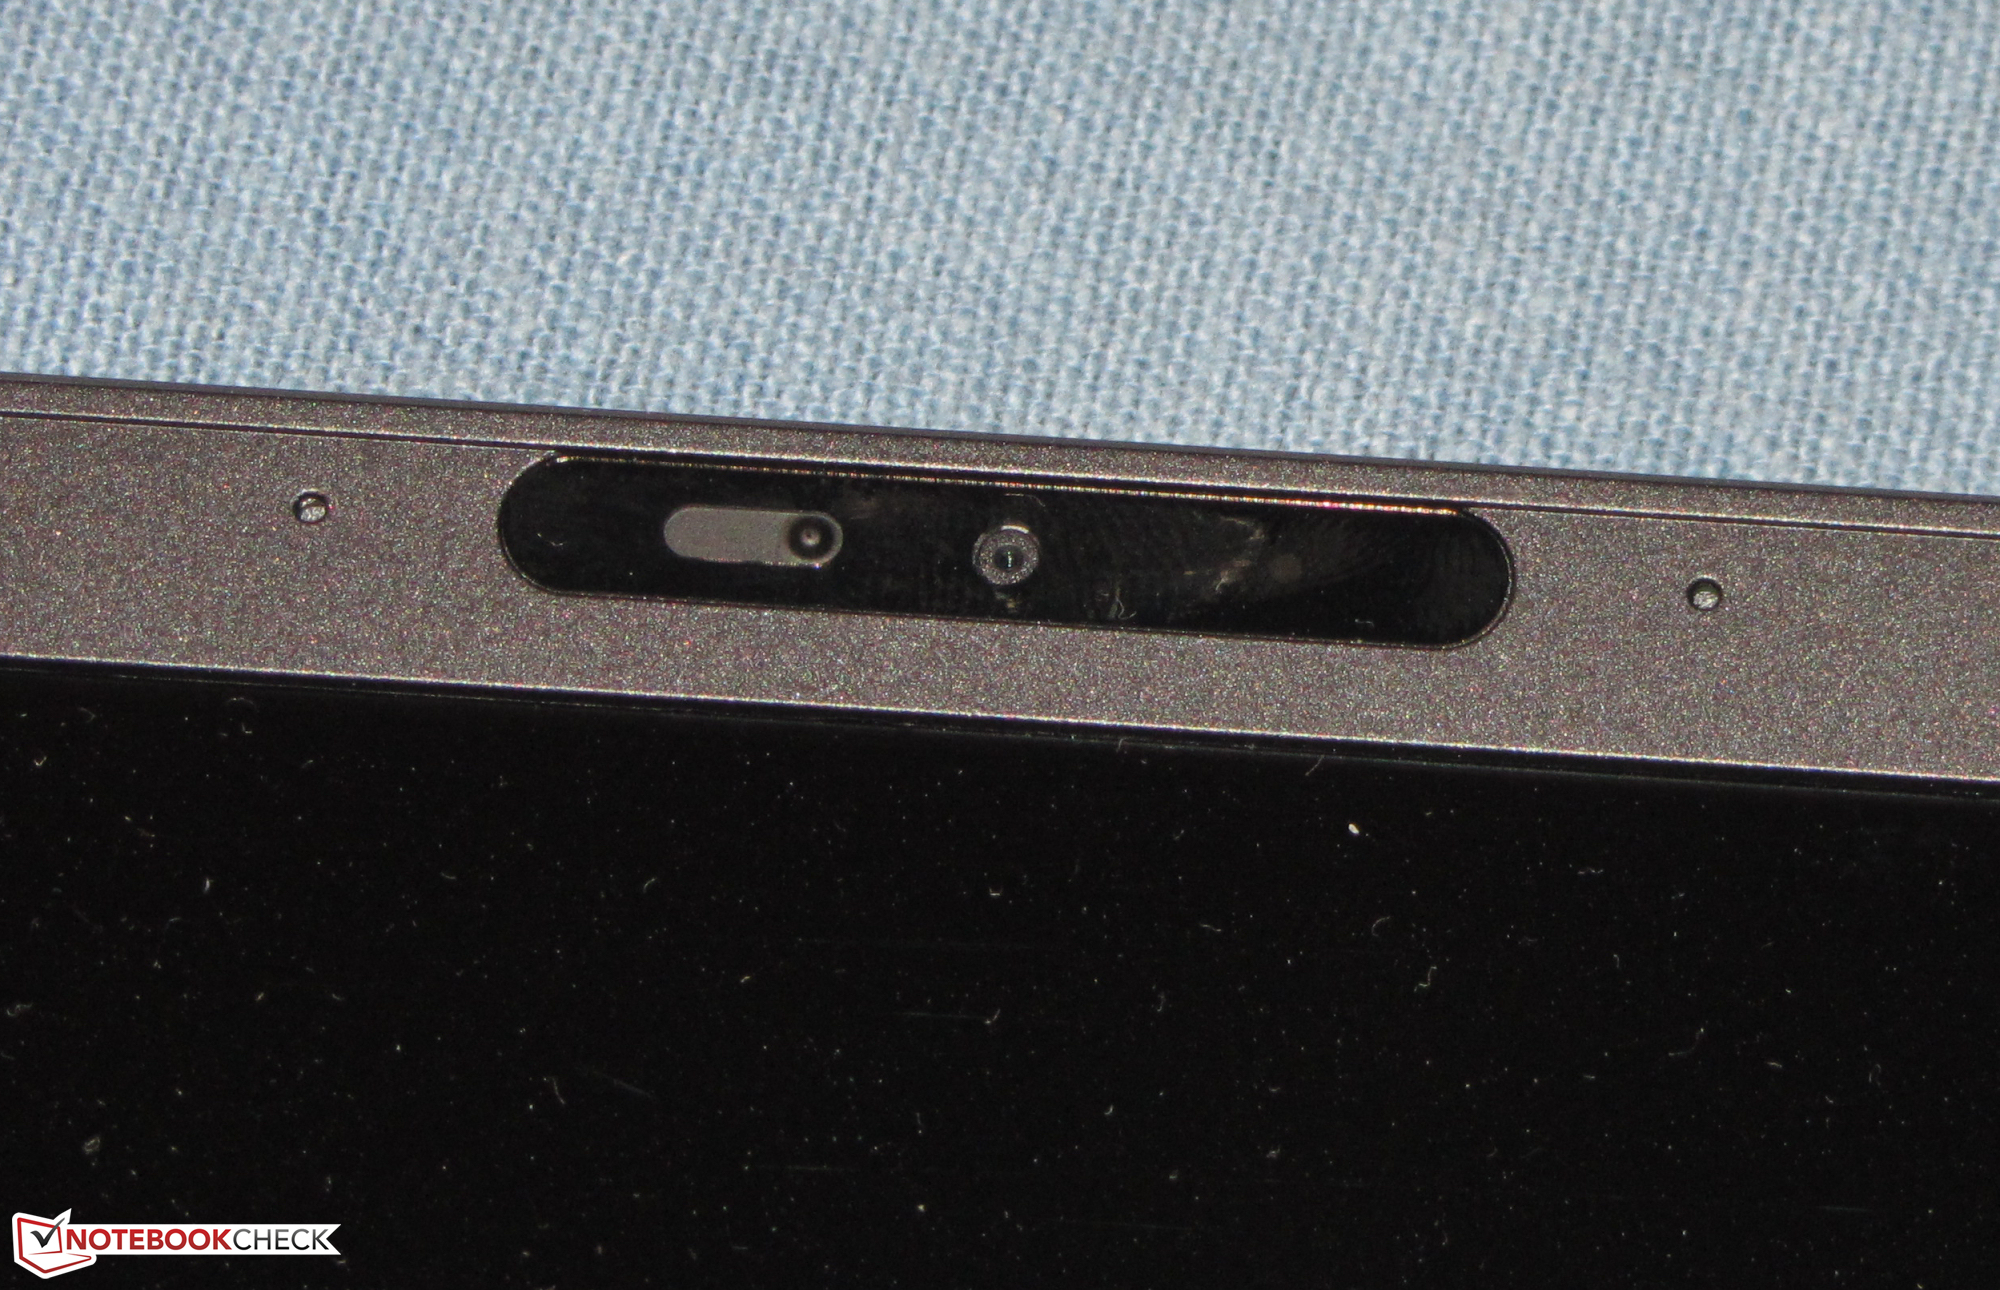
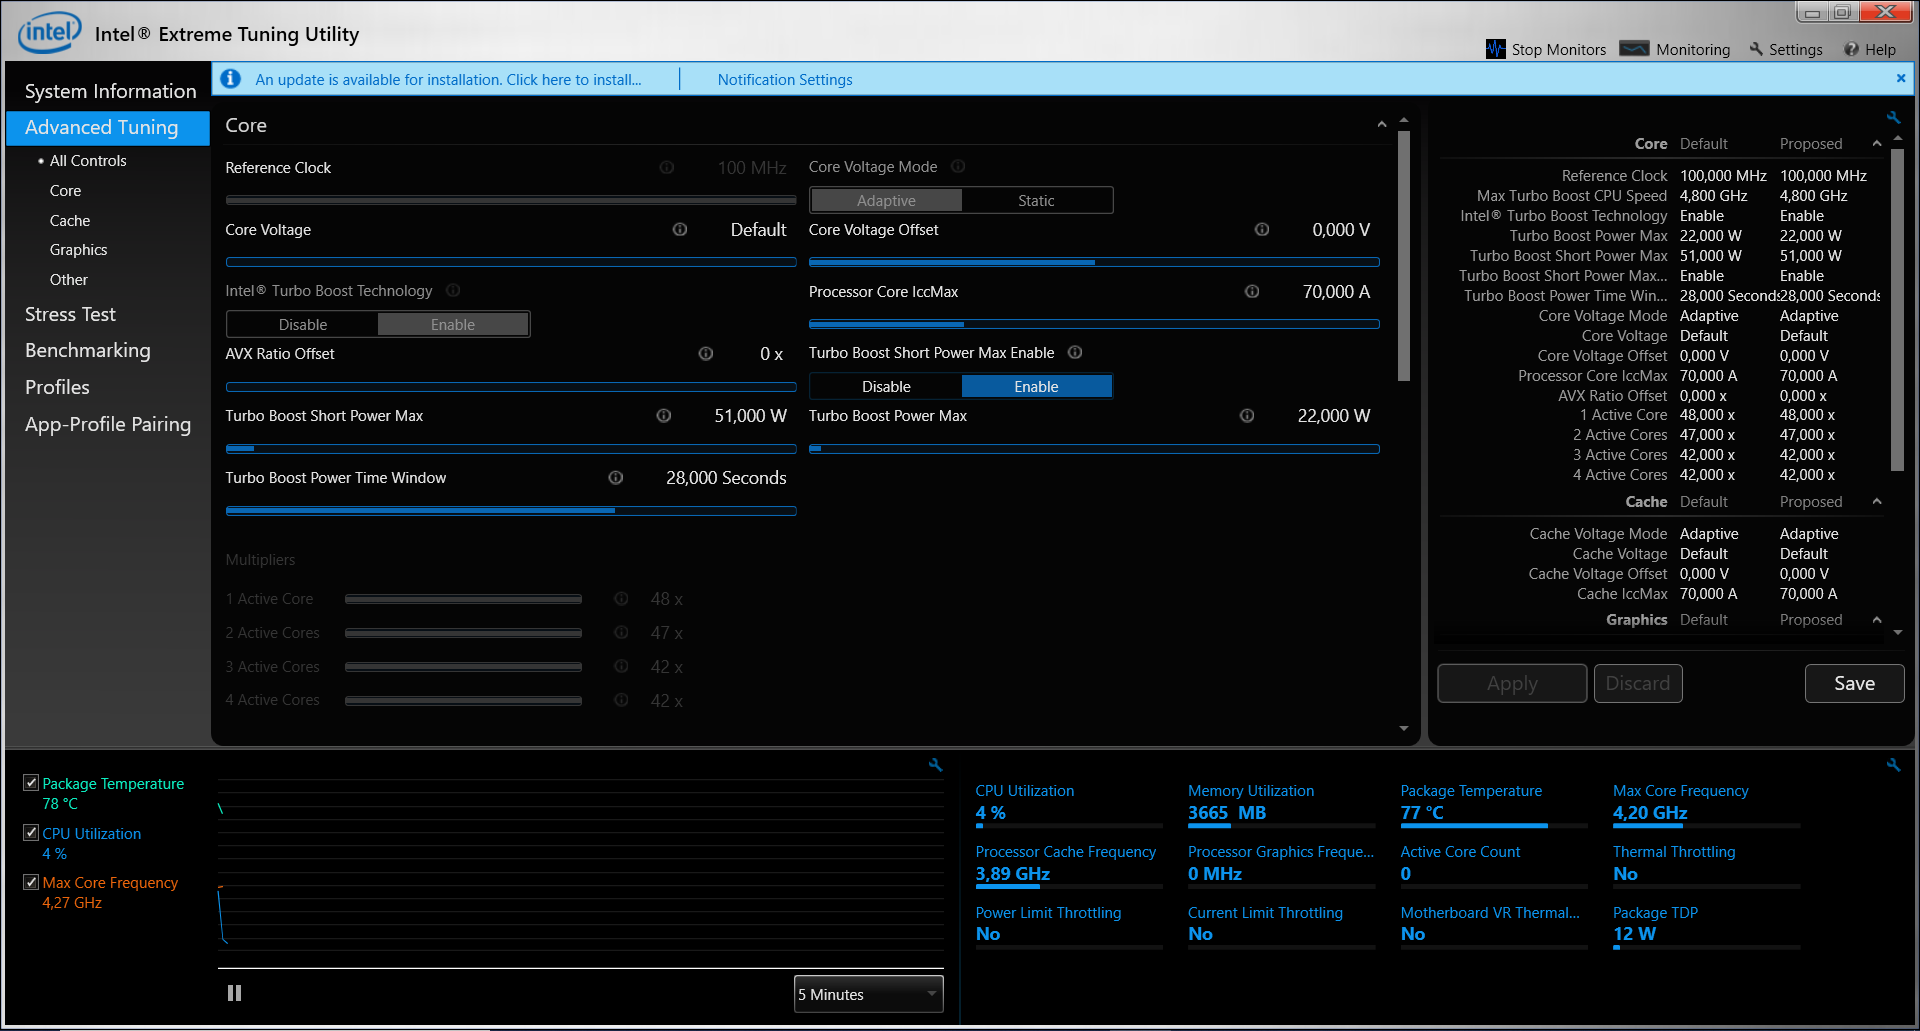
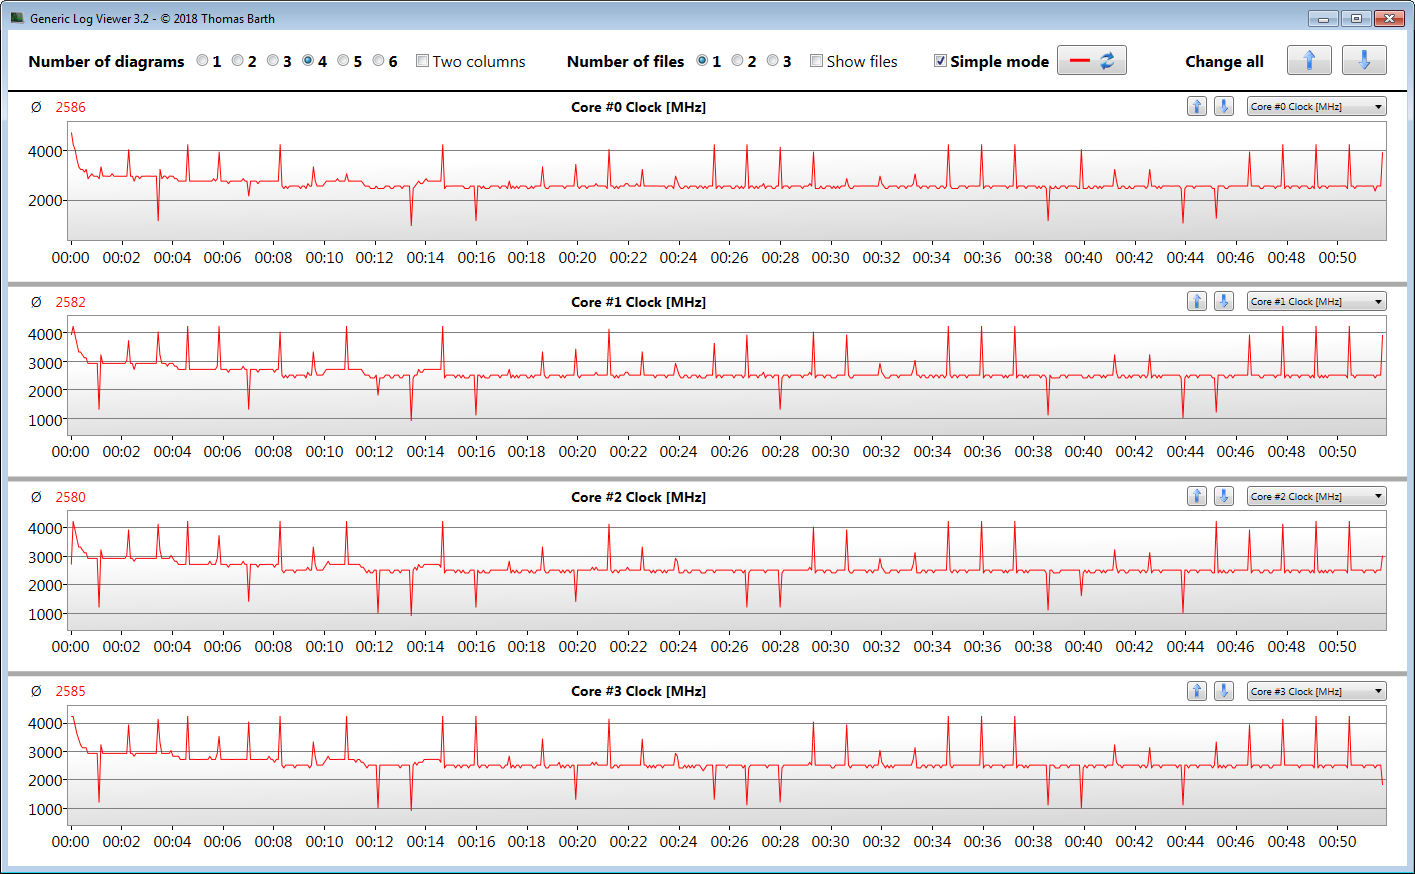
Dell Latitude 7400 är en aning kompaktare och lättare än sin föregångare. Enheten är ännu mer tilltalande tack vare den tunt infattade skärmen. Innanmätet stämmer överens med de senaste trenderna. En fyrkärnig Whiskey Lake-processor levererar tillräckligt med datorkraft för kontors- och internetapplikationer. Men den fulla potentialen kan bara nås i AC-läge. Vid batteridrift använder processorn knappt turbo överhuvudtaget och eventuellt gör den det inte alls. Det är priset du får betala för bra batteritid.
Med Latitude 7400 levererar Dell en toppskiktslaptop för kontoret som dock inte är utan svagheter.
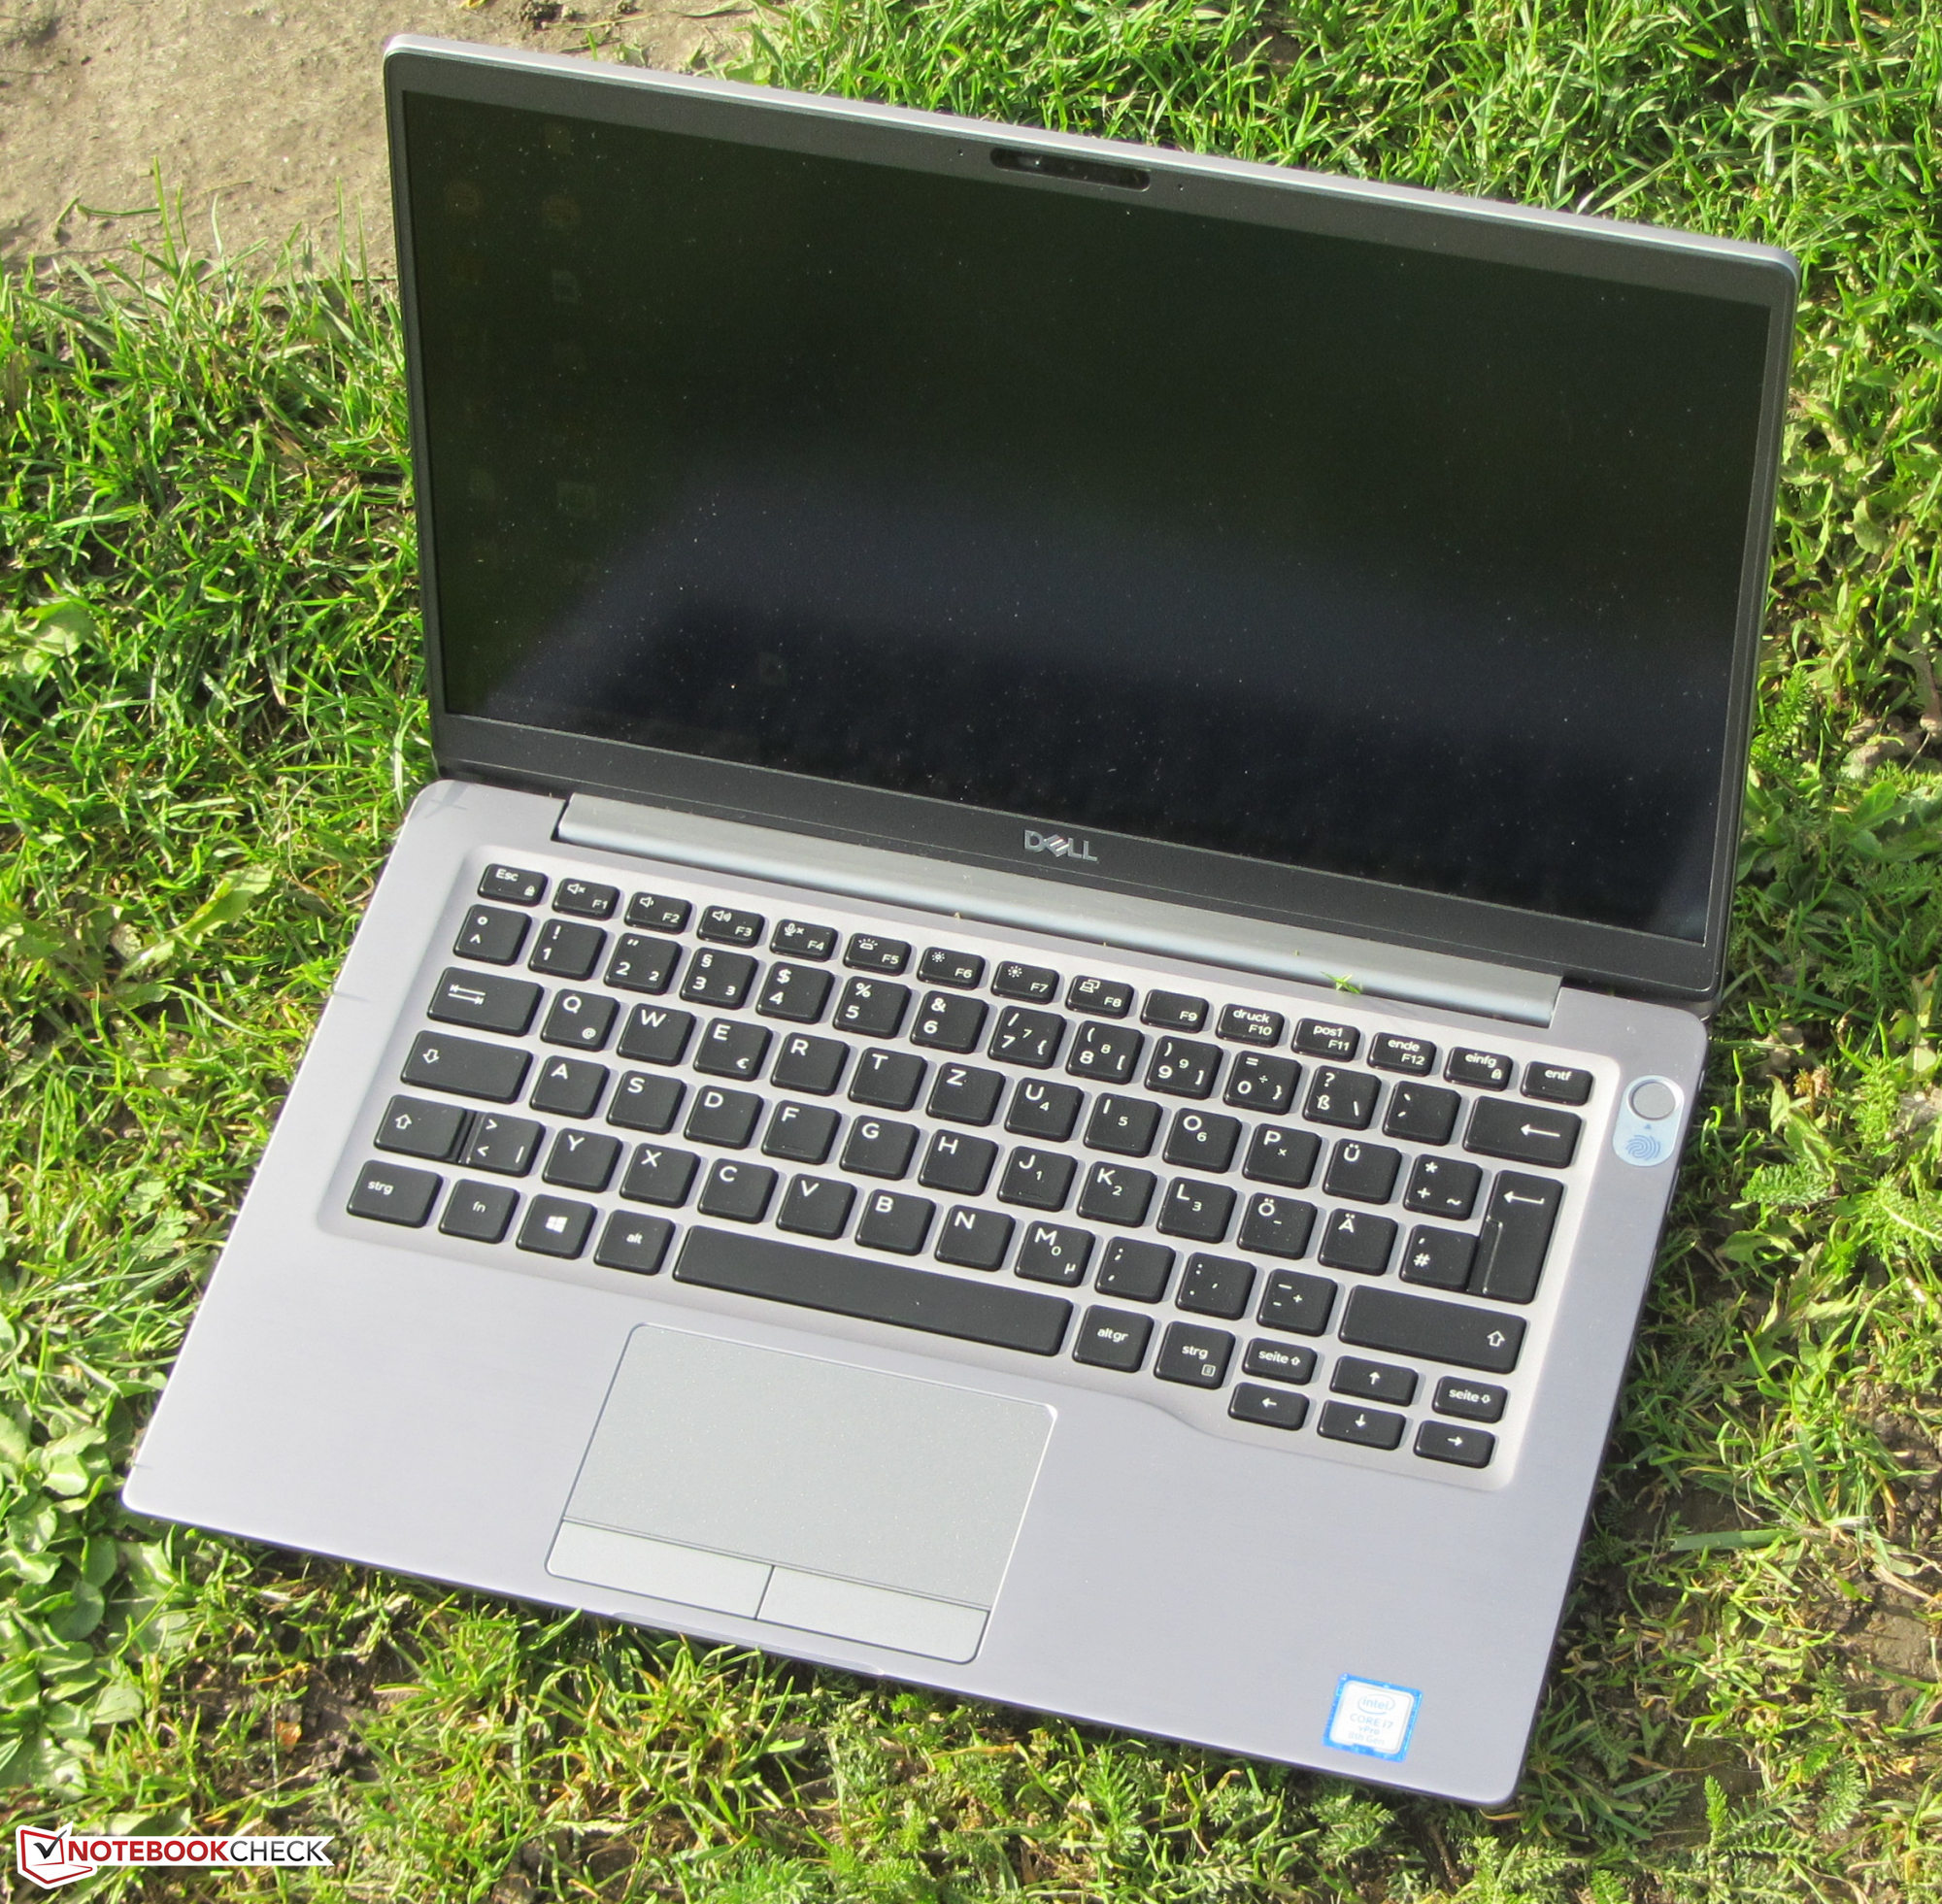
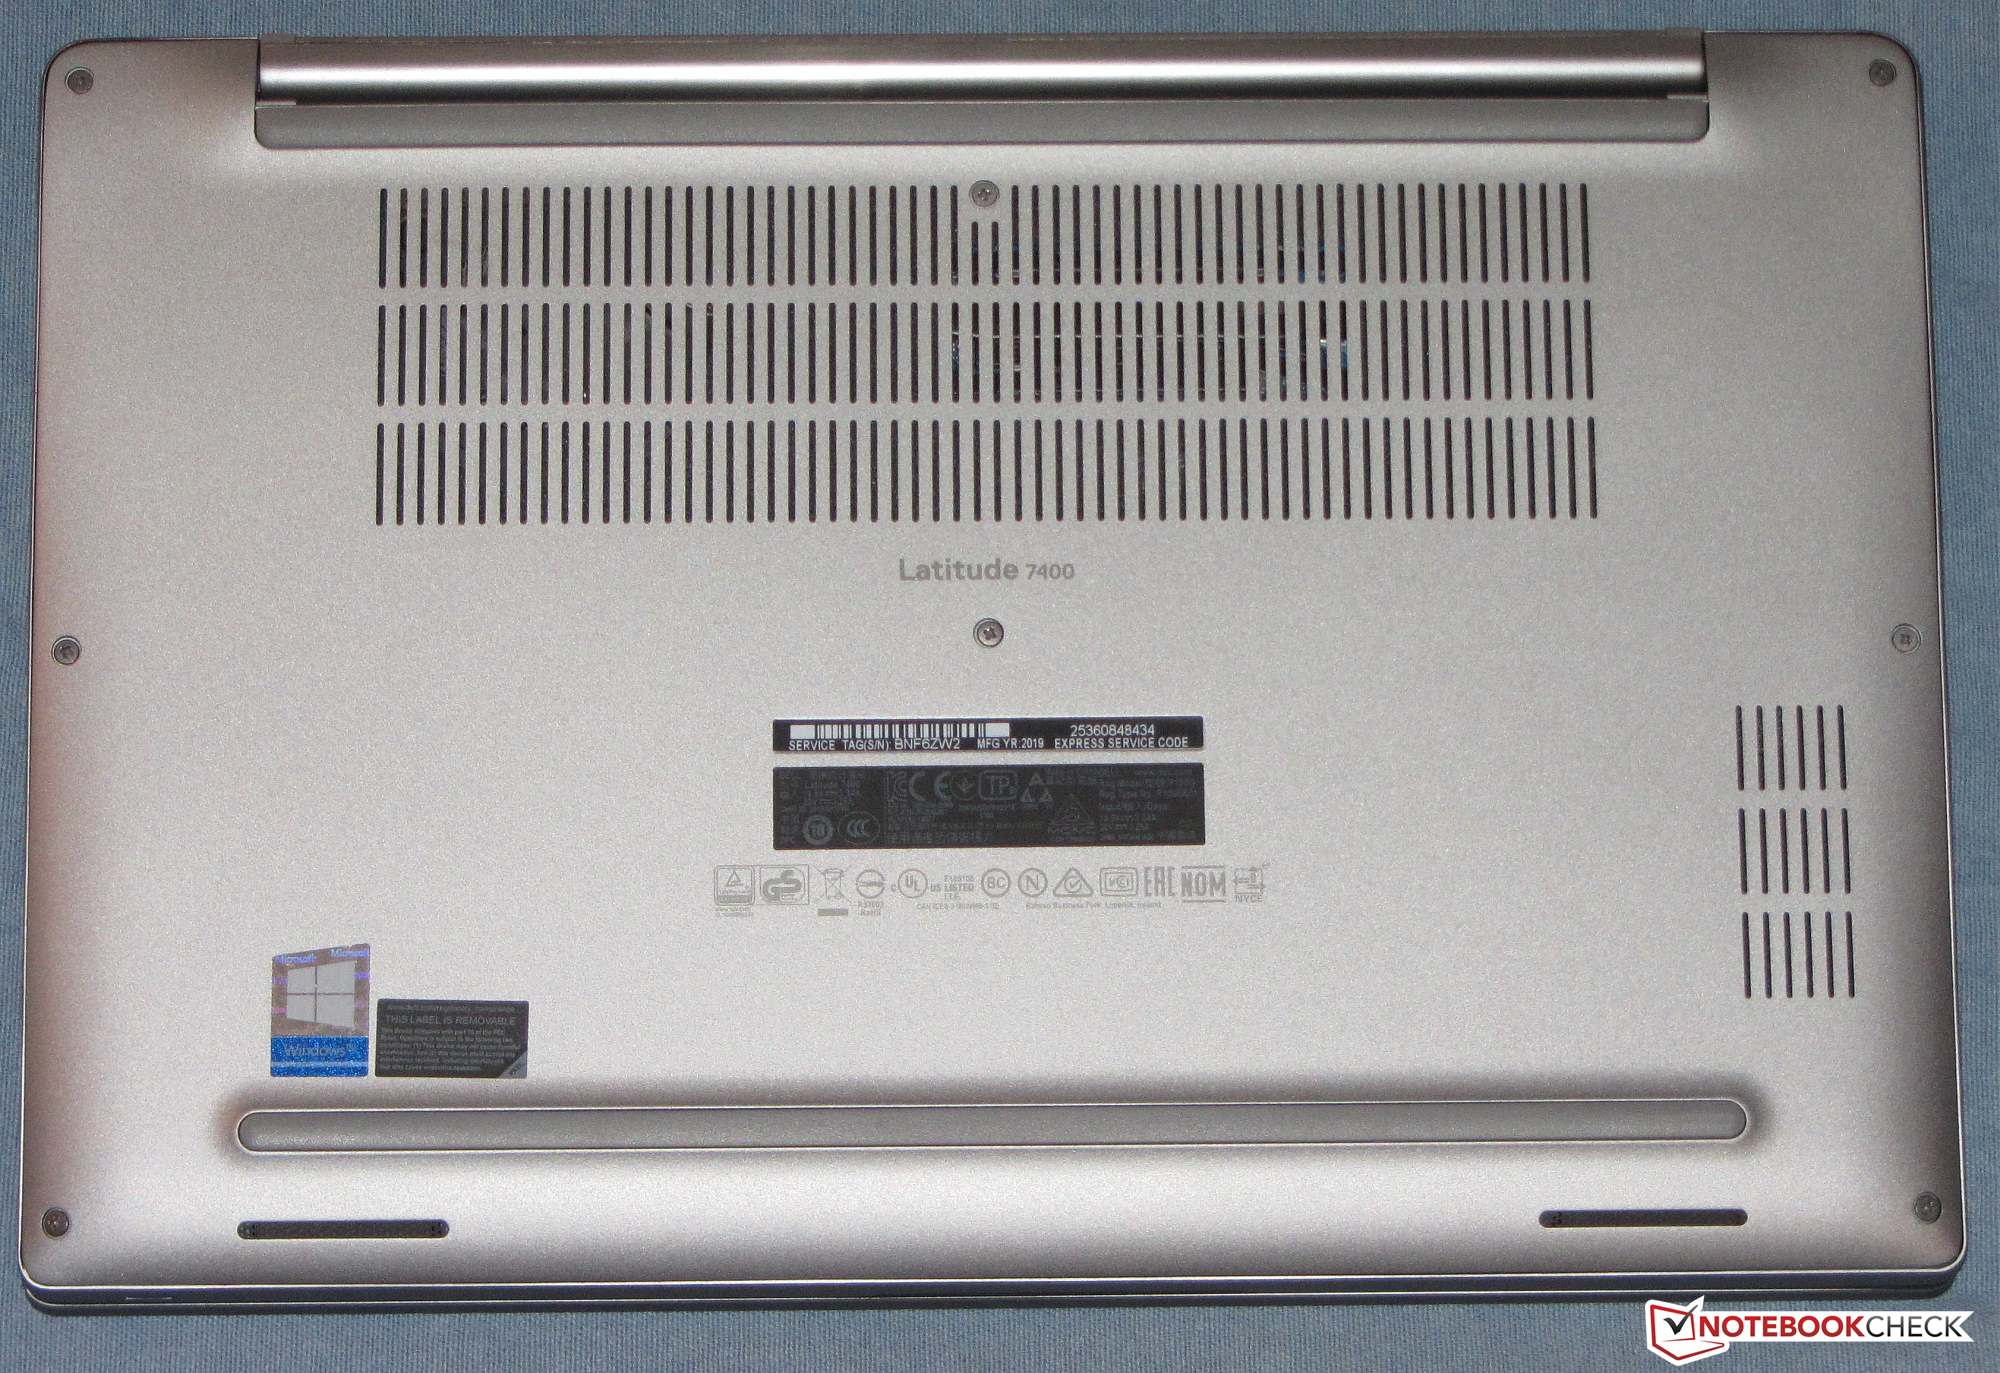
En snabb NVMe SSD-enhet säkrar ett kvickt system. Det är möjligt att byta SSD-enheten, men då får man öppna höljet. En höjdpunkt med datorn är i vårt tycke tangentbordet. Det är ett av de bästa tangentborden vi sett. Två nivåer av tangentbelysning ingår förstås.
Den matta IPS-skärmen får poäng för stabila betraktningsvinklar, bra kontrast, skaplig färgåtergivning direkt vid leverans och bra färgrymdstäckning. Ljusstyrkan är okej men borde varit bättre på en enhet i den här priskategorin. På grund av det går det inte riktigt att använda datorn utomhus.
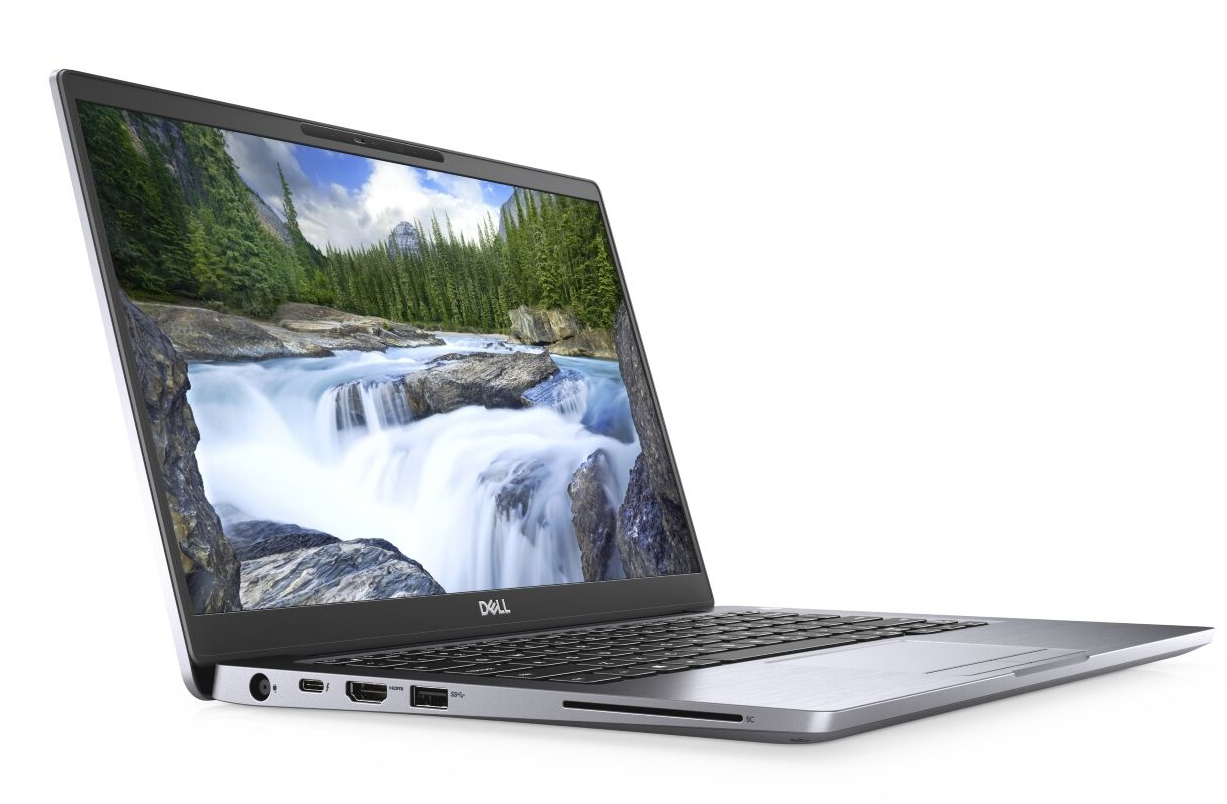
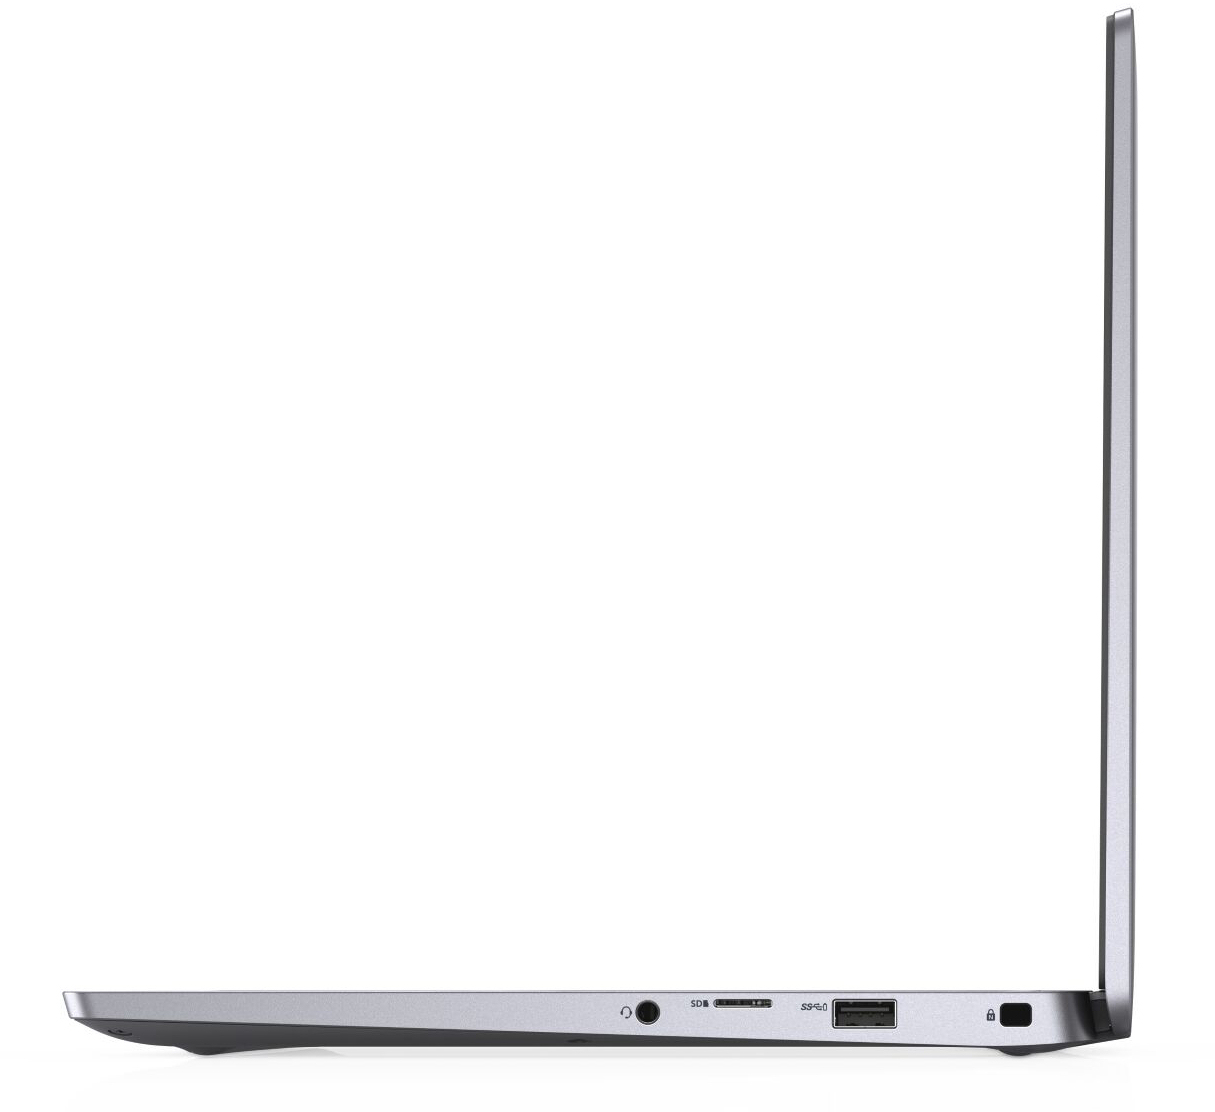
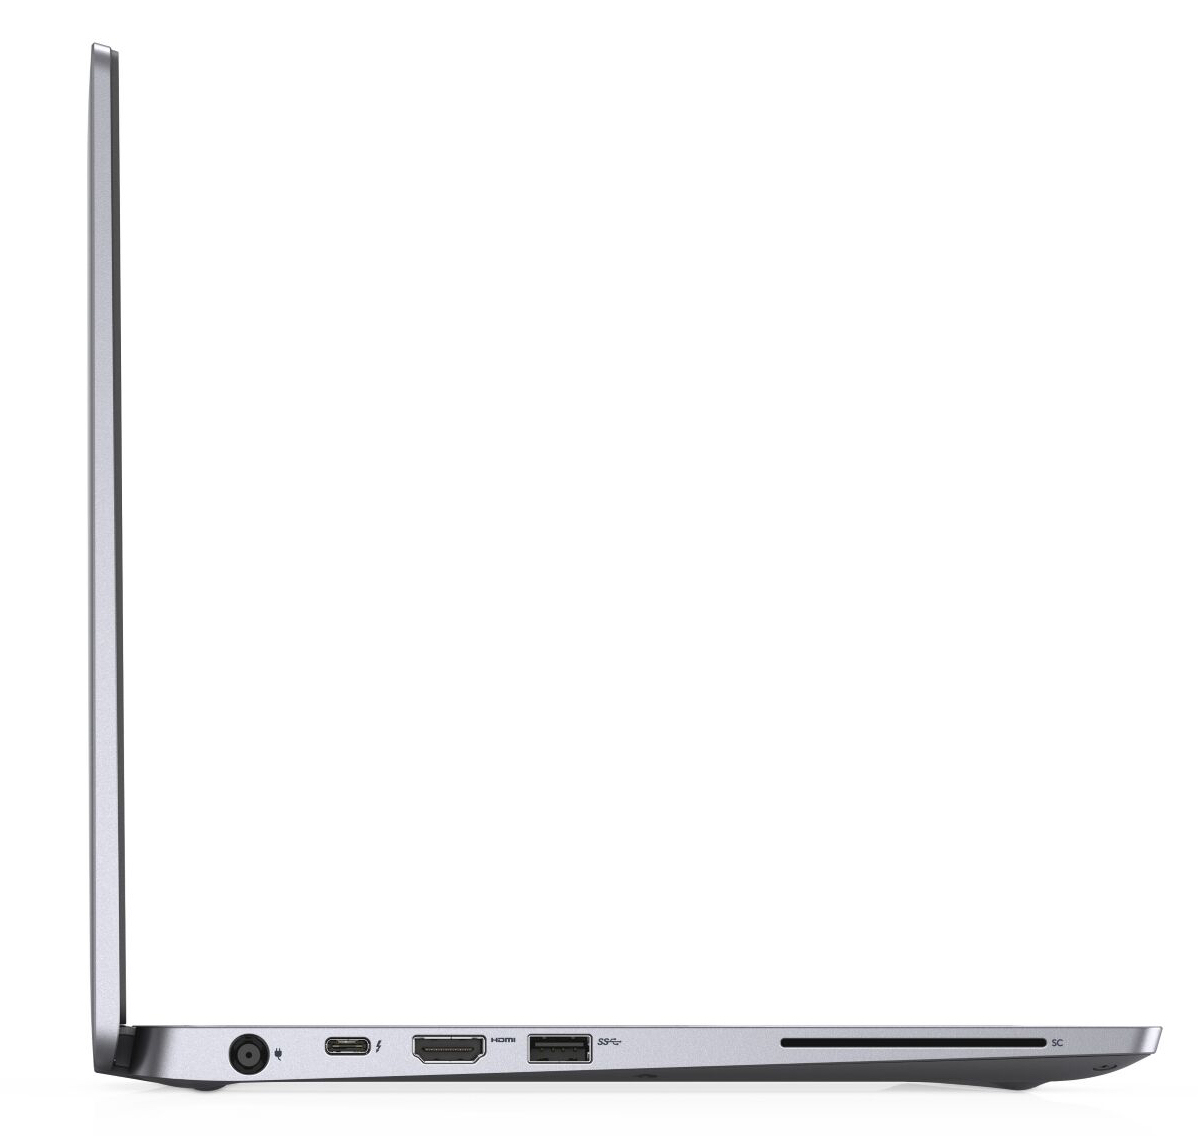
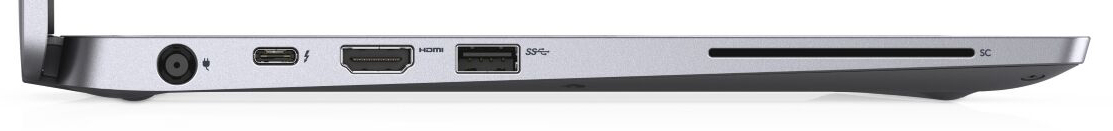
Thunderbolt 3-porten gör det möjligt att ansluta dockningslösningar och/eller en kraftfull extern GPU. Porten har förstås stöd för både Power Delivery 3.0 och DisplayPort genom USB-C (vilket kräver en separat adapter). Tyvärr avger fläkten ett visslande ljud.
Dell Latitude 7400-8N6DH
- 09/19/2019 v7 (old)
Sascha Mölck