Test: HP EliteBook x360 830 G6 - HP:s omvandlingsbara imponerar på nästan alla sätt (Sammanfattning)
| |||||||||||||||||||||||||
Distribution av ljusstyrkan: 69 %
Mitt på batteriet: 601 cd/m²
Kontrast: 2319:1 (Svärta: 0.26 cd/m²)
ΔE ColorChecker Calman: 2.2 | ∀{0.5-29.43 Ø4.72}
calibrated: 1.5
ΔE Greyscale Calman: 2.6 | ∀{0.09-98 Ø4.97}
93.6% sRGB (Argyll 1.6.3 3D)
60.2% AdobeRGB 1998 (Argyll 1.6.3 3D)
67.5% AdobeRGB 1998 (Argyll 3D)
95.3% sRGB (Argyll 3D)
66.1% Display P3 (Argyll 3D)
Gamma: 2.17
CCT: 6412 K
| HP EliteBook x360 830 G6 M133NVFC R5, , 1920x1080, 13.3" | HP EliteBook x360 1030 G3-4QZ12ES M133NVF3 R1, , 1920x1080, 13.3" | Lenovo ThinkPad X390 Yoga-20NQS05R00 LP133WF7-SPA1, , 1920x1080, 13.3" | Dell Latitude 7400 2-in-1 SHP14A2, , 1920x1080, 14" | |
|---|---|---|---|---|
| Display | -2% | 0% | 4% | |
| Display P3 Coverage (%) | 66.1 | 65.3 -1% | 65.2 -1% | 68.6 4% |
| sRGB Coverage (%) | 95.3 | 92.6 -3% | 97 2% | 99.6 5% |
| AdobeRGB 1998 Coverage (%) | 67.5 | 66.4 -2% | 67.3 0% | 70 4% |
| Response Times | 23% | -19% | -27% | |
| Response Time Grey 50% / Grey 80% * (ms) | 44 ? | 34.4 ? 22% | 59.2 ? -35% | 56 ? -27% |
| Response Time Black / White * (ms) | 30 ? | 23.2 ? 23% | 30.8 ? -3% | 38 ? -27% |
| PWM Frequency (Hz) | 952 ? | 18940 ? | 1667 ? | |
| Screen | -26% | -39% | -7% | |
| Brightness middle (cd/m²) | 603 | 668 11% | 319 -47% | 277.2 -54% |
| Brightness (cd/m²) | 692 | 685 -1% | 306 -56% | 263 -62% |
| Brightness Distribution (%) | 69 | 86 25% | 90 30% | 83 20% |
| Black Level * (cd/m²) | 0.26 | 0.52 -100% | 0.15 42% | 0.2 23% |
| Contrast (:1) | 2319 | 1285 -45% | 2127 -8% | 1386 -40% |
| Colorchecker dE 2000 * | 2.2 | 3.5 -59% | 6.1 -177% | 2.1 5% |
| Colorchecker dE 2000 max. * | 7.7 | 8.3 -8% | 9.7 -26% | 5.91 23% |
| Colorchecker dE 2000 calibrated * | 1.5 | 2.2 -47% | 1 33% | 1.03 31% |
| Greyscale dE 2000 * | 2.6 | 4.2 -62% | 8.6 -231% | 3.4 -31% |
| Gamma | 2.17 101% | 2.21 100% | 2.62 84% | 2.241 98% |
| CCT | 6412 101% | 6207 105% | 6613 98% | 6030 108% |
| Color Space (Percent of AdobeRGB 1998) (%) | 60.2 | 60.9 1% | 61.9 3% | 64 6% |
| Color Space (Percent of sRGB) (%) | 93.6 | 92.5 -1% | 96.8 3% | 100 7% |
| Totalt genomsnitt (program/inställningar) | -2% /
-15% | -19% /
-29% | -10% /
-7% |
* ... mindre är bättre
Visa svarstider
| ↔ Svarstid svart till vitt | ||
|---|---|---|
| 30 ms ... stiga ↗ och falla ↘ kombinerat | ↗ 14 ms stiga | 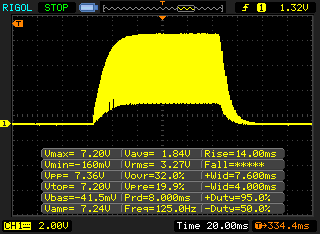 |
| ↘ 16 ms hösten | ||
| Skärmen visar långsamma svarsfrekvenser i våra tester och kommer att vara otillfredsställande för spelare. I jämförelse sträcker sig alla testade enheter från 0.1 (minst) till 240 (maximalt) ms. » 80 % av alla enheter är bättre. Detta innebär att den uppmätta svarstiden är sämre än genomsnittet av alla testade enheter (19.8 ms). | ||
| ↔ Svarstid 50 % grått till 80 % grått | ||
| 44 ms ... stiga ↗ och falla ↘ kombinerat | ↗ 18.8 ms stiga | 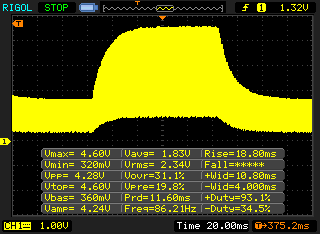 |
| ↘ 25.2 ms hösten | ||
| Skärmen visar långsamma svarsfrekvenser i våra tester och kommer att vara otillfredsställande för spelare. I jämförelse sträcker sig alla testade enheter från 0.165 (minst) till 636 (maximalt) ms. » 73 % av alla enheter är bättre. Detta innebär att den uppmätta svarstiden är sämre än genomsnittet av alla testade enheter (31 ms). | ||
Skärmflimmer / PWM (Puls-Width Modulation)
| Skärmflimmer / PWM upptäckt | 952 Hz | ≤ 100 % ljusstyrka inställning | 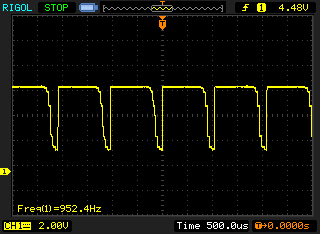 |
Displayens bakgrundsbelysning flimrar vid 952 Hz (i värsta fall, t.ex. med PWM) Flimrande upptäckt vid en ljusstyrkeinställning på 100 % och lägre. Det ska inte finnas något flimmer eller PWM över denna ljusstyrkeinställning. Frekvensen för 952 Hz är ganska hög, så de flesta användare som är känsliga för PWM bör inte märka något flimmer. Som jämförelse: 52 % av alla testade enheter använder inte PWM för att dämpa skärmen. Om PWM upptäcktes mättes ett medelvärde av 7772 (minst: 5 - maximum: 343500) Hz. | |||
| PCMark 8 | |
| Home Score Accelerated v2 | |
| Genomsnitt av klass Convertible (n=1senaste 2 åren) | |
| HP EliteBook x360 1030 G3 45X96UT | |
| HP EliteBook x360 1030 G3-4QZ12ES | |
| Lenovo ThinkPad X390 Yoga-20NQS05R00 | |
| Dell Latitude 7400 2-in-1 | |
| Genomsnitt Intel Core i7-8565U, Intel UHD Graphics 620 (2577 - 4179, n=20) | |
| HP EliteBook x360 830 G6 | |
| Work Score Accelerated v2 | |
| Genomsnitt av klass Convertible (n=1senaste 2 åren) | |
| Lenovo ThinkPad X390 Yoga-20NQS05R00 | |
| HP EliteBook x360 1030 G3-4QZ12ES | |
| Genomsnitt Intel Core i7-8565U, Intel UHD Graphics 620 (3596 - 5189, n=19) | |
| Dell Latitude 7400 2-in-1 | |
| HP EliteBook x360 830 G6 | |
| PCMark 8 Home Score Accelerated v2 | 3196 poäng | |
| PCMark 8 Work Score Accelerated v2 | 4421 poäng | |
| PCMark 10 Score | 3567 poäng | |
Hjälp | ||
| HP EliteBook x360 830 G6 WDC PC SN720 SDAPNTW-1T00 | HP EliteBook x360 1030 G3 45X96UT Samsung SSD PM981 MZVLB512HAJQ | Lenovo ThinkPad X390 Yoga-20NQS05R00 Intel SSD Pro 7600p SSDPEKKF512G8L | Dell Latitude 7400 2-in-1 Toshiba XG6 KXG60ZNV512G | Genomsnitt WDC PC SN720 SDAPNTW-1T00 | |
|---|---|---|---|---|---|
| CrystalDiskMark 5.2 / 6 | 12% | 26% | -35% | 12% | |
| Write 4K (MB/s) | 122.8 | 120 -2% | 144.1 17% | 35.06 -71% | 130.1 ? 6% |
| Read 4K (MB/s) | 46.89 | 43.42 -7% | 63.5 35% | 23.64 -50% | 44.1 ? -6% |
| Write Seq (MB/s) | 1801 | 1814 1% | 1496 -17% | 1537 -15% | 2151 ? 19% |
| Read Seq (MB/s) | 1014 | 2227 120% | 2677 164% | 1782 76% | 1295 ? 28% |
| Write 4K Q32T1 (MB/s) | 333.7 | 391.8 17% | 357.4 7% | 100.3 -70% | 390 ? 17% |
| Read 4K Q32T1 (MB/s) | 314.4 | 288.7 -8% | 482.3 53% | 62.7 -80% | 418 ? 33% |
| Write Seq Q32T1 (MB/s) | 2784 | 1860 -33% | 1558 -44% | 2698 -3% | 2790 ? 0% |
| Read Seq Q32T1 (MB/s) | 3261 | 3376 4% | 3021 -7% | 1073 -67% | 3338 ? 2% |

| 3DMark | |
| 1280x720 Cloud Gate Standard Graphics | |
| Genomsnitt av klass Convertible (7885 - 57566, n=34, senaste 2 åren) | |
| Lenovo ThinkPad X390 Yoga-20NQS05R00 | |
| Dell Latitude 7400 2-in-1 | |
| HP EliteBook x360 1030 G3-4QZ12ES | |
| HP EliteBook x360 830 G6 | |
| Genomsnitt Intel UHD Graphics 620 (6205 - 16400, n=225) | |
| 1920x1080 Fire Strike Graphics | |
| Genomsnitt av klass Convertible (1185 - 27447, n=50, senaste 2 åren) | |
| Lenovo ThinkPad X390 Yoga-20NQS05R00 | |
| Dell Latitude 7400 2-in-1 | |
| Genomsnitt Intel UHD Graphics 620 (557 - 2608, n=213) | |
| HP EliteBook x360 830 G6 | |
| 3DMark Cloud Gate Standard Score | 8104 poäng | |
| 3DMark Fire Strike Score | 1025 poäng | |
Hjälp | ||
| låg | med. | hög | ultra | |
|---|---|---|---|---|
| BioShock Infinite (2013) | 71.7 | 37.3 | 31.3 | 9.9 |
| The Witcher 3 (2015) | 15.3 | |||
| Dota 2 Reborn (2015) | 71 | 44.8 | 18.9 | 17.2 |
| Rise of the Tomb Raider (2016) | 21.9 | |||
| X-Plane 11.11 (2018) | 25.4 | 16.4 | 14.9 |
Ljudnivå
| Låg belastning |
| 28.8 / 28.8 / 32.2 dB(A) |
| Hög belastning |
| 32.2 / 34.4 dB(A) |
 | ||
30 dB tyst 40 dB(A) hörbar 50 dB(A) högt ljud |
||
min: | ||
(+) Den maximala temperaturen på ovansidan är 35.1 °C / 95 F, jämfört med genomsnittet av 35.4 °C / 96 F , allt från 19.6 till 60 °C för klassen Convertible.
(±) Botten värms upp till maximalt 43.3 °C / 110 F, jämfört med genomsnittet av 36.9 °C / 98 F
(+) Vid tomgångsbruk är medeltemperaturen för ovansidan 24.8 °C / 77 F, jämfört med enhetsgenomsnittet på 30.3 °C / ### class_avg_f### F.
(+) Handledsstöden och pekplattan är kallare än hudtemperaturen med maximalt 28 °C / 82.4 F och är därför svala att ta på.
(±) Medeltemperaturen för handledsstödsområdet på liknande enheter var 28 °C / 82.4 F (0 °C / 0 F).
HP EliteBook x360 830 G6 ljudanalys
(±) | högtalarljudstyrkan är genomsnittlig men bra (75.2 dB)
Bas 100 - 315 Hz
(-) | nästan ingen bas - i genomsnitt 16.7% lägre än medianen
(±) | linjäriteten för basen är genomsnittlig (11.4% delta till föregående frekvens)
Mellan 400 - 2000 Hz
(+) | balanserad mellan - endast 4.1% från medianen
(+) | mids är linjära (5.8% delta till föregående frekvens)
Högsta 2 - 16 kHz
(+) | balanserade toppar - endast 2.3% från medianen
(+) | toppar är linjära (4.8% delta till föregående frekvens)
Totalt 100 - 16 000 Hz
(±) | linjäriteten för det totala ljudet är genomsnittlig (18.8% skillnad mot median)
Jämfört med samma klass
» 44% av alla testade enheter i den här klassen var bättre, 5% liknande, 50% sämre
» Den bästa hade ett delta på 6%, genomsnittet var 20%, sämst var 57%
Jämfört med alla testade enheter
» 43% av alla testade enheter var bättre, 8% liknande, 49% sämre
» Den bästa hade ett delta på 4%, genomsnittet var 24%, sämst var 134%
Lenovo ThinkPad X390 Yoga-20NQS05R00 ljudanalys
(±) | högtalarljudstyrkan är genomsnittlig men bra (74.1 dB)
Bas 100 - 315 Hz
(-) | nästan ingen bas - i genomsnitt 15.8% lägre än medianen
(±) | linjäriteten för basen är genomsnittlig (10.6% delta till föregående frekvens)
Mellan 400 - 2000 Hz
(±) | högre mellan - i genomsnitt 6.5% högre än median
(±) | linjäriteten för mids är genomsnittlig (10.3% delta till föregående frekvens)
Högsta 2 - 16 kHz
(+) | balanserade toppar - endast 2.8% från medianen
(±) | linjäriteten för toppar är genomsnittlig (11% delta till föregående frekvens)
Totalt 100 - 16 000 Hz
(±) | linjäriteten för det totala ljudet är genomsnittlig (24% skillnad mot median)
Jämfört med samma klass
» 73% av alla testade enheter i den här klassen var bättre, 5% liknande, 22% sämre
» Den bästa hade ett delta på 6%, genomsnittet var 20%, sämst var 57%
Jämfört med alla testade enheter
» 72% av alla testade enheter var bättre, 6% liknande, 22% sämre
» Den bästa hade ett delta på 4%, genomsnittet var 24%, sämst var 134%
| Av/Standby | |
| Låg belastning | |
| Hög belastning |
|
Förklaring:
min: | |
| HP EliteBook x360 830 G6 i7-8565U, UHD Graphics 620, WDC PC SN720 SDAPNTW-1T00, IPS LED, 1920x1080, 13.3" | HP EliteBook x360 1030 G3 45X96UT i7-8650U, UHD Graphics 620, Samsung SSD PM981 MZVLB512HAJQ, IPS, 1920x1080, 13.3" | Lenovo ThinkPad X390 Yoga-20NQS05R00 i7-8565U, UHD Graphics 620, Intel SSD Pro 7600p SSDPEKKF512G8L, IPS LED, 1920x1080, 13.3" | Dell Latitude 7400 2-in-1 i7-8665U, UHD Graphics 620, Toshiba XG6 KXG60ZNV512G, IPS, 1920x1080, 14" | |
|---|---|---|---|---|
| Power Consumption | 8% | 6% | 25% | |
| Idle Minimum * (Watt) | 4.4 | 3.4 23% | 3.46 21% | 2.6 41% |
| Idle Average * (Watt) | 8 | 7.6 5% | 5.88 26% | 4.3 46% |
| Idle Maximum * (Watt) | 10.6 | 11.5 -8% | 9.12 14% | 5.5 48% |
| Load Average * (Watt) | 34.6 | 35.4 -2% | 45.6 -32% | 32 8% |
| Load Maximum * (Watt) | 68.2 | 51.9 24% | 65.9 3% | 78.8 -16% |
* ... mindre är bättre
| HP EliteBook x360 830 G6 i7-8565U, UHD Graphics 620, 53 Wh | HP EliteBook x360 1030 G3 45X96UT i7-8650U, UHD Graphics 620, 56.2 Wh | Lenovo ThinkPad X390 Yoga-20NQS05R00 i7-8565U, UHD Graphics 620, 50 Wh | Dell Latitude 7400 2-in-1 i7-8665U, UHD Graphics 620, 78 Wh | Genomsnitt av klass Convertible | |
|---|---|---|---|---|---|
| Batteridrifttid | 0% | -20% | 24% | 13% | |
| H.264 (h) | 10.7 | 10 -7% | 15.3 ? 43% | ||
| WiFi v1.3 (h) | 9.8 | 9.8 0% | 8.2 -16% | 12.2 24% | 12.1 ? 23% |
| Load (h) | 2.4 | 1.5 -37% | 1.779 ? -26% |
För
Emot

Läs den fullständiga versionen av den här recensionen på engelska här.
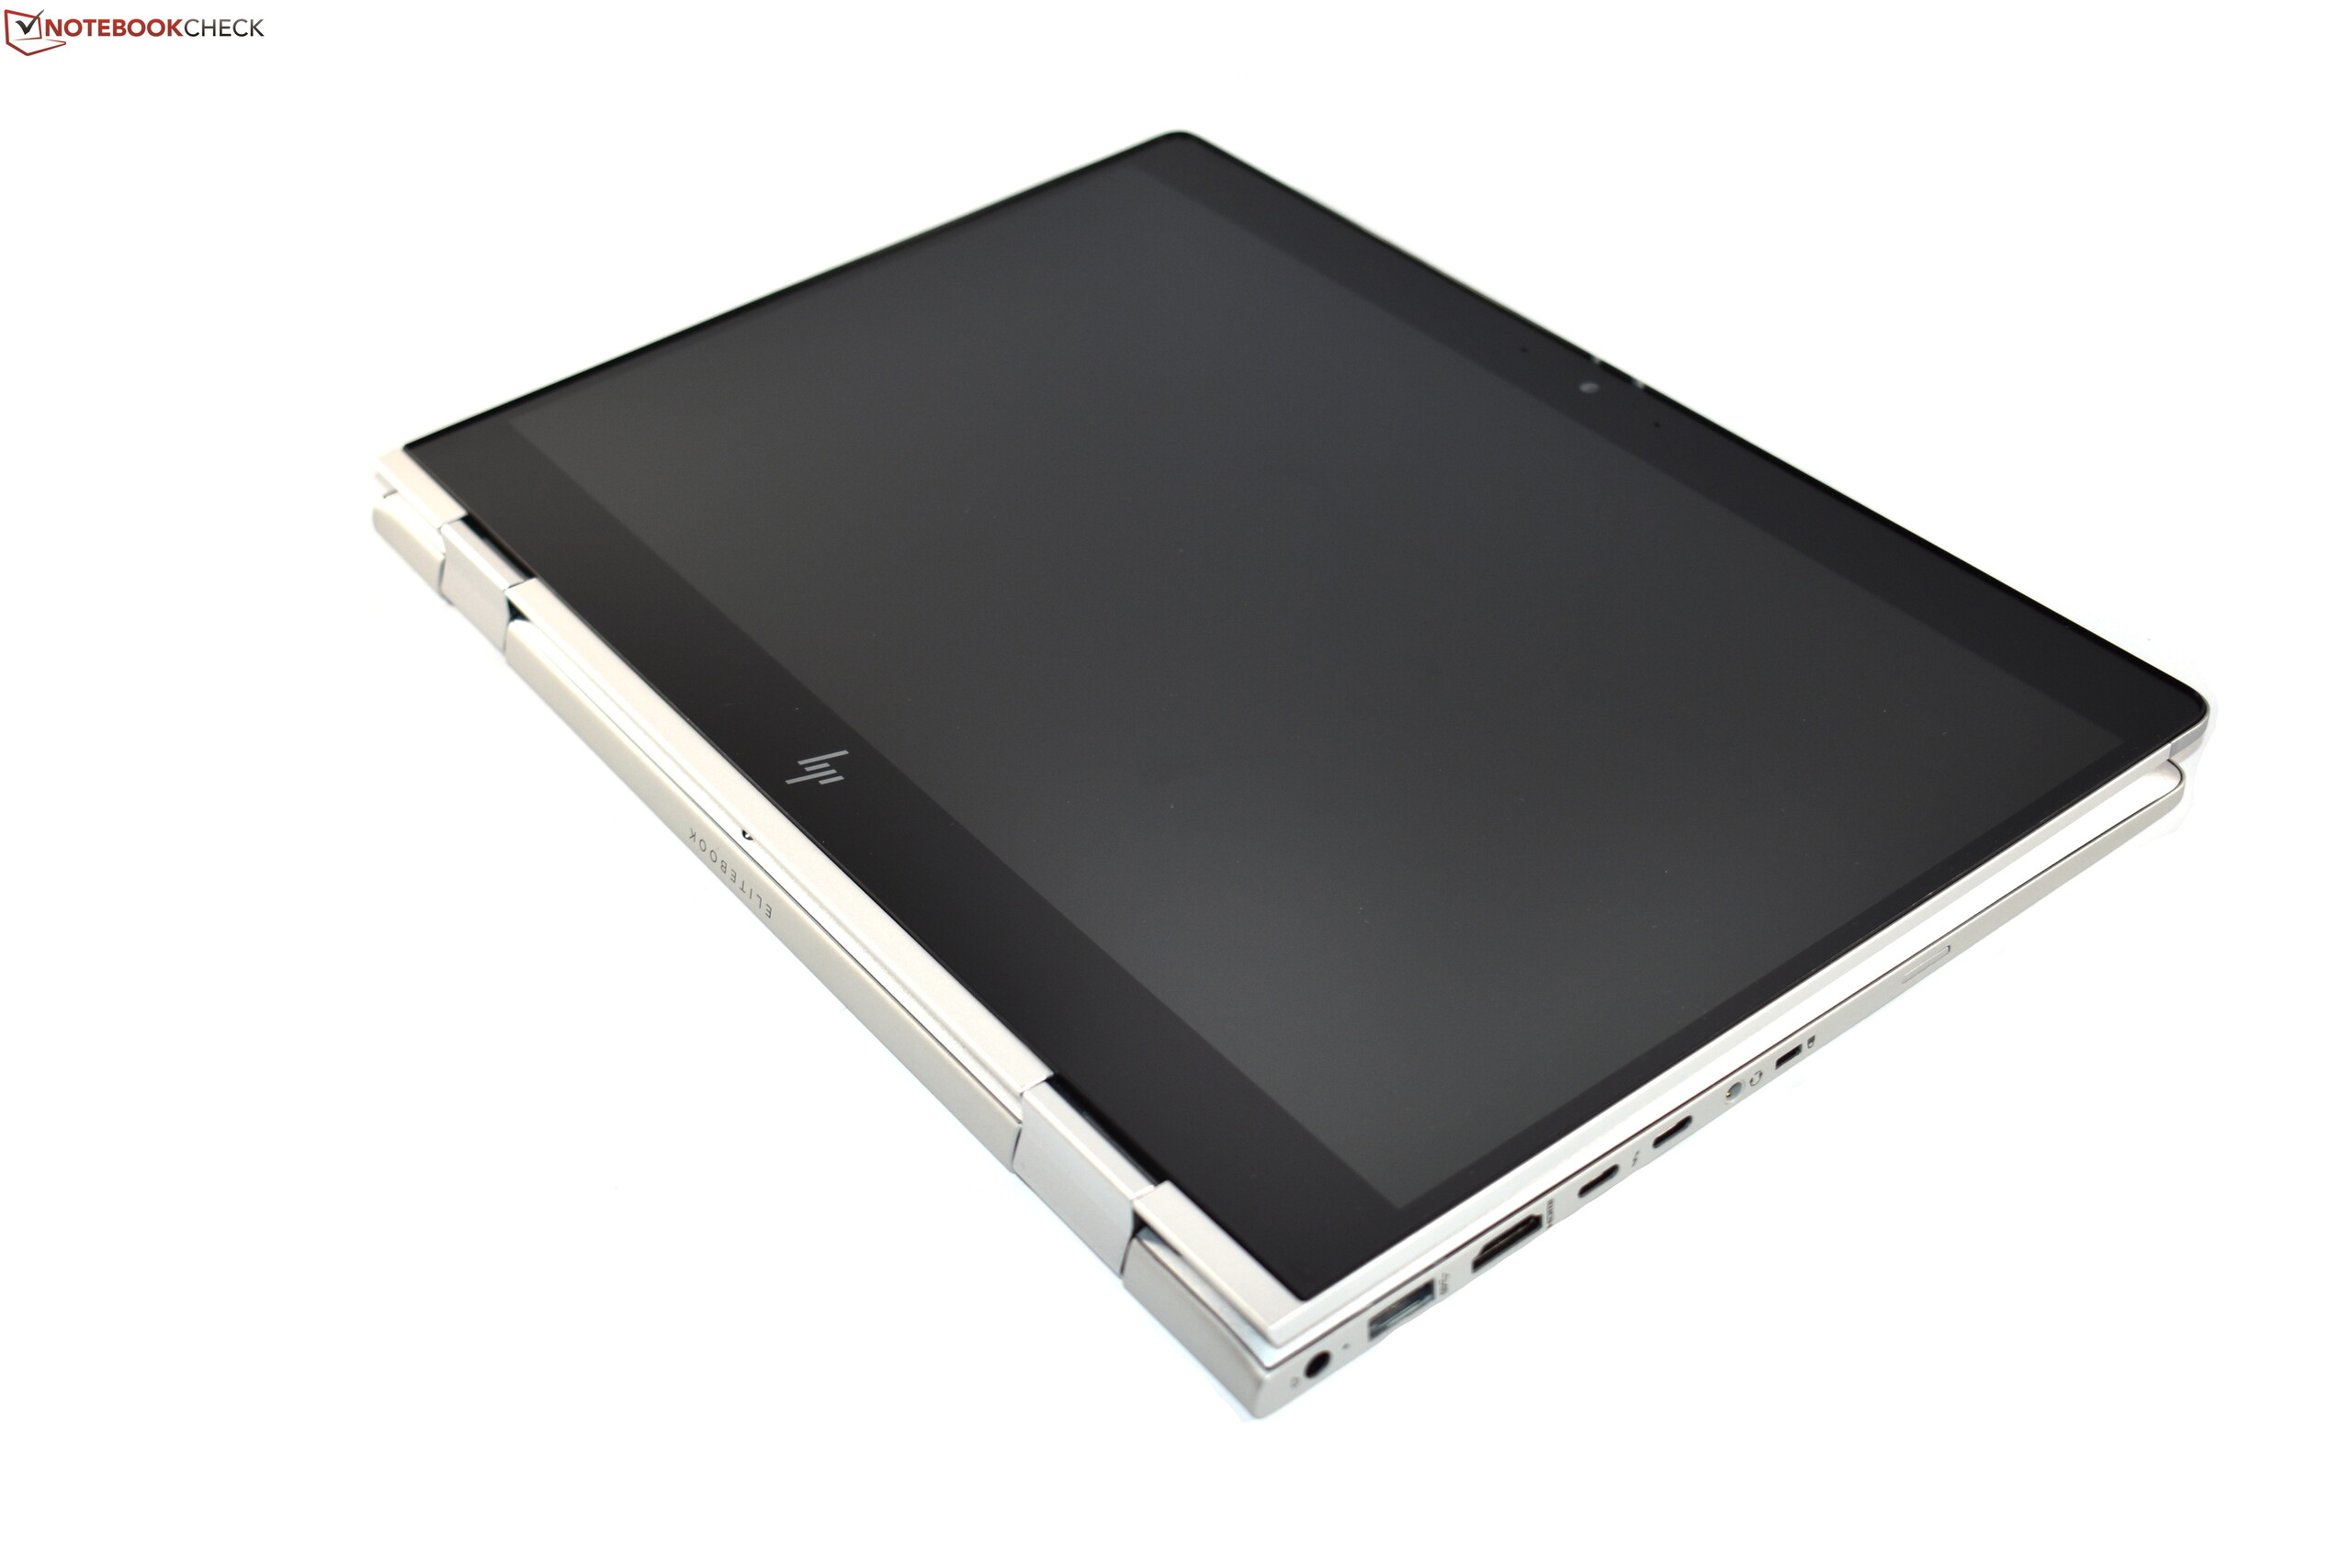
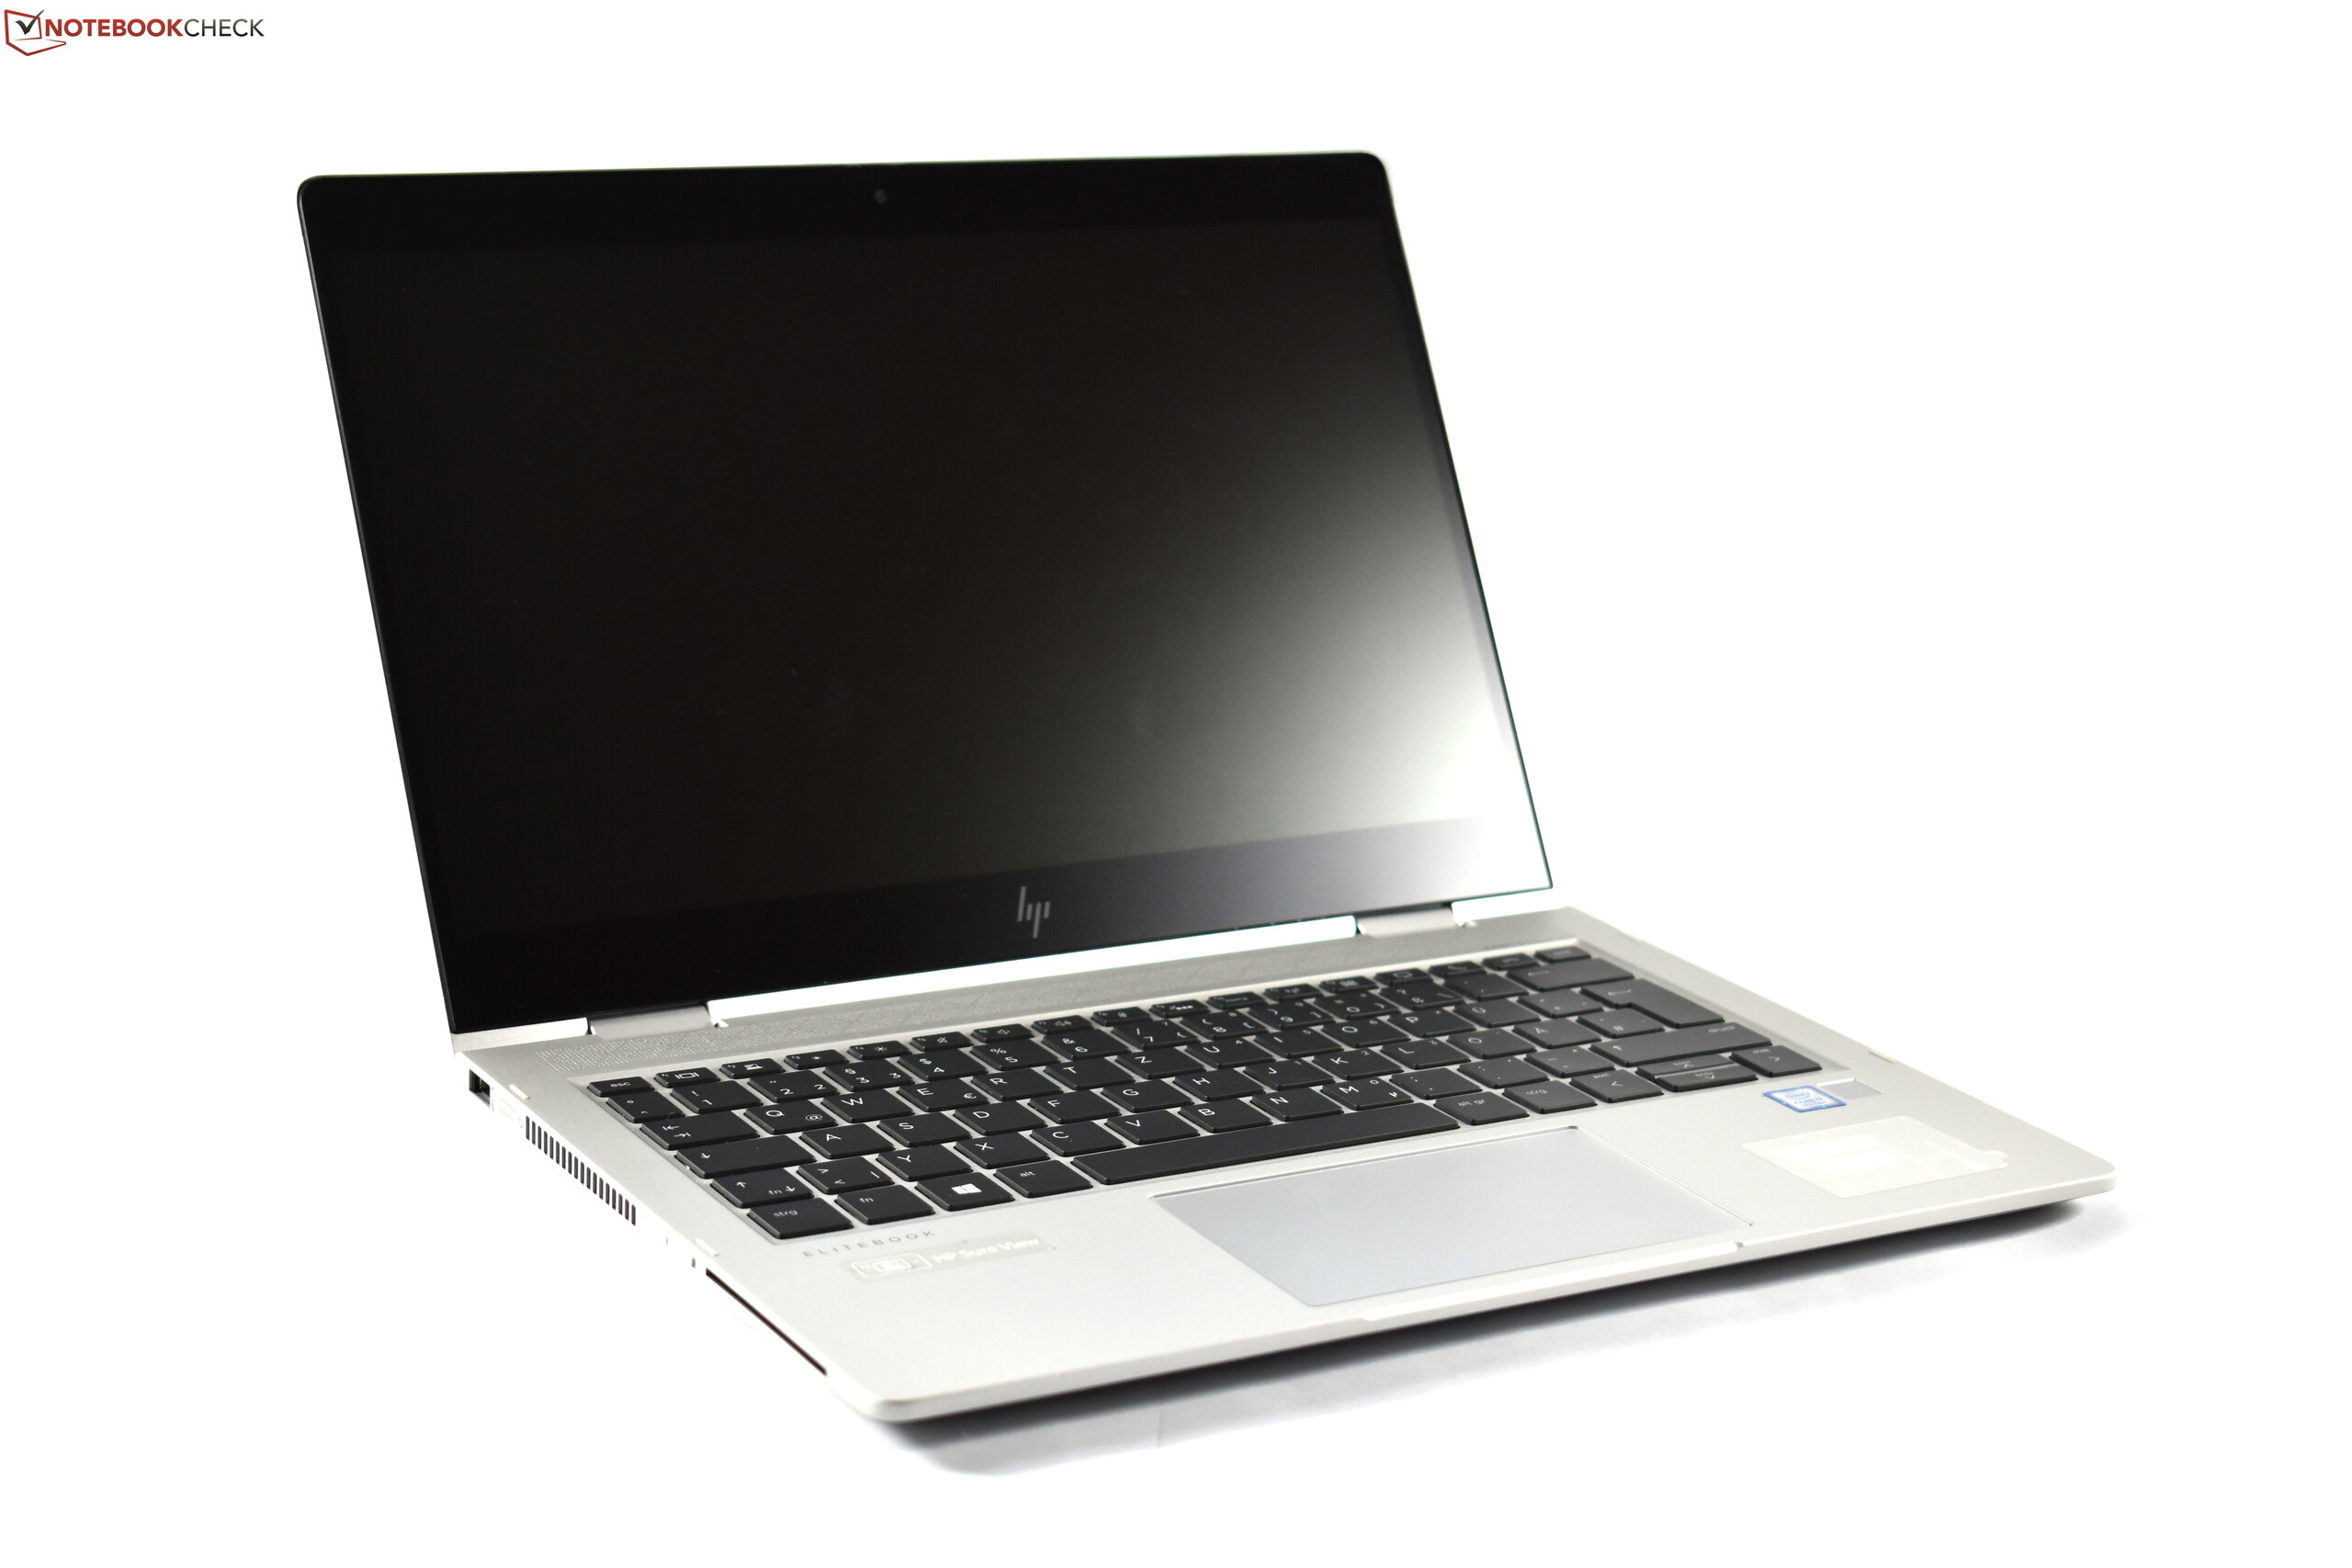
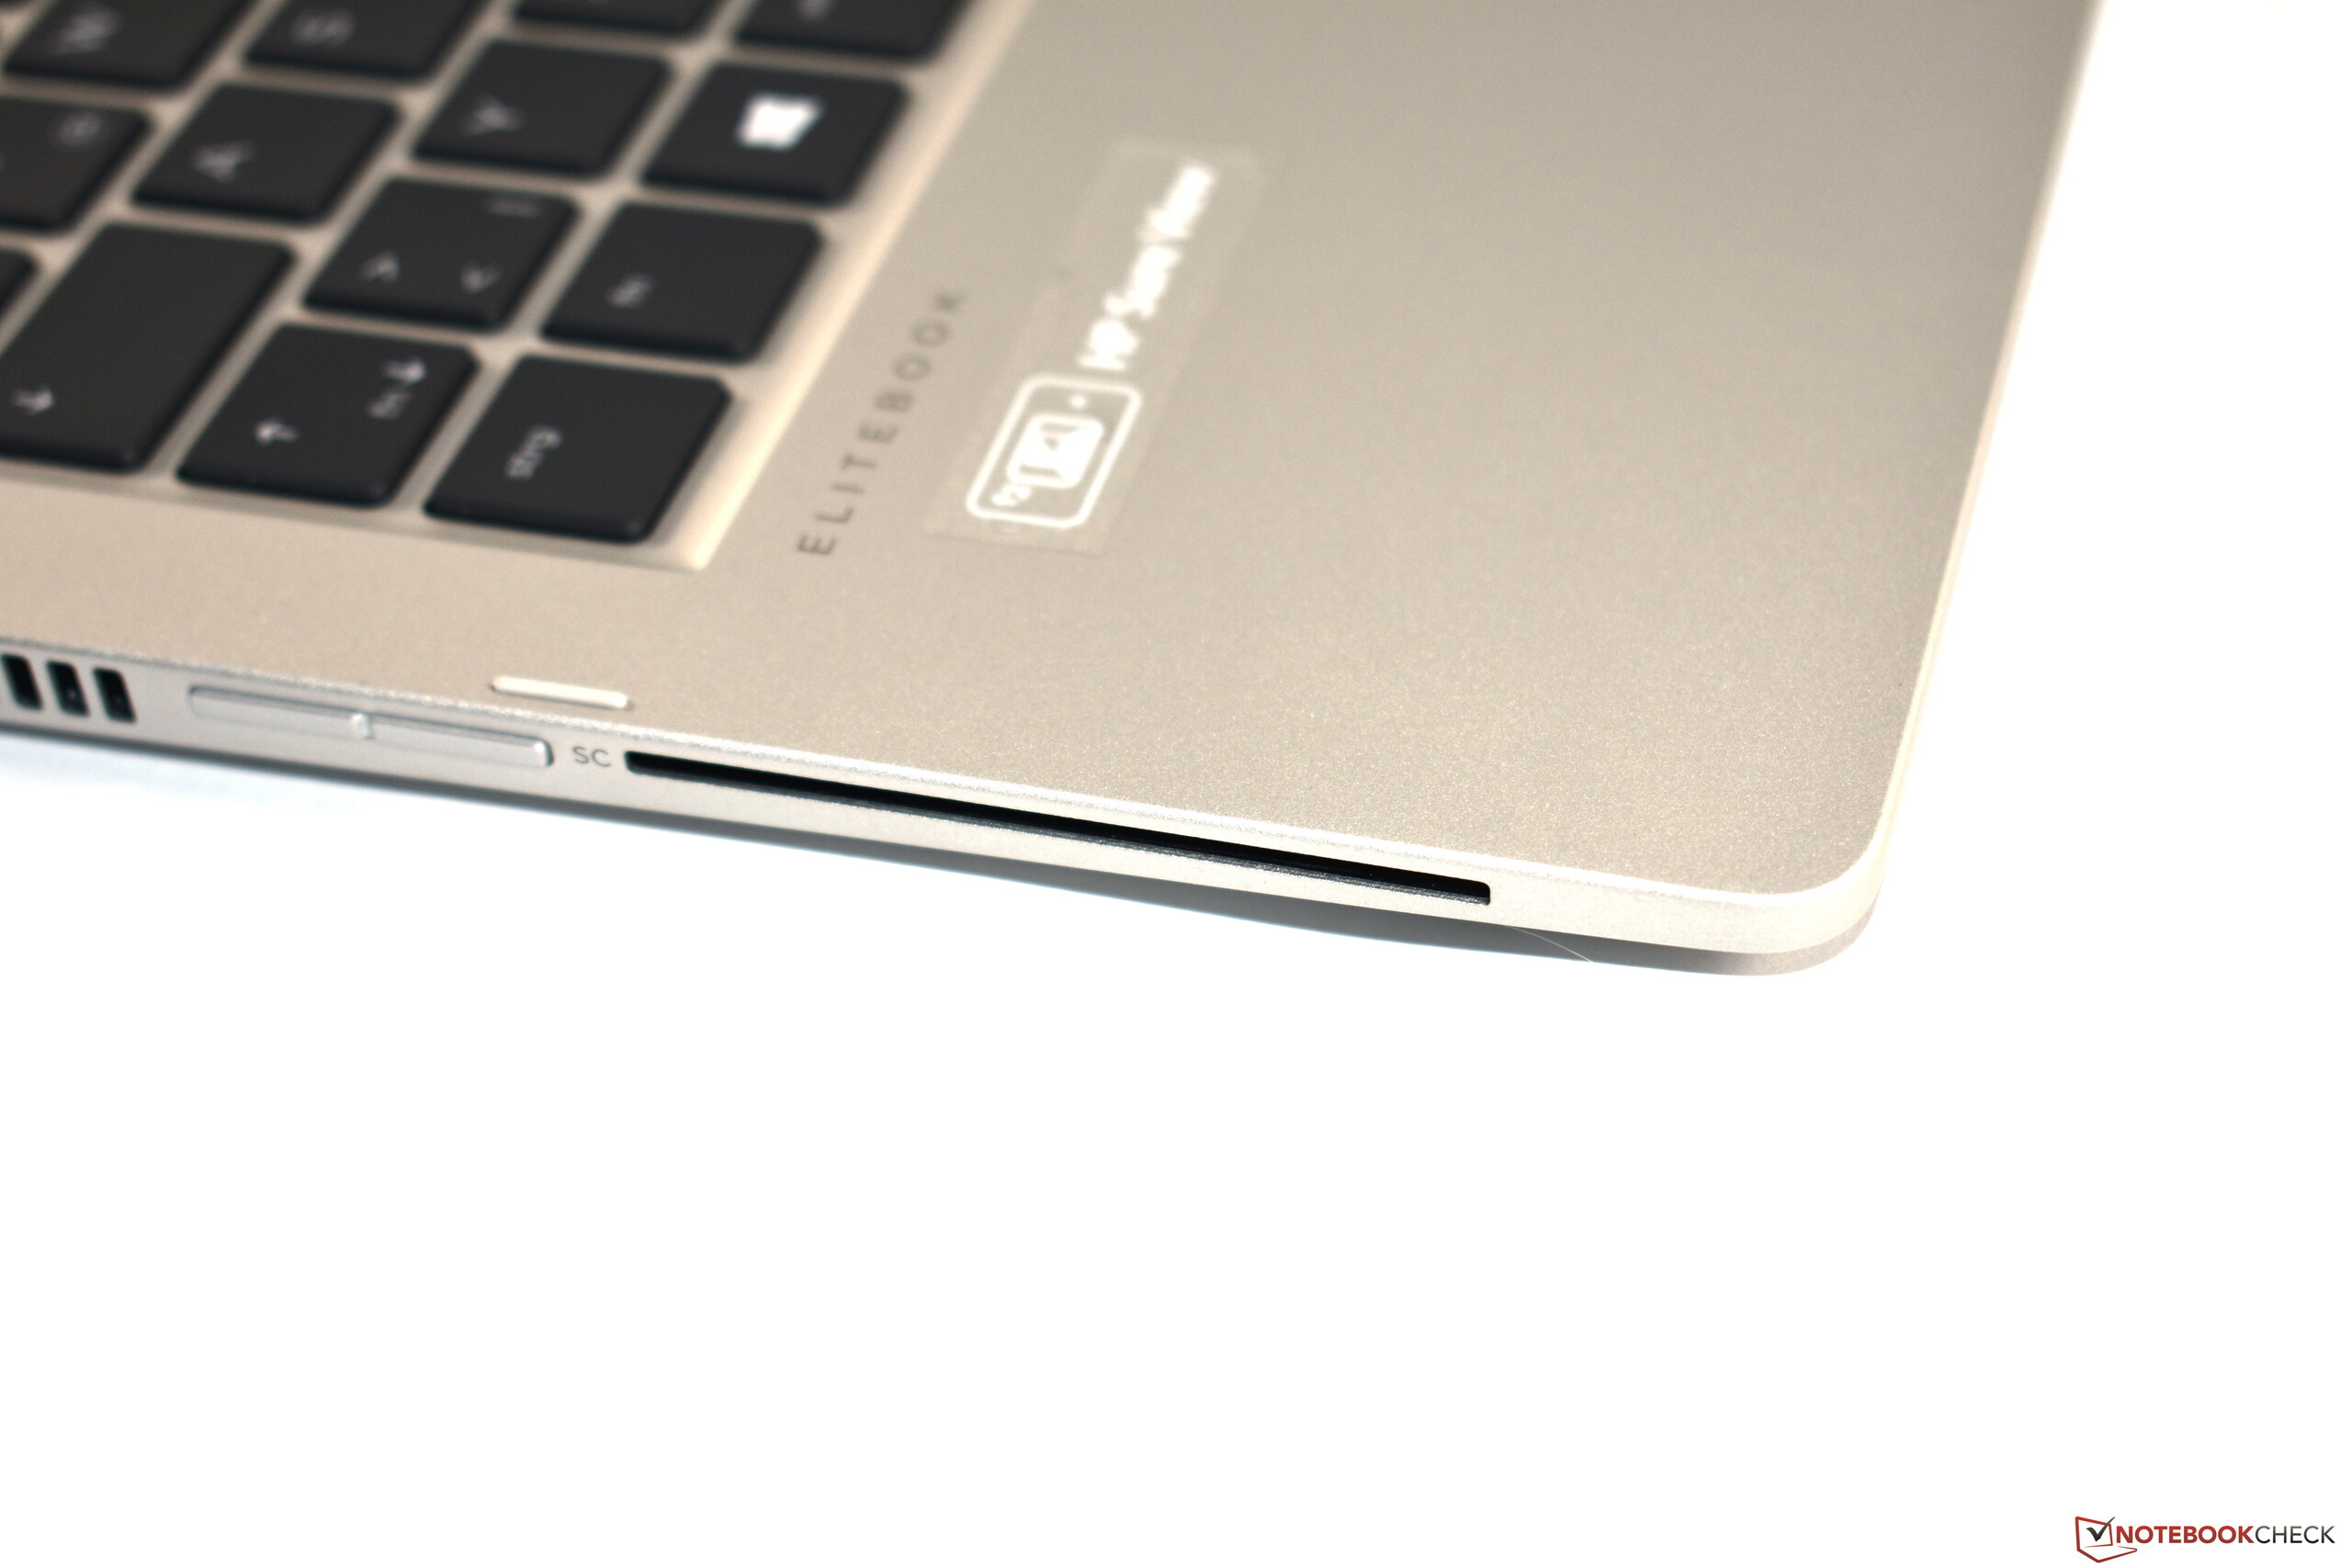
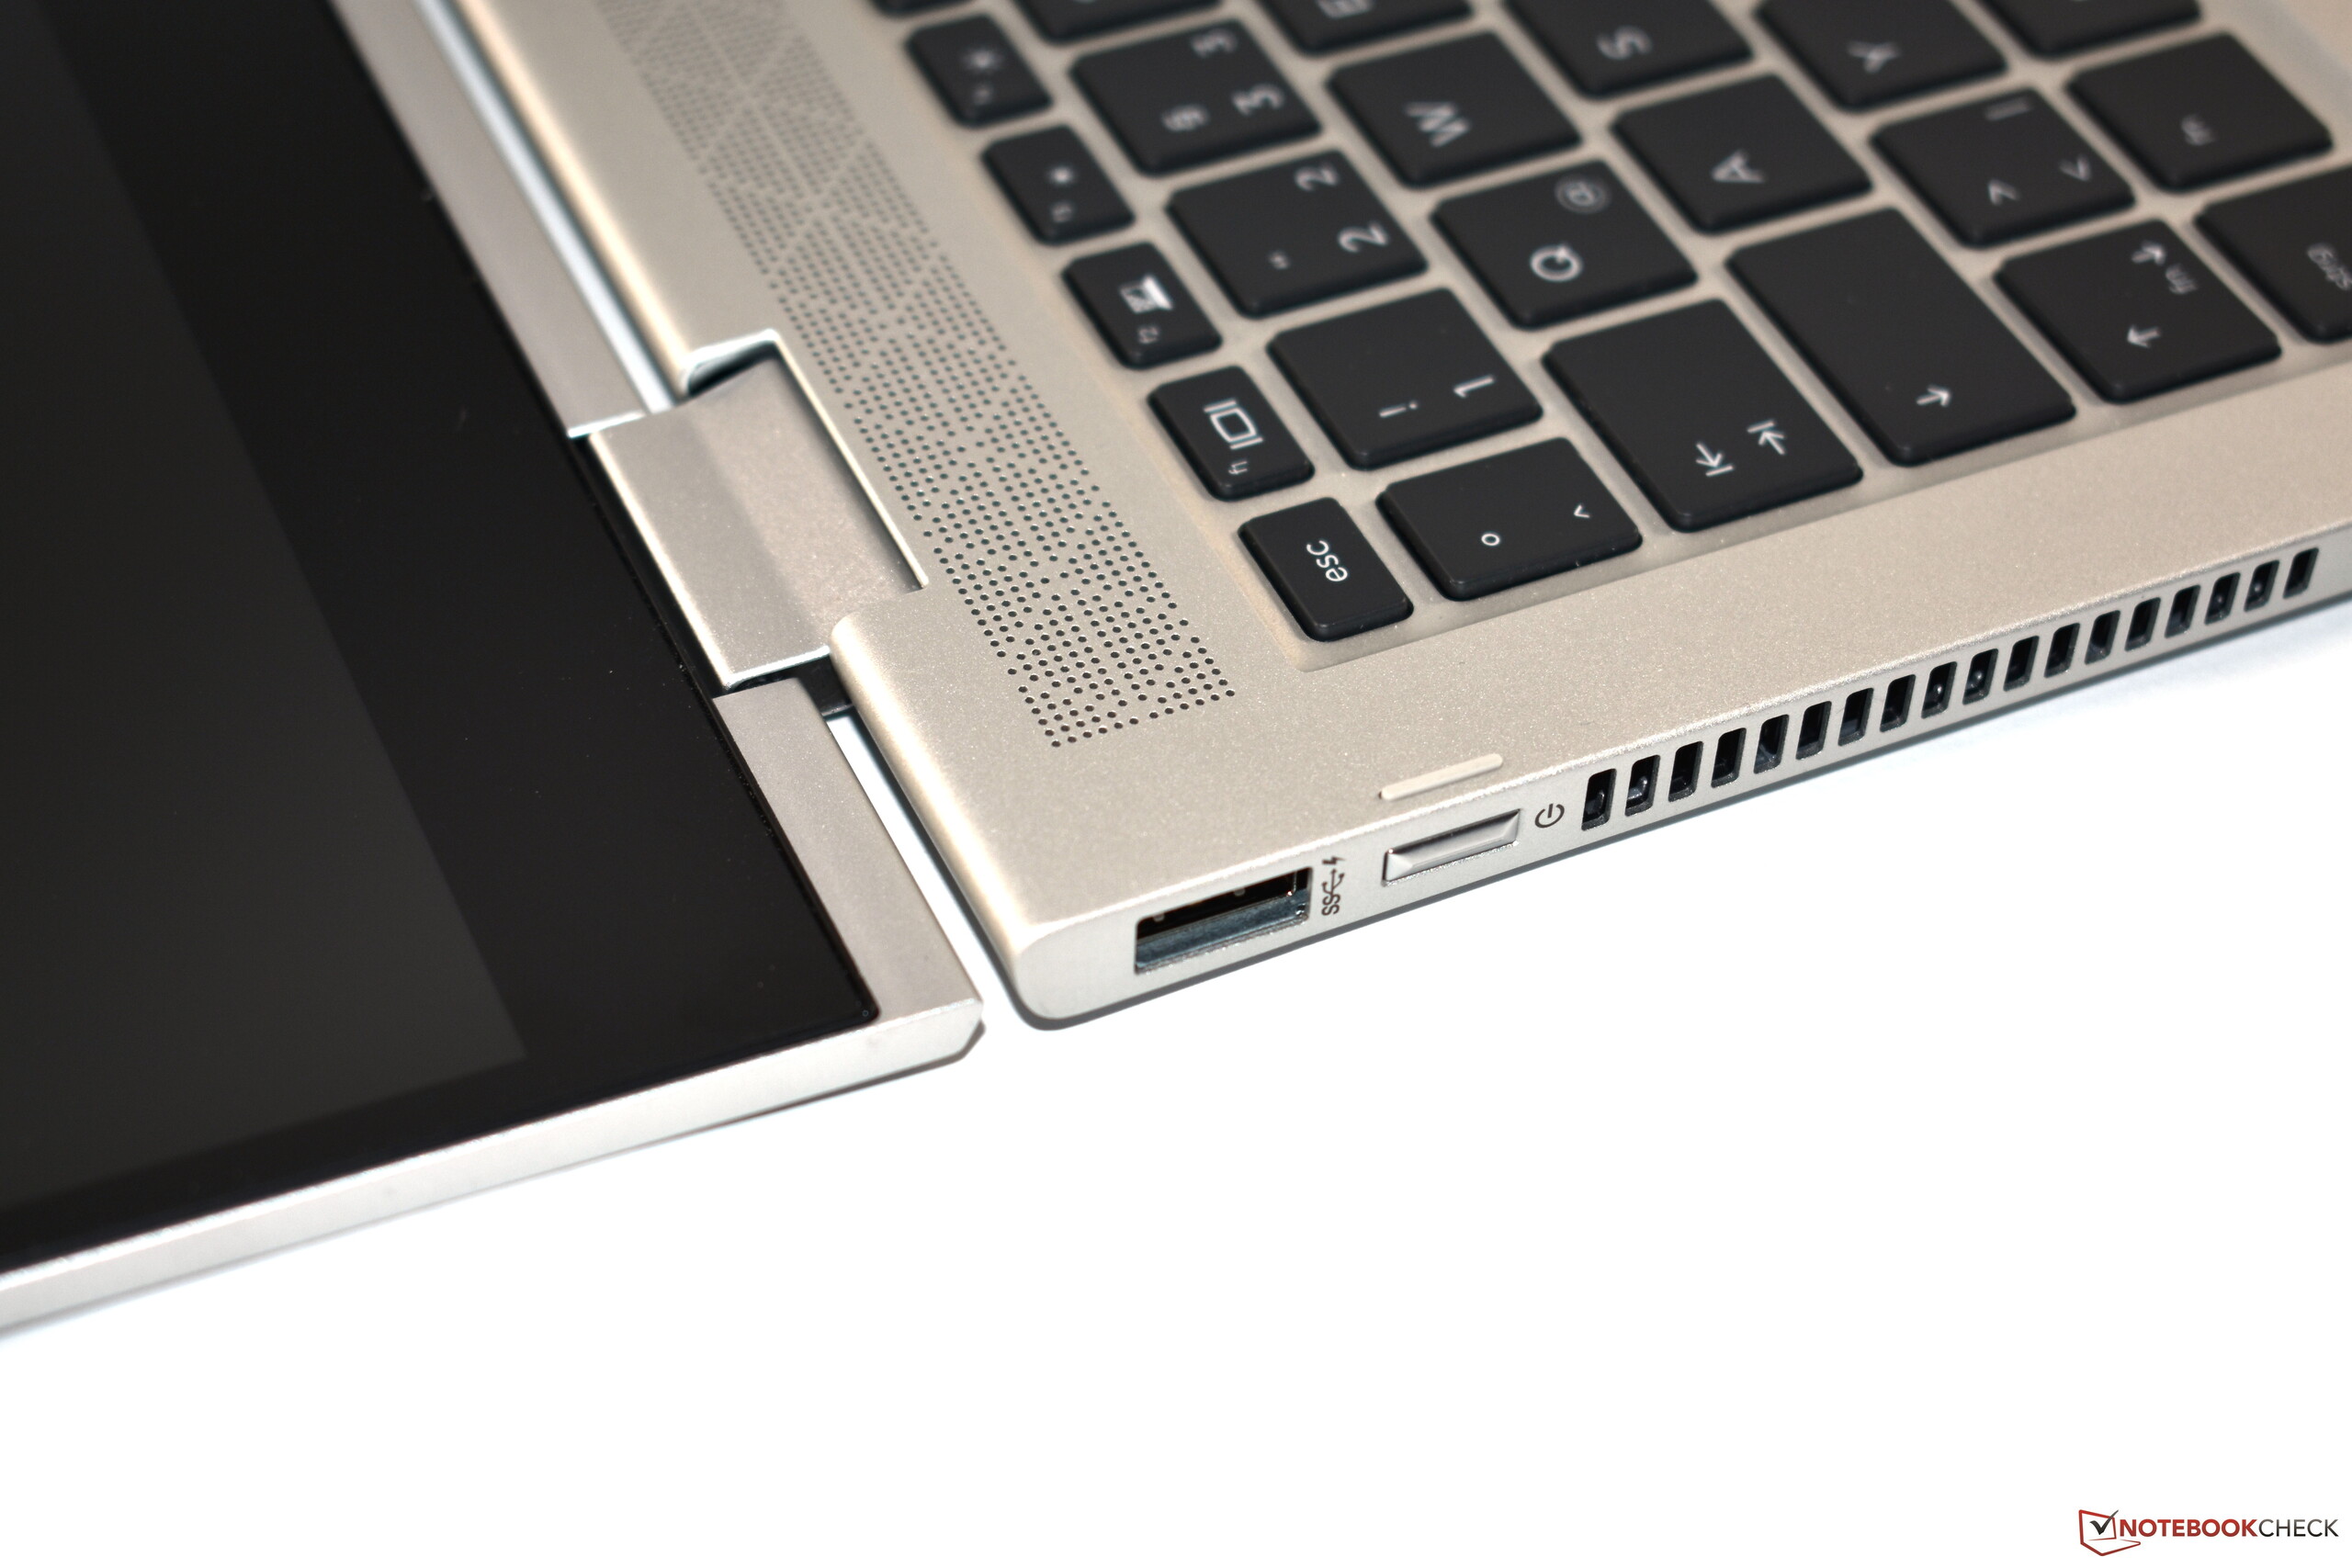
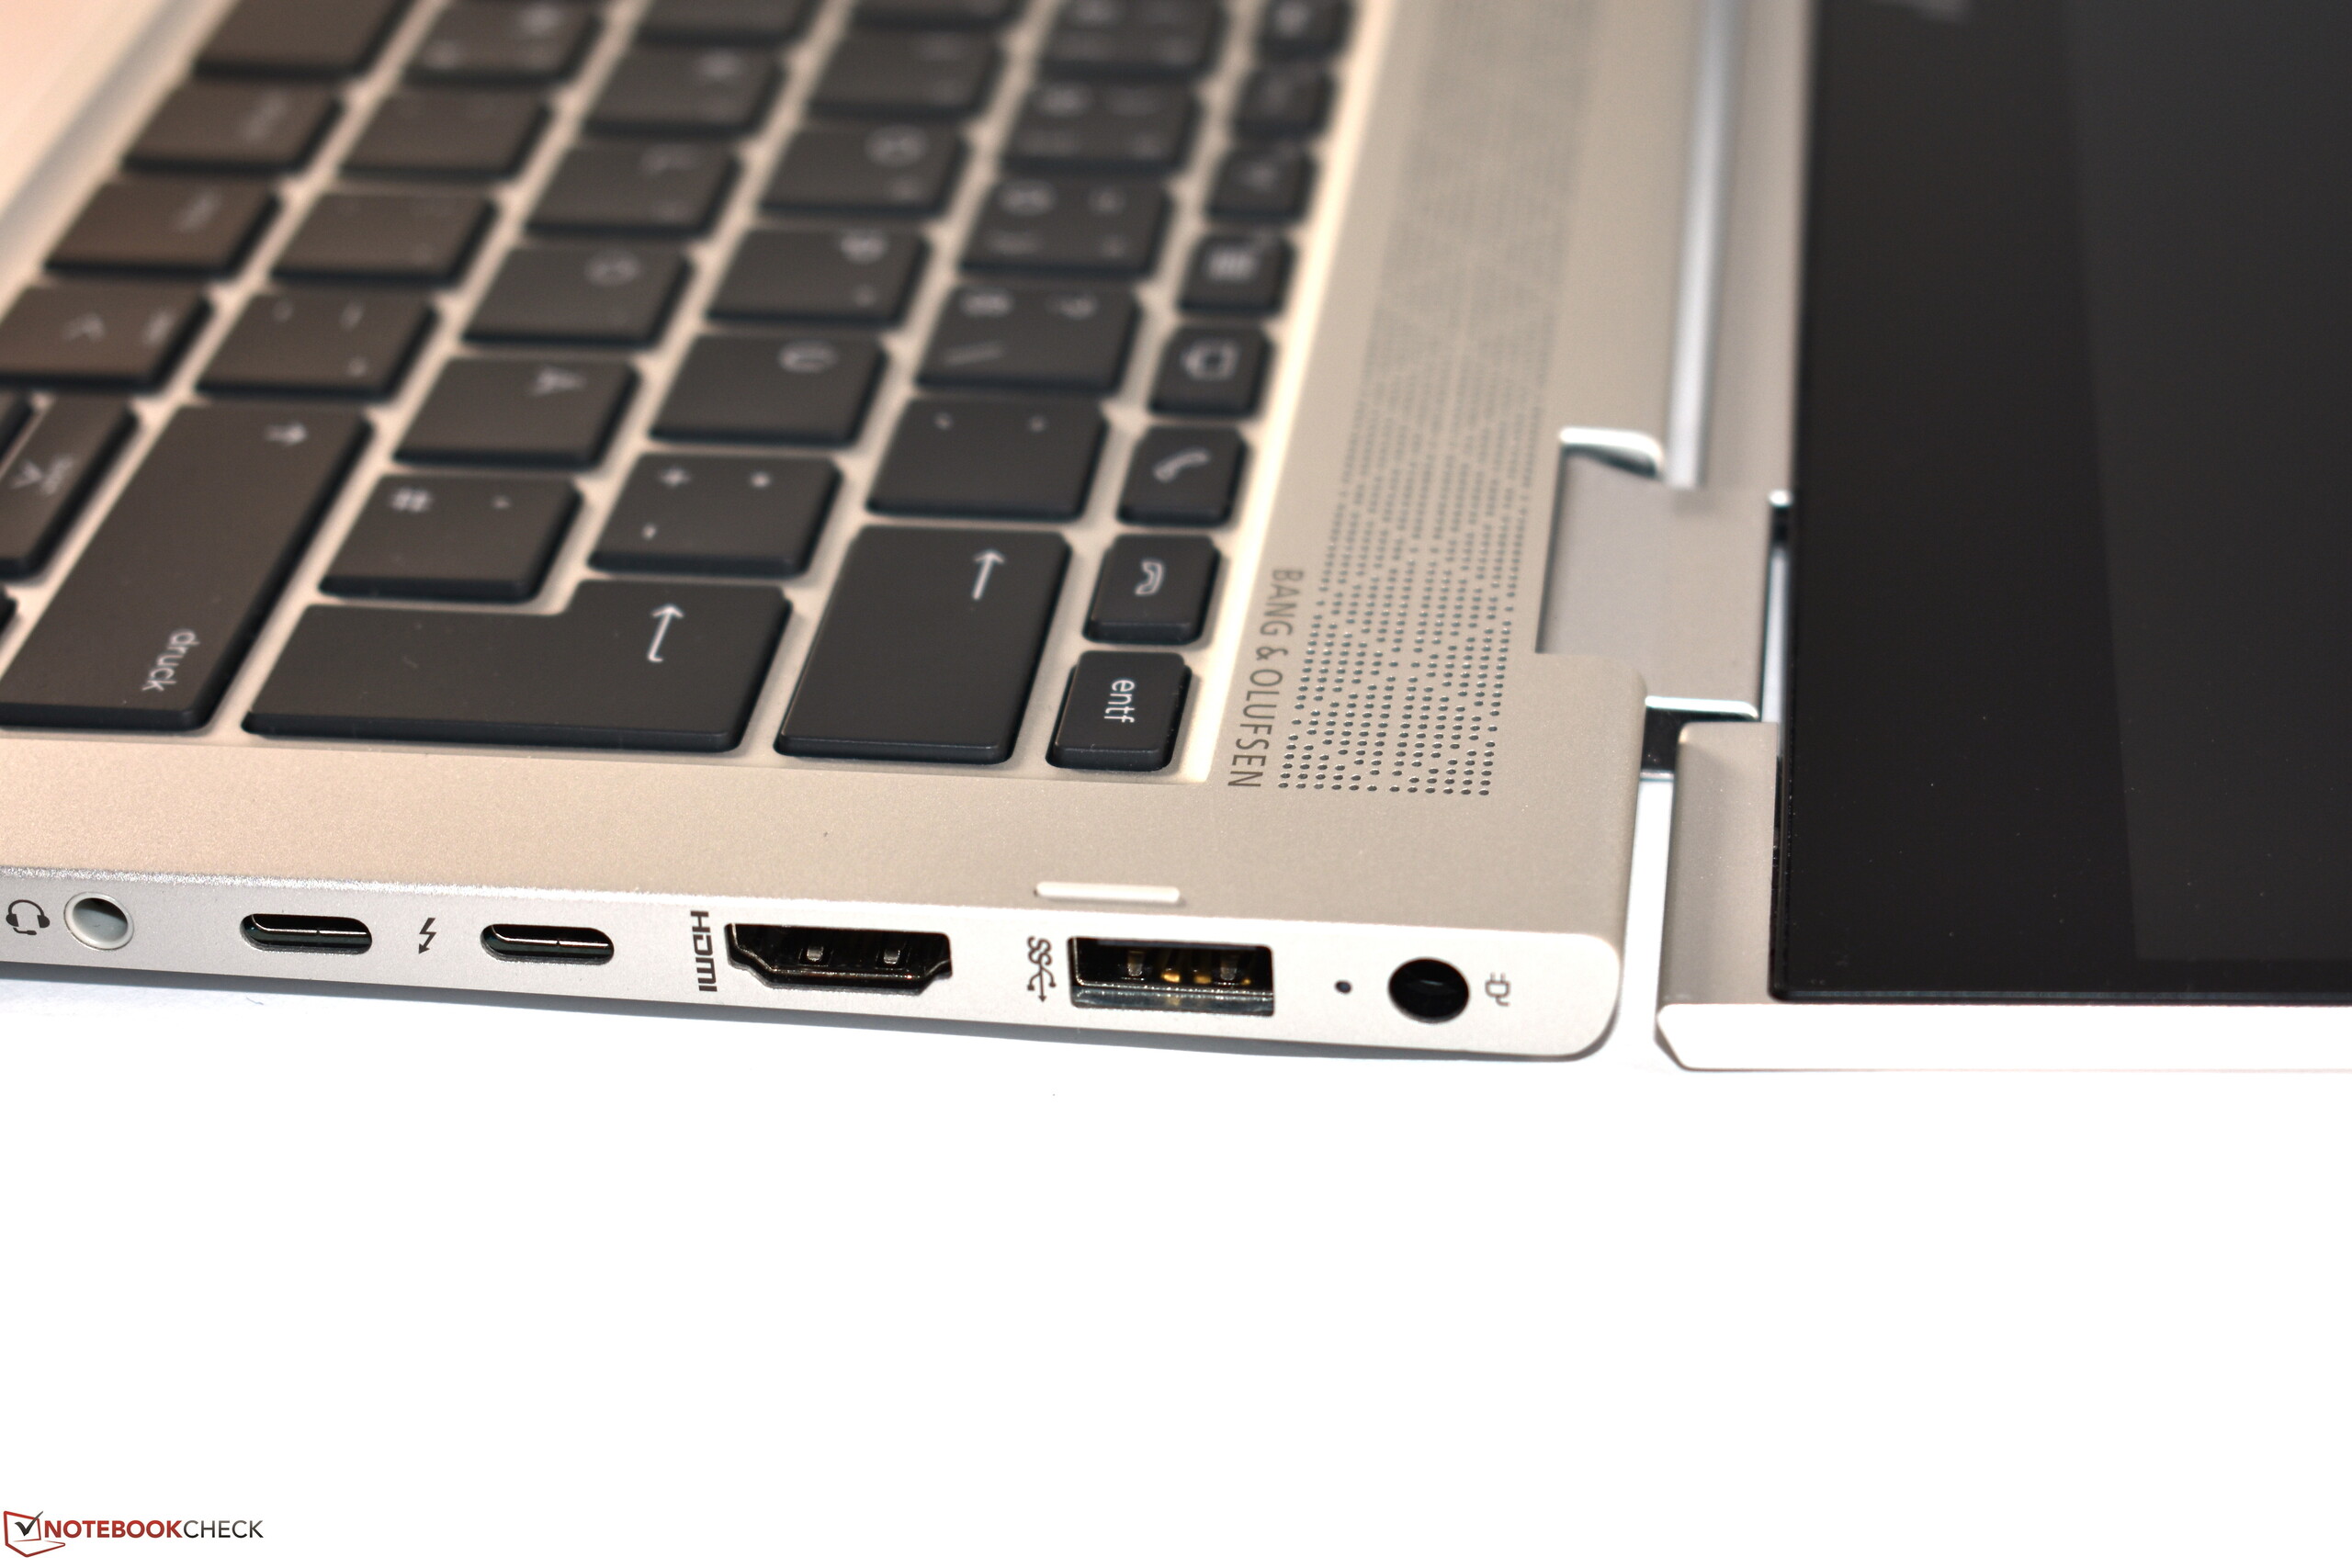
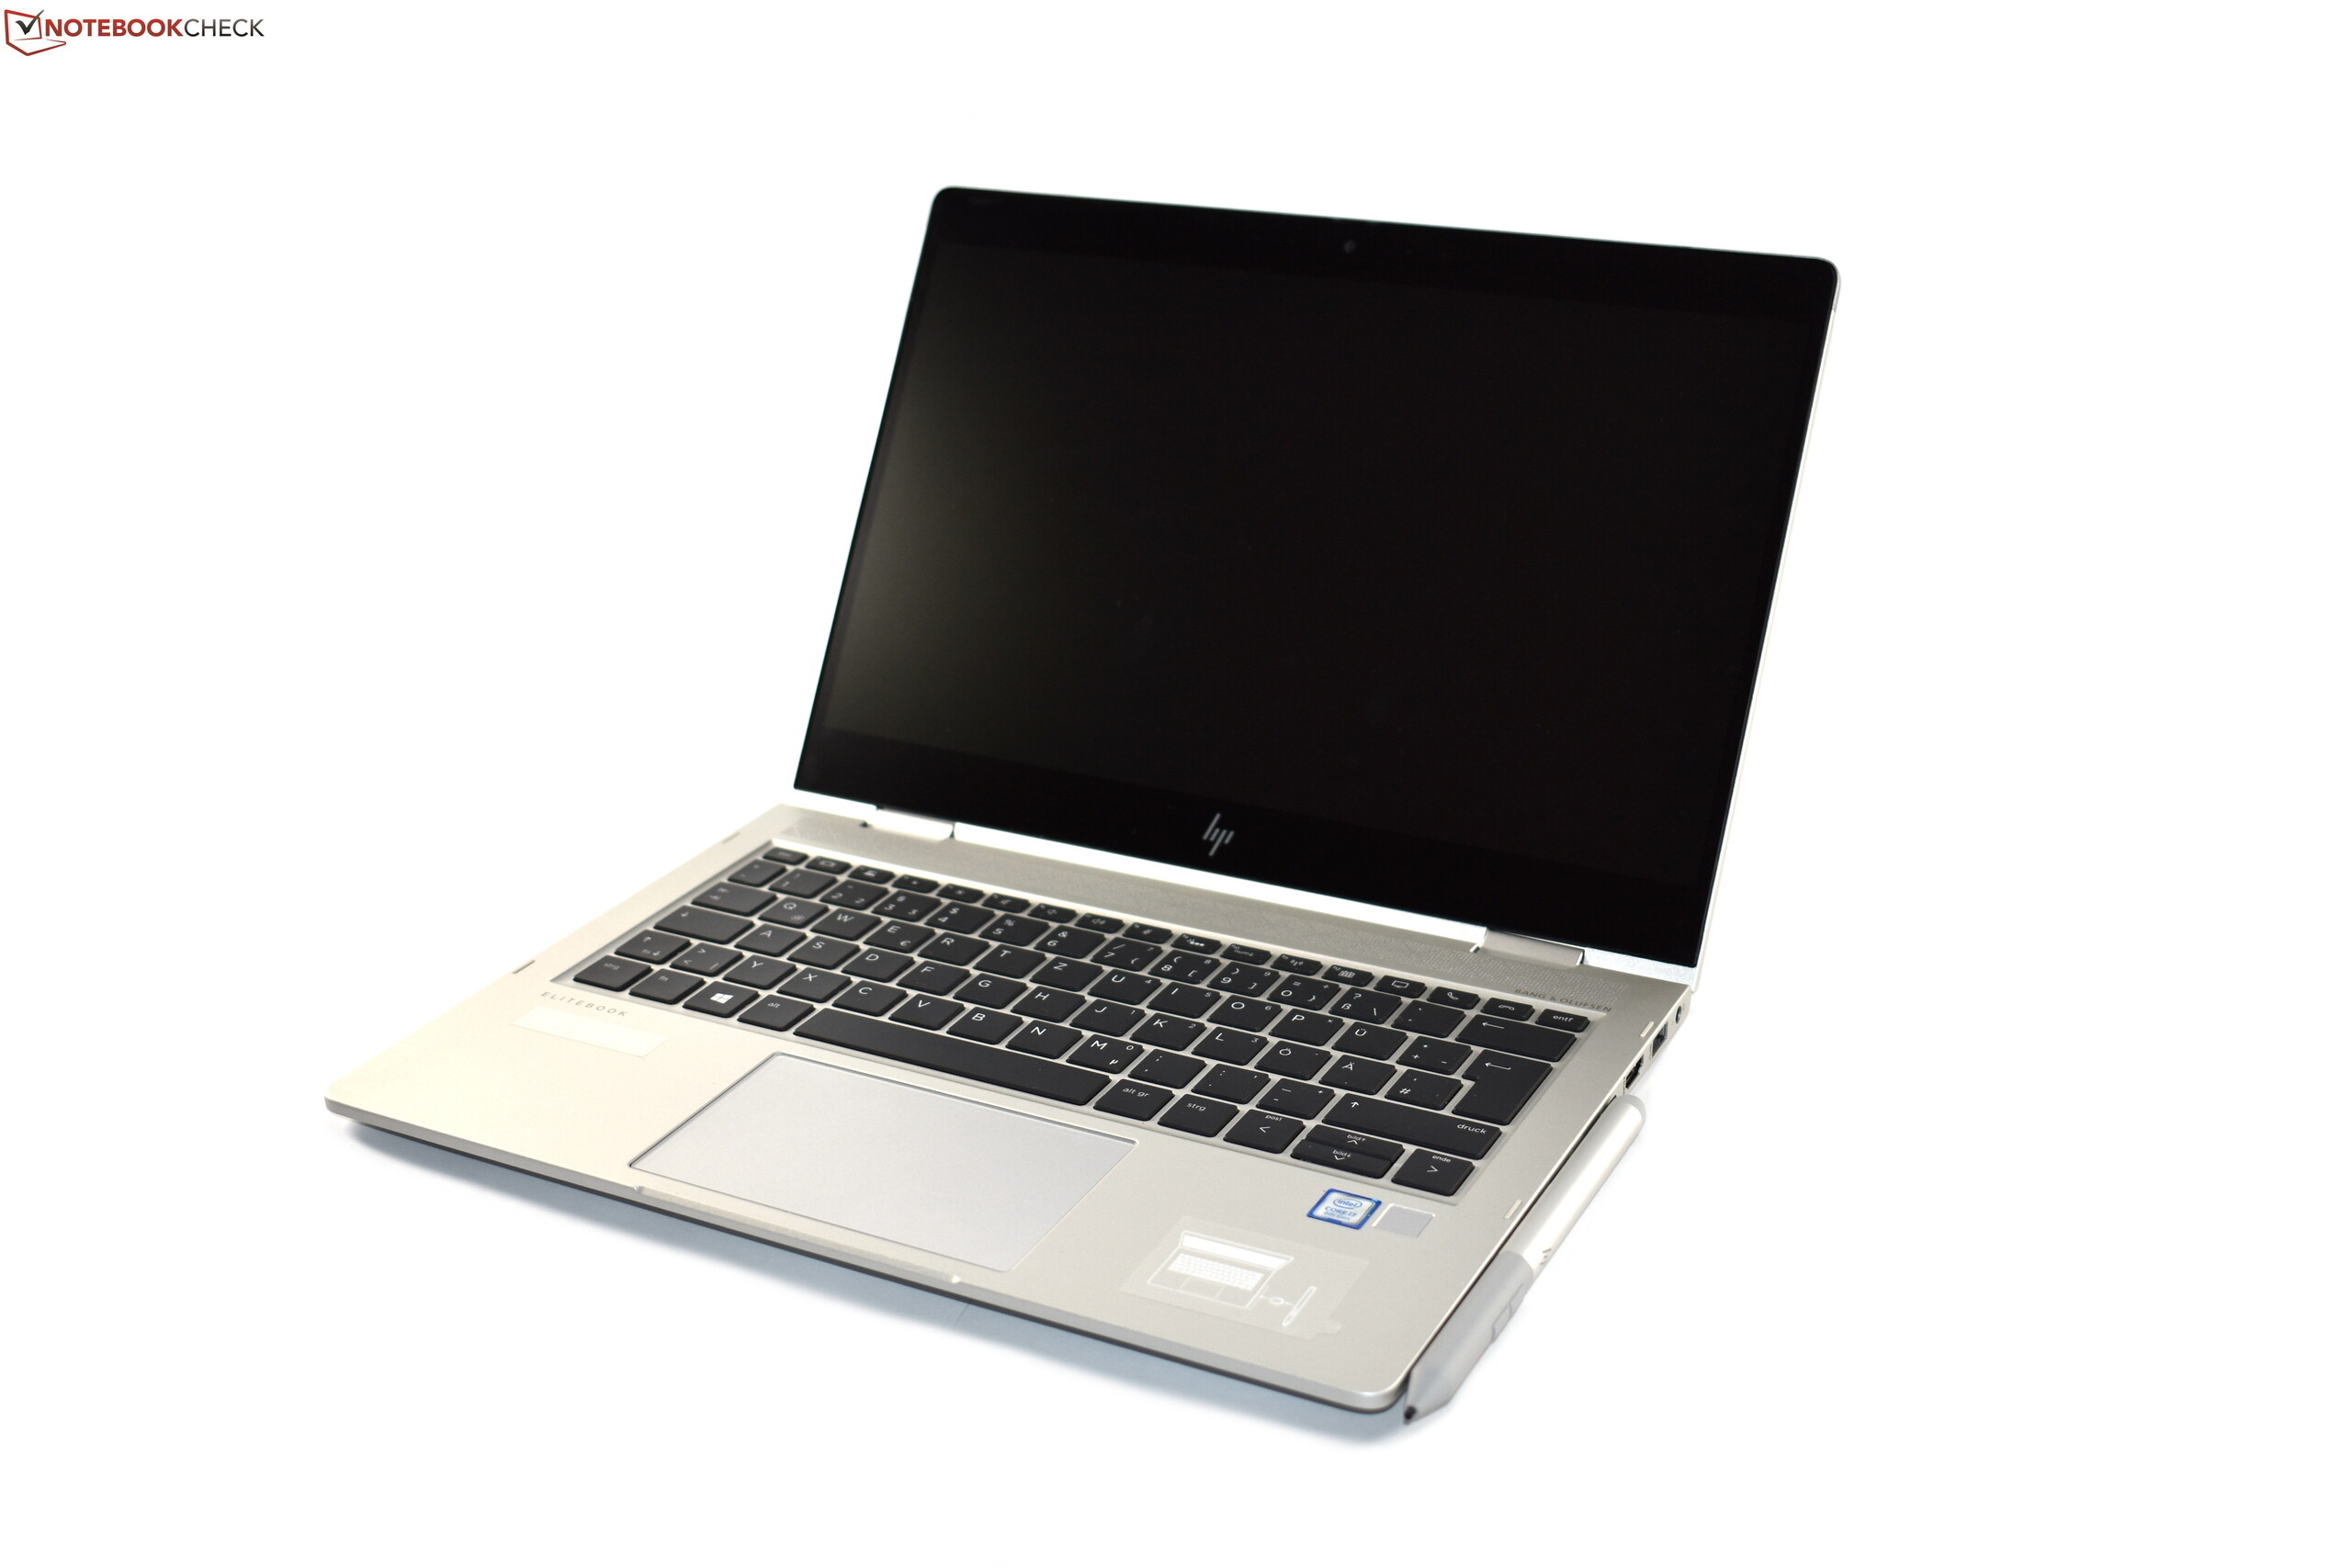
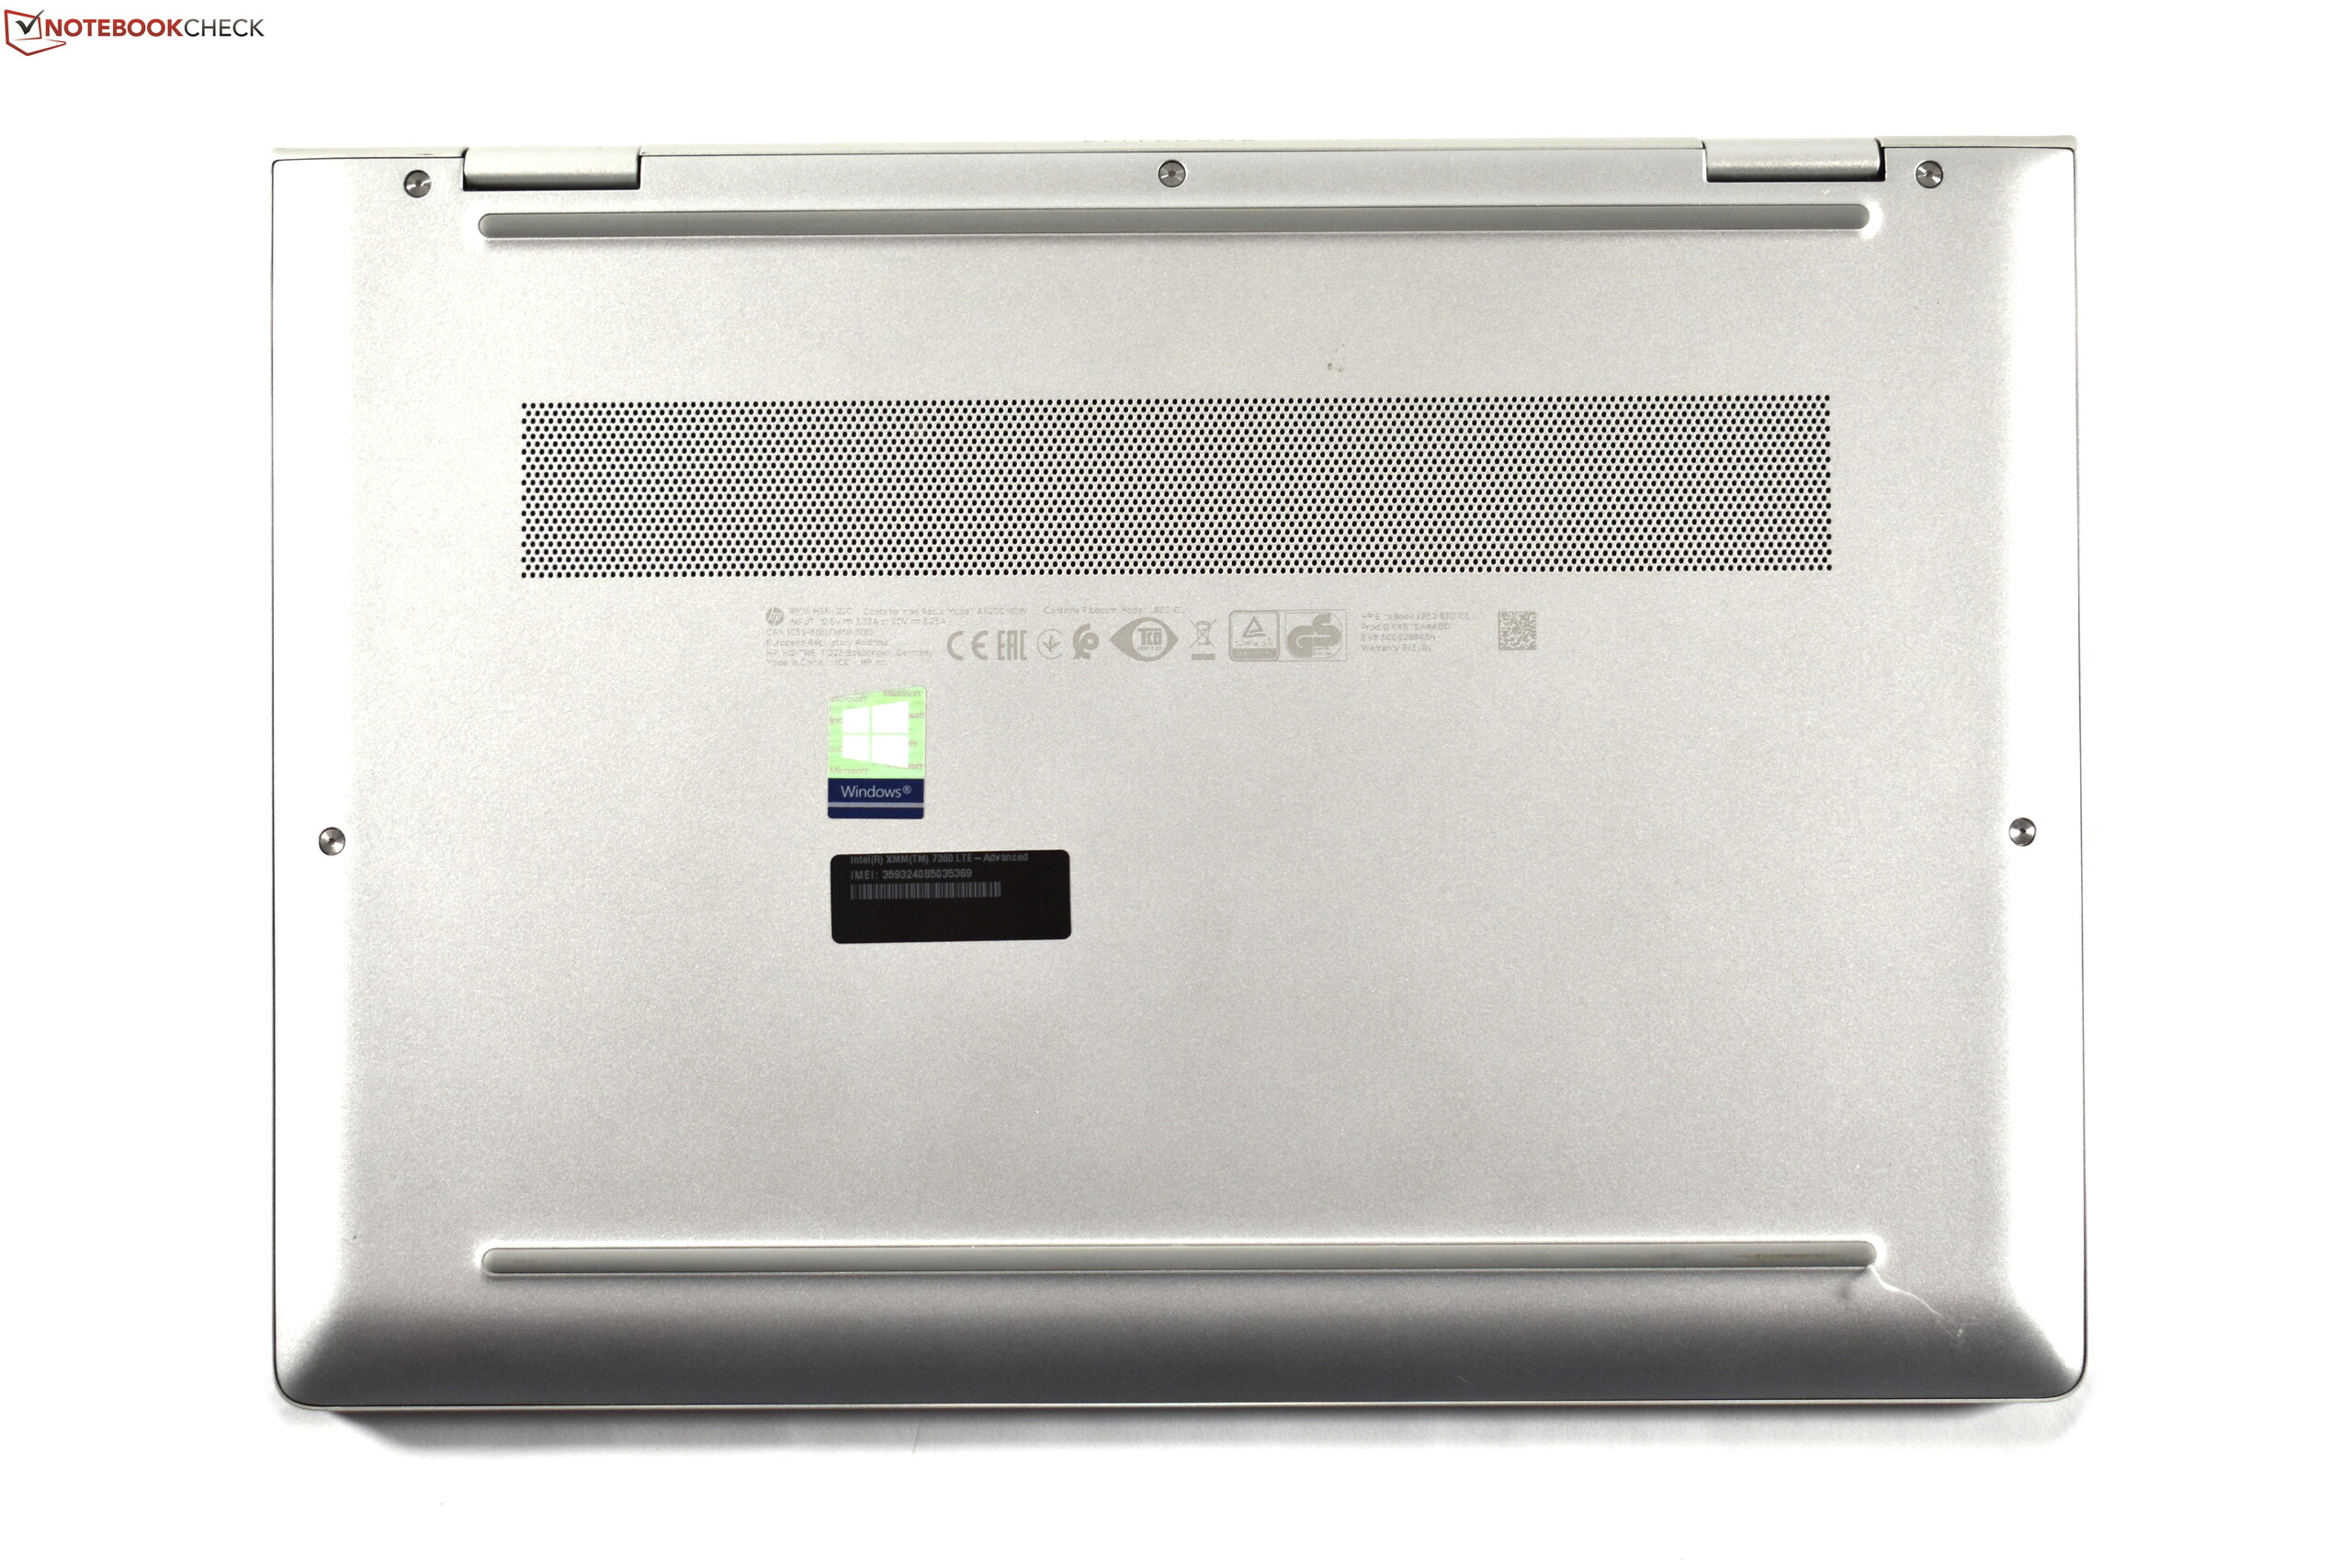
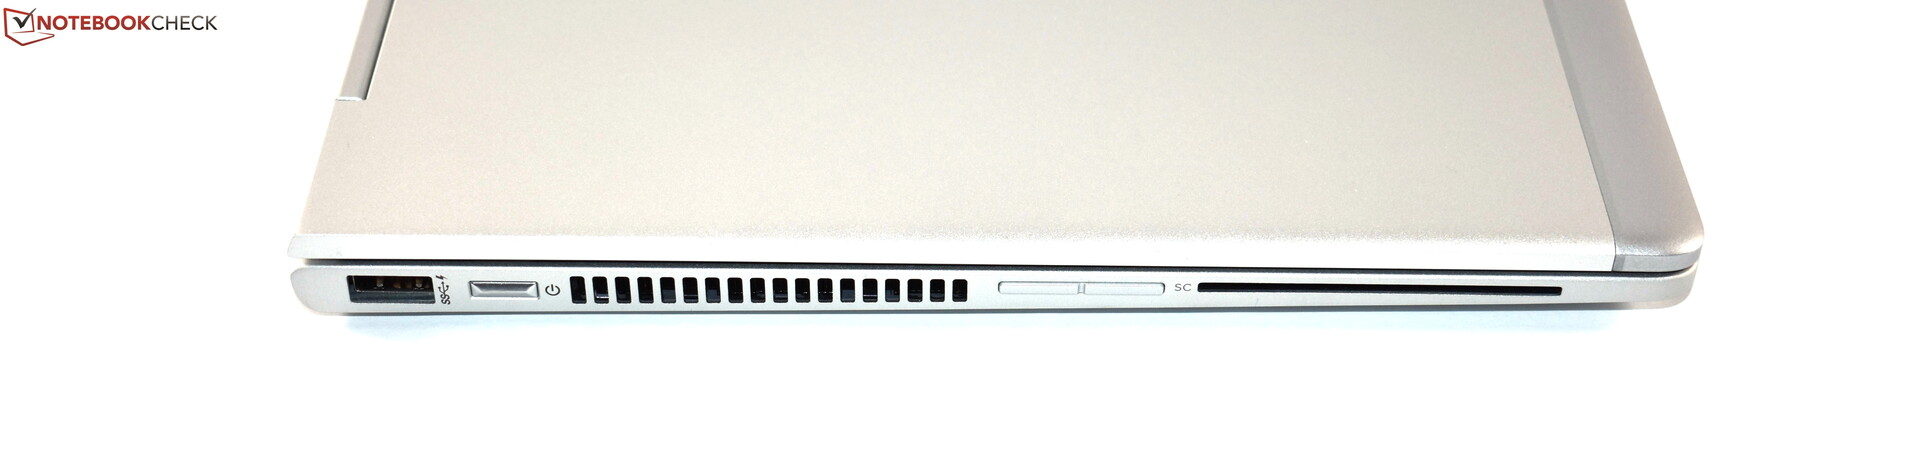
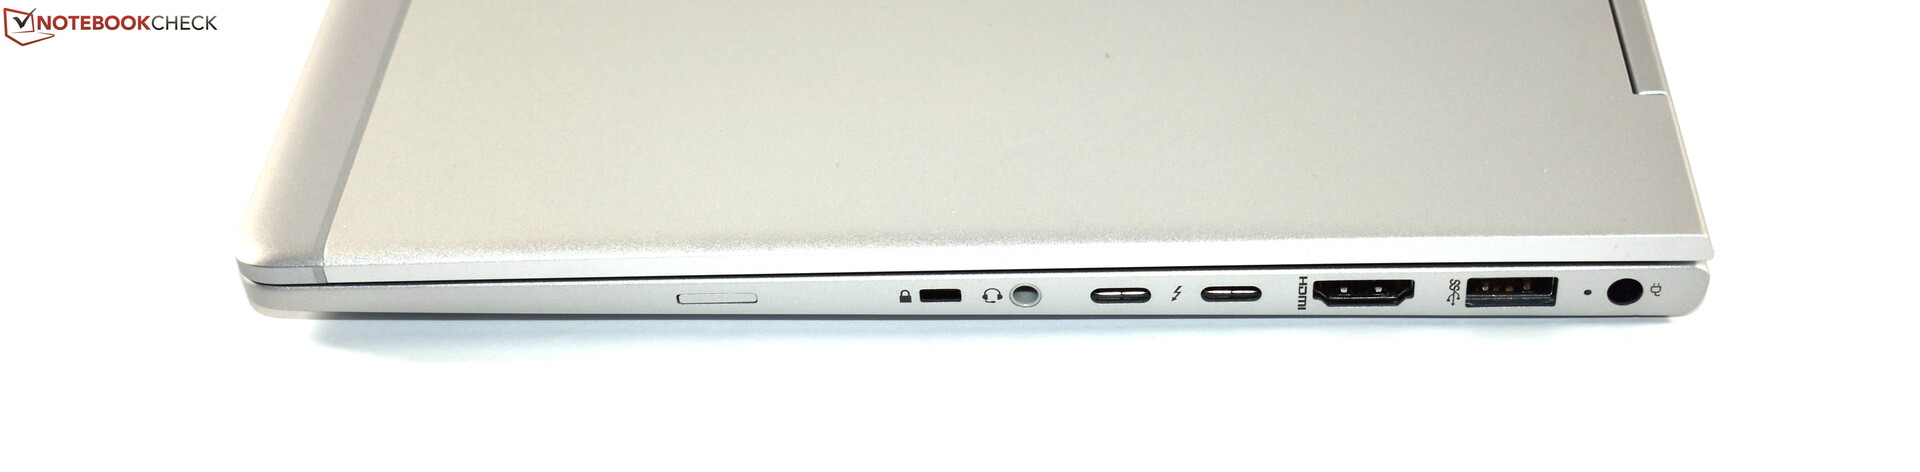
Med EliteBook x360 830 G6 har HP skapat en fantastisk omvandlingsbar för företagskunder. Den viktigaste egenskapen är förstås den extremt ljusstarka, matta och tryckkänsliga SureView-skärmen, som förvisso inte når upp till utlovade 1000 cd/m² men som ändå är extremt ljusstark på 700 cd/m². Även frånsett skärmen så gör HP knappt några misstag alls: Aluminiumhöljet är riktigt robust och välgjort, inmatningsenheterna är bekväma, EliteBook 830 har en stort utbud av portar och säkerhetsfunktioner och har dessutom skapliga uppgraderingsmöjligheter med sina två RAM-platser. Högtalarna är jämförelsevis bra, HP:s laptop blir inte varm och batteritiden är utmärkt. Notera också den långa garantitiden.
Helt felfri är dock inte HP EliteBook x360 830 G6. Processorn presterar till exempel sämre jämfört med dess konkurrenter. Vi får också klaga på spoltjutet. HP EliteBook saknar dessutom en (micro)SD-kortläsare och en TrackPoint. Konstigt nog blockerar pennan USB C-portarna när den är monterad på chassit. Till sist kunde skärmen haft stabilare betraktningsvinklar när SureView är avstängt. Minskningen i ljusstyrka är väldigt påtaglig.
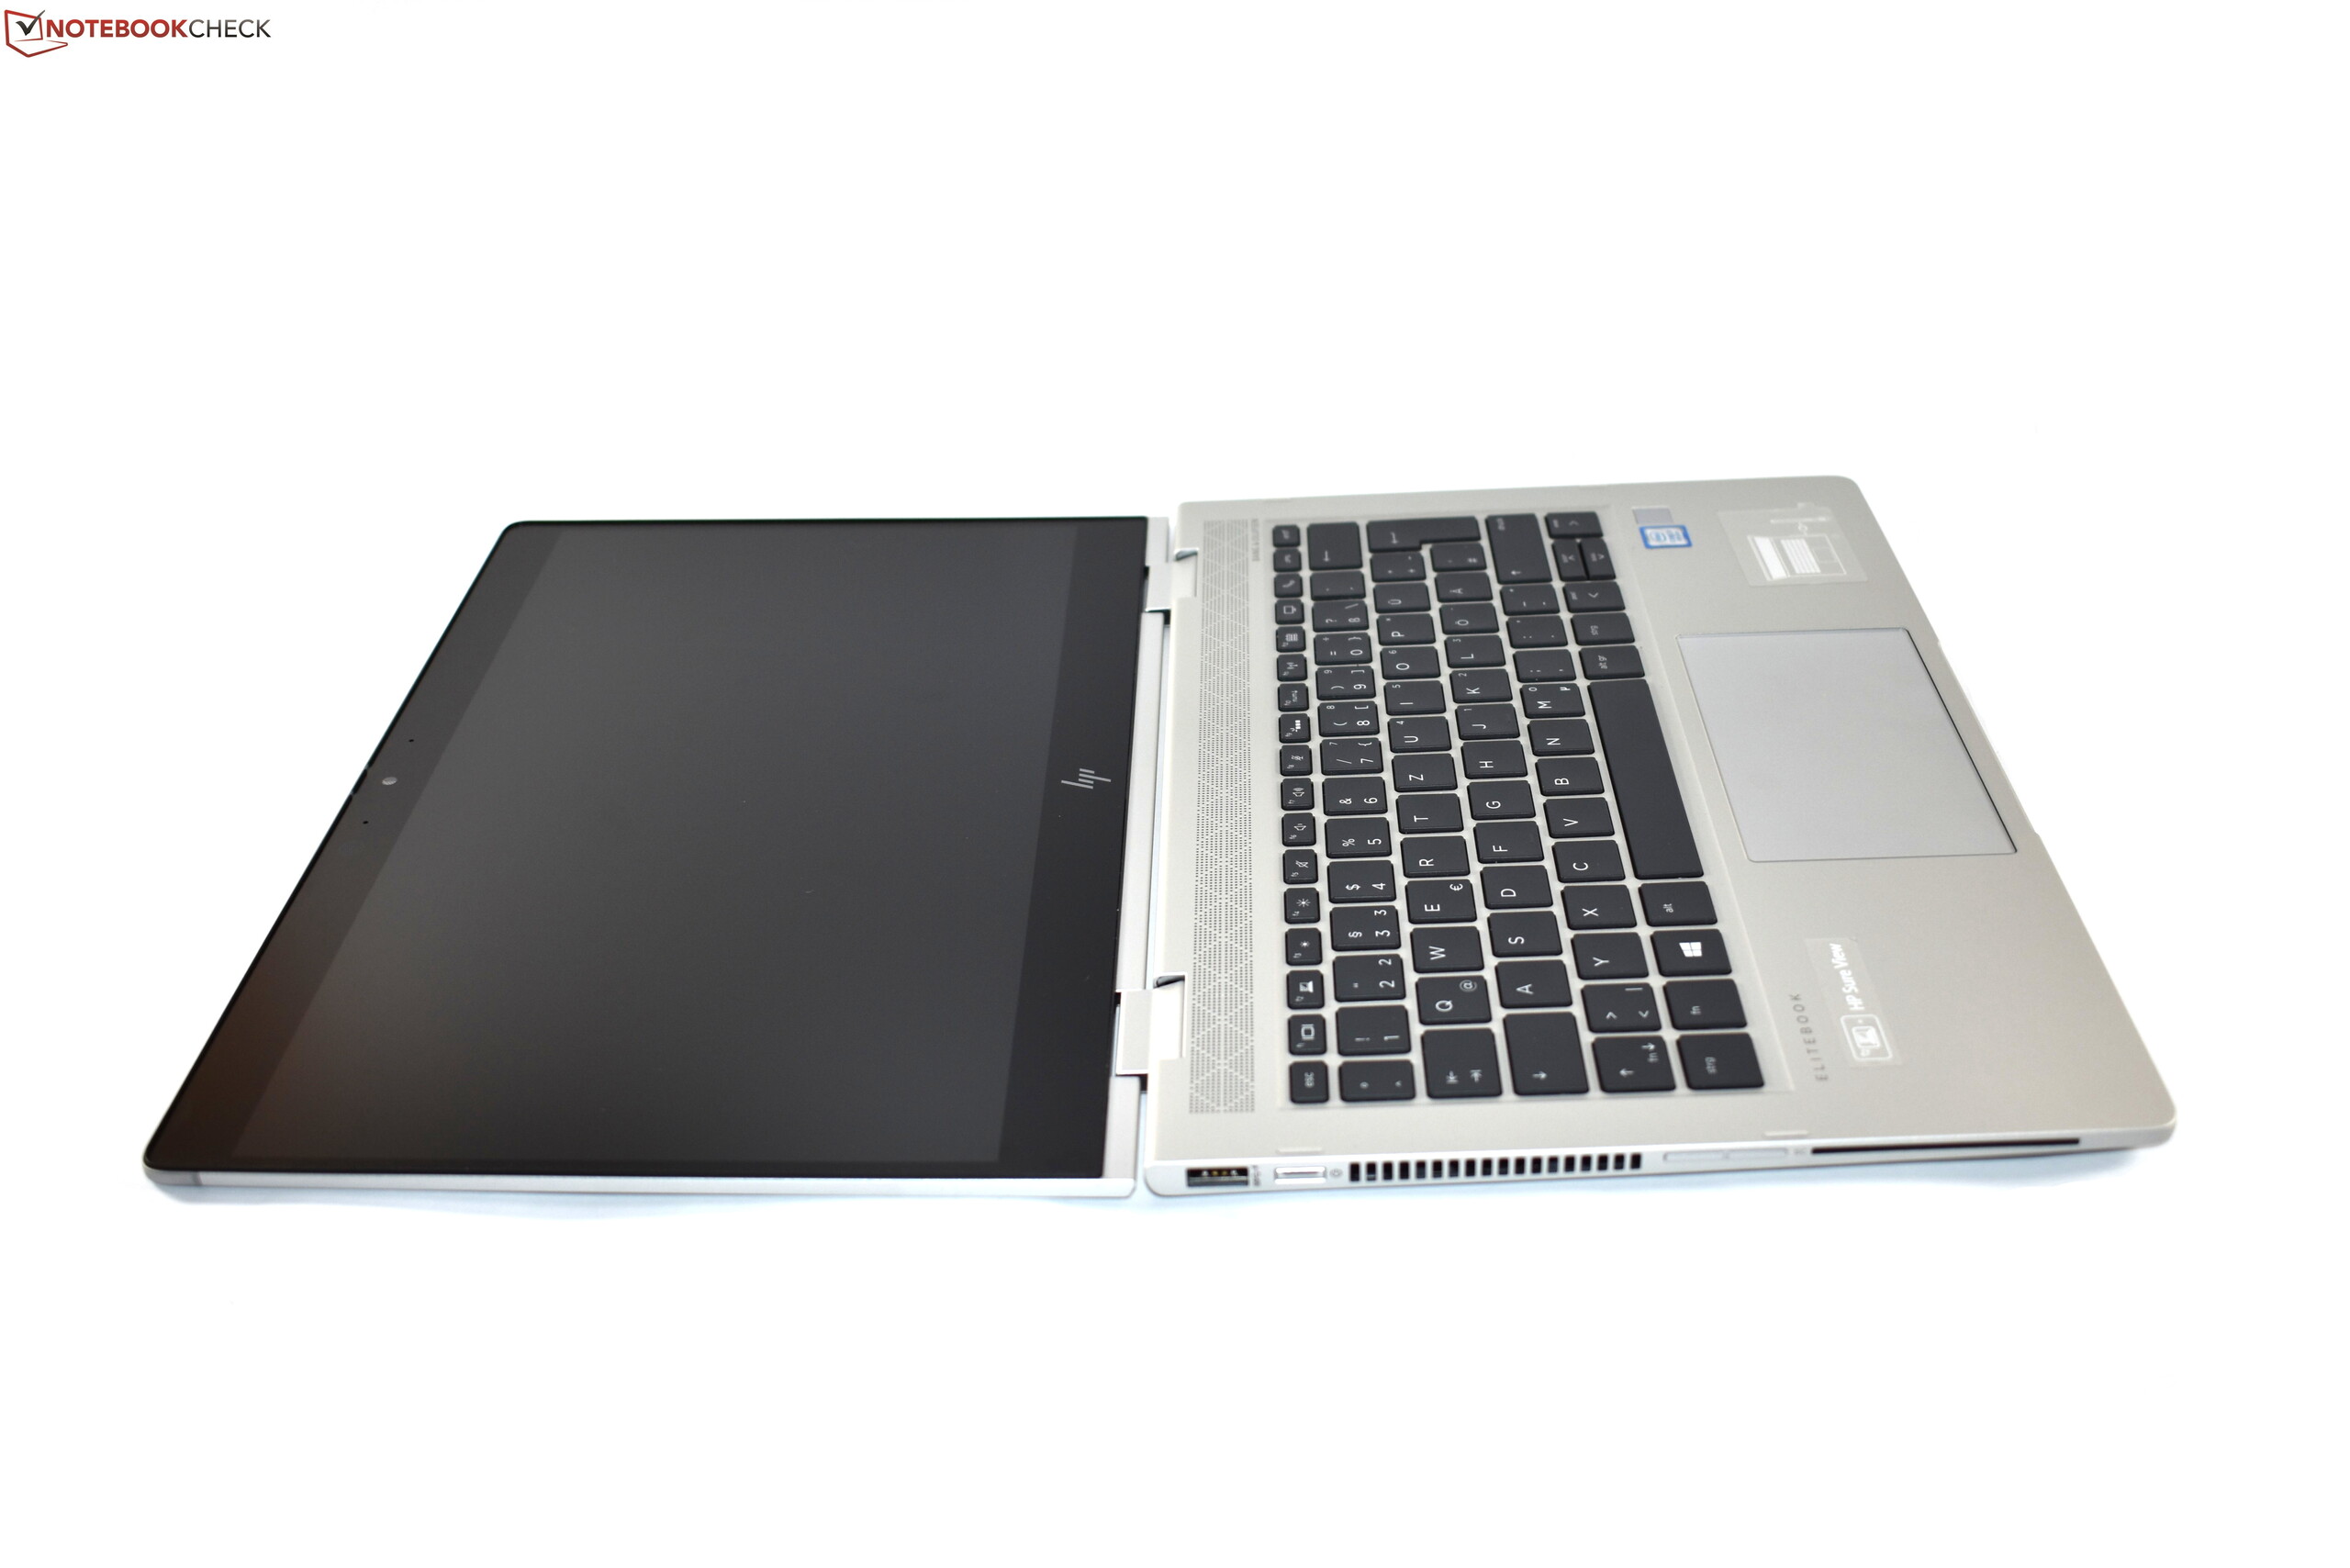
Många funktioner kombinerat med hög kvalitet: Det är vad HP EliteBook x360 830 G6 ger dig.
Allt som allt är HP EliteBook x360 830 G6 ett utmärkt val, inte bara för företagskunder utan också för privatpersoner som vill ha en pålitlig arbetshäst. Den är riktigt välutrustad och kan därför tävla med Lenovo ThinkPad X390 Yoga.
HP EliteBook x360 830 G6
- 09/30/2019 v7 (old)
Benjamin Herzig
Price comparison
