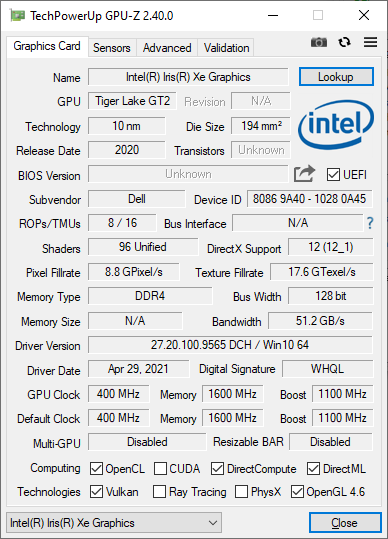
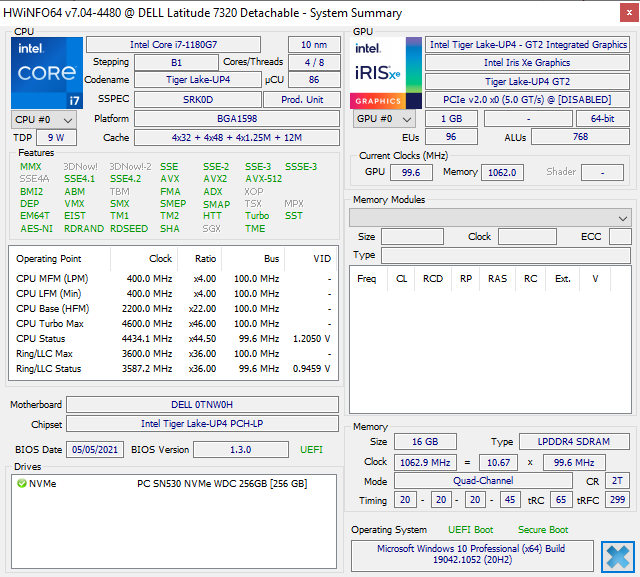
Test: Dell Latitude 13 7320 - Som Microsoft Surface Pro 7, fast bättre (Sammanfattning)
Testgrupp
Gradering | Datum | Modell | Vikt | Höjd | Storlek | Upplösning | Pris |
|---|---|---|---|---|---|---|---|
| 87.7 % v7 (old) | 06/2021 | Dell Latitude 13 7320 Detachable, i7-1180G7 i7-1180G7, Iris Xe G7 96EUs | 782 g | 8.44 mm | 13.00" | 1920x1280 | |
| 88.5 % v7 (old) | 03/2021 | Microsoft Surface Pro 7 Plus i5-1135G7, Iris Xe G7 80EUs | 796 g | 8.5 mm | 12.30" | 2736x1824 | |
| 88.5 % v7 (old) | 04/2021 | Lenovo ThinkPad X12 20UVS03G00 i7-1160G7, Iris Xe G7 96EUs | 1.1 kg | 14.5 mm | 12.30" | 1920x1280 | |
| 86.3 % v7 (old) | 10/2019 | Dell XPS 13 7390 2-in-1 Core i7 i7-1065G7, Iris Plus Graphics G7 (Ice Lake 64 EU) | 1.3 kg | 13 mm | 13.40" | 1920x1200 | |
| 87.1 % v7 (old) | 11/2020 | Lenovo Yoga Duet 7 13IML05-82AS000WGE i5-10210U, UHD Graphics 620 | 1.2 kg | 9.2 mm | 13.00" | 2160x1350 |


| |||||||||||||||||||||||||
Distribution av ljusstyrkan: 93 %
Mitt på batteriet: 521.8 cd/m²
Kontrast: 1491:1 (Svärta: 0.35 cd/m²)
ΔE ColorChecker Calman: 3.83 | ∀{0.5-29.43 Ø4.73}
calibrated: 1.97
ΔE Greyscale Calman: 4.4 | ∀{0.09-98 Ø4.97}
78.4% AdobeRGB 1998 (Argyll 3D)
100% sRGB (Argyll 3D)
79.5% Display P3 (Argyll 3D)
Gamma: 2.02
CCT: 6494 K
| Dell Latitude 13 7320 Detachable, i7-1180G7 Sharp LQ130N1, IPS, 13", 1920x1280 | Microsoft Surface Pro 7 Plus LG Philips LP123WQ332684, IPS, 12.3", 2736x1824 | Lenovo ThinkPad X12 20UVS03G00 N123NCA-GS1, a-Si IPS LED, 12.3", 1920x1280 | Dell XPS 13 7390 2-in-1 Core i7 Sharp LQ134N1, IPS, 13.4", 1920x1200 | Lenovo Yoga Duet 7 13IML05-82AS000WGE CSOT T3 LEN8290, IPS, 13", 2160x1350 | |
|---|---|---|---|---|---|
| Display | -10% | -10% | -7% | -8% | |
| Display P3 Coverage (%) | 79.5 | 66.9 -16% | 67 -16% | 69.9 -12% | 68.9 -13% |
| sRGB Coverage (%) | 100 | 96.7 -3% | 99.2 -1% | 99.2 -1% | 98.2 -2% |
| AdobeRGB 1998 Coverage (%) | 78.4 | 69.1 -12% | 68.8 -12% | 71.5 -9% | 71.1 -9% |
| Response Times | 2% | -15% | 11% | 6% | |
| Response Time Grey 50% / Grey 80% * (ms) | 53.2 ? | 50.8 ? 5% | 63.2 ? -19% | 47.6 ? 11% | 58 ? -9% |
| Response Time Black / White * (ms) | 32.8 ? | 33.6 ? -2% | 36 ? -10% | 29.2 ? 11% | 26 ? 21% |
| PWM Frequency (Hz) | 2451 ? | 199.2 ? | 2500 ? | ||
| Screen | 16% | 32% | 15% | -10% | |
| Brightness middle (cd/m²) | 521.8 | 408 -22% | 419 -20% | 549.8 5% | 450 -14% |
| Brightness (cd/m²) | 504 | 425 -16% | 406 -19% | 520 3% | 411 -18% |
| Brightness Distribution (%) | 93 | 85 -9% | 94 1% | 86 -8% | 83 -11% |
| Black Level * (cd/m²) | 0.35 | 0.34 3% | 0.23 34% | 0.39 -11% | 0.22 37% |
| Contrast (:1) | 1491 | 1200 -20% | 1822 22% | 1410 -5% | 2045 37% |
| Colorchecker dE 2000 * | 3.83 | 1.5 61% | 1.1 71% | 2.12 45% | 4.15 -8% |
| Colorchecker dE 2000 max. * | 5.51 | 2.5 55% | 2.2 60% | 3.66 34% | 11.49 -109% |
| Colorchecker dE 2000 calibrated * | 1.97 | 1.4 29% | 0.5 75% | 1.37 30% | 1.09 45% |
| Greyscale dE 2000 * | 4.4 | 1.6 64% | 1.5 66% | 2.6 41% | 6.66 -51% |
| Gamma | 2.02 109% | 2.05 107% | 2.06 107% | 2.3 96% | 2.42 91% |
| CCT | 6494 100% | 6432 101% | 6524 100% | 6884 94% | 6043 108% |
| Color Space (Percent of AdobeRGB 1998) (%) | 63.7 | 62.8 | 65.4 | 65 | |
| Color Space (Percent of sRGB) (%) | 96.8 | 99.2 | 99.7 | 98 | |
| Totalt genomsnitt (program/inställningar) | 3% /
8% | 2% /
17% | 6% /
10% | -4% /
-7% |
* ... mindre är bättre
Visa svarstider
| ↔ Svarstid svart till vitt | ||
|---|---|---|
| 32.8 ms ... stiga ↗ och falla ↘ kombinerat | ↗ 16.4 ms stiga | 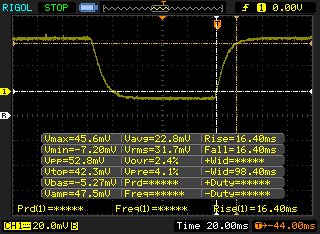 |
| ↘ 16.4 ms hösten | ||
| Skärmen visar långsamma svarsfrekvenser i våra tester och kommer att vara otillfredsställande för spelare. I jämförelse sträcker sig alla testade enheter från 0.1 (minst) till 240 (maximalt) ms. » 88 % av alla enheter är bättre. Detta innebär att den uppmätta svarstiden är sämre än genomsnittet av alla testade enheter (19.9 ms). | ||
| ↔ Svarstid 50 % grått till 80 % grått | ||
| 53.2 ms ... stiga ↗ och falla ↘ kombinerat | ↗ 26.4 ms stiga | 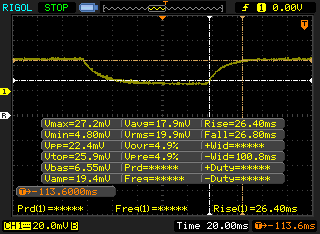 |
| ↘ 26.8 ms hösten | ||
| Skärmen visar långsamma svarsfrekvenser i våra tester och kommer att vara otillfredsställande för spelare. I jämförelse sträcker sig alla testade enheter från 0.165 (minst) till 636 (maximalt) ms. » 90 % av alla enheter är bättre. Detta innebär att den uppmätta svarstiden är sämre än genomsnittet av alla testade enheter (31.1 ms). | ||
Skärmflimmer / PWM (Puls-Width Modulation)
| Skärmflimmer / PWM upptäckt | 2451 Hz | ≤ 42 % ljusstyrka inställning | 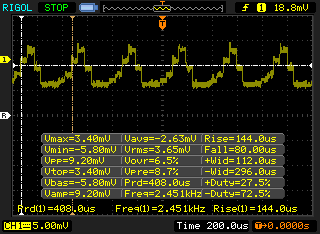 |
Displayens bakgrundsbelysning flimrar vid 2451 Hz (i värsta fall, t.ex. med PWM) Flimrande upptäckt vid en ljusstyrkeinställning på 42 % och lägre. Det ska inte finnas något flimmer eller PWM över denna ljusstyrkeinställning. Frekvensen för 2451 Hz är ganska hög, så de flesta användare som är känsliga för PWM bör inte märka något flimmer. Som jämförelse: 52 % av alla testade enheter använder inte PWM för att dämpa skärmen. Om PWM upptäcktes mättes ett medelvärde av 7798 (minst: 5 - maximum: 343500) Hz. | |||
Cinebench R23: Multi Core | Single Core
Cinebench R15: CPU Multi 64Bit | CPU Single 64Bit
Blender: v2.79 BMW27 CPU
7-Zip 18.03: 7z b 4 -mmt1 | 7z b 4
Geekbench 5.5: Single-Core | Multi-Core
HWBOT x265 Benchmark v2.2: 4k Preset
LibreOffice : 20 Documents To PDF
R Benchmark 2.5: Overall mean
| Cinebench R20 / CPU (Single Core) | |
| Genomsnitt Intel Core i7-1185G7 (489 - 593, n=28) | |
| Microsoft Surface Pro 7 Plus | |
| Lenovo ThinkPad X12 20UVS03G00 | |
| Lenovo IdeaPad Flex 5 14ALC05 82HU002YUS | |
| Dell Latitude 13 7320 Detachable, i7-1180G7 | |
| Genomsnitt Intel Core i7-1180G7 (n=1) | |
| Dell XPS 13 7390 2-in-1 Core i7 | |
| Asus VivoBook Flip 14 TM420IA | |
| Lenovo IdeaPad Flex 5 14ALC05-82HU006NGE | |
| HP Envy x360 13-ay0010nr | |
| Microsoft Surface Laptop Go Core i5 | |
| Dell XPS 13 7390 2-in-1 Core i3 | |
| HP Envy 13-aq0003ng | |
| Lenovo Yoga Duet 7 13IML05-82AS000WGE | |
| Cinebench R23 / Multi Core | |
| Lenovo IdeaPad Flex 5 14ALC05 82HU002YUS | |
| Lenovo IdeaPad Flex 5 14ALC05-82HU006NGE | |
| Genomsnitt Intel Core i7-1185G7 (3610 - 6383, n=24) | |
| Microsoft Surface Pro 7 Plus | |
| Dell Latitude 13 7320 Detachable, i7-1180G7 | |
| Genomsnitt Intel Core i7-1180G7 (n=1) | |
| Lenovo ThinkPad X12 20UVS03G00 | |
| Cinebench R23 / Single Core | |
| Genomsnitt Intel Core i7-1185G7 (1251 - 1532, n=24) | |
| Microsoft Surface Pro 7 Plus | |
| Dell Latitude 13 7320 Detachable, i7-1180G7 | |
| Genomsnitt Intel Core i7-1180G7 (n=1) | |
| Lenovo IdeaPad Flex 5 14ALC05 82HU002YUS | |
| Lenovo IdeaPad Flex 5 14ALC05-82HU006NGE | |
| Lenovo ThinkPad X12 20UVS03G00 | |
| 7-Zip 18.03 / 7z b 4 -mmt1 | |
| Genomsnitt Intel Core i7-1185G7 (3678 - 5507, n=27) | |
| Dell Latitude 13 7320 Detachable, i7-1180G7 | |
| Genomsnitt Intel Core i7-1180G7 (n=1) | |
| Lenovo IdeaPad Flex 5 14ALC05 82HU002YUS | |
| Dell XPS 13 7390 2-in-1 Core i7 | |
| Asus VivoBook Flip 14 TM420IA | |
| Microsoft Surface Pro 7 Plus | |
| Lenovo IdeaPad Flex 5 14ALC05-82HU006NGE | |
| HP Envy x360 13-ay0010nr | |
| Microsoft Surface Laptop Go Core i5 | |
| Dell XPS 13 7390 2-in-1 Core i3 | |
| Lenovo Yoga Duet 7 13IML05-82AS000WGE | |
| Geekbench 5.5 / Single-Core | |
| Dell Latitude 13 7320 Detachable, i7-1180G7 | |
| Genomsnitt Intel Core i7-1180G7 (n=1) | |
| Genomsnitt Intel Core i7-1185G7 (1398 - 1626, n=21) | |
| Lenovo ThinkPad X12 20UVS03G00 | |
| Microsoft Surface Pro 7 Plus | |
| Lenovo IdeaPad Flex 5 14ALC05 82HU002YUS | |
| Asus VivoBook Flip 14 TM420IA | |
| Microsoft Surface Laptop Go Core i5 | |
| Lenovo IdeaPad Flex 5 14ALC05-82HU006NGE | |
| HP Envy x360 13-ay0010nr | |
| Lenovo Yoga Duet 7 13IML05-82AS000WGE | |
| Geekbench 5.5 / Multi-Core | |
| Lenovo IdeaPad Flex 5 14ALC05 82HU002YUS | |
| Lenovo IdeaPad Flex 5 14ALC05-82HU006NGE | |
| Genomsnitt Intel Core i7-1185G7 (4620 - 5944, n=21) | |
| Asus VivoBook Flip 14 TM420IA | |
| Dell Latitude 13 7320 Detachable, i7-1180G7 | |
| Genomsnitt Intel Core i7-1180G7 (n=1) | |
| Microsoft Surface Pro 7 Plus | |
| Lenovo ThinkPad X12 20UVS03G00 | |
| HP Envy x360 13-ay0010nr | |
| Microsoft Surface Laptop Go Core i5 | |
| Lenovo Yoga Duet 7 13IML05-82AS000WGE | |
| HWBOT x265 Benchmark v2.2 / 4k Preset | |
| Lenovo IdeaPad Flex 5 14ALC05 82HU002YUS | |
| Lenovo IdeaPad Flex 5 14ALC05-82HU006NGE | |
| Asus VivoBook Flip 14 TM420IA | |
| HP Envy x360 13-ay0010nr | |
| Genomsnitt Intel Core i7-1185G7 (5.02 - 8.13, n=27) | |
| Dell XPS 13 7390 2-in-1 Core i7 | |
| Microsoft Surface Pro 7 Plus | |
| Dell Latitude 13 7320 Detachable, i7-1180G7 | |
| Genomsnitt Intel Core i7-1180G7 (n=1) | |
| Microsoft Surface Laptop Go Core i5 | |
| Lenovo ThinkPad X12 20UVS03G00 | |
| Dell XPS 13 7390 2-in-1 Core i3 | |
| Lenovo Yoga Duet 7 13IML05-82AS000WGE | |
| LibreOffice / 20 Documents To PDF | |
| Lenovo Yoga Duet 7 13IML05-82AS000WGE | |
| Lenovo IdeaPad Flex 5 14ALC05-82HU006NGE | |
| Microsoft Surface Laptop Go Core i5 | |
| HP Envy x360 13-ay0010nr | |
| Lenovo ThinkPad X12 20UVS03G00 | |
| Lenovo IdeaPad Flex 5 14ALC05 82HU002YUS | |
| Microsoft Surface Pro 7 Plus | |
| Asus VivoBook Flip 14 TM420IA | |
| Genomsnitt Intel Core i7-1185G7 (41.3 - 61.7, n=26) | |
| Dell Latitude 13 7320 Detachable, i7-1180G7 | |
| Genomsnitt Intel Core i7-1180G7 (n=1) | |
| R Benchmark 2.5 / Overall mean | |
| Lenovo Yoga Duet 7 13IML05-82AS000WGE | |
| Lenovo ThinkPad X12 20UVS03G00 | |
| Microsoft Surface Laptop Go Core i5 | |
| Microsoft Surface Pro 7 Plus | |
| Dell Latitude 13 7320 Detachable, i7-1180G7 | |
| Genomsnitt Intel Core i7-1180G7 (n=1) | |
| Lenovo IdeaPad Flex 5 14ALC05-82HU006NGE | |
| HP Envy x360 13-ay0010nr | |
| Asus VivoBook Flip 14 TM420IA | |
| Lenovo IdeaPad Flex 5 14ALC05 82HU002YUS | |
| Genomsnitt Intel Core i7-1185G7 (0.55 - 0.615, n=27) | |
Cinebench R23: Multi Core | Single Core
Cinebench R15: CPU Multi 64Bit | CPU Single 64Bit
Blender: v2.79 BMW27 CPU
7-Zip 18.03: 7z b 4 -mmt1 | 7z b 4
Geekbench 5.5: Single-Core | Multi-Core
HWBOT x265 Benchmark v2.2: 4k Preset
LibreOffice : 20 Documents To PDF
R Benchmark 2.5: Overall mean
* ... mindre är bättre
| PCMark 10 Score | 4758 poäng | |
Hjälp | ||
| DPC Latencies / LatencyMon - interrupt to process latency (max), Web, Youtube, Prime95 | |
| Lenovo Yoga Duet 7 13IML05-82AS000WGE | |
| Dell Latitude 13 7320 Detachable, i7-1180G7 | |
| Lenovo ThinkPad X12 20UVS03G00 | |
| Microsoft Surface Pro 7 Plus | |
* ... mindre är bättre
| Dell Latitude 13 7320 Detachable, i7-1180G7 WDC PC SN530 SDBPMPZ-265G | Microsoft Surface Pro 7 Plus Samsung PM991 MZ9LQ256HBJQ | Lenovo ThinkPad X12 20UVS03G00 Toshiba BG4 KBG40ZNT512G | Dell XPS 13 7390 2-in-1 Core i7 Toshiba BG4 KBG40ZPZ512G | Lenovo Yoga Duet 7 13IML05-82AS000WGE Lenovo UMIS RPJTJ256MEE1OWX | |
|---|---|---|---|---|---|
| AS SSD | 104% | 20% | 76% | 66% | |
| Seq Read (MB/s) | 1918 | 1725 -10% | 1760 -8% | 1801 -6% | 1629 -15% |
| Seq Write (MB/s) | 357.6 | 931 160% | 761 113% | 1125 215% | 694 94% |
| 4K Read (MB/s) | 38.97 | 50.1 29% | 47.68 22% | 39.7 2% | 47.87 23% |
| 4K Write (MB/s) | 195.5 | 136.9 -30% | 176 -10% | 67 -66% | 107 -45% |
| 4K-64 Read (MB/s) | 390.9 | 870 123% | 581 49% | 1253 221% | 411 5% |
| 4K-64 Write (MB/s) | 103.9 | 762 633% | 118.5 14% | 209 101% | 377 263% |
| Access Time Read * (ms) | 0.122 | 0.279 -129% | 0.155 -27% | 0.069 43% | 0.068 44% |
| Access Time Write * (ms) | 0.189 | 0.028 85% | 0.188 1% | 0.625 -231% | 0.035 81% |
| Score Read (Points) | 622 | 1093 76% | 805 29% | 1472 137% | 614 -1% |
| Score Write (Points) | 335 | 992 196% | 371 11% | 388 16% | 550 64% |
| Score Total (Points) | 1209 | 2616 116% | 1551 28% | 2583 114% | 1441 19% |
| Copy ISO MB/s (MB/s) | 858 | 1174 37% | 1293 51% | 1074 25% | |
| Copy Program MB/s (MB/s) | 239.9 | 262.8 10% | 560 133% | 532 122% | |
| Copy Game MB/s (MB/s) | 214.3 | 562 162% | 927 333% | 730 241% | |
| CrystalDiskMark 5.2 / 6 | 0% | -28% | 10% | 7% | |
| Write 4K (MB/s) | 177.5 | 165.3 -7% | 72.8 -59% | 106.7 -40% | 118 -34% |
| Read 4K (MB/s) | 47.45 | 42.95 -9% | 26.35 -44% | 49.94 5% | 53 12% |
| Write Seq (MB/s) | 971 | 955 -2% | 823 -15% | 1223 26% | 1208 24% |
| Read Seq (MB/s) | 1544 | 867 -44% | 1169 -24% | 1801 17% | 1625 5% |
| Write 4K Q32T1 (MB/s) | 295.3 | 423.5 43% | 112.6 -62% | 325.3 10% | 431 46% |
| Read 4K Q32T1 (MB/s) | 394.1 | 479.2 22% | 327.2 -17% | 551 40% | 356 -10% |
| Write Seq Q32T1 (MB/s) | 977 | 1060 8% | 1039 6% | 1224 25% | 1278 31% |
| Read Seq Q32T1 (MB/s) | 2482 | 2251 -9% | 2176 -12% | 2350 -5% | 1949 -21% |
| Totalt genomsnitt (program/inställningar) | 52% /
66% | -4% /
-0% | 43% /
52% | 37% /
44% |
* ... mindre är bättre

DiskSpd Read Loop, Queue Depth 8
| 3DMark 11 Performance | 5416 poäng | |
| 3DMark Cloud Gate Standard Score | 13812 poäng | |
| 3DMark Fire Strike Score | 4020 poäng | |
| 3DMark Time Spy Score | 1443 poäng | |
Hjälp | ||
| låg | med. | hög | ultra | |
|---|---|---|---|---|
| GTA V (2015) | 64.1 | 58.2 | 21 | 9.75 |
| The Witcher 3 (2015) | 80.3 | 53.3 | 30.1 | 13.8 |
| Dota 2 Reborn (2015) | 76.9 | 50.9 | 36.8 | 35.1 |
| Final Fantasy XV Benchmark (2018) | 32.3 | 18.2 | 13.5 | |
| X-Plane 11.11 (2018) | 20.6 | 27.7 | 25.5 |
| Dell Latitude 13 7320 Detachable, i7-1180G7 Iris Xe G7 96EUs, i7-1180G7, WDC PC SN530 SDBPMPZ-265G | Microsoft Surface Pro 7 Plus Iris Xe G7 80EUs, i5-1135G7, Samsung PM991 MZ9LQ256HBJQ | Lenovo ThinkPad X12 20UVS03G00 Iris Xe G7 96EUs, i7-1160G7, Toshiba BG4 KBG40ZNT512G | Dell XPS 13 7390 2-in-1 Core i7 Iris Plus Graphics G7 (Ice Lake 64 EU), i7-1065G7, Toshiba BG4 KBG40ZPZ512G | Lenovo Yoga Duet 7 13IML05-82AS000WGE UHD Graphics 620, i5-10210U, Lenovo UMIS RPJTJ256MEE1OWX | |
|---|---|---|---|---|---|
| Noise | 6% | -5% | 9% | ||
| av / miljö * (dB) | 25.3 | 25.1 1% | 28.1 -11% | 25.4 -0% | |
| Idle Minimum * (dB) | 25.4 | 25.1 1% | 28.1 -11% | 25.4 -0% | |
| Idle Average * (dB) | 25.4 | 25.1 1% | 28.1 -11% | 25.4 -0% | |
| Idle Maximum * (dB) | 25.4 | 26 -2% | 28.1 -11% | 25.4 -0% | |
| Load Average * (dB) | 37.7 | 34.6 8% | 31.7 16% | 30 20% | |
| Witcher 3 ultra * (dB) | 42 | 34.6 18% | 43.4 -3% | ||
| Load Maximum * (dB) | 42.1 | 37 12% | 43.4 -3% | 27.5 35% |
* ... mindre är bättre
Ljudnivå
| Låg belastning |
| 25.4 / 25.4 / 25.4 dB(A) |
| Hög belastning |
| 37.7 / 42.1 dB(A) |
 | ||
30 dB tyst 40 dB(A) hörbar 50 dB(A) högt ljud |
||
min: | ||
(+) Den maximala temperaturen på ovansidan är 38.8 °C / 102 F, jämfört med genomsnittet av 35.4 °C / 96 F , allt från 19.6 till 60 °C för klassen Convertible.
(±) Botten värms upp till maximalt 40 °C / 104 F, jämfört med genomsnittet av 36.9 °C / 98 F
(+) Vid tomgångsbruk är medeltemperaturen för ovansidan 29.6 °C / 85 F, jämfört med enhetsgenomsnittet på 30.3 °C / ### class_avg_f### F.
(+) Handledsstöden och pekplattan är kallare än hudtemperaturen med maximalt 29.4 °C / 84.9 F och är därför svala att ta på.
(±) Medeltemperaturen för handledsstödsområdet på liknande enheter var 28 °C / 82.4 F (-1.4 °C / -2.5 F).
Dell Latitude 13 7320 Detachable, i7-1180G7 ljudanalys
(±) | högtalarljudstyrkan är genomsnittlig men bra (77.7 dB)
Bas 100 - 315 Hz
(±) | reducerad bas - i genomsnitt 11.6% lägre än medianen
(±) | linjäriteten för basen är genomsnittlig (11.7% delta till föregående frekvens)
Mellan 400 - 2000 Hz
(+) | balanserad mellan - endast 2.7% från medianen
(+) | mids är linjära (4% delta till föregående frekvens)
Högsta 2 - 16 kHz
(+) | balanserade toppar - endast 3.2% från medianen
(+) | toppar är linjära (5.2% delta till föregående frekvens)
Totalt 100 - 16 000 Hz
(+) | det totala ljudet är linjärt (14% skillnad mot median)
Jämfört med samma klass
» 20% av alla testade enheter i den här klassen var bättre, 4% liknande, 77% sämre
» Den bästa hade ett delta på 6%, genomsnittet var 20%, sämst var 57%
Jämfört med alla testade enheter
» 16% av alla testade enheter var bättre, 4% liknande, 80% sämre
» Den bästa hade ett delta på 4%, genomsnittet var 24%, sämst var 134%
Apple MacBook 12 (Early 2016) 1.1 GHz ljudanalys
(+) | högtalare kan spela relativt högt (83.6 dB)
Bas 100 - 315 Hz
(±) | reducerad bas - i genomsnitt 11.3% lägre än medianen
(±) | linjäriteten för basen är genomsnittlig (14.2% delta till föregående frekvens)
Mellan 400 - 2000 Hz
(+) | balanserad mellan - endast 2.4% från medianen
(+) | mids är linjära (5.5% delta till föregående frekvens)
Högsta 2 - 16 kHz
(+) | balanserade toppar - endast 2% från medianen
(+) | toppar är linjära (4.5% delta till föregående frekvens)
Totalt 100 - 16 000 Hz
(+) | det totala ljudet är linjärt (10.2% skillnad mot median)
Jämfört med samma klass
» 7% av alla testade enheter i den här klassen var bättre, 2% liknande, 91% sämre
» Den bästa hade ett delta på 5%, genomsnittet var 18%, sämst var 53%
Jämfört med alla testade enheter
» 5% av alla testade enheter var bättre, 1% liknande, 94% sämre
» Den bästa hade ett delta på 4%, genomsnittet var 24%, sämst var 134%
| Av/Standby | |
| Låg belastning | |
| Hög belastning |
|
Förklaring:
min: | |
| Dell Latitude 13 7320 Detachable, i7-1180G7 i7-1180G7, Iris Xe G7 96EUs, WDC PC SN530 SDBPMPZ-265G, IPS, 1920x1280, 13" | Microsoft Surface Pro 7 Plus i5-1135G7, Iris Xe G7 80EUs, Samsung PM991 MZ9LQ256HBJQ, IPS, 2736x1824, 12.3" | Lenovo ThinkPad X12 20UVS03G00 i7-1160G7, Iris Xe G7 96EUs, Toshiba BG4 KBG40ZNT512G, a-Si IPS LED, 1920x1280, 12.3" | Dell XPS 13 7390 2-in-1 Core i7 i7-1065G7, Iris Plus Graphics G7 (Ice Lake 64 EU), Toshiba BG4 KBG40ZPZ512G, IPS, 1920x1200, 13.4" | Lenovo Yoga Duet 7 13IML05-82AS000WGE i5-10210U, UHD Graphics 620, Lenovo UMIS RPJTJ256MEE1OWX, IPS, 2160x1350, 13" | |
|---|---|---|---|---|---|
| Power Consumption | -63% | -22% | -19% | 2% | |
| Idle Minimum * (Watt) | 2.5 | 5.5 -120% | 4 -60% | 2.6 -4% | 3.1 -24% |
| Idle Average * (Watt) | 4.8 | 9.1 -90% | 5.9 -23% | 5.3 -10% | 5.7 -19% |
| Idle Maximum * (Watt) | 6 | 10.8 -80% | 8.3 -38% | 7 -17% | 8.7 -45% |
| Load Average * (Watt) | 31.9 | 39.2 -23% | 30.1 6% | 43.1 -35% | 20.5 36% |
| Witcher 3 ultra * (Watt) | 26.2 | 30.8 -18% | 43.1 -65% | ||
| Load Maximum * (Watt) | 61 | 62.5 -2% | 59 3% | 49 20% | 22.6 63% |
* ... mindre är bättre
| Dell Latitude 13 7320 Detachable, i7-1180G7 i7-1180G7, Iris Xe G7 96EUs, 40 Wh | Microsoft Surface Pro 7 Plus i5-1135G7, Iris Xe G7 80EUs, 48.9 Wh | Lenovo ThinkPad X12 20UVS03G00 i7-1160G7, Iris Xe G7 96EUs, 42 Wh | Dell XPS 13 7390 2-in-1 Core i7 i7-1065G7, Iris Plus Graphics G7 (Ice Lake 64 EU), 51 Wh | Lenovo Yoga Duet 7 13IML05-82AS000WGE i5-10210U, UHD Graphics 620, 39 Wh | |
|---|---|---|---|---|---|
| Batteridrifttid | 12% | -15% | -18% | -24% | |
| Reader / Idle (h) | 17.7 | 13.6 -23% | 12.8 -28% | ||
| WiFi v1.3 (h) | 11 | 8.1 -26% | 8.2 -25% | 9 -18% | 8.7 -21% |
| Load (h) | 2.1 | 3.9 86% | 2 -5% | 1.6 -24% |
För
Emot
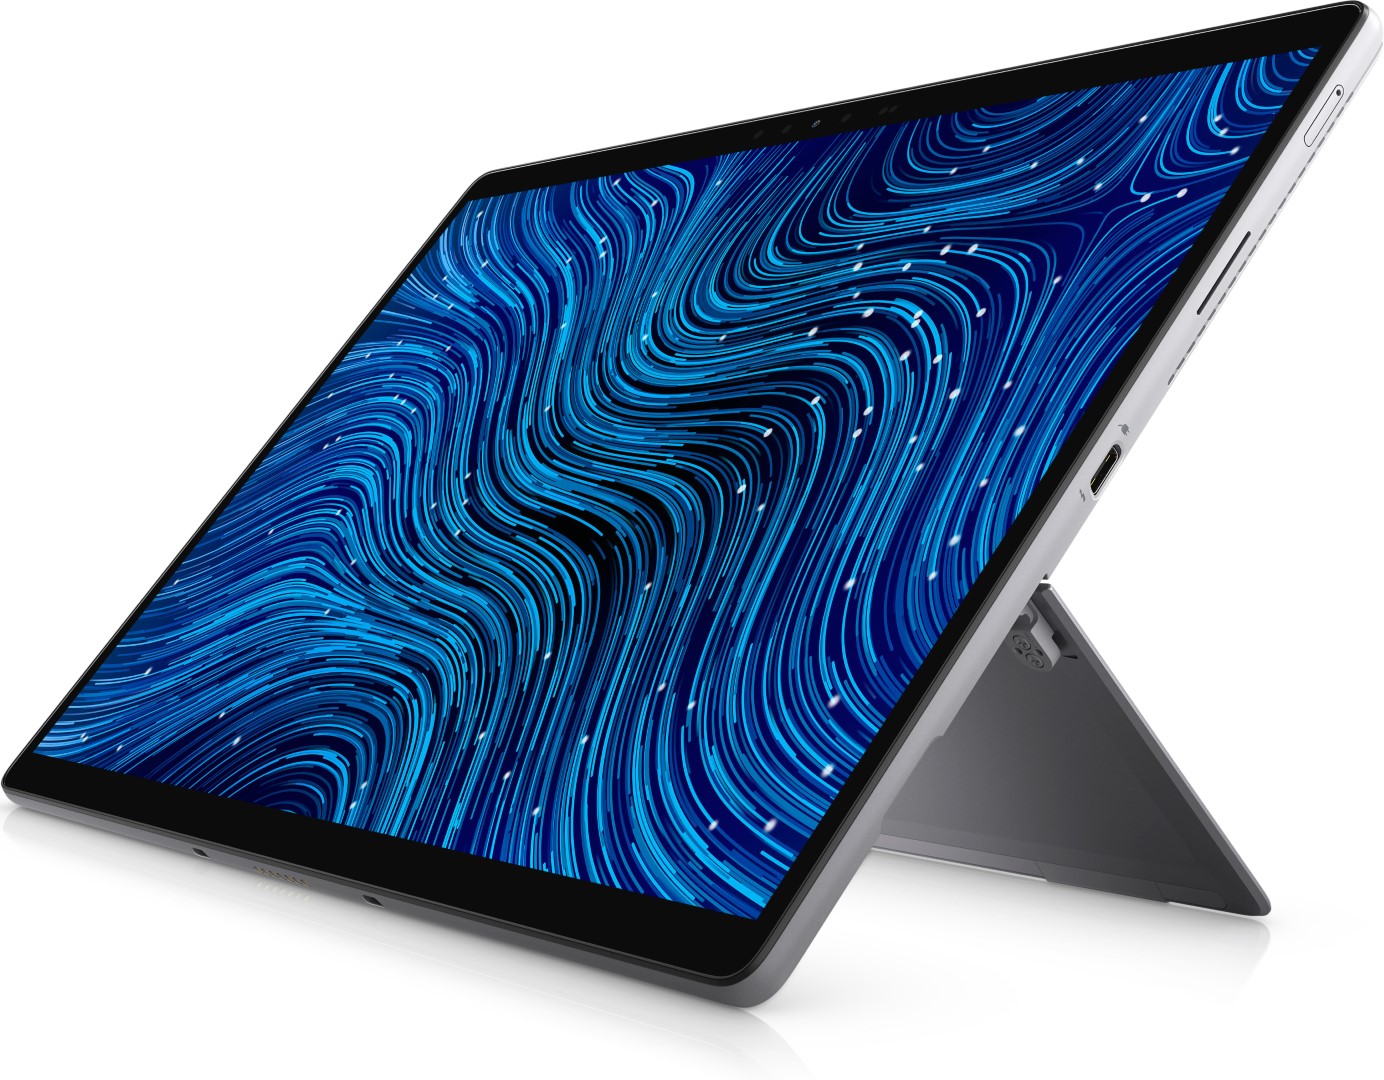
Omdöme — Minimalistisk design, maximal produktivitet
Läs den fullständiga versionen av den här recensionen på engelska här.
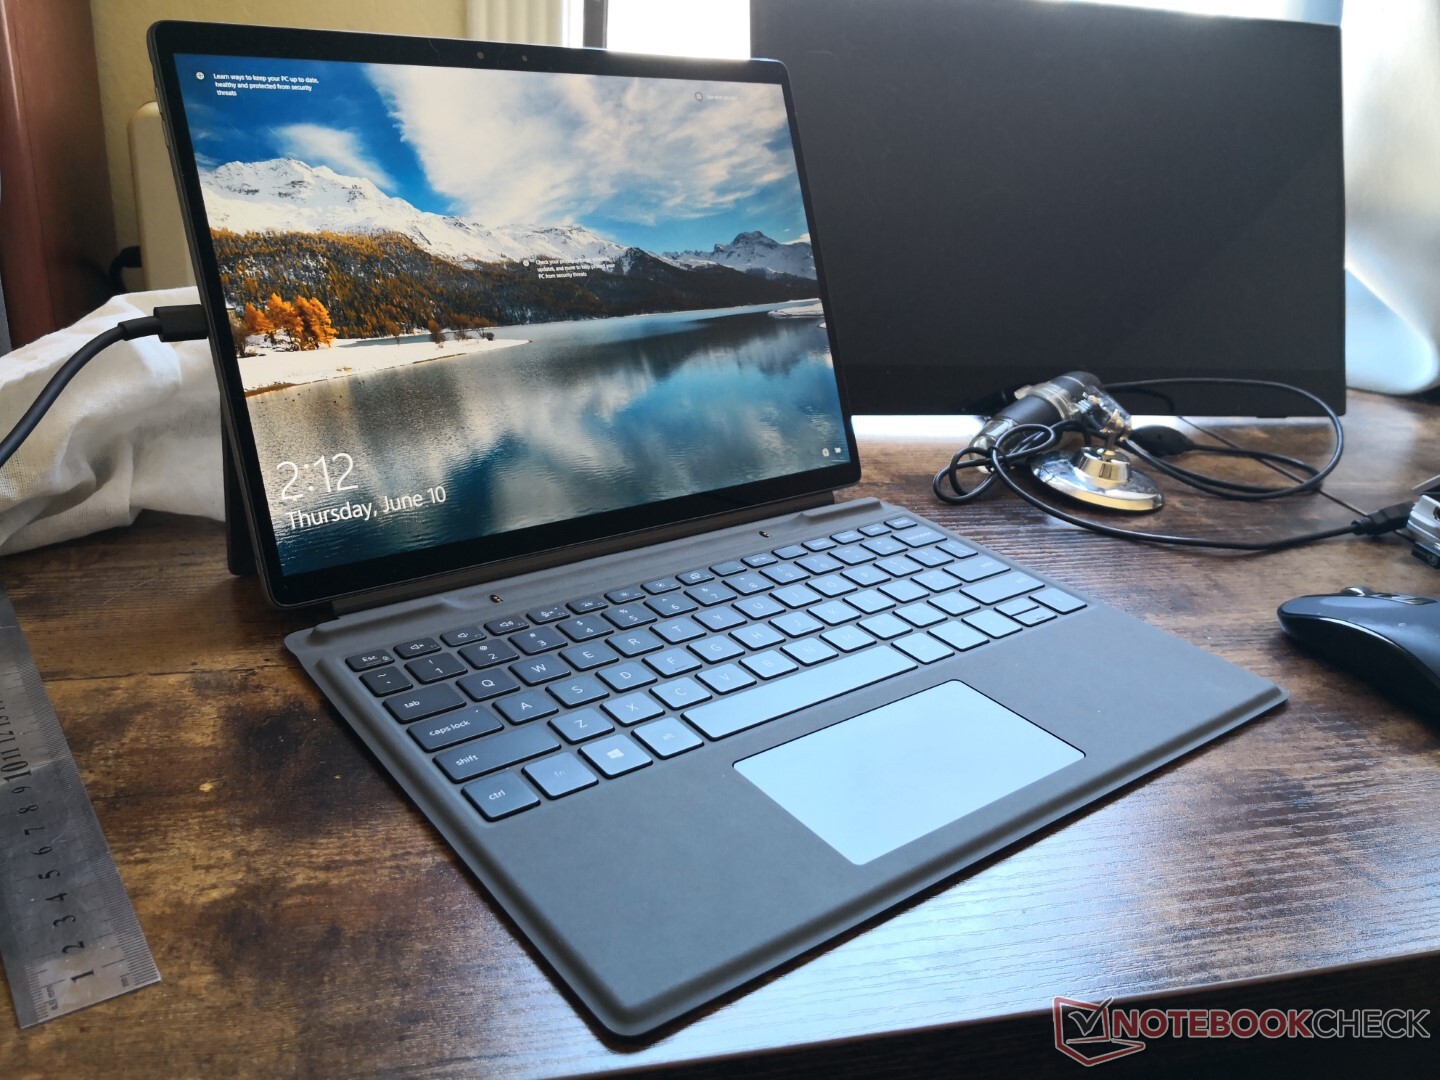
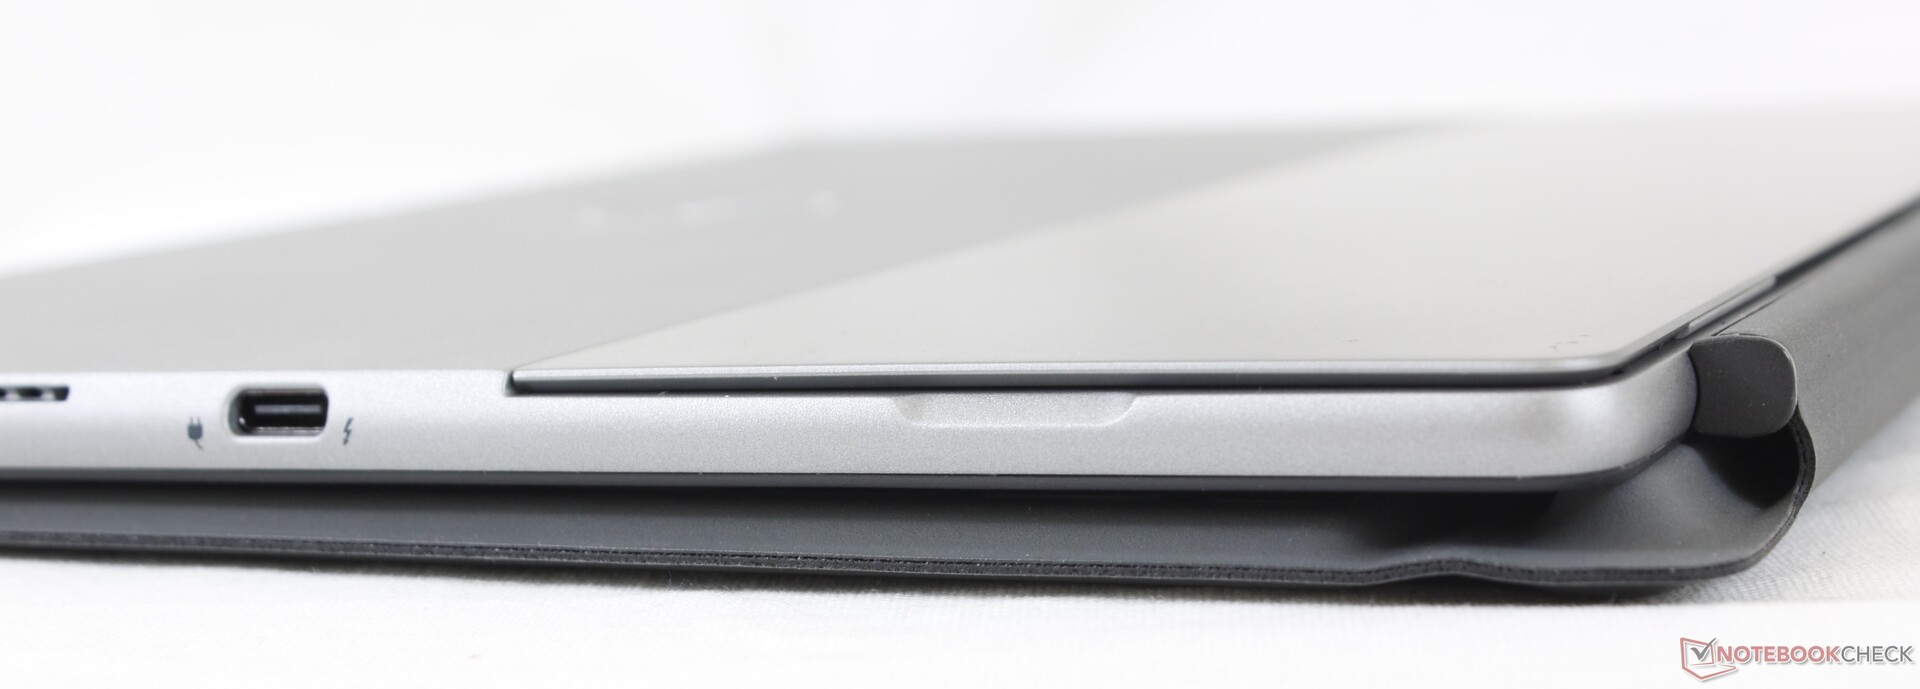
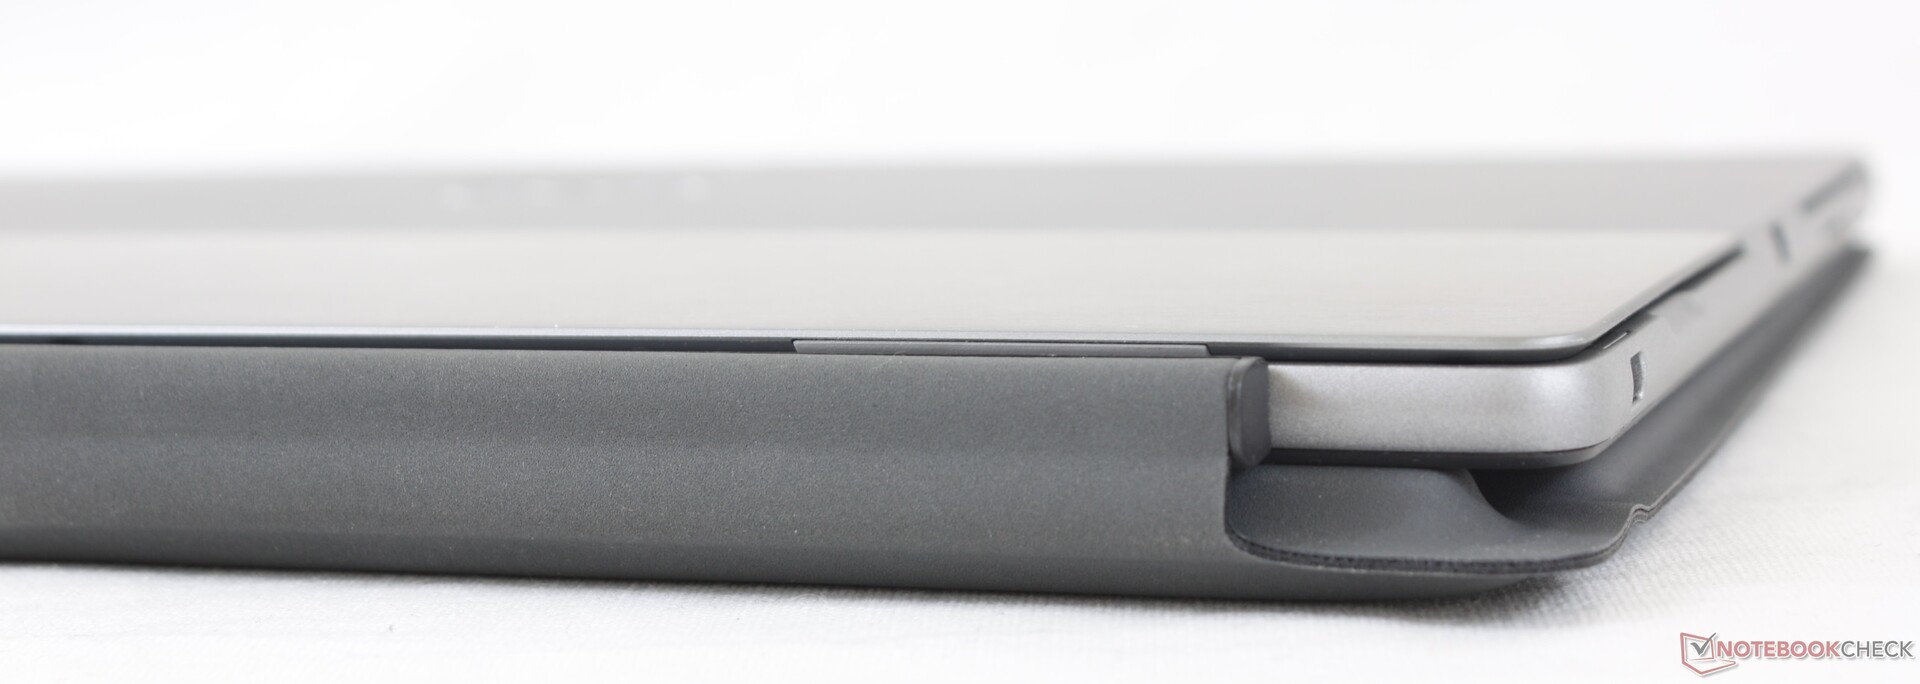
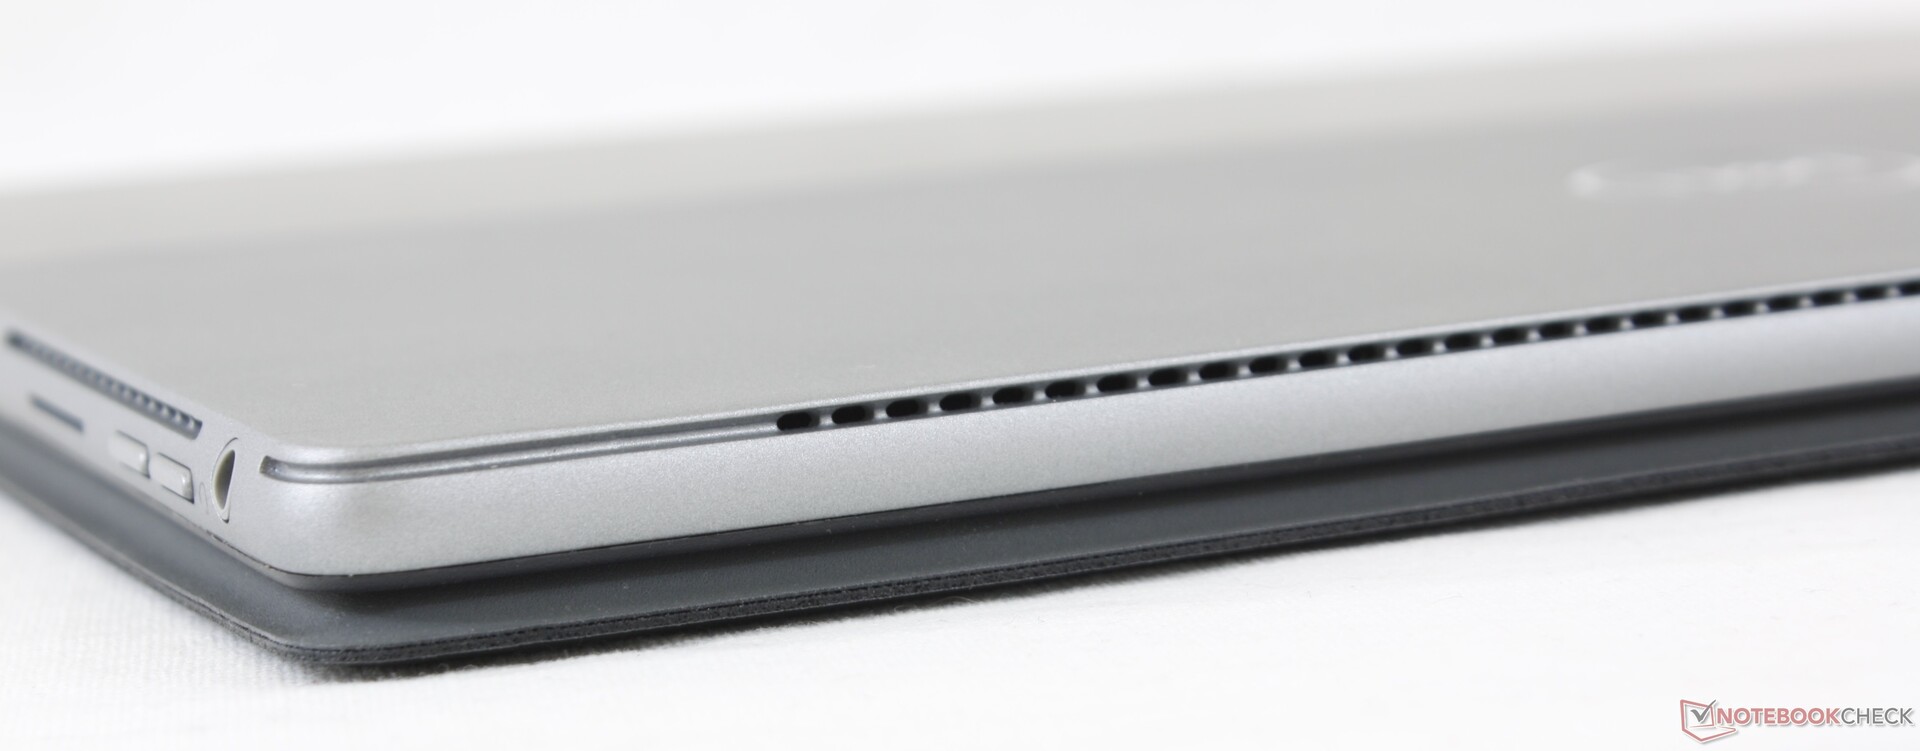
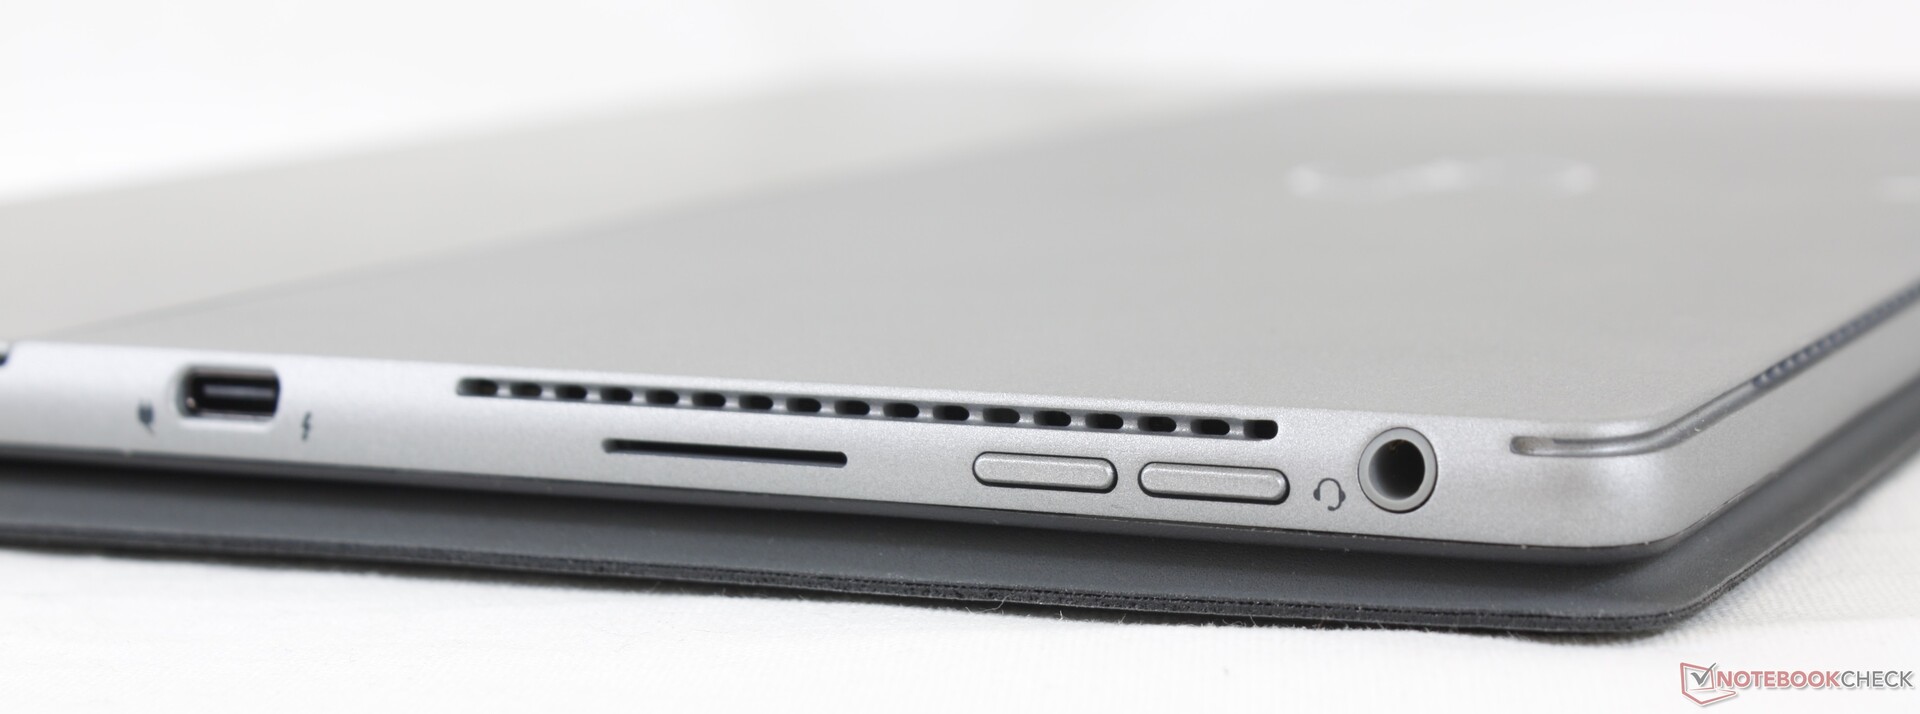
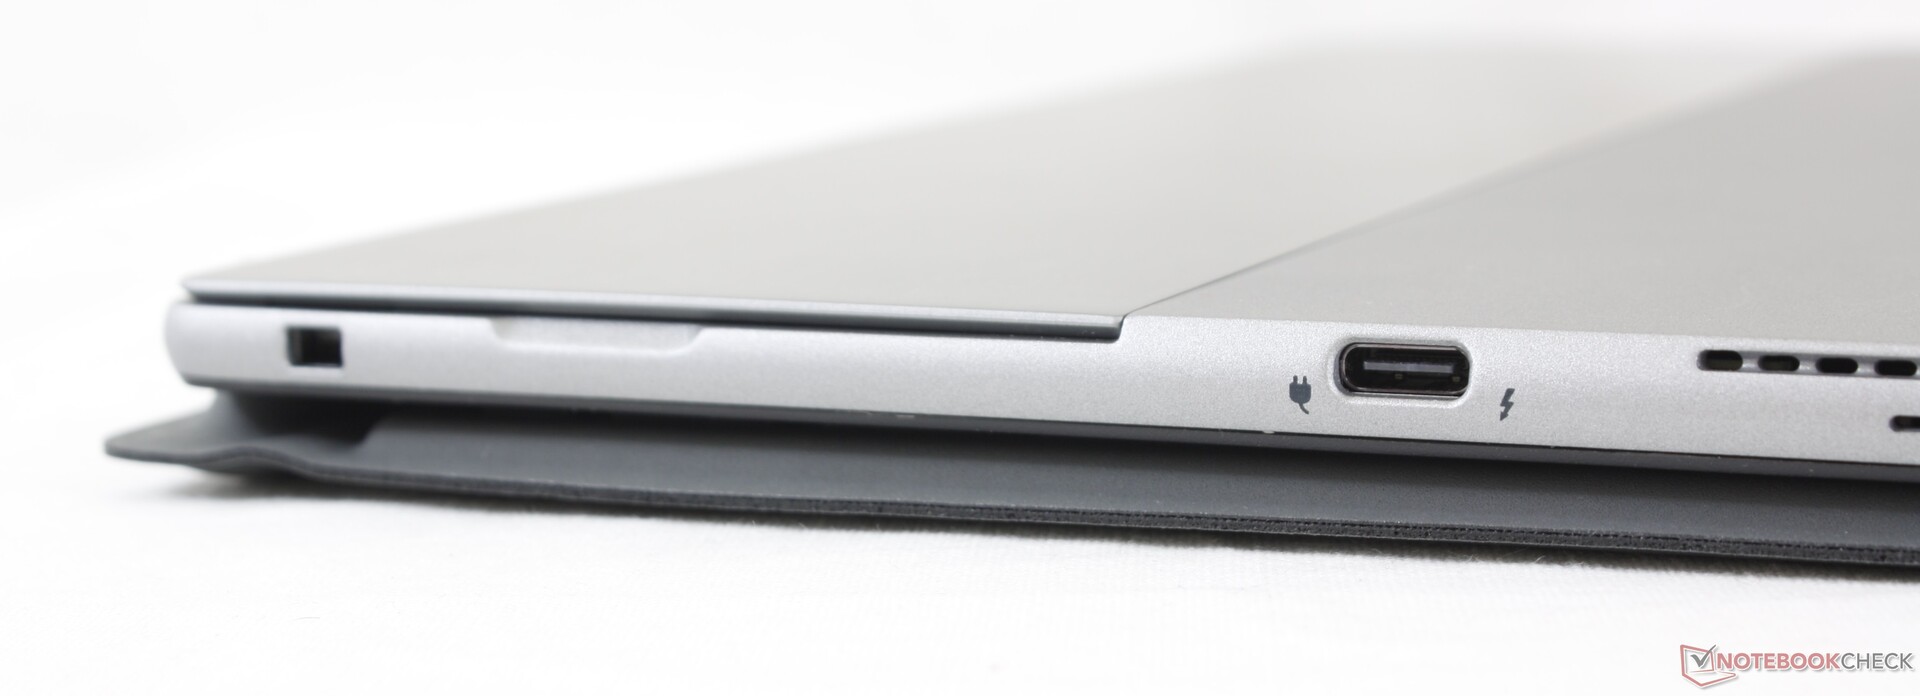
Om du letar efter en surfplatta med Windows och inte vill nöja dig med Microsoft Surface Pro är löstagbara Dell Latitude 13 7320 värd att överväga. Det största säljargumentet är en större och mer ljusstark 13-tumsskärm jämfört med den 12.3-tumsskärm Surface Pro 7 har, som den får plats med trots att Latitude 13 7320 är i princip identisk med Surface Pro 7 storleksmässigt. Dells enhet är dessutom mer energieffektiv och har längre batteritid, vilket gör den bättre om man reser mycket. På kontoret lär de två Thunderbolt 4-portarna säkerligen komma till nytta för dockning; de flesta andra surfplattorna har bara en enda USB C-port.
Lätt Dells bästa löstagbara Windows-maskin hittills. Tunn infattning, en tryckkänslig skärm med 500 nits ljusstyrka och två Thunderbolt 4-portar gör att Latitude 13 7320 skiljer sig från mängden av andra Windows-surfplattor.
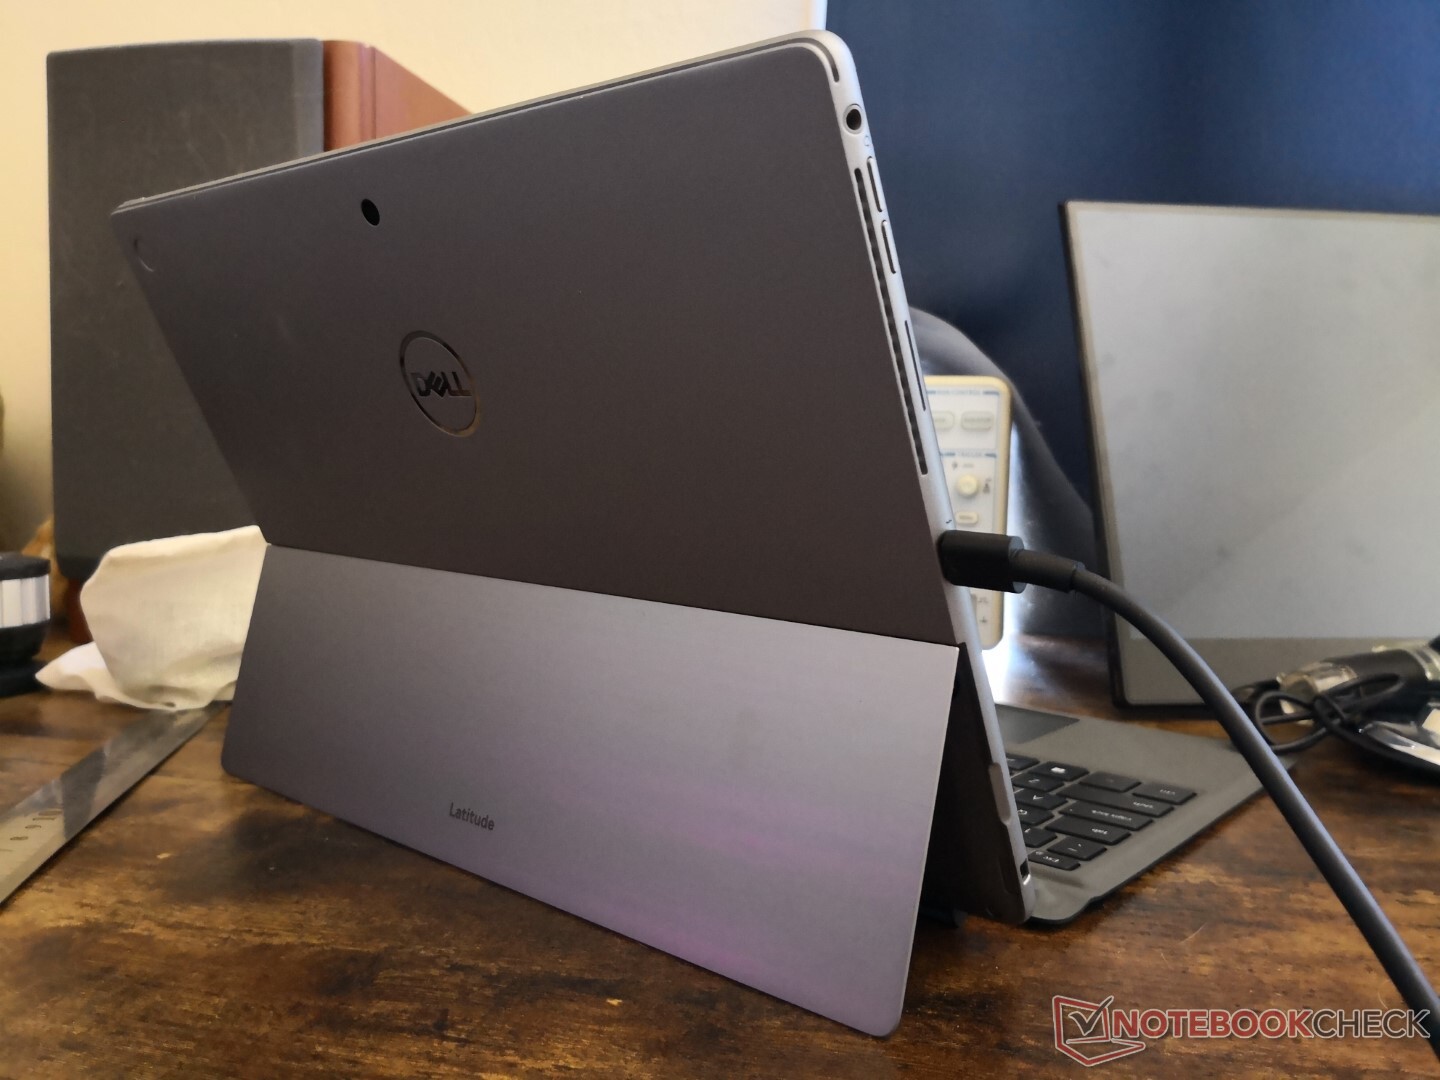
Intresserade köpare bör känna till att fläkten låter relativt mycket när man utför krävande uppgifter och den rena CPU-prestandan från en Core i7-1180G7 ligger strax under en Core i5-1135G7. Nya ägare borde också kolla stället så det inte sitter löst. Latitude 13 7320 är märkbart dyrare än Surface Pro 7, men den har fler funktioner på både in- och utsidan vilket kompenserar för detta.
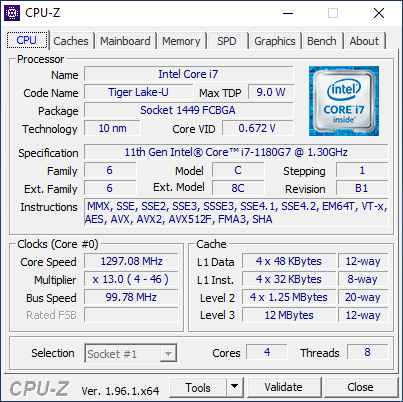
Dell Latitude 13 7320 Detachable, i7-1180G7
- 06/13/2021 v7 (old)
Allen Ngo
Price comparison
