Test: Dell Latitude 7390 (Core i7-8650U, Tryckkänslig skärm) Laptop (Sammanfattning)
| SD Card Reader | |
| average JPG Copy Test (av. of 3 runs) | |
| Lenovo ThinkPad X1 Carbon 2018-20KGS03900 (Toshiba Exceria Pro M501) | |
| Dell Latitude 7390 (Toshiba Exceria Pro M501) | |
| Dell Latitude 7390 (Toshiba Exceria Pro M501 UHS-II) | |
| Dell Latitude 13 7380 (Toshiba Exceria Pro SDXC 64 GB UHS-II) | |
| Asus ZenBook 13 UX331UN (Toshiba Exceria Pro M501 microSDXC 64GB) | |
| Genomsnitt av klass Office (19.8 - 198.5, n=22, senaste 2 åren) | |
| maximum AS SSD Seq Read Test (1GB) | |
| Lenovo ThinkPad X1 Carbon 2018-20KGS03900 (Toshiba Exceria Pro M501) | |
| Dell Latitude 7390 (Toshiba Exceria Pro M501 UHS-II) | |
| Dell Latitude 7390 (Toshiba Exceria Pro M501) | |
| Dell Latitude 13 7380 (Toshiba Exceria Pro SDXC 64 GB UHS-II) | |
| Asus ZenBook 13 UX331UN (Toshiba Exceria Pro M501 microSDXC 64GB) | |
| Genomsnitt av klass Office (27.4 - 249, n=21, senaste 2 åren) | |
| |||||||||||||||||||||||||
Distribution av ljusstyrkan: 86 %
Mitt på batteriet: 303.8 cd/m²
Kontrast: 980:1 (Svärta: 0.31 cd/m²)
ΔE ColorChecker Calman: 2.9 | ∀{0.5-29.43 Ø4.72}
calibrated: 1.72
ΔE Greyscale Calman: 3.7 | ∀{0.09-98 Ø4.97}
95% sRGB (Argyll 1.6.3 3D)
63% AdobeRGB 1998 (Argyll 1.6.3 3D)
67.8% AdobeRGB 1998 (Argyll 3D)
95.1% sRGB (Argyll 3D)
67.8% Display P3 (Argyll 3D)
Gamma: 2.118
CCT: 6323 K
| Dell Latitude 7390 LGD059B, IPS, 13.3", 1920x1080 | Dell Latitude 7390 AU Optronics AUO462D / B133HAN [DELL P/N:F7VDJ], IPS, 13.3", 1920x1080 | Lenovo ThinkPad X1 Carbon 2018-20KGS03900 B140QAN02.0, IPS, 14", 2560x1440 | HP Elitebook 1040 G4-2XU40UT Chi Mei CMN14D7, IPS, 14", 1920x1080 | Asus ZenBook 13 UX331UN AU Optronics B133HAN04.9, IPS, 13.3", 1920x1080 | |
|---|---|---|---|---|---|
| Display | -4% | 27% | 1% | -7% | |
| Display P3 Coverage (%) | 67.8 | 65.1 -4% | 87.7 29% | 66.8 -1% | 63.3 -7% |
| sRGB Coverage (%) | 95.1 | 90.8 -5% | 100 5% | 97.1 2% | 86.7 -9% |
| AdobeRGB 1998 Coverage (%) | 67.8 | 65.9 -3% | 99.9 47% | 69 2% | 63.4 -6% |
| Response Times | -25% | -37% | 4% | 1% | |
| Response Time Grey 50% / Grey 80% * (ms) | 36.8 ? | 48.8 ? -33% | 59.2 ? -61% | 34.4 ? 7% | 44 ? -20% |
| Response Time Black / White * (ms) | 30.4 ? | 35.2 ? -16% | 34.4 ? -13% | 30 ? 1% | 24 ? 21% |
| PWM Frequency (Hz) | 26040 ? | ||||
| Screen | -5% | 35% | -1% | -3% | |
| Brightness middle (cd/m²) | 303.8 | 329 8% | 578 90% | 295.9 -3% | 329 8% |
| Brightness (cd/m²) | 289 | 316 9% | 533 84% | 287 -1% | 306 6% |
| Brightness Distribution (%) | 86 | 92 7% | 84 -2% | 87 1% | 86 0% |
| Black Level * (cd/m²) | 0.31 | 0.25 19% | 0.38 -23% | 0.23 26% | 0.3 3% |
| Contrast (:1) | 980 | 1316 34% | 1521 55% | 1287 31% | 1097 12% |
| Colorchecker dE 2000 * | 2.9 | 4.3 -48% | 1.9 34% | 2.83 2% | 4.07 -40% |
| Colorchecker dE 2000 max. * | 5.79 | 7.8 -35% | 3.8 34% | 7.34 -27% | 7.05 -22% |
| Colorchecker dE 2000 calibrated * | 1.72 | 2.5 -45% | 0.8 53% | ||
| Greyscale dE 2000 * | 3.7 | 3.6 3% | 3 19% | 5.2 -41% | 2.76 25% |
| Gamma | 2.118 104% | 2.43 91% | 2.14 103% | 2.28 96% | 2.56 86% |
| CCT | 6323 103% | 6928 94% | 6377 102% | 7056 92% | 6915 94% |
| Color Space (Percent of AdobeRGB 1998) (%) | 63 | 59.1 -6% | 88.8 41% | 63 0% | 56 -11% |
| Color Space (Percent of sRGB) (%) | 95 | 90.6 -5% | 100 5% | 97 2% | 86 -9% |
| Totalt genomsnitt (program/inställningar) | -11% /
-8% | 8% /
25% | 1% /
0% | -3% /
-3% |
* ... mindre är bättre
Visa svarstider
| ↔ Svarstid svart till vitt | ||
|---|---|---|
| 30.4 ms ... stiga ↗ och falla ↘ kombinerat | ↗ 18.8 ms stiga | 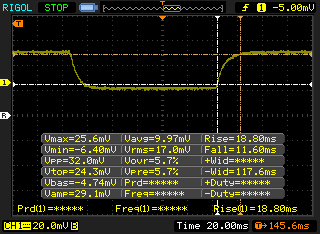 |
| ↘ 11.6 ms hösten | ||
| Skärmen visar långsamma svarsfrekvenser i våra tester och kommer att vara otillfredsställande för spelare. I jämförelse sträcker sig alla testade enheter från 0.1 (minst) till 240 (maximalt) ms. » 82 % av alla enheter är bättre. Detta innebär att den uppmätta svarstiden är sämre än genomsnittet av alla testade enheter (19.8 ms). | ||
| ↔ Svarstid 50 % grått till 80 % grått | ||
| 36.8 ms ... stiga ↗ och falla ↘ kombinerat | ↗ 18 ms stiga | 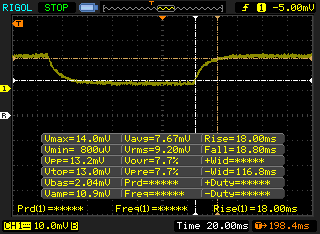 |
| ↘ 18.8 ms hösten | ||
| Skärmen visar långsamma svarsfrekvenser i våra tester och kommer att vara otillfredsställande för spelare. I jämförelse sträcker sig alla testade enheter från 0.165 (minst) till 636 (maximalt) ms. » 53 % av alla enheter är bättre. Detta innebär att den uppmätta svarstiden är sämre än genomsnittet av alla testade enheter (31 ms). | ||
Skärmflimmer / PWM (Puls-Width Modulation)
| Skärmflimmer / PWM upptäcktes inte | 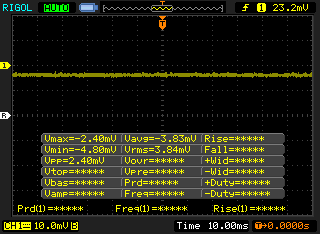 | ||
Som jämförelse: 52 % av alla testade enheter använder inte PWM för att dämpa skärmen. Om PWM upptäcktes mättes ett medelvärde av 7769 (minst: 5 - maximum: 343500) Hz. | |||

| wPrime 2.10 - 1024m | |
| Dell Latitude 13 7380 | |
| Genomsnitt av klass Office (274 - 675, n=7, senaste 2 åren) | |
| HP Elitebook 1040 G4-2XU40UT | |
| Genomsnitt Intel Core i7-8650U (268 - 335, n=3) | |
| Dell Latitude 7390 | |
* ... mindre är bättre
| PCMark 8 Home Score Accelerated v2 | 3886 poäng | |
| PCMark 8 Creative Score Accelerated v2 | 5083 poäng | |
| PCMark 8 Work Score Accelerated v2 | 5197 poäng | |
| PCMark 10 Score | 4053 poäng | |
Hjälp | ||
| Dell Latitude 7390 Samsung PM961 MZVLW256HEHP | Dell Latitude 7390 SK hynix SC311 M.2 | Lenovo ThinkPad X1 Carbon 2018-20KGS03900 Samsung SSD PM981 MZVLB512HAJQ | HP Elitebook 1040 G4-2XU40UT Toshiba XG4 NVMe (THNSN5512GPUK) | Genomsnitt Samsung PM961 MZVLW256HEHP | |
|---|---|---|---|---|---|
| AS SSD | -53% | 90% | -3% | -81% | |
| Copy Game MB/s (MB/s) | 352 | 1107 214% | 394.2 12% | 537 ? 53% | |
| Copy Program MB/s (MB/s) | 247.4 | 460.2 86% | 133.7 -46% | 343 ? 39% | |
| Copy ISO MB/s (MB/s) | 818 | 1247 52% | 534 -35% | 1004 ? 23% | |
| Score Total (Points) | 2215 | 857 -61% | 3529 59% | 2299 4% | 2565 ? 16% |
| Score Write (Points) | 501 | 311 -38% | 1801 259% | 848 69% | 587 ? 17% |
| Score Read (Points) | 1158 | 359 -69% | 1168 1% | 979 -15% | 1378 ? 19% |
| Access Time Write * (ms) | 0.032 | 0.056 -75% | 0.027 16% | 0.038 -19% | 0.4637 ? -1349% |
| Access Time Read * (ms) | 0.063 | 0.075 -19% | 0.029 54% | 0.105 -67% | 0.06777 ? -8% |
| 4K-64 Write (MB/s) | 302.4 | 210.3 -30% | 1529 406% | 662 119% | 419 ? 39% |
| 4K-64 Read (MB/s) | 932 | 282.8 -70% | 876 -6% | 782 -16% | 1112 ? 19% |
| 4K Write (MB/s) | 115.2 | 63.6 -45% | 134.3 17% | 100.1 -13% | 91.6 ? -20% |
| 4K Read (MB/s) | 49.43 | 27.31 -45% | 52.4 6% | 38.49 -22% | 45.1 ? -9% |
| Seq Write (MB/s) | 830 | 369.9 -55% | 1376 66% | 863 4% | 960 ? 16% |
| Seq Read (MB/s) | 1761 | 485.5 -72% | 2396 36% | 1585 -10% | 2019 ? 15% |
* ... mindre är bättre

| 3DMark 06 Standard Score | 10376 poäng | |
| 3DMark 11 Performance | 1860 poäng | |
| 3DMark Ice Storm Standard Score | 65709 poäng | |
| 3DMark Cloud Gate Standard Score | 7770 poäng | |
| 3DMark Fire Strike Score | 915 poäng | |
Hjälp | ||
| låg | med. | hög | ultra | |
|---|---|---|---|---|
| BioShock Infinite (2013) | 56 | 30 | 24 | 8 |
Ljudnivå
| Låg belastning |
| 28.2 / 28.2 / 28.2 dB(A) |
| Hög belastning |
| 31.5 / 42.7 dB(A) |
 | ||
30 dB tyst 40 dB(A) hörbar 50 dB(A) högt ljud |
||
min: | ||
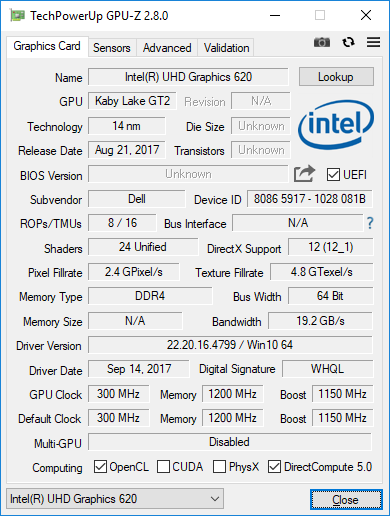
| Dell Latitude 7390 UHD Graphics 620, i7-8650U, Samsung PM961 MZVLW256HEHP | Dell Latitude 7390 UHD Graphics 620, i5-8350U, SK hynix SC311 M.2 | Dell Latitude 13 7380 HD Graphics 620, i7-7600U, Samsung PM961 MZVLW256HEHP | Lenovo ThinkPad X1 Carbon 2018-20KGS03900 UHD Graphics 620, i5-8550U, Samsung SSD PM981 MZVLB512HAJQ | HP Elitebook 1040 G4-2XU40UT HD Graphics 630, i7-7820HQ, Toshiba XG4 NVMe (THNSN5512GPUK) | Asus ZenBook 13 UX331UN GeForce MX150, i5-8550U, SK Hynix HFS256G39TND-N210A | |
|---|---|---|---|---|---|---|
| Noise | -3% | 3% | -2% | 2% | -8% | |
| av / miljö * (dB) | 28.2 | 29.5 -5% | 28 1% | 28.9 -2% | 28.2 -0% | 30.13 -7% |
| Idle Minimum * (dB) | 28.2 | 29.5 -5% | 28 1% | 28.9 -2% | 28.2 -0% | 30.13 -7% |
| Idle Average * (dB) | 28.2 | 29.5 -5% | 28 1% | 28.9 -2% | 28.2 -0% | 30.3 -7% |
| Idle Maximum * (dB) | 28.2 | 29.5 -5% | 29.6 -5% | 32.5 -15% | 28.2 -0% | 30.3 -7% |
| Load Average * (dB) | 31.5 | 32.4 -3% | 30.6 3% | 35.1 -11% | 33.3 -6% | 39.2 -24% |
| Load Maximum * (dB) | 42.7 | 39.9 7% | 35.4 17% | 35.1 18% | 35.3 17% | 41 4% |
* ... mindre är bättre
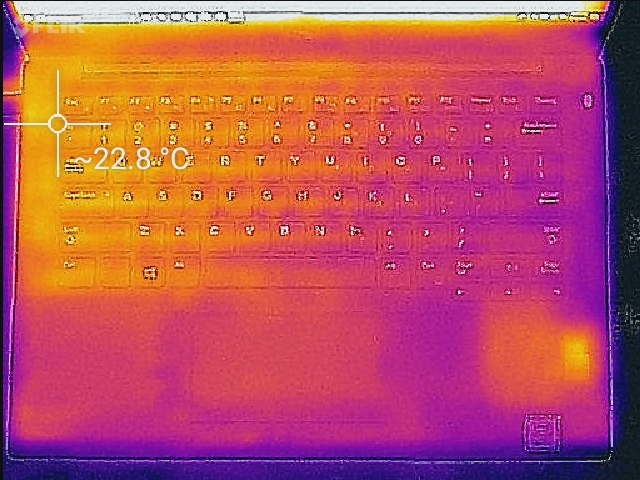
(±) Den maximala temperaturen på ovansidan är 44.4 °C / 112 F, jämfört med genomsnittet av 34.3 °C / 94 F , allt från 21.2 till 62.5 °C för klassen Office.
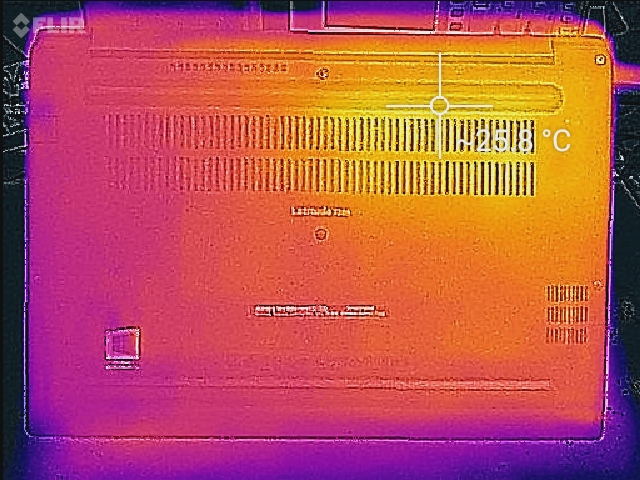
(-) Botten värms upp till maximalt 47.4 °C / 117 F, jämfört med genomsnittet av 36.8 °C / 98 F
(+) Vid tomgångsbruk är medeltemperaturen för ovansidan 21.9 °C / 71 F, jämfört med enhetsgenomsnittet på 29.5 °C / ### class_avg_f### F.
(+) Handledsstöden och pekplattan är kallare än hudtemperaturen med maximalt 29.4 °C / 84.9 F och är därför svala att ta på.
(±) Medeltemperaturen för handledsstödsområdet på liknande enheter var 27.5 °C / 81.5 F (-1.9 °C / -3.4 F).
Dell Latitude 7390 ljudanalys
(-) | inte särskilt höga högtalare (71.4 dB)
Bas 100 - 315 Hz
(±) | reducerad bas - i genomsnitt 12.4% lägre än medianen
(±) | linjäriteten för basen är genomsnittlig (13.6% delta till föregående frekvens)
Mellan 400 - 2000 Hz
(+) | balanserad mellan - endast 3.4% från medianen
(±) | linjäriteten för mids är genomsnittlig (10.3% delta till föregående frekvens)
Högsta 2 - 16 kHz
(+) | balanserade toppar - endast 3.1% från medianen
(±) | linjäriteten för toppar är genomsnittlig (12.6% delta till föregående frekvens)
Totalt 100 - 16 000 Hz
(±) | linjäriteten för det totala ljudet är genomsnittlig (20.4% skillnad mot median)
Jämfört med samma klass
» 45% av alla testade enheter i den här klassen var bättre, 10% liknande, 45% sämre
» Den bästa hade ett delta på 7%, genomsnittet var 21%, sämst var 53%
Jämfört med alla testade enheter
» 53% av alla testade enheter var bättre, 8% liknande, 39% sämre
» Den bästa hade ett delta på 4%, genomsnittet var 24%, sämst var 134%
Lenovo ThinkPad X1 Carbon 2018-20KGS03900 ljudanalys
(+) | högtalare kan spela relativt högt (83.6 dB)
Bas 100 - 315 Hz
(-) | nästan ingen bas - i genomsnitt 25.9% lägre än medianen
(±) | linjäriteten för basen är genomsnittlig (9.8% delta till föregående frekvens)
Mellan 400 - 2000 Hz
(+) | balanserad mellan - endast 3.8% från medianen
(±) | linjäriteten för mids är genomsnittlig (9% delta till föregående frekvens)
Högsta 2 - 16 kHz
(+) | balanserade toppar - endast 2.1% från medianen
(+) | toppar är linjära (4% delta till föregående frekvens)
Totalt 100 - 16 000 Hz
(±) | linjäriteten för det totala ljudet är genomsnittlig (18.7% skillnad mot median)
Jämfört med samma klass
» 34% av alla testade enheter i den här klassen var bättre, 7% liknande, 59% sämre
» Den bästa hade ett delta på 7%, genomsnittet var 21%, sämst var 53%
Jämfört med alla testade enheter
» 43% av alla testade enheter var bättre, 8% liknande, 50% sämre
» Den bästa hade ett delta på 4%, genomsnittet var 24%, sämst var 134%
| Låg belastning | |
| Hög belastning |
|
Förklaring:
min: | |
| Dell Latitude 7390 i7-8650U, UHD Graphics 620, Samsung PM961 MZVLW256HEHP, IPS, 1920x1080, 13.3" | Dell Latitude 7390 i5-8350U, UHD Graphics 620, SK hynix SC311 M.2, IPS, 1920x1080, 13.3" | Dell Latitude 13 7380 i7-7600U, HD Graphics 620, Samsung PM961 MZVLW256HEHP, IPS, 1920x1080, 13.3" | Lenovo ThinkPad X1 Carbon 2018-20KGS03900 i5-8550U, UHD Graphics 620, Samsung SSD PM981 MZVLB512HAJQ, IPS, 2560x1440, 14" | HP Elitebook 1040 G4-2XU40UT i7-7820HQ, HD Graphics 630, Toshiba XG4 NVMe (THNSN5512GPUK), IPS, 1920x1080, 14" | Asus ZenBook 13 UX331UN i5-8550U, GeForce MX150, SK Hynix HFS256G39TND-N210A, IPS, 1920x1080, 13.3" | |
|---|---|---|---|---|---|---|
| Power Consumption | -4% | 15% | -37% | -37% | 7% | |
| Idle Minimum * (Watt) | 3.3 | 2.34 29% | 3.2 3% | 3.8 -15% | 5.1 -55% | 2.2 33% |
| Idle Average * (Watt) | 5.9 | 5.6 5% | 5.5 7% | 8.9 -51% | 7 -19% | 5 15% |
| Idle Maximum * (Watt) | 6.2 | 6.5 -5% | 6.1 2% | 11.9 -92% | 11.7 -89% | 8 -29% |
| Load Average * (Watt) | 43.2 | 43 -0% | 29.5 32% | 47.5 -10% | 41.2 5% | 33 24% |
| Load Maximum * (Watt) | 45.2 | 67.4 -49% | 32 29% | 52.5 -16% | 56.9 -26% | 49.4 -9% |
* ... mindre är bättre
| Dell Latitude 7390 i7-8650U, UHD Graphics 620, 60 Wh | Dell Latitude 7390 i5-8350U, UHD Graphics 620, 60 Wh | Dell Latitude 13 7380 i7-7600U, HD Graphics 620, 60 Wh | Lenovo ThinkPad X1 Carbon 2018-20KGS03900 i5-8550U, UHD Graphics 620, 57 Wh | HP Elitebook 1040 G4-2XU40UT i7-7820HQ, HD Graphics 630, 67 Wh | Asus ZenBook 13 UX331UN i5-8550U, GeForce MX150, 50 Wh | |
|---|---|---|---|---|---|---|
| Batteridrifttid | -5% | -22% | 0% | -19% | ||
| WiFi v1.3 (h) | 11.1 | 10.5 -5% | 8.7 -22% | 11.1 0% | 9 -19% | |
| Reader / Idle (h) | 27.7 | 26.6 | 22.1 | 22.5 | 20.7 | |
| Load (h) | 1.5 | 2.4 | 1.8 | 1.6 | 1.8 |
För
Emot

Läs den fullständiga versionen av den här recensionen på engelska här.
Vår lista över klagomål har krympt sen förra månadens recension av Latitude 7390, i huvudsak tack vare skillnaderna i konfigurationen av dagens recensionsenhet, men även till viss del på grund av att en del av dessa saker kan ha varit ett resultat av egenheter hos dom individuella maskinerna. Uppgraderingen till Core i7 för definitivt med sig en del prestandafördelar — framförallt vid ihållande belastning, där hastigheten inte bara är högre utan också är mer konsekvent. Men för en stor majoritet av användarna är Core i5-modellen mer än tillräckligt kraftfull och kostnadsbesparingen kan göra den till ett mer attraktivt alternativ. Samma logik gäller i huvudsak även dess NVMe SSD (jämfört med det konventionella M.2 SATA-alternativet som vi såg i förra månadens Latitude 7390-testenhet), som är snabbare men som också är dyrare och genererar mer värme. Det mest förvånande är dock att den tryckkänsliga antireflex-skärmen från den här konfigurationen verkligen är antireflekterande; den har inga nackdelar jämfört med förra månadens konventionella (icke-tryckkänsliga) panel.
Den är definitivt dyr, men det finns få andra laptops i dess klass som imponerar så genomgående som Latitude 7390.
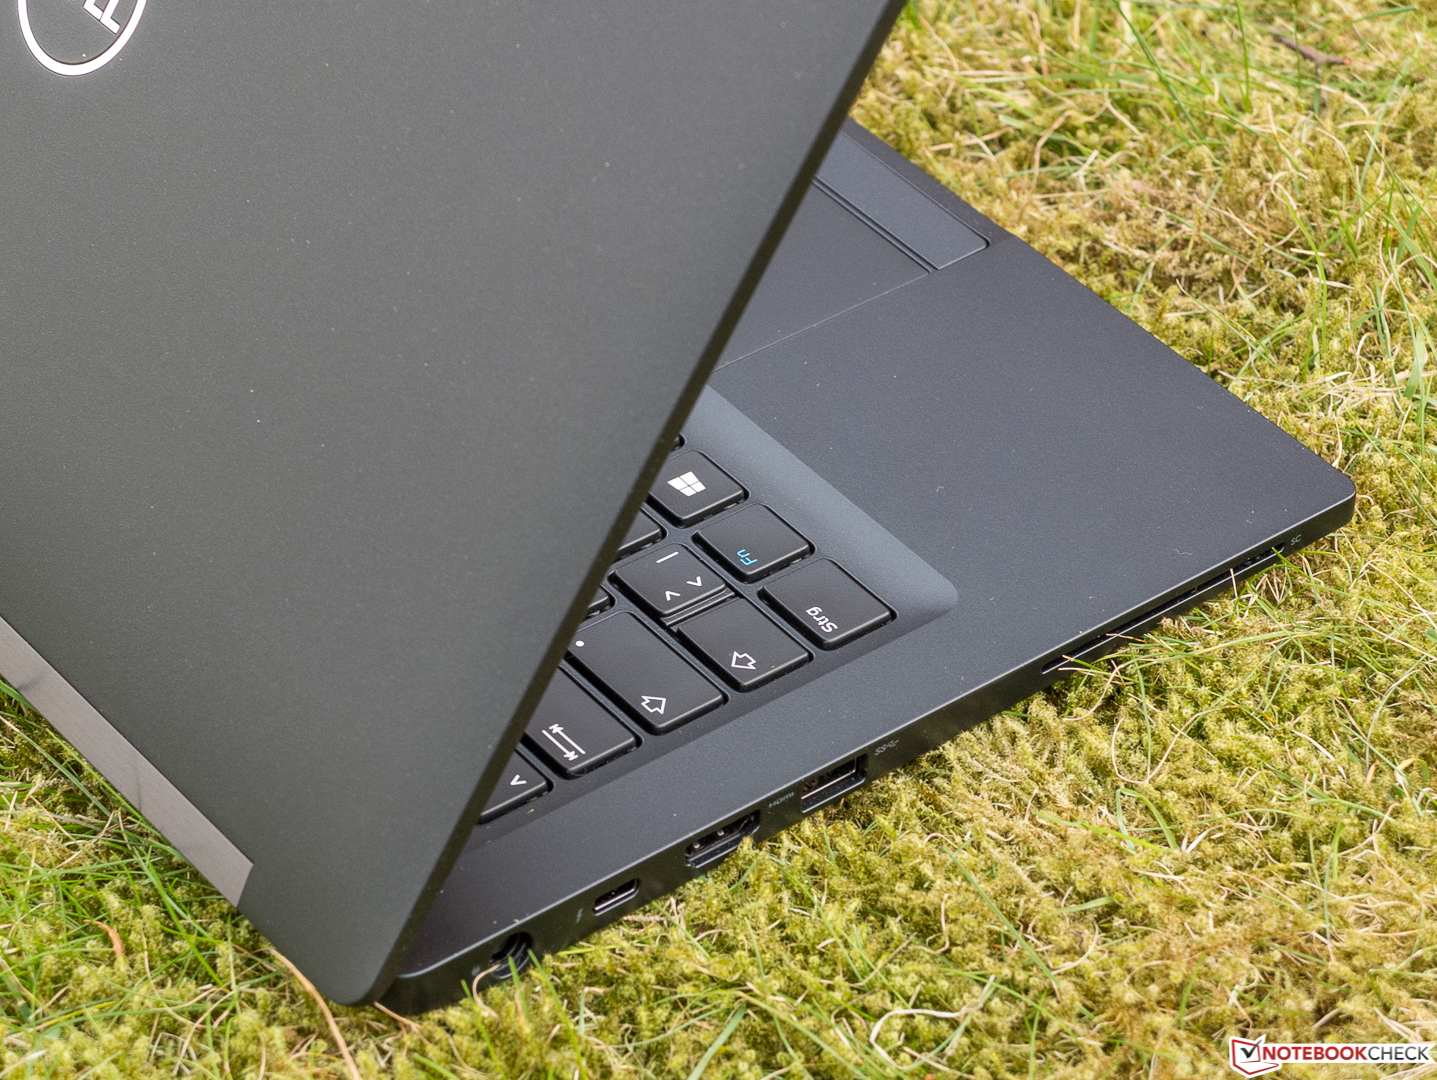
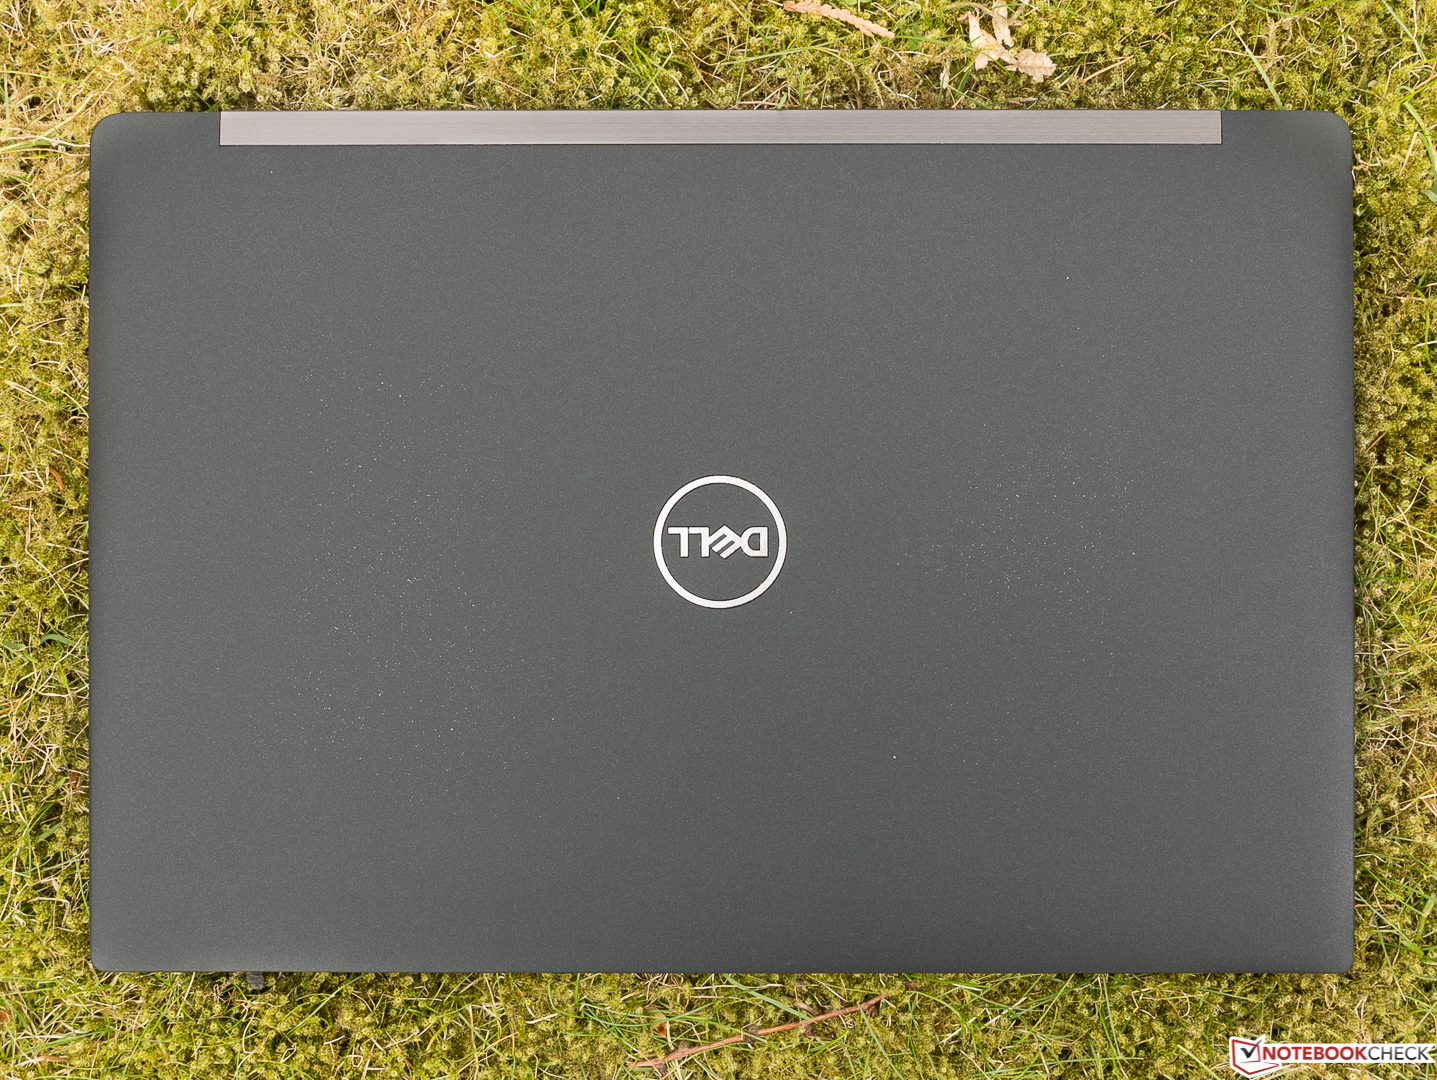
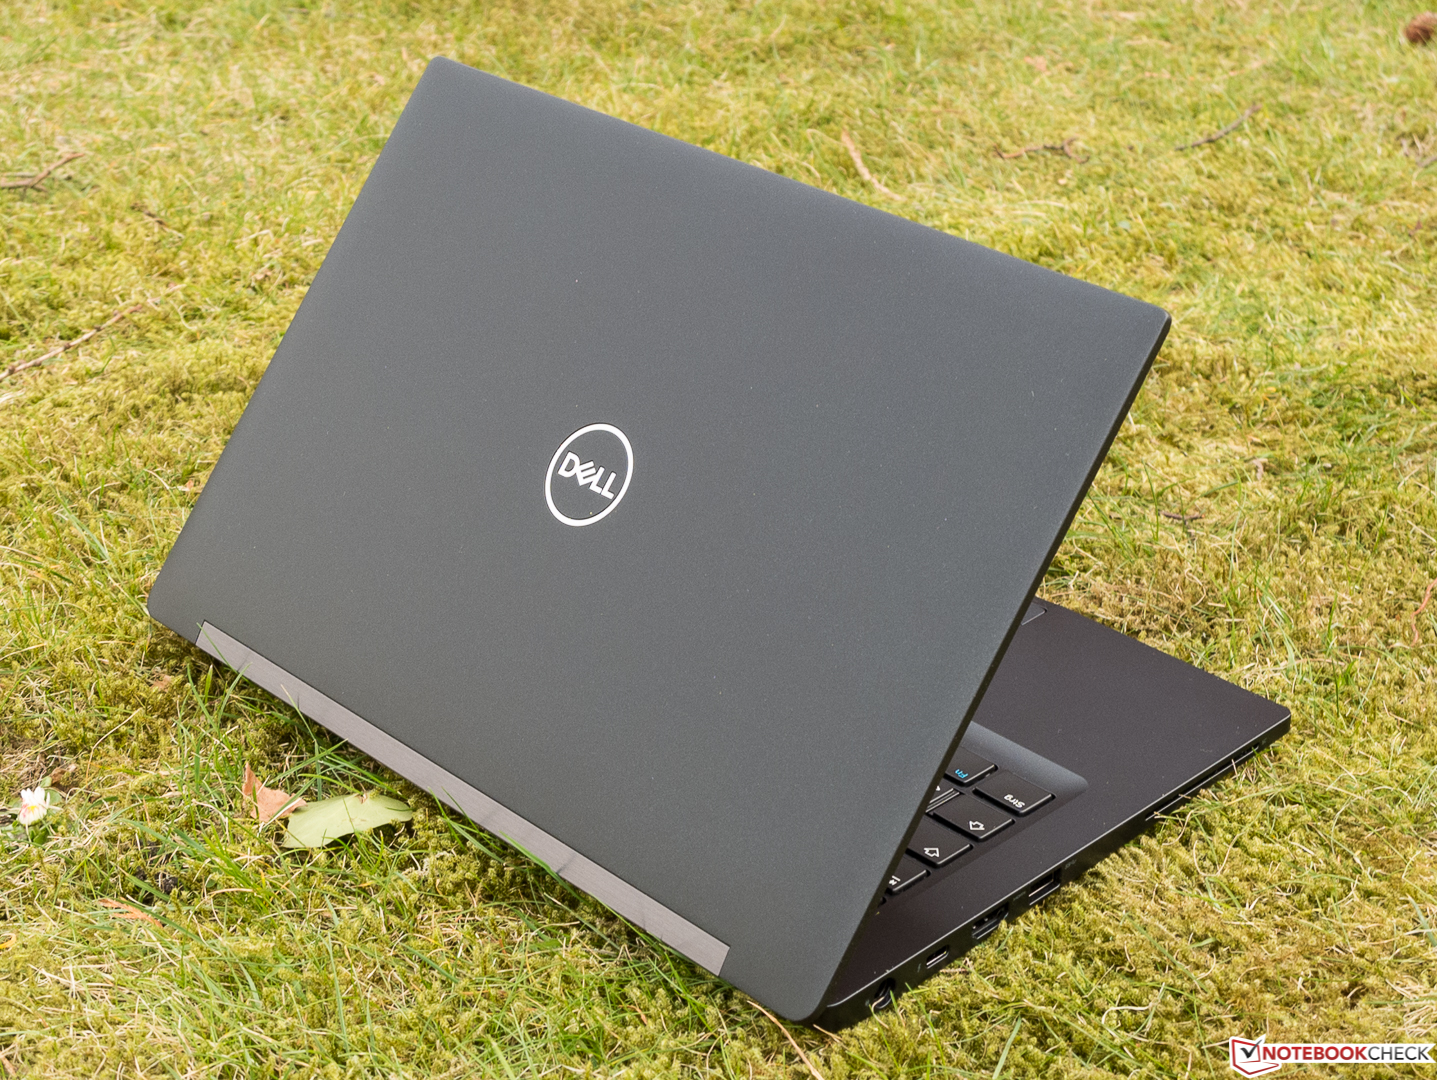
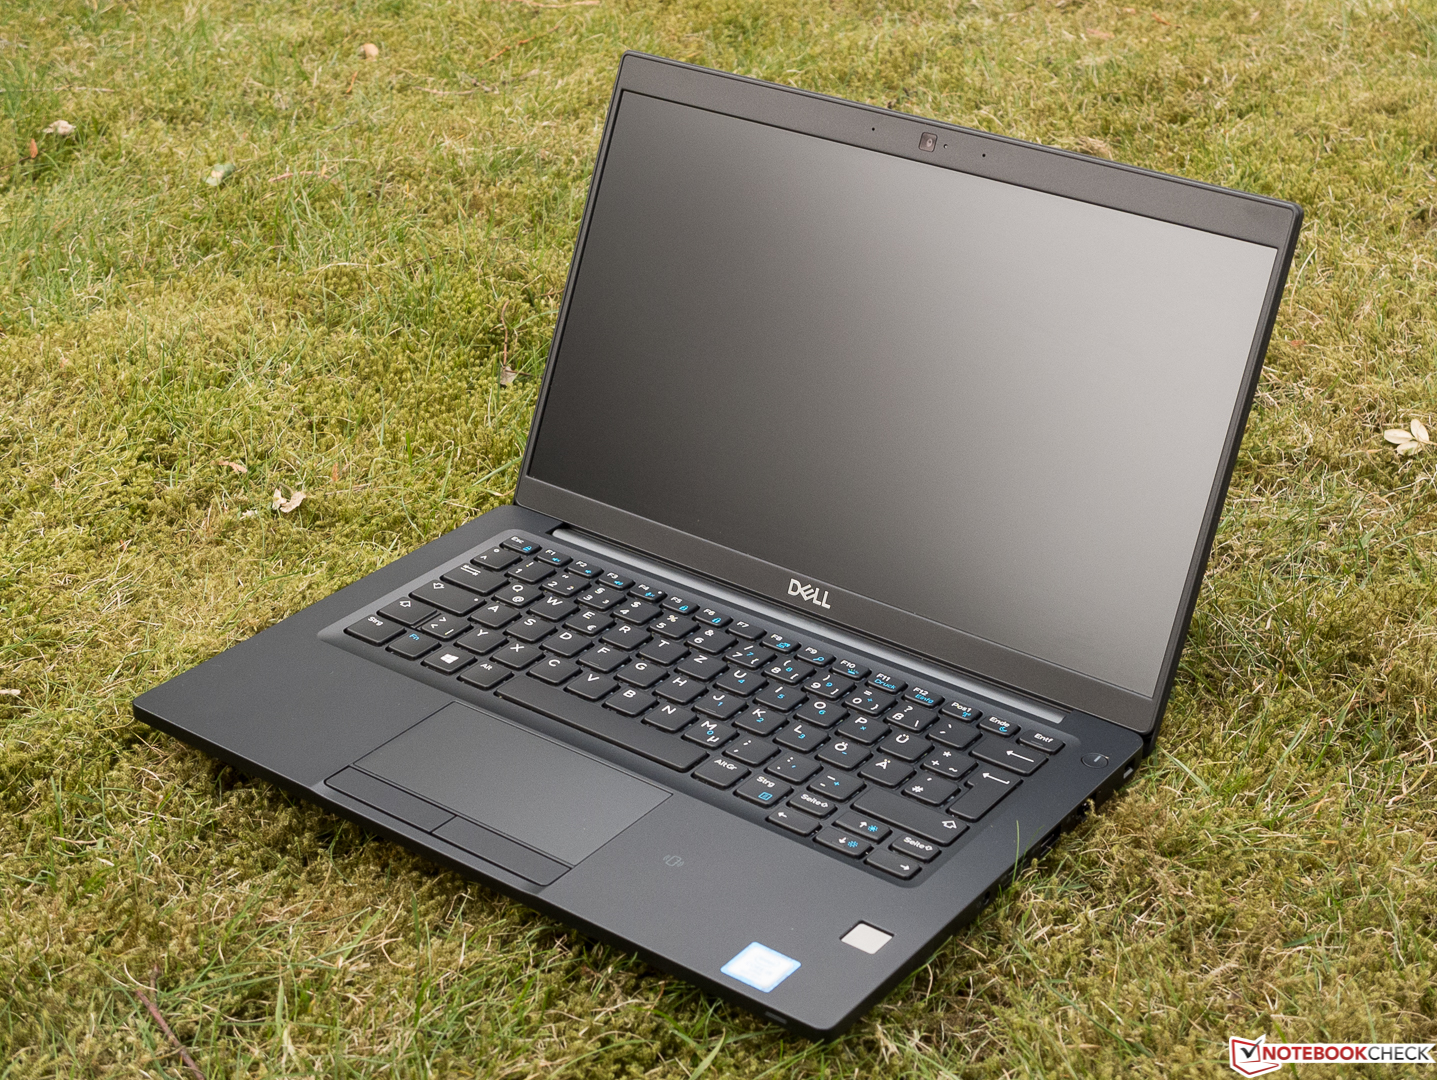
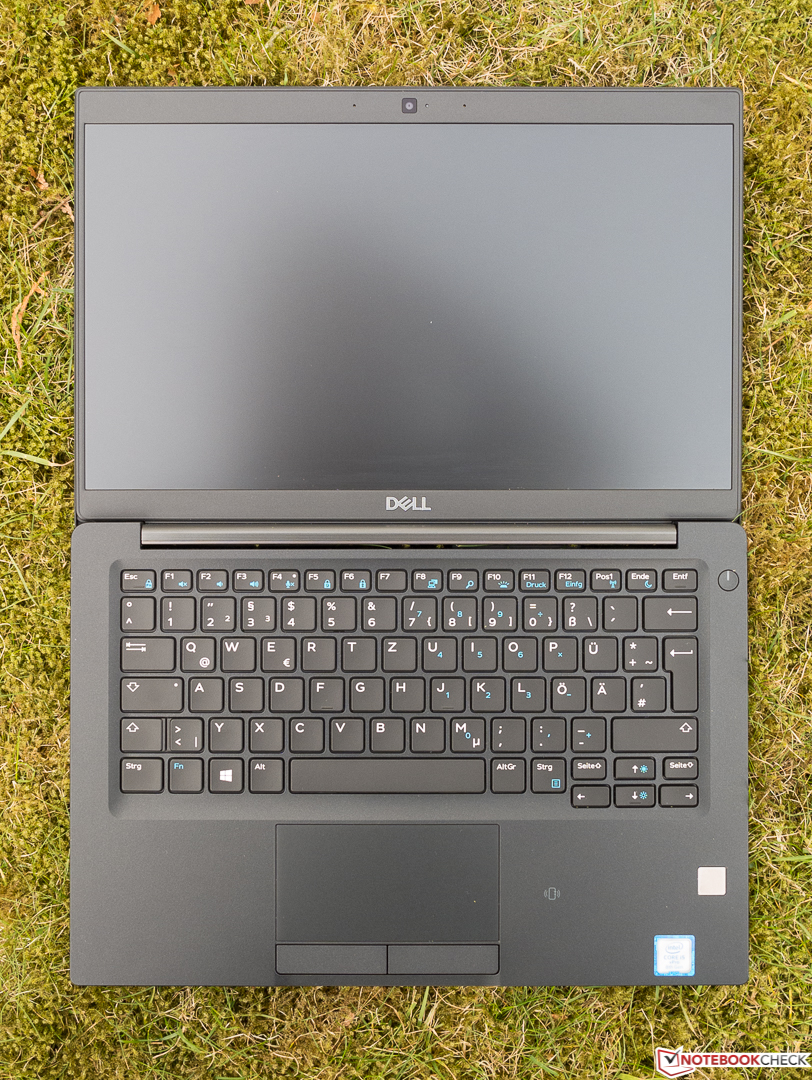
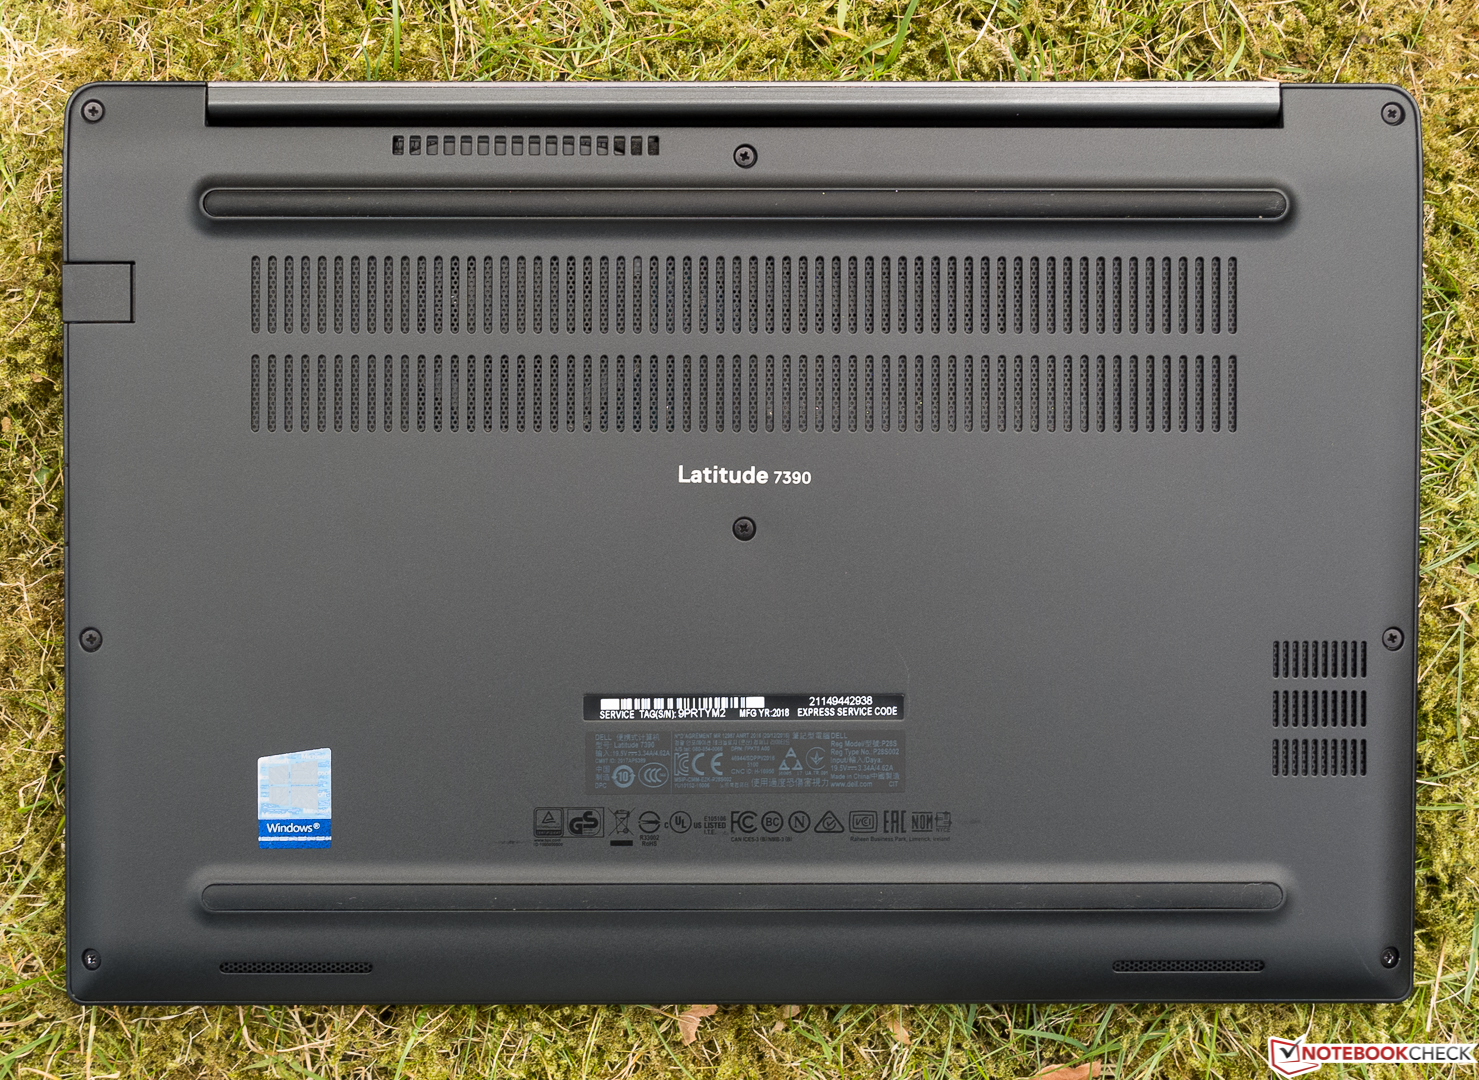
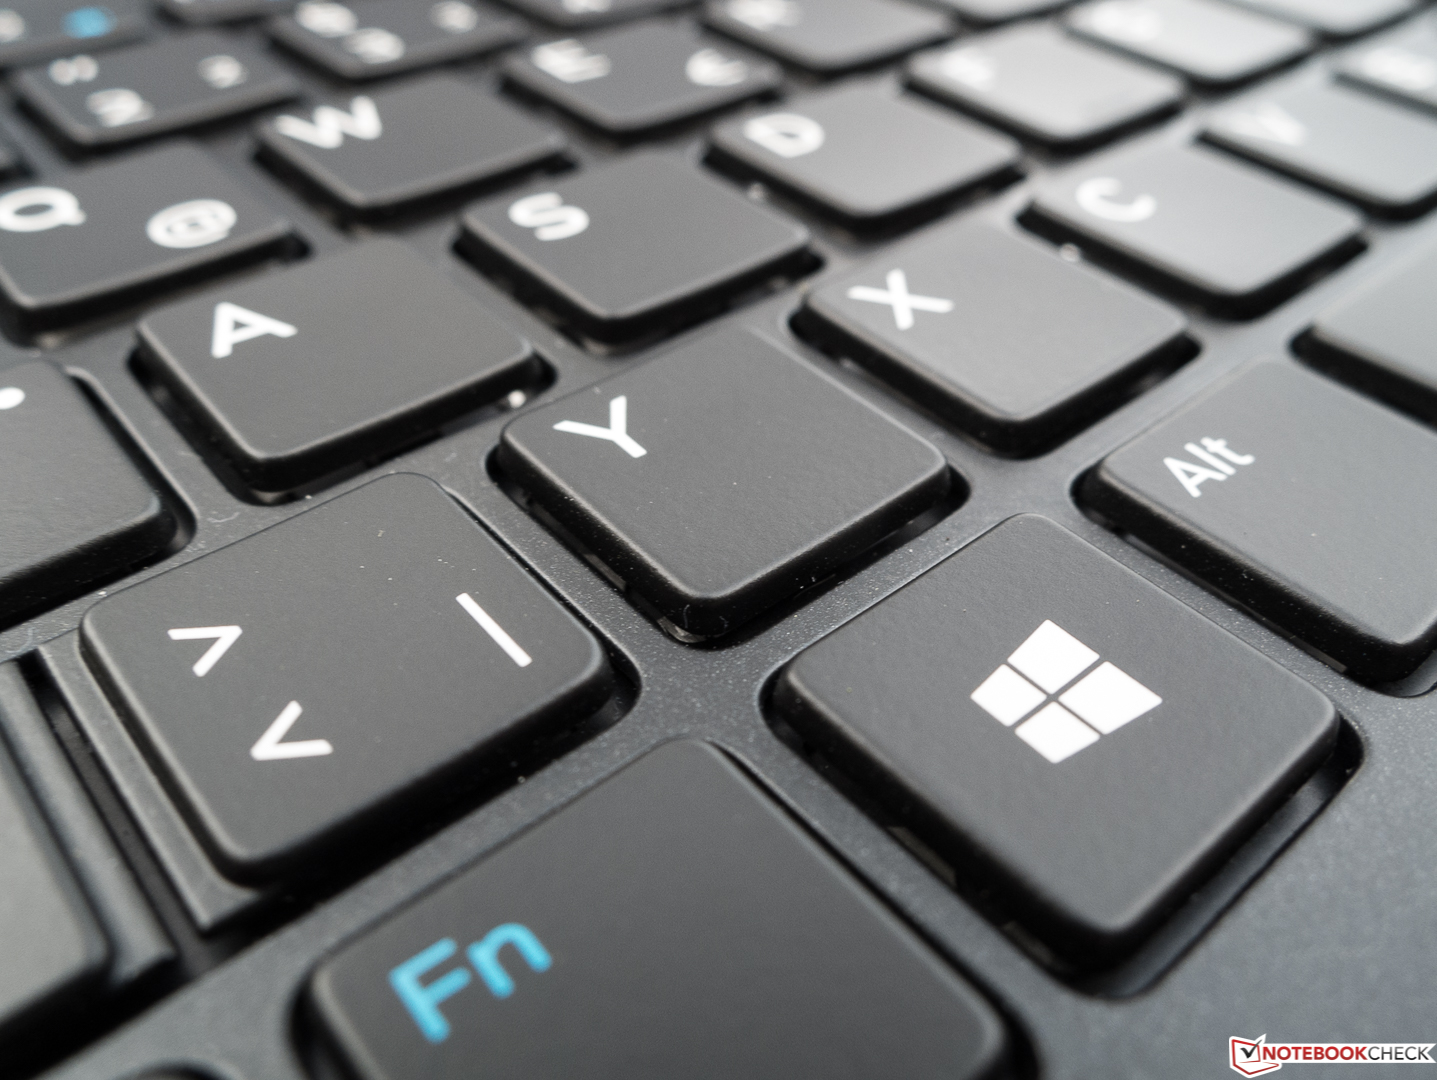
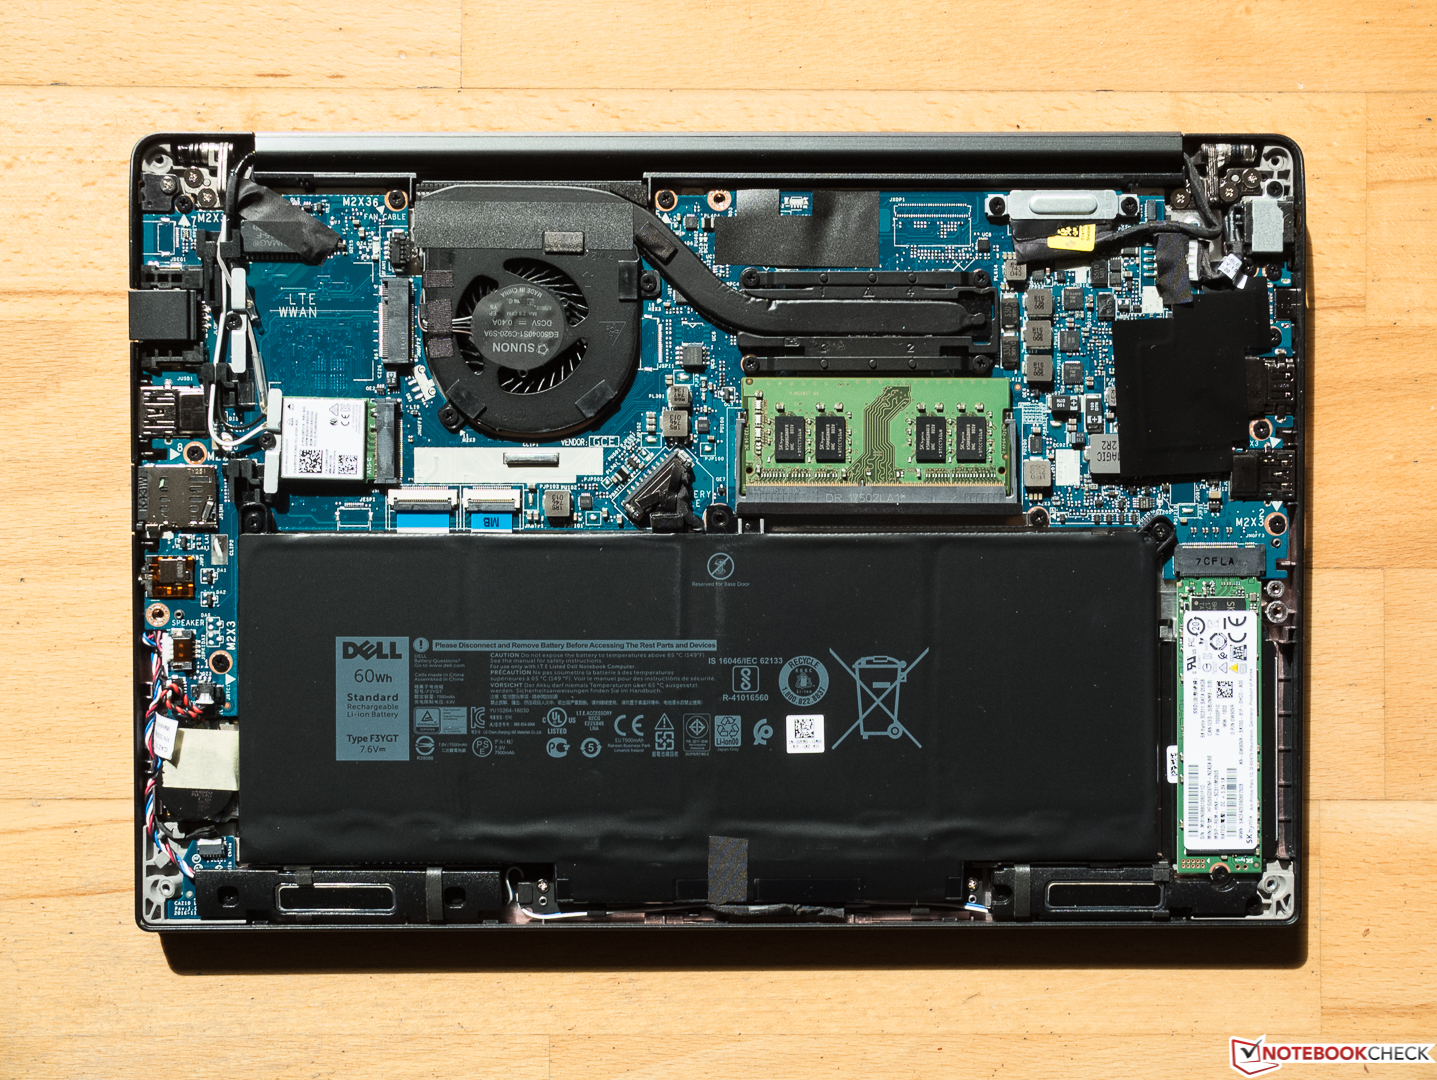
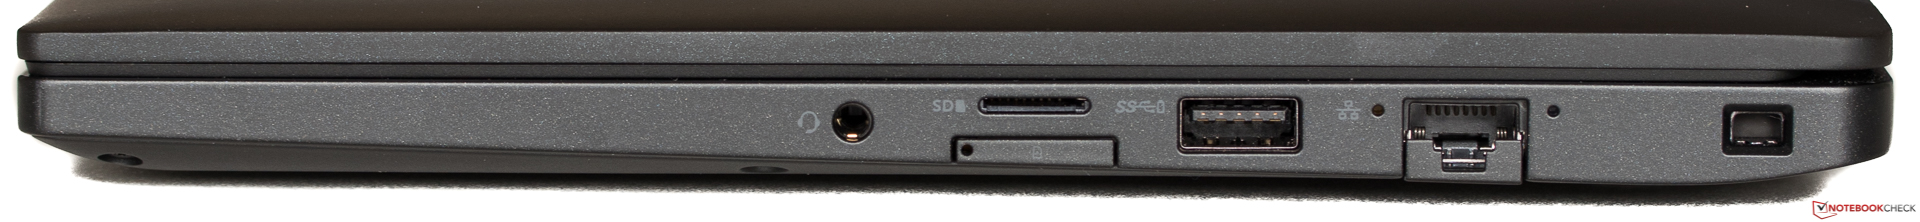
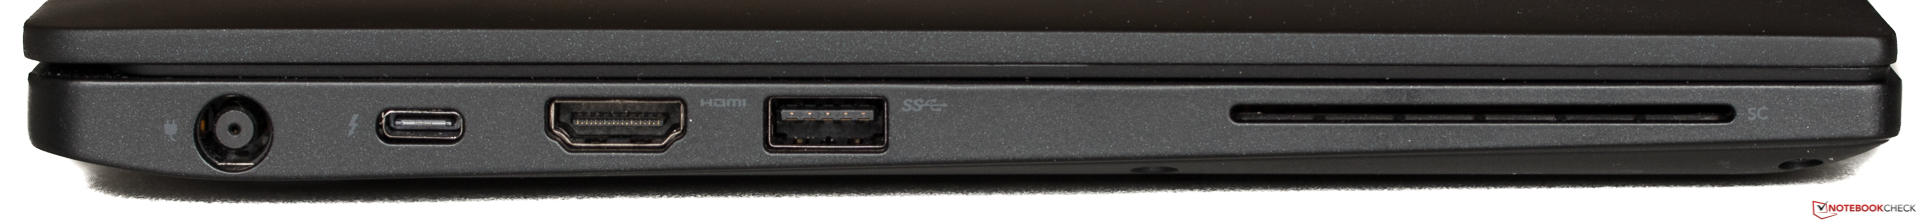
Den långa listan över fördelar gäller i övrigt fortfarande. 7390 har felfri konstruktionskvalitet och är gediget byggd samtidigt som den lyckas vara lätt och ha ett litet fotavtryck. Service är lätt tack vare den löstagbara bottenluckan. Det grundliga utbudet av portar och dom robusta säkerhetsfunktionerna kommer uppskattas av företags-kämpar och IT-departement. Tangentbordet och styrplattan på dagens recensionsex är båda totalt sett riktigt bra och skärmens panel förblir attraktiv trots skillnaden i komponenter som kommer med touch-förmågan. Slutligen så håller sig enheten tyst en majoritet av tiden och batteritiden är lång. Runda av allt det med 3 års "på plats"-garanti och du har en riktigt stark tävlande i företags-segmentet.
För 19 000 kronor är den definitivt inte billig, men det finns få andra laptops i dess klass som imponerar så genomgående som Latitude 7390. Lenovos X1 Carbon och HP:s EliteBook Folio 1040 G4 är troligen dom största konkurrenterna — men det är i ärlighetens namn svårt att hamna fel med någon av dom här maskinerna.
Dell Latitude 7390
- 05/10/2018 v6 (old)
Steve Schardein
Price comparison
