Det här är HP:s svar på Apple MacBook Pro: Recension av Envy 15 Creator 2020 med Core i7 (Sammanfattning)
Gradering | Datum | Modell | Vikt | Höjd | Storlek | Upplösning | Pris |
|---|---|---|---|---|---|---|---|
| 83 % v7 (old) | 08/2020 | HP Envy 15-ep0098nr i7-10750H, GeForce RTX 2060 Max-Q | 2 kg | 19 mm | 15.60" | 3840x2160 | |
| 80.4 % v7 (old) | 06/2020 | HP Envy x360 15-dr1679cl i7-10510U, UHD Graphics 620 | 2.1 kg | 17.2 mm | 15.60" | 1920x1080 | |
| 85 % v7 (old) | 01/2020 | HP Spectre X360 15-5ZV31AV i7-10510U, GeForce MX250 | 2.1 kg | 19.3 mm | 15.60" | 3840x2160 | |
| 90.1 % v7 (old) | 06/2020 | Dell XPS 15 9500 Core i7 4K UHD i7-10875H, GeForce GTX 1650 Ti Mobile | 2 kg | 18 mm | 15.60" | 3840x2400 | |
| 86 % v7 (old) | 12/2019 | Lenovo Yoga C940-15IRH i7-9750H, GeForce GTX 1650 Max-Q | 2 kg | 19.7 mm | 15.60" | 1920x1080 | |
| 89.7 % v7 (old) | 12/2019 | Apple MacBook Pro 16 2019 i9 5500M i9-9880H, Radeon Pro 5500M | 2 kg | 16.2 mm | 16.00" | 3072x1920 |
| SD Card Reader | |
| average JPG Copy Test (av. of 3 runs) | |
| Dell XPS 15 9500 Core i7 4K UHD (Toshiba Exceria Pro SDXC 64 GB UHS-II) | |
| HP Spectre X360 15-5ZV31AV (Toshiba Exceria Pro M501 UHS-II) | |
| HP Envy x360 15-dr1679cl (Toshiba Exceria Pro SDXC 64 GB UHS-II) | |
| HP Envy 15-ep0098nr (Toshiba Exceria Pro M501 UHS-II) | |
| maximum AS SSD Seq Read Test (1GB) | |
| Dell XPS 15 9500 Core i7 4K UHD (Toshiba Exceria Pro SDXC 64 GB UHS-II) | |
| HP Spectre X360 15-5ZV31AV (Toshiba Exceria Pro M501 UHS-II) | |
| HP Envy 15-ep0098nr (Toshiba Exceria Pro M501 UHS-II) | |
| HP Envy x360 15-dr1679cl (Toshiba Exceria Pro SDXC 64 GB UHS-II) | |

")
")
| |||||||||||||||||||||||||
Distribution av ljusstyrkan: 91 %
Mitt på batteriet: 374.3 cd/m²
Kontrast: ∞:1 (Svärta: 0 cd/m²)
ΔE ColorChecker Calman: 5.47 | ∀{0.5-29.43 Ø4.73}
calibrated: 4.61
ΔE Greyscale Calman: 2.3 | ∀{0.09-98 Ø4.97}
100% sRGB (Argyll 1.6.3 3D)
87.8% AdobeRGB 1998 (Argyll 1.6.3 3D)
99.9% AdobeRGB 1998 (Argyll 3D)
100% sRGB (Argyll 3D)
88.5% Display P3 (Argyll 3D)
Gamma: 2.09
CCT: 6340 K
| HP Envy 15-ep0098nr Samsung SDC4145, AMOLED, 15.6", 3840x2160 | HP Envy x360 15-dr1679cl AU Optronics B156HW02, IPS, 15.6", 1920x1080 | HP Spectre X360 15-5ZV31AV AU Optronics AUO30EB, IPS, 15.6", 3840x2160 | Dell XPS 15 9500 Core i7 4K UHD Sharp LQ156R1, IPS, 15.6", 3840x2400 | Lenovo Yoga C940-15IRH LG Philips LP156WFC-SPU1, IPS, 15.6", 1920x1080 | Apple MacBook Pro 16 2019 i9 5500M APPA044, IPS, 16", 3072x1920 | |
|---|---|---|---|---|---|---|
| Display | -52% | -20% | 0% | -25% | ||
| Display P3 Coverage (%) | 88.5 | 39.28 -56% | 68.3 -23% | 89.7 1% | 61.5 -31% | |
| sRGB Coverage (%) | 100 | 58.8 -41% | 94.3 -6% | 100 0% | 92.7 -7% | |
| AdobeRGB 1998 Coverage (%) | 99.9 | 40.58 -59% | 68.4 -32% | 99.8 0% | 63.6 -36% | |
| Response Times | -2812% | -4206% | -3890% | -3599% | -3822% | |
| Response Time Grey 50% / Grey 80% * (ms) | 0.8 ? | 39.6 ? -4850% | 56.8 ? -7000% | 54 ? -6650% | 48.4 ? -5950% | 52.4 ? -6450% |
| Response Time Black / White * (ms) | 2.7 ? | 23.6 ? -774% | 40.8 ? -1411% | 33.2 ? -1130% | 36.4 ? -1248% | 34.9 ? -1193% |
| PWM Frequency (Hz) | 242.7 ? | 131700 | ||||
| Screen | -36% | -3% | 10% | -5% | 34% | |
| Brightness middle (cd/m²) | 374.3 | 261.2 -30% | 284.6 -24% | 557.9 49% | 484.8 30% | 519 39% |
| Brightness (cd/m²) | 379 | 248 -35% | 285 -25% | 541 43% | 463 22% | 477 26% |
| Brightness Distribution (%) | 91 | 92 1% | 85 -7% | 91 0% | 82 -10% | 86 -5% |
| Black Level * (cd/m²) | 0.38 | 0.25 | 0.39 | 0.26 | 0.39 | |
| Colorchecker dE 2000 * | 5.47 | 5.4 1% | 3.52 36% | 4.54 17% | 4.5 18% | 2.28 58% |
| Colorchecker dE 2000 max. * | 8.22 | 16.31 -98% | 5.56 32% | 7.92 4% | 7.55 8% | 6.54 20% |
| Colorchecker dE 2000 calibrated * | 4.61 | 3.81 17% | 3 35% | 3.82 17% | 1.19 74% | 0.86 81% |
| Greyscale dE 2000 * | 2.3 | 4.1 -78% | 3.2 -39% | 3.2 -39% | 5.7 -148% | 0.9 61% |
| Gamma | 2.09 105% | 2.53 87% | 2.28 96% | 1.99 111% | 2.45 90% | 2145 0% |
| CCT | 6340 103% | 6611 98% | 7070 92% | 6451 101% | 6101 107% | 6572 99% |
| Color Space (Percent of AdobeRGB 1998) (%) | 87.8 | 37.4 -57% | 61.1 -30% | 89.5 2% | 58.7 -33% | 78 -11% |
| Color Space (Percent of sRGB) (%) | 100 | 58.7 -41% | 93.8 -6% | 100 0% | 92.8 -7% | |
| Contrast (:1) | 687 | 1138 | 1431 | 1865 | 1331 | |
| Totalt genomsnitt (program/inställningar) | -967% /
-436% | -1410% /
-607% | -1293% /
-549% | -1210% /
-523% | -1894% /
-737% |
* ... mindre är bättre
Visa svarstider
| ↔ Svarstid svart till vitt | ||
|---|---|---|
| 2.7 ms ... stiga ↗ och falla ↘ kombinerat | ↗ 1.3 ms stiga | 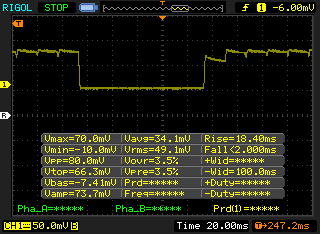 |
| ↘ 1.4 ms hösten | ||
| Skärmen visar väldigt snabba svarsfrekvenser i våra tester och borde vara mycket väl lämpad för fartfyllt spel. I jämförelse sträcker sig alla testade enheter från 0.1 (minst) till 240 (maximalt) ms. » 14 % av alla enheter är bättre. Det betyder att den uppmätta svarstiden är bättre än genomsnittet av alla testade enheter (19.9 ms). | ||
| ↔ Svarstid 50 % grått till 80 % grått | ||
| 0.8 ms ... stiga ↗ och falla ↘ kombinerat | ↗ 0.4 ms stiga | 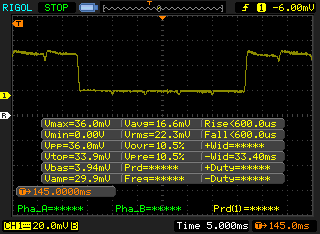 |
| ↘ 0.4 ms hösten | ||
| Skärmen visar väldigt snabba svarsfrekvenser i våra tester och borde vara mycket väl lämpad för fartfyllt spel. I jämförelse sträcker sig alla testade enheter från 0.165 (minst) till 636 (maximalt) ms. » 3 % av alla enheter är bättre. Det betyder att den uppmätta svarstiden är bättre än genomsnittet av alla testade enheter (31.1 ms). | ||
Skärmflimmer / PWM (Puls-Width Modulation)
| Skärmflimmer / PWM upptäckt | 242.7 Hz | ≤ 44 % ljusstyrka inställning | 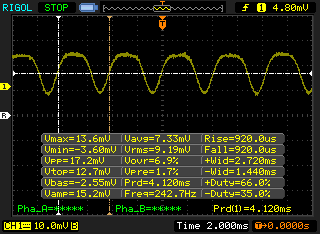 |
Displayens bakgrundsbelysning flimrar vid 242.7 Hz (i värsta fall, t.ex. med PWM) Flimrande upptäckt vid en ljusstyrkeinställning på 44 % och lägre. Det ska inte finnas något flimmer eller PWM över denna ljusstyrkeinställning. Frekvensen för 242.7 Hz är relativt låg, så känsliga användare kommer sannolikt att märka flimmer och uppleva ansträngda ögon vid den angivna ljusstyrkeinställningen och nedan. Som jämförelse: 52 % av alla testade enheter använder inte PWM för att dämpa skärmen. Om PWM upptäcktes mättes ett medelvärde av 7798 (minst: 5 - maximum: 343500) Hz. | |||
Cinebench R15: CPU Multi 64Bit | CPU Single 64Bit
Blender: v2.79 BMW27 CPU
7-Zip 18.03: 7z b 4 -mmt1 | 7z b 4
Geekbench 5.5: Single-Core | Multi-Core
HWBOT x265 Benchmark v2.2: 4k Preset
LibreOffice : 20 Documents To PDF
R Benchmark 2.5: Overall mean
| Cinebench R20 / CPU (Multi Core) | |
| Eurocom Sky X4C i9-9900KS | |
| Asus TUF Gaming A15 FA506IV-HN172 | |
| MSI GS66 Stealth 10SFS | |
| MSI GE65 Raider 9SF-049US | |
| Dell XPS 15 9500 Core i7 4K UHD | |
| Acer Nitro 5 AN515-44-R5FT | |
| HP Envy 15-ep0098nr | |
| Genomsnitt Intel Core i7-10750H (1749 - 3325, n=43) | |
| Lenovo Yoga C940-15IRH | |
| Schenker Work 15 | |
| Cinebench R20 / CPU (Single Core) | |
| Eurocom Sky X4C i9-9900KS | |
| Dell XPS 15 9500 Core i7 4K UHD | |
| Asus TUF Gaming A15 FA506IV-HN172 | |
| MSI GS66 Stealth 10SFS | |
| MSI GE65 Raider 9SF-049US | |
| Genomsnitt Intel Core i7-10750H (431 - 504, n=43) | |
| Lenovo Yoga C940-15IRH | |
| HP Envy 15-ep0098nr | |
| Acer Nitro 5 AN515-44-R5FT | |
| Schenker Work 15 | |
| Cinebench R15 / CPU Multi 64Bit | |
| Eurocom Sky X4C i9-9900KS | |
| Asus TUF Gaming A15 FA506IV-HN172 | |
| MSI GS66 Stealth 10SFS | |
| MSI GE65 Raider 9SF-049US | |
| Acer Nitro 5 AN515-44-R5FT | |
| Dell XPS 15 9500 Core i7 4K UHD | |
| HP Envy 15-ep0098nr | |
| Genomsnitt Intel Core i7-10750H (804 - 1418, n=50) | |
| Lenovo Yoga C940-15IRH | |
| Schenker Work 15 | |
| Cinebench R15 / CPU Single 64Bit | |
| Eurocom Sky X4C i9-9900KS | |
| Dell XPS 15 9500 Core i7 4K UHD | |
| MSI GS66 Stealth 10SFS | |
| MSI GE65 Raider 9SF-049US | |
| HP Envy 15-ep0098nr | |
| Genomsnitt Intel Core i7-10750H (184 - 213, n=45) | |
| Asus TUF Gaming A15 FA506IV-HN172 | |
| Lenovo Yoga C940-15IRH | |
| Acer Nitro 5 AN515-44-R5FT | |
| Schenker Work 15 | |
| Blender / v2.79 BMW27 CPU | |
| Schenker Work 15 | |
| Schenker Work 15 | |
| Genomsnitt Intel Core i7-10750H (322 - 587, n=43) | |
| Dell XPS 15 9500 Core i7 4K UHD | |
| HP Envy 15-ep0098nr | |
| Acer Nitro 5 AN515-44-R5FT | |
| MSI GS66 Stealth 10SFS | |
| Asus TUF Gaming A15 FA506IV-HN172 | |
| Eurocom Sky X4C i9-9900KS | |
| 7-Zip 18.03 / 7z b 4 -mmt1 | |
| Eurocom Sky X4C i9-9900KS | |
| Dell XPS 15 9500 Core i7 4K UHD | |
| MSI GS66 Stealth 10SFS | |
| Genomsnitt Intel Core i7-10750H (4504 - 5470, n=43) | |
| Asus TUF Gaming A15 FA506IV-HN172 | |
| Schenker Work 15 | |
| Schenker Work 15 | |
| HP Envy 15-ep0098nr | |
| Acer Nitro 5 AN515-44-R5FT | |
| 7-Zip 18.03 / 7z b 4 | |
| Eurocom Sky X4C i9-9900KS | |
| Asus TUF Gaming A15 FA506IV-HN172 | |
| MSI GS66 Stealth 10SFS | |
| Acer Nitro 5 AN515-44-R5FT | |
| Dell XPS 15 9500 Core i7 4K UHD | |
| Genomsnitt Intel Core i7-10750H (26040 - 37345, n=43) | |
| HP Envy 15-ep0098nr | |
| Schenker Work 15 | |
| Schenker Work 15 | |
| Geekbench 5.5 / Single-Core | |
| Eurocom Sky X4C i9-9900KS | |
| Dell XPS 15 9500 Core i7 4K UHD | |
| MSI GS66 Stealth 10SFS | |
| HP Envy 15-ep0098nr | |
| Genomsnitt Intel Core i7-10750H (1114 - 1333, n=43) | |
| Asus TUF Gaming A15 FA506IV-HN172 | |
| Acer Nitro 5 AN515-44-R5FT | |
| Geekbench 5.5 / Multi-Core | |
| Eurocom Sky X4C i9-9900KS | |
| Dell XPS 15 9500 Core i7 4K UHD | |
| MSI GS66 Stealth 10SFS | |
| HP Envy 15-ep0098nr | |
| Genomsnitt Intel Core i7-10750H (4443 - 6674, n=43) | |
| Asus TUF Gaming A15 FA506IV-HN172 | |
| Acer Nitro 5 AN515-44-R5FT | |
| HWBOT x265 Benchmark v2.2 / 4k Preset | |
| Eurocom Sky X4C i9-9900KS | |
| MSI GS66 Stealth 10SFS | |
| Asus TUF Gaming A15 FA506IV-HN172 | |
| HP Envy 15-ep0098nr | |
| Dell XPS 15 9500 Core i7 4K UHD | |
| Genomsnitt Intel Core i7-10750H (5.54 - 11.6, n=43) | |
| Acer Nitro 5 AN515-44-R5FT | |
| Schenker Work 15 | |
| Schenker Work 15 | |
| LibreOffice / 20 Documents To PDF | |
| Acer Nitro 5 AN515-44-R5FT | |
| Genomsnitt Intel Core i7-10750H (43.1 - 99.2, n=43) | |
| Dell XPS 15 9500 Core i7 4K UHD | |
| MSI GS66 Stealth 10SFS | |
| HP Envy 15-ep0098nr | |
| Asus TUF Gaming A15 FA506IV-HN172 | |
| R Benchmark 2.5 / Overall mean | |
| Acer Nitro 5 AN515-44-R5FT | |
| Genomsnitt Intel Core i7-10750H (0.578 - 0.708, n=42) | |
| HP Envy 15-ep0098nr | |
| Asus TUF Gaming A15 FA506IV-HN172 | |
| MSI GS66 Stealth 10SFS | |
| Dell XPS 15 9500 Core i7 4K UHD | |
* ... mindre är bättre
| PCMark 8 Home Score Accelerated v2 | 3463 poäng | |
| PCMark 8 Work Score Accelerated v2 | 4448 poäng | |
| PCMark 10 Score | 5553 poäng | |
Hjälp | ||
| DPC Latencies / LatencyMon - interrupt to process latency (max), Web, Youtube, Prime95 | |
| Dell XPS 15 9500 Core i7 4K UHD | |
| HP Envy 15-ep0098nr | |
| HP Envy x360 15-dr1679cl | |
| MSI GS66 Stealth 10SFS | |
| MSI GS66 Stealth 10SE-045 | |
| Razer Blade 15 RZ09-0328 | |
| Asus TUF Gaming A15 FA506IV-HN172 | |
* ... mindre är bättre
| HP Envy 15-ep0098nr Intel Optane Memory H10 with Solid State Storage 32GB + 512GB HBRPEKNX0202A(L/H) | HP Envy x360 15-dr1679cl Intel Optane Memory H10 with Solid State Storage 32GB + 512GB HBRPEKNX0202A(L/H) | HP Spectre X360 15-5ZV31AV Intel SSD 660p 2TB SSDPEKNW020T8 | Dell XPS 15 9500 Core i7 4K UHD SK Hynix PC611 512GB | Apple MacBook Pro 16 2019 i9 5500M Apple SSD AP1024 7171 | |
|---|---|---|---|---|---|
| AS SSD | -13% | 32% | 49% | 80% | |
| Seq Read (MB/s) | 1005 | 931 -7% | 1220 21% | 2072 106% | 2531 152% |
| Seq Write (MB/s) | 436.8 | 331.5 -24% | 1152 164% | 1486 240% | 2289 424% |
| 4K Read (MB/s) | 51.5 | 72.8 41% | 52.3 2% | 47.41 -8% | 15.85 -69% |
| 4K Write (MB/s) | 88 | 119 35% | 146.6 67% | 117.6 34% | 39.88 -55% |
| 4K-64 Read (MB/s) | 517 | 389.7 -25% | 652 26% | 967 87% | 1267 145% |
| 4K-64 Write (MB/s) | 839 | 573 -32% | 847 1% | 715 -15% | 1749 108% |
| Access Time Read * (ms) | 0.088 | 0.07 20% | 0.077 12% | 0.057 35% | 0.122 -39% |
| Access Time Write * (ms) | 0.151 | 0.138 9% | 0.106 30% | 0.096 36% | 0.095 37% |
| Score Read (Points) | 669 | 556 -17% | 826 23% | 1222 83% | 1536 130% |
| Score Write (Points) | 970 | 725 -25% | 1109 14% | 981 1% | 2018 108% |
| Score Total (Points) | 1972 | 1565 -21% | 2371 20% | 2809 42% | 4317 119% |
| Copy ISO MB/s (MB/s) | 1173 | 593 -49% | 2070 76% | 1999 70% | 1995 70% |
| Copy Program MB/s (MB/s) | 769 | 495.5 -36% | 571 -26% | 627 -18% | 584 -24% |
| Copy Game MB/s (MB/s) | 1045 | 566 -46% | 1219 17% | 1001 -4% | 1135 9% |
| CrystalDiskMark 5.2 / 6 | 4% | 26% | 51% | 48% | |
| Write 4K (MB/s) | 100.2 | 125.6 25% | 151.5 51% | 123.3 23% | 55.5 -45% |
| Read 4K (MB/s) | 112.8 | 145.8 29% | 59.3 -47% | 41.85 -63% | 16.21 -86% |
| Write Seq (MB/s) | 537 | 509 -5% | 1424 165% | 2054 282% | 1959 265% |
| Read Seq (MB/s) | 1270 | 1536 21% | 1609 27% | 1617 27% | 1763 39% |
| Write 4K Q32T1 (MB/s) | 480.6 | 362.4 -25% | 393.6 -18% | 413 -14% | 398.5 -17% |
| Read 4K Q32T1 (MB/s) | 364.9 | 307.3 -16% | 369.4 1% | 377.5 3% | 648 78% |
| Write Seq Q32T1 (MB/s) | 1224 | 1320 8% | 1946 59% | 2705 121% | 2727 123% |
| Read Seq Q32T1 (MB/s) | 2635 | 2489 -6% | 1934 -27% | 3442 31% | 3242 23% |
| Totalt genomsnitt (program/inställningar) | -5% /
-7% | 29% /
30% | 50% /
50% | 64% /
68% |
* ... mindre är bättre

Kontinuerlig inläsning: DiskSpd Read Loop, Queue Depth 8
| 3DMark 11 Performance | 18109 poäng | |
| 3DMark Cloud Gate Standard Score | 25407 poäng | |
| 3DMark Fire Strike Score | 14259 poäng | |
| 3DMark Time Spy Score | 6052 poäng | |
Hjälp | ||
| The Witcher 3 - 1920x1080 Ultra Graphics & Postprocessing (HBAO+) | |
| Eurocom Sky X4C i9-9900KS | |
| Gigabyte Aero 15 OLED XB-8DE51B0SP | |
| MSI GE65 Raider 9SF-049US | |
| MSI RTX 2060 Gaming Z 6G | |
| MSI GS66 Stealth 10SFS | |
| Dell G5 15 SE 5505 P89F | |
| HP Envy 15-ep0098nr | |
| Eluktronics RP-15 | |
| Razer Blade 15 RZ09-0328 | |
| Asus TUF Gaming A15 FA506IV-HN172 | |
| Genomsnitt NVIDIA GeForce RTX 2060 Max-Q (51.2 - 62.9, n=4) | |
| MSI P65 8RF-451 - Creator | |
| Microsoft Surface Book 3 15 | |
| Apple MacBook Pro 16 2019 i9 5500M | |
| Acer Nitro 5 AN515-44-R5FT | |
| Dell XPS 15 9500 Core i7 4K UHD | |
| Lenovo Yoga C940-15IRH | |
| Apple MacBook Pro 15 2019 i9 Vega 20 | |
| HP Spectre X360 15-5ZV31AV | |
| låg | med. | hög | ultra | QHD | 4K | |
|---|---|---|---|---|---|---|
| The Witcher 3 (2015) | 310.8 | 209.6 | 119 | 62.9 | 45.5 | |
| Dota 2 Reborn (2015) | 141 | 129 | 120 | 114 | 83.2 | |
| Final Fantasy XV Benchmark (2018) | 139 | 79 | 61.3 | 43.6 | 24.9 | |
| X-Plane 11.11 (2018) | 103 | 90.7 | 77.4 | 59.3 |
| HP Envy 15-ep0098nr GeForce RTX 2060 Max-Q, i7-10750H, Intel Optane Memory H10 with Solid State Storage 32GB + 512GB HBRPEKNX0202A(L/H) | HP Envy x360 15-dr1679cl UHD Graphics 620, i7-10510U, Intel Optane Memory H10 with Solid State Storage 32GB + 512GB HBRPEKNX0202A(L/H) | HP Spectre X360 15-5ZV31AV GeForce MX250, i7-10510U, Intel SSD 660p 2TB SSDPEKNW020T8 | Dell XPS 15 9500 Core i7 4K UHD GeForce GTX 1650 Ti Mobile, i7-10875H, SK Hynix PC611 512GB | Apple MacBook Pro 16 2019 i9 5500M Radeon Pro 5500M, i9-9880H, Apple SSD AP1024 7171 | |
|---|---|---|---|---|---|
| Noise | 11% | 14% | 11% | 8% | |
| av / miljö * (dB) | 26.4 | 28 -6% | 30.1 -14% | 28.4 -8% | 29.8 -13% |
| Idle Minimum * (dB) | 32.2 | 28 13% | 30.1 7% | 28.4 12% | 29.9 7% |
| Idle Average * (dB) | 32.2 | 30.2 6% | 30.1 7% | 28.4 12% | 29.9 7% |
| Idle Maximum * (dB) | 32.2 | 31.5 2% | 30.1 7% | 28.4 12% | 29.9 7% |
| Load Average * (dB) | 48.3 | 35.7 26% | 30.1 38% | 46 5% | 43 11% |
| Witcher 3 ultra * (dB) | 53.7 | 39.7 26% | 42 22% | 45.4 15% | |
| Load Maximum * (dB) | 58.8 | 43.1 27% | 42 29% | 47.1 20% | 46.1 22% |
* ... mindre är bättre
Ljudnivå
| Låg belastning |
| 32.2 / 32.2 / 32.2 dB(A) |
| Hög belastning |
| 48.3 / 58.8 dB(A) |
 | ||
30 dB tyst 40 dB(A) hörbar 50 dB(A) högt ljud |
||
min: | ||
(-) Den maximala temperaturen på ovansidan är 47.6 °C / 118 F, jämfört med genomsnittet av 36.8 °C / 98 F , allt från 21 till 71 °C för klassen Multimedia.
(-) Botten värms upp till maximalt 52 °C / 126 F, jämfört med genomsnittet av 39.1 °C / 102 F
(+) Vid tomgångsbruk är medeltemperaturen för ovansidan 26.1 °C / 79 F, jämfört med enhetsgenomsnittet på 31.3 °C / ### class_avg_f### F.
(±) När du spelar The Witcher 3 är medeltemperaturen för ovansidan 32.4 °C / 90 F, jämfört med enhetsgenomsnittet på 31.3 °C / ## #class_avg_f### F.
(+) Handledsstöden och pekplattan är kallare än hudtemperaturen med maximalt 31.8 °C / 89.2 F och är därför svala att ta på.
(-) Medeltemperaturen för handledsstödsområdet på liknande enheter var 28.7 °C / 83.7 F (-3.1 °C / -5.5 F).
HP Envy 15-ep0098nr ljudanalys
(±) | högtalarljudstyrkan är genomsnittlig men bra (79.9 dB)
Bas 100 - 315 Hz
(-) | nästan ingen bas - i genomsnitt 15.8% lägre än medianen
(±) | linjäriteten för basen är genomsnittlig (14.9% delta till föregående frekvens)
Mellan 400 - 2000 Hz
(+) | balanserad mellan - endast 3.7% från medianen
(+) | mids är linjära (5.9% delta till föregående frekvens)
Högsta 2 - 16 kHz
(+) | balanserade toppar - endast 1.8% från medianen
(+) | toppar är linjära (4% delta till föregående frekvens)
Totalt 100 - 16 000 Hz
(±) | linjäriteten för det totala ljudet är genomsnittlig (16.2% skillnad mot median)
Jämfört med samma klass
» 41% av alla testade enheter i den här klassen var bättre, 7% liknande, 51% sämre
» Den bästa hade ett delta på 5%, genomsnittet var 17%, sämst var 45%
Jämfört med alla testade enheter
» 26% av alla testade enheter var bättre, 6% liknande, 68% sämre
» Den bästa hade ett delta på 4%, genomsnittet var 24%, sämst var 134%
Apple MacBook 12 (Early 2016) 1.1 GHz ljudanalys
(+) | högtalare kan spela relativt högt (83.6 dB)
Bas 100 - 315 Hz
(±) | reducerad bas - i genomsnitt 11.3% lägre än medianen
(±) | linjäriteten för basen är genomsnittlig (14.2% delta till föregående frekvens)
Mellan 400 - 2000 Hz
(+) | balanserad mellan - endast 2.4% från medianen
(+) | mids är linjära (5.5% delta till föregående frekvens)
Högsta 2 - 16 kHz
(+) | balanserade toppar - endast 2% från medianen
(+) | toppar är linjära (4.5% delta till föregående frekvens)
Totalt 100 - 16 000 Hz
(+) | det totala ljudet är linjärt (10.2% skillnad mot median)
Jämfört med samma klass
» 7% av alla testade enheter i den här klassen var bättre, 2% liknande, 91% sämre
» Den bästa hade ett delta på 5%, genomsnittet var 18%, sämst var 53%
Jämfört med alla testade enheter
» 5% av alla testade enheter var bättre, 1% liknande, 94% sämre
» Den bästa hade ett delta på 4%, genomsnittet var 24%, sämst var 134%
| Av/Standby | |
| Låg belastning | |
| Hög belastning |
|
Förklaring:
min: | |
| HP Envy 15-ep0098nr i7-10750H, GeForce RTX 2060 Max-Q, Intel Optane Memory H10 with Solid State Storage 32GB + 512GB HBRPEKNX0202A(L/H), AMOLED, 3840x2160, 15.6" | HP Envy x360 15-dr1679cl i7-10510U, UHD Graphics 620, Intel Optane Memory H10 with Solid State Storage 32GB + 512GB HBRPEKNX0202A(L/H), IPS, 1920x1080, 15.6" | HP Spectre X360 15-5ZV31AV i7-10510U, GeForce MX250, Intel SSD 660p 2TB SSDPEKNW020T8, IPS, 3840x2160, 15.6" | Dell XPS 15 9500 Core i7 4K UHD i7-10875H, GeForce GTX 1650 Ti Mobile, SK Hynix PC611 512GB, IPS, 3840x2400, 15.6" | Apple MacBook Pro 16 2019 i9 5500M i9-9880H, Radeon Pro 5500M, Apple SSD AP1024 7171, IPS, 3072x1920, 16" | Lenovo Yoga C940-15IRH i7-9750H, GeForce GTX 1650 Max-Q, Intel Optane Memory H10 with Solid State Storage 32GB + 512GB HBRPEKNX0202A(L/H), IPS, 1920x1080, 15.6" | |
|---|---|---|---|---|---|---|
| Power Consumption | 58% | 48% | 15% | 28% | 20% | |
| Idle Minimum * (Watt) | 9.2 | 4.3 53% | 5.2 43% | 5.7 38% | 3.7 60% | 5.2 43% |
| Idle Average * (Watt) | 14.5 | 7.2 50% | 8.5 41% | 13.5 7% | 12.1 17% | 10.7 26% |
| Idle Maximum * (Watt) | 18 | 7.5 58% | 8.7 52% | 19.6 -9% | 17 6% | 24.3 -35% |
| Load Average * (Watt) | 110.9 | 40.4 64% | 65.6 41% | 114.1 -3% | 91.5 17% | 84.4 24% |
| Witcher 3 ultra * (Watt) | 125.5 | 56.5 55% | 93 26% | 103 18% | 83.9 33% | |
| Load Maximum * (Watt) | 194.6 | 65.7 66% | 92.4 53% | 135.2 31% | 102.3 47% | 142.8 27% |
* ... mindre är bättre
| HP Envy 15-ep0098nr i7-10750H, GeForce RTX 2060 Max-Q, 83 Wh | HP Envy x360 15-dr1679cl i7-10510U, UHD Graphics 620, 55.67 Wh | HP Spectre X360 15-5ZV31AV i7-10510U, GeForce MX250, 84 Wh | Dell XPS 15 9500 Core i7 4K UHD i7-10875H, GeForce GTX 1650 Ti Mobile, 86 Wh | Apple MacBook Pro 15 2019 i9 Vega 20 i9-9980HK, Radeon Pro Vega 20, 83 Wh | Lenovo Yoga C940-15IRH i7-9750H, GeForce GTX 1650 Max-Q, 69 Wh | |
|---|---|---|---|---|---|---|
| Batteridrifttid | 55% | 71% | 43% | 92% | 15% | |
| Reader / Idle (h) | 15 | 25.4 69% | 22.6 51% | 23 53% | 18.2 21% | |
| WiFi v1.3 (h) | 6 | 9.2 53% | 10.8 80% | 9.1 52% | 11.5 92% | 9.7 62% |
| Load (h) | 1.6 | 2.3 44% | 2.9 81% | 2 25% | 1 -37% |
För
Emot
Läs den fullständiga versionen av den här recensionen på engelska här.
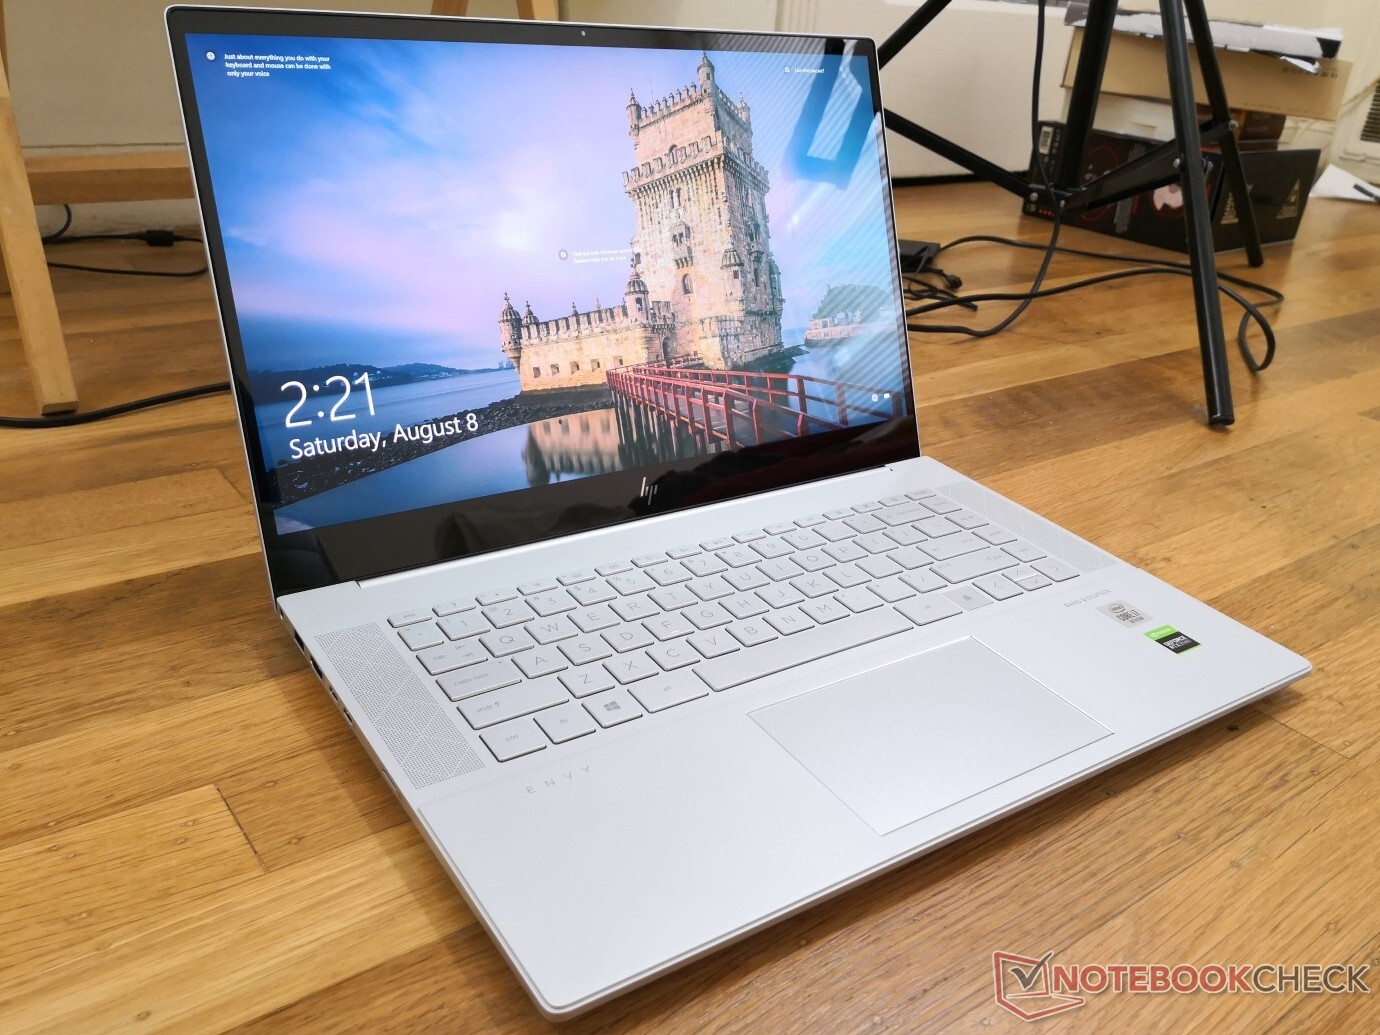
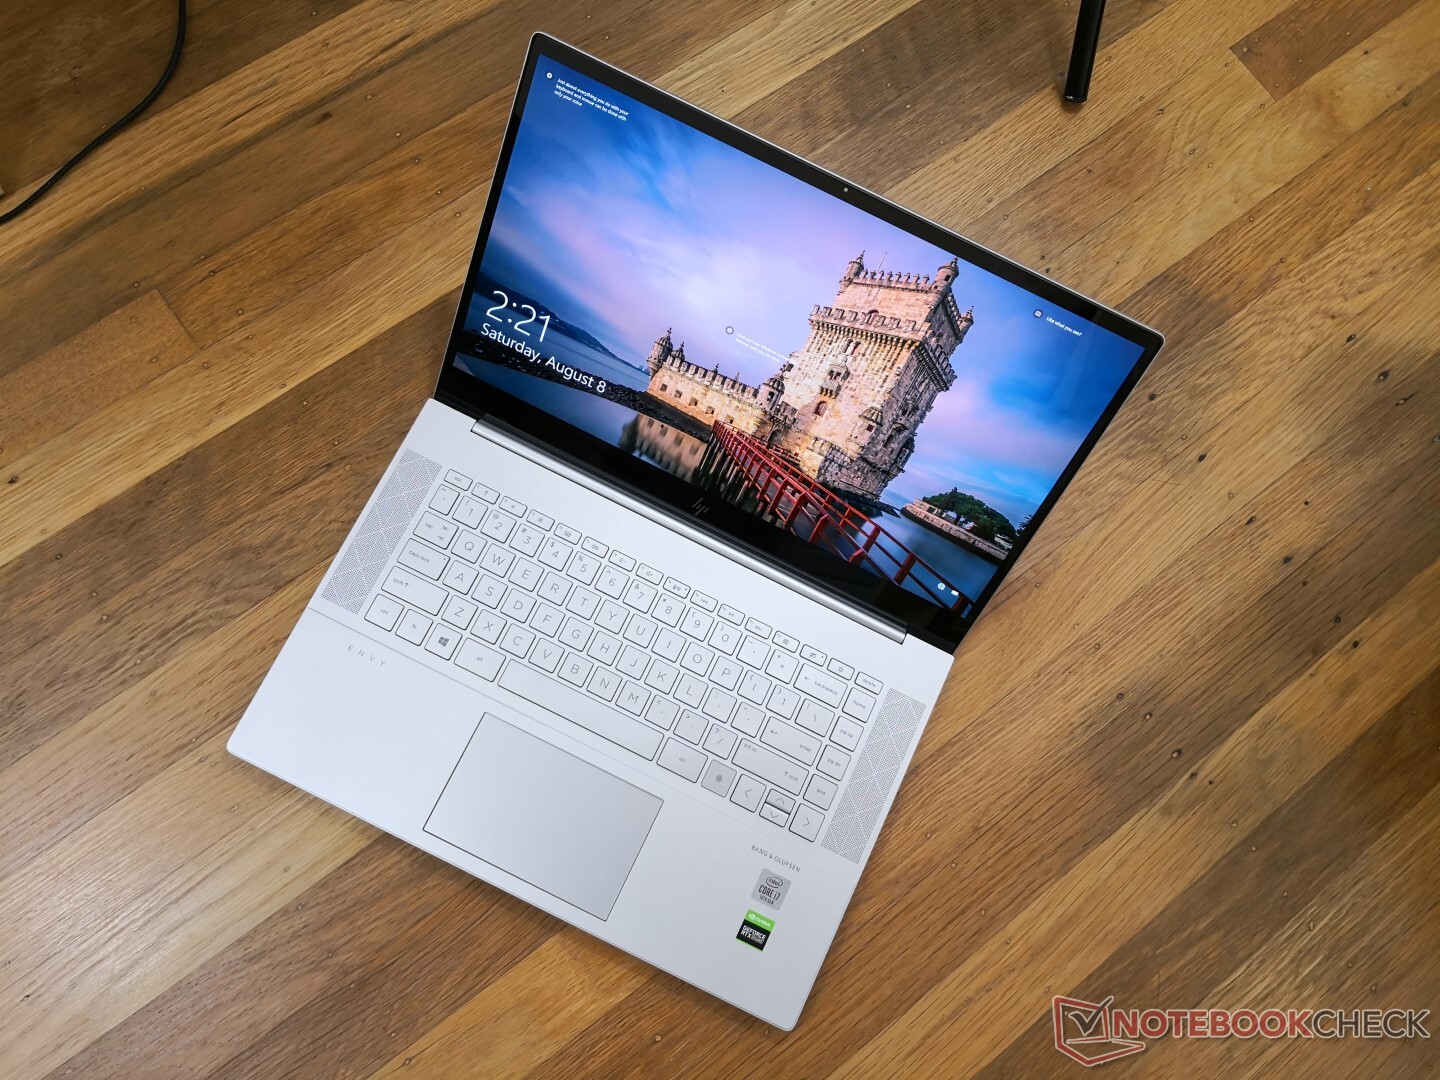
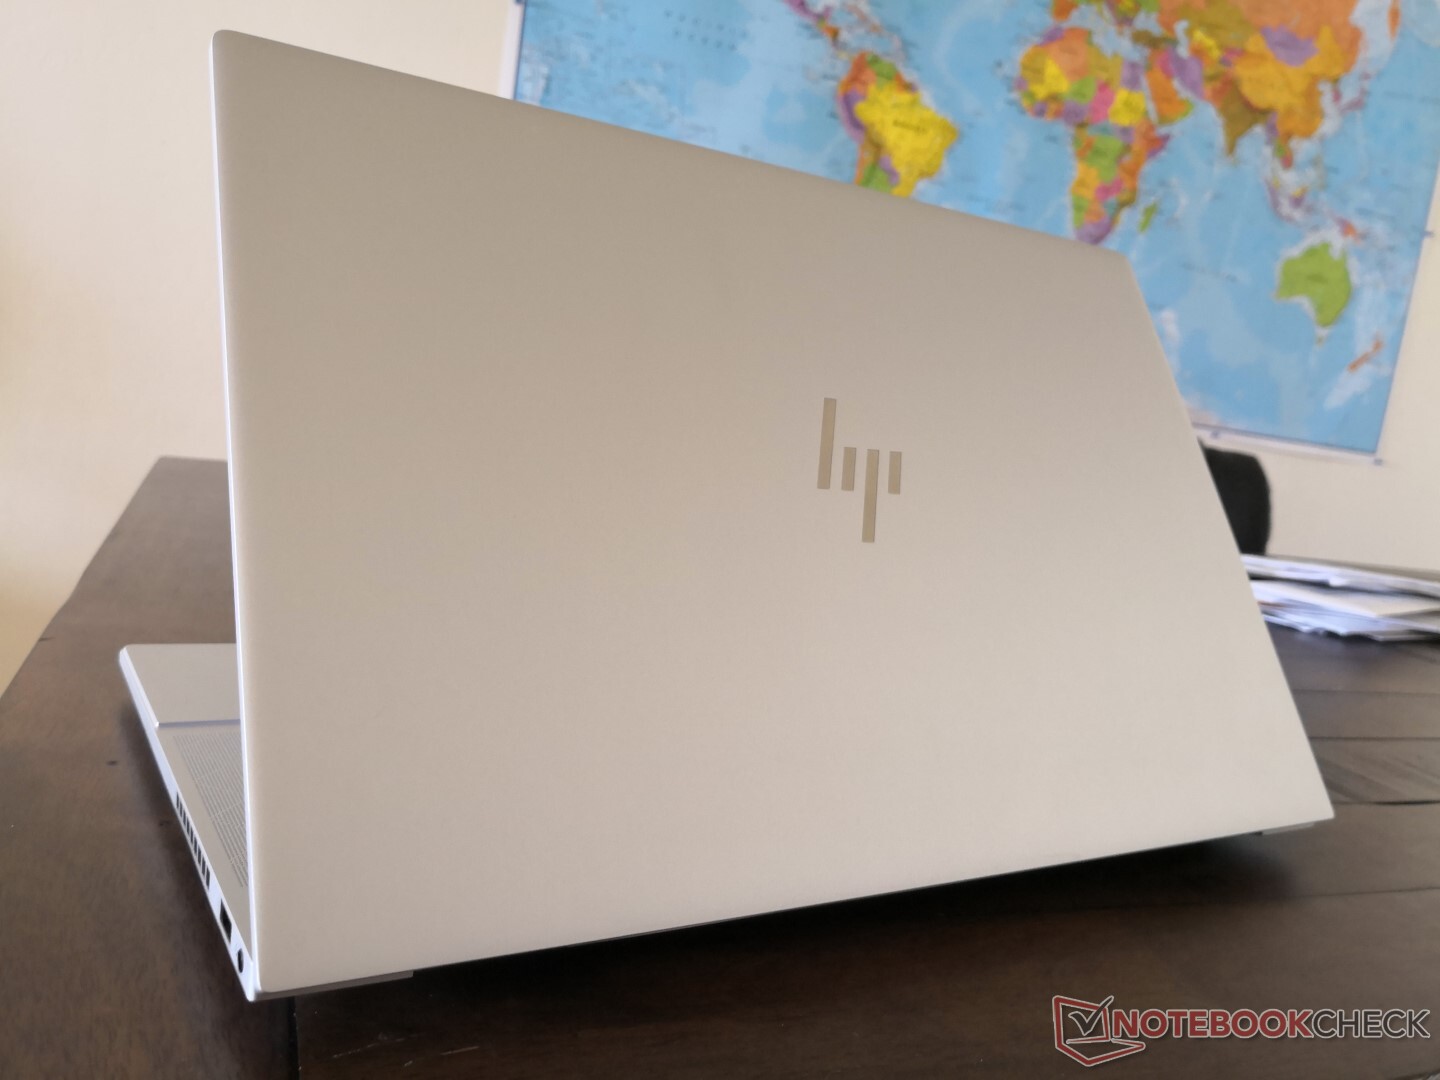
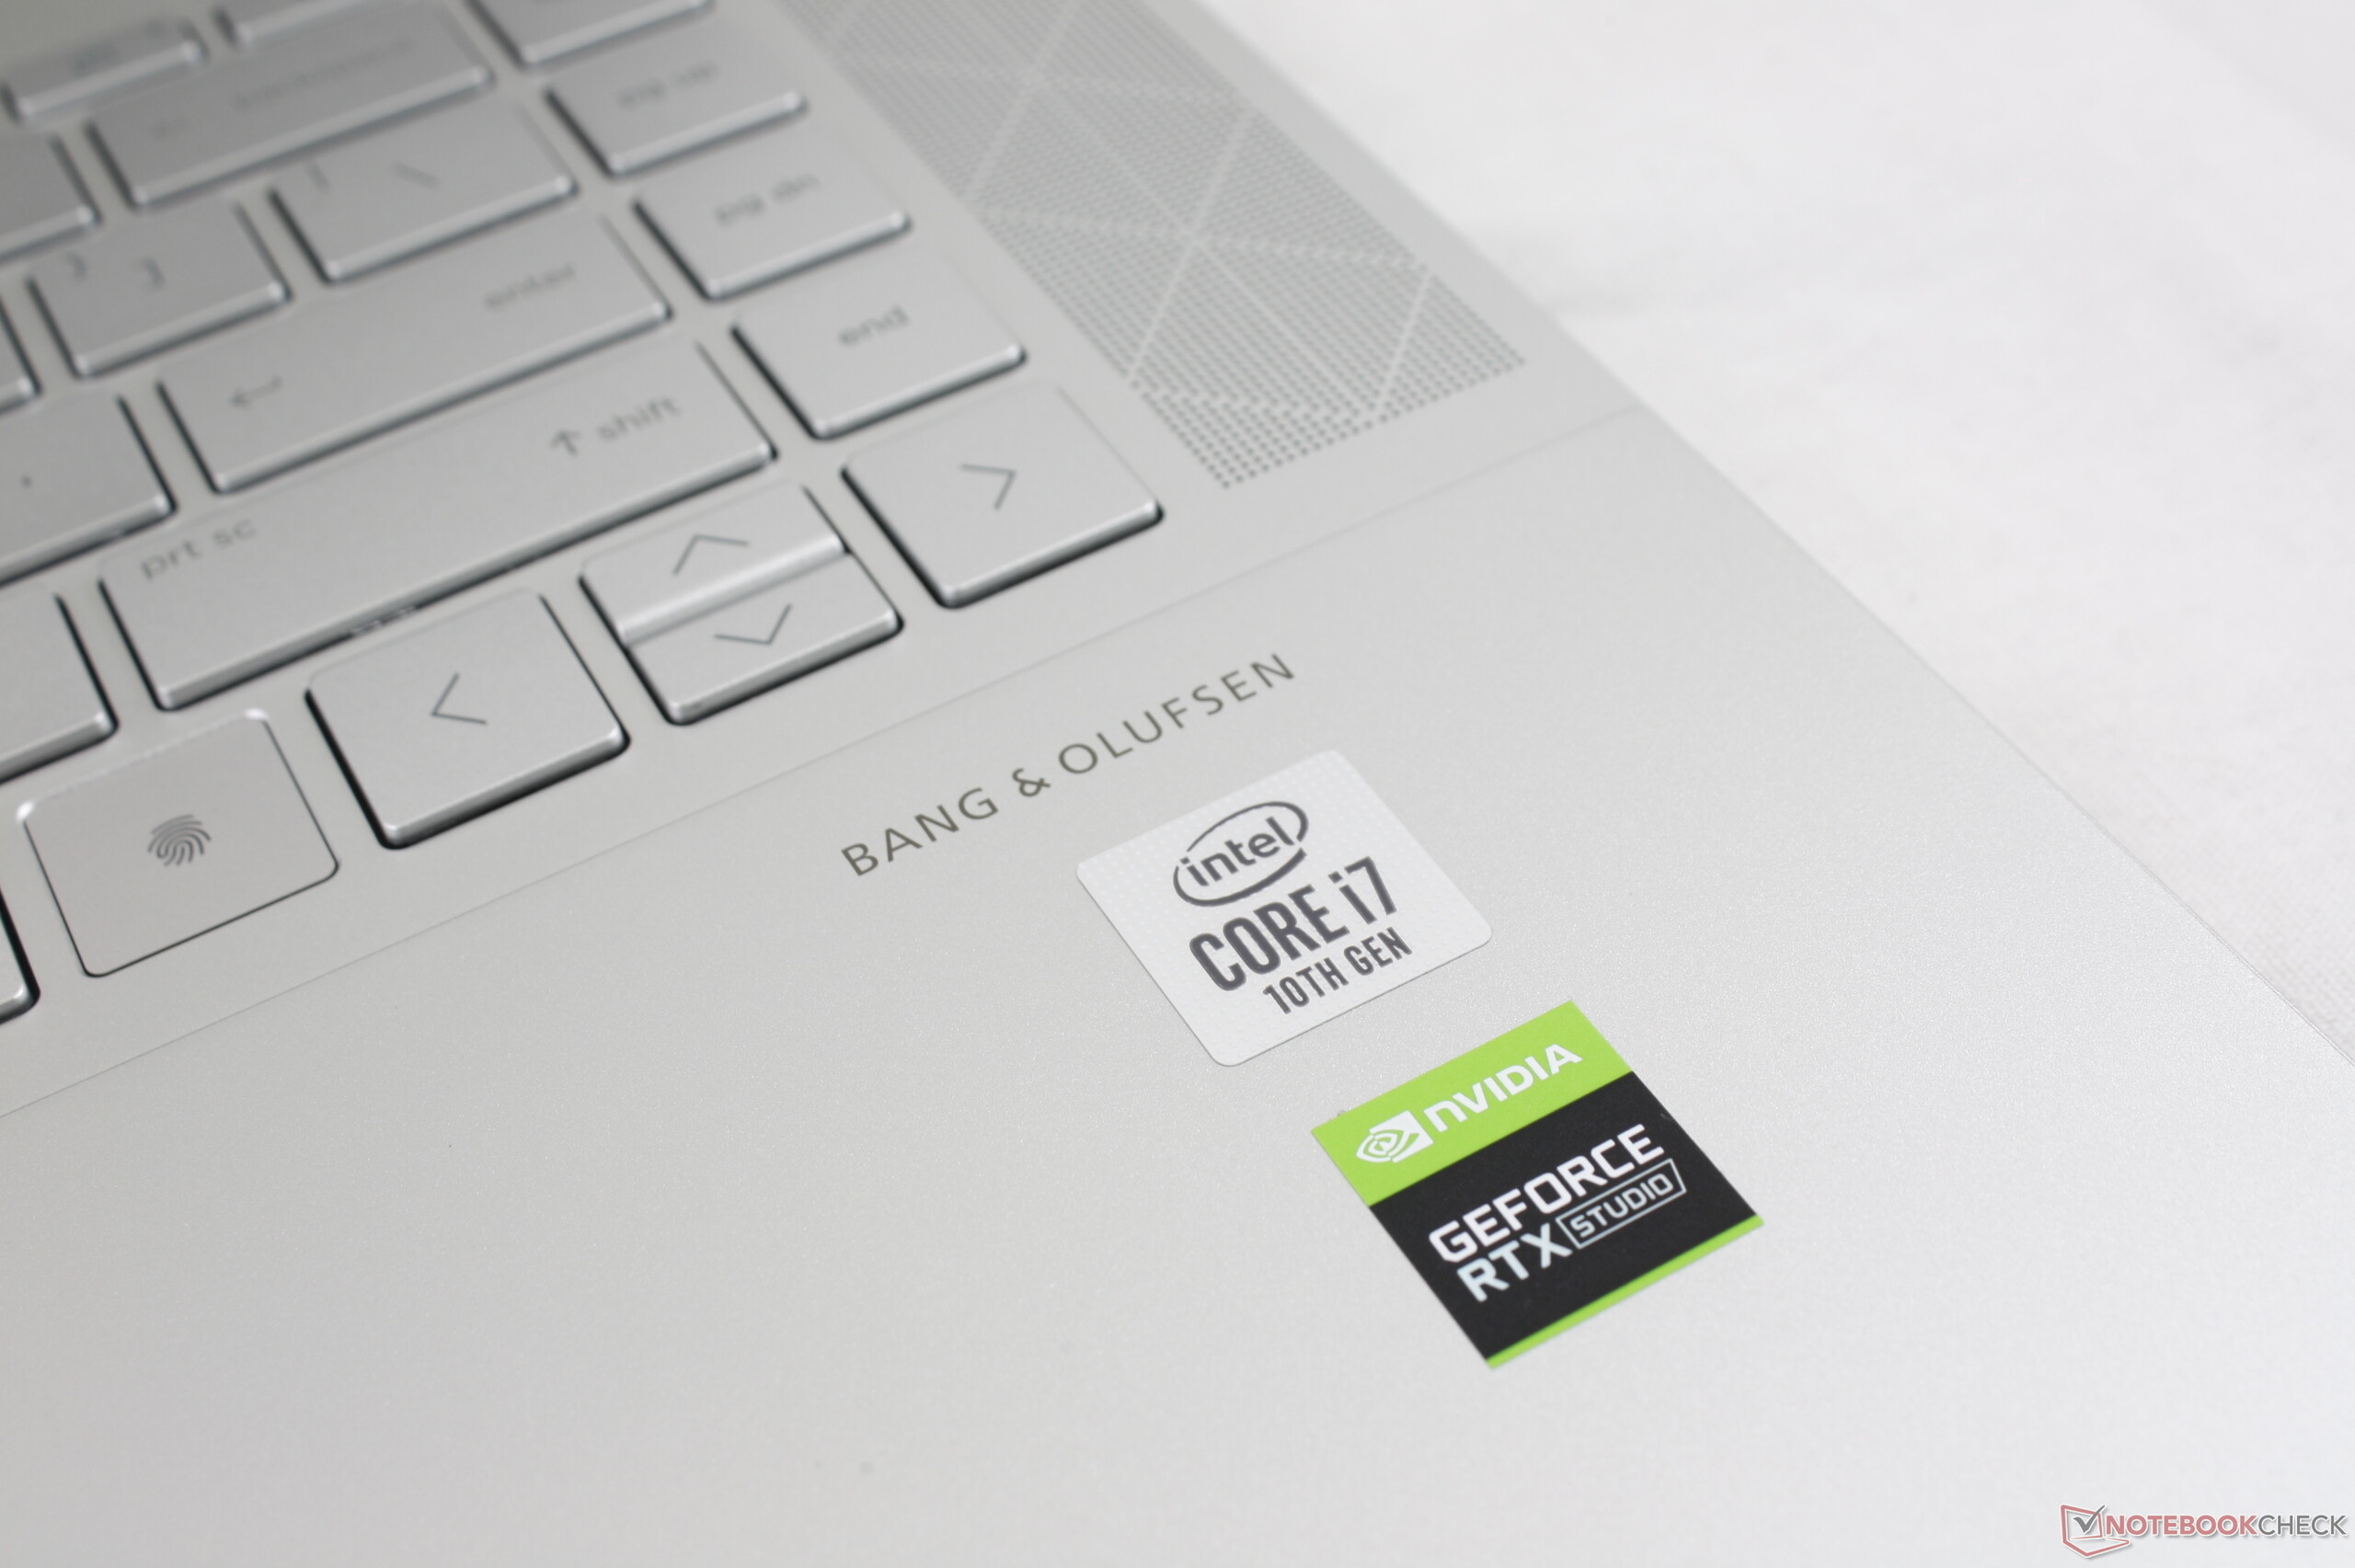
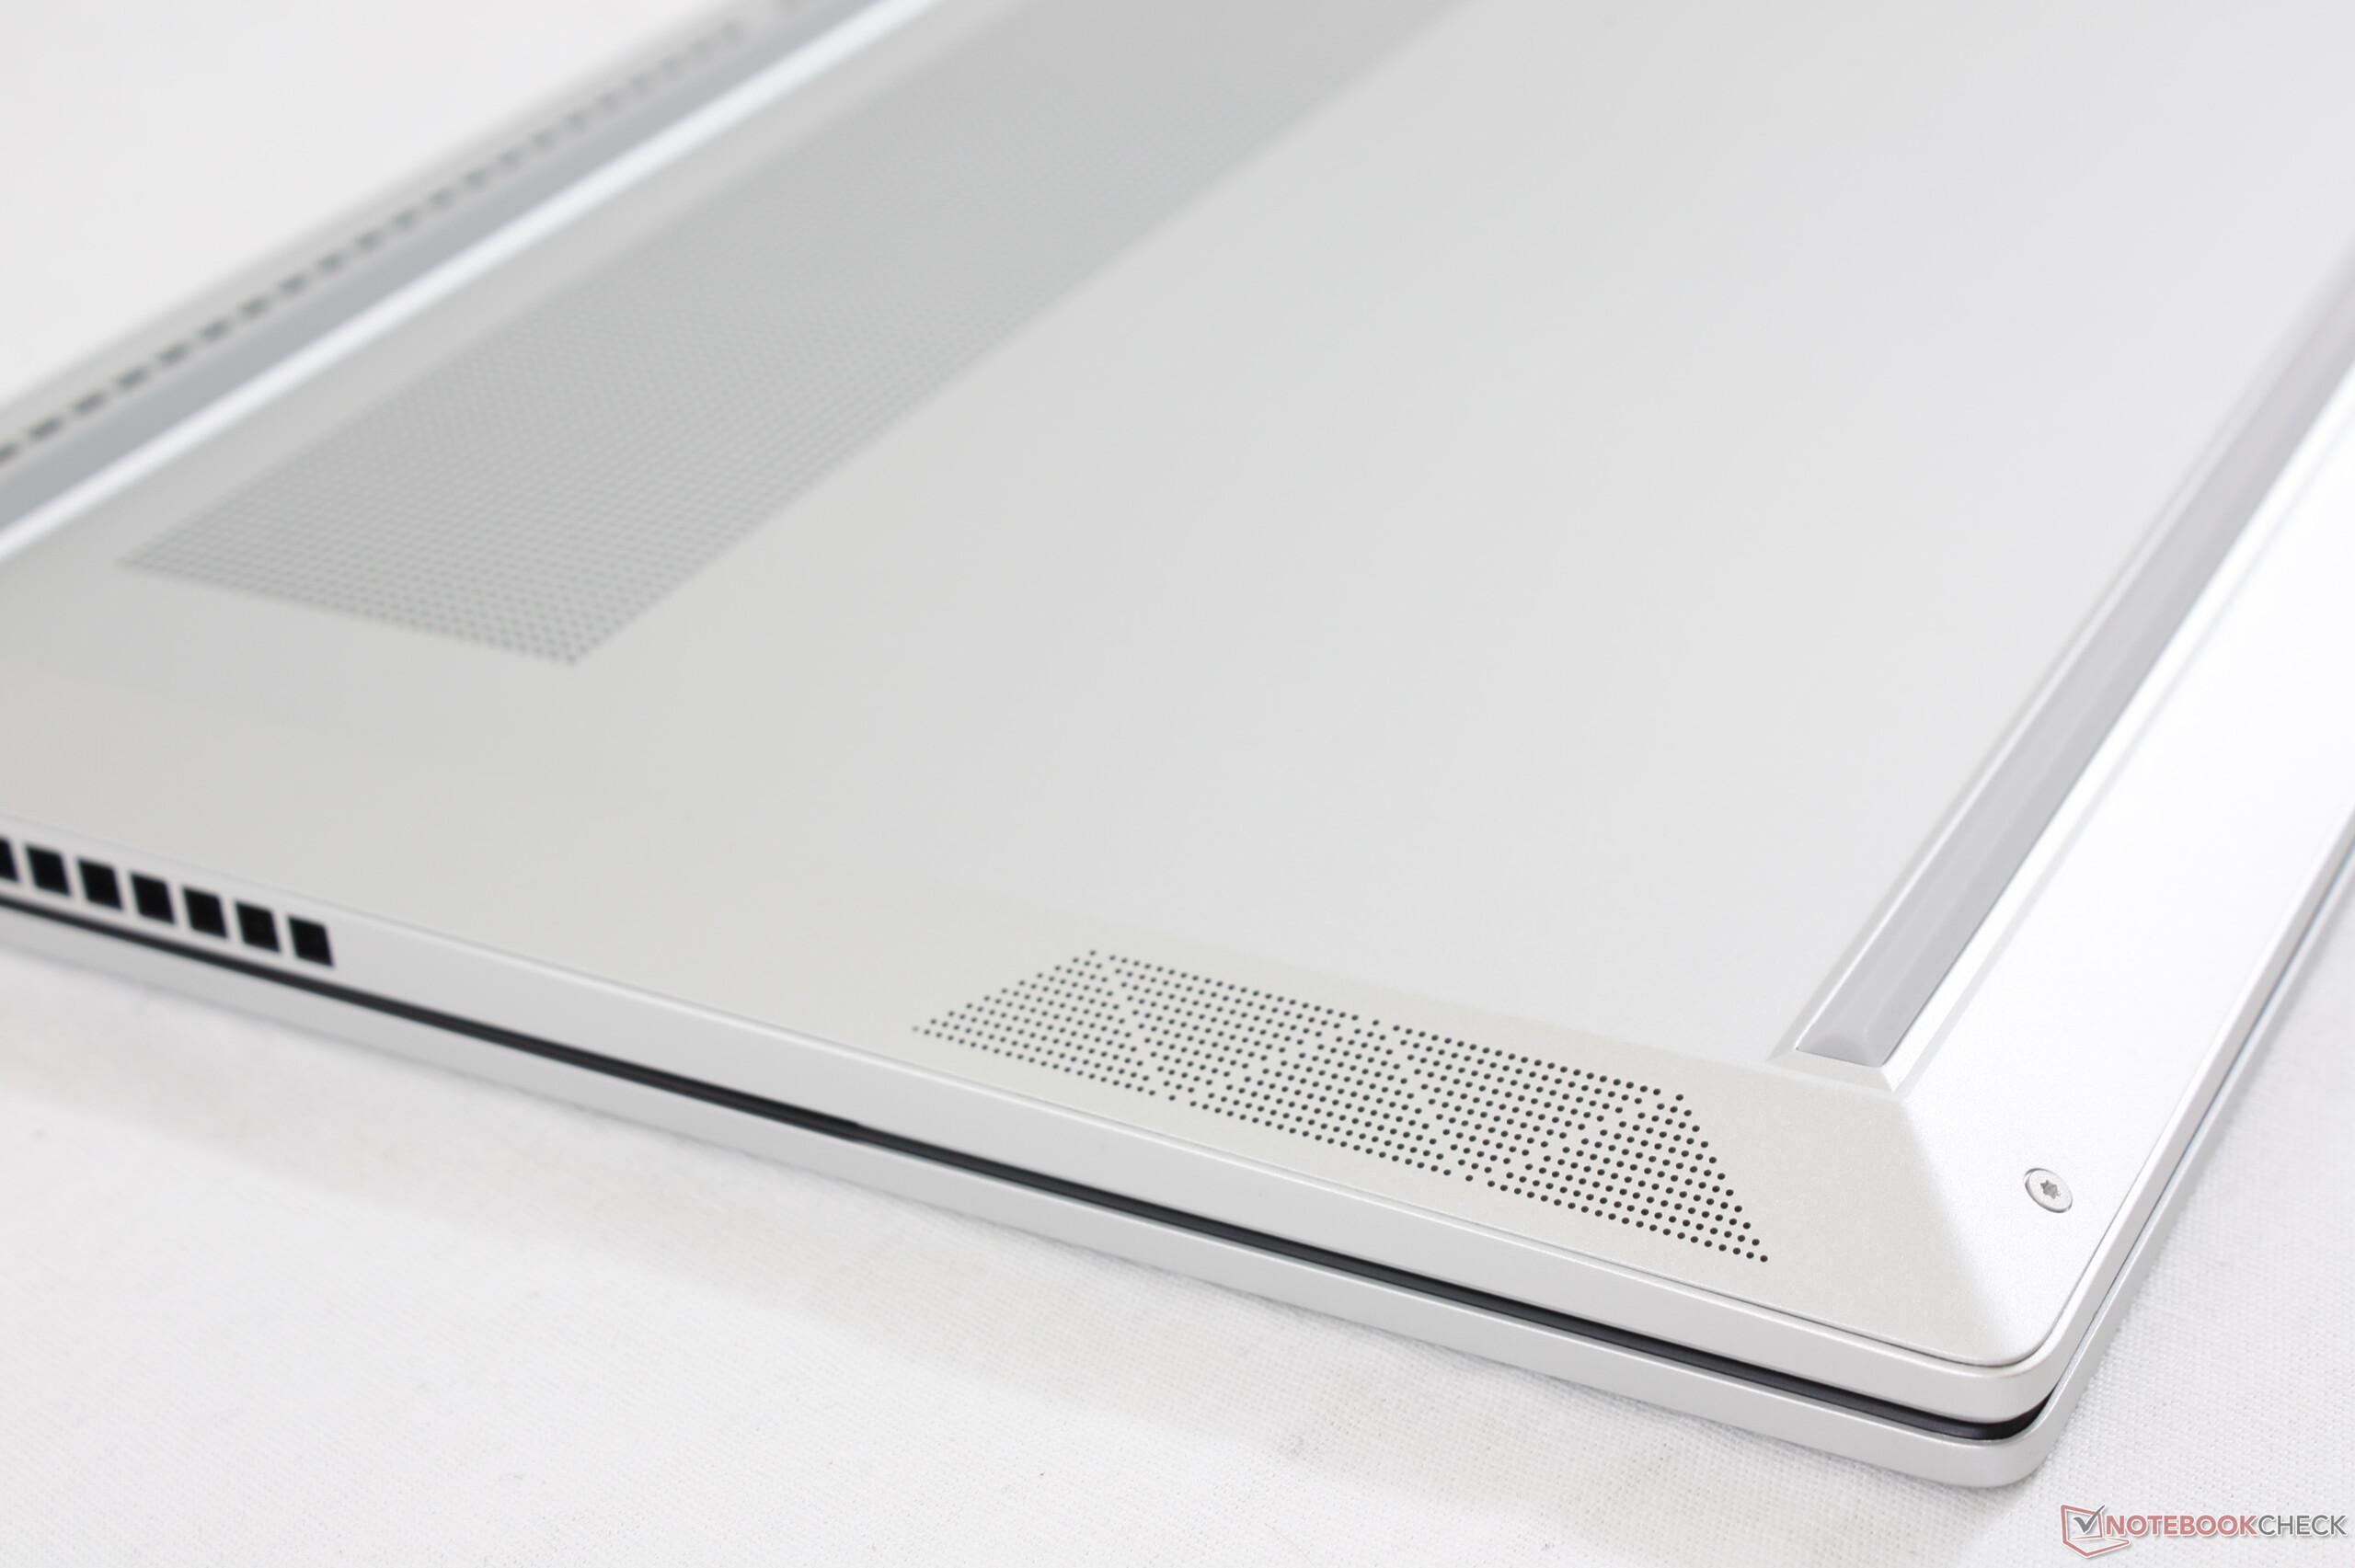
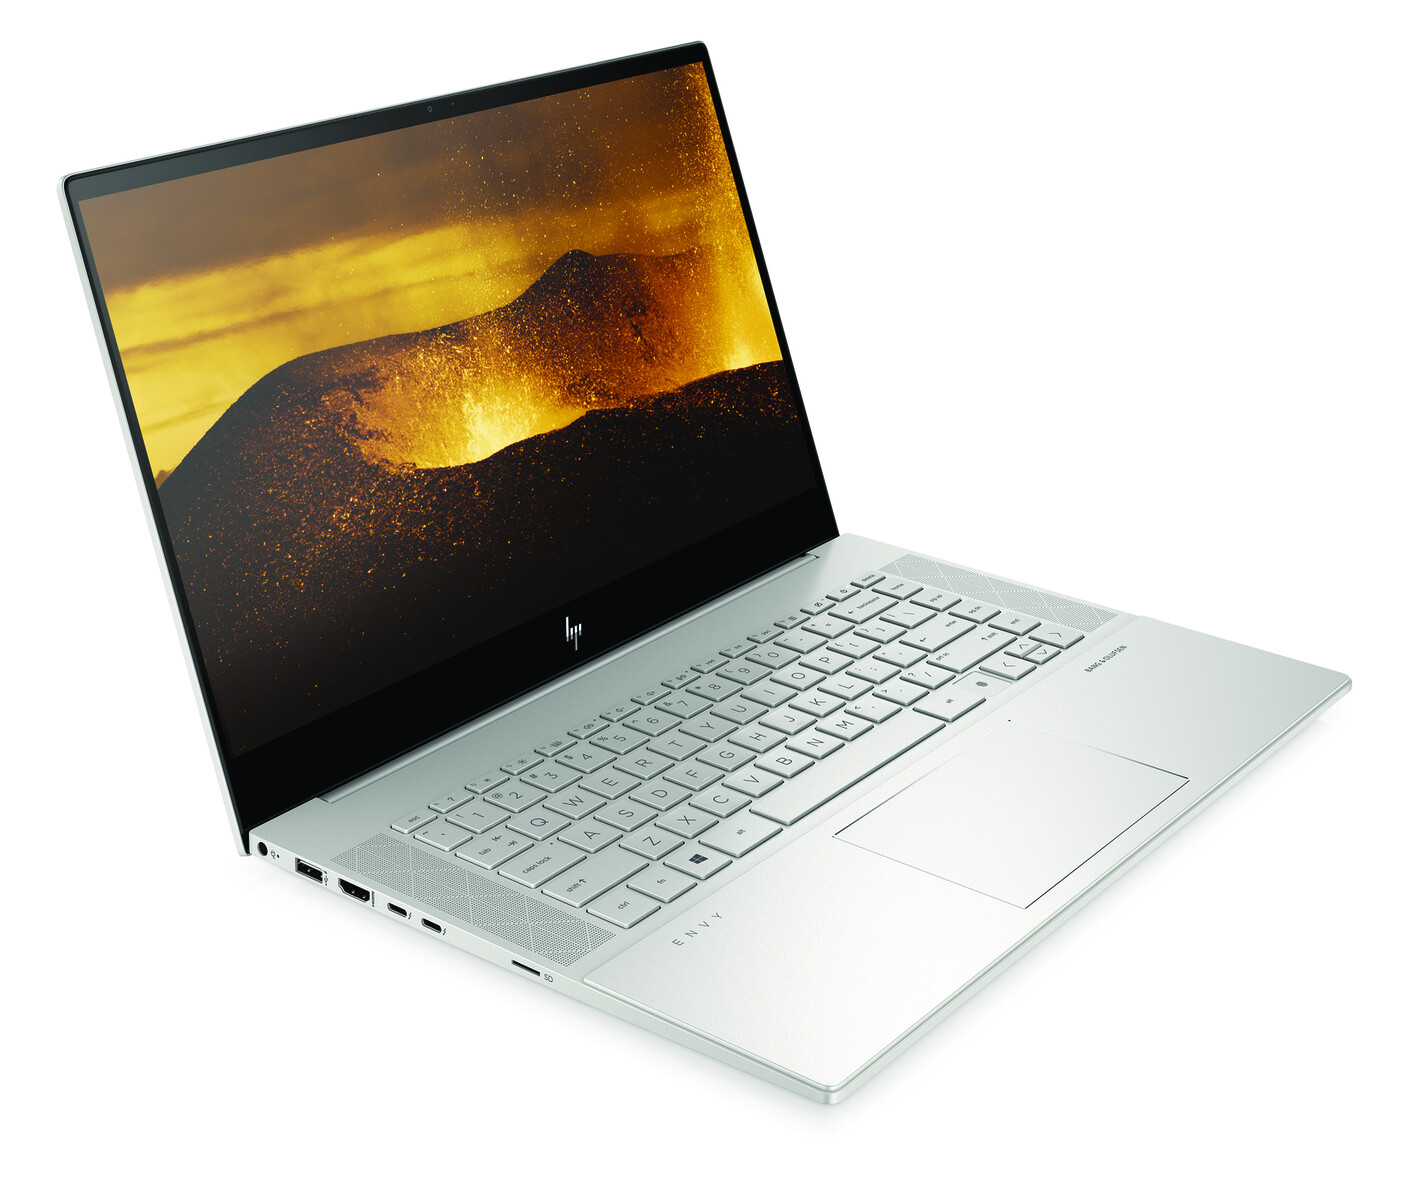
HP har i princip återuppfunnit sin Envy 15-serie. Den senaste modellen skiljer sig helt och hållet från den föregående generationen och nästan alla ändringarna är åt det bättre. Utöver en mer professionell look, enklare service och nya processoralternativ från Core H-serien har den en GeForce RTX 2060 Max-Q GPU som tillval, som är mycket snabbare än vad MacBook Pro 15 eller MacBook Pro 16 kan erbjuda för tillfället, samtidigt som datorn kostar mindre, vilket är precis vad HP tänkt sig.
Men hårdvara på spelnivå innebär också att Envy 15 ärver många av de brister som tunna bärbara speldatorer lider av. Bli inte lurad av det tjusiga Ultrabook-liknande utséendet; den här datorn kommer inte hålla igång lika länge som en typisk Intel UHD- eller GeForce MX-driven Ultrabook och den kommer heller inte vara lika tyst och lätt. Detta är nästan en förklädd spellaptop även om den marknadsförs åt kreatörer, på samma sätt som Gigabyte Aero-serien. AC-adaptern på 200 W är exempelvis betydligt större och därmed mer opraktisk att bära runt på än motsvarigheten från någon Ultrabook. Om du är med på nackdelarna som detta innebär kommer du bli nöjd med nya Envy 15 och dess höga prestanda, särskilt med tanke på priset och formfaktorn. Annars, om ditt arbete i huvudsak består av surfande och ordbehandling, är det bättre du väljer en Spectre.
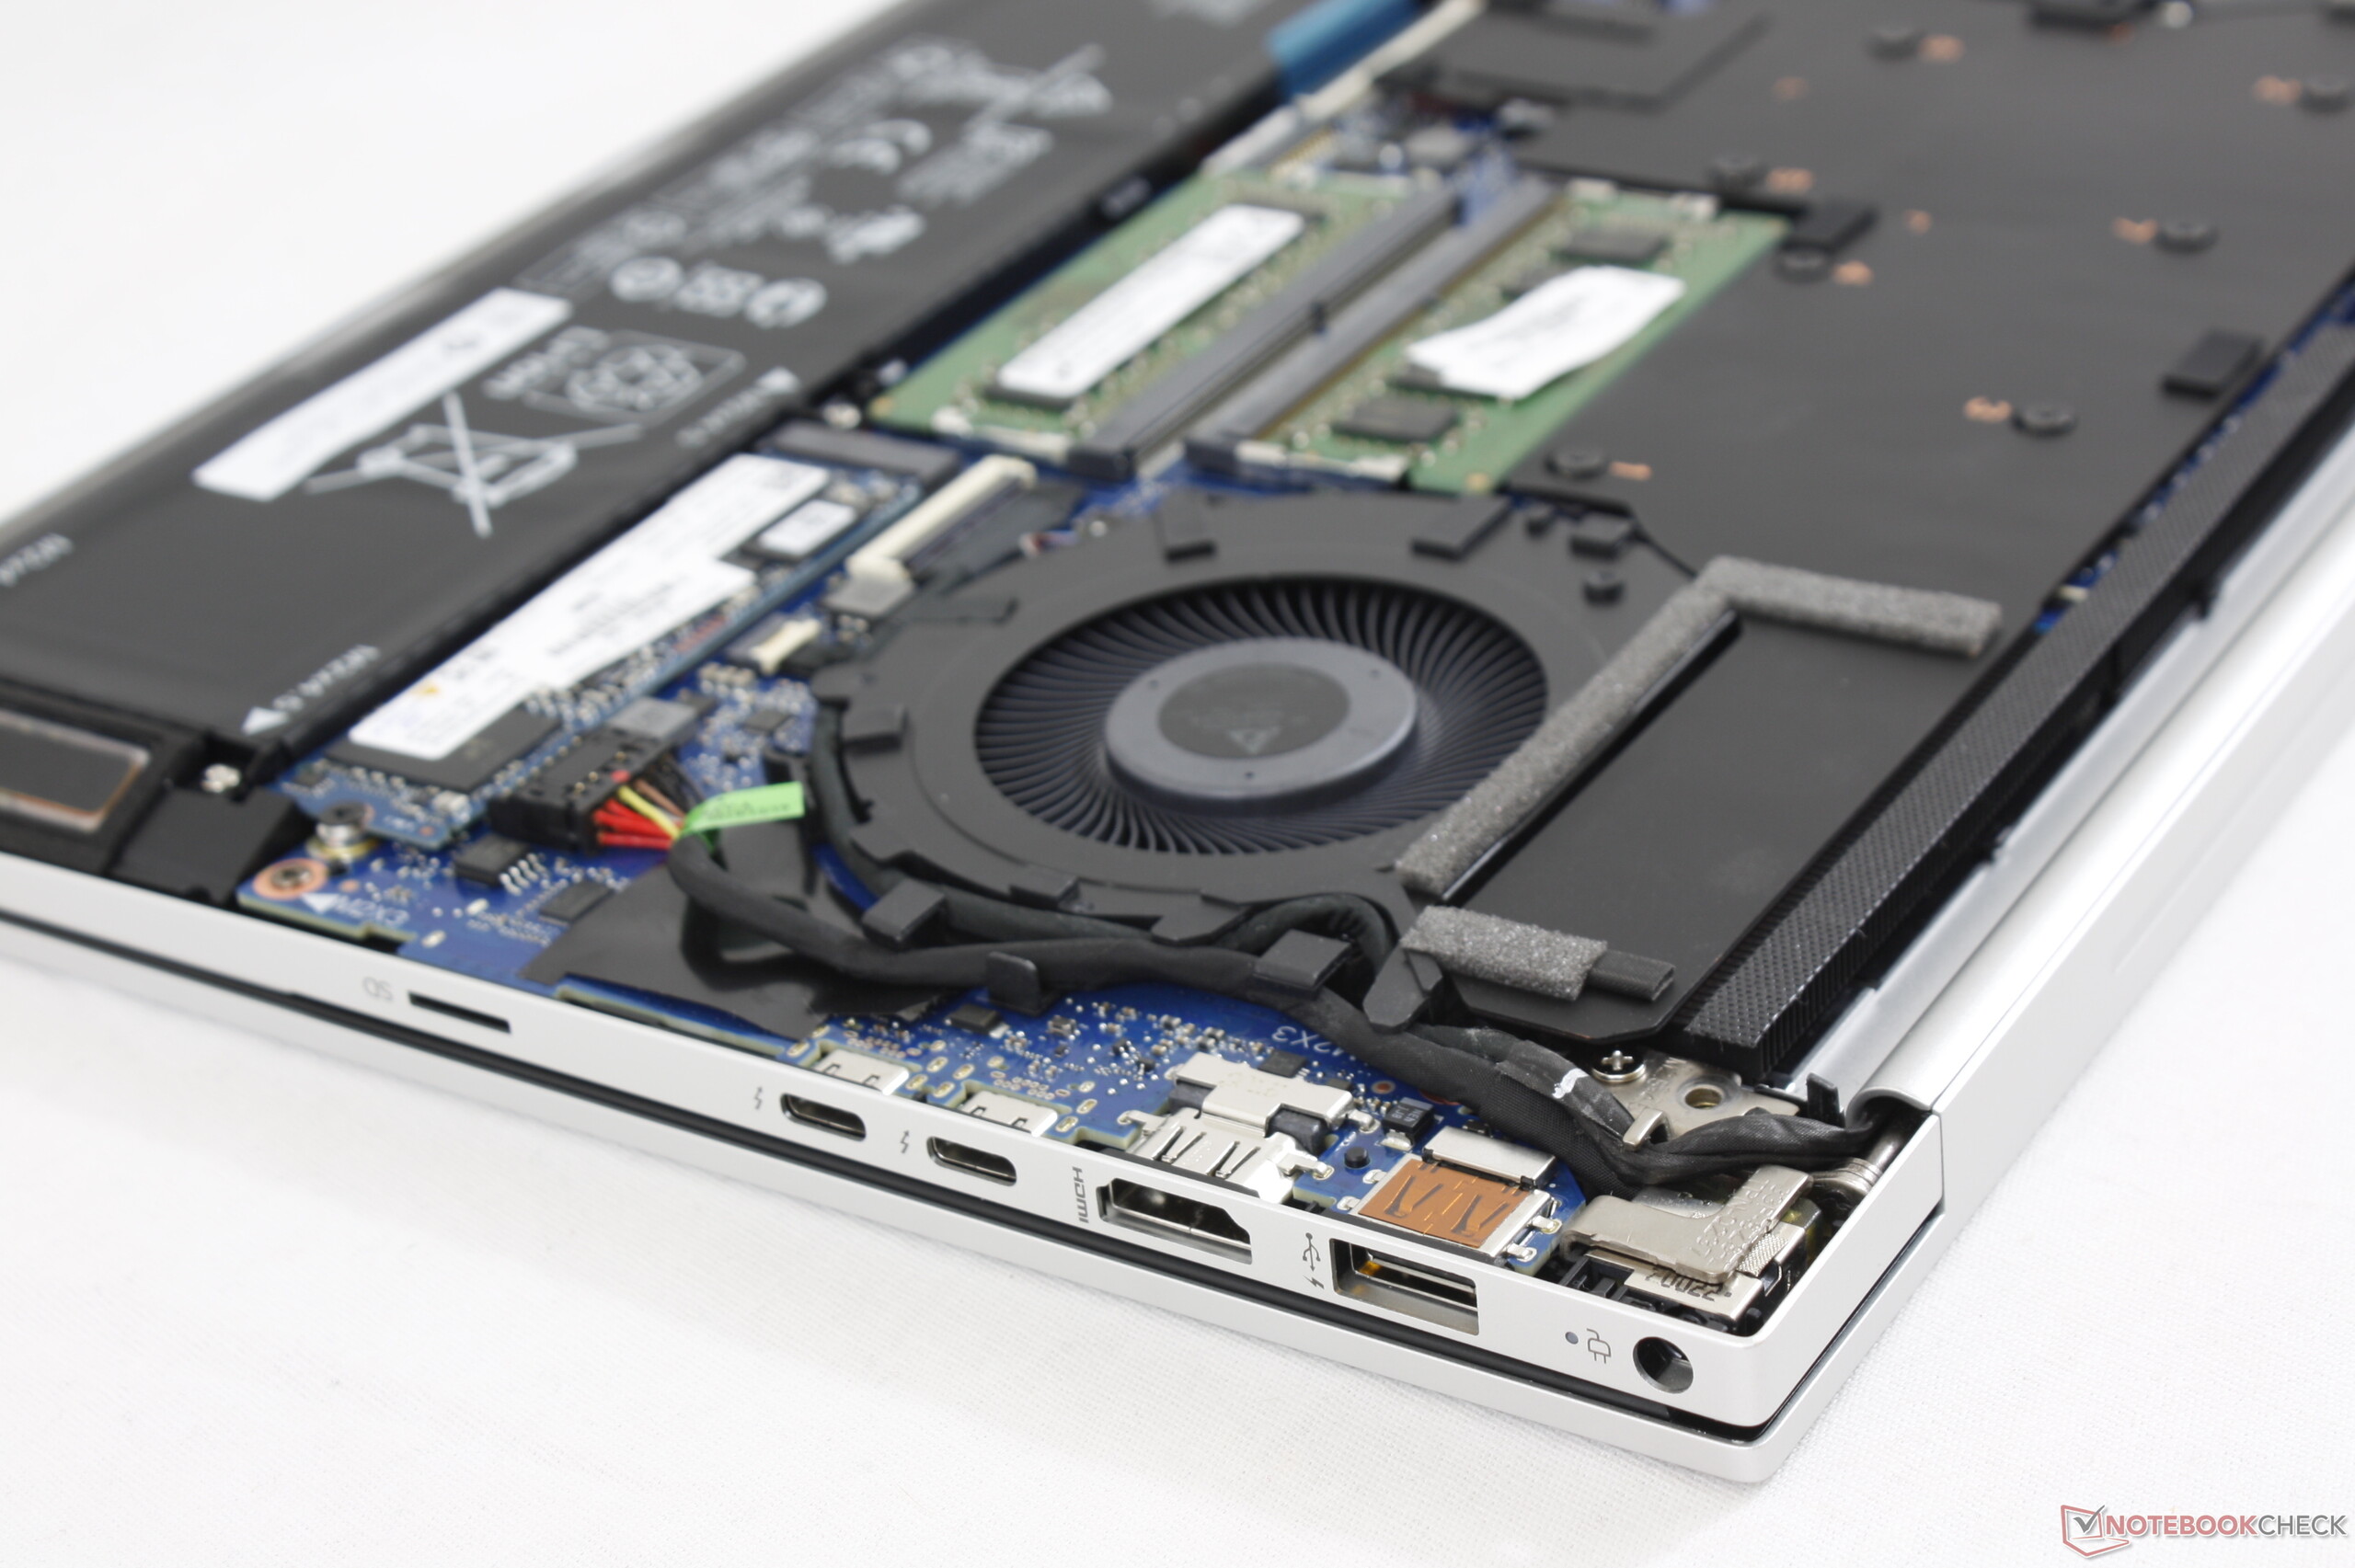
Det finns några justeringar som hade gjort Envy 15 ännu bättre. Stöd för USB C-laddning hade varit extremt användbart för den som reser mycket med tanke på att man då skulle kunna lämna den stora 200 W-nätadaptern hemma när den inte behövs. Både gångjärnen och klickplattan kunde varit fastare för att bättre reflektera den nya modellens pris. En mindre påträngande placering av fingeravtrycksläsaren hade också varit bättre för alla som förlitar sig på Fn-knappen.
Vill du ha en MacBook Pro men önskar att den hade snabbare grafik, OLED och fler portar? Då är det värt att ta en titt på 2020 års Envy 15. Den drivs inte längre av en ULV-processor utan har istället spelliknande hårdvarualternativ i ett Ultrabook-liknande chassi, vilket är en utmärkt mittenlösning.
HP Envy 15-ep0098nr
- 08/31/2022 v7 (old)
Allen Ngo
Price comparison
