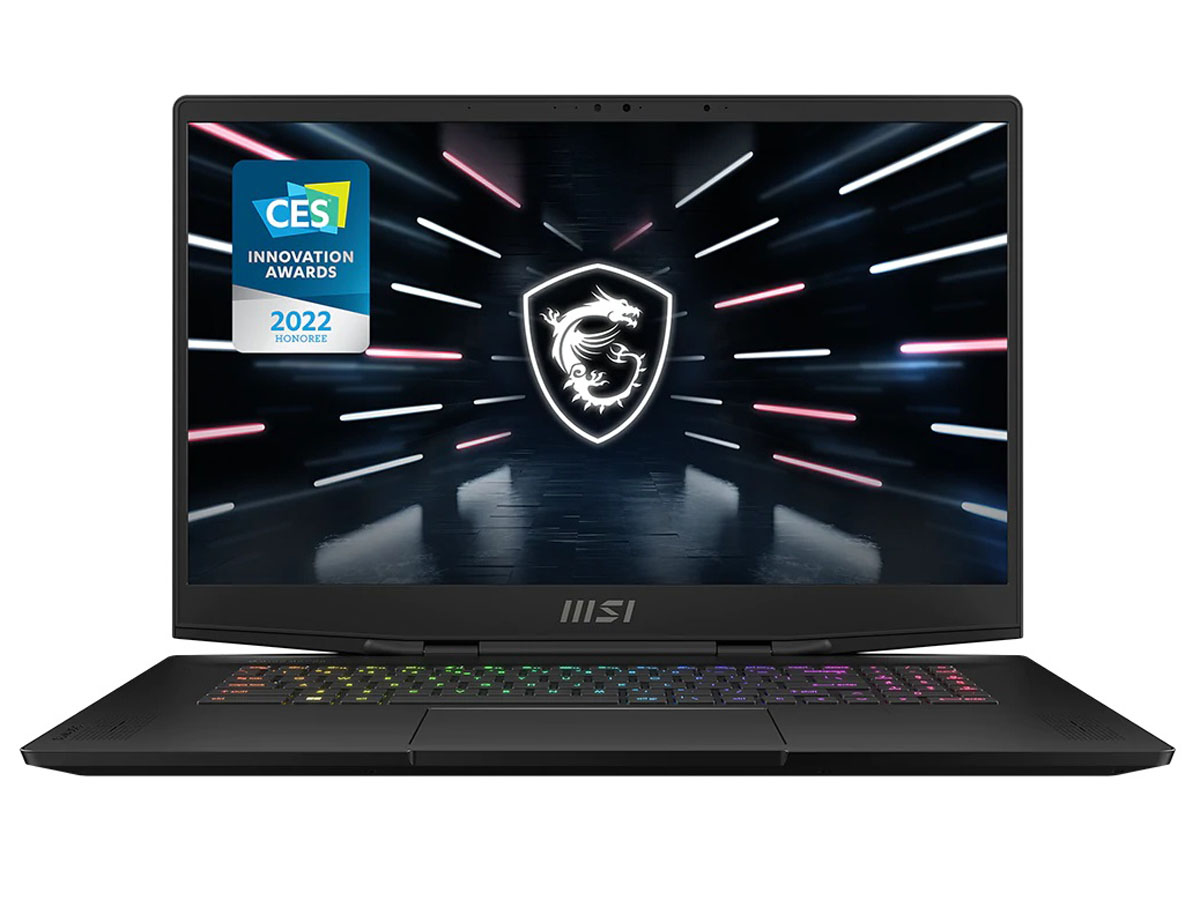
Recension av MSI Stealth GS77 - Ett bra alternativ till Razer Blade 17?
När MSI introducerade GS76 med 11:e generationens Intel förra året skulle modellen använda en helt annan chassidesign än den föregående GS75. För 2022 har GS77 med 12th gen Intel anlänt för att ersätta GS76 med ännu en fräsch chassiombyggnad. Vi är definitivt förvånade över att se ett nytt utseende så snart för MSI:s GS-serie, särskilt eftersom de flesta andra bärbara datorer skulle använda samma chassiskelett under åtminstone några år i rad innan de så småningom får en ansiktslyftning
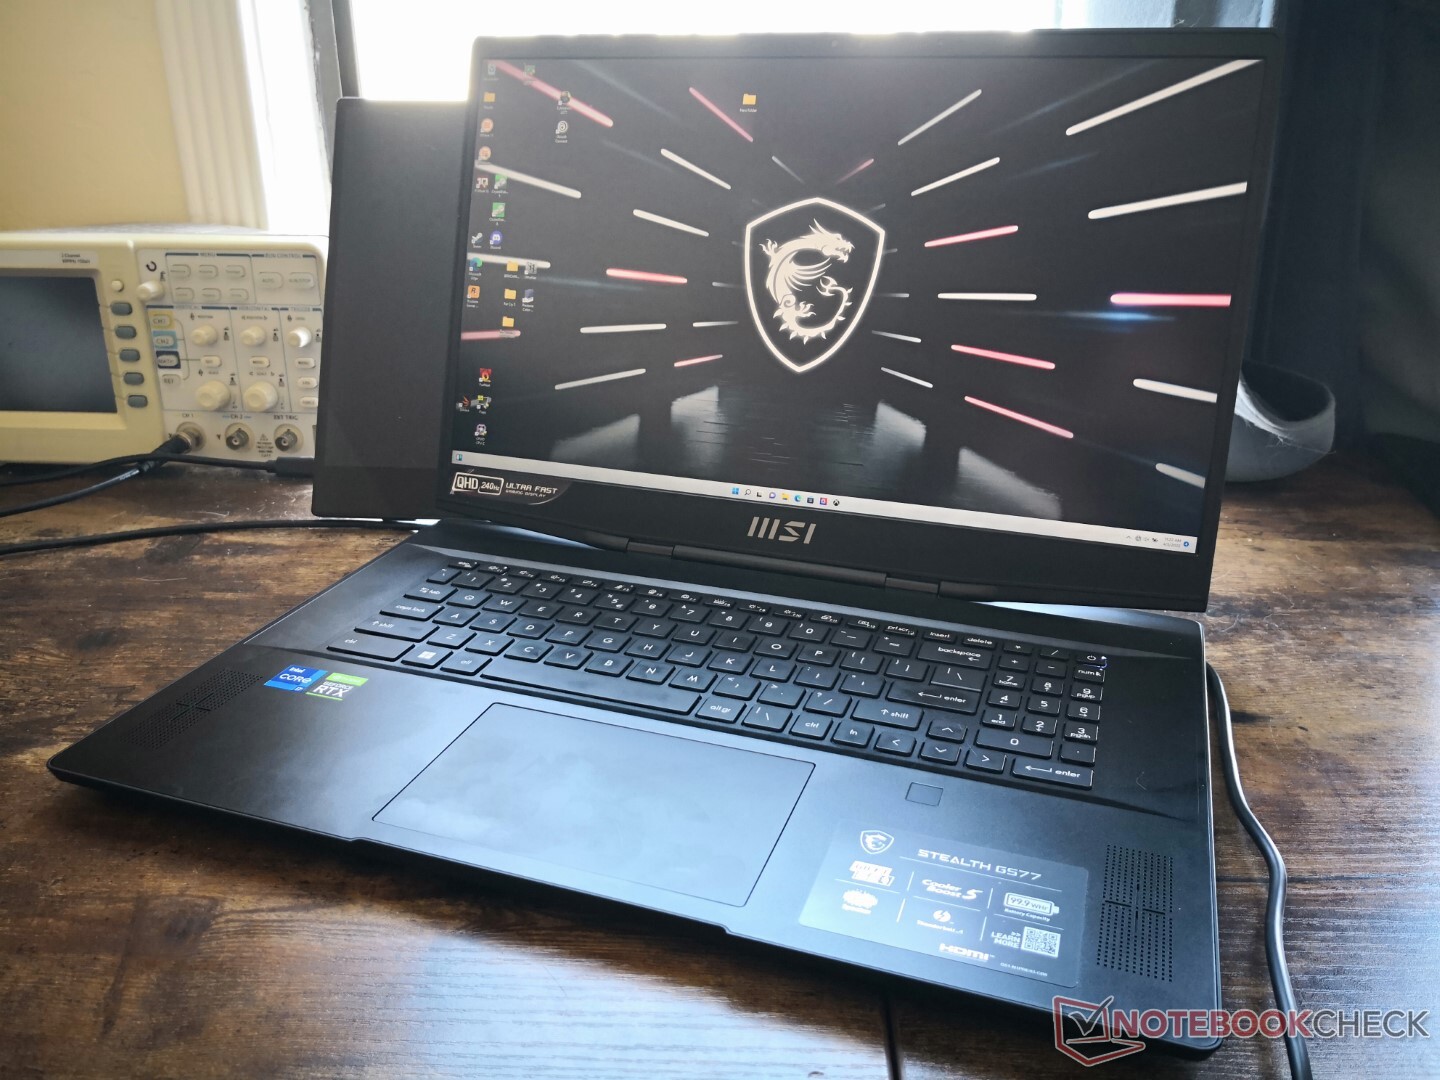
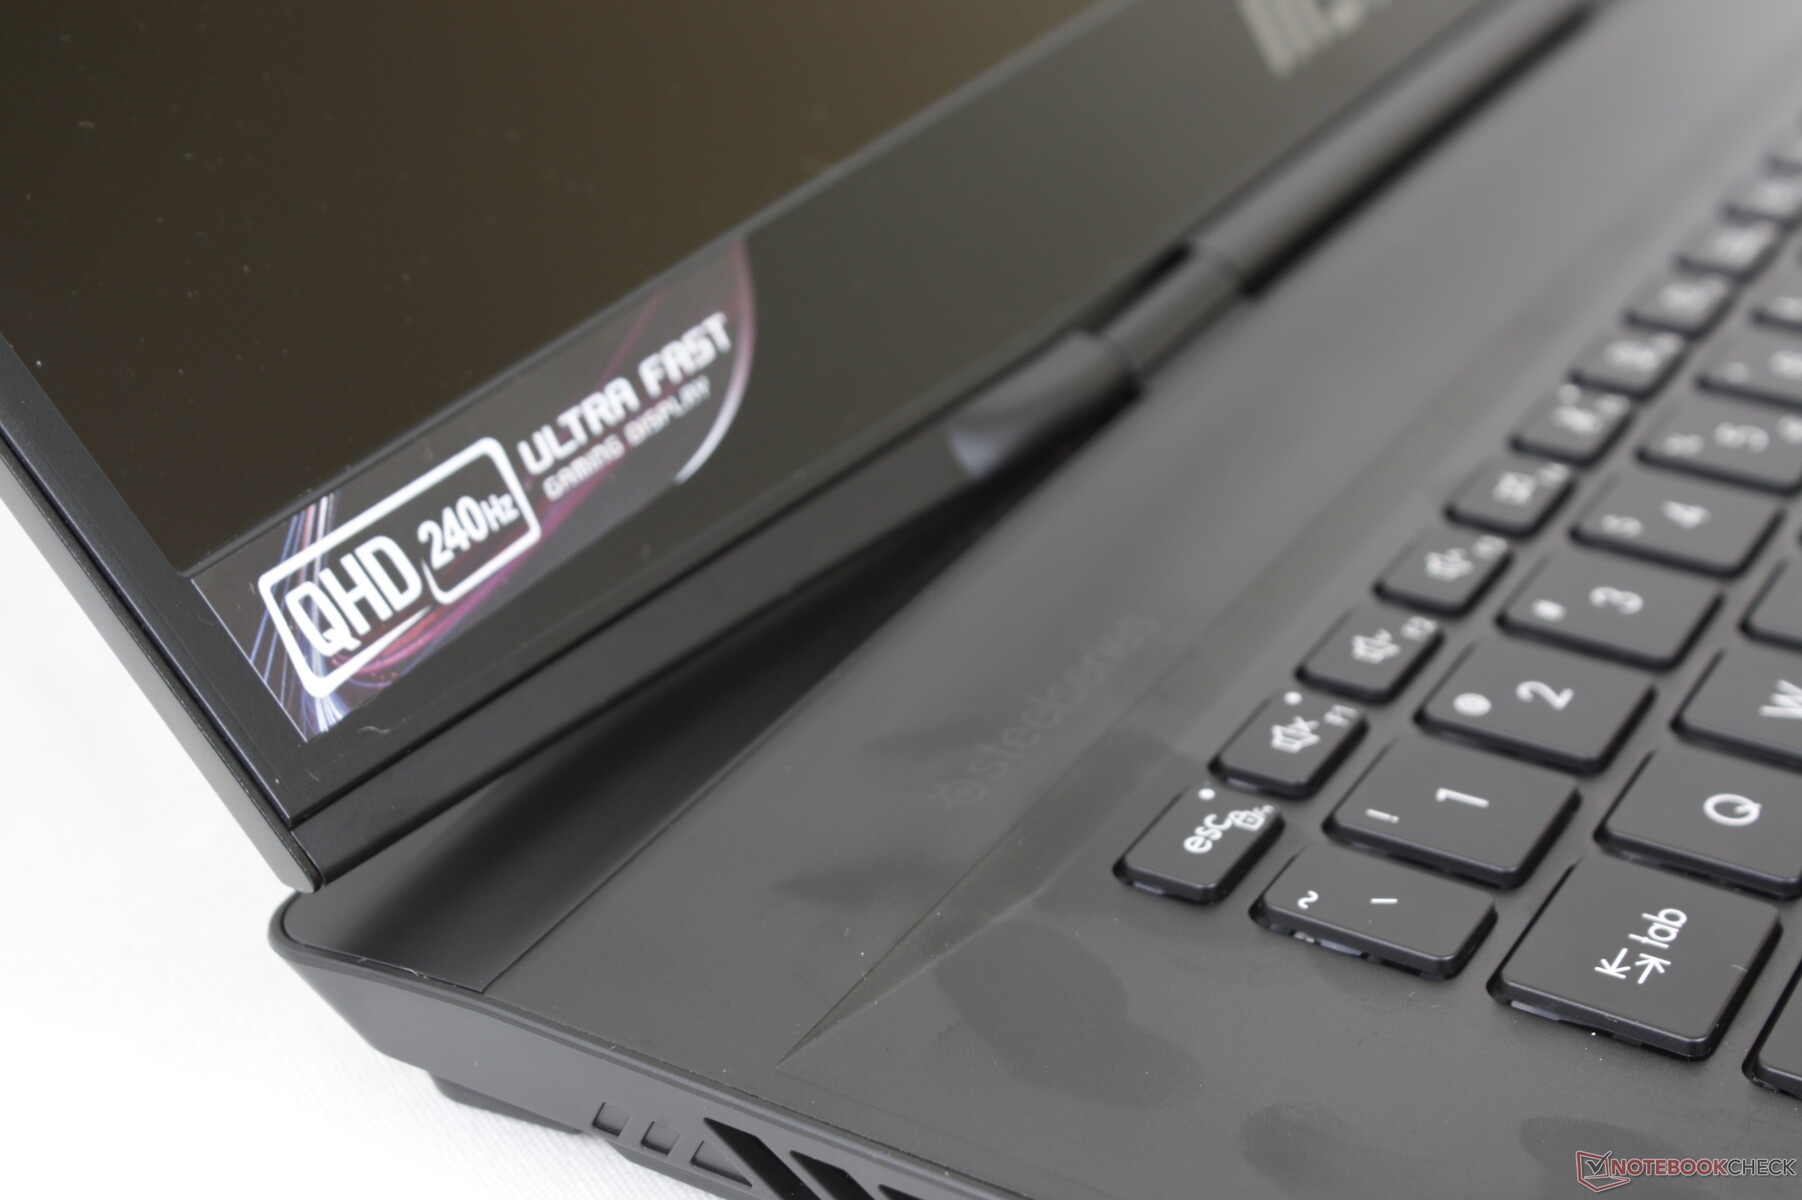
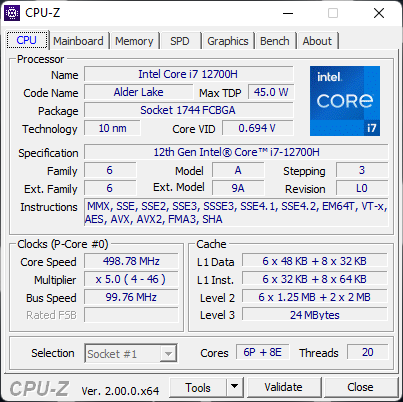
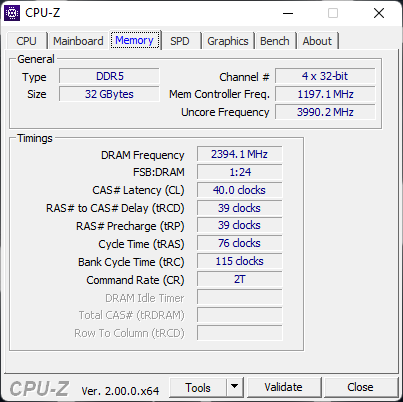
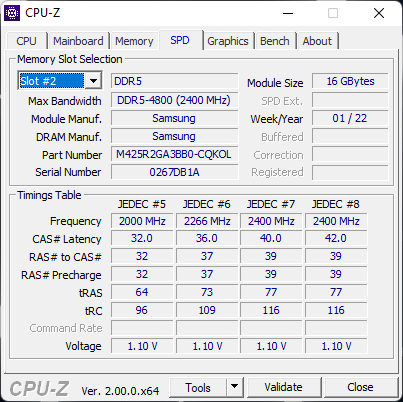
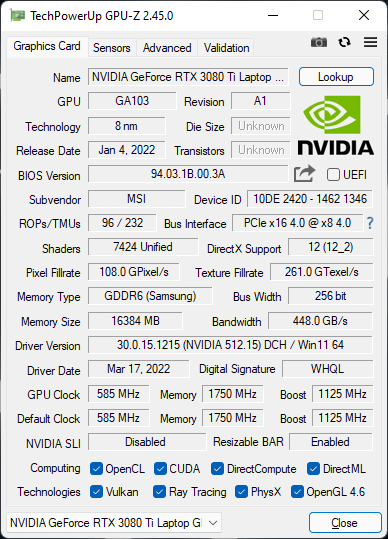
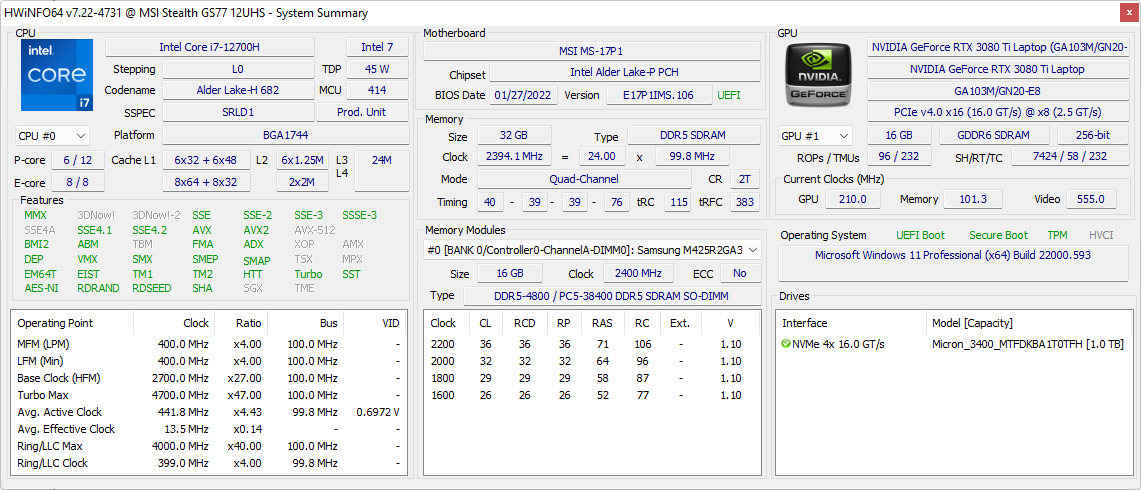
Vår konfiguration i recensionen kommer från Xotic PC med en 12th gen Core i7-12700H CPU, 105 W TGP GeForce RTX 3080 Ti GPU, 32 GB DDR5-4800 RAM, 240 Hz 1440p IPS-skärm och en 1 TB PCIe4 x4 NVMe SSD för cirka 3700 USD i butik. Andra SKU:er finns tillgängliga med Core i9-12900H, RTX 3070 Ti, RTX 3080, 360 Hz FHD eller 120 Hz UHD-skärmar istället
Bland de konkurrerande modellerna finns andra ultratunna Razer Blade 17, Dell Alienware x17,Asus ROG Zephyrus S17och Gigabyte Aorus 17 serier
Fler recensioner av MSI
Jämförelse av potentiella konkurrenter
Gradering | Datum | Modell | Vikt | Höjd | Storlek | Upplösning | Pris |
|---|---|---|---|---|---|---|---|
| 87.2 % v7 (old) | 04/2022 | MSI Stealth GS77 12UHS-083US i7-12700H, GeForce RTX 3080 Ti Laptop GPU | 2.9 kg | 20.8 mm | 17.30" | 2560x1440 | |
| 86.2 % v7 (old) | 10/2021 | MSI GS76 Stealth 11UH i9-11900H, GeForce RTX 3080 Laptop GPU | 2.4 kg | 20 mm | 17.30" | 3840x2160 | |
| 91.2 % v7 (old) | 03/2022 | Razer Blade 17 RTX 3080 Ti i7-12800H, GeForce RTX 3080 Ti Laptop GPU | 2.7 kg | 19.9 mm | 17.30" | 2560x1440 | |
| 87.5 % v7 (old) | 01/2022 | MSI GE76 Raider i9-12900HK, GeForce RTX 3080 Ti Laptop GPU | 3 kg | 26 mm | 17.30" | 1920x1080 | |
| 89 % v7 (old) | 09/2021 | Alienware x17 RTX 3080 P48E i7-11800H, GeForce RTX 3080 Laptop GPU | 3.2 kg | 21.4 mm | 17.30" | 3840x2160 | |
| 90.1 % v7 (old) | 08/2021 | Asus ROG Zephyrus S17 GX703HSD i9-11900H, GeForce RTX 3080 Laptop GPU | 2.8 kg | 19.9 mm | 17.30" | 2560x1440 |
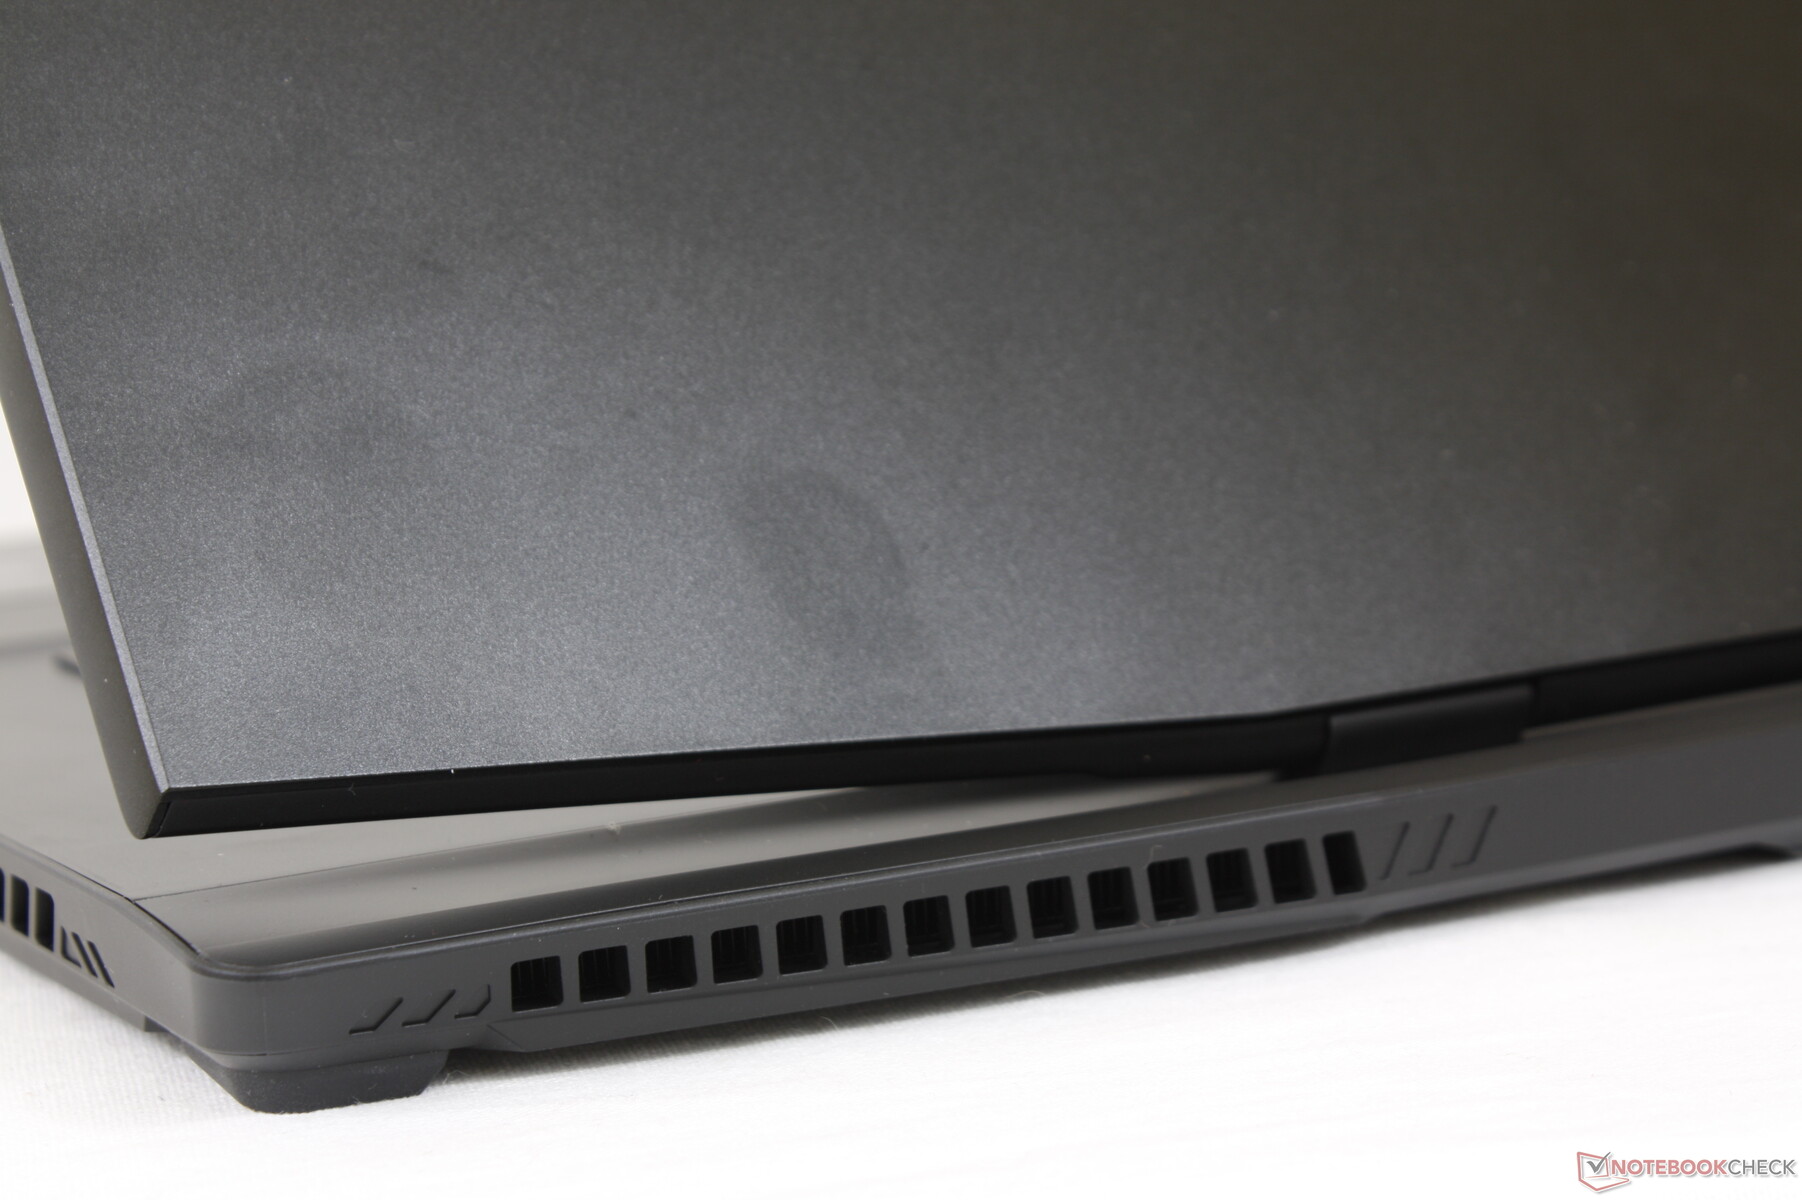
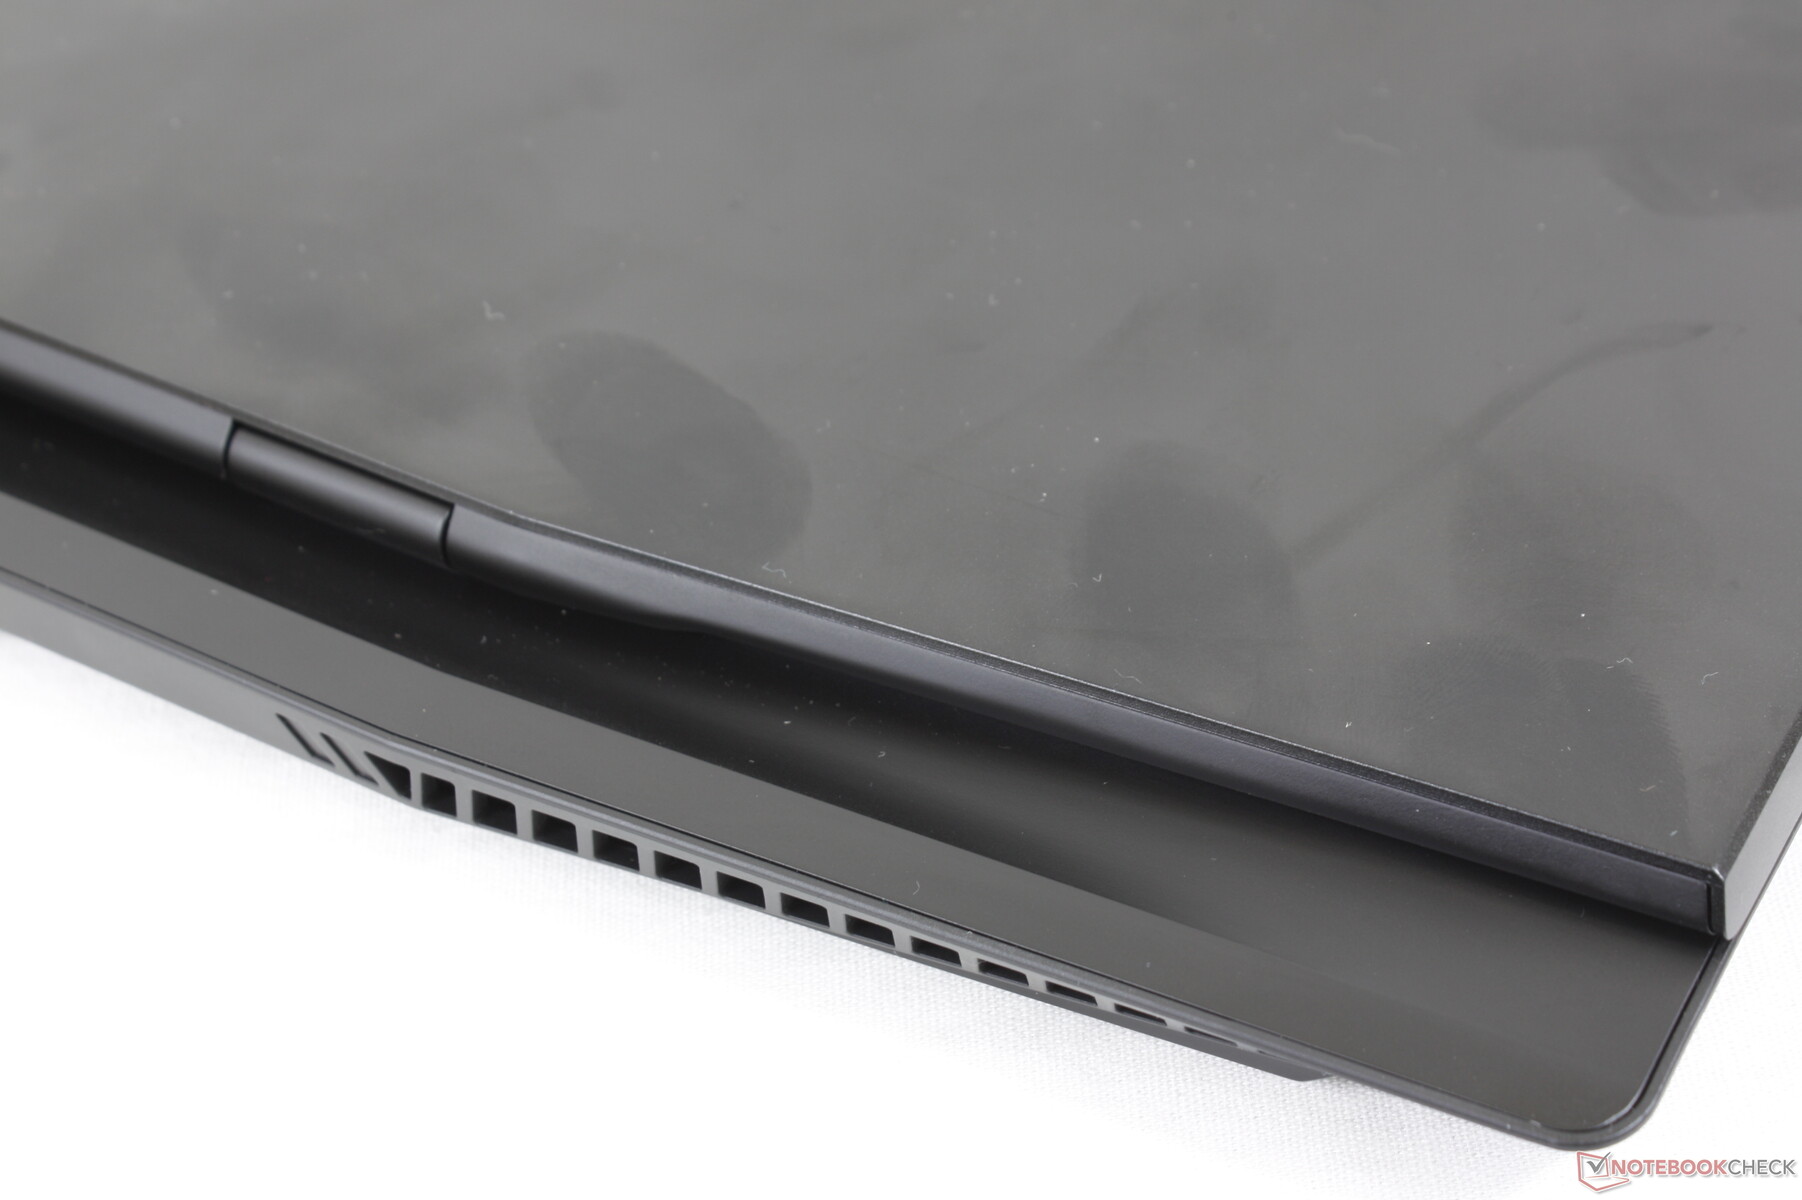
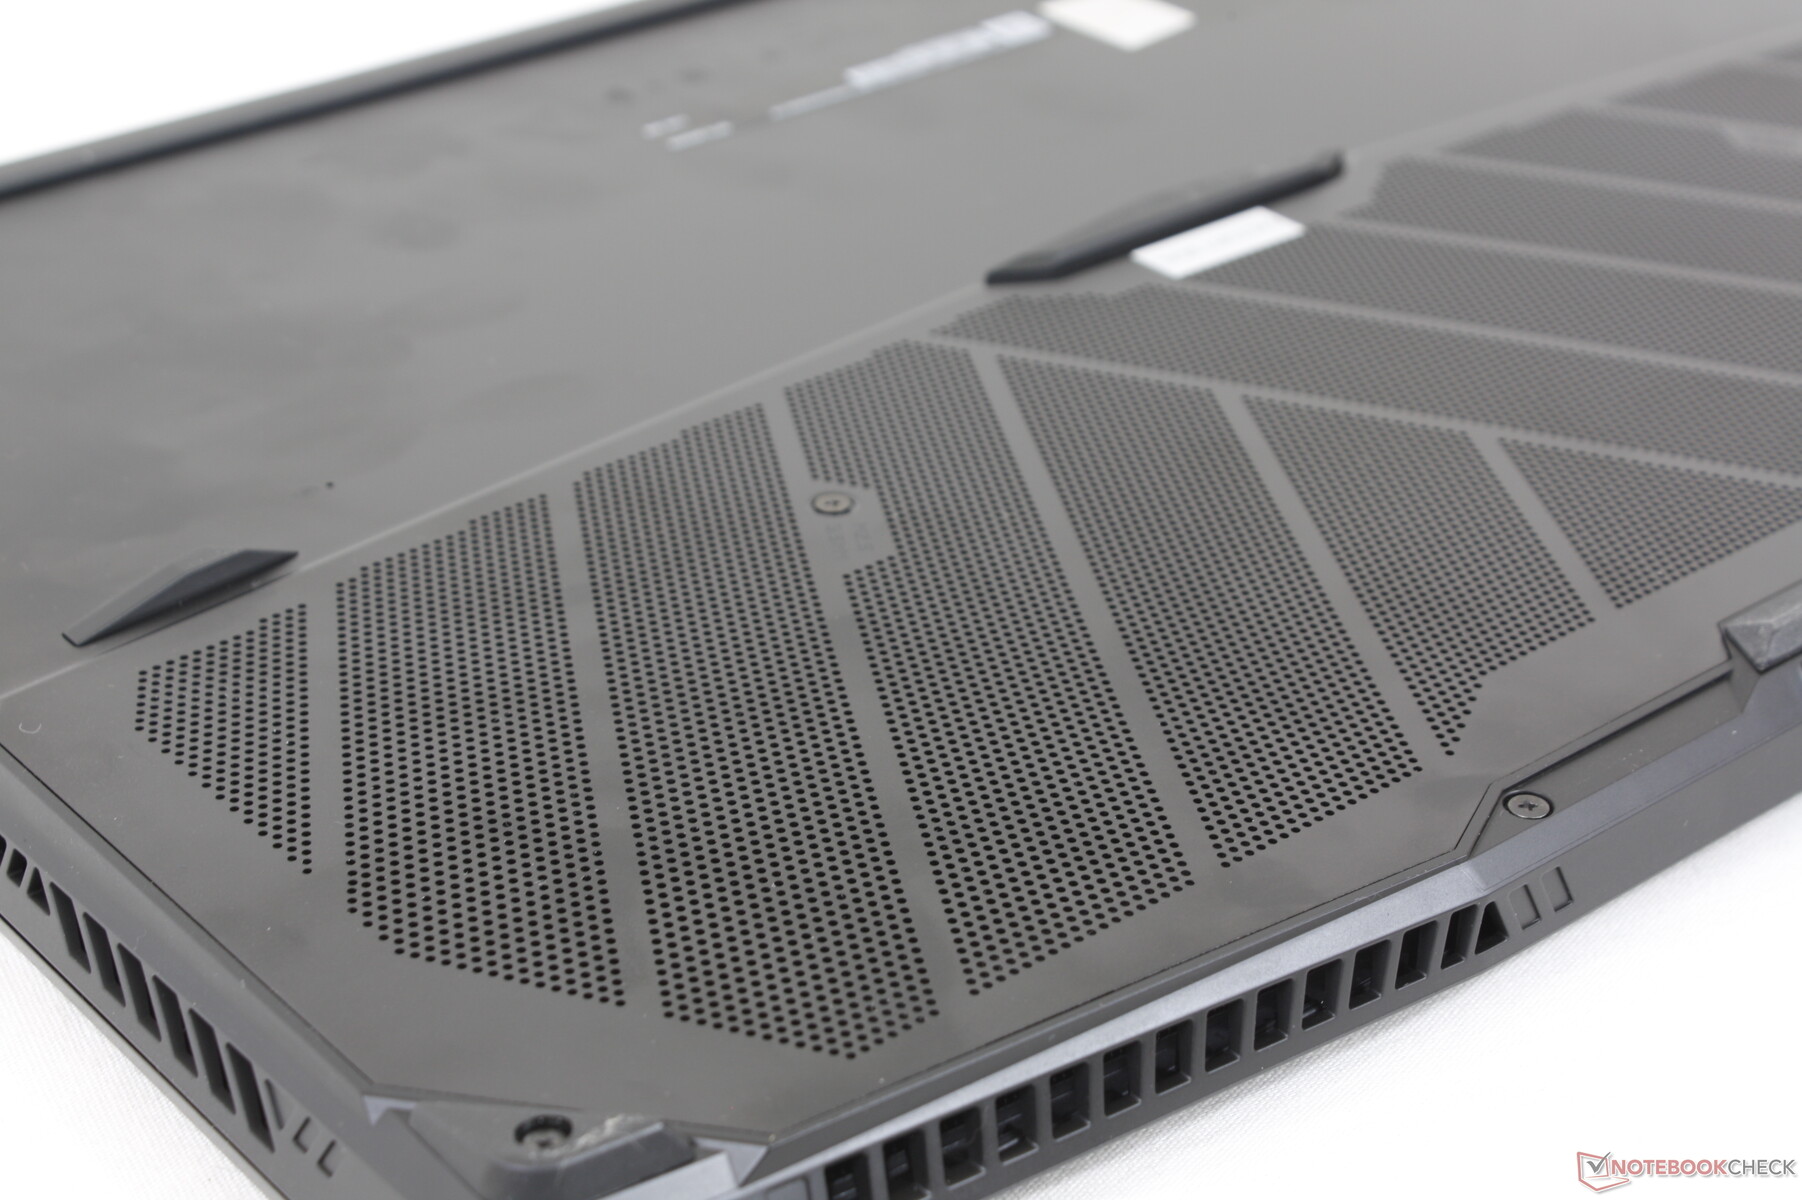
Hölje - Större, tyngre, hårdare
Ett av våra största klagomål på GS76 var att den offrade för mycket prestanda för en smalare och lättare formfaktor. Den omdesignade GS77 har åtgärdat detta genom att introducera en utskjutande jet-engine-baksida ungefär som på Alienware x17 eller MSI GT-serien. Vi är glada att se att chassiets styvhet också har förbättrats eftersom både basen och locket är mer obevekliga för alla vridningar och nedtryckningar än tidigare.
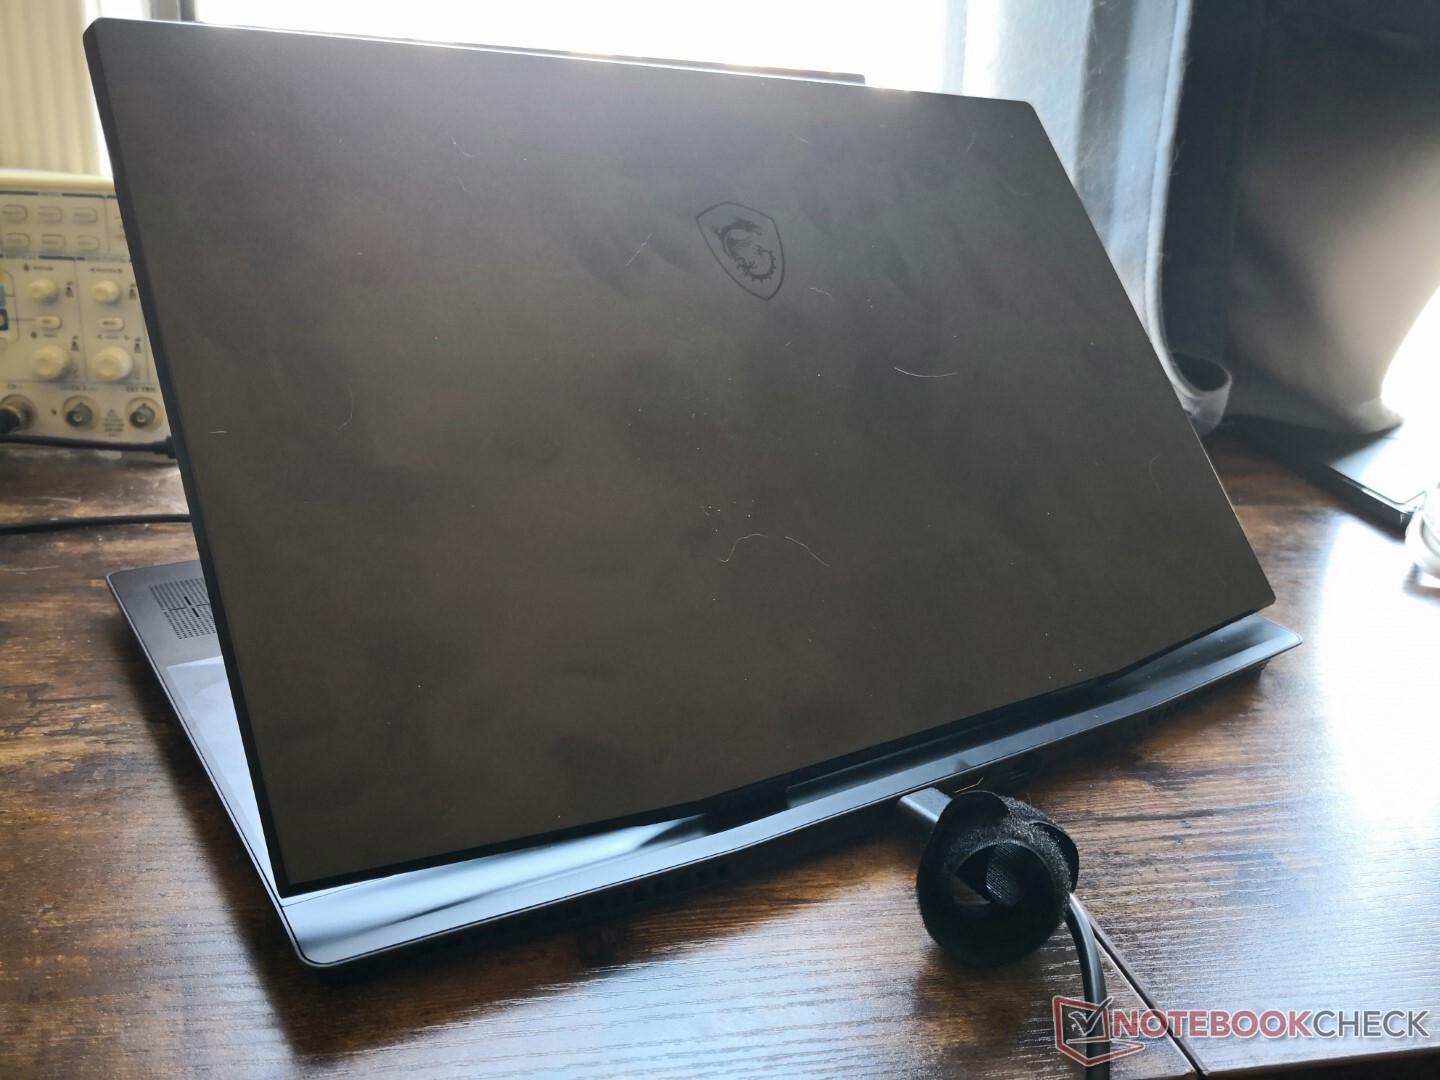
Det är intressant att GS77 är märkbart större och tyngre än den äldre GS76 med 14 procent respektive 21 procent. Den ökade storleken och vikten kan främst tillskrivas GS77:s tidigare nämnda större bakre del och det överlag tjockare skelettet. Modellen placerar sig mellan Blade 17 och Alienware x17 i både storlek och vikt som ett resultat av detta. I jämförelse var den äldre GS75 betydligt lättare med över 600 gram.
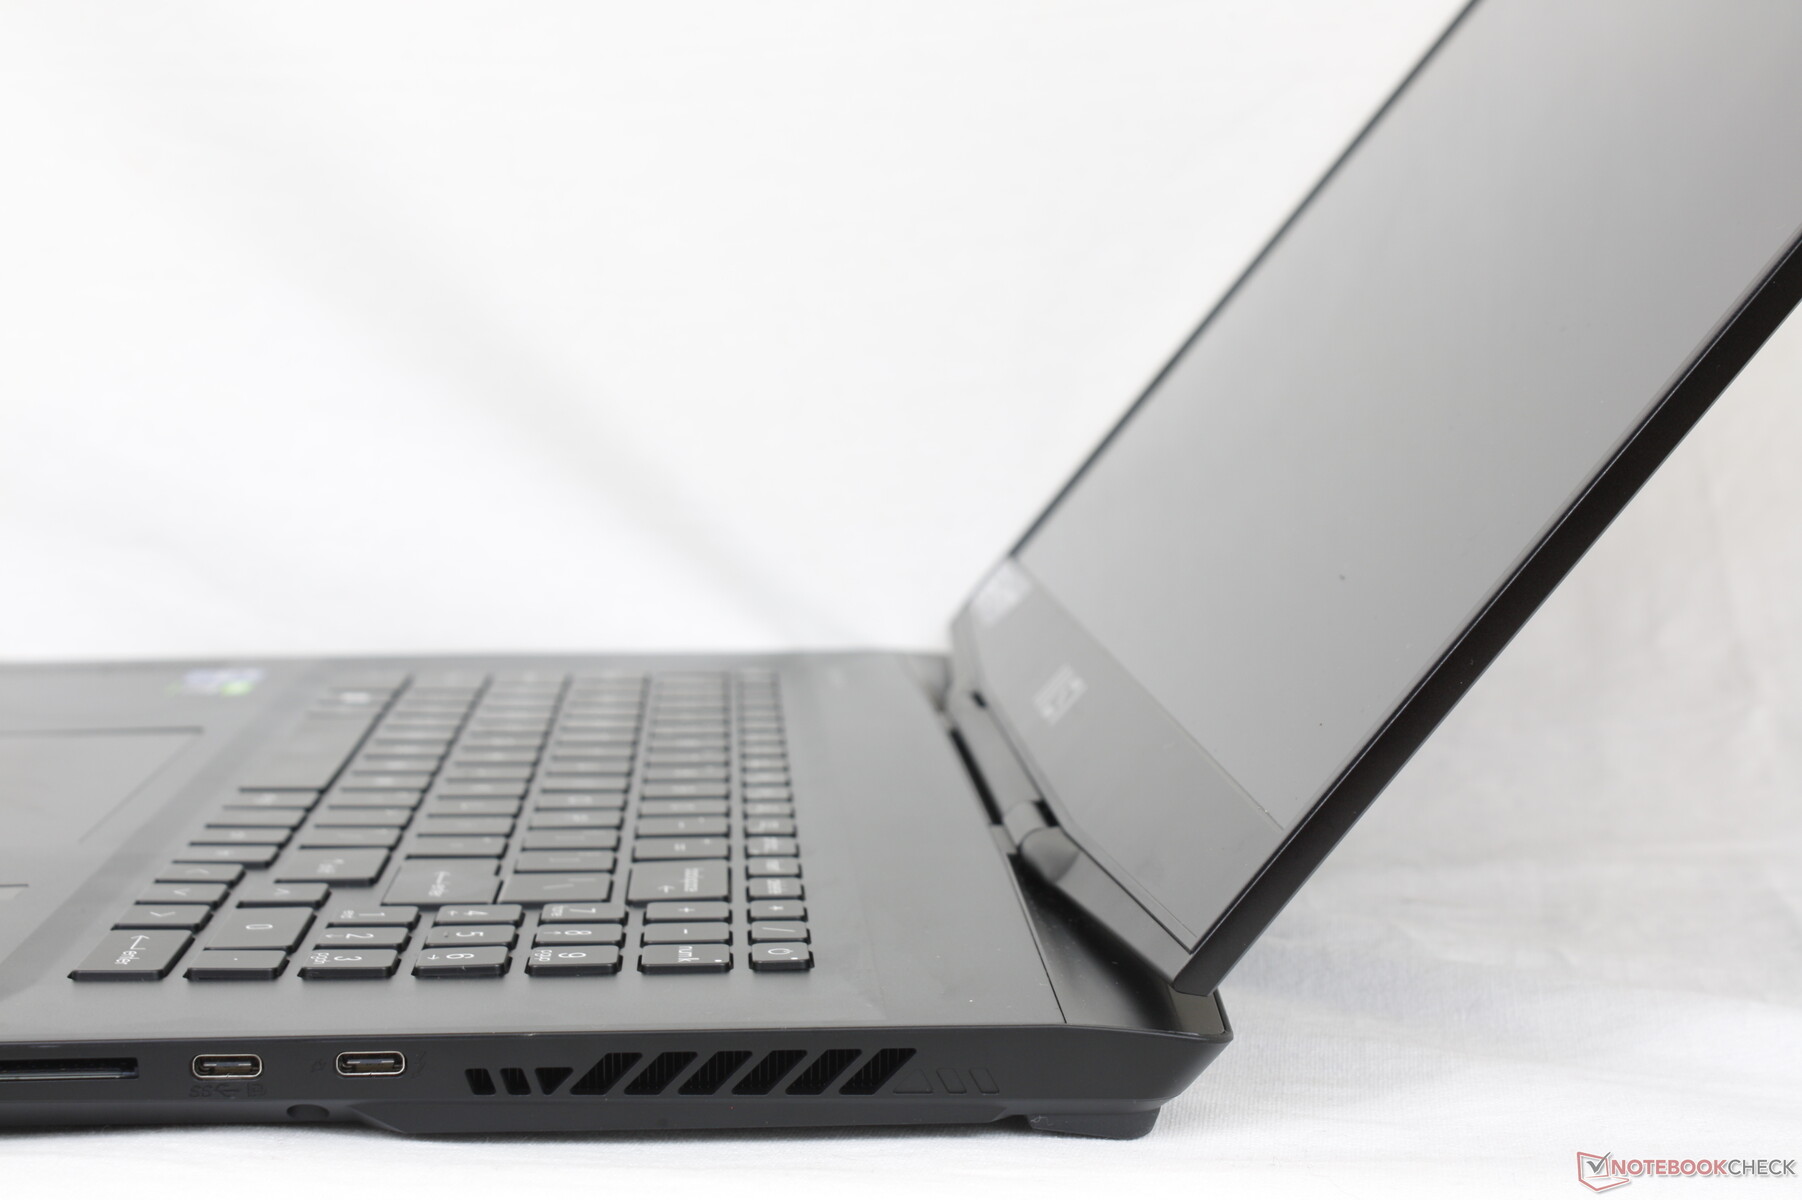
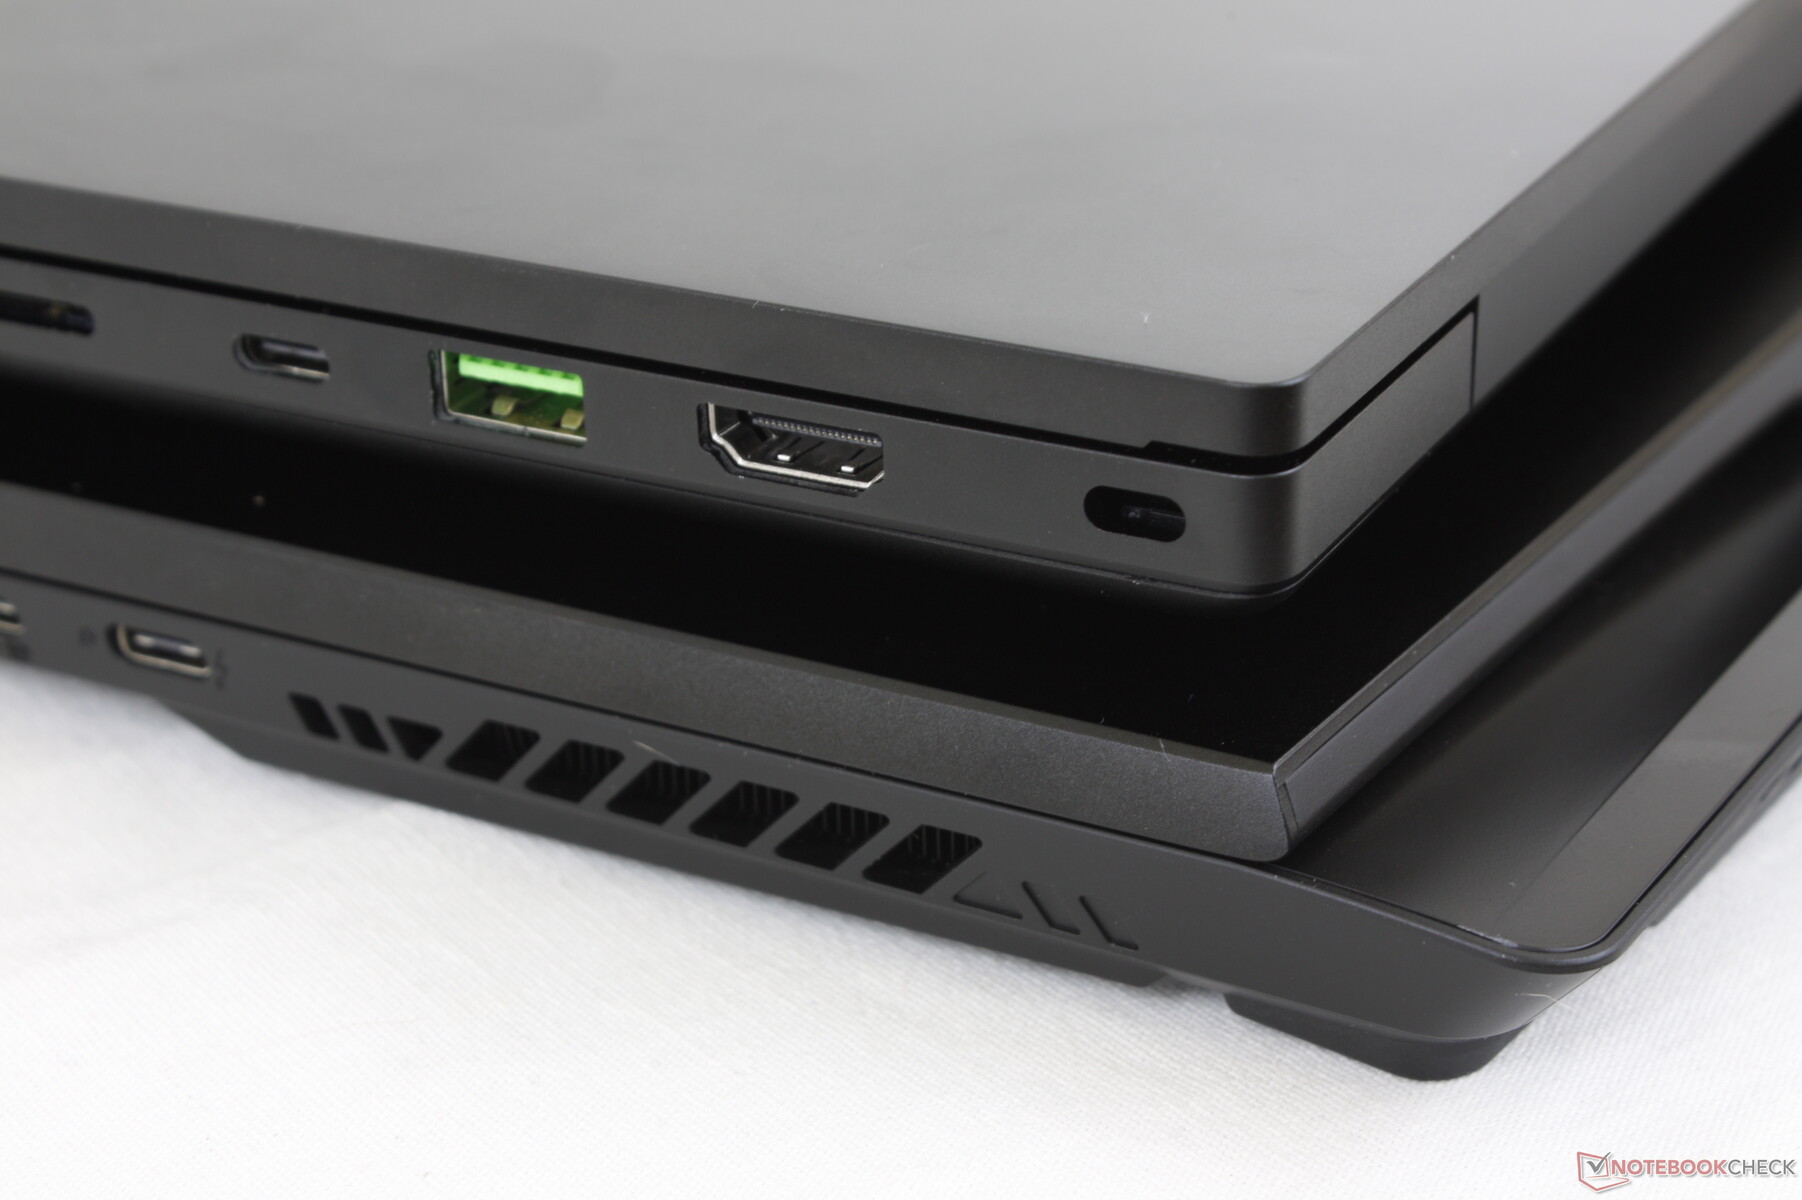
Anslutningsmöjligheter - Samma som tidigare
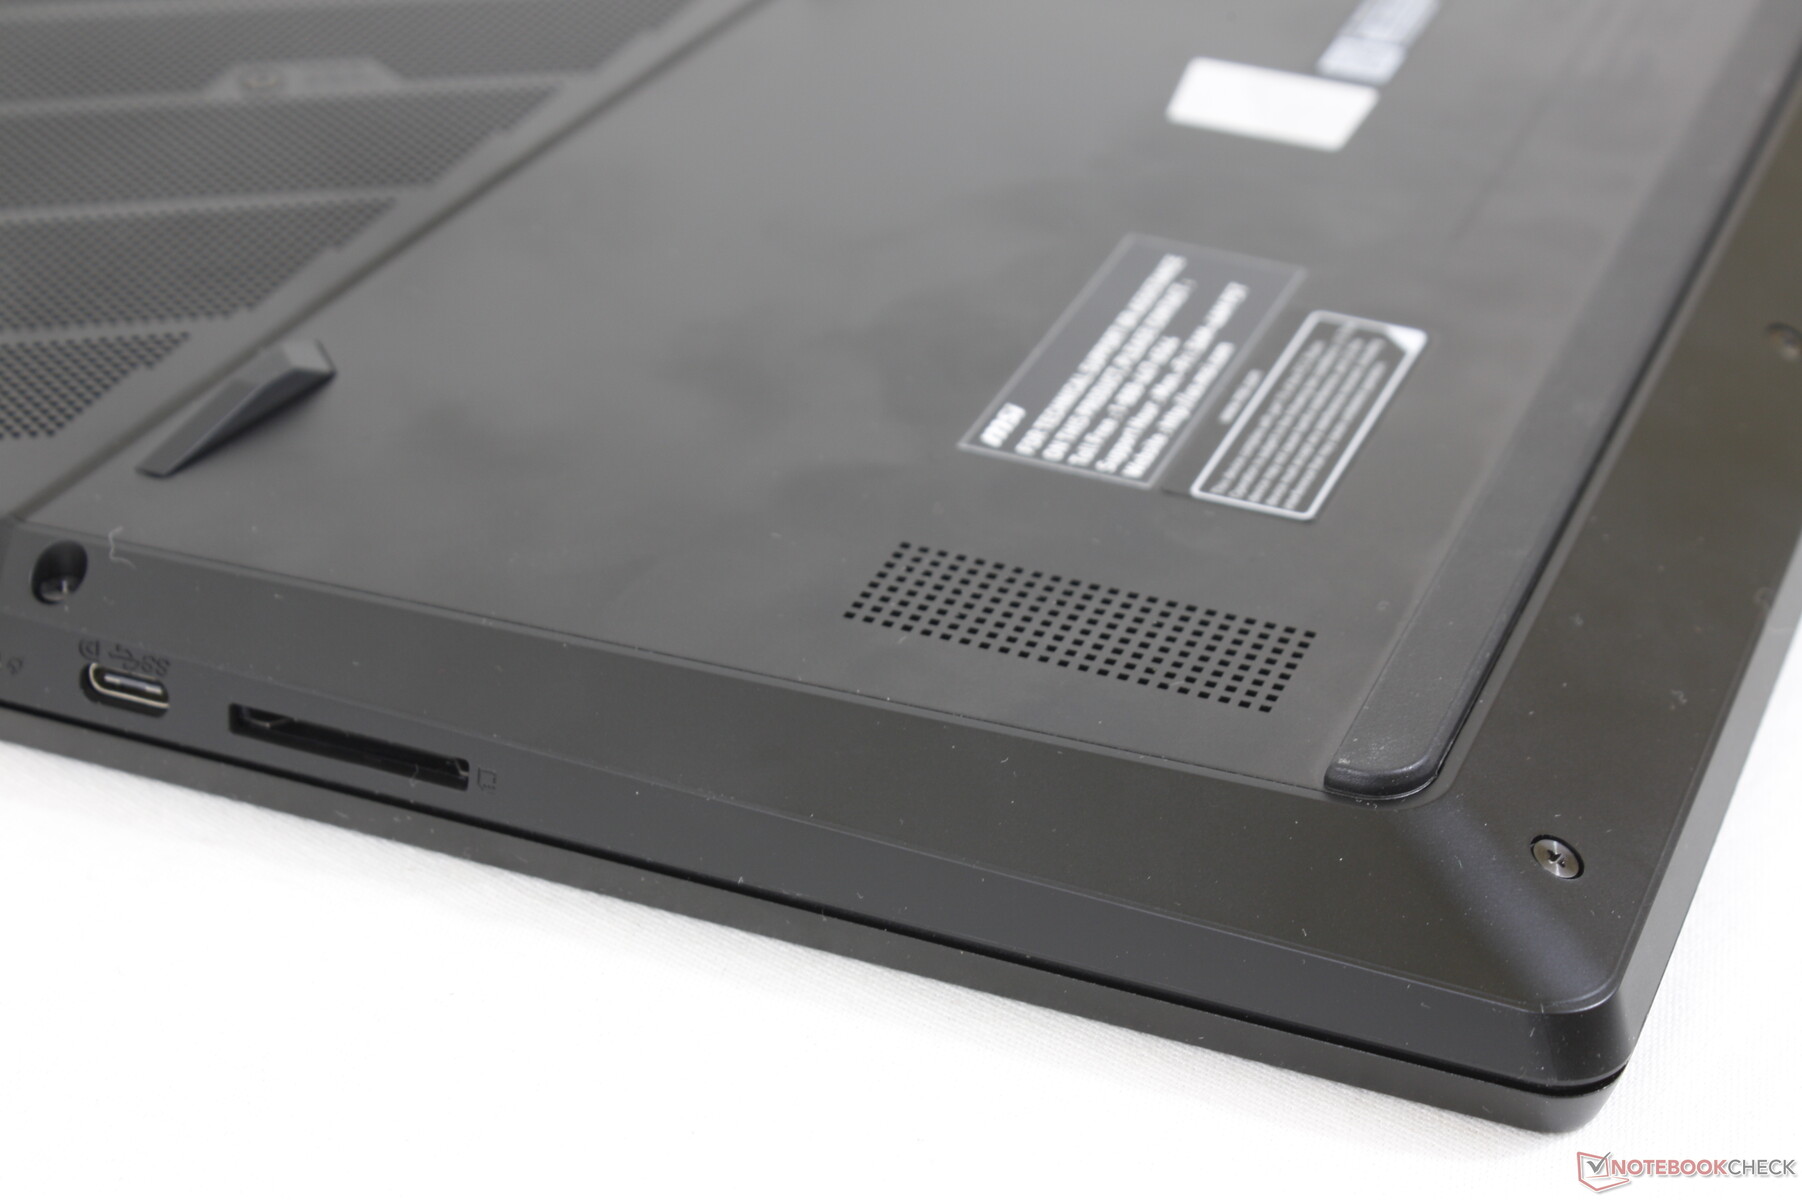
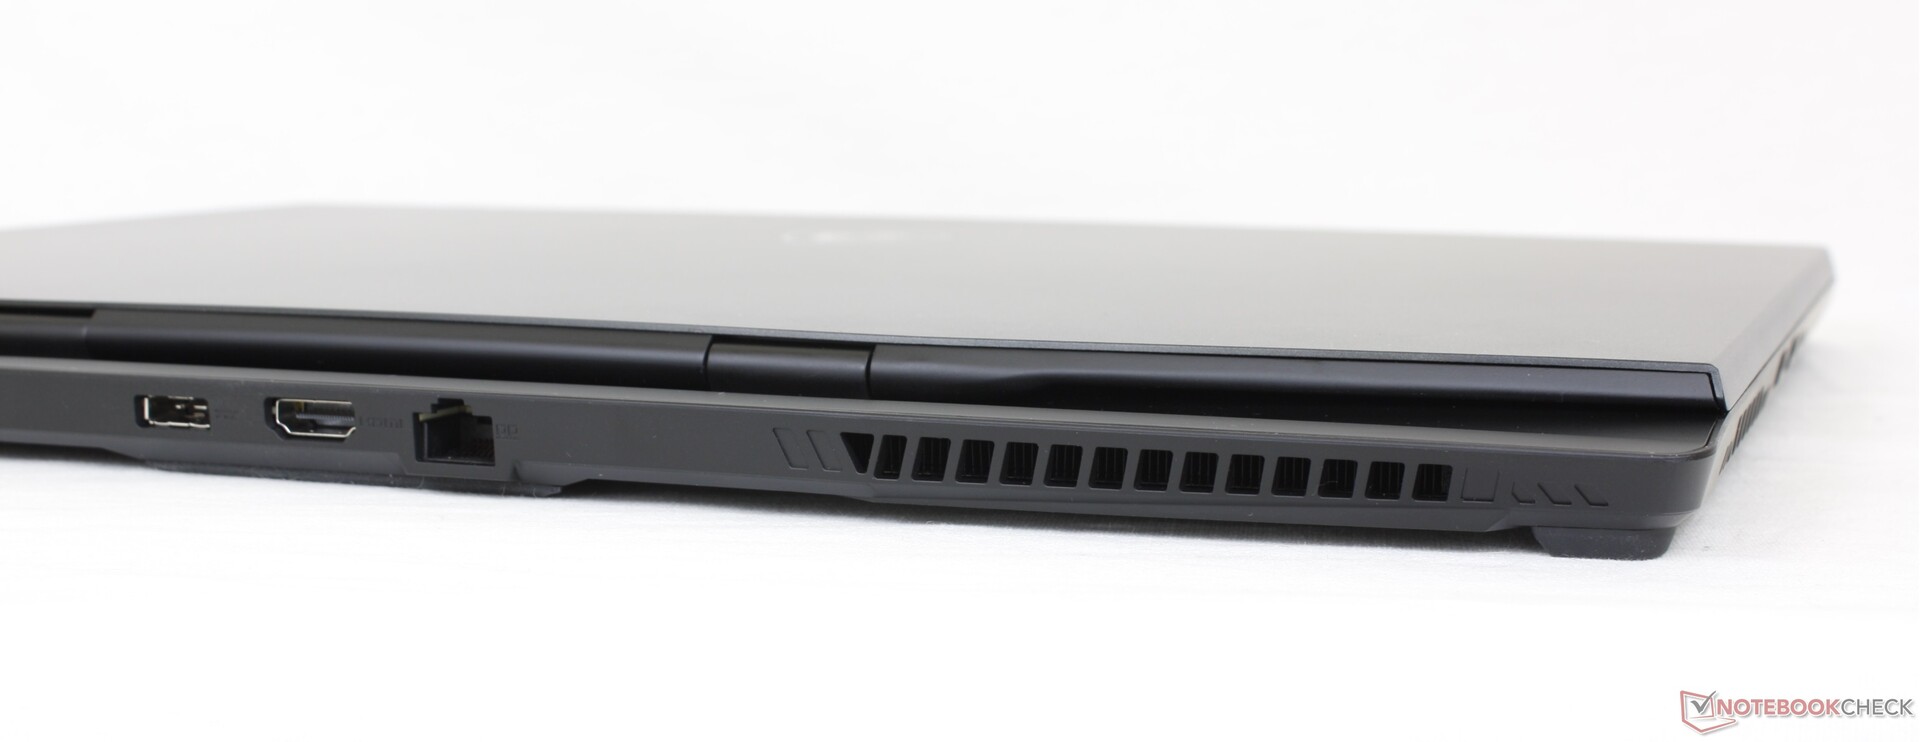
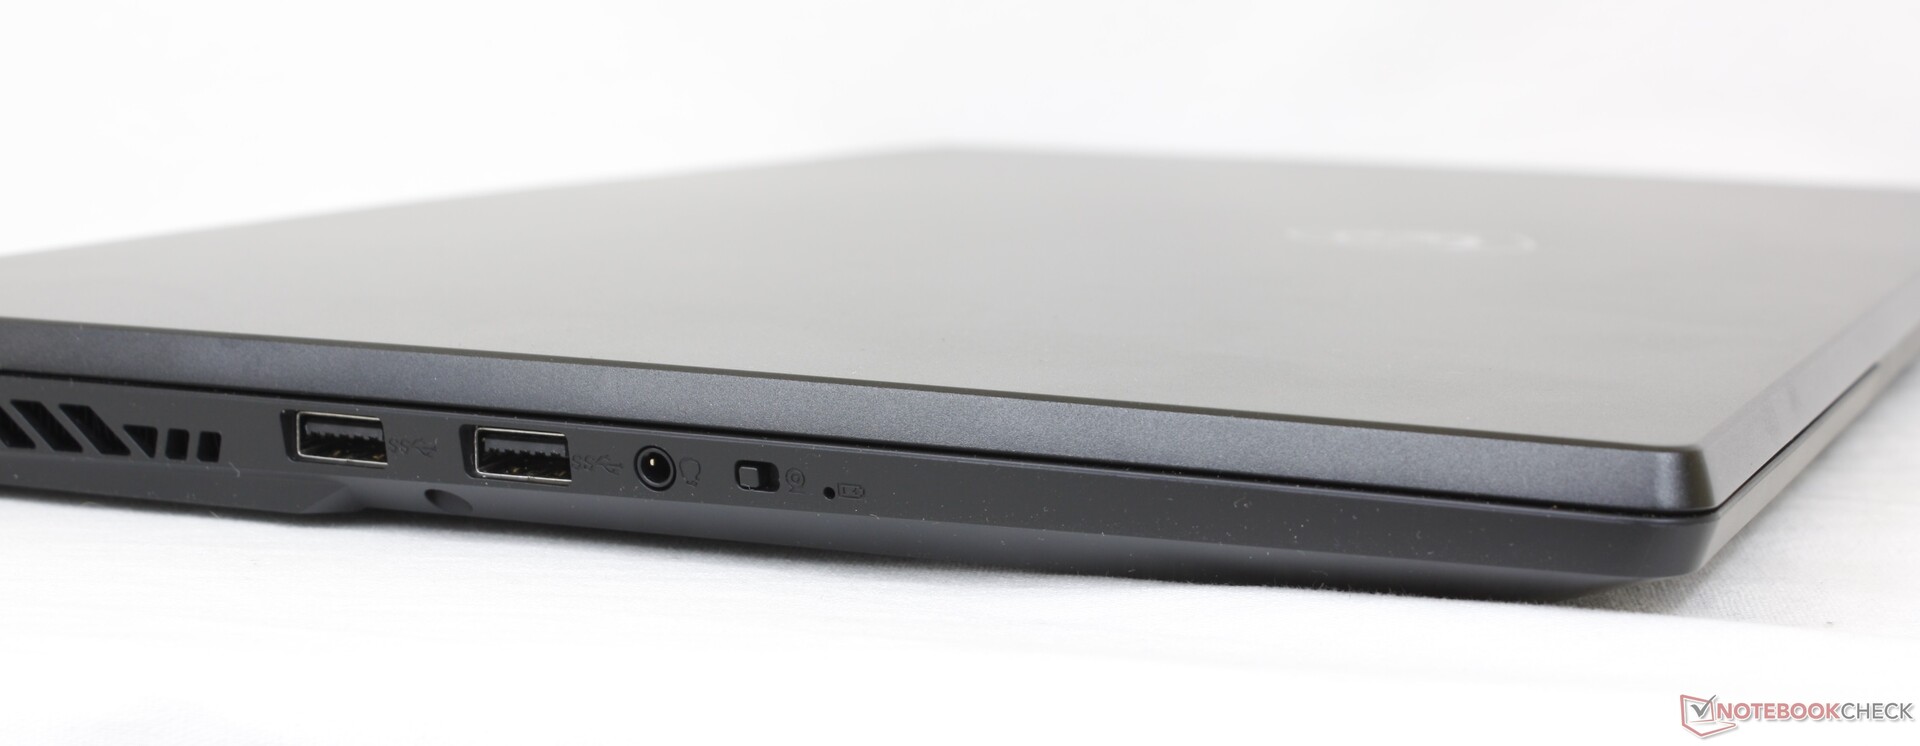
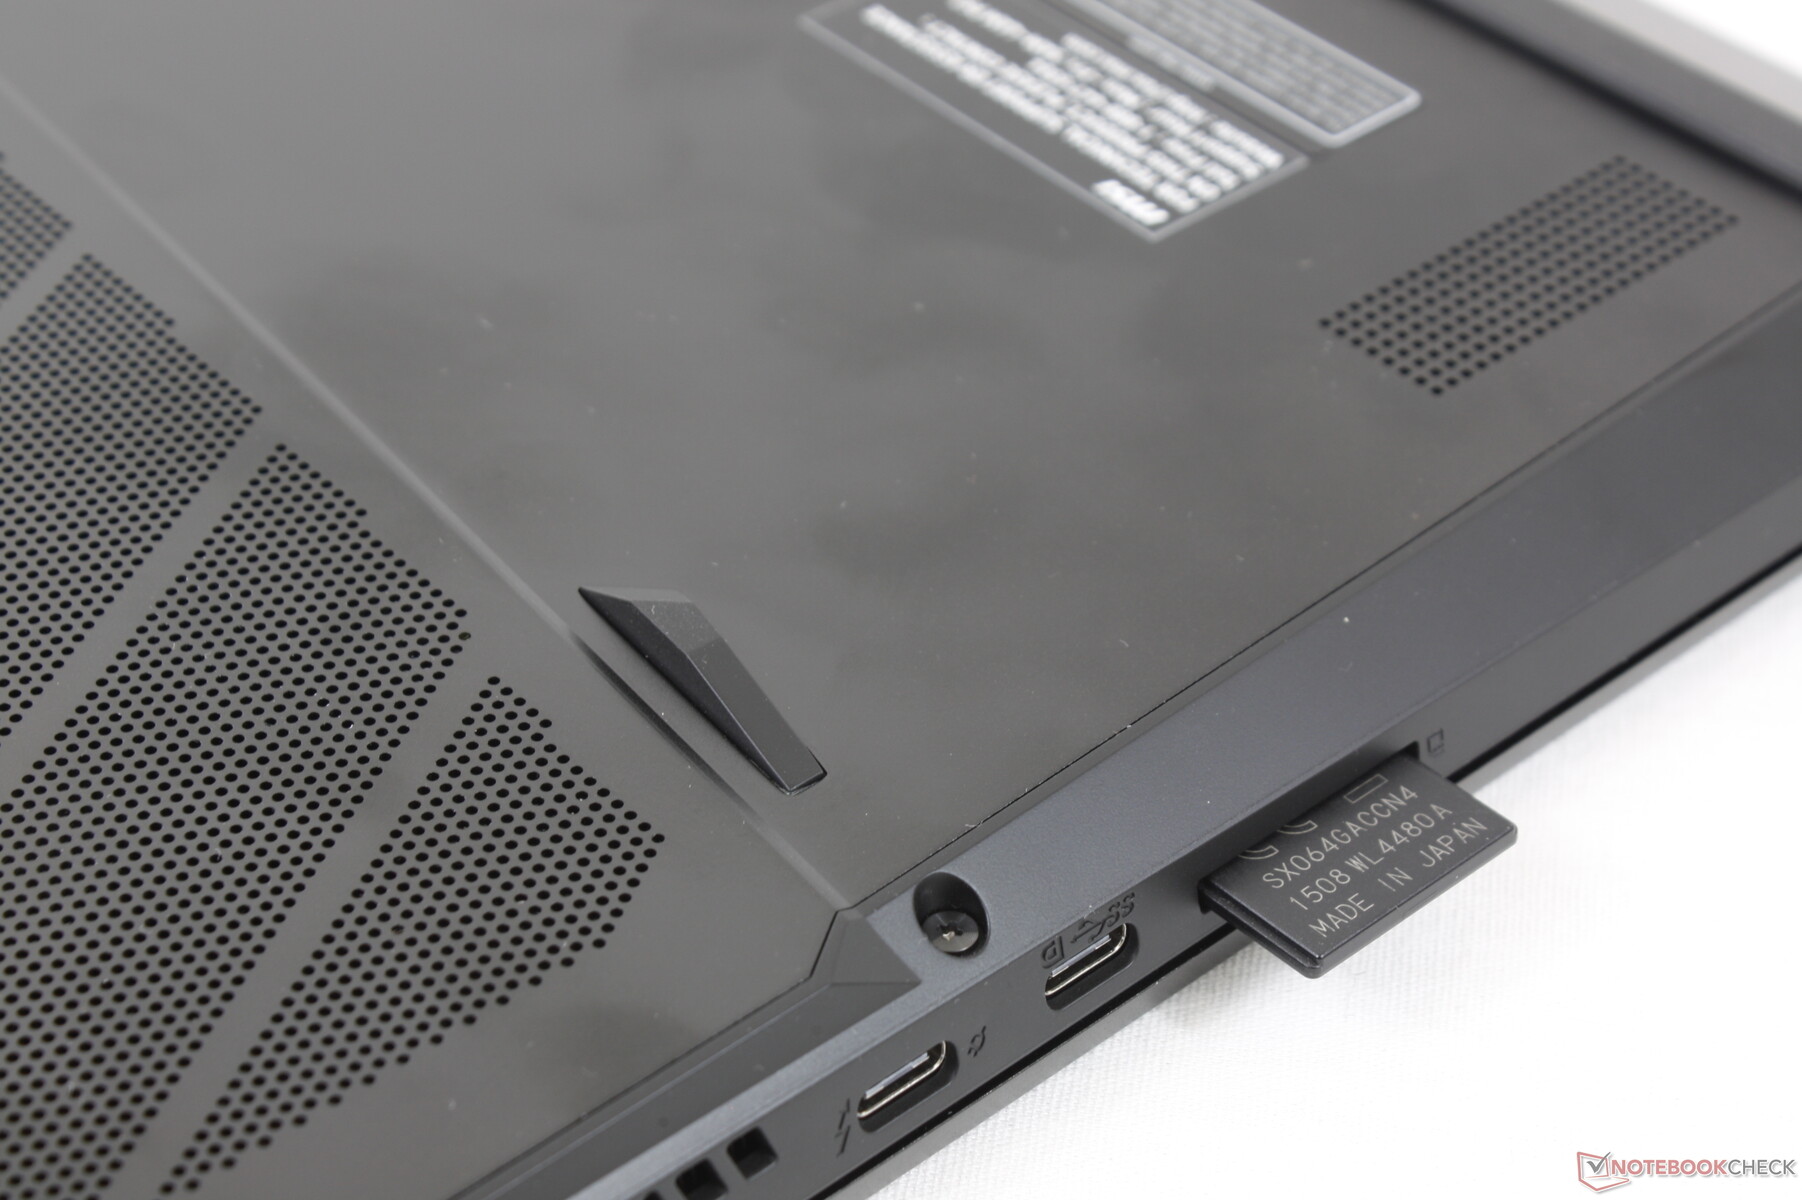
Portalternativen är identiska med GS76, men omdisponerade. Medan GS76 inte hade några portar på baksidan har GS77 en jämnare fördelning: 3 längs vänster, 3 längs höger och 3 längs baksidan.
Användare bör notera att endast en av de två USB-C-portarna längs högerkanten stöder Thunderbolt, precis som på GS76. Dessutom har nätadapterporten ändrats och därför är äldre nätadaptrar inte kompatibla.
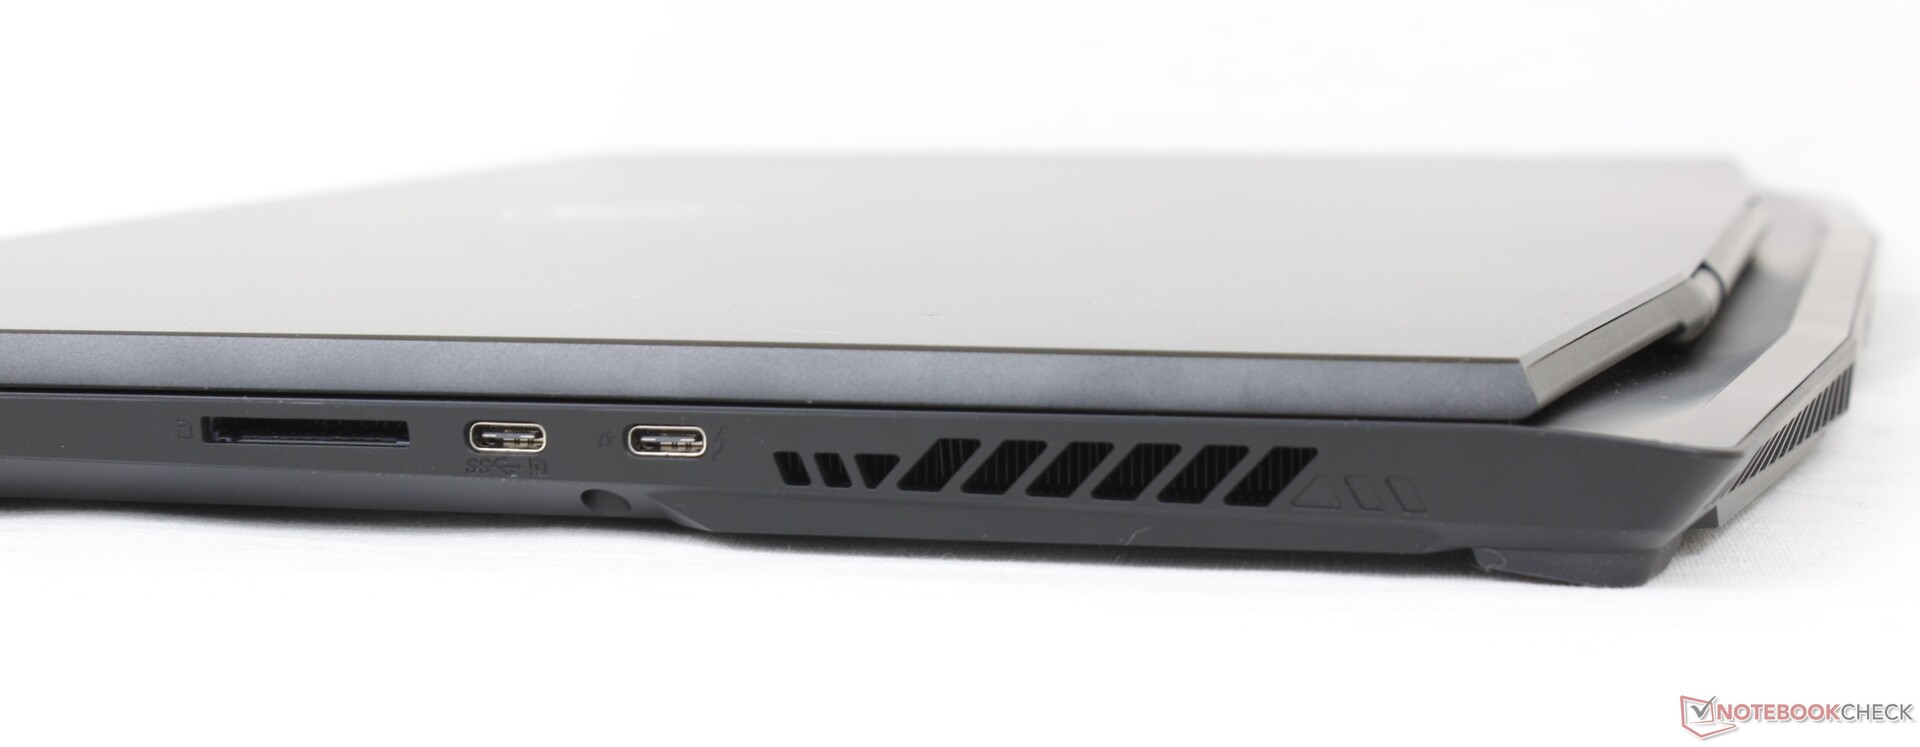
SD-kortläsare
MSI har mer än halverat hastigheten på den integrerade SD-läsaren jämfört med förra generationens GS76. Att flytta 1 GB bilder från vårt UHS-II-testkort till skrivbordet på vår GS77 tar cirka 14 sekunder jämfört med bara 5-6 sekunder på GS76. Användare som ofta förlitar sig på SD-läsaren kan bli besvikna över denna nedgradering.
| SD Card Reader | |
| average JPG Copy Test (av. of 3 runs) | |
| MSI GS76 Stealth 11UH (AV PRO microSD 128 GB V60) | |
| Asus ROG Zephyrus S17 GX703HSD | |
| Alienware x17 RTX 3080 P48E (AV Pro V60) | |
| Razer Blade 17 RTX 3080 Ti (AV Pro V60) | |
| MSI Stealth GS77 12UHS-083US (AV Pro V60) | |
| maximum AS SSD Seq Read Test (1GB) | |
| Asus ROG Zephyrus S17 GX703HSD | |
| Alienware x17 RTX 3080 P48E (AV Pro V60) | |
| MSI GS76 Stealth 11UH (AV PRO microSD 128 GB V60) | |
| Razer Blade 17 RTX 3080 Ti (AV Pro V60) | |
| MSI Stealth GS77 12UHS-083US (AV Pro V60) | |
Kommunikation
Webbkamera
Webbkameran har uppgraderats från 720p på GS76 till 1080p på GS77, vilket ger en skarpare bild. IR stöds för Windows Hello och en elektronisk slutare är tillgänglig längs vänsterkanten.


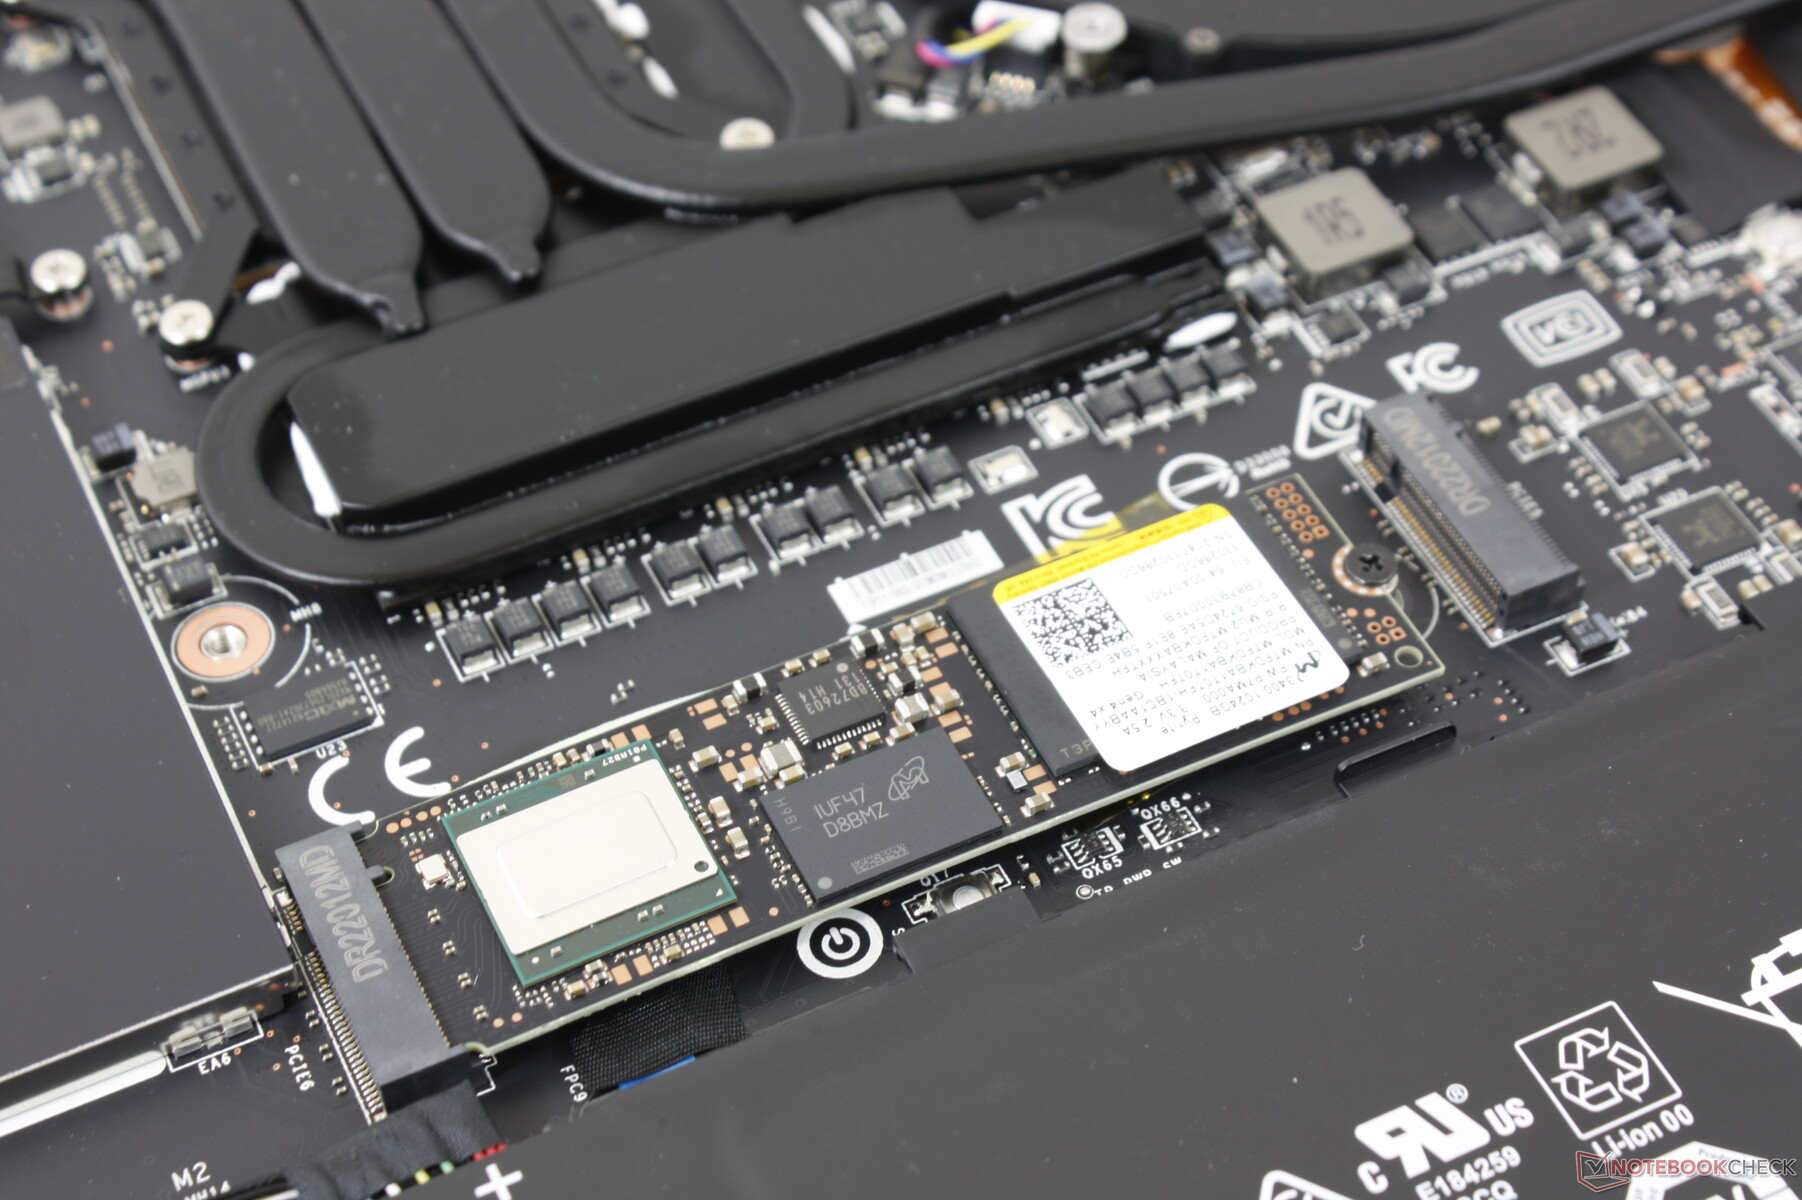
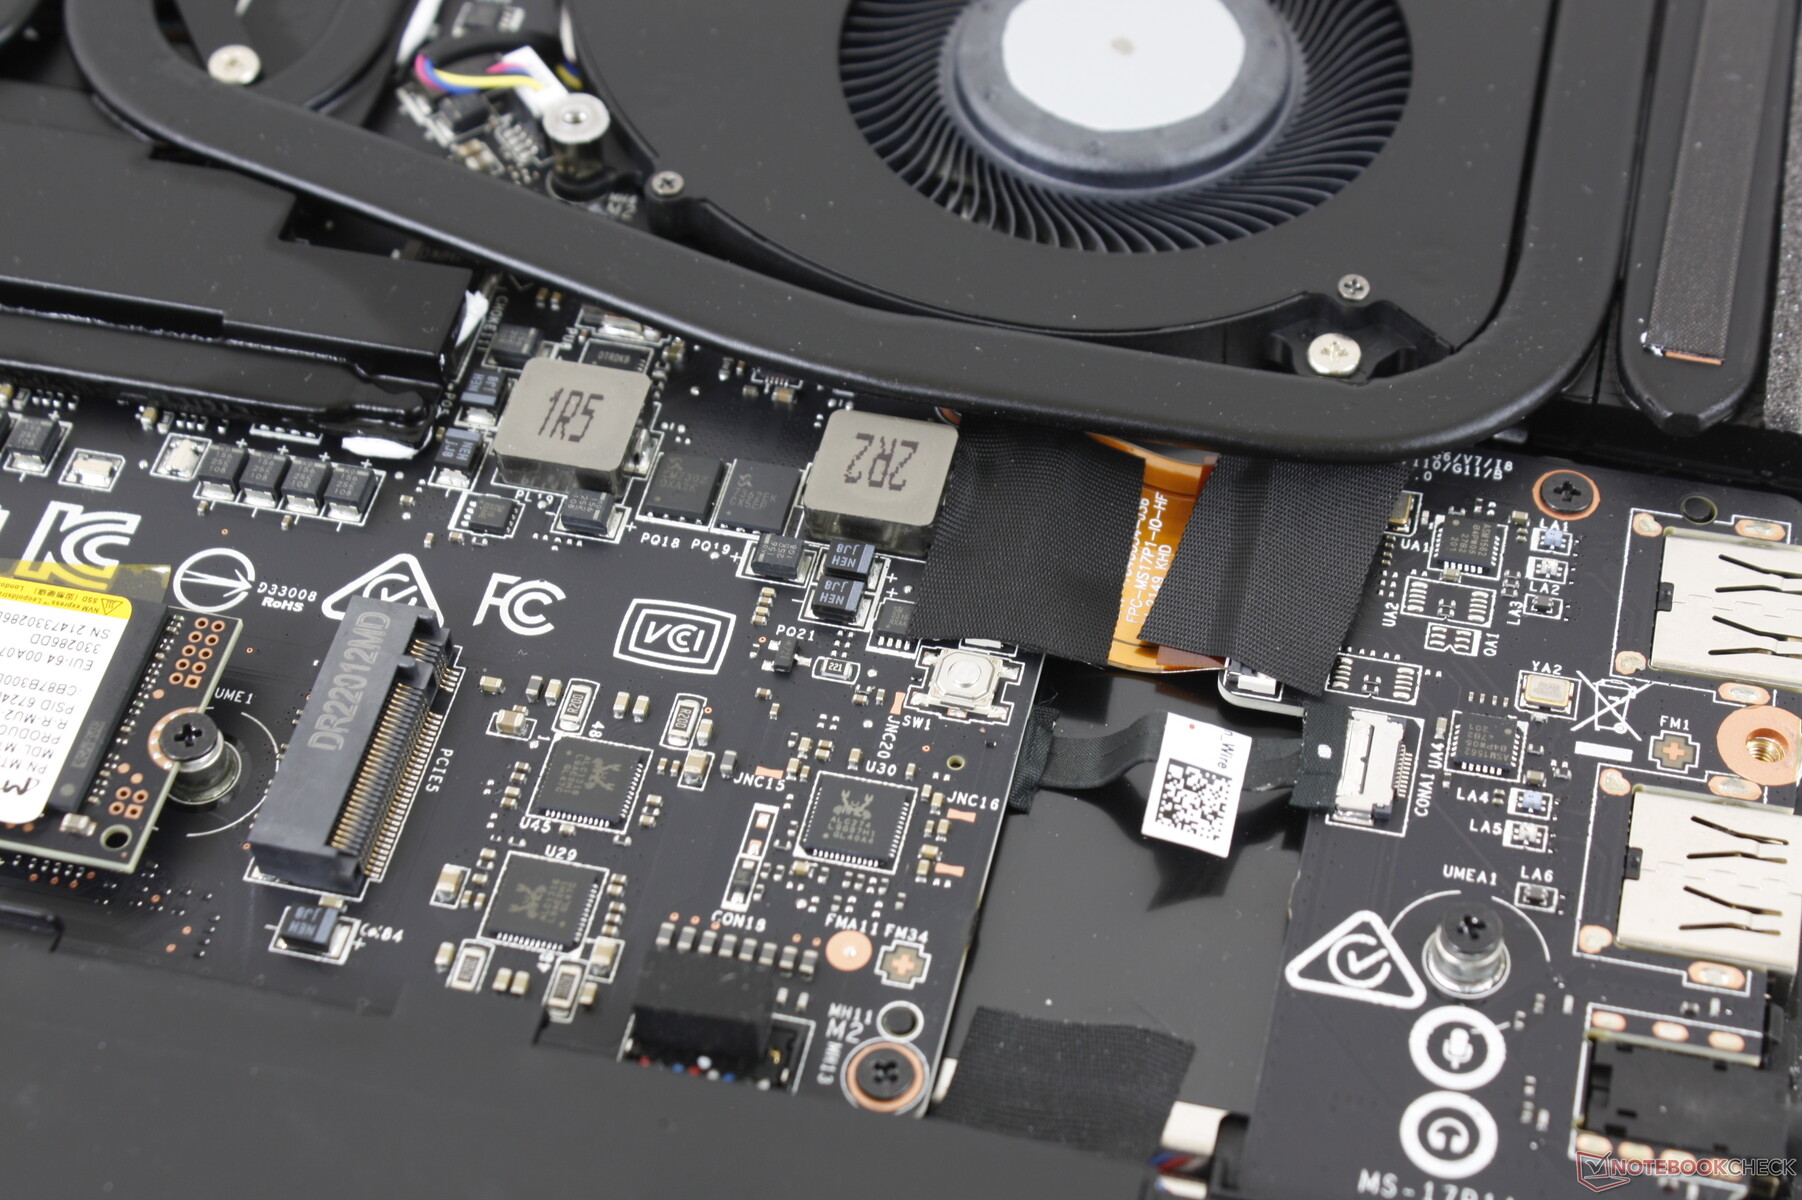
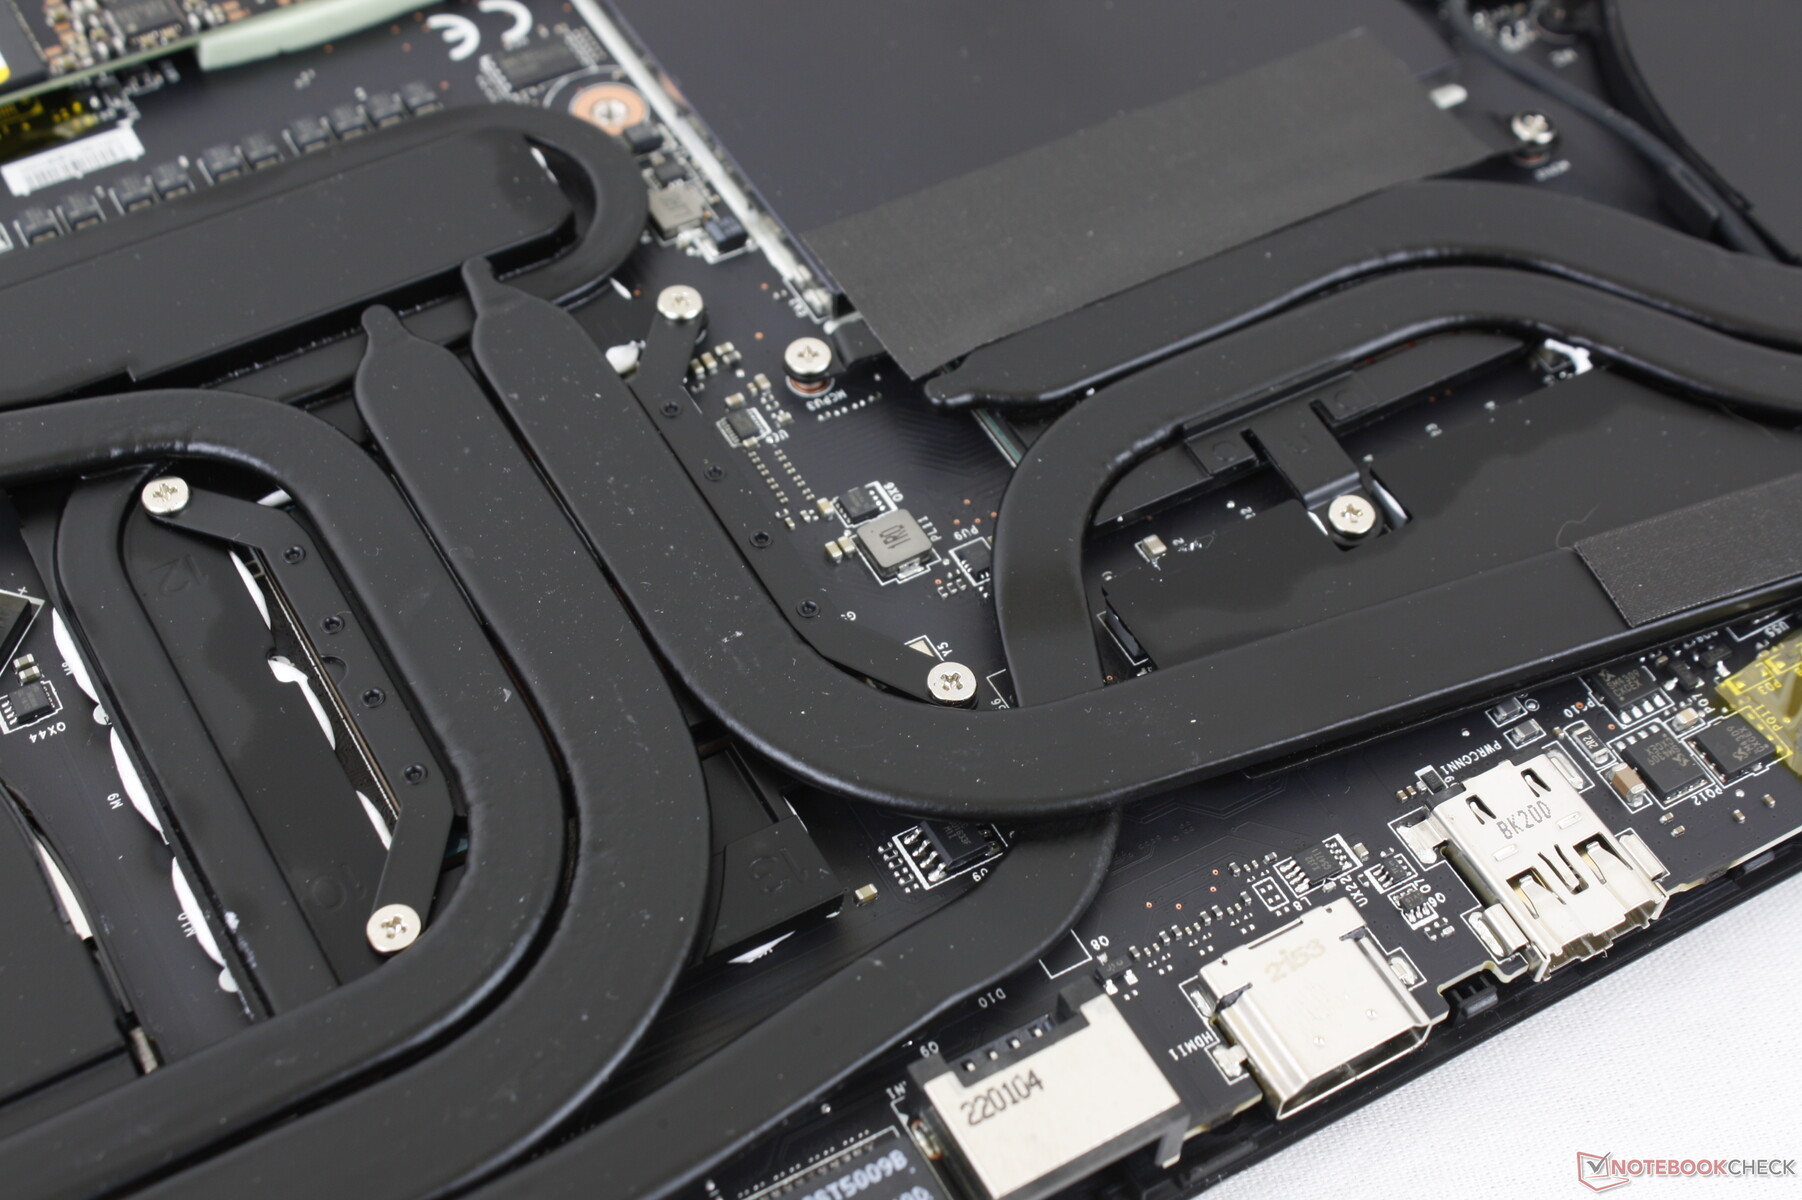
Underhåll
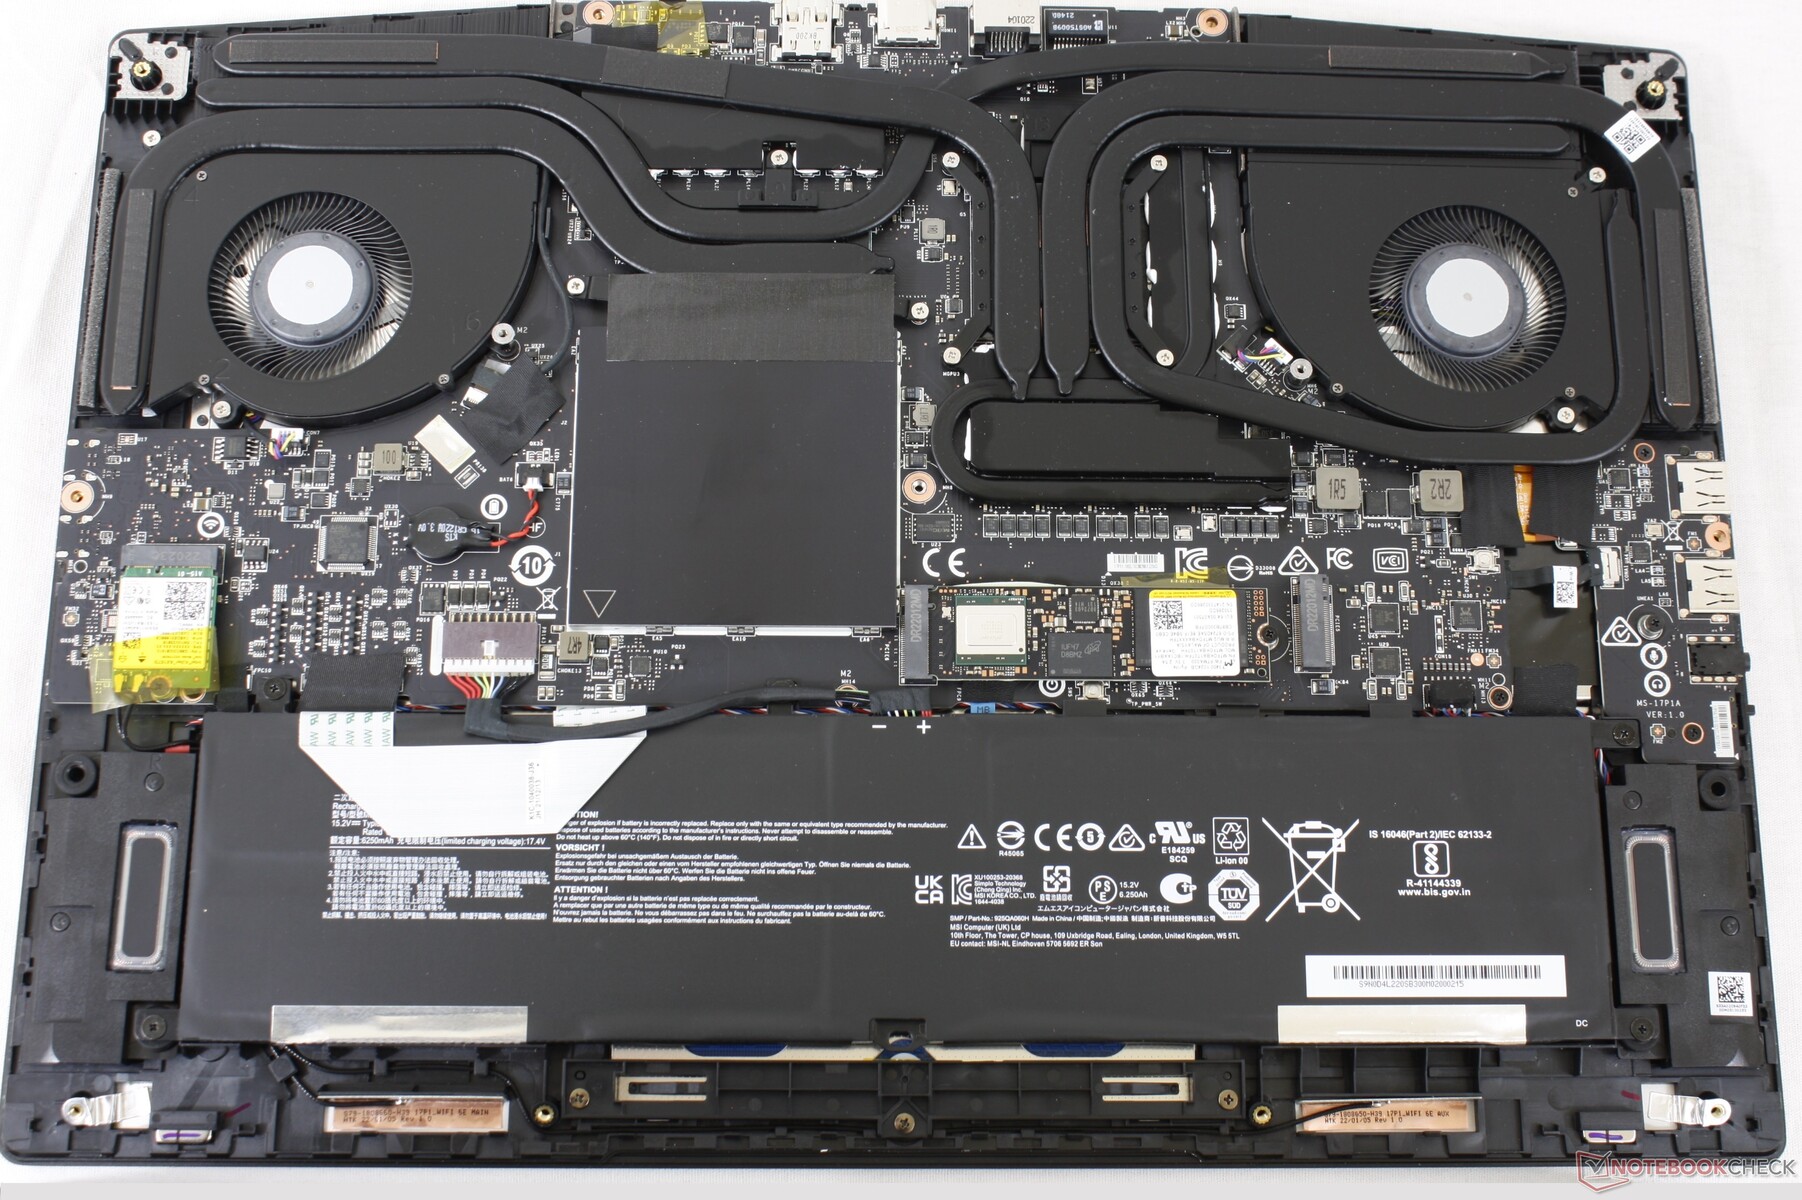
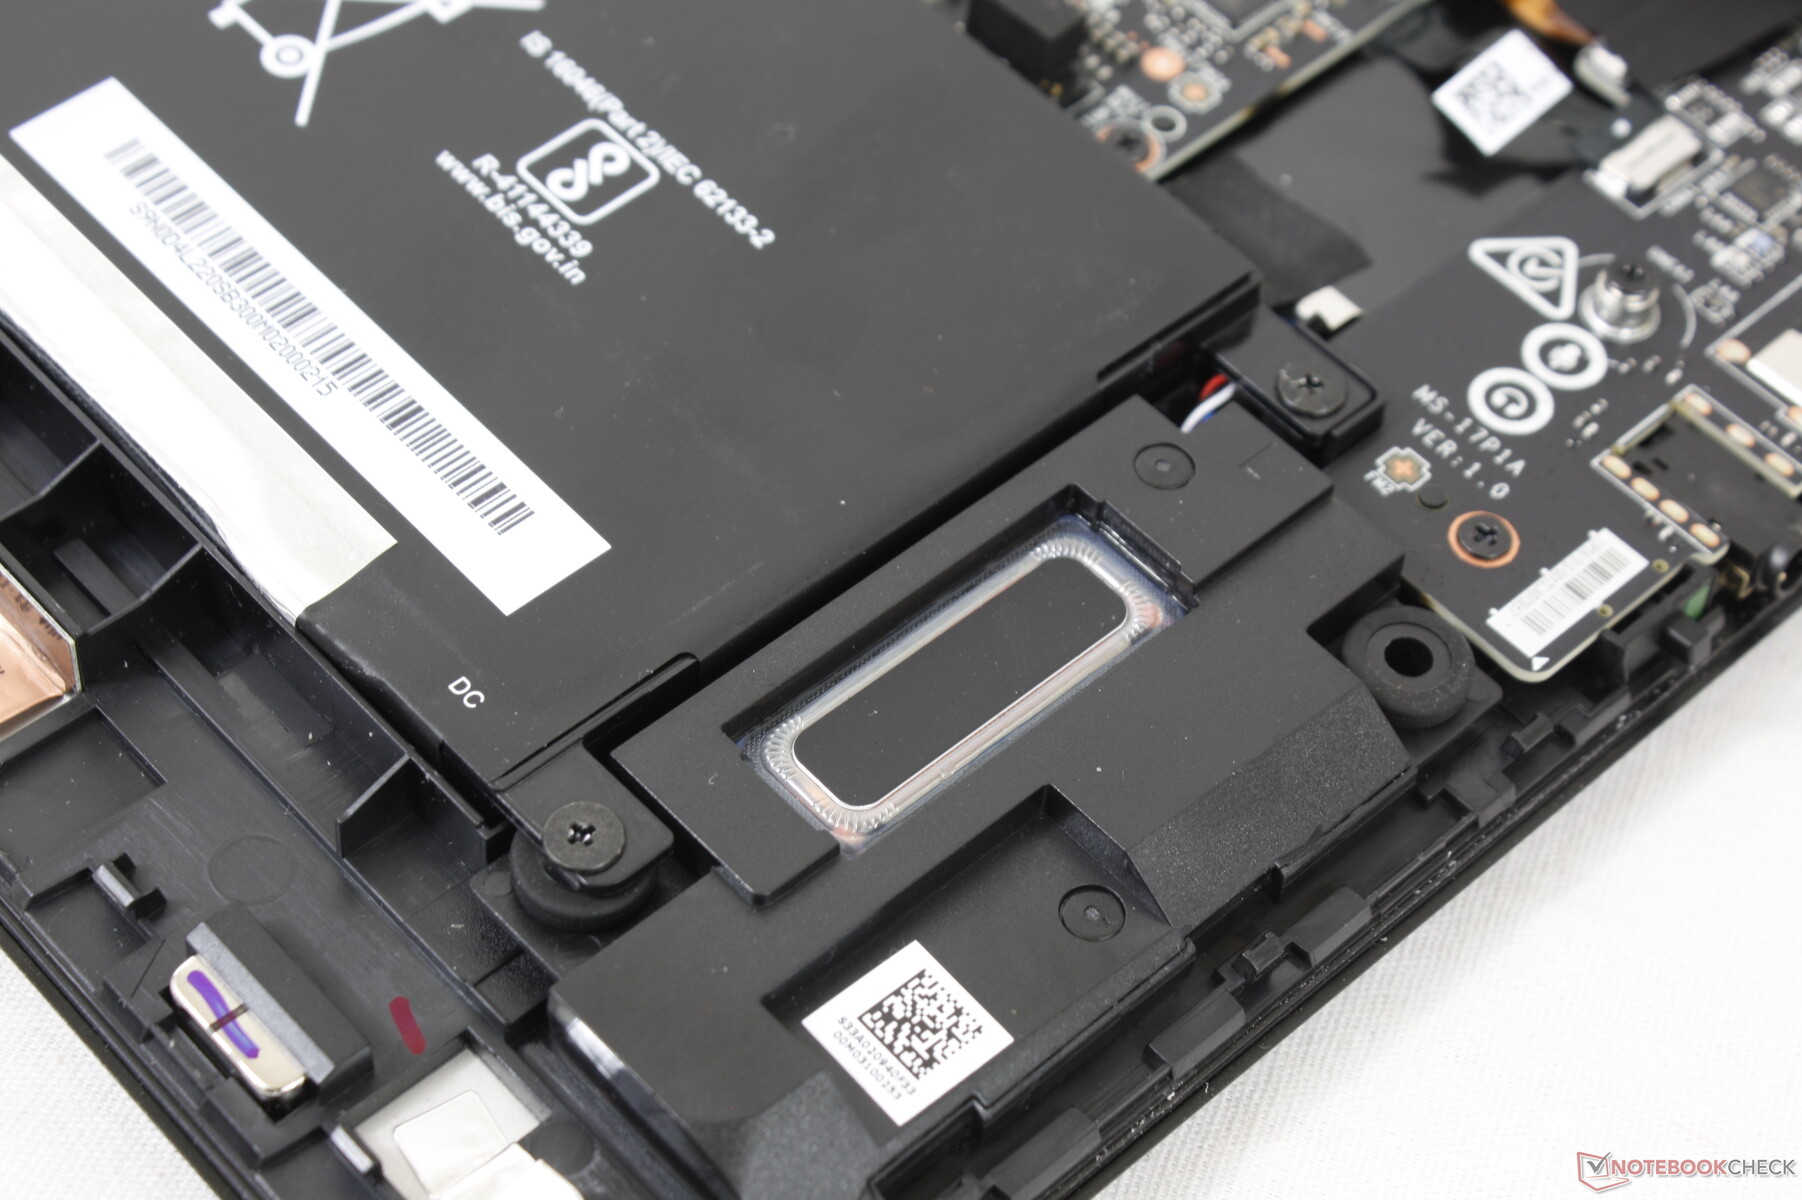
Bottenpanelen går ganska lätt att ta bort efter att ha tagit bort de 11 Philips-skruvarna under den. Tänk på att en fabriksförsegling måste brytas till skillnad från de flesta andra bärbara datorer för spel från konkurrerande tillverkare
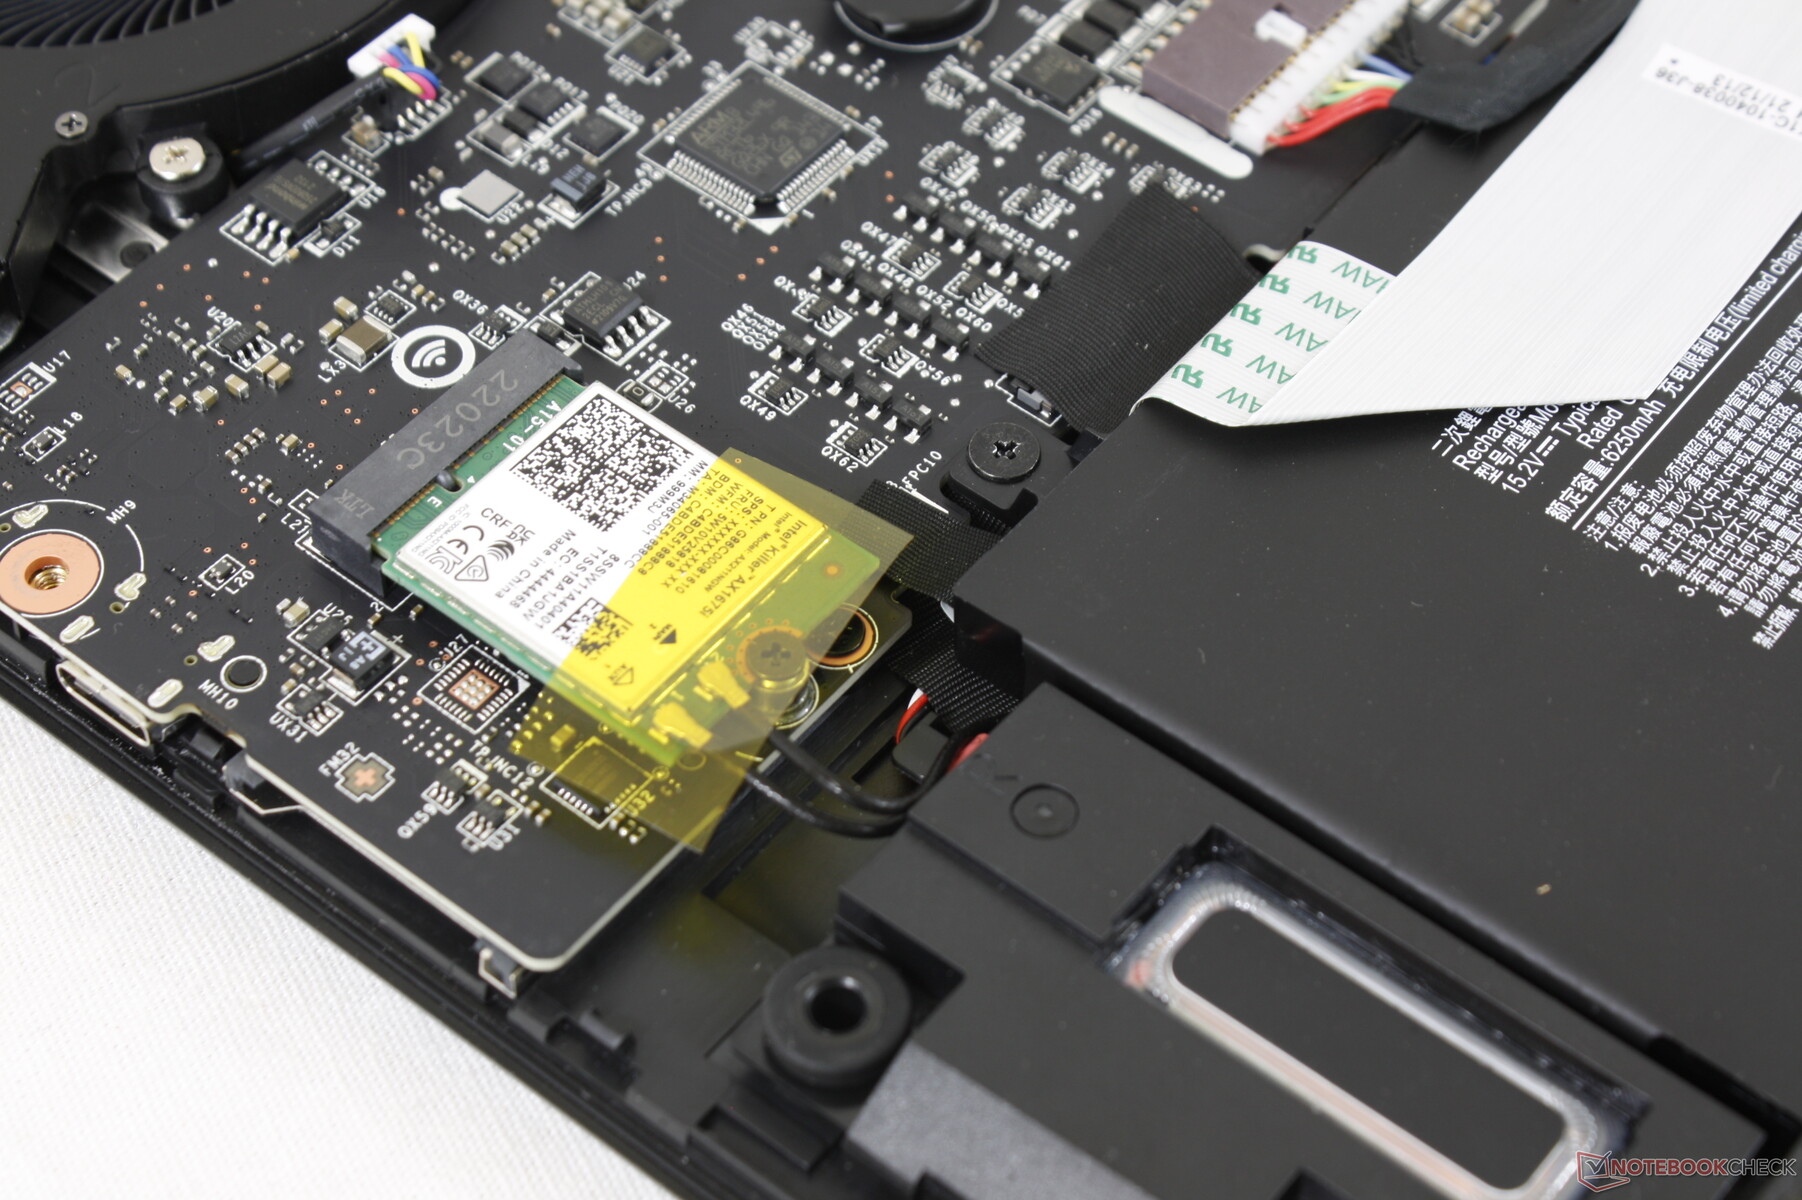
Väl inne har användarna tillgång till 2x SODIMM-platser, 2x PCIe4 x4 2280 SSD-platser och den avtagbara WLAN-modulen. De två SODIMM-platserna skyddas av ett eget aluminiumskydd.
Tillbehör och garanti
I förpackningen ingår en skärmtork av sammet förutom pappersarbete och nätadapter. En ettårig tillverkargaranti gäller med förlängningsalternativ om den köps från Xotic PC.
Inmatningsenheter - Sidosteg
Tangentbord
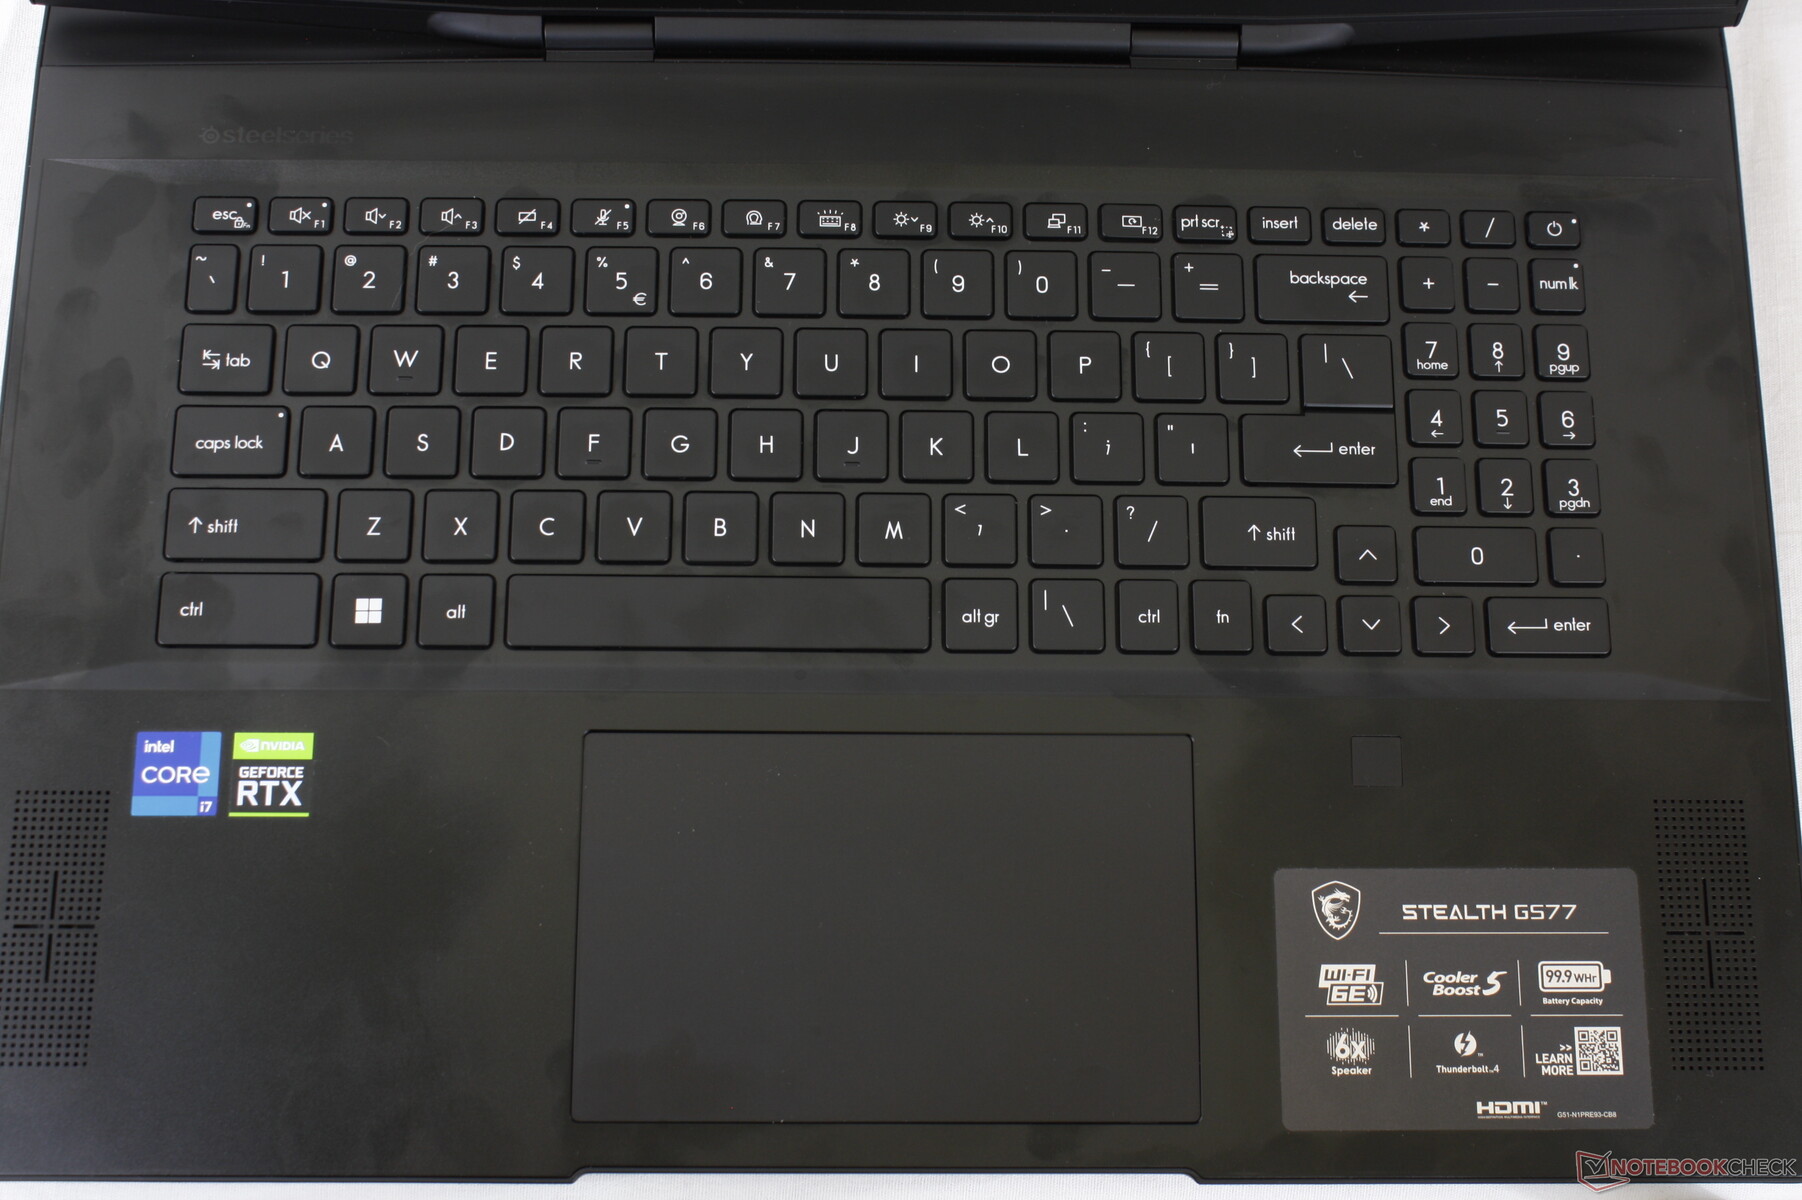
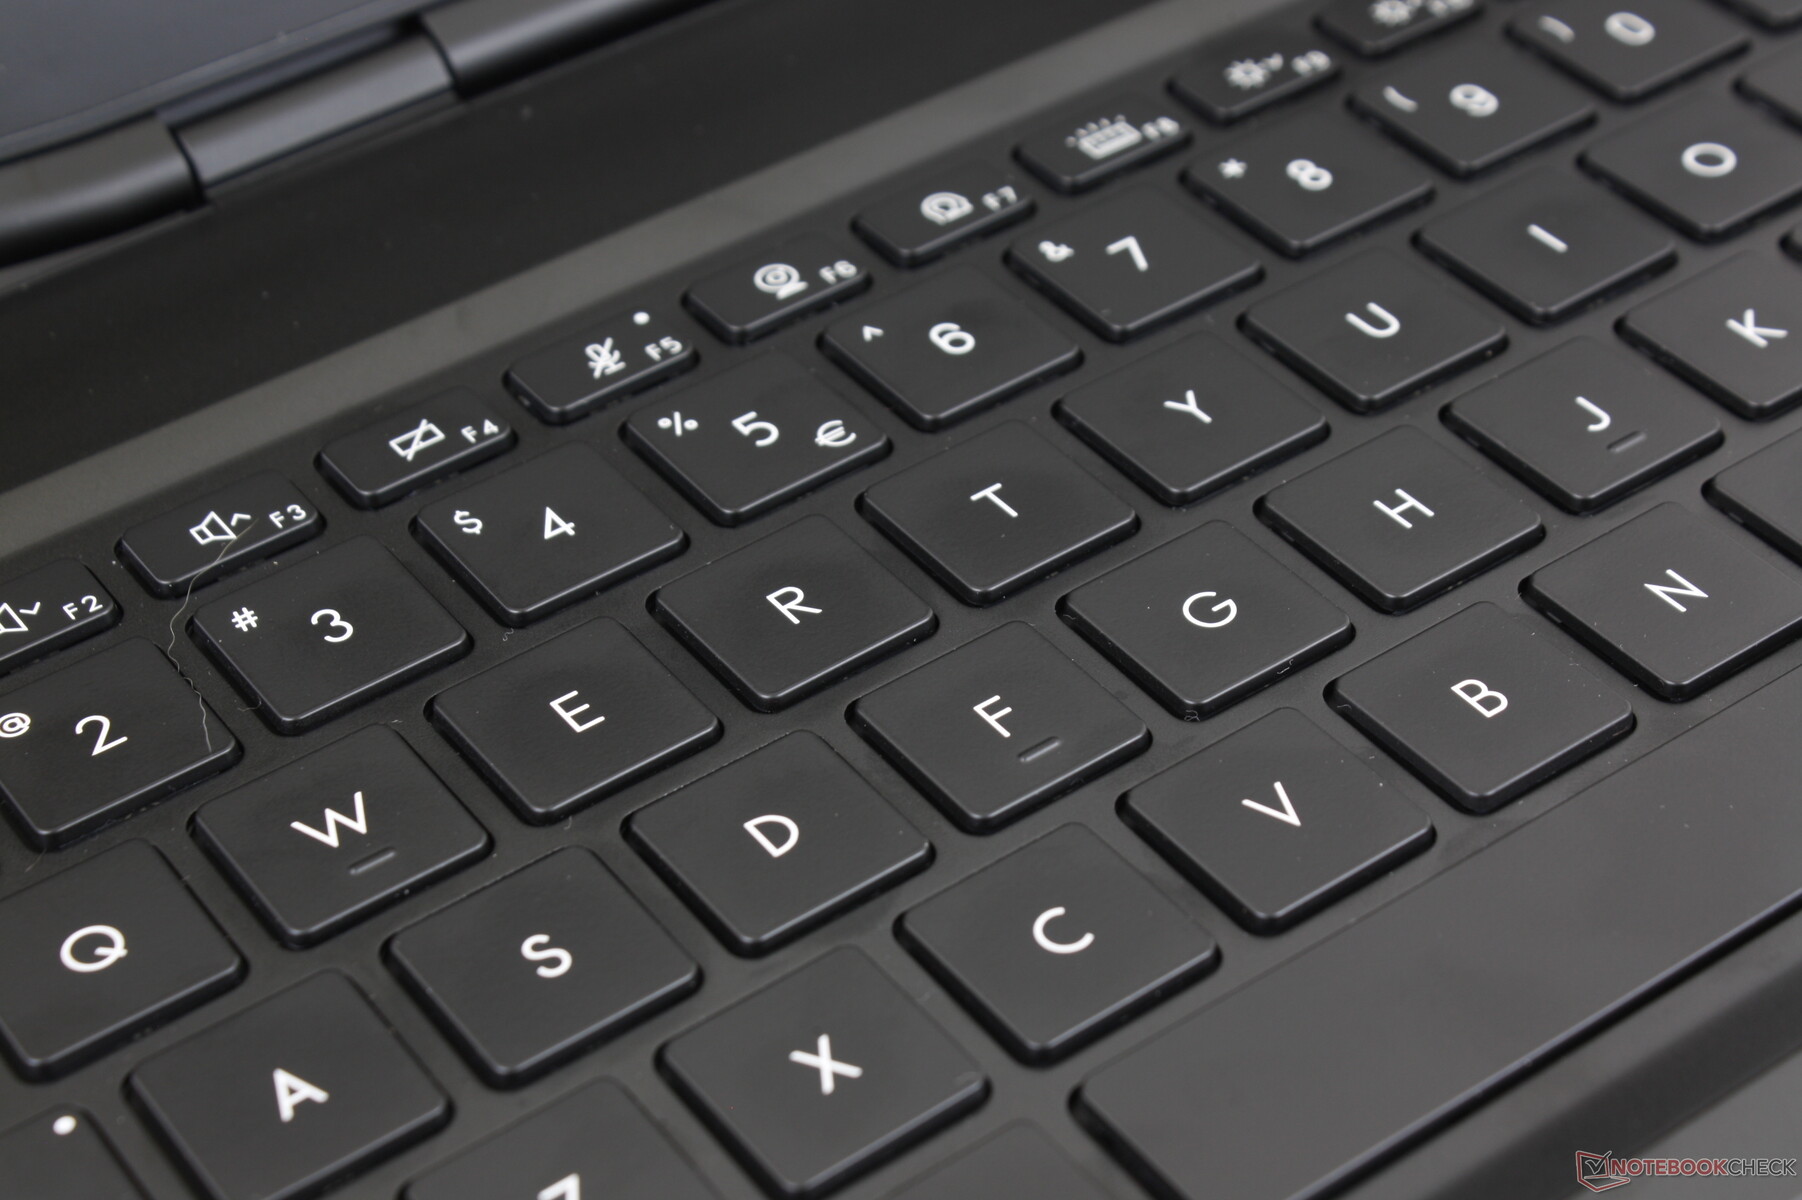
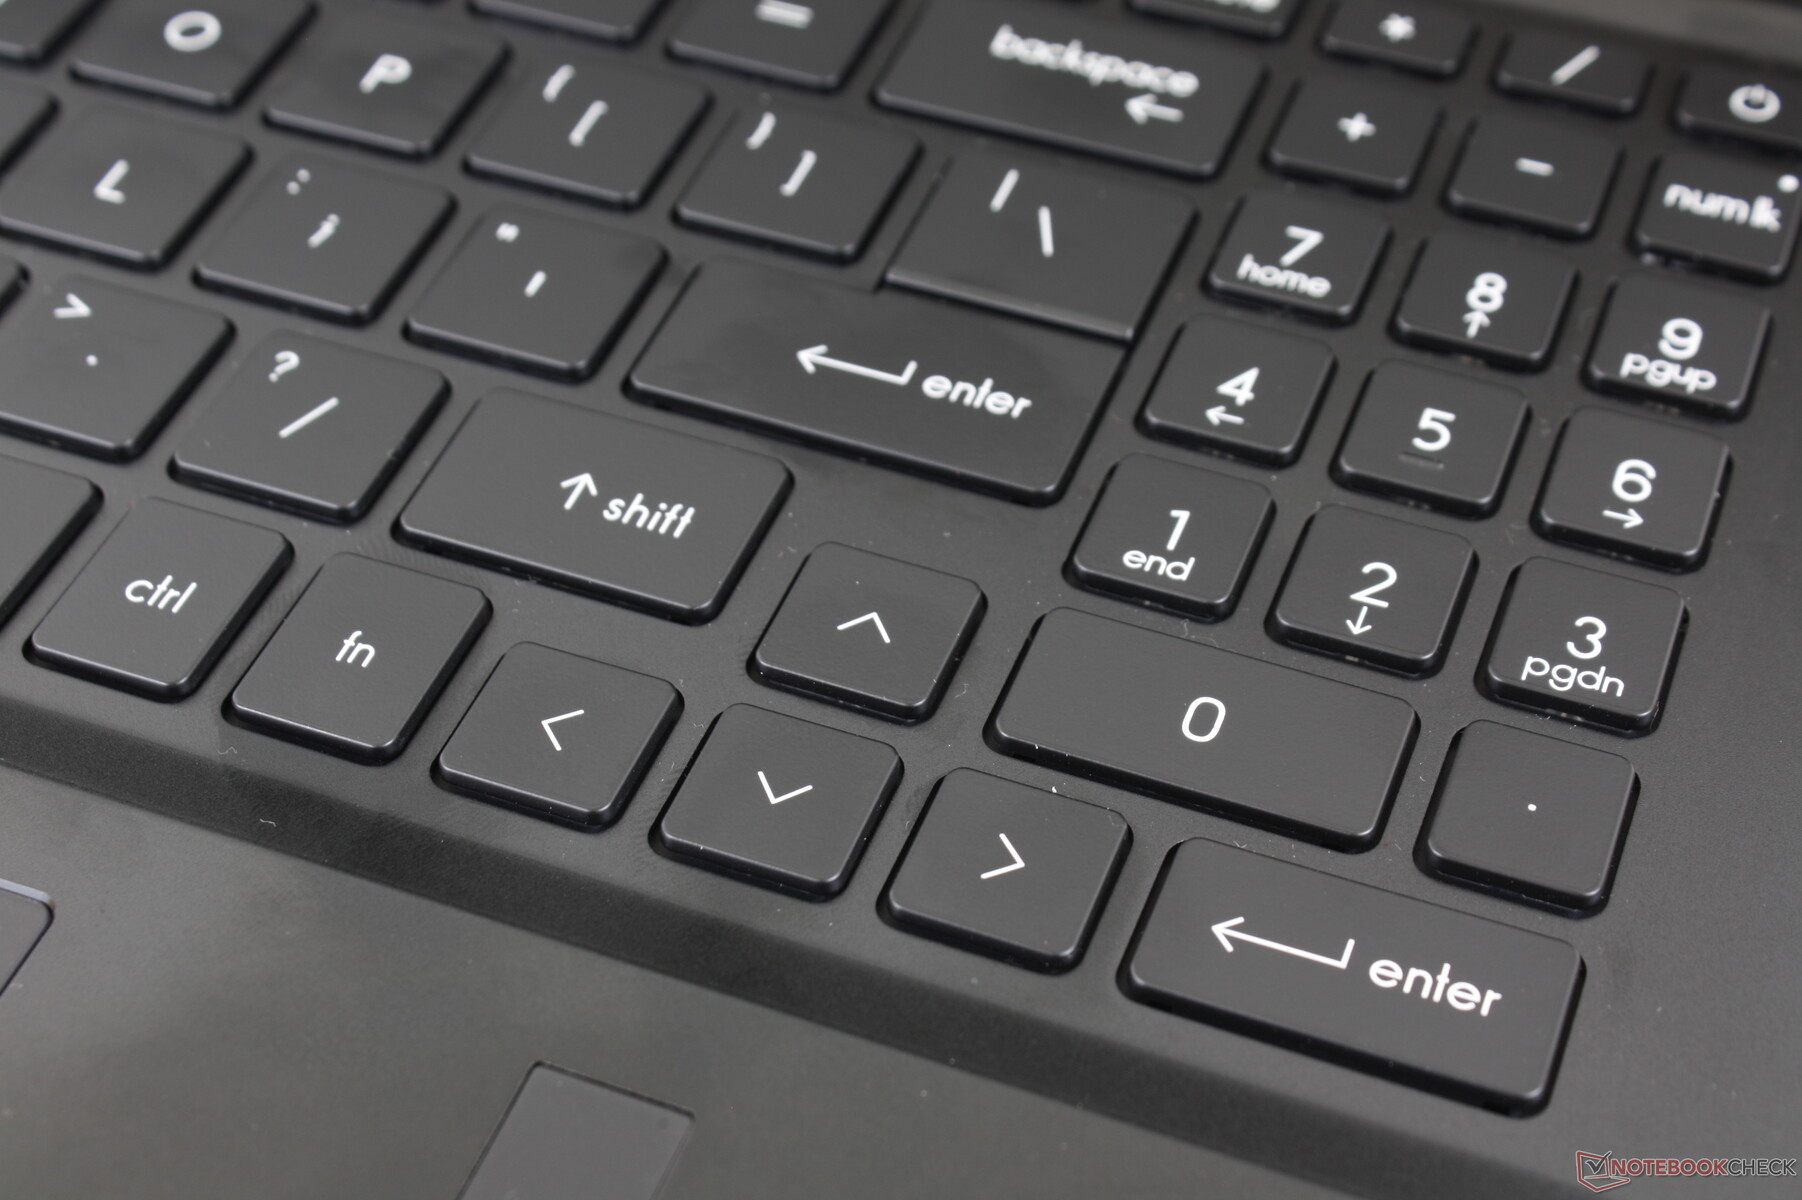
Tangentbordstangenterna är något mjukare och tystare än tangenterna på Blade 17. Det är alltså inte nödvändigtvis bättre eller sämre eftersom vissa användare kanske föredrar en tystare skrivupplevelse även om det innebär att de får en något svampigare feedback. GS77 integrerar även en dedikerad numpad medan Blade inte gör det
Tangenternas storlek är den enda stora nackdelen med GS77-tangentbordet. I synnerhet numpad, piltangenterna och den översta raden av funktionstangenter är alla mycket mindre än de huvudsakliga QWERTY-tangenterna och därför är de märkbart svampigare och svagare i återkoppling. Åtminstone funktionstangenterna på Blade 17 är av samma storlek som de huvudsakliga QWERTY-tangenterna för bättre enhetlighet.
Pekplatta
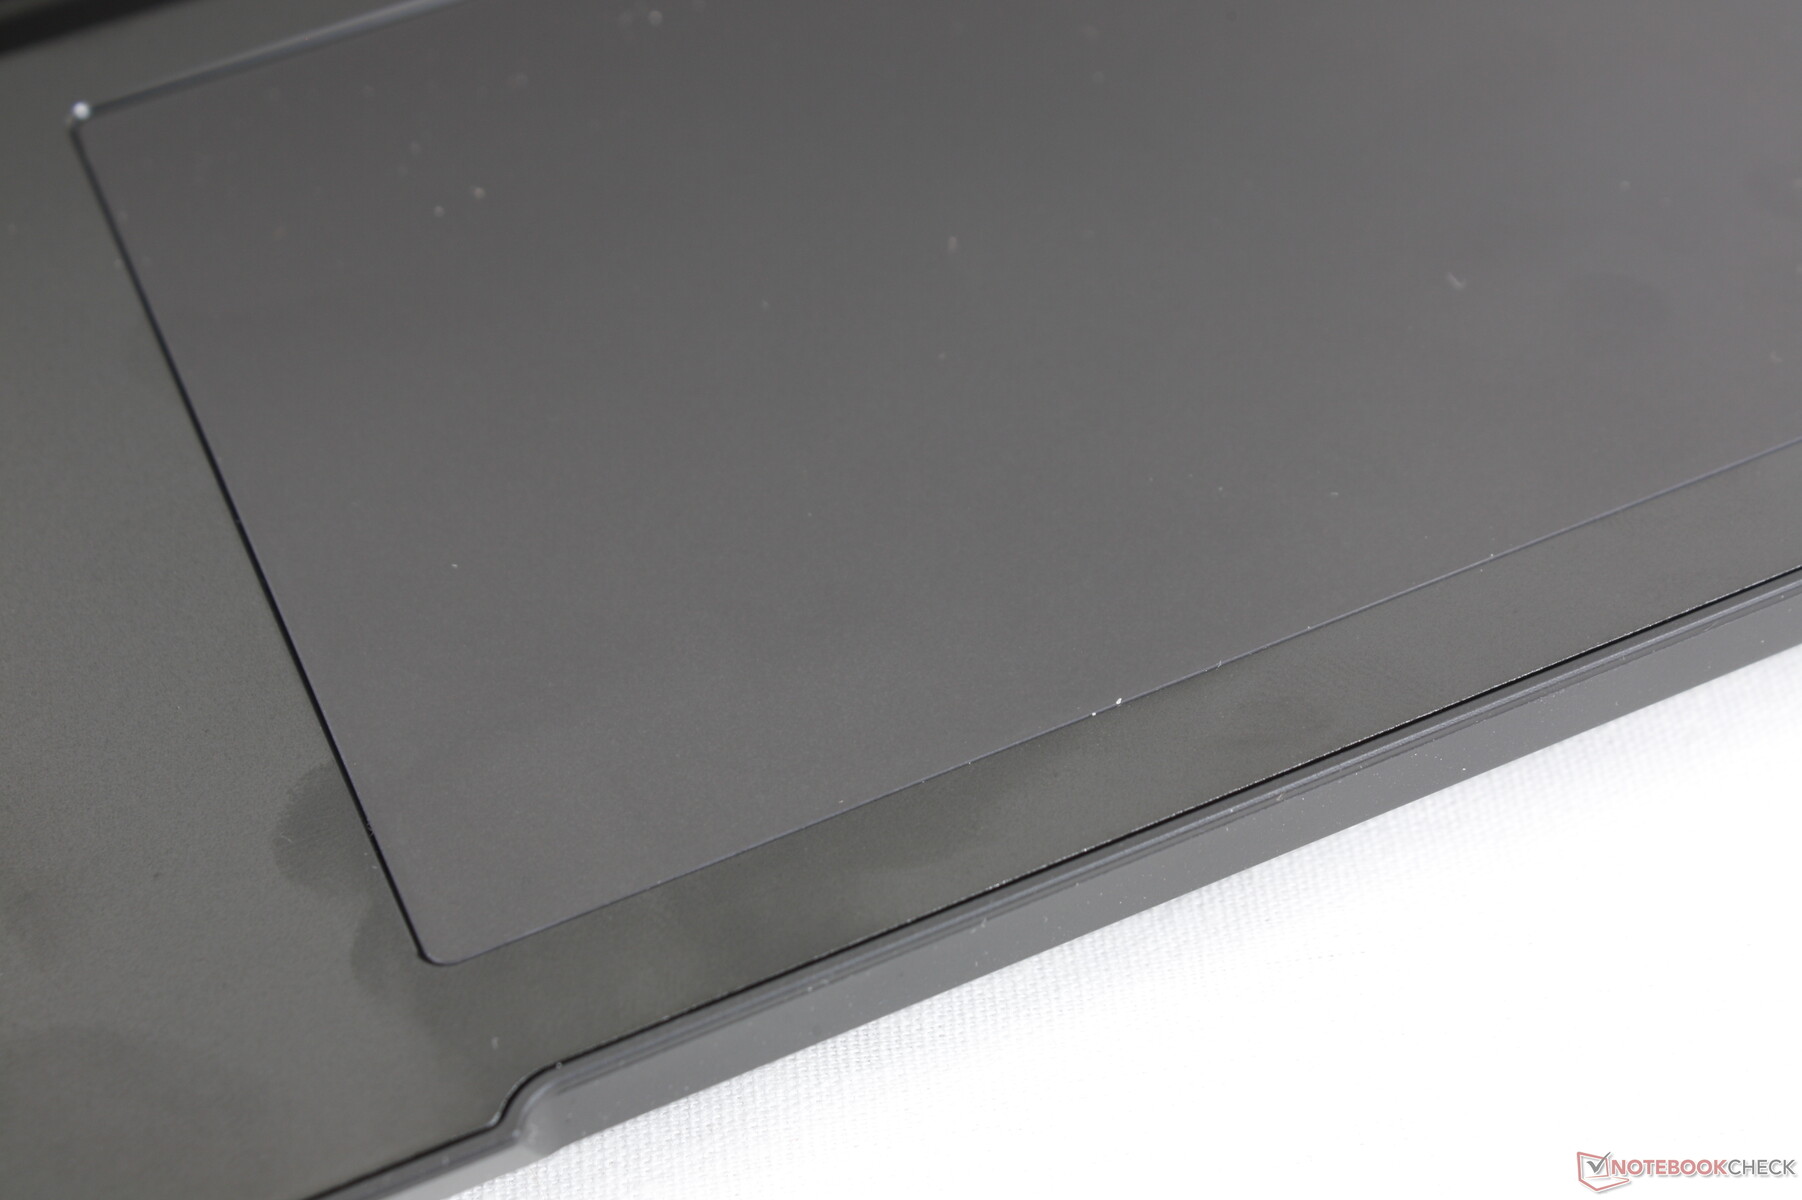
Klickplattan är något större än den på Blade 17 (13,2 x 8,2 cm jämfört med 13 x 8 cm). Dragningen är mycket jämn även när man glider i långsamma hastigheter för en mycket likartad känsla som på klickplattan på Blade 17. Istället är den största skillnaden mellan dem deras respektive återkoppling då klickandet på GS77-klickplattan är både fastare och högre än på Razer.
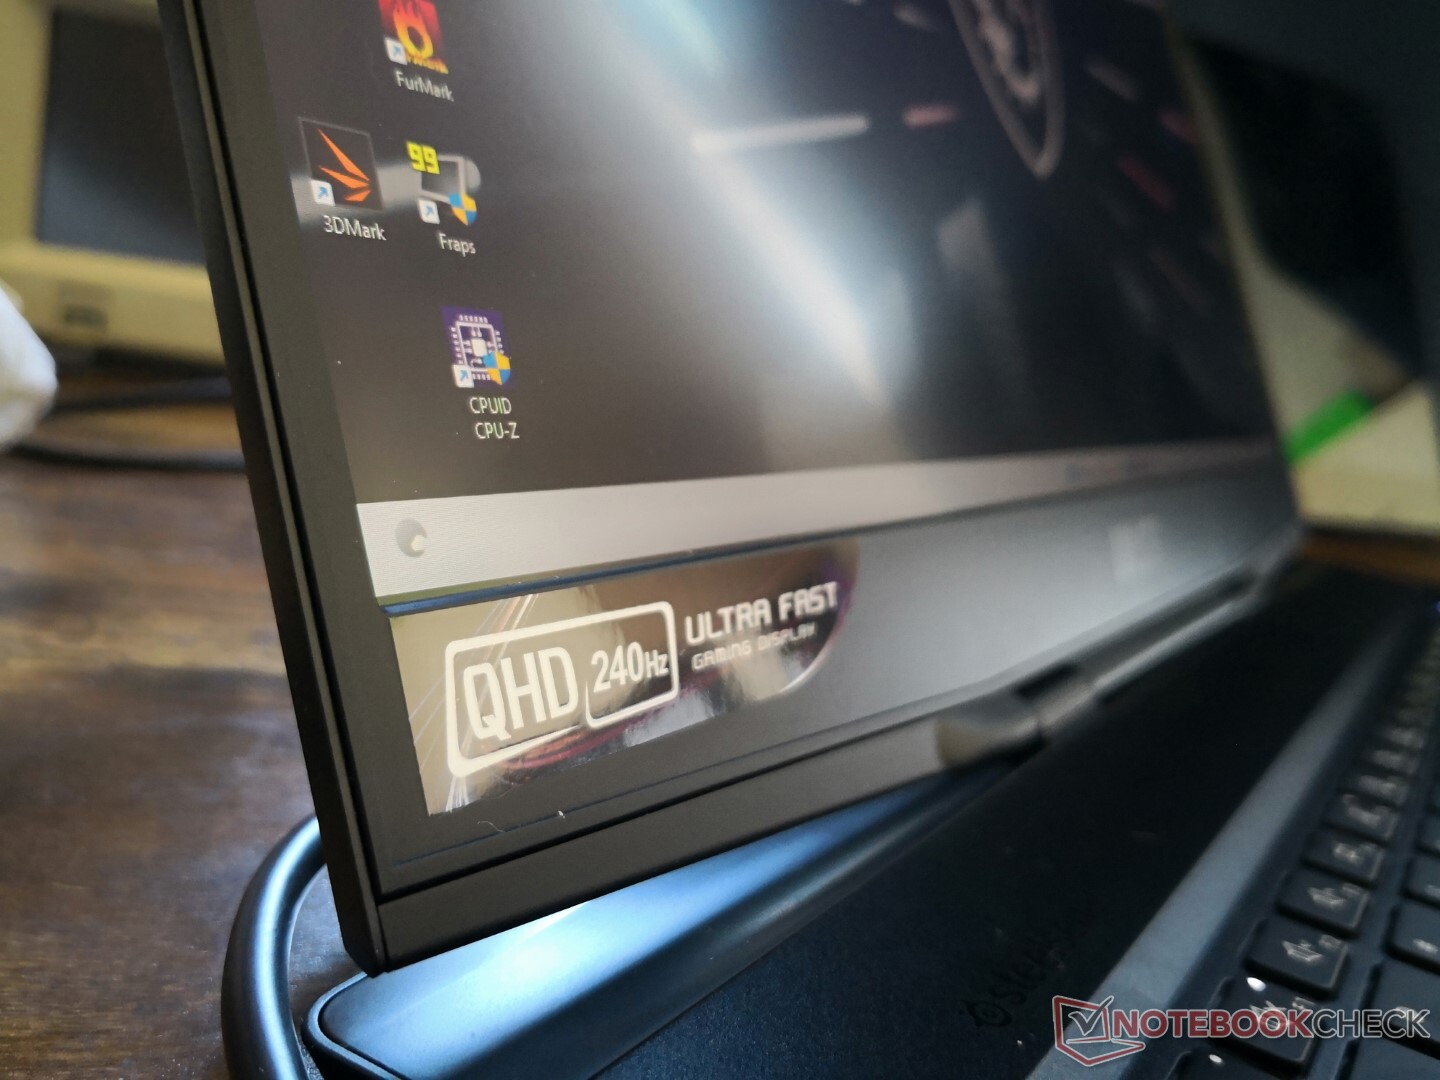
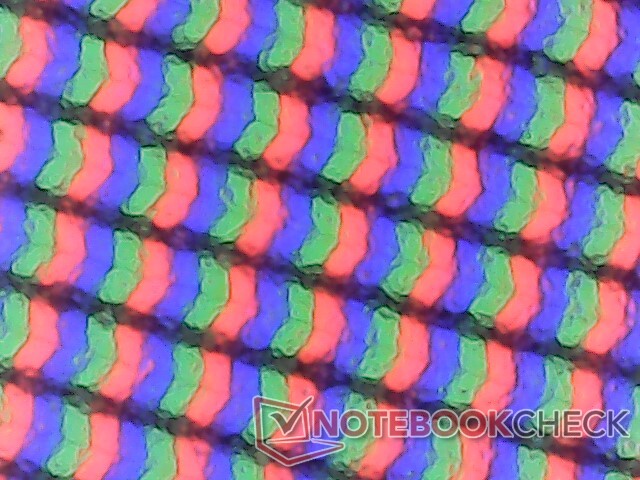
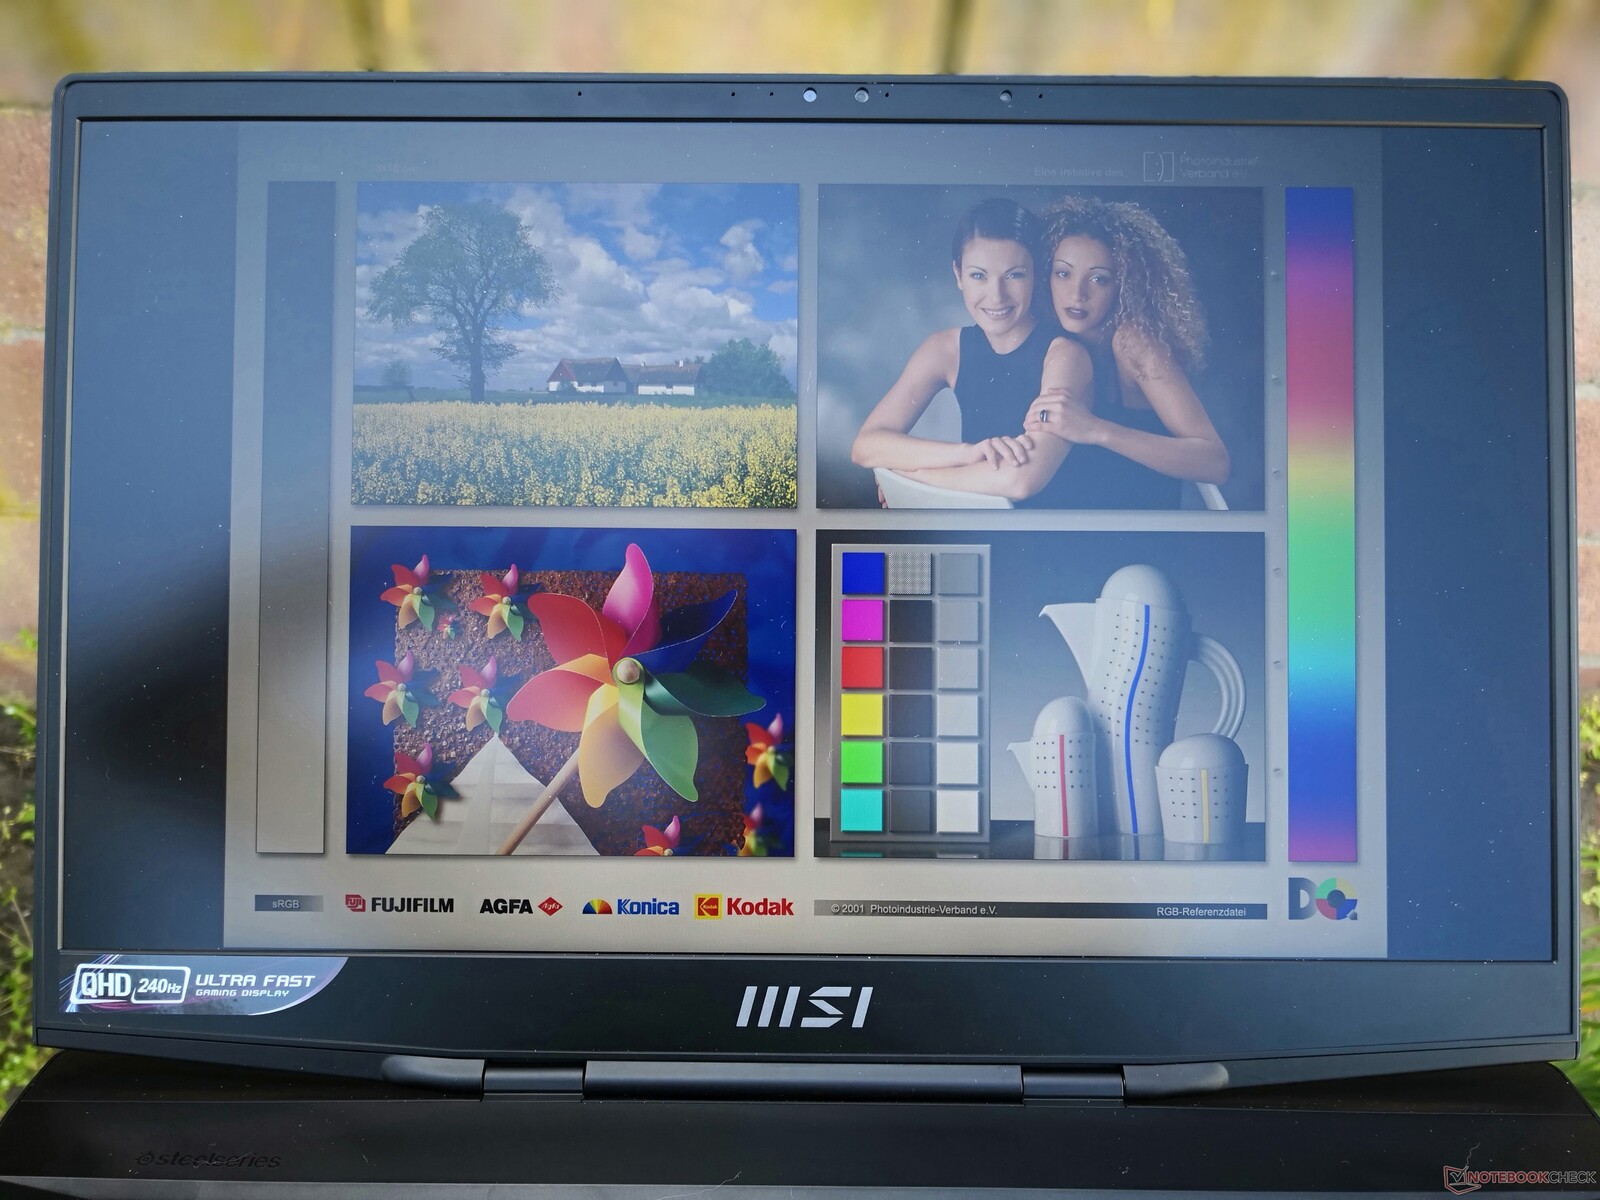
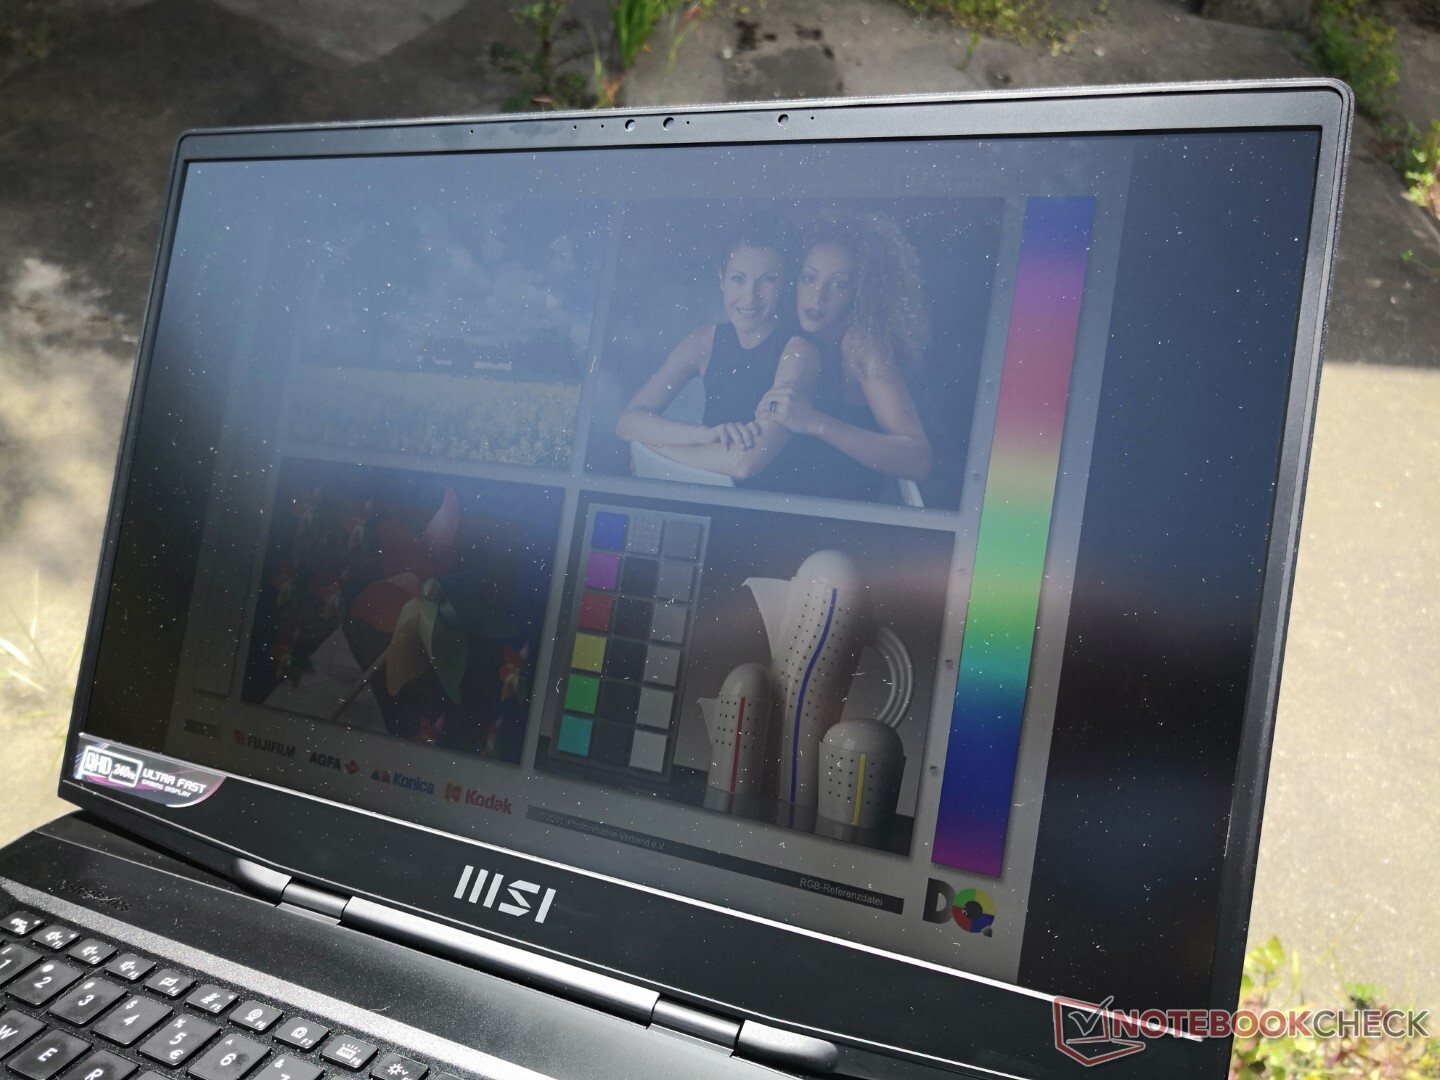
Skärm - hög uppdateringsfrekvens som standard
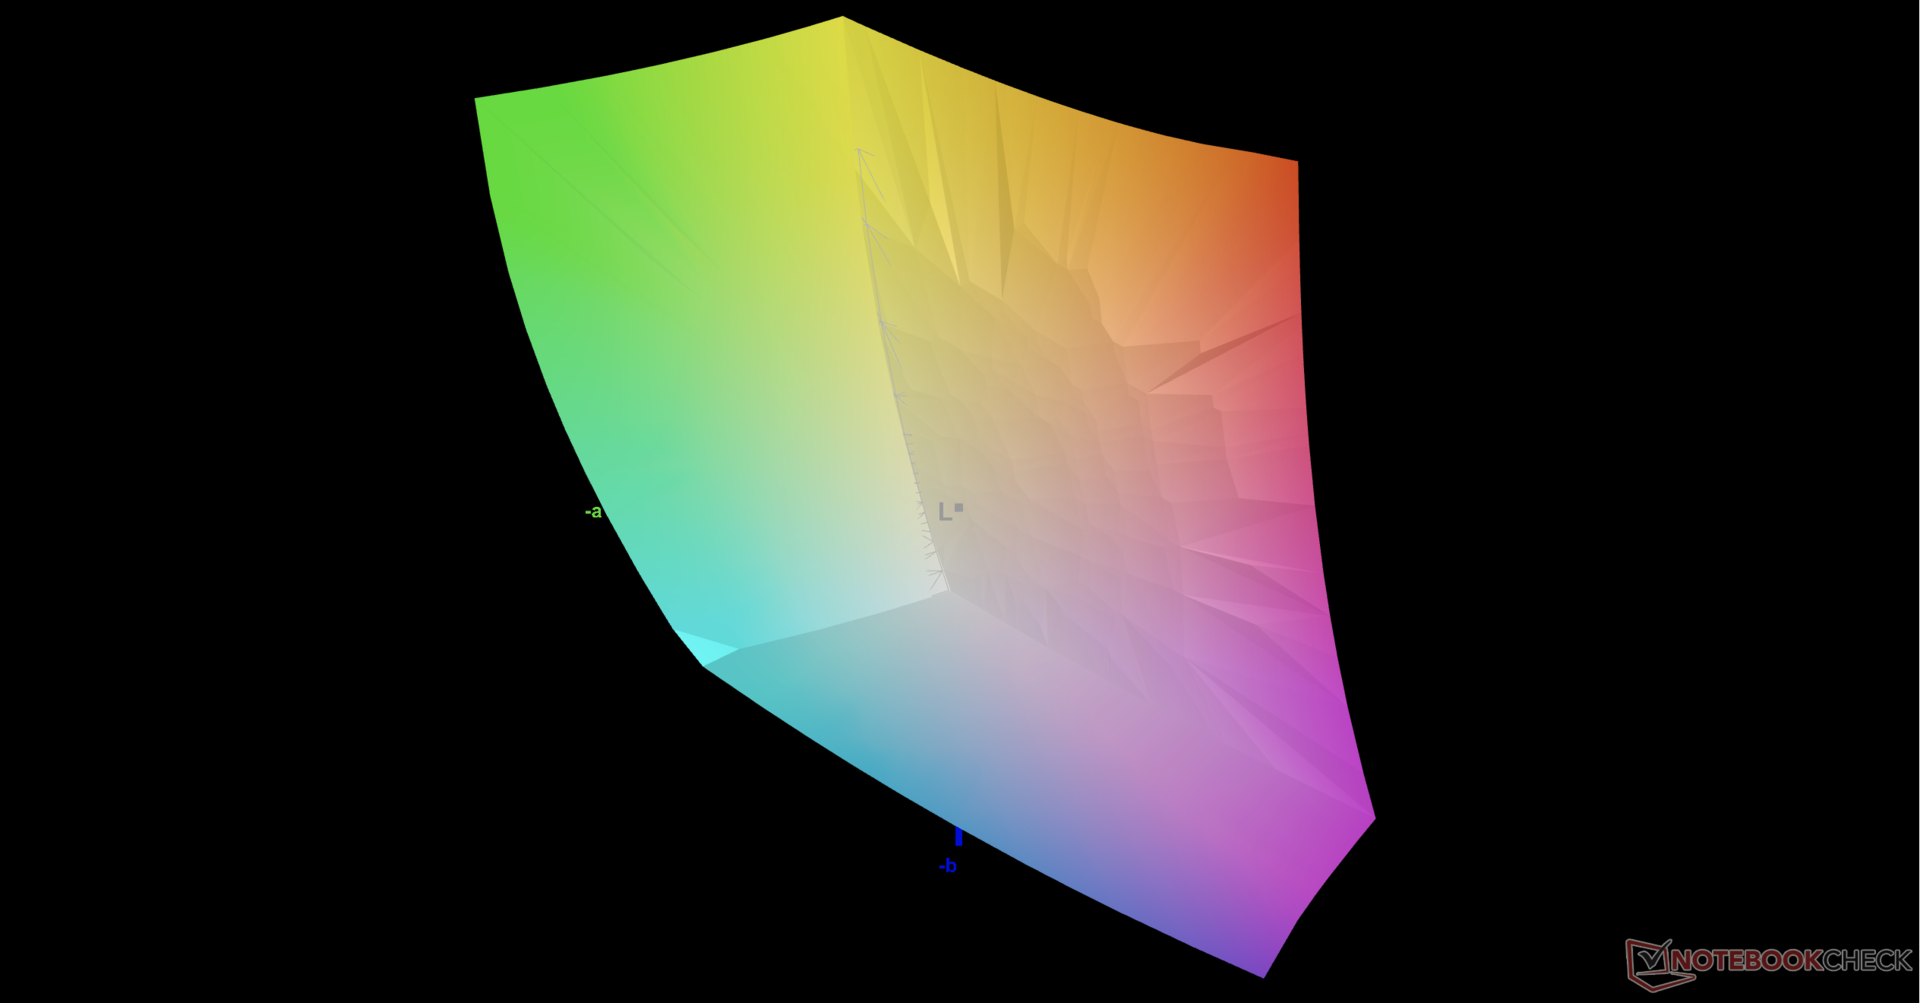
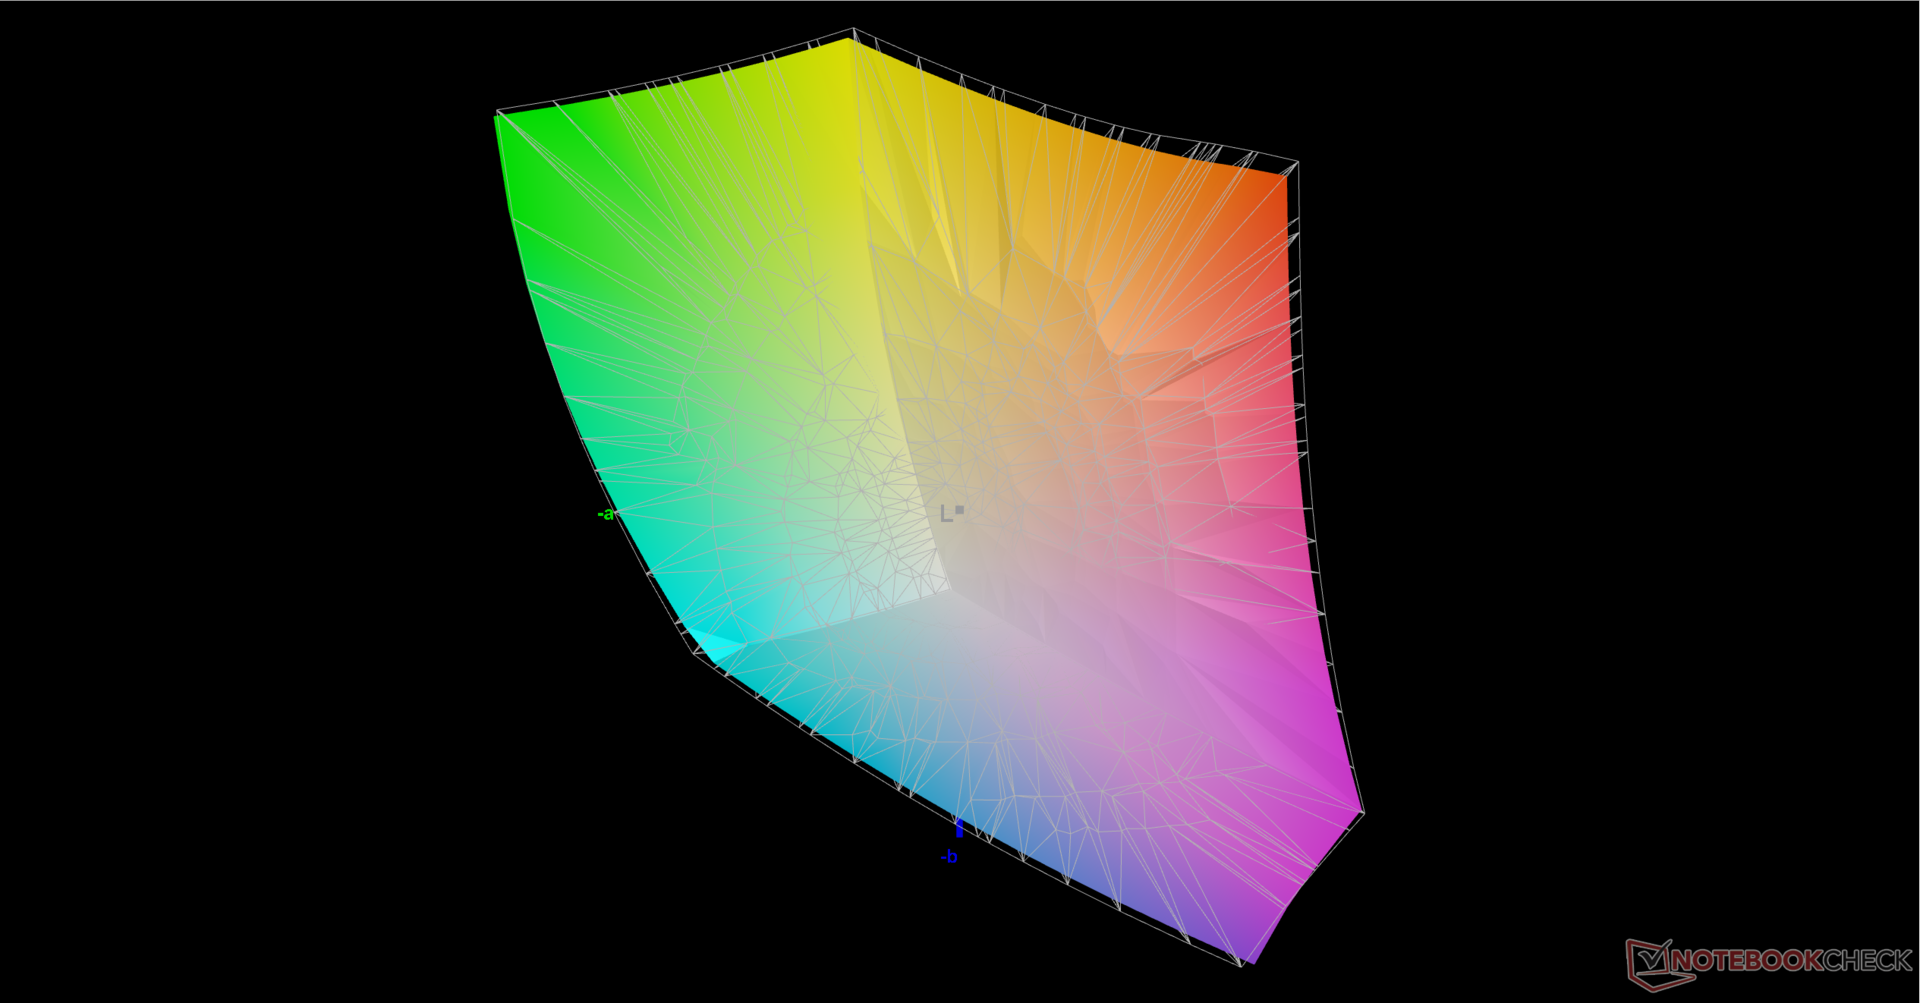
GS77 använder exakt samma högkvalitativa BOE NE173QHM-NZ1 1440p IPS-panel som Razer använder för sin Blade 17. Således är kärnattribut som den ursprungliga uppdateringsfrekvensen på 240 Hz, snabba svarstider, ett hyfsat kontrastförhållande på ~1000:1 och full DCI-P3-täckning identiska mellan de två konkurrerande bärbara 17,3-tumsdatorerna.
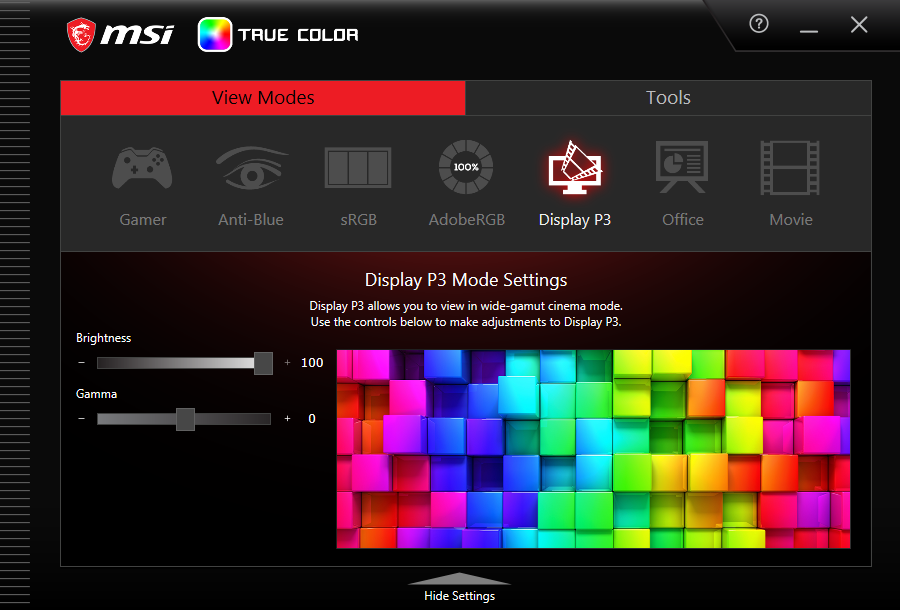
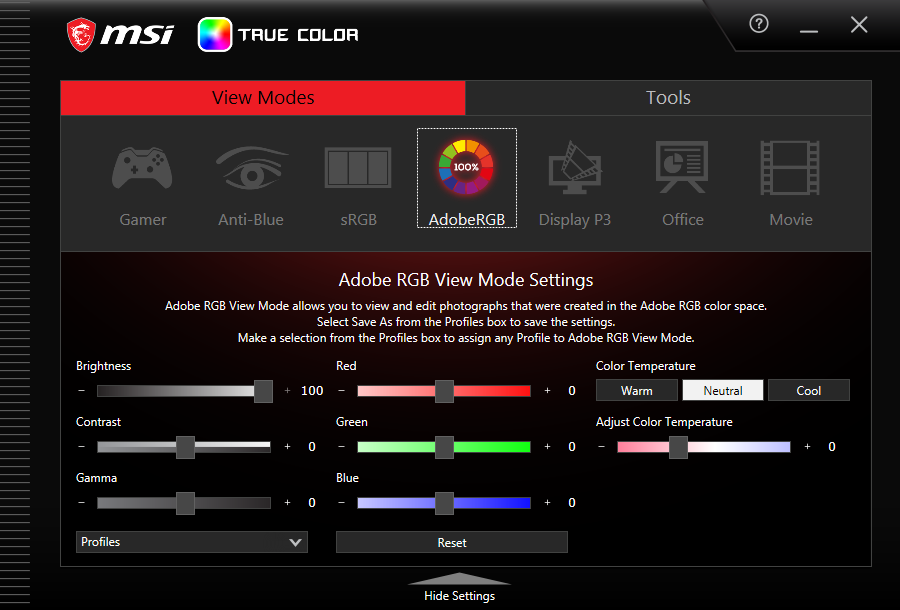
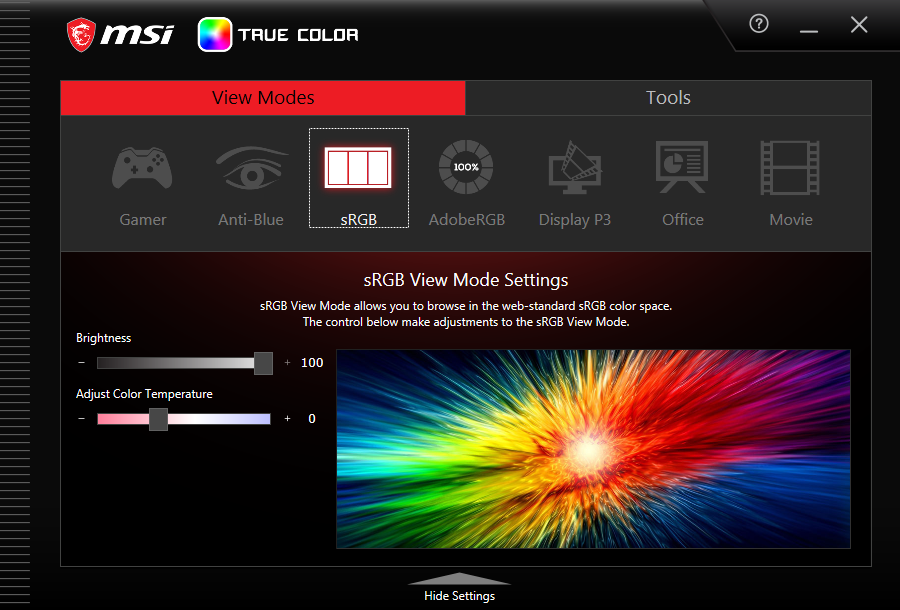
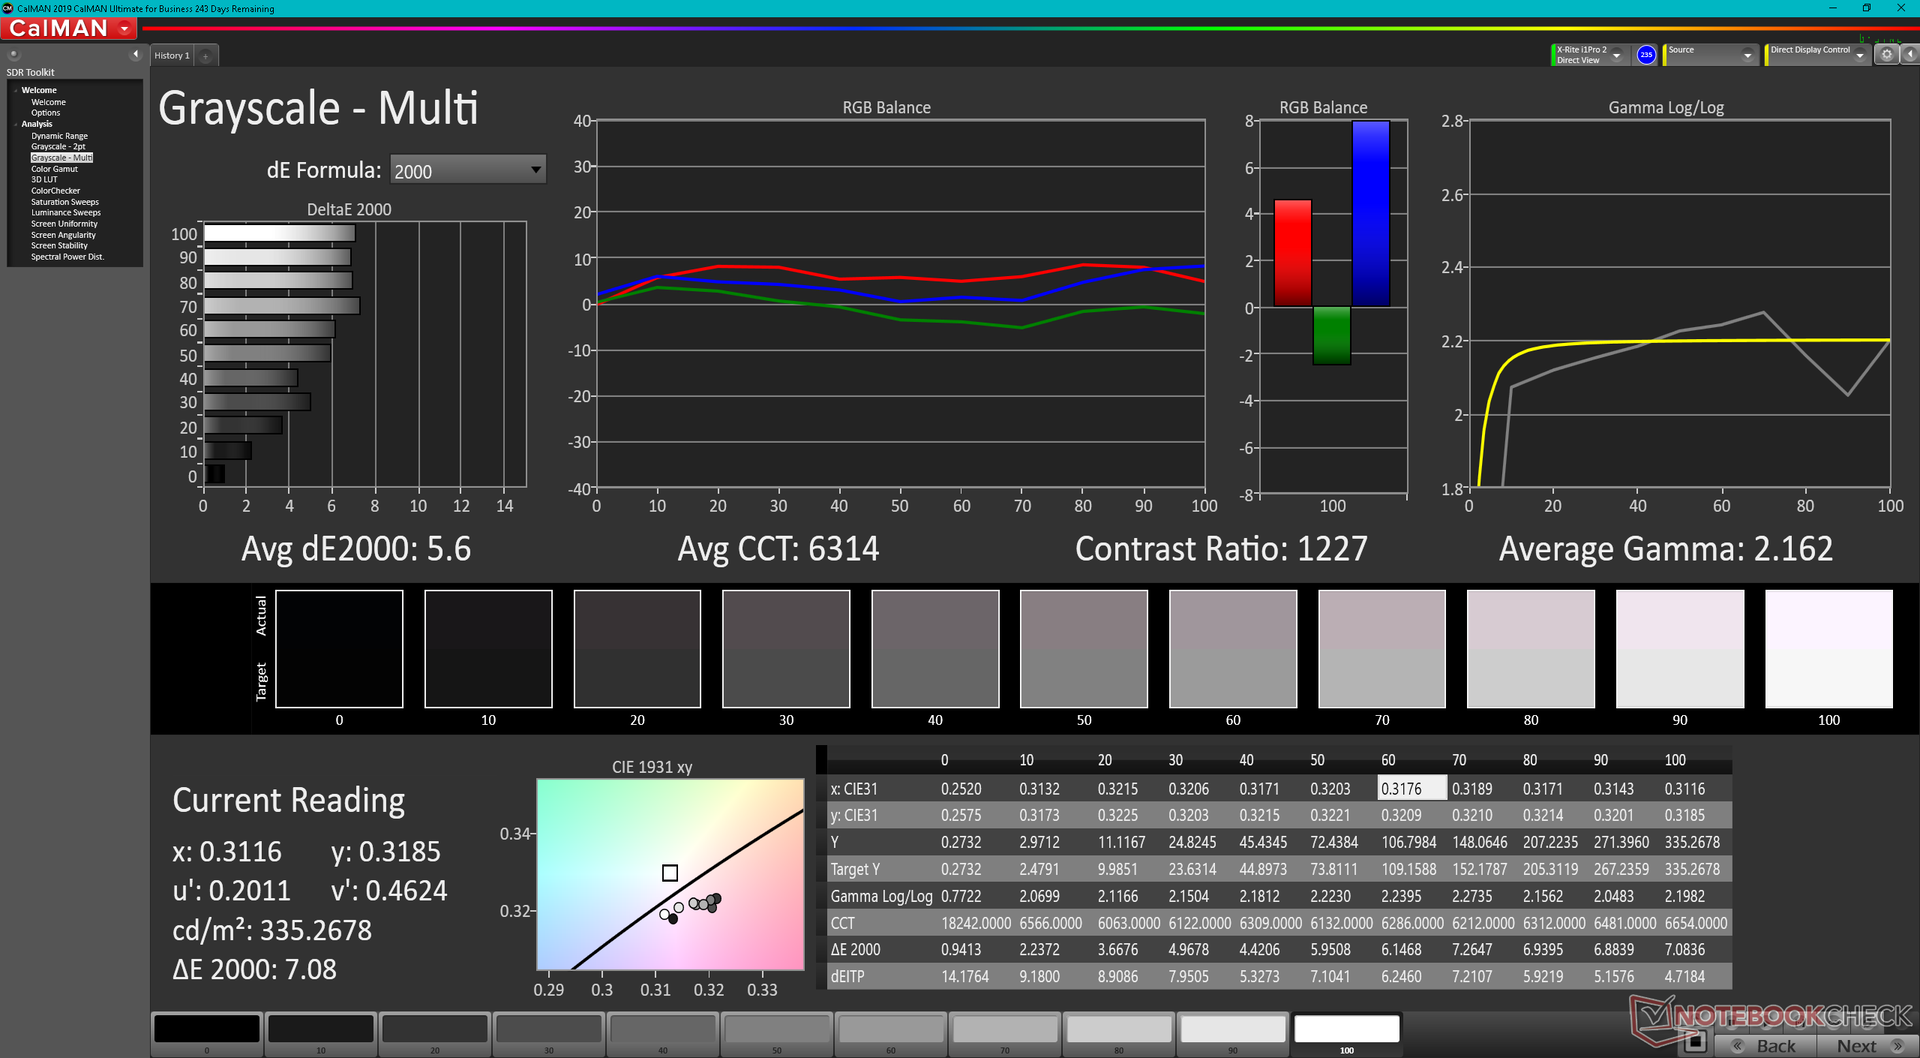
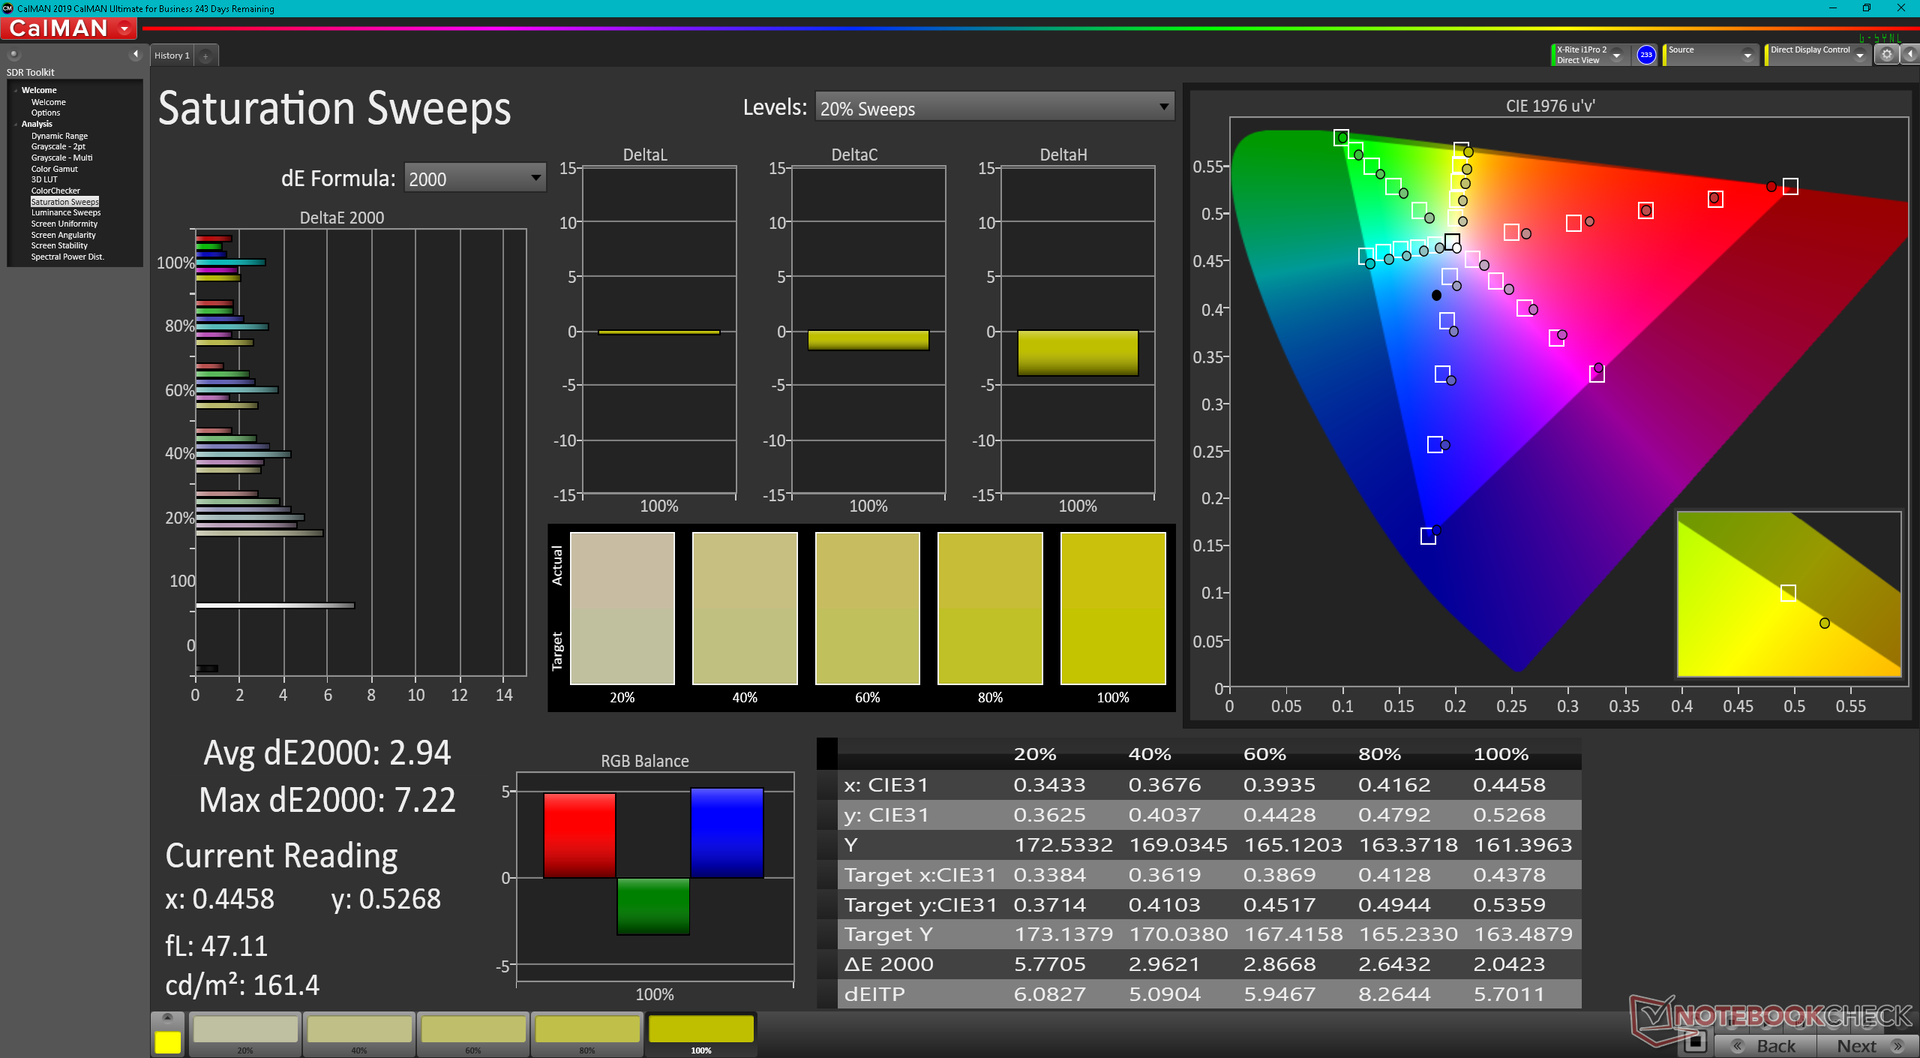
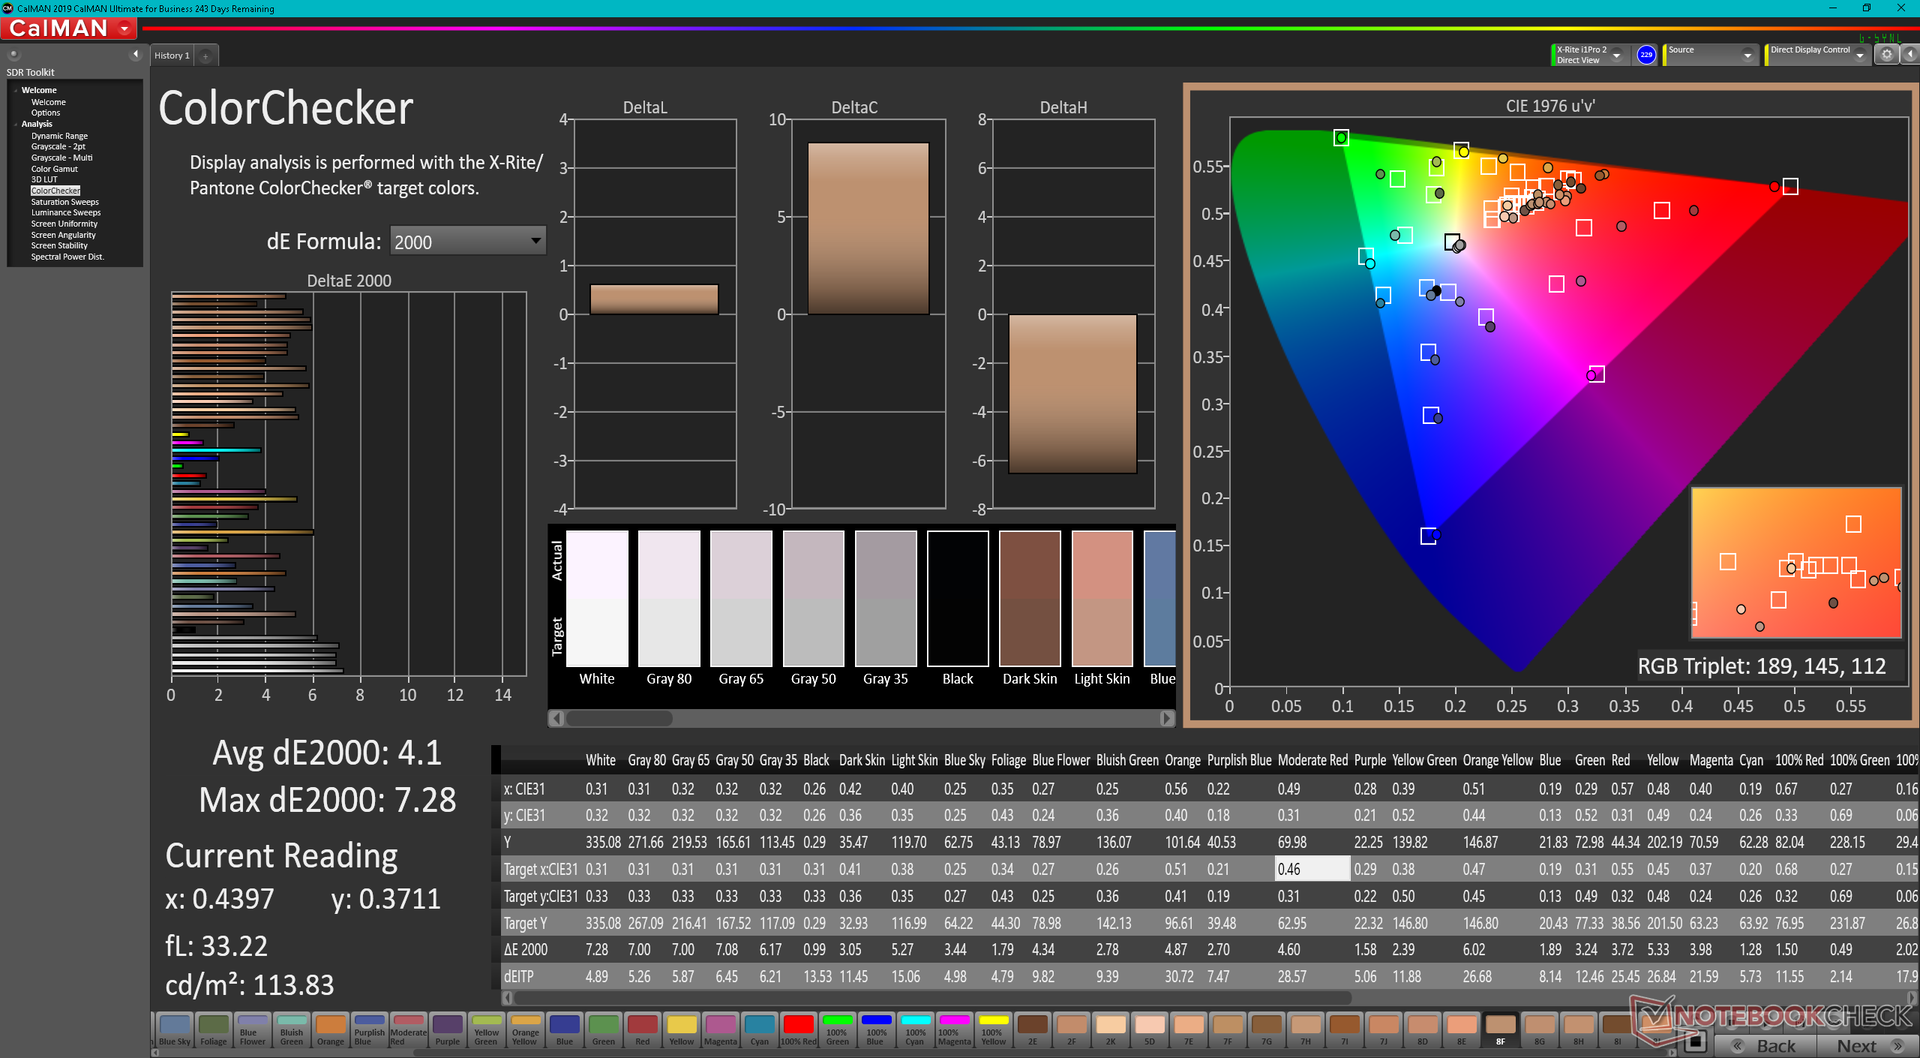
Det finns ändå två stora skillnader mellan GS77-skärmen och Blade 17-skärmen. För det första stöder GS77-skärmen inte G-Sync eller adaptiv synkronisering på grund av att modellen inte stöder Advanced Optimus eller MUX. För det andra är panelen på GS77 inte fabrikskalibrerad och därför är färgerna märkbart fel även när profilen är inställd på DCI-P3.
| |||||||||||||||||||||||||
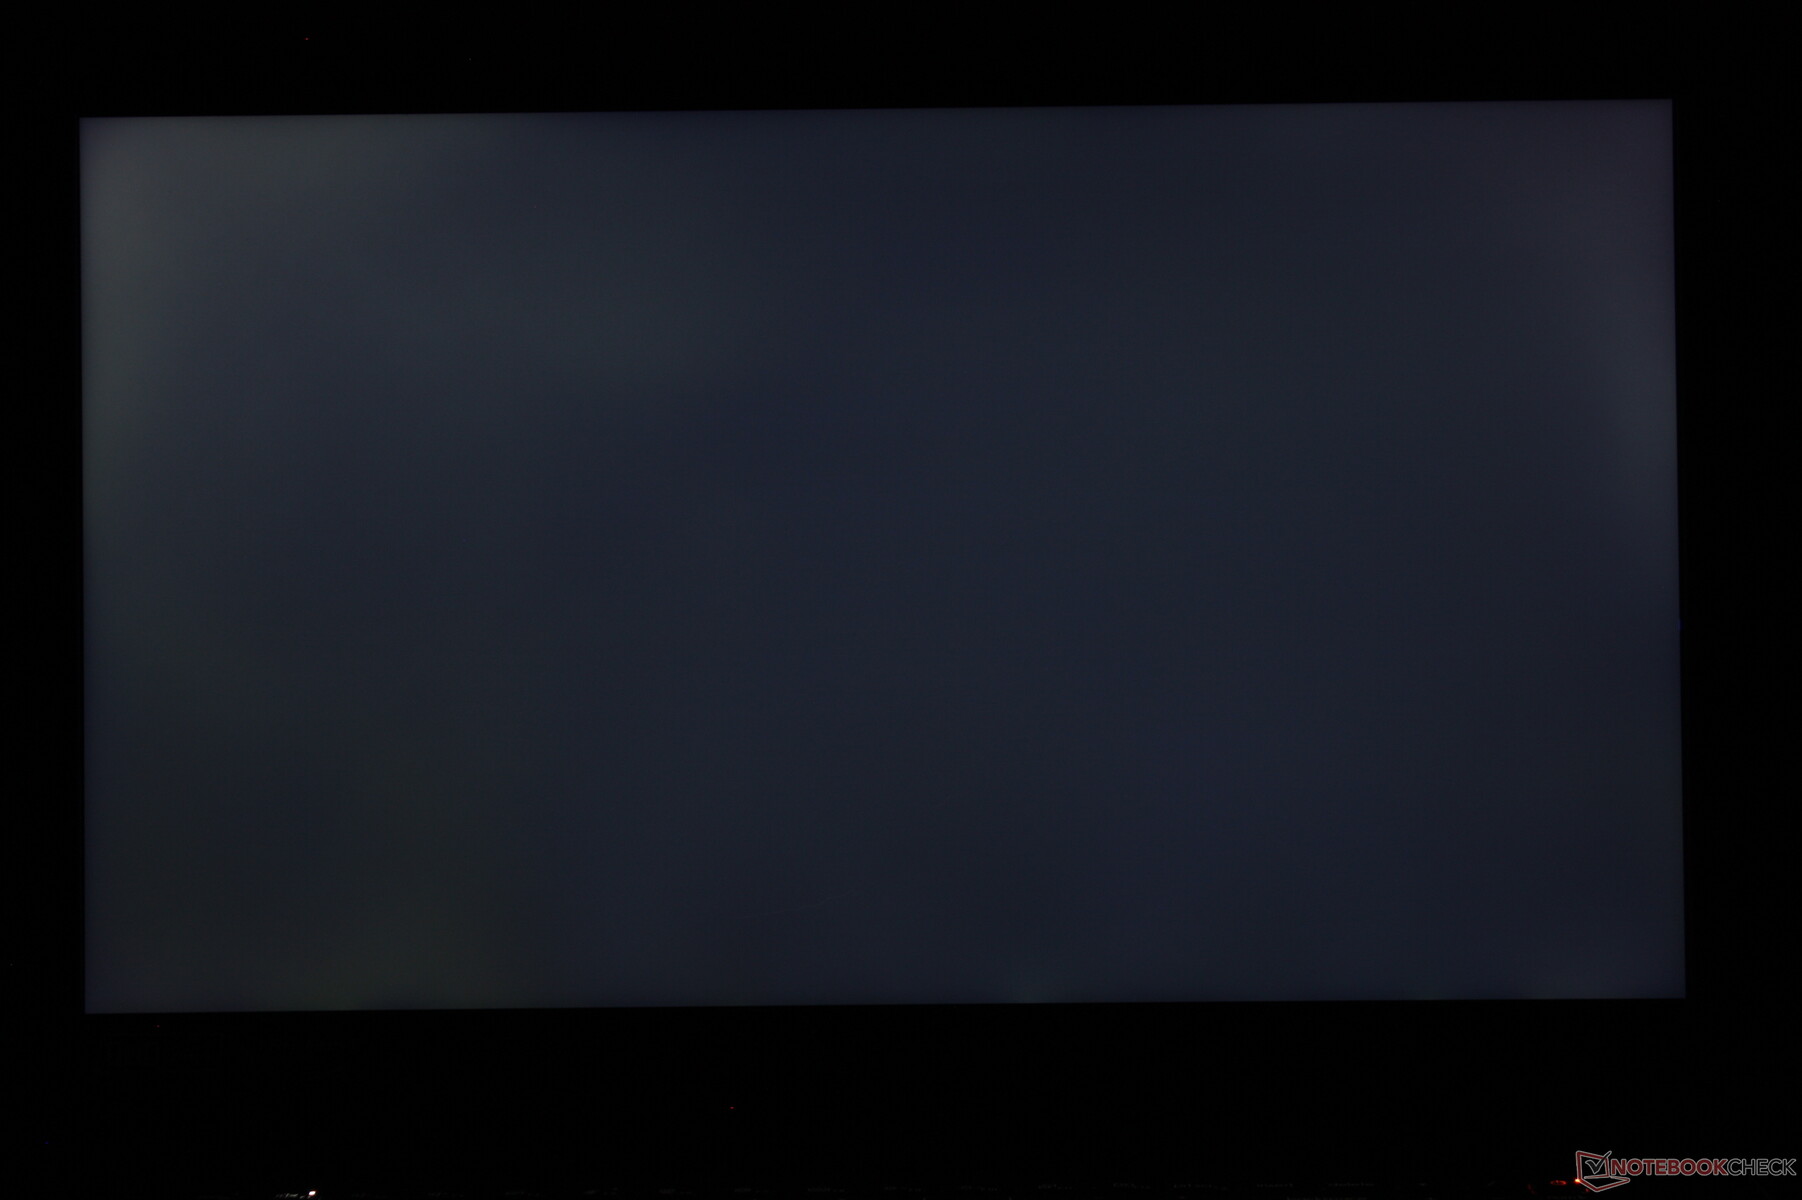
Distribution av ljusstyrkan: 79 %
Mitt på batteriet: 334.8 cd/m²
Kontrast: 985:1 (Svärta: 0.34 cd/m²)
ΔE ColorChecker Calman: 4.1 | ∀{0.5-29.43 Ø4.71}
ΔE Greyscale Calman: 5.6 | ∀{0.09-98 Ø4.96}
85.8% AdobeRGB 1998 (Argyll 3D)
99.7% sRGB (Argyll 3D)
96.2% Display P3 (Argyll 3D)
Gamma: 2.16
CCT: 6314 K
| MSI Stealth GS77 12UHS-083US BOE NE173QHM-NZ1, IPS, 2560x1440, 17.3" | MSI GS76 Stealth 11UH AUO B173ZAN06.1 (AUODE95), IPS, 3840x2160, 17.3" | Razer Blade 17 RTX 3080 Ti BOE NE173QHM-NZ1, IPS, 2560x1440, 17.3" | MSI GE76 Raider AU Optronics B173HAN05.4 (AUOE295), IPS-Level, 1920x1080, 17.3" | Alienware x17 RTX 3080 P48E AU Optronics B173ZAN, IPS, 3840x2160, 17.3" | Asus ROG Zephyrus S17 GX703HSD BOE099D (BOE CQ NE173QHM-NY3), IPS, 2560x1440, 17.3" | |
|---|---|---|---|---|---|---|
| Display | -21% | 1% | -21% | 3% | -2% | |
| Display P3 Coverage (%) | 96.2 | 63 -35% | 98.7 3% | 63.1 -34% | 88.3 -8% | 94.2 -2% |
| sRGB Coverage (%) | 99.7 | 94.8 -5% | 99.9 0% | 94 -6% | 100 0% | 98.7 -1% |
| AdobeRGB 1998 Coverage (%) | 85.8 | 65 -24% | 86.2 0% | 65.2 -24% | 100 17% | 84.4 -2% |
| Response Times | 50% | 6% | 47% | 19% | 55% | |
| Response Time Grey 50% / Grey 80% * (ms) | 17.6 ? | 8.8 ? 50% | 17.6 ? -0% | 5.6 ? 68% | 14.4 ? 18% | 4.8 73% |
| Response Time Black / White * (ms) | 12.8 ? | 6.4 ? 50% | 11.4 ? 11% | 9.6 ? 25% | 10.4 ? 19% | 8 37% |
| PWM Frequency (Hz) | ||||||
| Screen | 26% | 13% | 30% | 12% | 13% | |
| Brightness middle (cd/m²) | 334.8 | 474 42% | 335.9 0% | 290 -13% | 438.7 31% | 322 -4% |
| Brightness (cd/m²) | 305 | 454 49% | 294 -4% | 290 -5% | 435 43% | 288 -6% |
| Brightness Distribution (%) | 79 | 88 11% | 75 -5% | 96 22% | 91 15% | 72 -9% |
| Black Level * (cd/m²) | 0.34 | 0.46 -35% | 0.38 -12% | 0.23 32% | 0.48 -41% | 0.3 12% |
| Contrast (:1) | 985 | 1030 5% | 884 -10% | 1261 28% | 914 -7% | 1073 9% |
| Colorchecker dE 2000 * | 4.1 | 1.5 63% | 2.82 31% | 1.59 61% | 4.34 -6% | 3.05 26% |
| Colorchecker dE 2000 max. * | 7.28 | 5.59 23% | 5.04 31% | 3.17 56% | 7.3 -0% | 5.23 28% |
| Greyscale dE 2000 * | 5.6 | 2.8 50% | 1.7 70% | 2.5 55% | 2.4 57% | 3.11 44% |
| Gamma | 2.16 102% | 2.158 102% | 2.14 103% | 2.253 98% | 2.09 105% | 2.13 103% |
| CCT | 6314 103% | 6597 99% | 6382 102% | 6640 98% | 6413 101% | 6553 99% |
| Colorchecker dE 2000 calibrated * | 0.86 | 0.87 | 0.72 | 1.92 | ||
| Color Space (Percent of AdobeRGB 1998) (%) | 84 | |||||
| Color Space (Percent of sRGB) (%) | 99 | |||||
| Totalt genomsnitt (program/inställningar) | 18% /
19% | 7% /
9% | 19% /
20% | 11% /
11% | 22% /
16% |
* ... mindre är bättre
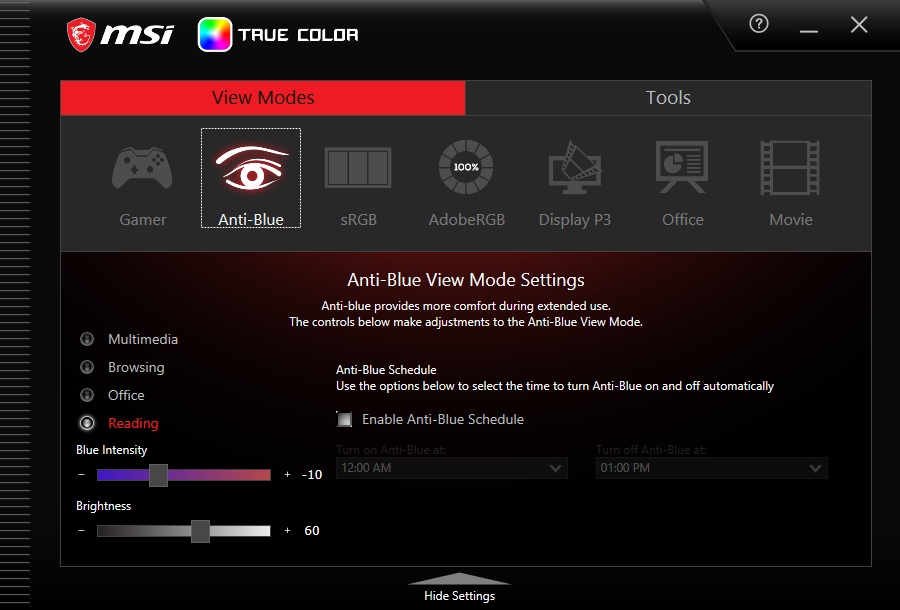
Som vi nämnde ovan kalibrerar MSI inte varje panel på fabriken och det visar sig med vår X-Rite-färgmätare. Färgtemperaturen är för varm utanför lådan och därför är de genomsnittliga DeltaE-värdena relativt höga på GS77 som ett resultat. Tack och lov kan användare manuellt justera färgtemperaturen och RGB-värdena via den förinstallerade MSI True Color-programvaran utan större problem.
Visa svarstider
| ↔ Svarstid svart till vitt | ||
|---|---|---|
| 12.8 ms ... stiga ↗ och falla ↘ kombinerat | ↗ 7.6 ms stiga | 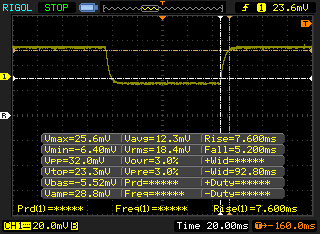 |
| ↘ 5.2 ms hösten | ||
| Skärmen visar bra svarsfrekvens i våra tester, men kan vara för långsam för konkurrenskraftiga spelare. I jämförelse sträcker sig alla testade enheter från 0.1 (minst) till 240 (maximalt) ms. » 33 % av alla enheter är bättre. Det betyder att den uppmätta svarstiden är bättre än genomsnittet av alla testade enheter (19.8 ms). | ||
| ↔ Svarstid 50 % grått till 80 % grått | ||
| 17.6 ms ... stiga ↗ och falla ↘ kombinerat | ↗ 10 ms stiga | 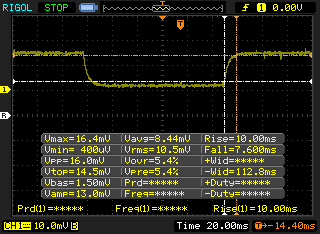 |
| ↘ 7.6 ms hösten | ||
| Skärmen visar bra svarsfrekvens i våra tester, men kan vara för långsam för konkurrenskraftiga spelare. I jämförelse sträcker sig alla testade enheter från 0.165 (minst) till 636 (maximalt) ms. » 32 % av alla enheter är bättre. Det betyder att den uppmätta svarstiden är bättre än genomsnittet av alla testade enheter (31 ms). | ||
Skärmflimmer / PWM (Puls-Width Modulation)
| Skärmflimmer / PWM upptäcktes inte | 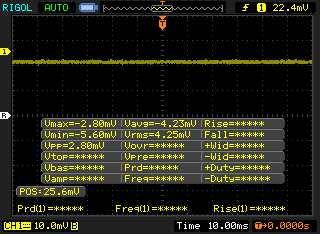 | ||
Som jämförelse: 52 % av alla testade enheter använder inte PWM för att dämpa skärmen. Om PWM upptäcktes mättes ett medelvärde av 7757 (minst: 5 - maximum: 343500) Hz. | |||

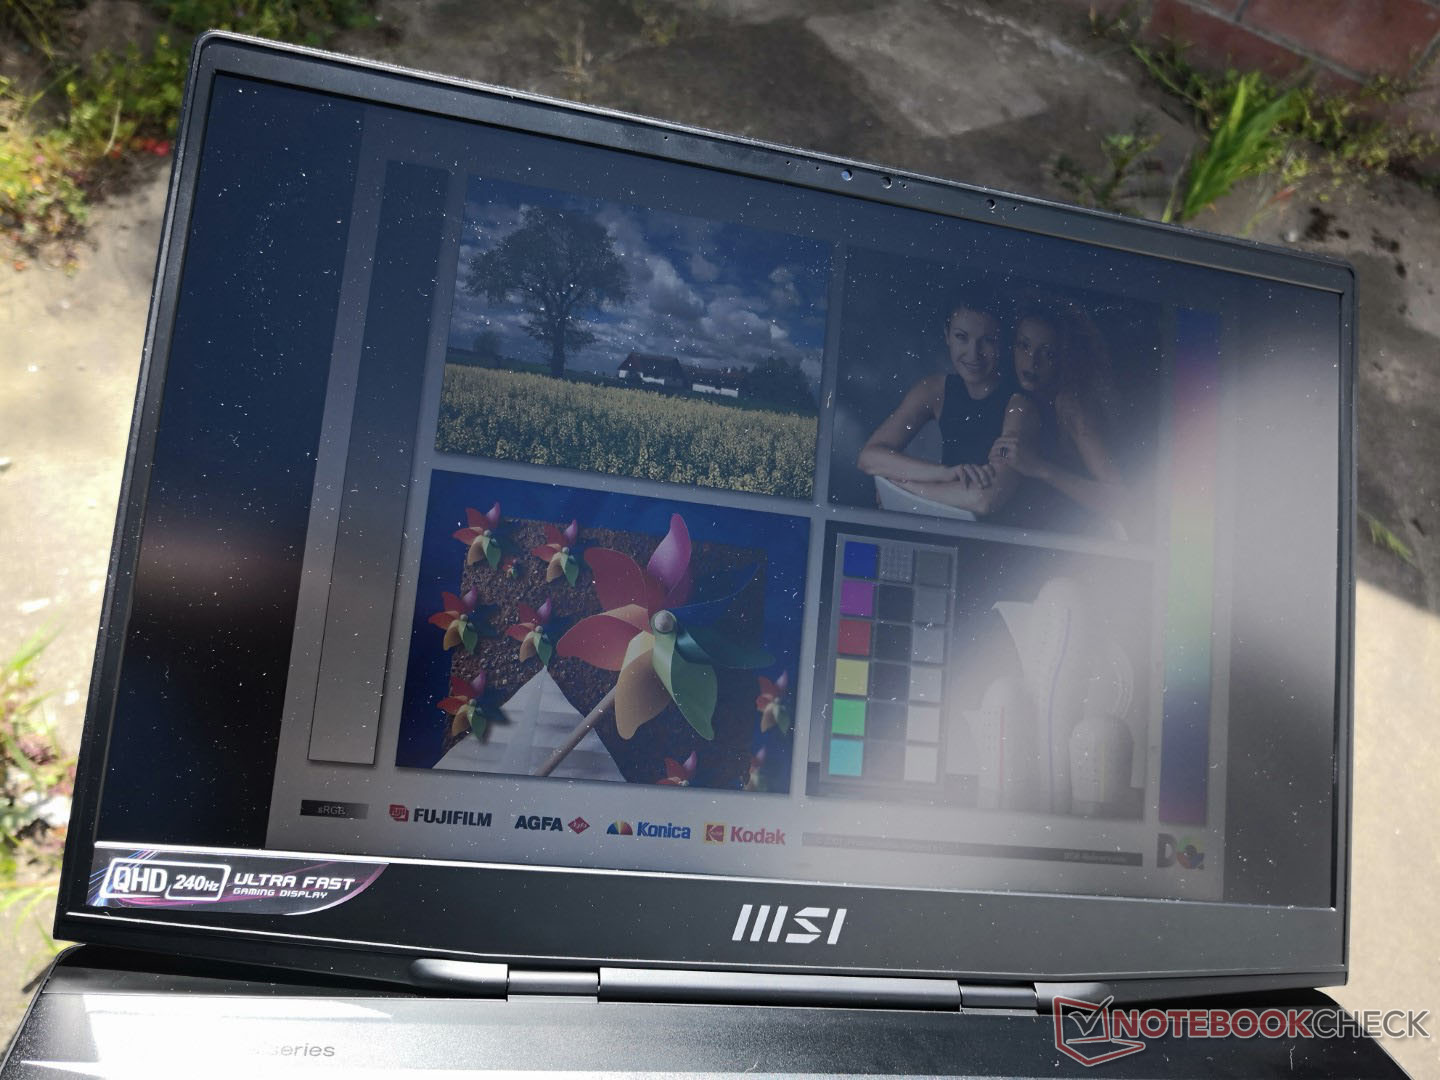
Vår 1440p-skärm är nästan 30 procent svagare än vad vi registrerade på 4K GS76 för att vara på en mer likartad nivå med Blade 17. Synligheten utomhus är därefter inte lika bra som på förra årets modell.
Prestanda - 12th Gen Intel med 105 W TGP-grafik
Provningsförhållanden
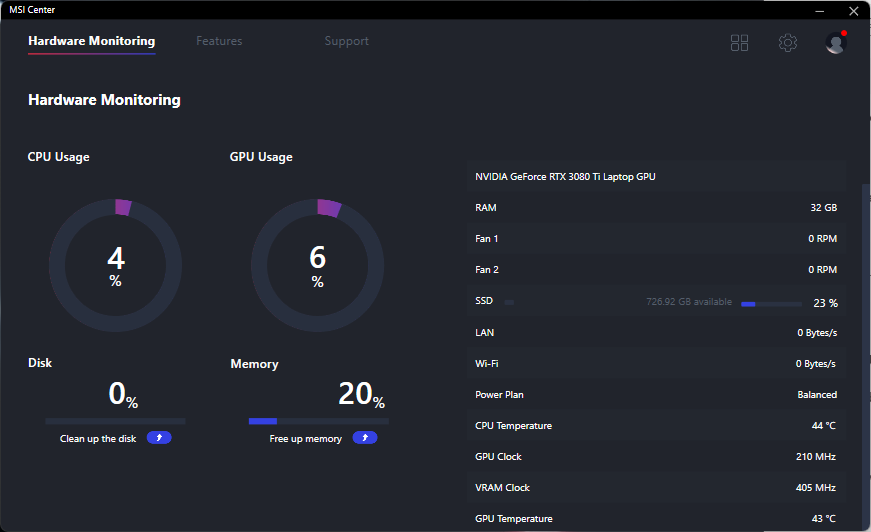
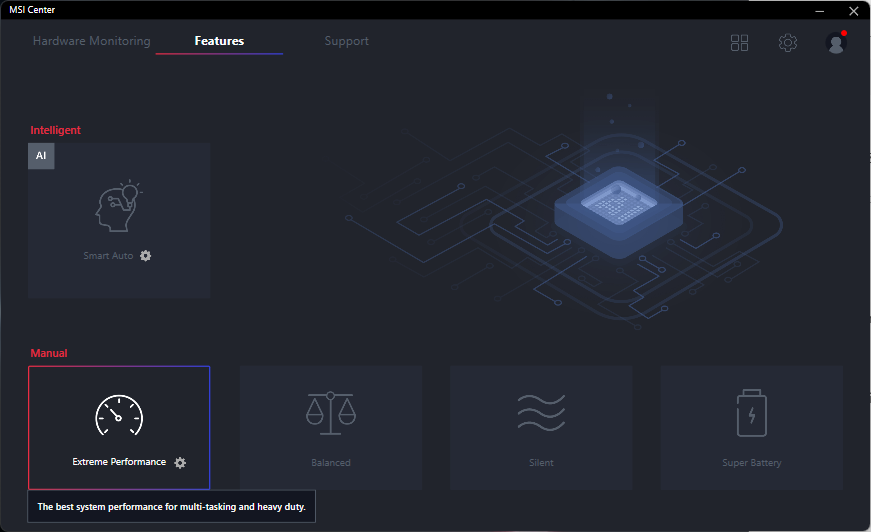
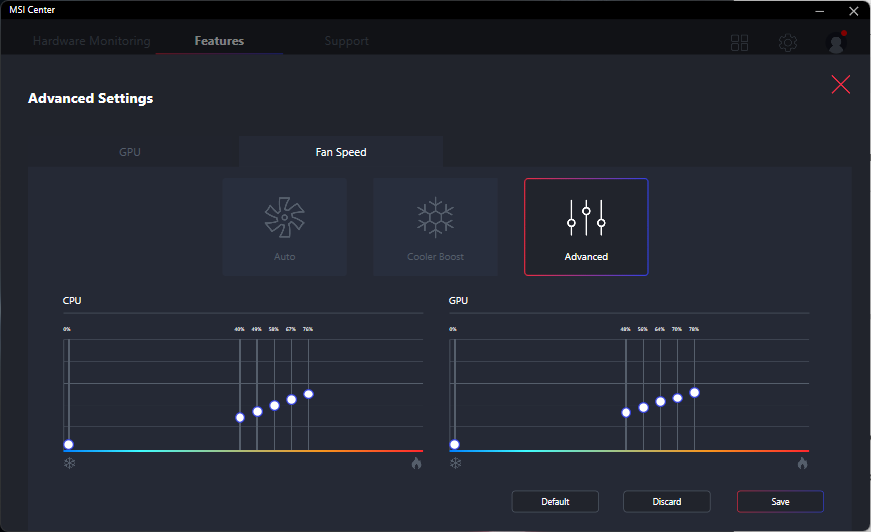
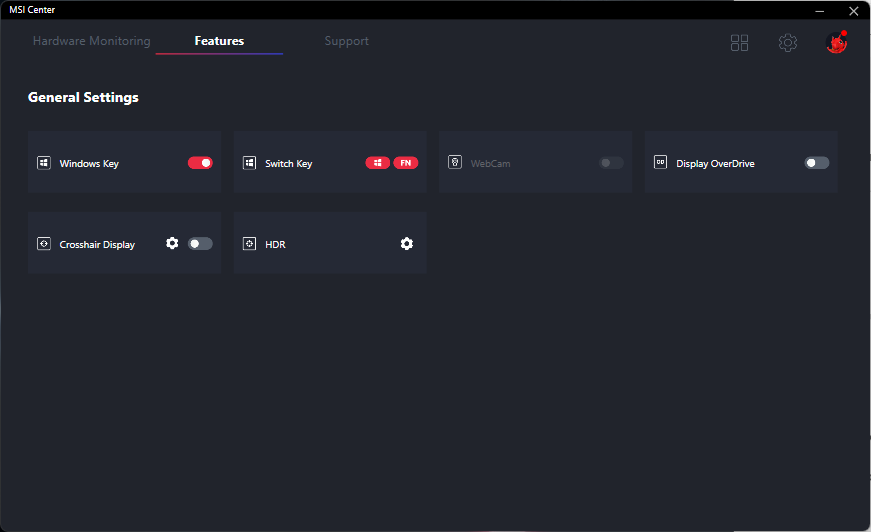
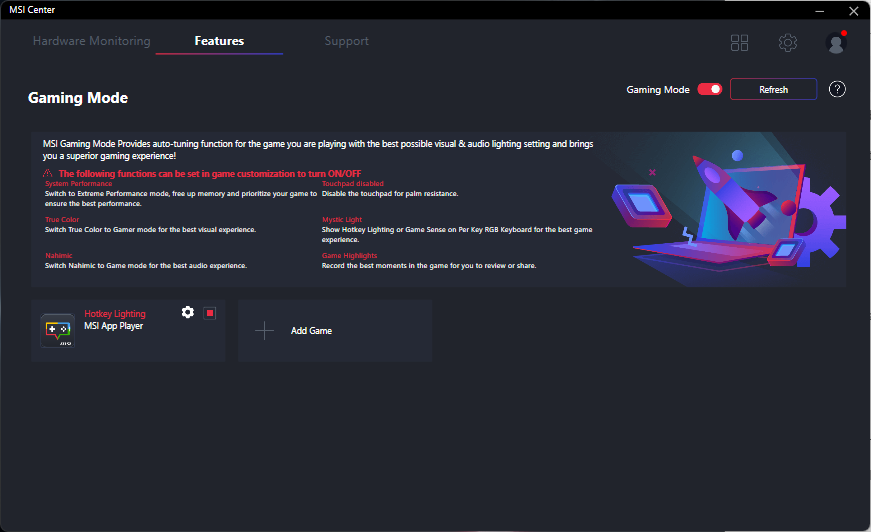
Vi ställde in vår enhet på Extreme Performance-läget via den förinstallerade MSI Control Center-programvaran innan vi körde några av de följande benchmarks. Vi rekommenderar att användarna bekantar sig med den här programvaran eftersom viktiga systemfunktioner kan ställas in här.
Processor - Stora vinster från år till år
CPU-prestandan är utmärkt med resultat som ligger inom en eller två procentenheter från den genomsnittliga bärbara datorn i vår databas som är utrustad med samma Core i7-12700H CPU. Prestandan för flera trådar är till och med konsekvent snabbare än Core i7-12800H i Blade 17 med 6-8 procent. Även om fördelen är relativt liten förklarar den den något högre bildfrekvensen vid spel i lägre upplösningar på GS77 jämfört med Blade 17.
GS77 levereras med en dyrare Core i9-12900H alternativ, men prestandaökningen bör bara vara några få procentenheter jämfört med vår Core i7-12700H baserat på vår erfarenhet av en handfull bärbara datorer med Core i9-12900H som redan finns på marknaden.
Prestandauppgraderingen från år till år jämfört med Intels 11:e generation Tiger Lake-H-serie är mer betydande. Jämfört med Core i9-11900H i förra årets GS76är vår Core i7-12700H cirka 15 procent och 25-30 procent snabbare i en- och flertrådsoperationer.
Cinebench R15 Multi Loop
Cinebench R23: Multi Core | Single Core
Cinebench R15: CPU Multi 64Bit | CPU Single 64Bit
Blender: v2.79 BMW27 CPU
7-Zip 18.03: 7z b 4 | 7z b 4 -mmt1
Geekbench 5.5: Multi-Core | Single-Core
HWBOT x265 Benchmark v2.2: 4k Preset
LibreOffice : 20 Documents To PDF
R Benchmark 2.5: Overall mean
| Cinebench R20 / CPU (Multi Core) | |
| Corsair One i300 | |
| MSI GE76 Raider | |
| MSI Vector GP66 12UGS | |
| MSI Stealth GS77 12UHS-083US | |
| Razer Blade 17 RTX 3080 Ti | |
| Genomsnitt Intel Core i7-12700H (1576 - 7407, n=64) | |
| Asus ROG Strix G17 G713QE-RB74 | |
| MSI GS76 Stealth 11UH | |
| Gigabyte A7 X1 | |
| Asus TUF Gaming F17 FX707Z-HX011W | |
| Schenker XMG Pro 17 (Late 2021, RTX 3080) | |
| MSI GE76 Raider 10UH | |
| MSI GS75 10SF-609US | |
| Cinebench R20 / CPU (Single Core) | |
| Corsair One i300 | |
| MSI GE76 Raider | |
| MSI Vector GP66 12UGS | |
| Razer Blade 17 RTX 3080 Ti | |
| Asus TUF Gaming F17 FX707Z-HX011W | |
| MSI Stealth GS77 12UHS-083US | |
| Genomsnitt Intel Core i7-12700H (300 - 704, n=64) | |
| MSI GS76 Stealth 11UH | |
| Schenker XMG Pro 17 (Late 2021, RTX 3080) | |
| Gigabyte A7 X1 | |
| Asus ROG Strix G17 G713QE-RB74 | |
| MSI GS75 10SF-609US | |
| MSI GE76 Raider 10UH | |
| Cinebench R15 / CPU Multi 64Bit | |
| Corsair One i300 | |
| MSI GE76 Raider | |
| Asus TUF Gaming F17 FX707Z-HX011W | |
| MSI Stealth GS77 12UHS-083US | |
| Genomsnitt Intel Core i7-12700H (1379 - 2916, n=70) | |
| MSI Vector GP66 12UGS | |
| Razer Blade 17 RTX 3080 Ti | |
| MSI GS76 Stealth 11UH | |
| Gigabyte A7 X1 | |
| Asus ROG Strix G17 G713QE-RB74 | |
| Schenker XMG Pro 17 (Late 2021, RTX 3080) | |
| MSI GE76 Raider 10UH | |
| MSI GS75 10SF-609US | |
| Cinebench R15 / CPU Single 64Bit | |
| Corsair One i300 | |
| MSI GE76 Raider | |
| MSI Vector GP66 12UGS | |
| Razer Blade 17 RTX 3080 Ti | |
| MSI Stealth GS77 12UHS-083US | |
| Asus TUF Gaming F17 FX707Z-HX011W | |
| Genomsnitt Intel Core i7-12700H (113 - 263, n=65) | |
| Gigabyte A7 X1 | |
| MSI GS76 Stealth 11UH | |
| Asus ROG Strix G17 G713QE-RB74 | |
| Schenker XMG Pro 17 (Late 2021, RTX 3080) | |
| MSI GS75 10SF-609US | |
| MSI GE76 Raider 10UH | |
| Blender / v2.79 BMW27 CPU | |
| MSI GS75 10SF-609US | |
| MSI GE76 Raider 10UH | |
| Schenker XMG Pro 17 (Late 2021, RTX 3080) | |
| MSI GS76 Stealth 11UH | |
| Asus TUF Gaming F17 FX707Z-HX011W | |
| Gigabyte A7 X1 | |
| Asus ROG Strix G17 G713QE-RB74 | |
| Genomsnitt Intel Core i7-12700H (168 - 732, n=63) | |
| Razer Blade 17 RTX 3080 Ti | |
| MSI Vector GP66 12UGS | |
| MSI Stealth GS77 12UHS-083US | |
| MSI GE76 Raider | |
| Corsair One i300 | |
| 7-Zip 18.03 / 7z b 4 | |
| Corsair One i300 | |
| MSI GE76 Raider | |
| MSI Stealth GS77 12UHS-083US | |
| MSI Vector GP66 12UGS | |
| Razer Blade 17 RTX 3080 Ti | |
| Genomsnitt Intel Core i7-12700H (22844 - 73067, n=63) | |
| Gigabyte A7 X1 | |
| Asus TUF Gaming F17 FX707Z-HX011W | |
| Asus ROG Strix G17 G713QE-RB74 | |
| MSI GS76 Stealth 11UH | |
| Schenker XMG Pro 17 (Late 2021, RTX 3080) | |
| MSI GS75 10SF-609US | |
| MSI GE76 Raider 10UH | |
| 7-Zip 18.03 / 7z b 4 -mmt1 | |
| Corsair One i300 | |
| MSI GE76 Raider | |
| MSI Vector GP66 12UGS | |
| Razer Blade 17 RTX 3080 Ti | |
| Gigabyte A7 X1 | |
| Genomsnitt Intel Core i7-12700H (2743 - 5972, n=63) | |
| MSI GS76 Stealth 11UH | |
| Asus TUF Gaming F17 FX707Z-HX011W | |
| Schenker XMG Pro 17 (Late 2021, RTX 3080) | |
| MSI Stealth GS77 12UHS-083US | |
| Asus ROG Strix G17 G713QE-RB74 | |
| MSI GS75 10SF-609US | |
| MSI GE76 Raider 10UH | |
| Geekbench 5.5 / Multi-Core | |
| Corsair One i300 | |
| MSI GE76 Raider | |
| MSI Stealth GS77 12UHS-083US | |
| Razer Blade 17 RTX 3080 Ti | |
| Asus TUF Gaming F17 FX707Z-HX011W | |
| MSI Vector GP66 12UGS | |
| Genomsnitt Intel Core i7-12700H (5144 - 13745, n=64) | |
| MSI GS76 Stealth 11UH | |
| Schenker XMG Pro 17 (Late 2021, RTX 3080) | |
| MSI GS75 10SF-609US | |
| MSI GE76 Raider 10UH | |
| Gigabyte A7 X1 | |
| Geekbench 5.5 / Single-Core | |
| Corsair One i300 | |
| MSI GE76 Raider | |
| MSI Vector GP66 12UGS | |
| Asus TUF Gaming F17 FX707Z-HX011W | |
| Razer Blade 17 RTX 3080 Ti | |
| MSI Stealth GS77 12UHS-083US | |
| Genomsnitt Intel Core i7-12700H (803 - 1851, n=64) | |
| MSI GS76 Stealth 11UH | |
| Schenker XMG Pro 17 (Late 2021, RTX 3080) | |
| Gigabyte A7 X1 | |
| MSI GS75 10SF-609US | |
| MSI GE76 Raider 10UH | |
| HWBOT x265 Benchmark v2.2 / 4k Preset | |
| Corsair One i300 | |
| MSI GE76 Raider | |
| MSI Vector GP66 12UGS | |
| MSI Stealth GS77 12UHS-083US | |
| Razer Blade 17 RTX 3080 Ti | |
| Genomsnitt Intel Core i7-12700H (4.67 - 21.8, n=64) | |
| MSI GS76 Stealth 11UH | |
| Schenker XMG Pro 17 (Late 2021, RTX 3080) | |
| Asus ROG Strix G17 G713QE-RB74 | |
| Gigabyte A7 X1 | |
| Asus TUF Gaming F17 FX707Z-HX011W | |
| MSI GE76 Raider 10UH | |
| MSI GS75 10SF-609US | |
| LibreOffice / 20 Documents To PDF | |
| Asus TUF Gaming F17 FX707Z-HX011W | |
| Gigabyte A7 X1 | |
| Asus ROG Strix G17 G713QE-RB74 | |
| MSI GS75 10SF-609US | |
| MSI GS76 Stealth 11UH | |
| MSI GE76 Raider 10UH | |
| Schenker XMG Pro 17 (Late 2021, RTX 3080) | |
| Razer Blade 17 RTX 3080 Ti | |
| Genomsnitt Intel Core i7-12700H (34.2 - 95.3, n=63) | |
| MSI Stealth GS77 12UHS-083US | |
| MSI Vector GP66 12UGS | |
| MSI GE76 Raider | |
| Corsair One i300 | |
| R Benchmark 2.5 / Overall mean | |
| MSI GS75 10SF-609US | |
| MSI GE76 Raider 10UH | |
| Schenker XMG Pro 17 (Late 2021, RTX 3080) | |
| MSI GS76 Stealth 11UH | |
| Asus ROG Strix G17 G713QE-RB74 | |
| Gigabyte A7 X1 | |
| Genomsnitt Intel Core i7-12700H (0.4441 - 1.052, n=63) | |
| Asus TUF Gaming F17 FX707Z-HX011W | |
| MSI Stealth GS77 12UHS-083US | |
| Razer Blade 17 RTX 3080 Ti | |
| MSI GE76 Raider | |
| MSI Vector GP66 12UGS | |
| Corsair One i300 | |
Cinebench R23: Multi Core | Single Core
Cinebench R15: CPU Multi 64Bit | CPU Single 64Bit
Blender: v2.79 BMW27 CPU
7-Zip 18.03: 7z b 4 | 7z b 4 -mmt1
Geekbench 5.5: Multi-Core | Single-Core
HWBOT x265 Benchmark v2.2: 4k Preset
LibreOffice : 20 Documents To PDF
R Benchmark 2.5: Overall mean
* ... mindre är bättre
AIDA64: FP32 Ray-Trace | FPU Julia | CPU SHA3 | CPU Queen | FPU SinJulia | FPU Mandel | CPU AES | CPU ZLib | FP64 Ray-Trace | CPU PhotoWorxx
| Performance rating | |
| MSI GE76 Raider | |
| Genomsnitt Intel Core i7-12700H | |
| MSI Stealth GS77 12UHS-083US | |
| Razer Blade 17 RTX 3080 Ti | |
| AIDA64 / FP32 Ray-Trace | |
| Genomsnitt Intel Core i7-12700H (2585 - 17957, n=64) | |
| MSI GE76 Raider | |
| MSI Stealth GS77 12UHS-083US | |
| Razer Blade 17 RTX 3080 Ti | |
| AIDA64 / FPU Julia | |
| Genomsnitt Intel Core i7-12700H (12439 - 90760, n=64) | |
| MSI GE76 Raider | |
| MSI Stealth GS77 12UHS-083US | |
| Razer Blade 17 RTX 3080 Ti | |
| AIDA64 / CPU SHA3 | |
| MSI GE76 Raider | |
| MSI Stealth GS77 12UHS-083US | |
| Genomsnitt Intel Core i7-12700H (833 - 4242, n=64) | |
| Razer Blade 17 RTX 3080 Ti | |
| AIDA64 / CPU Queen | |
| MSI GE76 Raider | |
| Razer Blade 17 RTX 3080 Ti | |
| MSI Stealth GS77 12UHS-083US | |
| Genomsnitt Intel Core i7-12700H (57923 - 103202, n=63) | |
| AIDA64 / FPU SinJulia | |
| MSI GE76 Raider | |
| MSI Stealth GS77 12UHS-083US | |
| Razer Blade 17 RTX 3080 Ti | |
| Genomsnitt Intel Core i7-12700H (3249 - 9939, n=64) | |
| AIDA64 / FPU Mandel | |
| Genomsnitt Intel Core i7-12700H (7135 - 44760, n=64) | |
| MSI GE76 Raider | |
| MSI Stealth GS77 12UHS-083US | |
| Razer Blade 17 RTX 3080 Ti | |
| AIDA64 / CPU AES | |
| MSI GE76 Raider | |
| MSI Stealth GS77 12UHS-083US | |
| Genomsnitt Intel Core i7-12700H (31839 - 144360, n=64) | |
| Razer Blade 17 RTX 3080 Ti | |
| AIDA64 / CPU ZLib | |
| MSI GE76 Raider | |
| MSI Stealth GS77 12UHS-083US | |
| Genomsnitt Intel Core i7-12700H (305 - 1171, n=64) | |
| Razer Blade 17 RTX 3080 Ti | |
| AIDA64 / FP64 Ray-Trace | |
| Genomsnitt Intel Core i7-12700H (1437 - 9692, n=64) | |
| MSI GE76 Raider | |
| MSI Stealth GS77 12UHS-083US | |
| Razer Blade 17 RTX 3080 Ti | |
| AIDA64 / CPU PhotoWorxx | |
| Razer Blade 17 RTX 3080 Ti | |
| MSI GE76 Raider | |
| MSI Stealth GS77 12UHS-083US | |
| Genomsnitt Intel Core i7-12700H (12863 - 52207, n=64) | |
Systemets prestanda
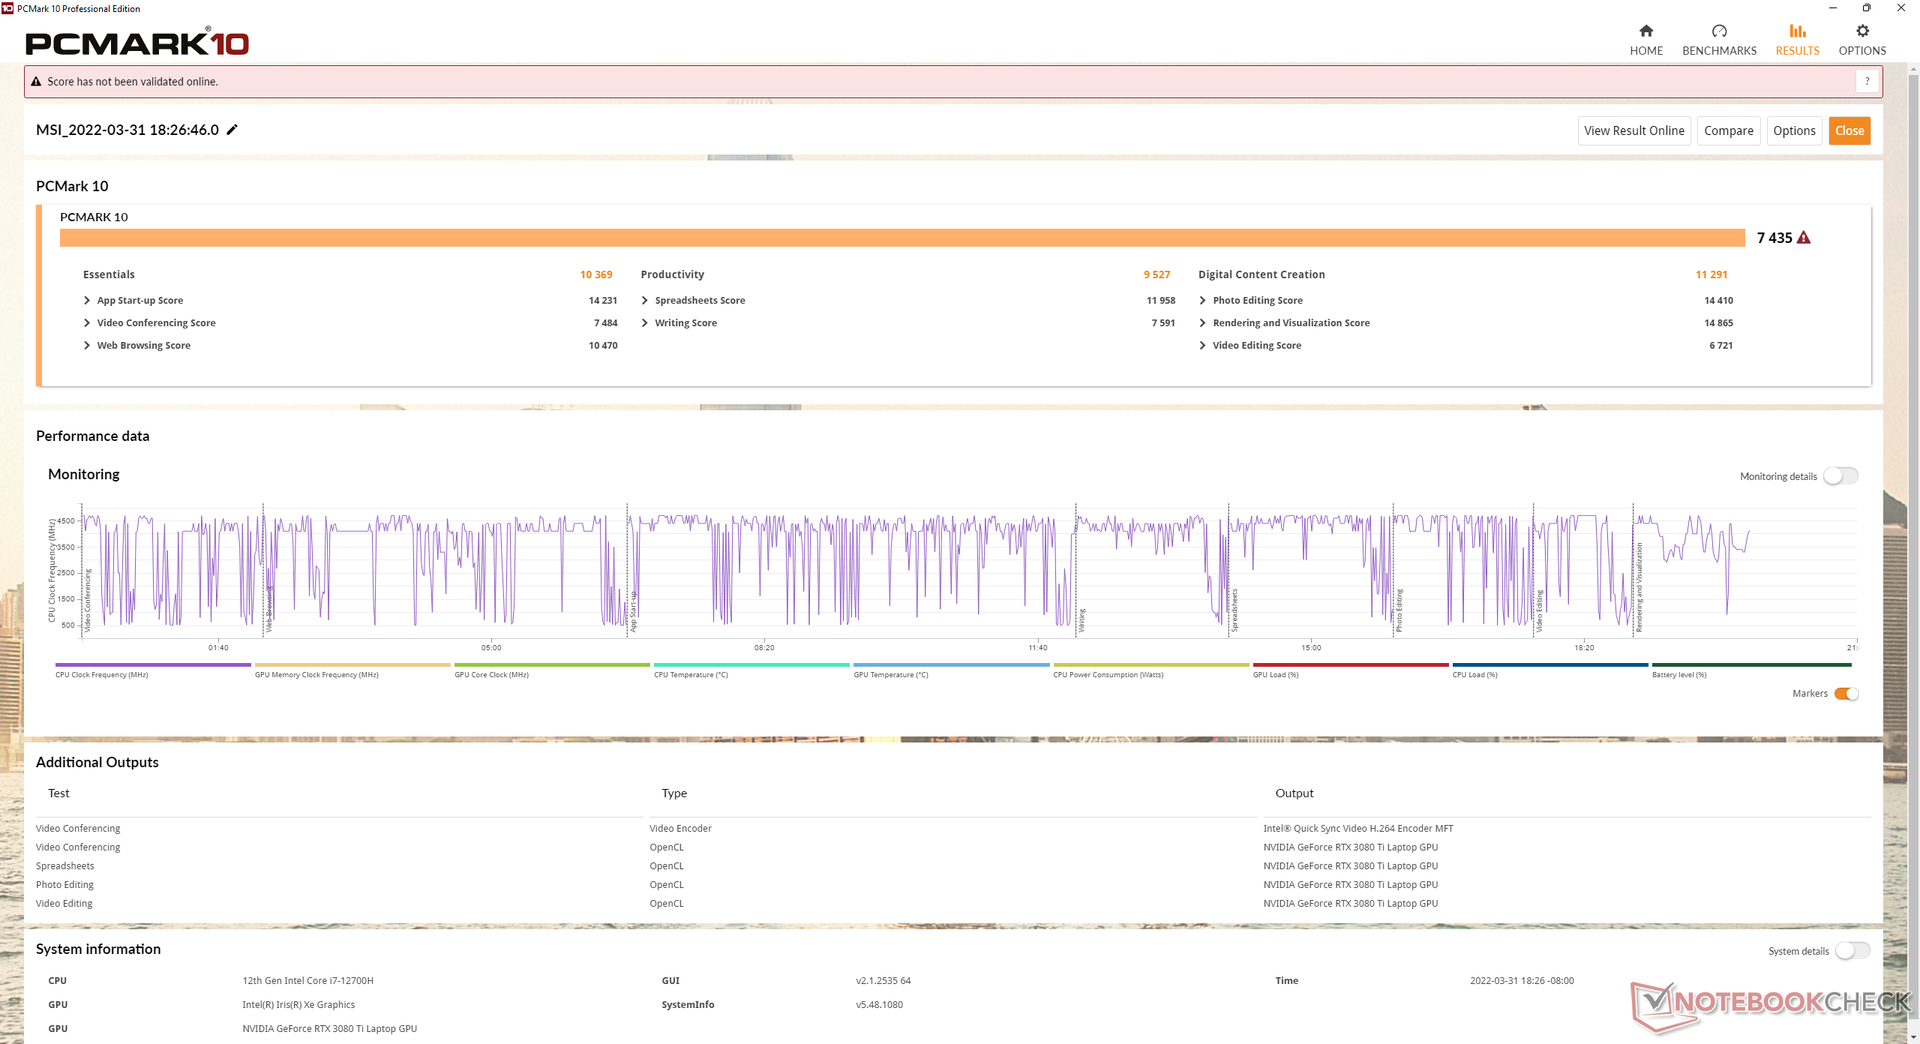
PCMark-resultaten ligger konsekvent före förra årets GS76 men något bakom den senaste Blade 17
Vi upplevde ett par problem relaterade till viloläge och uppdateringsfrekvens värda att nämna på vår recensionsenhet. När systemet ställdes i viloläge var strömförbrukningen ibland onormalt hög och med mycket varma yttemperaturer. Samtidigt kunde vissa spel, inklusive Witcher 3, Far Cry 5 och Strange Brigade blev svarta när skärmens ursprungliga uppdateringsfrekvens ställdes in på 240 Hz i stället för 60 Hz. Inget av dessa problem dök upp på vår Blade 17-enhet trots att båda de bärbara datorerna använder samma 240 Hz-paneler från BOE.
| PCMark 10 / Score | |
| MSI GE76 Raider | |
| Razer Blade 17 RTX 3080 Ti | |
| Alienware x17 RTX 3080 P48E | |
| MSI Stealth GS77 12UHS-083US | |
| Genomsnitt Intel Core i7-12700H, NVIDIA GeForce RTX 3080 Ti Laptop GPU (6868 - 7638, n=7) | |
| Asus ROG Zephyrus S17 GX703HSD | |
| MSI GS76 Stealth 11UH | |
| PCMark 10 / Essentials | |
| Razer Blade 17 RTX 3080 Ti | |
| MSI GE76 Raider | |
| Asus ROG Zephyrus S17 GX703HSD | |
| Genomsnitt Intel Core i7-12700H, NVIDIA GeForce RTX 3080 Ti Laptop GPU (9987 - 11318, n=7) | |
| MSI Stealth GS77 12UHS-083US | |
| Alienware x17 RTX 3080 P48E | |
| MSI GS76 Stealth 11UH | |
| PCMark 10 / Productivity | |
| MSI GE76 Raider | |
| Alienware x17 RTX 3080 P48E | |
| MSI Stealth GS77 12UHS-083US | |
| Genomsnitt Intel Core i7-12700H, NVIDIA GeForce RTX 3080 Ti Laptop GPU (8944 - 10726, n=7) | |
| Razer Blade 17 RTX 3080 Ti | |
| Asus ROG Zephyrus S17 GX703HSD | |
| MSI GS76 Stealth 11UH | |
| PCMark 10 / Digital Content Creation | |
| MSI GE76 Raider | |
| Razer Blade 17 RTX 3080 Ti | |
| Alienware x17 RTX 3080 P48E | |
| MSI Stealth GS77 12UHS-083US | |
| Genomsnitt Intel Core i7-12700H, NVIDIA GeForce RTX 3080 Ti Laptop GPU (8956 - 12249, n=7) | |
| Asus ROG Zephyrus S17 GX703HSD | |
| MSI GS76 Stealth 11UH | |
| PCMark 10 Score | 7435 poäng | |
Hjälp | ||
| AIDA64 / Memory Copy | |
| MSI GE76 Raider | |
| Razer Blade 17 RTX 3080 Ti | |
| MSI Stealth GS77 12UHS-083US | |
| Genomsnitt Intel Core i7-12700H (25615 - 80511, n=64) | |
| AIDA64 / Memory Read | |
| Razer Blade 17 RTX 3080 Ti | |
| MSI GE76 Raider | |
| MSI Stealth GS77 12UHS-083US | |
| Genomsnitt Intel Core i7-12700H (25586 - 79442, n=64) | |
| AIDA64 / Memory Write | |
| Razer Blade 17 RTX 3080 Ti | |
| MSI Stealth GS77 12UHS-083US | |
| MSI GE76 Raider | |
| Genomsnitt Intel Core i7-12700H (23679 - 88660, n=64) | |
| AIDA64 / Memory Latency | |
| MSI Stealth GS77 12UHS-083US | |
| MSI GE76 Raider | |
| Genomsnitt Intel Core i7-12700H (76.2 - 133.9, n=62) | |
| Asus ROG Zephyrus S17 GX703HSD | |
| Alienware x17 RTX 3080 P48E | |
| Razer Blade 17 RTX 3080 Ti | |
* ... mindre är bättre
DPC-latenstid
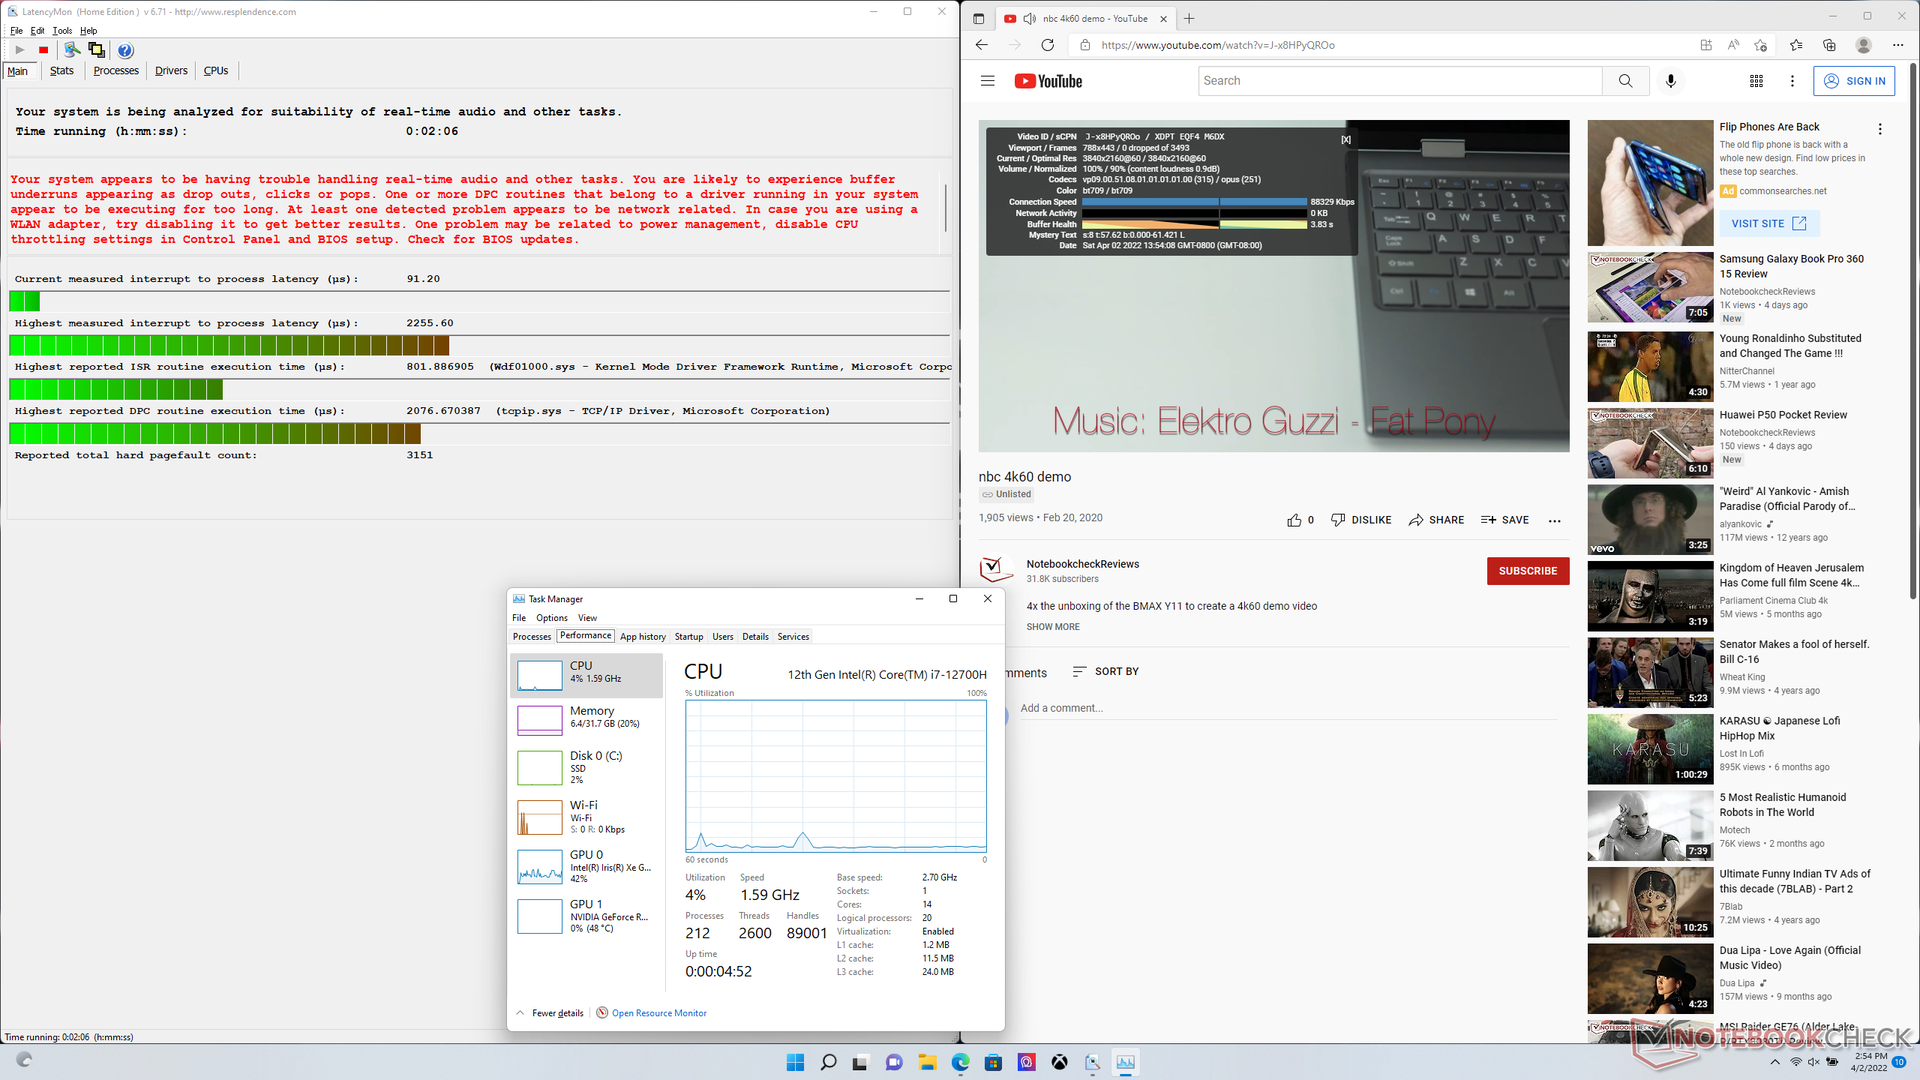
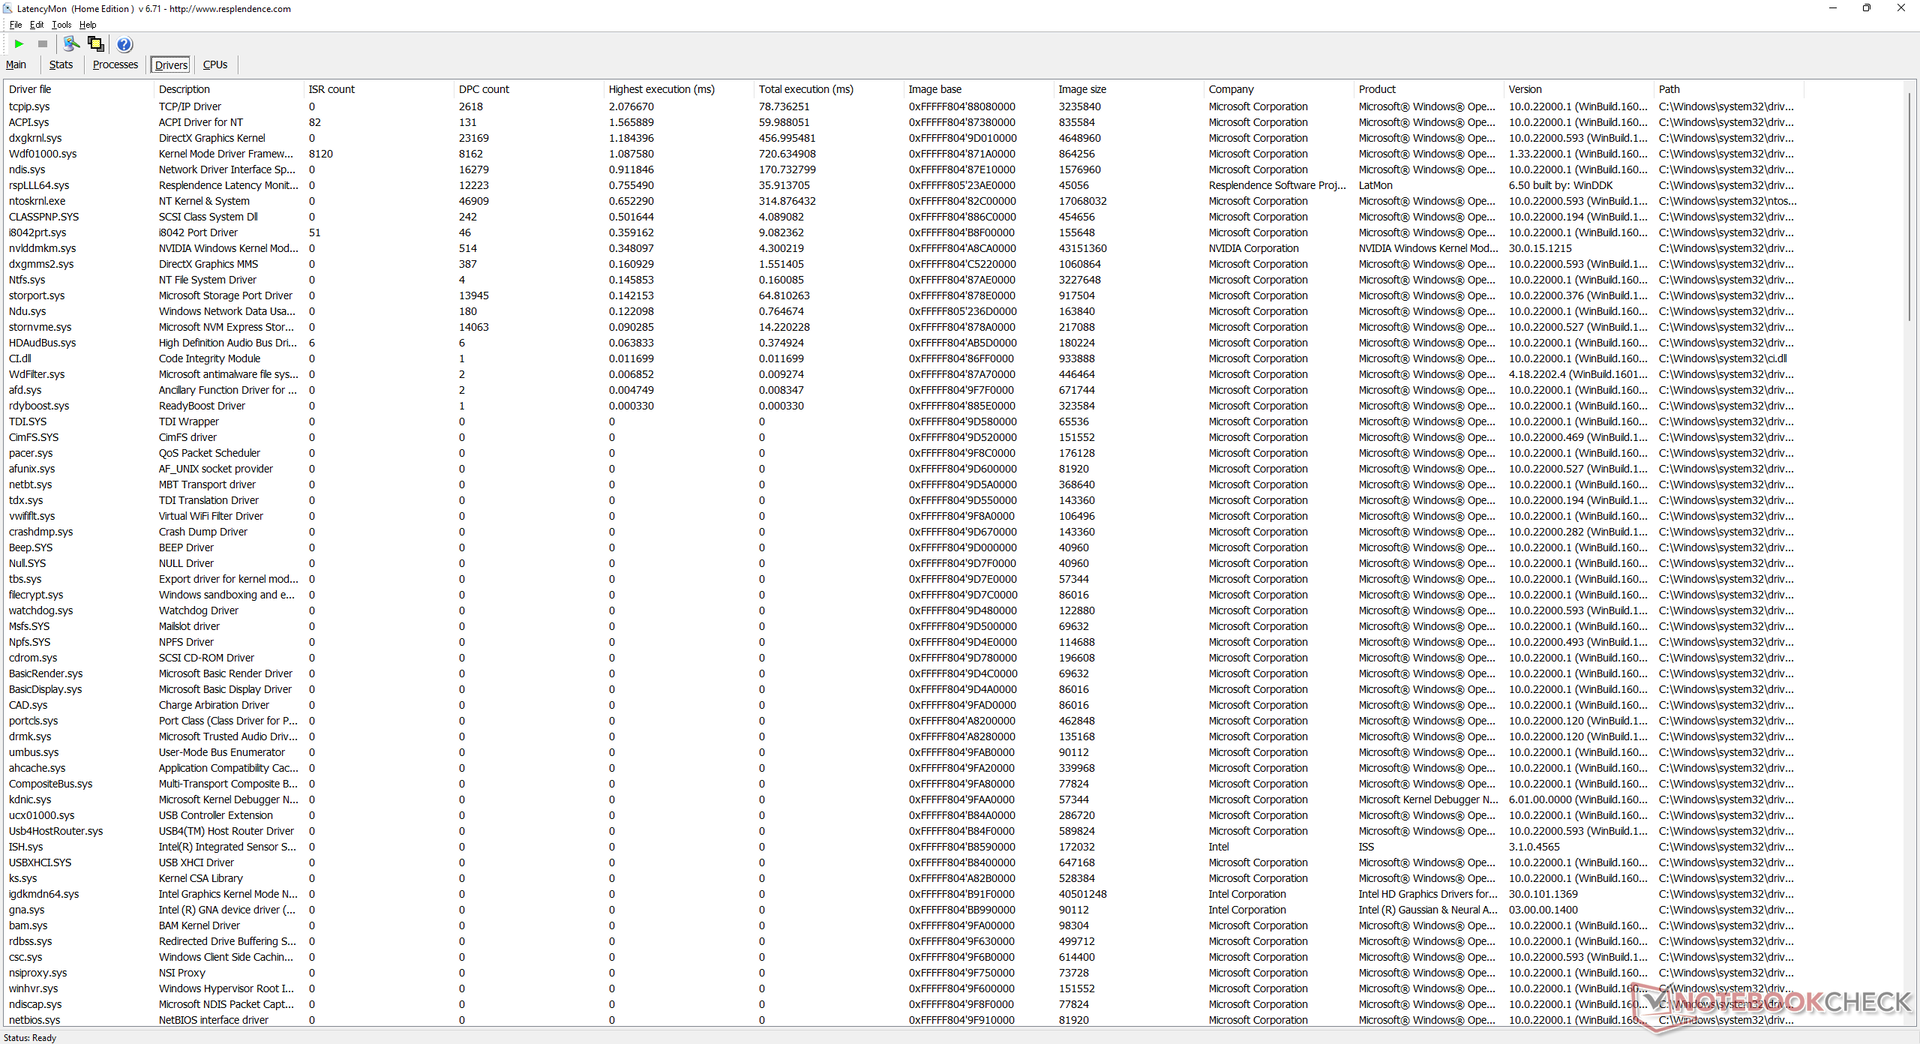
LatencyMon visar DPC-problem när man öppnar flera webbläsarflikar på vår hemsida. uppspelning av 4K-video vid 60 FPS är annars helt smidig och utan några tappade bilder under våra tester på iGPU:n.
| DPC Latencies / LatencyMon - interrupt to process latency (max), Web, Youtube, Prime95 | |
| Alienware x17 RTX 3080 P48E | |
| MSI Stealth GS77 12UHS-083US | |
| MSI GE76 Raider | |
| Asus ROG Zephyrus S17 GX703HSD | |
| Razer Blade 17 RTX 3080 Ti | |
| MSI GS76 Stealth 11UH | |
* ... mindre är bättre
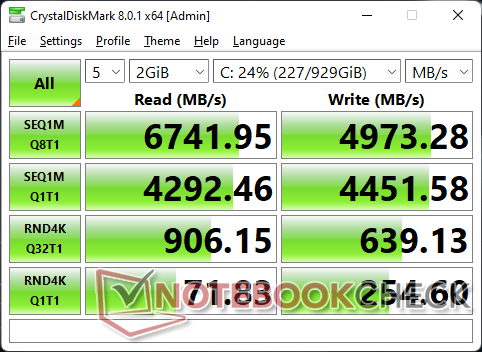
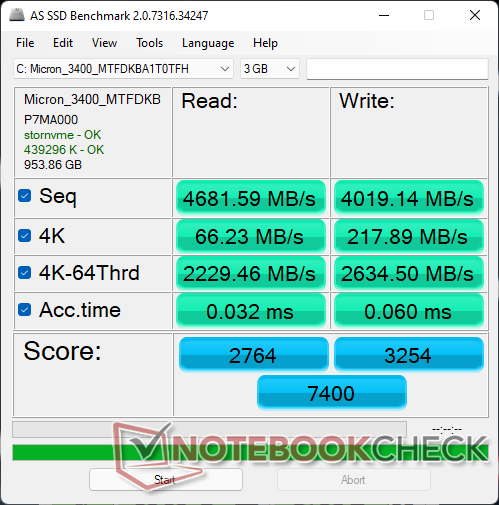
Lagringsenheter - upp till 2x PCIe4 x4 NVMe SSD-enheter
Vår testenhet levererades med en Micron 3400 PCIe4 x4 NVMe SSD. Även om det är en högklassig enhet verkar prestandan vara konsekvent långsammare än Samsung PM9A1 som är standard på de flesta bärbara speldatorer med flaggskepp. Hållbarheten i prestanda är ändå utmärkt när den utsätts för vårt DiskSpd-slingtest.

| Drive Performance rating - Percent | |
| Asus ROG Zephyrus S17 GX703HSD | |
| MSI GE76 Raider | |
| Razer Blade 17 RTX 3080 Ti | |
| MSI GS76 Stealth 11UH | |
| MSI Stealth GS77 12UHS-083US | |
| Alienware x17 RTX 3080 P48E | |
* ... mindre är bättre
Disk Throttling: DiskSpd Read Loop, Queue Depth 8
GPU-prestanda - Något snabbare än RTX 3080
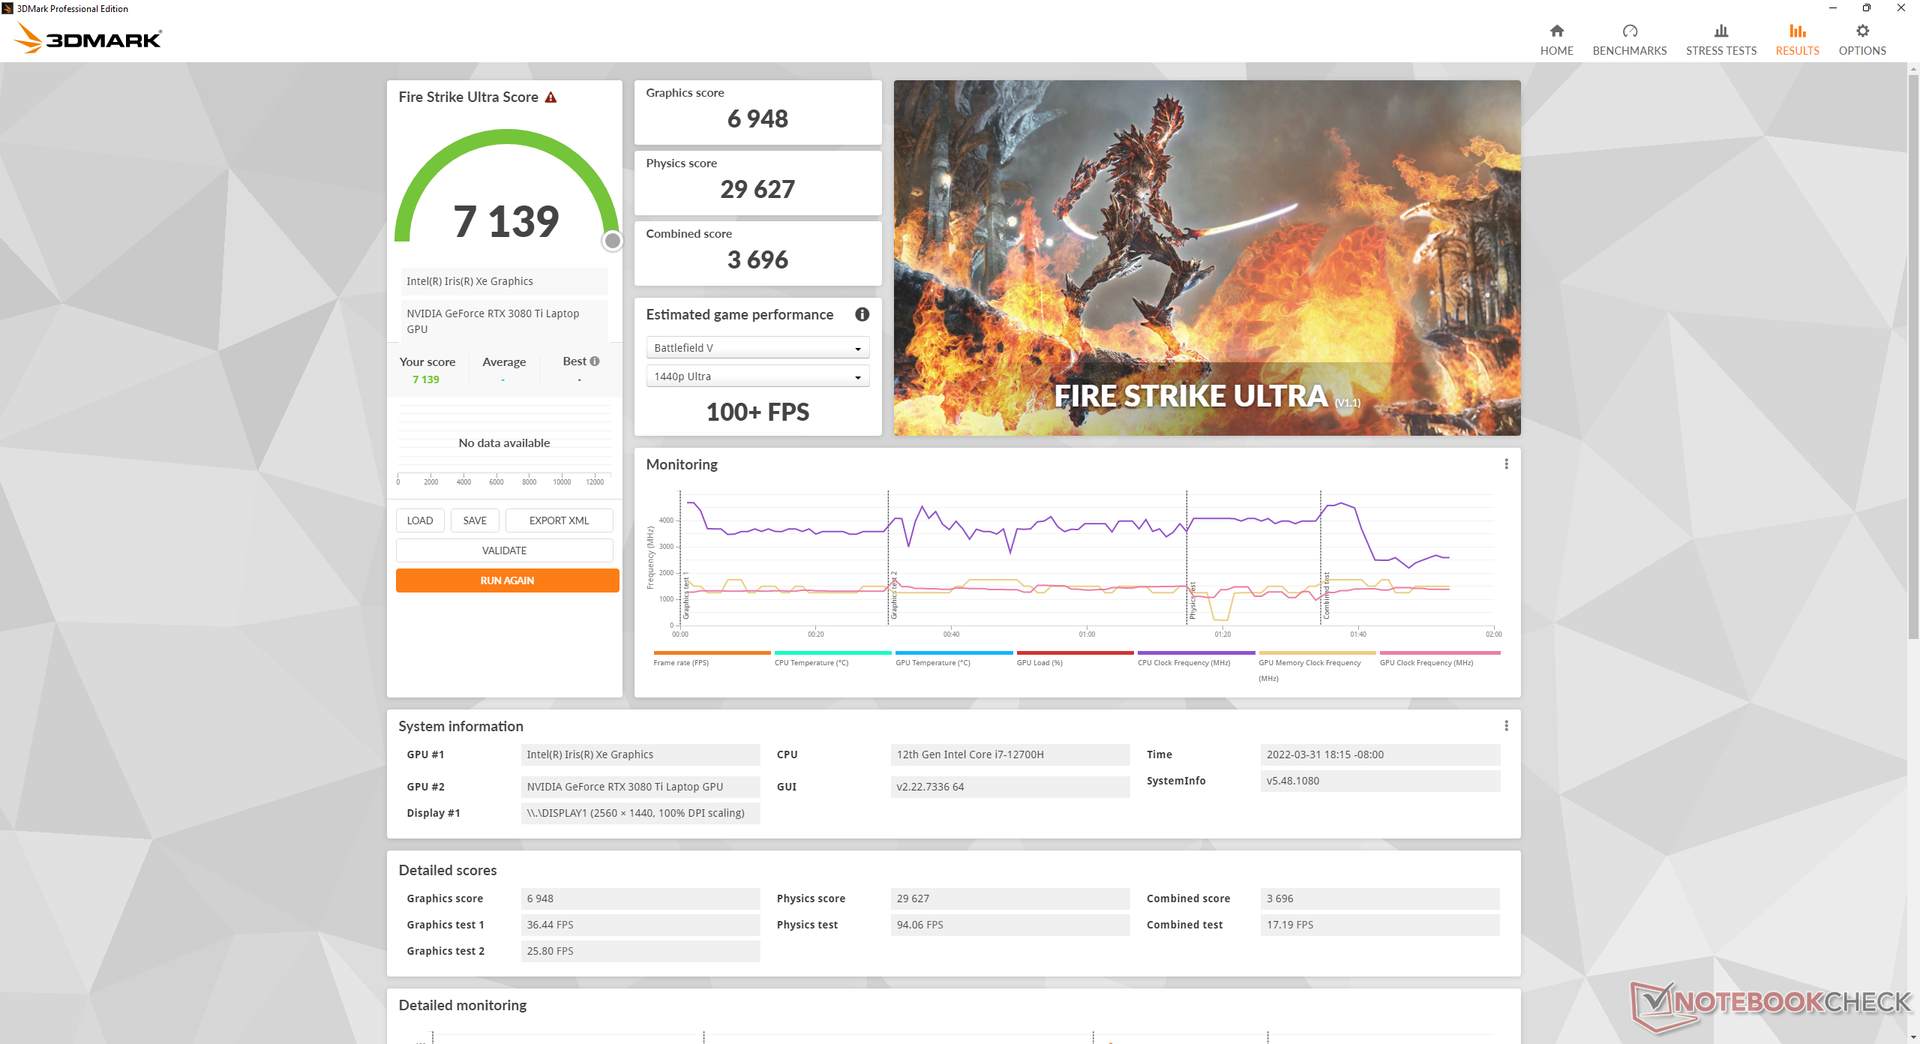
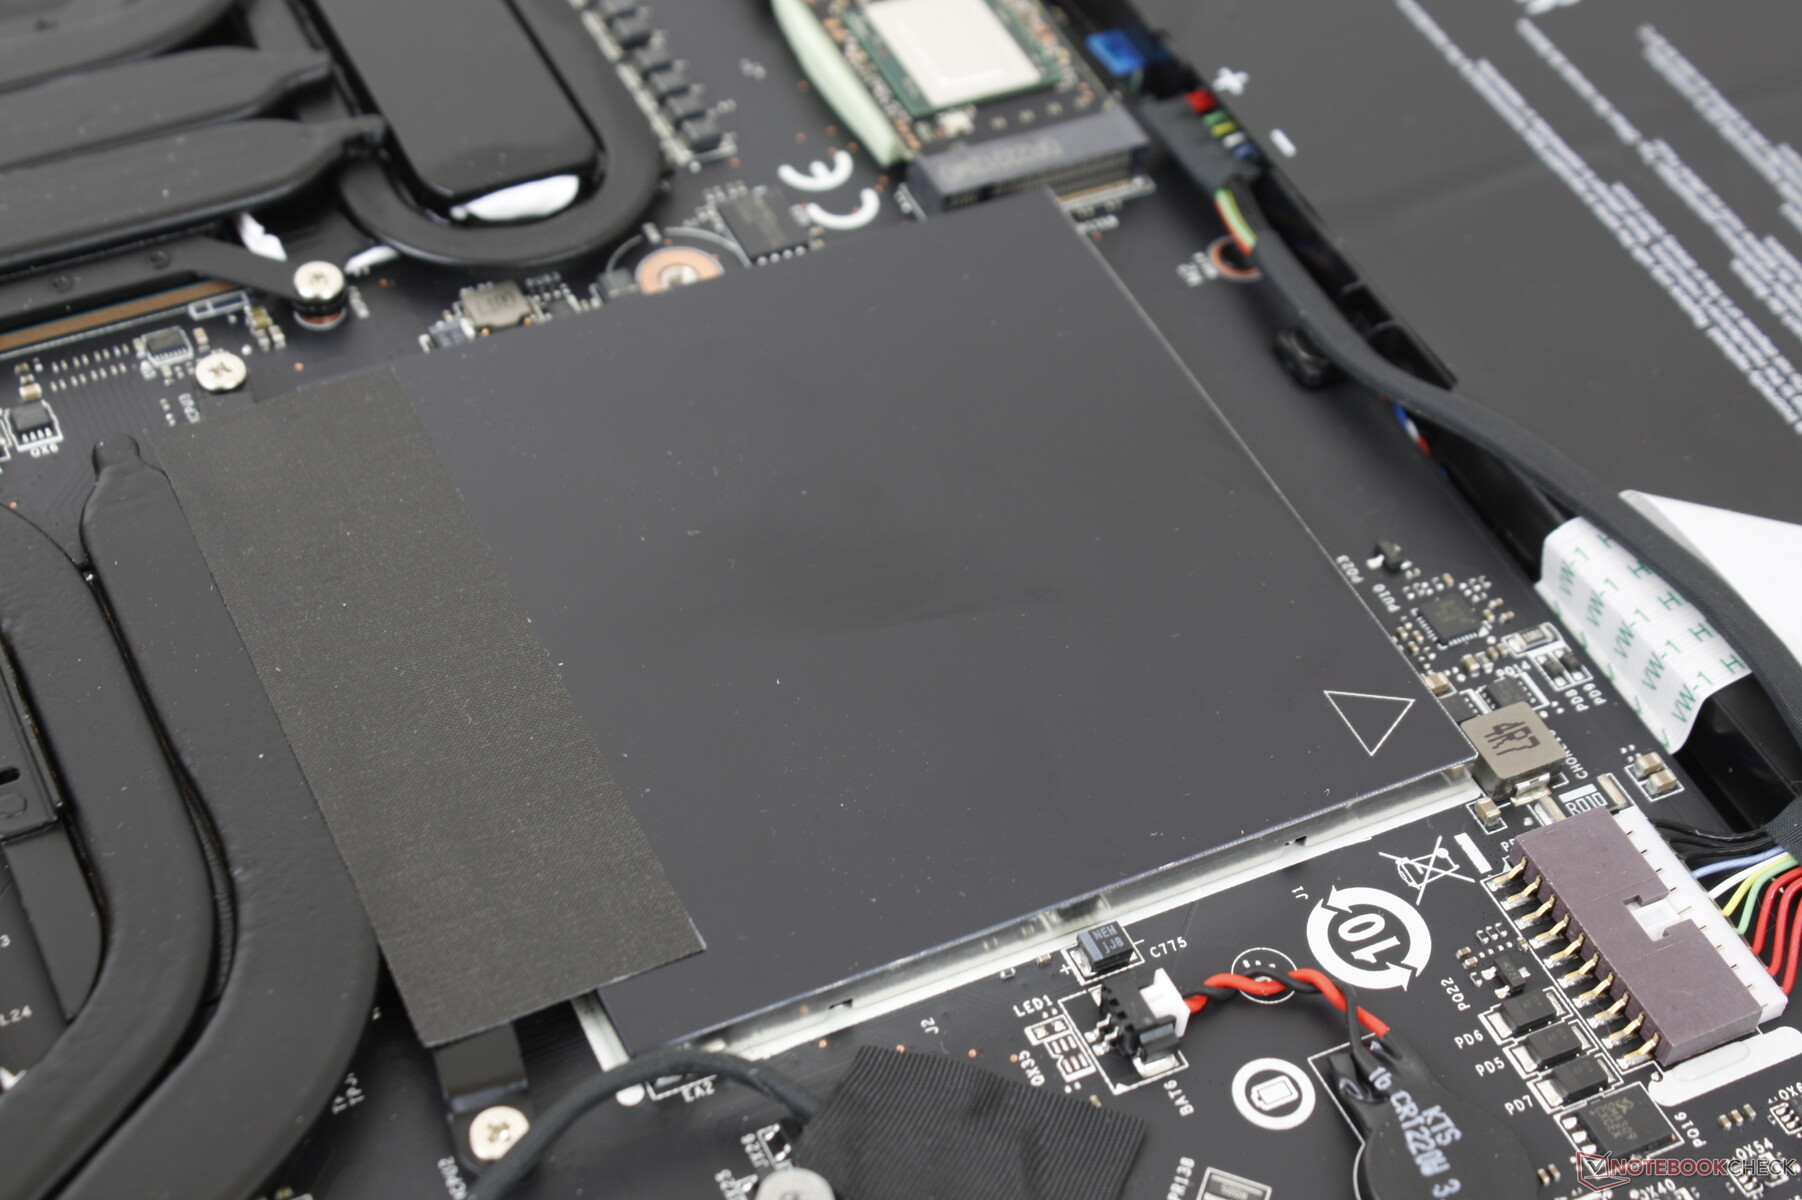
GeForce RTX 3080 Ti i GS77 ger en prestandaökning på 12 till 15 procent jämfört med RTX 3080 i förra årets GS76. Jämfört med 165 W RTX 3080 Ti i Blade 17 är dock vår 105 W RTX 3080 Ti cirka 13 till 18 procent långsammare. Det här prestandadeltat är mest synligt när man spelar i högre upplösningar där vår GS77 konsekvent skulle hamna bakom Razer-alternativet. Annars är prestandaskillnaden mellan ett 105 W RTX 3080 Ti och 165 W RTX 3080 Ti mycket mindre vid 1080p eller lägre upplösningar där titlar sannolikt är processorbundna.
Att köra GS77 på strömprofilen Balanced i stället för Extreme Performance minskar GPU-prestandan med cirka 12 procent.
skrivbord GeForce RTX 3080 Ti är fortfarande betydligt snabbare än vår mobilversion med cirka 65 till 80 procent.
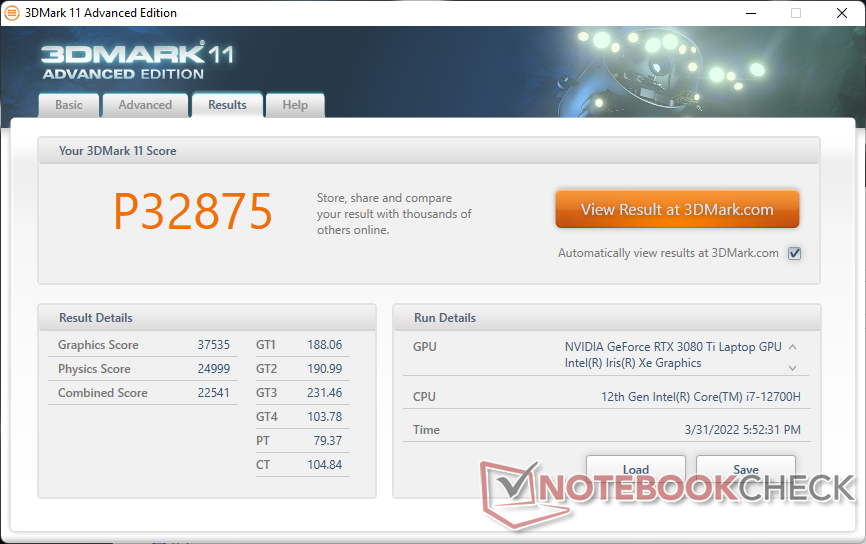
| 3DMark 11 - 1280x720 Performance GPU | |
| NVIDIA GeForce RTX 3080 Ti Founders Edition | |
| Razer Blade 17 RTX 3080 Ti | |
| Genomsnitt NVIDIA GeForce RTX 3080 Ti Laptop GPU (13920 - 45841, n=45) | |
| MSI Stealth GS77 12UHS-083US | |
| Razer Blade 17 RTX 3070 | |
| Alienware m17 R3 P45E | |
| MSI GS76 Stealth 11UH | |
| Asus TUF Gaming F17 FX706HM | |
| MSI GS75 10SF-609US | |
| Eluktronics RP-17 | |
| Asus ROG Strix G17 G713QE-RB74 | |
| Asus TUF A17 FA706IU-AS76 | |
| 3DMark 11 Performance | 32875 poäng | |
| 3DMark Cloud Gate Standard Score | 55980 poäng | |
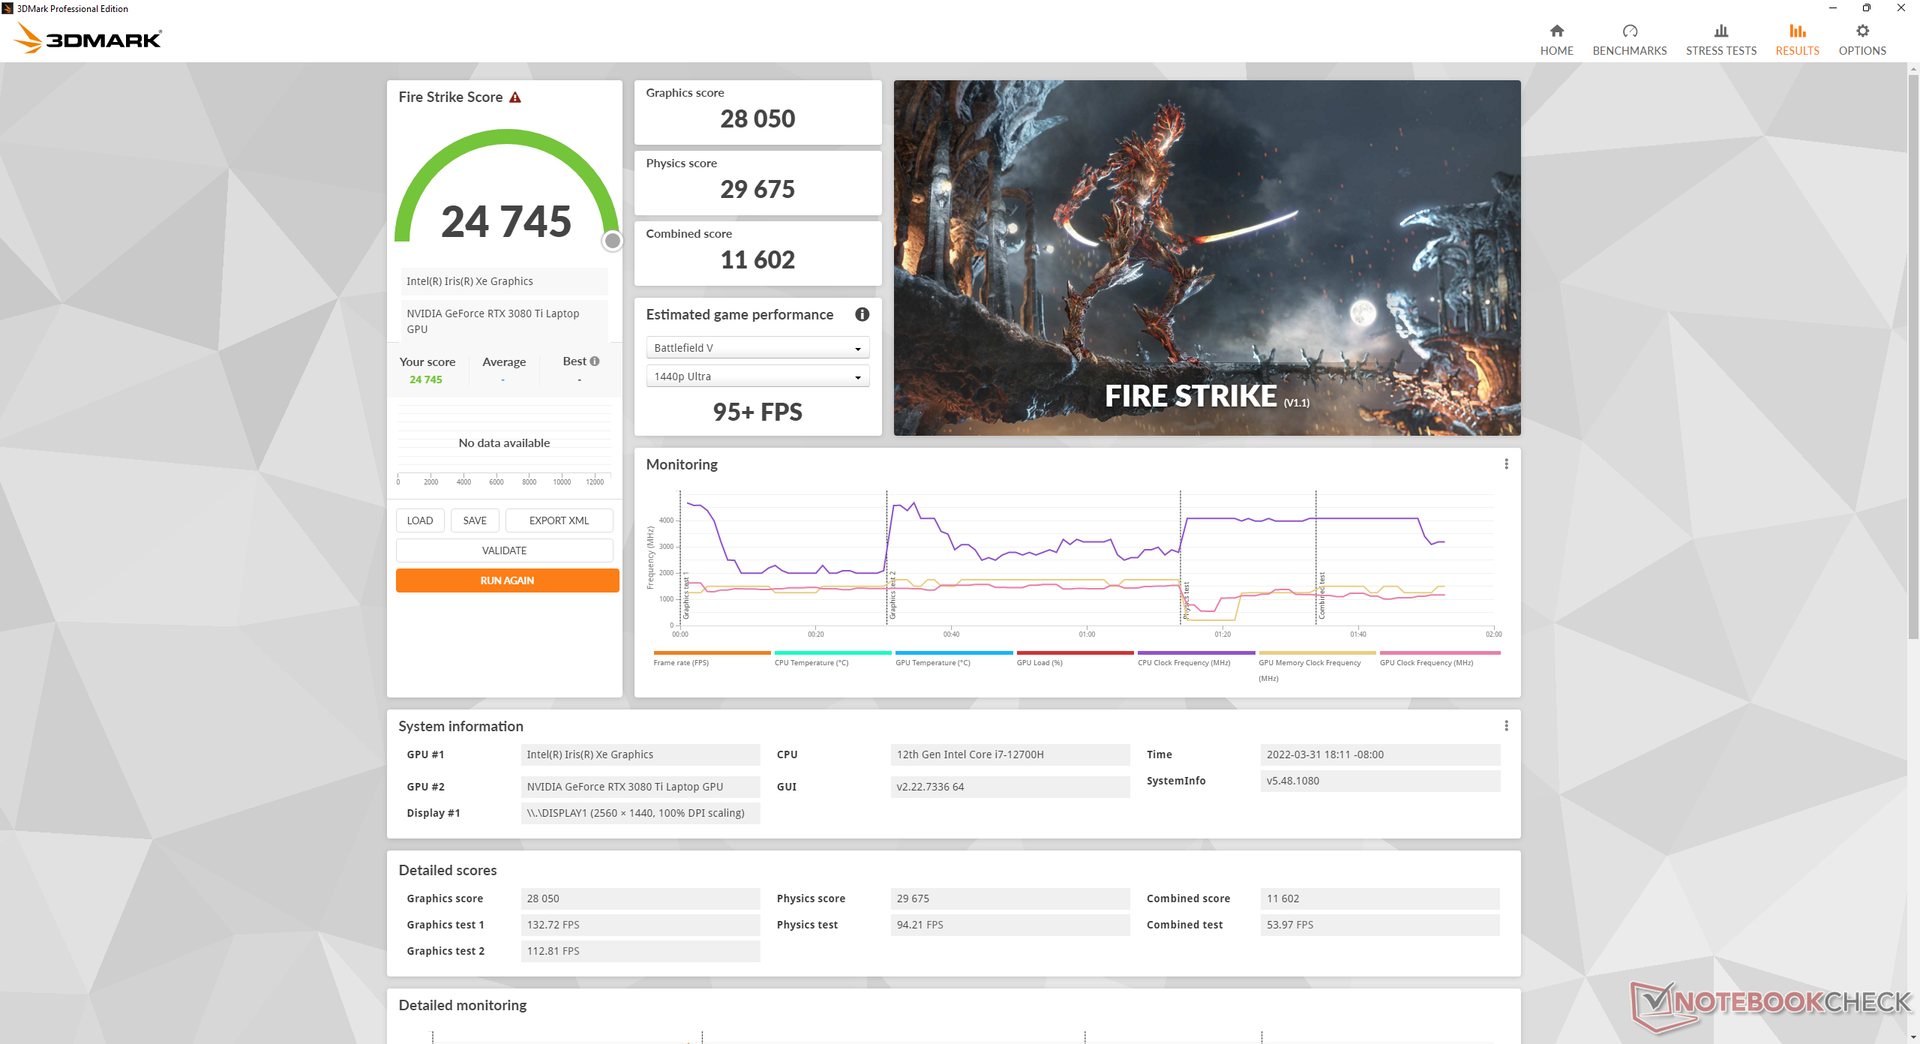
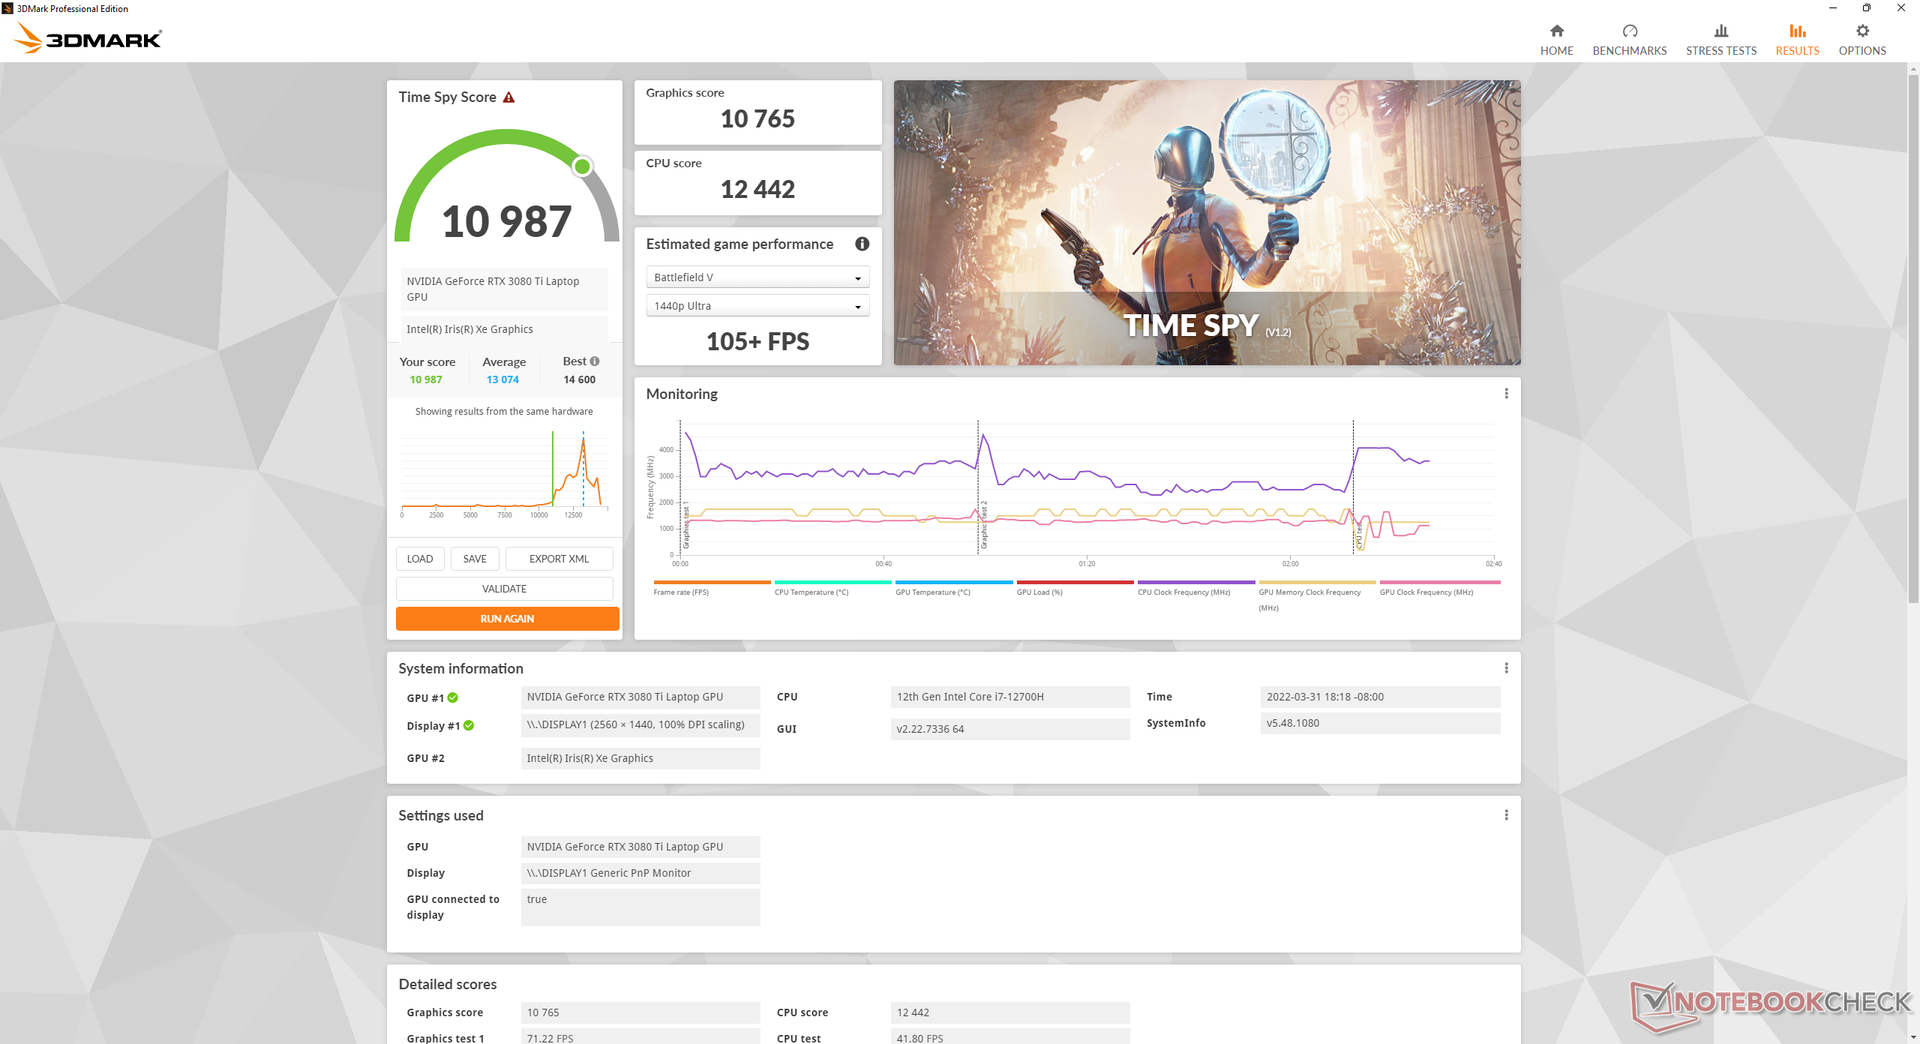
| 3DMark Fire Strike Score | 24745 poäng | |
| 3DMark Time Spy Score | 10987 poäng | |
Hjälp | ||
Witcher 3 FPS Chart
| låg | med. | hög | ultra | QHD | |
|---|---|---|---|---|---|
| GTA V (2015) | 186 | 185 | 175 | 113 | 94.2 |
| The Witcher 3 (2015) | 447.2 | 298.8 | 206.8 | 109.1 | |
| Dota 2 Reborn (2015) | 182 | 169 | 161 | 154 | |
| Final Fantasy XV Benchmark (2018) | 196 | 130 | 101 | 79.5 | |
| X-Plane 11.11 (2018) | 146 | 126 | 103 | ||
| Far Cry 5 (2018) | 190 | 145 | 136 | 129 | 101 |
| Strange Brigade (2018) | 447 | 239 | 196 | 177 | 126 |
| Cyberpunk 2077 1.6 (2022) | 133.2 | 113.6 | 92.9 | 92.8 | 49.7 |
Utsläpp
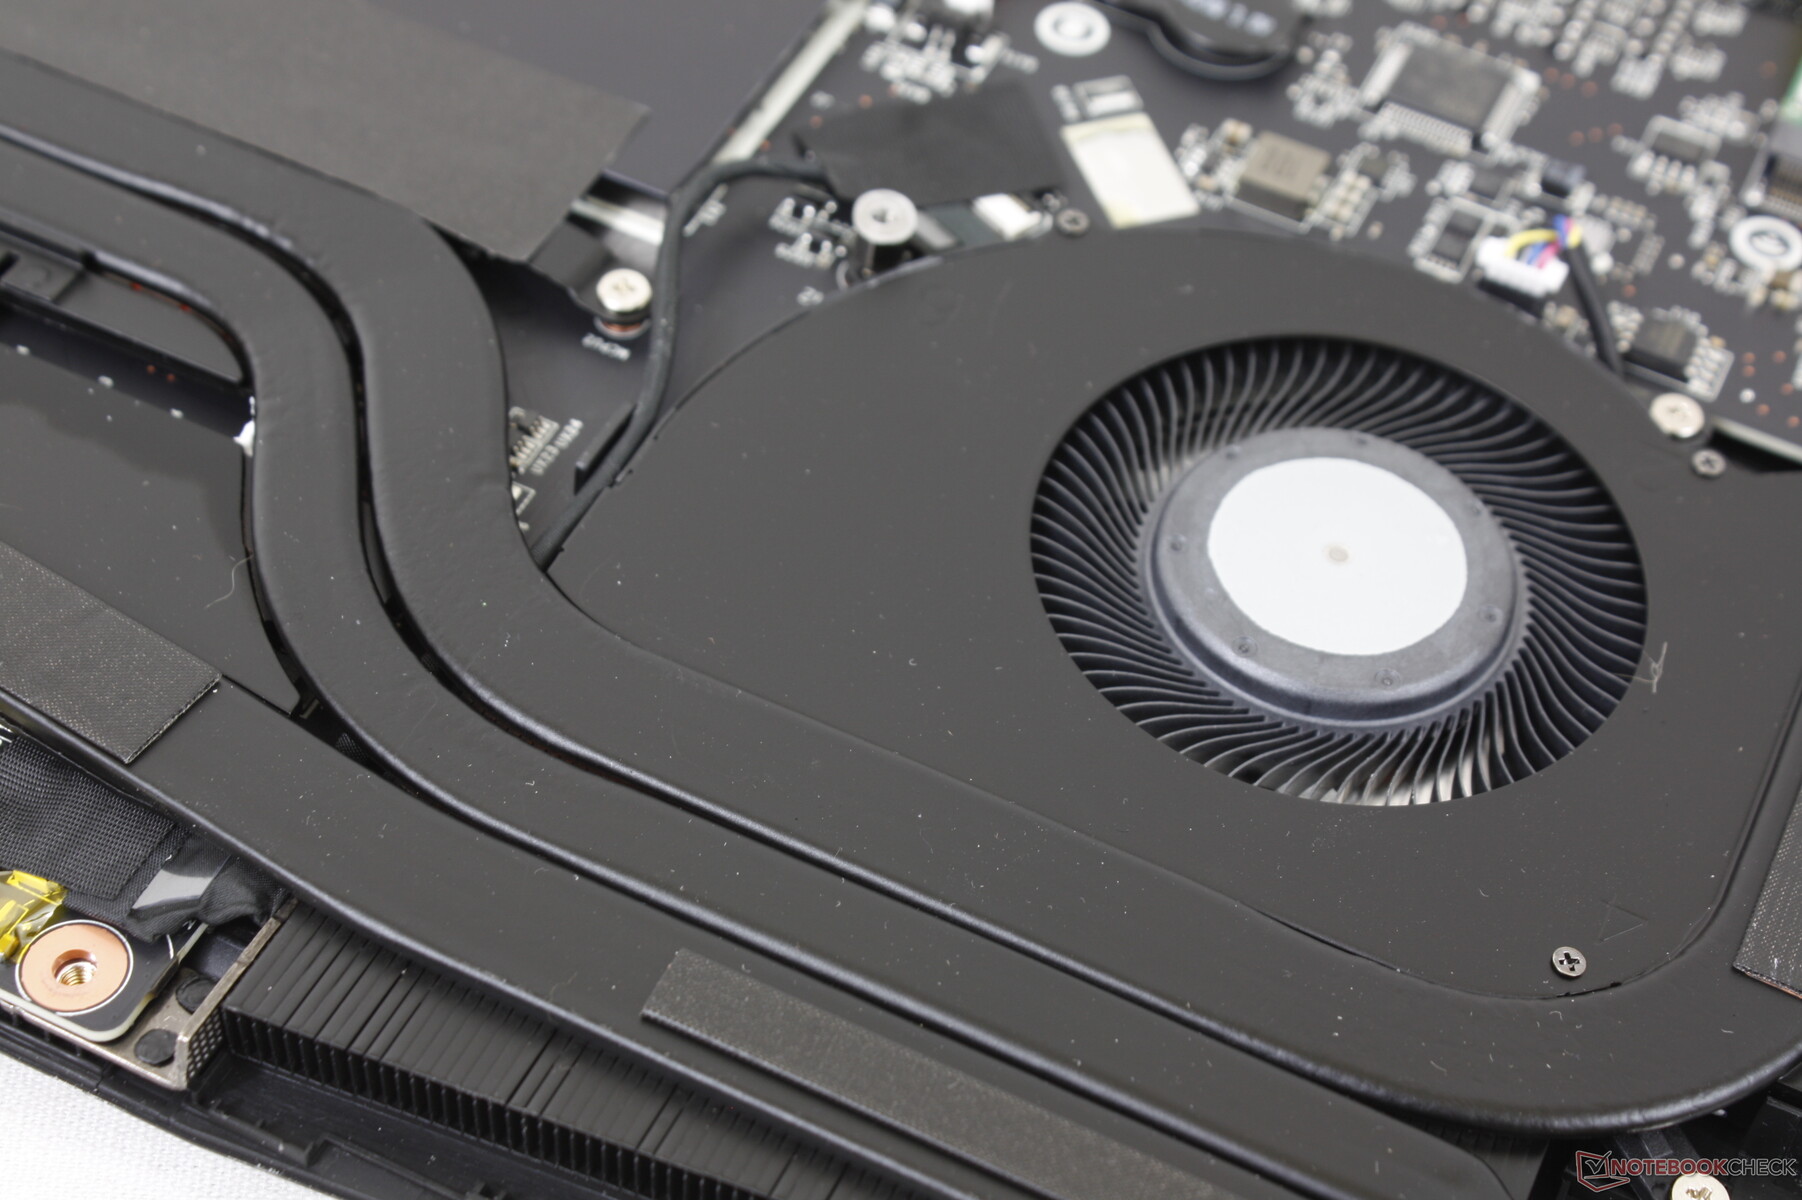
Systembuller - Inga fler trippelfläktar
De interna fläktarna gör ett bra jobb genom att vara tysta när de är inställda på batterispar- eller tyst läge. Fläktljudet kan ibland stiga till 31 dB(A) mot en tyst bakgrund på 24,5 dB(A) vid surfning eller videostreaming för att vara hörbart men inte störande
Fläktljud vid drift Witcher 3 i läget Extreme Performance är betydligt tystare än på Blade 17 (46 dB(A) jämfört med 51 dB(A)). Om läget Cooler Boost är aktiverat blir dock GS77 den bärbara datorn som låter mest med 57 dB(A). Lyckligtvis behövs inte Cooler Boost-läget för att få ut den bärbara datorns fulla prestanda
Om samma spelkörs i balanserat läge istället för i Extreme Performance-läget blir fläktljudet något tystare, 44,1 dB(A), men med en försämrad grafikprestanda på 12 procent, som tidigare nämnts. Användare som oroar sig för fläktljud kan överväga att spela på dessa lägre effektprofiler istället.

Ljudnivå
| Låg belastning |
| 24.5 / 24.5 / 30.8 dB(A) |
| Hög belastning |
| 34.6 / 56.8 dB(A) |
 | ||
30 dB tyst 40 dB(A) hörbar 50 dB(A) högt ljud |
||
min: | ||
| MSI Stealth GS77 12UHS-083US GeForce RTX 3080 Ti Laptop GPU, i7-12700H, Micron 3400 1TB MTFDKBA1T0TFH | MSI GS76 Stealth 11UH GeForce RTX 3080 Laptop GPU, i9-11900H, Samsung PM9A1 MZVL22T0HBLB | Razer Blade 17 RTX 3080 Ti GeForce RTX 3080 Ti Laptop GPU, i7-12800H, Samsung PM9A1 MZVL21T0HCLR | MSI GE76 Raider GeForce RTX 3080 Ti Laptop GPU, i9-12900HK, Samsung PM9A1 MZVL22T0HBLB | Alienware x17 RTX 3080 P48E GeForce RTX 3080 Laptop GPU, i7-11800H, 2x WDC PC SN730 SDBPNTY-1T00 (RAID 0) | Asus ROG Zephyrus S17 GX703HSD GeForce RTX 3080 Laptop GPU, i9-11900H, Samsung PM9A1 MZVL22T0HBLB | |
|---|---|---|---|---|---|---|
| Noise | -8% | 3% | -15% | 1% | 5% | |
| av / miljö * (dB) | 24.5 | 24 2% | 23.3 5% | 26 -6% | 24.9 -2% | 23 6% |
| Idle Minimum * (dB) | 24.5 | 24 2% | 23.3 5% | 26 -6% | 24.9 -2% | 23 6% |
| Idle Average * (dB) | 24.5 | 25 -2% | 23.3 5% | 27 -10% | 24.9 -2% | 23 6% |
| Idle Maximum * (dB) | 30.8 | 42 -36% | 26.3 15% | 40 -30% | 29.6 4% | 23 25% |
| Load Average * (dB) | 34.6 | 46 -33% | 38.2 -10% | 50 -45% | 31.1 10% | 41 -18% |
| Witcher 3 ultra * (dB) | 46.2 | 48 -4% | 50.9 -10% | 53 -15% | 49.7 -8% | 45 3% |
| Load Maximum * (dB) | 56.8 | 48 15% | 49.1 14% | 53 7% | 54.8 4% | 52 8% |
* ... mindre är bättre
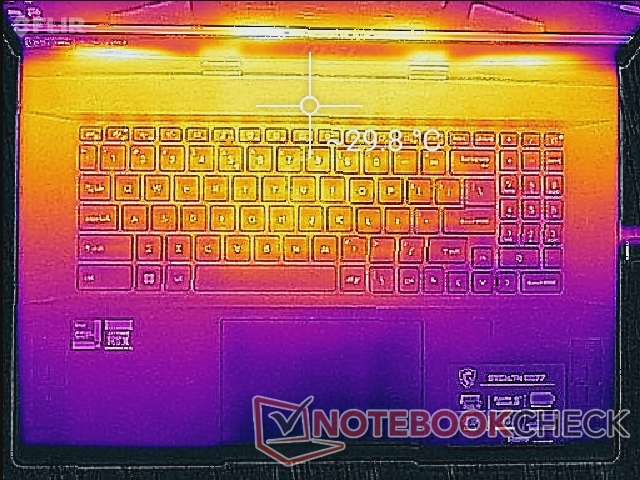
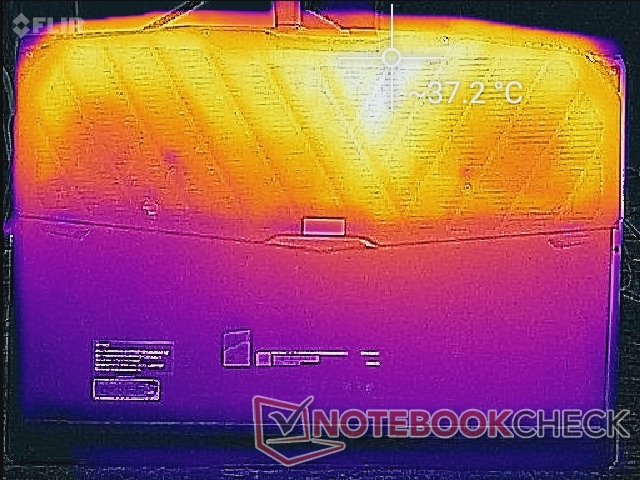
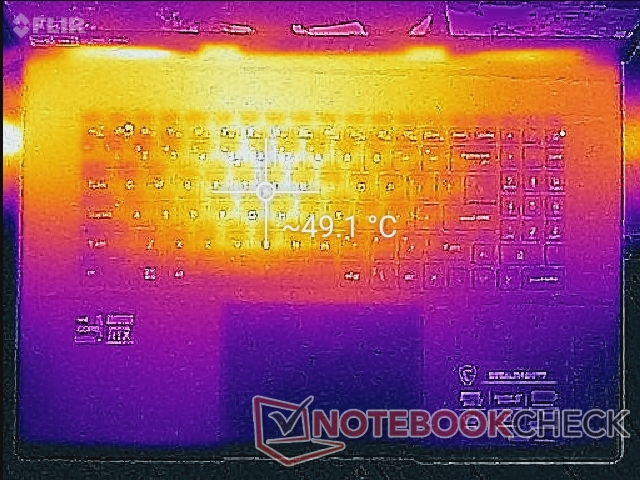
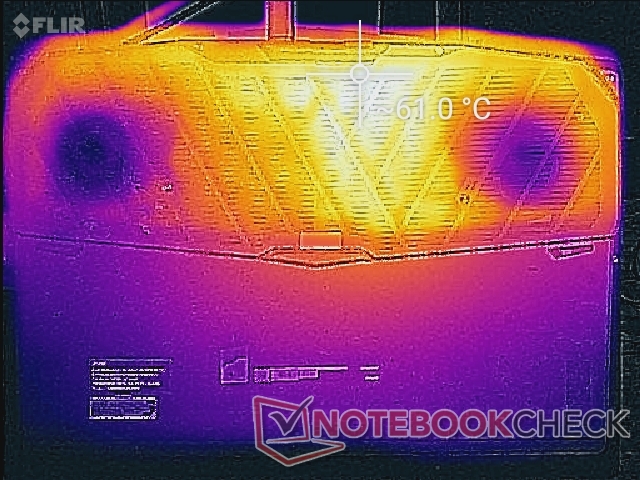
Temperatur
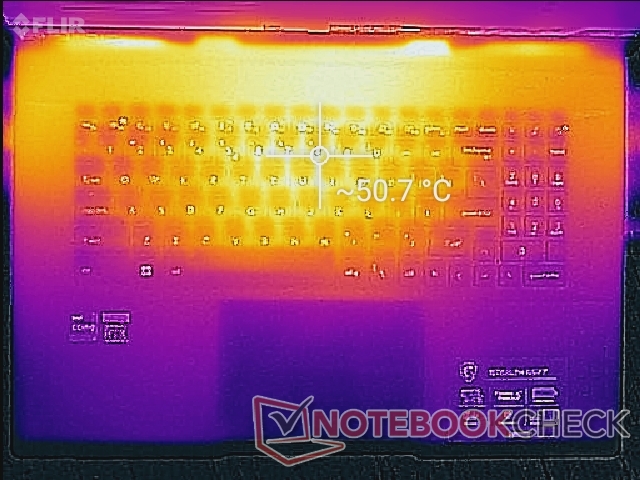
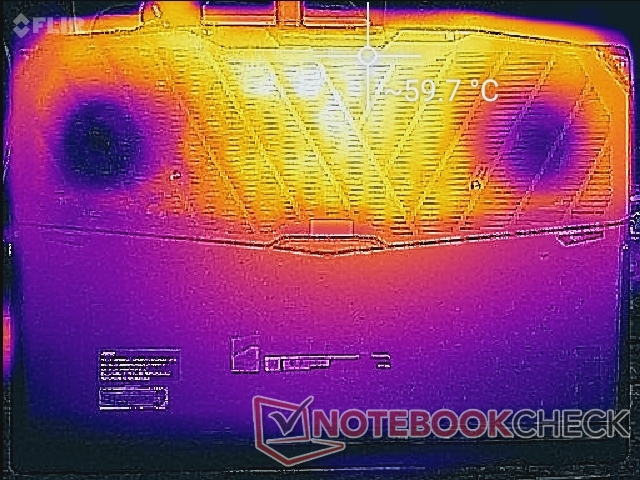
De varma punkterna på ytan när du spelar är ungefär samma som vi noterade på GS76, omkring 49 C nära tangentbordets mitt och 61 C på undersidan. Temperaturfördelningen är dock bättre på den nyare modellen, eftersom handflatorna nu är mycket svalare vid under 30 C jämfört med 35 C eller högre på GS76
Blade 17 har svalare WASD-tangenter än på GS77 eftersom Razer-modellen drar in kall luft från sina WASD-tangenter. Detta kan ses när man jämför temperaturkartorna mellan GS77 och Blade 17.
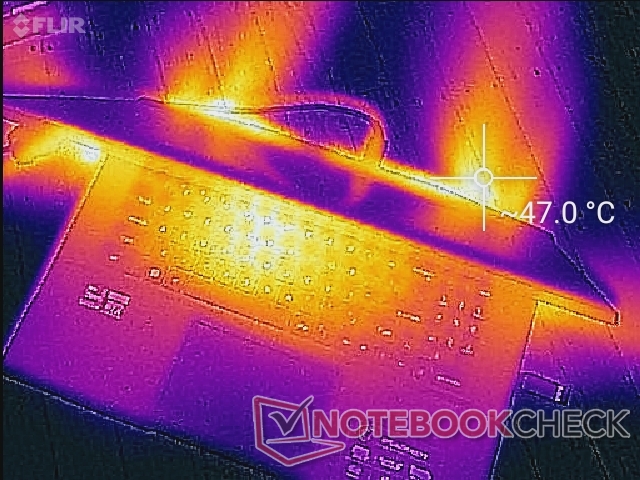
(-) Den maximala temperaturen på ovansidan är 50.6 °C / 123 F, jämfört med genomsnittet av 40.4 °C / 105 F , allt från 21.2 till 68.8 °C för klassen Gaming.
(-) Botten värms upp till maximalt 59.6 °C / 139 F, jämfört med genomsnittet av 43.2 °C / 110 F
(+) Vid tomgångsbruk är medeltemperaturen för ovansidan 26.9 °C / 80 F, jämfört med enhetsgenomsnittet på 33.9 °C / ### class_avg_f### F.
(±) När du spelar The Witcher 3 är medeltemperaturen för ovansidan 36.2 °C / 97 F, jämfört med enhetsgenomsnittet på 33.9 °C / ## #class_avg_f### F.
(+) Handledsstöden och pekplattan är kallare än hudtemperaturen med maximalt 30 °C / 86 F och är därför svala att ta på.
(±) Medeltemperaturen för handledsstödsområdet på liknande enheter var 28.8 °C / 83.8 F (-1.2 °C / -2.2 F).
| MSI Stealth GS77 12UHS-083US Intel Core i7-12700H, NVIDIA GeForce RTX 3080 Ti Laptop GPU | MSI GS76 Stealth 11UH Intel Core i9-11900H, NVIDIA GeForce RTX 3080 Laptop GPU | Razer Blade 17 RTX 3080 Ti Intel Core i7-12800H, NVIDIA GeForce RTX 3080 Ti Laptop GPU | MSI GE76 Raider Intel Core i9-12900HK, NVIDIA GeForce RTX 3080 Ti Laptop GPU | Alienware x17 RTX 3080 P48E Intel Core i7-11800H, NVIDIA GeForce RTX 3080 Laptop GPU | Asus ROG Zephyrus S17 GX703HSD Intel Core i9-11900H, NVIDIA GeForce RTX 3080 Laptop GPU | |
|---|---|---|---|---|---|---|
| Heat | 9% | 2% | 7% | -1% | -4% | |
| Maximum Upper Side * (°C) | 50.6 | 49 3% | 46 9% | 43 15% | 58.4 -15% | 59 -17% |
| Maximum Bottom * (°C) | 59.6 | 57 4% | 46.8 21% | 47 21% | 49 18% | 53 11% |
| Idle Upper Side * (°C) | 30 | 28 7% | 36.2 -21% | 33 -10% | 33.6 -12% | 35 -17% |
| Idle Bottom * (°C) | 37.4 | 30 20% | 38.6 -3% | 37 1% | 34.6 7% | 35 6% |
* ... mindre är bättre
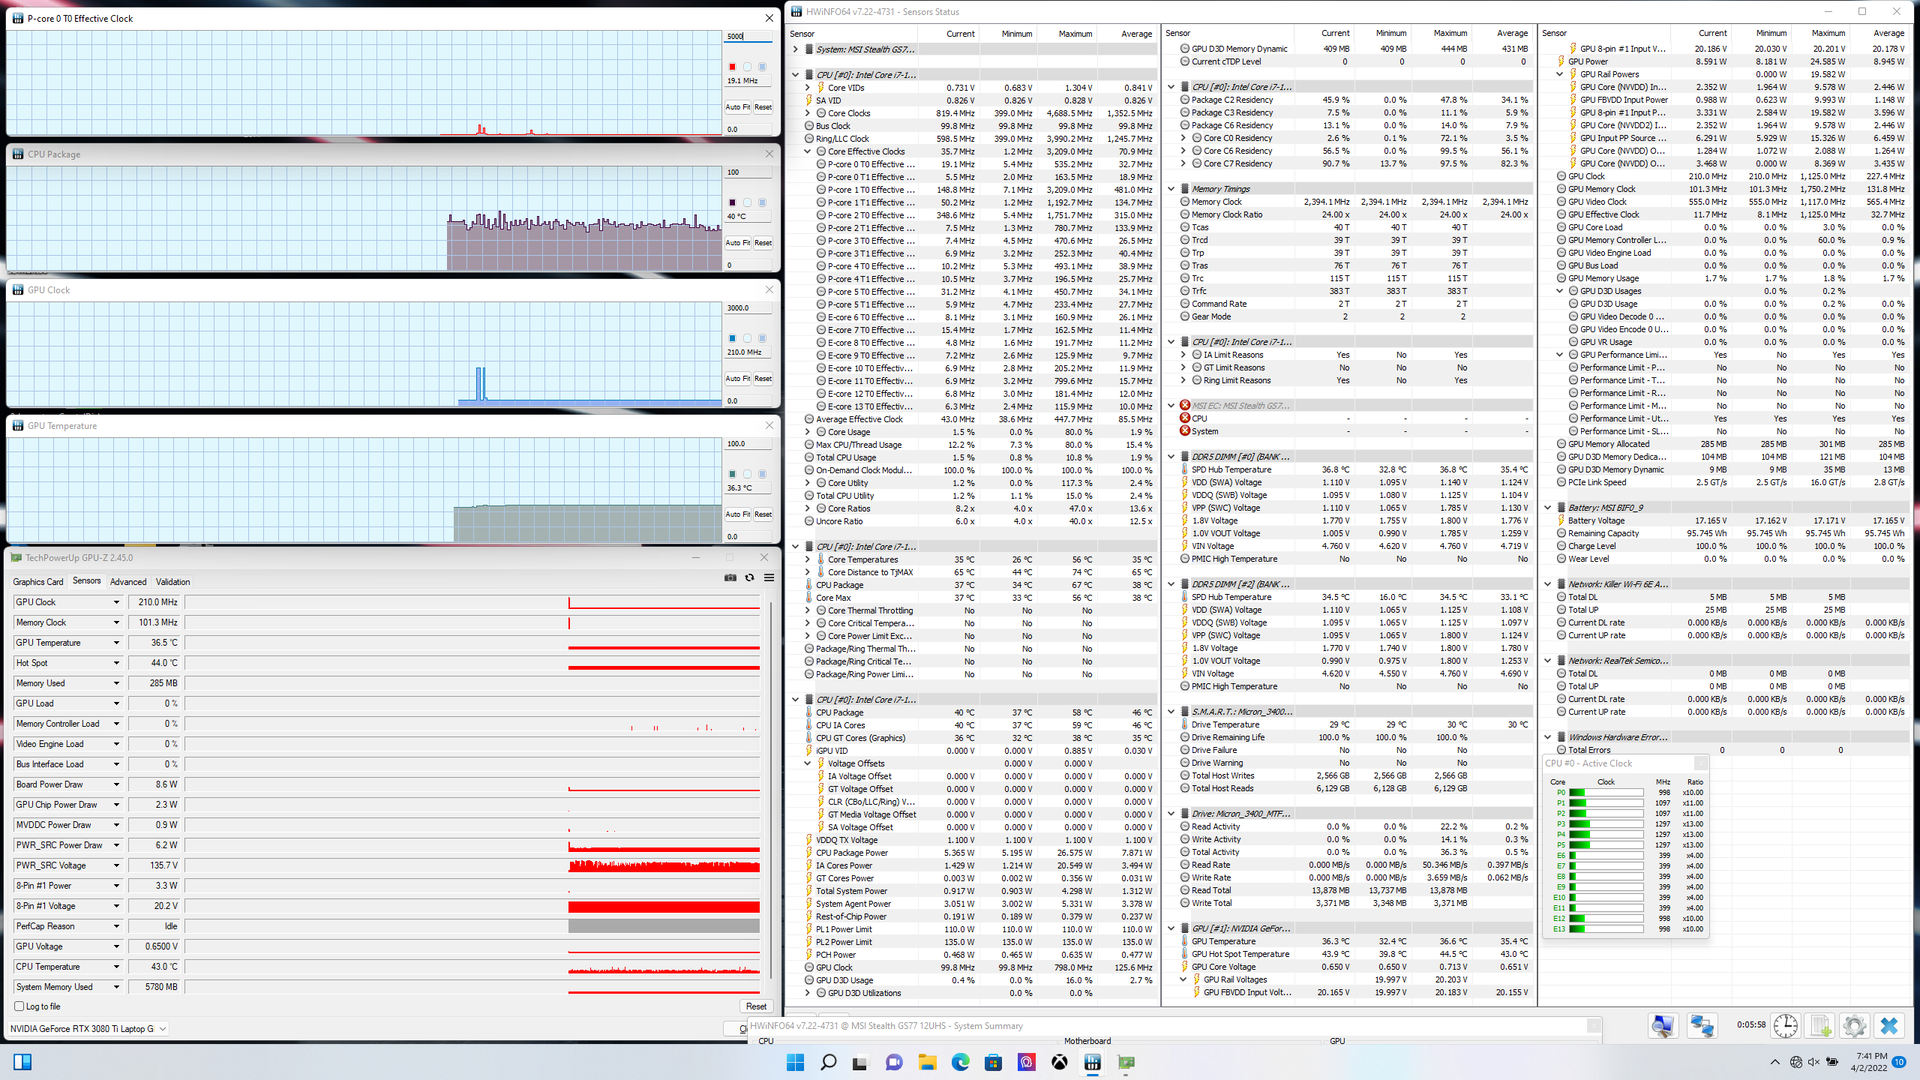
Stresstest
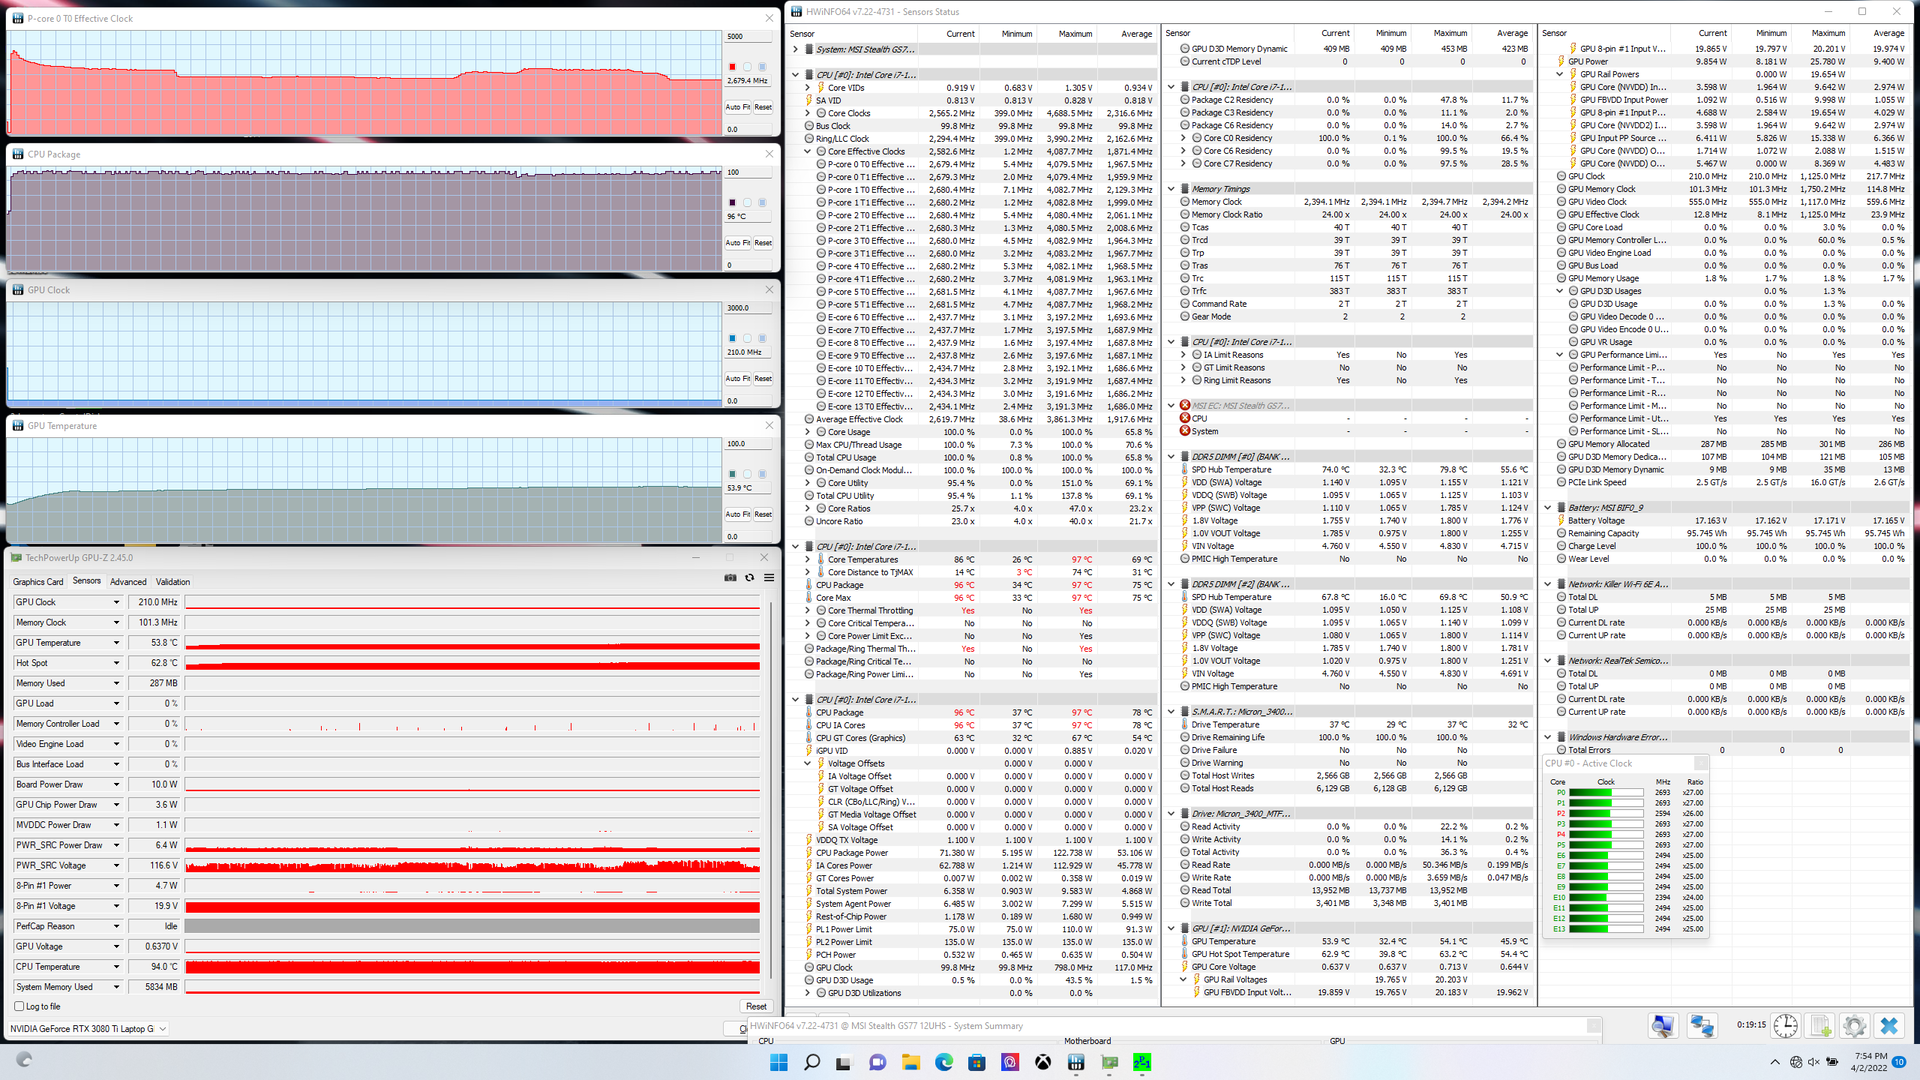
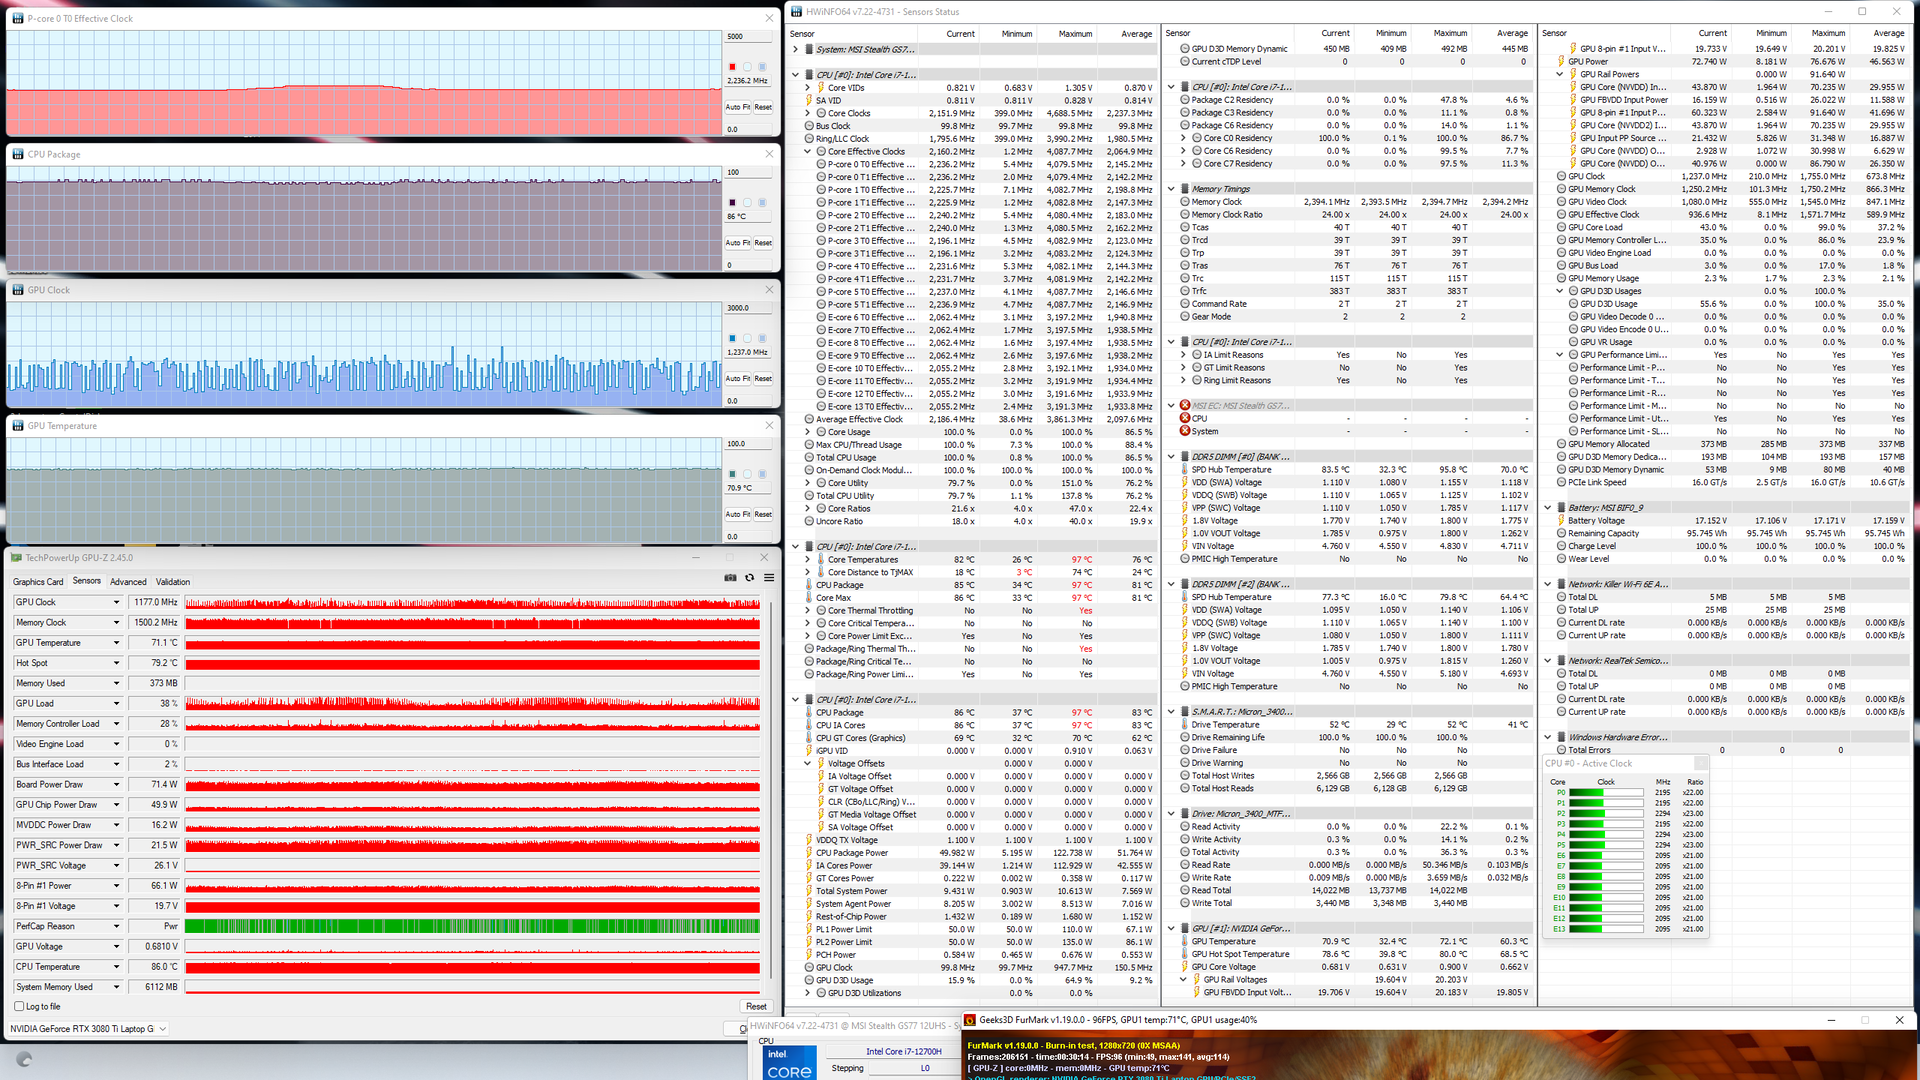
När Prime95 kördes för att stressa processorn ökade klockfrekvensen och kärntemperaturen till 4 GHz och 95 C under de första sekunderna innan den stabiliserades i intervallet 2,7-3 GHz för att förhindra att processorn blev varmare. Som jämförelse skulle Core i7-12800H i Blade 17 gå långsammare och svalare vid 2,4 till 2,6 GHz respektive 71 C när den utsattes för liknande Prime95-förhållanden. MSI pressar alltså sin CPU mycket varmare för att maximera processorns prestanda. CPU-paketeffekten på GS77 skulle vara så hög som 122,7 W under början av testet innan den stabiliserades på cirka 71 W, vilket återigen är högre än de 61 W som vi registrerade på Razer.
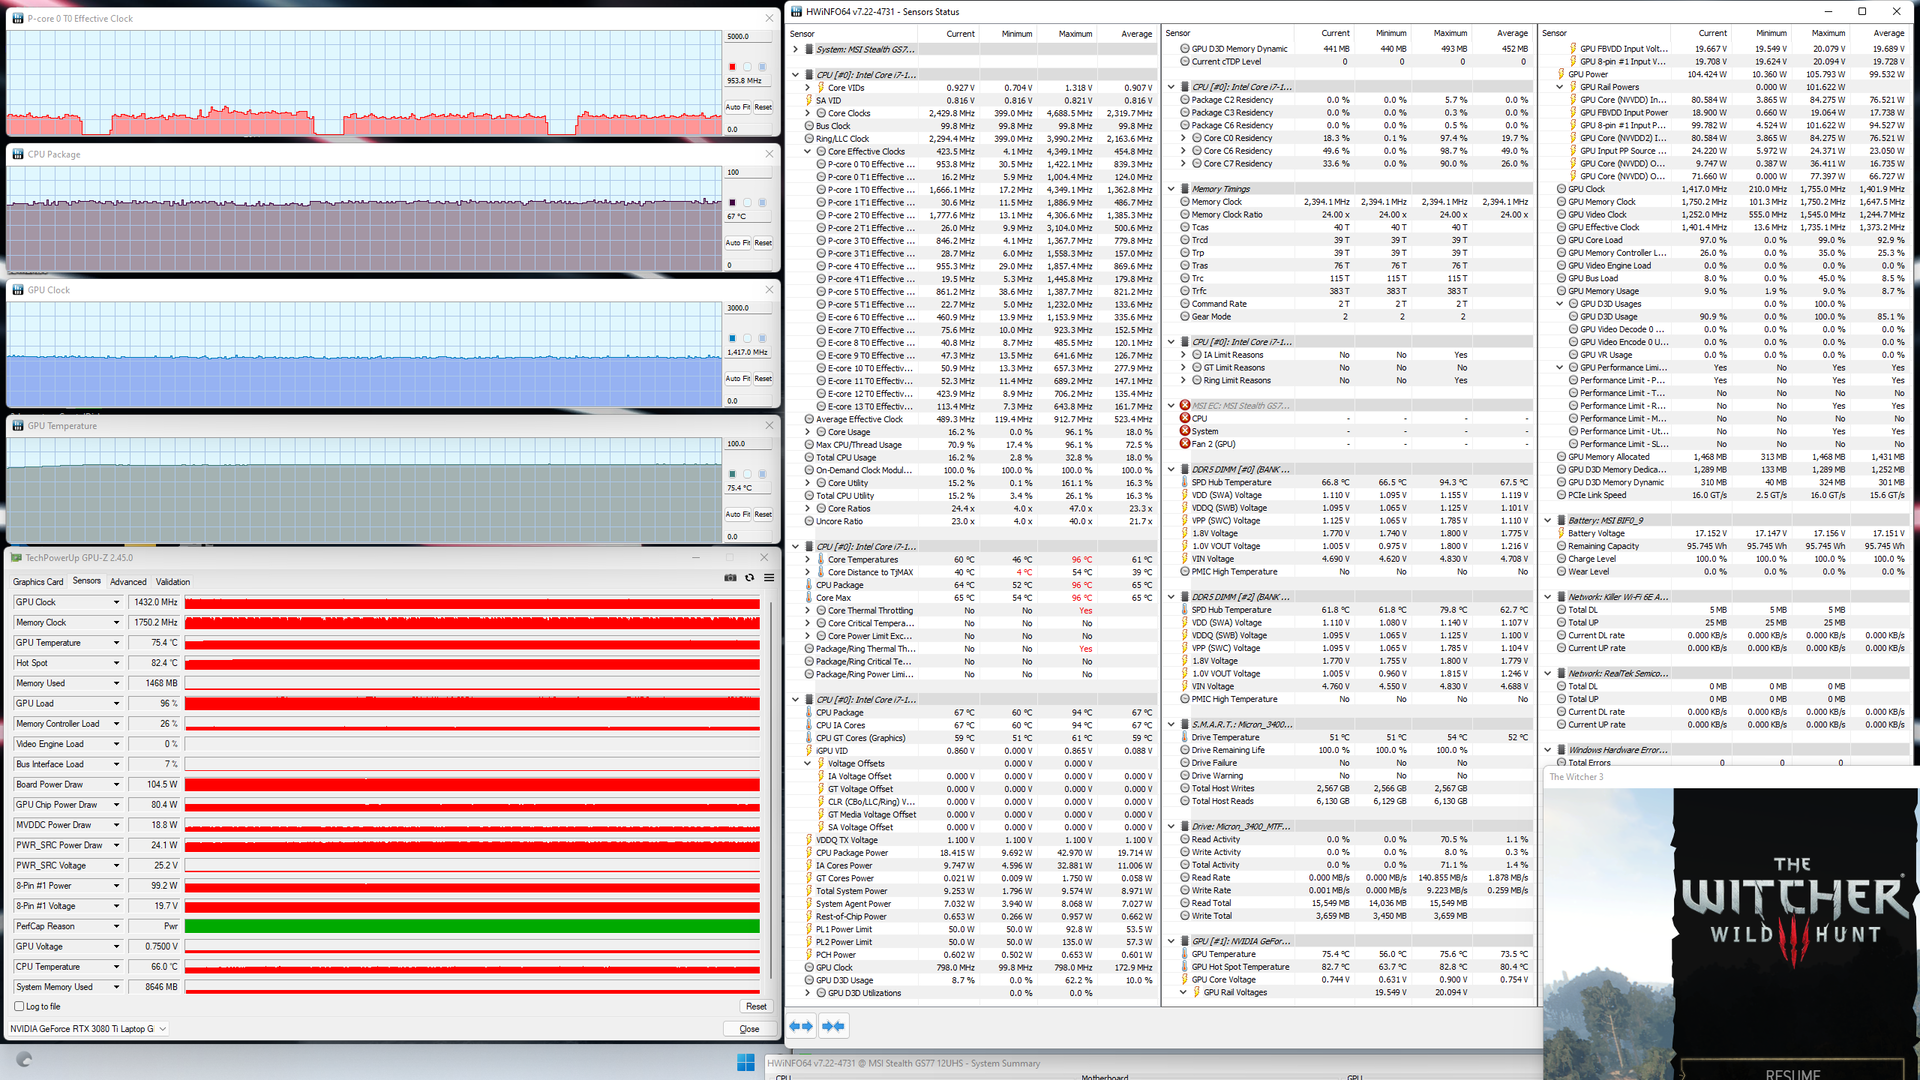
GPU-klockan, minnesklockan och temperaturen skulle stabiliseras vid 1432 MHz, 1750 MHz respektive 75 C när man kör Witcher 3. Samma test på Blade 17 skulle resultera i en GPU-klocka, minnesklocka och temperatur på 1597 MHz, 2000 MHz respektive 77 C. Den snabbare GPU-prestandan hos Razer kan till största delen tillskrivas dess mycket högre TGP-mål jämfört med vår MSI (165 W jämfört med 105 W). GPU-Z registrerade faktiskt en konsekvent strömförbrukning från GPU-kortet på 104,5 W när spelet kördes.
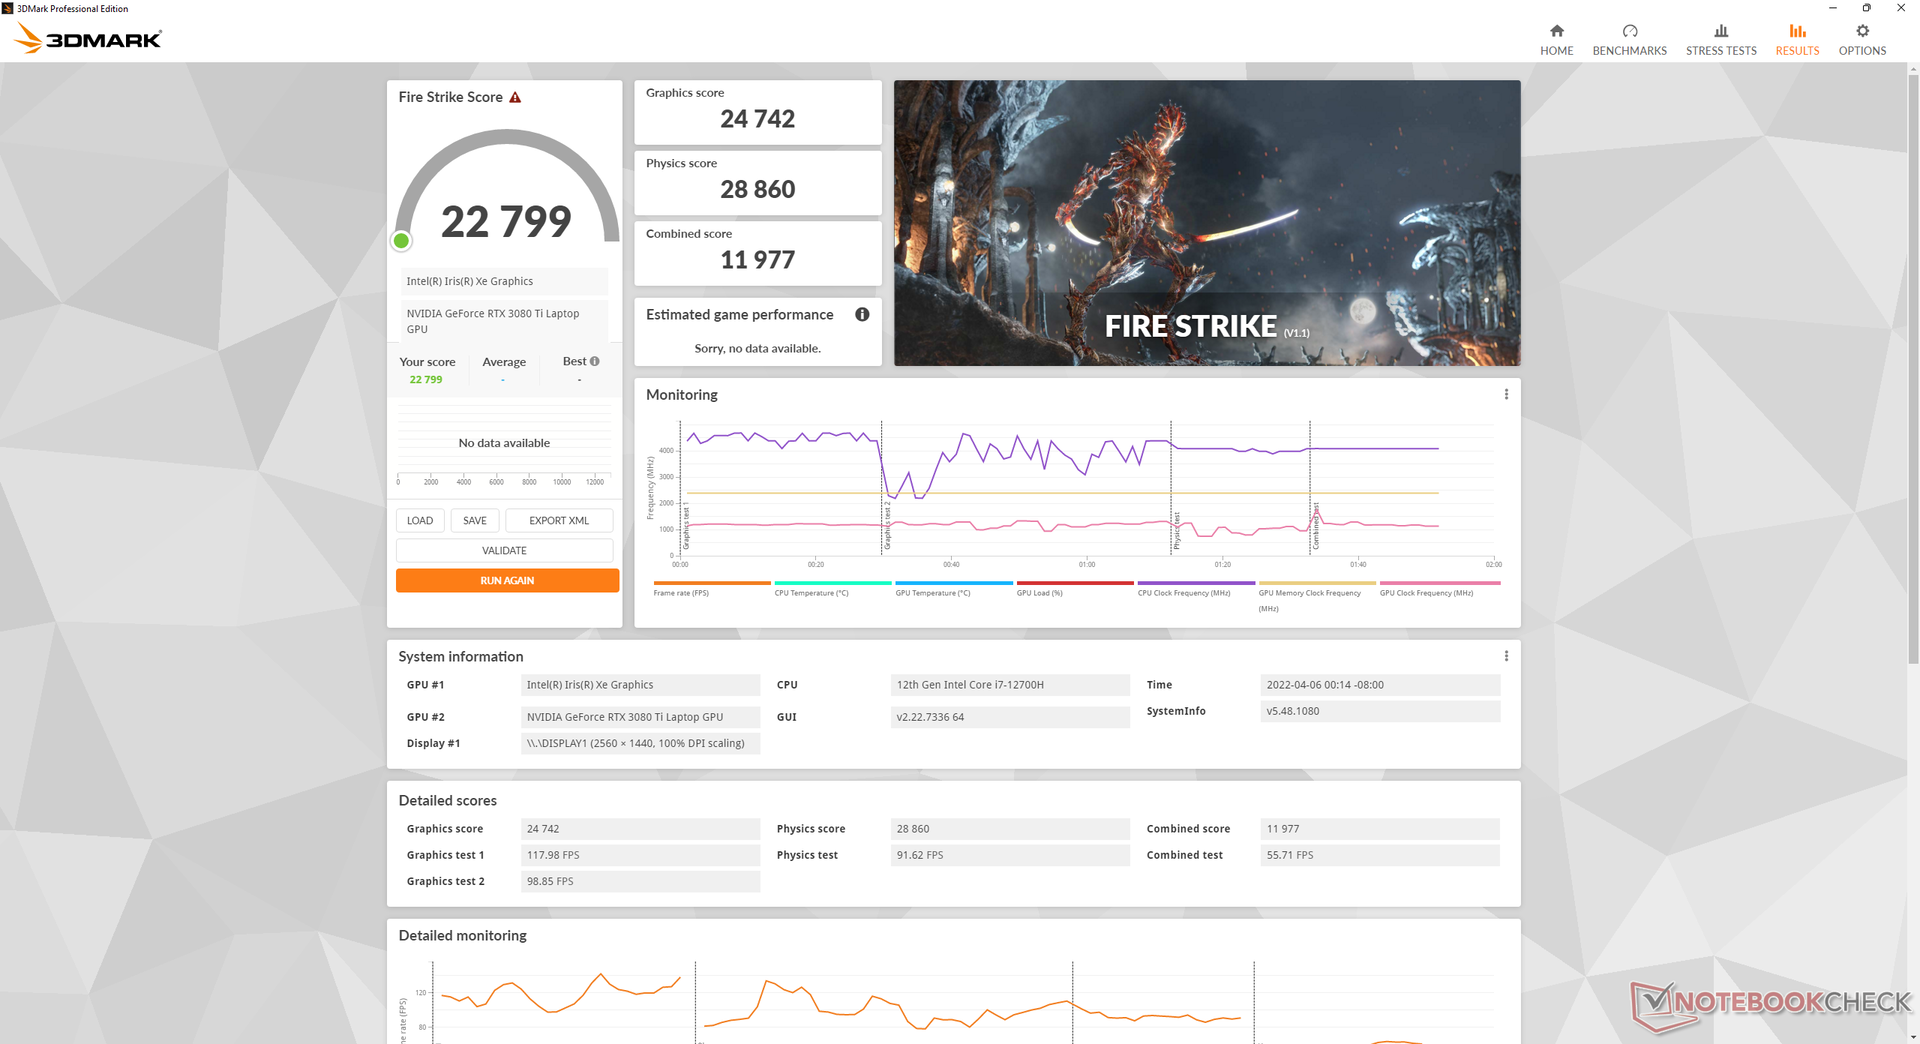
Att köra på batteri begränsar prestandan. Ett Fire Strike -test på batterier skulle ge fysik- och grafikpoäng på 29675 respektive 28050 poäng, jämfört med 14170 och 6220 poäng när det är på strömförsörjning.
| CPU-klocka (GHz) | GPU-klocka (MHz) | Genomsnittlig CPU-temperatur (°C) | Genomsnittlig GPU-temperatur (°C) | |
| System Idle | -- | -- | 40 | 37 |
| Prime95 Stress | 2,7 - 3,0 | -- | 96 | 54 |
| Prime95 + FurMark Stress | 2.2 | 430 - 1237 | 86 | 71 |
| Witcher 3 Stress | ~1,0 | 1432 | 67 | 75 |
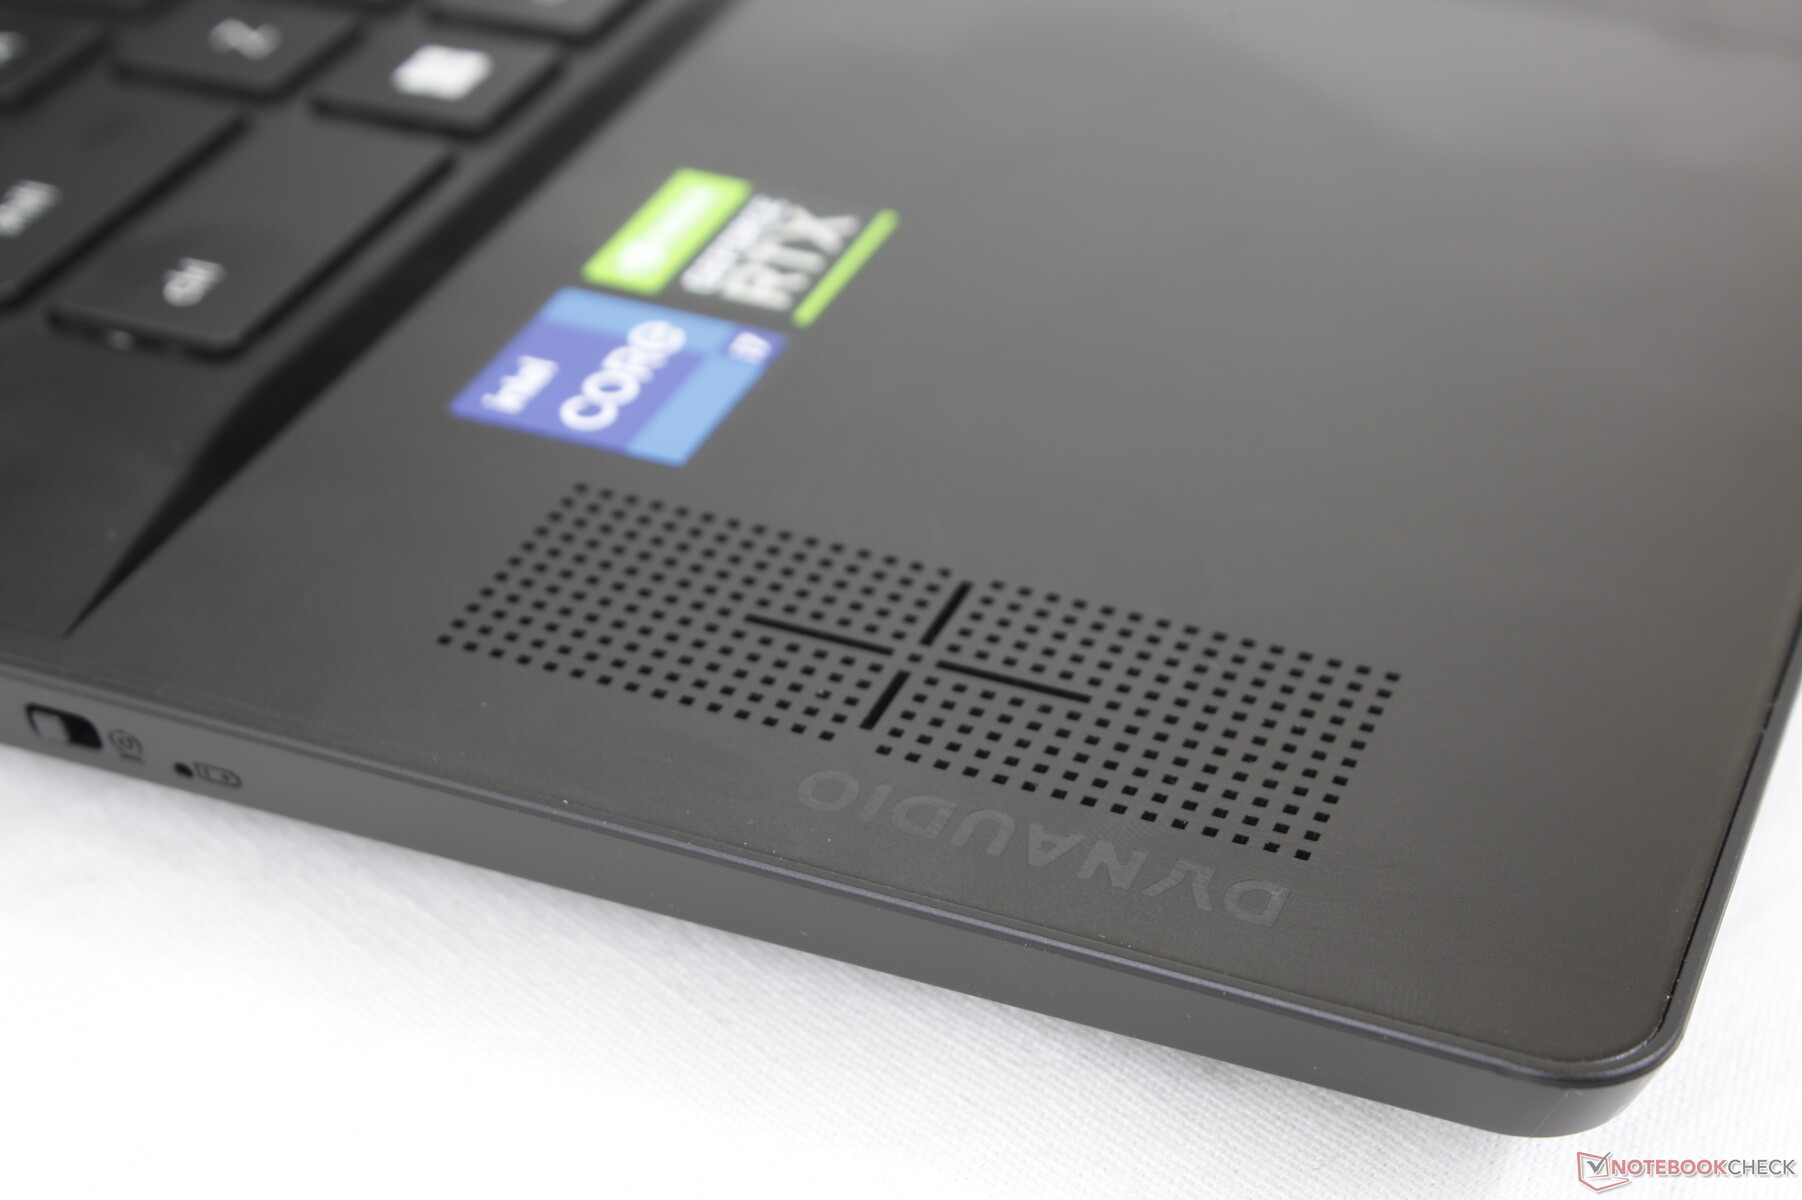
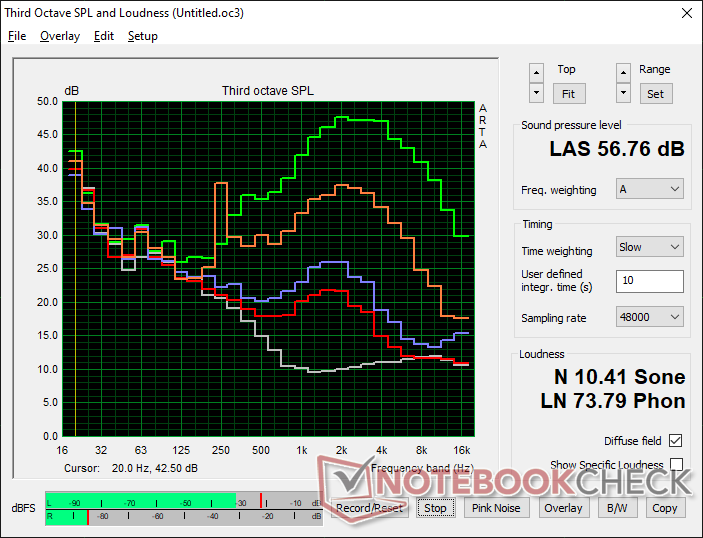
Högtalare
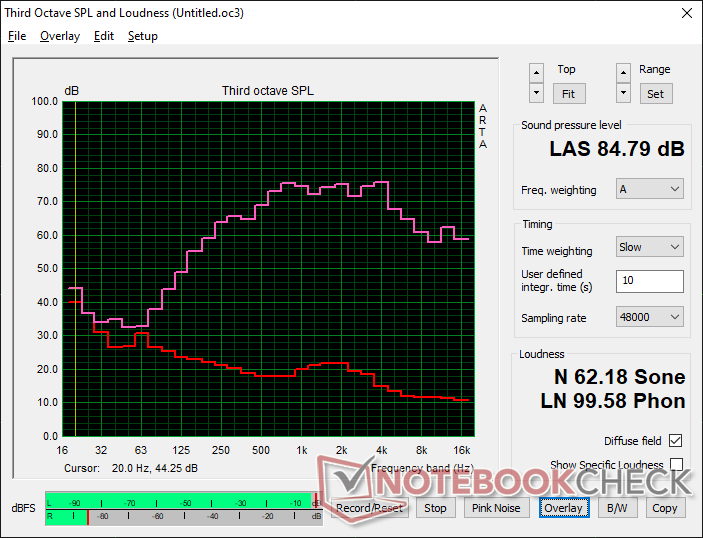
MSI Stealth GS77 12UHS-083US ljudanalys
(+) | högtalare kan spela relativt högt (84.8 dB)
Bas 100 - 315 Hz
(±) | reducerad bas - i genomsnitt 9.4% lägre än medianen
(±) | linjäriteten för basen är genomsnittlig (9.8% delta till föregående frekvens)
Mellan 400 - 2000 Hz
(±) | högre mellan - i genomsnitt 7% högre än median
(+) | mids är linjära (4.9% delta till föregående frekvens)
Högsta 2 - 16 kHz
(±) | högre toppar - i genomsnitt 5.8% högre än medianen
(±) | linjäriteten för toppar är genomsnittlig (7.9% delta till föregående frekvens)
Totalt 100 - 16 000 Hz
(±) | linjäriteten för det totala ljudet är genomsnittlig (15.9% skillnad mot median)
Jämfört med samma klass
» 38% av alla testade enheter i den här klassen var bättre, 7% liknande, 56% sämre
» Den bästa hade ett delta på 6%, genomsnittet var 18%, sämst var 132%
Jämfört med alla testade enheter
» 25% av alla testade enheter var bättre, 5% liknande, 70% sämre
» Den bästa hade ett delta på 4%, genomsnittet var 23%, sämst var 134%
Apple MacBook Pro 16 2021 M1 Pro ljudanalys
(+) | högtalare kan spela relativt högt (84.7 dB)
Bas 100 - 315 Hz
(+) | bra bas - bara 3.8% från medianen
(+) | basen är linjär (5.2% delta till föregående frekvens)
Mellan 400 - 2000 Hz
(+) | balanserad mellan - endast 1.3% från medianen
(+) | mids är linjära (2.1% delta till föregående frekvens)
Högsta 2 - 16 kHz
(+) | balanserade toppar - endast 1.9% från medianen
(+) | toppar är linjära (2.7% delta till föregående frekvens)
Totalt 100 - 16 000 Hz
(+) | det totala ljudet är linjärt (4.6% skillnad mot median)
Jämfört med samma klass
» 0% av alla testade enheter i den här klassen var bättre, 0% liknande, 100% sämre
» Den bästa hade ett delta på 5%, genomsnittet var 17%, sämst var 45%
Jämfört med alla testade enheter
» 0% av alla testade enheter var bättre, 0% liknande, 100% sämre
» Den bästa hade ett delta på 4%, genomsnittet var 23%, sämst var 134%
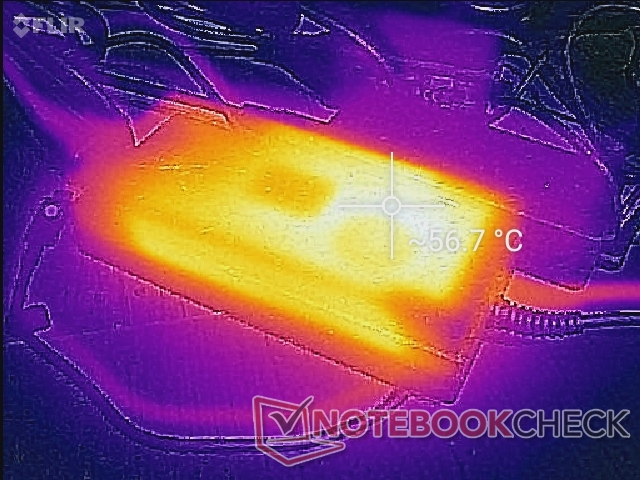
Energiförvaltning
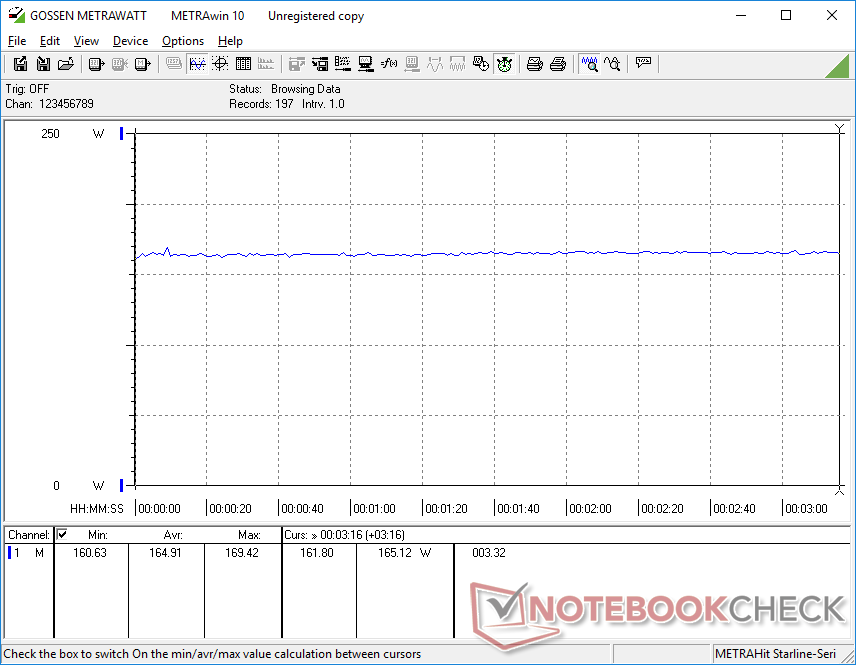
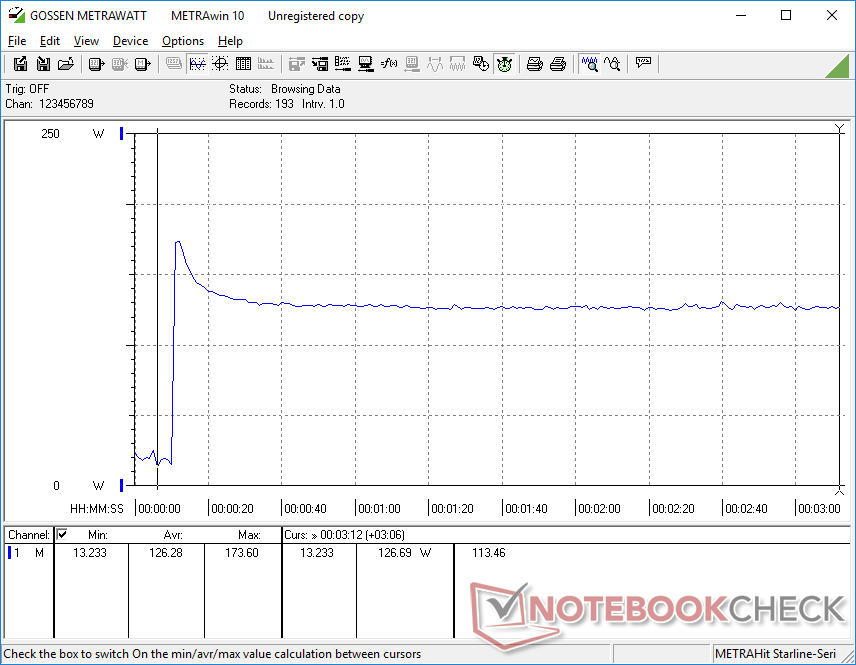
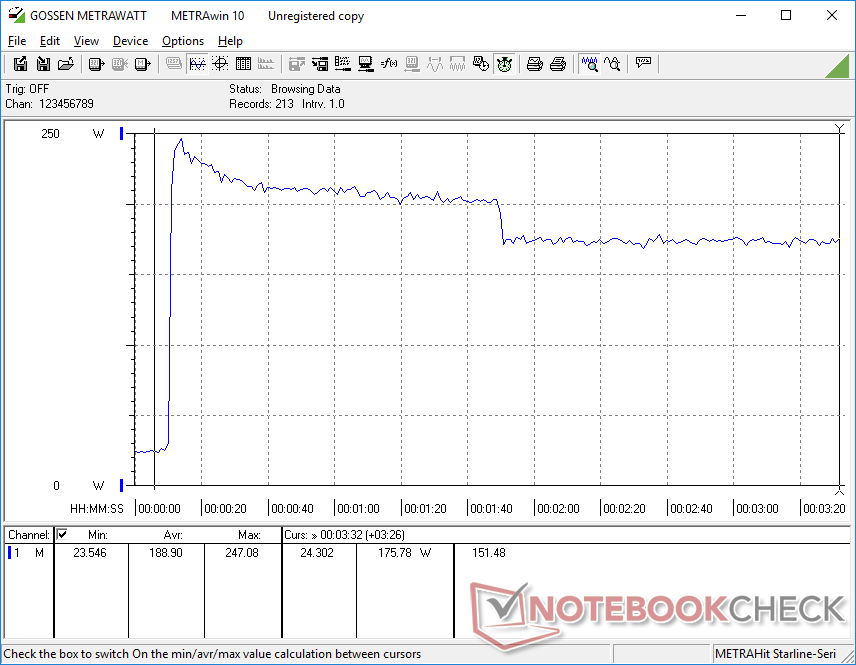
Strömförbrukning - Lite mer strömkrävande
GS77 är inte så mycket mer krävande än förra årets GS76 trots att prestandan har ökat. Körning Witcher 3kräver till exempel bara 5 procent mer kraft för en tidigare nämnd 12 till 15 procent högre grafikprestanda jämfört med RTX 3080. Den lilla skillnaden i energiförbrukning kan tillskrivas CPU och GPU i GS77 som siktar på relativt liknande TDP- och TGP-nivåer som processorerna i GS76. Däremot har TGP-målet mellan modellerna 2021 och 2022 för Blade 17 ökat avsevärt från 100 W till 165 W, vilket leder till betydligt högre strömförbrukningsnivåer för Blade 17 jämfört med GS77, vilket framgår av tabellen nedan.
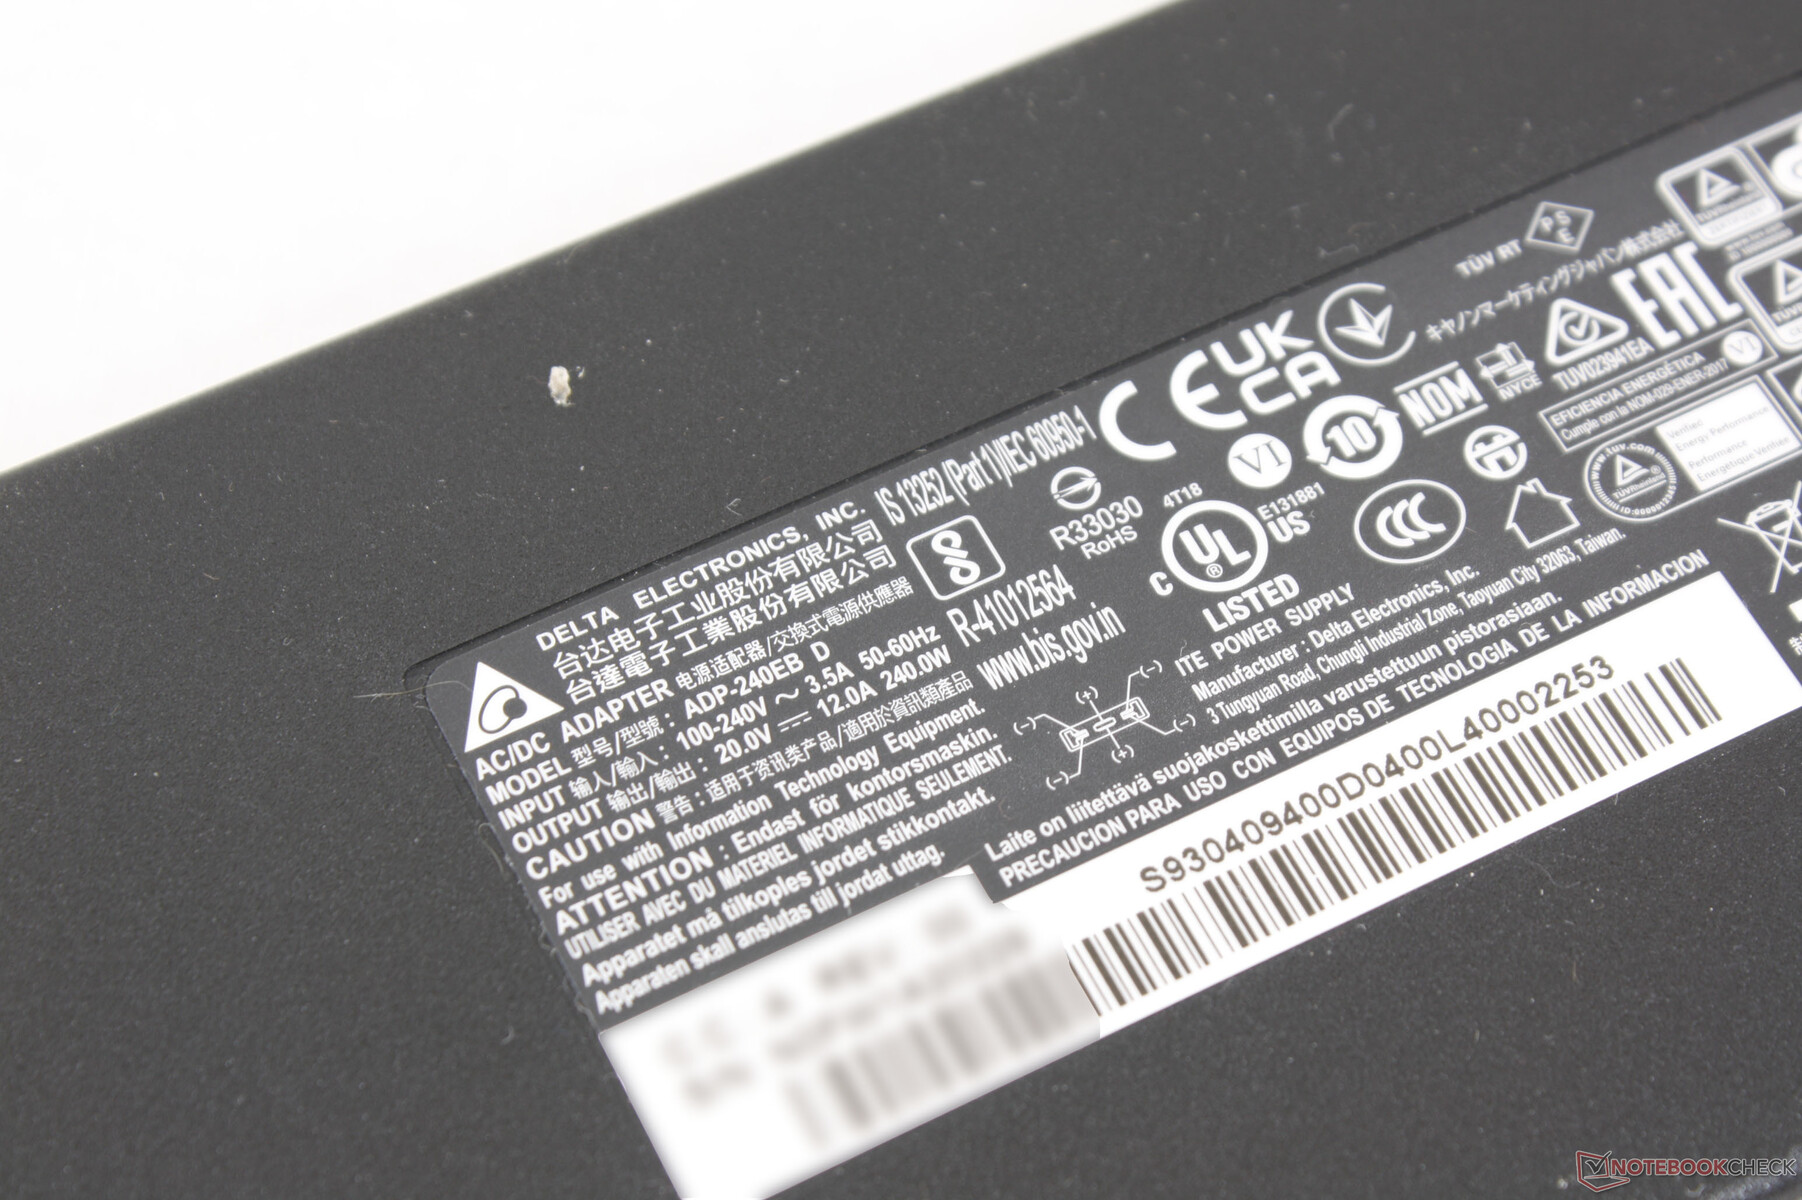
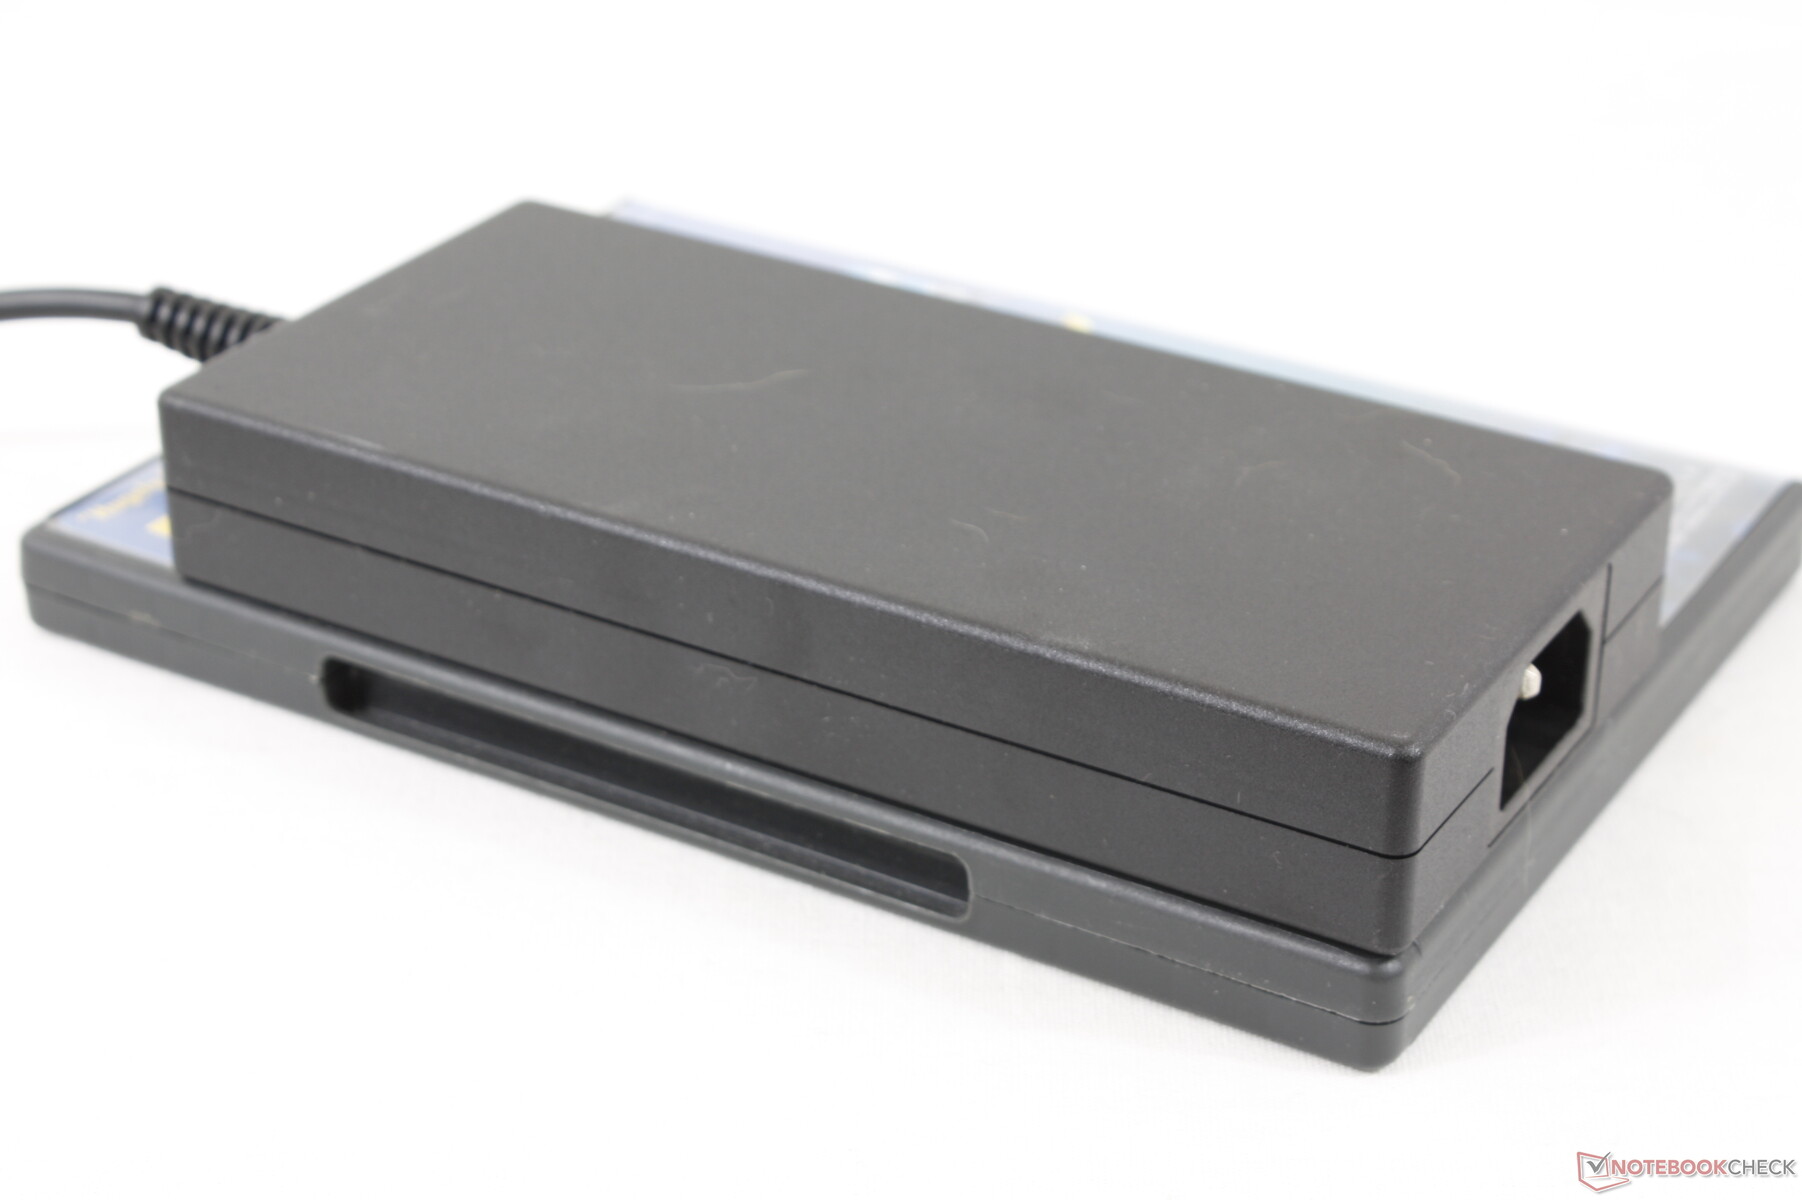
En 240 W AC-adapter är standard medan Blade 17 levereras med en 280 W-adapter med högre kapacitet. Man skulle kunna förvänta sig att Razer-adaptern är större, men 240 W-adaptern från MSI är faktiskt den något större (~16,4 x 7,5 x 2,5 cm jämfört med ~16,4 x 7 x 2,5 cm).
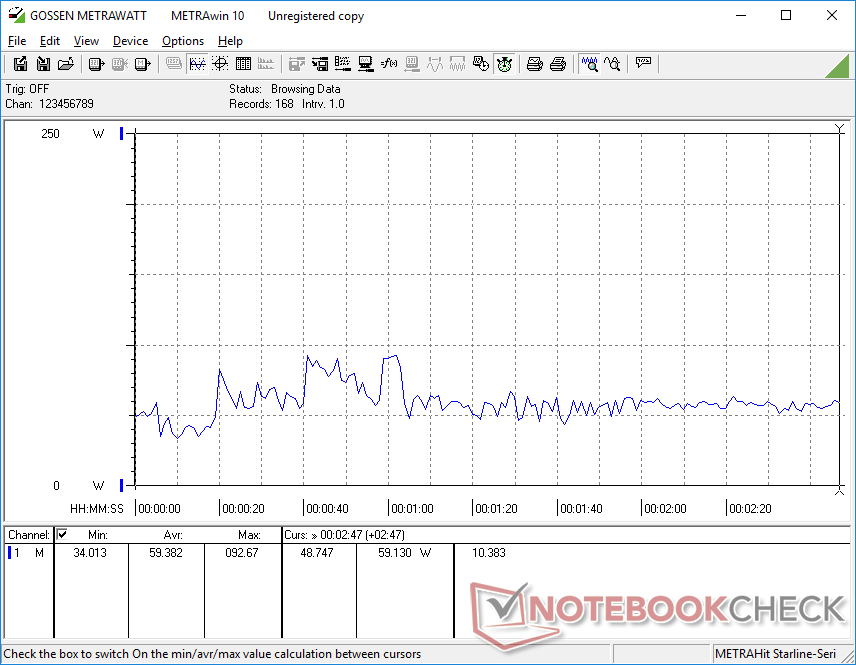
| Av/Standby | |
| Låg belastning | |
| Hög belastning |
|
Förklaring:
min: | |
| MSI Stealth GS77 12UHS-083US i7-12700H, GeForce RTX 3080 Ti Laptop GPU, Micron 3400 1TB MTFDKBA1T0TFH, IPS, 2560x1440, 17.3" | MSI GS76 Stealth 11UH i9-11900H, GeForce RTX 3080 Laptop GPU, Samsung PM9A1 MZVL22T0HBLB, IPS, 3840x2160, 17.3" | Razer Blade 17 RTX 3080 Ti i7-12800H, GeForce RTX 3080 Ti Laptop GPU, Samsung PM9A1 MZVL21T0HCLR, IPS, 2560x1440, 17.3" | MSI GE76 Raider i9-12900HK, GeForce RTX 3080 Ti Laptop GPU, Samsung PM9A1 MZVL22T0HBLB, IPS-Level, 1920x1080, 17.3" | Alienware x17 RTX 3080 P48E i7-11800H, GeForce RTX 3080 Laptop GPU, 2x WDC PC SN730 SDBPNTY-1T00 (RAID 0), IPS, 3840x2160, 17.3" | Asus ROG Zephyrus S17 GX703HSD i9-11900H, GeForce RTX 3080 Laptop GPU, Samsung PM9A1 MZVL22T0HBLB, IPS, 2560x1440, 17.3" | |
|---|---|---|---|---|---|---|
| Power Consumption | 7% | -57% | -4% | -17% | -11% | |
| Idle Minimum * (Watt) | 20 | 14 30% | 29.8 -49% | 12 40% | 10.2 49% | 21.7 -9% |
| Idle Average * (Watt) | 21.4 | 19 11% | 37.1 -73% | 17 21% | 21.2 1% | 27 -26% |
| Idle Maximum * (Watt) | 27 | 31 -15% | 60.8 -125% | 28 -4% | 48.4 -79% | 33 -22% |
| Load Average * (Watt) | 100.5 | 97 3% | 135.3 -35% | 118 -17% | 118.7 -18% | 108 -7% |
| Witcher 3 ultra * (Watt) | 165 | 156 5% | 243 -47% | 252 -53% | 249 -51% | 195 -18% |
| Load Maximum * (Watt) | 247.1 | 231 7% | 273.1 -11% | 272 -10% | 262 -6% | 210 15% |
* ... mindre är bättre
Power Consumption Witcher 3 / Stresstest
Power Consumption external Monitor
Batteritid - 99 Wh till räddningen
Körtiderna är nästan identiska med dem vi registrerade på förra årets GS76 och något längre än de vi registrerade på nya Blade 17. De senaste GS-modellerna utmärker sig för sitt stora batteri på 99 Wh jämfört med 90 Wh eller mindre på de flesta andra bärbara datorer för spel.
Laddning från tom till full kapacitet tar nästan 2,5 timmar vår ungefär 1 timme längre än de flesta andra bärbara datorer. Systemet kan också laddas via USB-C genom dess enda Thunderbolt 4-port.
| MSI Stealth GS77 12UHS-083US i7-12700H, GeForce RTX 3080 Ti Laptop GPU, 99 Wh | MSI GS76 Stealth 11UH i9-11900H, GeForce RTX 3080 Laptop GPU, 99.9 Wh | Razer Blade 17 RTX 3080 Ti i7-12800H, GeForce RTX 3080 Ti Laptop GPU, 82 Wh | MSI GE76 Raider i9-12900HK, GeForce RTX 3080 Ti Laptop GPU, 99.99 Wh | Alienware x17 RTX 3080 P48E i7-11800H, GeForce RTX 3080 Laptop GPU, 87 Wh | Asus ROG Zephyrus S17 GX703HSD i9-11900H, GeForce RTX 3080 Laptop GPU, 90 Wh | |
|---|---|---|---|---|---|---|
| Batteridrifttid | -4% | -19% | -18% | -28% | 57% | |
| Reader / Idle (h) | 10.8 | 9.9 -8% | 8 -26% | 7 -35% | ||
| WiFi v1.3 (h) | 6.2 | 6.4 3% | 5.5 -11% | 5.1 -18% | 5.9 -5% | 7.5 21% |
| Load (h) | 1.4 | 1.3 -7% | 1.1 -21% | 0.8 -43% | 2.7 93% | |
| H.264 (h) | 7.2 | |||||
| Witcher 3 ultra (h) | 1 |
För
Emot
Slutsats - Bättre än GS76... för det mesta

GS77 är några steg framåt och några steg bakåt från GS76. Förbättringarna är många, bland annat det starkare och styvare skelettet, webbkameran med högre upplösning, större klickplatta, enklare service, relativt likartade batteritider, nyare bildskärmsalternativ och högre prestanda vid ungefär samma TDP- och TGP-nivåer som tidigare. Processorprestanda är bättre än väntat även jämfört med andra bärbara datorer med Core i7- eller Core i9-processorer. Den nyare modellen känns mer rejäl än den utgående modellen för högre kvalitetsintryck också.
Å andra sidan har GS77 gått tillbaka i vissa viktiga aspekter. Chassiets storlek och vikt i synnerhet är märkbart större och tyngre än GS76 vilket innebär att GS77 inte är lika resevänlig som sin föregångare. QHD-panelen med 240 Hz är inte heller lika ljusstark som GS76:s 4K-panel, medan SD-kortläsaren nu är mer än två gånger långsammare. Den maximala vinkeln på gångjärnen är mycket smalare den här gången också för mindre rörelsefrihet.
På det hela taget är den nyare modellen ett generellt steg uppåt för GS-serien trots några olyckliga bakslag. TGP GPU:n på 105 W är dock något oroande, eftersom det kan tyda på att framtida SKU:er också kommer att vara låsta till GPU:er på ~100 W medan den ångkammarkylda Blade 17 kan använda sig av mer kraftfulla 165 W-versioner. MSI missade sitt tillfälle att lägga till ytterligare önskvärda funktioner till GS77, inklusive en MUX-switch, fabriks-kalibrerad skärm eller internt G-Sync-stöd, som alla finns tillgängliga på den mindre Razer Blade 17.
Pris och tillgänglighet
MSI Stealth GS77 12UHS-083US
- 04/07/2022 v7 (old)
Allen Ngo
Price comparison

