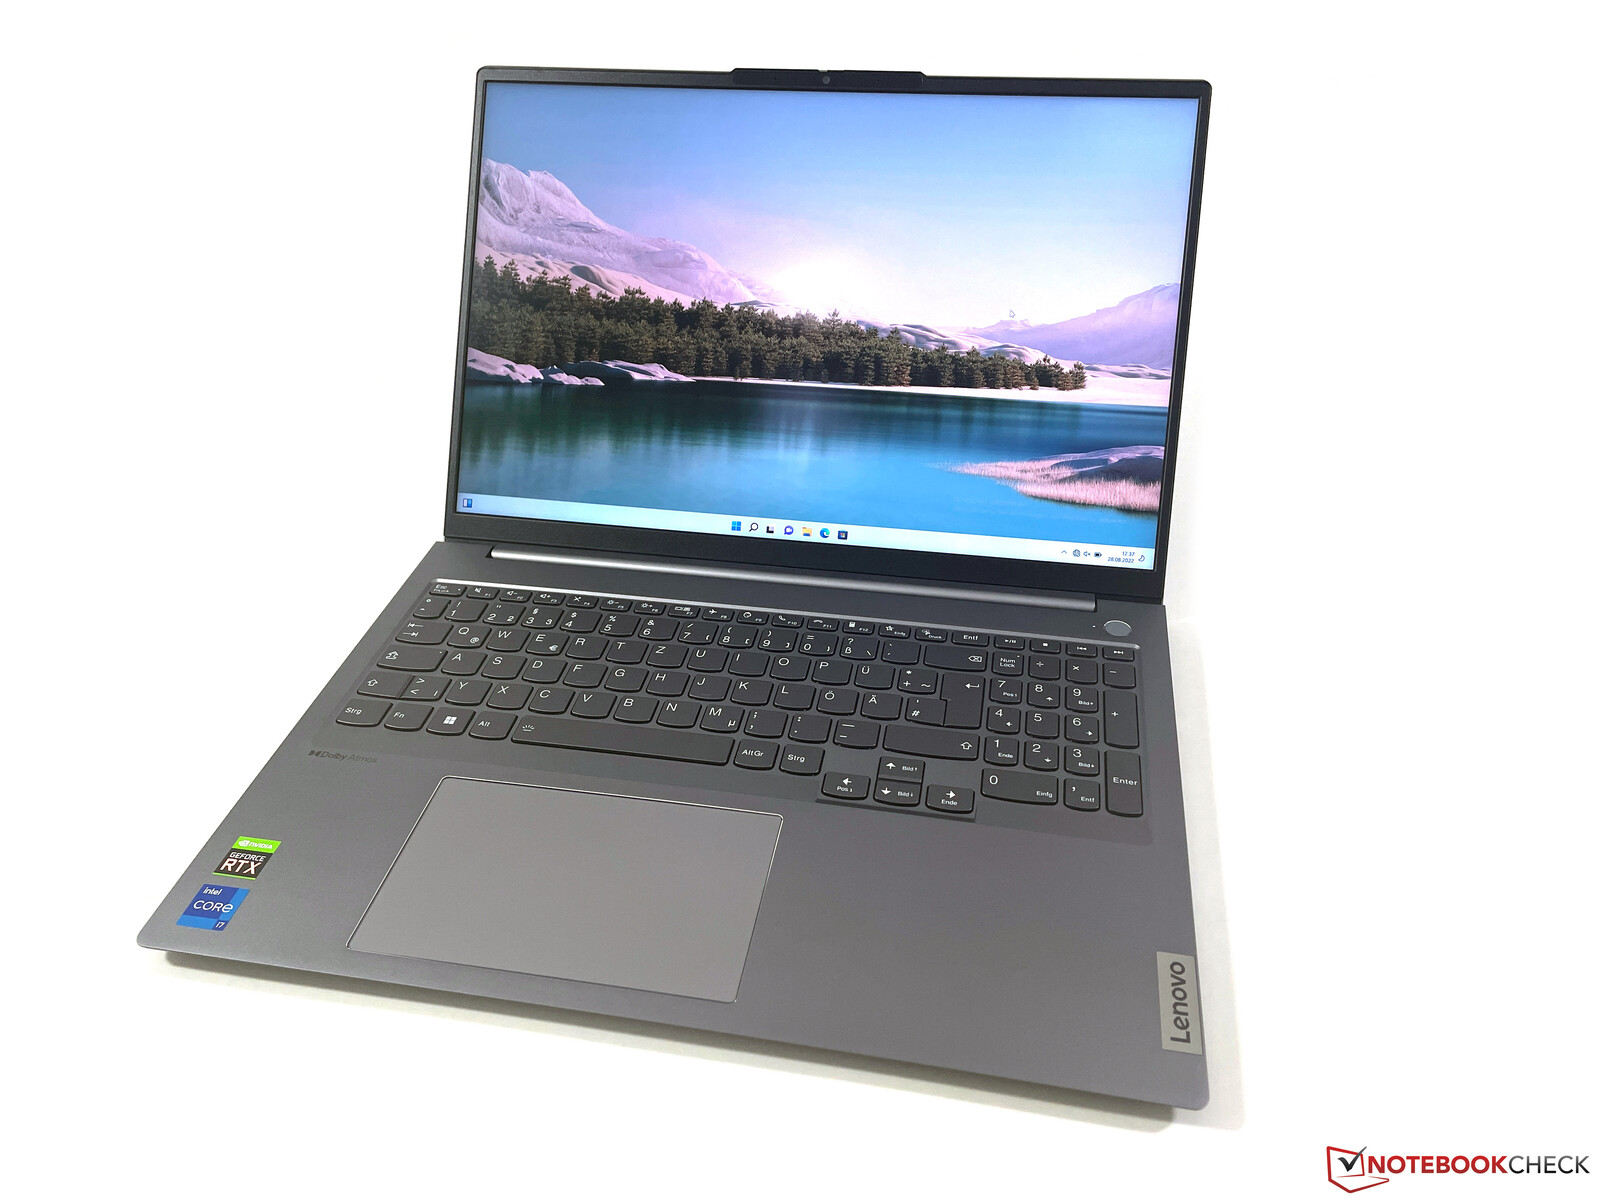
Recension av Lenovo ThinkBook 16 G4+: Bra multimedia laptop med mycket kraft
Med ThinkBook 16 G4+ presenterar Lenovo en 16-tums bärbar multimediebok med kraftfulla komponenter och många moderna funktioner till ett pris på 1 200 euro (1 200 US-dollar). Förutom den senaste Intel Core i7-12700H-processorn finns den dedikerade GeForce RTX 2050 från Nvidia samt moderna funktioner som Thunderbolt 4, Wi-Fi 6E eller PCIe 4.0. Skärmen är en matt WQHD IPS-panel och det finns en stor 1 TB SSD, tillsammans med 16 GB RAM. Vårt recensionsexemplar är en campusmodell utan operativsystem.
Potentiella konkurrenter i jämförelse
Gradering | Datum | Modell | Vikt | Höjd | Storlek | Upplösning | Pris |
|---|---|---|---|---|---|---|---|
| 88.4 % v7 (old) | 09/2022 | Lenovo ThinkBook 16 G4+ IAP i7-12700H, GeForce RTX 2050 Mobile | 1.8 kg | 16.5 mm | 16.00" | 2560x1600 | |
| 87.4 % v7 (old) | 08/2022 | Dell Inspiron 16 Plus 7620 i7-12700H, GeForce RTX 3050 Ti Laptop GPU | 2.1 kg | 18.99 mm | 16.00" | 3072x1920 | |
| 86.2 % v7 (old) | 07/2022 | Acer Swift X SFX16-51G-5388 i5-11320H, GeForce RTX 3050 4GB Laptop GPU | 1.8 kg | 18.9 mm | 16.10" | 1920x1080 | |
v (old) | 12/2021 | Asus Vivobook Pro 16X-M7600QE R9 5900HX, GeForce RTX 3050 Ti Laptop GPU | 1.9 kg | 19 mm | 16.10" | 3840x2400 | |
| 83.6 % v7 (old) | 07/2022 | Huawei MateBook D 16 2022 i7-12700H, Iris Xe G7 96EUs | 1.7 kg | 18.4 mm | 16.00" | 1920x1200 | |
| 79.8 % v7 (old) | 08/2022 | Samsung Galaxy Book2 15 i7-1260P, A350M | 1.6 kg | 15 mm | 15.60" | 1920x1080 |
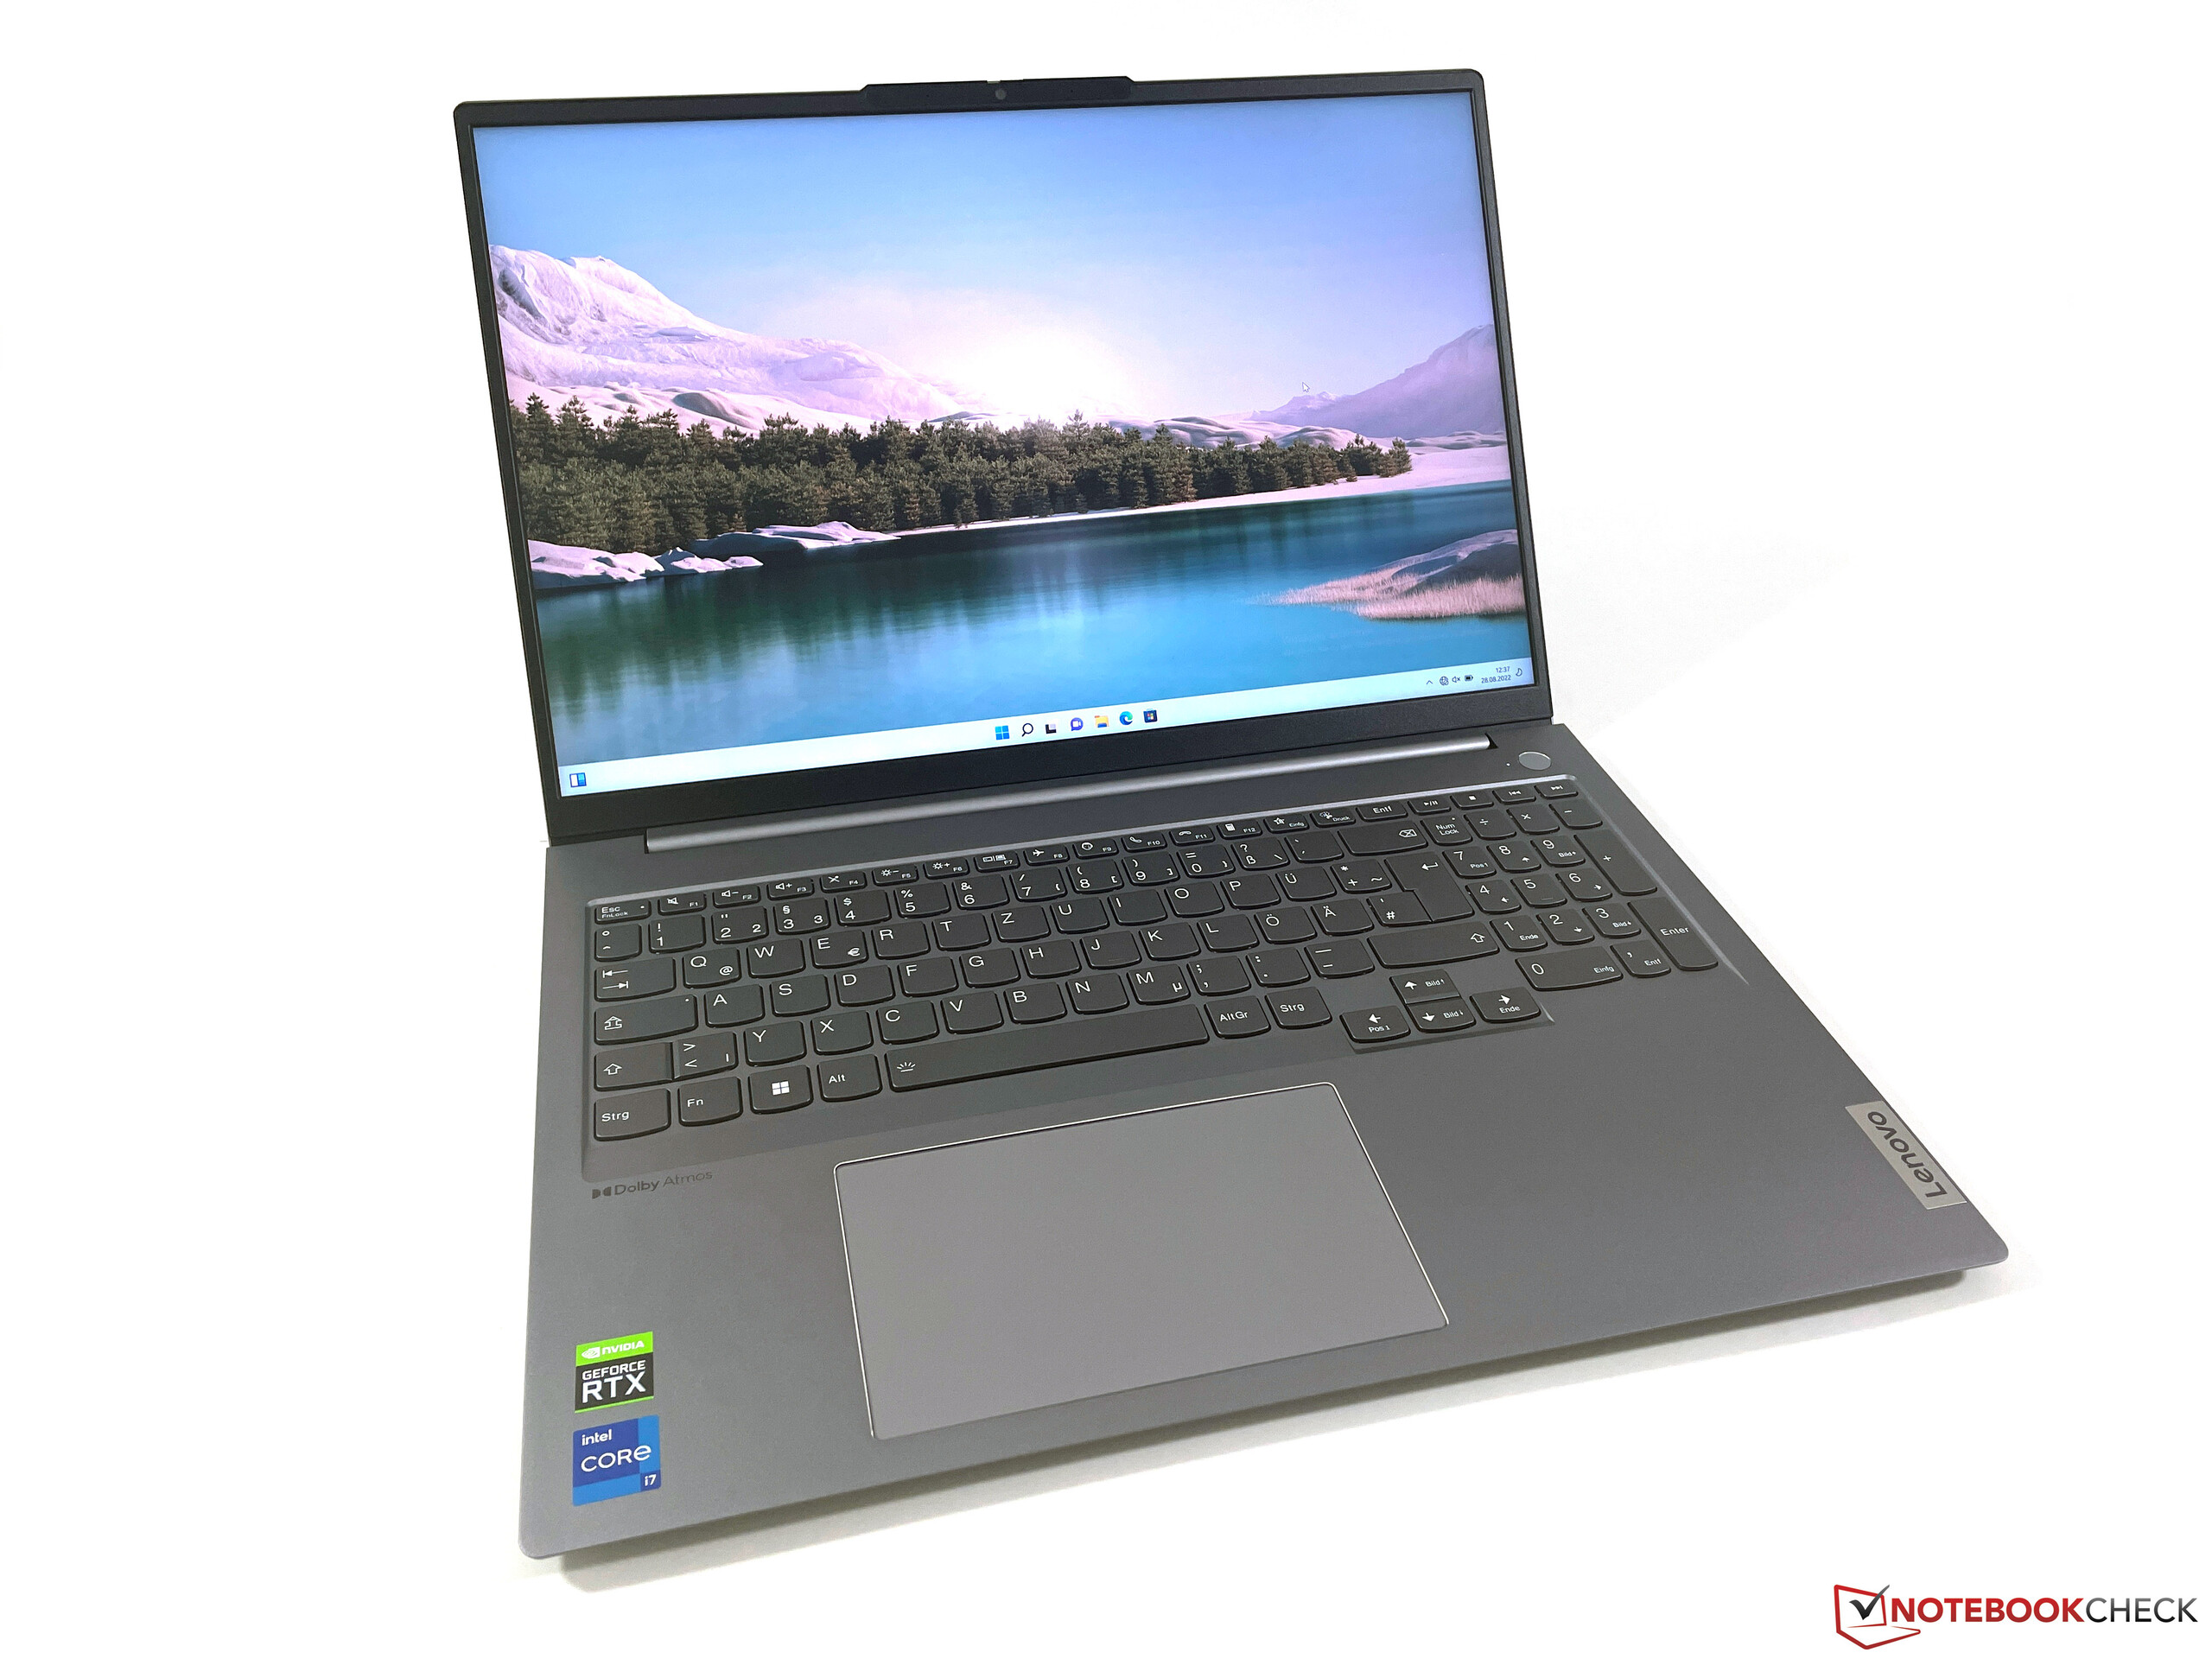
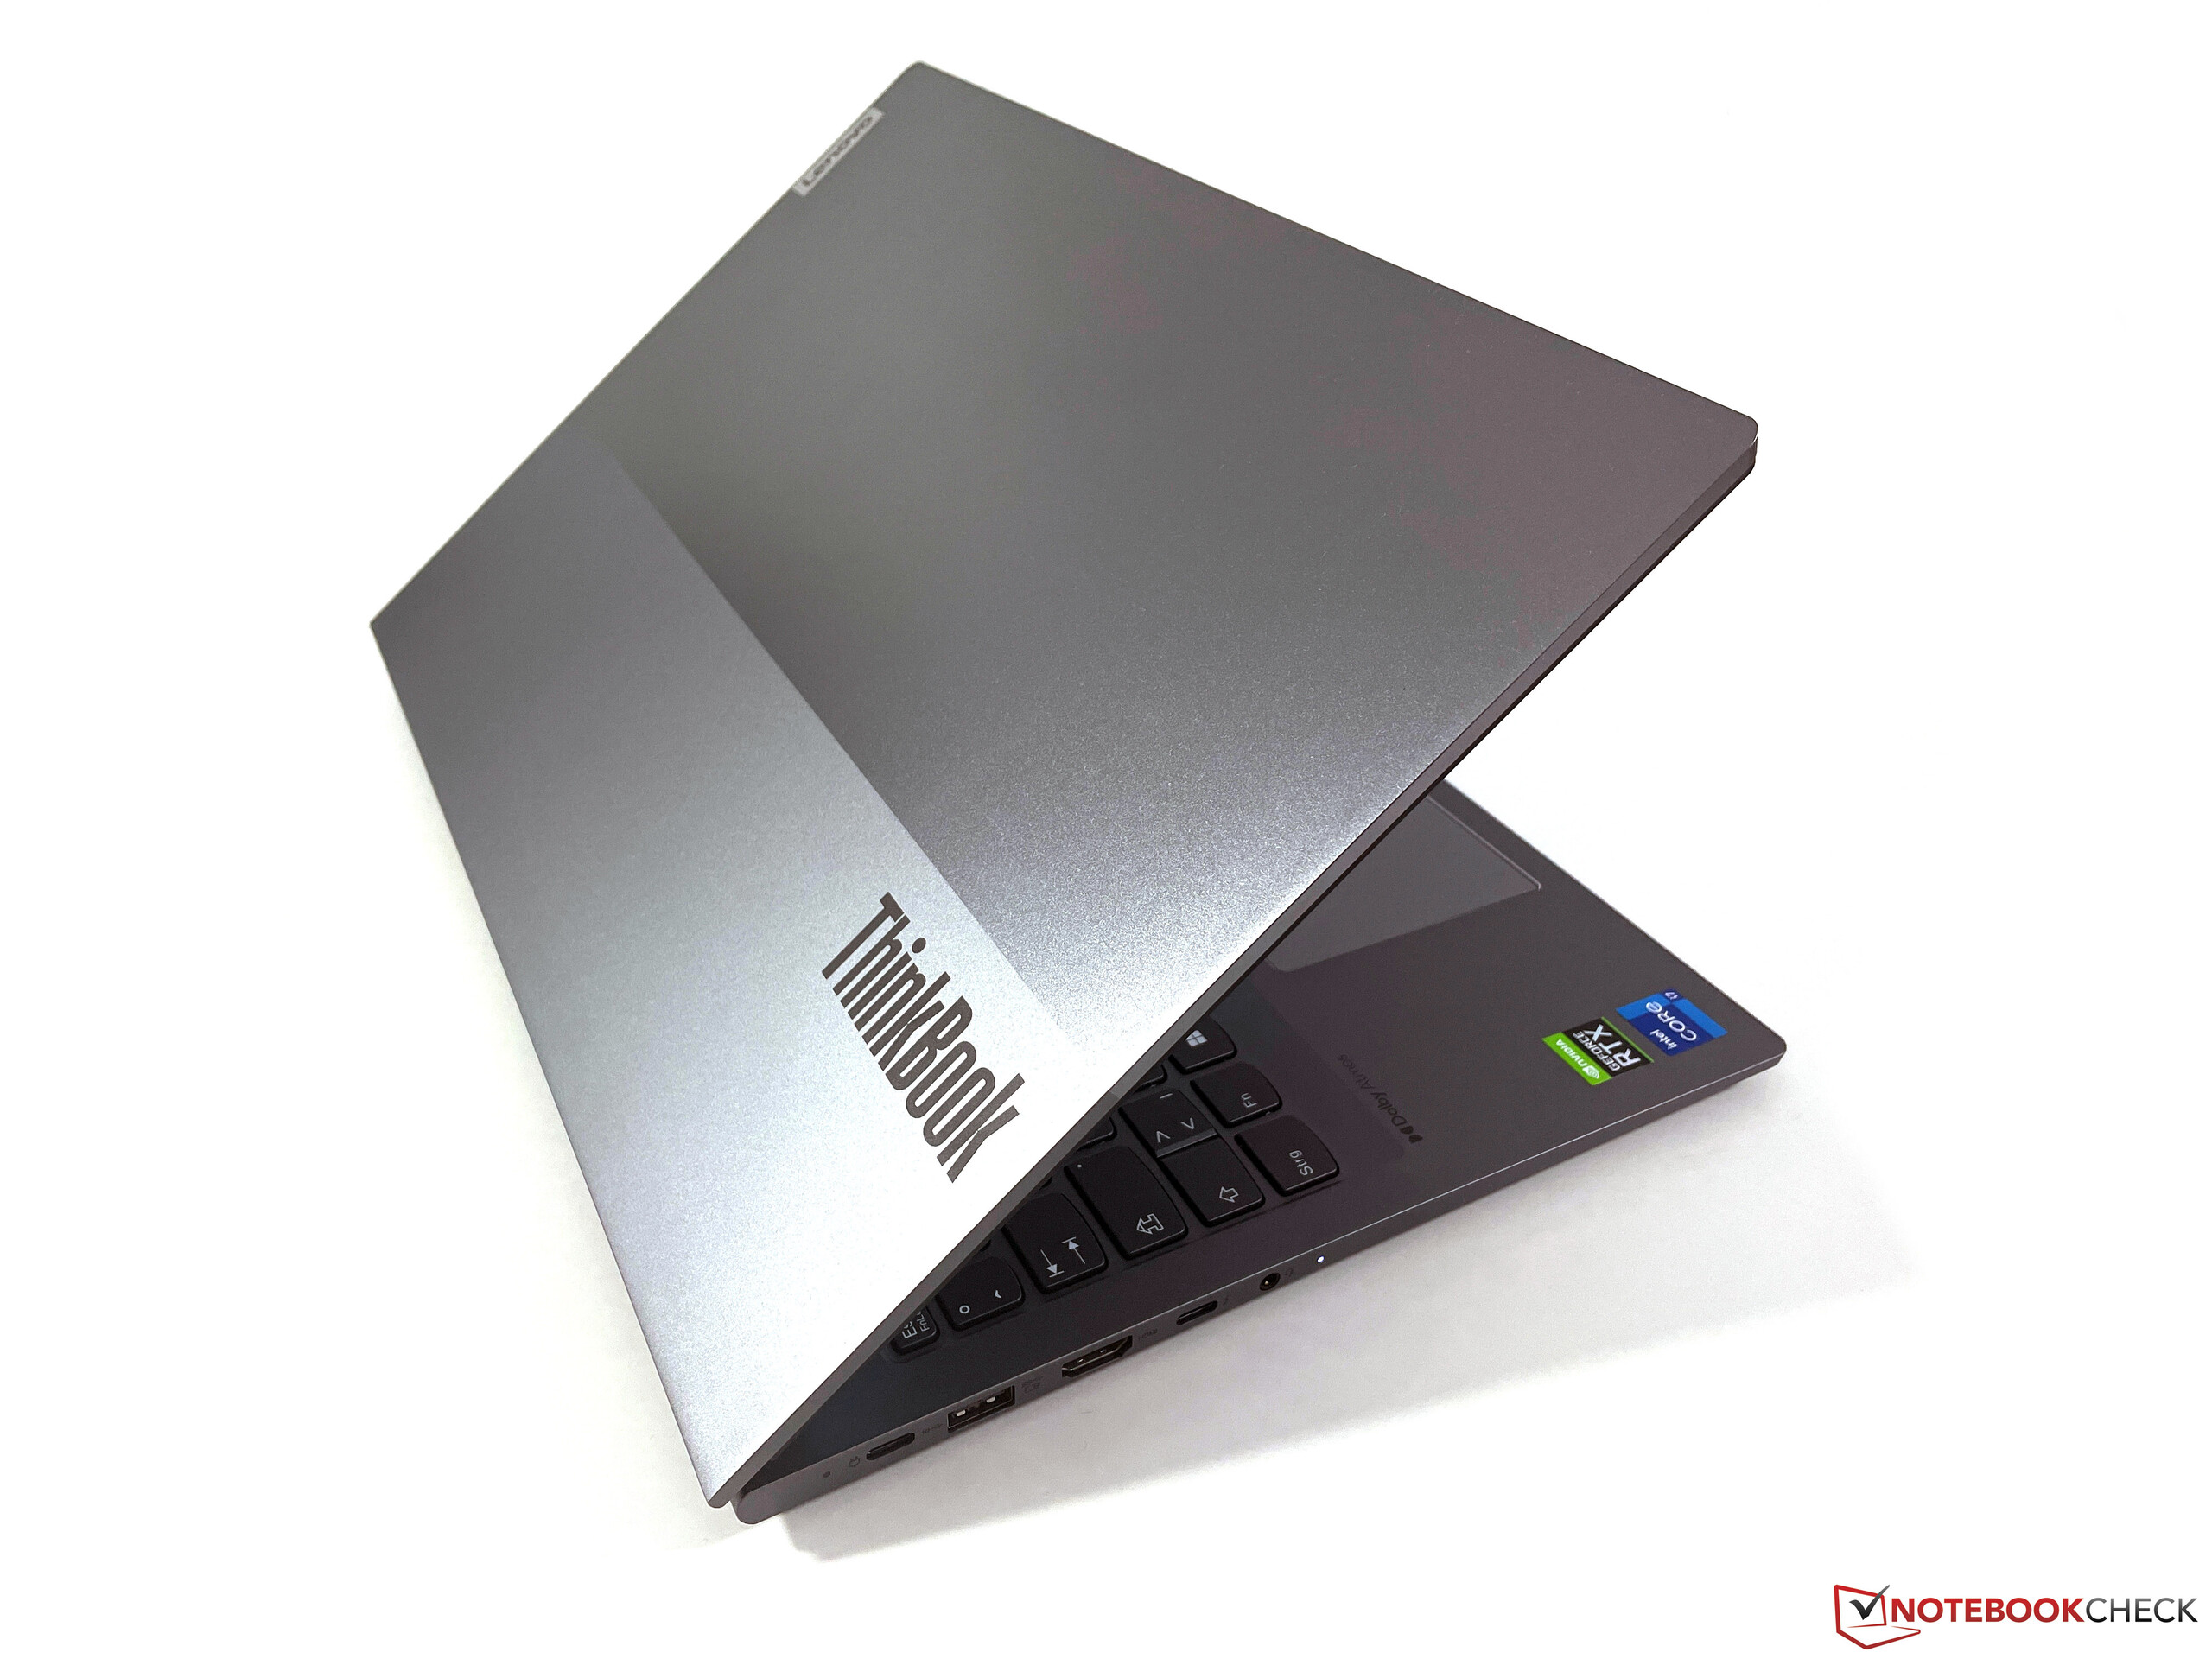
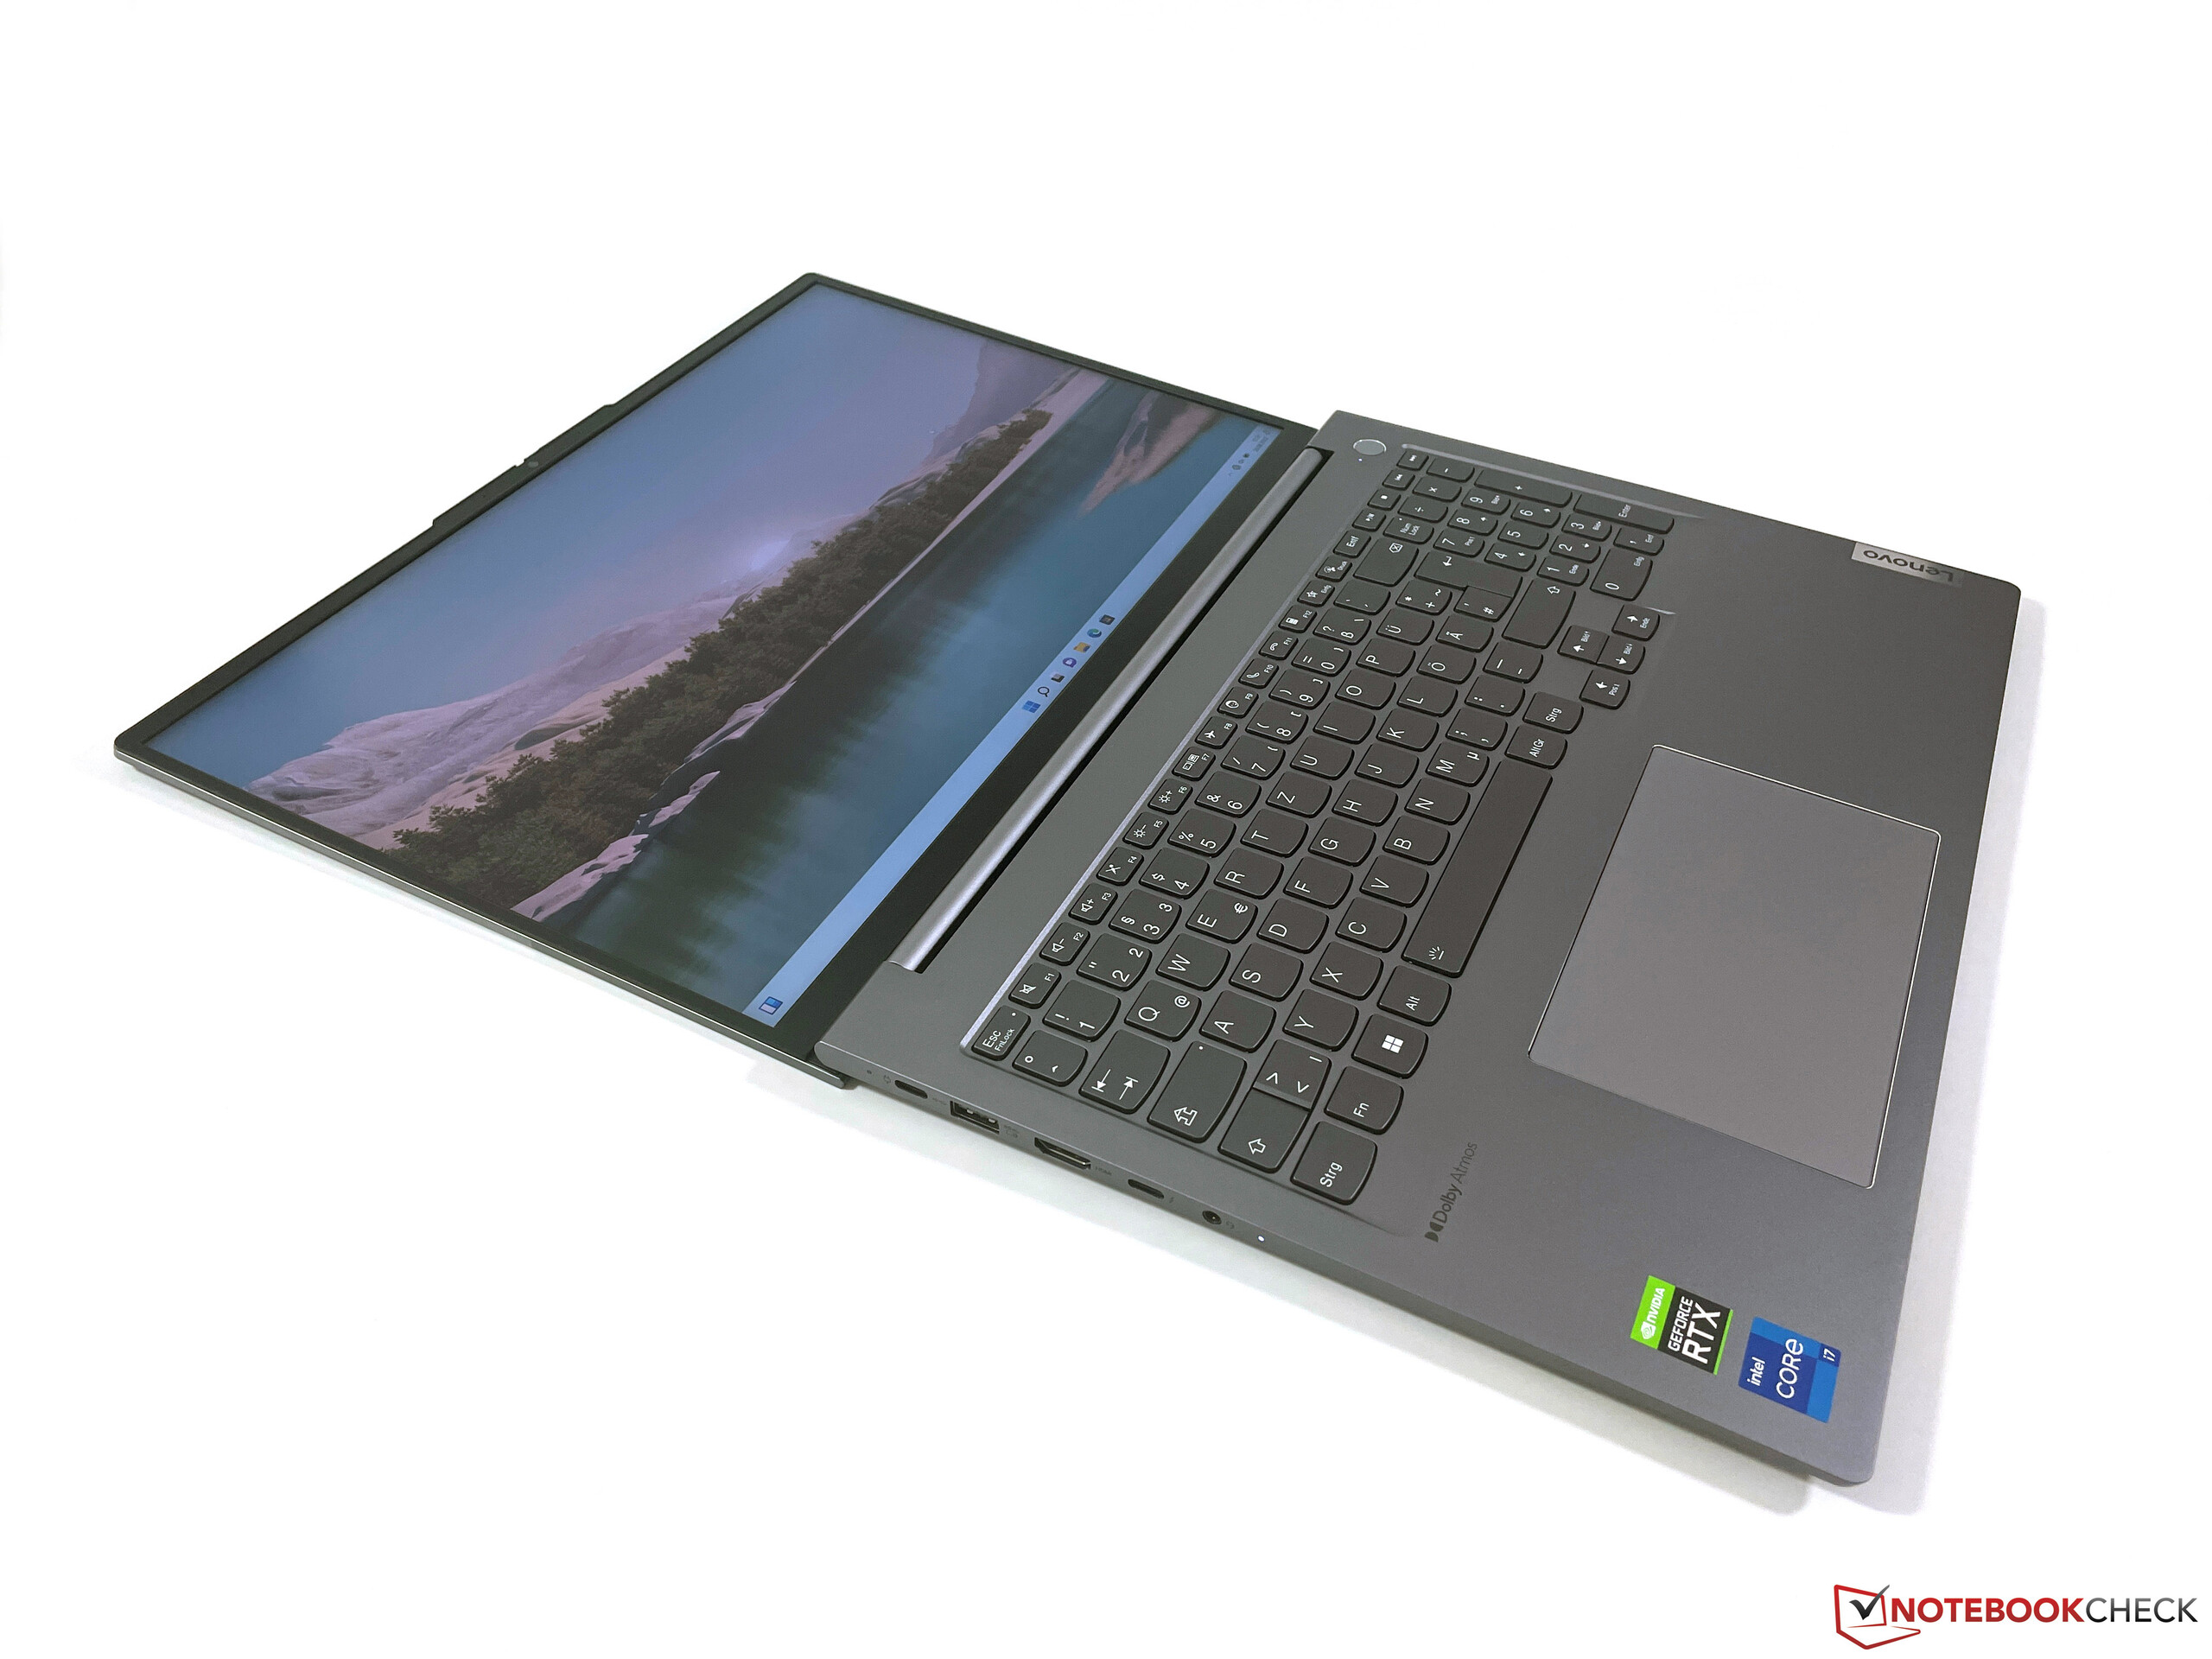
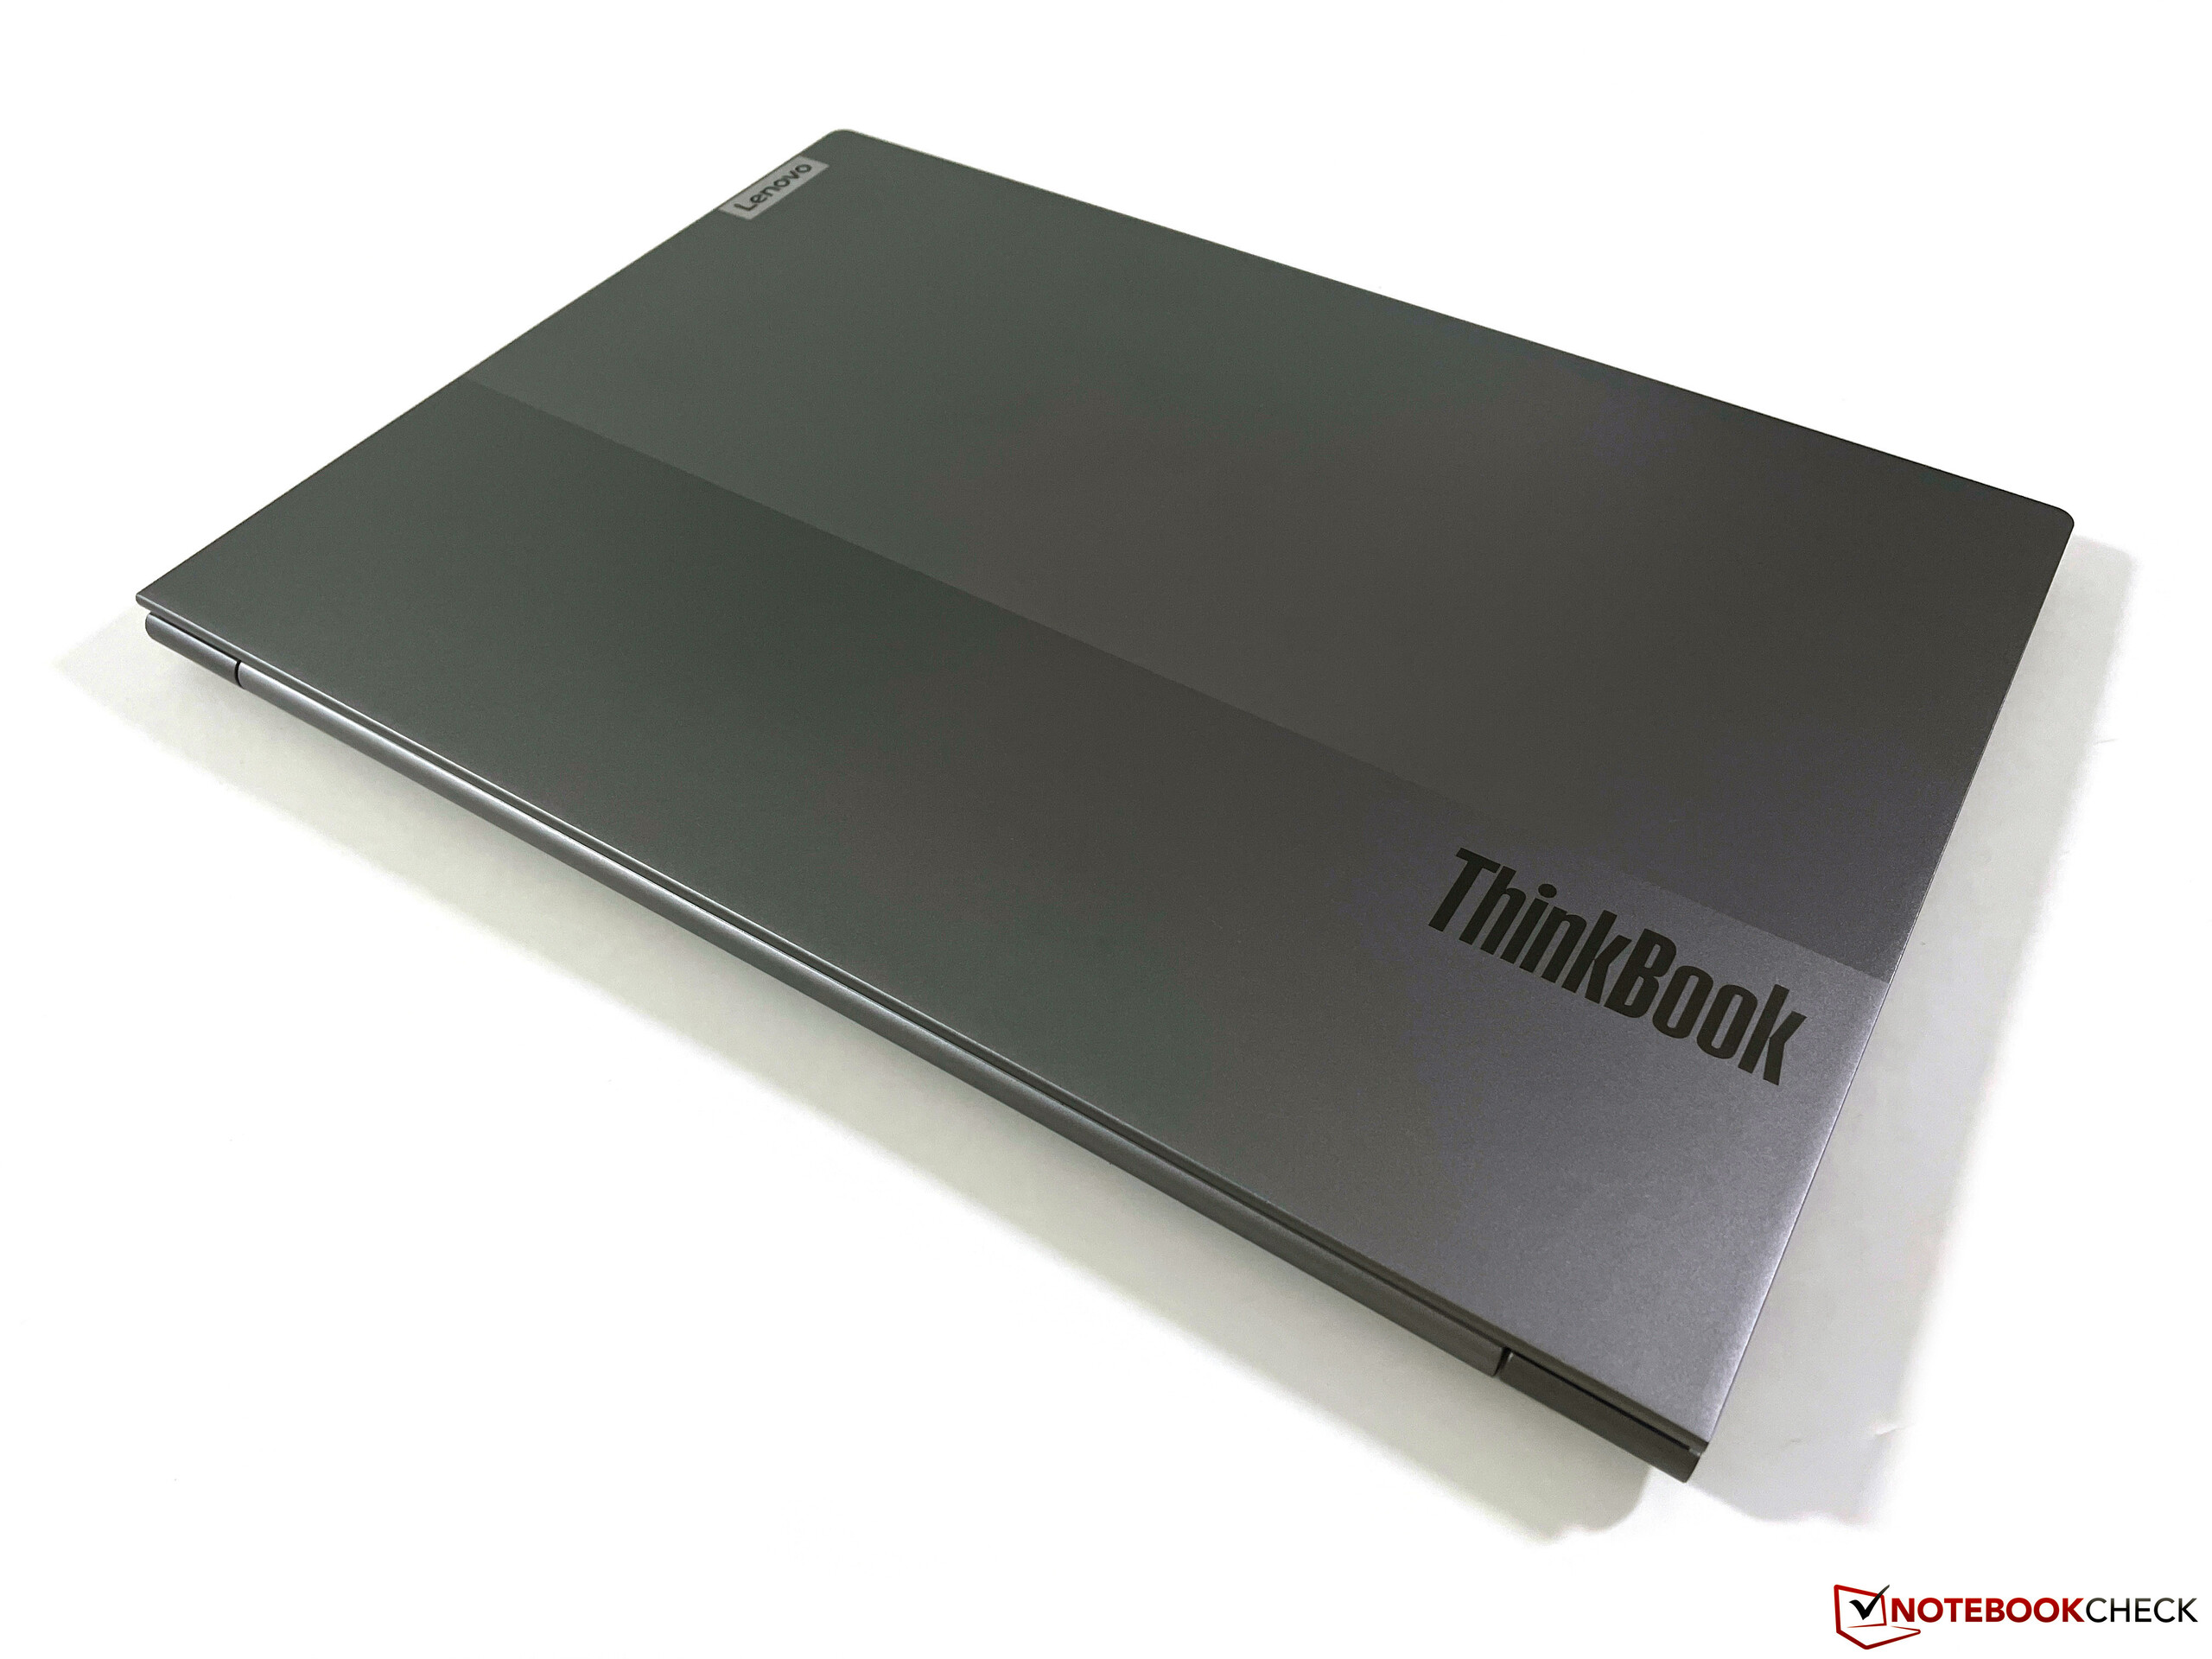
Hölje - Lenovo använder sig av aluminium
Lenovo använder huvudsakligen aluminium för höljet (dvs. locket och basenheten) och ytorna är både sandblästrade och anodiserade. De släta ytorna känns behagliga och förmedlar ett högkvalitativt intryck. Fingeravtryck syns relativt snabbt, men kan också lätt avlägsnas. Visuellt ser det silverfärgade fodralet elegant ut och passar bra in i professionella miljöer. Den enda visuella accenten är det tvåfärgade displaylocket med två olika nyanser av grått.
När det gäller utförande ger ThinkBook ett i grunden bra intryck, men det finns fortfarande utrymme för förbättringar. Vi kunde framkalla tysta knarrande ljud från basenheten och tangentbordsytan kan också tryckas in. Skärmluckan visar sig vara mer stabil - vi kunde inte framkalla några bildfel, men skärmen vacklar tydligt när öppningsvinkeln ändras. Maximalt 180 grader är möjligt och gångjärnen är väljusterade, eftersom öppning med en hand inte utgör något problem.
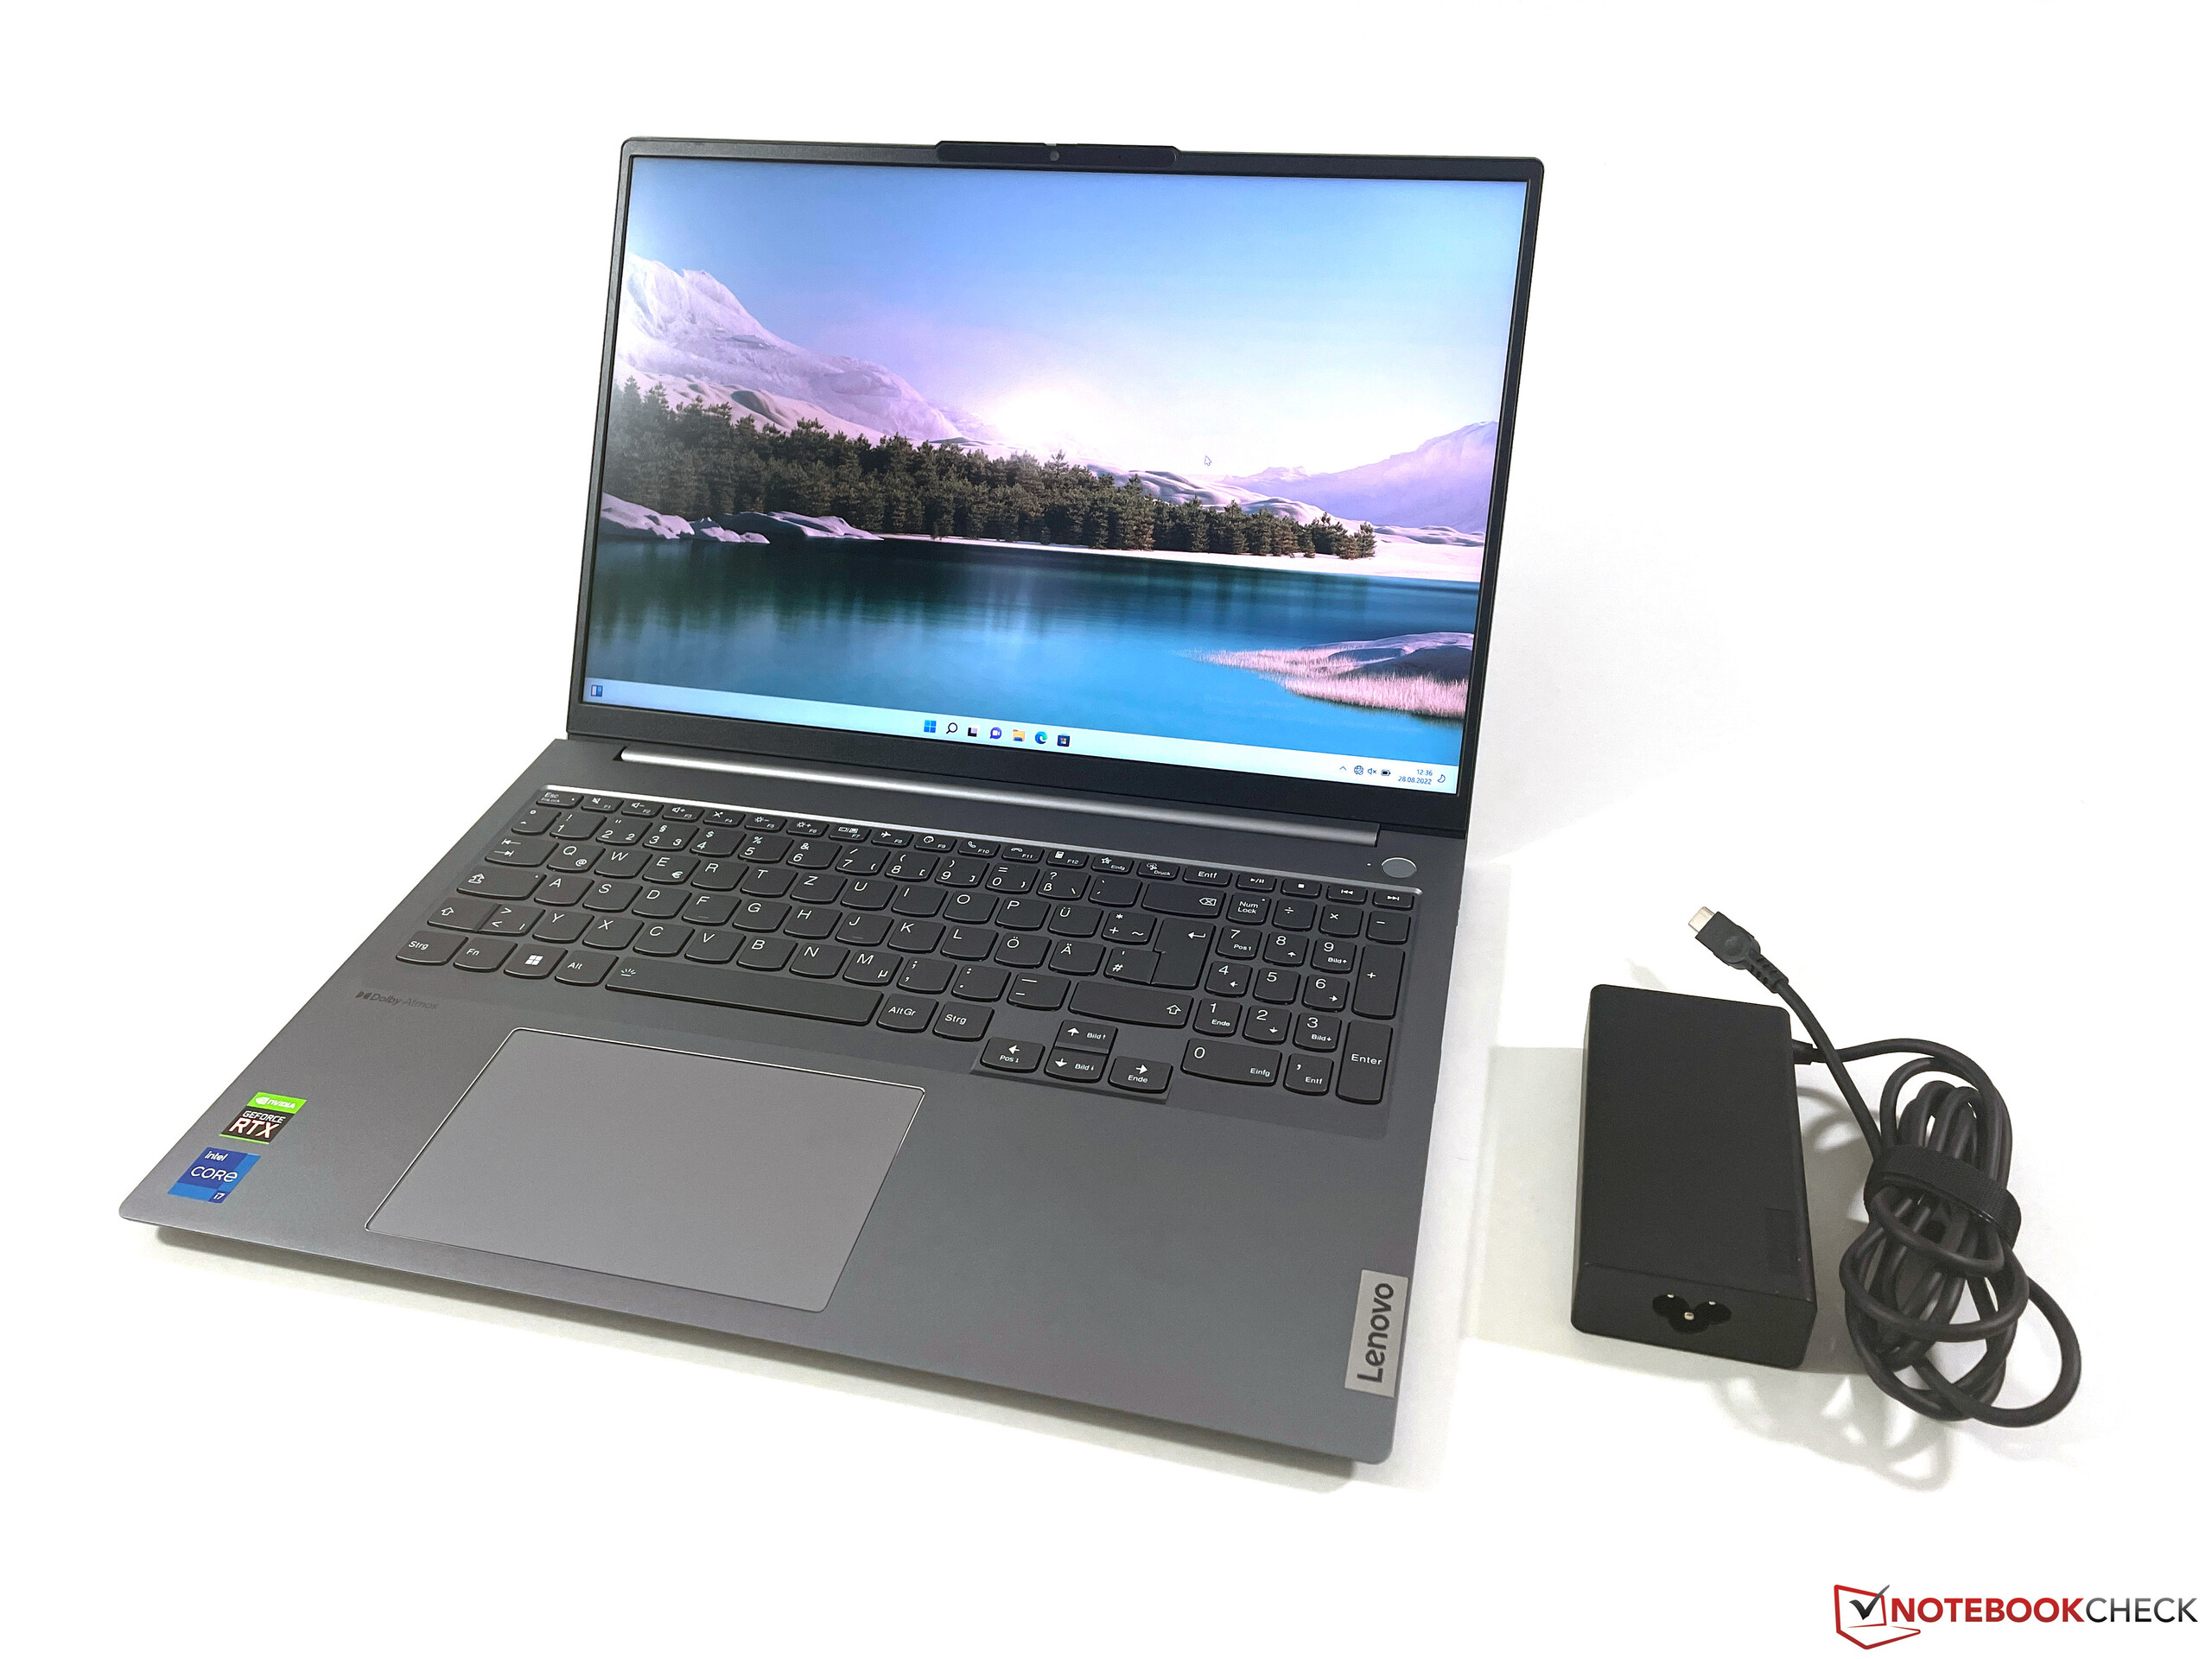
Med undantag förAcer Swift Xär 16-tums enheterna i jämförelsefältet mycket lika varandra när det gäller storlek. ThinkBook är dock lite tunnare än de flesta av rivalerna med endast 1,65 cm. Vikten uppgår till 1,82 kg, exklusive de ytterligare 400 grammen för nätadaptern.
Utrustning - ThinkBook med Thunderbolt 4
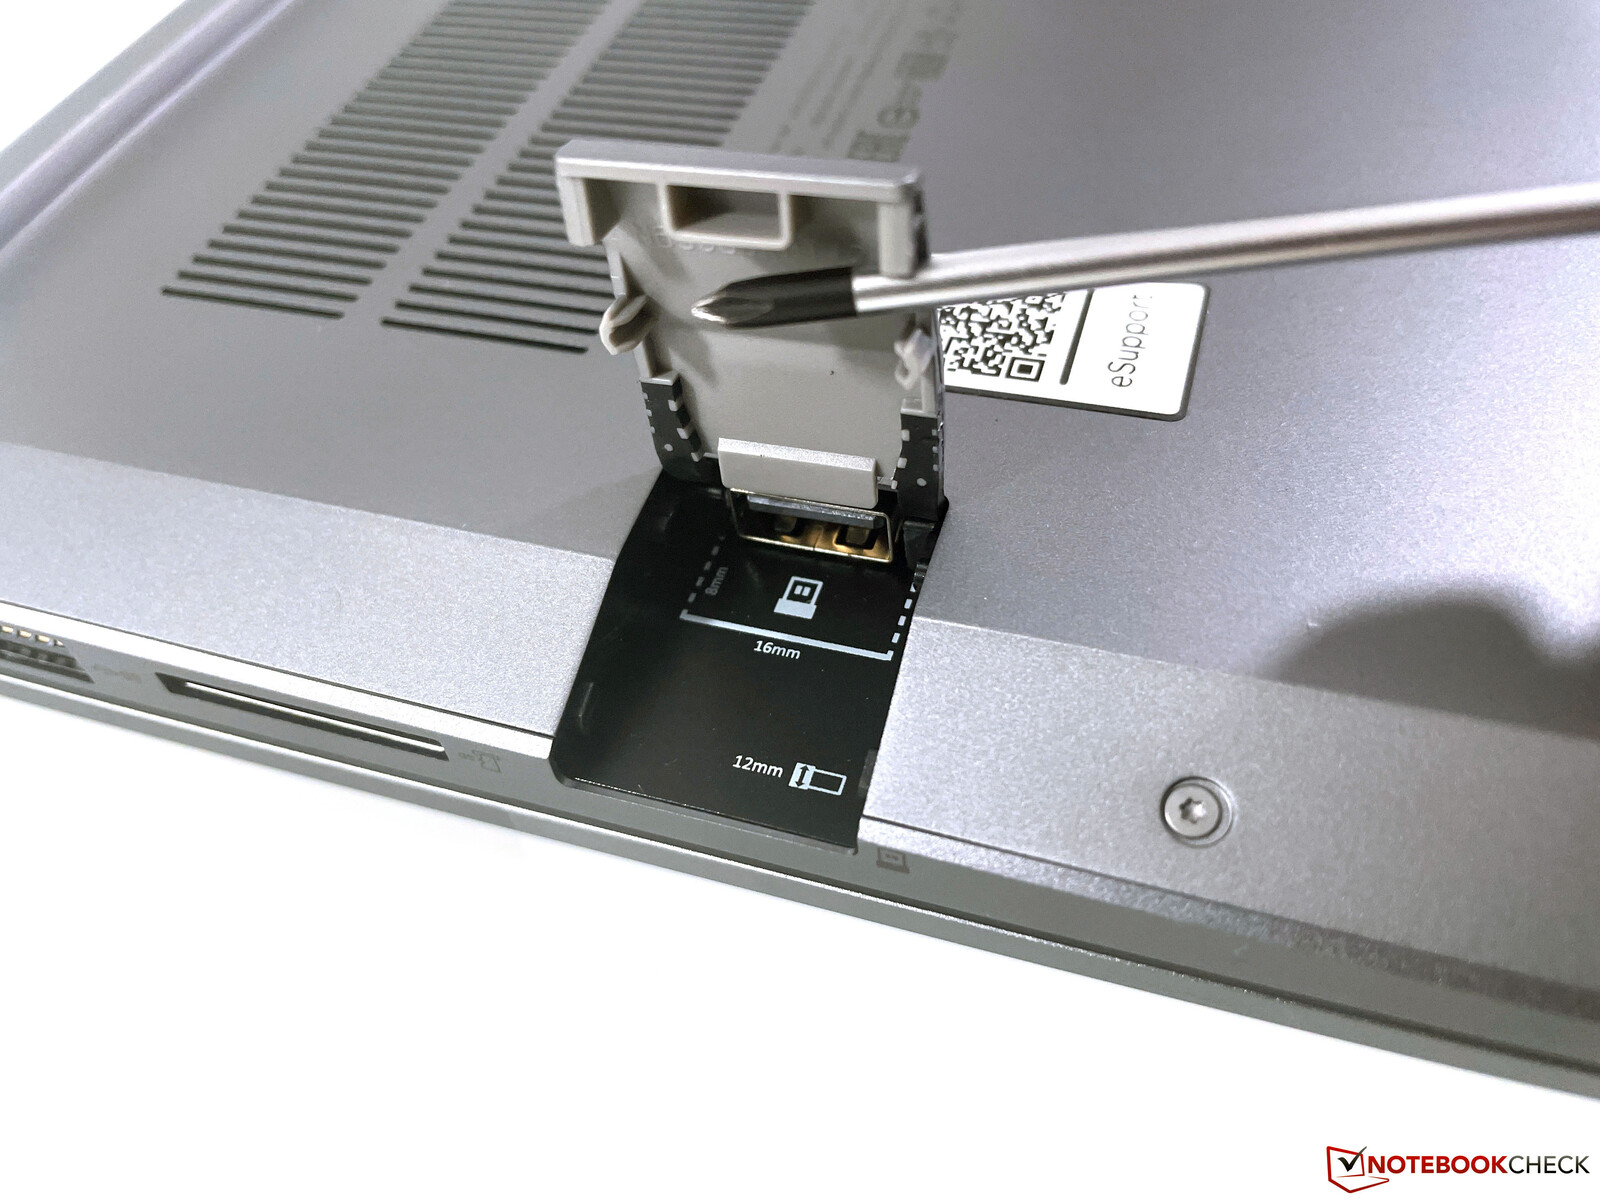
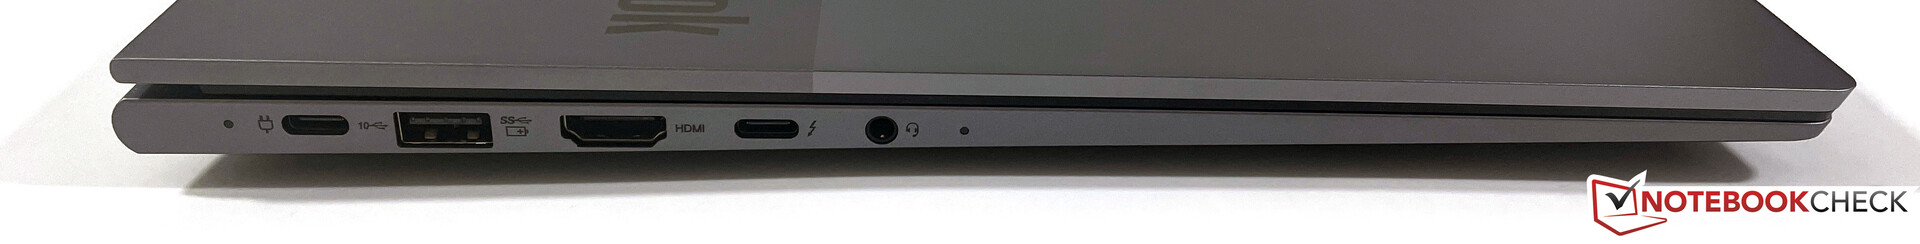
ThinkBook 16 G4+ har praktiskt taget alla portar du kan önska dig. Förutom en modern Thunderbolt 4-port finns det även vanliga USB-A-portar, en fullfjädrad HDMI-utgång och en Gigabit Ethernet-port. Det finns till och med en dold USB-port under en flik på höger sida, som endast uppfyller 2.0-standarden, men som är perfekt för permanent anslutna donglar, till exempel externa inmatningsenheter.
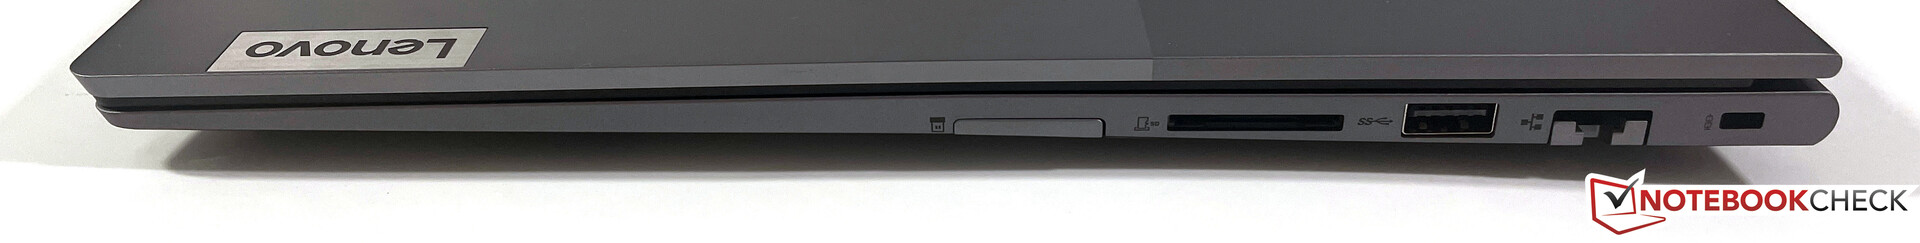
SD-kortläsare
Det finns en SD-kortläsare på höger sida som inte helt rymmer minneskorten (de sticker ut ca 2 cm). Vi uppmätte överföringshastigheter på nästan 90 MB/s via vårt referenskort (Angelbird AV Pro V60 UHS-II), vilket placerar ThinkBook före konkurrenter vars kortläsare endast fungerar via USB 2.0.
| SD Card Reader | |
| average JPG Copy Test (av. of 3 runs) | |
| Genomsnitt av klass Multimedia (23 - 531, n=36, senaste 2 åren) | |
| Lenovo ThinkBook 16 G4+ IAP (Angelbird AV Pro V60) | |
| Asus Vivobook Pro 16X-M7600QE (AV Pro SD microSD 128 GB V60) | |
| Dell Inspiron 16 Plus 7620 (Toshiba Exceria Pro SDXC 64 GB UHS-II) | |
| Samsung Galaxy Book2 15 (Angelbird AV Pro V60) | |
| maximum AS SSD Seq Read Test (1GB) | |
| Genomsnitt av klass Multimedia (37.3 - 1455, n=35, senaste 2 åren) | |
| Lenovo ThinkBook 16 G4+ IAP (Angelbird AV Pro V60) | |
| Asus Vivobook Pro 16X-M7600QE (AV Pro SD microSD 128 GB V60) | |
| Dell Inspiron 16 Plus 7620 (Toshiba Exceria Pro SDXC 64 GB UHS-II) | |
| Samsung Galaxy Book2 15 (Angelbird AV Pro V60) | |
Kommunikation
Förutom Gigabit Ethernet-modulen (Intel I219-V) installerar Lenovo den mycket moderna Intel AX211E Wi-Fi 6E-modulen, som teoretiskt sett stöder de senaste 6 GHz-nätverken. Vi kunde dock inte ansluta till 6 GHz-nätverket i vår referensrouter från Asus. Ändå var överföringshastigheterna mycket höga och stabila på 5 GHz-nätverket, varför det inte finns några egentliga begränsningar i praktiken.
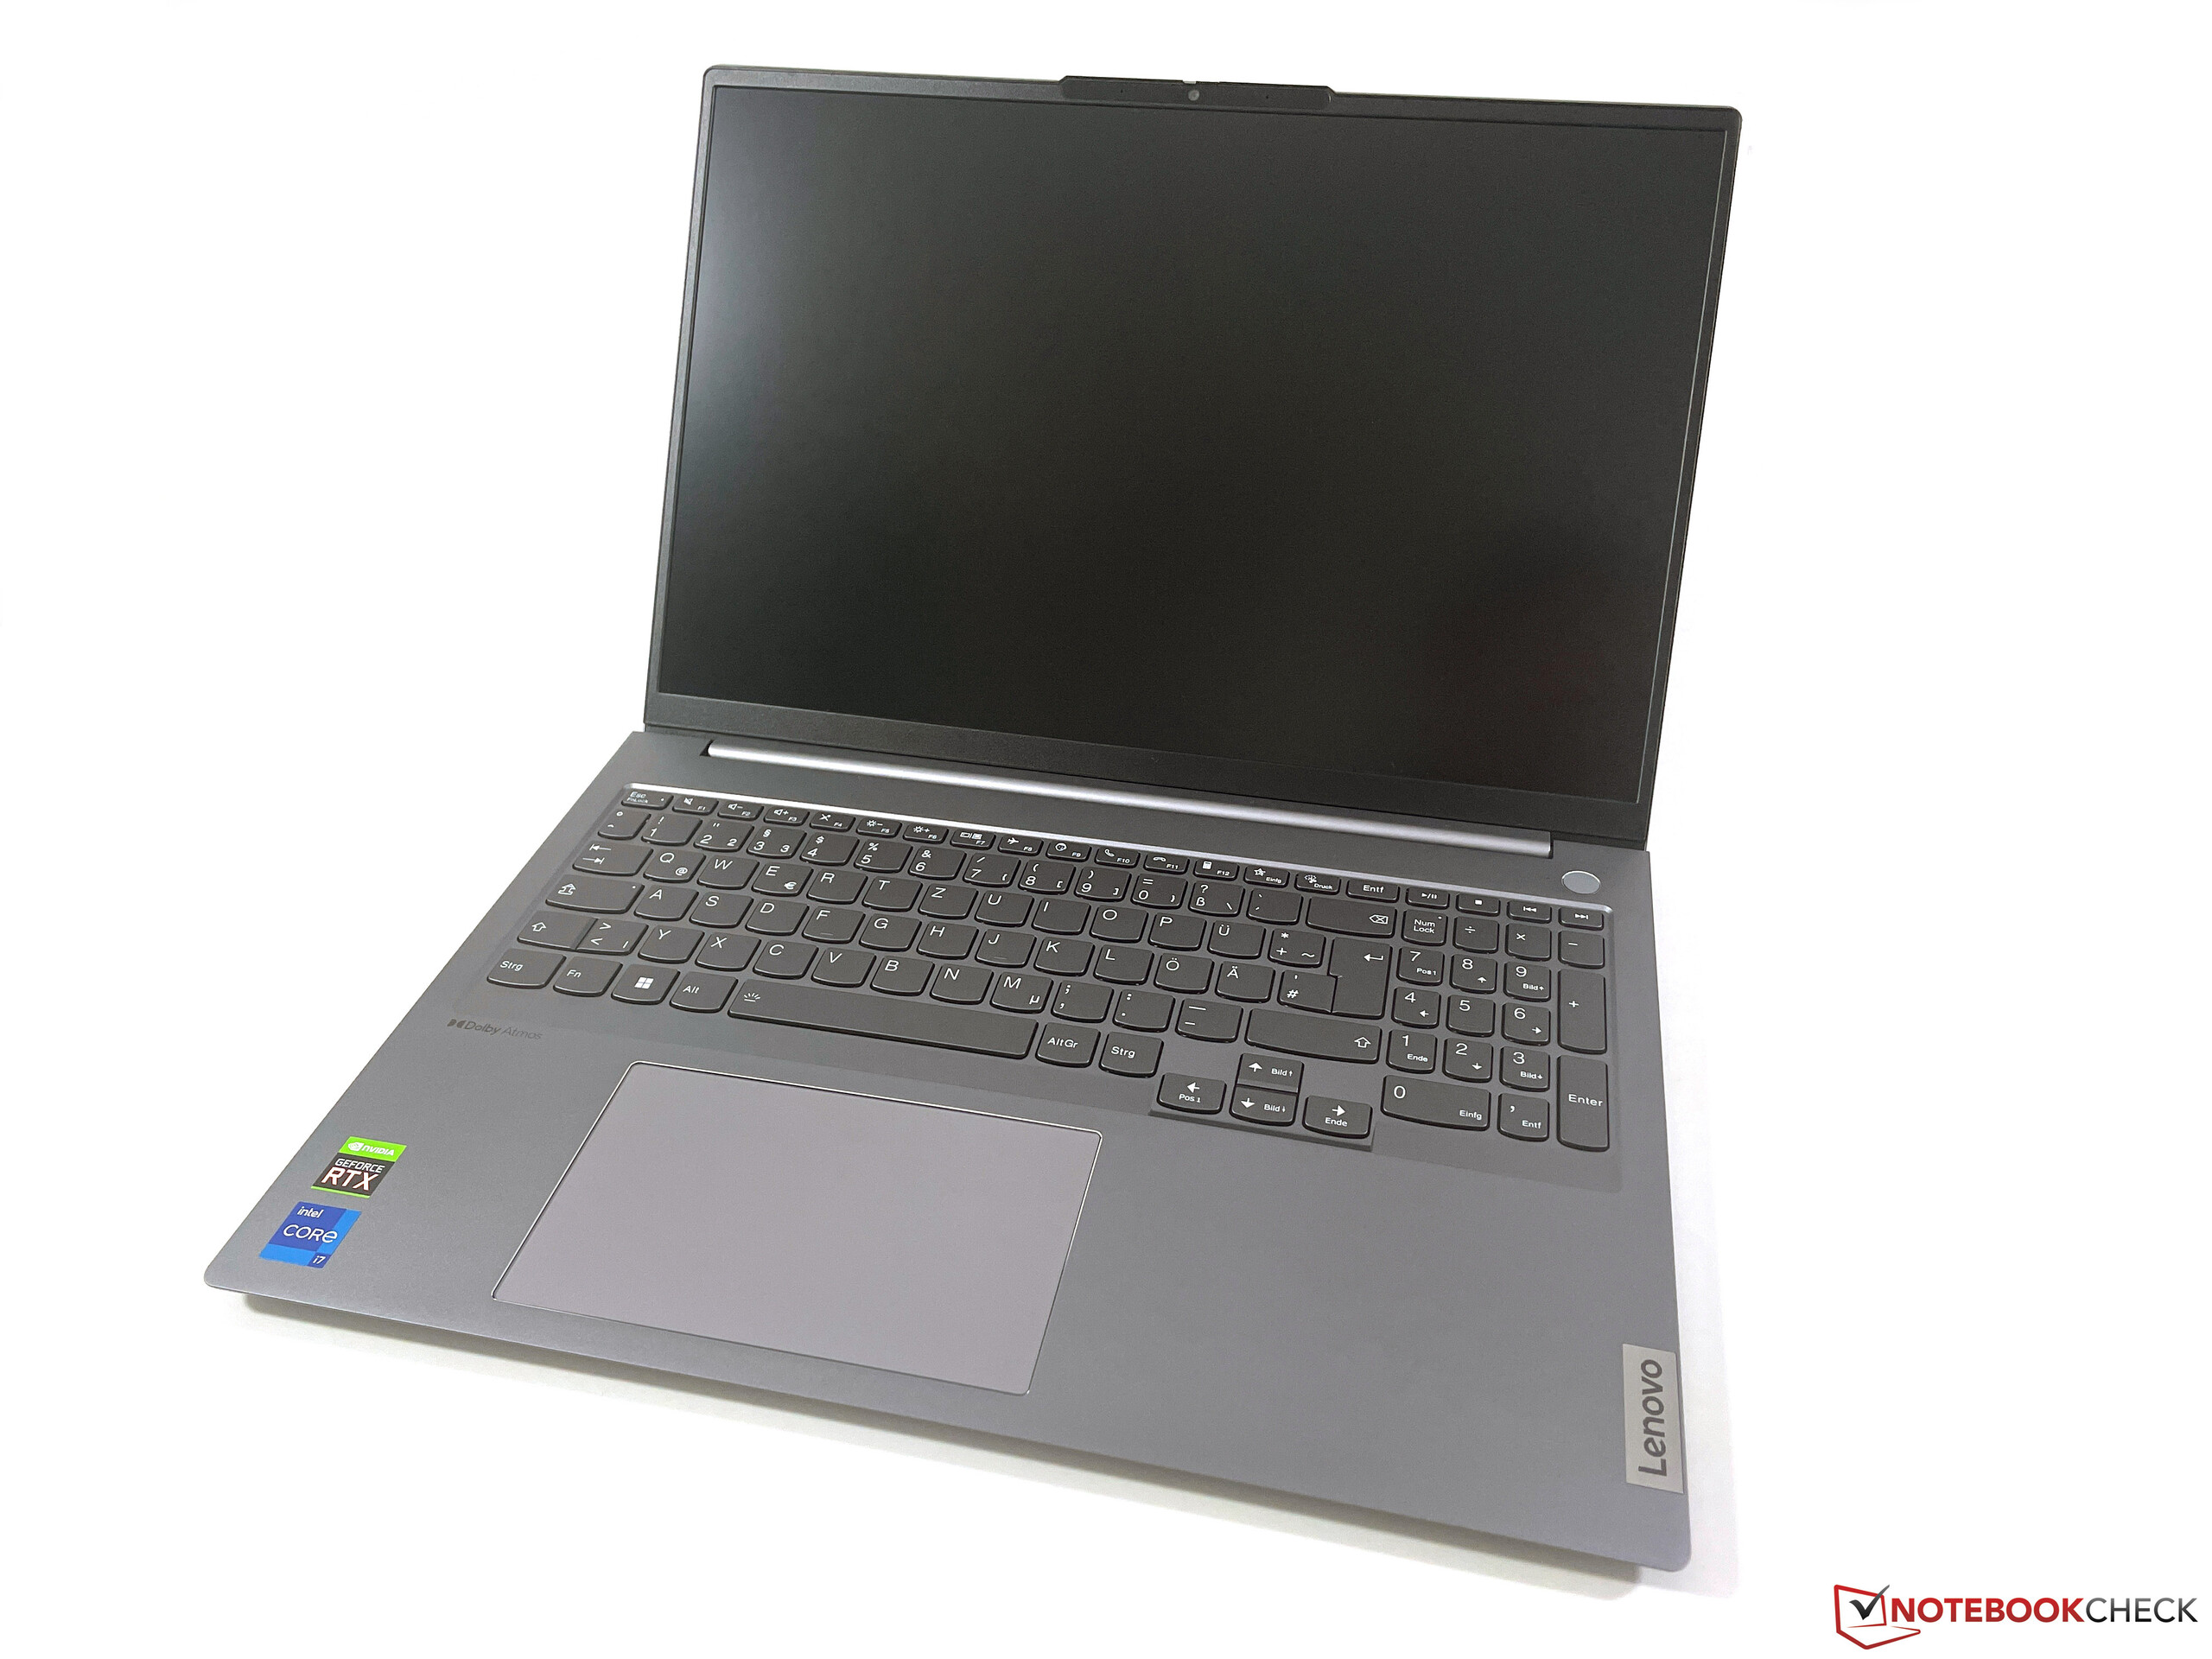
Webbkamera
ThinkBook har en 1080p-kamera med mekanisk slutare som ger bättre bilder än tidigare 720p-moduler. Dessutom finns det en IR-kamera för ansiktsigenkänning via Windows Hello.


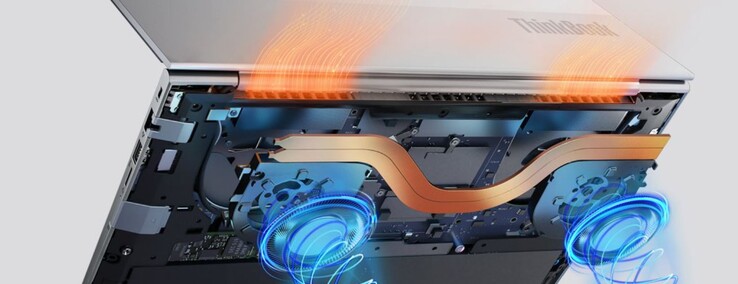
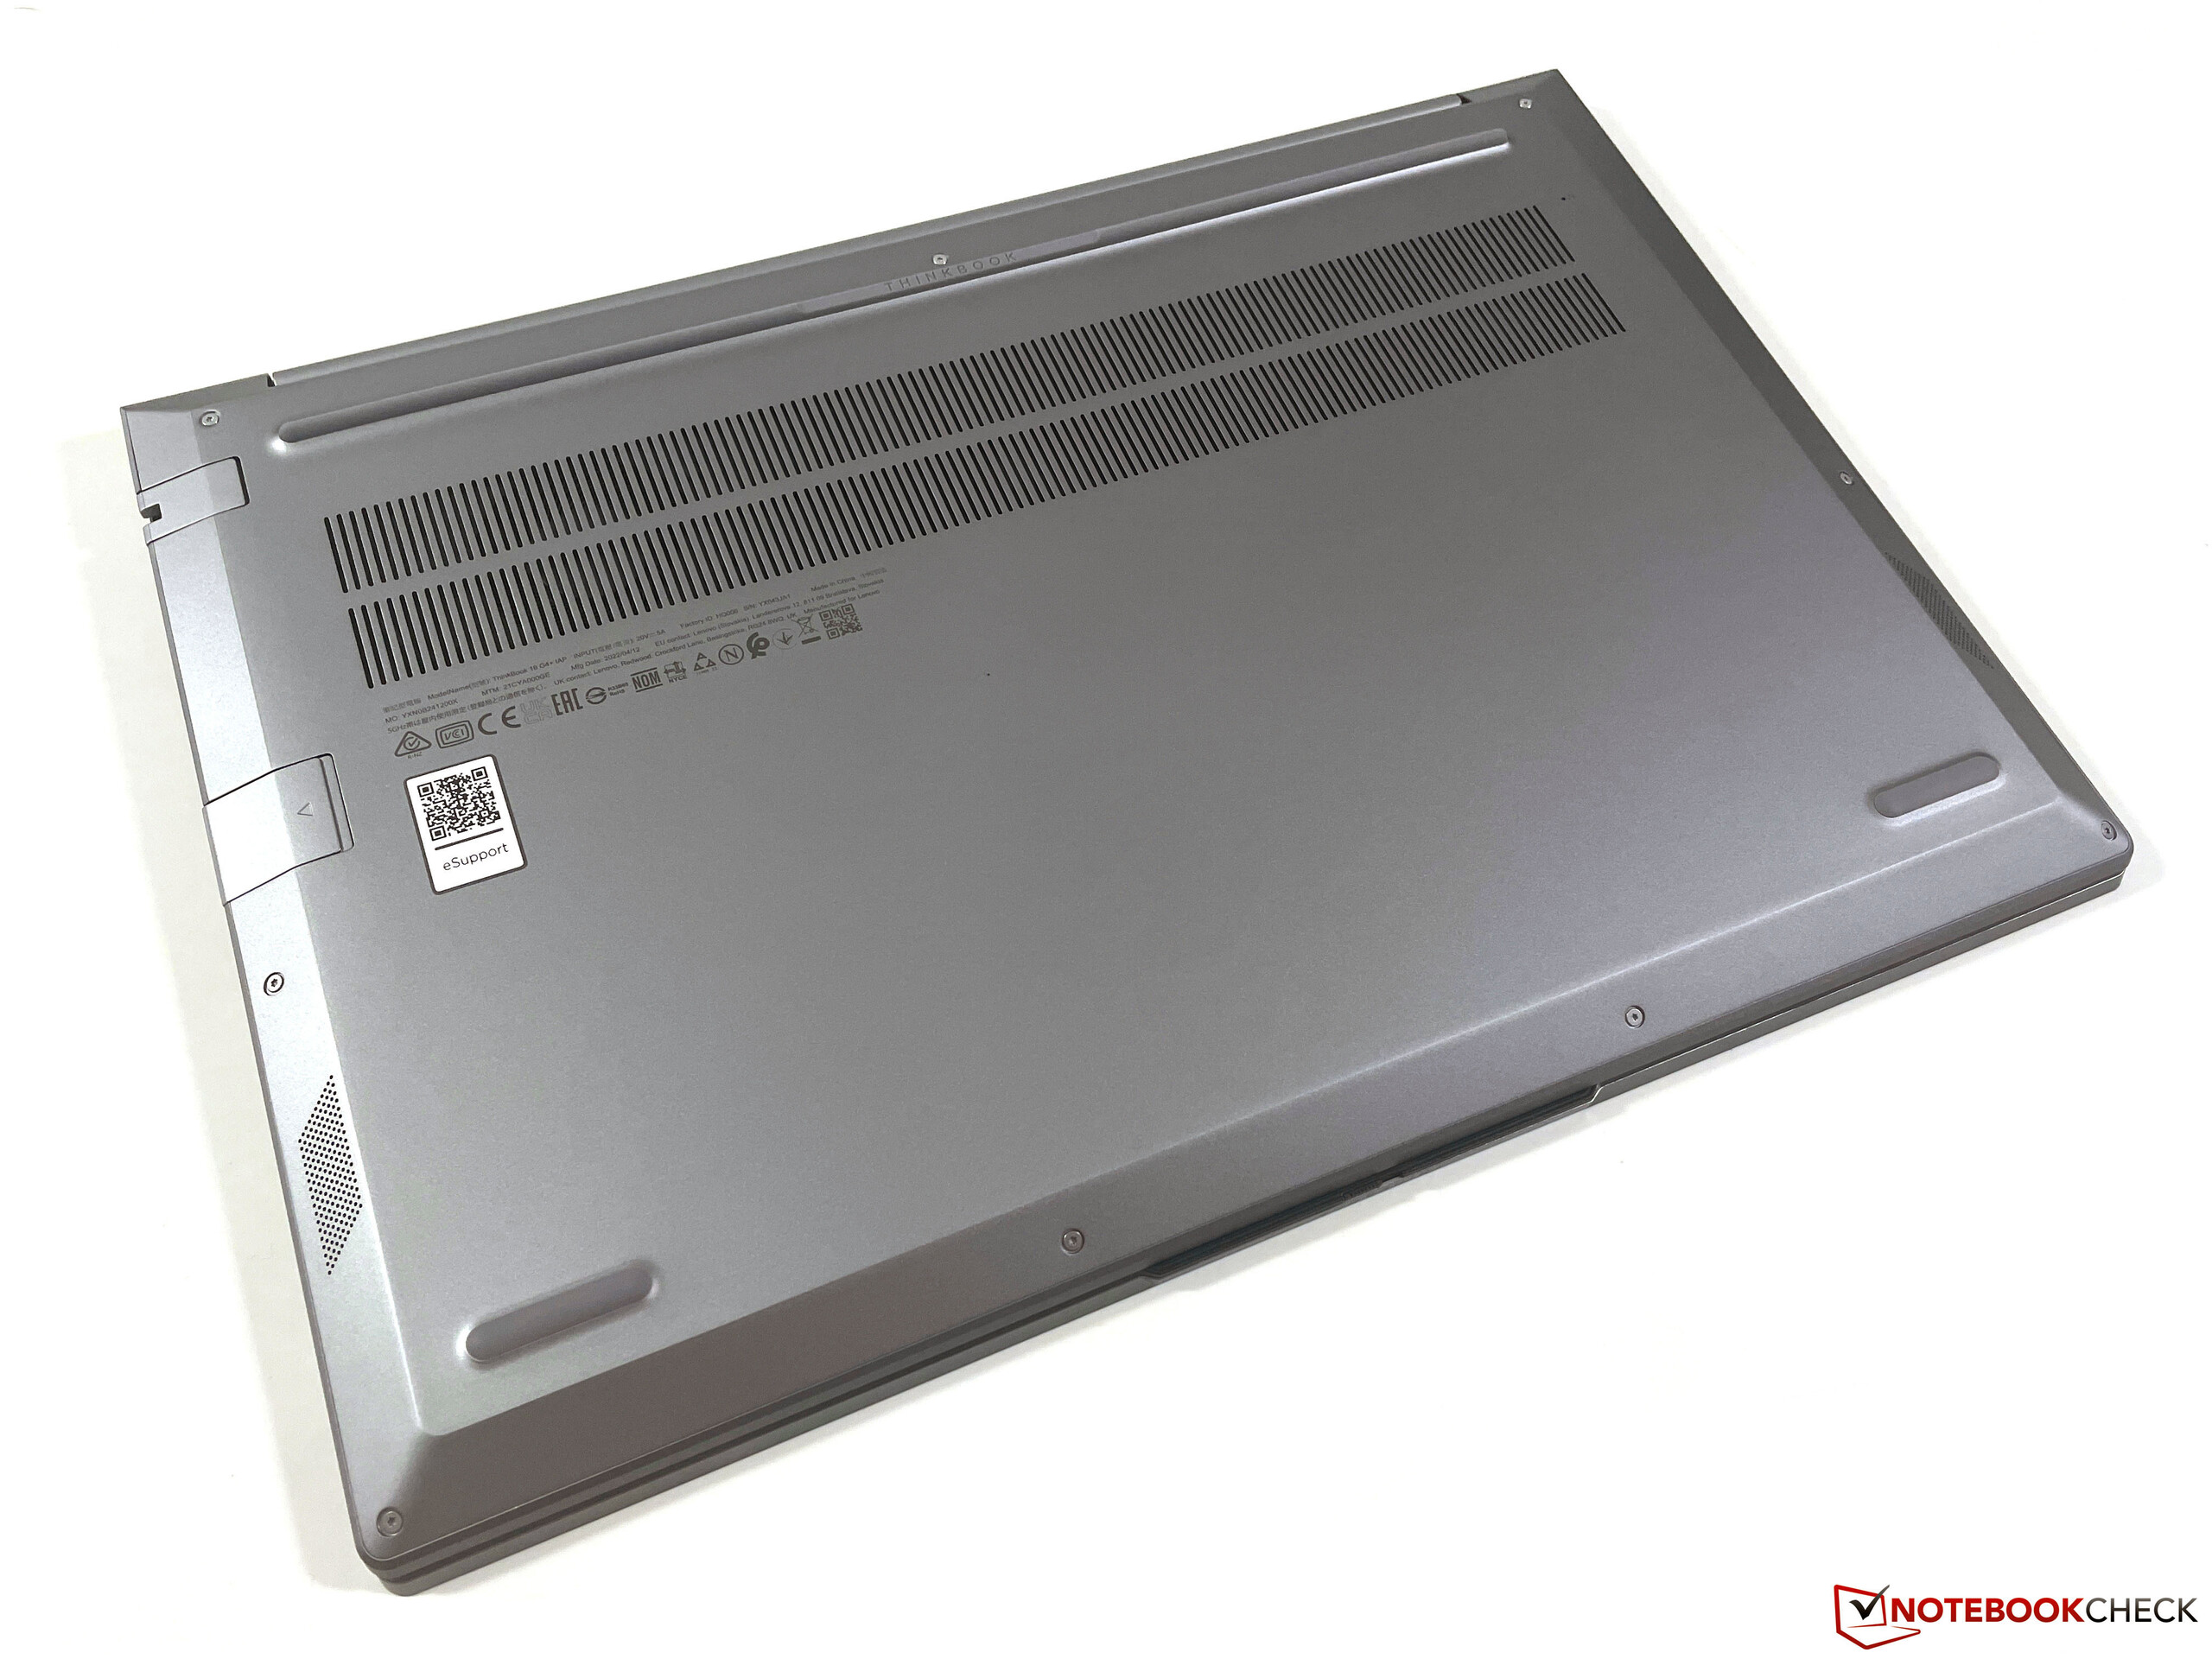
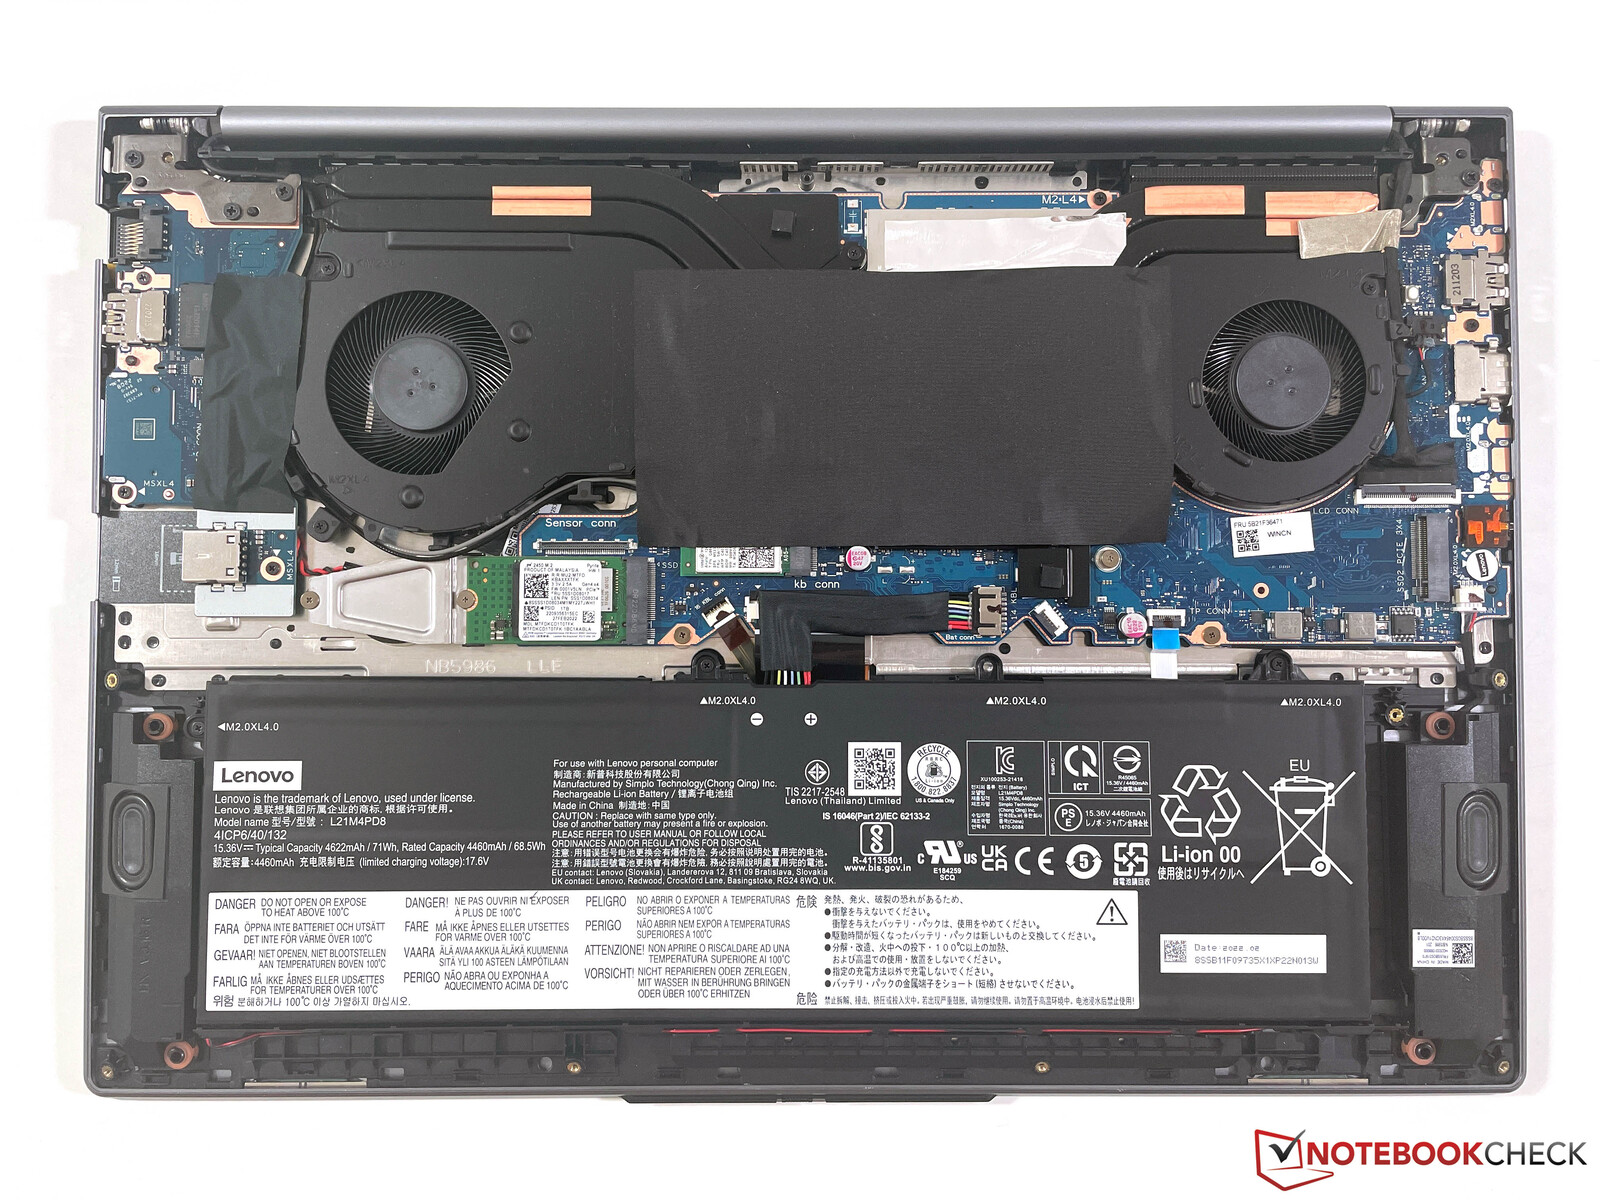
Underhåll
Grundplattan är fäst med totalt 10 Torxskruvar (T5) och kan lätt tas bort. Därefter kan du rengöra de två fläktarna och komma åt de två M.2-2280-platserna för SSD-diskar. WLAN-modulen är delvis överklistrad, men kan i princip bytas ut. Endast RAM-minnet är fastlött och kan inte uppgraderas.
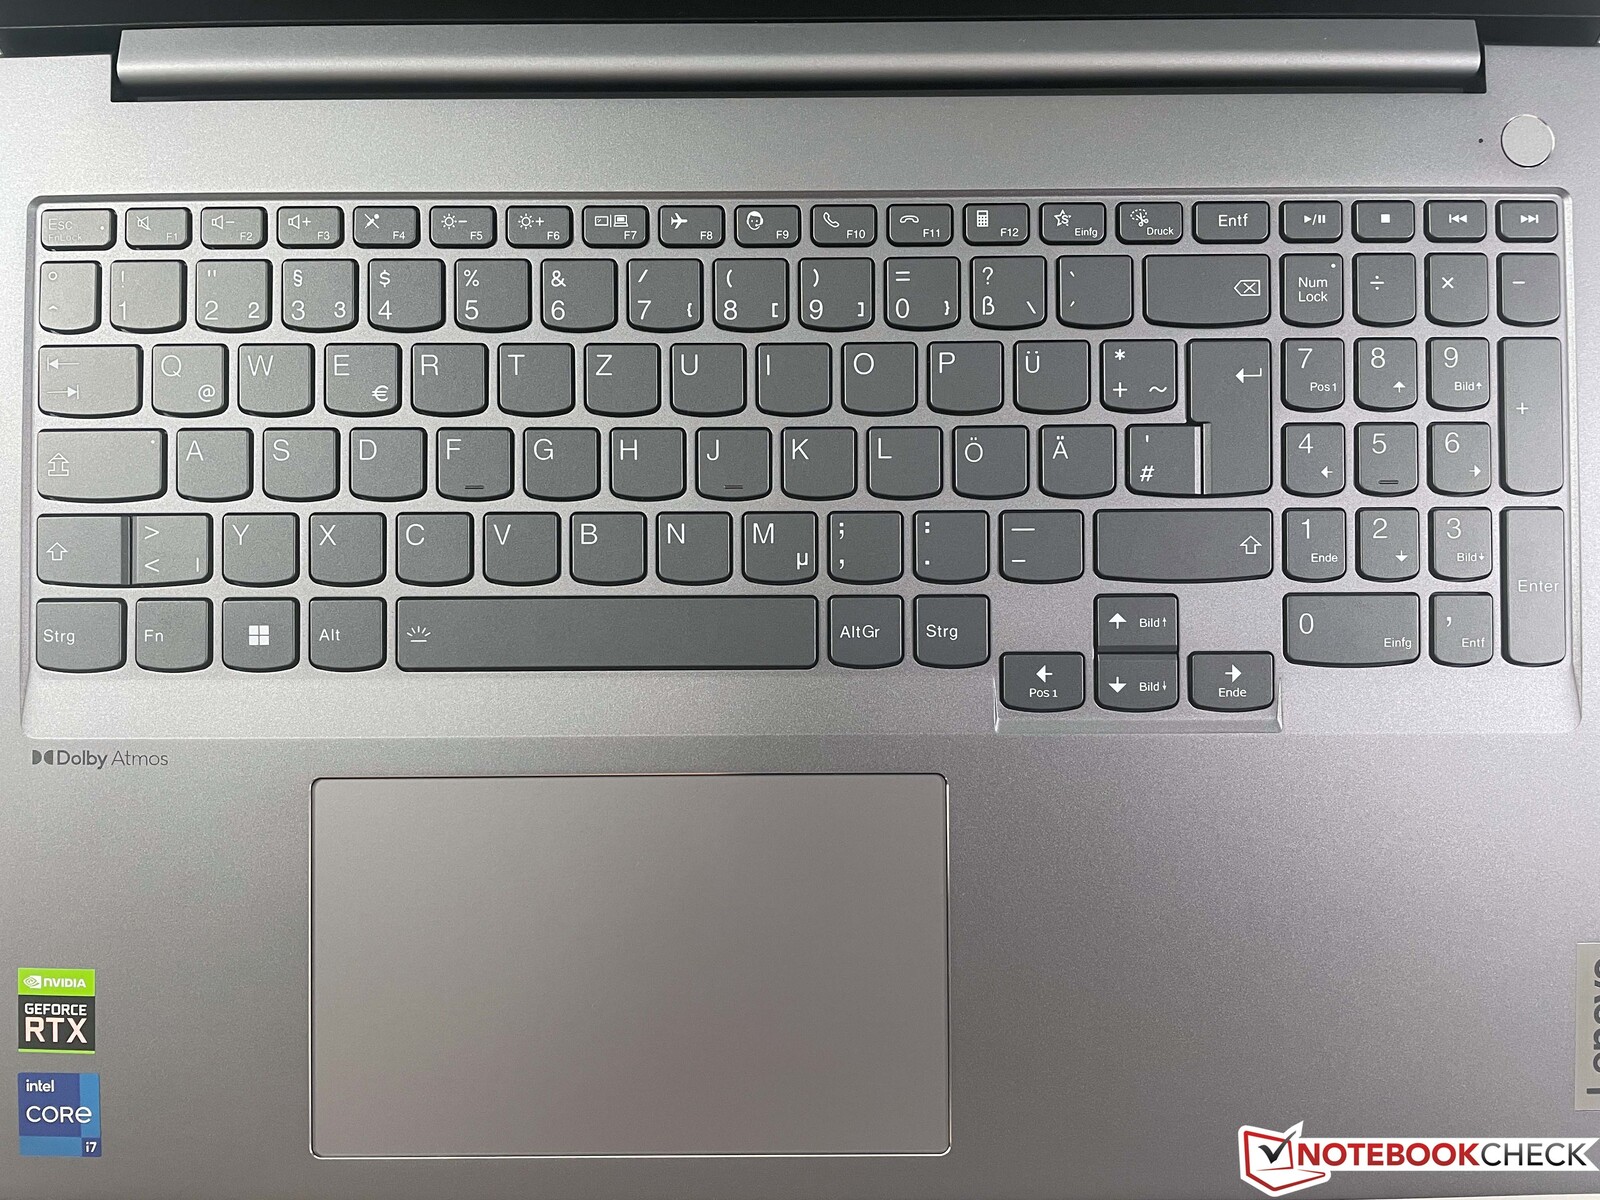
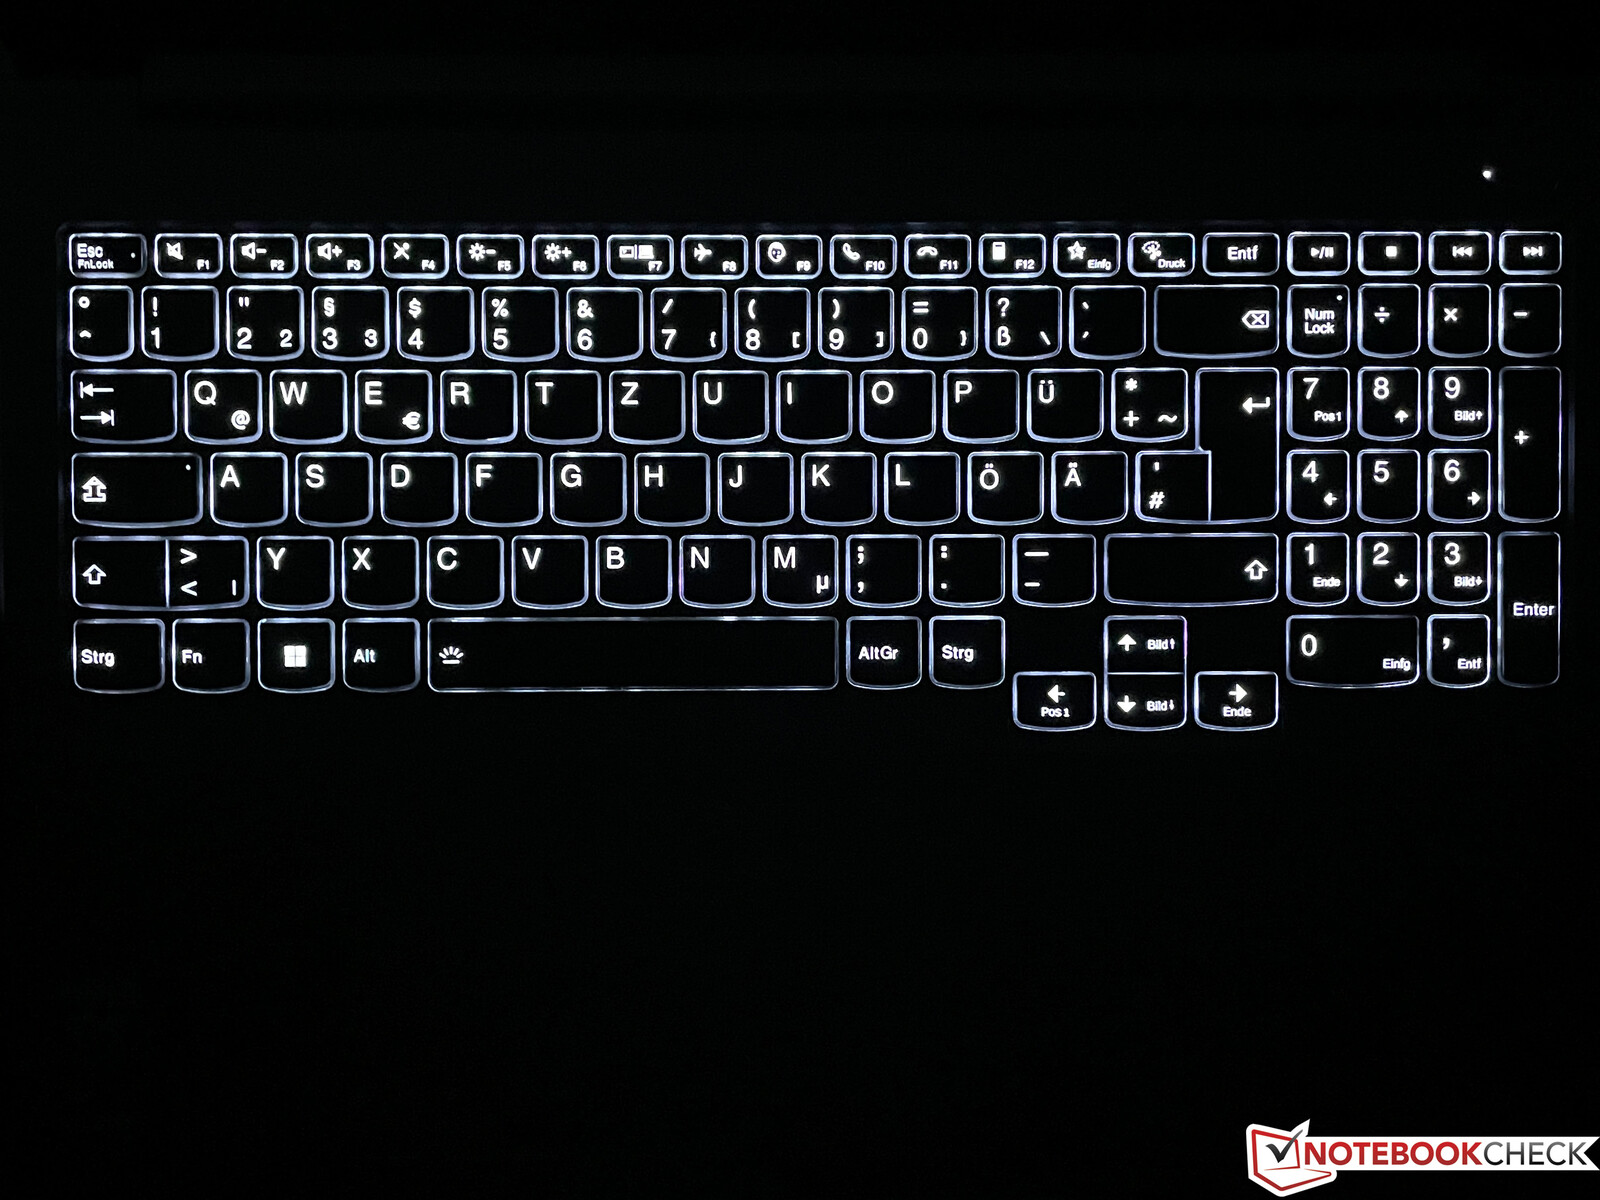
Inmatningsenheter - Bärbar multimedieapparat med ett genomsnittligt tangentbord
Det mörkgrå tangentbordet har en vit bakgrundsbelysning med två nivåer och en dedikerad nummerplatta på höger sida, även om tangenterna är lite smalare här. När det gäller skrivkänslan ligger ThinkBook mer i linje med tillverkarens IdeaPads än ThinkPads. Tangenternas rörlighet är ganska kort, men återkopplingen är i alla fall mycket exakt och tangenterna skramlar inte heller. Enligt vår mening slösar Lenovo bort en del potential här; det finns bekvämare ingångar om du ofta skriver mycket långa texter. Strömbrytaren är placerad till höger ovanför tangentbordet och innehåller en fingeravtrycksläsare.
Den stora ClickPad har förskjutits något till vänster och erbjuder med sina 12 x 7,5 cm tillräckligt med utrymme för pekarnavigation samt gester med upp till fyra fingrar. Detta fungerar mycket bra tack vare Microsofts Precision -standard och kudden skramlar inte heller. Den nedre halvan kan tryckas fysiskt, men detta kännetecknas av högljudda och billigt klingande klickljud, så du bör endast trycka på plattan (tap to click).
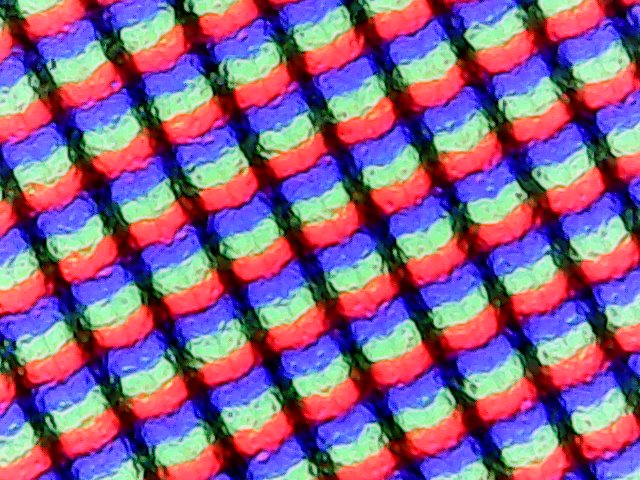
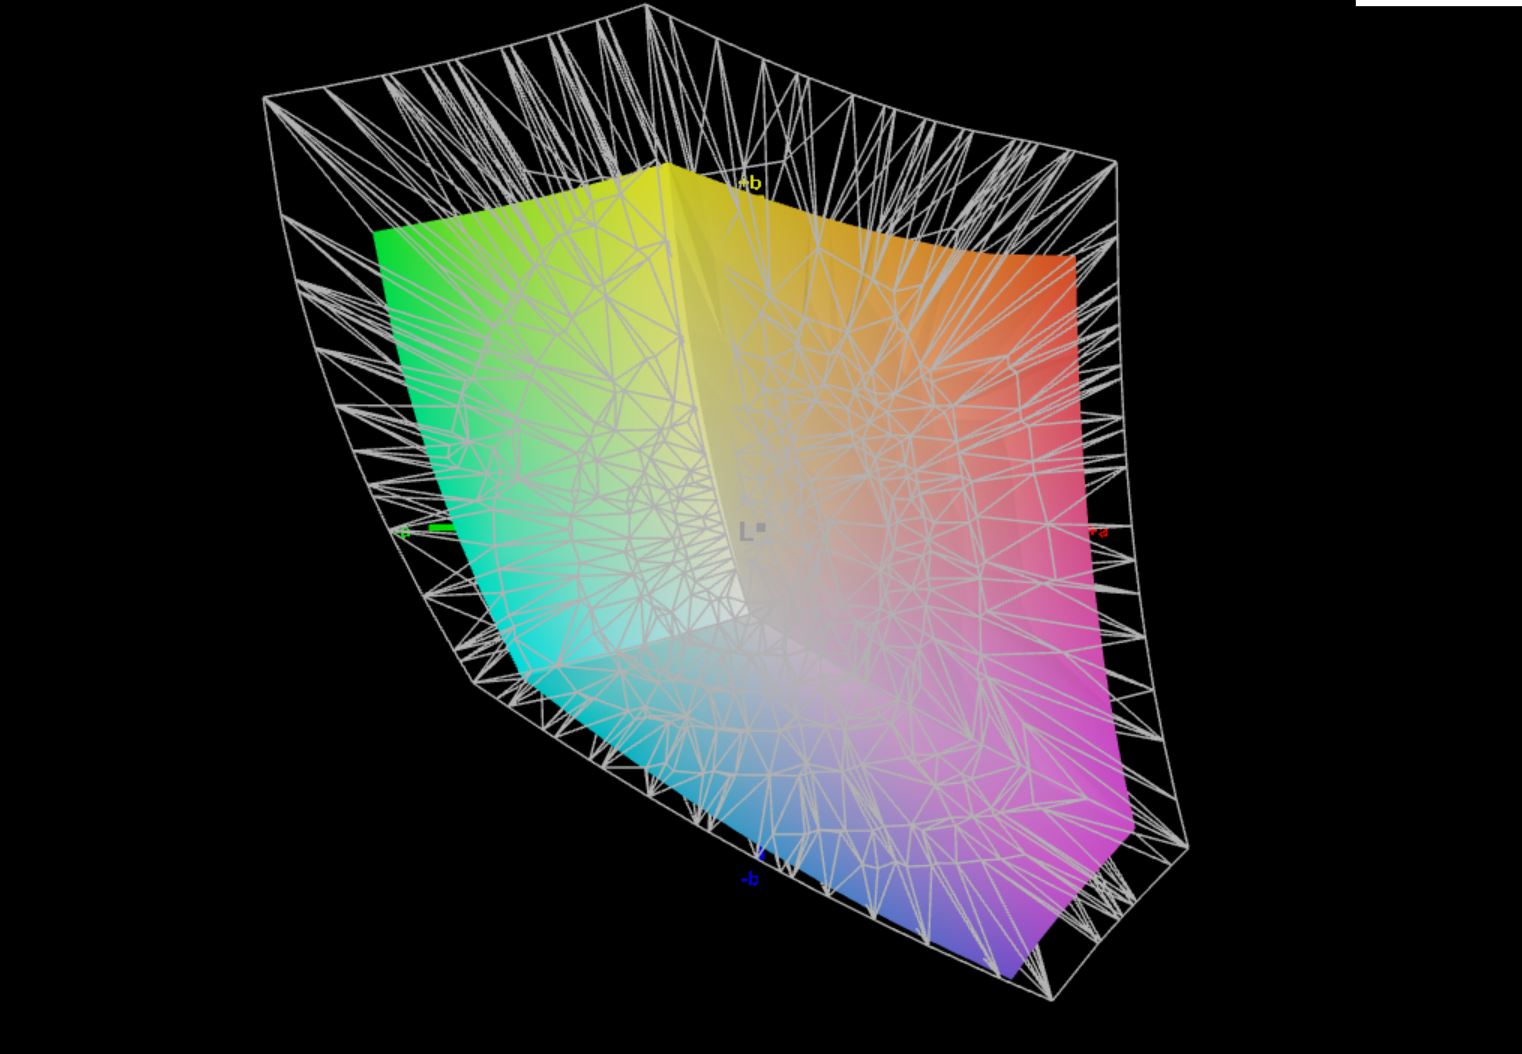
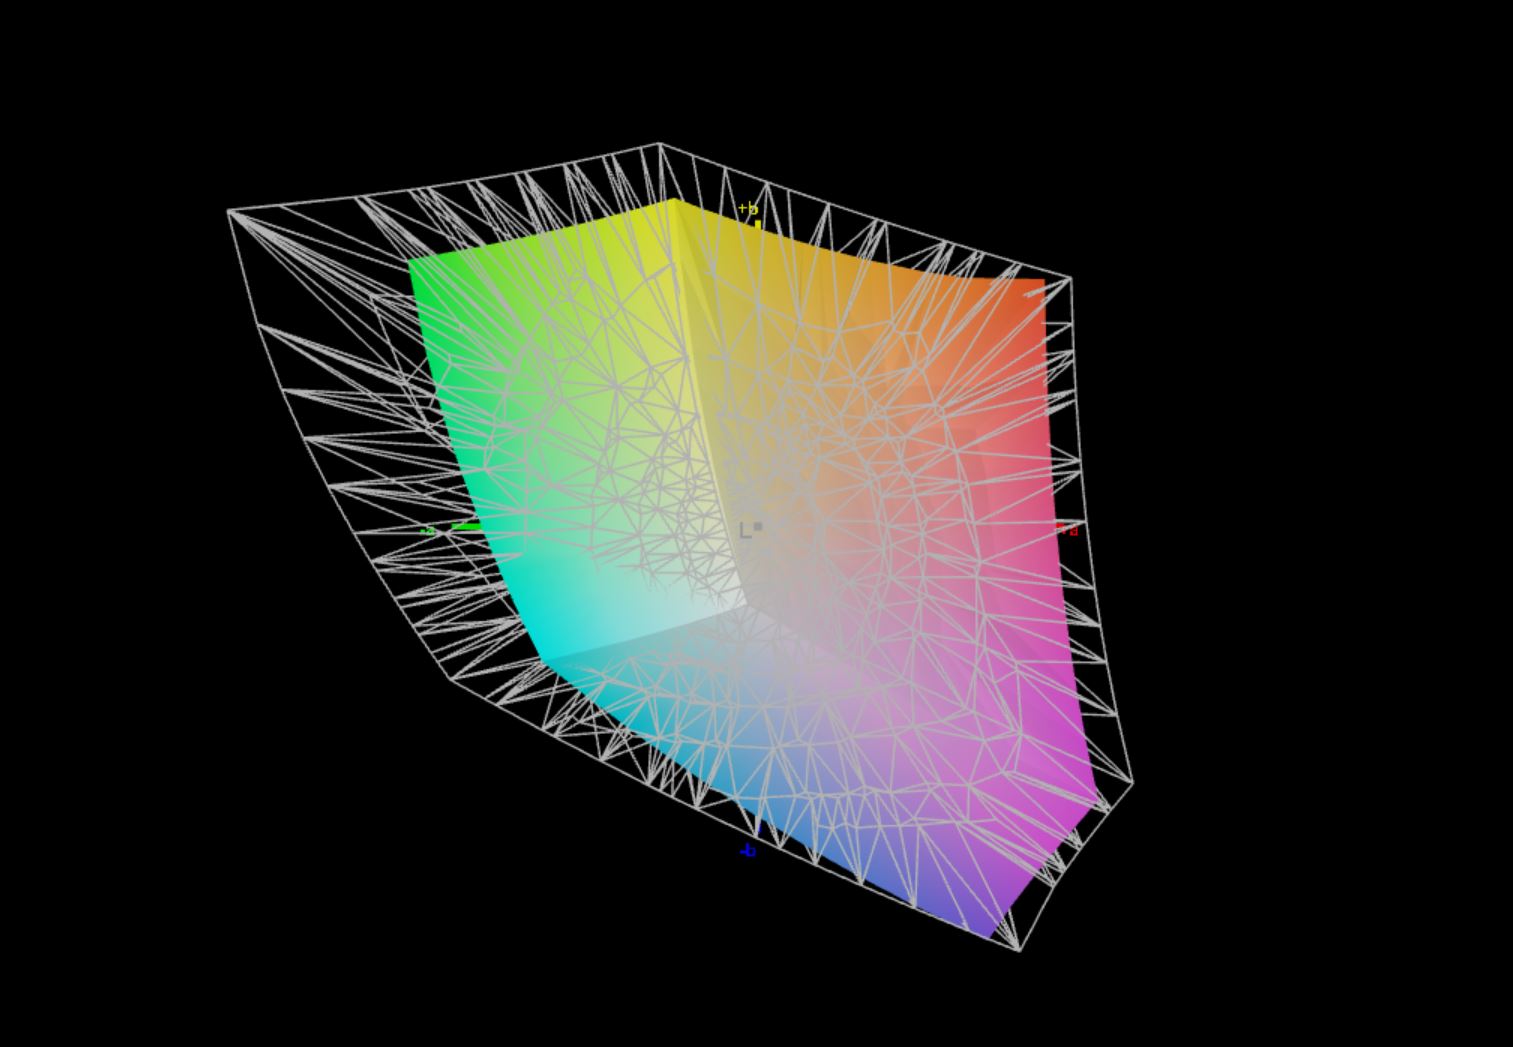
Skärm - Matt WQHD IPS-panel
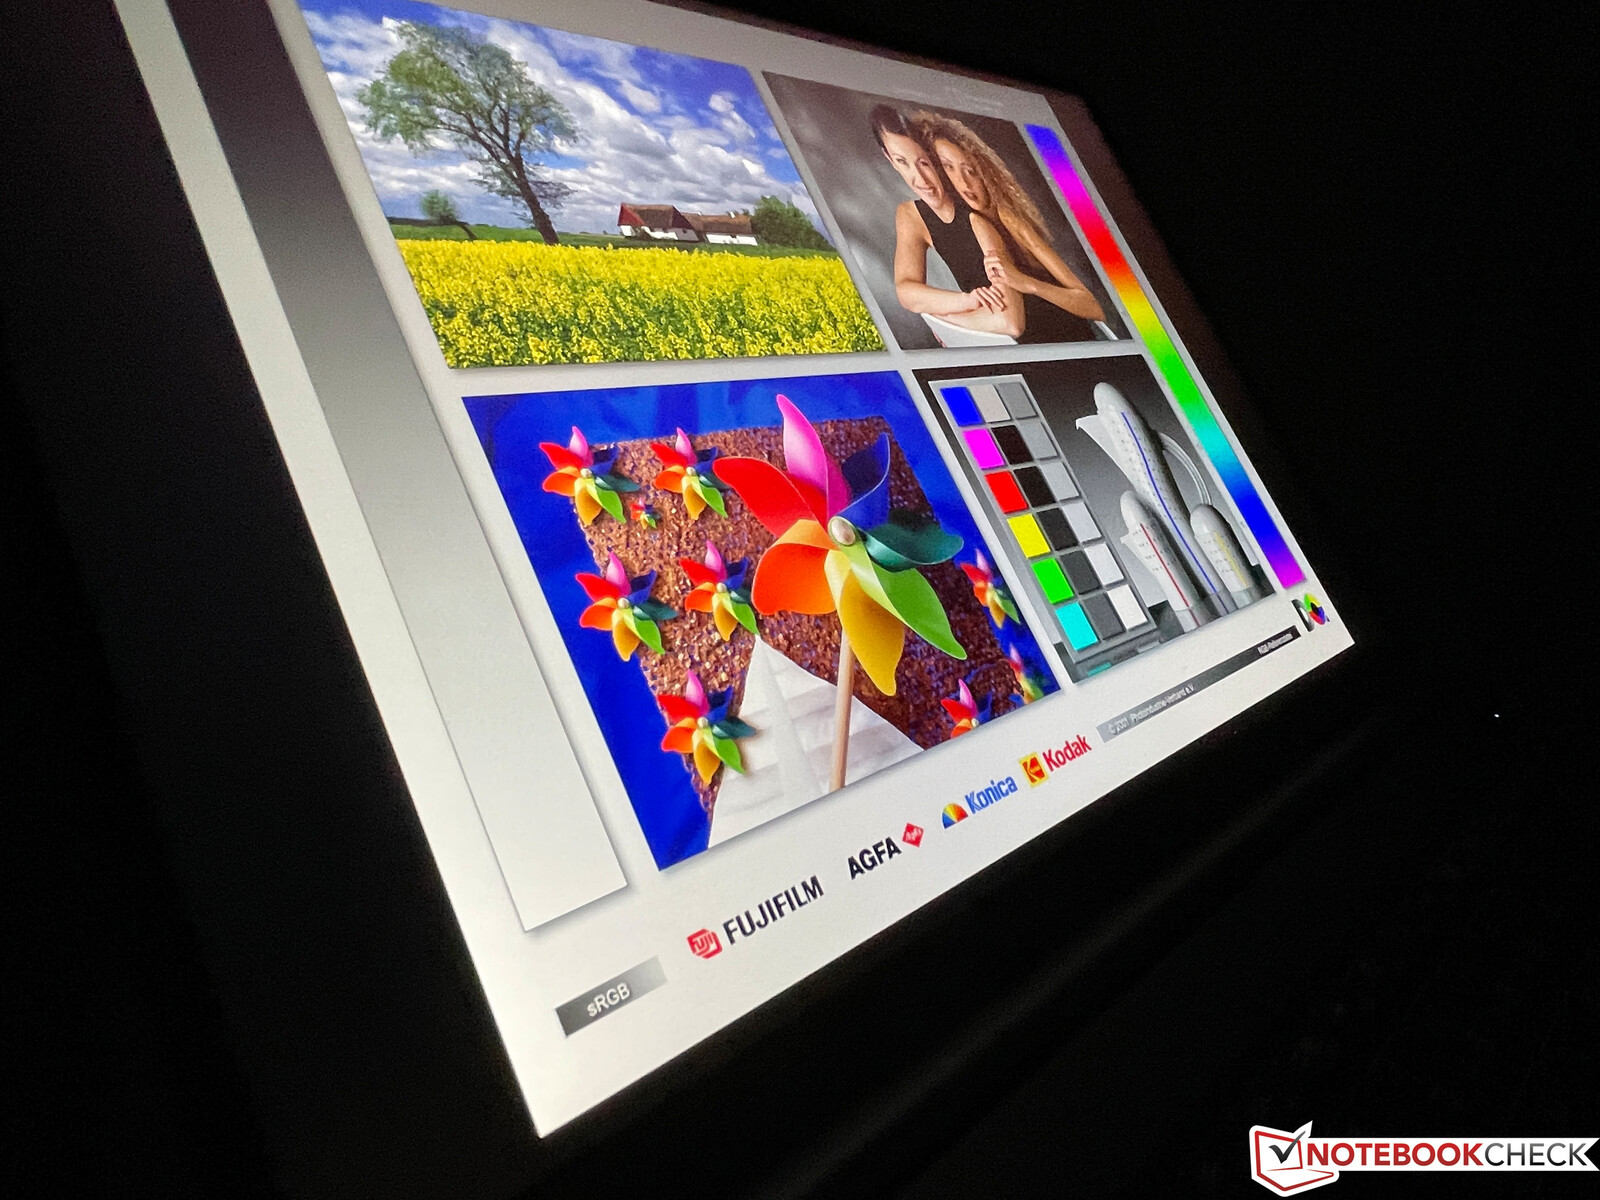
Lenovo utrustar ThinkBook 16 G4+ med en matt WQHD-panel i 16:10-format, men det finns två olika versioner av IPS-skärmen. Vårt recensionsexemplar använder en 60 Hz-panel, men enligt specifikationsbladet finns även en 120 Hz-modell med fabriksfärgkalibrering som tillval.
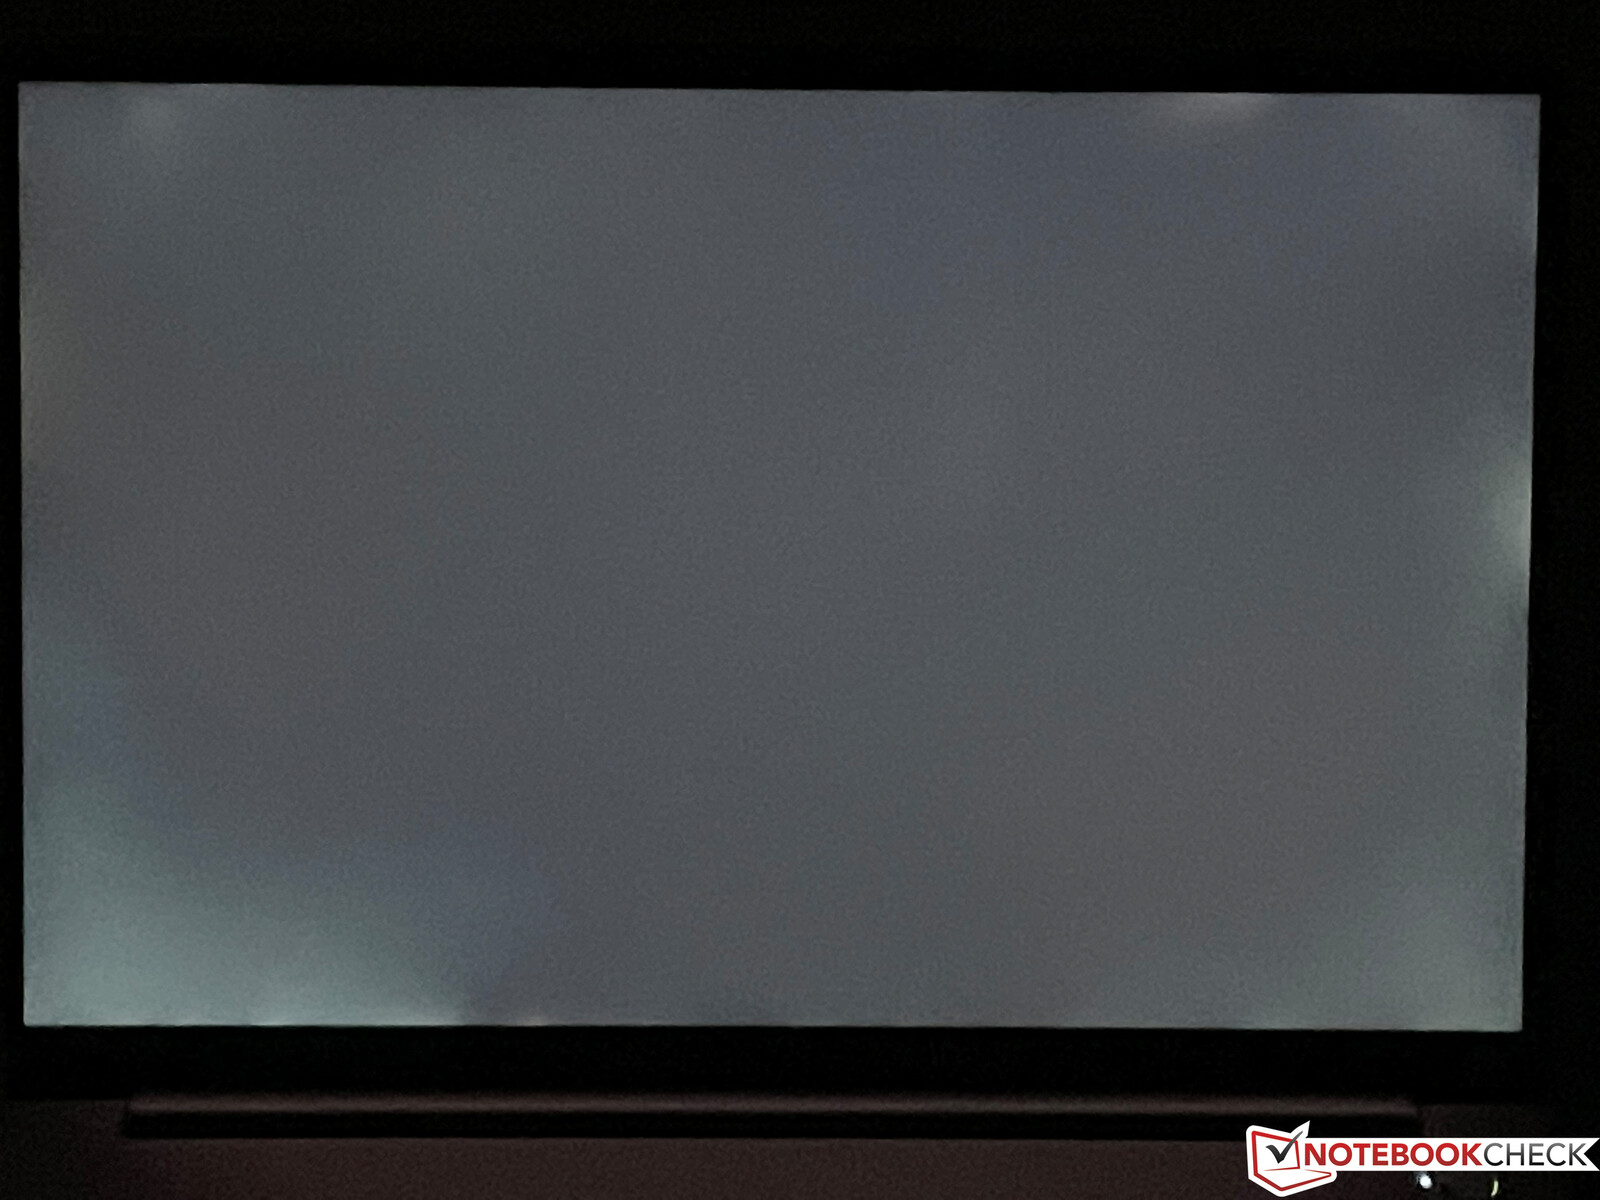
Vårt subjektiva bildintryck av den matta panelen är mycket bra. Innehållet visas tydligt, färgerna är levande och ljusa områden är inte korniga. Vi fastställde ett mycket bra kontrastförhållande på nästan 1700:1 (svartvärde 0,23), vilket säkert också bidrar till det levande bildintrycket. Lenovo anger en ljusstyrka på 350 cd/m², vilket vår panel precis överträffar. Det finns inget PWM-flimmer och responstiderna är oansenliga, men det finns tydligt synliga halos på mörka bakgrunder vid höga ljusstyrkor. IPS-skärmens betraktningsvinkelstabilitet är mycket bra, men HDR-innehåll stöds inte.
| |||||||||||||||||||||||||
Distribution av ljusstyrkan: 91 %
Mitt på batteriet: 372 cd/m²
Kontrast: 1613:1 (Svärta: 0.23 cd/m²)
ΔE ColorChecker Calman: 2.6 | ∀{0.5-29.43 Ø4.71}
calibrated: 1.3
ΔE Greyscale Calman: 3.7 | ∀{0.09-98 Ø4.96}
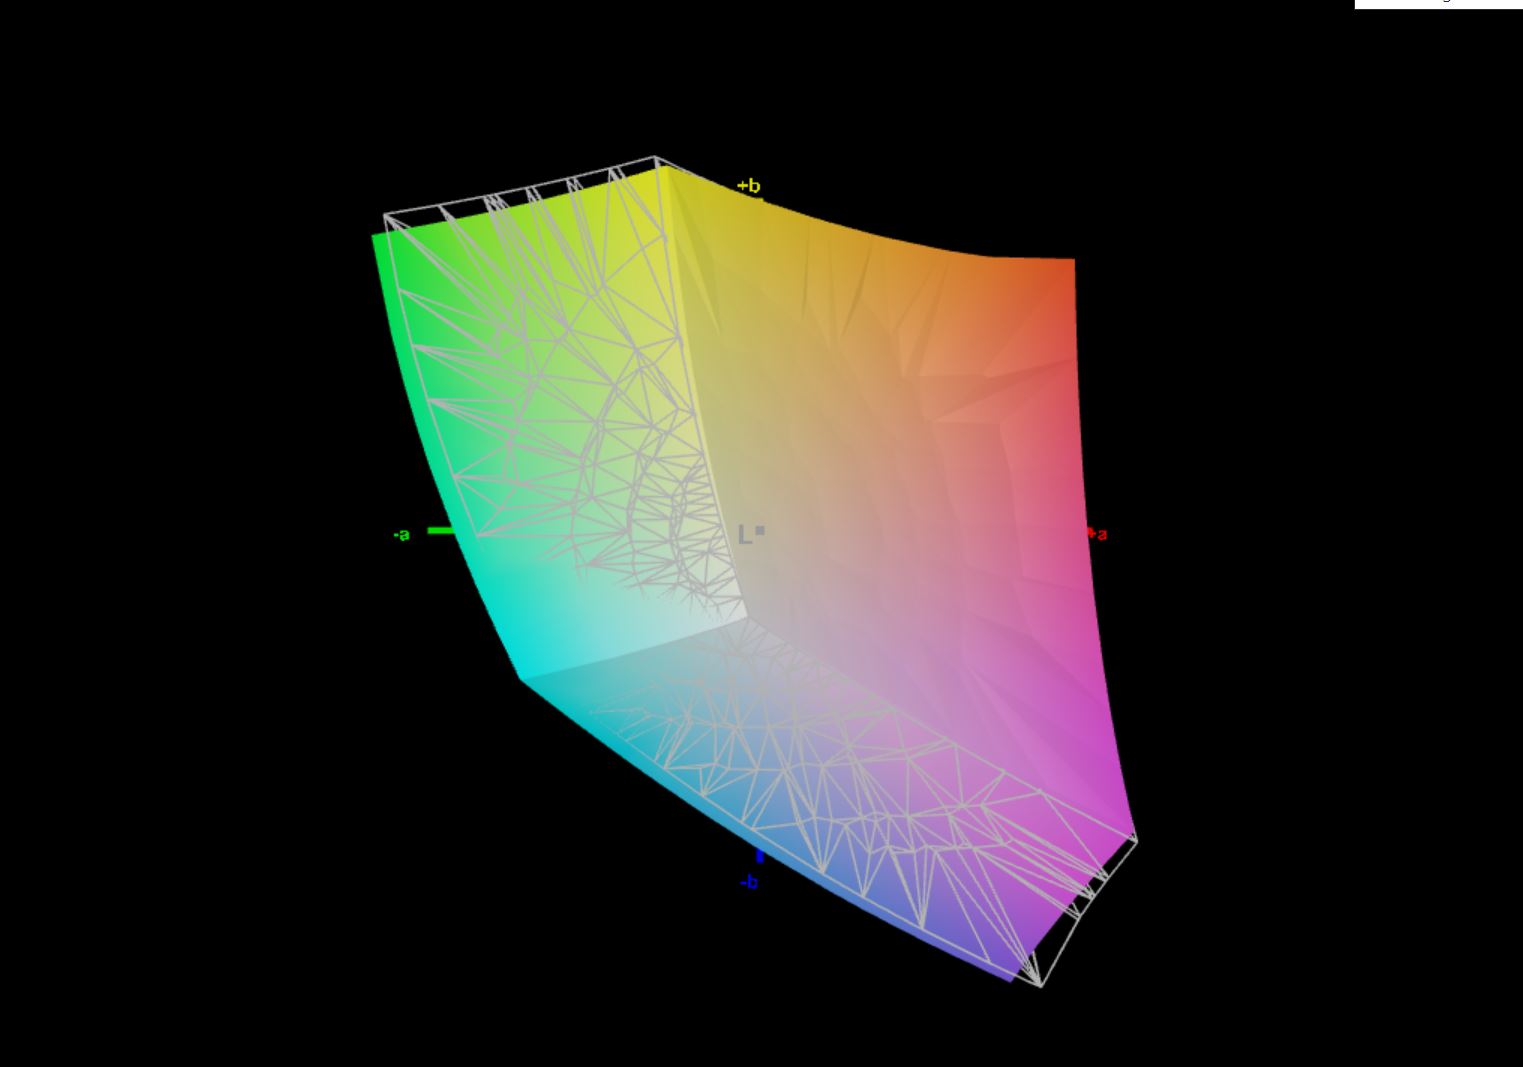
71.7% AdobeRGB 1998 (Argyll 3D)
97.5% sRGB (Argyll 3D)
69.6% Display P3 (Argyll 3D)
Gamma: 2.32
CCT: 7271 K
| Lenovo ThinkBook 16 G4+ IAP LEN160WQXGA, IPS, 2560x1600, 16" | Dell Inspiron 16 Plus 7620 BOE NE16N41, IPS, 3072x1920, 16" | Acer Swift X SFX16-51G-5388 Chi Mei N161HCA-EA3, , 1920x1080, 16.1" | Asus Vivobook Pro 16X-M7600QE Samsung ATNA60YV02-0, OLED, 3840x2400, 16.1" | Huawei MateBook D 16 2022 BOE NV160WUM-NH0, IPS, 1920x1200, 16" | Samsung Galaxy Book2 15 NE156FHM-NS0, IPS, 1920x1080, 15.6" | |
|---|---|---|---|---|---|---|
| Display | 2% | -5% | 27% | -4% | -27% | |
| Display P3 Coverage (%) | 69.6 | 70.8 2% | 65.1 -6% | 99.8 43% | 66.2 -5% | 49.6 -29% |
| sRGB Coverage (%) | 97.5 | 99.5 2% | 95.65 -2% | 100 3% | 96.4 -1% | 74.8 -23% |
| AdobeRGB 1998 Coverage (%) | 71.7 | 73.2 2% | 66.75 -7% | 96.9 35% | 68.3 -5% | 51.3 -28% |
| Response Times | -42% | -6% | 91% | -2% | -24% | |
| Response Time Grey 50% / Grey 80% * (ms) | 32.7 ? | 38 ? -16% | 30 ? 8% | 2 ? 94% | 30.5 ? 7% | 32.3 ? 1% |
| Response Time Black / White * (ms) | 16.8 ? | 28 ? -67% | 20 ? -19% | 2 ? 88% | 18.7 ? -11% | 25 ? -49% |
| PWM Frequency (Hz) | 60 ? | |||||
| Screen | 8% | 11% | 14% | -19% | -71% | |
| Brightness middle (cd/m²) | 371 | 288.9 -22% | 276 -26% | 392 6% | 319 -14% | 337 -9% |
| Brightness (cd/m²) | 357 | 276 -23% | 264 -26% | 396 11% | 317 -11% | 325 -9% |
| Brightness Distribution (%) | 91 | 92 1% | 85 -7% | 98 8% | 90 -1% | 89 -2% |
| Black Level * (cd/m²) | 0.23 | 0.26 -13% | 0.16 30% | 0.23 -0% | 0.4 -74% | |
| Contrast (:1) | 1613 | 1111 -31% | 1725 7% | 1387 -14% | 843 -48% | |
| Colorchecker dE 2000 * | 2.6 | 1.88 28% | 1.8 31% | 1.74 33% | 3.4 -31% | 4.7 -81% |
| Colorchecker dE 2000 max. * | 4.4 | 4.37 1% | 3.77 14% | 3.18 28% | 8.1 -84% | 15.7 -257% |
| Colorchecker dE 2000 calibrated * | 1.3 | 0.42 68% | 0.63 52% | 1.85 -42% | 0.8 38% | 2.8 -115% |
| Greyscale dE 2000 * | 3.7 | 1.4 62% | 2.76 25% | 1.77 52% | 5.7 -54% | 5.4 -46% |
| Gamma | 2.32 95% | 2.3 96% | 2.37 93% | 2.22 99% | 2.1 105% | 2.07 106% |
| CCT | 7271 89% | 6634 98% | 6564 99% | 6483 100% | 7433 87% | 7727 84% |
| Totalt genomsnitt (program/inställningar) | -11% /
-0% | 0% /
5% | 44% /
30% | -8% /
-13% | -41% /
-55% |
* ... mindre är bättre
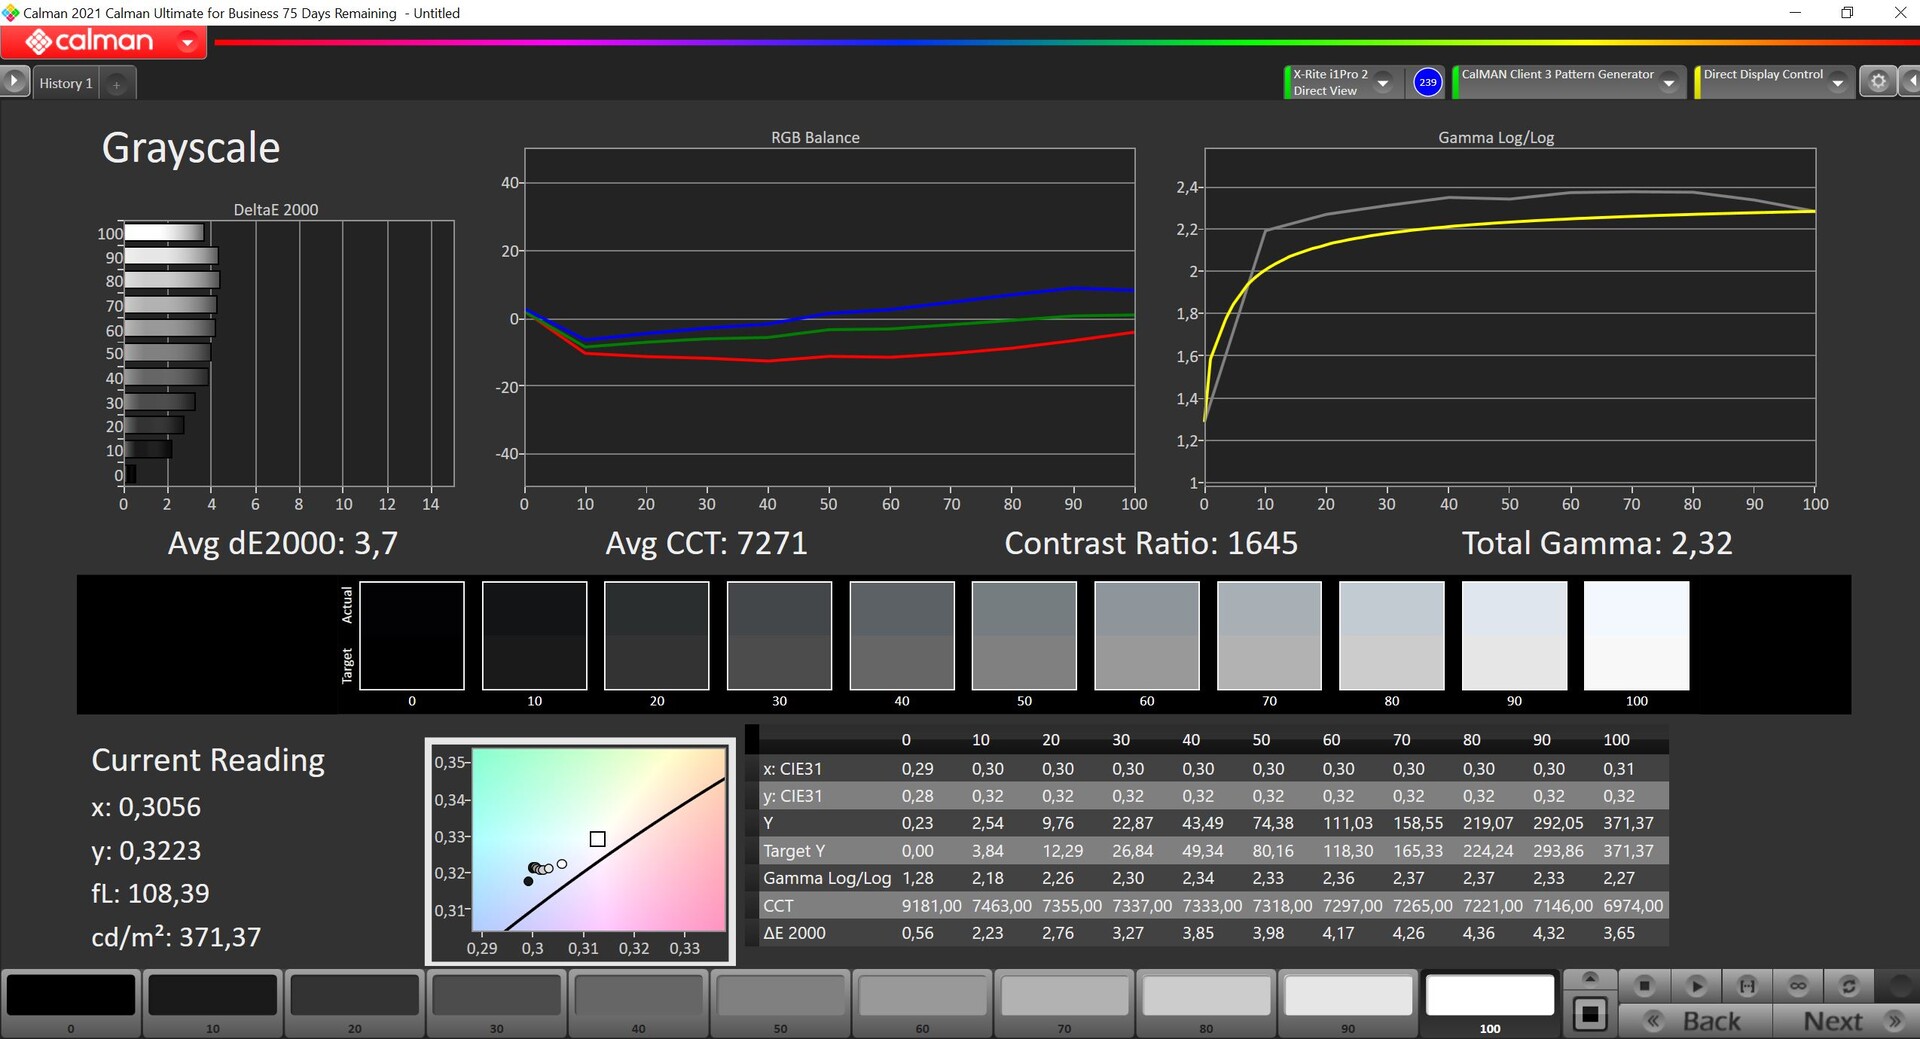
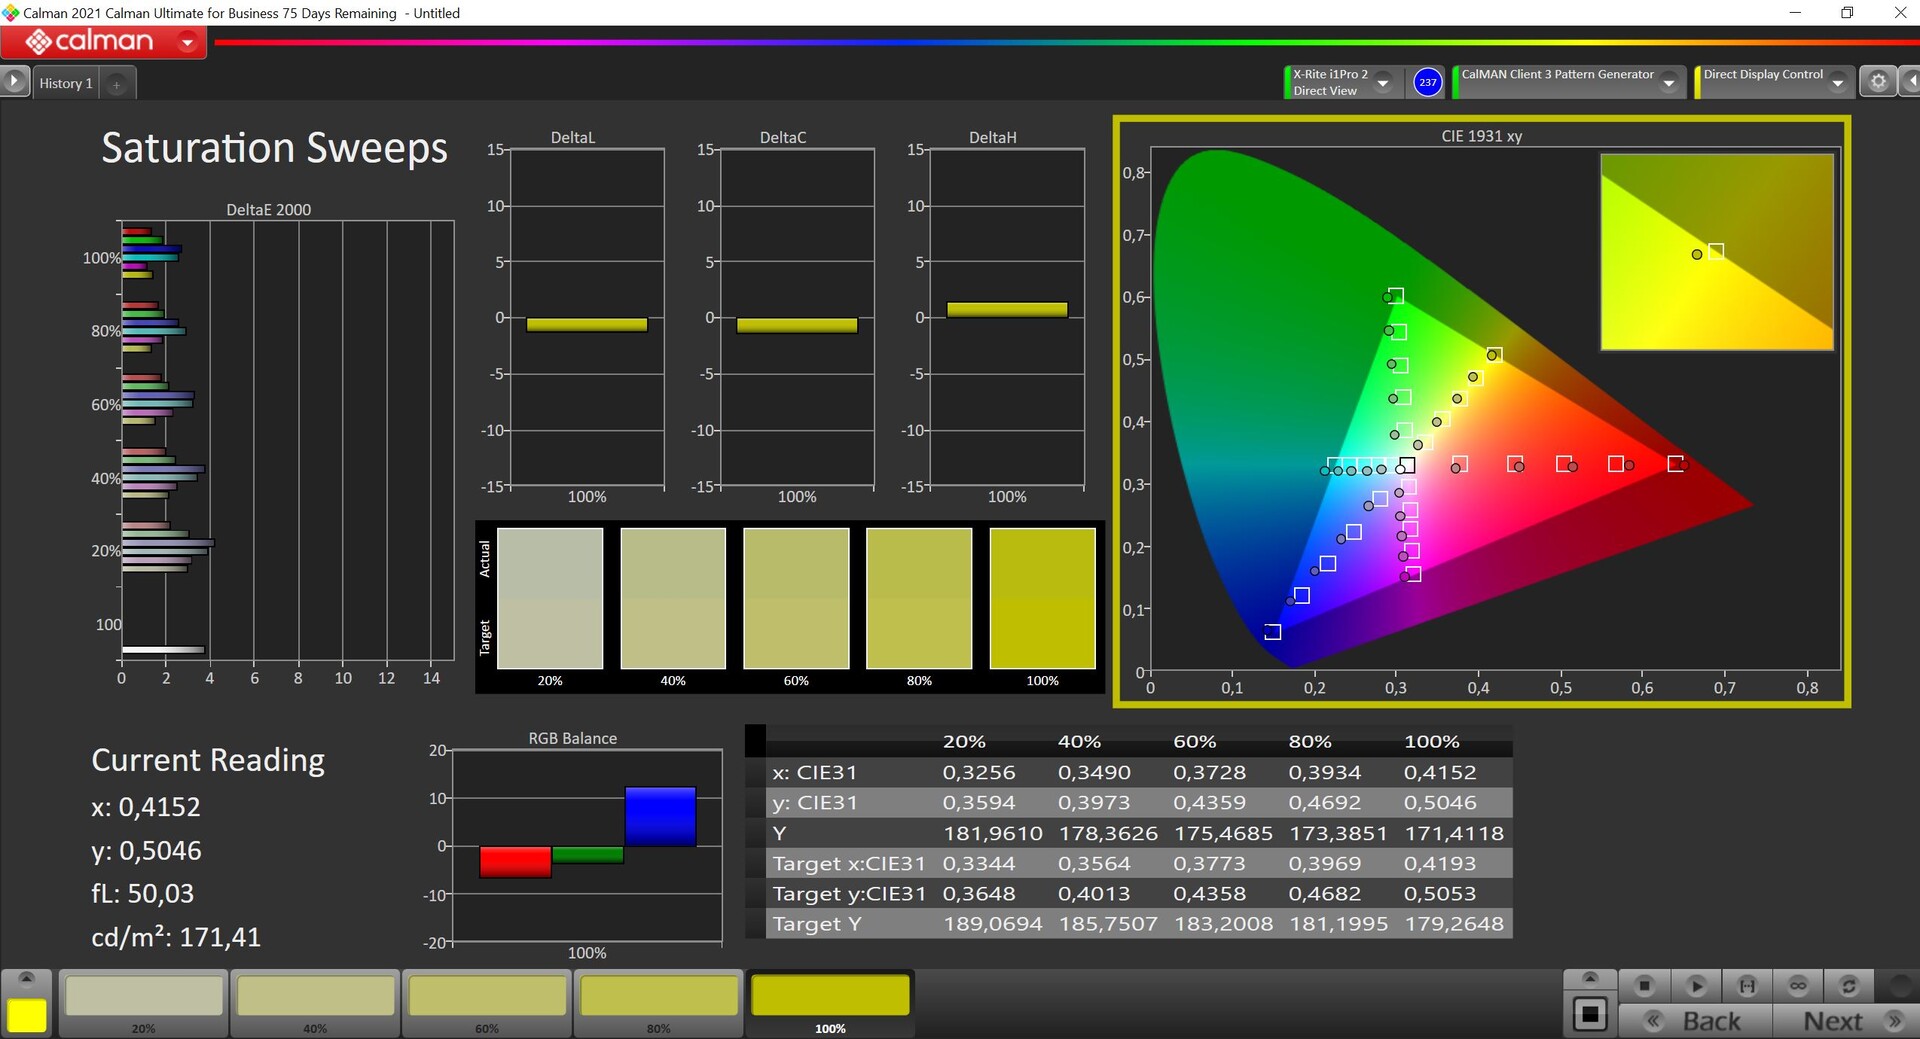
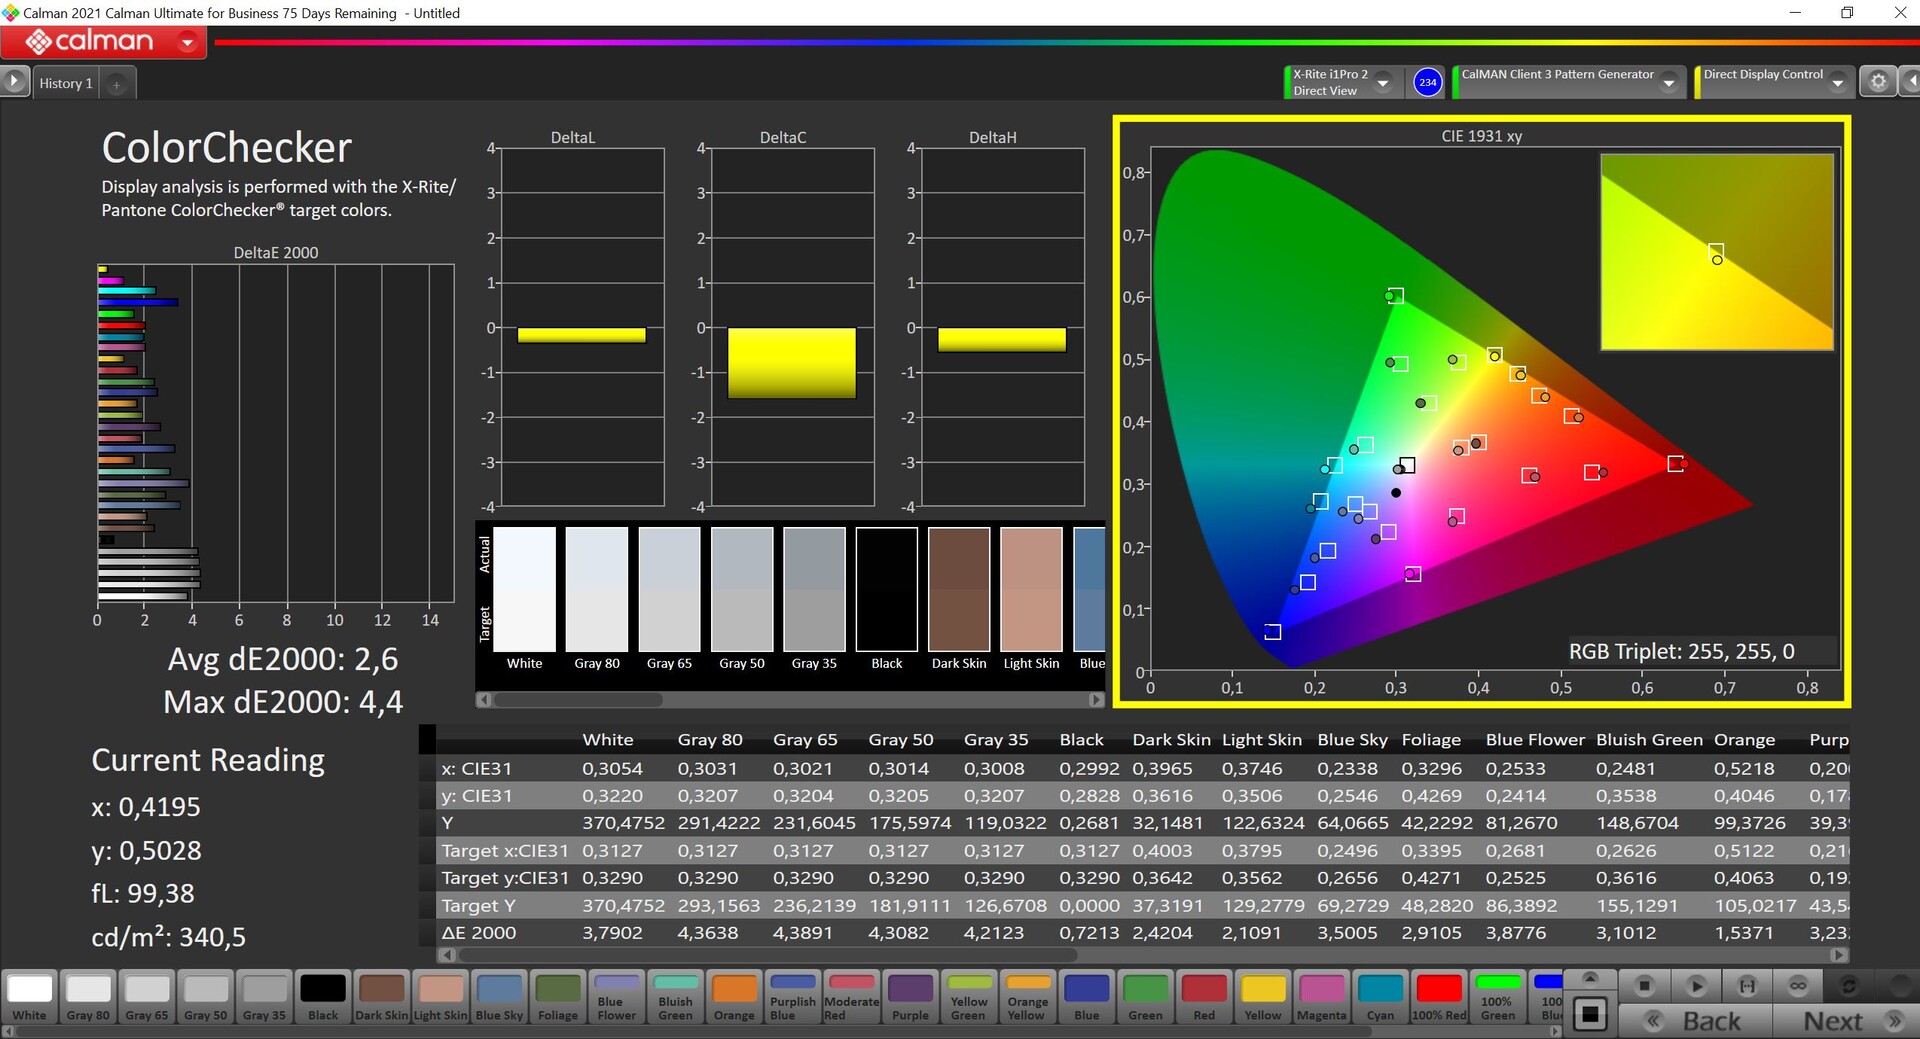
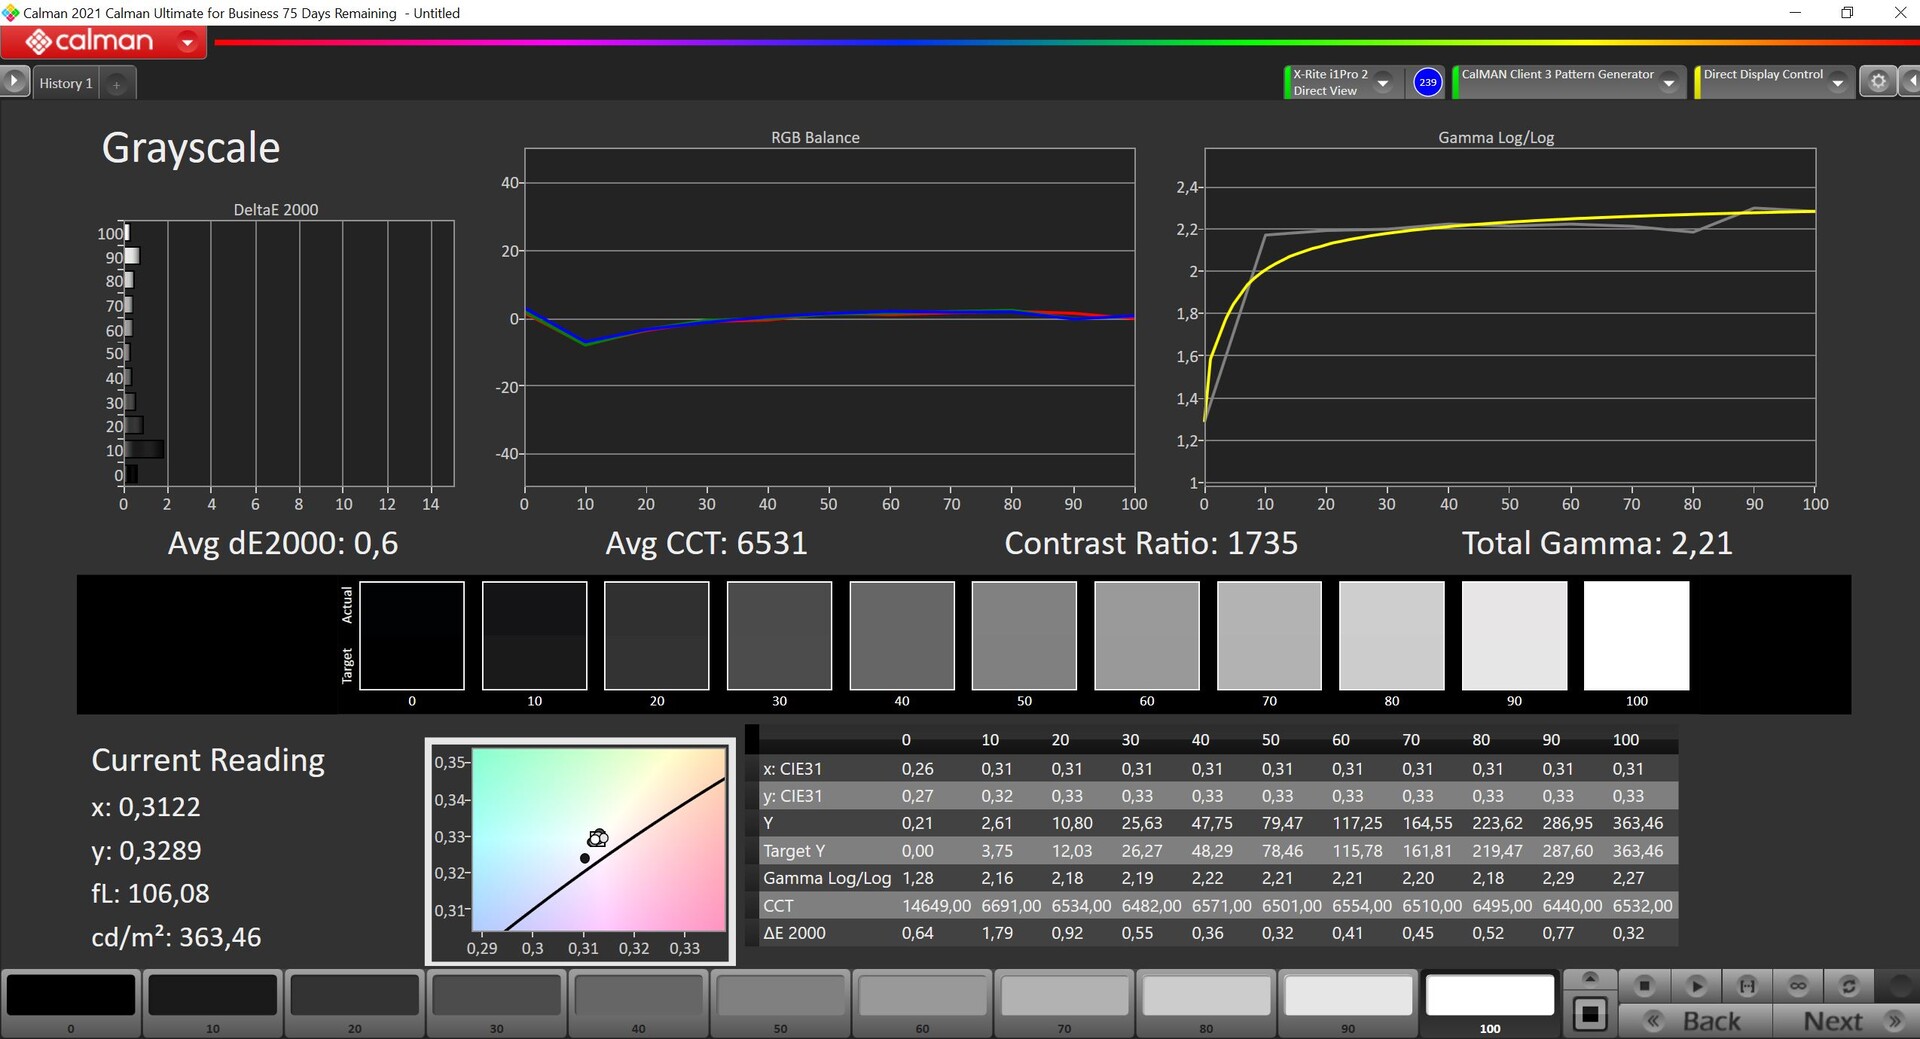
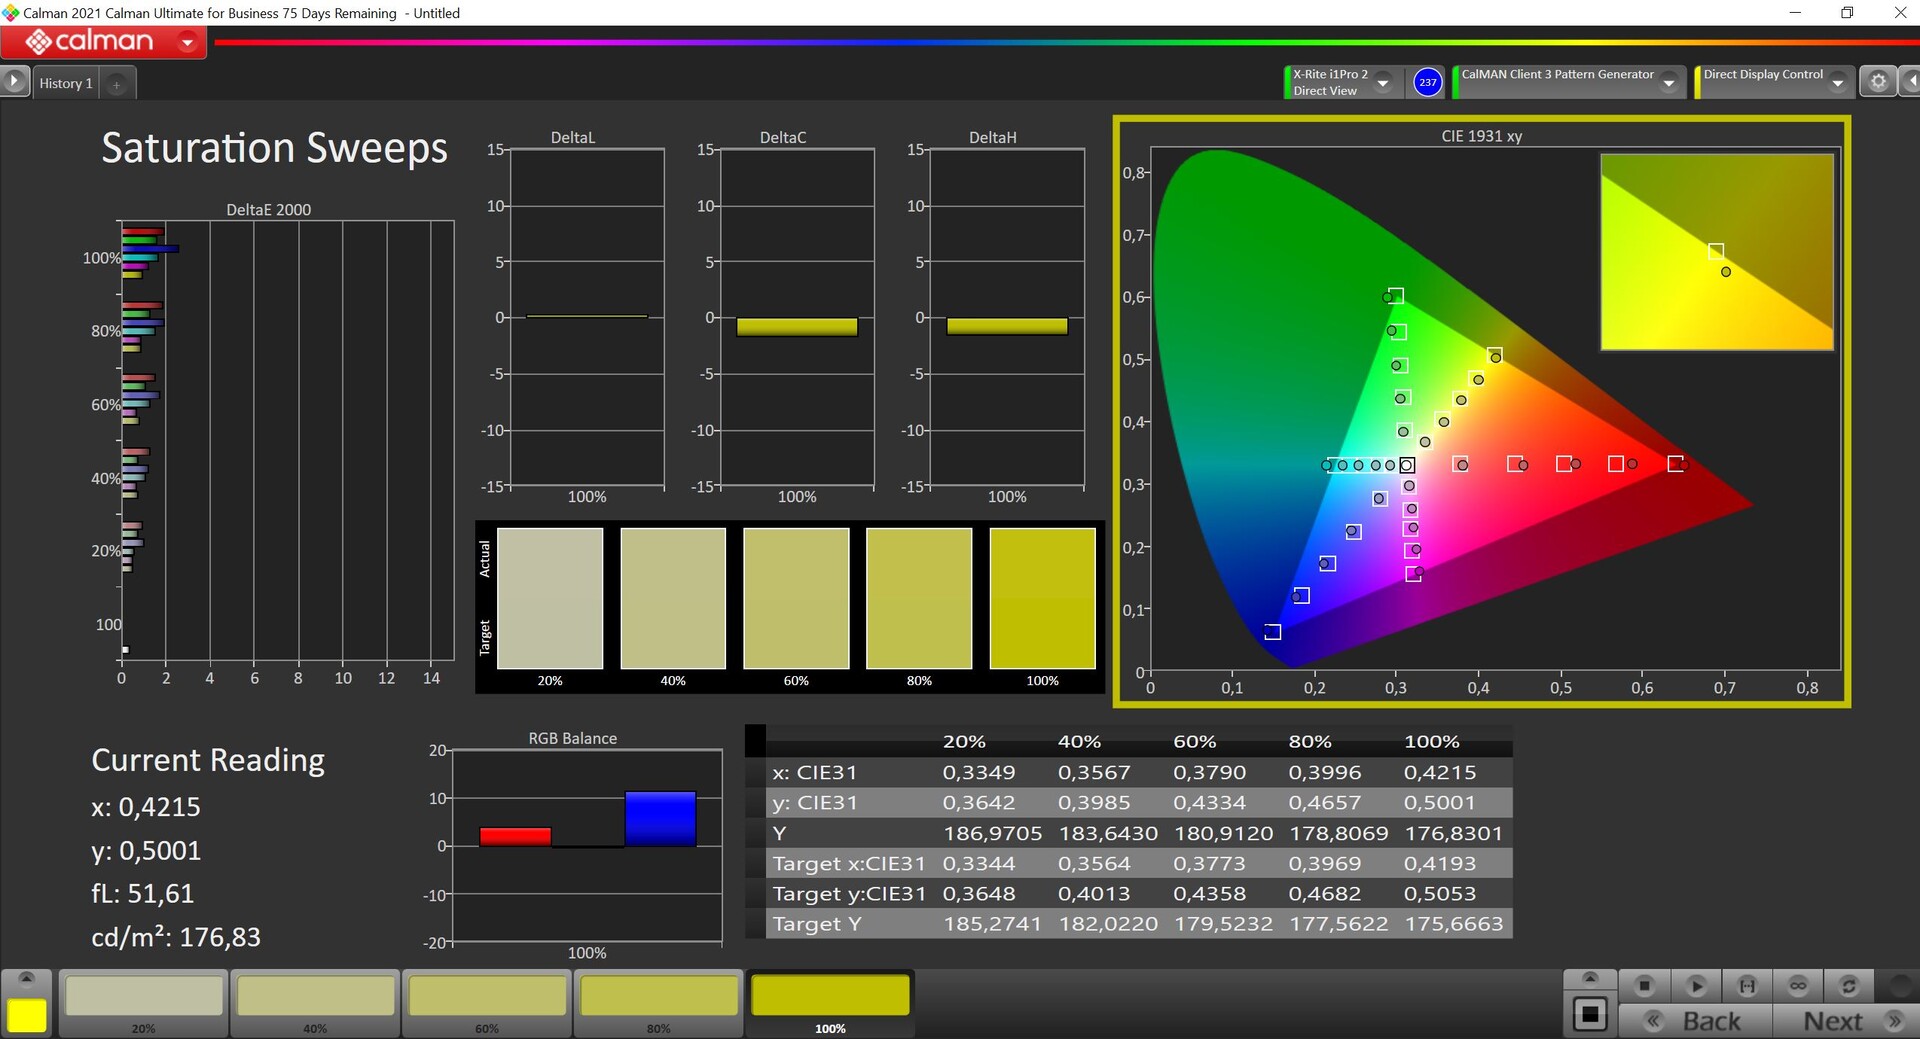
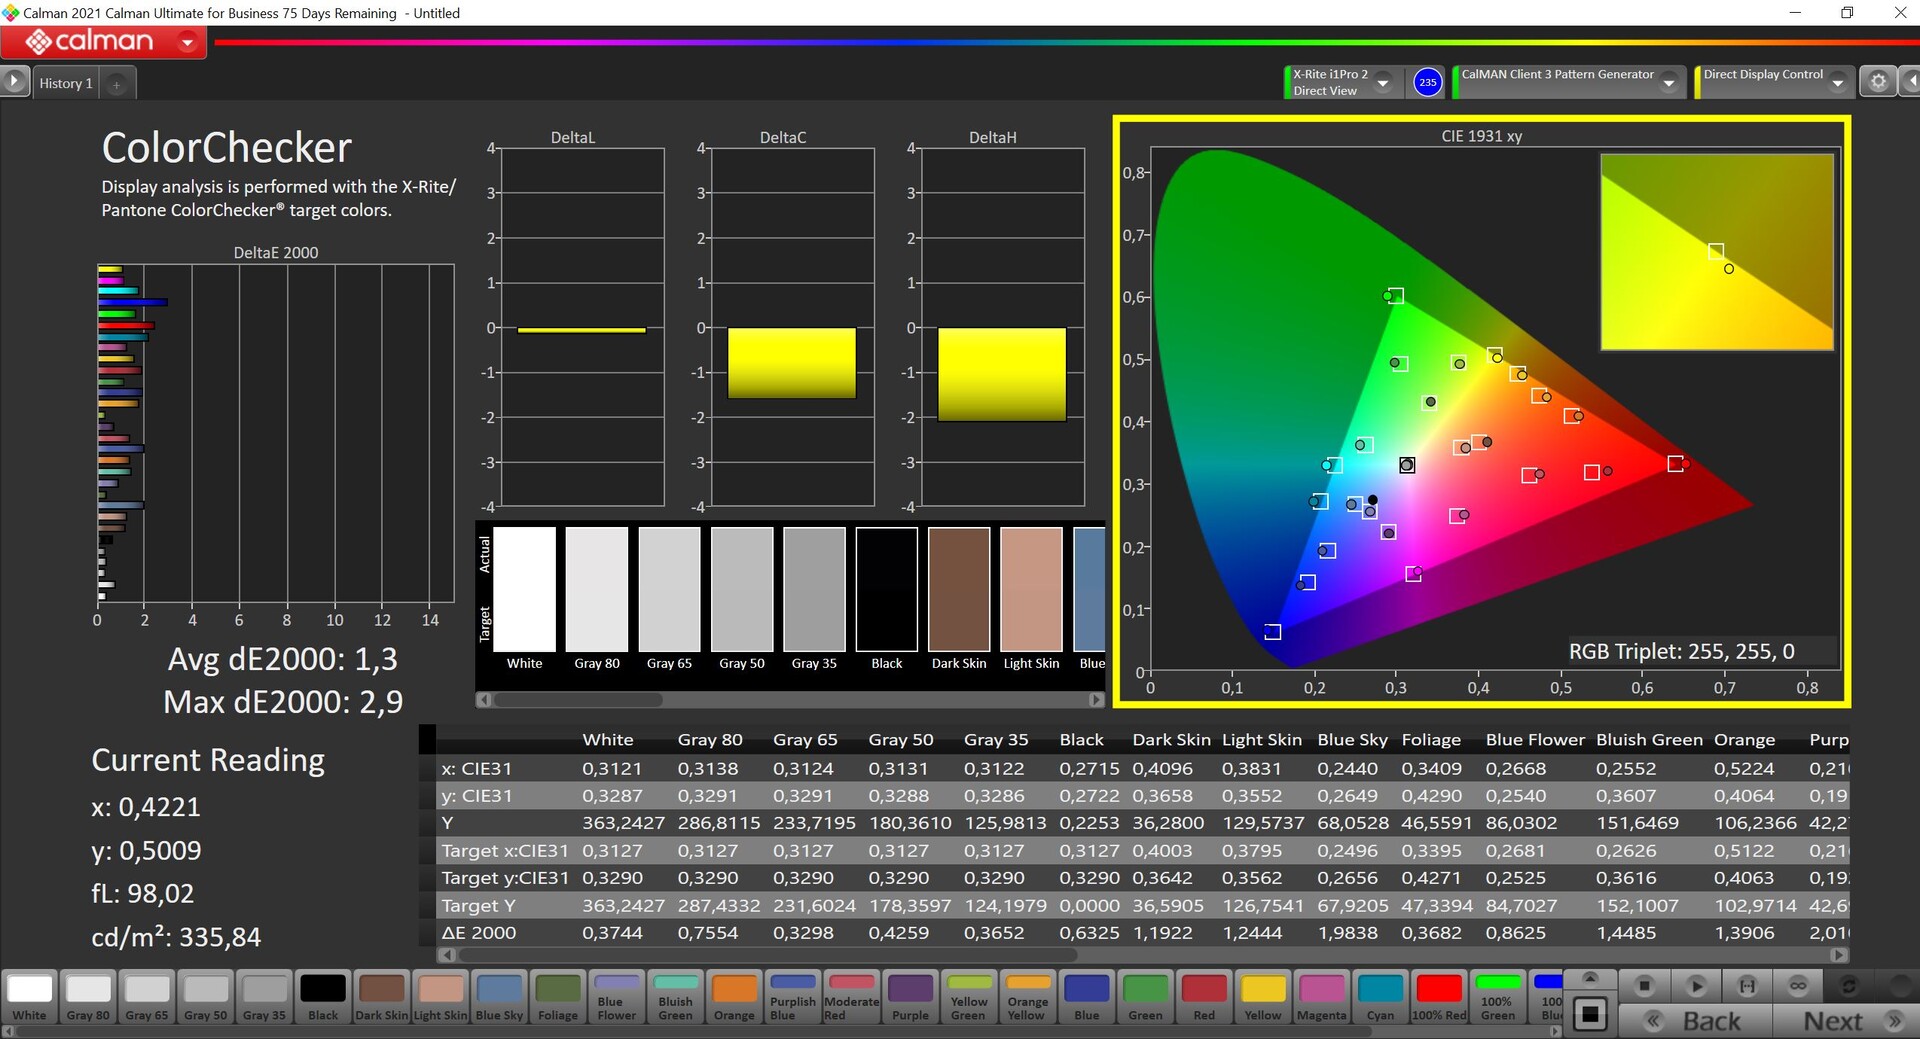
Vår analys med den professionella CalMAN-programvaran (X-Rite i1 Pro 2) visar en något blåaktig nyans i kombination med en något för kall färgtemperatur. Å andra sidan är avvikelserna för gråskalan och även färgerna jämfört med sRGB-referensfärgrymden redan ganska låga. Om du inte vill redigera bilder behöver du inte nödvändigtvis kalibrera panelen, men det finns fortfarande mycket potential här och efter vår kalibrering är resultaten mycket bättre och alla färger ligger under den viktiga DeltaE-2000-avvikelsen på 3. Tillsammans med den nästan fullständiga sRGB-täckningen är bild-/videoredigering också möjlig
Visa svarstider
| ↔ Svarstid svart till vitt | ||
|---|---|---|
| 16.8 ms ... stiga ↗ och falla ↘ kombinerat | ↗ 6.4 ms stiga | 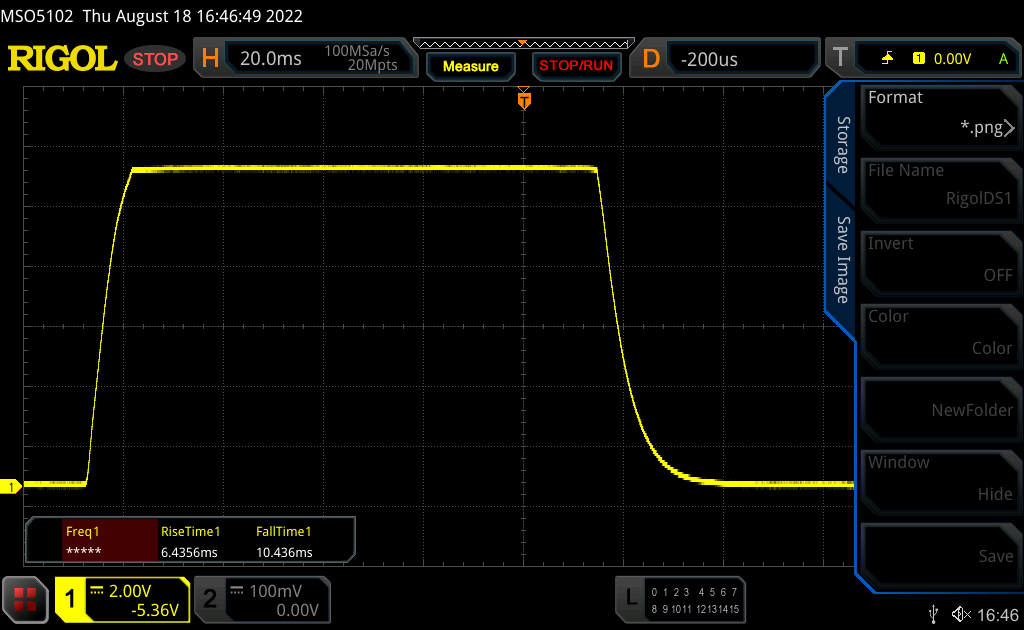 |
| ↘ 10.4 ms hösten | ||
| Skärmen visar bra svarsfrekvens i våra tester, men kan vara för långsam för konkurrenskraftiga spelare. I jämförelse sträcker sig alla testade enheter från 0.1 (minst) till 240 (maximalt) ms. » 39 % av alla enheter är bättre. Det betyder att den uppmätta svarstiden är bättre än genomsnittet av alla testade enheter (19.8 ms). | ||
| ↔ Svarstid 50 % grått till 80 % grått | ||
| 32.7 ms ... stiga ↗ och falla ↘ kombinerat | ↗ 15.7 ms stiga | 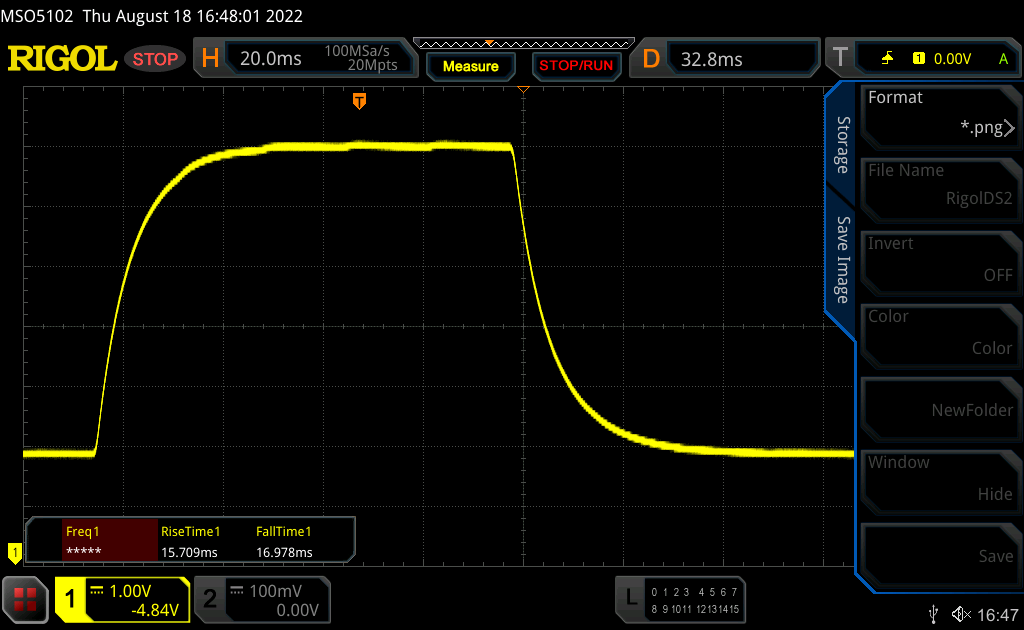 |
| ↘ 17 ms hösten | ||
| Skärmen visar långsamma svarsfrekvenser i våra tester och kommer att vara otillfredsställande för spelare. I jämförelse sträcker sig alla testade enheter från 0.165 (minst) till 636 (maximalt) ms. » 45 % av alla enheter är bättre. Det betyder att den uppmätta svarstiden liknar genomsnittet av alla testade enheter (30.9 ms). | ||
Skärmflimmer / PWM (Puls-Width Modulation)
| Skärmflimmer / PWM upptäcktes inte |  | ||
Som jämförelse: 52 % av alla testade enheter använder inte PWM för att dämpa skärmen. Om PWM upptäcktes mättes ett medelvärde av 7741 (minst: 5 - maximum: 343500) Hz. | |||
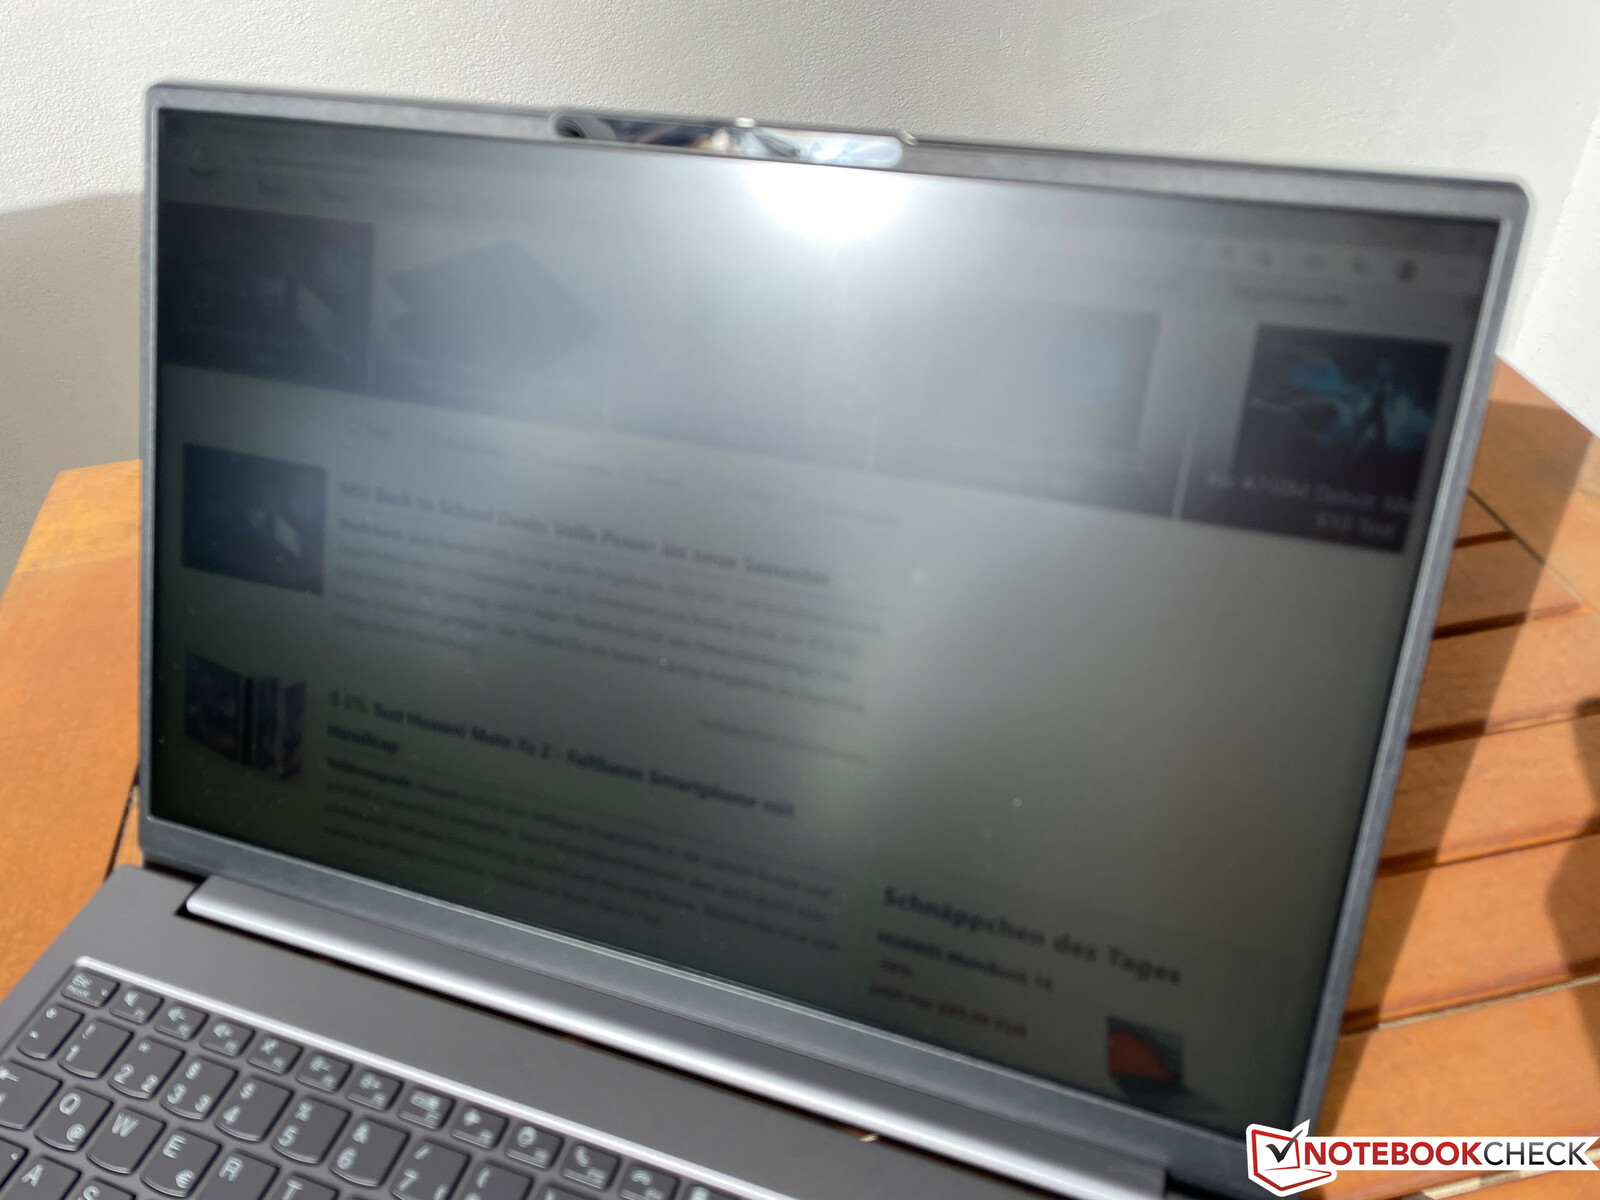
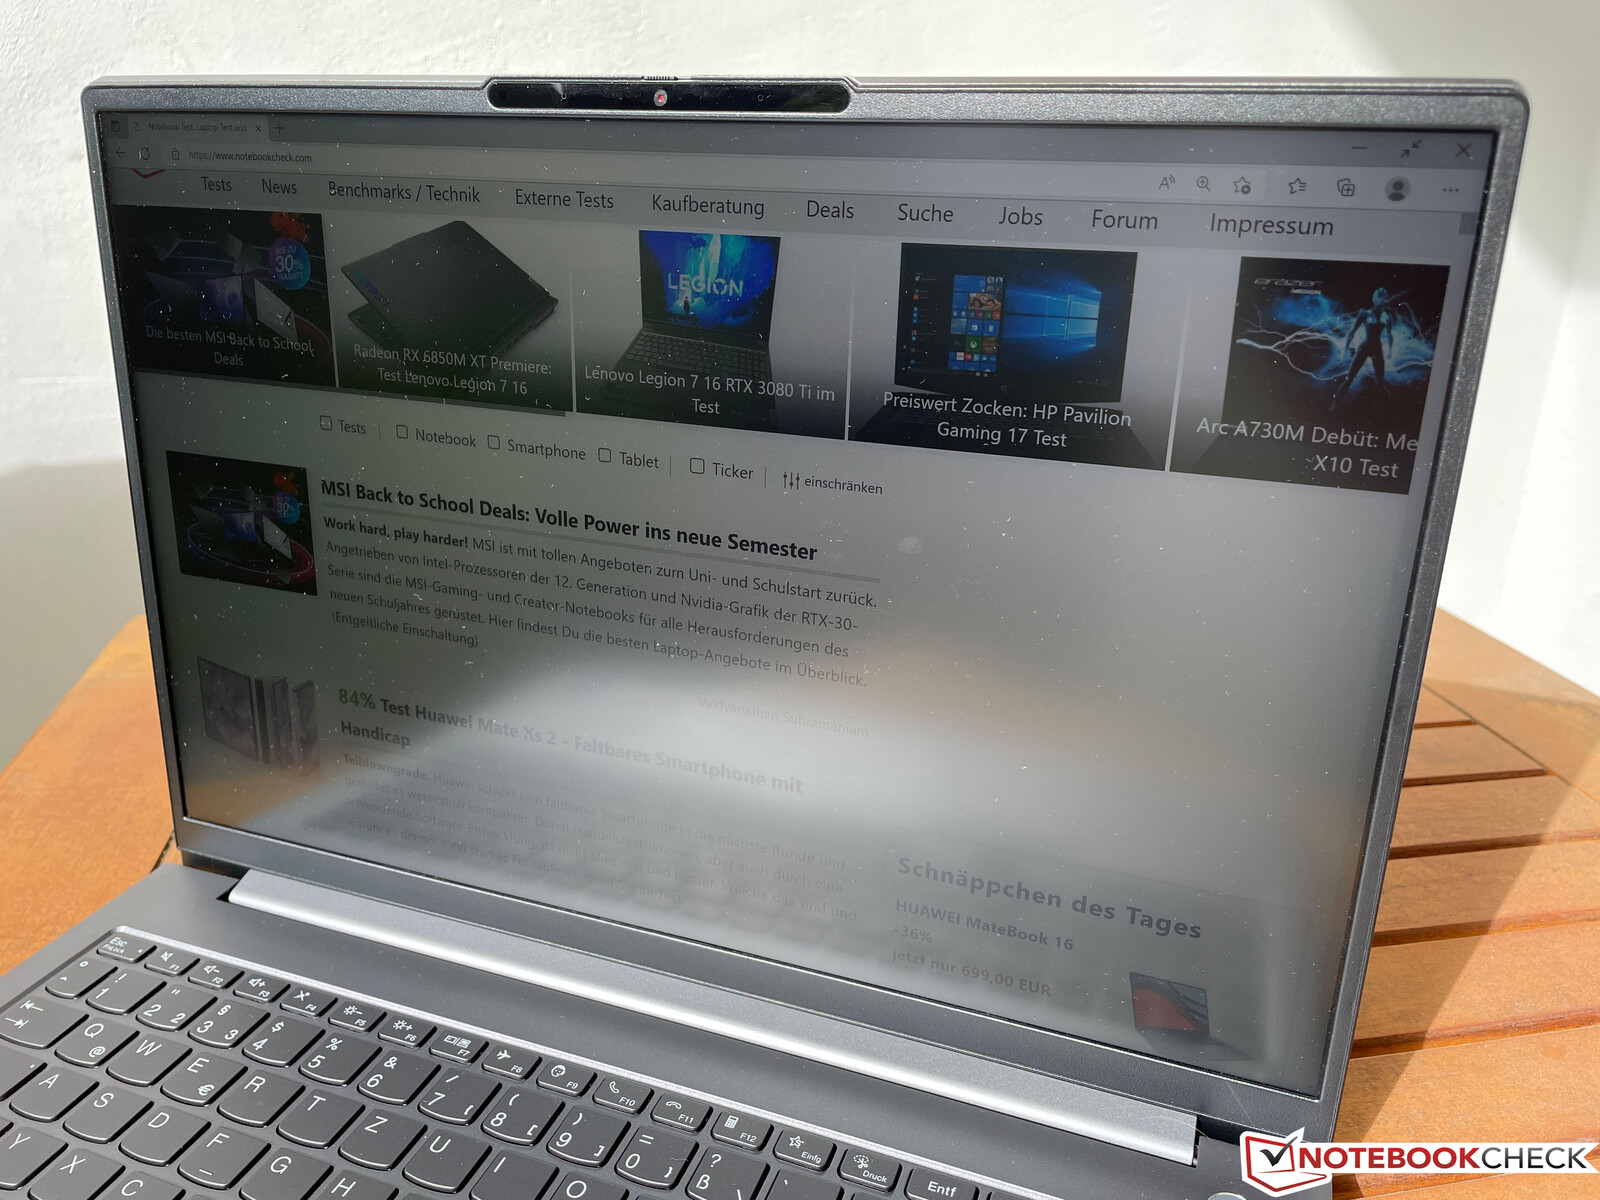
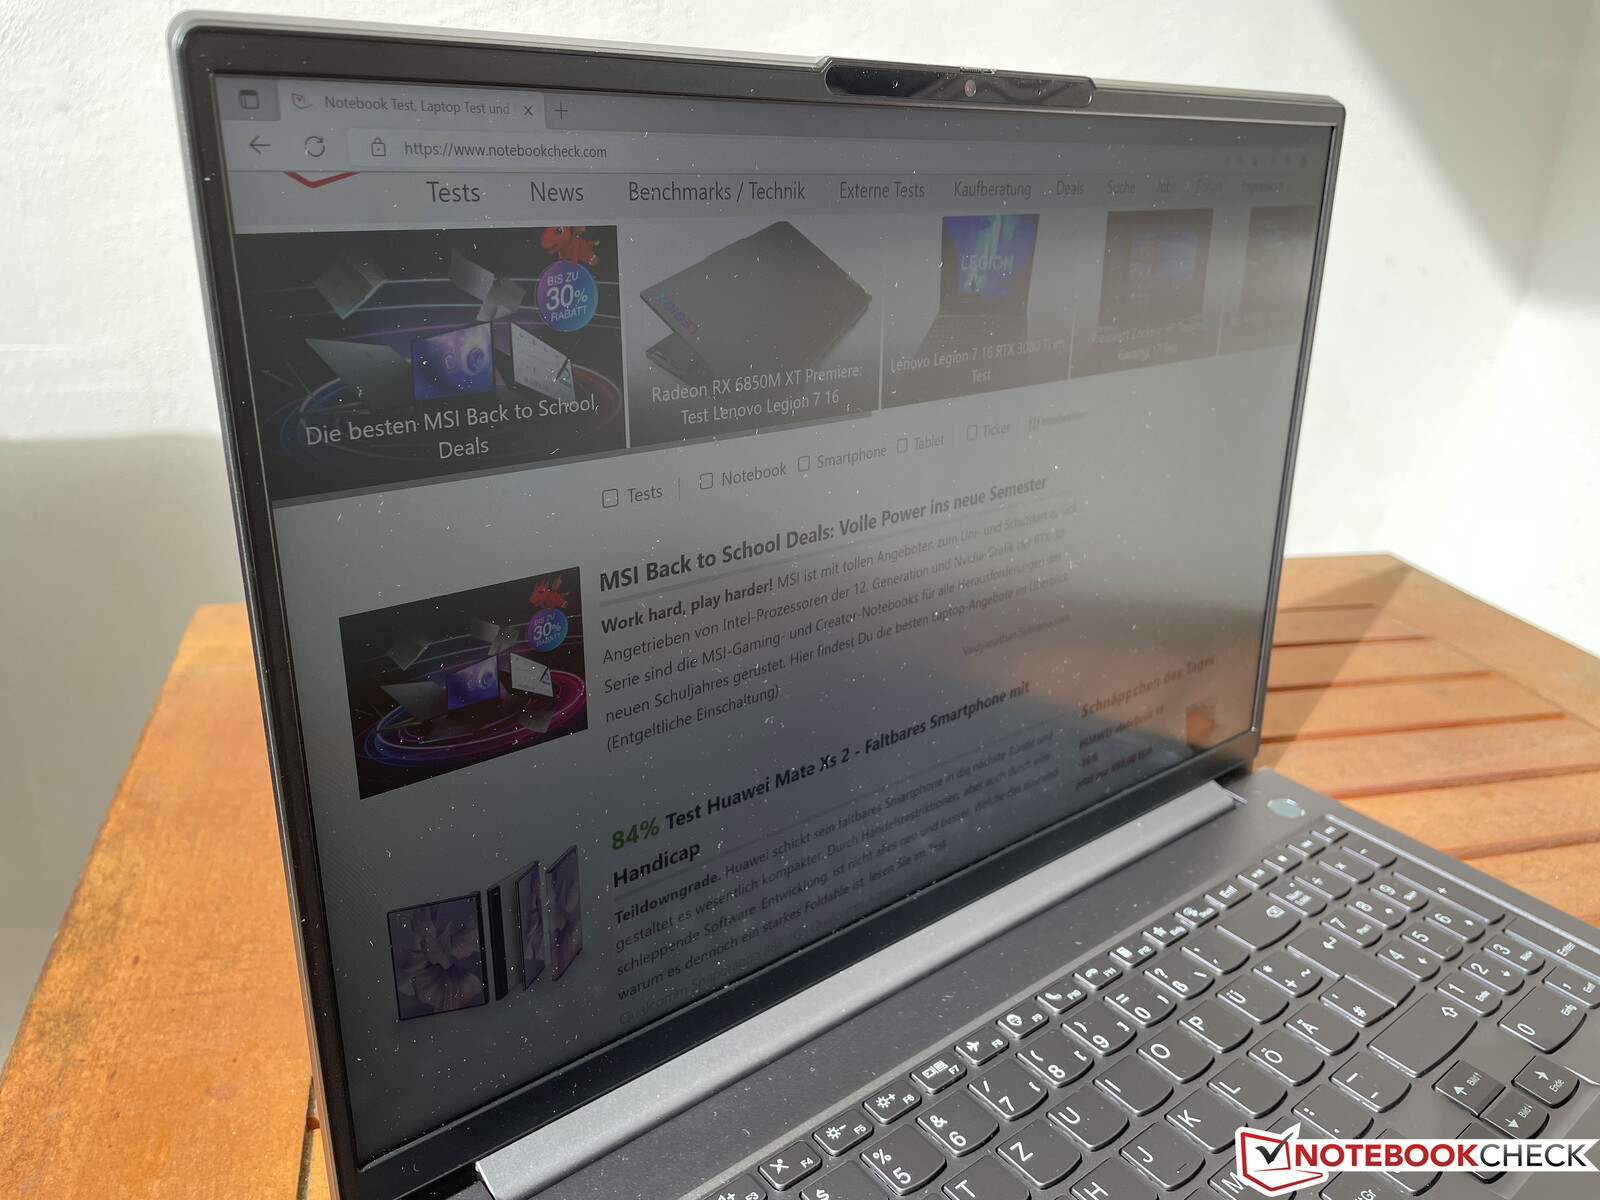
Den matta skärmytan är förstås till hjälp utomhus, och du kan arbeta bekvämt under molniga dagar, men skärmen behöver vara lite ljusare under mycket ljusa dagar.
Prestanda - Alder Lake och GeForce RTX
Provningsförhållanden
Som vanligt erbjuder Lenovo sina egna ströminställningar som kan ställas in antingen via den förinstallerade Vantage-mjukvaran eller tangentkombinationen Fn+P. Vi har listat respektive TDP/TGP-värden för CPU och GPU i tabellen nedan. Vi använde inställningen High Performance för testning.
| Prestandaläge | CPU-belastning | GPU-belastning | Stresstest | Max. fläktvolym |
|---|---|---|---|---|
| Batterisparande | 64 -> 20 watt | 20 watt | CPU: 20 wattGPU : 20 watt |
30,5 dB(A) |
| Intelligent Cooling | 72 -> 35 watt | 36 watt | CPU: 24 wattGPU : 36 watt |
43,7 dB(A) |
| Hög prestanda | 80 -> 55 watt | 60 watt | CPU: 20 wattGPU : 50 watt |
47 dB(A) |
Processor
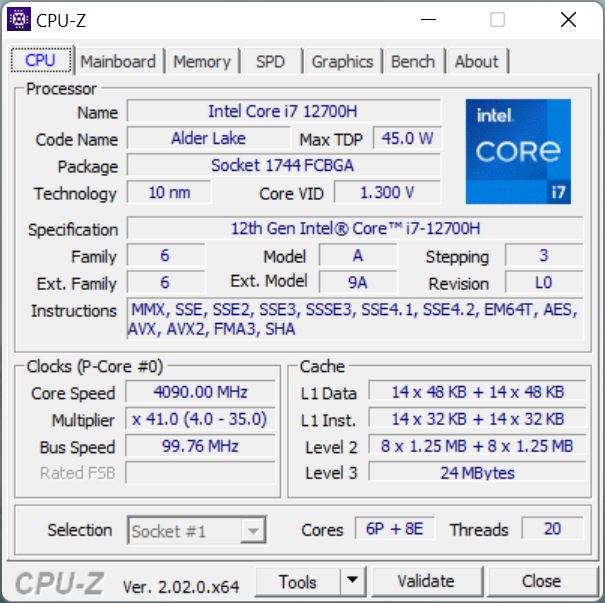
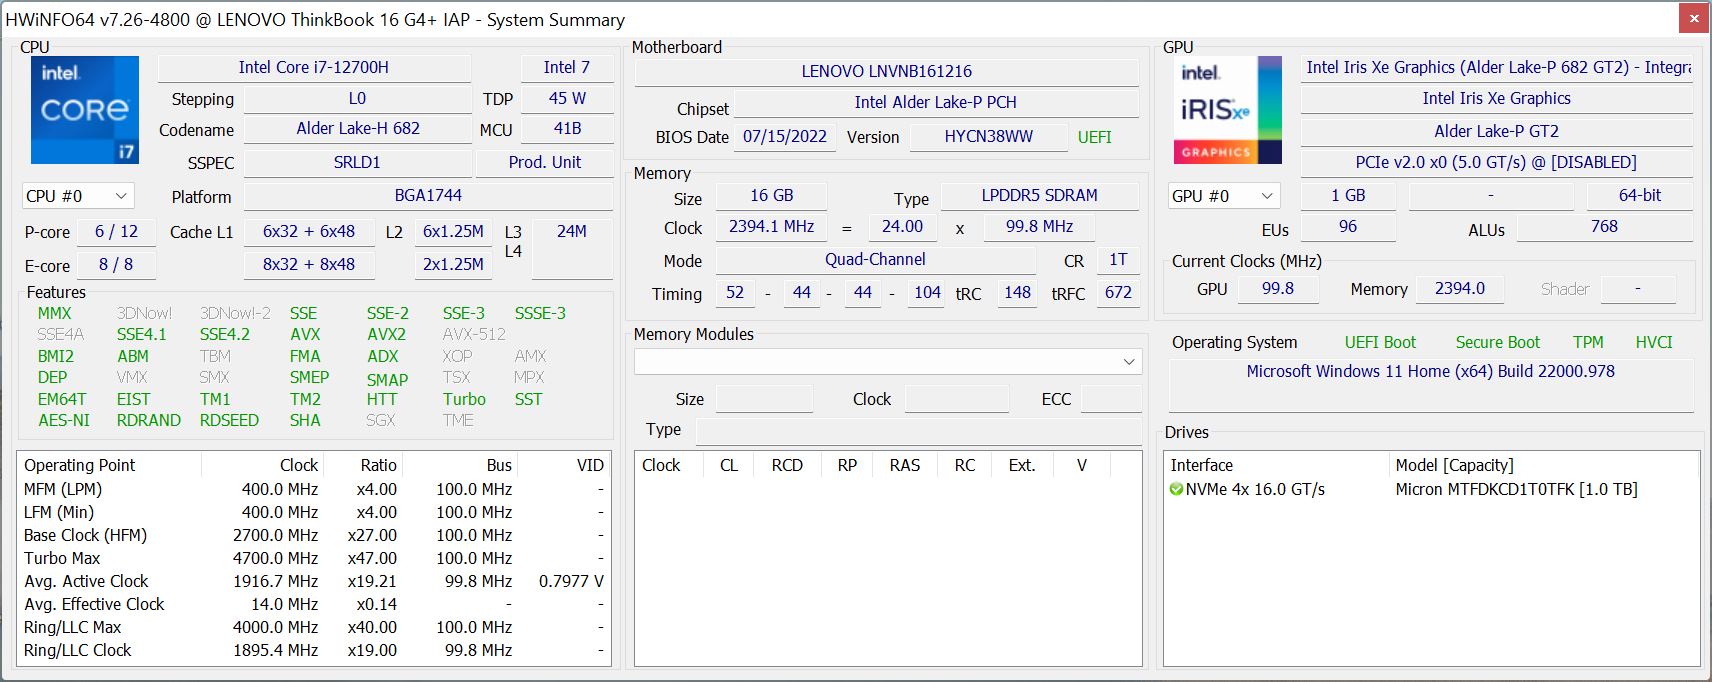
Core i7-12700Här en snabb processor från Intels nuvarande Alder Lake-generation som bygger på en hybridarkitektur med 6 snabba prestandakärnor och 8 effektivitetskärnor. Tack vare höga effektgränser är prestandautbytet för ThinkBook 16 G4+ mycket bra och CPU-prestandan är bättre än hos rivalerna. Även vid ihållande belastning stannar processorn på 55 watt och levererar bra resultat. Den maximala förbrukningen begränsas dock till 70 watt i batteriläge och når sedan snabbt 64 watt, vilket är anledningen till att prestandan för flera kärnor är ~12 % lägre när den inte är inkopplad. Fler CPU-benchmarks finns tillgängliga här.
Cinebench R15 Multi Sustained Load
Cinebench R23: Multi Core | Single Core
Cinebench R20: CPU (Multi Core) | CPU (Single Core)
Cinebench R15: CPU Multi 64Bit | CPU Single 64Bit
Blender: v2.79 BMW27 CPU
7-Zip 18.03: 7z b 4 | 7z b 4 -mmt1
Geekbench 5.5: Multi-Core | Single-Core
HWBOT x265 Benchmark v2.2: 4k Preset
LibreOffice : 20 Documents To PDF
R Benchmark 2.5: Overall mean
| CPU Performance rating | |
| Genomsnitt av klass Multimedia | |
| Lenovo ThinkBook 16 G4+ IAP | |
| Genomsnitt Intel Core i7-12700H | |
| Dell Inspiron 16 Plus 7620 | |
| Huawei MateBook D 16 2022 | |
| Asus Vivobook Pro 16X-M7600QE | |
| Samsung Galaxy Book2 15 | |
| Acer Swift X SFX16-51G-5388 | |
| Cinebench R23 / Multi Core | |
| Genomsnitt av klass Multimedia (4861 - 33362, n=65, senaste 2 åren) | |
| Lenovo ThinkBook 16 G4+ IAP | |
| Genomsnitt Intel Core i7-12700H (4032 - 19330, n=64) | |
| Dell Inspiron 16 Plus 7620 | |
| Asus Vivobook Pro 16X-M7600QE | |
| Asus Vivobook Pro 16X-M7600QE | |
| Huawei MateBook D 16 2022 | |
| Samsung Galaxy Book2 15 | |
| Acer Swift X SFX16-51G-5388 | |
| Cinebench R23 / Single Core | |
| Genomsnitt av klass Multimedia (1128 - 2459, n=64, senaste 2 åren) | |
| Lenovo ThinkBook 16 G4+ IAP | |
| Huawei MateBook D 16 2022 | |
| Samsung Galaxy Book2 15 | |
| Dell Inspiron 16 Plus 7620 | |
| Genomsnitt Intel Core i7-12700H (778 - 1826, n=63) | |
| Asus Vivobook Pro 16X-M7600QE | |
| Asus Vivobook Pro 16X-M7600QE | |
| Acer Swift X SFX16-51G-5388 | |
| Cinebench R20 / CPU (Multi Core) | |
| Genomsnitt av klass Multimedia (1887 - 12912, n=56, senaste 2 åren) | |
| Lenovo ThinkBook 16 G4+ IAP | |
| Genomsnitt Intel Core i7-12700H (1576 - 7407, n=64) | |
| Dell Inspiron 16 Plus 7620 | |
| Asus Vivobook Pro 16X-M7600QE | |
| Asus Vivobook Pro 16X-M7600QE | |
| Huawei MateBook D 16 2022 | |
| Samsung Galaxy Book2 15 | |
| Acer Swift X SFX16-51G-5388 | |
| Cinebench R20 / CPU (Single Core) | |
| Genomsnitt av klass Multimedia (425 - 853, n=56, senaste 2 åren) | |
| Lenovo ThinkBook 16 G4+ IAP | |
| Samsung Galaxy Book2 15 | |
| Dell Inspiron 16 Plus 7620 | |
| Genomsnitt Intel Core i7-12700H (300 - 704, n=64) | |
| Huawei MateBook D 16 2022 | |
| Asus Vivobook Pro 16X-M7600QE | |
| Asus Vivobook Pro 16X-M7600QE | |
| Acer Swift X SFX16-51G-5388 | |
| Cinebench R15 / CPU Multi 64Bit | |
| Genomsnitt av klass Multimedia (856 - 5224, n=60, senaste 2 åren) | |
| Genomsnitt Intel Core i7-12700H (1379 - 2916, n=70) | |
| Lenovo ThinkBook 16 G4+ IAP | |
| Dell Inspiron 16 Plus 7620 | |
| Huawei MateBook D 16 2022 | |
| Huawei MateBook D 16 2022 | |
| Asus Vivobook Pro 16X-M7600QE | |
| Asus Vivobook Pro 16X-M7600QE | |
| Samsung Galaxy Book2 15 | |
| Acer Swift X SFX16-51G-5388 | |
| Cinebench R15 / CPU Single 64Bit | |
| Genomsnitt av klass Multimedia (184.8 - 326, n=58, senaste 2 åren) | |
| Lenovo ThinkBook 16 G4+ IAP | |
| Huawei MateBook D 16 2022 | |
| Dell Inspiron 16 Plus 7620 | |
| Genomsnitt Intel Core i7-12700H (113 - 263, n=65) | |
| Samsung Galaxy Book2 15 | |
| Asus Vivobook Pro 16X-M7600QE | |
| Asus Vivobook Pro 16X-M7600QE | |
| Acer Swift X SFX16-51G-5388 | |
| Blender / v2.79 BMW27 CPU | |
| Acer Swift X SFX16-51G-5388 | |
| Samsung Galaxy Book2 15 | |
| Huawei MateBook D 16 2022 | |
| Asus Vivobook Pro 16X-M7600QE | |
| Asus Vivobook Pro 16X-M7600QE | |
| Genomsnitt av klass Multimedia (100 - 557, n=57, senaste 2 åren) | |
| Dell Inspiron 16 Plus 7620 | |
| Genomsnitt Intel Core i7-12700H (168 - 732, n=63) | |
| Lenovo ThinkBook 16 G4+ IAP | |
| 7-Zip 18.03 / 7z b 4 | |
| Lenovo ThinkBook 16 G4+ IAP | |
| Genomsnitt Intel Core i7-12700H (22844 - 73067, n=63) | |
| Dell Inspiron 16 Plus 7620 | |
| Asus Vivobook Pro 16X-M7600QE | |
| Asus Vivobook Pro 16X-M7600QE | |
| Genomsnitt av klass Multimedia (26062 - 130368, n=54, senaste 2 åren) | |
| Huawei MateBook D 16 2022 | |
| Samsung Galaxy Book2 15 | |
| Acer Swift X SFX16-51G-5388 | |
| 7-Zip 18.03 / 7z b 4 -mmt1 | |
| Genomsnitt av klass Multimedia (3666 - 7545, n=55, senaste 2 åren) | |
| Asus Vivobook Pro 16X-M7600QE | |
| Asus Vivobook Pro 16X-M7600QE | |
| Huawei MateBook D 16 2022 | |
| Lenovo ThinkBook 16 G4+ IAP | |
| Genomsnitt Intel Core i7-12700H (2743 - 5972, n=63) | |
| Dell Inspiron 16 Plus 7620 | |
| Samsung Galaxy Book2 15 | |
| Acer Swift X SFX16-51G-5388 | |
| Geekbench 5.5 / Multi-Core | |
| Genomsnitt av klass Multimedia (4652 - 20422, n=55, senaste 2 åren) | |
| Lenovo ThinkBook 16 G4+ IAP | |
| Dell Inspiron 16 Plus 7620 | |
| Genomsnitt Intel Core i7-12700H (5144 - 13745, n=64) | |
| Huawei MateBook D 16 2022 | |
| Asus Vivobook Pro 16X-M7600QE | |
| Asus Vivobook Pro 16X-M7600QE | |
| Samsung Galaxy Book2 15 | |
| Acer Swift X SFX16-51G-5388 | |
| Geekbench 5.5 / Single-Core | |
| Genomsnitt av klass Multimedia (805 - 2974, n=55, senaste 2 åren) | |
| Huawei MateBook D 16 2022 | |
| Lenovo ThinkBook 16 G4+ IAP | |
| Samsung Galaxy Book2 15 | |
| Dell Inspiron 16 Plus 7620 | |
| Genomsnitt Intel Core i7-12700H (803 - 1851, n=64) | |
| Asus Vivobook Pro 16X-M7600QE | |
| Asus Vivobook Pro 16X-M7600QE | |
| Acer Swift X SFX16-51G-5388 | |
| HWBOT x265 Benchmark v2.2 / 4k Preset | |
| Genomsnitt av klass Multimedia (5.26 - 36.1, n=55, senaste 2 åren) | |
| Lenovo ThinkBook 16 G4+ IAP | |
| Genomsnitt Intel Core i7-12700H (4.67 - 21.8, n=64) | |
| Dell Inspiron 16 Plus 7620 | |
| Asus Vivobook Pro 16X-M7600QE | |
| Asus Vivobook Pro 16X-M7600QE | |
| Huawei MateBook D 16 2022 | |
| Samsung Galaxy Book2 15 | |
| Acer Swift X SFX16-51G-5388 | |
| LibreOffice / 20 Documents To PDF | |
| Asus Vivobook Pro 16X-M7600QE | |
| Asus Vivobook Pro 16X-M7600QE | |
| Acer Swift X SFX16-51G-5388 | |
| Genomsnitt av klass Multimedia (23.9 - 146.7, n=56, senaste 2 åren) | |
| Lenovo ThinkBook 16 G4+ IAP | |
| Dell Inspiron 16 Plus 7620 | |
| Genomsnitt Intel Core i7-12700H (34.2 - 95.3, n=63) | |
| Samsung Galaxy Book2 15 | |
| Huawei MateBook D 16 2022 | |
| R Benchmark 2.5 / Overall mean | |
| Acer Swift X SFX16-51G-5388 | |
| Asus Vivobook Pro 16X-M7600QE | |
| Asus Vivobook Pro 16X-M7600QE | |
| Dell Inspiron 16 Plus 7620 | |
| Genomsnitt Intel Core i7-12700H (0.4441 - 1.052, n=63) | |
| Samsung Galaxy Book2 15 | |
| Genomsnitt av klass Multimedia (0.3604 - 0.947, n=55, senaste 2 åren) | |
| Lenovo ThinkBook 16 G4+ IAP | |
| Huawei MateBook D 16 2022 | |
* ... mindre är bättre
AIDA64: FP32 Ray-Trace | FPU Julia | CPU SHA3 | CPU Queen | FPU SinJulia | FPU Mandel | CPU AES | CPU ZLib | FP64 Ray-Trace | CPU PhotoWorxx
| Performance rating | |
| Genomsnitt av klass Multimedia | |
| Asus Vivobook Pro 16X-M7600QE | |
| Lenovo ThinkBook 16 G4+ IAP | |
| Dell Inspiron 16 Plus 7620 | |
| Genomsnitt Intel Core i7-12700H | |
| Huawei MateBook D 16 2022 | |
| Samsung Galaxy Book2 15 | |
| Acer Swift X SFX16-51G-5388 | |
| AIDA64 / FP32 Ray-Trace | |
| Genomsnitt av klass Multimedia (2214 - 50388, n=53, senaste 2 åren) | |
| Lenovo ThinkBook 16 G4+ IAP | |
| Asus Vivobook Pro 16X-M7600QE | |
| Asus Vivobook Pro 16X-M7600QE | |
| Dell Inspiron 16 Plus 7620 | |
| Huawei MateBook D 16 2022 | |
| Genomsnitt Intel Core i7-12700H (2585 - 17957, n=64) | |
| Acer Swift X SFX16-51G-5388 | |
| Samsung Galaxy Book2 15 | |
| AIDA64 / FPU Julia | |
| Asus Vivobook Pro 16X-M7600QE | |
| Asus Vivobook Pro 16X-M7600QE | |
| Genomsnitt av klass Multimedia (12867 - 201874, n=53, senaste 2 åren) | |
| Lenovo ThinkBook 16 G4+ IAP | |
| Dell Inspiron 16 Plus 7620 | |
| Huawei MateBook D 16 2022 | |
| Genomsnitt Intel Core i7-12700H (12439 - 90760, n=64) | |
| Acer Swift X SFX16-51G-5388 | |
| Samsung Galaxy Book2 15 | |
| AIDA64 / CPU SHA3 | |
| Genomsnitt av klass Multimedia (626 - 8623, n=53, senaste 2 åren) | |
| Lenovo ThinkBook 16 G4+ IAP | |
| Asus Vivobook Pro 16X-M7600QE | |
| Asus Vivobook Pro 16X-M7600QE | |
| Genomsnitt Intel Core i7-12700H (833 - 4242, n=64) | |
| Dell Inspiron 16 Plus 7620 | |
| Huawei MateBook D 16 2022 | |
| Acer Swift X SFX16-51G-5388 | |
| Samsung Galaxy Book2 15 | |
| AIDA64 / CPU Queen | |
| Lenovo ThinkBook 16 G4+ IAP | |
| Asus Vivobook Pro 16X-M7600QE | |
| Asus Vivobook Pro 16X-M7600QE | |
| Genomsnitt Intel Core i7-12700H (57923 - 103202, n=63) | |
| Huawei MateBook D 16 2022 | |
| Dell Inspiron 16 Plus 7620 | |
| Genomsnitt av klass Multimedia (13483 - 181505, n=40, senaste 2 åren) | |
| Samsung Galaxy Book2 15 | |
| Acer Swift X SFX16-51G-5388 | |
| AIDA64 / FPU SinJulia | |
| Asus Vivobook Pro 16X-M7600QE | |
| Asus Vivobook Pro 16X-M7600QE | |
| Lenovo ThinkBook 16 G4+ IAP | |
| Genomsnitt Intel Core i7-12700H (3249 - 9939, n=64) | |
| Dell Inspiron 16 Plus 7620 | |
| Genomsnitt av klass Multimedia (886 - 28794, n=53, senaste 2 åren) | |
| Huawei MateBook D 16 2022 | |
| Samsung Galaxy Book2 15 | |
| Acer Swift X SFX16-51G-5388 | |
| AIDA64 / FPU Mandel | |
| Asus Vivobook Pro 16X-M7600QE | |
| Asus Vivobook Pro 16X-M7600QE | |
| Genomsnitt av klass Multimedia (6395 - 105740, n=53, senaste 2 åren) | |
| Lenovo ThinkBook 16 G4+ IAP | |
| Dell Inspiron 16 Plus 7620 | |
| Genomsnitt Intel Core i7-12700H (7135 - 44760, n=64) | |
| Huawei MateBook D 16 2022 | |
| Acer Swift X SFX16-51G-5388 | |
| Samsung Galaxy Book2 15 | |
| AIDA64 / CPU AES | |
| Asus Vivobook Pro 16X-M7600QE | |
| Asus Vivobook Pro 16X-M7600QE | |
| Huawei MateBook D 16 2022 | |
| Genomsnitt Intel Core i7-12700H (31839 - 144360, n=64) | |
| Lenovo ThinkBook 16 G4+ IAP | |
| Dell Inspiron 16 Plus 7620 | |
| Genomsnitt av klass Multimedia (8171 - 126790, n=53, senaste 2 åren) | |
| Acer Swift X SFX16-51G-5388 | |
| Samsung Galaxy Book2 15 | |
| AIDA64 / CPU ZLib | |
| Lenovo ThinkBook 16 G4+ IAP | |
| Dell Inspiron 16 Plus 7620 | |
| Genomsnitt Intel Core i7-12700H (305 - 1171, n=64) | |
| Genomsnitt av klass Multimedia (143.8 - 2022, n=53, senaste 2 åren) | |
| Asus Vivobook Pro 16X-M7600QE | |
| Asus Vivobook Pro 16X-M7600QE | |
| Huawei MateBook D 16 2022 | |
| Samsung Galaxy Book2 15 | |
| Acer Swift X SFX16-51G-5388 | |
| AIDA64 / FP64 Ray-Trace | |
| Genomsnitt av klass Multimedia (1014 - 26875, n=53, senaste 2 åren) | |
| Asus Vivobook Pro 16X-M7600QE | |
| Asus Vivobook Pro 16X-M7600QE | |
| Lenovo ThinkBook 16 G4+ IAP | |
| Dell Inspiron 16 Plus 7620 | |
| Genomsnitt Intel Core i7-12700H (1437 - 9692, n=64) | |
| Huawei MateBook D 16 2022 | |
| Acer Swift X SFX16-51G-5388 | |
| Samsung Galaxy Book2 15 | |
| AIDA64 / CPU PhotoWorxx | |
| Genomsnitt av klass Multimedia (8187 - 88154, n=53, senaste 2 åren) | |
| Samsung Galaxy Book2 15 | |
| Lenovo ThinkBook 16 G4+ IAP | |
| Huawei MateBook D 16 2022 | |
| Acer Swift X SFX16-51G-5388 | |
| Dell Inspiron 16 Plus 7620 | |
| Genomsnitt Intel Core i7-12700H (12863 - 52207, n=64) | |
| Asus Vivobook Pro 16X-M7600QE | |
| Asus Vivobook Pro 16X-M7600QE | |
Systemets prestanda
Vid daglig användning är ThinkBook 16 G4+ en extremt responsiv bärbar dator och med tanke på de kraftfulla komponenterna bör man inte oroa sig för flaskhalsar i prestandan under de kommande åren. Vi kunde inte köra syntetiska PCMark 10 i vårt granskningsexemplar eftersom det alltid kraschade trots flera ominstallationer av programmet och även av drivrutinerna. Detta var det enda problemet vi stötte på under testningen och resultaten i de andra benchmarks är som väntat mycket bra.
WebXPRT 3: Overall
WebXPRT 4: Overall
Jetstream 2: 2.0 Total
Mozilla Kraken 1.1: Total
Octane V2: Total Score
LibreOffice : 20 Documents To PDF
| CrossMark / Overall | |
| Genomsnitt av klass Multimedia (866 - 2728, n=59, senaste 2 åren) | |
| Huawei MateBook D 16 2022 | |
| Lenovo ThinkBook 16 G4+ IAP | |
| Genomsnitt Intel Core i7-12700H, NVIDIA GeForce RTX 2050 Mobile (n=1) | |
| Dell Inspiron 16 Plus 7620 | |
| Acer Swift X SFX16-51G-5388 | |
| CrossMark / Productivity | |
| Huawei MateBook D 16 2022 | |
| Genomsnitt av klass Multimedia (931 - 2489, n=59, senaste 2 åren) | |
| Lenovo ThinkBook 16 G4+ IAP | |
| Genomsnitt Intel Core i7-12700H, NVIDIA GeForce RTX 2050 Mobile (n=1) | |
| Dell Inspiron 16 Plus 7620 | |
| Acer Swift X SFX16-51G-5388 | |
| CrossMark / Creativity | |
| Genomsnitt av klass Multimedia (907 - 3465, n=59, senaste 2 åren) | |
| Huawei MateBook D 16 2022 | |
| Lenovo ThinkBook 16 G4+ IAP | |
| Genomsnitt Intel Core i7-12700H, NVIDIA GeForce RTX 2050 Mobile (n=1) | |
| Dell Inspiron 16 Plus 7620 | |
| Acer Swift X SFX16-51G-5388 | |
| CrossMark / Responsiveness | |
| Huawei MateBook D 16 2022 | |
| Lenovo ThinkBook 16 G4+ IAP | |
| Genomsnitt Intel Core i7-12700H, NVIDIA GeForce RTX 2050 Mobile (n=1) | |
| Genomsnitt av klass Multimedia (605 - 2024, n=59, senaste 2 åren) | |
| Dell Inspiron 16 Plus 7620 | |
| Acer Swift X SFX16-51G-5388 | |
| WebXPRT 3 / Overall | |
| Genomsnitt av klass Multimedia (136.4 - 596, n=62, senaste 2 åren) | |
| Huawei MateBook D 16 2022 | |
| Dell Inspiron 16 Plus 7620 | |
| Lenovo ThinkBook 16 G4+ IAP | |
| Genomsnitt Intel Core i7-12700H, NVIDIA GeForce RTX 2050 Mobile (n=1) | |
| Asus Vivobook Pro 16X-M7600QE | |
| Samsung Galaxy Book2 15 | |
| Acer Swift X SFX16-51G-5388 | |
| WebXPRT 4 / Overall | |
| Genomsnitt av klass Multimedia (167.3 - 402, n=64, senaste 2 åren) | |
| Huawei MateBook D 16 2022 | |
| Lenovo ThinkBook 16 G4+ IAP | |
| Genomsnitt Intel Core i7-12700H, NVIDIA GeForce RTX 2050 Mobile (n=1) | |
| Dell Inspiron 16 Plus 7620 | |
| Samsung Galaxy Book2 15 | |
| Acer Swift X SFX16-51G-5388 | |
| Jetstream 2 / 2.0 Total | |
| Genomsnitt av klass Multimedia (287 - 481, n=30, senaste 2 åren) | |
| Dell Inspiron 16 Plus 7620 | |
| Lenovo ThinkBook 16 G4+ IAP | |
| Genomsnitt Intel Core i7-12700H, NVIDIA GeForce RTX 2050 Mobile (n=1) | |
| Huawei MateBook D 16 2022 | |
| Samsung Galaxy Book2 15 | |
| Acer Swift X SFX16-51G-5388 | |
| Mozilla Kraken 1.1 / Total | |
| Acer Swift X SFX16-51G-5388 | |
| Asus Vivobook Pro 16X-M7600QE | |
| Asus Vivobook Pro 16X-M7600QE | |
| Samsung Galaxy Book2 15 | |
| Dell Inspiron 16 Plus 7620 | |
| Huawei MateBook D 16 2022 | |
| Lenovo ThinkBook 16 G4+ IAP | |
| Genomsnitt Intel Core i7-12700H, NVIDIA GeForce RTX 2050 Mobile (n=1) | |
| Genomsnitt av klass Multimedia (228 - 835, n=65, senaste 2 åren) | |
| Octane V2 / Total Score | |
| Genomsnitt av klass Multimedia (79641 - 153175, n=29, senaste 2 åren) | |
| Huawei MateBook D 16 2022 | |
| Lenovo ThinkBook 16 G4+ IAP | |
| Genomsnitt Intel Core i7-12700H, NVIDIA GeForce RTX 2050 Mobile (n=1) | |
| Samsung Galaxy Book2 15 | |
| Acer Swift X SFX16-51G-5388 | |
| LibreOffice / 20 Documents To PDF | |
| Asus Vivobook Pro 16X-M7600QE | |
| Asus Vivobook Pro 16X-M7600QE | |
| Acer Swift X SFX16-51G-5388 | |
| Genomsnitt av klass Multimedia (23.9 - 146.7, n=56, senaste 2 åren) | |
| Lenovo ThinkBook 16 G4+ IAP | |
| Genomsnitt Intel Core i7-12700H, NVIDIA GeForce RTX 2050 Mobile (n=1) | |
| Dell Inspiron 16 Plus 7620 | |
| Samsung Galaxy Book2 15 | |
| Huawei MateBook D 16 2022 | |
* ... mindre är bättre
» No benchmarks for this notebook found!
| AIDA64 / Memory Copy | |
| Genomsnitt av klass Multimedia (11299 - 132135, n=53, senaste 2 åren) | |
| Lenovo ThinkBook 16 G4+ IAP | |
| Samsung Galaxy Book2 15 | |
| Huawei MateBook D 16 2022 | |
| Acer Swift X SFX16-51G-5388 | |
| Dell Inspiron 16 Plus 7620 | |
| Genomsnitt Intel Core i7-12700H (25615 - 80511, n=64) | |
| Asus Vivobook Pro 16X-M7600QE | |
| Asus Vivobook Pro 16X-M7600QE | |
| AIDA64 / Memory Read | |
| Genomsnitt av klass Multimedia (11624 - 174586, n=53, senaste 2 åren) | |
| Lenovo ThinkBook 16 G4+ IAP | |
| Dell Inspiron 16 Plus 7620 | |
| Samsung Galaxy Book2 15 | |
| Genomsnitt Intel Core i7-12700H (25586 - 79442, n=64) | |
| Huawei MateBook D 16 2022 | |
| Acer Swift X SFX16-51G-5388 | |
| Asus Vivobook Pro 16X-M7600QE | |
| Asus Vivobook Pro 16X-M7600QE | |
| AIDA64 / Memory Write | |
| Genomsnitt av klass Multimedia (11755 - 134998, n=53, senaste 2 åren) | |
| Samsung Galaxy Book2 15 | |
| Acer Swift X SFX16-51G-5388 | |
| Huawei MateBook D 16 2022 | |
| Lenovo ThinkBook 16 G4+ IAP | |
| Dell Inspiron 16 Plus 7620 | |
| Genomsnitt Intel Core i7-12700H (23679 - 88660, n=64) | |
| Asus Vivobook Pro 16X-M7600QE | |
| Asus Vivobook Pro 16X-M7600QE | |
| AIDA64 / Memory Latency | |
| Genomsnitt av klass Multimedia (7 - 535, n=52, senaste 2 åren) | |
| Acer Swift X SFX16-51G-5388 | |
| Lenovo ThinkBook 16 G4+ IAP | |
| Huawei MateBook D 16 2022 | |
| Dell Inspiron 16 Plus 7620 | |
| Genomsnitt Intel Core i7-12700H (76.2 - 133.9, n=62) | |
| Asus Vivobook Pro 16X-M7600QE | |
| Asus Vivobook Pro 16X-M7600QE | |
| Samsung Galaxy Book2 15 | |
* ... mindre är bättre
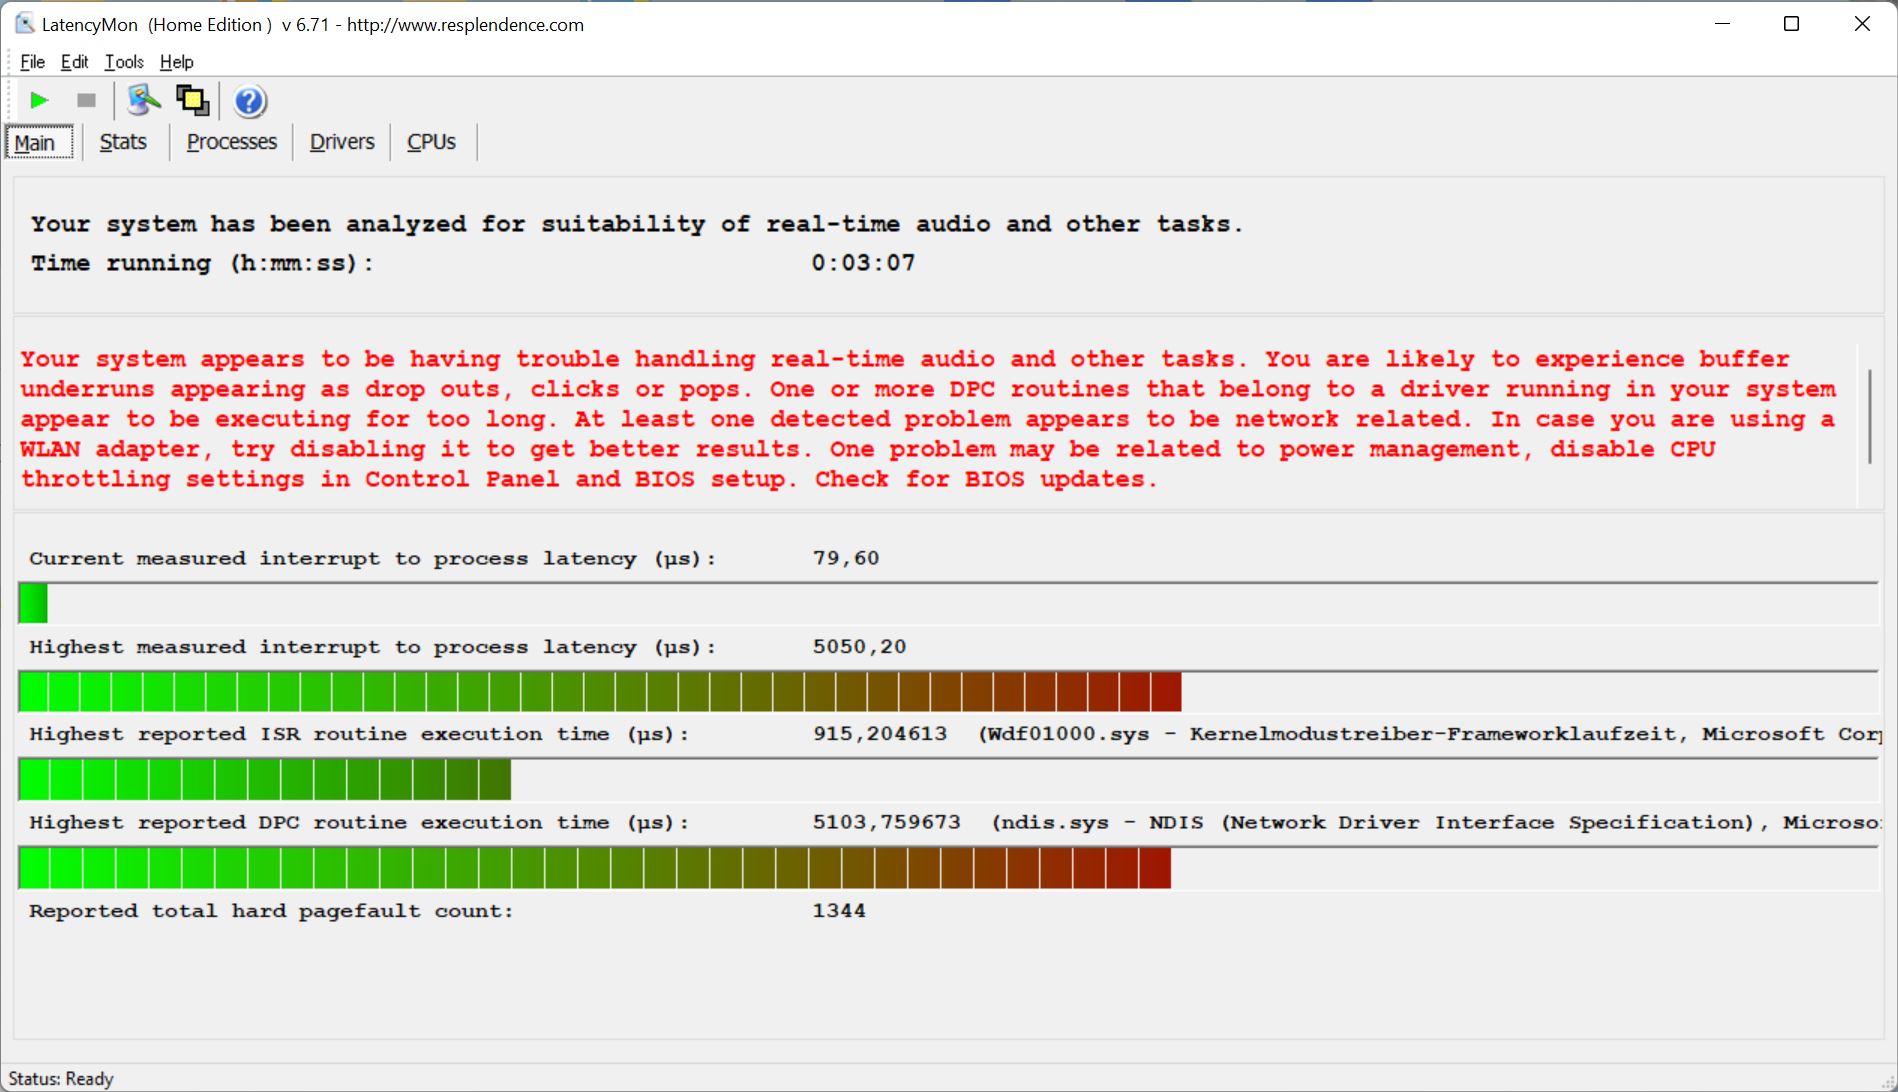
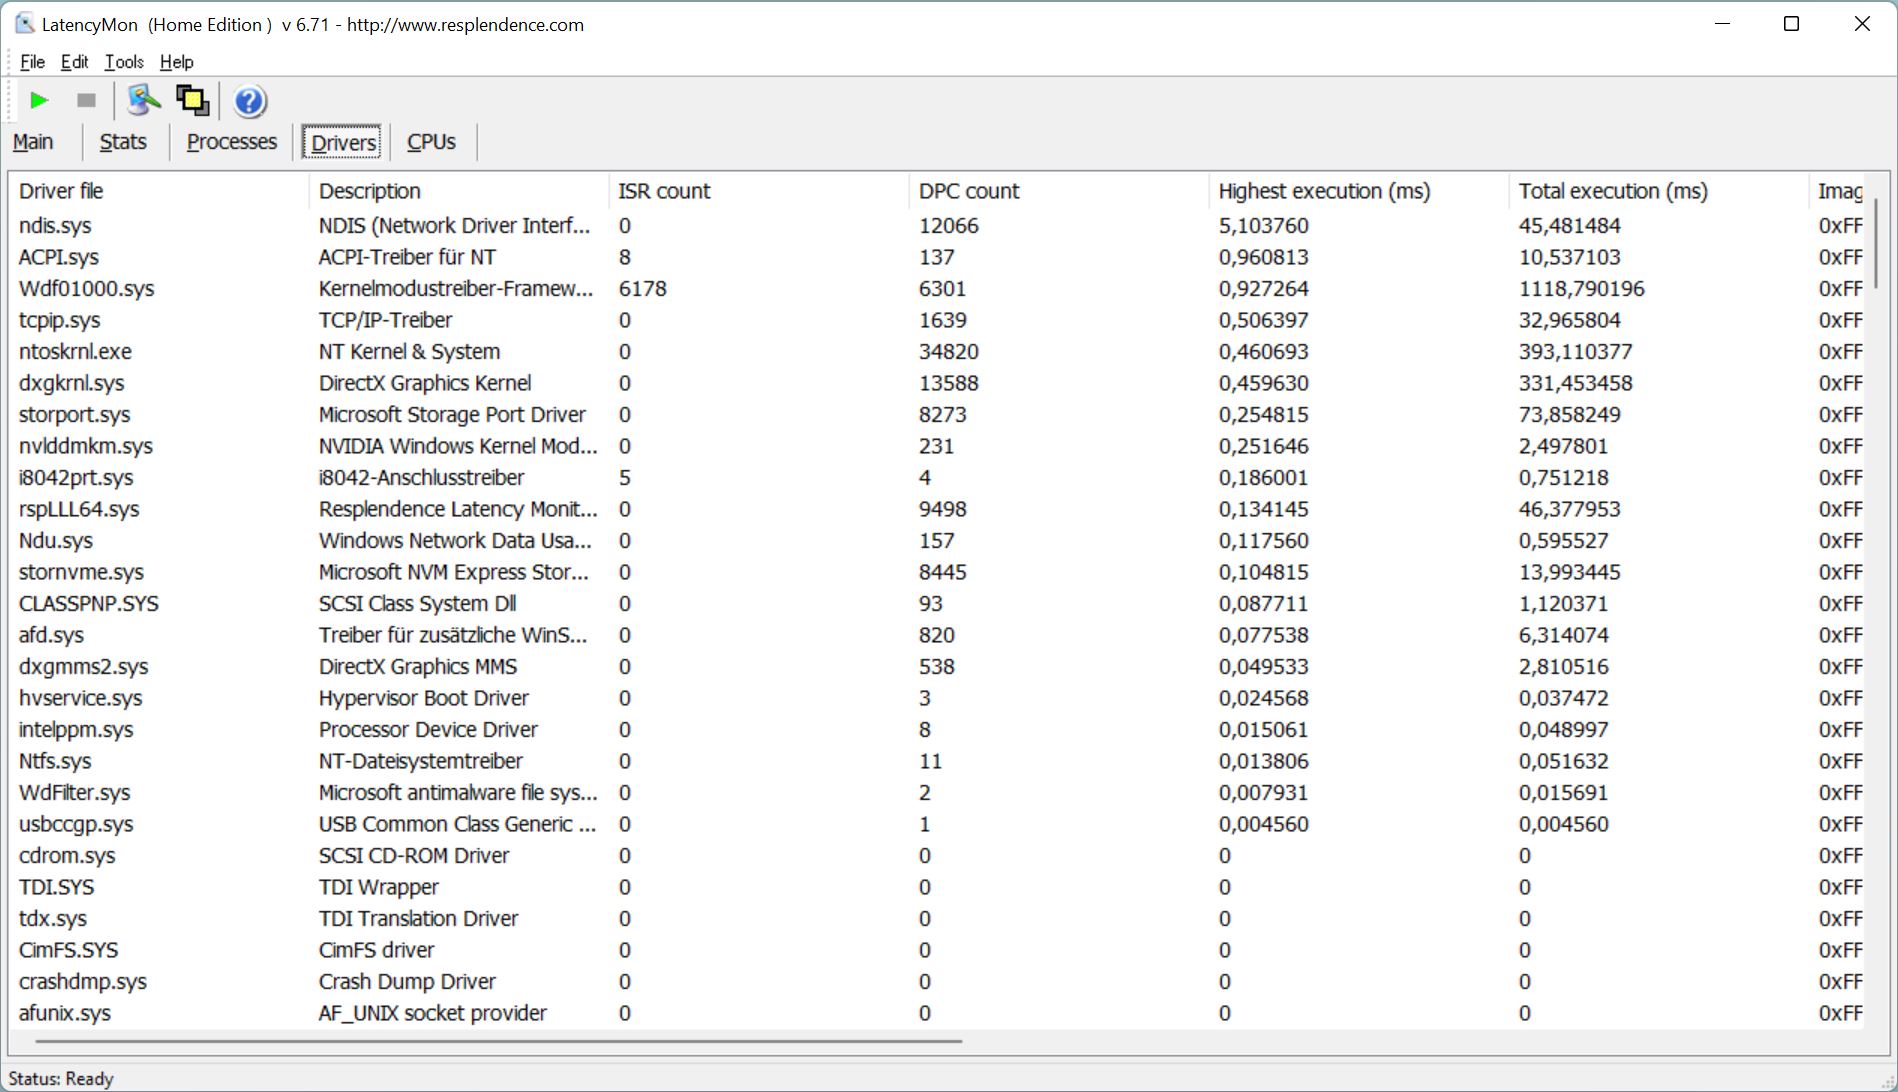
DPC-latenstid
I vårt standardiserade latenstest (webbsurfning, 4K YouTube-uppspelning, CPU-belastning) visar ThinkBook 16 G4+ allvarliga begränsningar med den nuvarande versionen och är därför olämplig för att använda ljudprogram i realtid.
| DPC Latencies / LatencyMon - interrupt to process latency (max), Web, Youtube, Prime95 | |
| Acer Swift X SFX16-51G-5388 | |
| Lenovo ThinkBook 16 G4+ IAP | |
| Asus Vivobook Pro 16X-M7600QE | |
| Dell Inspiron 16 Plus 7620 | |
| Samsung Galaxy Book2 15 | |
| Huawei MateBook D 16 2022 | |
* ... mindre är bättre
Massenspeicher
ThinkBook 16 G4+ har två M.2-2280-platser för SSD-diskar, varav den ena använder en snabb PCIe 4.0-anslutning och den andra PCIe 3.0. En kompakt Micron 2450 (M.2-2242) är installerad i vårt recensionsexemplar, vilket redan är en PCIe 4.0 SSD, men den här enheten är inte den snabbaste, eftersom tillverkaren anger en maximal överföringshastighet på 3,6 GB/s. Slutresultatet är att du har en PCIe 4.0 SSD med PCIe 3.0-hastighet. Detta innebär dock inga verkliga begränsningar i praktiken och prestandan förblir stabil även vid långvarig belastning. SSD:n erbjuder en kapacitet på 1 TB, varvid 916 GB fortfarande är tillgängliga efter den första uppstarten. Fler SSD-benchmarks finns tillgängligahär.

* ... mindre är bättre
Sustained Read Performance: DiskSpd Read Loop, Queue Depth 8
Grafikkort
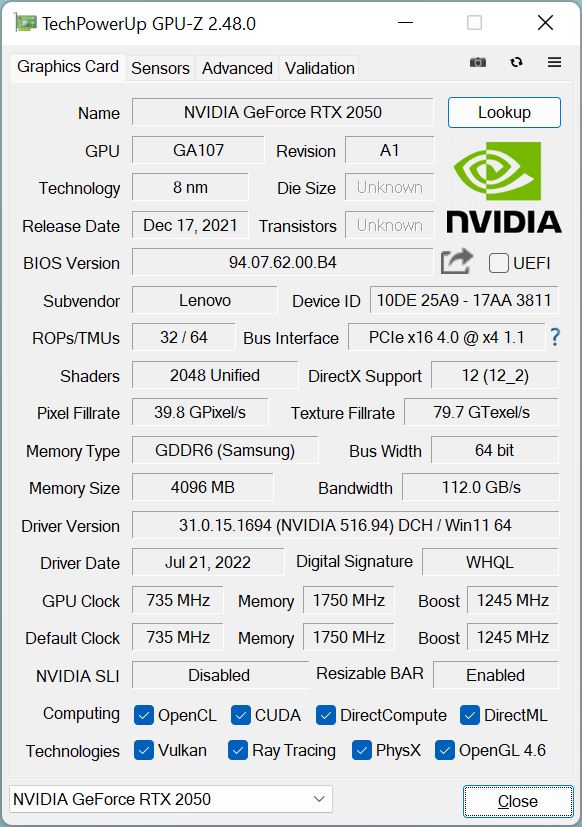
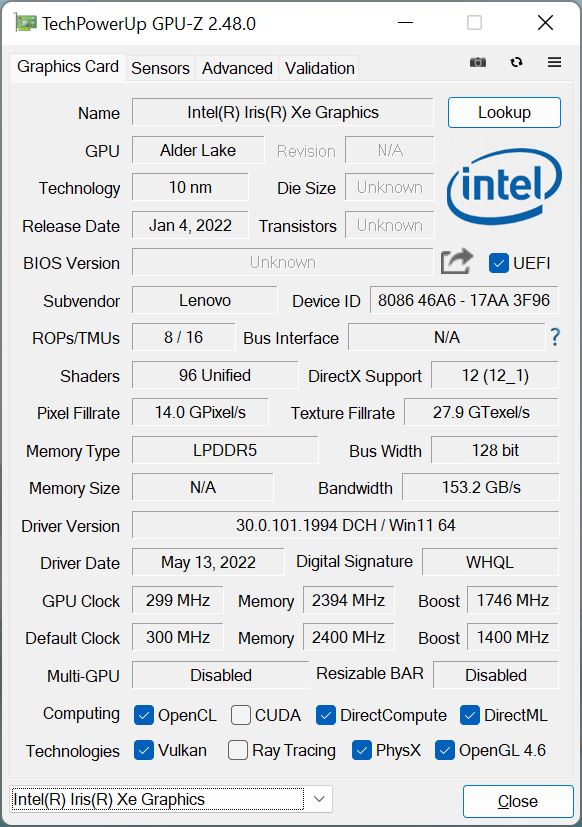
I vardaglig användning hanteras grafikberäkningar ofta av processorns integreradeIris Xe Graphics G7den dedikerade Nvidia GeForce RTX 2050kopplas bara på automatiskt vid högre belastning. I princip är denna GPU en GeForce MX570, men har även stöd för RayTracing och DLSS. TGP är inställd på maximalt 50 watt, varvid ytterligare 10 watt kan användas av processorn. Vi observerade en maximal kärnklocka på 1 762 MHz.
I de syntetiska riktmärkena placerar sig RTX 2050 vanligtvis strax bakom RTX 3050, som arbetar lite mer effektivt. Dessutom är GPU:n mer än dubbelt så snabb som Iris Xe Graphics G7 i krävande tester. Det finns ingen prestandaförlust vid långvarig belastning, eftersom det krävande stresstestet Time Spy lätt klaras med 99,7 %.
GPU:ns energiförbrukning är dock begränsad till 30 watt i batteriläge, vilket leder till en prestandaförlust på 15 %. Fler GPU-benchmarks finns i vårtekniska avsnittet.
| V-Ray 5 Benchmark - GPU CUDA | |
| Genomsnitt av klass Multimedia (335 - 1482, n=5, senaste 2 åren) | |
| Acer Swift X SFX16-51G-5388 | |
| Genomsnitt NVIDIA GeForce RTX 2050 Mobile (169 - 214, n=3) | |
* ... mindre är bättre
| 3DMark Vantage P Result | 52669 poäng | |
| 3DMark 11 Performance | 15277 poäng | |
| 3DMark Cloud Gate Standard Score | 40781 poäng | |
| 3DMark Fire Strike Score | 9274 poäng | |
| 3DMark Time Spy Score | 4300 poäng | |
Hjälp | ||
Spelprestanda
Spelprestandan hosRTX 2050är bra, och ThinkBook 16 G4+ ligger återigen bakom RTX 3050 Ti och i många fall även RTX 3050. Många titlar kan alltså spelas smidigt i Full HD och höga detaljer, och native WQHD-upplösning är också möjlig i vissa fall. En minskning av detaljerna i FHD krävs endast för krävande titlar som Cyberpoint 2077. Vår Witcher 3 -slinga visar att prestandan inte sjunker under längre spelsessioner. Fler benchmarks för spel finns tillgängliga här.
| The Witcher 3 | |
| 1920x1080 High Graphics & Postprocessing (Nvidia HairWorks Off) | |
| Dell Inspiron 16 Plus 7620 | |
| Lenovo ThinkBook 16 G4+ IAP | |
| Genomsnitt av klass Multimedia (22 - 157, n=5, senaste 2 åren) | |
| Asus Vivobook Pro 16X-M7600QE | |
| Genomsnitt NVIDIA GeForce RTX 2050 Mobile (46.7 - 78, n=8) | |
| Acer Swift X SFX16-51G-5388 | |
| Samsung Galaxy Book2 15 | |
| Huawei MateBook D 16 2022 | |
| 1920x1080 Ultra Graphics & Postprocessing (HBAO+) | |
| Dell Inspiron 16 Plus 7620 | |
| Asus Vivobook Pro 16X-M7600QE | |
| Genomsnitt av klass Multimedia (11 - 107, n=5, senaste 2 åren) | |
| Lenovo ThinkBook 16 G4+ IAP | |
| Genomsnitt NVIDIA GeForce RTX 2050 Mobile (24.3 - 39.6, n=9) | |
| Acer Swift X SFX16-51G-5388 | |
| Samsung Galaxy Book2 15 | |
| Huawei MateBook D 16 2022 | |
| Cyberpunk 2077 1.6 | |
| 1920x1080 High Preset | |
| Dell Inspiron 16 Plus 7620 | |
| Lenovo ThinkBook 16 G4+ IAP | |
| Genomsnitt NVIDIA GeForce RTX 2050 Mobile (19.1 - 31, n=4) | |
| Samsung Galaxy Book2 15 | |
| 1920x1080 Ultra Preset | |
| Dell Inspiron 16 Plus 7620 | |
| Lenovo ThinkBook 16 G4+ IAP | |
| Genomsnitt NVIDIA GeForce RTX 2050 Mobile (16.8 - 27.4, n=4) | |
| Samsung Galaxy Book2 15 | |
| F1 2021 | |
| 1920x1080 High Preset AA:T AF:16x | |
| Asus Vivobook Pro 16X-M7600QE | |
| Lenovo ThinkBook 16 G4+ IAP | |
| Genomsnitt NVIDIA GeForce RTX 2050 Mobile (66.2 - 107.6, n=3) | |
| Samsung Galaxy Book2 15 | |
| Huawei MateBook D 16 2022 | |
| 1920x1080 Ultra High Preset + Raytracing AA:T AF:16x | |
| Asus Vivobook Pro 16X-M7600QE | |
| Genomsnitt NVIDIA GeForce RTX 2050 Mobile (36.1 - 52.3, n=3) | |
| Lenovo ThinkBook 16 G4+ IAP | |
| Huawei MateBook D 16 2022 | |
| Samsung Galaxy Book2 15 | |
Witcher 3 FPS Chart
| låg | med. | hög | ultra | QHD | |
|---|---|---|---|---|---|
| GTA V (2015) | 179.1 | 175.3 | 108.1 | 52.9 | 37.3 |
| The Witcher 3 (2015) | 216 | 139 | 77 | 38.3 | |
| Dota 2 Reborn (2015) | 167.4 | 153.9 | 140 | 129.6 | |
| Final Fantasy XV Benchmark (2018) | 109.1 | 61 | 41.8 | 29 | |
| X-Plane 11.11 (2018) | 139.6 | 106.4 | 90.1 | ||
| Far Cry 5 (2018) | 118 | 68 | 62 | 60 | 39 |
| Strange Brigade (2018) | 196.9 | 86.8 | 71.5 | 63.1 | 46.5 |
| F1 2021 (2021) | 229 | 130.6 | 99.5 | 44.1 | 28.2 |
| Cyberpunk 2077 1.6 (2022) | 49 | 41 | 31 | 25 |
Utsläpp - Spel kräver hörlurar
Buller
Vid tomgång eller låg belastning förblir de två fläktarna nästan alltid avaktiverade, även i högprestandaläget . De når dock snabbt högsta hastighet vid högre belastning i detta läge, vilket motsvarar en ljudnivå på 47 dB(A). Detta är redan klart hörbart och därför rekommenderar vi hörlurar när du spelar. I läget Intelligent Cooling är den bärbara datorn endast marginellt tystare med knappt 44 dB(A) när man spelar. Om du inte behöver mycket prestanda kan du enkelt byta till batterisparläge, eftersom fläktarna sällan kickar igång och knappt hörs, men det här läget är knappast lämpligt för spel på grund av effektminskningen. Inga elektroniska ljud upptäcktes.
Ljudnivå
| Låg belastning |
| 24.2 / 24.2 / 24.2 dB(A) |
| Hög belastning |
| 47 / 47 dB(A) |
 | ||
30 dB tyst 40 dB(A) hörbar 50 dB(A) högt ljud |
||
min: | ||
| Lenovo ThinkBook 16 G4+ IAP GeForce RTX 2050 Mobile, i7-12700H, Micron 2450 1TB MTFDKCD1T0TFK | Dell Inspiron 16 Plus 7620 GeForce RTX 3050 Ti Laptop GPU, i7-12700H, Kioxia BG5 KBG50ZNS512G | Acer Swift X SFX16-51G-5388 GeForce RTX 3050 4GB Laptop GPU, i5-11320H, Samsung PM991 MZVLQ512HBLU | Asus Vivobook Pro 16X-M7600QE GeForce RTX 3050 Ti Laptop GPU, R9 5900HX, SK Hynix HFM001TD3JX013N | Huawei MateBook D 16 2022 Iris Xe G7 96EUs, i7-12700H, Silicon Motion PCIe-8 SSD | Samsung Galaxy Book2 15 A350M, i7-1260P, Samsung PM991 MZVLQ512HBLU | |
|---|---|---|---|---|---|---|
| Noise | -6% | -3% | -5% | 2% | -4% | |
| av / miljö * (dB) | 24.2 | 23.3 4% | 25.4 -5% | 26 -7% | 24.2 -0% | 24.3 -0% |
| Idle Minimum * (dB) | 24.2 | 25.7 -6% | 25.4 -5% | 27 -12% | 24.2 -0% | 24.3 -0% |
| Idle Average * (dB) | 24.2 | 26.1 -8% | 25.4 -5% | 27 -12% | 25.8 -7% | 24.3 -0% |
| Idle Maximum * (dB) | 24.2 | 30.6 -26% | 27.8 -15% | 27.5 -14% | 30.5 -26% | 29.8 -23% |
| Load Average * (dB) | 47 | 46.2 2% | 41 13% | 41.7 11% | 39.8 15% | 47.5 -1% |
| Witcher 3 ultra * (dB) | 47 | 49.2 -5% | 39.8 15% | 47.5 -1% | ||
| Load Maximum * (dB) | 47 | 49.4 -5% | 47 -0% | 45.3 4% | 39.8 15% | 47.5 -1% |
* ... mindre är bättre
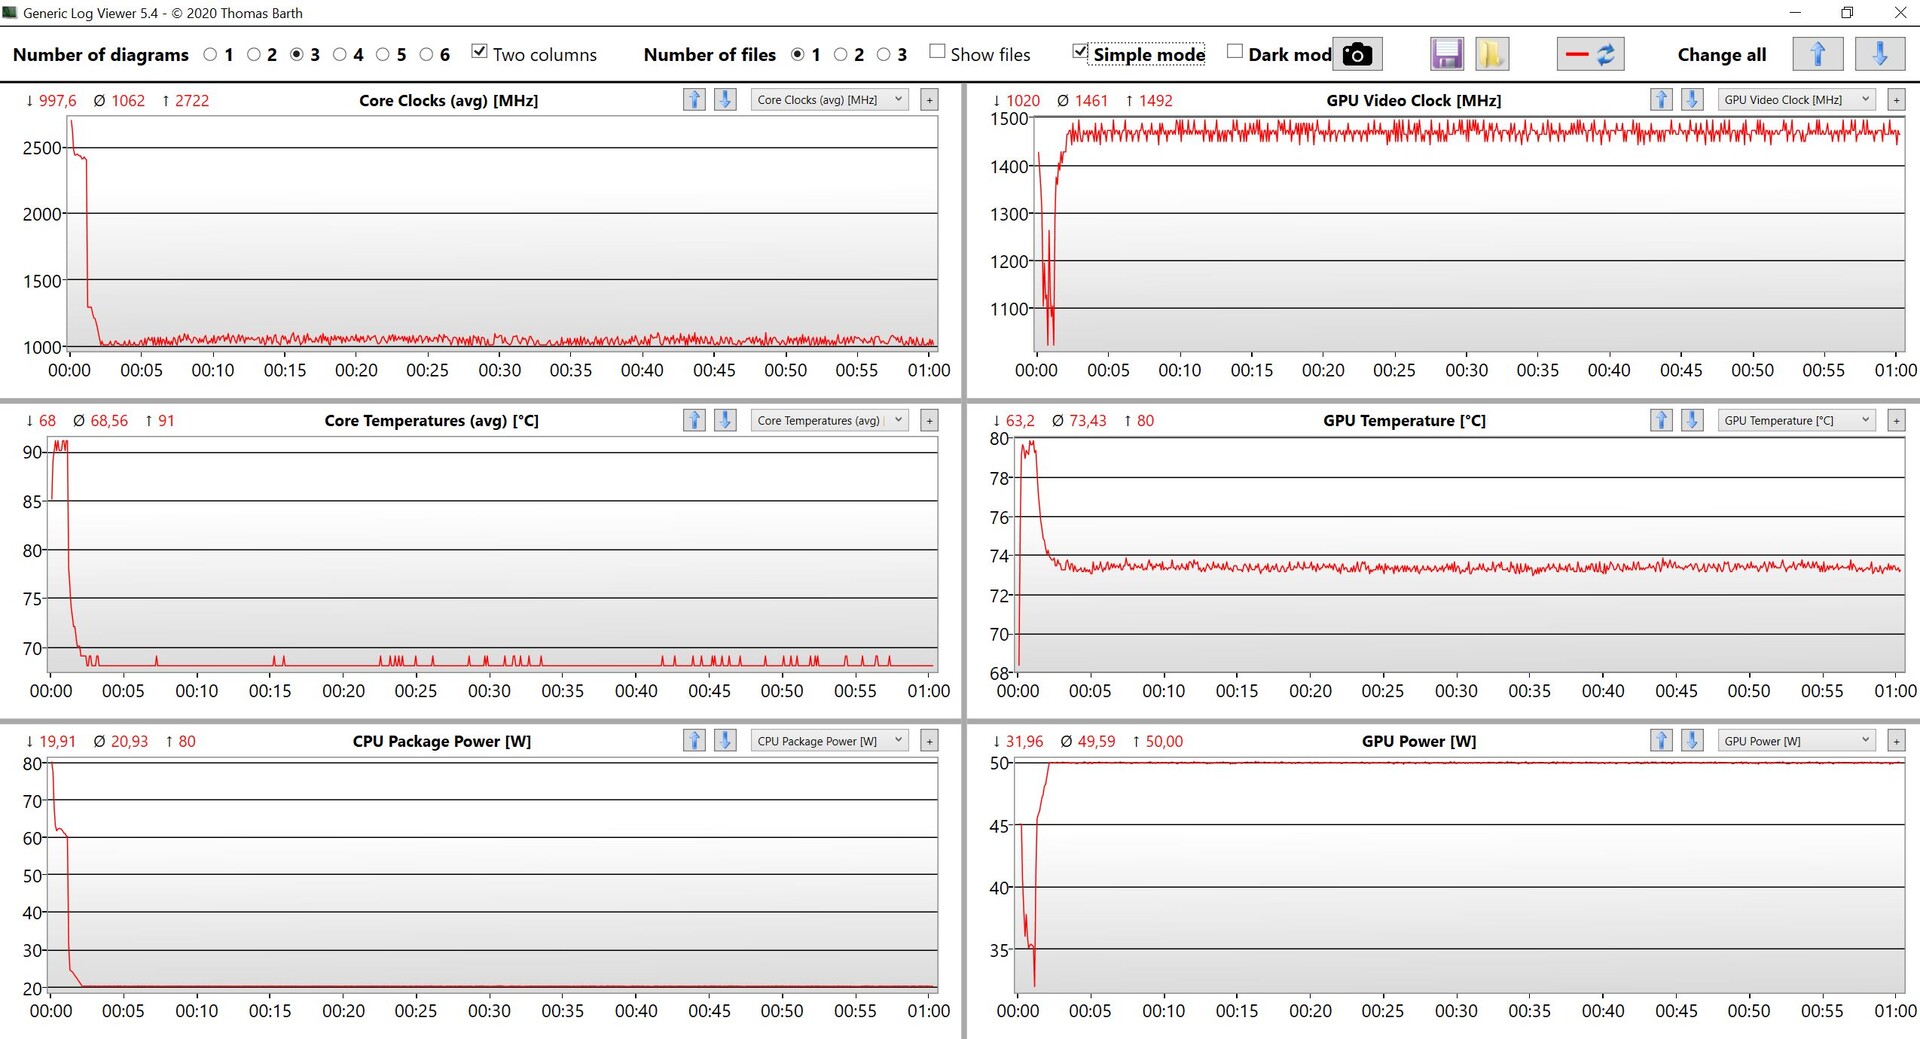
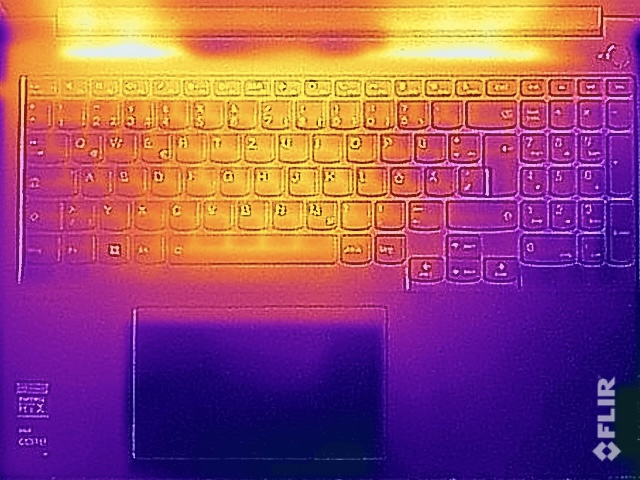
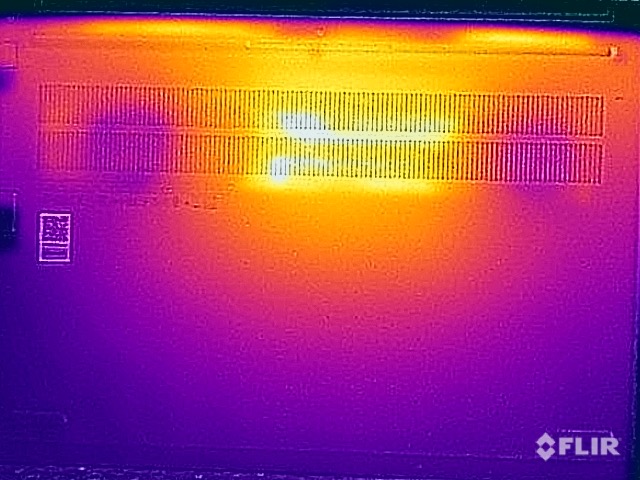
Temperatur
Aluminiumhöljet värms inte upp alls vid låg belastning. Det blir bara betydligt varmare vid spel eller stresstester. På ovansidan av basenheten registrerade vi cirka 42 °C i det mellersta/övre tangentbordsområdet, vilket också märks när man skriver, men inte är obehagligt. På undersidan finns det en hotspot i det centrala bakre området av höljet, där vi uppmätte cirka 50 °C. Direkt hudkontakt med metallytor bör undvikas här.
I stresstesterna startar processorn med full effekt för att efter några minuter plana ut på 20 watt, medan grafikkortet stabiliseras vid 50 watt och stannar kvar på denna nivå. GPU:n prioriteras därför i läget High Performance, medan processorn tillåts förbruka lite mer ström i läget Intelligent Cooling (24/36 watt).
(±) Den maximala temperaturen på ovansidan är 42.9 °C / 109 F, jämfört med genomsnittet av 36.8 °C / 98 F , allt från 21 till 71 °C för klassen Multimedia.
(-) Botten värms upp till maximalt 50.6 °C / 123 F, jämfört med genomsnittet av 39.1 °C / 102 F
(+) Vid tomgångsbruk är medeltemperaturen för ovansidan 25.3 °C / 78 F, jämfört med enhetsgenomsnittet på 31.3 °C / ### class_avg_f### F.
(±) När du spelar The Witcher 3 är medeltemperaturen för ovansidan 36.1 °C / 97 F, jämfört med enhetsgenomsnittet på 31.3 °C / ## #class_avg_f### F.
(+) Handledsstöden och pekplattan är kallare än hudtemperaturen med maximalt 28.3 °C / 82.9 F och är därför svala att ta på.
(±) Medeltemperaturen för handledsstödsområdet på liknande enheter var 28.7 °C / 83.7 F (+0.4 °C / 0.8 F).
| Lenovo ThinkBook 16 G4+ IAP Intel Core i7-12700H, NVIDIA GeForce RTX 2050 Mobile | Dell Inspiron 16 Plus 7620 Intel Core i7-12700H, NVIDIA GeForce RTX 3050 Ti Laptop GPU | Acer Swift X SFX16-51G-5388 Intel Core i5-11320H, NVIDIA GeForce RTX 3050 4GB Laptop GPU | Asus Vivobook Pro 16X-M7600QE AMD Ryzen 9 5900HX, NVIDIA GeForce RTX 3050 Ti Laptop GPU | Huawei MateBook D 16 2022 Intel Core i7-12700H, Intel Iris Xe Graphics G7 96EUs | Samsung Galaxy Book2 15 Intel Core i7-1260P, Intel Arc A350M | |
|---|---|---|---|---|---|---|
| Heat | -7% | -13% | 3% | -3% | 1% | |
| Maximum Upper Side * (°C) | 42.9 | 46 -7% | 52.4 -22% | 39.4 8% | 41.8 3% | 44.6 -4% |
| Maximum Bottom * (°C) | 50.6 | 45.8 9% | 50 1% | 43.6 14% | 47.3 7% | 47.5 6% |
| Idle Upper Side * (°C) | 26 | 29.2 -12% | 30.3 -17% | 27.6 -6% | 28.3 -9% | 25.8 1% |
| Idle Bottom * (°C) | 26.5 | 31 -17% | 30.4 -15% | 27.5 -4% | 30.2 -14% | 26.1 2% |
* ... mindre är bättre
Högtalare
Lenovo utrustar ThinkBook 16 G4+ med två stereohögtalare (2x 2 watt), som är placerade på basenhetens framsida och riktar ljudet nedåt. Ljudmässigt är modulerna genomsnittliga och jämförbara med den direkta konkurrenten, den Dell Inspiron 16 Plus, eftersom båda modellerna saknar kraft och bas. För bakgrundsmusik eller tillfälliga videor är ljudkvaliteten tillräcklig och är till och med mycket bra för talåtergivning (t.ex. konferenser) tack vare den linjära återgivningen av diskant/högtalare. Externa högtalare eller hörlurar bör dock användas för spel eller filmkvällar.
Lenovo ThinkBook 16 G4+ IAP ljudanalys
(±) | högtalarljudstyrkan är genomsnittlig men bra (77.6 dB)
Bas 100 - 315 Hz
(-) | nästan ingen bas - i genomsnitt 17.3% lägre än medianen
(±) | linjäriteten för basen är genomsnittlig (10.3% delta till föregående frekvens)
Mellan 400 - 2000 Hz
(+) | balanserad mellan - endast 4.6% från medianen
(+) | mids är linjära (4.6% delta till föregående frekvens)
Högsta 2 - 16 kHz
(+) | balanserade toppar - endast 1.6% från medianen
(+) | toppar är linjära (6.2% delta till föregående frekvens)
Totalt 100 - 16 000 Hz
(±) | linjäriteten för det totala ljudet är genomsnittlig (15.7% skillnad mot median)
Jämfört med samma klass
» 39% av alla testade enheter i den här klassen var bättre, 5% liknande, 56% sämre
» Den bästa hade ett delta på 5%, genomsnittet var 17%, sämst var 45%
Jämfört med alla testade enheter
» 24% av alla testade enheter var bättre, 5% liknande, 71% sämre
» Den bästa hade ett delta på 4%, genomsnittet var 23%, sämst var 134%
Dell Inspiron 16 Plus 7620 ljudanalys
(+) | högtalare kan spela relativt högt (87.8 dB)
Bas 100 - 315 Hz
(-) | nästan ingen bas - i genomsnitt 22.2% lägre än medianen
(±) | linjäriteten för basen är genomsnittlig (9.7% delta till föregående frekvens)
Mellan 400 - 2000 Hz
(+) | balanserad mellan - endast 3.3% från medianen
(+) | mids är linjära (5.3% delta till föregående frekvens)
Högsta 2 - 16 kHz
(+) | balanserade toppar - endast 2.5% från medianen
(+) | toppar är linjära (4.7% delta till föregående frekvens)
Totalt 100 - 16 000 Hz
(+) | det totala ljudet är linjärt (13.4% skillnad mot median)
Jämfört med samma klass
» 28% av alla testade enheter i den här klassen var bättre, 5% liknande, 68% sämre
» Den bästa hade ett delta på 5%, genomsnittet var 17%, sämst var 45%
Jämfört med alla testade enheter
» 14% av alla testade enheter var bättre, 4% liknande, 82% sämre
» Den bästa hade ett delta på 4%, genomsnittet var 23%, sämst var 134%
Energiförvaltning - ThinkBook med god uthållighet
Effektförbrukning
ThinkBooks tomgångsförbrukning är helt acceptabel med tanke på den stora WQHD-panelen med högst ~12 watt. Det medföljande 100-watts nätaggregatet blir dock snabbt en begränsande faktor under belastning. I extrema fall anger HWiNFO-verktyget en maximal totalförbrukning på 162 watt i början av stresstestet och vid utvärdering av data ser vi att upp till 70 watt också måste utvinnas från batteriet under en kort tid. Situationen stabiliseras efter några minuter, men detta är verkligen inte gynnsamt för batteriets livslängd om batteriet måste tappas om och om igen under belastning.
| Av/Standby | |
| Låg belastning | |
| Hög belastning |
|
Förklaring:
min: | |
| Lenovo ThinkBook 16 G4+ IAP i7-12700H, GeForce RTX 2050 Mobile, Micron 2450 1TB MTFDKCD1T0TFK, IPS, 2560x1600, 16" | Dell Inspiron 16 Plus 7620 i7-12700H, GeForce RTX 3050 Ti Laptop GPU, Kioxia BG5 KBG50ZNS512G, IPS, 3072x1920, 16" | Acer Swift X SFX16-51G-5388 i5-11320H, GeForce RTX 3050 4GB Laptop GPU, Samsung PM991 MZVLQ512HBLU, , 1920x1080, 16.1" | Asus Vivobook Pro 16X-M7600QE R9 5900HX, GeForce RTX 3050 Ti Laptop GPU, SK Hynix HFM001TD3JX013N, OLED, 3840x2400, 16.1" | Huawei MateBook D 16 2022 i7-12700H, Iris Xe G7 96EUs, Silicon Motion PCIe-8 SSD, IPS, 1920x1200, 16" | Samsung Galaxy Book2 15 i7-1260P, A350M, Samsung PM991 MZVLQ512HBLU, IPS, 1920x1080, 15.6" | Genomsnitt NVIDIA GeForce RTX 2050 Mobile | Genomsnitt av klass Multimedia | |
|---|---|---|---|---|---|---|---|---|
| Power Consumption | -29% | 0% | -22% | 12% | 30% | 11% | 1% | |
| Idle Minimum * (Watt) | 5 | 6.8 -36% | 7 -40% | 8.2 -64% | 6.1 -22% | 4 20% | 5.11 ? -2% | 5.62 ? -12% |
| Idle Average * (Watt) | 11.2 | 9.6 14% | 10.1 10% | 16.2 -45% | 10.6 5% | 7.8 30% | 9.15 ? 18% | 10.2 ? 9% |
| Idle Maximum * (Watt) | 11.6 | 17 -47% | 15 -29% | 19.7 -70% | 11.5 1% | 8.5 27% | 11.2 ? 3% | 12.5 ? -8% |
| Load Average * (Watt) | 89.3 | 117.5 -32% | 63.3 29% | 65.8 26% | 65.5 27% | 59.1 34% | 70.6 ? 21% | 65 ? 27% |
| Witcher 3 ultra * (Watt) | 83 | 113.1 -36% | 63.3 24% | 65.6 21% | 61.2 26% | 56.7 32% | ||
| Load Maximum * (Watt) | 102 | 137.4 -35% | 94 8% | 104 -2% | 68.4 33% | 62.4 39% | 87.4 ? 14% | 111.9 ? -10% |
* ... mindre är bättre
Power consumption Witcher 3 / Stress test
Power cosumption with an external monitor
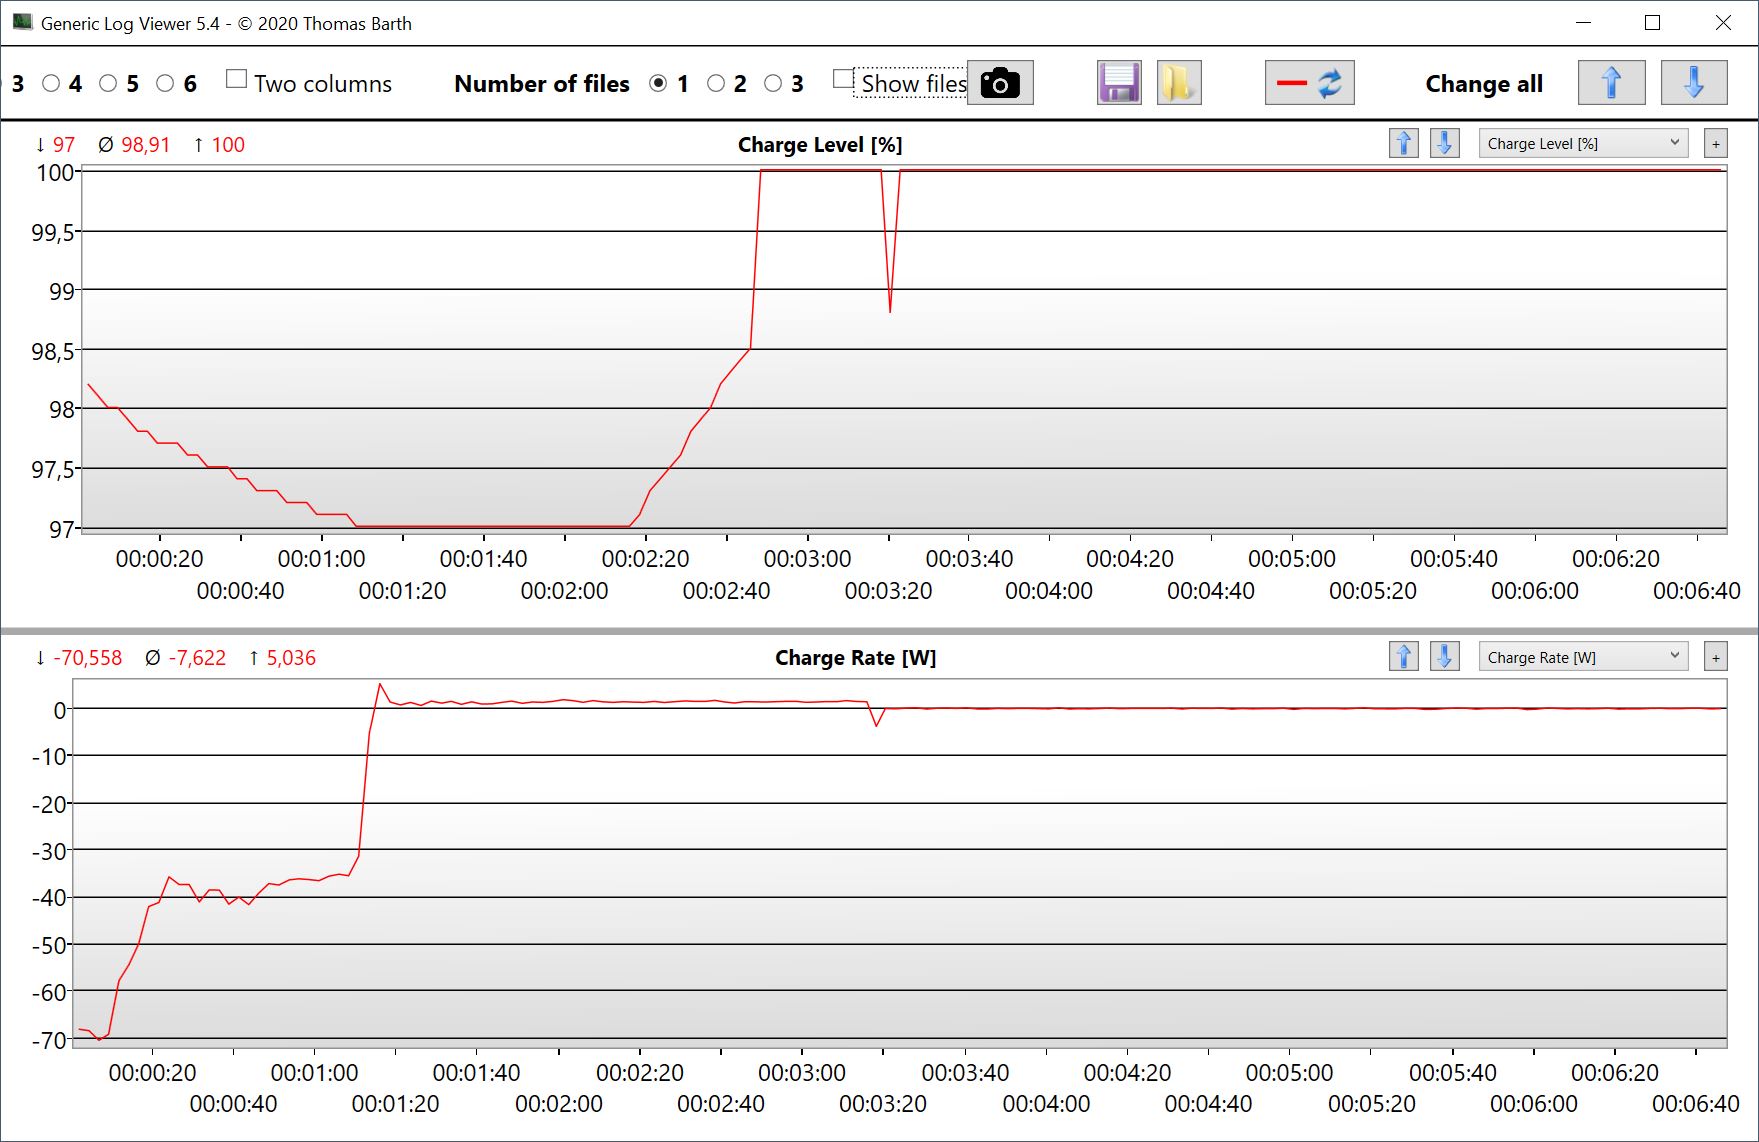
Batteritid
Batteriet på 71 Wh ger hyggliga driftstider, eftersom vårt testprov klarade sig mellan 6:43 timmar och 8:09 timmar i WLAN-test, beroende på skärmens ljusstyrka. Lite mer än 12 timmar är till och med möjligt med videouppspelning vid 150 cd/m² (motsvarande 71 % av maximal ljusstyrka). Den här stora skillnaden till WLAN-testet visar än en gång att de nuvarande Alder Lake-processorerna inte arbetar särskilt effektivt, inte ens vid belastning av en enda kärna (dvs. när man surfar på internet).
Den fullständiga laddningsprocessen med enheten påslagen tar cirka 100 minuter med en linjär laddningskurva, men det finns också ett expressladdningsalternativ som bara tar 73 minuter (60 % är redan tillgängligt efter 28 minuter).
| Lenovo ThinkBook 16 G4+ IAP i7-12700H, GeForce RTX 2050 Mobile, 71 Wh | Dell Inspiron 16 Plus 7620 i7-12700H, GeForce RTX 3050 Ti Laptop GPU, 86 Wh | Acer Swift X SFX16-51G-5388 i5-11320H, GeForce RTX 3050 4GB Laptop GPU, 58.7 Wh | Asus Vivobook Pro 16X-M7600QE R9 5900HX, GeForce RTX 3050 Ti Laptop GPU, 96 Wh | Huawei MateBook D 16 2022 i7-12700H, Iris Xe G7 96EUs, 60 Wh | Samsung Galaxy Book2 15 i7-1260P, A350M, 54 Wh | Genomsnitt av klass Multimedia | |
|---|---|---|---|---|---|---|---|
| Batteridrifttid | -2% | -11% | 6% | -13% | -5% | 31% | |
| H.264 (h) | 12.6 | 8.4 -33% | 10.6 -16% | 16.8 ? 33% | |||
| WiFi v1.3 (h) | 8.2 | 9.6 17% | 8.1 -1% | 11.3 38% | 7.1 -13% | 8.2 0% | 12.3 ? 50% |
| Load (h) | 1.5 | 1.2 -20% | 1.5 0% | 1.1 -27% | 1.5 0% | 1.645 ? 10% |
För
Emot
Slutsats - ThinkBook 16 G4+ är en mycket bra bärbar dator för multimedieanvändning

Lenovo ThinkBook 16 G4+ är en mycket solid multimedianotebook som har få kritikpunkter, bortsett från den svaga strömförsörjningen vid toppbelastning. Basenheten skulle kunna vara lite stabilare och Lenovo har också utrymme för förbättringar i tangentbordet, men dessa punkter skulle inte avskräcka oss från att köpa den.
Den stora 16-tums IPS-displayen erbjuder mycket god bildbildkvalitet fri från PWM och ljusa ytor verkar inte korniga trots den matta ytan. Även om det saknas ytterligare funktioner som HDR, en högre uppdateringsfrekvens eller ett utökat färgutrymme här, är panelen ändå fullt tillräcklig för sitt avsedda ändamål. Prestandavärdena, tack vare kombinationen av en Intel Core i7-12700H och en Nvidia GeForce RTX 2050, är mycket bra. Till och med spelande är inget problem med ThinkBook.
I ThinkBook 16 G4+ erbjuder Lenovo en mycket bra multimedianotebook som inte har några större svaga punkter och som imponerar med sina omfattande anslutningsmöjligheter, höga prestanda och bra IPS-skärm i vardagligt bruk.
Konkurrerande enheter, som t.ex Dell Inspiron 16 Plus eller Acer Swift X, erbjuder något snabbare och effektivare GPU:er i den RTX 3050 och RTX 3050 Ti, men kämpar med mörkare skärmar. På det hela taget är ThinkBook 16 G4+ en mycket solid bärbar dator som, allt som allt, ligger före sina rivaler.
Pris och tillgänglighet
Lenovo ThinkBook 16 G4+ verkar inte finnas i någon större utsträckning i hela världen. På Lenovos officiella webbplats finns den bärbara datorn till exempel listad på Frankrike (1 079,00 €), Italien (1,659.00€), Singapore (SG$1 504,07) och Förenade Arabemiraten.
Förteckningen är inte uttömmande. Priserna gäller från och med 20.09.2022 och kan ändras
Lenovo ThinkBook 16 G4+ IAP
- 09/20/2022 v7 (old)
Andreas Osthoff
Price comparison

