Apple MacBook Pro 16 2021 M1 Max Laptop Review: Full prestanda utan strypning
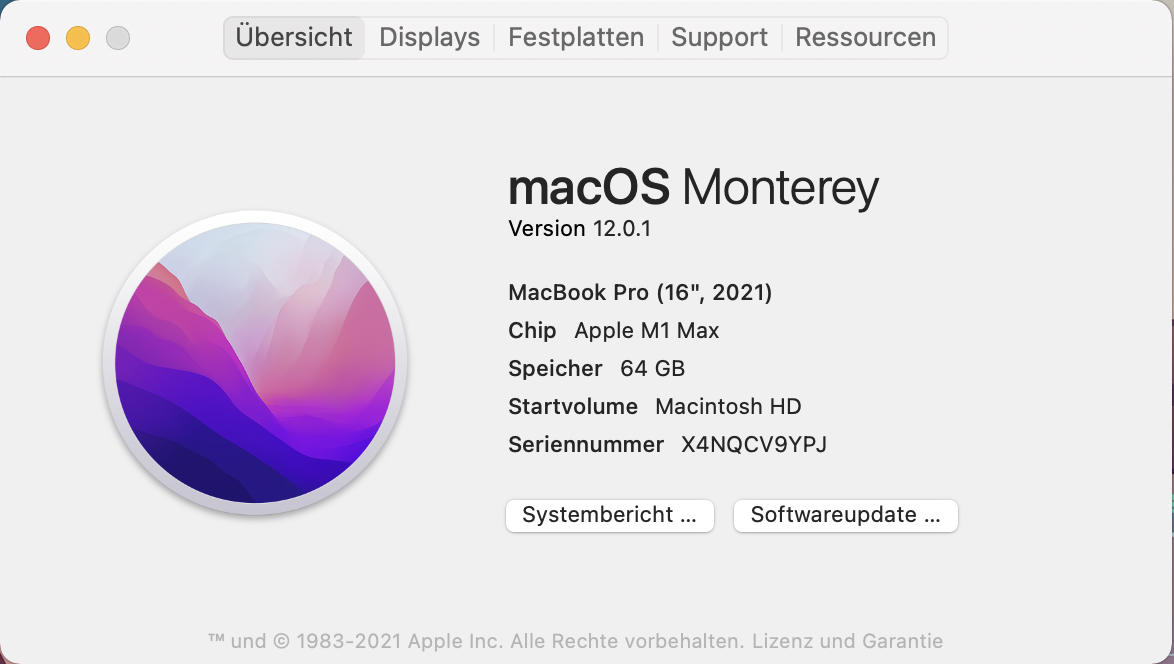
Vi har redan granskat MacBook Pro 16 i instegsutförande med Apples M1 Pro SoC. Nu är det dags att ta en närmare titt på den mest kraftfulla enheten från Cupertino, MacBook Pro 16 med M1 Max SoC, 32 GPU-kärnor och 64 GB RAM. I kombination med 2 TB PCIe 4.0 SSD har den ett försäljningspris på 4769 euro.
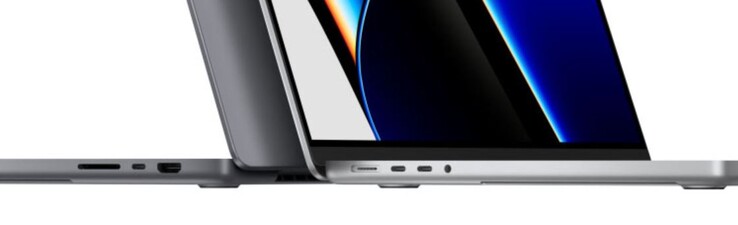
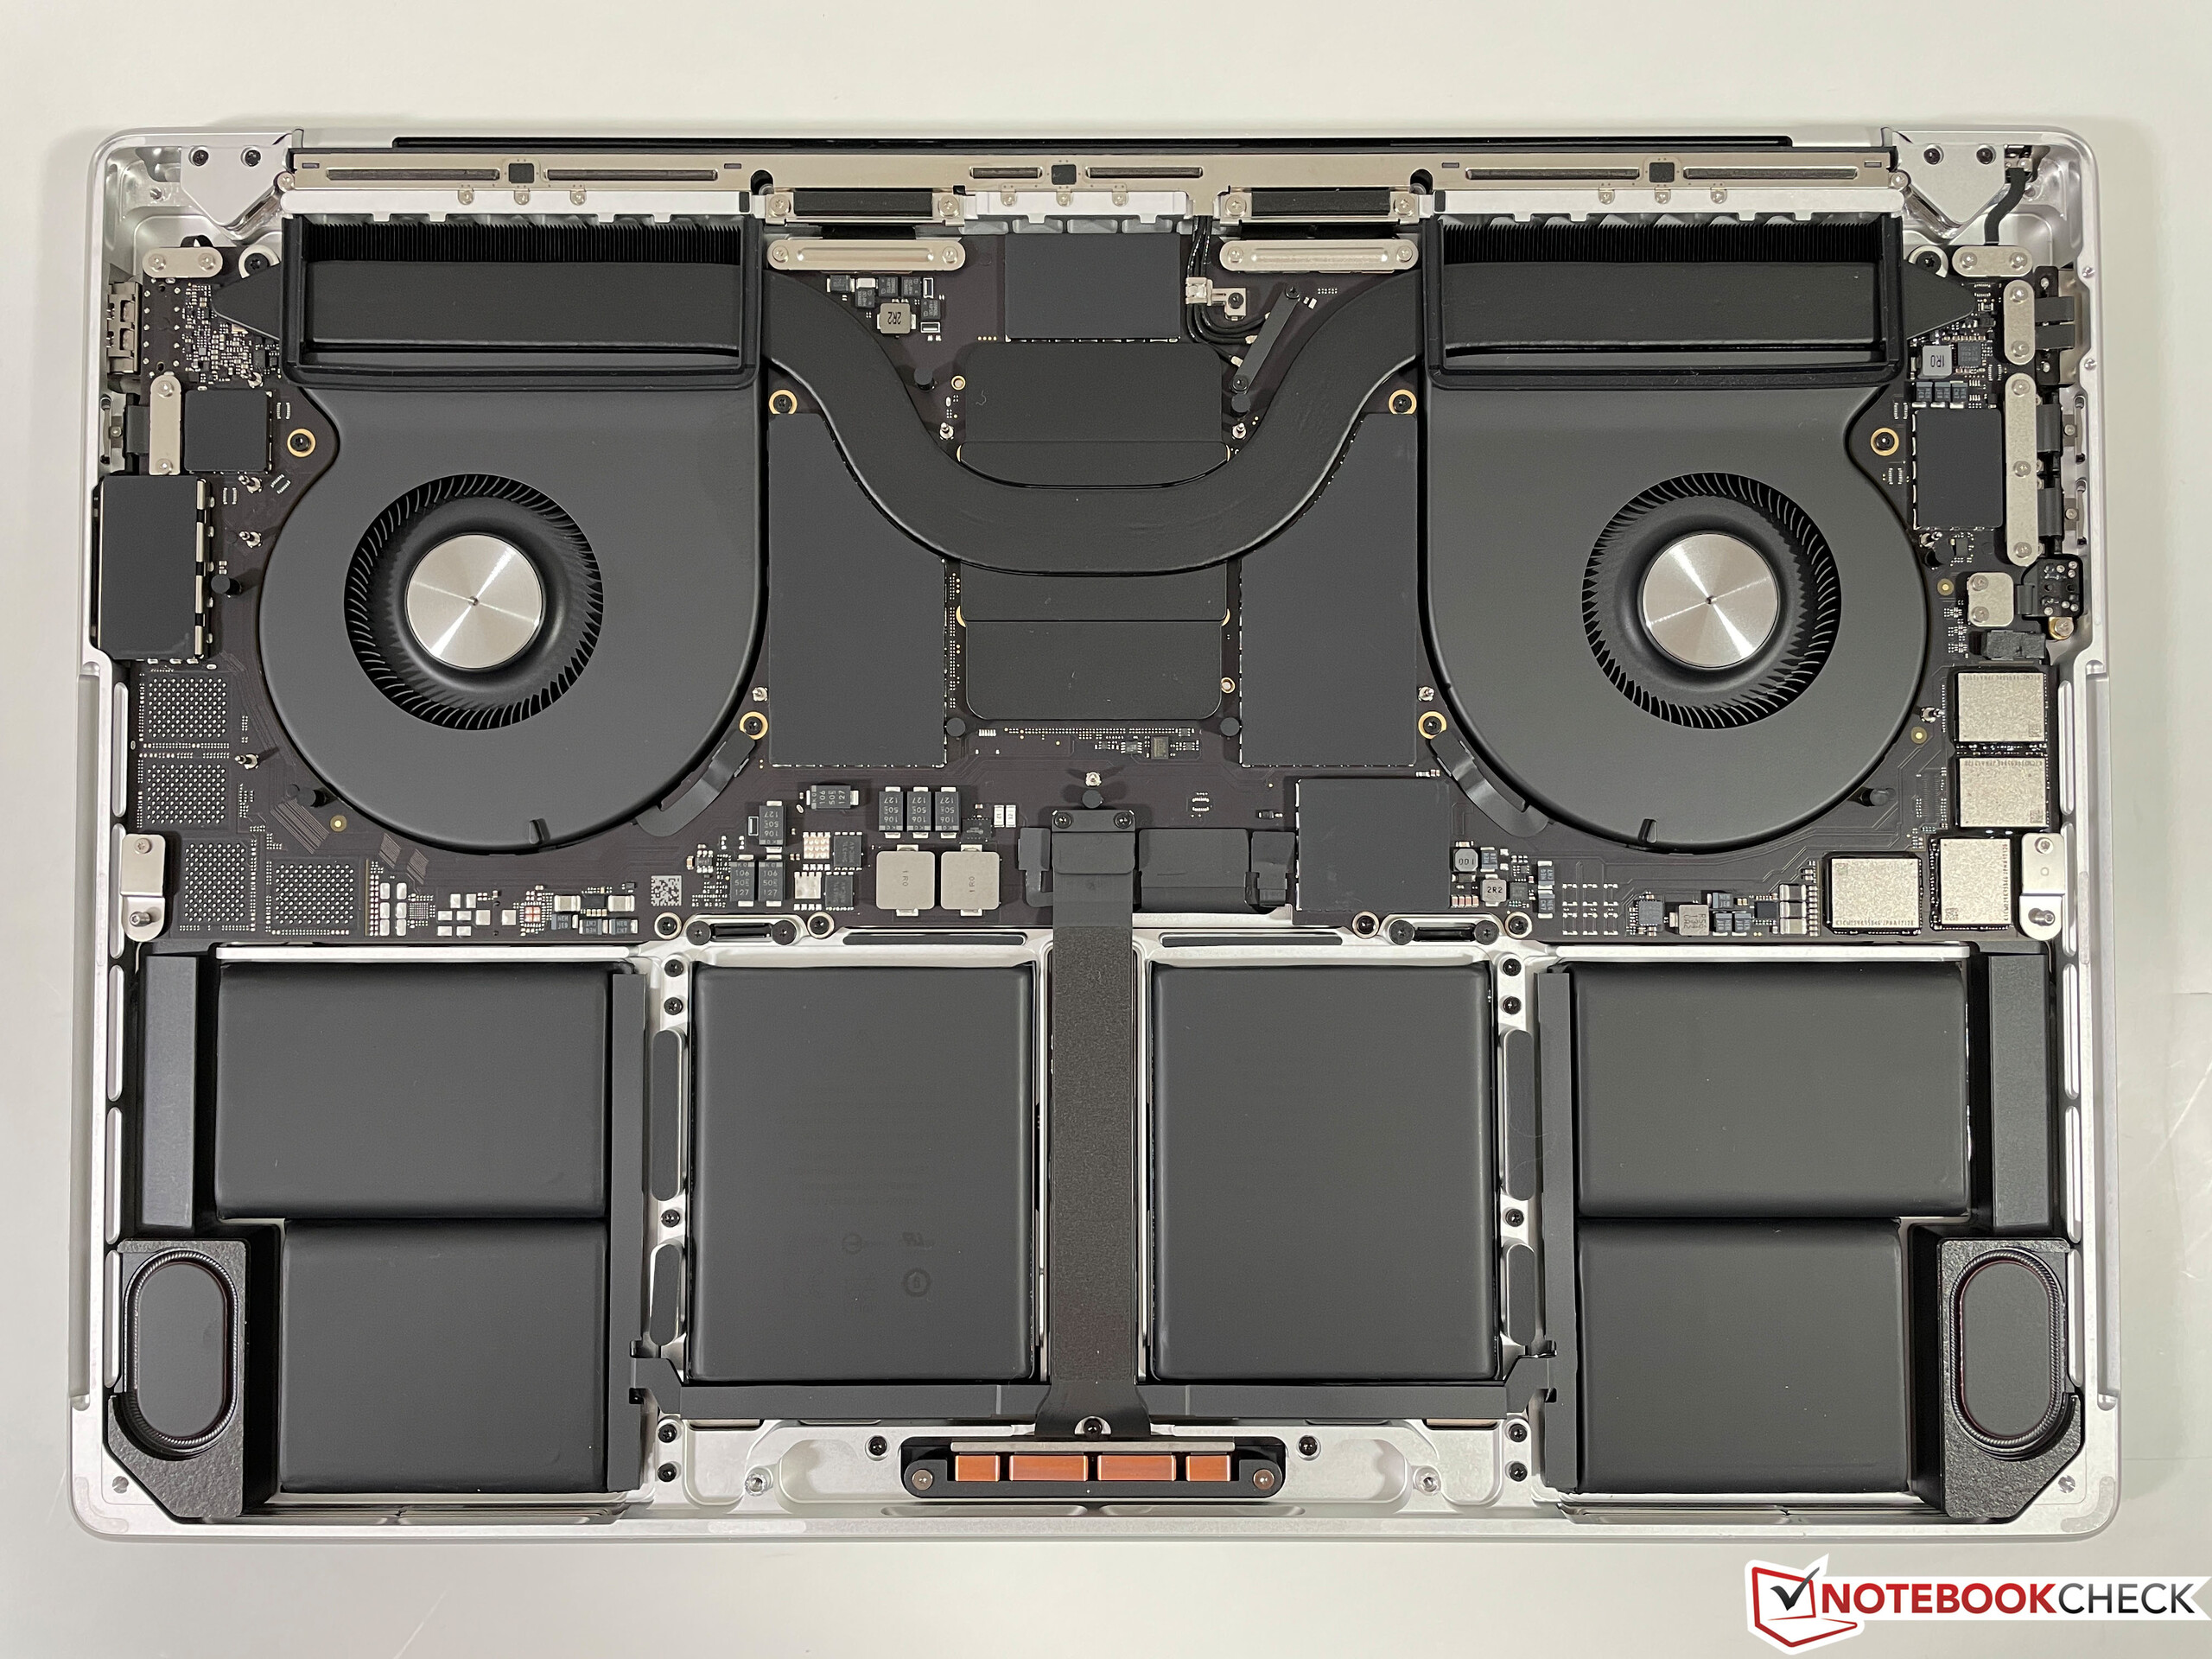
I den här artikeln kommer vi att fokusera på prestandaskillnaden mellan M1 Max jämfört med MBP 16 med M1 Pro samt effekterna på temperaturerna och fläktbeteendet. Enheten med M1 Max har dessutom ett extra prestandaläge som vi kommer att testa. Alla andra delar som chassit, anslutningsmöjligheterna, inmatningsenheterna, skärmen och högtalarna är identiska med den tidigare recensionsenheten, så ta en titt på vår omfattande recension för alla detaljer:
Potential competitors in comparison
Gradering | Datum | Modell | Vikt | Höjd | Storlek | Upplösning | Pris |
|---|---|---|---|---|---|---|---|
| 92.5 % v7 (old) | 11/2021 | Apple MacBook Pro 16 2021 M1 Max M1 Max, M1 Max 32-Core GPU | 2.2 kg | 16.8 mm | 16.20" | 3456x2234 | |
| 93.2 % v7 (old) | 11/2021 | Apple MacBook Pro 16 2021 M1 Pro M1 Pro, M1 Pro 16-Core GPU | 2.2 kg | 16.8 mm | 16.20" | 3456x2234 | |
| 89.8 % v7 (old) | 11/2021 | Lenovo ThinkPad P1 G4-20Y4S0KS00 i7-11850H, GeForce RTX 3070 Laptop GPU | 2 kg | 17.7 mm | 16.00" | 3840x2400 | |
| 87.8 % v7 (old) | 09/2021 | HP ZBook Studio 15 G8 i9-11950H, GeForce RTX 3070 Laptop GPU | 1.9 kg | 18 mm | 15.60" | 3840x2160 | |
| 88.9 % v7 (old) | 10/2021 | Razer Blade 15 Advanced (Mid 2021) i7-11800H, GeForce RTX 3080 Laptop GPU | 2 kg | 16.99 mm | 15.60" | 1920x1080 | |
| 87.9 % v7 (old) | 09/2021 | Dell XPS 17 9710 Core i7 RTX 3060 i7-11800H, GeForce RTX 3060 Laptop GPU | 2.5 kg | 19.5 mm | 17.00" | 3840x2400 |
Prestanda - Apple M1 Max med 32 GPU-kärnor
Översikt av inställningar
Den nya MacBook Pro 16 2021 med denM1 Max-processorhar ett valfritt prestandaläge. Det påverkar dock endast fläkthastigheten och därmed yttemperaturerna under belastning, men det finns ingen prestandaskillnad jämfört med den automatiska standardinställningen. Vi har utfört alla följande benchmarks och mätningar med standardläget automatiskt läge. Det valfria energisparläget begränsar M1 Max paketkraft till 30 W, vilket innebär att systemet förblir tyst, även under stress.
Processor
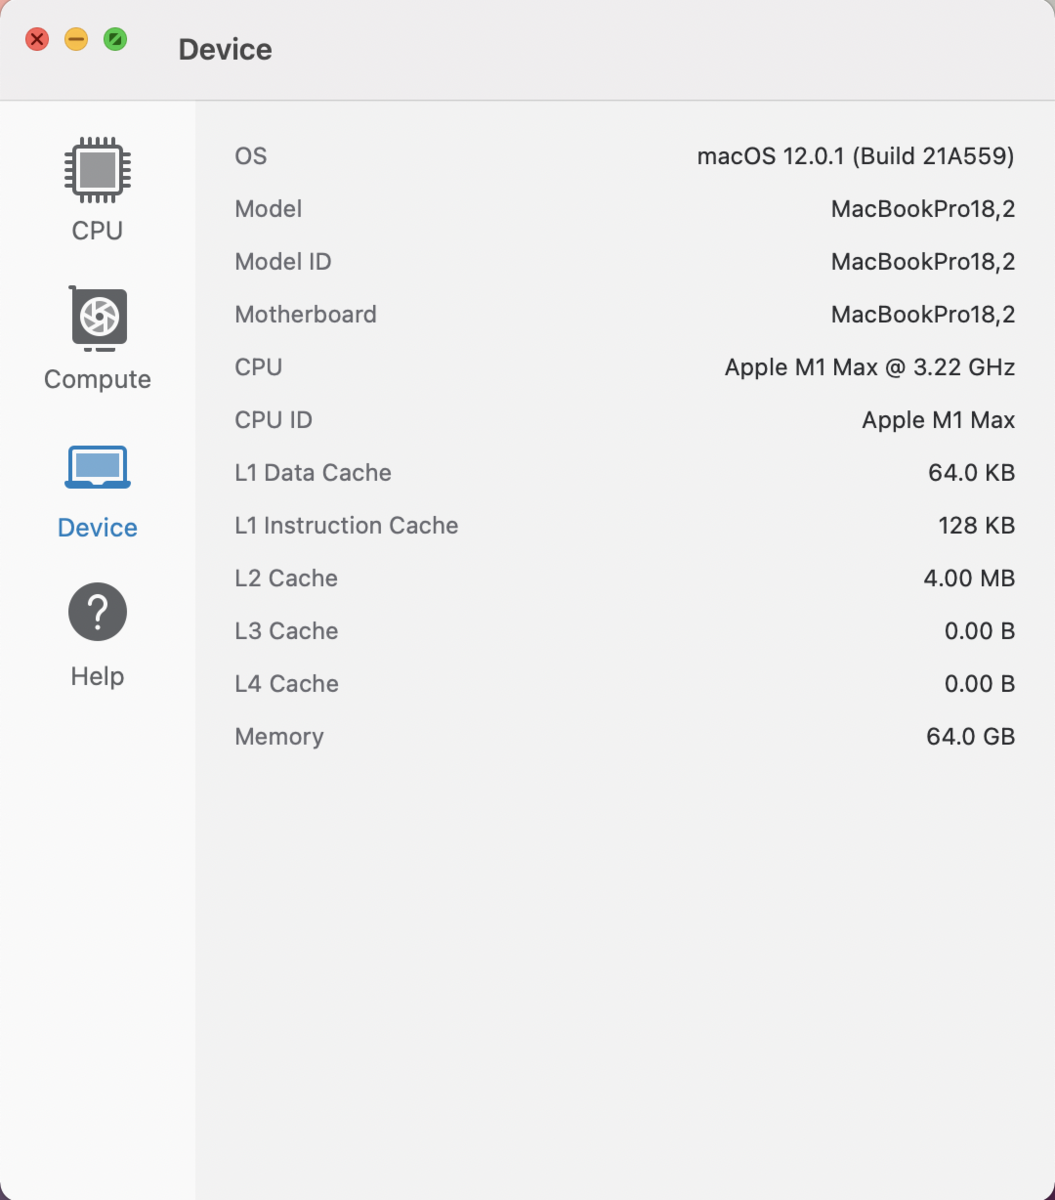
CPU-delen avApple M1 Maxmed 10 kärnor (1 effektivitetskluster med två kärnor + 2 prestandakluster med fyra kärnor vardera) är i princip identiska medM1 Proså vi kan hålla det kort här. Vi fastställer en maximal förbrukning på cirka 29 watt (~34 W paketenergi) i de flerkärniga benchmarks, både under uthålliga arbetsbelastningar och på batteri. Dessa förbrukningsvärden är något högre jämfört med M1 Pro, men detta beror på det större chipet med ytterligare GPU-kärnor, större cache och mer RAM-minne. Våra benchmarkresultat är som väntat nästan identiska med M1 Pro med mindre fluktuationer.
Både resultaten för enkärniga och flerkärniga är jämförbara med rivalerna, men alla är utrustade med 45 W CPU:er och de kräver ofta mycket mer ström i verkligheten. Dessutom minskar nästan alla Windows-konkurrenter CPU-prestanda på batteri.
Cinebench R15 Multi Loop
Cinebench R23: Multi Core | Single Core
Cinebench R20: CPU (Multi Core) | CPU (Single Core)
Cinebench R15: CPU Multi 64Bit | CPU Single 64Bit
Blender: v2.79 BMW27 CPU
Geekbench 5.5: Multi-Core | Single-Core
| CPU Performance rating | |
| Genomsnitt av klass Multimedia | |
| Lenovo ThinkPad P1 G4-20Y4S0KS00 | |
| HP ZBook Studio 15 G8 | |
| Apple MacBook Pro 16 2021 M1 Pro | |
| Genomsnitt Apple M1 Max | |
| Apple MacBook Pro 16 2021 M1 Max | |
| Razer Blade 15 Advanced (Mid 2021) -2! | |
| Dell XPS 17 9710 Core i7 RTX 3060 -2! | |
| Cinebench R23 / Multi Core | |
| Genomsnitt av klass Multimedia (4861 - 33362, n=74, senaste 2 åren) | |
| Genomsnitt Apple M1 Max (12385 - 12396, n=3) | |
| Apple MacBook Pro 16 2021 M1 Max | |
| Apple MacBook Pro 16 2021 M1 Pro | |
| Razer Blade 15 Advanced (Mid 2021) | |
| HP ZBook Studio 15 G8 | |
| Lenovo ThinkPad P1 G4-20Y4S0KS00 | |
| Dell XPS 17 9710 Core i7 RTX 3060 | |
| Cinebench R23 / Single Core | |
| Genomsnitt av klass Multimedia (1128 - 2459, n=66, senaste 2 åren) | |
| HP ZBook Studio 15 G8 | |
| Lenovo ThinkPad P1 G4-20Y4S0KS00 | |
| Apple MacBook Pro 16 2021 M1 Pro | |
| Genomsnitt Apple M1 Max (1530 - 1536, n=3) | |
| Apple MacBook Pro 16 2021 M1 Max | |
| Razer Blade 15 Advanced (Mid 2021) | |
| Dell XPS 17 9710 Core i7 RTX 3060 | |
| Cinebench R20 / CPU (Multi Core) | |
| Genomsnitt av klass Multimedia (1887 - 12912, n=57, senaste 2 åren) | |
| Razer Blade 15 Advanced (Mid 2021) | |
| Lenovo ThinkPad P1 G4-20Y4S0KS00 | |
| HP ZBook Studio 15 G8 | |
| Dell XPS 17 9710 Core i7 RTX 3060 | |
| Genomsnitt Apple M1 Max (2735 - 2753, n=3) | |
| Apple MacBook Pro 16 2021 M1 Max | |
| Apple MacBook Pro 16 2021 M1 Pro | |
| Cinebench R20 / CPU (Single Core) | |
| Genomsnitt av klass Multimedia (425 - 853, n=57, senaste 2 åren) | |
| HP ZBook Studio 15 G8 | |
| Lenovo ThinkPad P1 G4-20Y4S0KS00 | |
| Razer Blade 15 Advanced (Mid 2021) | |
| Dell XPS 17 9710 Core i7 RTX 3060 | |
| Apple MacBook Pro 16 2021 M1 Pro | |
| Genomsnitt Apple M1 Max (390 - 395, n=3) | |
| Apple MacBook Pro 16 2021 M1 Max | |
| Cinebench R15 / CPU Multi 64Bit | |
| Genomsnitt av klass Multimedia (856 - 5224, n=61, senaste 2 åren) | |
| Lenovo ThinkPad P1 G4-20Y4S0KS00 | |
| Razer Blade 15 Advanced (Mid 2021) | |
| Dell XPS 17 9710 Core i7 RTX 3060 | |
| HP ZBook Studio 15 G8 | |
| Apple MacBook Pro 16 2021 M1 Max | |
| Genomsnitt Apple M1 Max (1689 - 1693, n=3) | |
| Apple MacBook Pro 16 2021 M1 Pro | |
| Cinebench R15 / CPU Single 64Bit | |
| Genomsnitt av klass Multimedia (184.8 - 326, n=59, senaste 2 åren) | |
| HP ZBook Studio 15 G8 | |
| Lenovo ThinkPad P1 G4-20Y4S0KS00 | |
| Razer Blade 15 Advanced (Mid 2021) | |
| Dell XPS 17 9710 Core i7 RTX 3060 | |
| Apple MacBook Pro 16 2021 M1 Pro | |
| Genomsnitt Apple M1 Max (197 - 210, n=3) | |
| Apple MacBook Pro 16 2021 M1 Max | |
| Blender / v2.79 BMW27 CPU | |
| Dell XPS 17 9710 Core i7 RTX 3060 | |
| Razer Blade 15 Advanced (Mid 2021) | |
| Lenovo ThinkPad P1 G4-20Y4S0KS00 | |
| HP ZBook Studio 15 G8 | |
| Genomsnitt av klass Multimedia (100 - 557, n=58, senaste 2 åren) | |
| Apple MacBook Pro 16 2021 M1 Max | |
| Genomsnitt Apple M1 Max (187 - 190, n=3) | |
| Apple MacBook Pro 16 2021 M1 Pro | |
| Geekbench 5.5 / Multi-Core | |
| Genomsnitt av klass Multimedia (4652 - 20422, n=56, senaste 2 åren) | |
| Apple MacBook Pro 16 2021 M1 Max | |
| Genomsnitt Apple M1 Max (12563 - 12818, n=4) | |
| Apple MacBook Pro 16 2021 M1 Pro | |
| Lenovo ThinkPad P1 G4-20Y4S0KS00 | |
| HP ZBook Studio 15 G8 | |
| Geekbench 5.5 / Single-Core | |
| Genomsnitt av klass Multimedia (805 - 2974, n=56, senaste 2 åren) | |
| Genomsnitt Apple M1 Max (1764 - 1798, n=4) | |
| Apple MacBook Pro 16 2021 M1 Max | |
| Apple MacBook Pro 16 2021 M1 Pro | |
| HP ZBook Studio 15 G8 | |
| Lenovo ThinkPad P1 G4-20Y4S0KS00 | |
* ... mindre är bättre
Systemets prestanda
Det är inte förvånande att MacBook Pro 16 2021 i den övre delen av serien är en mycket kraftfull och mycket responsiv bärbar dator. Under vardagliga uppgifter eller när du bara belastar processorn kommer du inte att märka någon skillnad på den instegsenheten med M1 Pro dock. Detta stöds också av det systemövergripande riktmärket CrossMark, där de två enheterna är mycket lika varandra. BlackMagic RAW Speed Test visar på fördelen med det större cacheminnet, eftersom CPU-testet visar en liten fördel på 7 procent.
Vi utförde även de två PugetBench-testerna för Adobe Photoshop samt Adobe Premiere Pro. M1 Max presterar märkbart bättre än M1 Pro, men man bör vara lite försiktig med resultaten eftersom benchmarks endast är kompatibla med Intel-versionerna av programmen. Dessa emuleras via Rosetta 2, och det fungerar, men prestandan är märkbart sämre jämfört med de ursprungliga versionerna. Dessa kommer att vara mycket snabbare i praktiken, men vi kan inte fastställa den exakta prestandafördelen.
CrossMark: Overall | Productivity | Creativity | Responsiveness
Photoshop PugetBench: Overall Score | GPU Score | General Score | Filter Score
Premiere Pro PugetBench: Overall Score 0.9 | Export 0.9 | Live Playback 0.9 | GPU 0.9
Jetstream 2: 2.0 Total
WebXPRT 3: Overall
Speedometer 2.0: Result 2.0
| Blackmagic RAW Speed Test / 12:1 8K Metal | |
| Genomsnitt av klass Multimedia (78 - 430, n=7, senaste 2 åren) | |
| Apple MacBook Pro 16 2021 M1 Max | |
| Genomsnitt Apple M1 Max, Apple M1 Max 32-Core GPU (200 - 202, n=2) | |
| Apple MacBook Pro 16 2021 M1 Pro | |
| Apple MacBook Pro 14 2021 M1 Pro Entry | |
| Apple MacBook Pro 16 2019 i9 5500M | |
| Blackmagic RAW Speed Test / 12:1 8K CPU | |
| Genomsnitt av klass Multimedia (44 - 102, n=7, senaste 2 åren) | |
| Apple MacBook Pro 16 2019 i9 5500M | |
| Genomsnitt Apple M1 Max, Apple M1 Max 32-Core GPU (29 - 30, n=2) | |
| Apple MacBook Pro 16 2021 M1 Max | |
| Apple MacBook Pro 16 2021 M1 Pro | |
| Apple MacBook Pro 14 2021 M1 Pro Entry | |
| CrossMark / Overall | |
| Genomsnitt av klass Multimedia (866 - 2728, n=60, senaste 2 åren) | |
| Lenovo ThinkPad P1 G4-20Y4S0KS00 | |
| Genomsnitt Apple M1 Max, Apple M1 Max 32-Core GPU (1586 - 1621, n=2) | |
| Apple MacBook Pro 16 2021 M1 Max | |
| Apple MacBook Pro 16 2021 M1 Pro | |
| Apple MacBook Pro 14 2021 M1 Pro Entry | |
| Apple MacBook Air 2020 M1 Entry | |
| Apple MacBook Pro 16 2019 i9 5500M | |
| CrossMark / Productivity | |
| Genomsnitt av klass Multimedia (931 - 2489, n=60, senaste 2 åren) | |
| Lenovo ThinkPad P1 G4-20Y4S0KS00 | |
| Genomsnitt Apple M1 Max, Apple M1 Max 32-Core GPU (1361 - 1385, n=2) | |
| Apple MacBook Pro 16 2021 M1 Max | |
| Apple MacBook Pro 16 2021 M1 Pro | |
| Apple MacBook Pro 14 2021 M1 Pro Entry | |
| Apple MacBook Air 2020 M1 Entry | |
| Apple MacBook Pro 16 2019 i9 5500M | |
| CrossMark / Creativity | |
| Genomsnitt av klass Multimedia (907 - 3465, n=60, senaste 2 åren) | |
| Genomsnitt Apple M1 Max, Apple M1 Max 32-Core GPU (2102 - 2153, n=2) | |
| Apple MacBook Pro 16 2021 M1 Max | |
| Apple MacBook Pro 16 2021 M1 Pro | |
| Apple MacBook Pro 14 2021 M1 Pro Entry | |
| Lenovo ThinkPad P1 G4-20Y4S0KS00 | |
| Apple MacBook Air 2020 M1 Entry | |
| Apple MacBook Pro 16 2019 i9 5500M | |
| CrossMark / Responsiveness | |
| Genomsnitt av klass Multimedia (605 - 2024, n=60, senaste 2 åren) | |
| Lenovo ThinkPad P1 G4-20Y4S0KS00 | |
| Genomsnitt Apple M1 Max, Apple M1 Max 32-Core GPU (1080 - 1107, n=2) | |
| Apple MacBook Pro 16 2021 M1 Max | |
| Apple MacBook Pro 16 2021 M1 Pro | |
| Apple MacBook Pro 14 2021 M1 Pro Entry | |
| Apple MacBook Air 2020 M1 Entry | |
| Apple MacBook Pro 16 2019 i9 5500M | |
| Photoshop PugetBench / Overall Score | |
| Lenovo ThinkPad P1 G4-20Y4S0KS00 | |
| Genomsnitt Apple M1 Max, Apple M1 Max 32-Core GPU (809 - 989, n=2) | |
| Apple MacBook Pro 16 2021 M1 Max | |
| Apple MacBook Pro 16 2021 M1 Pro | |
| Apple MacBook Pro 16 2019 i9 5500M | |
| Apple MacBook Pro 14 2021 M1 Pro Entry | |
| Apple MacBook Air 2020 M1 Entry | |
| Photoshop PugetBench / GPU Score | |
| Lenovo ThinkPad P1 G4-20Y4S0KS00 | |
| Genomsnitt Apple M1 Max, Apple M1 Max 32-Core GPU (98.5 - 108.1, n=2) | |
| Apple MacBook Pro 16 2021 M1 Max | |
| Apple MacBook Pro 16 2021 M1 Pro | |
| Apple MacBook Pro 14 2021 M1 Pro Entry | |
| Apple MacBook Pro 16 2019 i9 5500M | |
| Apple MacBook Air 2020 M1 Entry | |
| Photoshop PugetBench / General Score | |
| Genomsnitt Apple M1 Max, Apple M1 Max 32-Core GPU (86.5 - 97.2, n=2) | |
| Lenovo ThinkPad P1 G4-20Y4S0KS00 | |
| Apple MacBook Pro 16 2021 M1 Max | |
| Apple MacBook Pro 16 2021 M1 Pro | |
| Apple MacBook Pro 14 2021 M1 Pro Entry | |
| Apple MacBook Pro 16 2019 i9 5500M | |
| Apple MacBook Air 2020 M1 Entry | |
| Photoshop PugetBench / Filter Score | |
| Lenovo ThinkPad P1 G4-20Y4S0KS00 | |
| Genomsnitt Apple M1 Max, Apple M1 Max 32-Core GPU (75.2 - 100.6, n=2) | |
| Apple MacBook Pro 16 2021 M1 Max | |
| Apple MacBook Pro 16 2019 i9 5500M | |
| Apple MacBook Pro 16 2021 M1 Pro | |
| Apple MacBook Pro 14 2021 M1 Pro Entry | |
| Apple MacBook Air 2020 M1 Entry | |
| Premiere Pro PugetBench / Overall Score 0.9 | |
| Apple MacBook Pro 16 2021 M1 Max | |
| Genomsnitt Apple M1 Max, Apple M1 Max 32-Core GPU (862 - 1080, n=2) | |
| Apple MacBook Pro 14 2021 M1 Pro Entry | |
| Lenovo ThinkPad P1 G4-20Y4S0KS00 | |
| Apple MacBook Pro 16 2021 M1 Pro | |
| Apple MacBook Air 2020 M1 Entry | |
| Premiere Pro PugetBench / Export 0.9 | |
| Genomsnitt Apple M1 Max, Apple M1 Max 32-Core GPU (53.2 - 90.9, n=2) | |
| Lenovo ThinkPad P1 G4-20Y4S0KS00 | |
| Apple MacBook Pro 16 2021 M1 Max | |
| Apple MacBook Pro 16 2021 M1 Pro | |
| Apple MacBook Pro 14 2021 M1 Pro Entry | |
| Apple MacBook Air 2020 M1 Entry | |
| Premiere Pro PugetBench / Live Playback 0.9 | |
| Apple MacBook Pro 16 2021 M1 Max | |
| Apple MacBook Pro 14 2021 M1 Pro Entry | |
| Genomsnitt Apple M1 Max, Apple M1 Max 32-Core GPU (106 - 216, n=2) | |
| Apple MacBook Pro 16 2021 M1 Pro | |
| Lenovo ThinkPad P1 G4-20Y4S0KS00 | |
| Apple MacBook Air 2020 M1 Entry | |
| Premiere Pro PugetBench / GPU 0.9 | |
| Lenovo ThinkPad P1 G4-20Y4S0KS00 | |
| Genomsnitt Apple M1 Max, Apple M1 Max 32-Core GPU (54.8 - 55.8, n=2) | |
| Apple MacBook Pro 16 2021 M1 Max | |
| Apple MacBook Pro 16 2021 M1 Pro | |
| Apple MacBook Pro 14 2021 M1 Pro Entry | |
| Apple MacBook Air 2020 M1 Entry | |
| Jetstream 2 / 2.0 Total | |
| Genomsnitt av klass Multimedia (287 - 481, n=31, senaste 2 åren) | |
| Genomsnitt Apple M1 Max, Apple M1 Max 32-Core GPU (215 - 215, n=2) | |
| Apple MacBook Pro 16 2021 M1 Max | |
| Apple MacBook Pro 16 2021 M1 Pro | |
| Apple MacBook Pro 14 2021 M1 Pro Entry | |
| HP ZBook Studio 15 G8 | |
| Apple MacBook Air 2020 M1 Entry | |
| Apple MacBook Air 2020 M1 Entry | |
| Dell XPS 17 9710 Core i7 RTX 3060 | |
| Razer Blade 15 Advanced (Mid 2021) | |
| Apple MacBook Pro 13 Late 2020 M1 Entry (8 / 256 GB) | |
| WebXPRT 3 / Overall | |
| Genomsnitt Apple M1 Max, Apple M1 Max 32-Core GPU (350 - 366, n=2) | |
| Apple MacBook Pro 16 2021 M1 Max | |
| Apple MacBook Pro 14 2021 M1 Pro Entry | |
| Apple MacBook Pro 16 2021 M1 Pro | |
| Genomsnitt av klass Multimedia (136.4 - 596, n=63, senaste 2 åren) | |
| Apple MacBook Air 2020 M1 Entry | |
| Apple MacBook Air 2020 M1 Entry | |
| Apple MacBook Pro 13 Late 2020 M1 Entry (8 / 256 GB) | |
| Lenovo ThinkPad P1 G4-20Y4S0KS00 | |
| HP ZBook Studio 15 G8 | |
| Dell XPS 17 9710 Core i7 RTX 3060 | |
| Razer Blade 15 Advanced (Mid 2021) | |
| Apple MacBook Pro 16 2019 i9 5500M | |
| Speedometer 2.0 / Result 2.0 | |
| Genomsnitt av klass Multimedia (337 - 946, n=30, senaste 2 åren) | |
| Genomsnitt Apple M1 Max, Apple M1 Max 32-Core GPU (272 - 349, n=2) | |
| Apple MacBook Pro 16 2021 M1 Pro | |
| Apple MacBook Pro 16 2021 M1 Max | |
| Apple MacBook Air 2020 M1 Entry | |
| Apple MacBook Air 2020 M1 Entry | |
| Apple MacBook Pro 14 2021 M1 Pro Entry | |
| Apple MacBook Pro 13 Late 2020 M1 Entry (8 / 256 GB) | |
Lagringsenheter
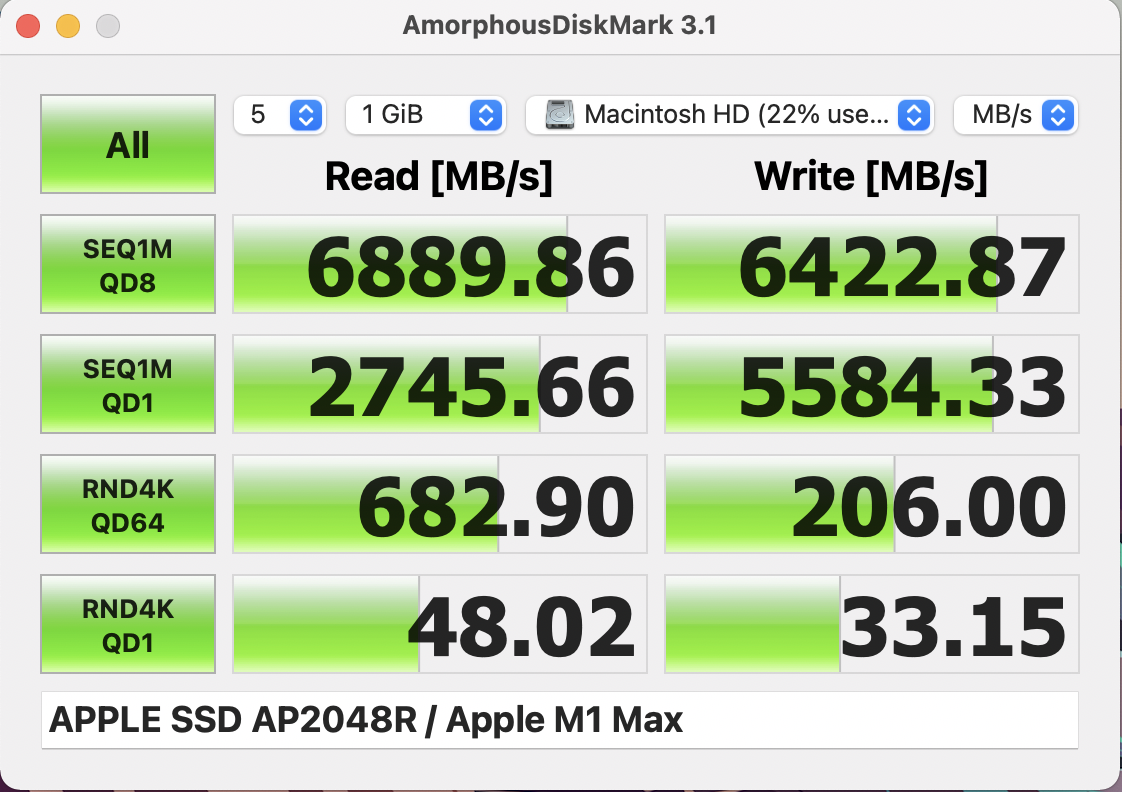
Vår recensionsenhet är utrustad med en snabb PCIe 4.0 SSD med en lagringskapacitet på 2 TB. Efter den första installationen kan du använda 1,97 TB för dina egna filer. Enheten klarar utmärkta överföringshastigheter på nästan 7 GB/s i riktmärkena. Du kan utrusta MacBook Pro med upp till 8 TB SSD-lagring, men Apple tar ut en rejäl premie för detta (+2070 euro jämfört med 2 TB SSD). Fler SSD-jämförelser finns i vår Teknikavsnittet.
GPU-prestanda - 32 GPU-kärnor
Den avancerade versionen av MacBook Pro 16 2021 med den snabbaste M1 Max är utrustad med fyra GPU-kluster med åtta kärnor vardera. Vi kan fastställa en maximal förbrukning på 44 W för GPU:n under riktmärkena, och resultaten är mycket bättre jämfört med den M1 Pro med 16 GPU-kärnor med en fördel mellan 60 upp till 95 procent. Benchmark Wild Life Extreme Unlimited, som körs nativt på MacBook, visar jämförbara prestandasiffror medGeForce RTX 3070, trots att M1 Max inte ens kräver hälften av kraften. Grafikprestandan är också helt stabil på batteri
Du kan spela spel på MacBook Pro 16, men antalet tillgängliga spel är den stora begränsningen. Det finns för närvarande bara några få inhemska titlar och några kan emuleras. Våra benchmarks för spel visar återigen en fördel på cirka 70-80 procent jämfört medM1 Prooch prestandan i Shadow of the Tomb Raider är ungefär jämförbar med snabba versioner avGeForce RTX 3060. Det finns dock återigen problemet med att det är en emulerad titel.
Appar som CrossWare ger stöd för Windows-spel som Witcher 3 eller GTA V och prestandan är faktiskt inte dålig. Som ett exempel har vi fångat benchmarksekvensen för GTA V i videon nedan. Du kan tydligt se att prestandan är mycket bra med ultrainställningar (1920 x 1200 pixlar), men det finns märkbara stutters. Du kan fortfarande spela spelet så här, men MacBook Pro 16, även med den kraftfulla M1 Max, är helt enkelt inte en bärbar dator för spel.
| låg | med. | hög | ultra | |
|---|---|---|---|---|
| Shadow of the Tomb Raider (2018) | 140 | 104 | 97 | 87 |
| Total War: Three Kingdoms (2019) | 201 | 127 | 80 | 59 |
| Borderlands 3 (2019) | 65.5 | 55.3 | 47.6 | 40.7 |
Systembrus
MacBook Pro 16 med M1 Max-processor är tyst när den går på tomgång och vid lätt belastning, eftersom fläktarna är avstängda och det inte heller finns några andra elektroniska ljud (t.ex. spolningsljud). Ren CPU-belastning resulterar i den lägsta fläkthastigheten (1600 varv per minut), som knappt hörs alls. Den blir bara högre när du börjar belasta de 32 GPU-kärnorna.
Fläktarna på MacBook Pro 16 M1 Max kan nå en högre maxhastighet (5348 rpm på vänster sida och 5776 rpm på höger sida) jämfört med MacBook Pro 16 M1 Max M1 Pro-enheten (4280 respektive 4750 varv per minut). Dessa maxhastigheter är dock ganska teoretiska, eftersom det bara fanns ett scenario där vi kunde nå maxhastigheten. Vi var tvungna att starta stresstestet (CB R23 och 3DMark Wildlife Extreme) i det normala läget och växlade till prestandaläget efter ett par minuter. MBP 16 ökar då fläkthastigheten till det maximala värdet under några minuter, vilket resulterar i högljudda 55,6 dB(A). Efter ett tag kommer fläktarna att plana ut på 4400 varv per minut (49,5 dB(A)). Om du startar stresstestet med prestandaläget kommer fläkthastigheten att fluktuera mellan 4000 (47,3 dB(A)) och 4900 rpm (52 dB(A)) med ett genomsnitt på 4400 rpm (49,5 dB(A)). Som vi sa tidigare finns det ingen prestandafördel, så det är inte meningsfullt att använda prestandaläget.
Om du bara lämnar energiinställningarna i standardläget automatiskt läge kommer stresstestet endast att resultera i 3600 varv per minut, vilket ger 42,9 dB(A). Under vårt speltest av Witcher 3 kommer fläkthastigheten att fluktuera lite med ett genomsnitt på 3200 varv per minut (39,5 dB(A)). Vi kan också observera 3600 rpm i PugetBench-benchmark (Premiere Pro), men tänk på att detta är den emulerade versionen av appen. Det övergripande fläktljudet är ett mycket bekvämt muller och du kan fortfarande arbeta mycket bekvämt utan hörlurar. Alla dessa resultat är identiska för såväl nät- som batteridrift.
Det valfria energisparläget begränsar M1 Max paketkraft till 30 W, vilket resulterar i en helt tyst drift, även under stresstestet.
Ljudnivå
| Låg belastning |
| 24.2 / 24.2 / 24.2 dB(A) |
| Hög belastning |
| 42.9 / 42.9 dB(A) |
 | ||
30 dB tyst 40 dB(A) hörbar 50 dB(A) högt ljud |
||
min: | ||
| Apple MacBook Pro 16 2021 M1 Max M1 Max 32-Core GPU, M1 Max, Apple SSD AP2048R | Apple MacBook Pro 16 2021 M1 Pro M1 Pro 16-Core GPU, M1 Pro, Apple SSD AP1024R | Lenovo ThinkPad P1 G4-20Y4S0KS00 GeForce RTX 3070 Laptop GPU, i7-11850H, Samsung PM9A1 MZVL21T0HCLR | HP ZBook Studio 15 G8 GeForce RTX 3070 Laptop GPU, i9-11950H, Samsung PM981a MZVLB2T0HALB | Razer Blade 15 Advanced (Mid 2021) GeForce RTX 3080 Laptop GPU, i7-11800H, SSSTC CA6-8D1024 | Dell XPS 17 9710 Core i7 RTX 3060 GeForce RTX 3060 Laptop GPU, i7-11800H, Micron 2300 1TB MTFDHBA1T0TDV | |
|---|---|---|---|---|---|---|
| Noise | 7% | -4% | -7% | -7% | -9% | |
| av / miljö * (dB) | 24.2 | 24.7 -2% | 23.8 2% | 23.5 3% | 25.1 -4% | 25.5 -5% |
| Idle Minimum * (dB) | 24.2 | 24.7 -2% | 23.8 2% | 25.3 -5% | 25.3 -5% | 25.2 -4% |
| Idle Average * (dB) | 24.2 | 24.7 -2% | 23.8 2% | 25.3 -5% | 25.3 -5% | 25.2 -4% |
| Idle Maximum * (dB) | 24.2 | 24.7 -2% | 28.3 -17% | 25.3 -5% | 25.3 -5% | 25.2 -4% |
| Load Average * (dB) | 42.9 | 26.1 39% | 38.6 10% | 41.2 4% | 42 2% | 45.9 -7% |
| Witcher 3 ultra * (dB) | 39.5 | 47.4 -20% | 49.4 -25% | 45.6 -15% | 49 -24% | |
| Load Maximum * (dB) | 42.9 | 37.4 13% | 47.4 -10% | 49.4 -15% | 51.6 -20% | 50.4 -17% |
* ... mindre är bättre
Temperatur
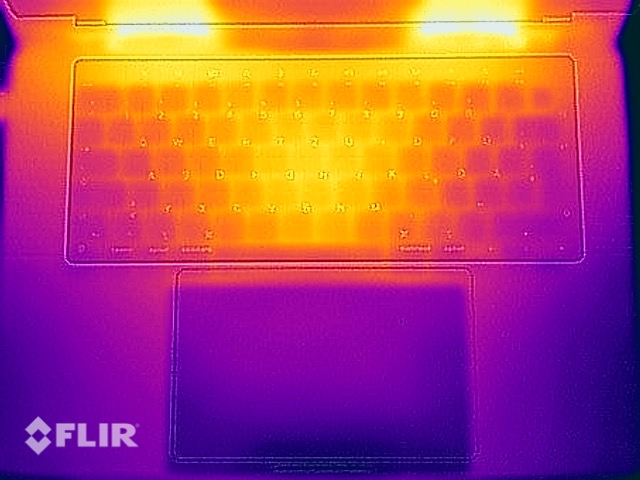
Den nya MacBook Pro 16 har inga temperaturproblem, eftersom du knappt märker några varmare ytor under vardagliga uppgifter och temperaturerna är inte alls kritiska, inte ens när du verkligen belastar enheten
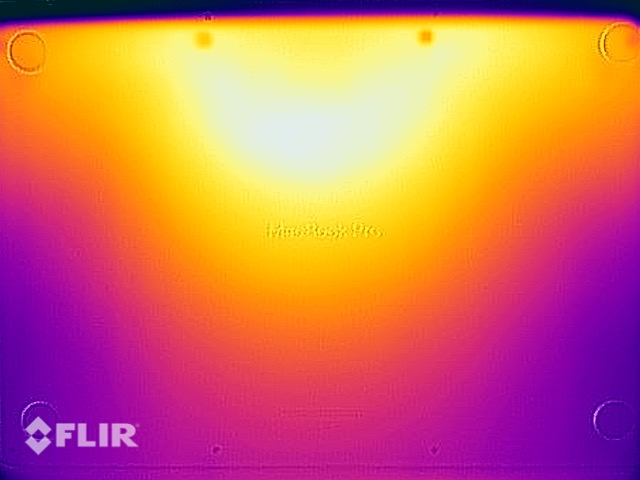
I motsats till vårt standardförfarande (Cinebench R15 + FurMark) använder vi de två inhemska apparna Cinebench R23 och 3DMark Wildlife Extreme (stresstest för varje app) för stresstestet på MacBook Pro. Vi lyckades få de högsta förbrukningssiffrorna med den här kombinationen. I motsats till kraftfulla bärbara Windows-datorer är prestandan stenhård under det en timme långa testet och yttemperaturerna är fortfarande mycket låga. Vi kan bara mäta cirka 42 °C på toppen och botten av basenheten. Chassit blir en aning varmare under Witcher 3 -testet på grund av de lägre fläkthastigheterna, men skillnaden är knappast värd att märka
Vi utförde även stresstestet med det valfria prestandaläget och tittade på temperaturerna. Som tidigare nämnts påverkar det inte prestandan, men yttemperaturerna är ännu lägre med upp till 39,9 °C på grund av de högre fläkthastigheterna. Allt som allt är dessa resultat utmärkta med tanke på prestandanivåerna och fläktljudet. Till och med PSU-temperaturerna är helt okej med upp till 43 °C
Vi kan inte märka någon skillnad när det gäller fläkthastighet eller yttemperaturer när vi använder en extern skärm.
(±) Den maximala temperaturen på ovansidan är 42.3 °C / 108 F, jämfört med genomsnittet av 36.8 °C / 98 F , allt från 21 till 71 °C för klassen Multimedia.
(±) Botten värms upp till maximalt 41.7 °C / 107 F, jämfört med genomsnittet av 39.1 °C / 102 F
(+) Vid tomgångsbruk är medeltemperaturen för ovansidan 23.5 °C / 74 F, jämfört med enhetsgenomsnittet på 31.3 °C / ### class_avg_f### F.
(±) När du spelar The Witcher 3 är medeltemperaturen för ovansidan 36.9 °C / 98 F, jämfört med enhetsgenomsnittet på 31.3 °C / ## #class_avg_f### F.
(+) Handledsstöden och pekplattan är kallare än hudtemperaturen med maximalt 30.2 °C / 86.4 F och är därför svala att ta på.
(±) Medeltemperaturen för handledsstödsområdet på liknande enheter var 28.7 °C / 83.7 F (-1.5 °C / -2.7 F).
Stresstest av yttemperaturer med det valfria prestandaläget:
(+) Den maximala temperaturen på ovansidan är 39.9 °C / 104 F, jämfört med genomsnittet av 36.8 °C / 98 F , allt från 21 till 71 °C för klassen Multimedia.
(+) Botten värms upp till maximalt 38.7 °C / 102 F, jämfört med genomsnittet av 39.1 °C / 102 F
(+) Handledsstöden och pekplattan är kallare än hudtemperaturen med maximalt 25.9 °C / 78.6 F och är därför svala att ta på.
(+) Medeltemperaturen för handledsstödsområdet på liknande enheter var 28.7 °C / 83.7 F (+2.8 °C / 5.1 F).
| Apple MacBook Pro 16 2021 M1 Max Apple M1 Max, Apple M1 Max 32-Core GPU | Apple MacBook Pro 16 2021 M1 Pro Apple M1 Pro, Apple M1 Pro 16-Core GPU | Lenovo ThinkPad P1 G4-20Y4S0KS00 Intel Core i7-11850H, NVIDIA GeForce RTX 3070 Laptop GPU | HP ZBook Studio 15 G8 Intel Core i9-11950H, NVIDIA GeForce RTX 3070 Laptop GPU | Razer Blade 15 Advanced (Mid 2021) Intel Core i7-11800H, NVIDIA GeForce RTX 3080 Laptop GPU | Dell XPS 17 9710 Core i7 RTX 3060 Intel Core i7-11800H, NVIDIA GeForce RTX 3060 Laptop GPU | |
|---|---|---|---|---|---|---|
| Heat | 2% | -23% | -21% | -38% | -28% | |
| Maximum Upper Side * (°C) | 42.3 | 41 3% | 51 -21% | 49 -16% | 51 -21% | 50.2 -19% |
| Maximum Bottom * (°C) | 41.7 | 39 6% | 53.5 -28% | 54.2 -30% | 52 -25% | 38.4 8% |
| Idle Upper Side * (°C) | 23.9 | 24 -0% | 28.8 -21% | 26.2 -10% | 35.2 -47% | 37.6 -57% |
| Idle Bottom * (°C) | 23.9 | 24 -0% | 29.3 -23% | 30.2 -26% | 37.8 -58% | 34.2 -43% |
* ... mindre är bättre
Energihantering - M1 Max förbrukar mer ström
Effektförbrukning
MacBook Pro 16 med M1 Max har en något högre tomgångsförbrukning jämfört med enheten med M1 Max.M1 Provilket är ett resultat av de extra GPU-kärnorna, den större cacheminnet och det större RAM-minnet. Vi lyckades också mäta toppförbrukning på upp till 30 W när panelen nådde full HDR-hellhet under uppspelning av HDR-videor.
Vi kan se en maximal paketeffekt på nästan 90 W (närmare bestämt 86 W), men det finns fluktuationer på grund av förändringarna i benchmarksekvenserna. Du kan se detta beteende mycket väl i följande diagram, där förbrukningen under vårt stresstest fluktuerade mellan 90 och upp till 135 watt. Den kommer upprepade gånger att träffa de högre siffrorna med en genomsnittlig förbrukning på 115 Watt. Spel (testat med Witcher 3 via Steam/CrossWare) resulterar i en stadig förbrukning på mer än 100 watt (~61 W paketeffekt). Strömadaptern på 140 W räcker för att täcka topparna under full belastning.
| Av/Standby | |
| Låg belastning | |
| Hög belastning |
|
Förklaring:
min: | |
| Apple MacBook Pro 16 2021 M1 Max M1 Max, M1 Max 32-Core GPU, 99.6 Wh | Apple MacBook Pro 16 2021 M1 Pro M1 Pro, M1 Pro 16-Core GPU, 99.6 Wh | Lenovo ThinkPad P1 G4-20Y4S0KS00 i7-11850H, GeForce RTX 3070 Laptop GPU, 90 Wh | HP ZBook Studio 15 G8 i9-11950H, GeForce RTX 3070 Laptop GPU, 83 Wh | Razer Blade 15 Advanced (Mid 2021) i7-11800H, GeForce RTX 3080 Laptop GPU, 80 Wh | Dell XPS 17 9710 Core i7 RTX 3060 i7-11800H, GeForce RTX 3060 Laptop GPU, 97 Wh | Genomsnitt av klass Multimedia | |
|---|---|---|---|---|---|---|---|
| Power Consumption | 20% | -28% | -48% | -96% | -13% | 21% | |
| Idle Minimum * (Watt) | 5.4 | 5 7% | 8.1 -50% | 11 -104% | 19.5 -261% | 7.5 -39% | 5.66 ? -5% |
| Idle Average * (Watt) | 16.4 | 15.1 8% | 20.2 -23% | 18.8 -15% | 23.3 -42% | 15.7 4% | 10.2 ? 38% |
| Idle Maximum * (Watt) | 16.7 | 15.5 7% | 21.9 -31% | 31.7 -90% | 40.1 -140% | 23.1 -38% | 12.5 ? 25% |
| Load Average * (Watt) | 94 | 54 43% | 88.2 6% | 105.2 -12% | 98.9 -5% | 87.2 7% | 65.2 ? 31% |
| Witcher 3 ultra * (Watt) | 104 | 149 -43% | 148 -42% | 174 -67% | 116 -12% | ||
| Load Maximum * (Watt) | 135 | 90 33% | 170.6 -26% | 171.8 -27% | 214 -59% | 131.6 3% | 113.5 ? 16% |
* ... mindre är bättre
Power Consumption Witcher 3 / Stress test
Batteriets drifttid
De något högre förbrukningsvärdena påverkar också batteritiderna, och resultaten för MBP 16 M1 Max är lite kortare än för MBP 16 M1 Max M1 Pro-enheten. Wi-Fi-testet vid 150 nits (något mer än 50 % av den maximala SDR-ljusstyrkan) bestämmer nästan 15 timmar och därmed 2 timmar mindre än på M1 Pro-enheten. Detta resultat sjunker till lite mer än 7 timmar när vi använder den maximala SDR-styrkan på 500 nits. Det finns ingen skillnad mellan Safari i ett fönster eller i fullskärmsläge.
Vår standard h.264-testvideo vid 150 nits pågår i 17 timmar och därmed bara 30 minuter mindre jämfört med MBP 16 med M1 Pro. Vi kontrollerade även batteritiden under videouppspelning av en 4K HDR-video på YouTube vid maximal ljusstyrka, vilket resulterade i en drifttid på 4:37 timmar. Detta är för närvarande inte längre möjligt, eftersom det fanns rapporter om problem med HDR-videor och YouTube för närvarande inte erbjuder HDR-videor på den nya MacBook Pro-modellen (även 14 tum).
Prestandan är inte begränsad på batteri, även när du belastar både CPU samt GPU. Detta är förvånande med tanke på en genomsnittlig förbrukning på 115 W under stresstestet och som ett resultat av detta räcker inte batteriet på 99,6 Wh särskilt länge i detta scenario. Resultatet på 63 minuter är bara möjligt eftersom prestandan reduceras massivt till 13W paketkraft när batterinivåerna når 5 % återstående kapacitet, vilket är fallet efter bara 50 minuter.
| Apple MacBook Pro 16 2021 M1 Max M1 Max, M1 Max 32-Core GPU, 99.6 Wh | Apple MacBook Pro 16 2021 M1 Pro M1 Pro, M1 Pro 16-Core GPU, 99.6 Wh | Lenovo ThinkPad P1 G4-20Y4S0KS00 i7-11850H, GeForce RTX 3070 Laptop GPU, 90 Wh | HP ZBook Studio 15 G8 i9-11950H, GeForce RTX 3070 Laptop GPU, 83 Wh | Razer Blade 15 Advanced (Mid 2021) i7-11800H, GeForce RTX 3080 Laptop GPU, 80 Wh | Dell XPS 17 9710 Core i7 RTX 3060 i7-11800H, GeForce RTX 3060 Laptop GPU, 97 Wh | Genomsnitt av klass Multimedia | |
|---|---|---|---|---|---|---|---|
| Batteridrifttid | 8% | -34% | 3% | -60% | 44% | 11% | |
| H.264 (h) | 17 | 17.5 3% | 7.2 -58% | 17.1 ? 1% | |||
| WiFi v1.3 (h) | 14.9 | 16.9 13% | 7 -53% | 6.2 -58% | 5.9 -60% | 7.6 -49% | 12.2 ? -18% |
| Load (h) | 1.1 | 1.2 9% | 1.8 64% | 2.6 136% | 1.664 ? 51% | ||
| Reader / Idle (h) | 12.9 | 17.7 | 24.9 ? |
För
Emot
Bedömning - M1 Max övertygar med prestanda och sval drift

MacBook Pro 16 2021 med den snabbaste versionen av M1 Max-processorn med 32 GPU-kärnor övertygar inte bara med sin prestanda, utan framför allt med de låga temperaturerna och de jämförelsevis tysta fläktarna. Den kraftfulla kylningslösningen och den effektiva chipdesignen lönar sig definitivt här, eftersom temperaturerna är helt okritiska även vid maximal belastning. Och du kan till och med använda den maximala prestandan på batteri, vilket hittills inte har förekommit i det här prestandasortimentet. Det valfria prestandaläget resulterar å andra sidan i något högre fläktar och lägre yttemperaturer, men vi tror inte att det verkligen är nödvändigt
Prestandan hosM1 MaxochM1 Proär i stort sett identiska när det gäller CPU:n, och den stora skillnaden är antalet GPU-kärnor. Huruvida du verkligen behöver den extra kraften beror naturligtvis på ditt användningsscenario. Om du redigerar många videor eller planerar att använda fler externa skärmar är M1 Max det rätta alternativet. Men om du bara letar efter en bärbar multimediebärbar dator av hög kvalitet rekommenderar vi basmodellen avMacBook Pro 16med M1 Pro
Den avancerade modellen av den nya MacBook Pro 16 2021 övertygar inte bara med den ökade grafikprestandan från M1 Max SoC, utan även med de utmärkta utsläppsresultaten
I övrigt får du samma för- och nackdelar som vi redan har diskuterat i vår djupgående granskning av basmodellen av MBP 16. Tack vare den fantastiska Mini-LED-skärmen och de utmärkta högtalarna finns det inte mycket att klaga på, även om det fortfarande finns utrymme för förbättringar när det gäller till exempel anslutningsmöjligheter. MacBook Pro kommer inte heller att passa alla användare. Om du bara vill ha en enhet för allting och dessutom gillar att spela lite spel är du i stort sett tvingad att använda en kraftfull bärbar Windows-dator som t.ex.ThinkPad X1 Extreme G4,Razer Blade 15, eller denDell XPS 17(den XPS 15 är inte tillgänglig med en lika kraftfull GPU). Detta gäller även om du är beroende av programvara som helt enkelt inte finns tillgänglig för MacBook.
Pris och tillgänglighet
Tillgången till den nya MacBook Pro 16 är för närvarande begränsad. Det bästa alternativet är att hämta den i en av Apple:s butiker, där du kan få vår testenhet med 2 TB SDD för 4299 dollar.
Apple MacBook Pro 16 2021 M1 Max
- 11/24/2021 v7 (old)
Andreas Osthoff
Price comparison

