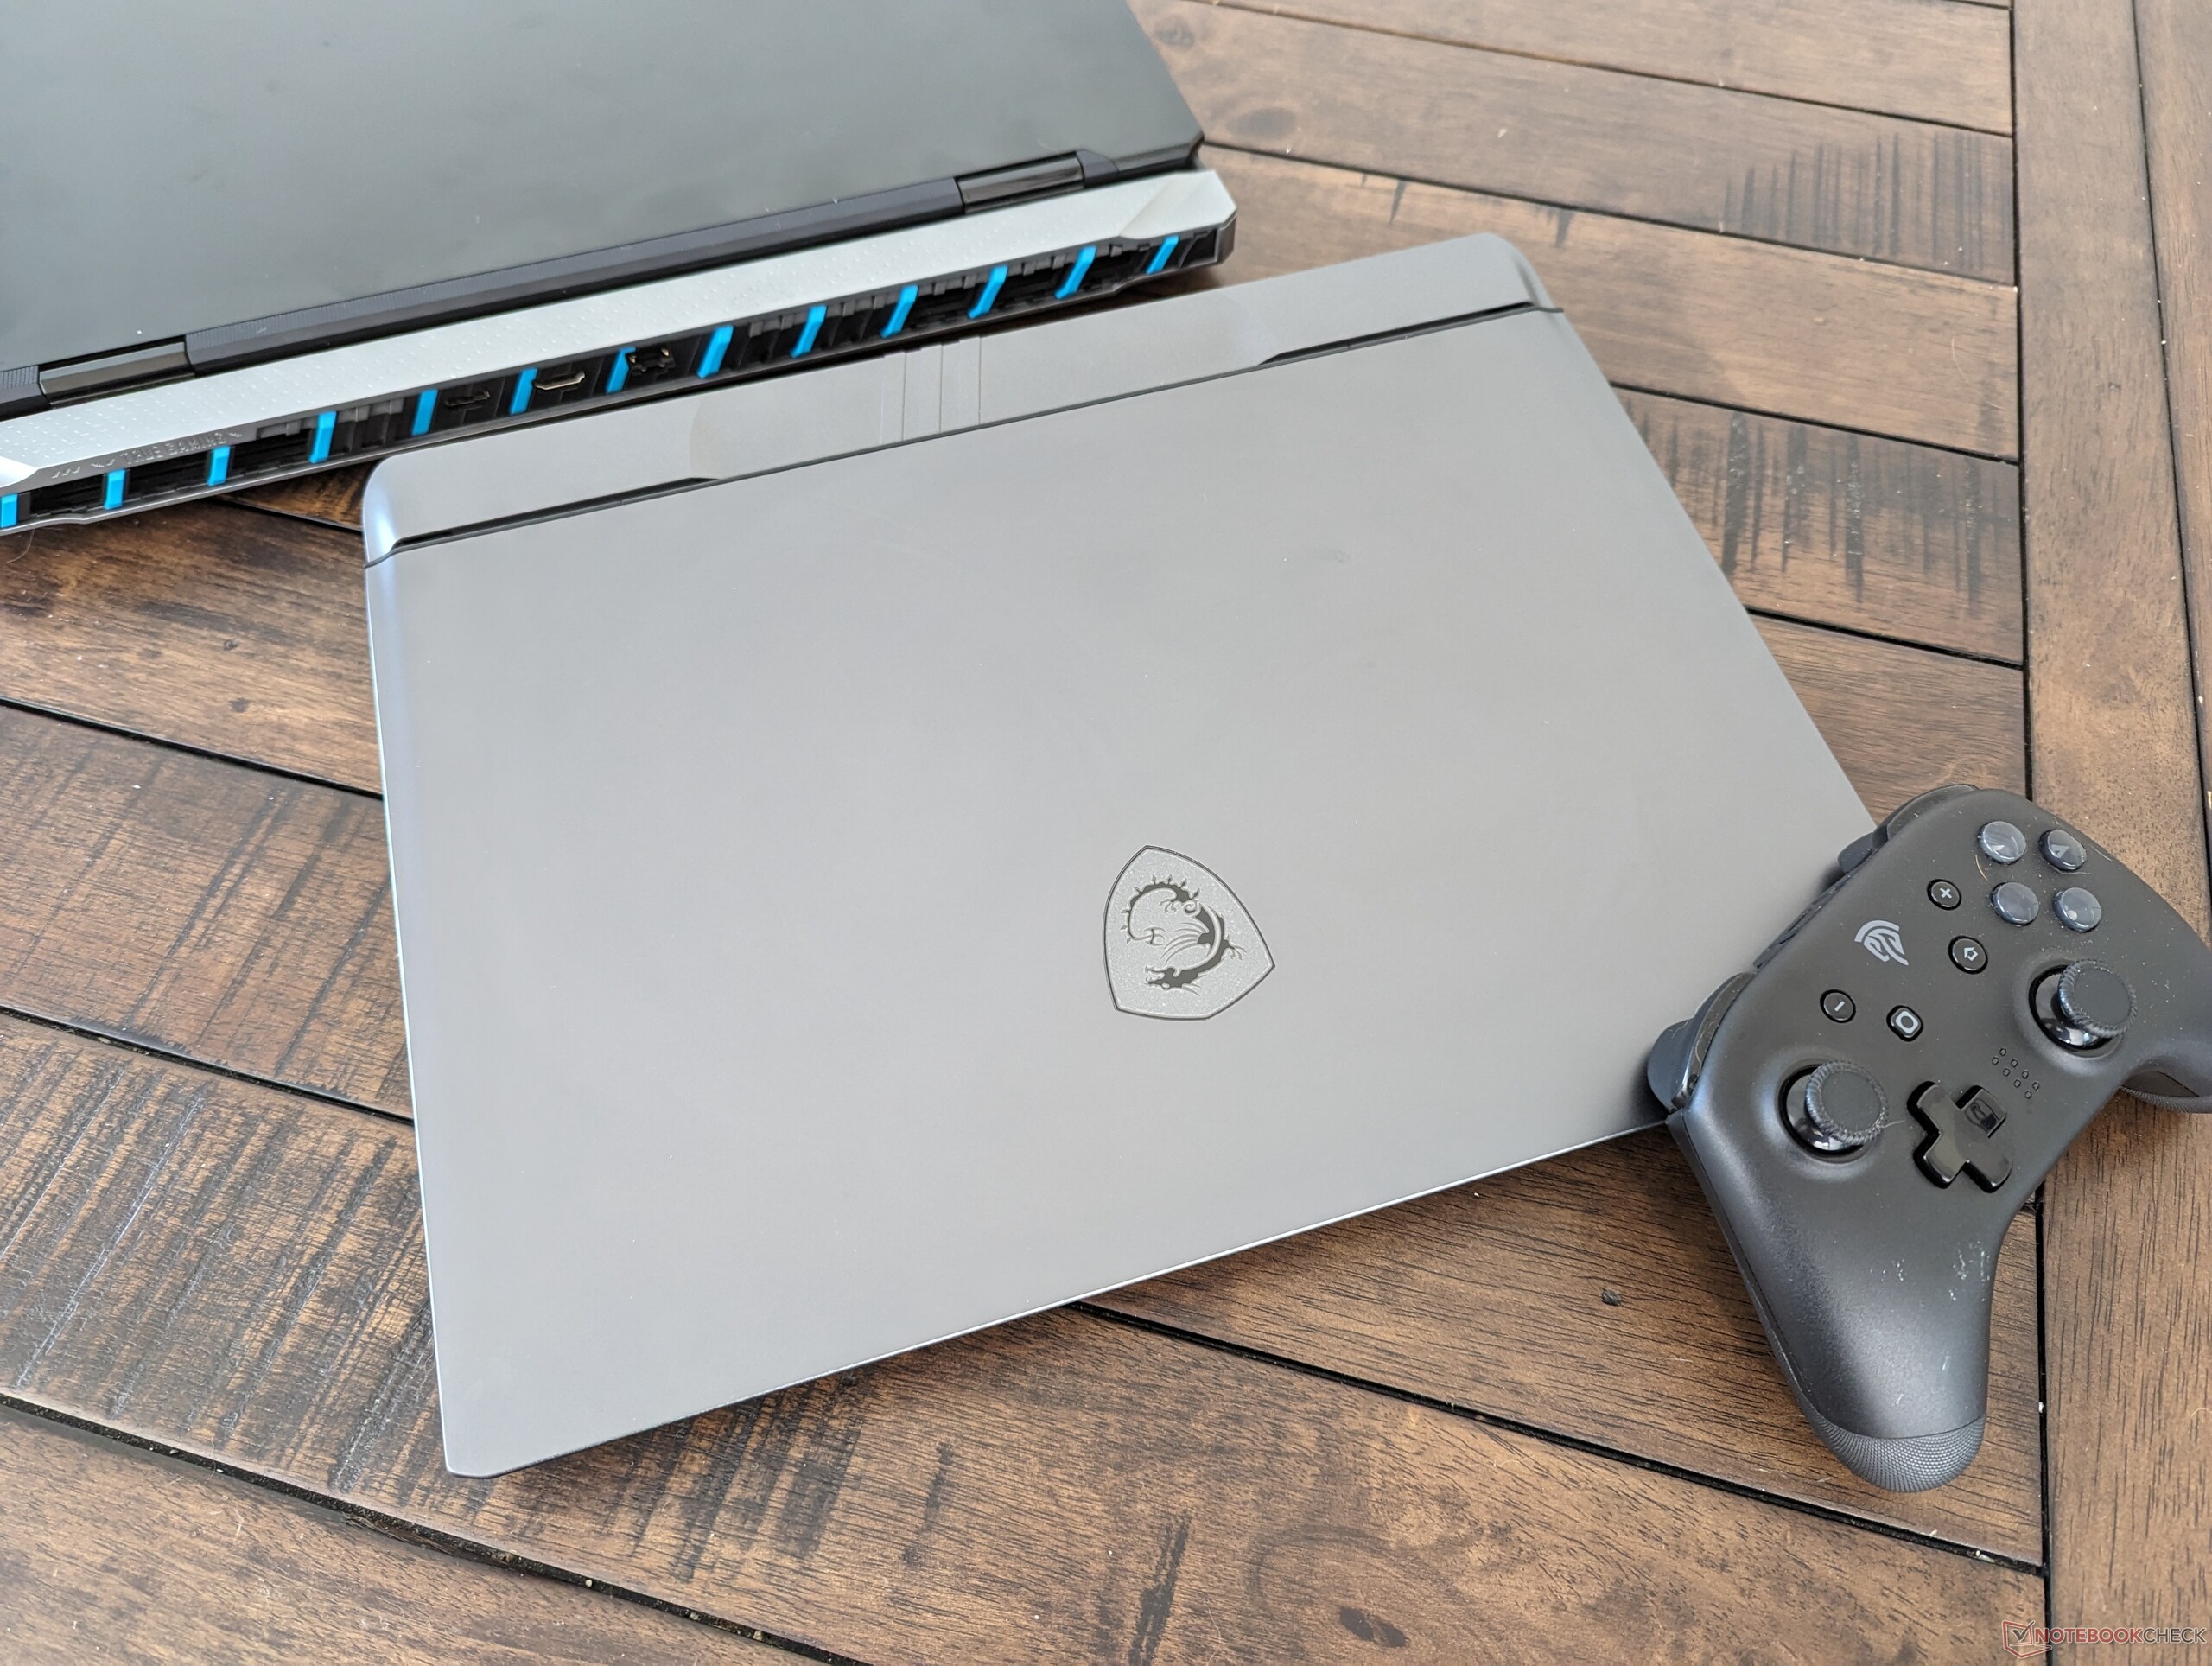
MSI Vector 16 HX laptop recension: Titan-prestanda utan Titan-pris

MSI Vector 16 HX ska inte förväxlas med den avsomnade Maingear Vector, utan efterträder förra årets GP68 genom att introducera nya 14:e generationens Intel Raptor Lake-HX CPU-alternativ och en reviderad chassidesign över den åldrande 15,6-tums GP66. Modellen gjorde sin debut tidigare i år på CES 2024 tillsammans med en mängd andra tillkännagivanden som MSI Claw och Titan 18 HX.
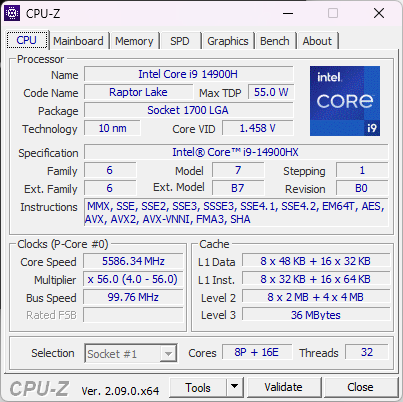
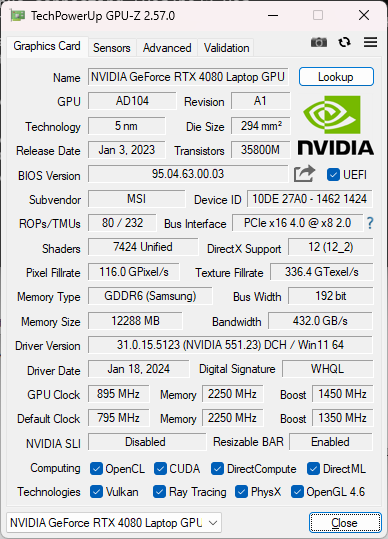
Vår granskningsenhet är en avancerad konfiguration med Core i9-14900HX CPU, 175
GeForce RTX 4080 GPU och 1600p 240 Hz IPS-skärm för cirka $2700 USD. Andra konfigurationer finns med RTX 4090, 4070 eller 4060-grafik och en 1200p 144 Hz-skärm, men alla alternativ för närvarande inkluderar samma Core i9-14900HX-processor.Alternativ till Vector 16 HX inkluderar andra mellanklass till avancerade 16-tums bärbara speldatorer som Lenovo Legion 5i 16,Asus TUF Gaming A16 , Alienware m16 R1, eller HP Omen 16.
Fler MSI recensioner:
Potentiella konkurrenter i jämförelse
Gradering | Datum | Modell | Vikt | Höjd | Storlek | Upplösning | Pris |
|---|---|---|---|---|---|---|---|
| 88 % v7 (old) | 02/2024 | MSI Vector 16 HX A14V i9-14900HX, GeForce RTX 4080 Laptop GPU | 2.7 kg | 28.55 mm | 16.00" | 2560x1600 | |
| 86.9 % v7 (old) | 03/2022 | MSI Vector GP66 12UGS i9-12900H, GeForce RTX 3070 Ti Laptop GPU | 2.3 kg | 23.4 mm | 15.60" | 1920x1080 | |
| 89.1 % v7 (old) | 02/2024 | Lenovo Legion 5 16IRX G9 i7-14650HX, GeForce RTX 4060 Laptop GPU | 2.4 kg | 25.2 mm | 16.00" | 2560x1600 | |
| 85.1 % v7 (old) | 09/2023 | HP Victus 16-r0077ng i7-13700H, GeForce RTX 4070 Laptop GPU | 2.4 kg | 24 mm | 16.10" | 1920x1080 | |
| 86.9 % v7 (old) | 06/2023 | Asus TUF Gaming A16 FA617XS R9 7940HS, Radeon RX 7600S | 2.2 kg | 22.1 mm | 16.00" | 1920x1200 | |
| 86.1 % v7 (old) | 10/2022 | Dell G16 7620 i7-12700H, GeForce RTX 3060 Laptop GPU | 2.6 kg | 26.9 mm | 16.00" | 2560x1600 |
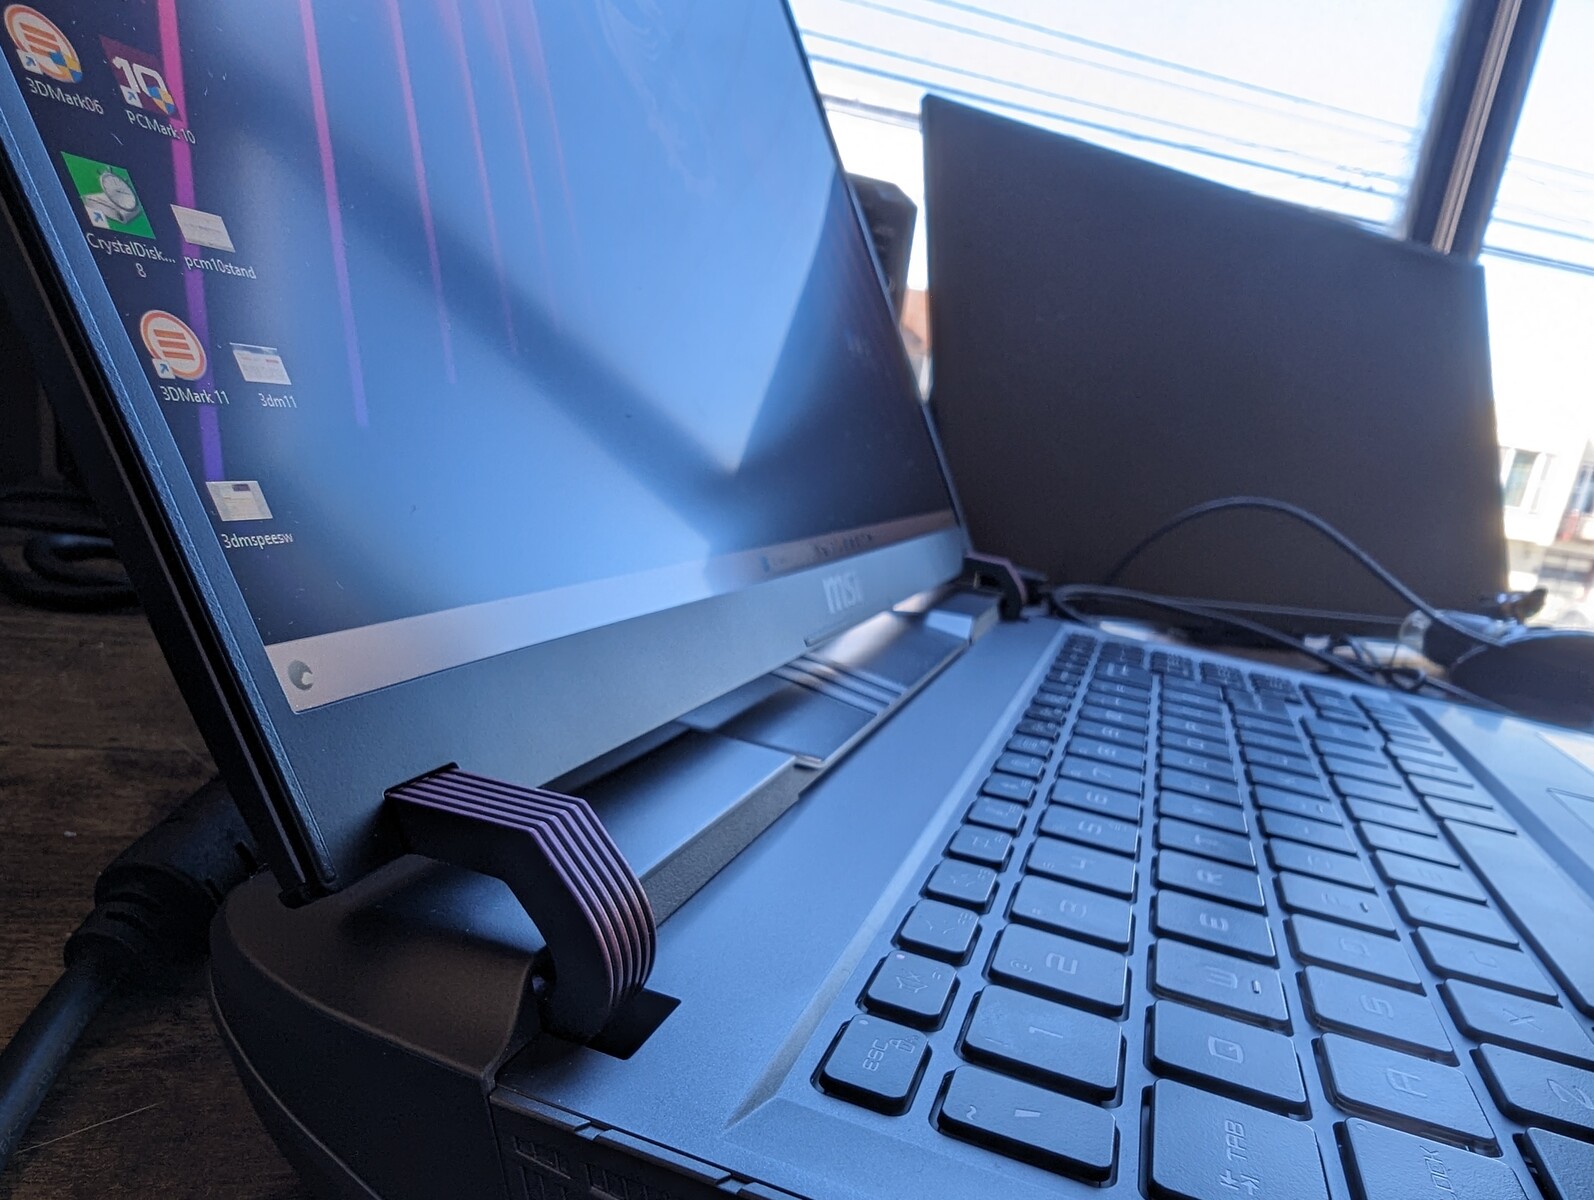
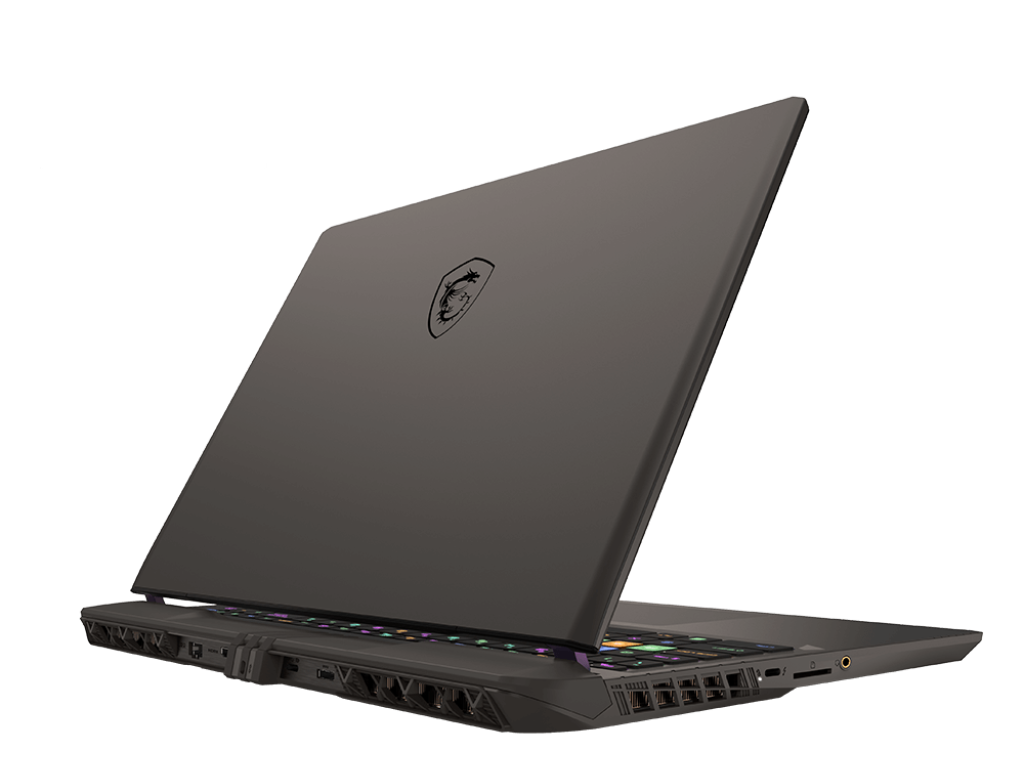
Case - Stark, men inget märkvärdigt
Bortsett från det yttre locket i metalllegering är det mesta av basen i plast för en mindre lyxig upplevelse jämfört med den dyrare Titan HX. Vector-serien är inte tänkt att vara toppen av linjen, men vi förväntar oss ändå lite mer med tanke på det begärda priset på ~ $ 2000. Dess tangentbordsdäck och bottenpanel saknar premiumkänslan hos alternativ som Razer Blade 16 eller Alienware m16 R1.
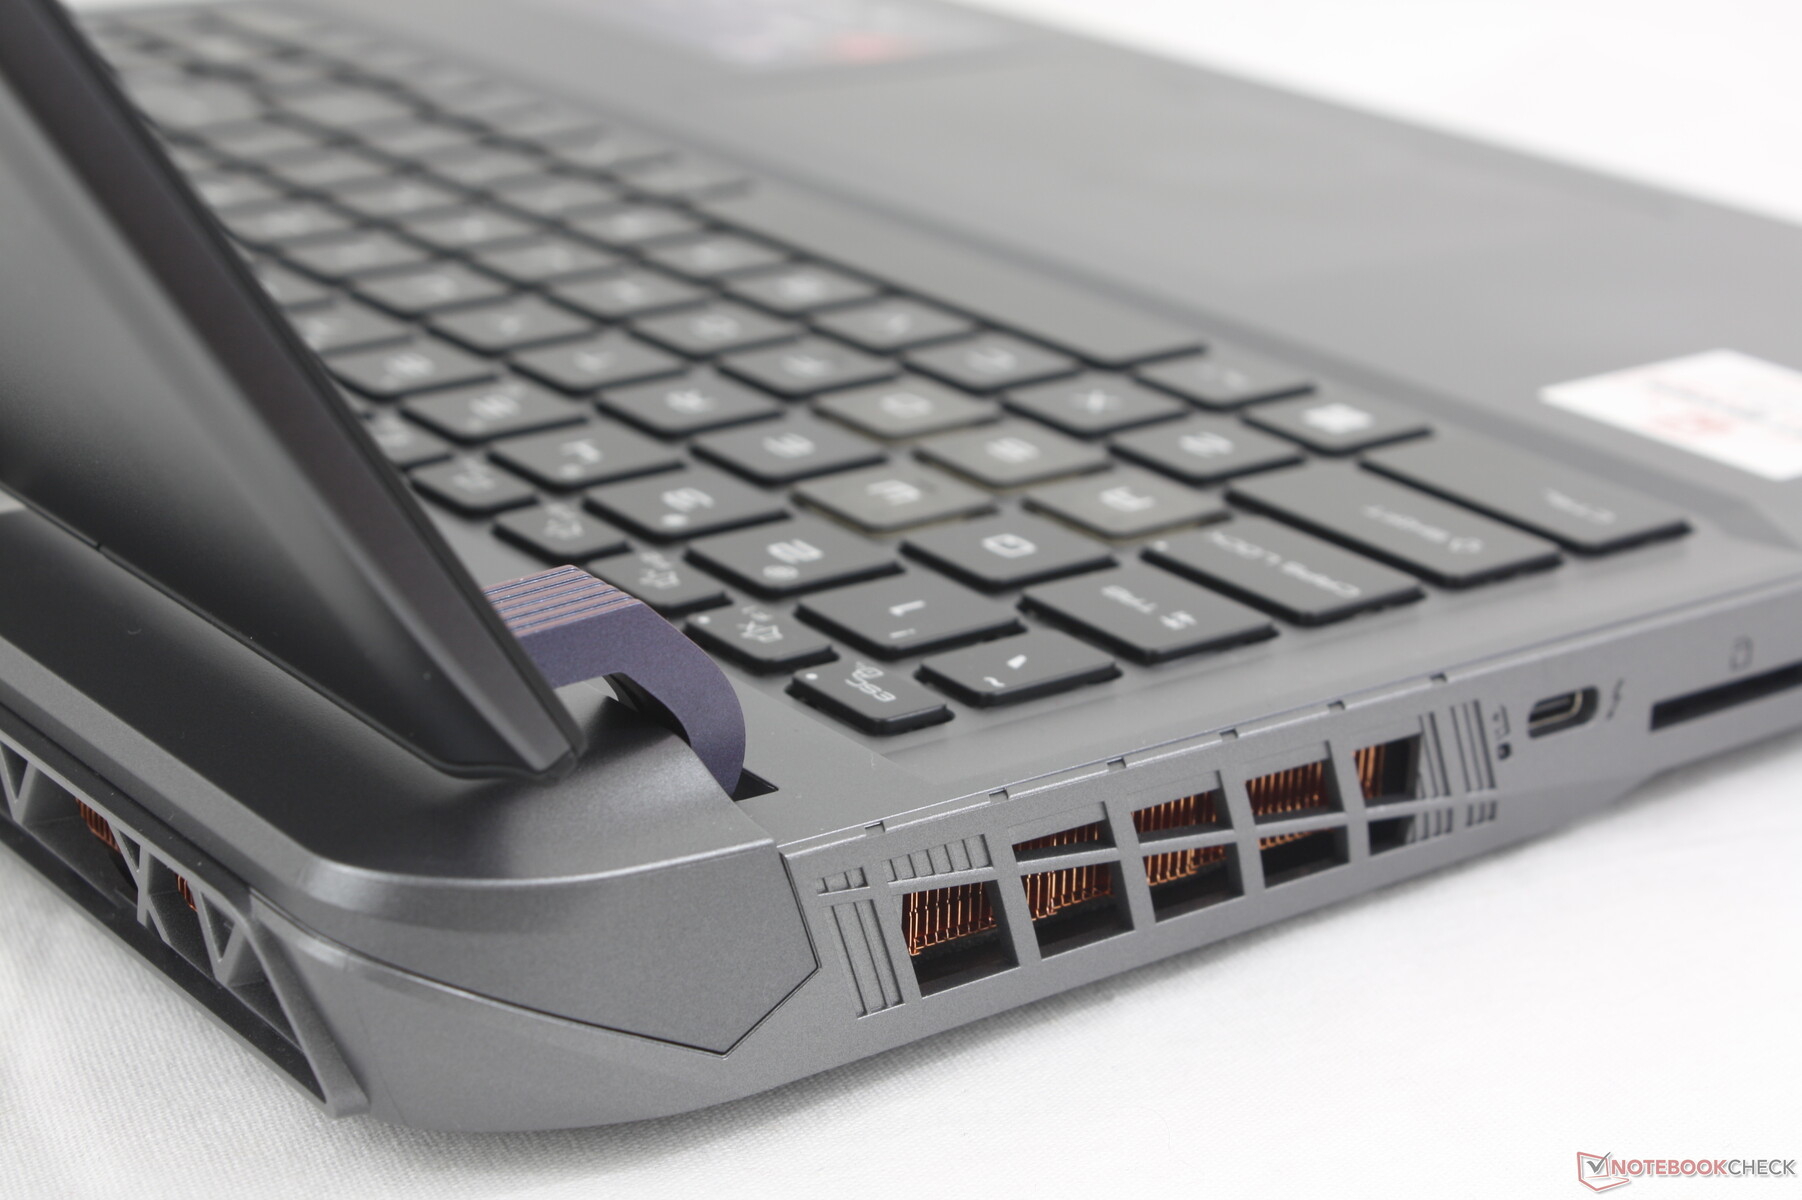
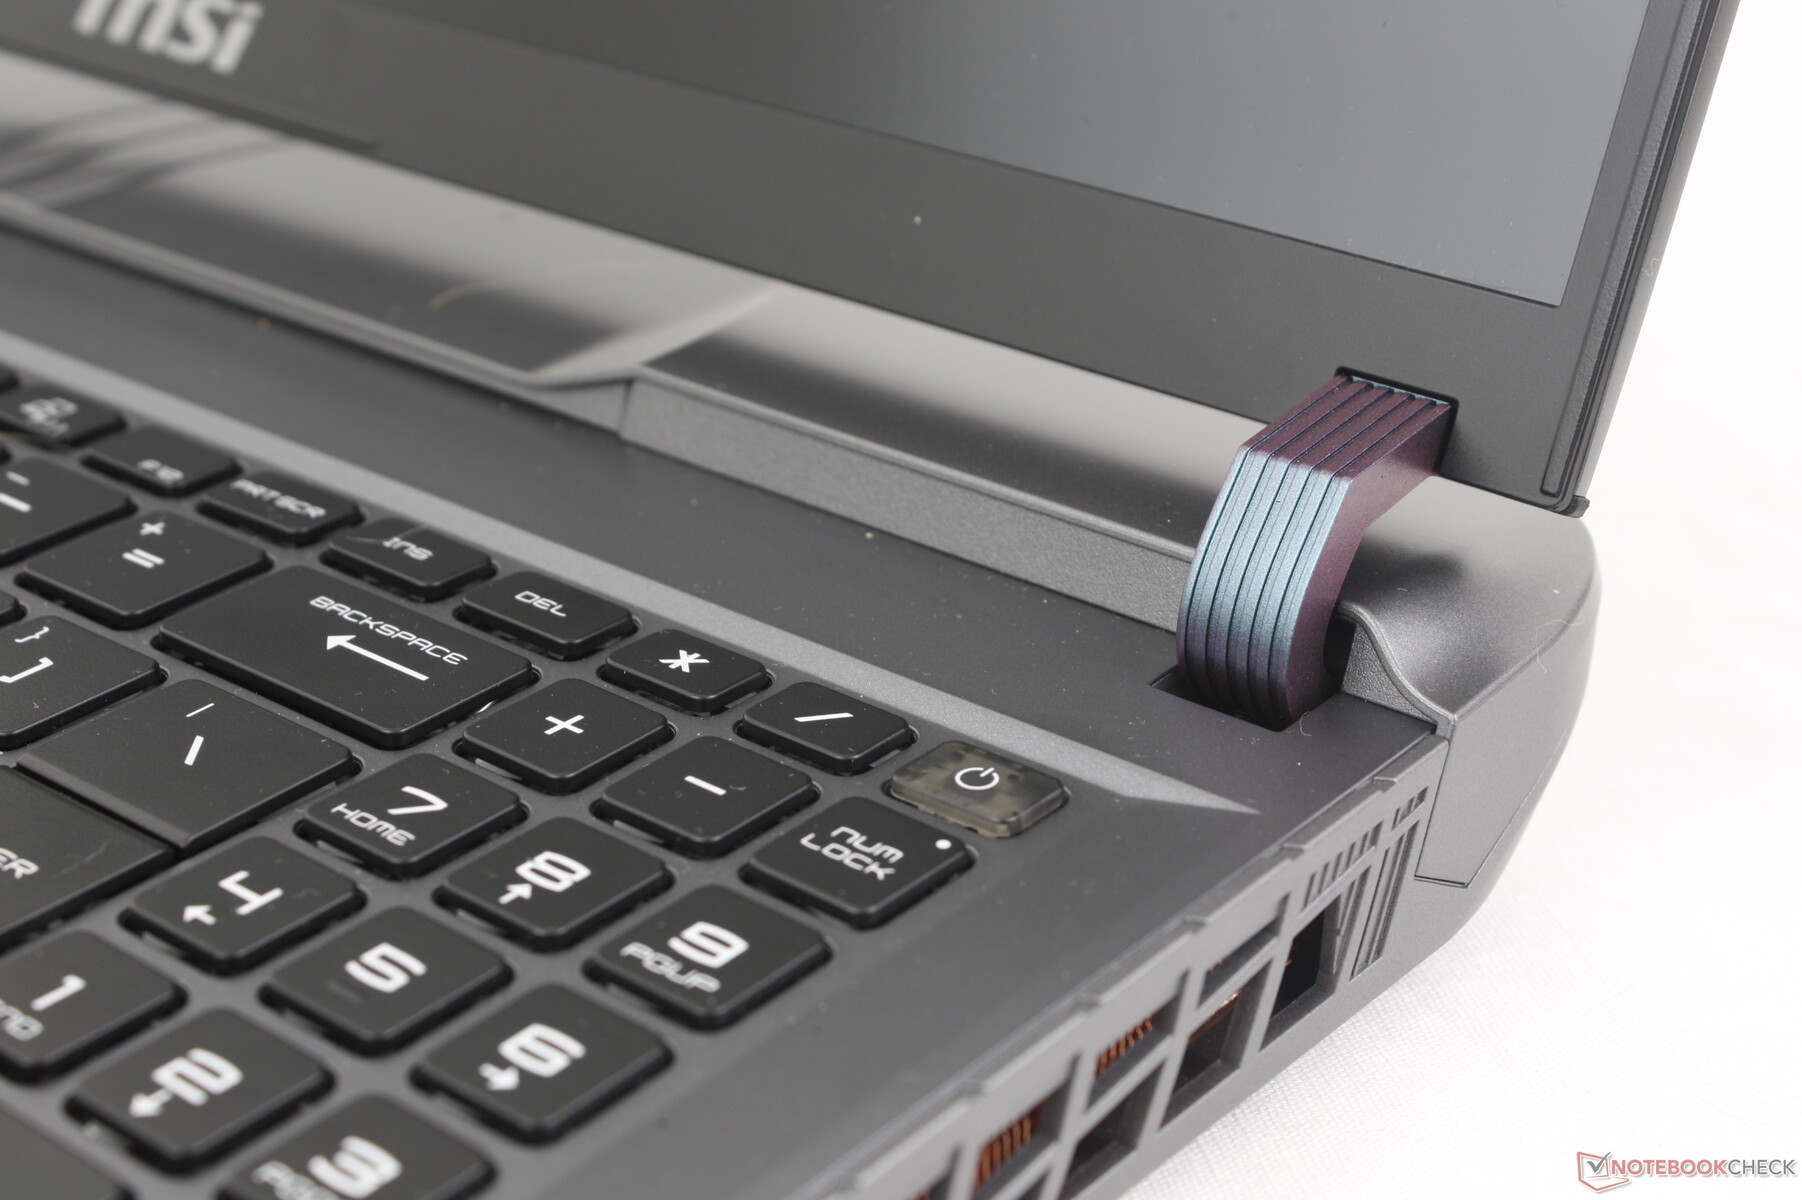
Lyckligtvis är chassits styvhet utmärkt från topp till botten, inklusive locket där det tenderar att vara märkbart svagare på andra bärbara datorer. De omdesignade gångjärnen i synnerhet är nu mycket större och fastare än tidigare för att påminna om gångjärnen på Asus Strix Scar 17. Deras krökning begränsar dock den maximala vinkeln som du kan öppna skärmen till endast 130 grader.
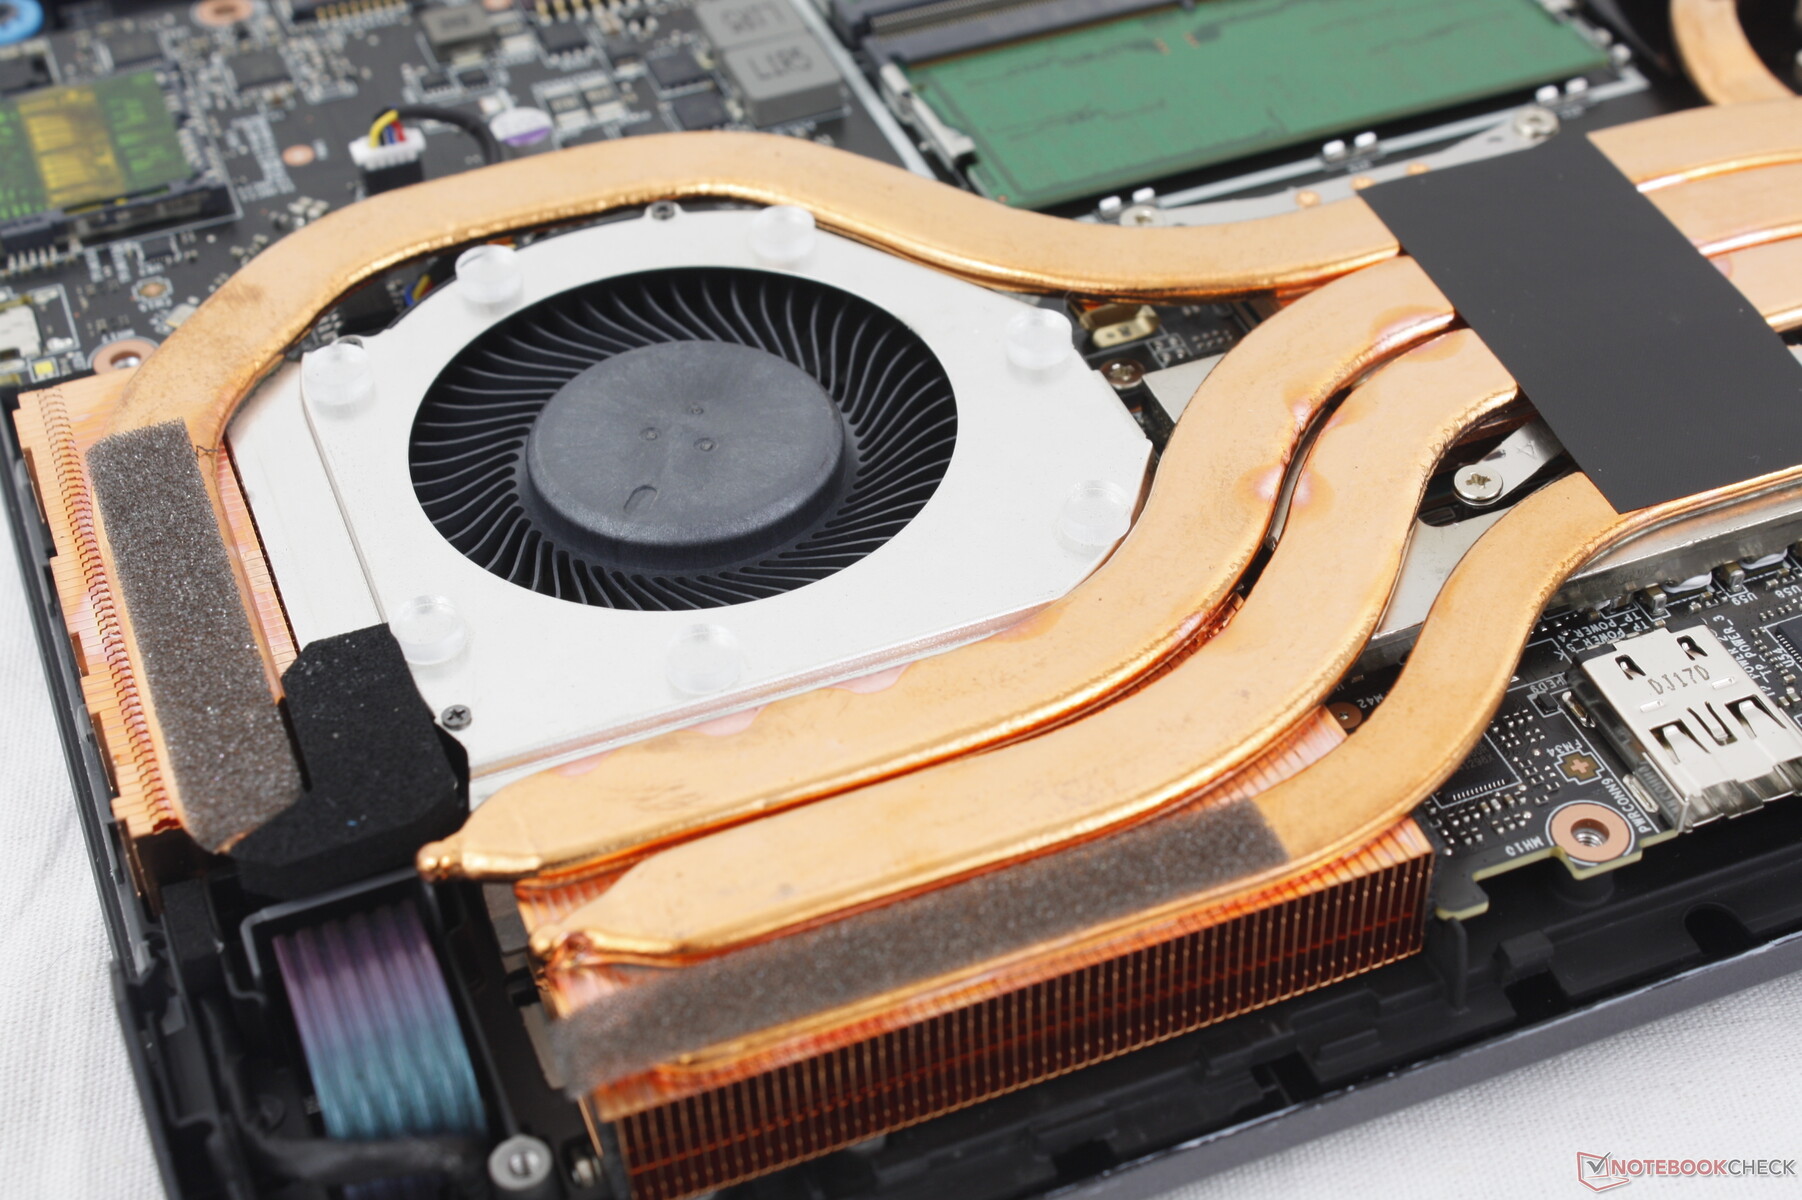
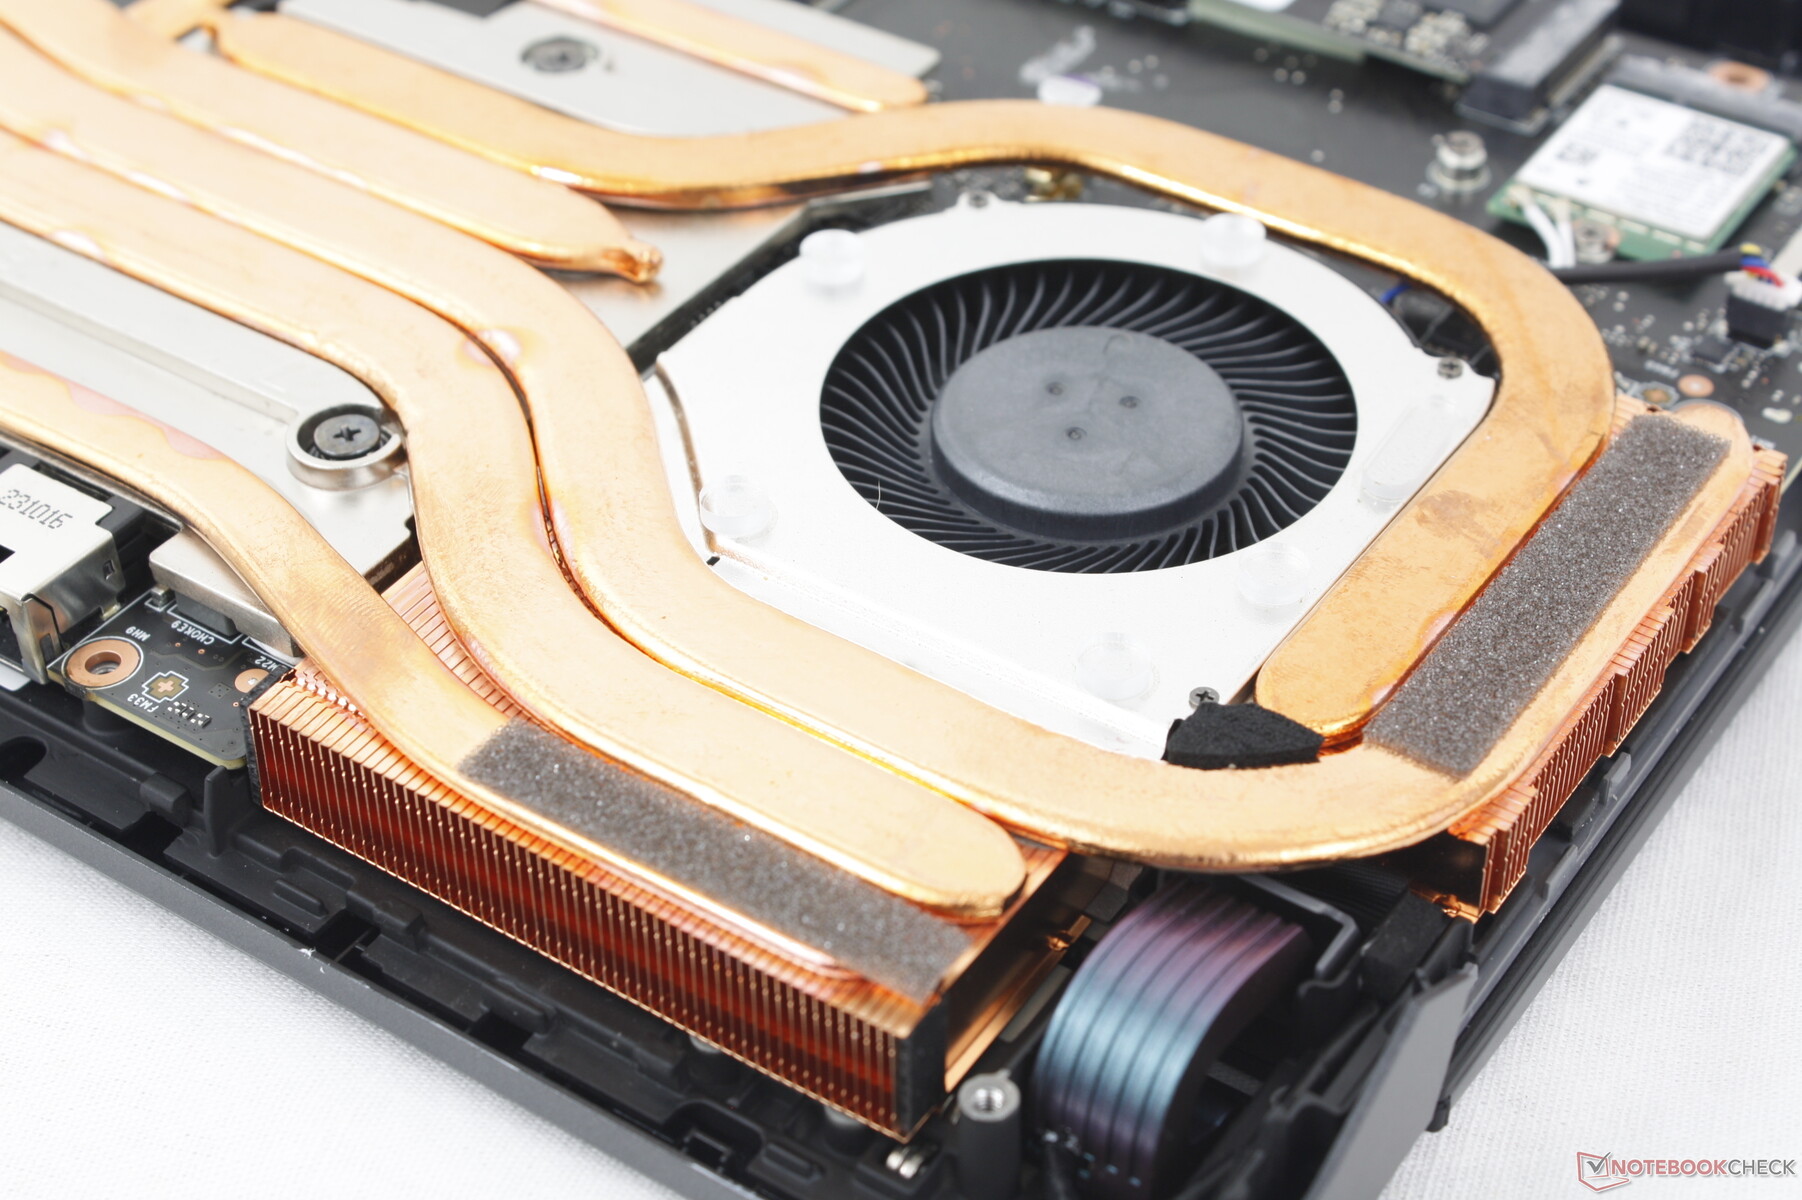
Vector 16 HX är en stor bärbar dator och det finns ingen väg runt det. Det ambitiösa TGP-målet på 175 W (eller 240 W i kombination med CPU) kräver en kraftfullare kyllösning och större chassidesign än de flesta andra 16-tumsmodeller. MSI är till och med större och tyngre än förra årets Dell G16 7620 som redan var ganska stor. Det är tack och lov inte riktigt lika tungt som 18-tums Razer Blade 18 eller Asus ROG Strix Scar 18men den är inte precis bärbar heller.
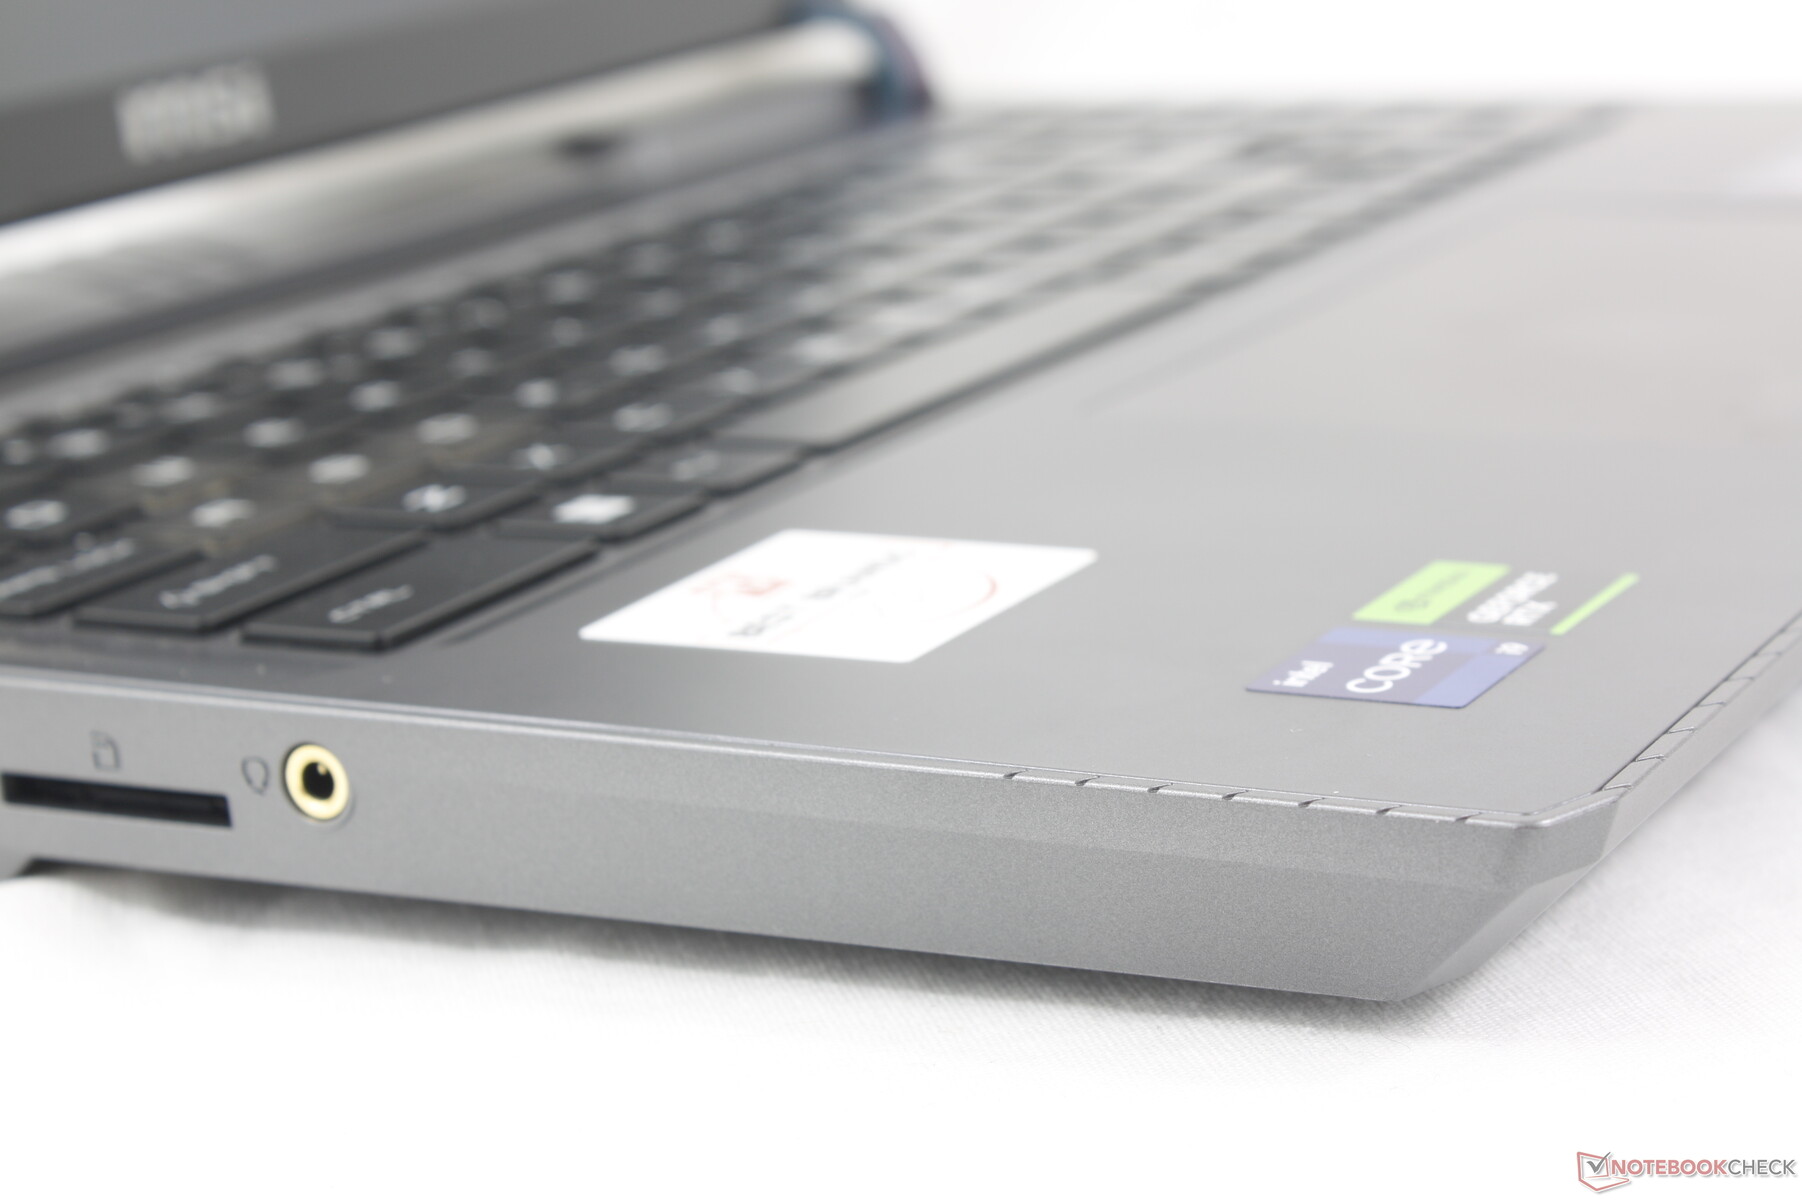
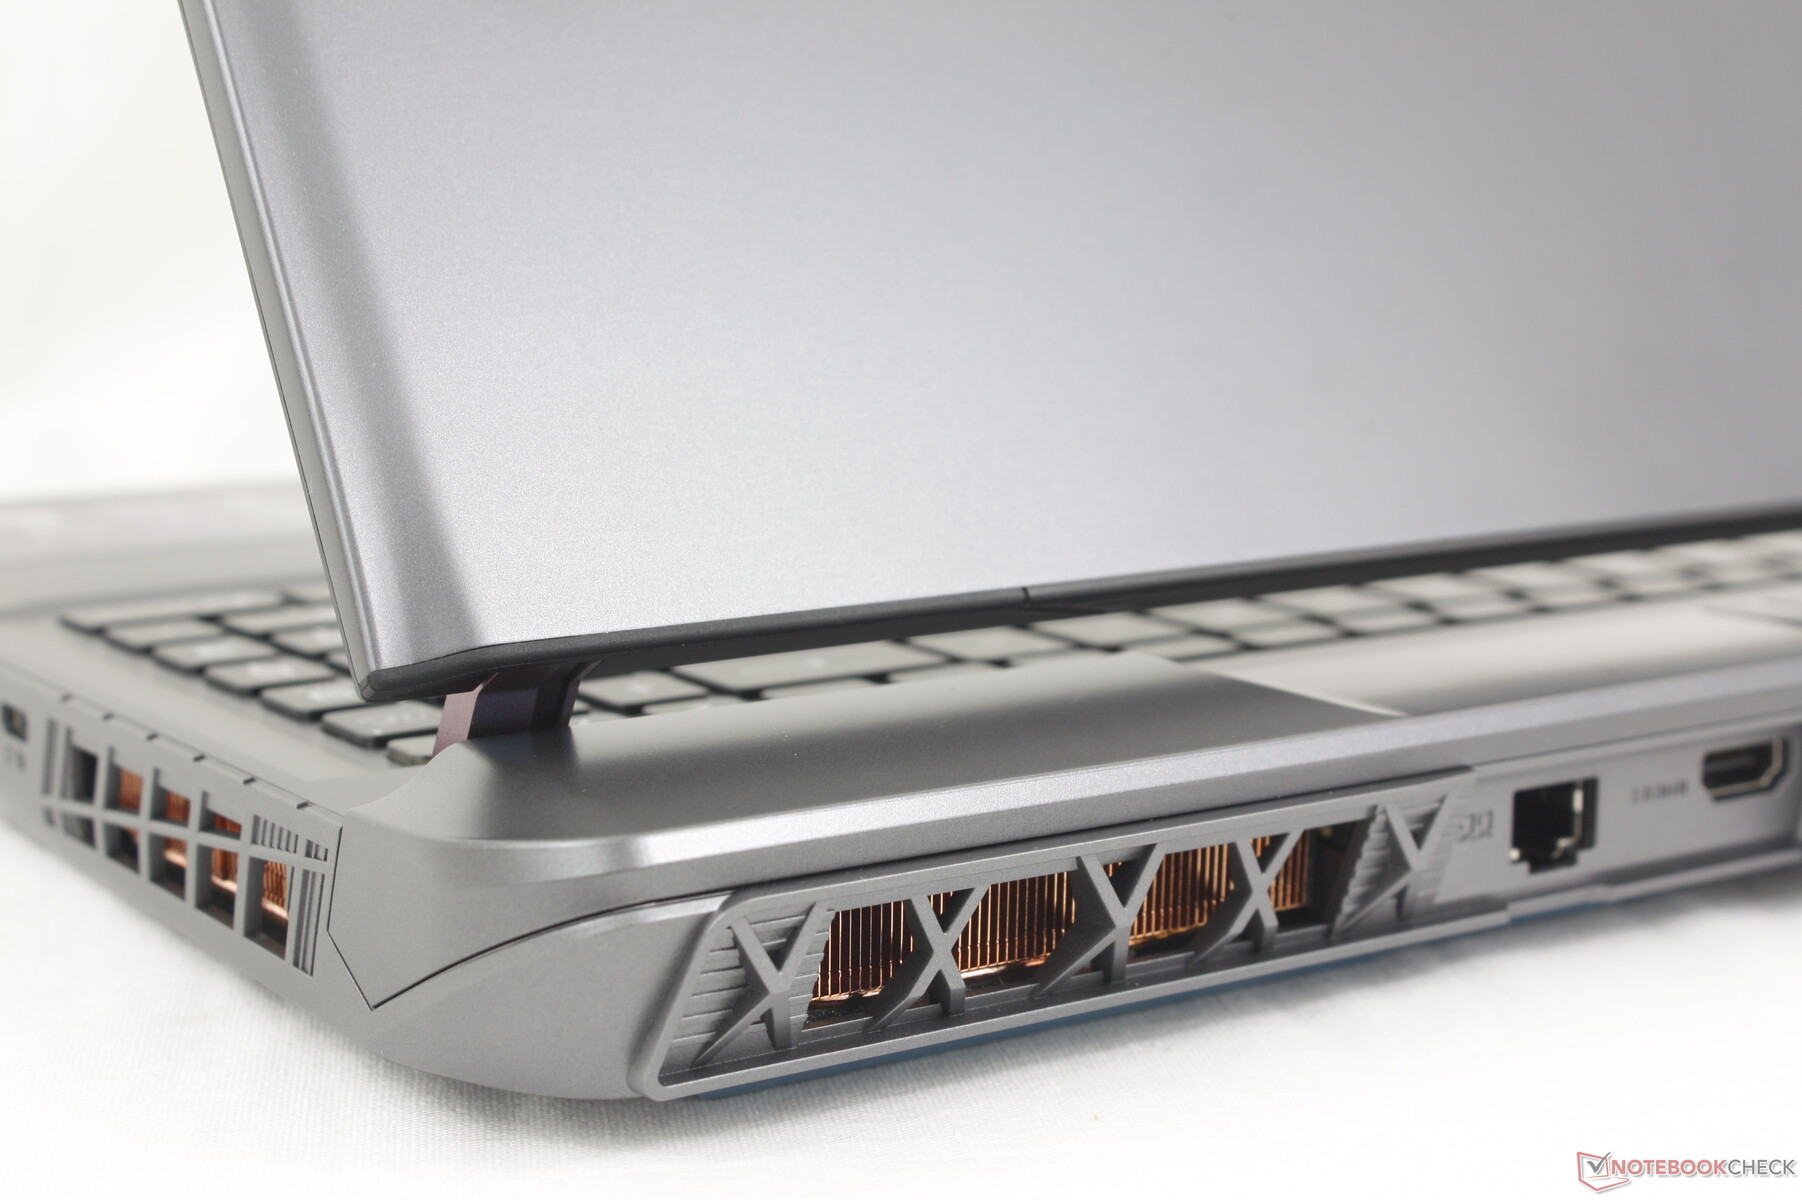
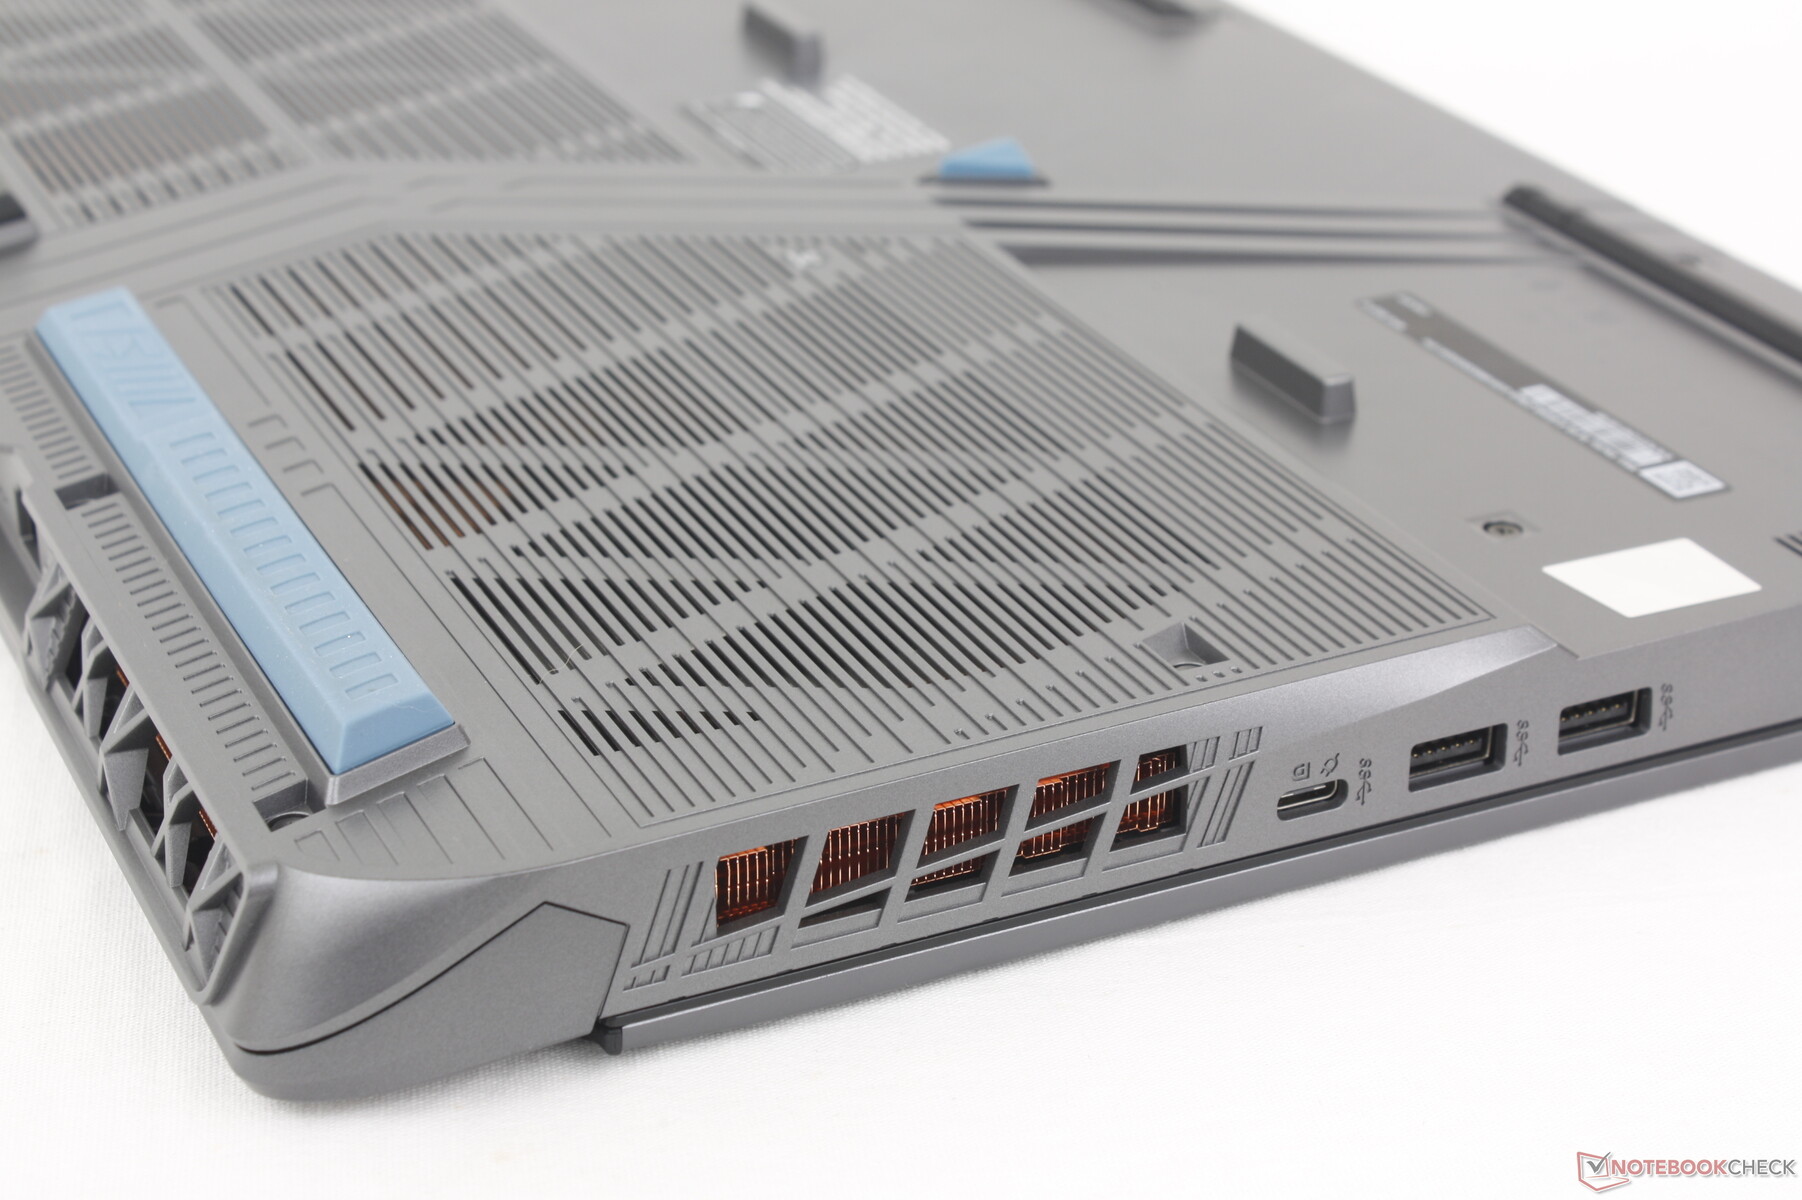
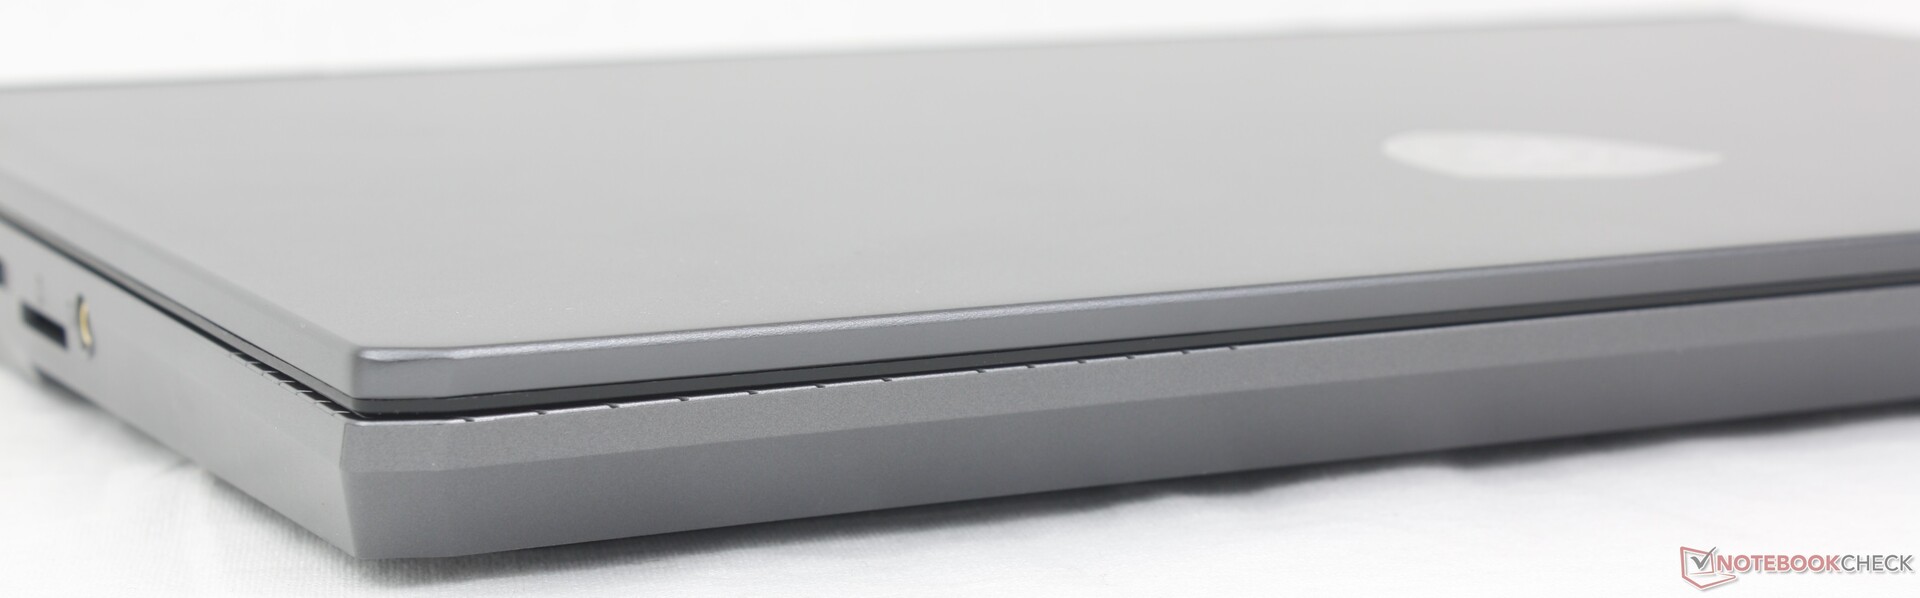
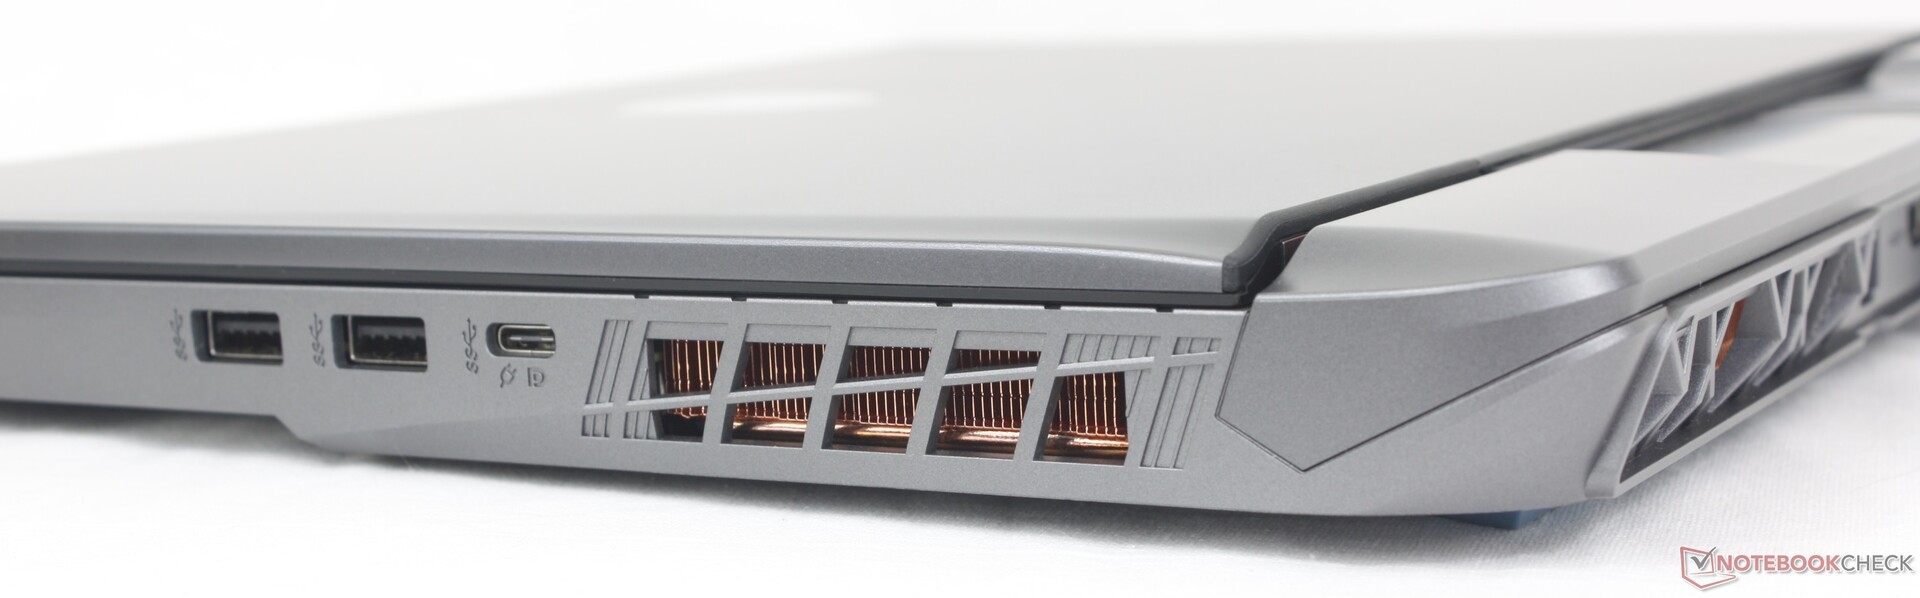
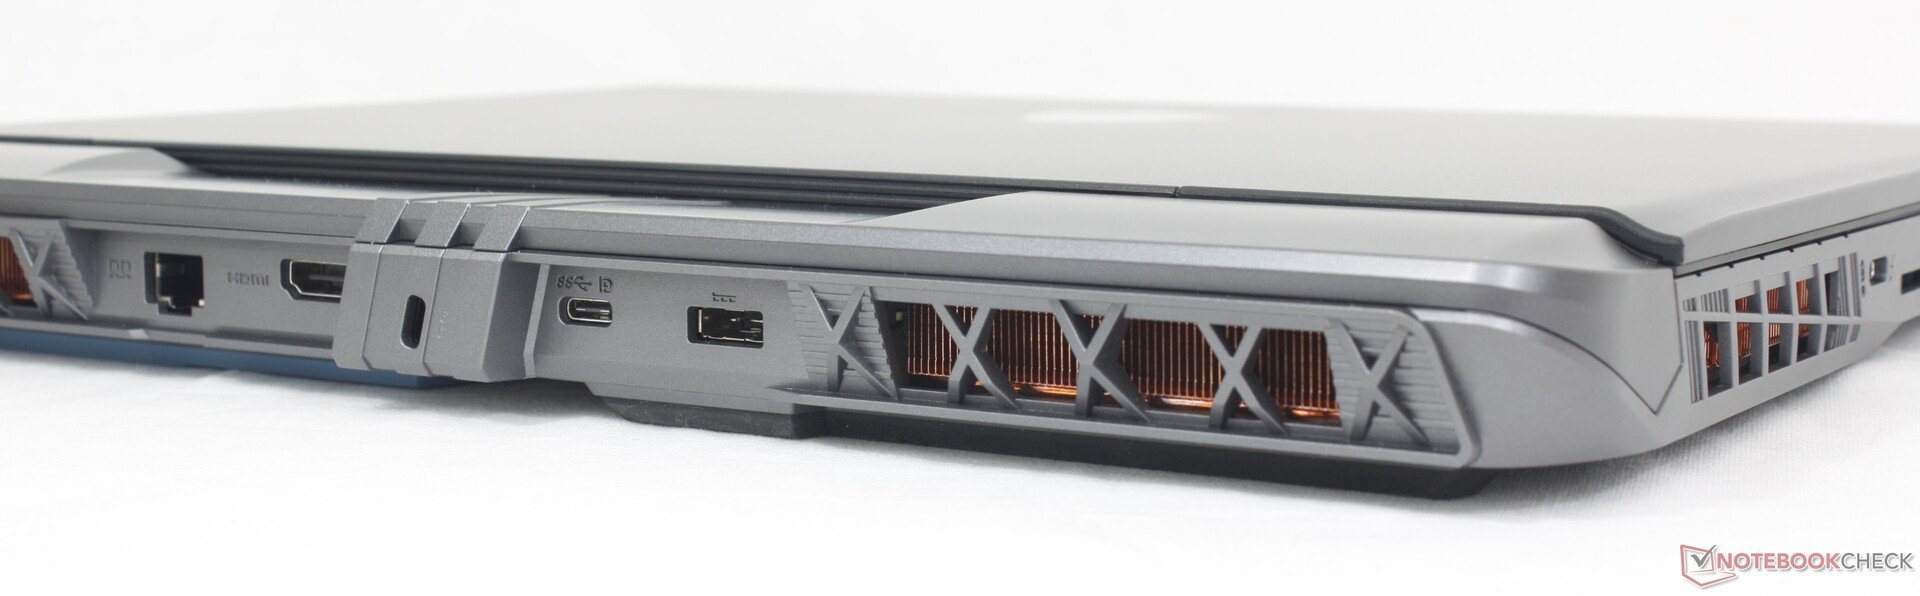
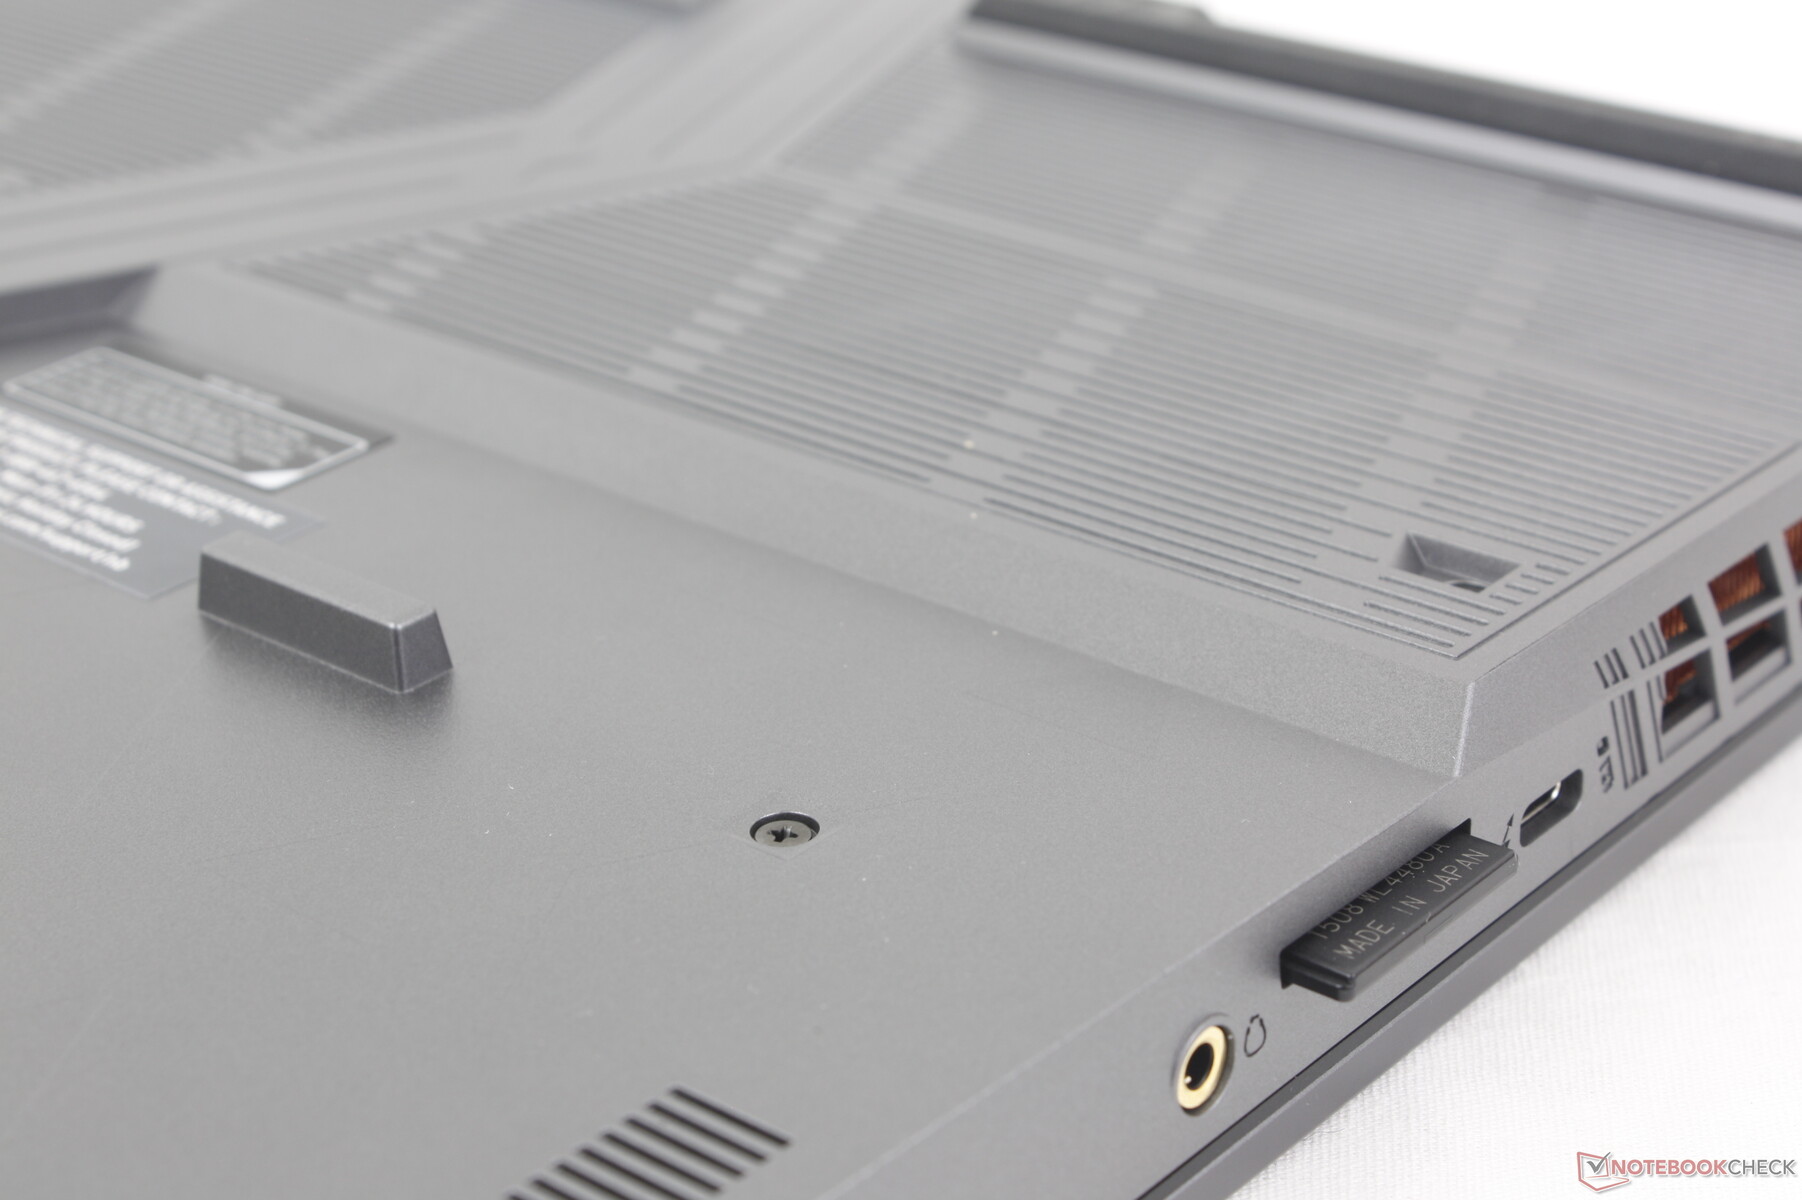
Anslutningsmöjligheter
MSI har sett över portarna jämfört med GP66. Nytt för Vector 16 HX är SD-kortläsaren och ytterligare USB-C-portar nu med ordentligt Thunderbolt-stöd. I gengäld har den nyare modellen dock färre USB-A-portar och har tappat den dedikerade mini-DisplayPort. Detta jämförs fortfarande positivt mot konkurrenter som Dell G16 eller Asus TUF Gaming A16 som har färre USB-C-portar eller saknar SD-kortläsare.
Observera att AC-adapterporten är identisk med den på Titan 18 HX även om deras AC-adapterstorlekar kan vara olika.
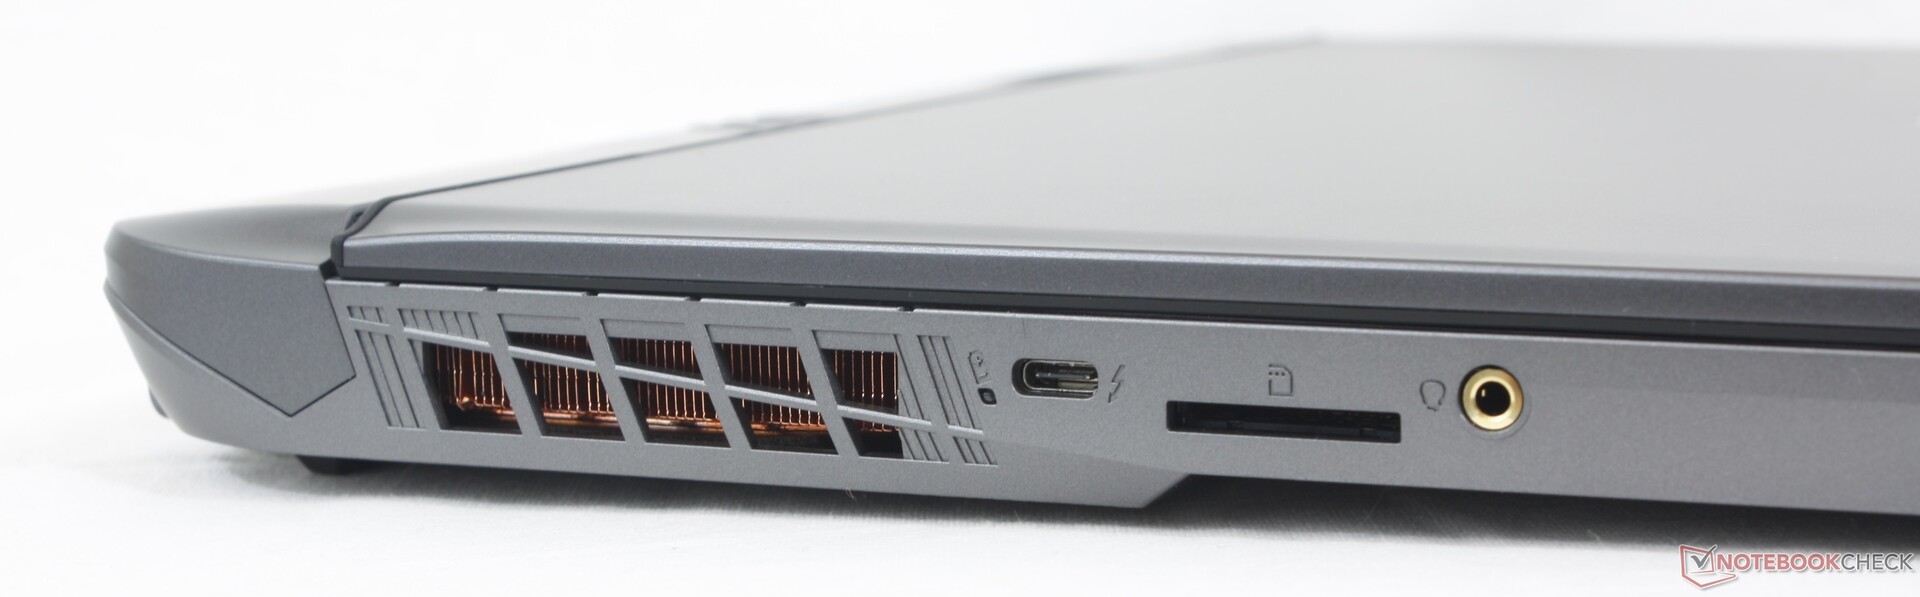
SD-kortläsare
Överföringshastigheten från den integrerade SD-kortläsaren är hyfsad med ca 90 MB/s, vilket är 2x till 3x snabbare än den kortläsare som finns på den nya Lenovo Legion 5 16. Läsaren på MSI är dock inte fjäderbelastad och därför kan ett isatt SD-kort vara svårt att ta bort med större fingrar.
| SD Card Reader | |
| average JPG Copy Test (av. of 3 runs) | |
| MSI Vector 16 HX A14V (Toshiba Exceria Pro SDXC 64 GB UHS-II) | |
| Lenovo Legion 5 16IRX G9 | |
| maximum AS SSD Seq Read Test (1GB) | |
| MSI Vector 16 HX A14V (Toshiba Exceria Pro SDXC 64 GB UHS-II) | |
| Lenovo Legion 5 16IRX G9 | |
Kommunikation
Killer BE1750x är kompatibel med Wi-Fi 7 och Bluetooth 5.4, även om Wi-Fi 7-routrar ännu inte är så vanliga. Dess inkludering handlar därför mer om framtidssäkring eftersom de flesta användare idag inte har Wi-Fi 7-routrar. Överföringshastigheterna är ändå stabila och pålitliga när de paras ihop med vår Asus AXE11000 Wi-Fi 6E testrouter.
| Networking | |
| iperf3 transmit AX12 | |
| MSI Vector GP66 12UGS | |
| iperf3 receive AX12 | |
| MSI Vector GP66 12UGS | |
| iperf3 transmit AXE11000 | |
| Lenovo Legion 5 16IRX G9 | |
| MSI Vector 16 HX A14V | |
| Dell G16 7620 | |
| Asus TUF Gaming A16 FA617XS | |
| HP Victus 16-r0077ng | |
| iperf3 receive AXE11000 | |
| Lenovo Legion 5 16IRX G9 | |
| MSI Vector 16 HX A14V | |
| Dell G16 7620 | |
| Asus TUF Gaming A16 FA617XS | |
| HP Victus 16-r0077ng | |
| iperf3 transmit AXE11000 6GHz | |
| MSI Vector 16 HX A14V | |
| iperf3 receive AXE11000 6GHz | |
| MSI Vector 16 HX A14V | |
Webbkamera
Den integrerade webbkameran är på ynka 1 MP eftersom Vector inte är utformad för frekventa videokonferenser. IR stöds inte heller, men den har åtminstone en fysisk slutare för integritetsändamål.


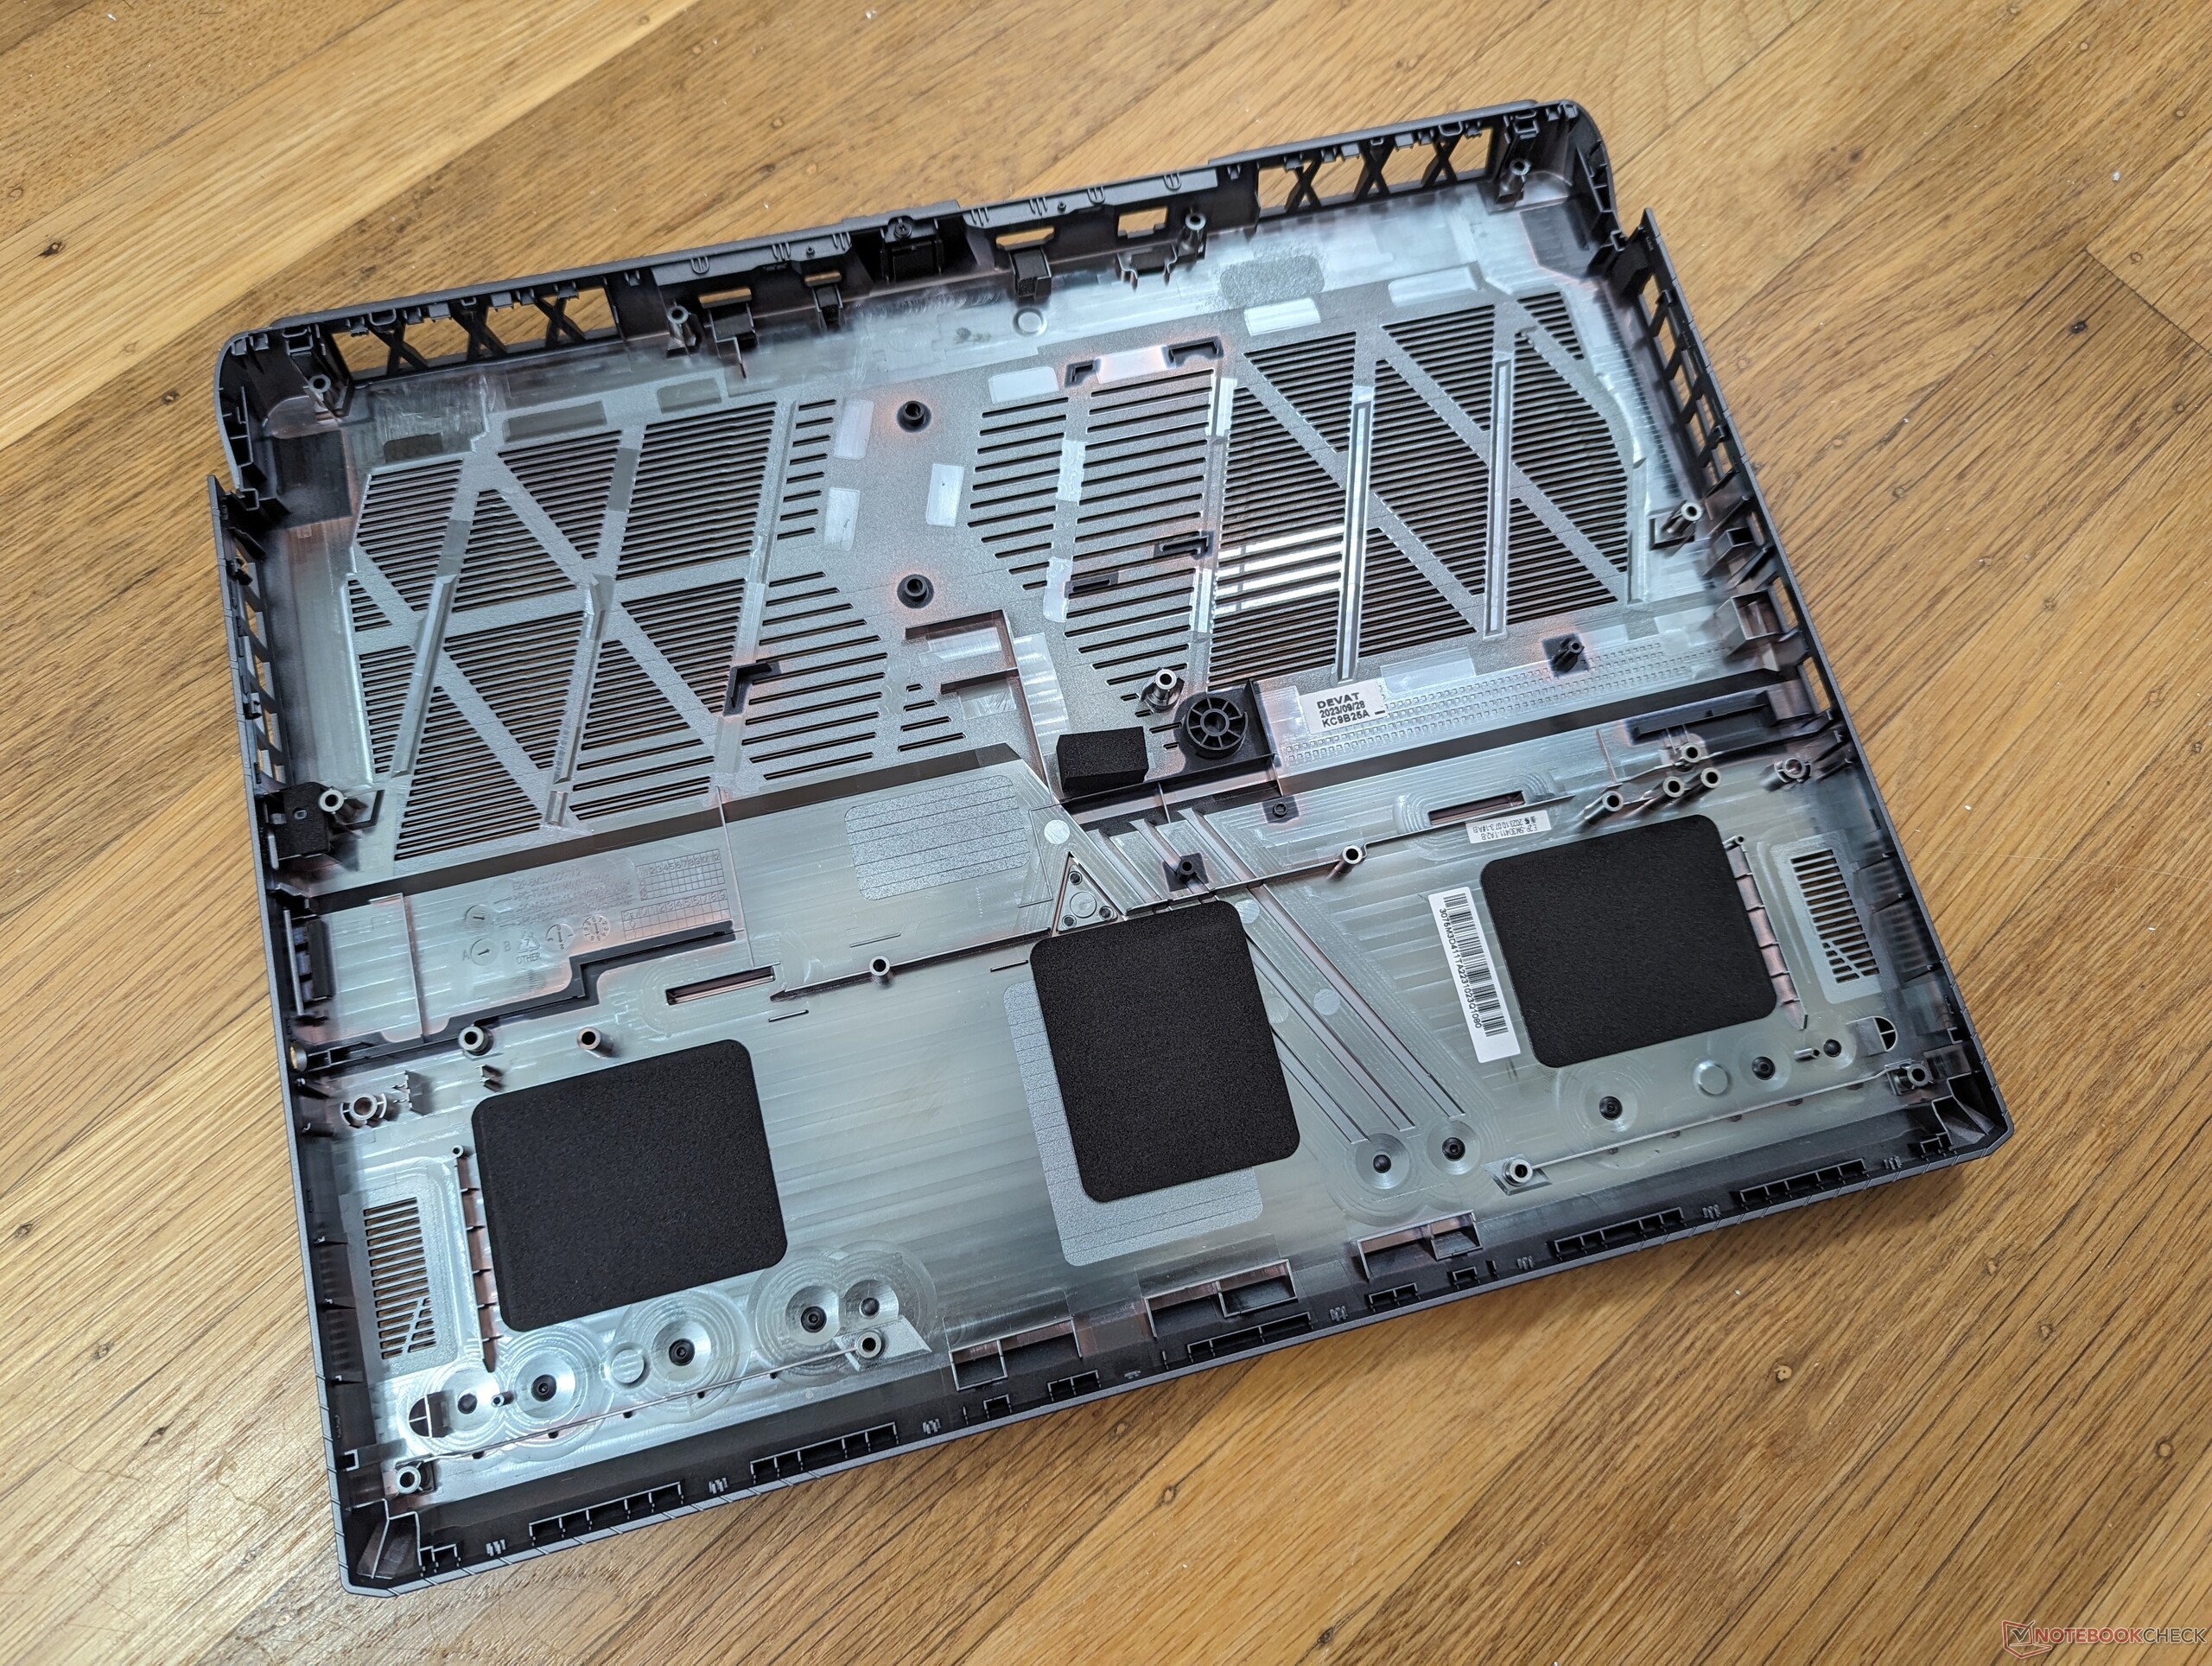
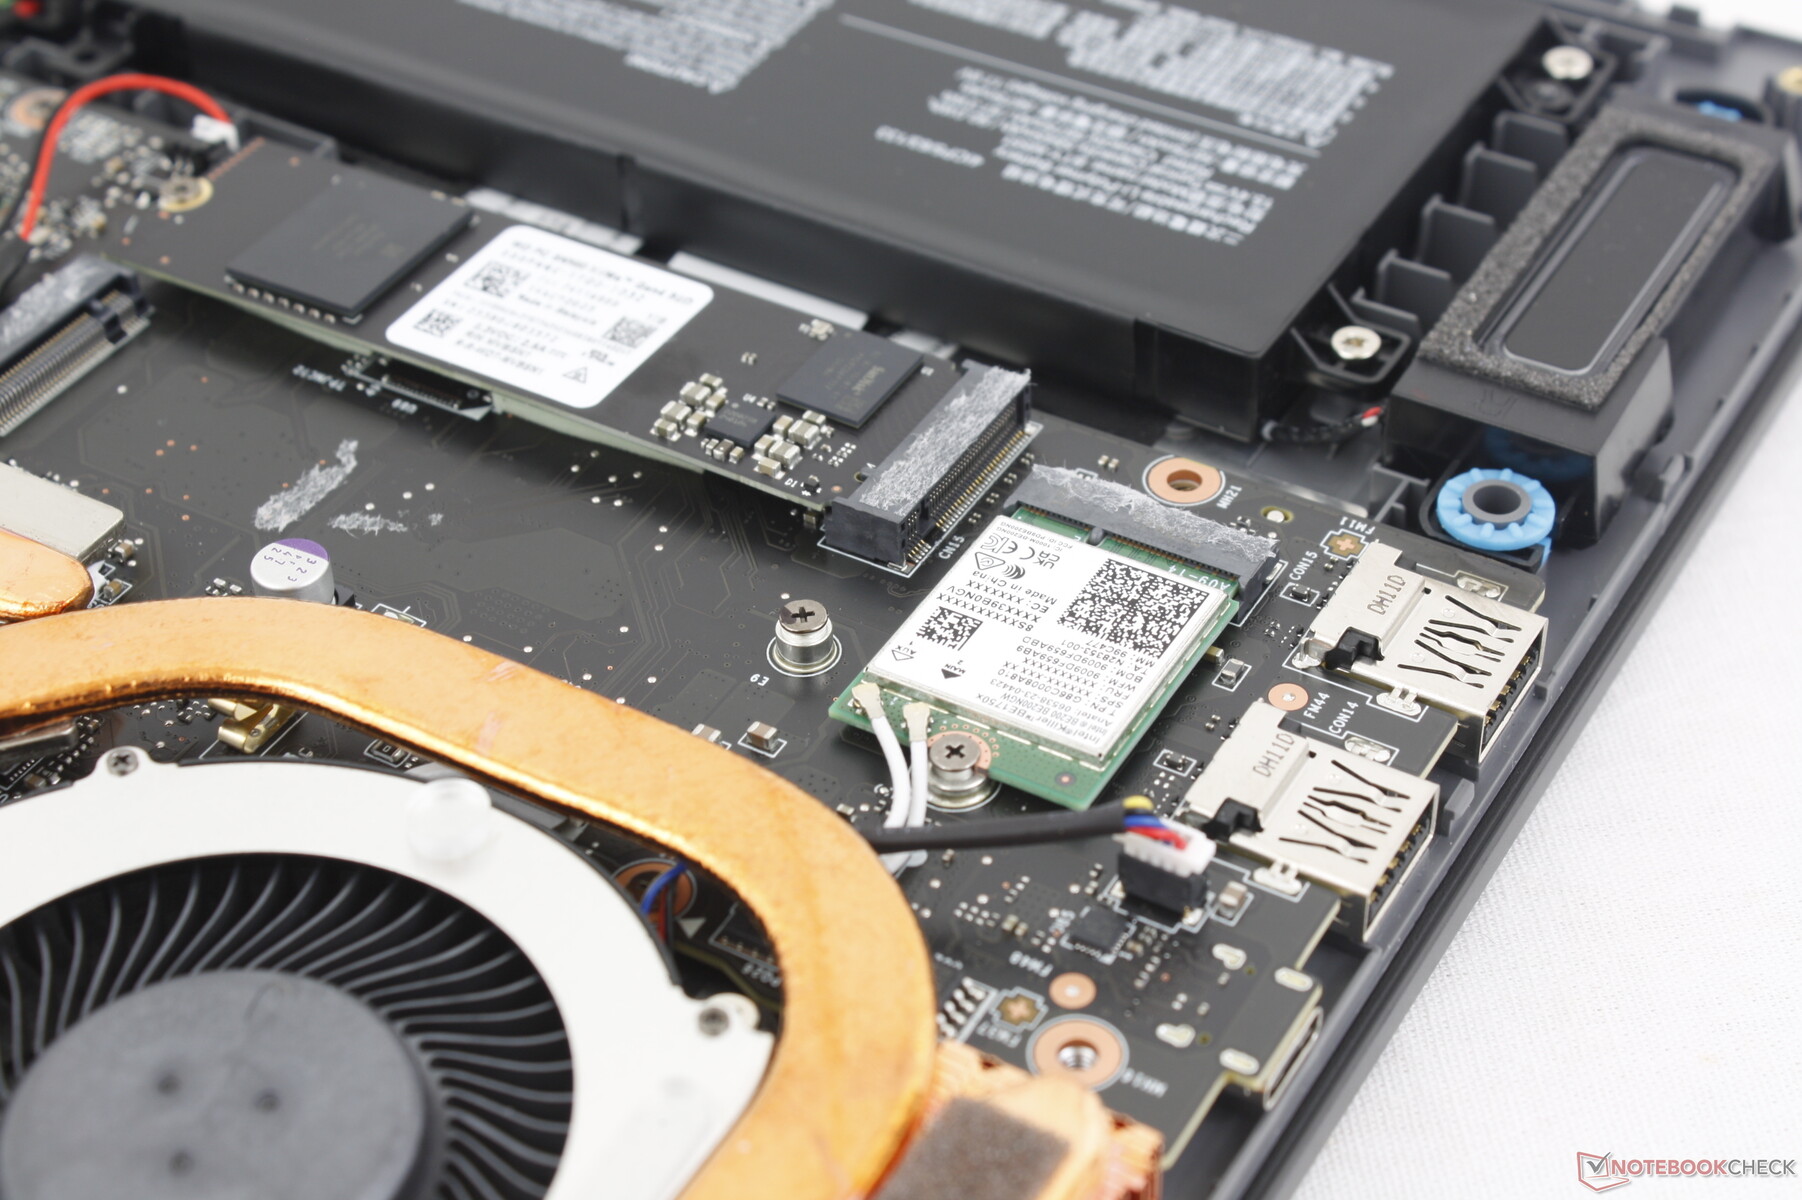
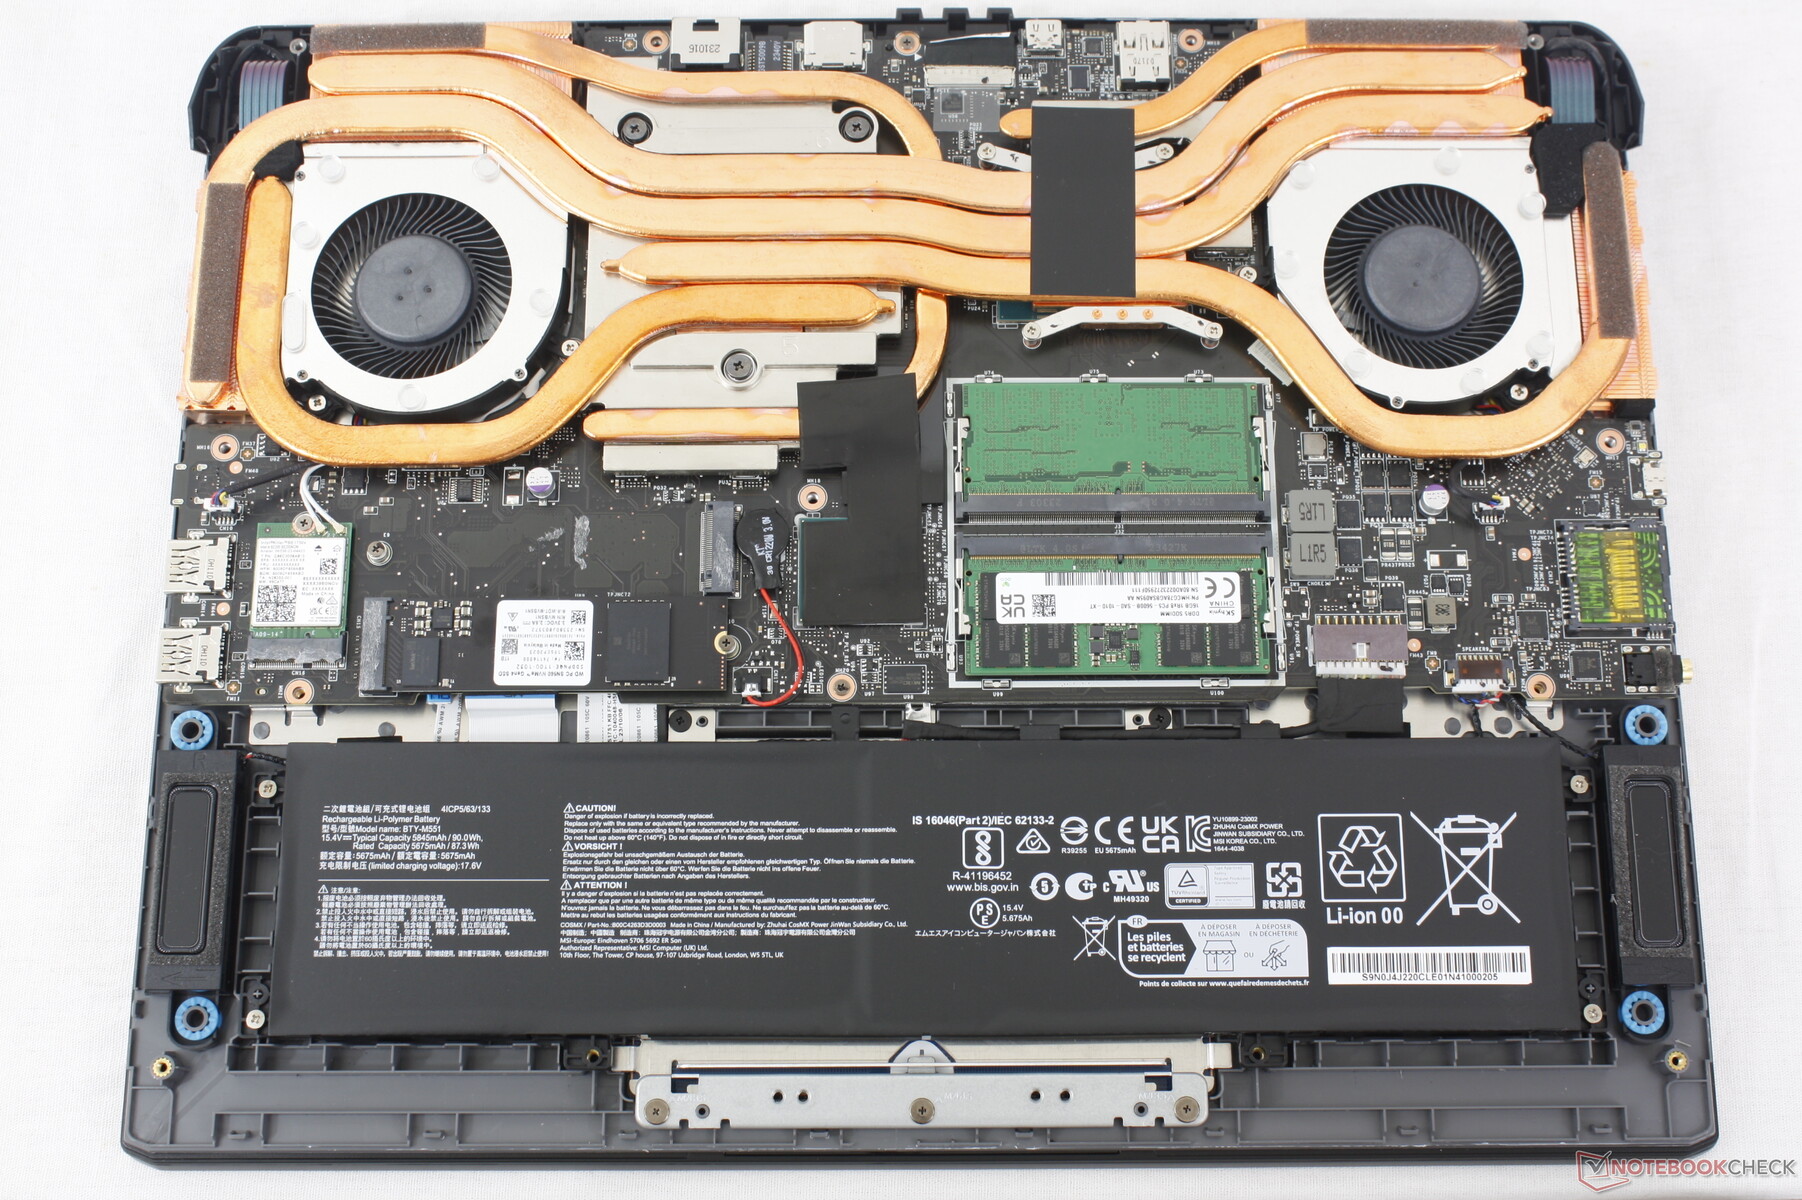
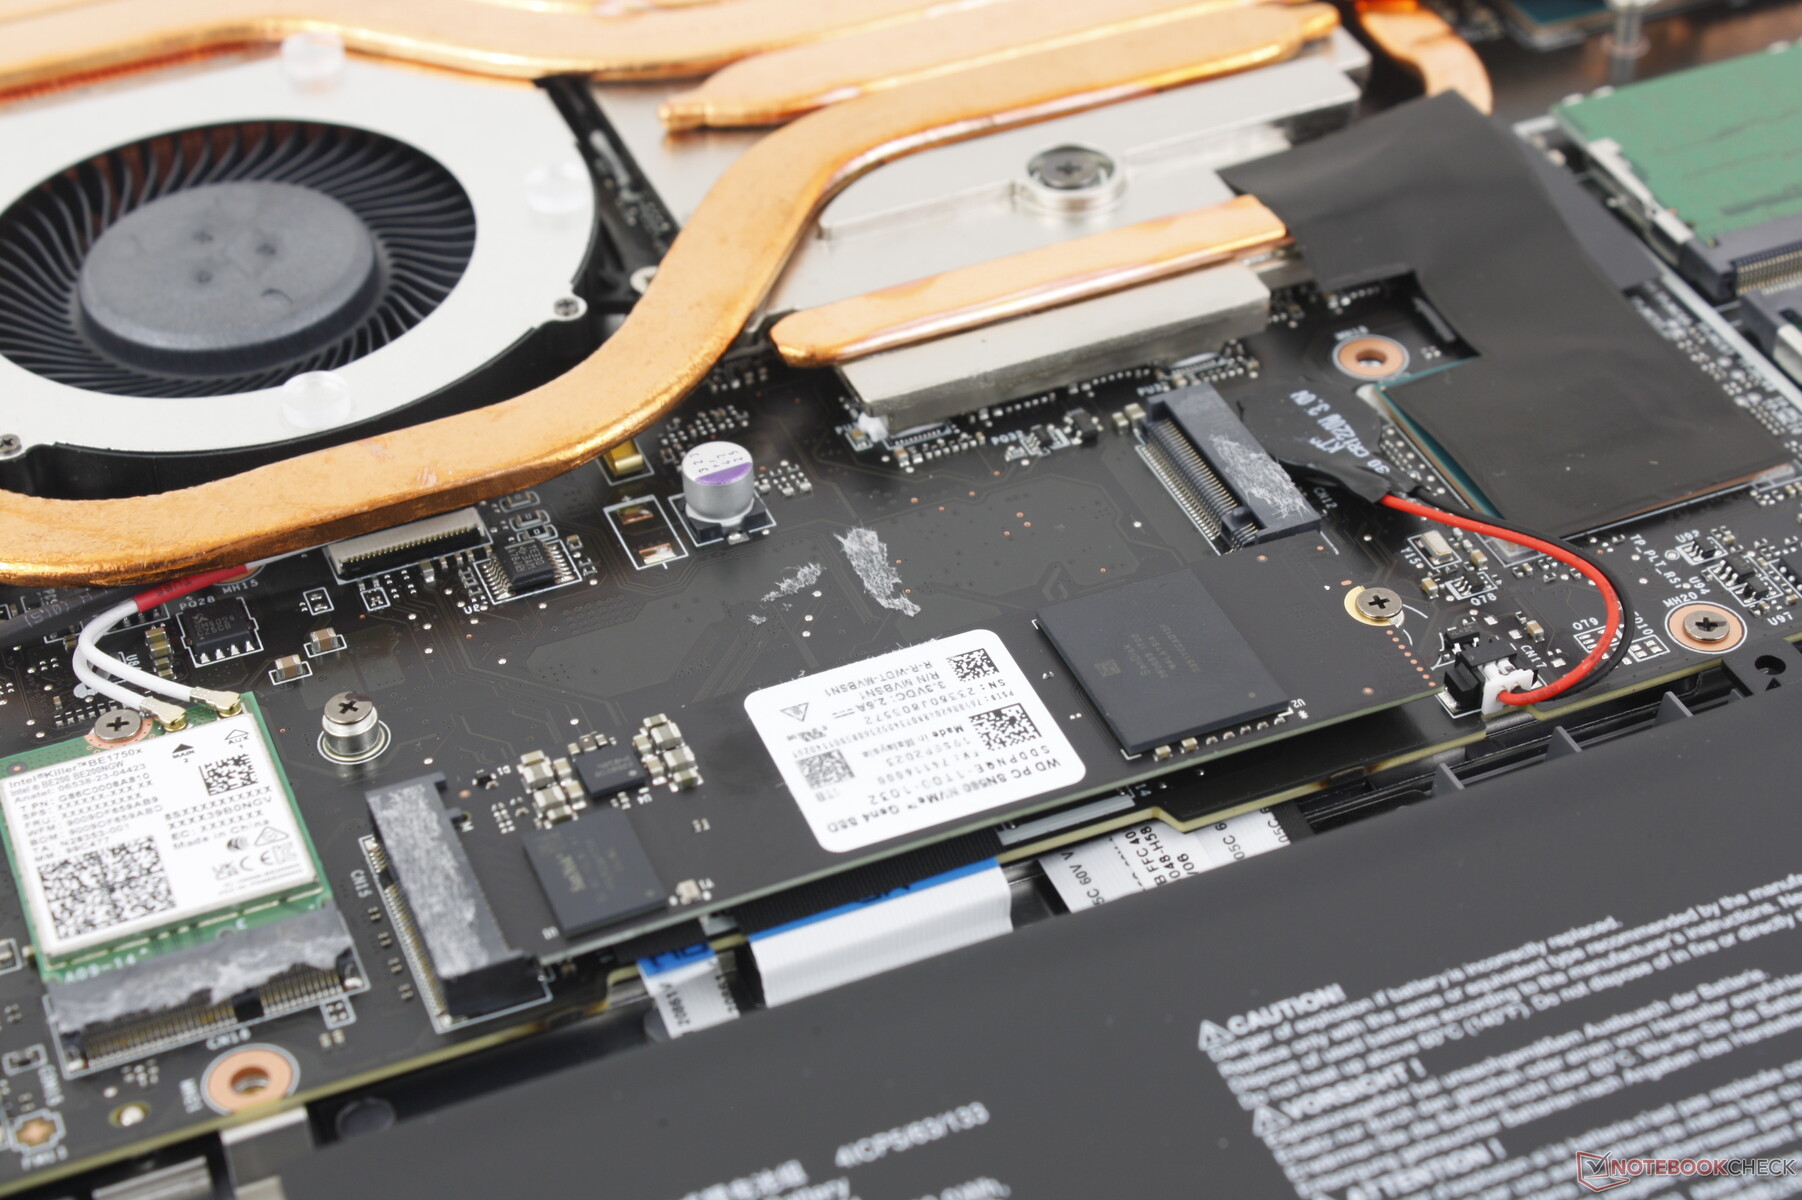
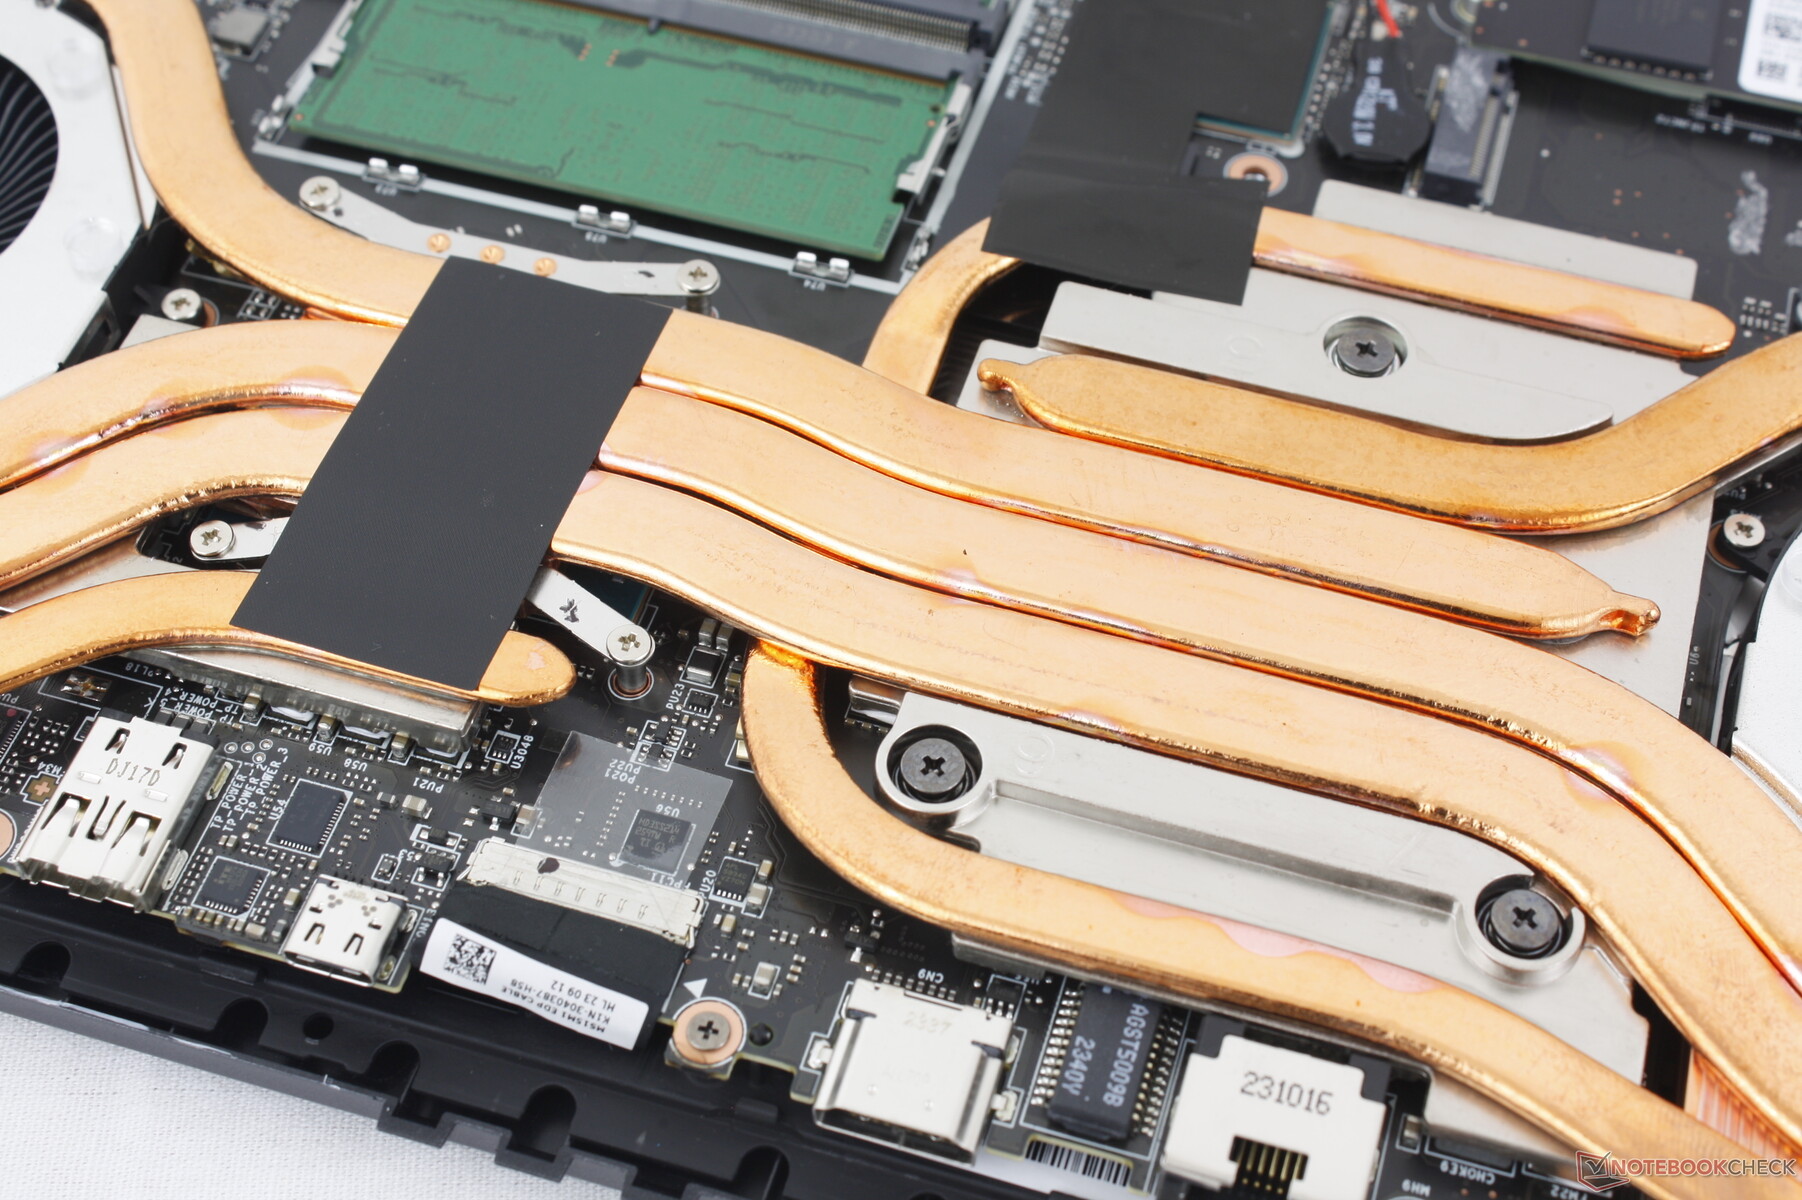
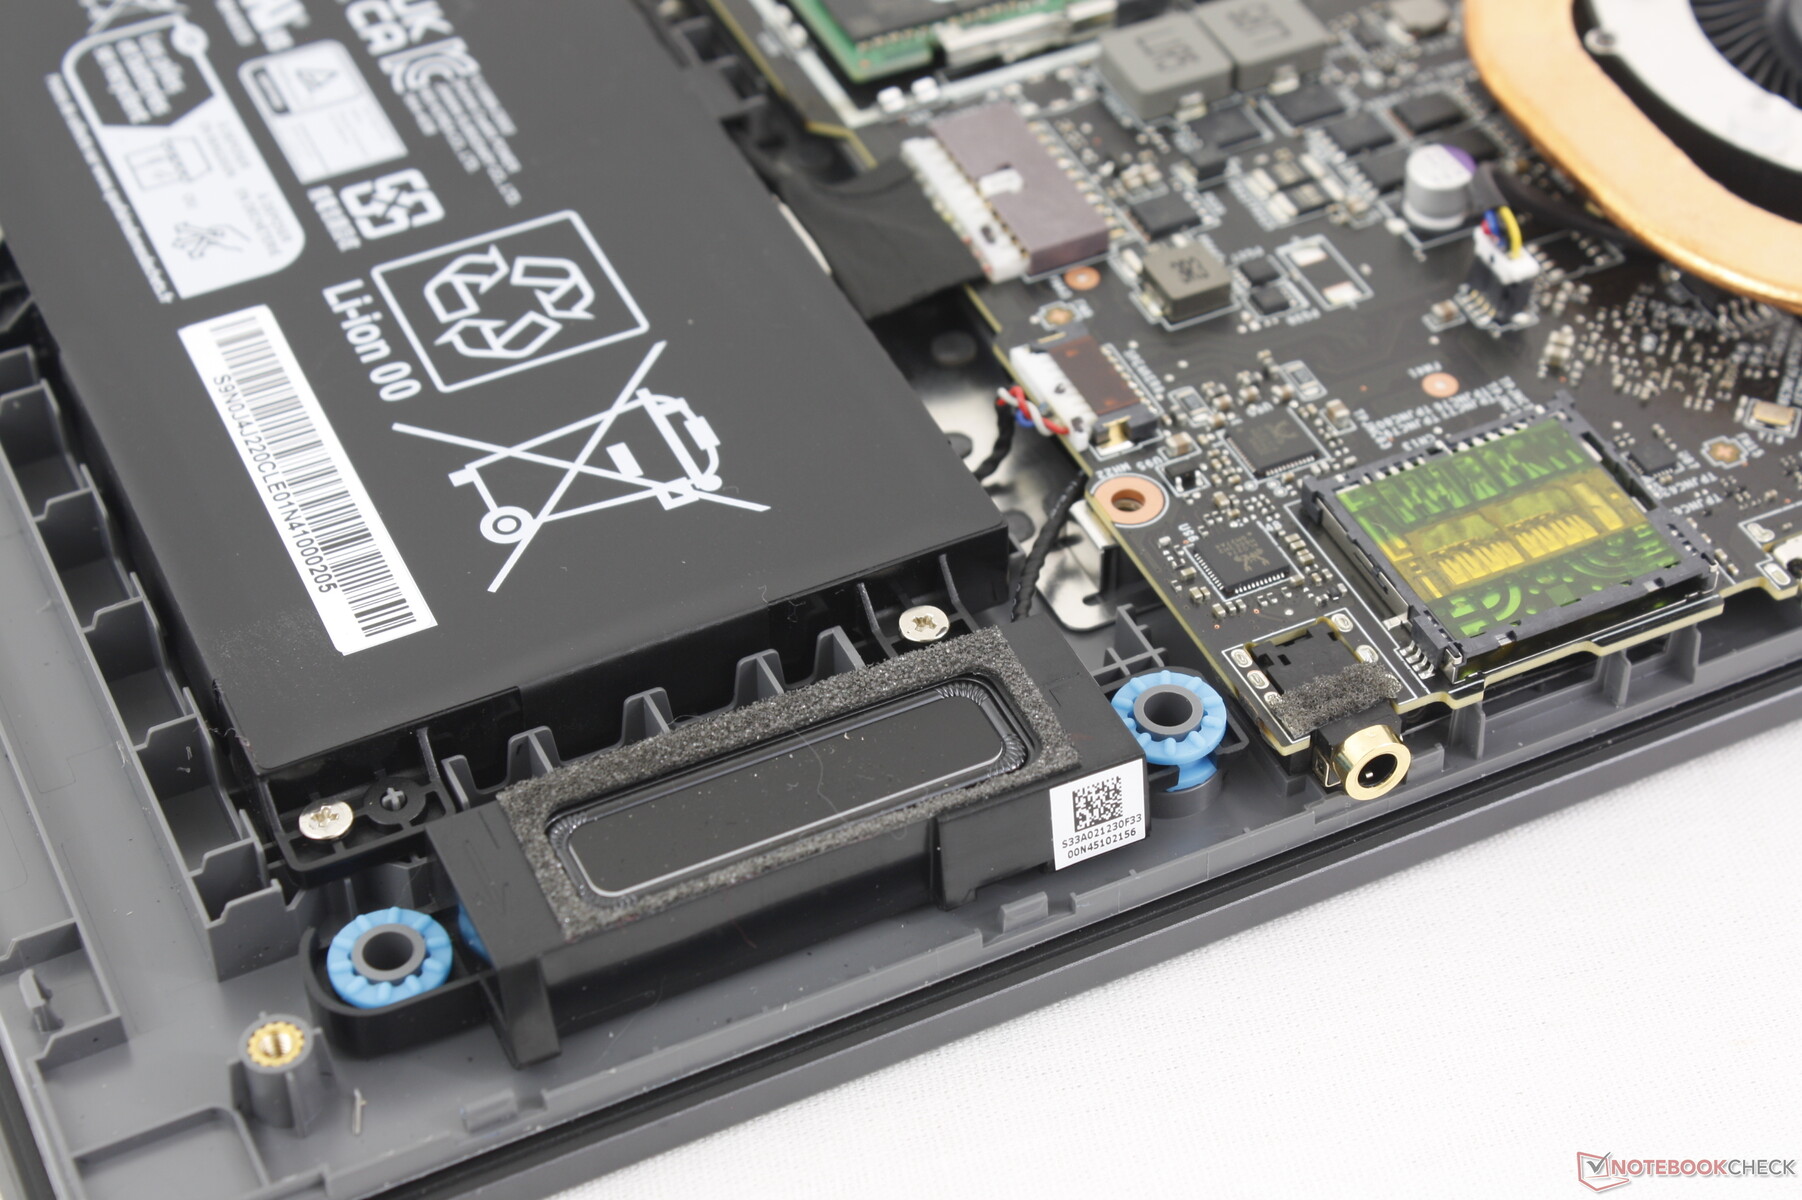
Underhåll
Bottenpanelen fästs med 13 stjärnskruvar. Tyvärr kan det vara svårt att ta bort panelen eftersom kanterna och hörnen har betydande böjningar som gör processen mer besvärlig än den behöver vara. I jämförelse är bottenpanelen på Razer Blade 16 mycket plattare och har färre spärrar för enklare borttagning. En platt kant rekommenderas vid service av Vector 16 HX.
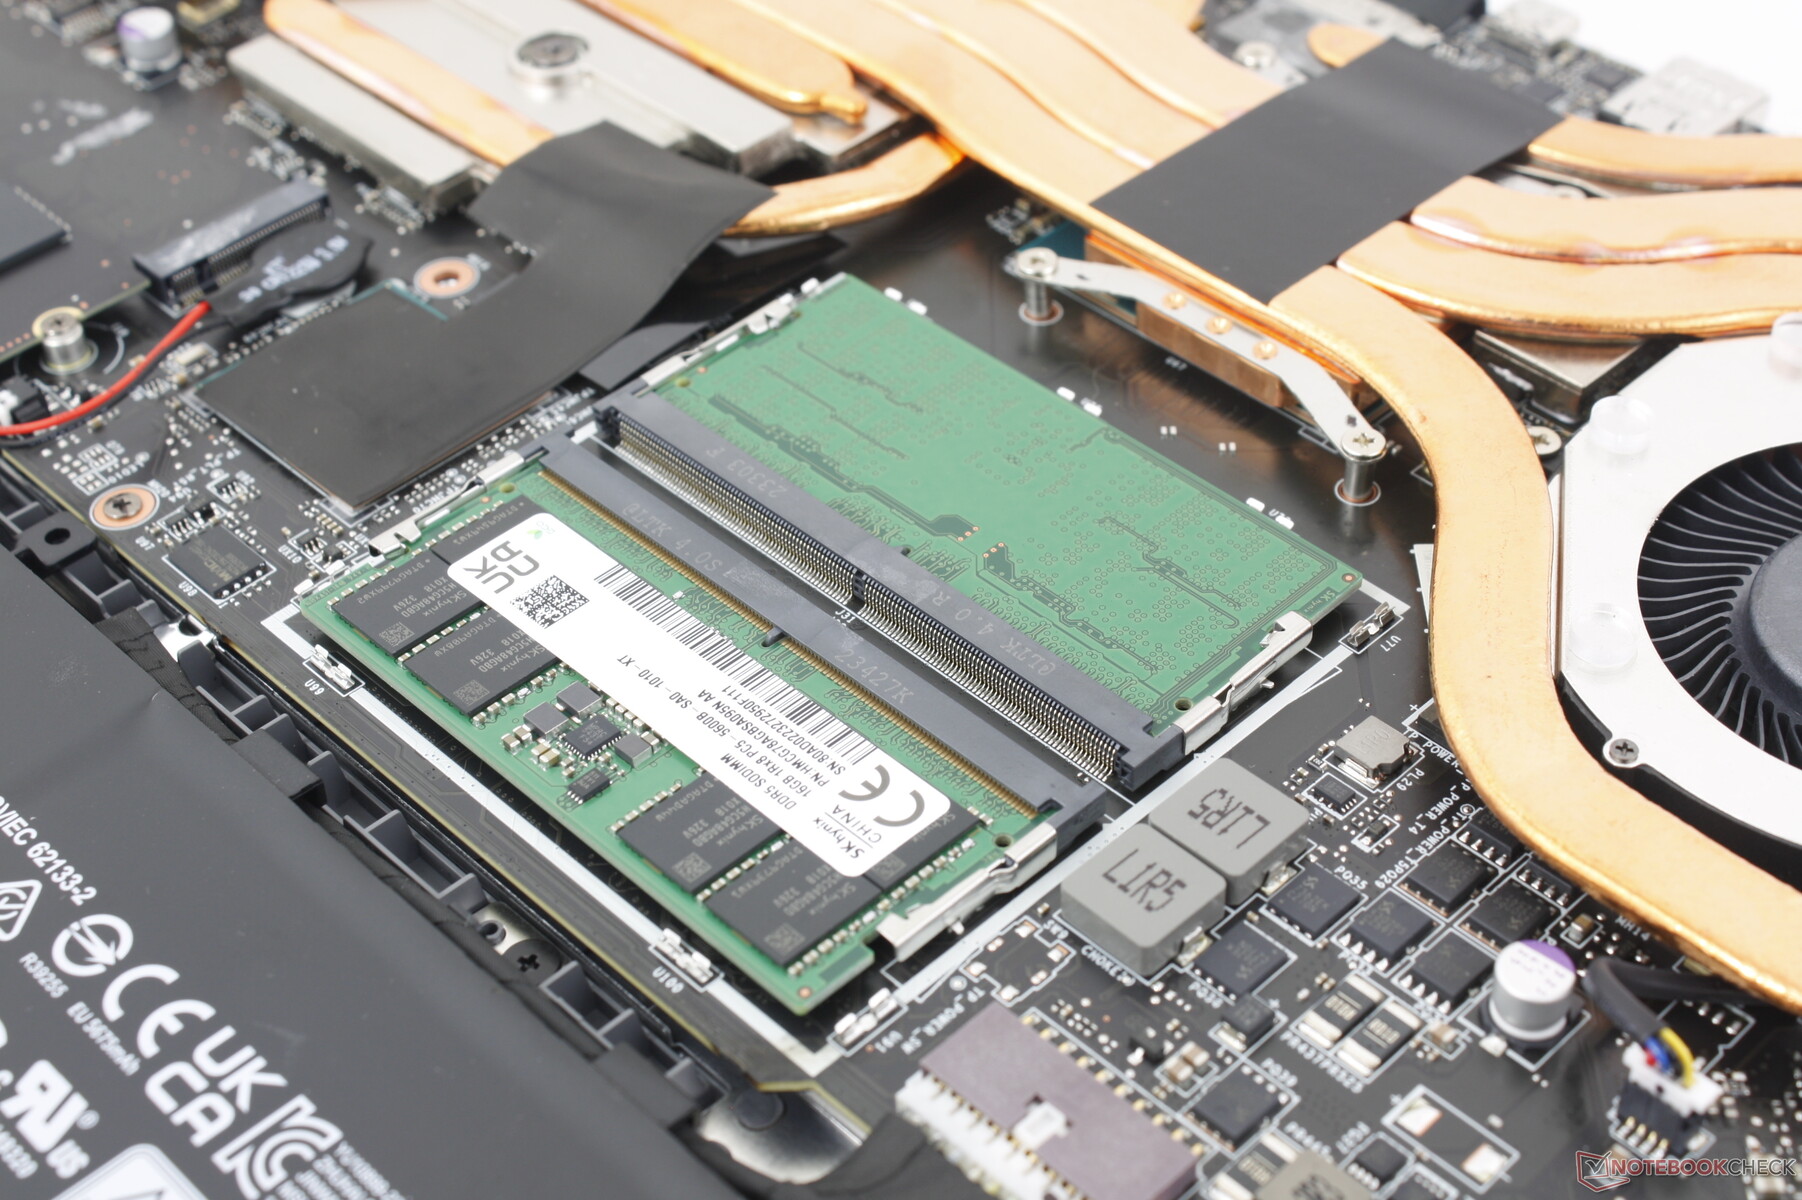
Väl på insidan har användare tillgång till 2x M.2-lagringsfack, 2x SODIMM-kortplatser, batteri och WLAN-modul precis som på den äldre Vector GP66-designen.
Tillbehör och garanti
Det finns inget extra i förpackningen förutom nätadapter och pappersarbete. Den vanliga ettåriga begränsade tillverkargarantin gäller vid köp i USA.
Inmatningsenheter - enkla och funktionella
Tangentbord
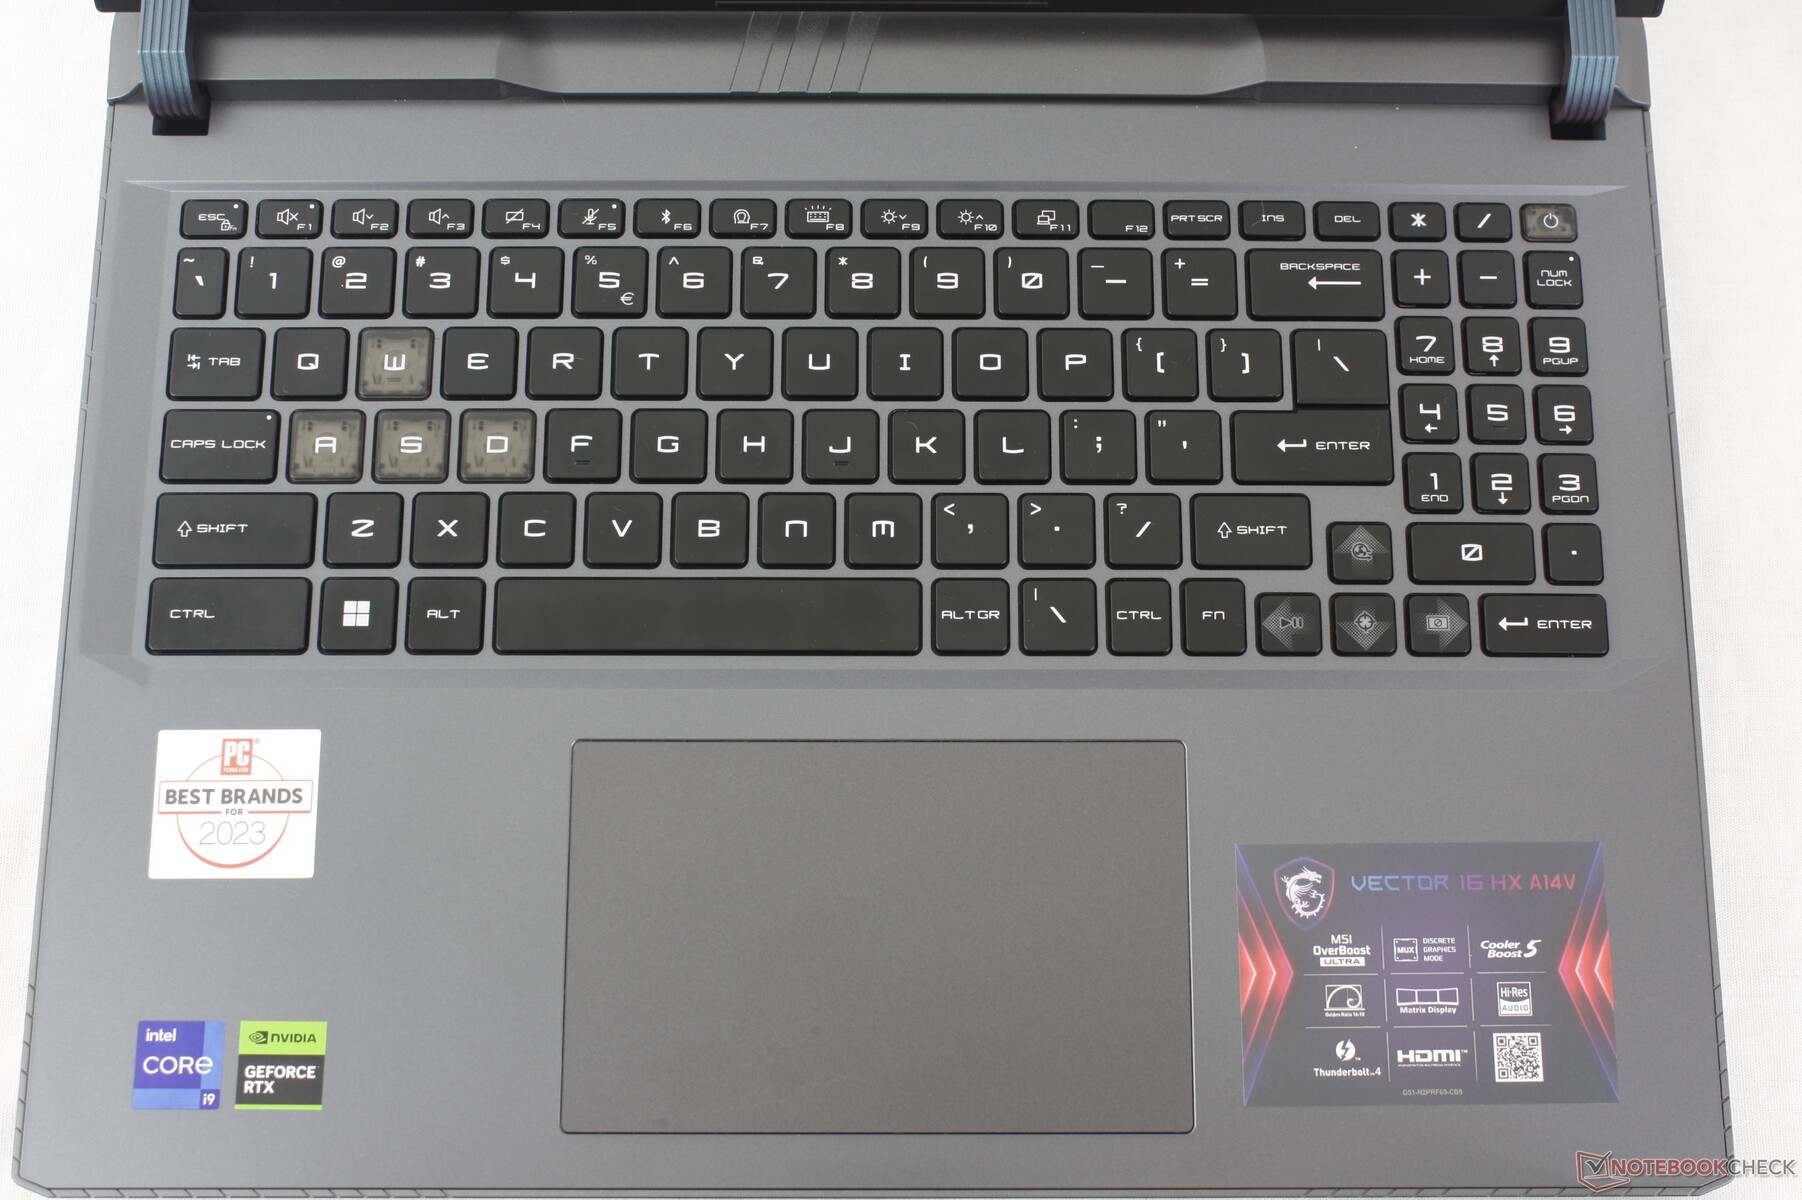
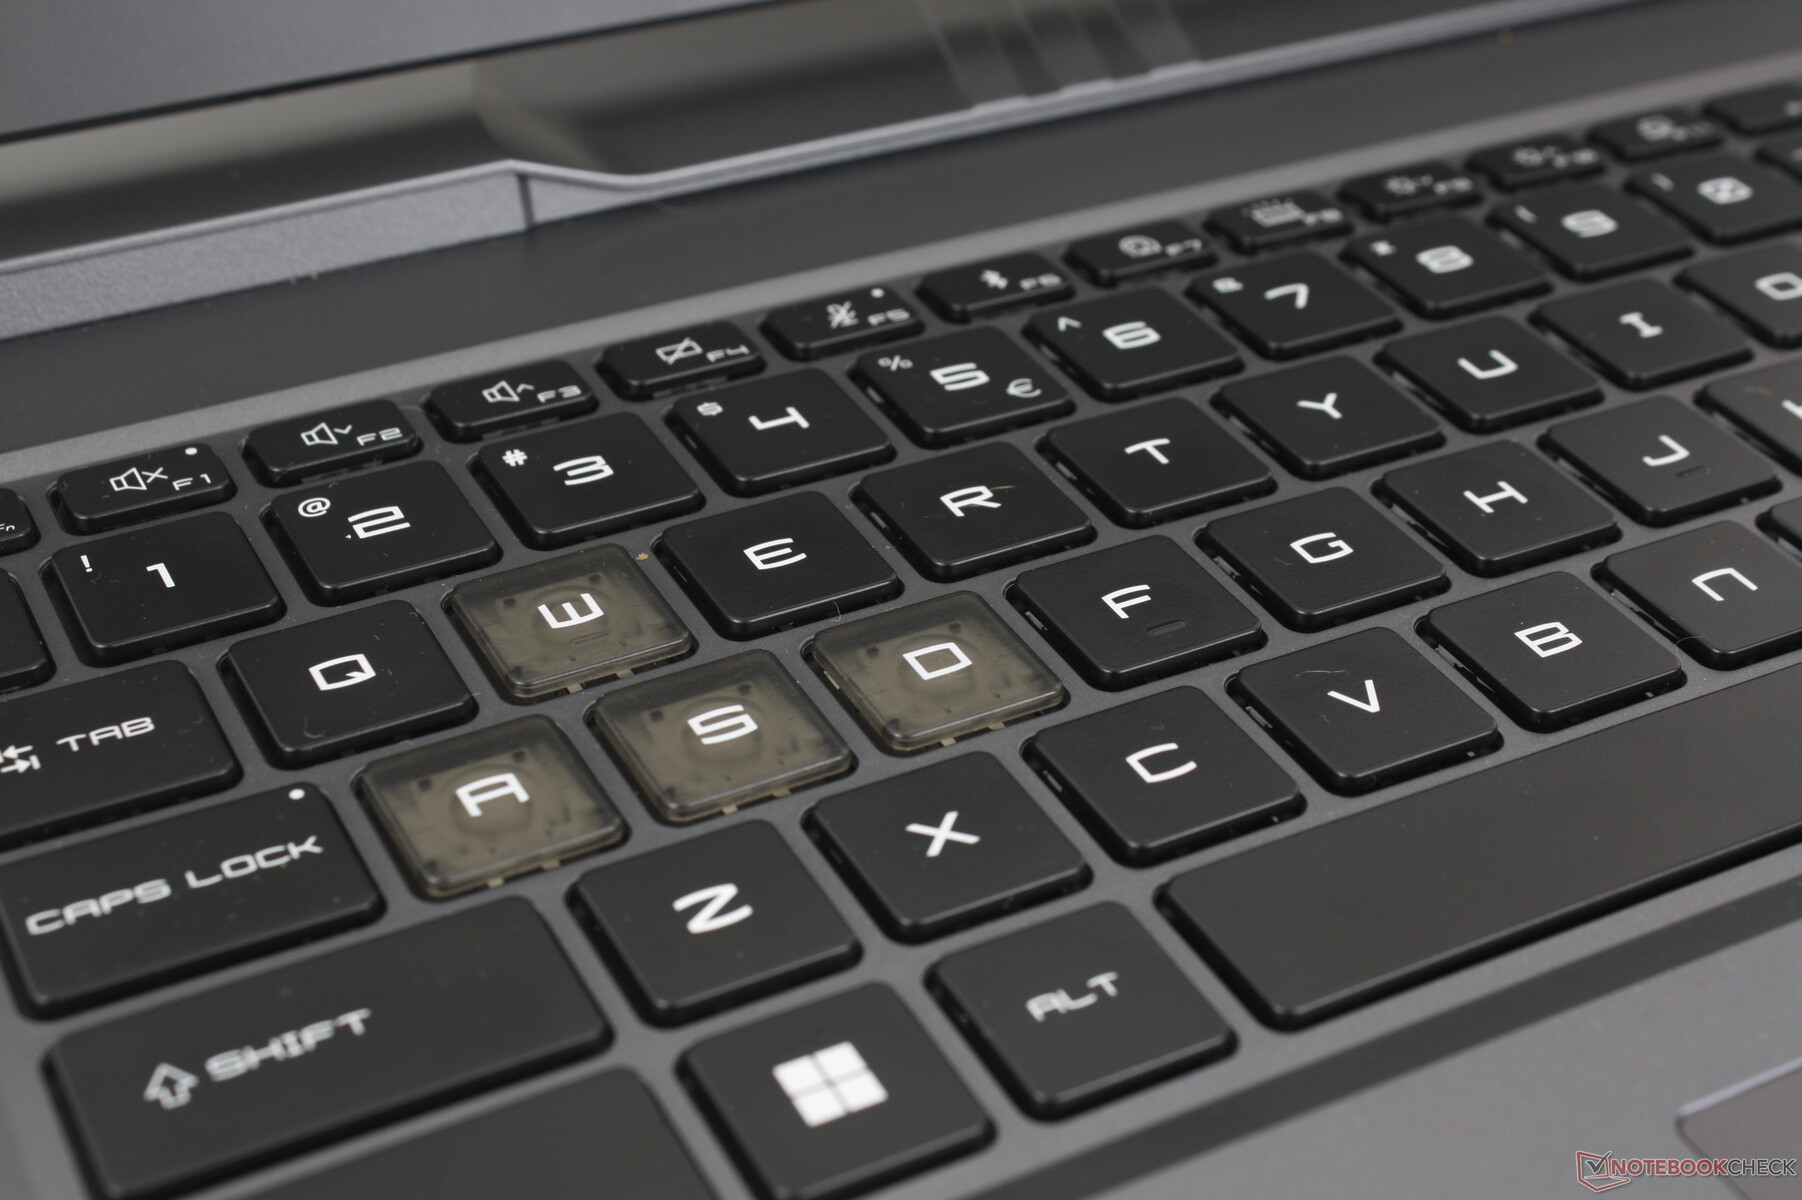
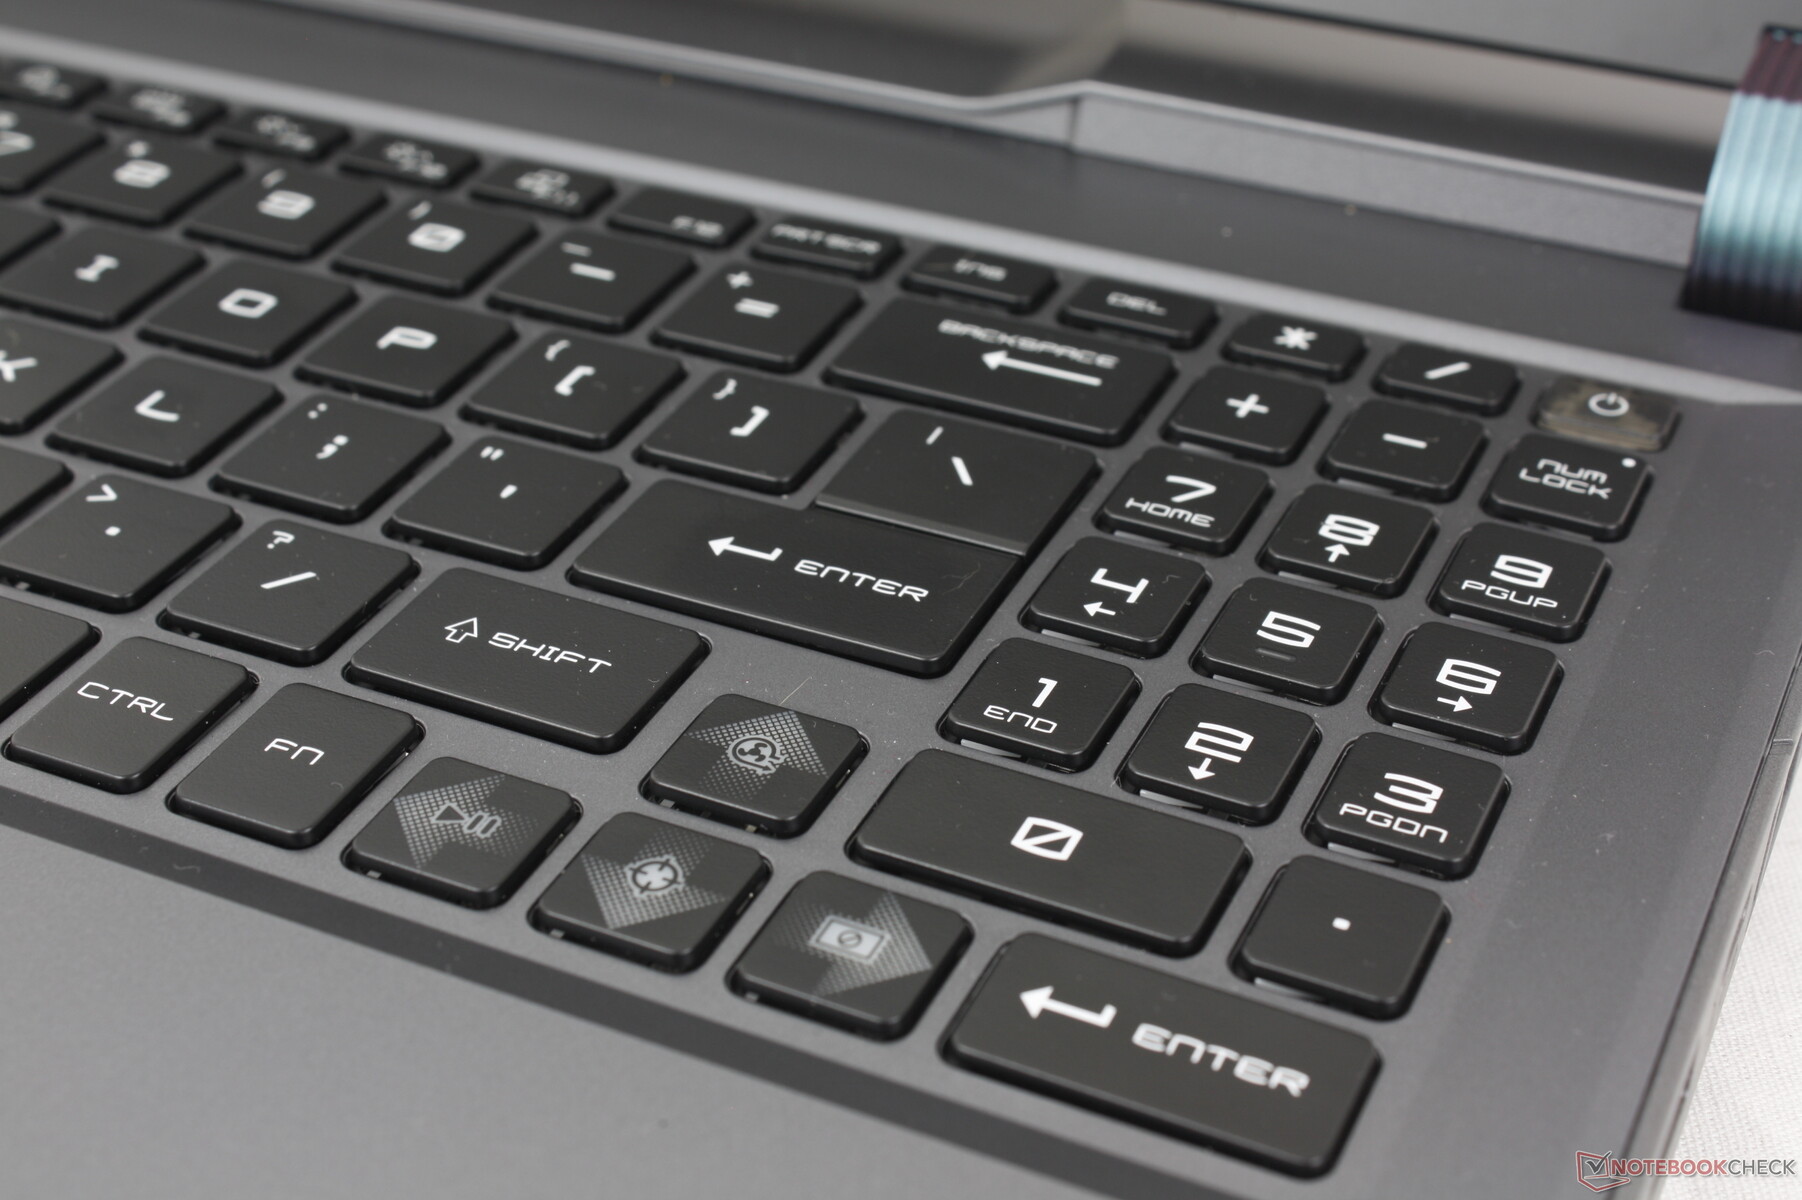
MSI har förnyat tangentbordslayouten jämfört med den äldre Vector GP66 design. De besvärliga Fn/Ctrl-tangenterna på GP66 är nu ordentligt separerade och det finns också en ny numpad medan många andra bärbara speldatorer vanligtvis utelämnar numpad helt och hållet. Tyvärr är piltangenterna mindre än tidigare medan de smala numpad-tangenterna inte är särskilt bekväma att använda. Deras implementering känns därför som en eftertanke jämfört med de annars större och mer bekväma QWERTY-tangenterna.
RGB-belysning per tangent är standard för att lysa upp alla tangenter och symboler.
Pekplatta
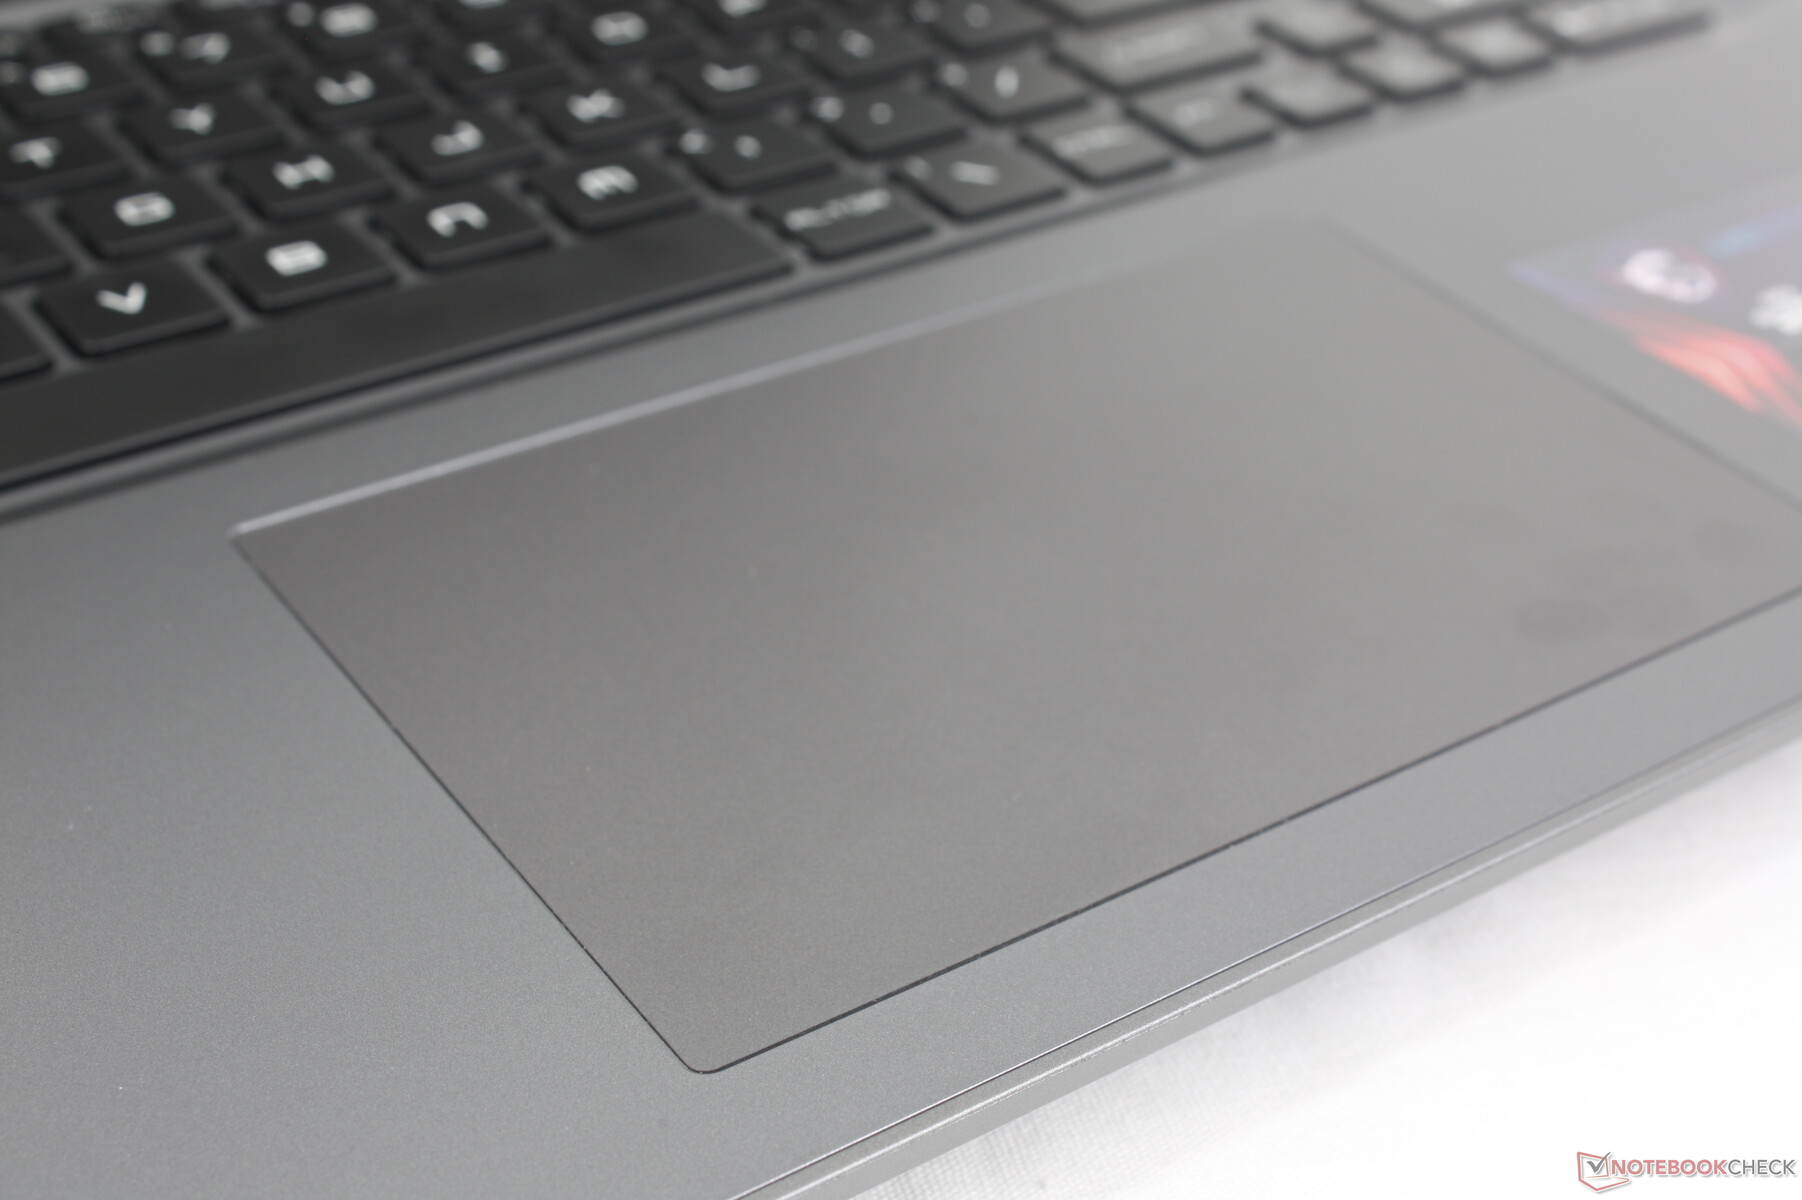
Med cirka 13,2 x 8,2 cm är klickplattan rymligare än på Dell G16 7620 (10,5 x 6 cm) och äldre Vector GP66 (10,5 x 6,5 cm). Dragkraften är mycket jämn med endast mycket liten stickning när man glider i långsammare hastigheter. Feedback vid nedtryckning är också ganska fast trots det relativt tysta klappret. Clickpads är vanligtvis undermåliga på bärbara speldatorer, men vi är glada att se en rejäl halvdan en på Vector 16 HX.
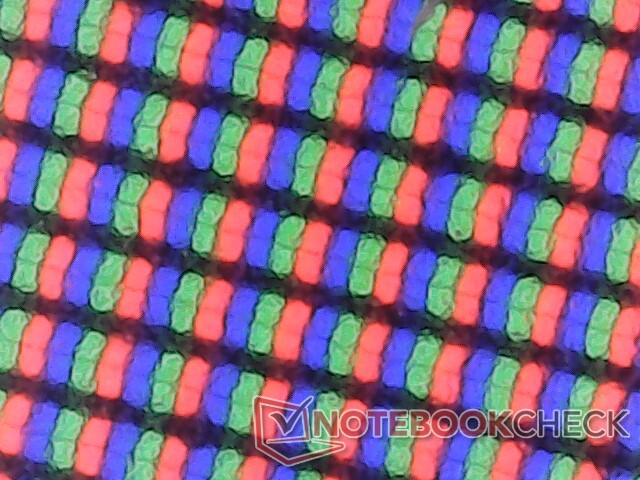
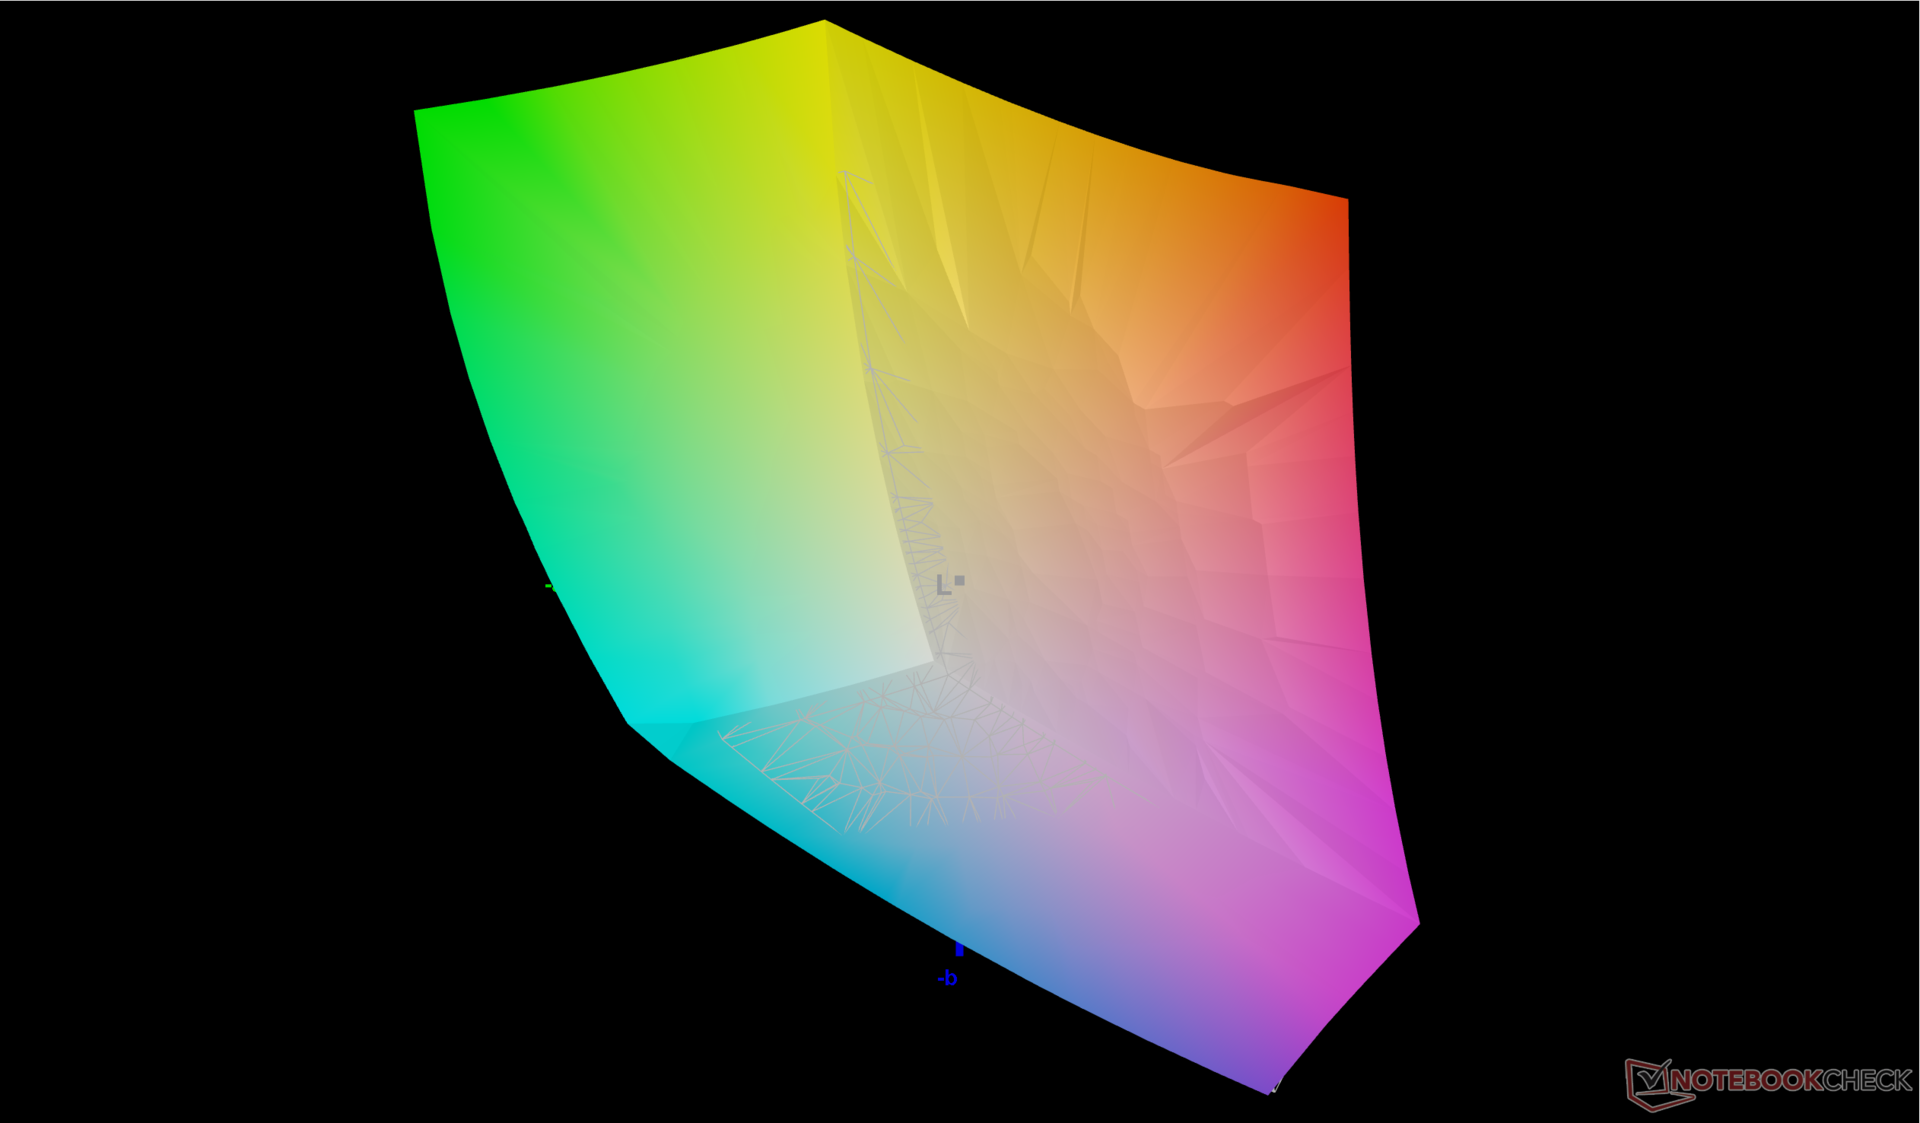
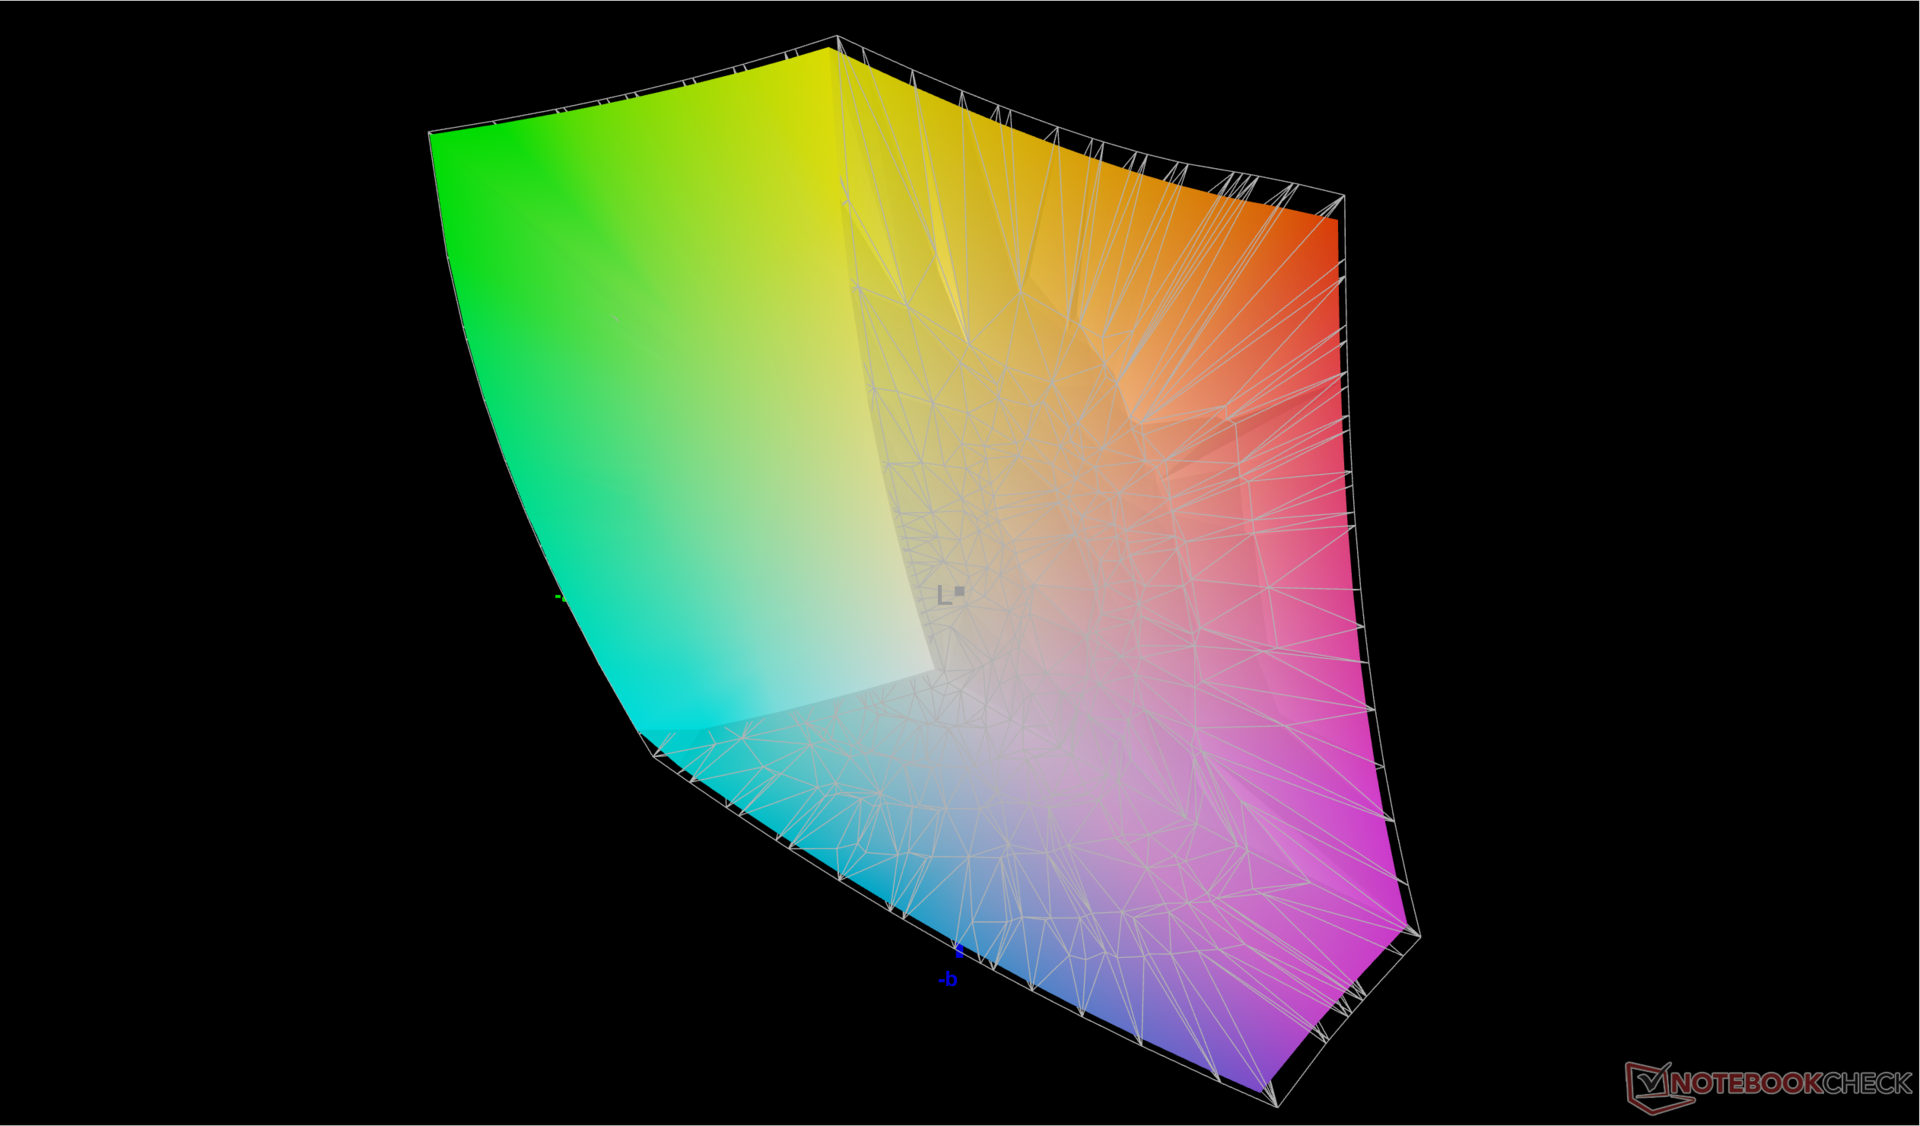
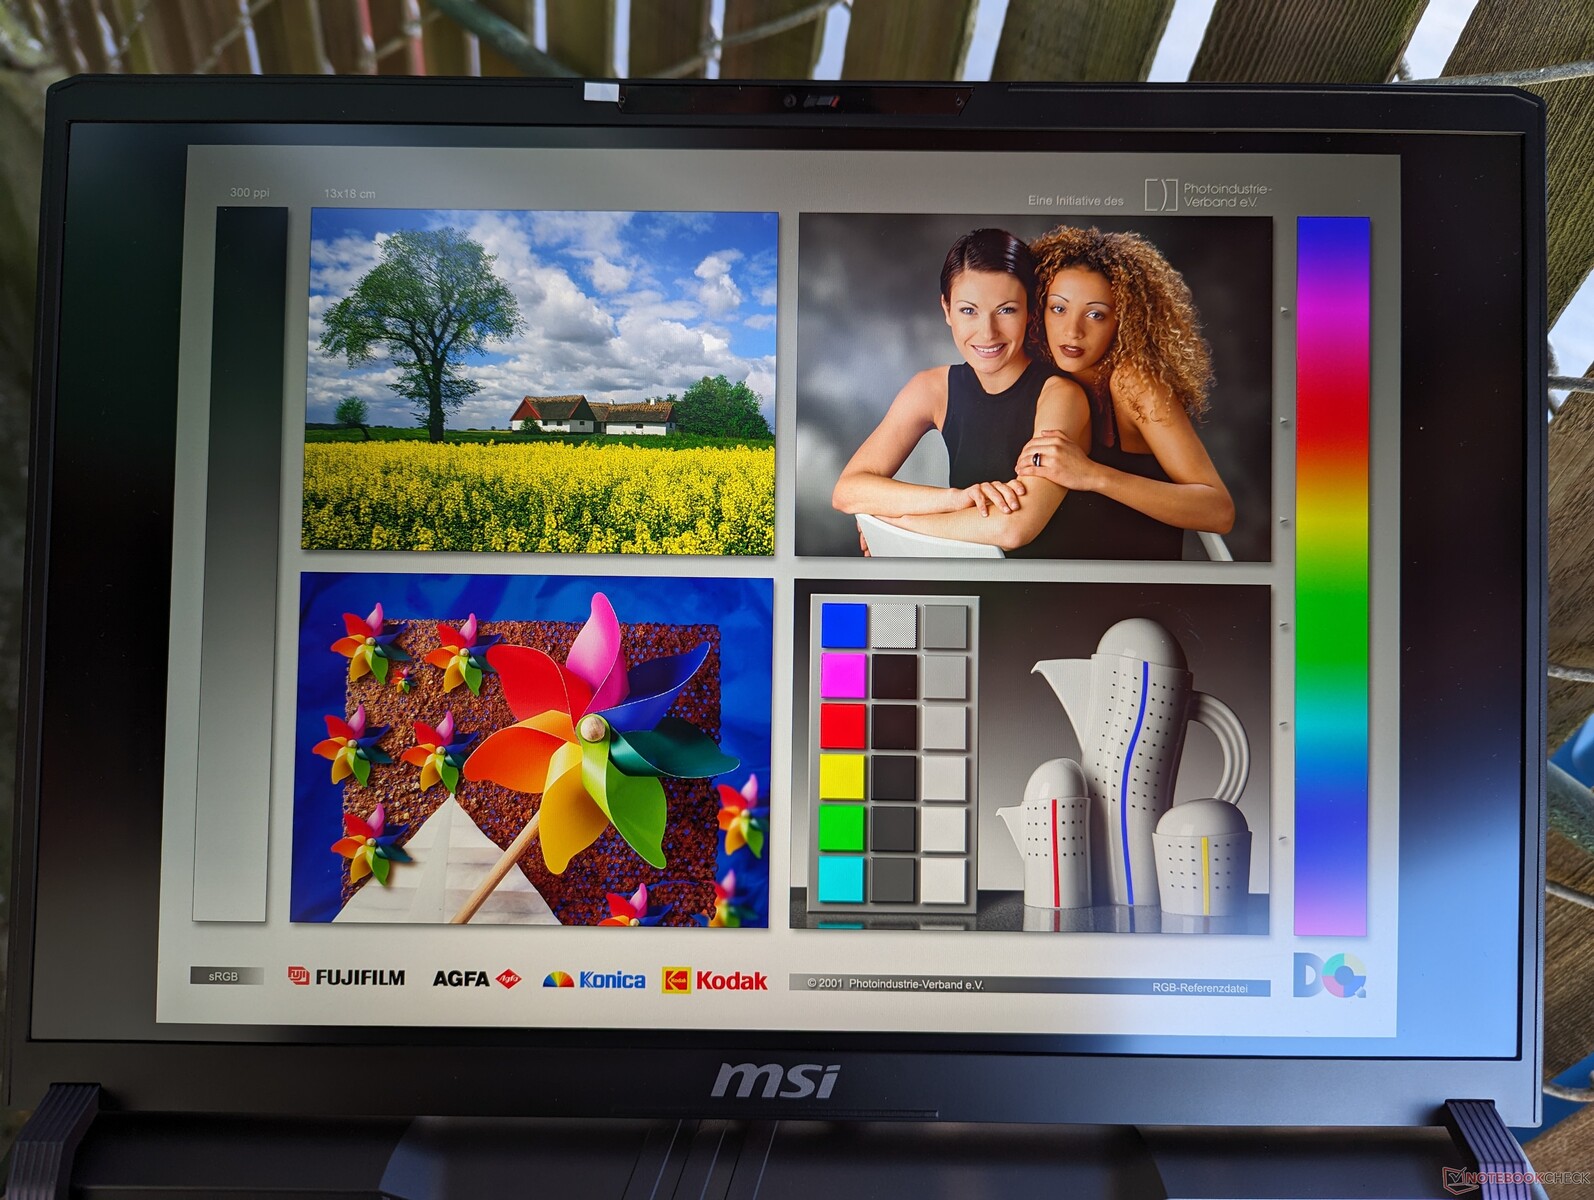
Display - Alla IPS utan G-Sync
Detta är det första systemet i vår databas som levereras med den avancerade Chi Mei N160GME-GTB-panelen. Dess egenskaper är mycket lika NE160QDM-NZ3 som finns på den senaste Lenovo Legion 5 16 men med en anmärkningsvärd förbättring: full DCI-P3-täckning istället för endast sRGB. I övrigt kan användare förvänta sig samma snabba 240 Hz inbyggda uppdateringsfrekvens, ~1300:1 kontrastförhållande och snabba svarstider som på Lenovo-maskinen.
G-Sync saknas i alla nuvarande konfigurationer av Vector 16 HX. Uppdateringsfrekvensen är också fast på antingen 60 Hz eller 240 Hz, medan paneler med variabel uppdateringsfrekvens blir allt vanligare.
Tänk på att den billigare 1200p 144 Hz-konfigurationen sannolikt kommer att ha andra attribut än vår 1600p 240 Hz-konfiguration när det gäller ljusstyrka, färger och mer.
| |||||||||||||||||||||||||
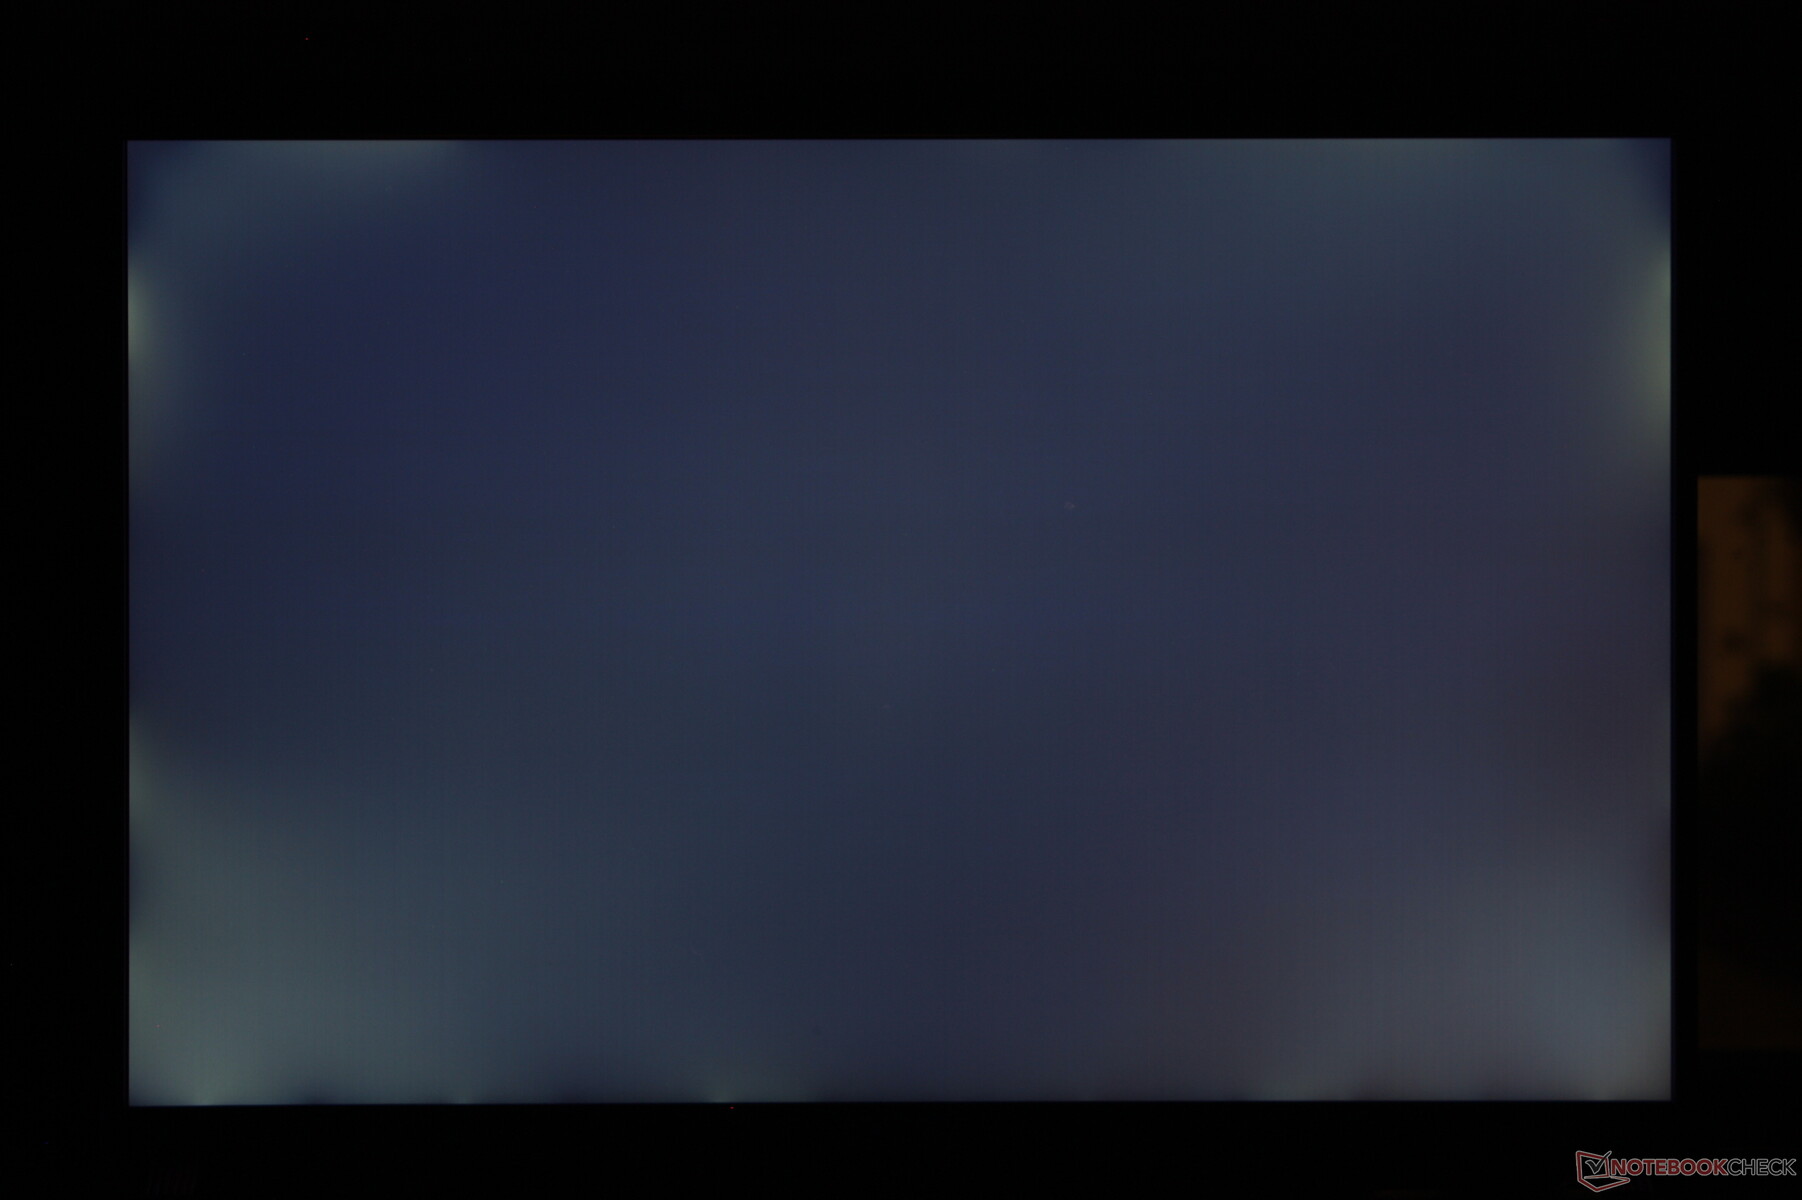
Distribution av ljusstyrkan: 83 %
Mitt på batteriet: 557.2 cd/m²
Kontrast: 1359:1 (Svärta: 0.41 cd/m²)
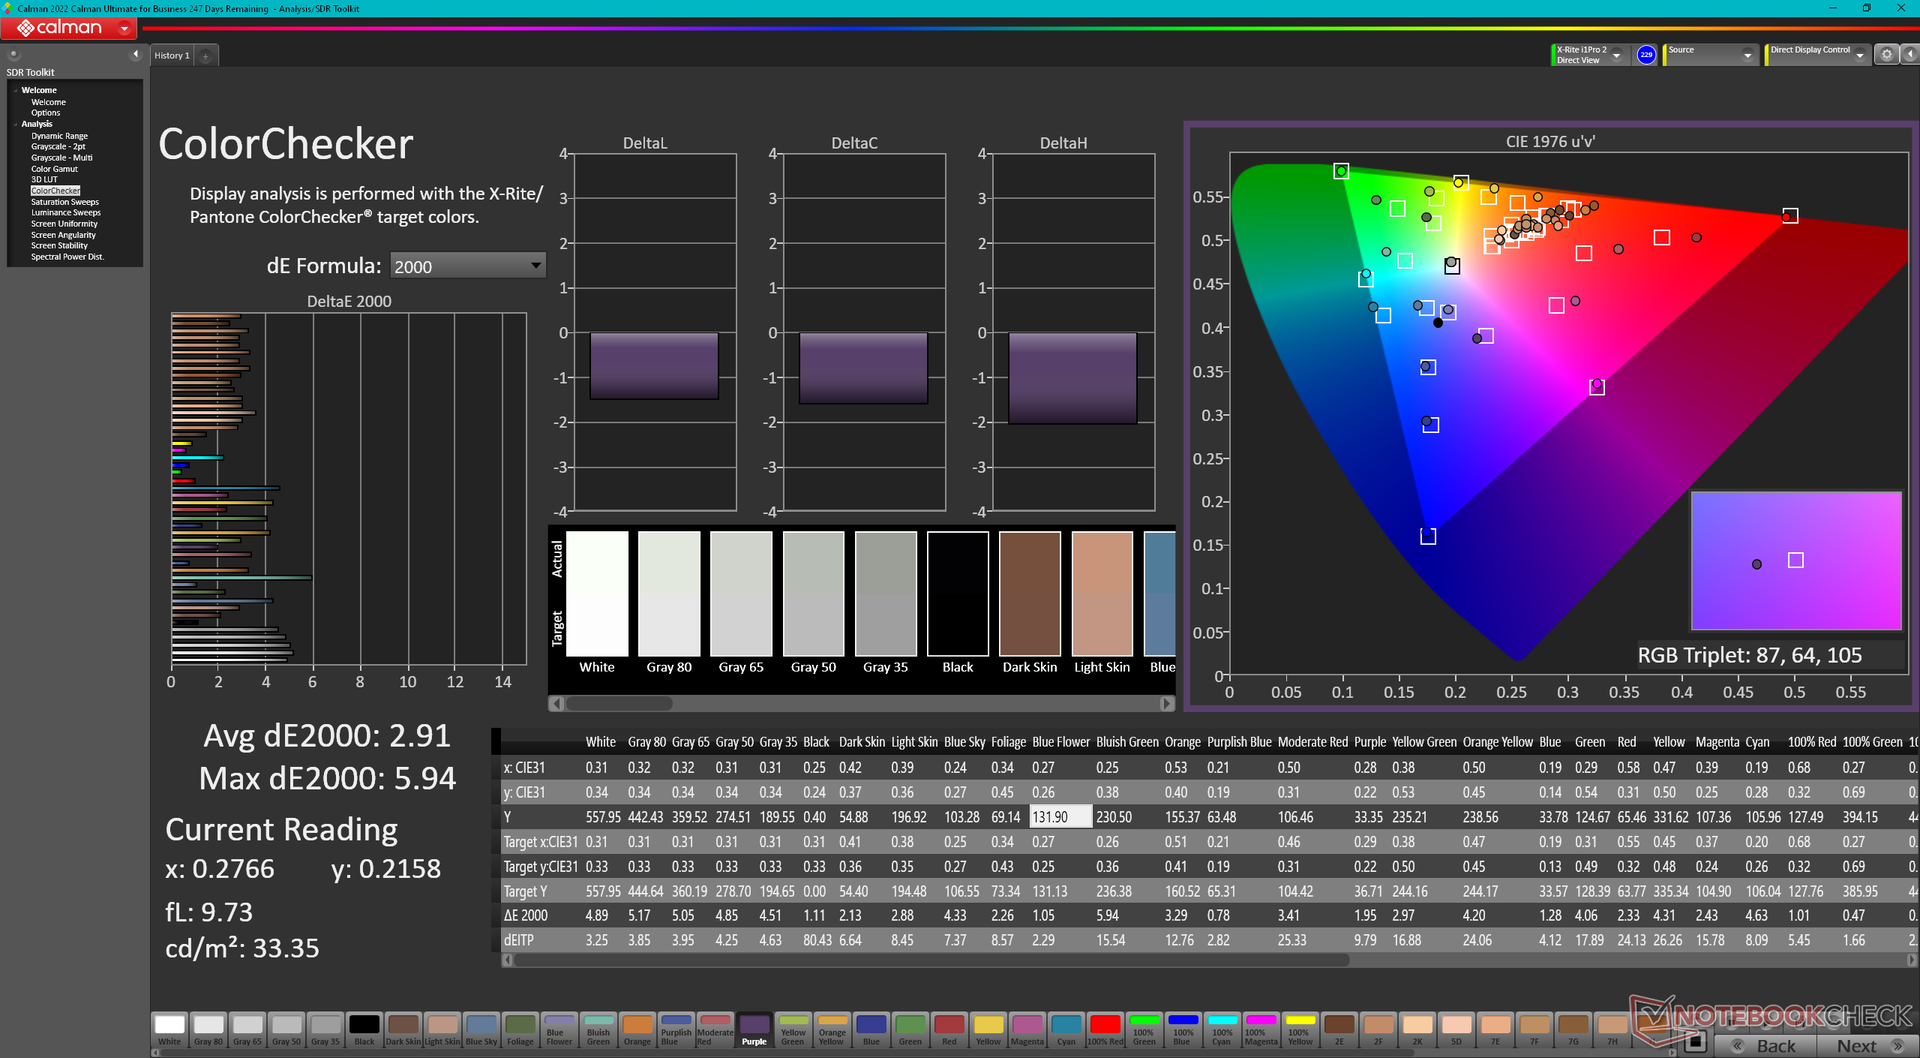
ΔE ColorChecker Calman: 2.91 | ∀{0.5-29.43 Ø4.72}
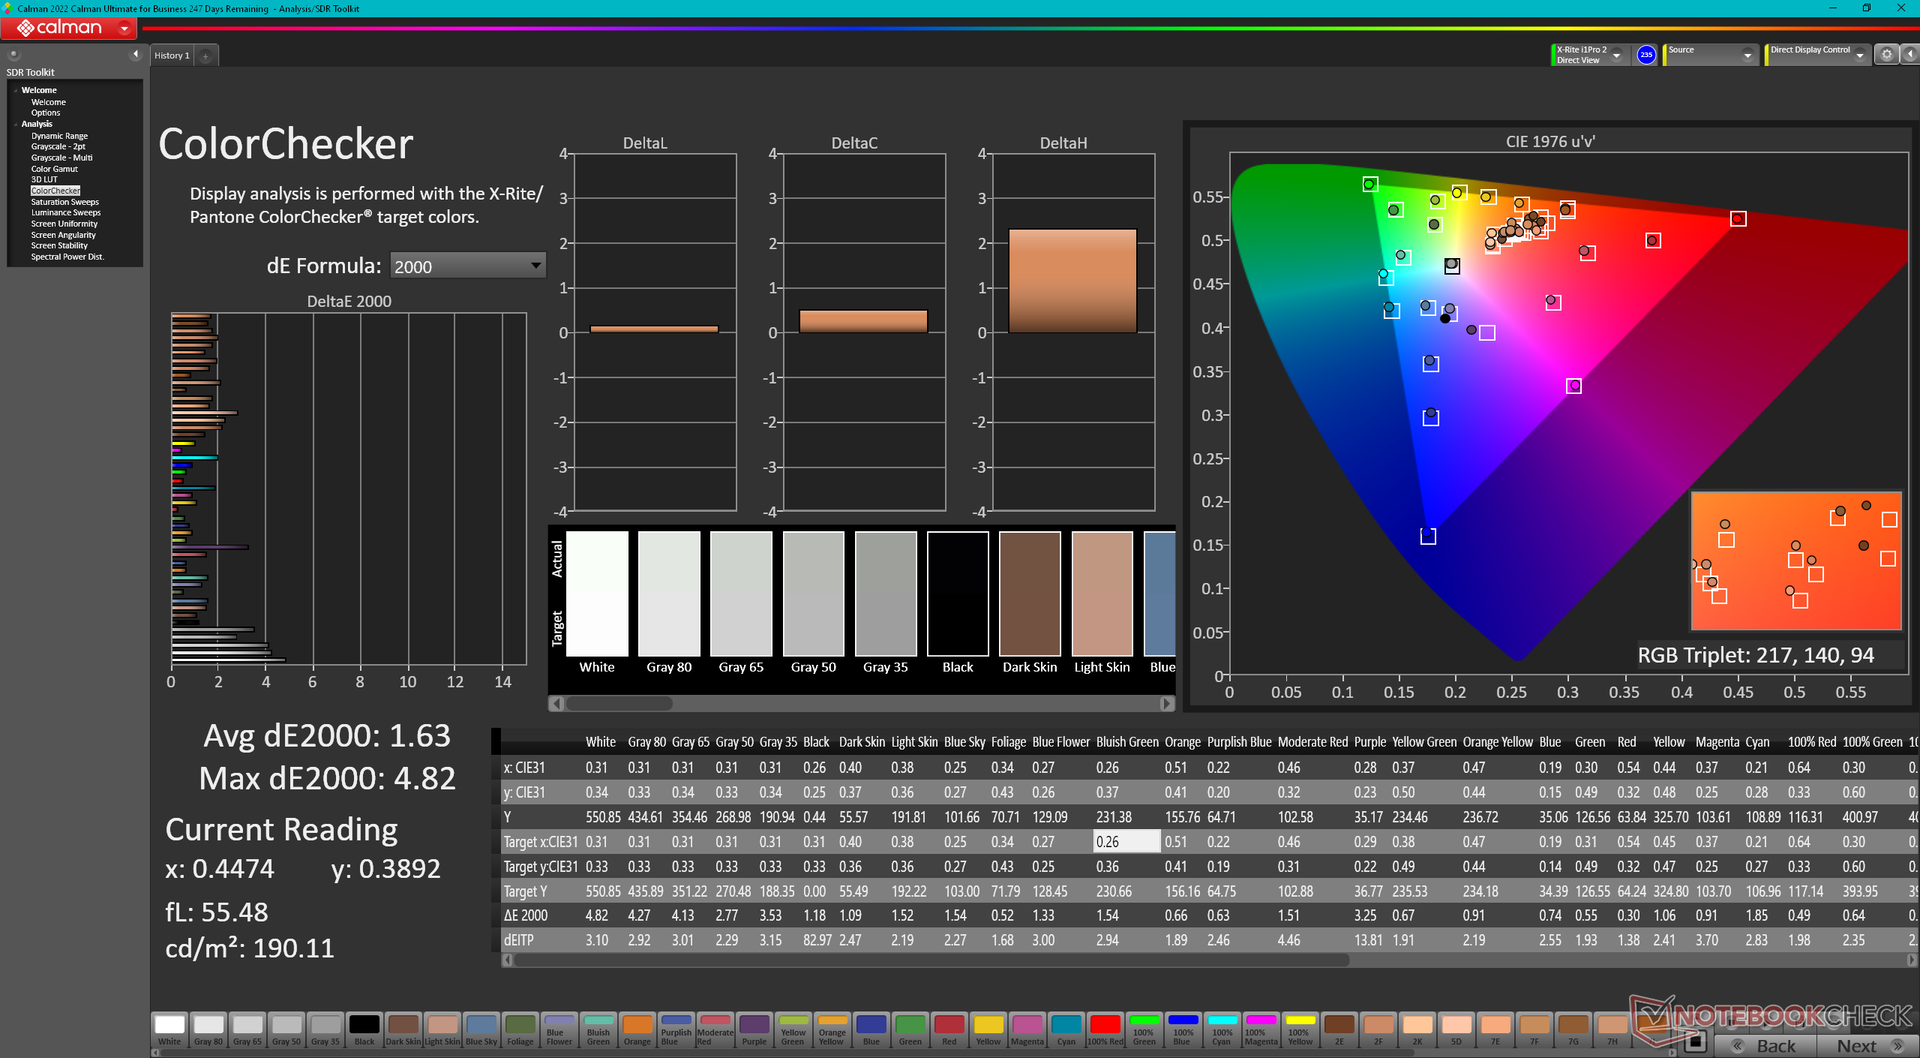
calibrated: 1.63
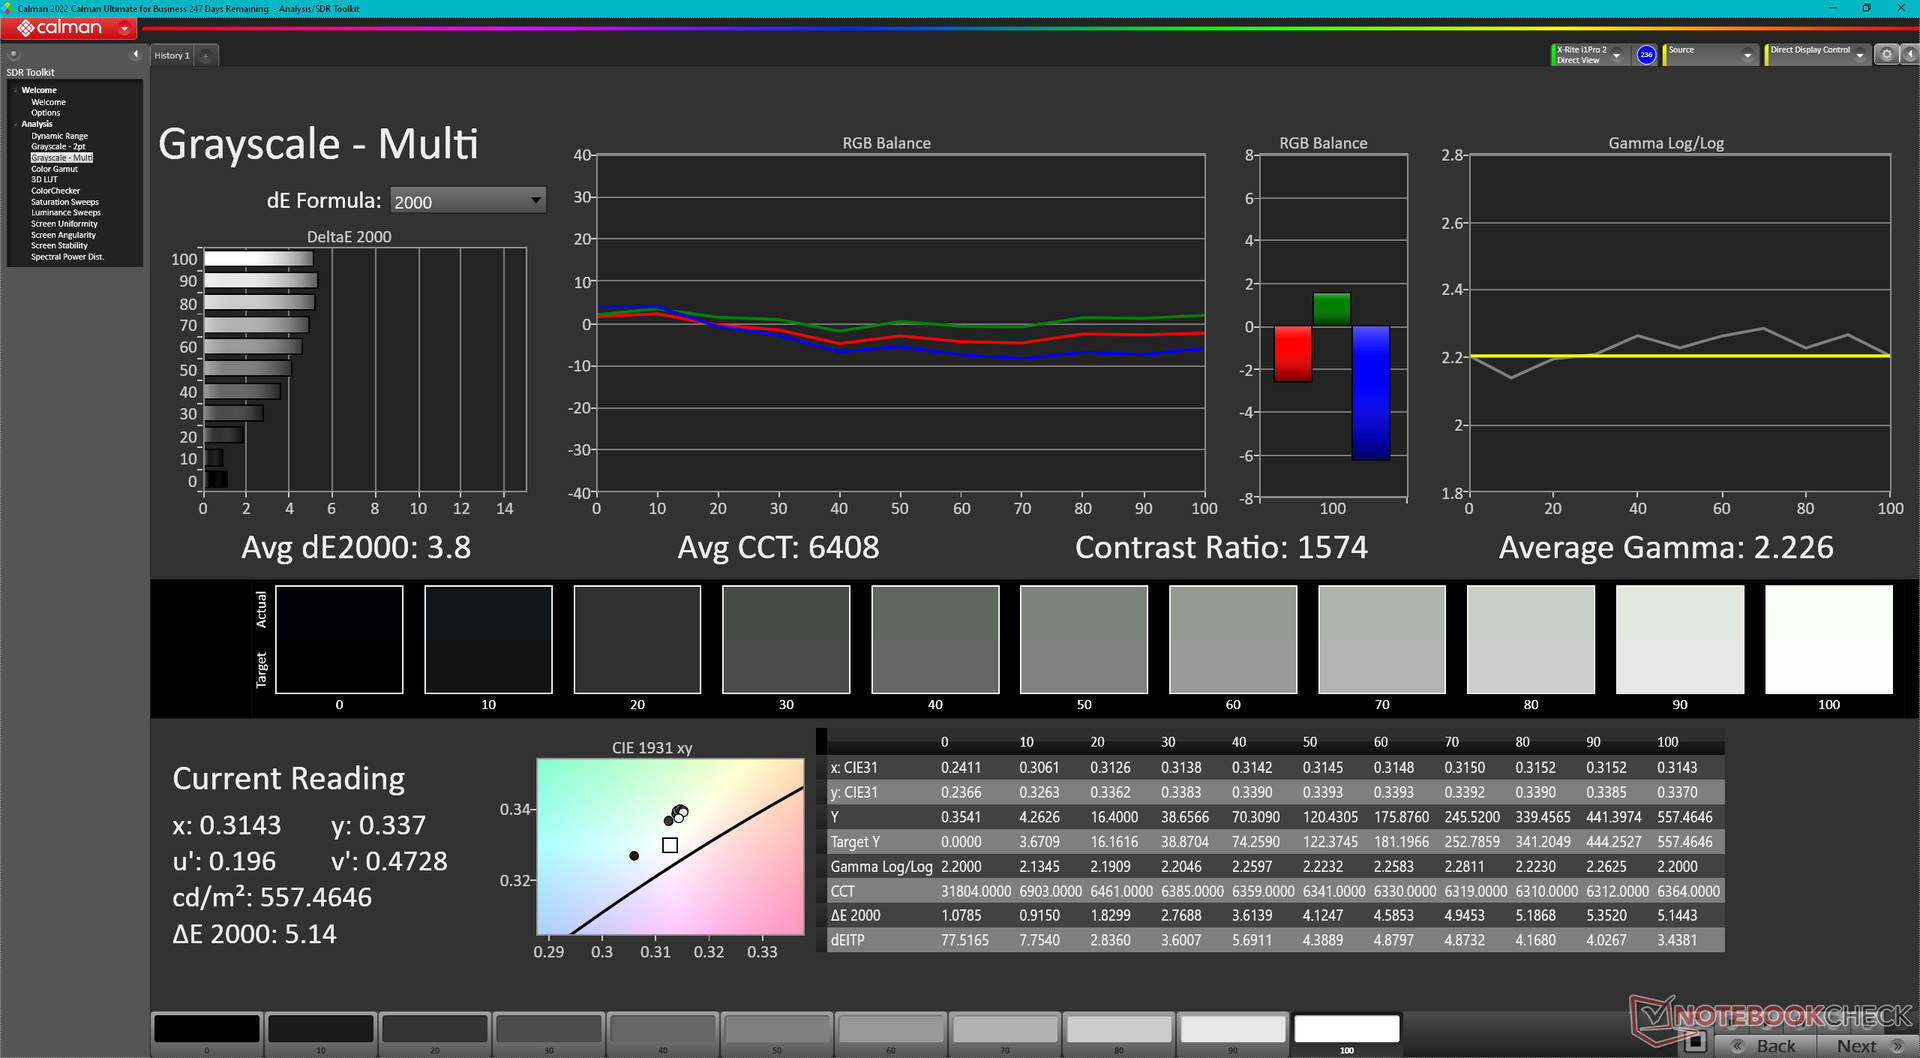
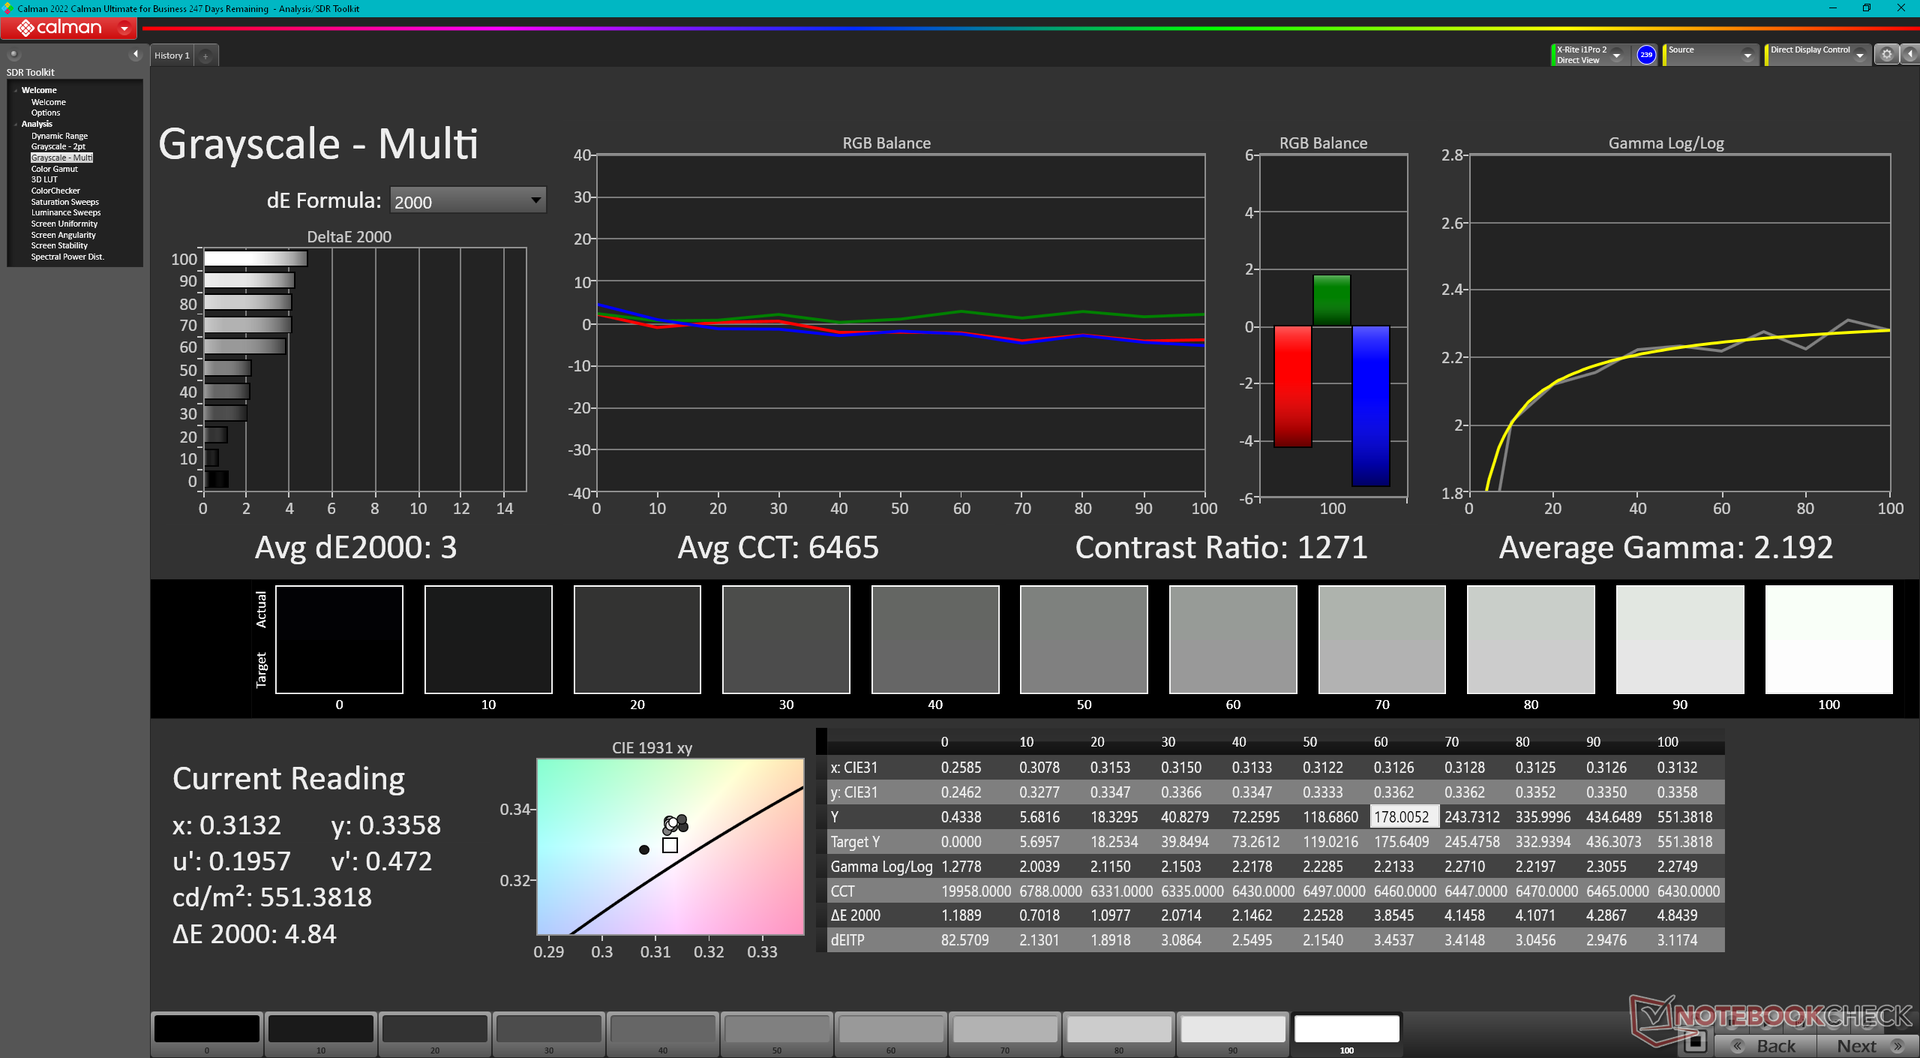
ΔE Greyscale Calman: 3.8 | ∀{0.09-98 Ø4.97}
85.4% AdobeRGB 1998 (Argyll 3D)
99.7% sRGB (Argyll 3D)
95.4% Display P3 (Argyll 3D)
Gamma: 2.23
CCT: 6408 K
| MSI Vector 16 HX A14V Chi Mei N160GME-GTB, IPS, 2560x1600, 16" | MSI Vector GP66 12UGS BOE NE156FHM-NZ3, IPS, 1920x1080, 15.6" | Lenovo Legion 5 16IRX G9 NE160QDM-NZ3, IPS, 2560x1600, 16" | HP Victus 16-r0077ng CMN162D, IPS, 1920x1080, 16.1" | Asus TUF Gaming A16 FA617XS BOE NE160WUM-NX2, IPS, 1920x1200, 16" | Dell G16 7620 BOE NE16QDM, IPS, 2560x1600, 16" | |
|---|---|---|---|---|---|---|
| Display | -14% | -12% | -17% | -15% | -16% | |
| Display P3 Coverage (%) | 95.4 | 70.1 -27% | 72.4 -24% | 66.7 -30% | 69.3 -27% | 68.3 -28% |
| sRGB Coverage (%) | 99.7 | 99.5 0% | 100 0% | 98 -2% | 97.3 -2% | 98 -2% |
| AdobeRGB 1998 Coverage (%) | 85.4 | 72.1 -16% | 74.1 -13% | 69 -19% | 70.7 -17% | 70.5 -17% |
| Response Times | 7% | -48% | -53% | -81% | -21% | |
| Response Time Grey 50% / Grey 80% * (ms) | 5.7 ? | 5.8 ? -2% | 12.5 ? -119% | 13.3 ? -133% | 15.6 ? -174% | 8.6 ? -51% |
| Response Time Black / White * (ms) | 11.4 ? | 9.6 ? 16% | 8.7 ? 24% | 8.2 ? 28% | 10 ? 12% | 10.4 ? 9% |
| PWM Frequency (Hz) | ||||||
| Screen | -3% | 29% | 17% | 13% | 5% | |
| Brightness middle (cd/m²) | 557.2 | 353.1 -37% | 526 -6% | 308 -45% | 301 -46% | 369.4 -34% |
| Brightness (cd/m²) | 506 | 325 -36% | 500 -1% | 285 -44% | 294 -42% | 348 -31% |
| Brightness Distribution (%) | 83 | 85 2% | 87 5% | 85 2% | 94 13% | 83 0% |
| Black Level * (cd/m²) | 0.41 | 0.38 7% | 0.33 20% | 0.25 39% | 0.21 49% | 0.32 22% |
| Contrast (:1) | 1359 | 929 -32% | 1594 17% | 1232 -9% | 1433 5% | 1154 -15% |
| Colorchecker dE 2000 * | 2.91 | 2.24 23% | 1.2 59% | 1.3 55% | 1.79 38% | 1.78 39% |
| Colorchecker dE 2000 max. * | 5.94 | 5 16% | 2.1 65% | 2.76 54% | 3.48 41% | 4.41 26% |
| Colorchecker dE 2000 calibrated * | 1.63 | 1.02 37% | 1 39% | 0.92 44% | 1.2 26% | 1.22 25% |
| Greyscale dE 2000 * | 3.8 | 4 -5% | 1.3 66% | 1.7 55% | 2.5 34% | 3.2 16% |
| Gamma | 2.23 99% | 2.24 98% | 2.23 99% | 2.167 102% | 2.265 97% | 2.2 100% |
| CCT | 6408 101% | 6864 95% | 6391 102% | 6767 96% | 6157 106% | 6750 96% |
| Totalt genomsnitt (program/inställningar) | -3% /
-4% | -10% /
9% | -18% /
-0% | -28% /
-6% | -11% /
-3% |
* ... mindre är bättre
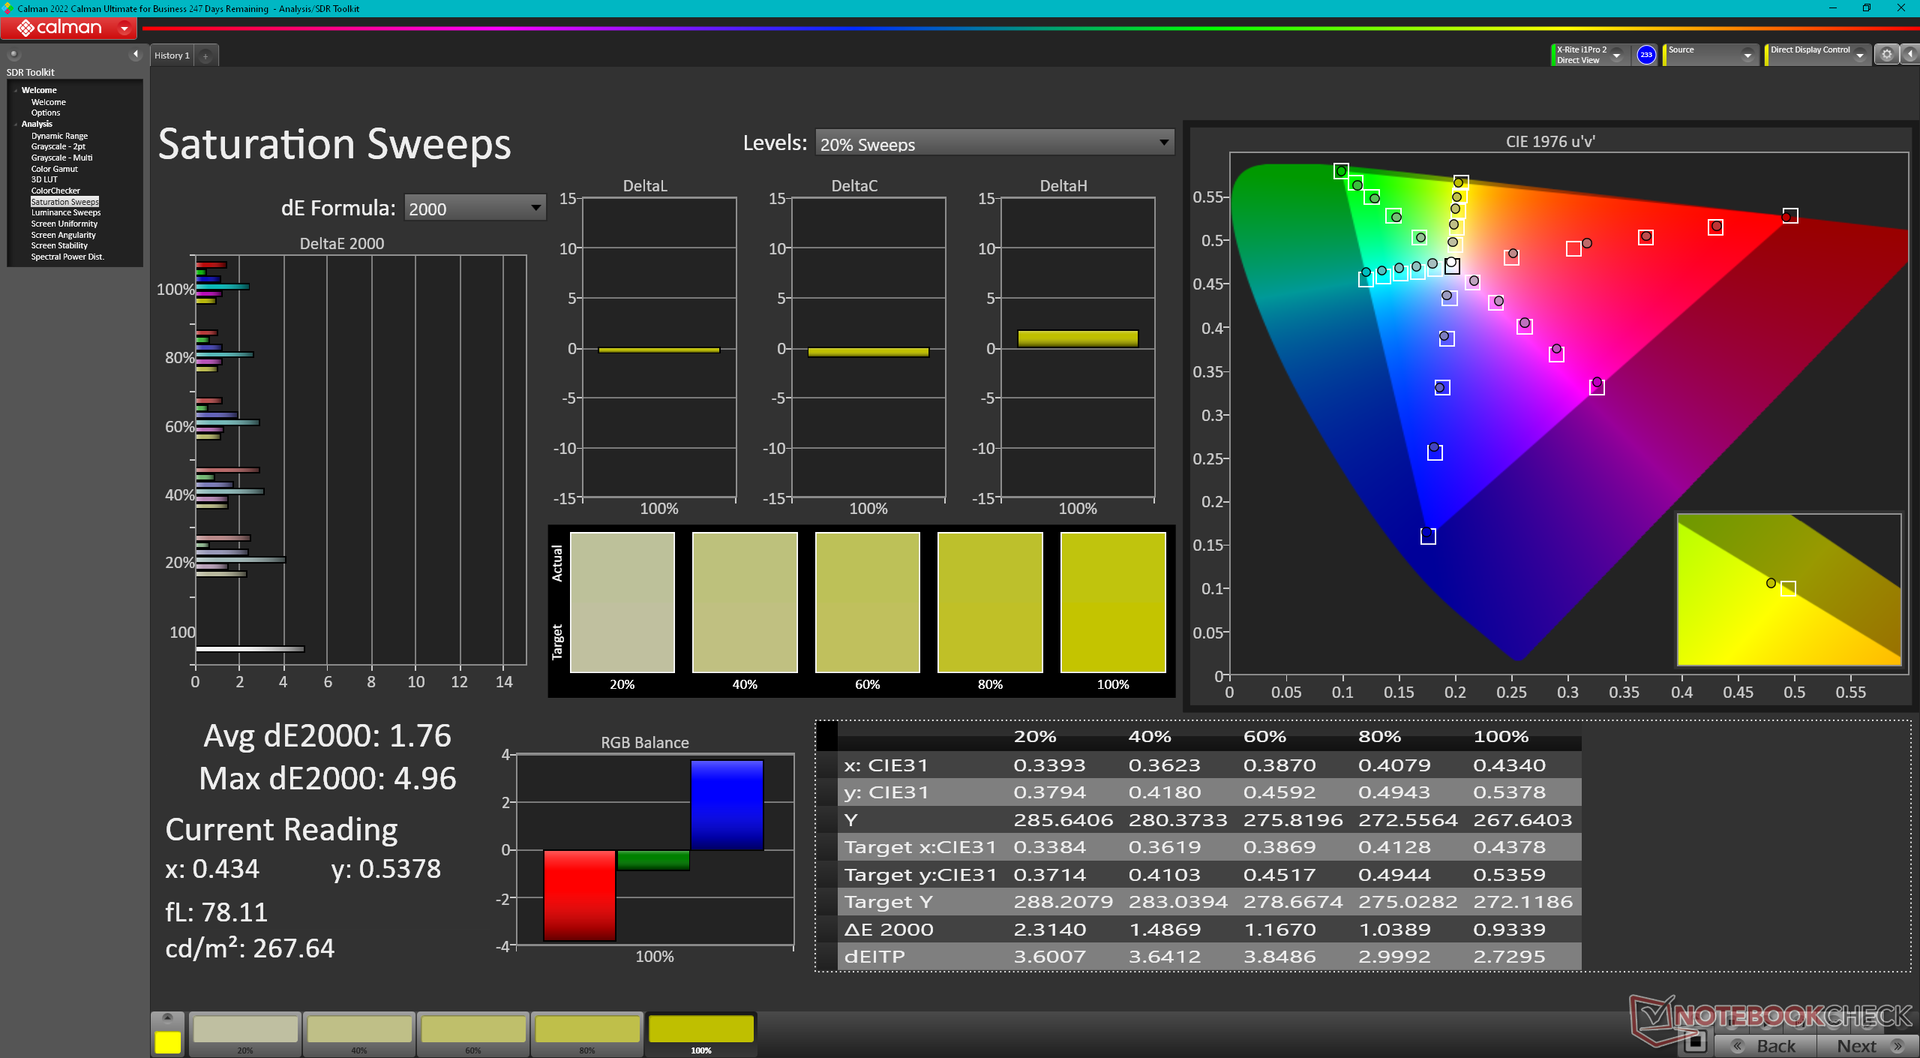
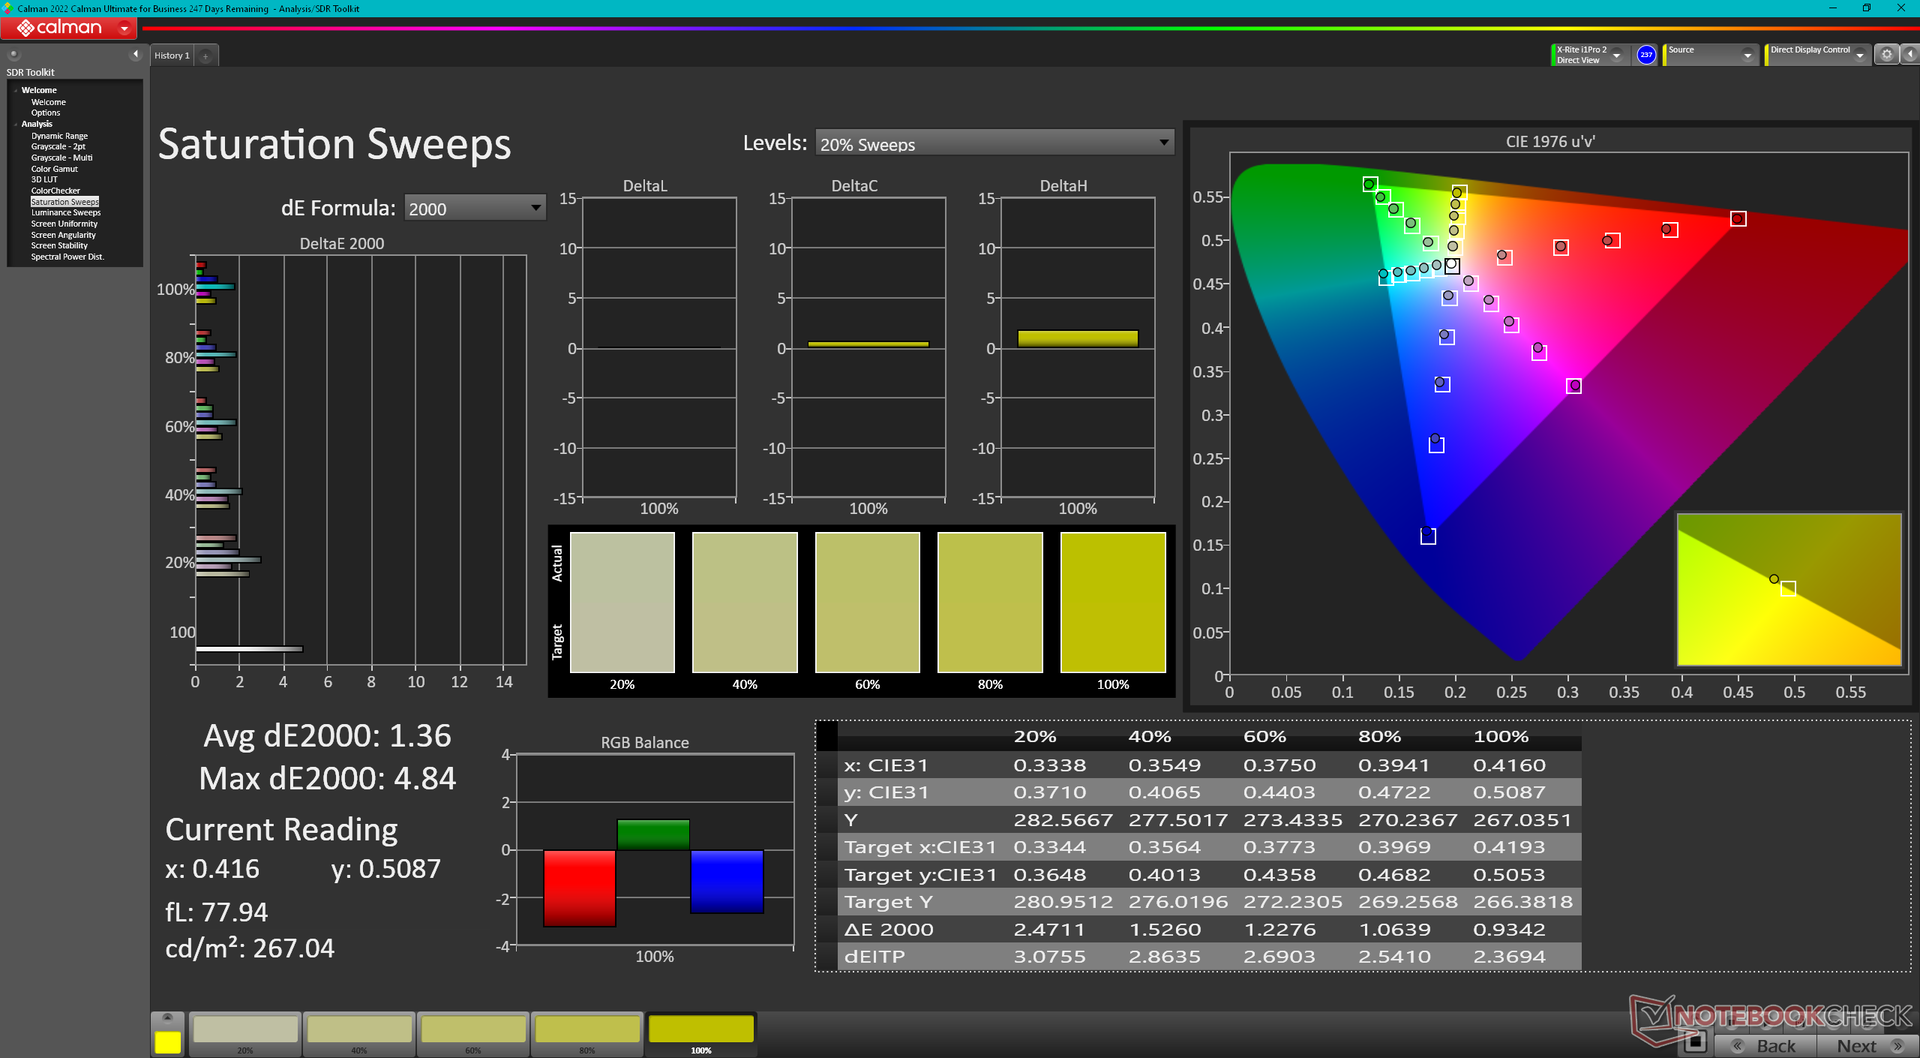
Även om skärmen inte är förkalibrerad är dess färger redan relativt exakta. Genomsnittliga deltaE-värden för gråskala och färg är endast 3,8 respektive 2,91, jämfört med P3-standarden. Vår kalibrerade ICM-profil är tillgänglig gratis ovan för att förbättra noggrannheten närmare deltaE <2-standarden.
Visa svarstider
| ↔ Svarstid svart till vitt | ||
|---|---|---|
| 11.4 ms ... stiga ↗ och falla ↘ kombinerat | ↗ 6.5 ms stiga | 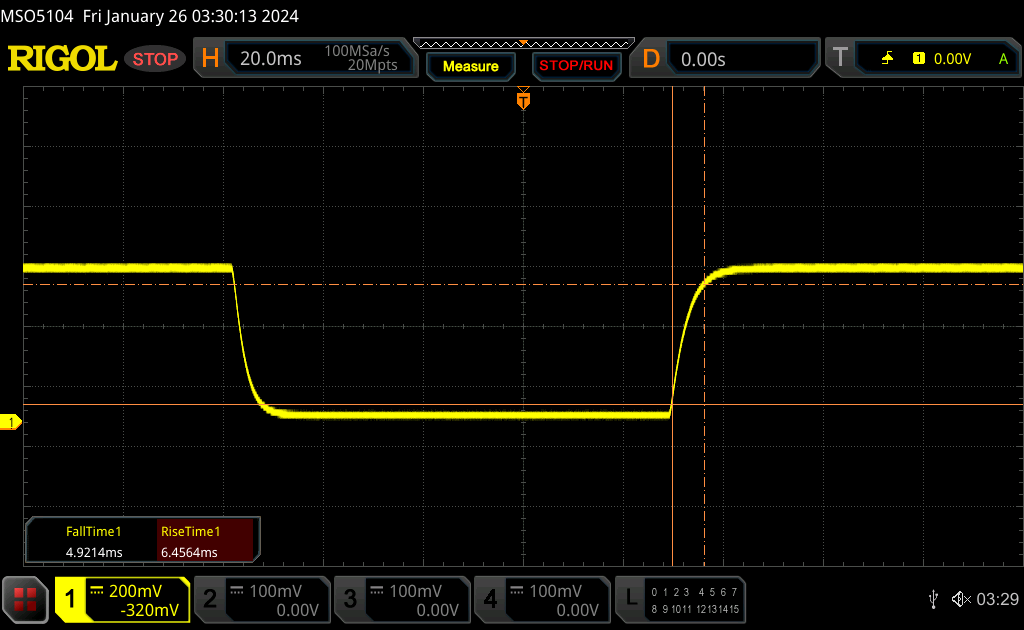 |
| ↘ 4.9 ms hösten | ||
| Skärmen visar bra svarsfrekvens i våra tester, men kan vara för långsam för konkurrenskraftiga spelare. I jämförelse sträcker sig alla testade enheter från 0.1 (minst) till 240 (maximalt) ms. » 31 % av alla enheter är bättre. Det betyder att den uppmätta svarstiden är bättre än genomsnittet av alla testade enheter (19.8 ms). | ||
| ↔ Svarstid 50 % grått till 80 % grått | ||
| 5.7 ms ... stiga ↗ och falla ↘ kombinerat | ↗ 2.8 ms stiga | 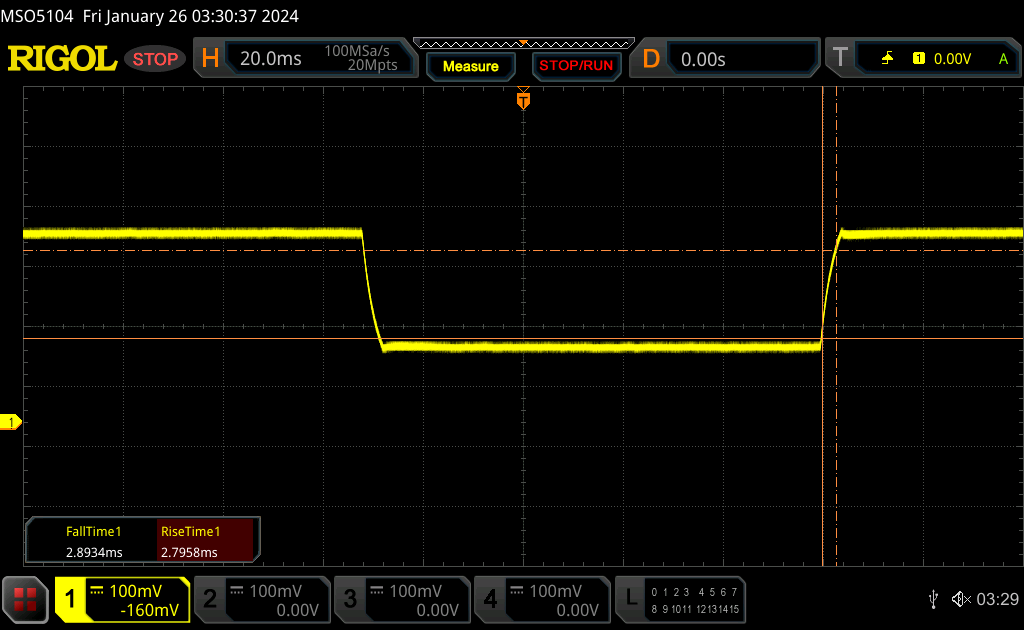 |
| ↘ 2.9 ms hösten | ||
| Skärmen visar väldigt snabba svarsfrekvenser i våra tester och borde vara mycket väl lämpad för fartfyllt spel. I jämförelse sträcker sig alla testade enheter från 0.165 (minst) till 636 (maximalt) ms. » 18 % av alla enheter är bättre. Det betyder att den uppmätta svarstiden är bättre än genomsnittet av alla testade enheter (31 ms). | ||
Skärmflimmer / PWM (Puls-Width Modulation)
| Skärmflimmer / PWM upptäcktes inte | 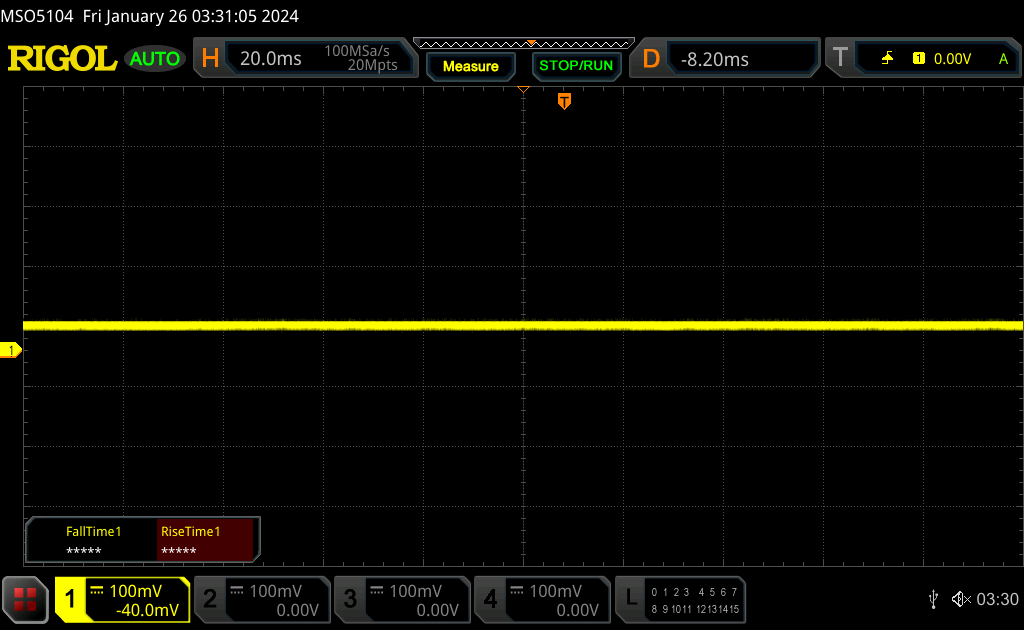 | ||
Som jämförelse: 52 % av alla testade enheter använder inte PWM för att dämpa skärmen. Om PWM upptäcktes mättes ett medelvärde av 7769 (minst: 5 - maximum: 343500) Hz. | |||
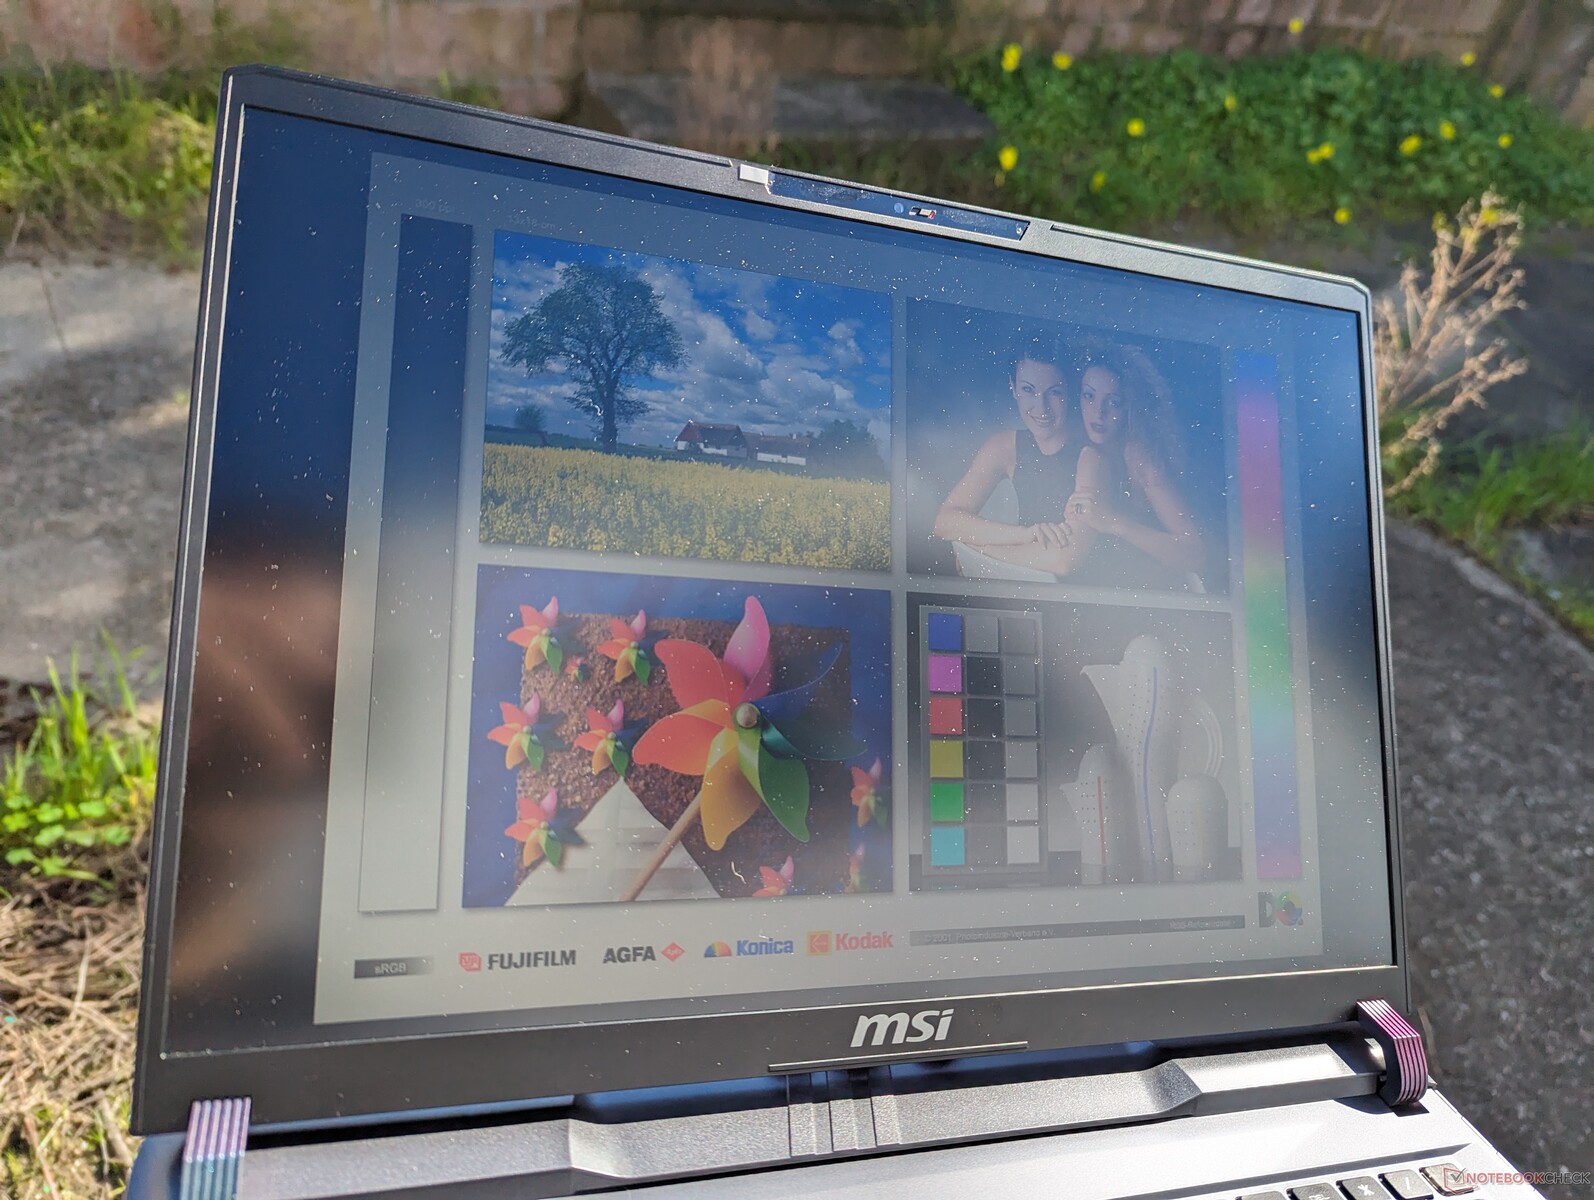
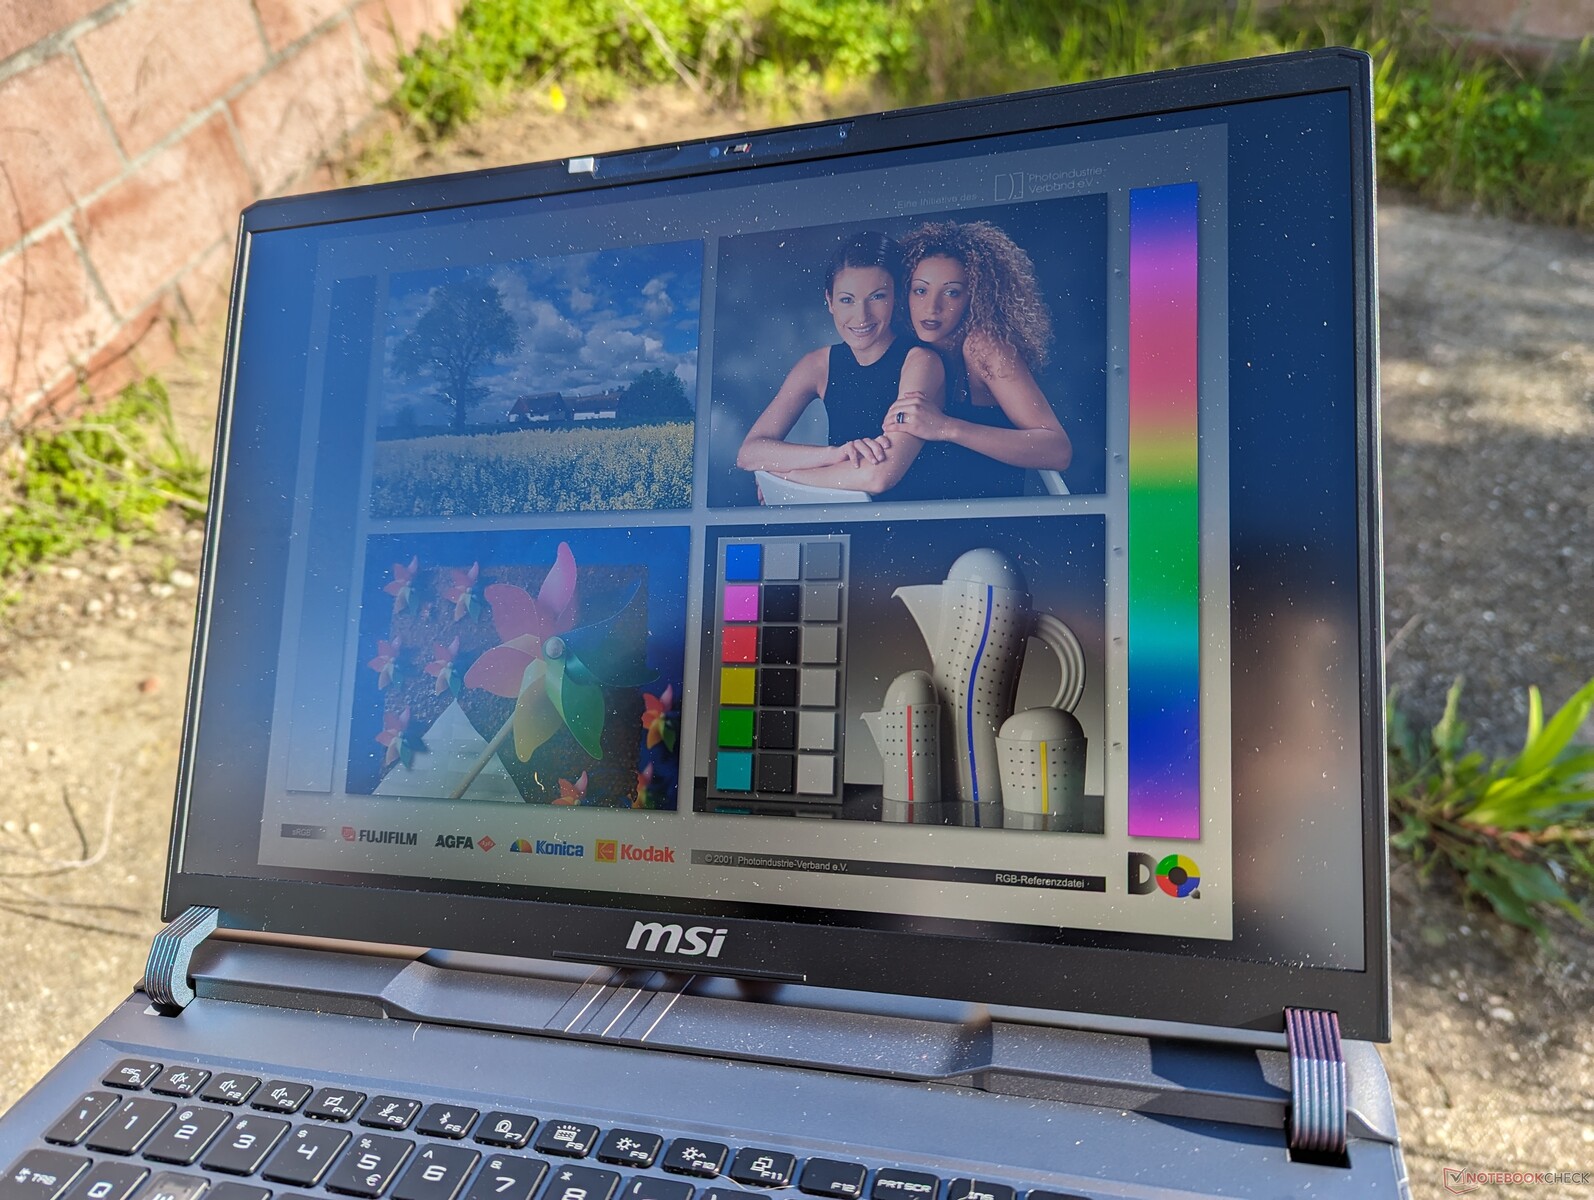
Den matta skärmen är relativt ljusstark för en IPS-panel med cirka 550 nits jämfört med endast 300 nits på HP Victus 16 eller Asus TUF Gaming A16. Synligheten är acceptabel i skugga men skärmen är annars fortfarande för svag under ljusare utomhusförhållanden.
Prestanda
Villkor för testning
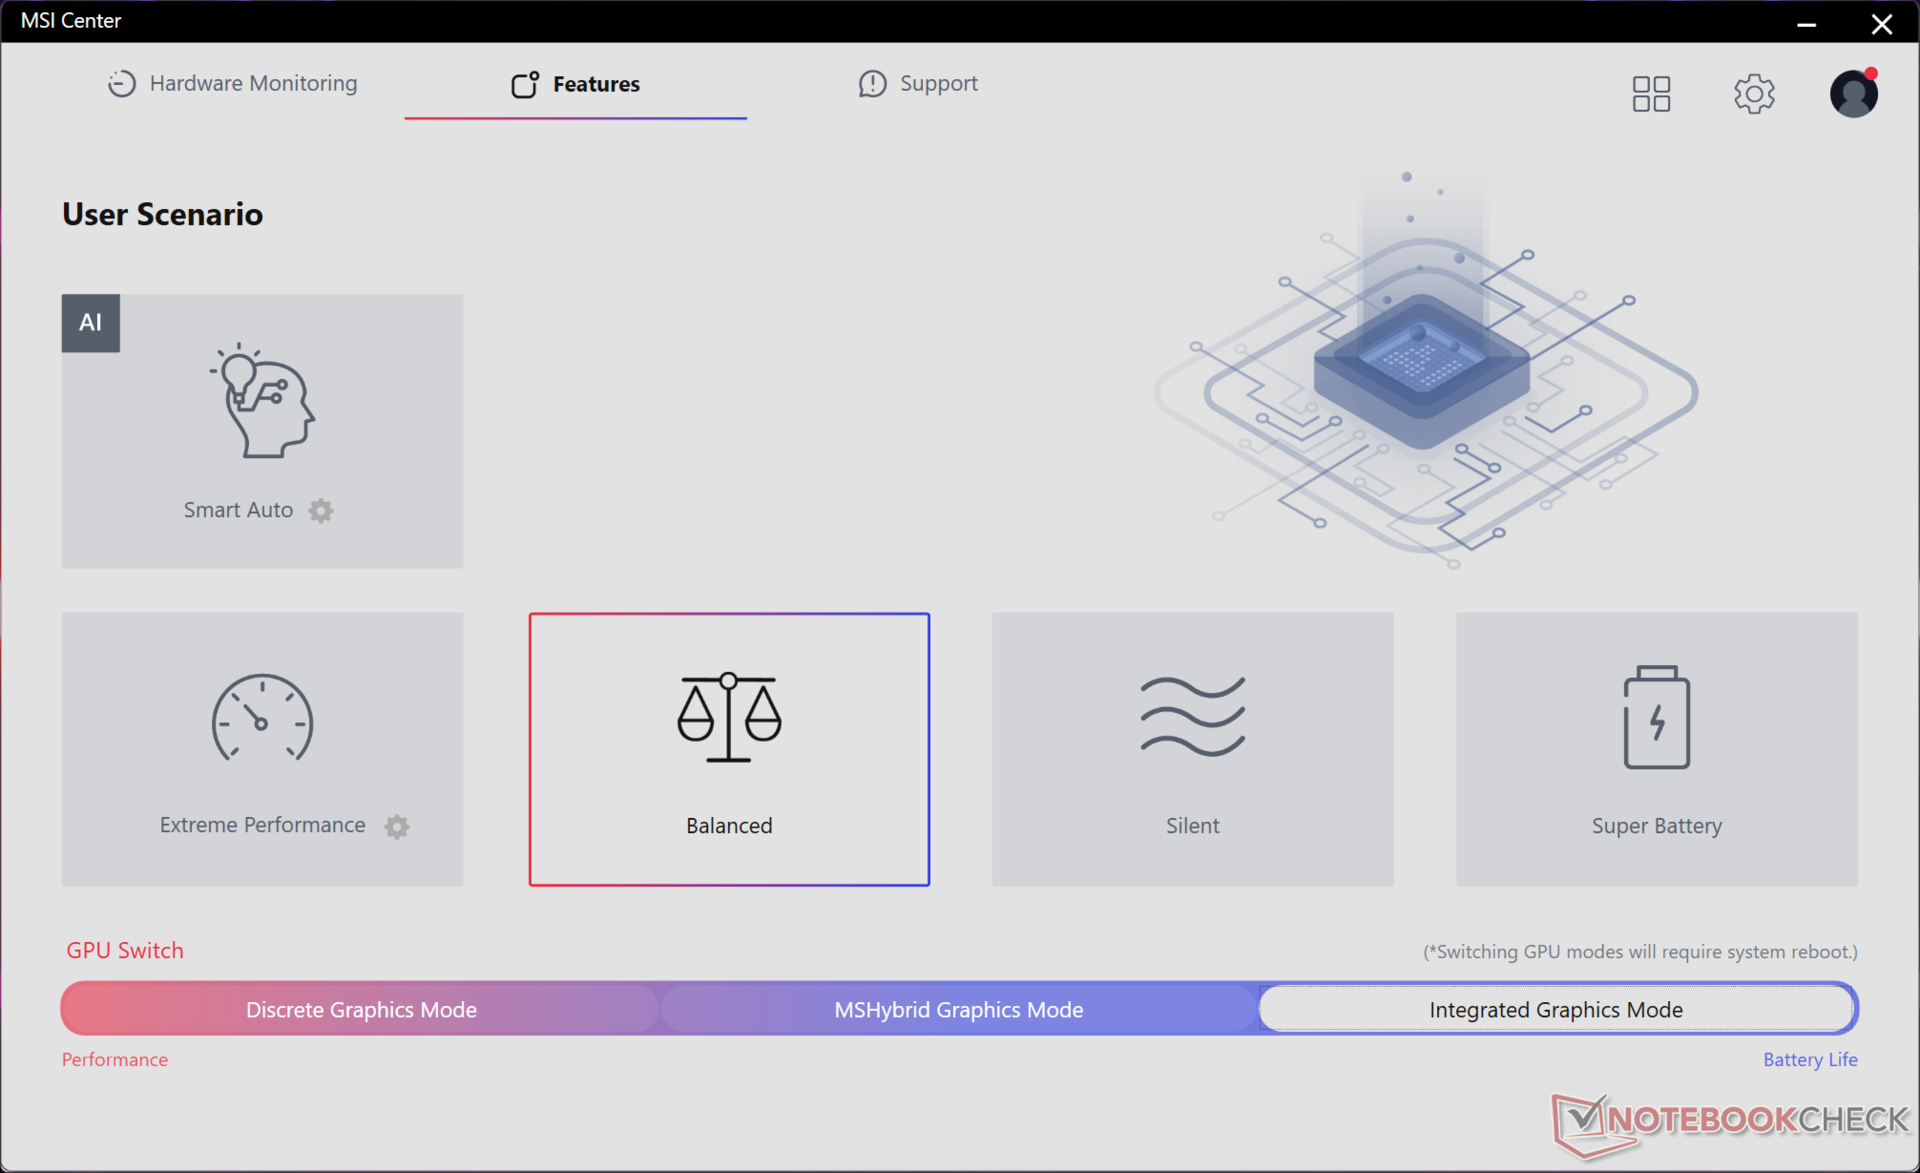
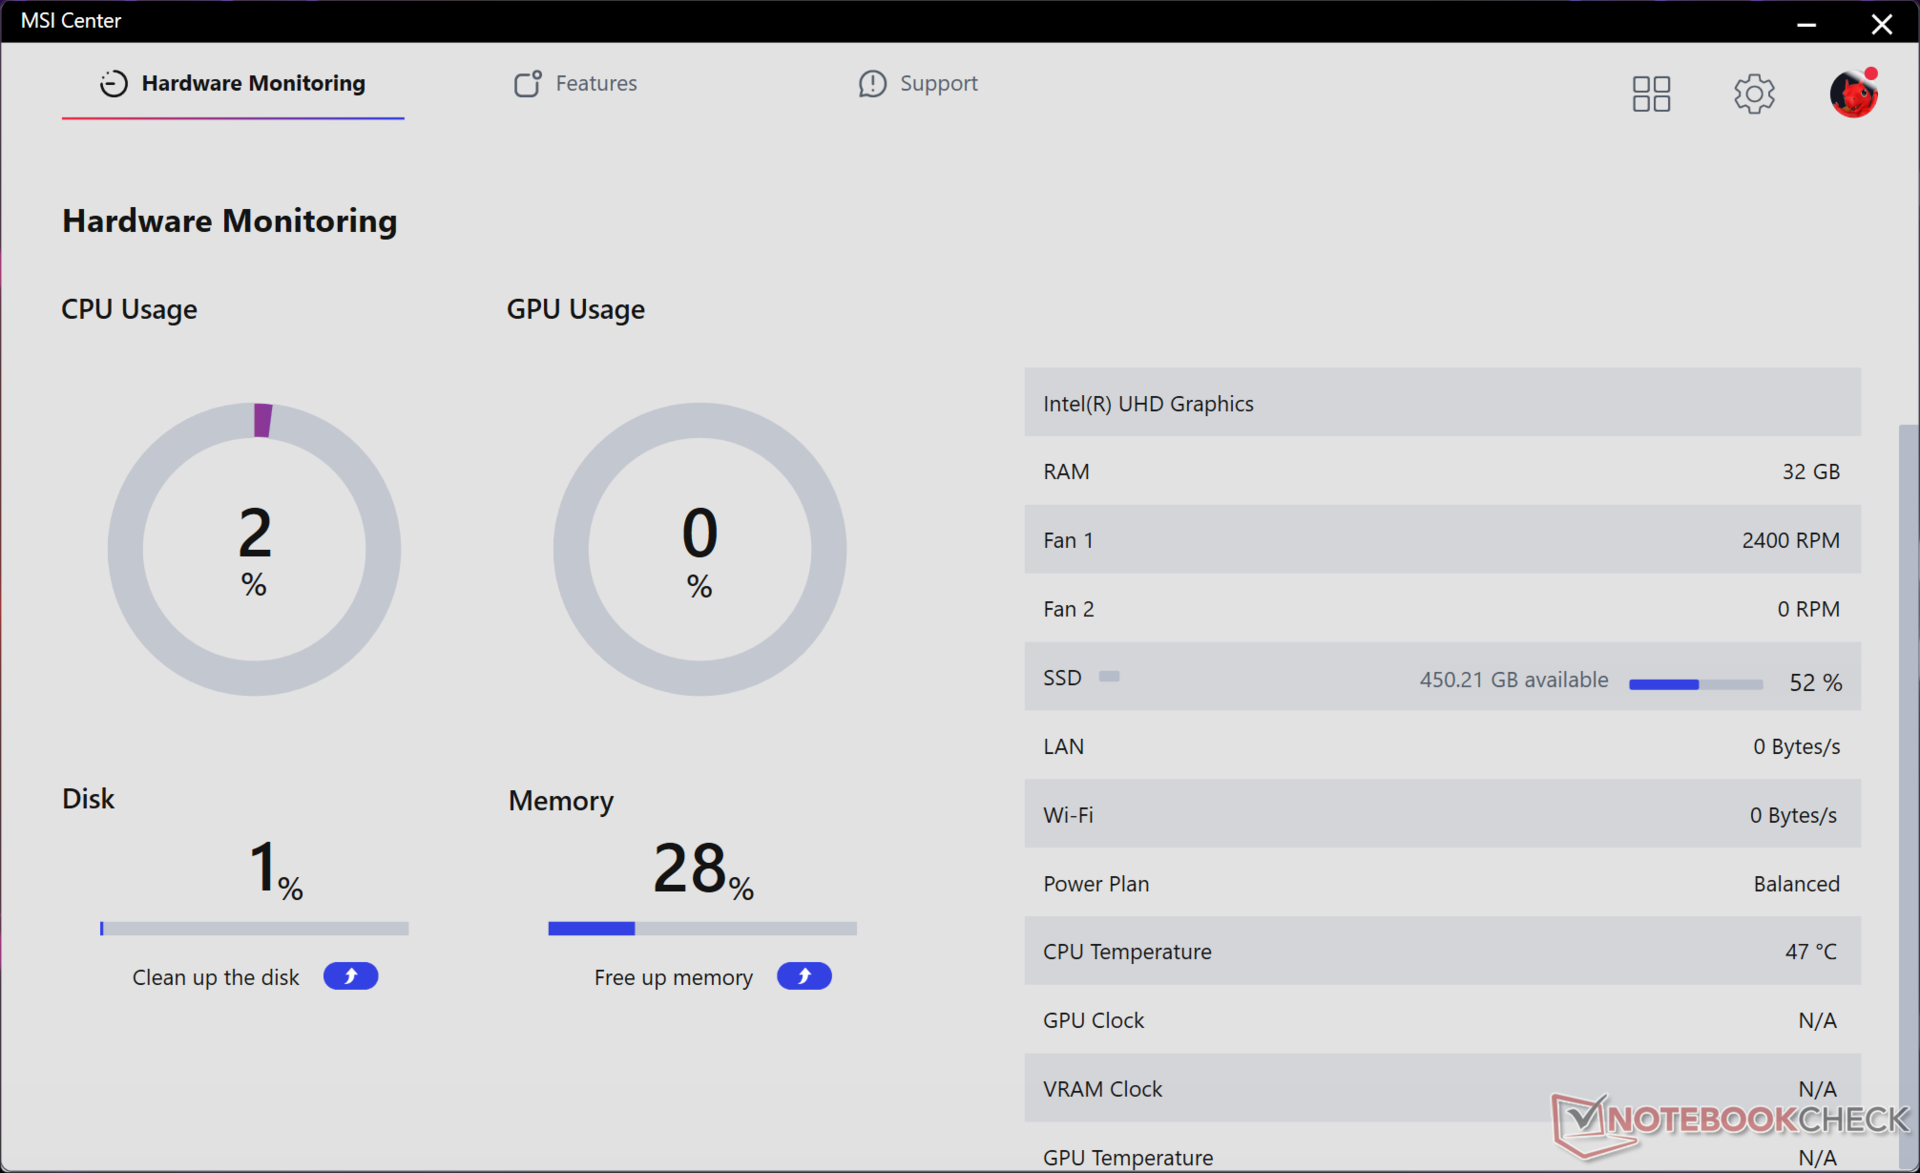
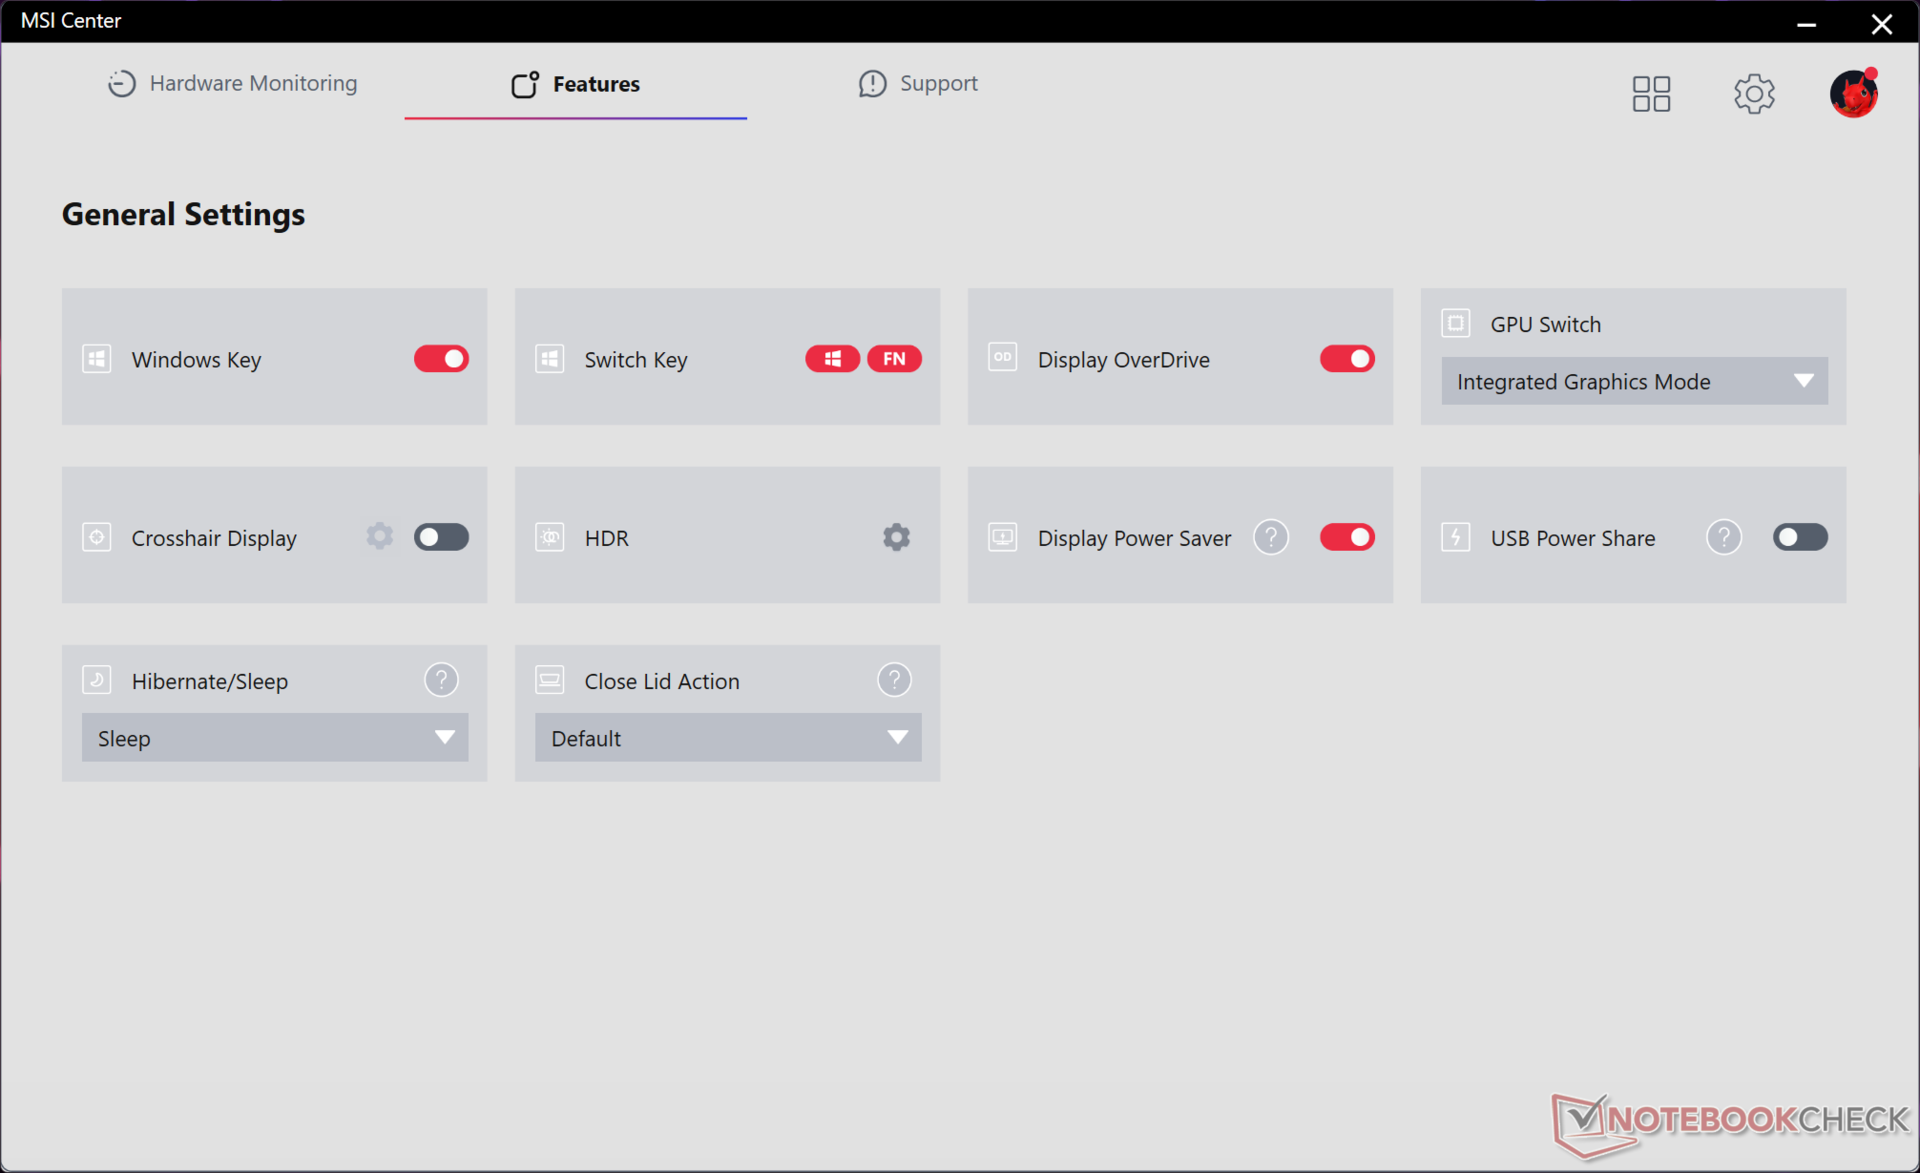
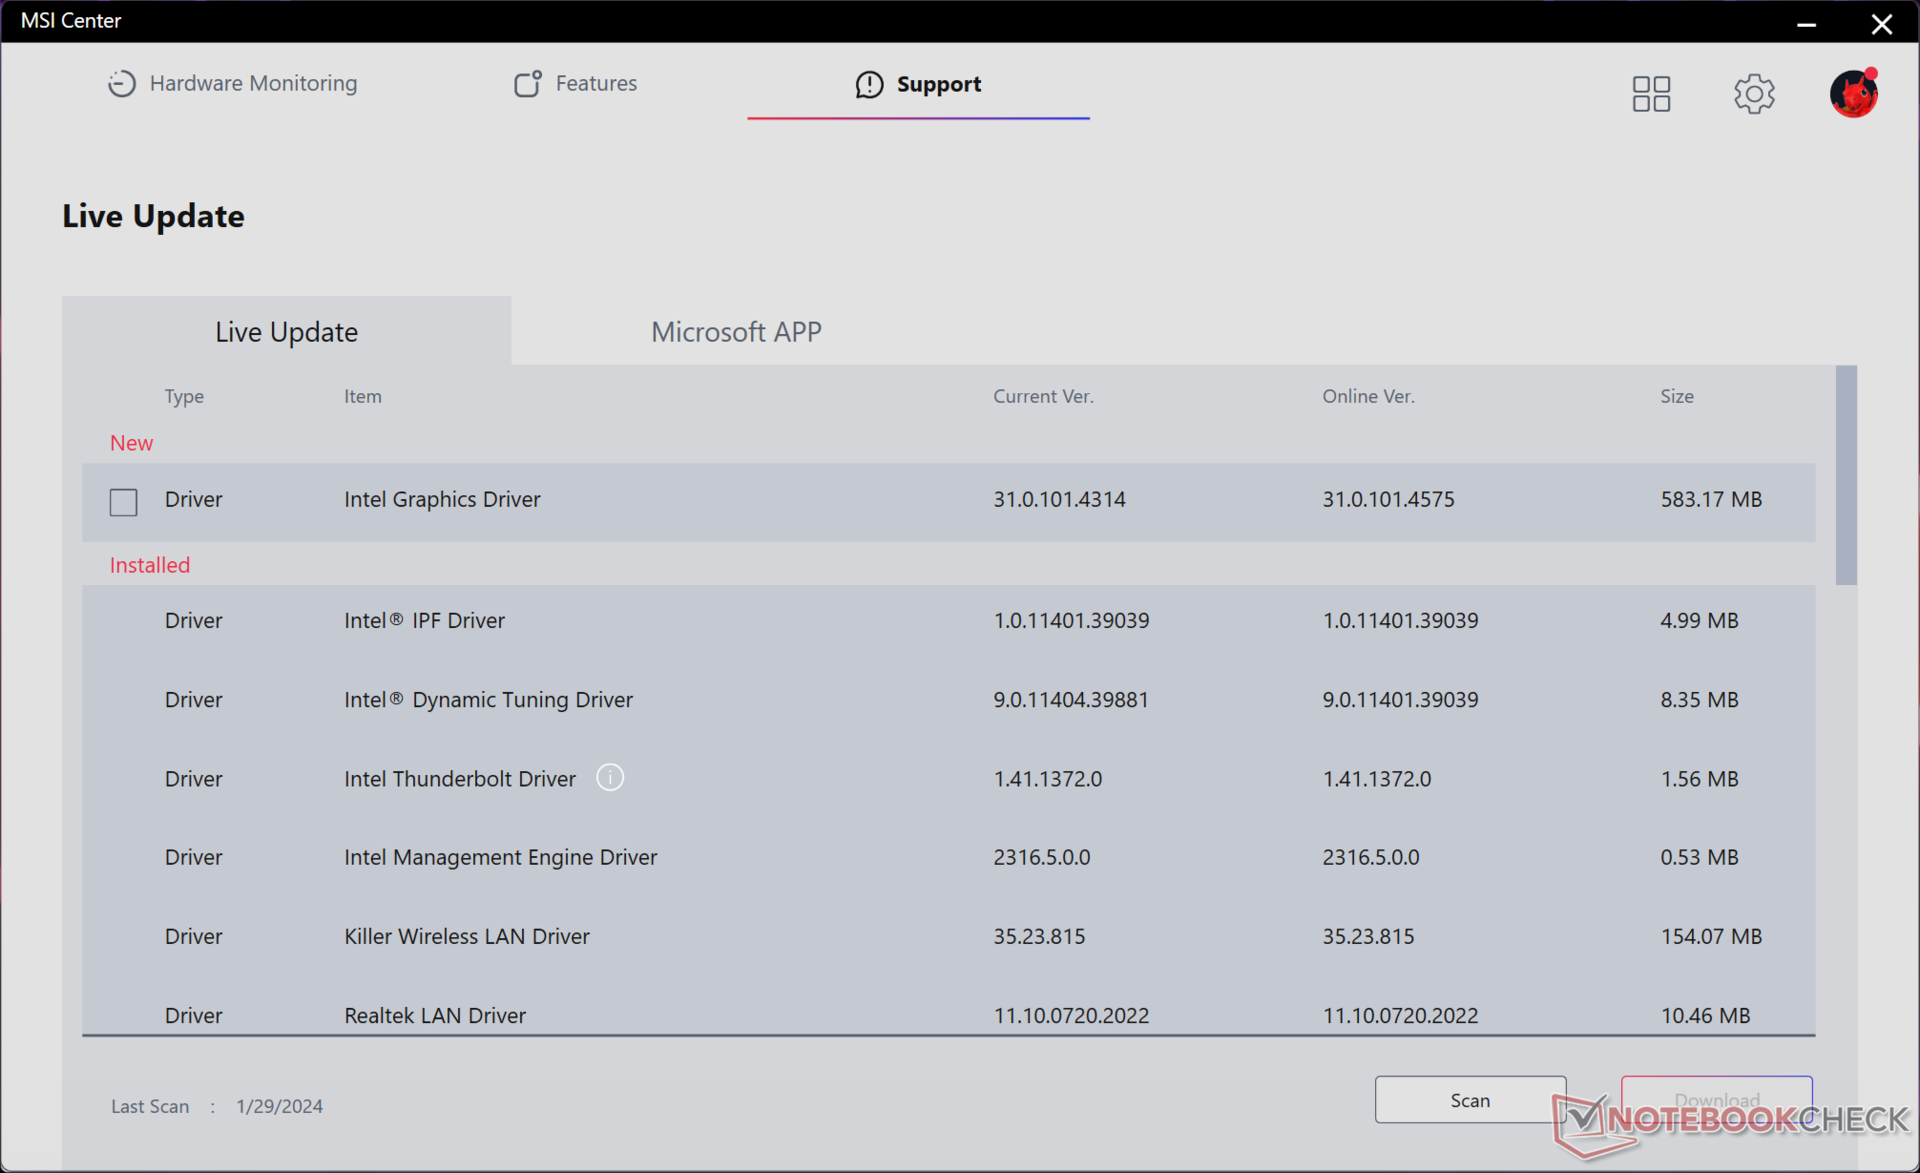
Vi ställde in vår enhet på dGPU-läge och Extreme Performance-läge med Cooler Boost aktivt innan vi körde riktmärkena nedan. Ägare bör bekanta sig med den förinstallerade MSI Center-programvaran eftersom den är navet för systemuppdateringar, systemstatistik, växling av funktioner och justering av MUX-inställningar och energiprofiler. Att växla mellan dGPU- och iGPU-lägen kräver omstart, vilket kan ta ännu längre tid än en vanlig kallstart.
Processor
I likhet med vad vi upptäckte på Titan 18 HX, är Core i9-14900HX bara en liten ökning jämfört med den senaste generationens Core i9-13980HX med upp till 10 procent. Fördelarna jämfört med föregående år är därför endast marginella, särskilt eftersom 14:e generationens Raptor Lake-HX-uppdateringsserie saknar den nya dedikerade NPU som finns i 14:e generationens Meteor Lake-serie. Core i9-13980HX var naturligtvis en av de snabbaste mobila processorerna 2023 och Core i9-14900HX är absolut inte sämre. Användare som uppgraderar från 12:e generationens eller äldre bärbara Intel gaming-datorer bör fortfarande se betydande prestandaförbättringar.
Cinebench R15 Multi Loop
Cinebench R23: Multi Core | Single Core
Cinebench R20: CPU (Multi Core) | CPU (Single Core)
Cinebench R15: CPU Multi 64Bit | CPU Single 64Bit
Blender: v2.79 BMW27 CPU
7-Zip 18.03: 7z b 4 | 7z b 4 -mmt1
Geekbench 6.7: Multi-Core | Single-Core
Geekbench 5.5: Multi-Core | Single-Core
HWBOT x265 Benchmark v2.2: 4k Preset
LibreOffice : 20 Documents To PDF
R Benchmark 2.5: Overall mean
| CPU Performance rating | |
| MSI Vector 16 HX A14V | |
| Asus Zephyrus Duo 16 GX650PY-NM006W -2! | |
| Genomsnitt Intel Core i9-14900HX | |
| Alienware m16 R1 AMD | |
| Lenovo Legion 5 16IRX G9 | |
| Alienware m16 R1 Intel | |
| Lenovo Legion Pro 5 16ARX8 -2! | |
| Asus TUF Gaming A16 FA617XS -2! | |
| MSI Vector GP66 12UGS -2! | |
| Lenovo Legion Slim 7 16APH8 | |
| Lenovo LOQ 16IRH8 | |
| Dell G16 7620 -2! | |
| HP Victus 16-r0077ng | |
| Geekbench 6.7 / Multi-Core | |
| MSI Vector 16 HX A14V | |
| Genomsnitt Intel Core i9-14900HX (13158 - 19665, n=37) | |
| Lenovo Legion 5 16IRX G9 | |
| Alienware m16 R1 Intel | |
| Lenovo LOQ 16IRH8 | |
| Lenovo Legion Slim 7 16APH8 | |
| Alienware m16 R1 AMD | |
| HP Victus 16-r0077ng | |
| Geekbench 6.7 / Single-Core | |
| MSI Vector 16 HX A14V | |
| Genomsnitt Intel Core i9-14900HX (2419 - 3129, n=37) | |
| Lenovo Legion 5 16IRX G9 | |
| Alienware m16 R1 AMD | |
| Alienware m16 R1 Intel | |
| Lenovo Legion Slim 7 16APH8 | |
| Lenovo LOQ 16IRH8 | |
| HP Victus 16-r0077ng | |
| HWBOT x265 Benchmark v2.2 / 4k Preset | |
| Asus Zephyrus Duo 16 GX650PY-NM006W | |
| MSI Vector 16 HX A14V | |
| Alienware m16 R1 AMD | |
| Genomsnitt Intel Core i9-14900HX (16.8 - 38.9, n=37) | |
| Lenovo Legion 5 16IRX G9 | |
| Lenovo Legion Pro 5 16ARX8 | |
| Alienware m16 R1 Intel | |
| Asus TUF Gaming A16 FA617XS | |
| Lenovo Legion Slim 7 16APH8 | |
| MSI Vector GP66 12UGS | |
| Dell G16 7620 | |
| Lenovo LOQ 16IRH8 | |
| HP Victus 16-r0077ng | |
Cinebench R23: Multi Core | Single Core
Cinebench R20: CPU (Multi Core) | CPU (Single Core)
Cinebench R15: CPU Multi 64Bit | CPU Single 64Bit
Blender: v2.79 BMW27 CPU
7-Zip 18.03: 7z b 4 | 7z b 4 -mmt1
Geekbench 6.7: Multi-Core | Single-Core
Geekbench 5.5: Multi-Core | Single-Core
HWBOT x265 Benchmark v2.2: 4k Preset
LibreOffice : 20 Documents To PDF
R Benchmark 2.5: Overall mean
* ... mindre är bättre
AIDA64: FP32 Ray-Trace | FPU Julia | CPU SHA3 | CPU Queen | FPU SinJulia | FPU Mandel | CPU AES | CPU ZLib | FP64 Ray-Trace | CPU PhotoWorxx
| Performance rating | |
| MSI Vector 16 HX A14V | |
| Genomsnitt Intel Core i9-14900HX | |
| Asus TUF Gaming A16 FA617XS | |
| Lenovo Legion 5 16IRX G9 | |
| Dell G16 7620 | |
| HP Victus 16-r0077ng | |
| MSI Vector GP66 12UGS | |
| AIDA64 / FP32 Ray-Trace | |
| MSI Vector 16 HX A14V | |
| Asus TUF Gaming A16 FA617XS | |
| Genomsnitt Intel Core i9-14900HX (13098 - 33474, n=36) | |
| Lenovo Legion 5 16IRX G9 | |
| Dell G16 7620 | |
| HP Victus 16-r0077ng | |
| MSI Vector GP66 12UGS | |
| AIDA64 / FPU Julia | |
| MSI Vector 16 HX A14V | |
| Genomsnitt Intel Core i9-14900HX (67573 - 166040, n=36) | |
| Asus TUF Gaming A16 FA617XS | |
| Lenovo Legion 5 16IRX G9 | |
| Dell G16 7620 | |
| HP Victus 16-r0077ng | |
| MSI Vector GP66 12UGS | |
| AIDA64 / CPU SHA3 | |
| MSI Vector 16 HX A14V | |
| Genomsnitt Intel Core i9-14900HX (3589 - 7979, n=36) | |
| Asus TUF Gaming A16 FA617XS | |
| Lenovo Legion 5 16IRX G9 | |
| Dell G16 7620 | |
| HP Victus 16-r0077ng | |
| MSI Vector GP66 12UGS | |
| AIDA64 / CPU Queen | |
| MSI Vector 16 HX A14V | |
| Genomsnitt Intel Core i9-14900HX (118405 - 148966, n=36) | |
| Asus TUF Gaming A16 FA617XS | |
| MSI Vector GP66 12UGS | |
| Dell G16 7620 | |
| Lenovo Legion 5 16IRX G9 | |
| HP Victus 16-r0077ng | |
| AIDA64 / FPU SinJulia | |
| MSI Vector 16 HX A14V | |
| Asus TUF Gaming A16 FA617XS | |
| Genomsnitt Intel Core i9-14900HX (10475 - 18517, n=36) | |
| Lenovo Legion 5 16IRX G9 | |
| Dell G16 7620 | |
| MSI Vector GP66 12UGS | |
| HP Victus 16-r0077ng | |
| AIDA64 / FPU Mandel | |
| MSI Vector 16 HX A14V | |
| Asus TUF Gaming A16 FA617XS | |
| Genomsnitt Intel Core i9-14900HX (32543 - 83662, n=36) | |
| Lenovo Legion 5 16IRX G9 | |
| HP Victus 16-r0077ng | |
| Dell G16 7620 | |
| MSI Vector GP66 12UGS | |
| AIDA64 / CPU AES | |
| Genomsnitt Intel Core i9-14900HX (86964 - 241777, n=36) | |
| MSI Vector 16 HX A14V | |
| MSI Vector GP66 12UGS | |
| Lenovo Legion 5 16IRX G9 | |
| Asus TUF Gaming A16 FA617XS | |
| Dell G16 7620 | |
| HP Victus 16-r0077ng | |
| AIDA64 / CPU ZLib | |
| MSI Vector 16 HX A14V | |
| Genomsnitt Intel Core i9-14900HX (1054 - 2292, n=36) | |
| Lenovo Legion 5 16IRX G9 | |
| Asus TUF Gaming A16 FA617XS | |
| MSI Vector GP66 12UGS | |
| Dell G16 7620 | |
| HP Victus 16-r0077ng | |
| AIDA64 / FP64 Ray-Trace | |
| MSI Vector 16 HX A14V | |
| Asus TUF Gaming A16 FA617XS | |
| Genomsnitt Intel Core i9-14900HX (6809 - 18349, n=36) | |
| Lenovo Legion 5 16IRX G9 | |
| Dell G16 7620 | |
| HP Victus 16-r0077ng | |
| MSI Vector GP66 12UGS | |
| AIDA64 / CPU PhotoWorxx | |
| MSI Vector 16 HX A14V | |
| Genomsnitt Intel Core i9-14900HX (23903 - 54702, n=36) | |
| HP Victus 16-r0077ng | |
| Dell G16 7620 | |
| Lenovo Legion 5 16IRX G9 | |
| Asus TUF Gaming A16 FA617XS | |
| MSI Vector GP66 12UGS | |
Systemets prestanda
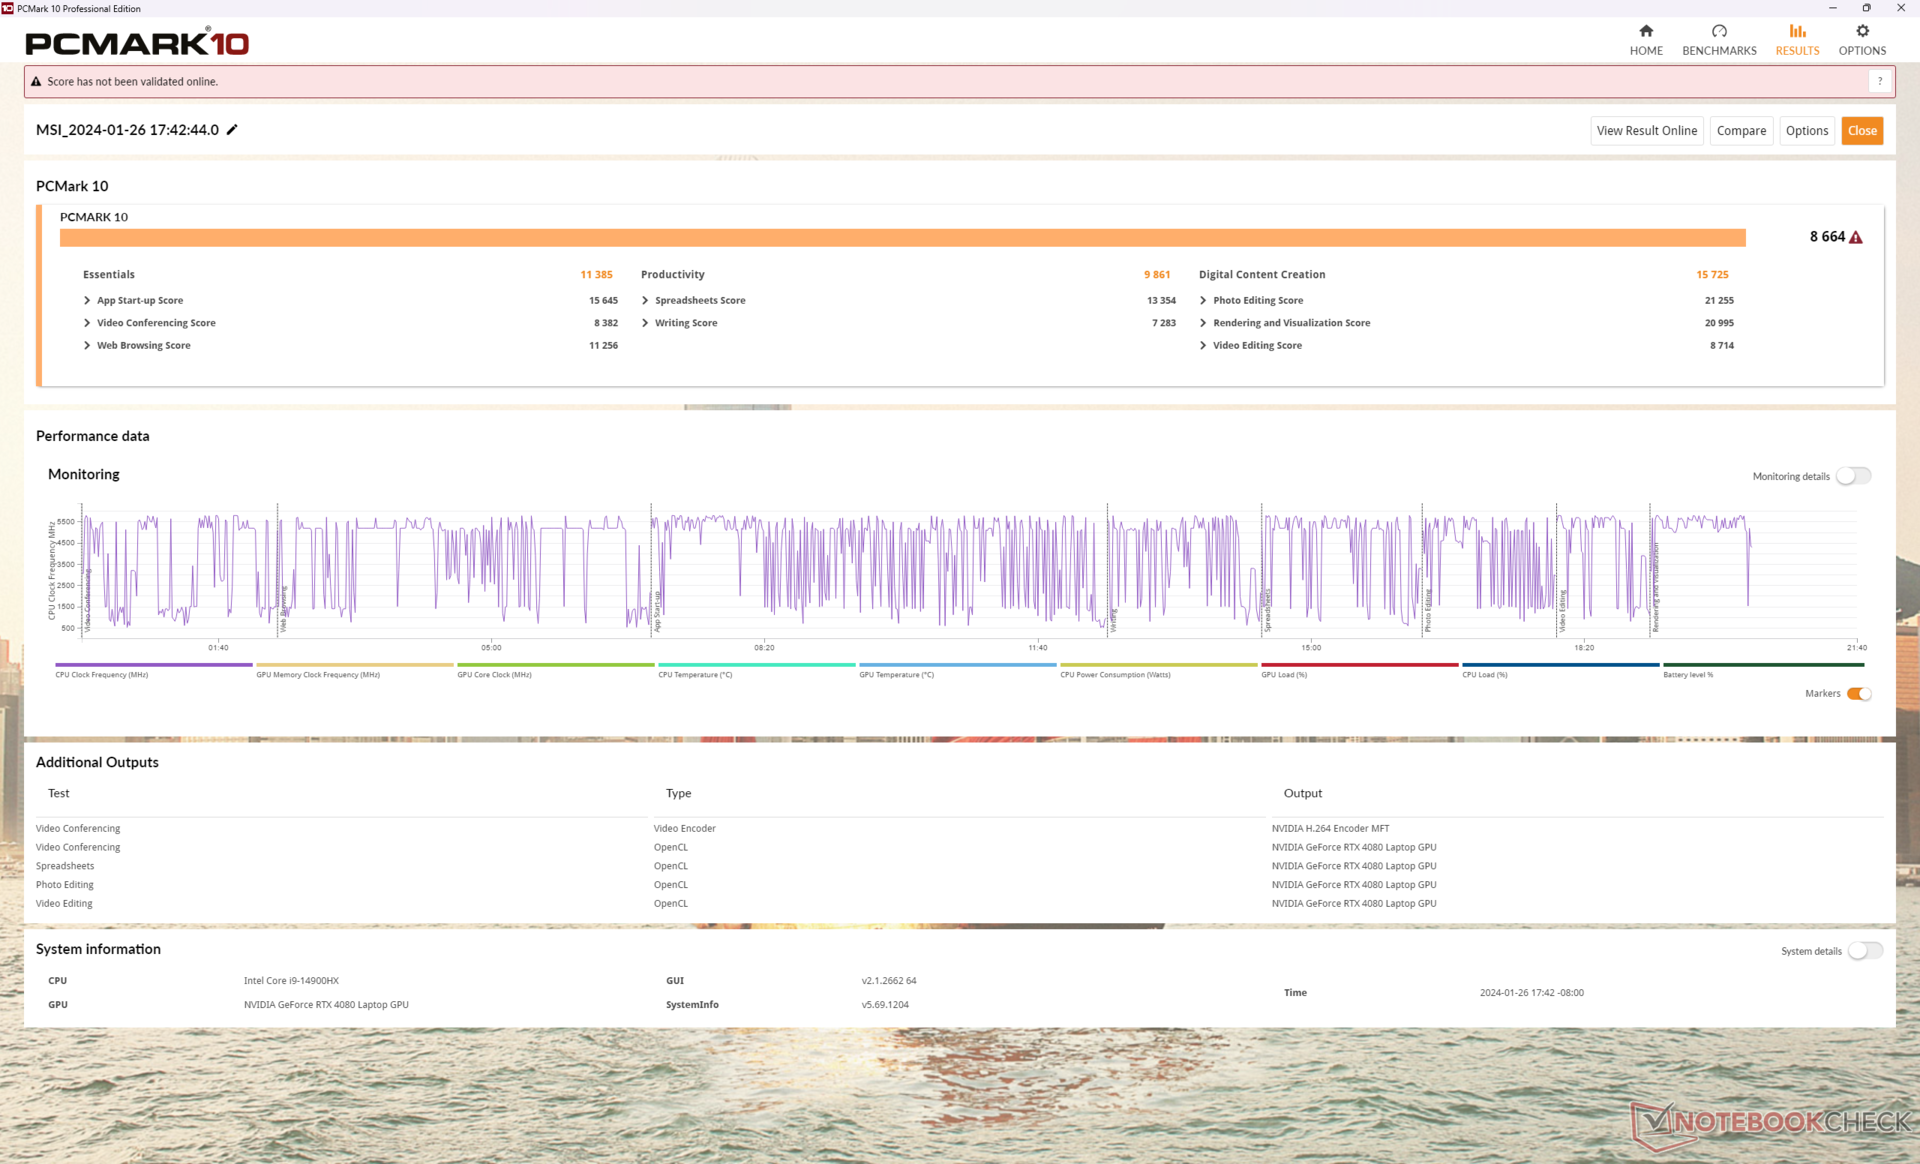
PCMark-resultaten är några av de bästa för en bärbar dator i övre mellanklassen tack vare den nya 14:e generationens CPU och 175 W GeForce RTX 4080 GPU med full effekt. RAM-prestandan är också snabbare än väntat med läs- och skrivhastigheter som är cirka 70 procent snabbare än på den äldre Vector GP66-designen.
CrossMark: Overall | Productivity | Creativity | Responsiveness
WebXPRT 3: Overall
WebXPRT 4: Overall
Mozilla Kraken 1.1: Total
| PCMark 10 / Score | |
| Genomsnitt Intel Core i9-14900HX, NVIDIA GeForce RTX 4080 Laptop GPU (7703 - 9223, n=7) | |
| MSI Vector 16 HX A14V | |
| MSI Vector GP66 12UGS | |
| Asus TUF Gaming A16 FA617XS | |
| Lenovo Legion 5 16IRX G9 | |
| Dell G16 7620 | |
| HP Victus 16-r0077ng | |
| PCMark 10 / Essentials | |
| Genomsnitt Intel Core i9-14900HX, NVIDIA GeForce RTX 4080 Laptop GPU (11255 - 12600, n=7) | |
| MSI Vector 16 HX A14V | |
| MSI Vector GP66 12UGS | |
| Asus TUF Gaming A16 FA617XS | |
| Lenovo Legion 5 16IRX G9 | |
| HP Victus 16-r0077ng | |
| Dell G16 7620 | |
| PCMark 10 / Productivity | |
| Asus TUF Gaming A16 FA617XS | |
| Genomsnitt Intel Core i9-14900HX, NVIDIA GeForce RTX 4080 Laptop GPU (6662 - 11410, n=7) | |
| MSI Vector GP66 12UGS | |
| MSI Vector 16 HX A14V | |
| Lenovo Legion 5 16IRX G9 | |
| HP Victus 16-r0077ng | |
| Dell G16 7620 | |
| PCMark 10 / Digital Content Creation | |
| MSI Vector 16 HX A14V | |
| Genomsnitt Intel Core i9-14900HX, NVIDIA GeForce RTX 4080 Laptop GPU (14211 - 16246, n=7) | |
| MSI Vector GP66 12UGS | |
| Lenovo Legion 5 16IRX G9 | |
| Asus TUF Gaming A16 FA617XS | |
| Dell G16 7620 | |
| HP Victus 16-r0077ng | |
| CrossMark / Overall | |
| MSI Vector 16 HX A14V | |
| Genomsnitt Intel Core i9-14900HX, NVIDIA GeForce RTX 4080 Laptop GPU (1992 - 2334, n=7) | |
| Lenovo Legion 5 16IRX G9 | |
| Dell G16 7620 | |
| Asus TUF Gaming A16 FA617XS | |
| CrossMark / Productivity | |
| MSI Vector 16 HX A14V | |
| Genomsnitt Intel Core i9-14900HX, NVIDIA GeForce RTX 4080 Laptop GPU (1812 - 2204, n=7) | |
| Lenovo Legion 5 16IRX G9 | |
| Asus TUF Gaming A16 FA617XS | |
| Dell G16 7620 | |
| CrossMark / Creativity | |
| MSI Vector 16 HX A14V | |
| Genomsnitt Intel Core i9-14900HX, NVIDIA GeForce RTX 4080 Laptop GPU (2327 - 2500, n=7) | |
| Lenovo Legion 5 16IRX G9 | |
| Asus TUF Gaming A16 FA617XS | |
| Dell G16 7620 | |
| CrossMark / Responsiveness | |
| MSI Vector 16 HX A14V | |
| Genomsnitt Intel Core i9-14900HX, NVIDIA GeForce RTX 4080 Laptop GPU (1520 - 2254, n=7) | |
| Lenovo Legion 5 16IRX G9 | |
| Dell G16 7620 | |
| Asus TUF Gaming A16 FA617XS | |
| WebXPRT 3 / Overall | |
| Genomsnitt Intel Core i9-14900HX, NVIDIA GeForce RTX 4080 Laptop GPU (310 - 345, n=7) | |
| MSI Vector 16 HX A14V | |
| Lenovo Legion 5 16IRX G9 | |
| MSI Vector GP66 12UGS | |
| HP Victus 16-r0077ng | |
| HP Victus 16-r0077ng | |
| Dell G16 7620 | |
| WebXPRT 4 / Overall | |
| Genomsnitt Intel Core i9-14900HX, NVIDIA GeForce RTX 4080 Laptop GPU (300 - 321, n=7) | |
| MSI Vector 16 HX A14V | |
| Lenovo Legion 5 16IRX G9 | |
| Asus TUF Gaming A16 FA617XS | |
| Dell G16 7620 | |
| HP Victus 16-r0077ng | |
| HP Victus 16-r0077ng | |
| Mozilla Kraken 1.1 / Total | |
| Dell G16 7620 | |
| HP Victus 16-r0077ng | |
| HP Victus 16-r0077ng | |
| MSI Vector GP66 12UGS | |
| Asus TUF Gaming A16 FA617XS | |
| Lenovo Legion 5 16IRX G9 | |
| MSI Vector 16 HX A14V | |
| Genomsnitt Intel Core i9-14900HX, NVIDIA GeForce RTX 4080 Laptop GPU (437 - 446, n=7) | |
* ... mindre är bättre
| PCMark 10 Score | 8664 poäng | |
Hjälp | ||
| AIDA64 / Memory Copy | |
| MSI Vector 16 HX A14V | |
| Genomsnitt Intel Core i9-14900HX (38028 - 83392, n=36) | |
| HP Victus 16-r0077ng | |
| Lenovo Legion 5 16IRX G9 | |
| Asus TUF Gaming A16 FA617XS | |
| Dell G16 7620 | |
| MSI Vector GP66 12UGS | |
| AIDA64 / Memory Read | |
| MSI Vector 16 HX A14V | |
| Genomsnitt Intel Core i9-14900HX (43306 - 87568, n=36) | |
| Lenovo Legion 5 16IRX G9 | |
| HP Victus 16-r0077ng | |
| Dell G16 7620 | |
| Asus TUF Gaming A16 FA617XS | |
| MSI Vector GP66 12UGS | |
| AIDA64 / Memory Write | |
| MSI Vector 16 HX A14V | |
| Asus TUF Gaming A16 FA617XS | |
| Genomsnitt Intel Core i9-14900HX (37146 - 80589, n=36) | |
| HP Victus 16-r0077ng | |
| Dell G16 7620 | |
| Lenovo Legion 5 16IRX G9 | |
| MSI Vector GP66 12UGS | |
| AIDA64 / Memory Latency | |
| Dell G16 7620 | |
| HP Victus 16-r0077ng | |
| MSI Vector GP66 12UGS | |
| Asus TUF Gaming A16 FA617XS | |
| Lenovo Legion 5 16IRX G9 | |
| Genomsnitt Intel Core i9-14900HX (76.1 - 105, n=36) | |
| MSI Vector 16 HX A14V | |
* ... mindre är bättre
DPC-fördröjning
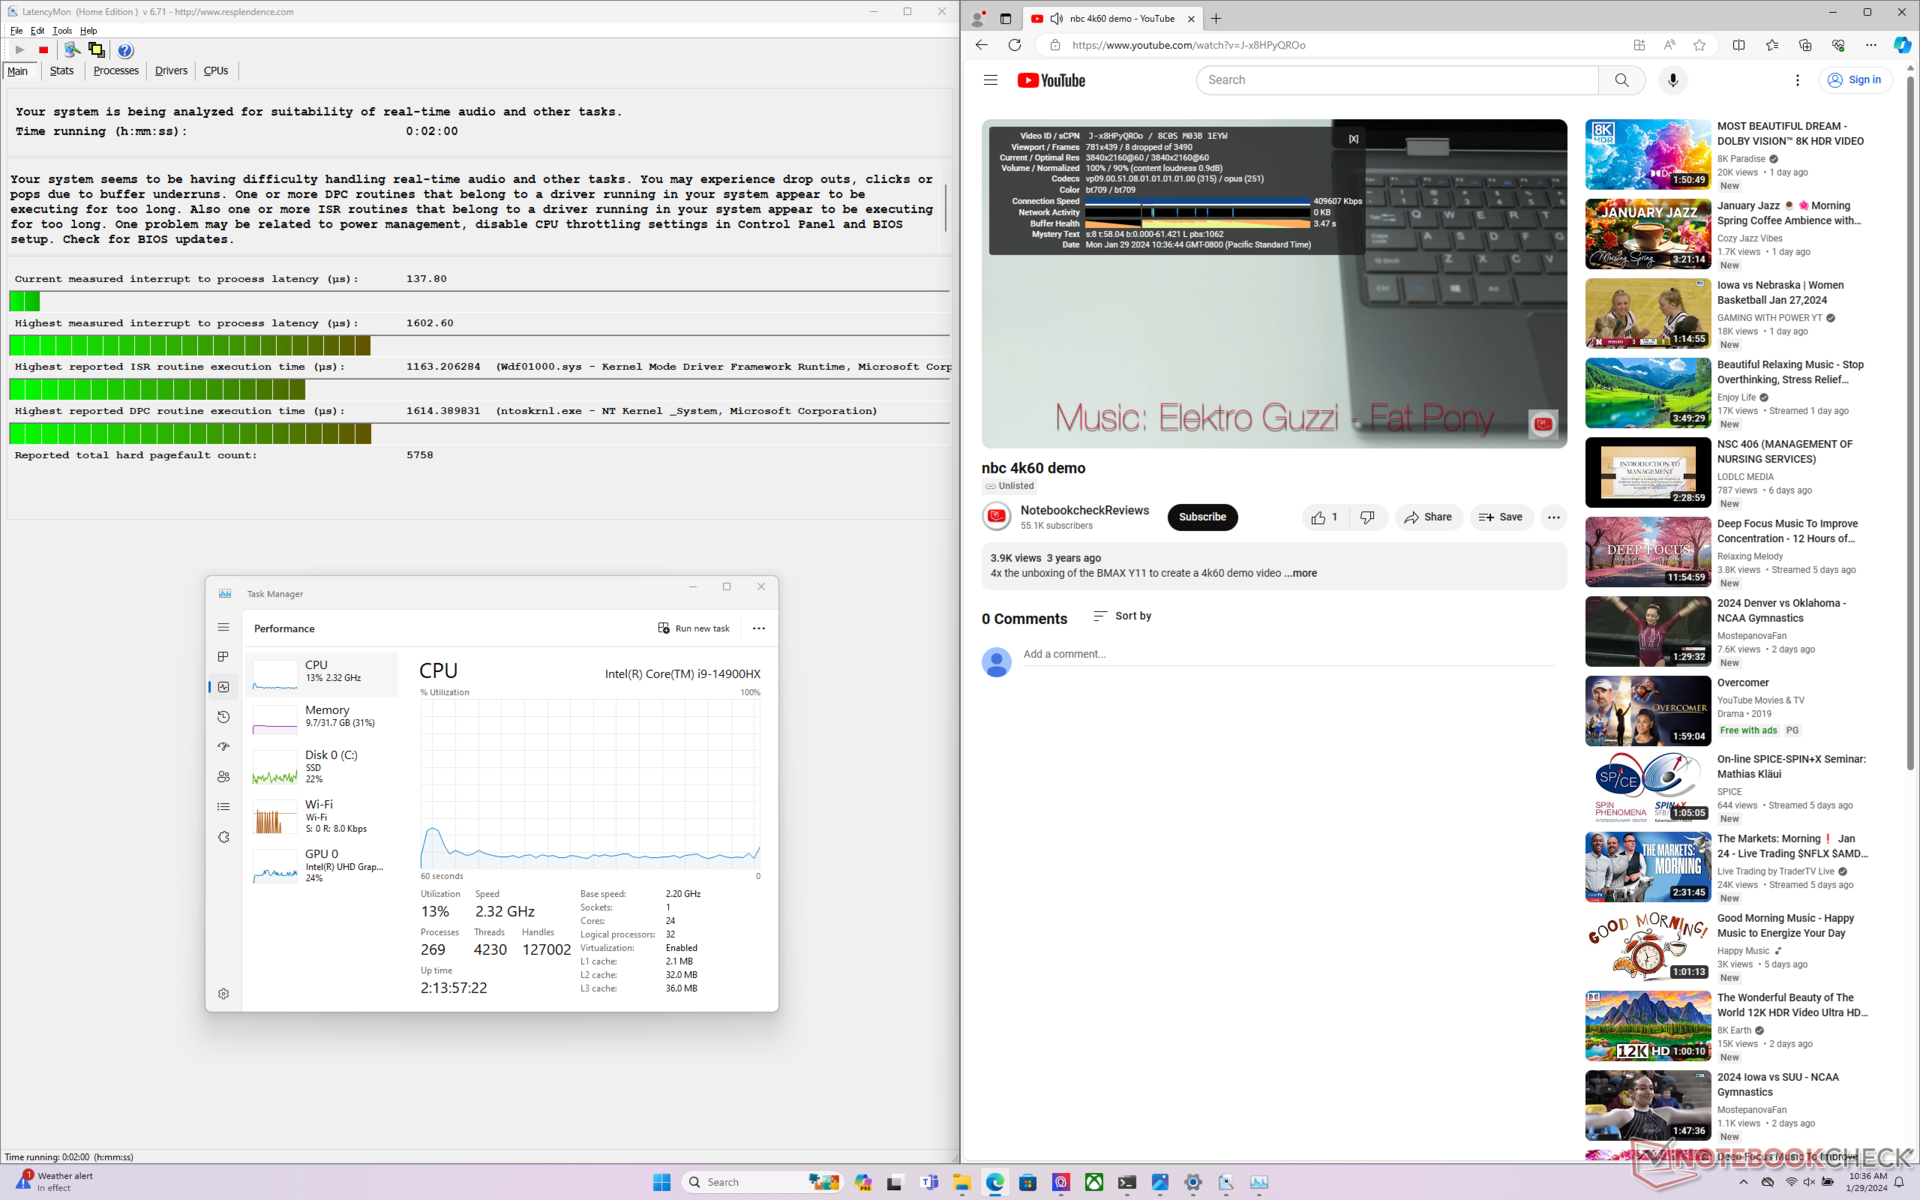
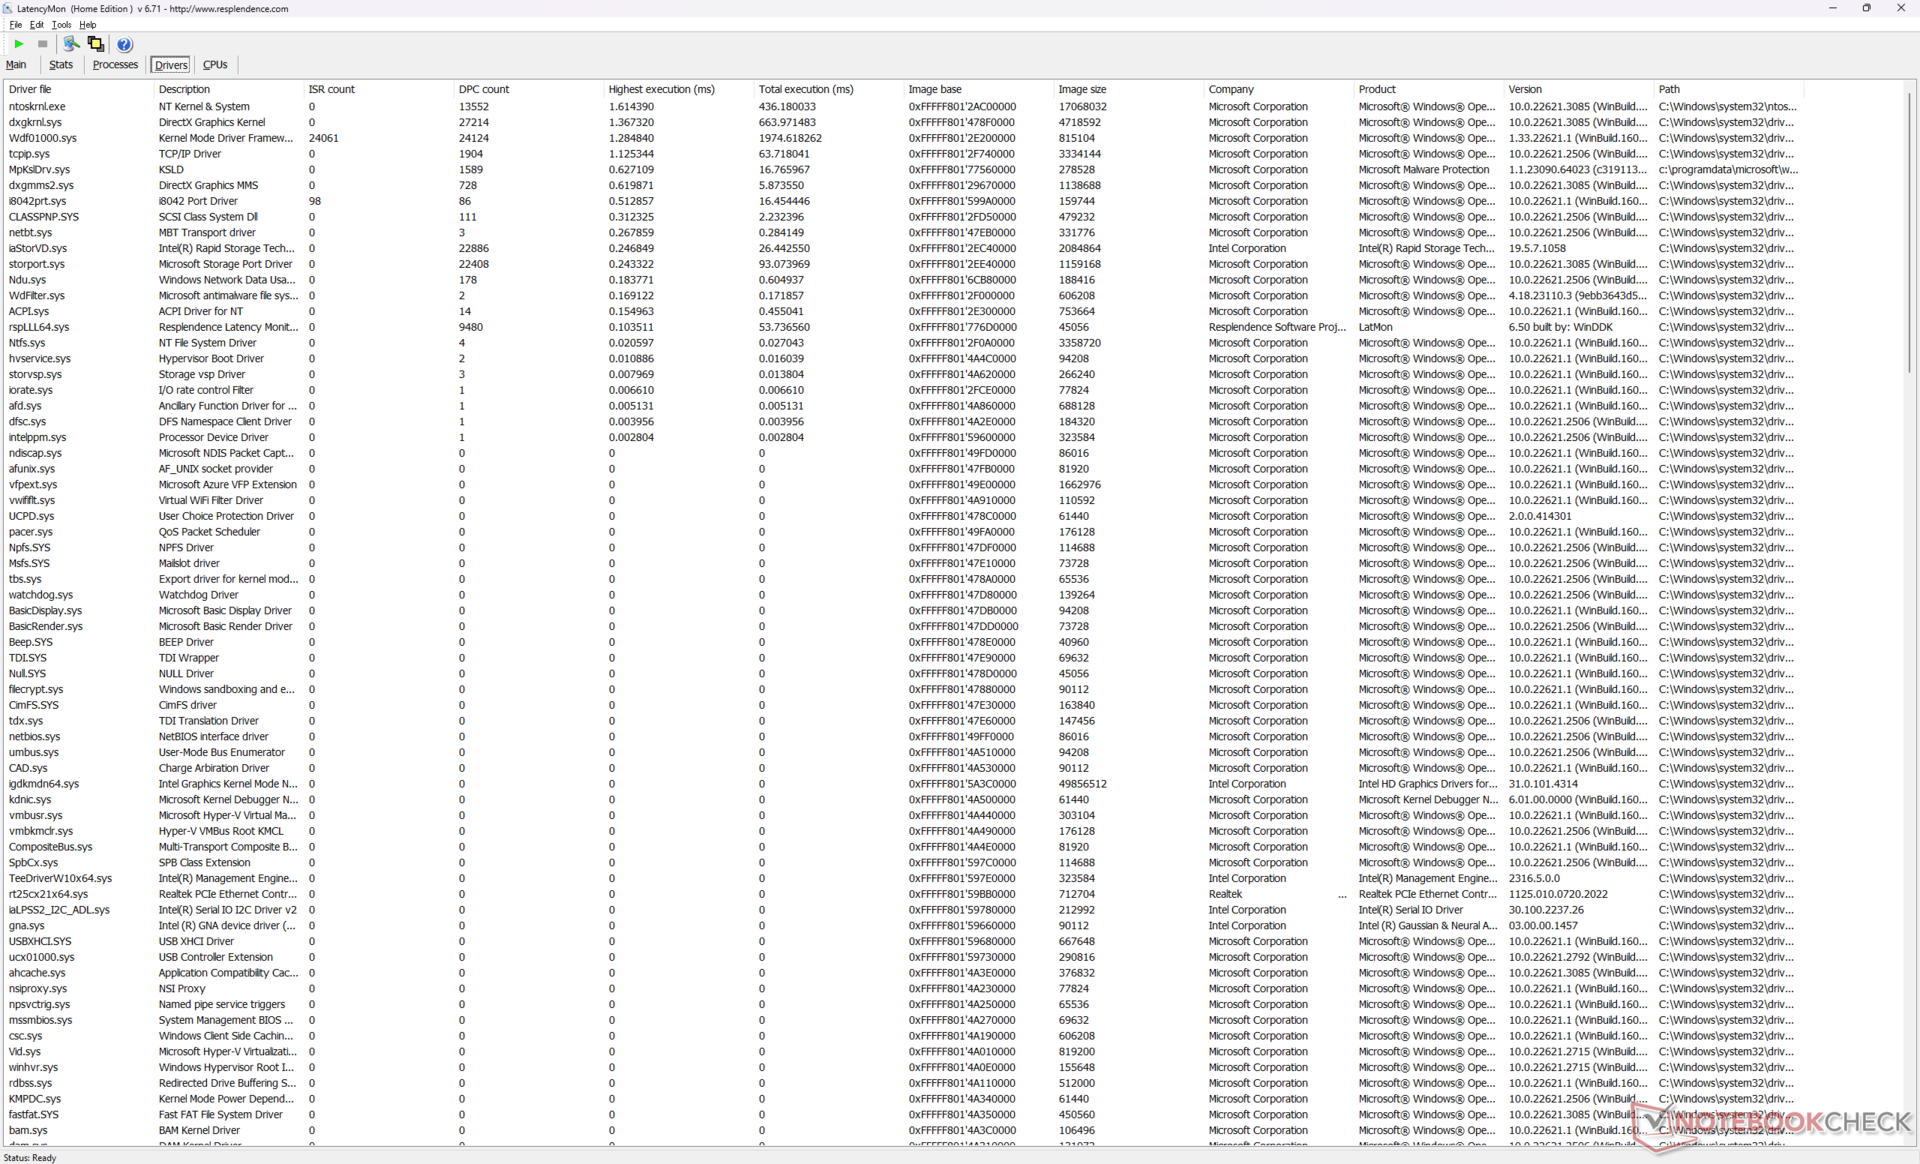
LatencyMon avslöjar DPC-problem när flera flikar öppnas på vår hemsida samt 8 tappade bildrutor under en minutlång 4K60-testvideo. De tappade bildrutorna inträffade med nästan regelbundna intervall, vilket tyder på ett problem relaterat till bakgrundsaktivitet eller en underliggande drivrutin.
| DPC Latencies / LatencyMon - interrupt to process latency (max), Web, Youtube, Prime95 | |
| MSI Vector GP66 12UGS | |
| Lenovo Legion 5 16IRX G9 | |
| HP Victus 16-r0077ng | |
| MSI Vector 16 HX A14V | |
| Asus TUF Gaming A16 FA617XS | |
| Dell G16 7620 | |
* ... mindre är bättre
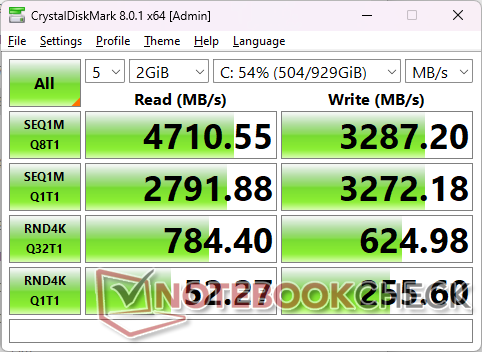
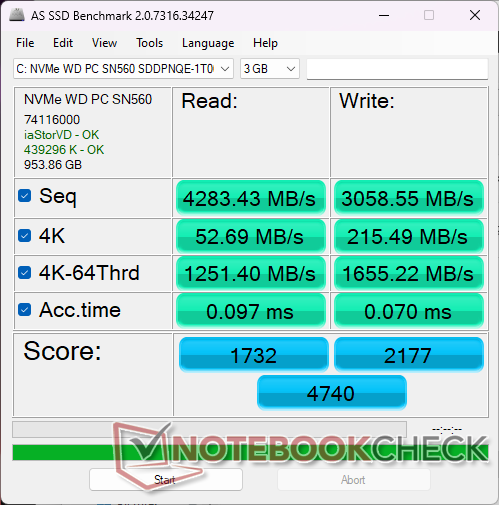
Lagringsenheter
Vår testenhet är konfigurerad med mellanklassens 1 TB Western Digital PC SN560 PCIe4 x4 NVMe SSD för stabila överföringshastigheter på cirka 4900 MB/s även under stress. Modellen stöder även PCIe5 x4 SSD-enheter precis som på den större Titan 18 HX, men den låga tillgängligheten av PCIe5 SSD-enheter innebär att de allra flesta konfigurationer i naturen för närvarande endast levereras med PCIe4-enheter.

| Drive Performance rating - Percent | |
| Lenovo Legion 5 16IRX G9 | |
| Dell G16 7620 | |
| MSI Vector GP66 12UGS | |
| HP Victus 16-r0077ng | |
| MSI Vector 16 HX A14V | |
| Asus TUF Gaming A16 FA617XS | |
* ... mindre är bättre
Disk Throttling: DiskSpd Read Loop, Queue Depth 8
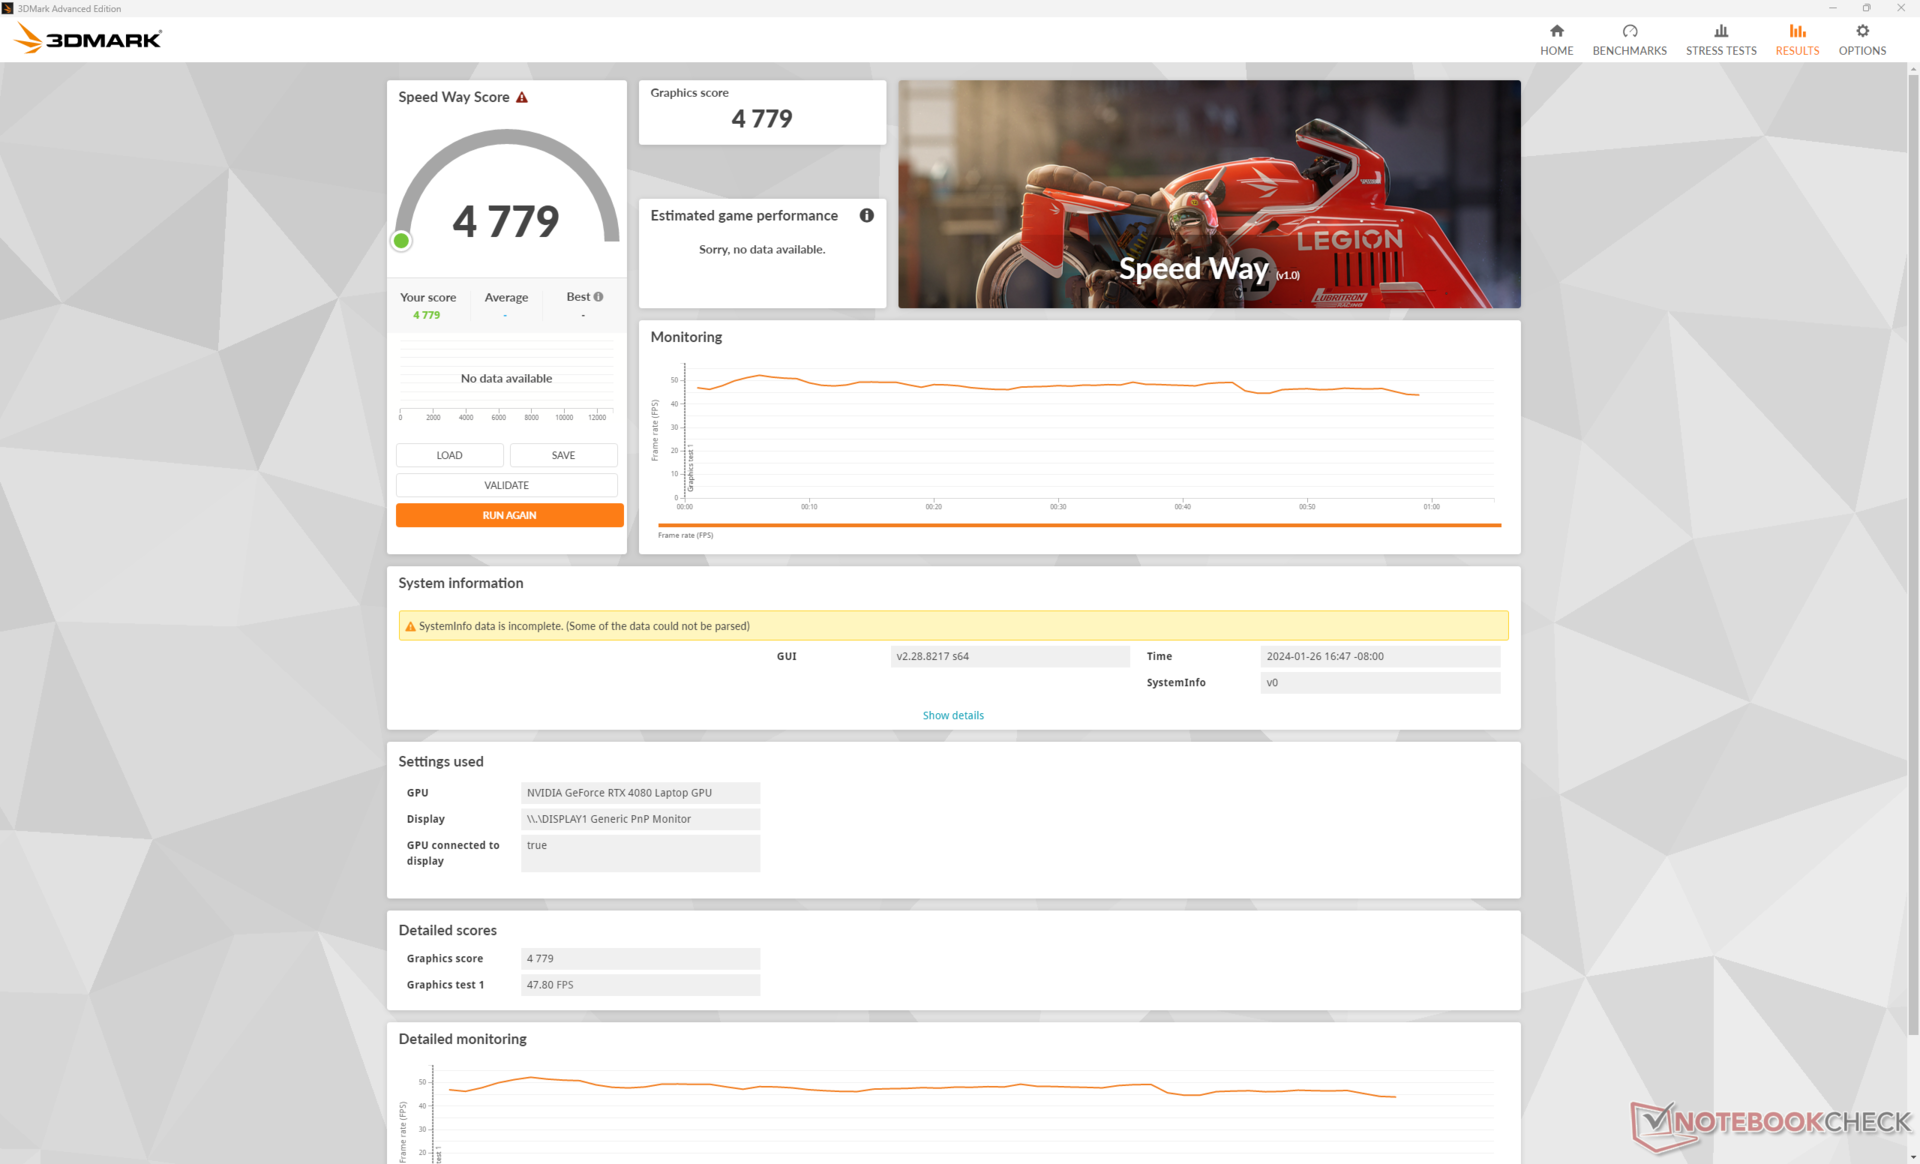
GPU-prestanda - där Vector briljerar
Medan de flesta andra bärbara speldatorer siktar på lägre TGP-värden, inklusive den utgående GP66, siktar Vector 16 HX på maximala 175 W för snabbare prestanda. Följaktligen är vårt MSI-system cirka 8 till 10 procent snabbare än den genomsnittliga bärbara datorn i vår databas som är utrustad med samma mobila GeForce RTX 4080 GPU. Det är inte så stor marginal, men kraftanvändare och spelare som vill pressa så mycket GPU-prestanda som möjligt från sina maskiner kommer att vilja överväga Vector 16 HX över alternativ med samma grafikalternativ som HP Omen 16.
Uppgradering till RTX 4090 förväntas öka grafikprestandan med ca 10 procent medan en uppgradering till RTX 4070 och RTX 4060 förväntas minska prestandan med ca 30 till 35 procent respektive 40 till 45 procent.
| Kraftprofil | Fysikresultat | Poäng för grafik | Kombinerat resultat |
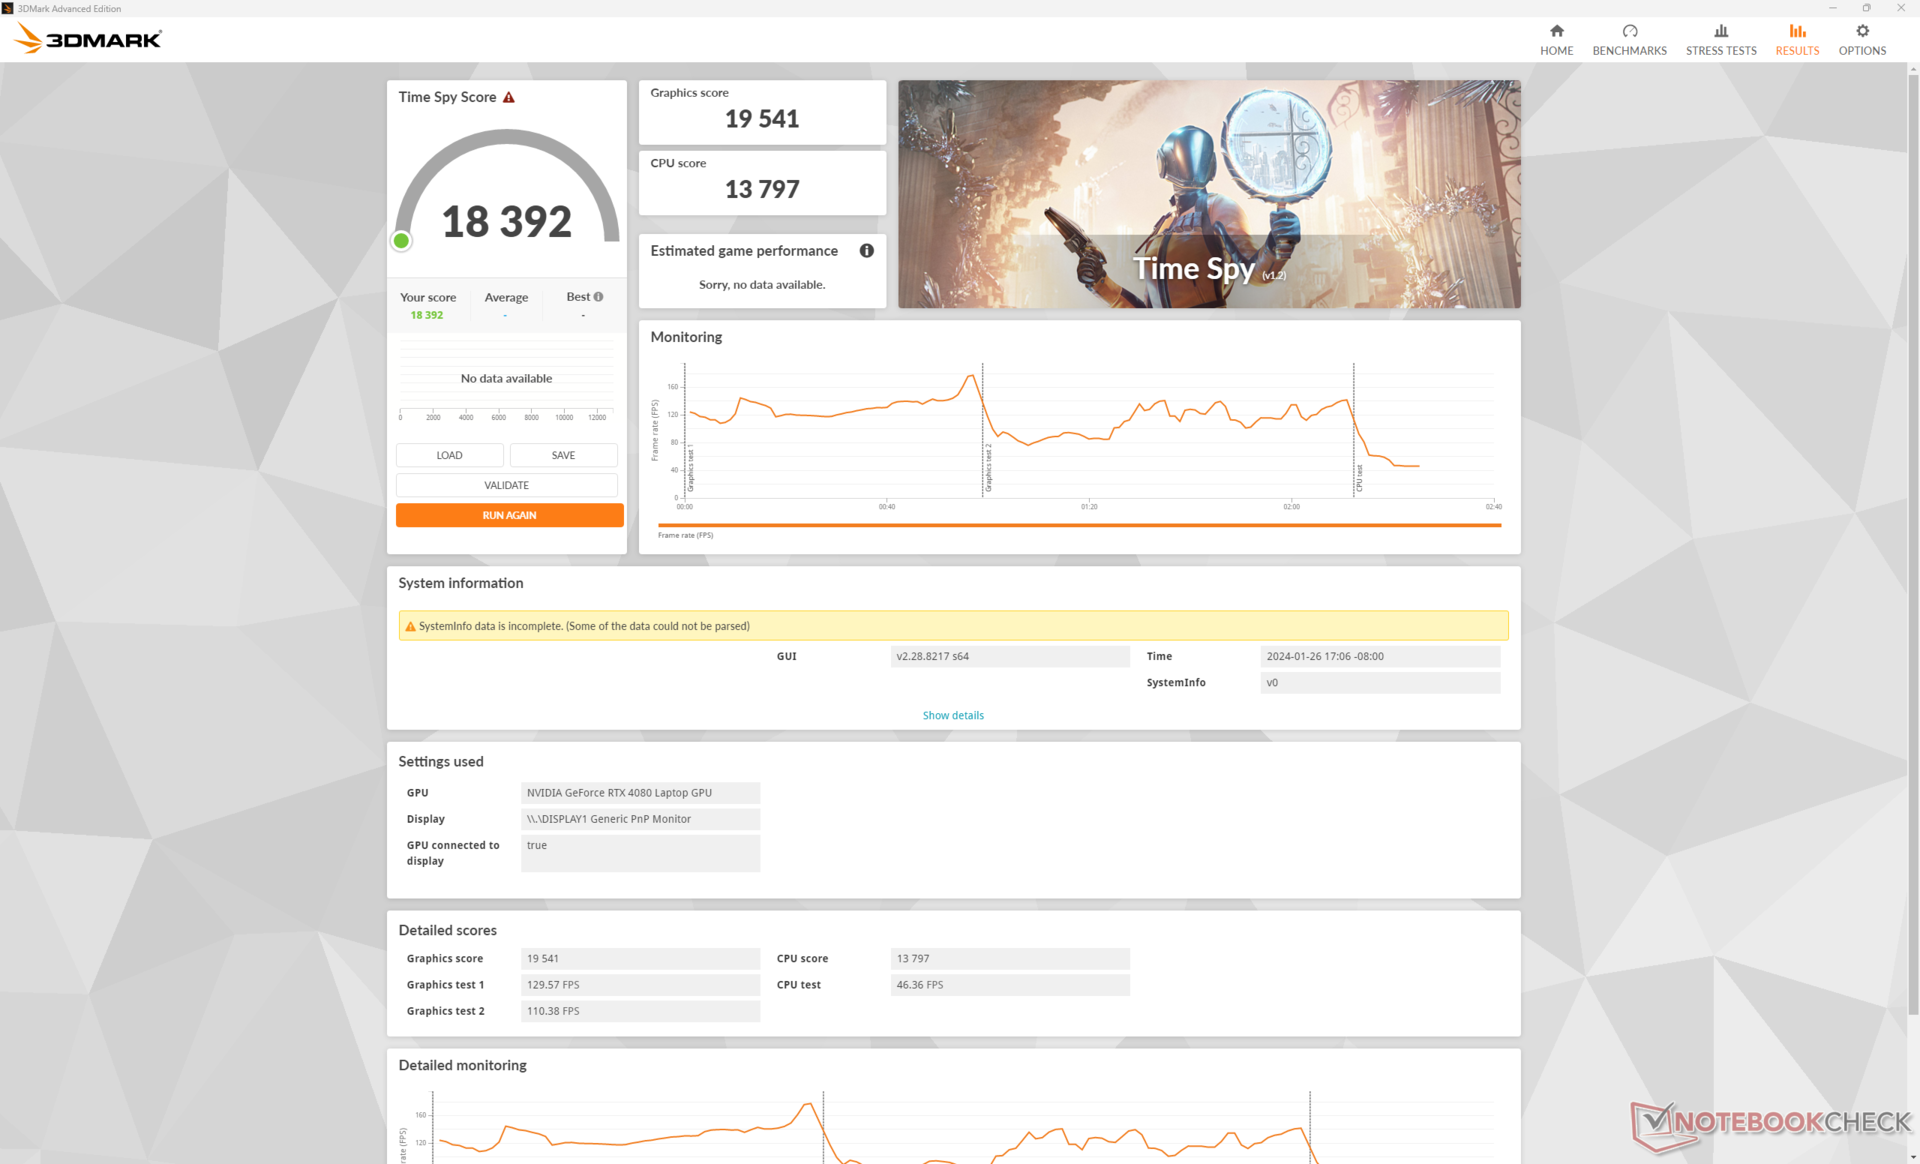
| Extrem prestanda (med Cooler Boost på) | 13797 | 19541 | 18392 |
| Extrem prestanda (med kylarförstärkning av) | 14118 (-0%) | 19471 (-0%) | 18423 (-0%) |
| Balanserat läge | 13858 (-0%) | 16466 (-16%) | 16013 (-13%) |
| Batteridrift | 8307 (-40%) | 8955 (-54%) | 8851 (-52%) |
Precis som på andra MSI-laptops med Cooler Boost verkar prestandan inte påverkas av funktionen så länge du använder Extreme Performance-läget, baserat på våra Time Spy -resultat i tabellen ovan. Att gå ner till balanserat läge kommer dock att minska grafikprestandan med cirka 16 procent.
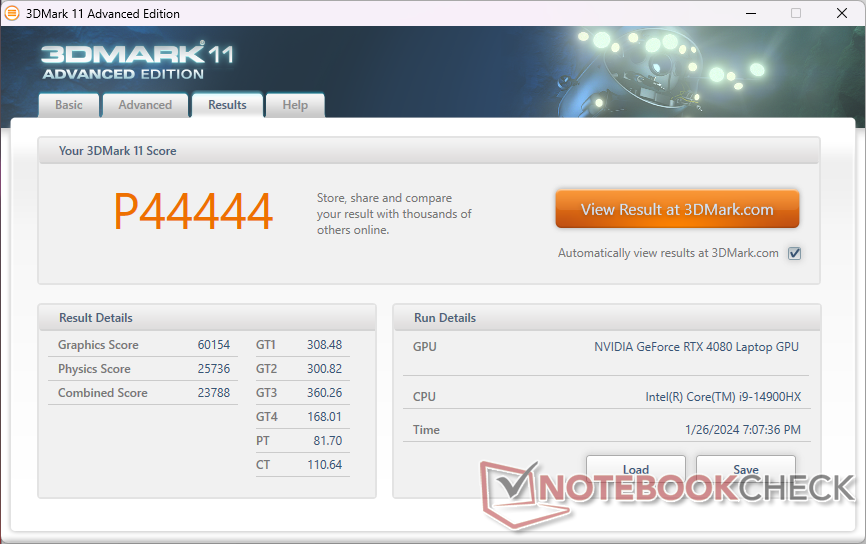
| 3DMark 11 Performance | 44444 poäng | |
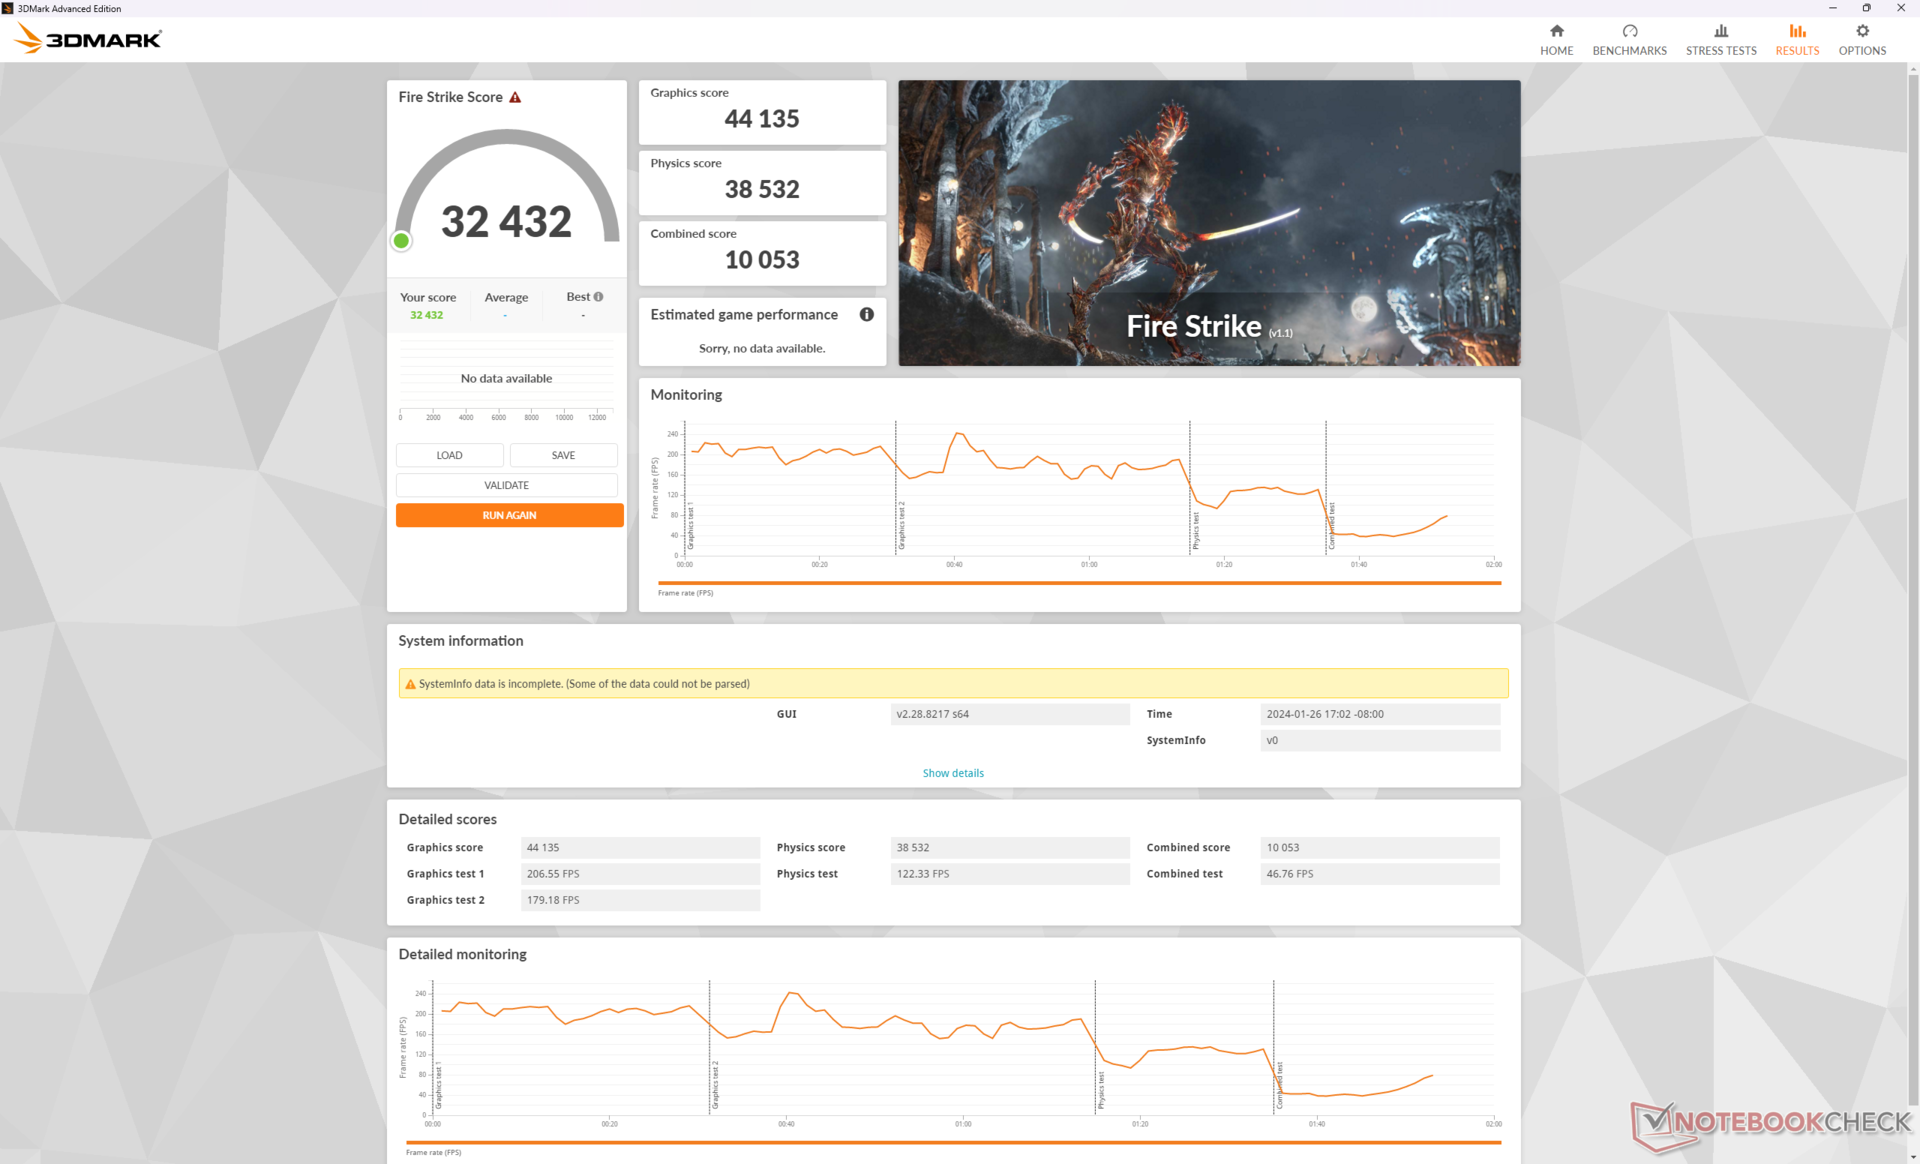
| 3DMark Fire Strike Score | 32432 poäng | |
| 3DMark Time Spy Score | 18392 poäng | |
Hjälp | ||
* ... mindre är bättre
Spelprestanda
Alla aktuella titlar körs smidigt i den inbyggda 1600p-upplösningen med de flesta inställningarna på max. Du kanske dock vill överväga att aktivera v-sync eller begränsa bildfrekvensen till 120 på grund av avsaknaden av G-Sync. Baldur's Gate, till exempel, har i genomsnitt 129 FPS vid 1440p vilket kan resultera i skärmrivning på 240 Hz-skärmen om bildfrekvensen är upplåst.
DLSS rekommenderas om du spelar på 4K eftersom den mobila RTX 4080 är betydligt svagare än sin stationära motsvarighet. Cyberpunk 2077 skulle i genomsnitt bara ha 18,5 FPS vid 4K Ultra RT-inställningar, men genom att aktivera både DLSS Auto och ramgenerering skulle genomsnittet öka till 75,8 FPS.
| Performance rating - Percent | |
| MSI Vector 16 HX A14V | |
| Lenovo Legion 5 16IRX G9 | |
| MSI Vector GP66 12UGS | |
| HP Victus 16-r0077ng | |
| Dell G16 7620 | |
| Asus TUF Gaming A16 FA617XS | |
| The Witcher 3 - 1920x1080 Ultra Graphics & Postprocessing (HBAO+) | |
| MSI Vector 16 HX A14V | |
| MSI Vector GP66 12UGS | |
| HP Victus 16-r0077ng | |
| Asus TUF Gaming A16 FA617XS | |
| Lenovo Legion 5 16IRX G9 | |
| Dell G16 7620 | |
| GTA V - 1920x1080 Highest AA:4xMSAA + FX AF:16x | |
| MSI Vector 16 HX A14V | |
| MSI Vector GP66 12UGS | |
| Lenovo Legion 5 16IRX G9 | |
| HP Victus 16-r0077ng | |
| Dell G16 7620 | |
| Asus TUF Gaming A16 FA617XS | |
| Final Fantasy XV Benchmark - 1920x1080 High Quality | |
| MSI Vector 16 HX A14V | |
| MSI Vector GP66 12UGS | |
| HP Victus 16-r0077ng | |
| Lenovo Legion 5 16IRX G9 | |
| Dell G16 7620 | |
| Asus TUF Gaming A16 FA617XS | |
| Strange Brigade - 1920x1080 ultra AA:ultra AF:16 | |
| MSI Vector 16 HX A14V | |
| MSI Vector GP66 12UGS | |
| Lenovo Legion 5 16IRX G9 | |
| HP Victus 16-r0077ng | |
| Asus TUF Gaming A16 FA617XS | |
| Dell G16 7620 | |
| Dota 2 Reborn - 1920x1080 ultra (3/3) best looking | |
| MSI Vector 16 HX A14V | |
| Lenovo Legion 5 16IRX G9 | |
| MSI Vector GP66 12UGS | |
| Dell G16 7620 | |
| HP Victus 16-r0077ng | |
| Asus TUF Gaming A16 FA617XS | |
| X-Plane 11.11 - 1920x1080 high (fps_test=3) | |
| MSI Vector 16 HX A14V | |
| Lenovo Legion 5 16IRX G9 | |
| MSI Vector GP66 12UGS | |
| Dell G16 7620 | |
| HP Victus 16-r0077ng | |
| Asus TUF Gaming A16 FA617XS | |
| Baldur's Gate 3 | |
| 1920x1080 High Preset AA:T | |
| MSI Vector 16 HX A14V | |
| Genomsnitt NVIDIA GeForce RTX 4080 Laptop GPU (122.2 - 183.5, n=4) | |
| Framework Laptop 16 | |
| Lenovo ThinkPad Z16 Gen 2 | |
| 1920x1080 Ultra Preset AA:T | |
| MSI Vector 16 HX A14V | |
| Genomsnitt NVIDIA GeForce RTX 4080 Laptop GPU (111.8 - 181.2, n=7) | |
| Framework Laptop 16 | |
| Lenovo ThinkPad Z16 Gen 2 | |
| 2560x1440 Ultra Preset AA:T | |
| MSI Vector 16 HX A14V | |
| Genomsnitt NVIDIA GeForce RTX 4080 Laptop GPU (88.3 - 129.3, n=7) | |
| Framework Laptop 16 | |
| Lenovo ThinkPad Z16 Gen 2 | |
| 3840x2160 Ultra Preset AA:T | |
| MSI Vector 16 HX A14V | |
| Genomsnitt NVIDIA GeForce RTX 4080 Laptop GPU (48.8 - 68.4, n=5) | |
| Framework Laptop 16 | |
Witcher 3 FPS Chart
| låg | med. | hög | ultra | QHD | 4K | |
|---|---|---|---|---|---|---|
| GTA V (2015) | 187.1 | 185.7 | 181.9 | 136.5 | 128.8 | 158.6 |
| The Witcher 3 (2015) | 640 | 513.3 | 384.6 | 183.3 | 121.2 | |
| Dota 2 Reborn (2015) | 217 | 194.8 | 186.7 | 175 | 168.4 | |
| Final Fantasy XV Benchmark (2018) | 232 | 219 | 178.8 | 142 | 79.5 | |
| X-Plane 11.11 (2018) | 204 | 177.4 | 137.7 | 118.1 | ||
| Far Cry 5 (2018) | 180 | 167 | 161 | 154 | 97 | |
| Strange Brigade (2018) | 505 | 405 | 378 | 349 | 248 | 123.2 |
| Tiny Tina's Wonderlands (2022) | 344 | 297.1 | 212.8 | 167.1 | 114.8 | 60.3 |
| F1 22 (2022) | 339 | 324 | 297 | 81.2 | 76.9 | 39.6 |
| Baldur's Gate 3 (2023) | 228.5 | 204.3 | 183.5 | 181.2 | 129.3 | 68.4 |
| Cyberpunk 2077 (2023) | 143.4 | 135.3 | 127.1 | 118.6 | 79.4 | 36.6 |
Utsläpp - högt och stolt
Buller från systemet
Systemet är ganska högljutt även när det bara går på tomgång på skrivbordet med strömprofilerna Balanserad eller Tyst. Fläktljudet vid körning Witcher 3 i läget Extreme Performance skulle ligga på 62 dB(A) oavsett inställningen för Cooler Boost. Området 60+ dB(A) är hem för några av de mest högljudda bärbara datorerna i vår databas till den punkt där hörlurar rekommenderas för en bättre spelupplevelse.
Om du spelar i balanserat läge sänks fläktljudet avsevärt till 54 dB(A). Även om det fortfarande är högt är det inte i närheten av lika illa som i läget Extreme Performance. Användare kan därför vilja spela i läget Balanserat istället för läget Extrem prestanda, även om det innebär en 16-procentig minskning av GPU-prestandan som nämnts ovan.
Ljudnivå
| Låg belastning |
| 33.5 / 33.5 / 33.5 dB(A) |
| Hög belastning |
| 52.1 / 62 dB(A) |
 | ||
30 dB tyst 40 dB(A) hörbar 50 dB(A) högt ljud |
||
min: | ||
| MSI Vector 16 HX A14V GeForce RTX 4080 Laptop GPU, i9-14900HX, WD PC SN560 SDDPNQE-1T00 | MSI Vector GP66 12UGS GeForce RTX 3070 Ti Laptop GPU, i9-12900H | Lenovo Legion 5 16IRX G9 GeForce RTX 4060 Laptop GPU, i7-14650HX, Samsung PM9A1 MZVL21T0HCLR | HP Victus 16-r0077ng GeForce RTX 4070 Laptop GPU, i7-13700H, Kioxia XG8 KXG80ZNV1T02 | Asus TUF Gaming A16 FA617XS Radeon RX 7600S, R9 7940HS, Micron 2400 MTFDKBA512QFM | Dell G16 7620 GeForce RTX 3060 Laptop GPU, i7-12700H, WDC PC SN810 512GB | |
|---|---|---|---|---|---|---|
| Noise | 17% | 11% | 14% | 15% | 18% | |
| av / miljö * (dB) | 23.2 | 22.9 1% | 24 -3% | 25 -8% | 25 -8% | 23.2 -0% |
| Idle Minimum * (dB) | 33.5 | 23.4 30% | 24 28% | 28 16% | 25 25% | 28.3 16% |
| Idle Average * (dB) | 33.5 | 23.4 30% | 28.8 14% | 29 13% | 26 22% | 28.8 14% |
| Idle Maximum * (dB) | 33.5 | 27.4 18% | 32 4% | 30 10% | 28 16% | 28.9 14% |
| Load Average * (dB) | 52.1 | 36 31% | 45.5 13% | 43 17% | 43 17% | 32.4 38% |
| Witcher 3 ultra * (dB) | 62 | 58.2 6% | 53.1 14% | 46 26% | 51 18% | 48.3 22% |
| Load Maximum * (dB) | 62 | 58 6% | 55.7 10% | 48 23% | 53 15% | 48.1 22% |
* ... mindre är bättre
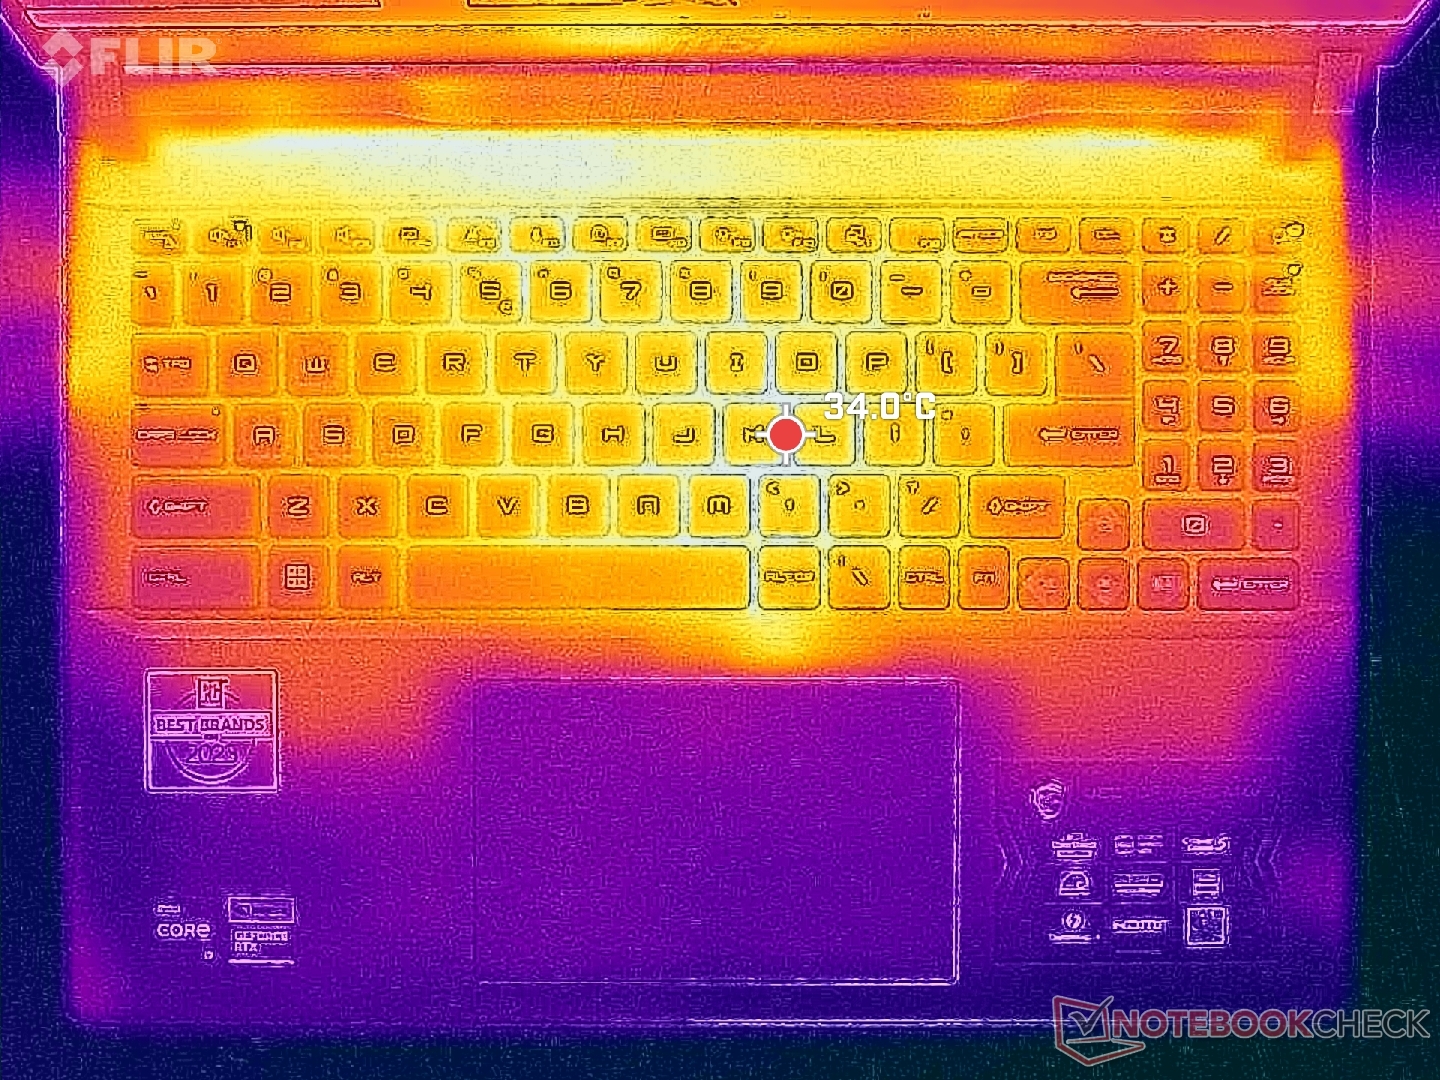
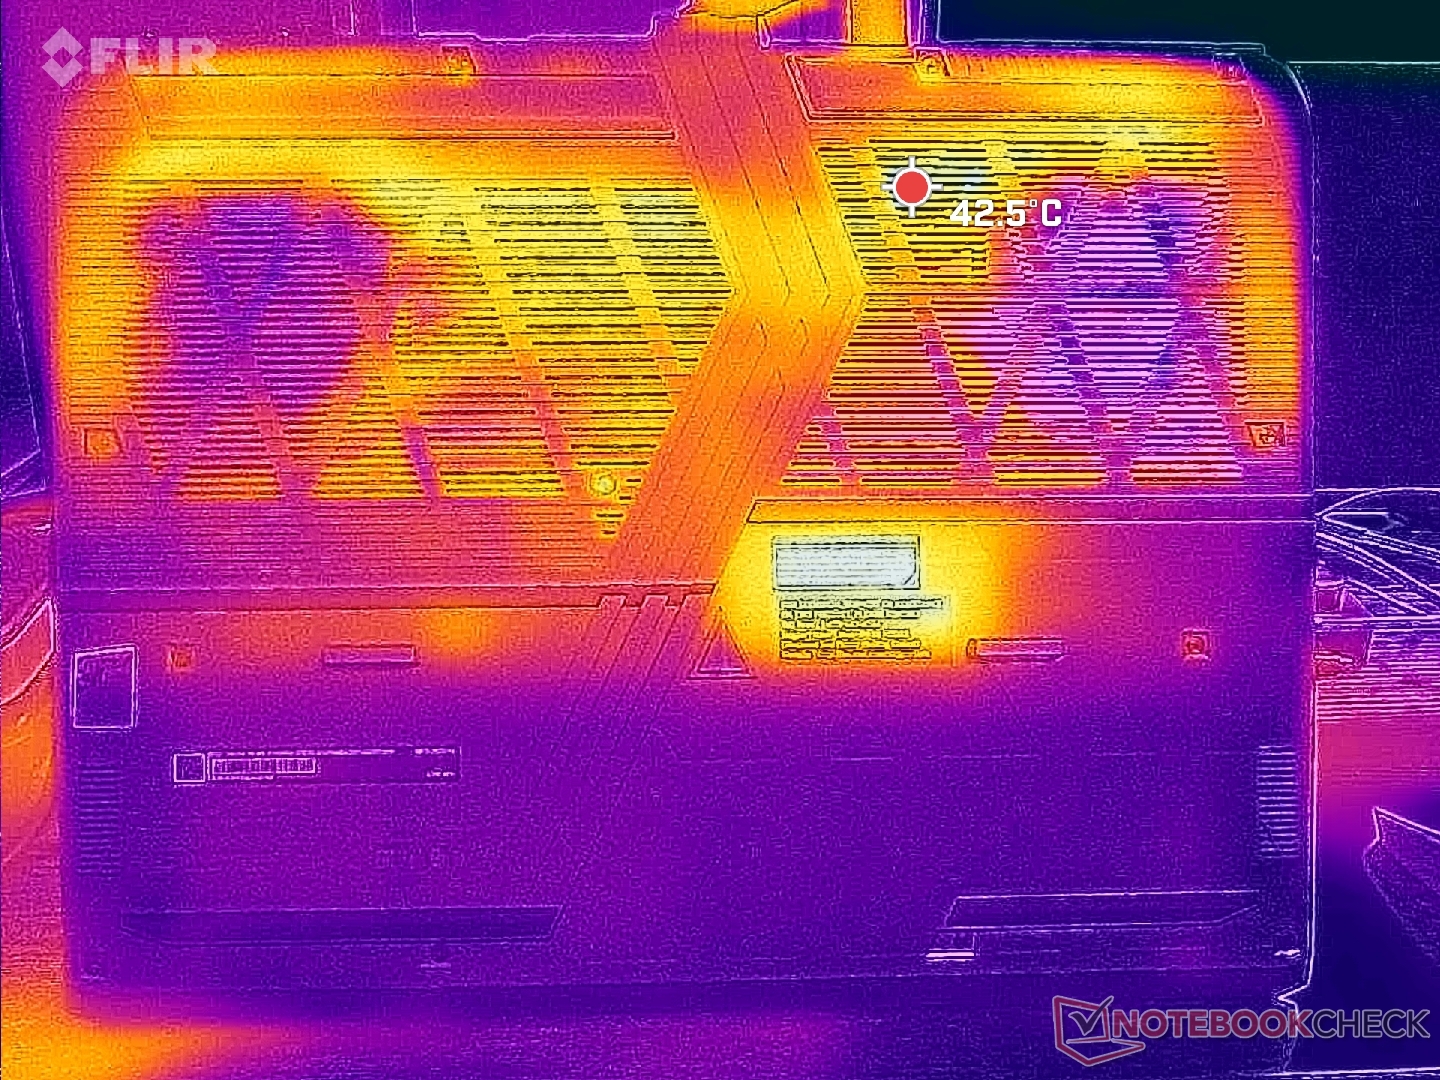
Temperatur
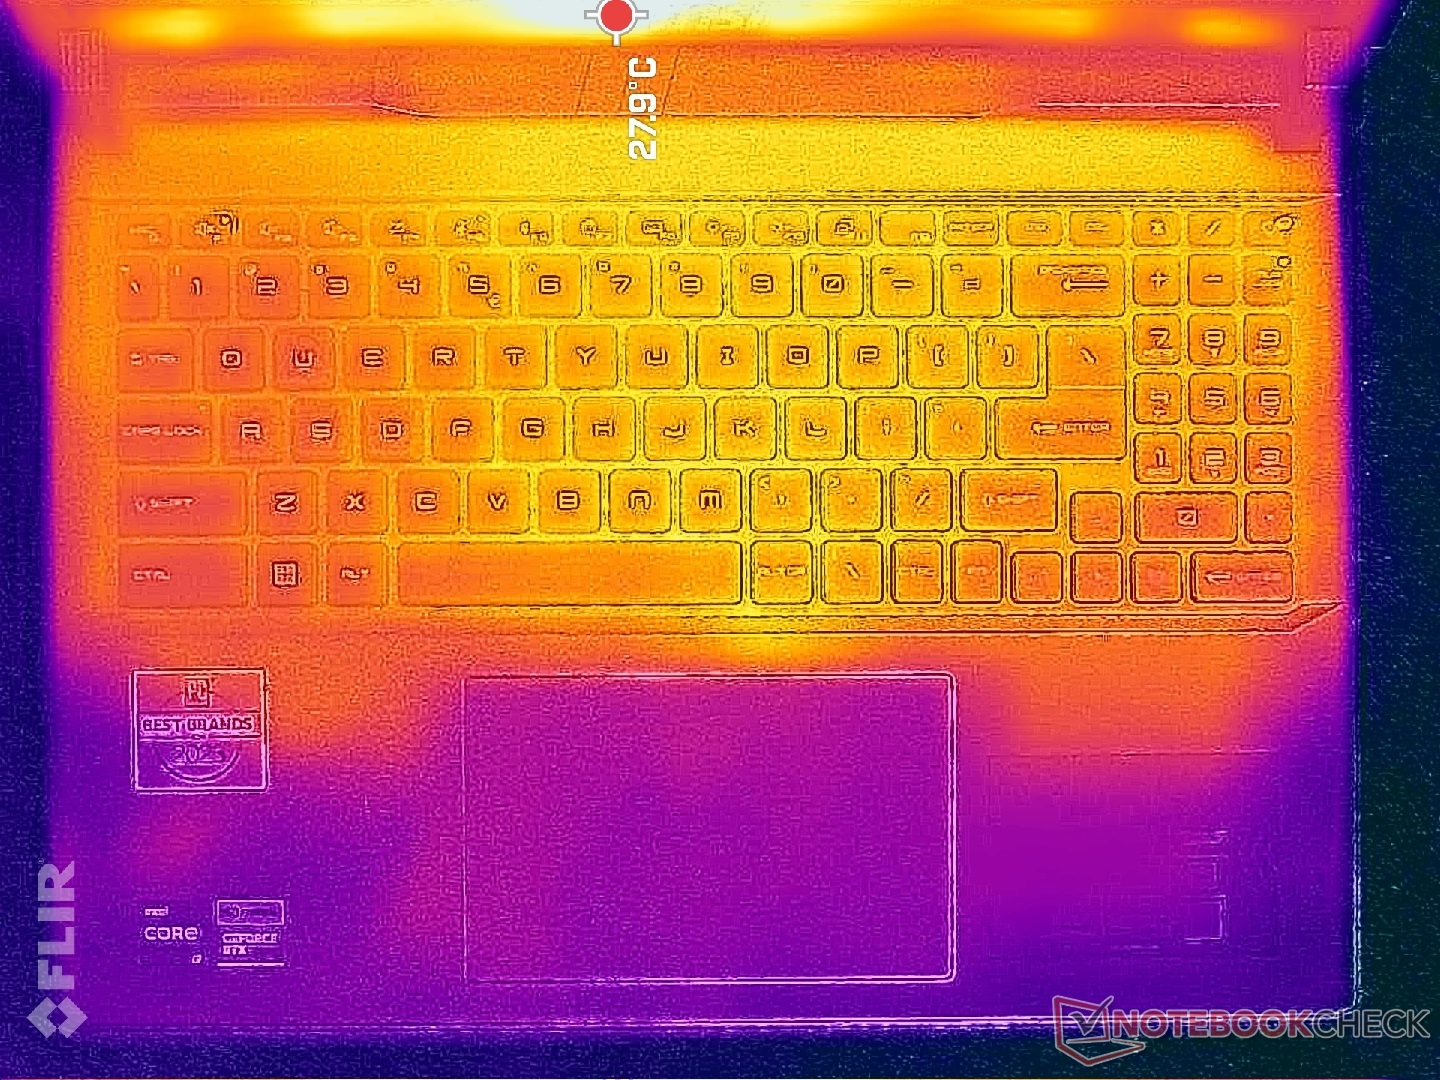
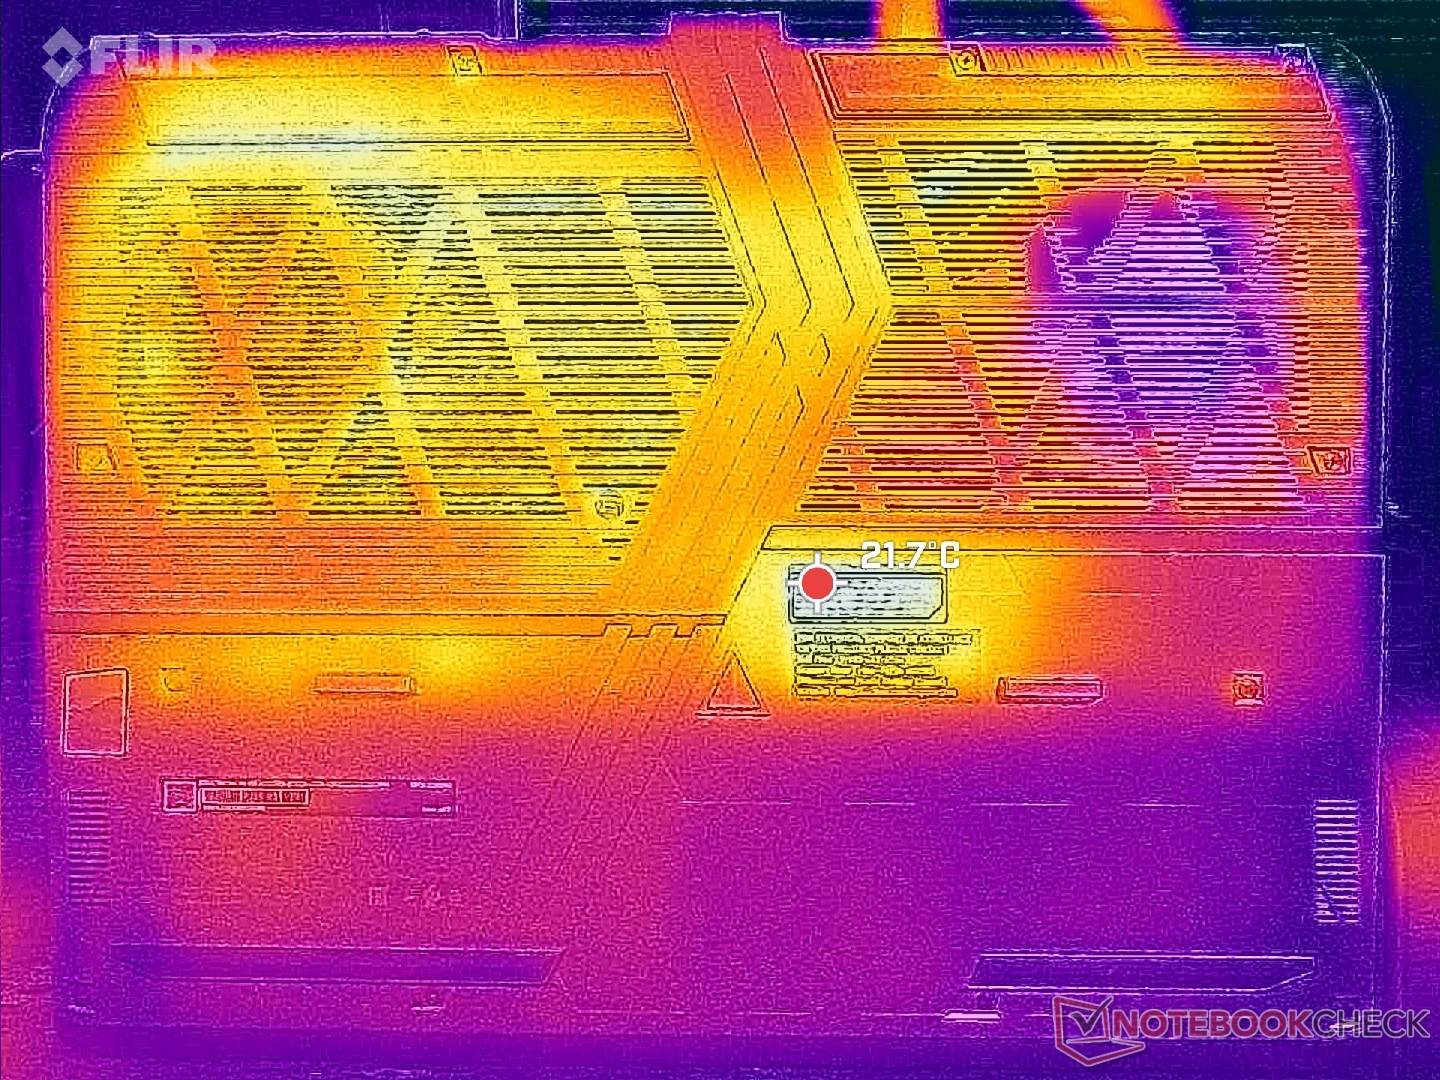
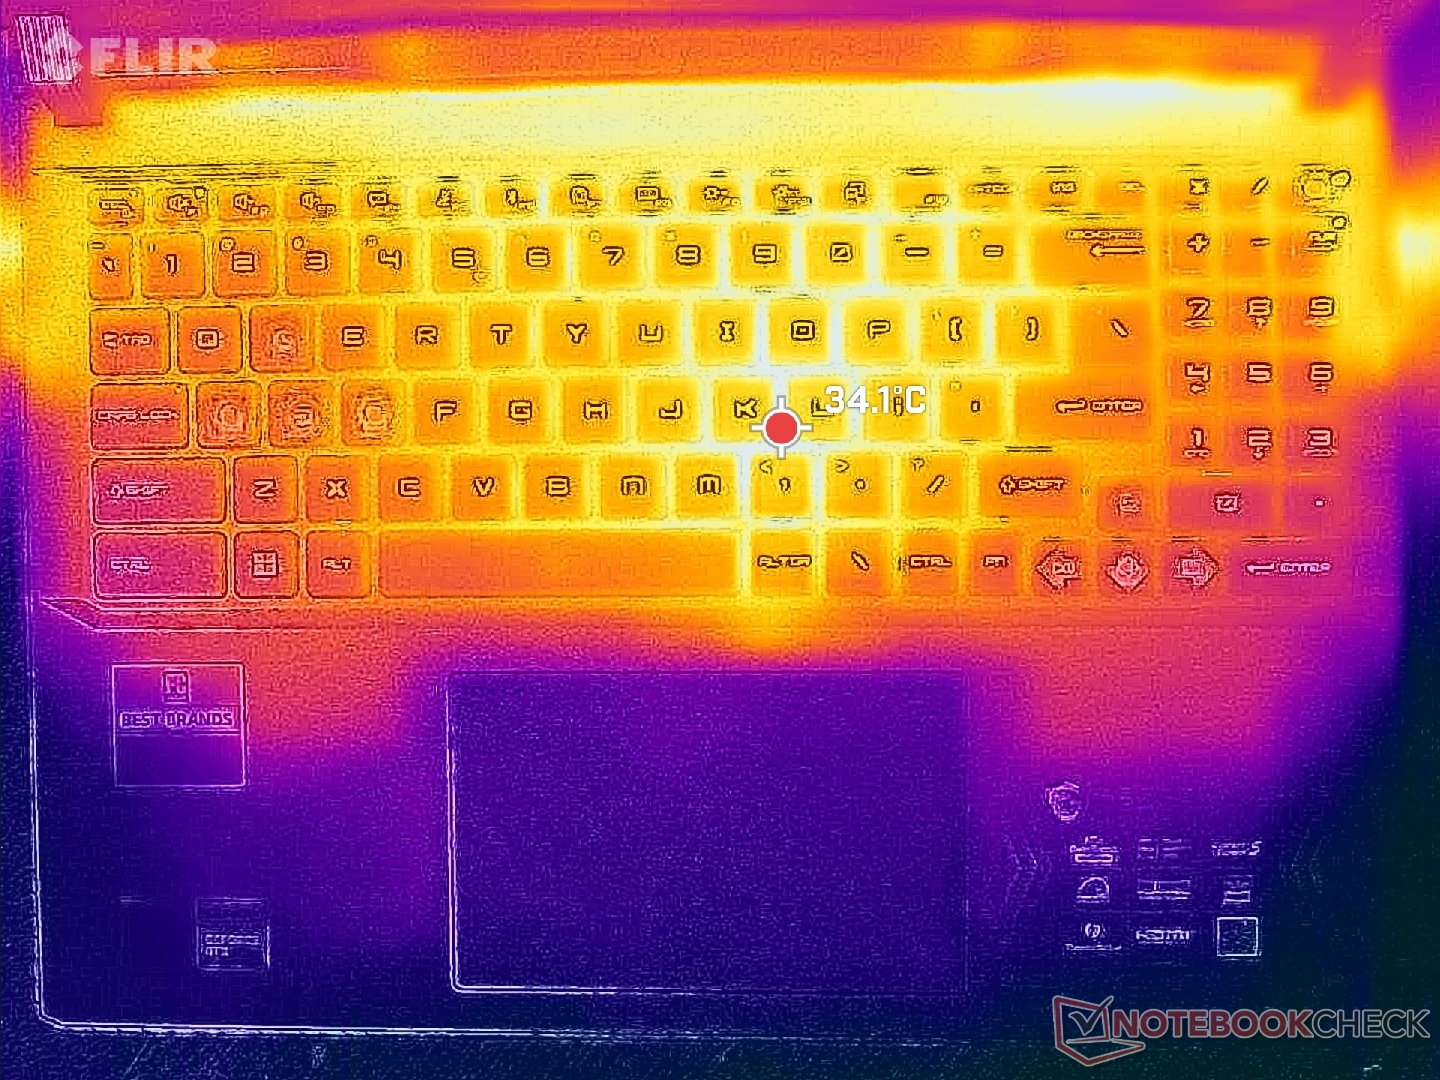
Yttemperaturerna är svalare än på de flesta andra bärbara speldatorer tack vare plastbasen, de rikliga ventilationsgallren och den tjocka chassidesignen. Faktum är att det här är en av de svalaste bärbara speldatorerna vi har testat med en RTX 4080. När du kör Witcher 3skulle den heta punkten på tangentbordets mitt nå endast 34 C jämfört med 39 C på Legion 5i 16 G9 eller äldre Vector GP66.
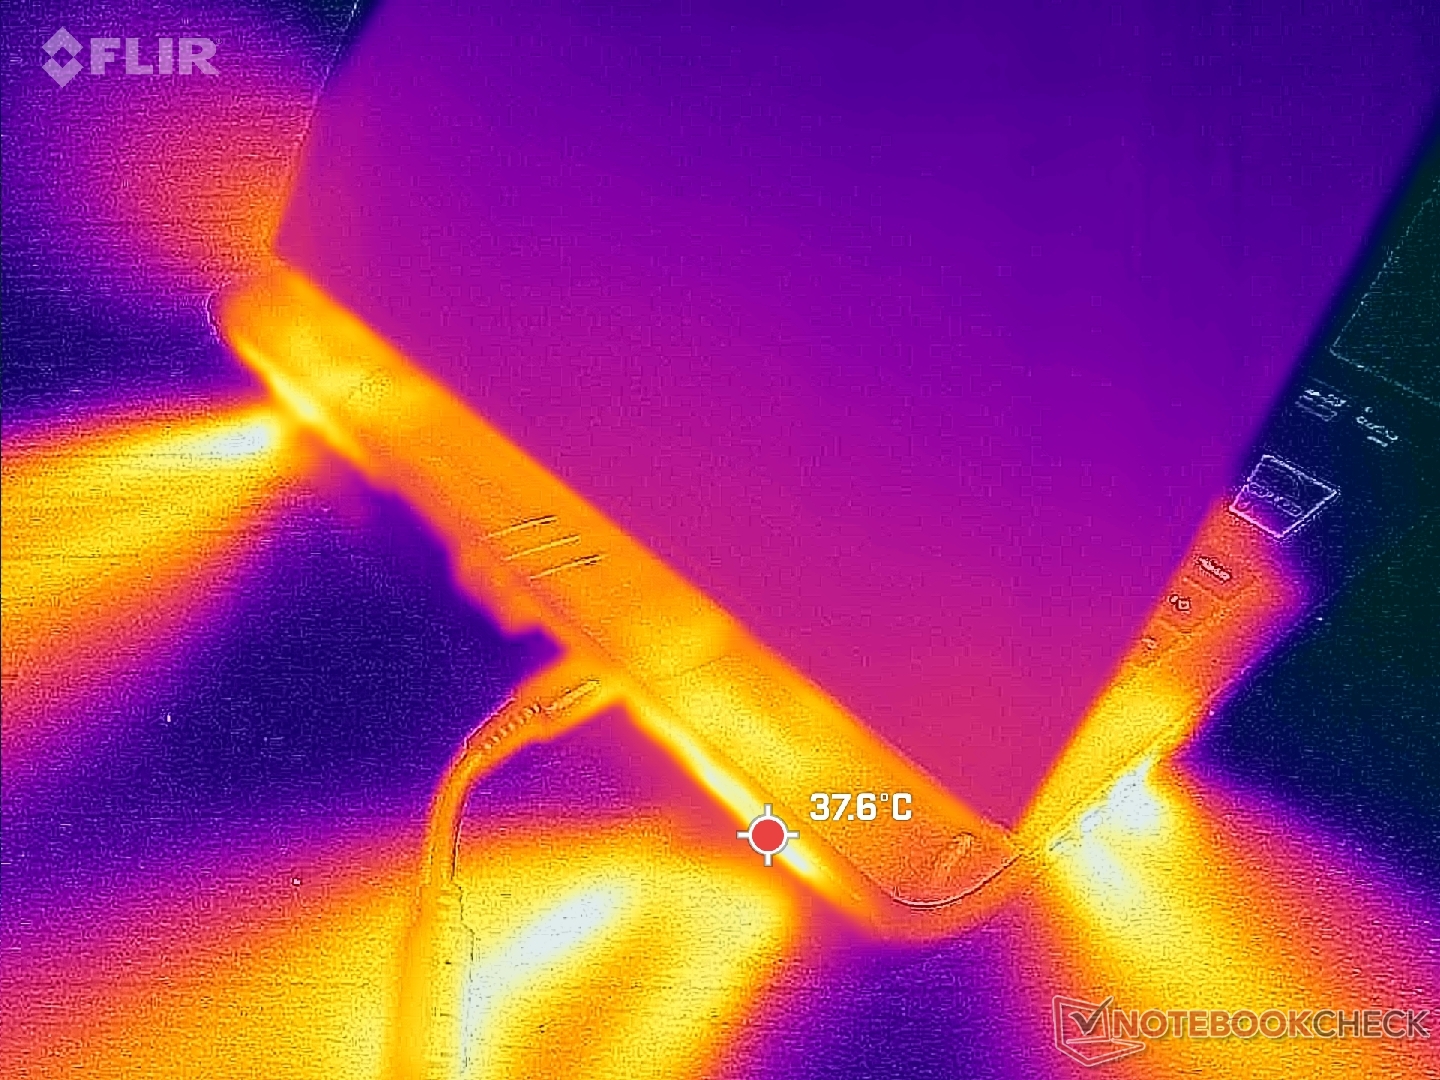
(+) Den maximala temperaturen på ovansidan är 36.4 °C / 98 F, jämfört med genomsnittet av 40.4 °C / 105 F , allt från 21.2 till 68.8 °C för klassen Gaming.
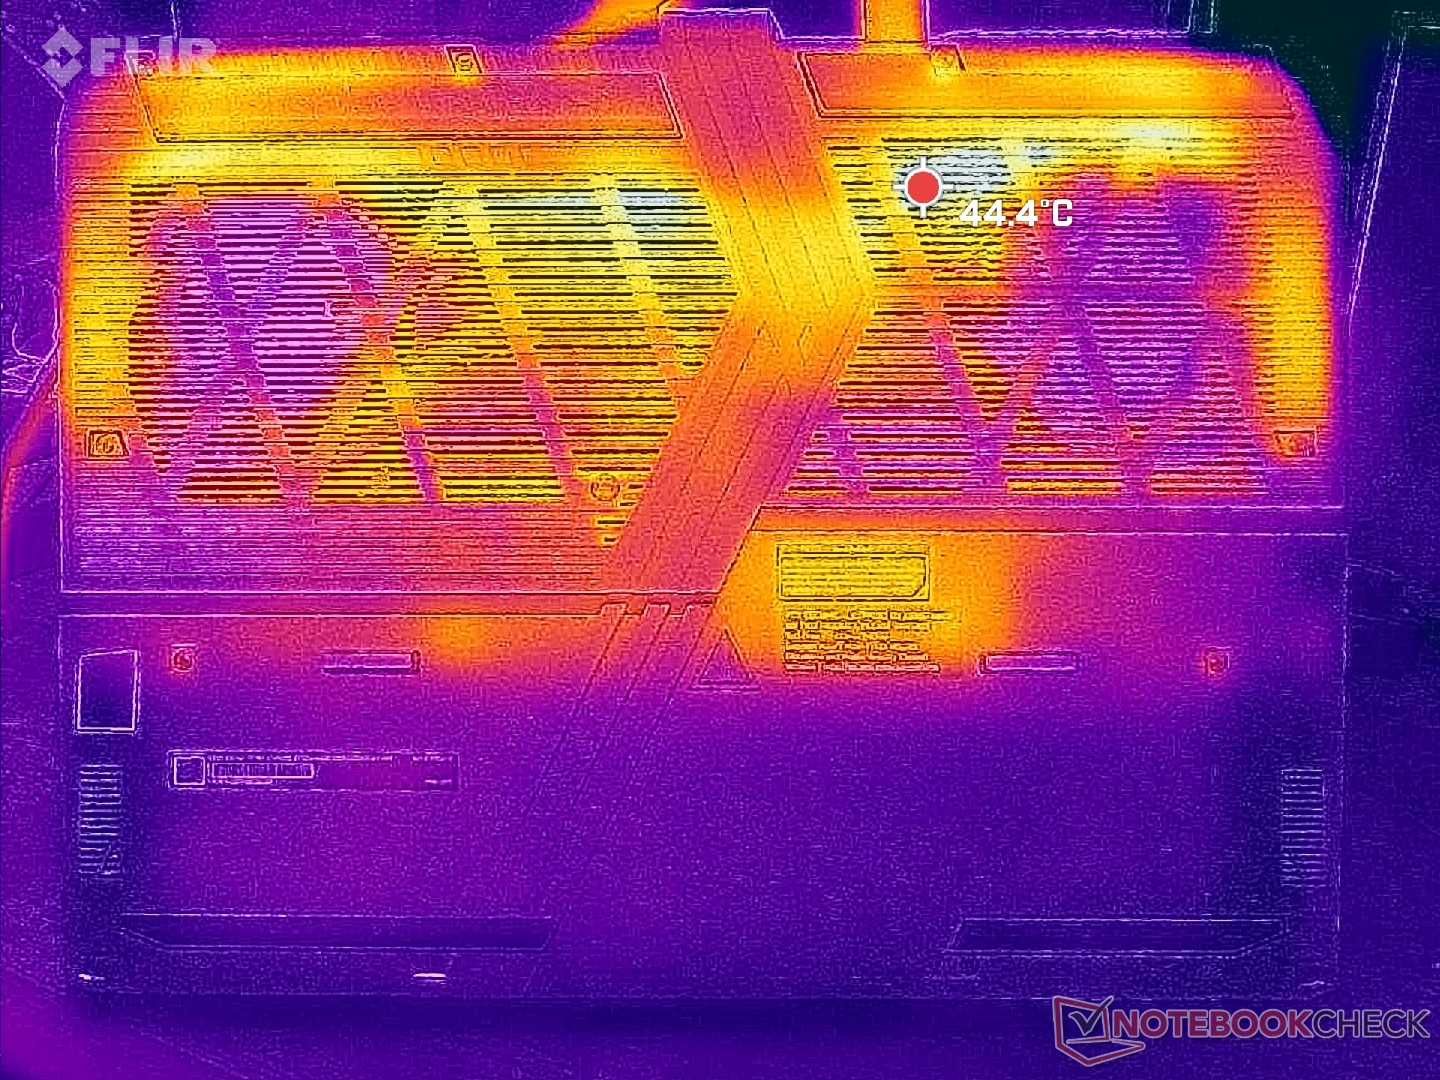
(+) Botten värms upp till maximalt 35.6 °C / 96 F, jämfört med genomsnittet av 43.2 °C / 110 F
(+) Vid tomgångsbruk är medeltemperaturen för ovansidan 24.5 °C / 76 F, jämfört med enhetsgenomsnittet på 33.9 °C / ### class_avg_f### F.
(+) När du spelar The Witcher 3 är medeltemperaturen för ovansidan 30.4 °C / 87 F, jämfört med enhetsgenomsnittet på 33.9 °C / ## #class_avg_f### F.
(+) Handledsstöden och pekplattan är kallare än hudtemperaturen med maximalt 24 °C / 75.2 F och är därför svala att ta på.
(+) Medeltemperaturen för handledsstödsområdet på liknande enheter var 28.8 °C / 83.8 F (+4.8 °C / 8.6 F).
| MSI Vector 16 HX A14V Intel Core i9-14900HX, NVIDIA GeForce RTX 4080 Laptop GPU | MSI Vector GP66 12UGS Intel Core i9-12900H, NVIDIA GeForce RTX 3070 Ti Laptop GPU | Lenovo Legion 5 16IRX G9 Intel Core i7-14650HX, NVIDIA GeForce RTX 4060 Laptop GPU | HP Victus 16-r0077ng Intel Core i7-13700H, NVIDIA GeForce RTX 4070 Laptop GPU | Asus TUF Gaming A16 FA617XS AMD Ryzen 9 7940HS, AMD Radeon RX 7600S | Dell G16 7620 Intel Core i7-12700H, NVIDIA GeForce RTX 3060 Laptop GPU | |
|---|---|---|---|---|---|---|
| Heat | -25% | -20% | -35% | -26% | -15% | |
| Maximum Upper Side * (°C) | 36.4 | 40.2 -10% | 40.4 -11% | 51 -40% | 53 -46% | 47.6 -31% |
| Maximum Bottom * (°C) | 35.6 | 43.8 -23% | 43.8 -23% | 54 -52% | 48 -35% | 54 -52% |
| Idle Upper Side * (°C) | 26.6 | 34.8 -31% | 30.3 -14% | 37 -39% | 30 -13% | 23 14% |
| Idle Bottom * (°C) | 27 | 37 -37% | 35.3 -31% | 29 -7% | 30 -11% | 24.6 9% |
* ... mindre är bättre
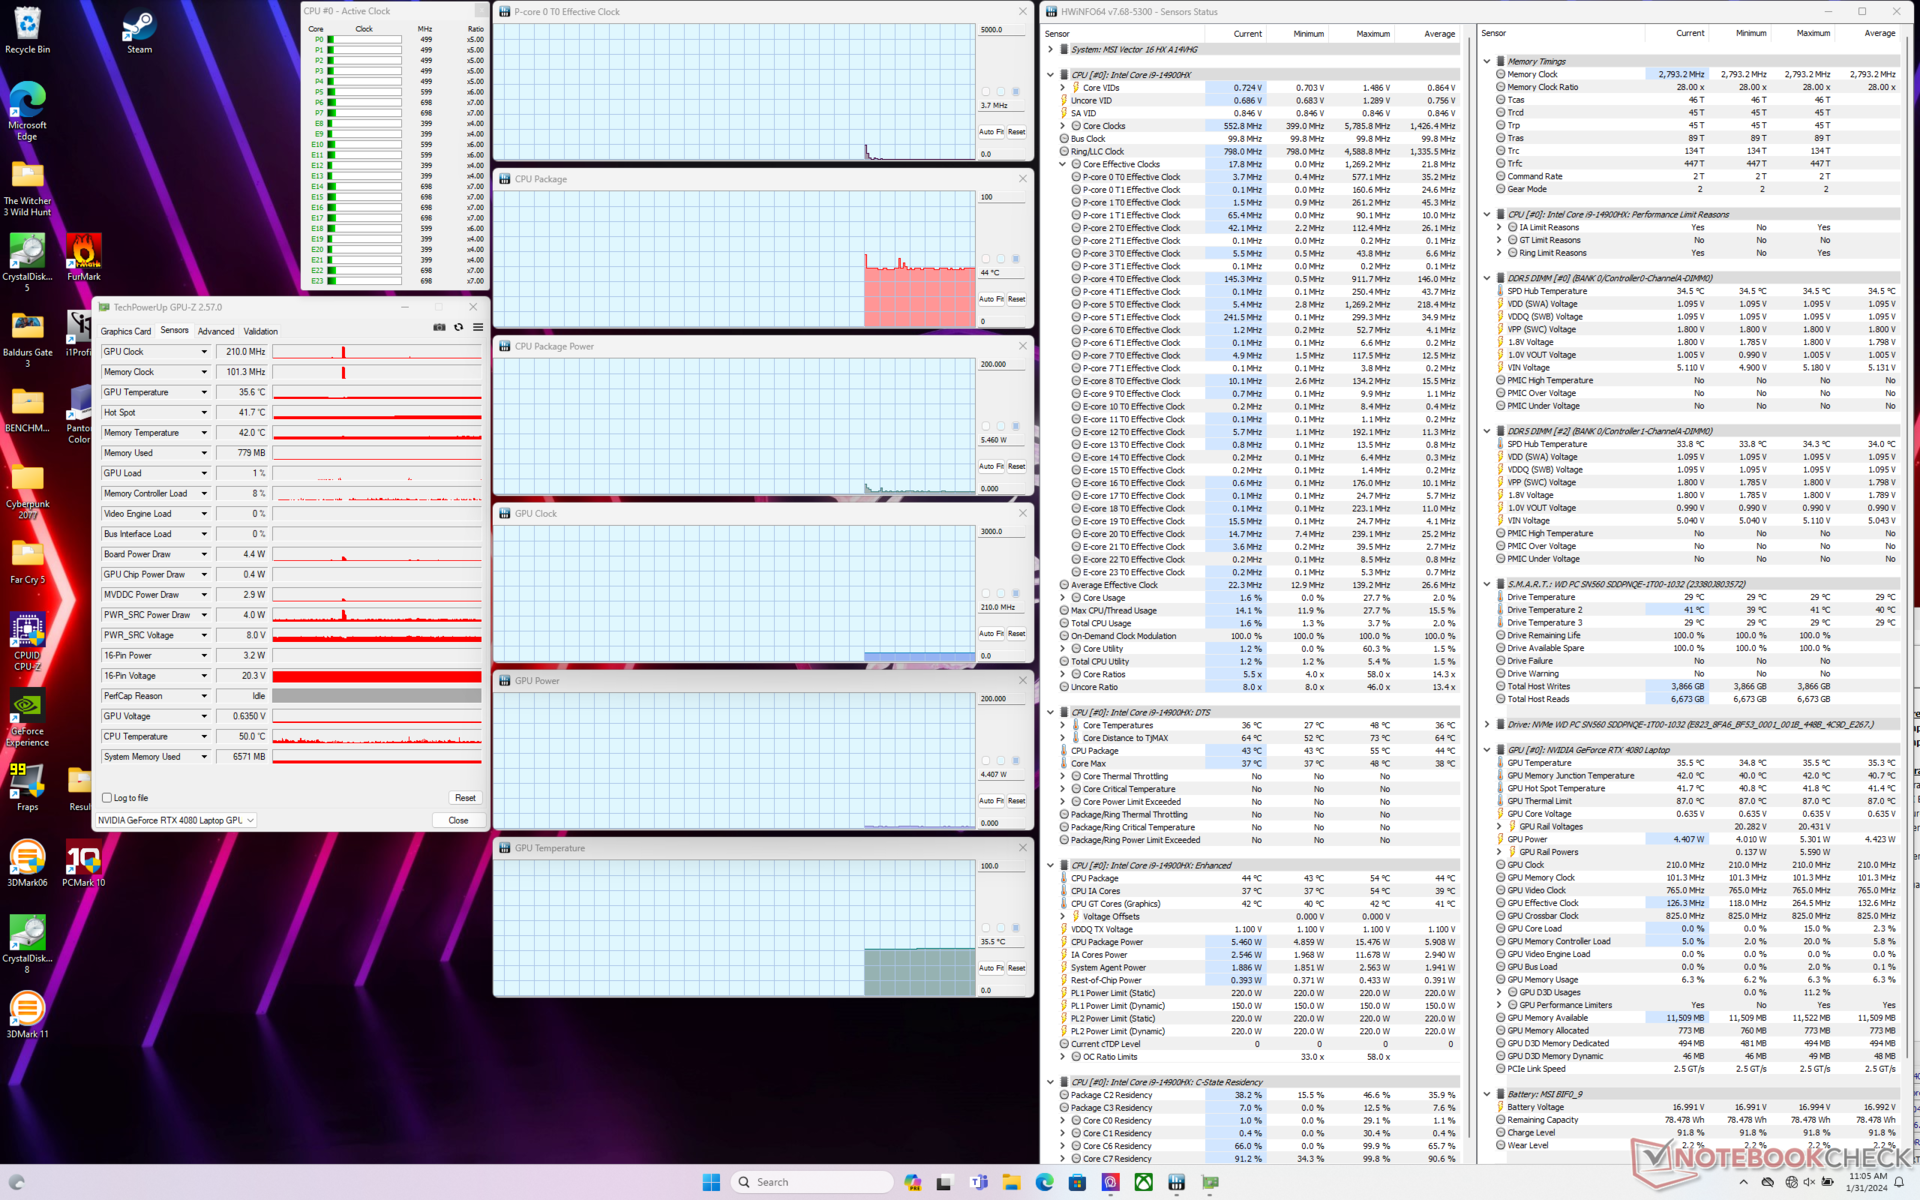
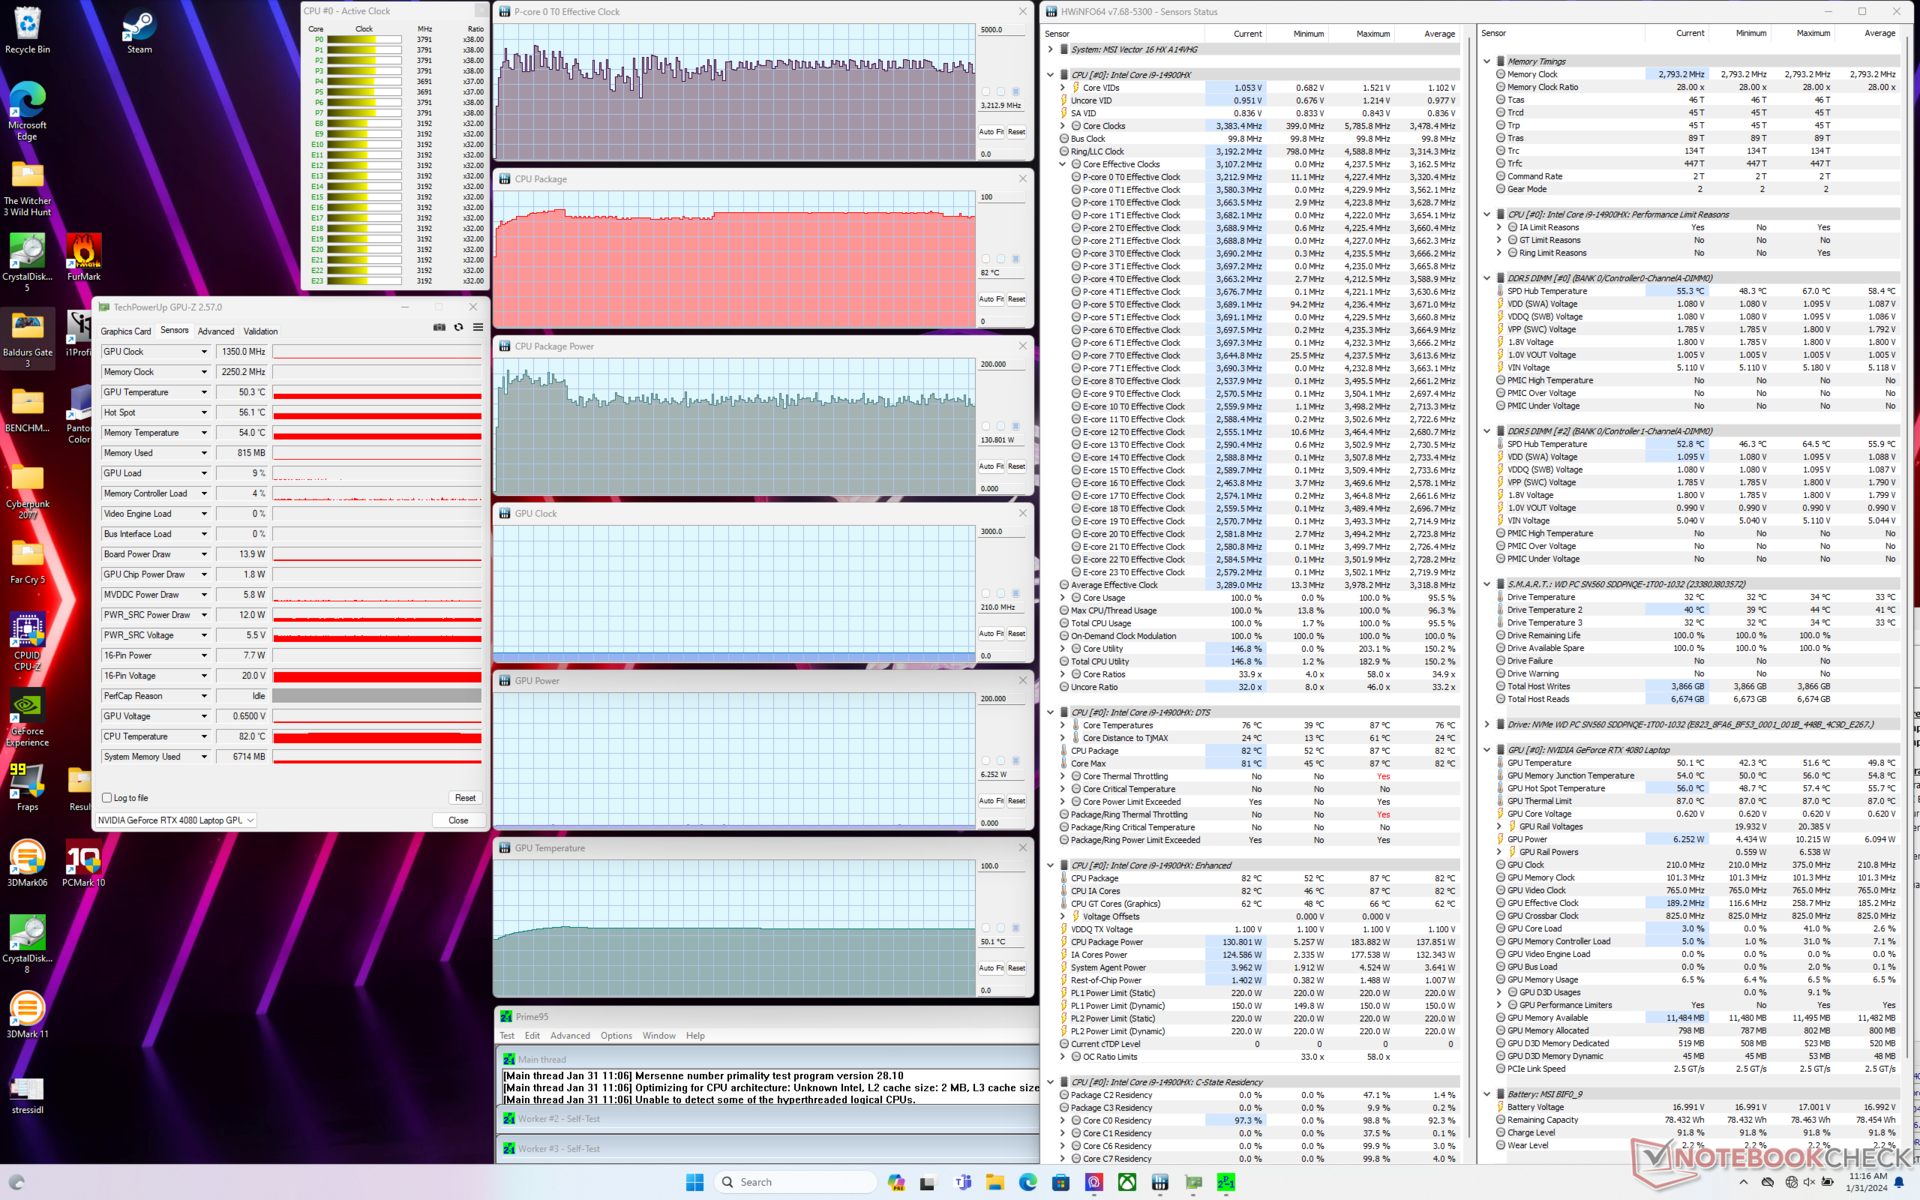
Stresstest
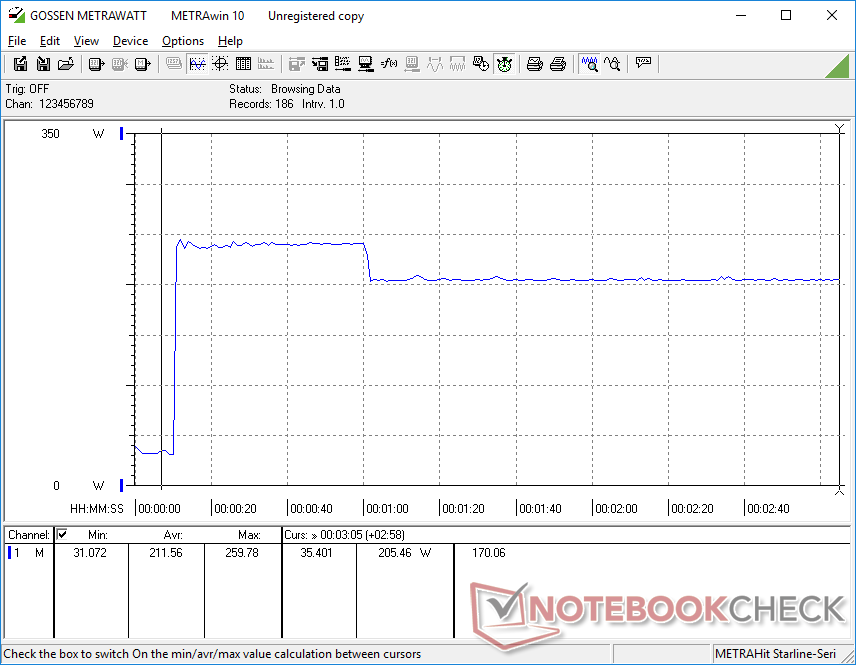
När Prime95-belastningen initierades ökade processorn till 4,2 GHz och 180 W tills kärntemperaturen nådde 87 C ungefär en minut senare. Därefter sjunker den till ~3,3 GHz, 140 W och 82 C. Resultaten förblir desamma även om Cooler Boost är aktiverat.
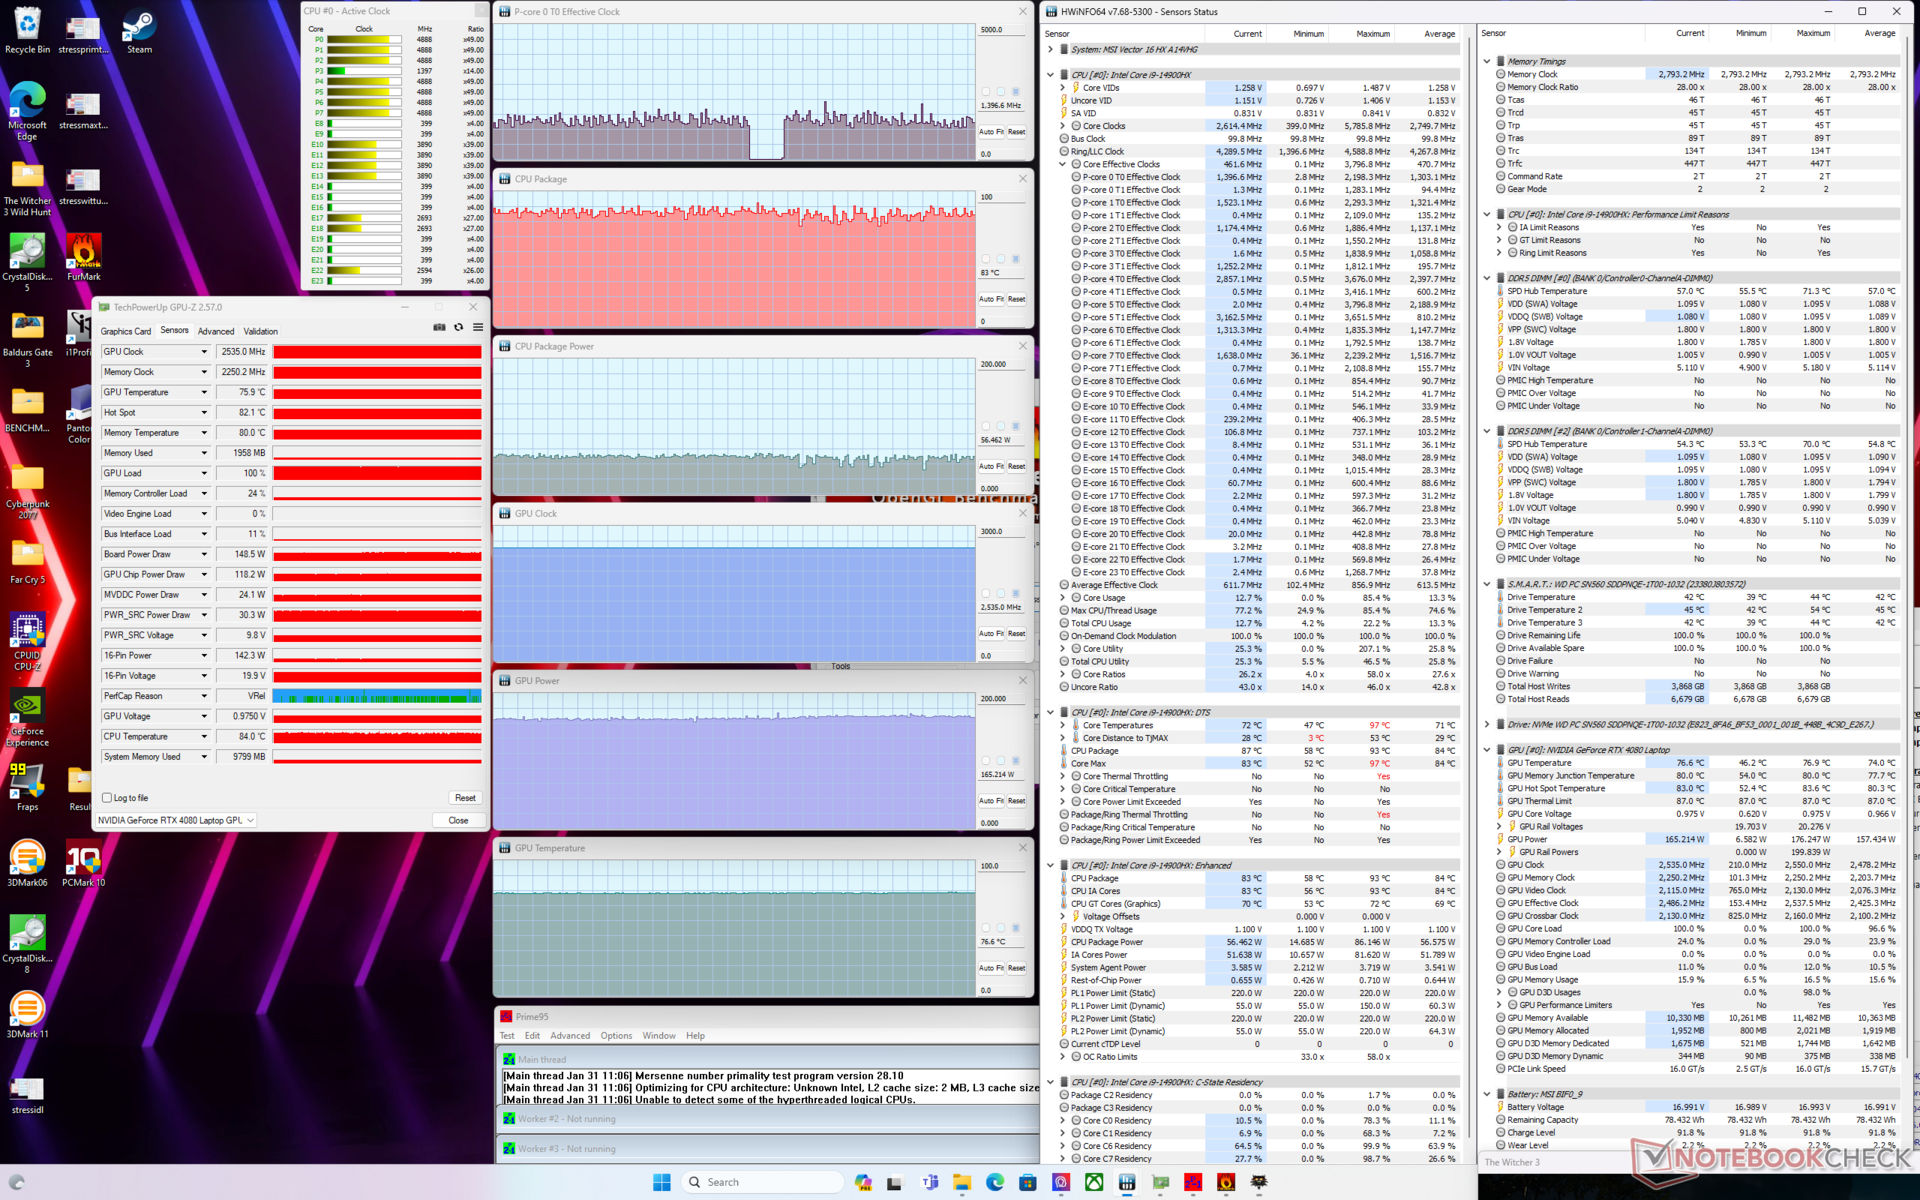
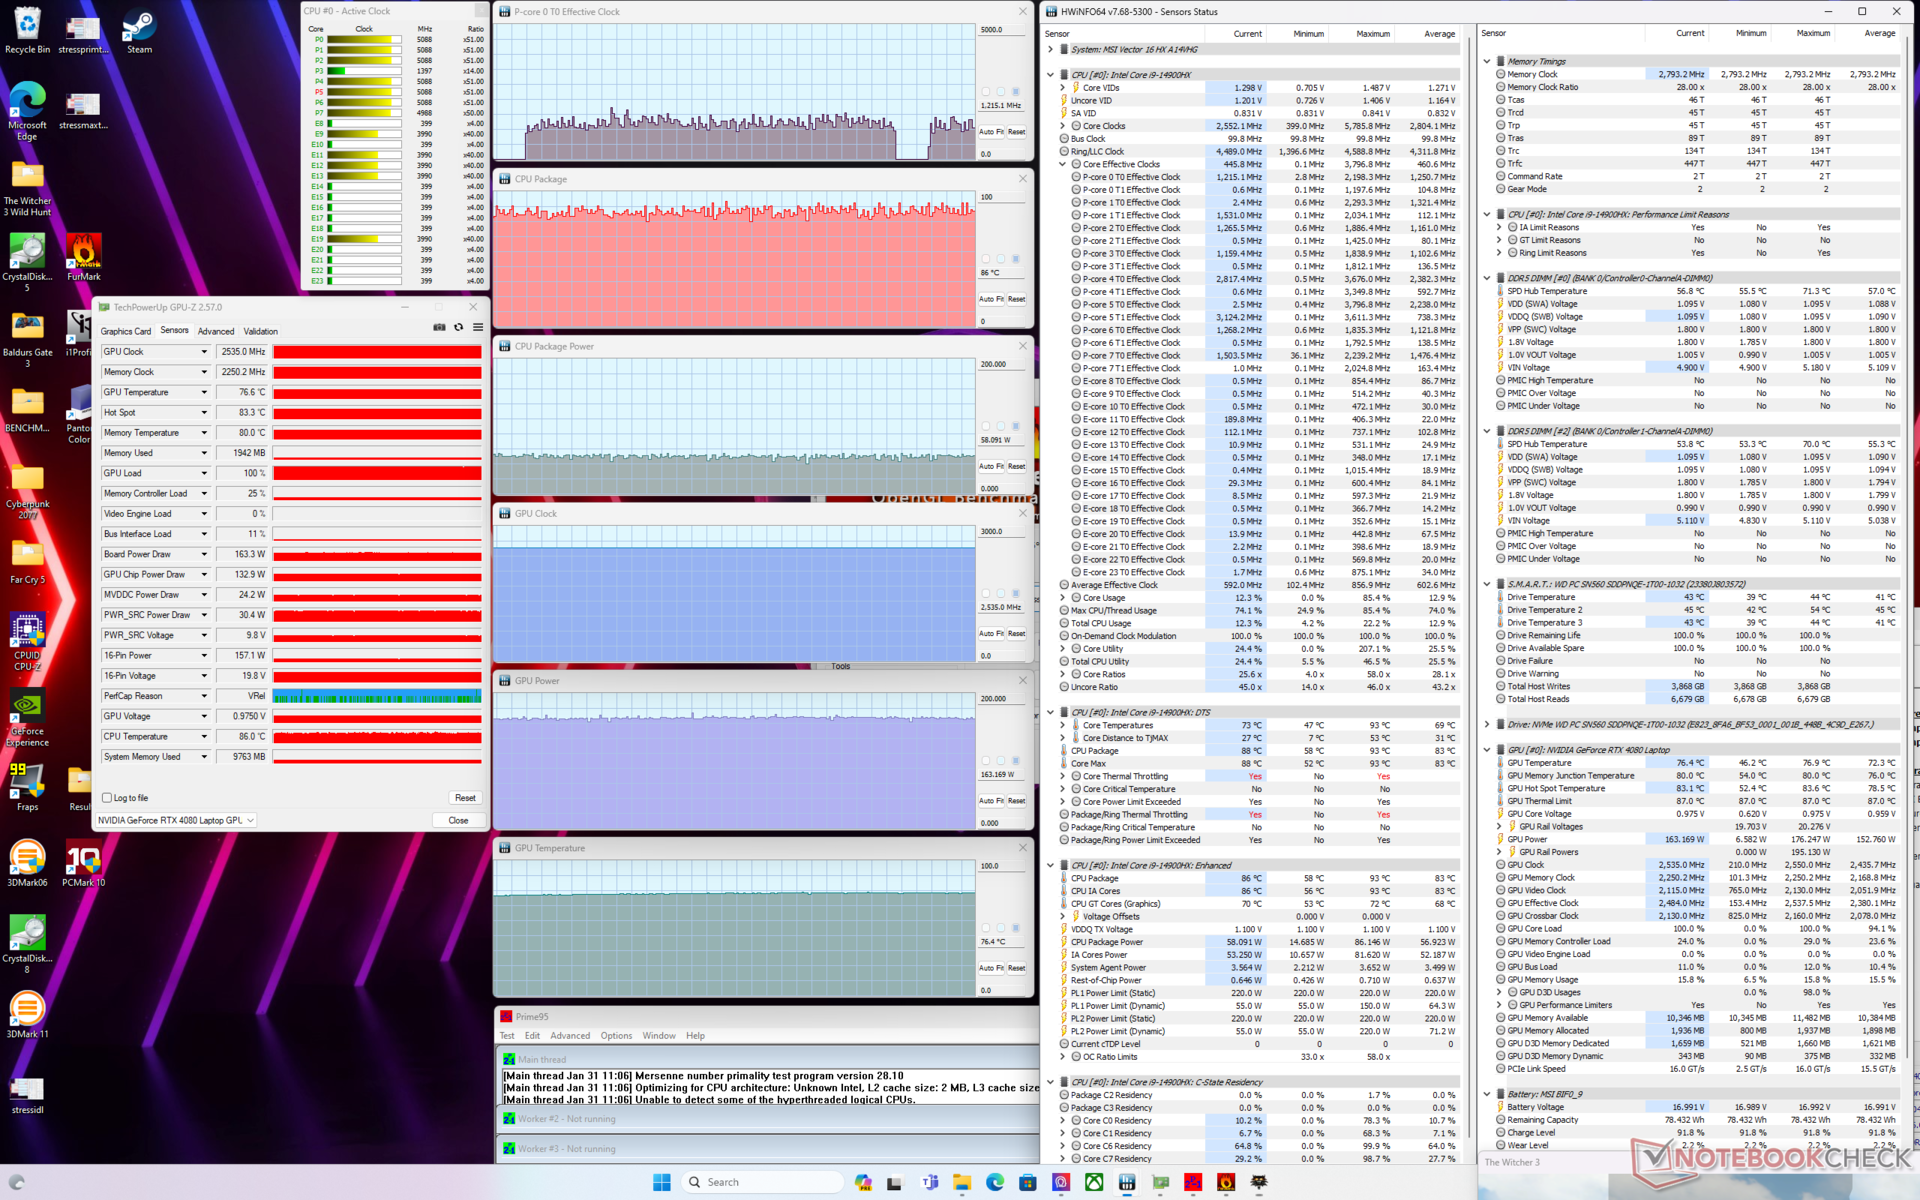
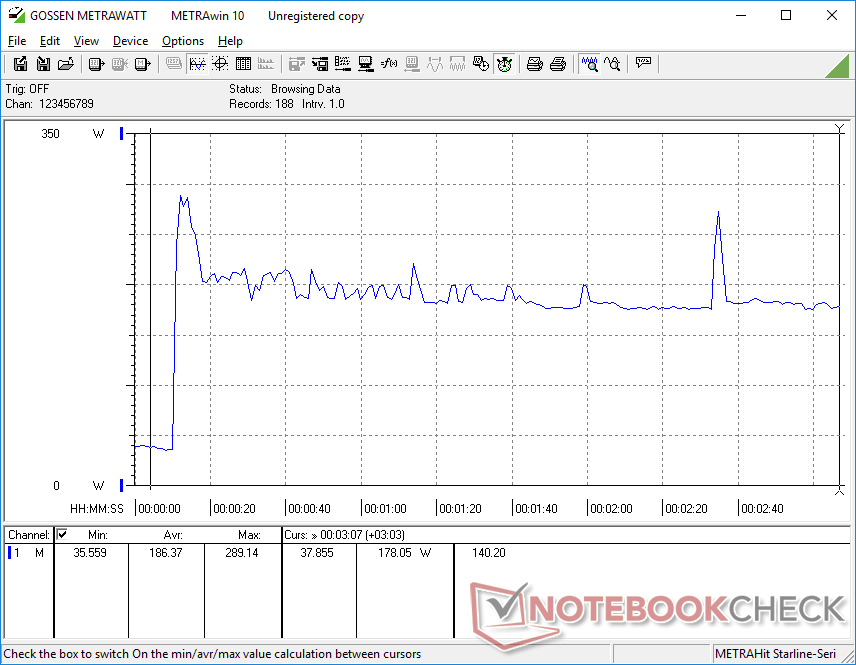
Om Witcher 3 körs i läget Extreme Performance för att representera typiska spelbelastningar skulle det resultera i stabila GPU-värden på 2535 MHz klockfrekvens, 77 C kärntemperatur och 165 W kortströmförbrukning enligt HWiNFO. Resultaten skulle förbli nästan desamma oavsett inställningen för Cooler Boost. Att gå ner till det tystare läget Balanced skulle dock minska GPU-klockan och kortets strömförbrukning till bara 2055 MHz respektive 120 W, vilket återspeglar den anmärkningsvärda prestandaförlusten som nämns i vårt avsnitt om GPU-prestanda ovan.
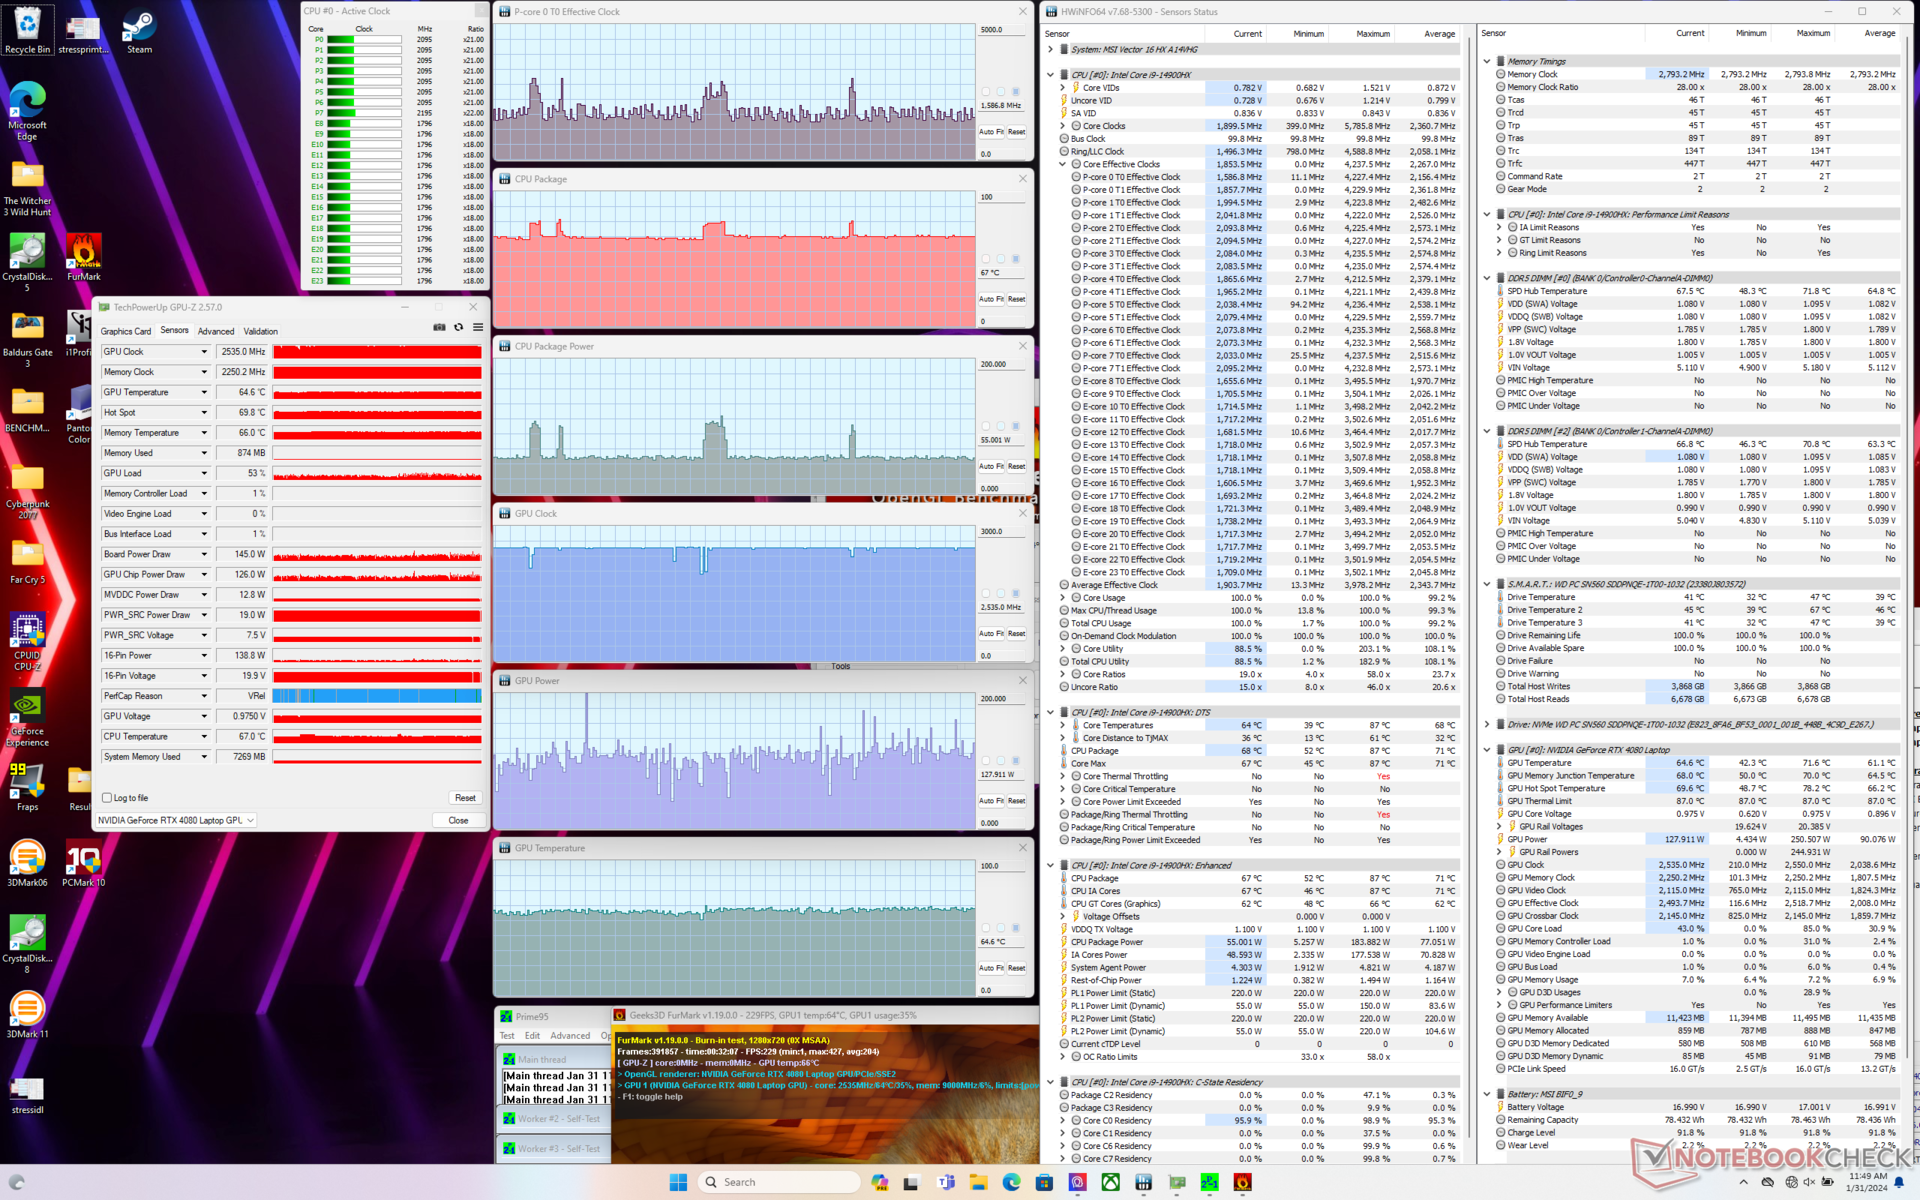
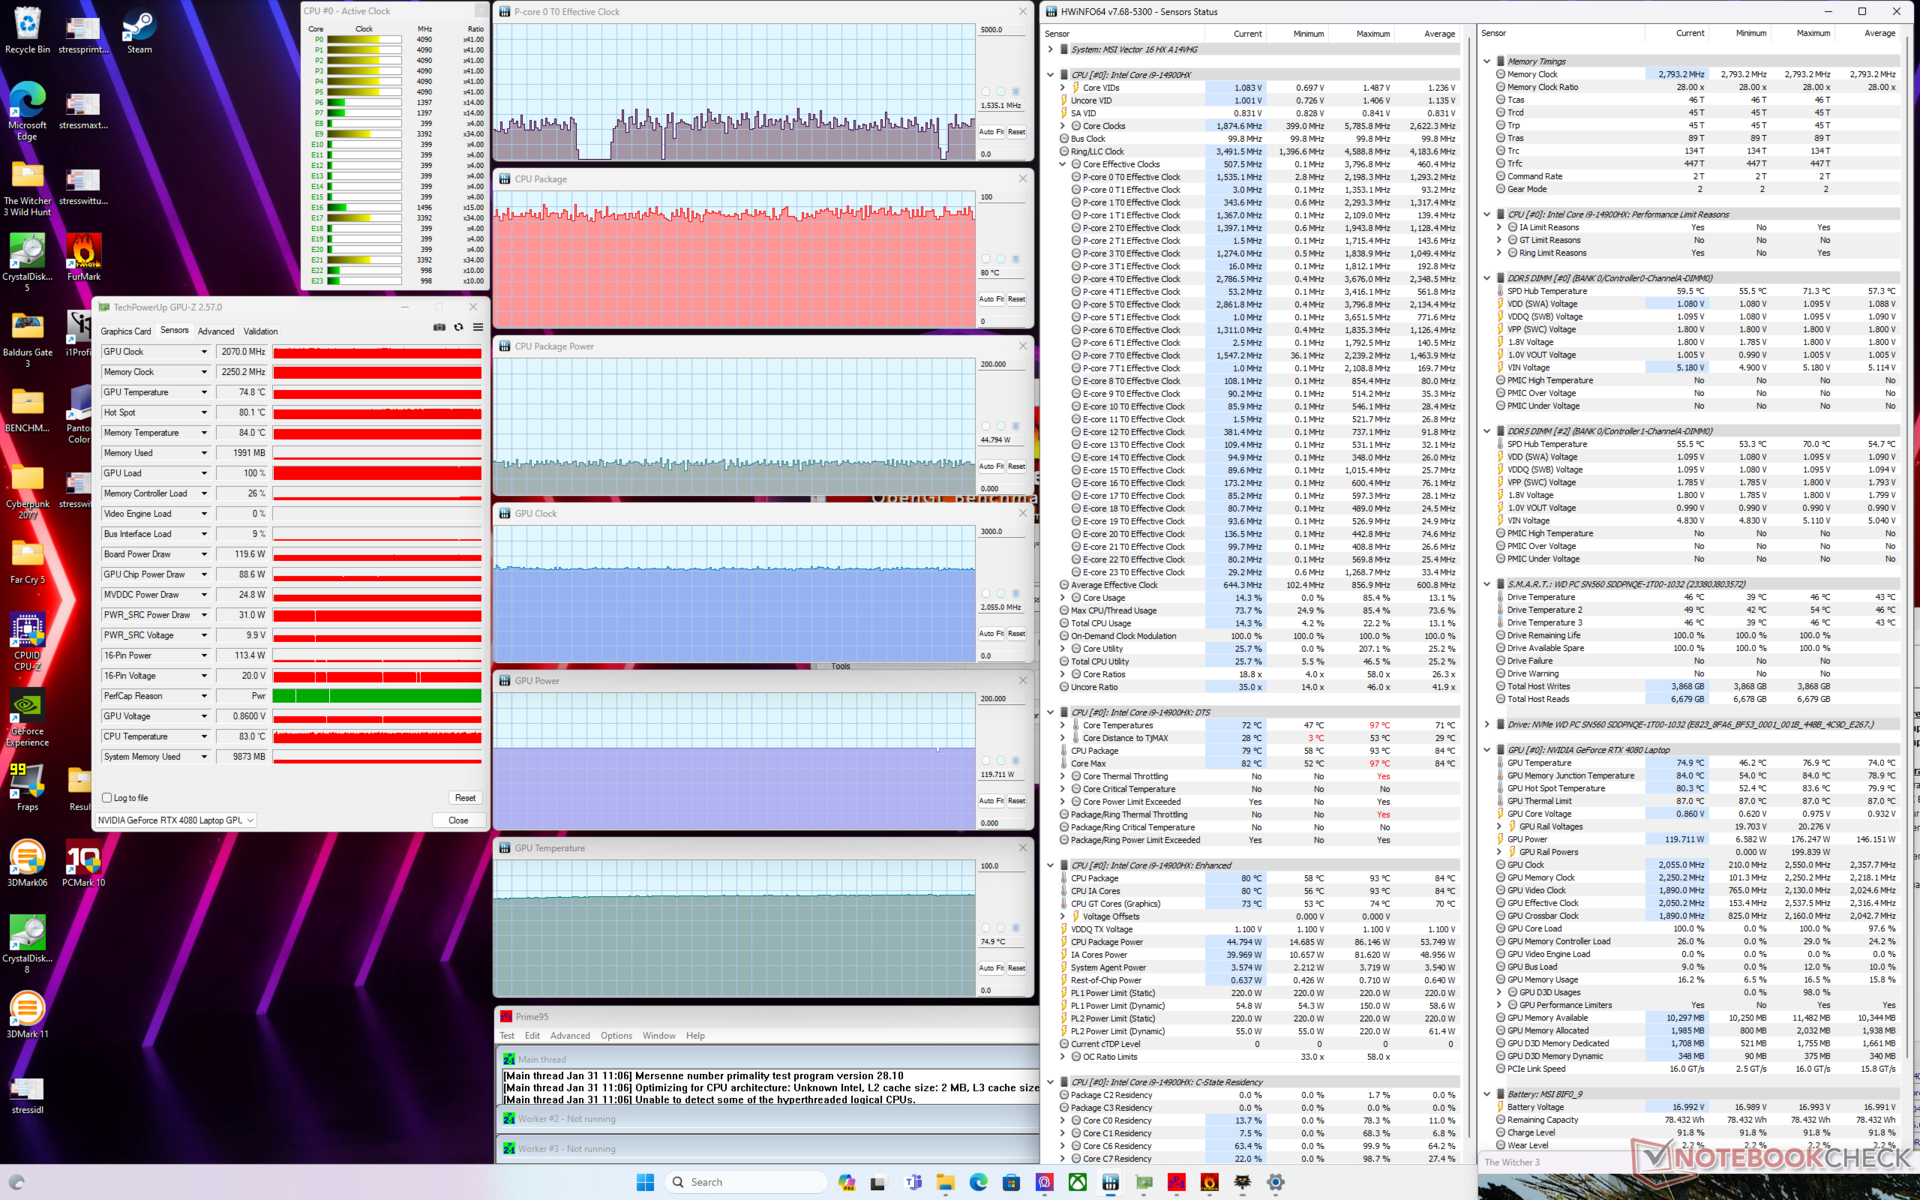
| CPU-klocka (GHz) | GPU-klocka (MHz) | Genomsnittlig CPU-temperatur (°C) | Genomsnittlig GPU-temperatur (°C) | |
| System i viloläge | -- | -- | 44 | 36 |
| Prime95 Stress | 3.3 | -- | 82 | 50 |
| Prime95 + FurMark Stress (Extreme Performance w/ Cooler Boost on) | ~1.7 | 2535 | 67 | 65 |
| Witcher 3 Stress (balanserat läge) | ~1,5 | 2055 | 81 | 75 |
| Witcher 3 Stress (Extreme Performance w/ Cooler Boost off) | ~1.5 | 2535 | 83 | 77 |
| Witcher 3 Stress (Extreme Performance w/ Cooler Boost on) | ~1.5 | 2535 | 85 | 77 |
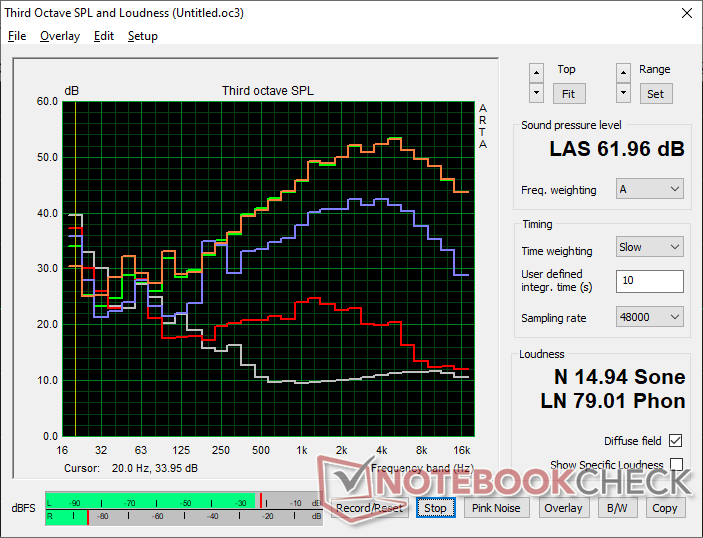
Högtalare
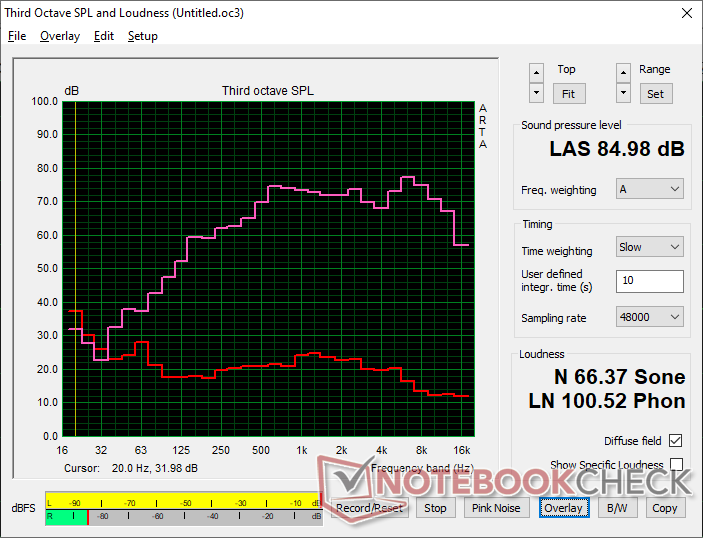
MSI Vector 16 HX A14V ljudanalys
(+) | högtalare kan spela relativt högt (85 dB)
Bas 100 - 315 Hz
(±) | reducerad bas - i genomsnitt 12.7% lägre än medianen
(+) | basen är linjär (6.8% delta till föregående frekvens)
Mellan 400 - 2000 Hz
(+) | balanserad mellan - endast 3% från medianen
(+) | mids är linjära (3.6% delta till föregående frekvens)
Högsta 2 - 16 kHz
(+) | balanserade toppar - endast 3.1% från medianen
(+) | toppar är linjära (6.7% delta till föregående frekvens)
Totalt 100 - 16 000 Hz
(+) | det totala ljudet är linjärt (12.6% skillnad mot median)
Jämfört med samma klass
» 16% av alla testade enheter i den här klassen var bättre, 4% liknande, 81% sämre
» Den bästa hade ett delta på 6%, genomsnittet var 18%, sämst var 132%
Jämfört med alla testade enheter
» 11% av alla testade enheter var bättre, 3% liknande, 86% sämre
» Den bästa hade ett delta på 4%, genomsnittet var 24%, sämst var 134%
Apple MacBook Pro 16 2021 M1 Pro ljudanalys
(+) | högtalare kan spela relativt högt (84.7 dB)
Bas 100 - 315 Hz
(+) | bra bas - bara 3.8% från medianen
(+) | basen är linjär (5.2% delta till föregående frekvens)
Mellan 400 - 2000 Hz
(+) | balanserad mellan - endast 1.3% från medianen
(+) | mids är linjära (2.1% delta till föregående frekvens)
Högsta 2 - 16 kHz
(+) | balanserade toppar - endast 1.9% från medianen
(+) | toppar är linjära (2.7% delta till föregående frekvens)
Totalt 100 - 16 000 Hz
(+) | det totala ljudet är linjärt (4.6% skillnad mot median)
Jämfört med samma klass
» 0% av alla testade enheter i den här klassen var bättre, 0% liknande, 100% sämre
» Den bästa hade ett delta på 5%, genomsnittet var 17%, sämst var 45%
Jämfört med alla testade enheter
» 0% av alla testade enheter var bättre, 0% liknande, 100% sämre
» Den bästa hade ett delta på 4%, genomsnittet var 24%, sämst var 134%
Energiförvaltning
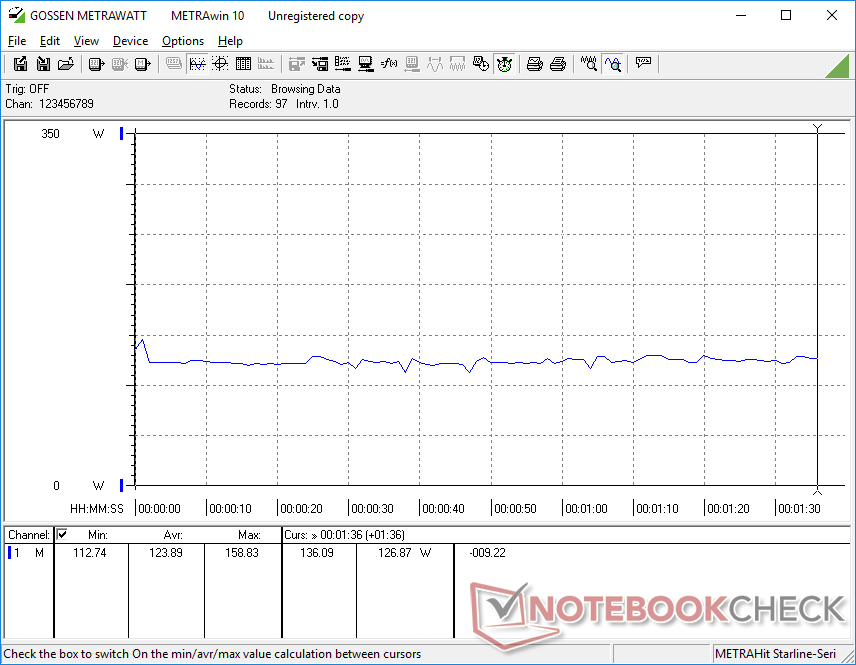
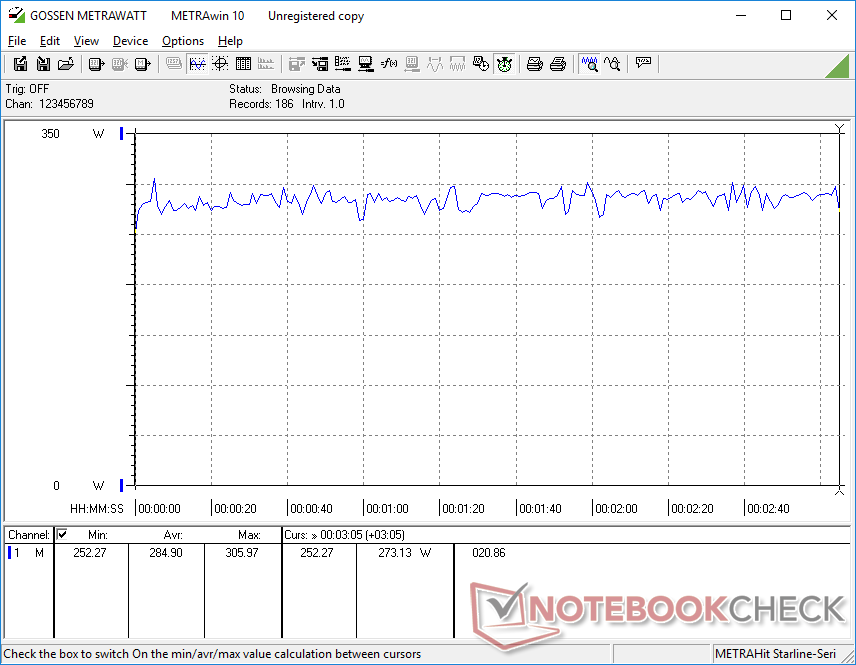
Strömförbrukning
Vector 16 HX må vara snabbare än den utgående Vector GP66, men den är också mycket mer strömkrävande. Att köra Witcher 3 och Prime95 kräver 27 procent respektive 58 procent mer ström jämfört med den äldre modellen. Trots detta är prestandavinsterna mycket större än effektvinsterna för högre prestanda per watt.
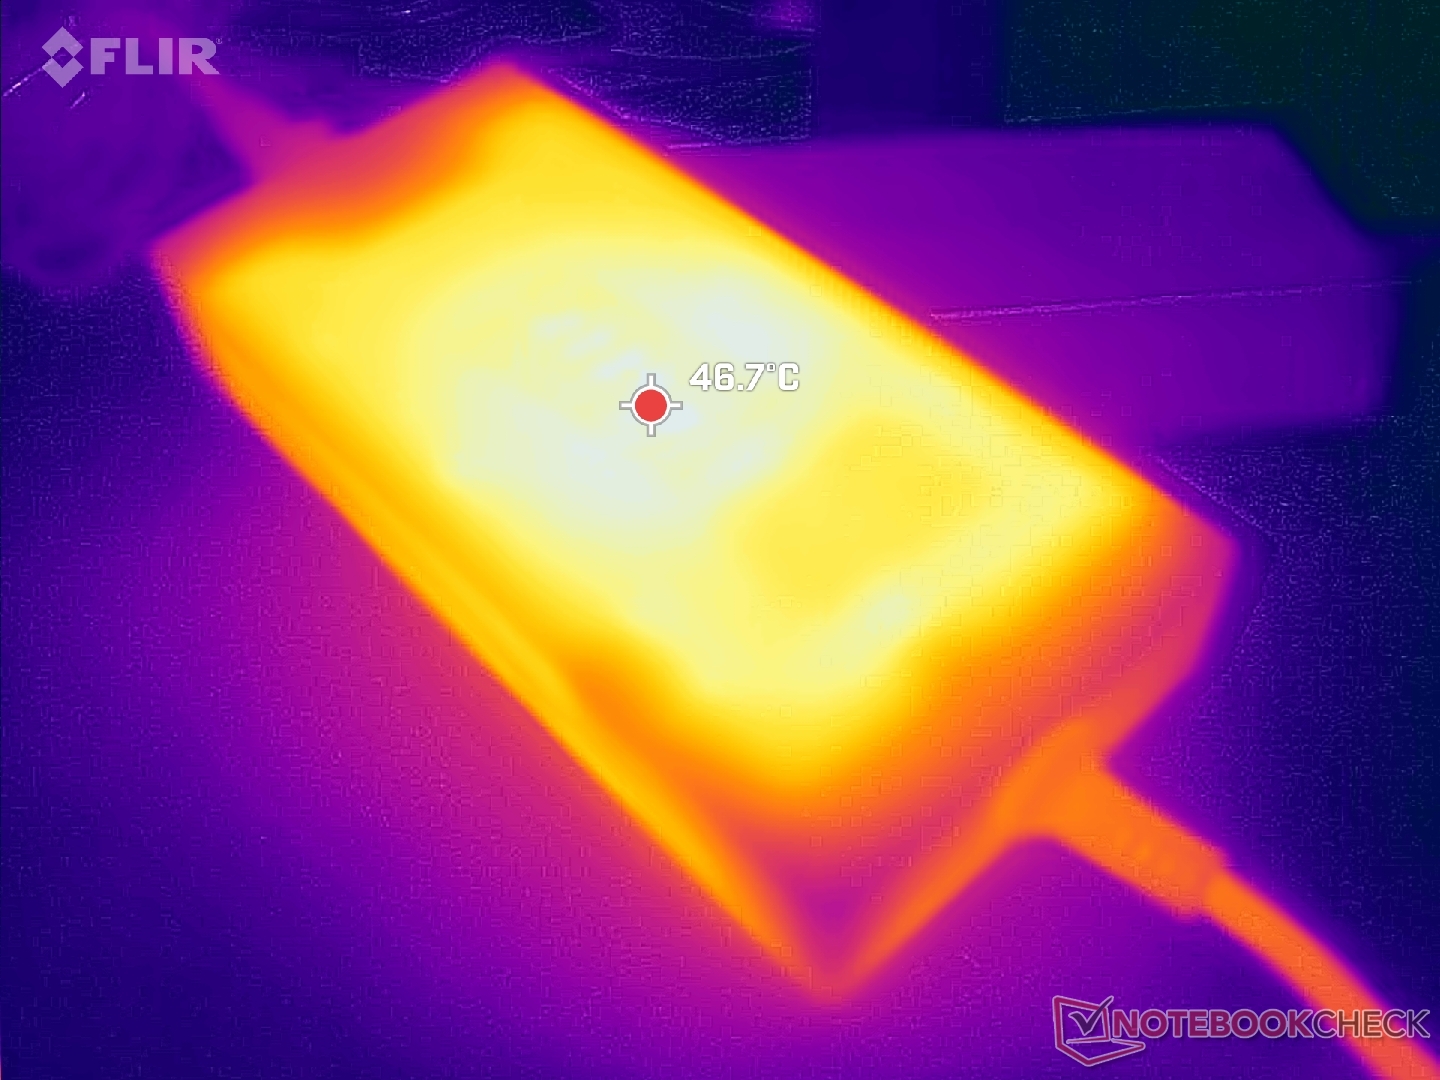
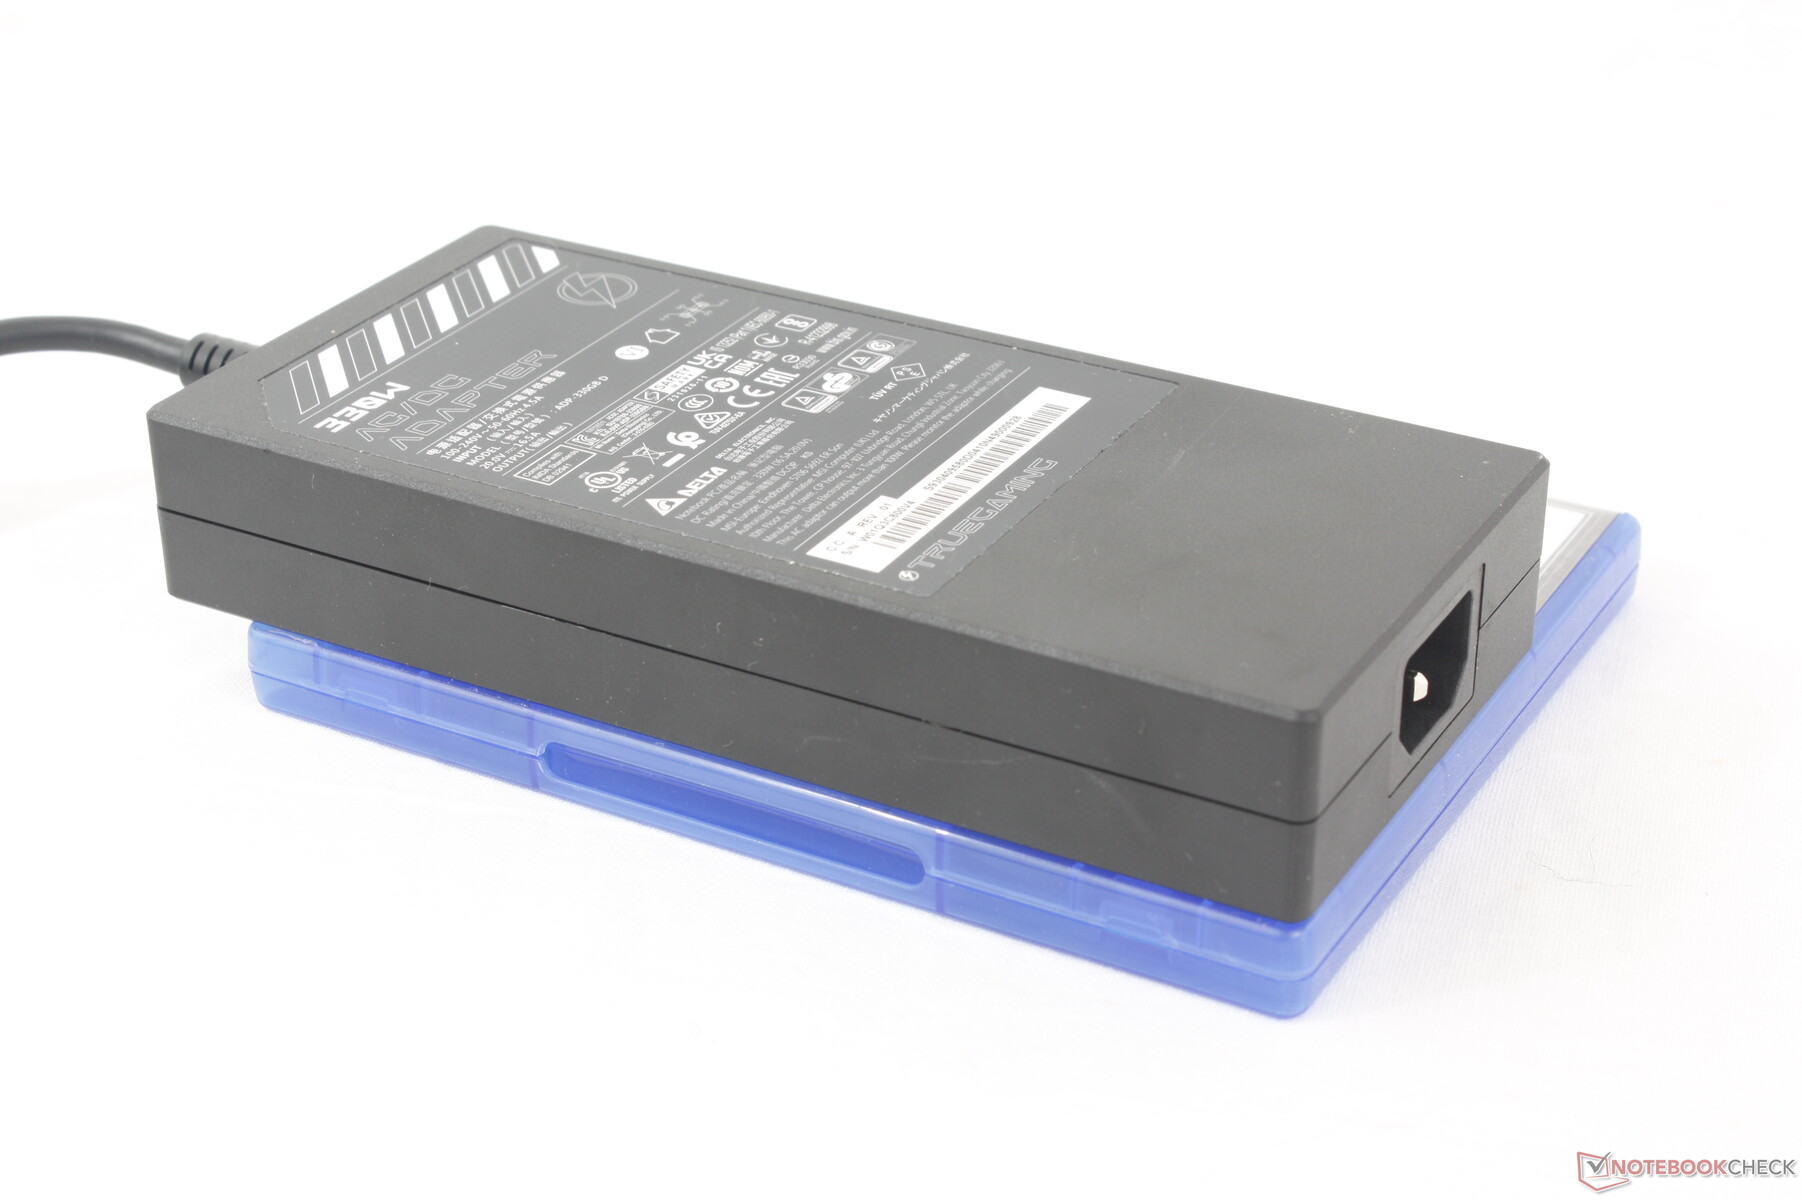
Systemet levereras med antingen en 280 W eller 330 W AC-adapter beroende på konfiguration. Den nya 330 W AC-adaptern är relativt tunn på ~18,5 x 8,5 x 3,2 cm vilket är ungefär samma storlek som ~18 x 8,5 x 3,5 cm 280 W AC-adaptern för den äldre GP66.
| Av/Standby | |
| Låg belastning | |
| Hög belastning |
|
Förklaring:
min: | |
| MSI Vector 16 HX A14V i9-14900HX, GeForce RTX 4080 Laptop GPU, WD PC SN560 SDDPNQE-1T00, IPS, 2560x1600, 16" | MSI Vector GP66 12UGS i9-12900H, GeForce RTX 3070 Ti Laptop GPU, , IPS, 1920x1080, 15.6" | Lenovo Legion 5 16IRX G9 i7-14650HX, GeForce RTX 4060 Laptop GPU, Samsung PM9A1 MZVL21T0HCLR, IPS, 2560x1600, 16" | HP Victus 16-r0077ng i7-13700H, GeForce RTX 4070 Laptop GPU, Kioxia XG8 KXG80ZNV1T02, IPS, 1920x1080, 16.1" | Asus TUF Gaming A16 FA617XS R9 7940HS, Radeon RX 7600S, Micron 2400 MTFDKBA512QFM, IPS, 1920x1200, 16" | Dell G16 7620 i7-12700H, GeForce RTX 3060 Laptop GPU, WDC PC SN810 512GB, IPS, 2560x1600, 16" | |
|---|---|---|---|---|---|---|
| Power Consumption | -2% | 20% | 38% | 47% | 18% | |
| Idle Minimum * (Watt) | 15.8 | 17.5 -11% | 15.4 3% | 8 49% | 7 56% | 14.4 9% |
| Idle Average * (Watt) | 23.3 | 20.1 14% | 19.7 15% | 13 44% | 10 57% | 17.8 24% |
| Idle Maximum * (Watt) | 30 | 47.3 -58% | 20.7 31% | 22 27% | 15 50% | 31.5 -5% |
| Load Average * (Watt) | 123.9 | 107.3 13% | 102.6 17% | 86 31% | 86 31% | 101.2 18% |
| Witcher 3 ultra * (Watt) | 285 | 225 21% | 191.3 33% | 141.8 50% | 160.6 44% | 176.9 38% |
| Load Maximum * (Watt) | 306 | 277.7 9% | 246.6 19% | 233 24% | 172 44% | 242.9 21% |
* ... mindre är bättre
Power Consumption Witcher 3 / Stresstest
Power Consumption external Monitor
Batteritid
Medan batterikapaciteten har ökat betydligt från 65 Wh till 90 Wh jämfört med den äldre Vector GP66-designen, har de faktiska drifttiderna inte ökat. WLAN-surfning med balanserad energiprofil och aktiv iGPU klockar fortfarande in på cirka 5,5 timmar innan automatisk avstängning. Andra 16-tums system som Lenovo Legion 5 16 eller HP Victus 16 klarar fyra timmar längre vardera i jämförelse.
Laddning från tom till full kapacitet tar nästan 2,5 timmar med den medföljande nätadaptern. Systemet kan laddas via USB-C genom porten längs den högra kanten.
| MSI Vector 16 HX A14V i9-14900HX, GeForce RTX 4080 Laptop GPU, 90 Wh | MSI Vector GP66 12UGS i9-12900H, GeForce RTX 3070 Ti Laptop GPU, 65 Wh | Lenovo Legion 5 16IRX G9 i7-14650HX, GeForce RTX 4060 Laptop GPU, 80 Wh | HP Victus 16-r0077ng i7-13700H, GeForce RTX 4070 Laptop GPU, 83 Wh | Asus TUF Gaming A16 FA617XS R9 7940HS, Radeon RX 7600S, 90 Wh | Dell G16 7620 i7-12700H, GeForce RTX 3060 Laptop GPU, 84 Wh | |
|---|---|---|---|---|---|---|
| Batteridrifttid | -17% | -4% | 29% | 60% | -31% | |
| Reader / Idle (h) | 10.7 | 7.9 -26% | 20.3 90% | 7.1 -34% | ||
| WiFi v1.3 (h) | 5.5 | 5.7 4% | 7.4 35% | 7.1 29% | 12.4 125% | 5 -9% |
| Load (h) | 1.4 | 1 -29% | 0.8 -43% | 0.9 -36% | 0.7 -50% | |
| H.264 (h) | 9.6 | 12.4 |
För
Emot
Dom - Snabb och chonky
Bärbara speldatorer balanserar på en tunn linje mellan bärbarhet och prestanda, där den nuvarande trenden lutar åt bärbarhet. MSI Vector 16 HX föredrar utan omsvep prestanda även om det innebär ett tjockare, större och mer högljutt system. Det är faktiskt en av de största och mest högljudda 16-tums bärbara speldatorerna som för närvarande finns på marknaden.
MSI Vector 16 HX är inte blyg när det kommer till fläktljud eller storlek. I gengäld utklassar den andra bärbara speldatorer med samma GeForce RTX 4080 eller 4090 GPU när det gäller prestanda.
Den stora storleken och de högljudda fläktarna är inte för intet eftersom modellen utmärker sig när det gäller prestanda. 175 W GeForce RTX 4080 GPU är cirka 10 procent snabbare än genomsnittet och kan mäta sig med till och med vissa bärbara datorer med RTX 4090. Bara detta faktum kommer sannolikt att locka prestandajägare som inte har något emot att offra lite portabilitet för de extra hästkrafterna. Det rejäla chassit är också styvt och med ett starkt lock, vilket inte är något vi kan säga om många tunnare alternativ.
Några aspekter skulle verkligen kunna vara bättre. Om MSI vill hålla fast vid en stor design, bör servicevänligheten göras enklare och vätskekylning eller ångkammare bör övervägas i ett försök att minska fläktljudet. Numpad eller åtminstone piltangenterna bör göras större ungefär som piltangenterna på Lenovo Legion 5 16.
Pris och tillgänglighet
MSI Vector 16 HX A14V
- 02/03/2024 v7 (old)
Allen Ngo
Genomskinlighet
Valet av enheter som ska granskas görs av vår redaktion. Testprovet gavs till författaren som ett lån av tillverkaren eller återförsäljaren för denna recension. Långivaren hade inget inflytande på denna recension och inte heller fick tillverkaren en kopia av denna recension innan publiceringen. Det fanns ingen skyldighet att publicera denna recension. Som ett oberoende medieföretag är Notebookcheck inte föremål för auktoritet från tillverkare, återförsäljare eller förlag.
This is how Notebookcheck is testingEvery year, Notebookcheck independently reviews hundreds of laptops and smartphones using standardized procedures to ensure that all results are comparable. We have continuously developed our test methods for around 20 years and set industry standards in the process. In our test labs, high-quality measuring equipment is utilized by experienced technicians and editors. These tests involve a multi-stage validation process. Our complex rating system is based on hundreds of well-founded measurements and benchmarks, which maintains objectivity.
Price comparison

