Asus ROG Strix Scar 18 2023 G834JY recension - Bärbar dator för spel med RTX 4090
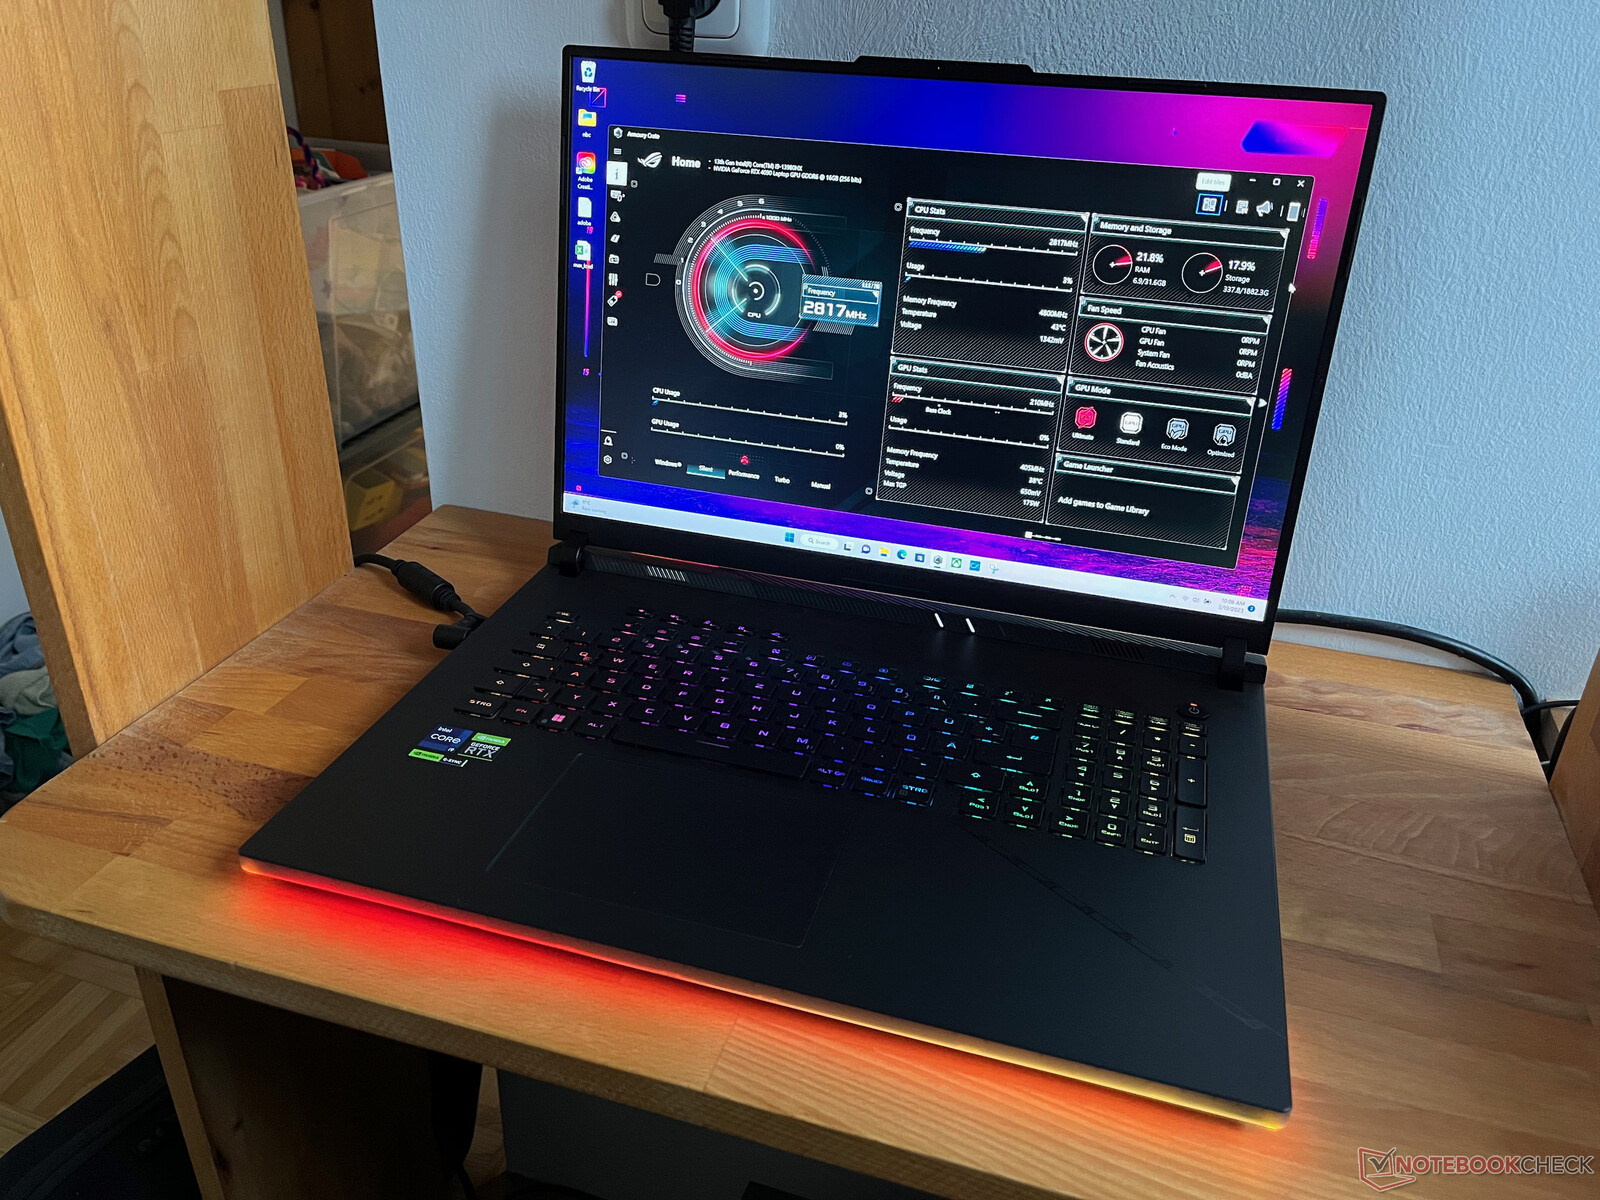
Med ROG Strix Scar 18 ansluter sig Asus också till trenden med att återuppliva 18-tums spelmonster. Till lanseringen finns det ett nytt fodral med den RTX 4080och RTX 4090 GPU för bärbara datorersom används av vår testenhet. När det gäller CPU:er använder Asus den nya HX-serien, vilket innebär att du får de snabbaste laptopkomponenterna som för närvarande finns på marknaden. Det stora höljet används inte bara fullt ut av den 18-tums QHD+-skärmen, utan rymmer även ett nytt kylsystem med tre fläktar, som ska hålla de strömhungriga komponenterna i schack. I följande test tar vi en detaljerad titt på G834JY-N6005W med RTX 4090, 32 GB GDDR5 RAM och 2x 1-TB SSD som för närvarande finns tillgänglig i England.
Potentiella konkurrenter i jämförelse
Gradering | Datum | Modell | Vikt | Höjd | Storlek | Upplösning | Pris |
|---|---|---|---|---|---|---|---|
| 86.6 % v7 (old) | 02/2023 | Asus ROG Strix Scar 18 2023 G834JY-N6005W i9-13980HX, GeForce RTX 4090 Laptop GPU | 3.1 kg | 30.8 mm | 18.00" | 2560x1600 | |
| 89 % v7 (old) | 02/2023 | MSI Titan GT77 HX 13VI i9-13950HX, GeForce RTX 4090 Laptop GPU | 3.5 kg | 23 mm | 17.30" | 3840x2160 | |
| 89.4 % v7 (old) | 02/2023 | Lenovo Legion Pro 7 16IRX8H i9-13900HX, GeForce RTX 4080 Laptop GPU | 2.7 kg | 26 mm | 16.00" | 2560x1600 | |
| 91.2 % v7 (old) | 02/2023 | Razer Blade 16 Early 2023 i9-13950HX, GeForce RTX 4080 Laptop GPU | 2.4 kg | 21.99 mm | 16.00" | 2560x1600 | |
| 86.9 % v7 (old) | 11/2022 | Asus ROG Strix Scar 17 SE G733CX-LL014W i9-12950HX, GeForce RTX 3080 Ti Laptop GPU | 2.9 kg | 28.3 mm | 17.30" | 2560x1440 | |
| 88.3 % v7 (old) | 08/2022 | MSI Titan GT77 12UHS i9-12900HX, GeForce RTX 3080 Ti Laptop GPU | 3.3 kg | 23 mm | 17.30" | 1920x1080 | |
| 85.4 % v7 (old) | 03/2023 | HP Omen 17-ck2097ng i9-13900HX, GeForce RTX 4080 Laptop GPU | 2.8 kg | 27 mm | 17.30" | 2560x1440 |
Fall
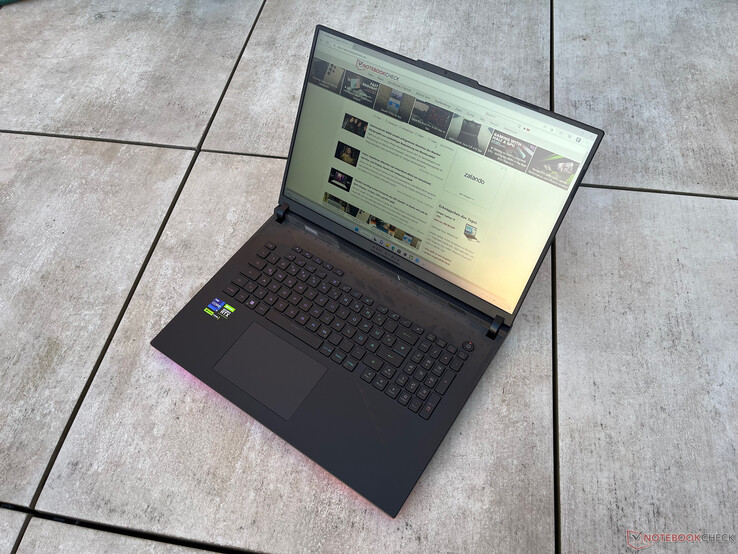
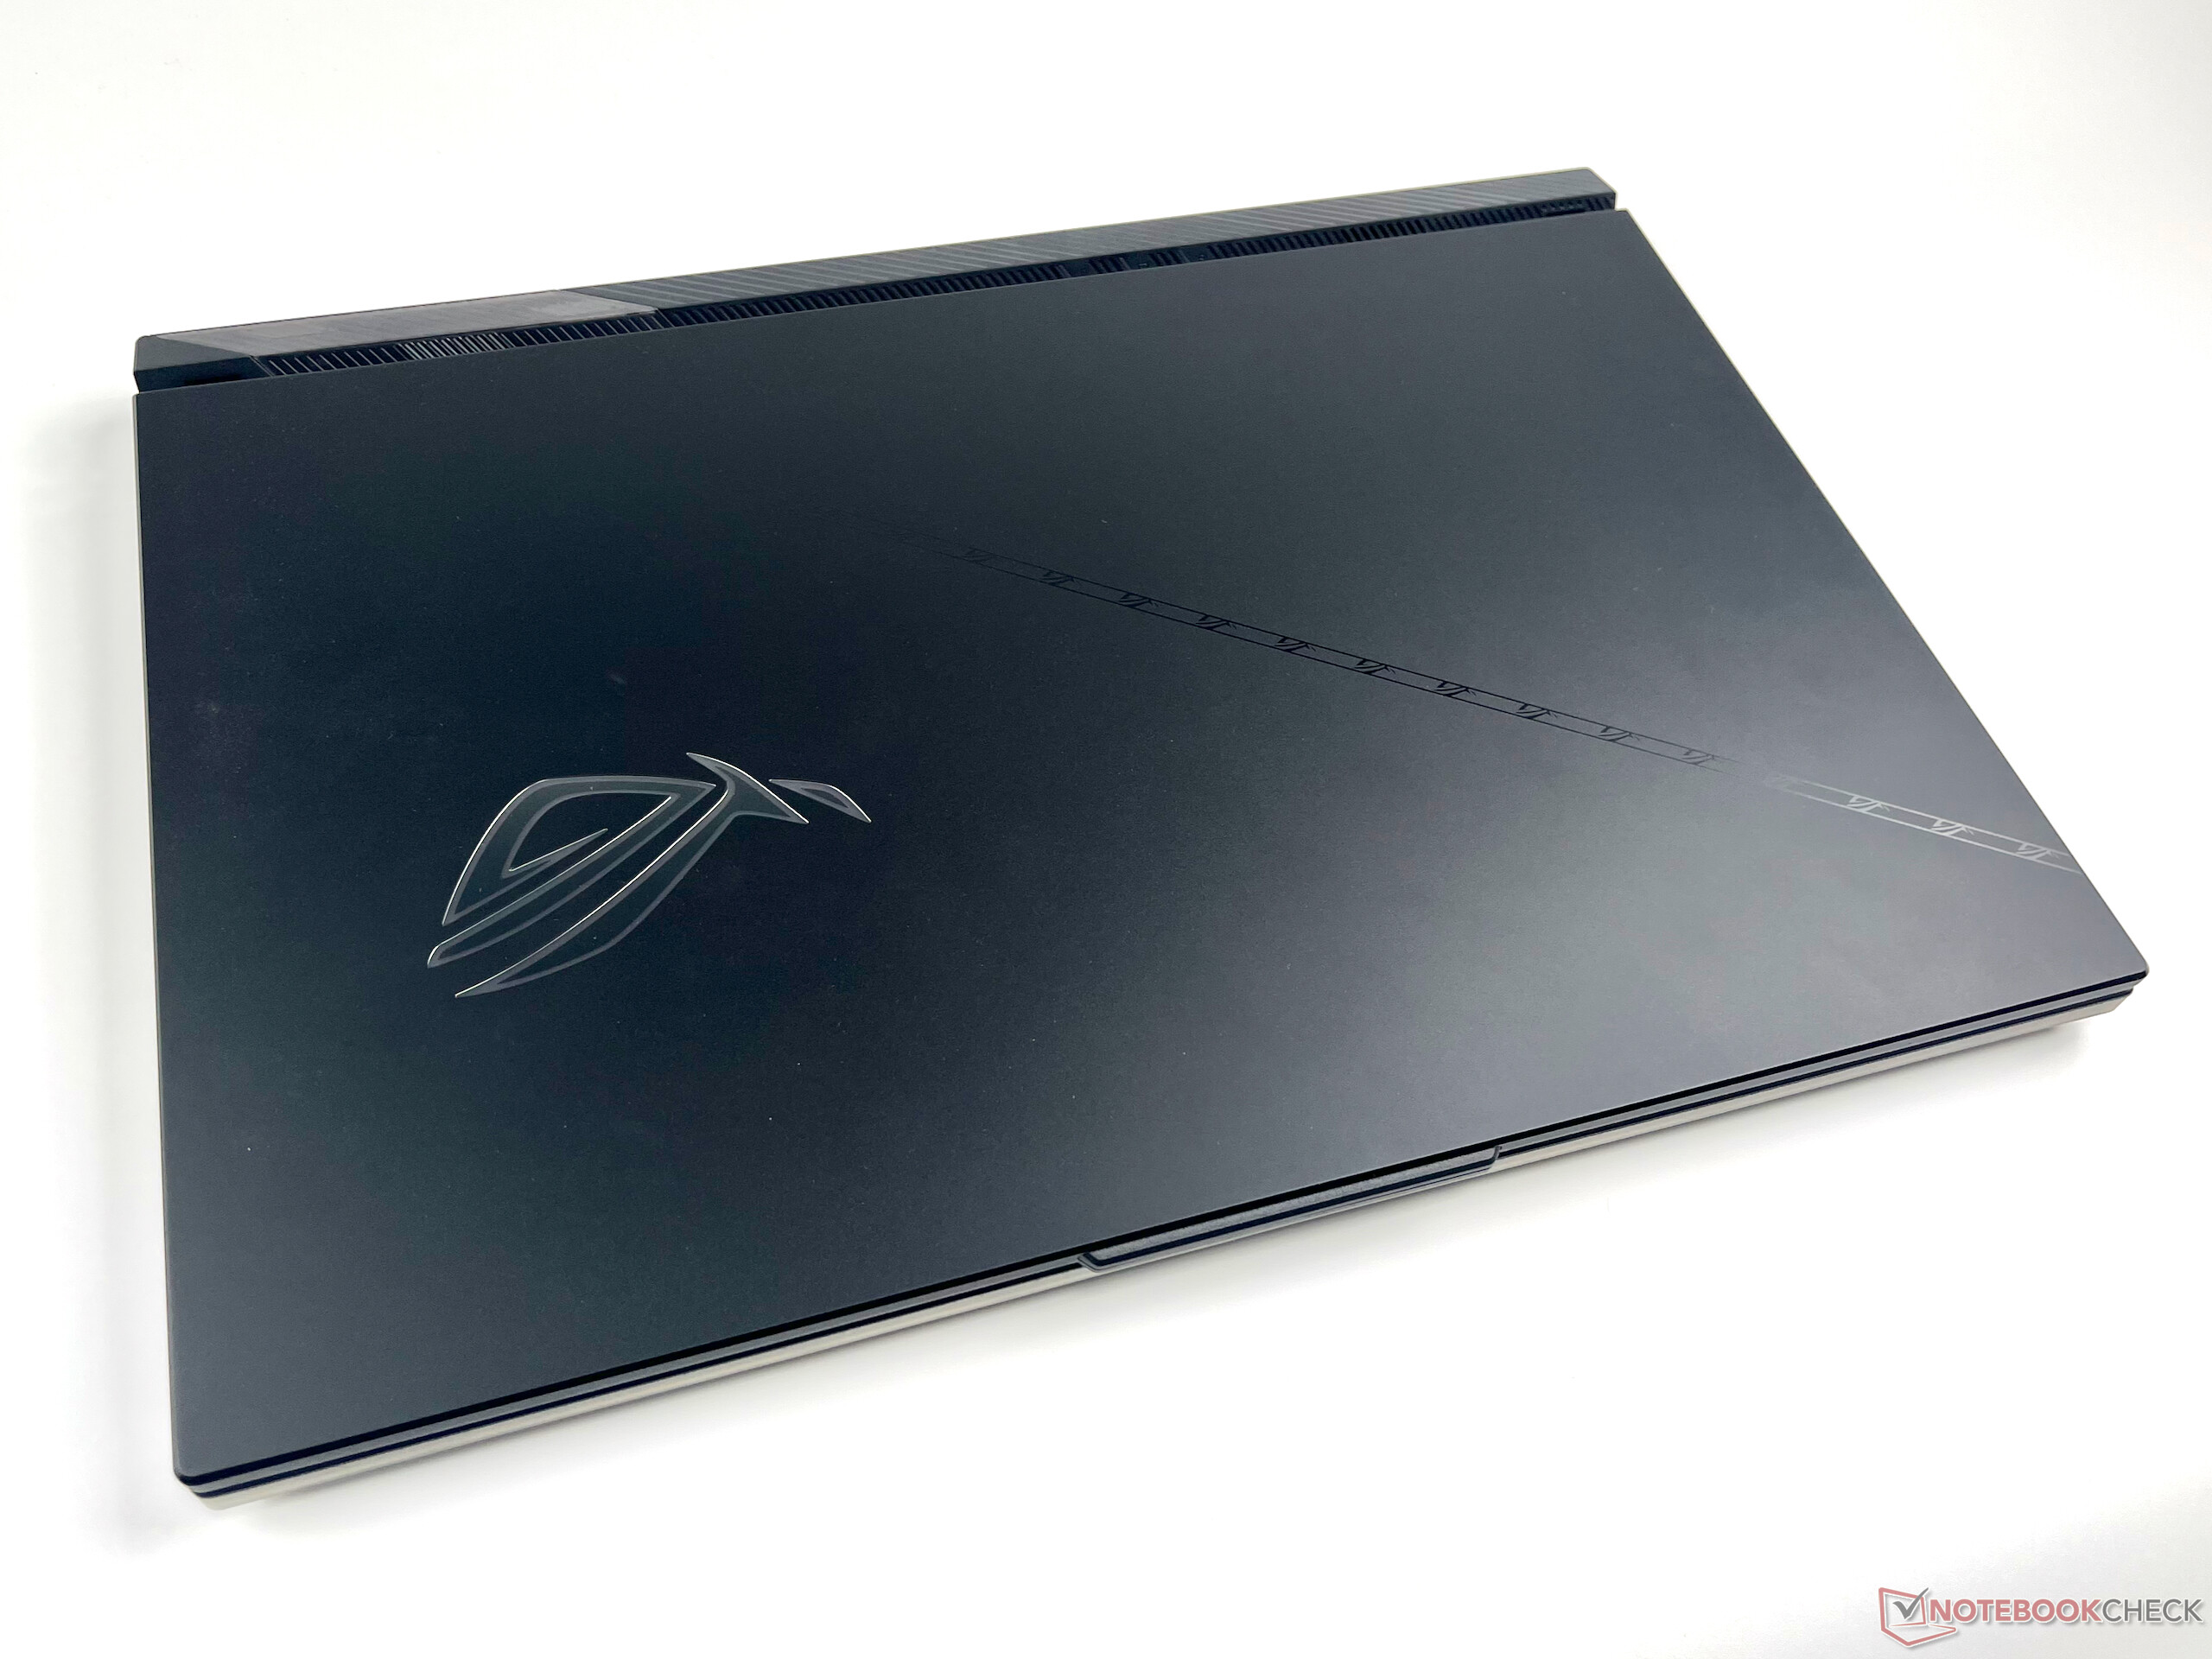
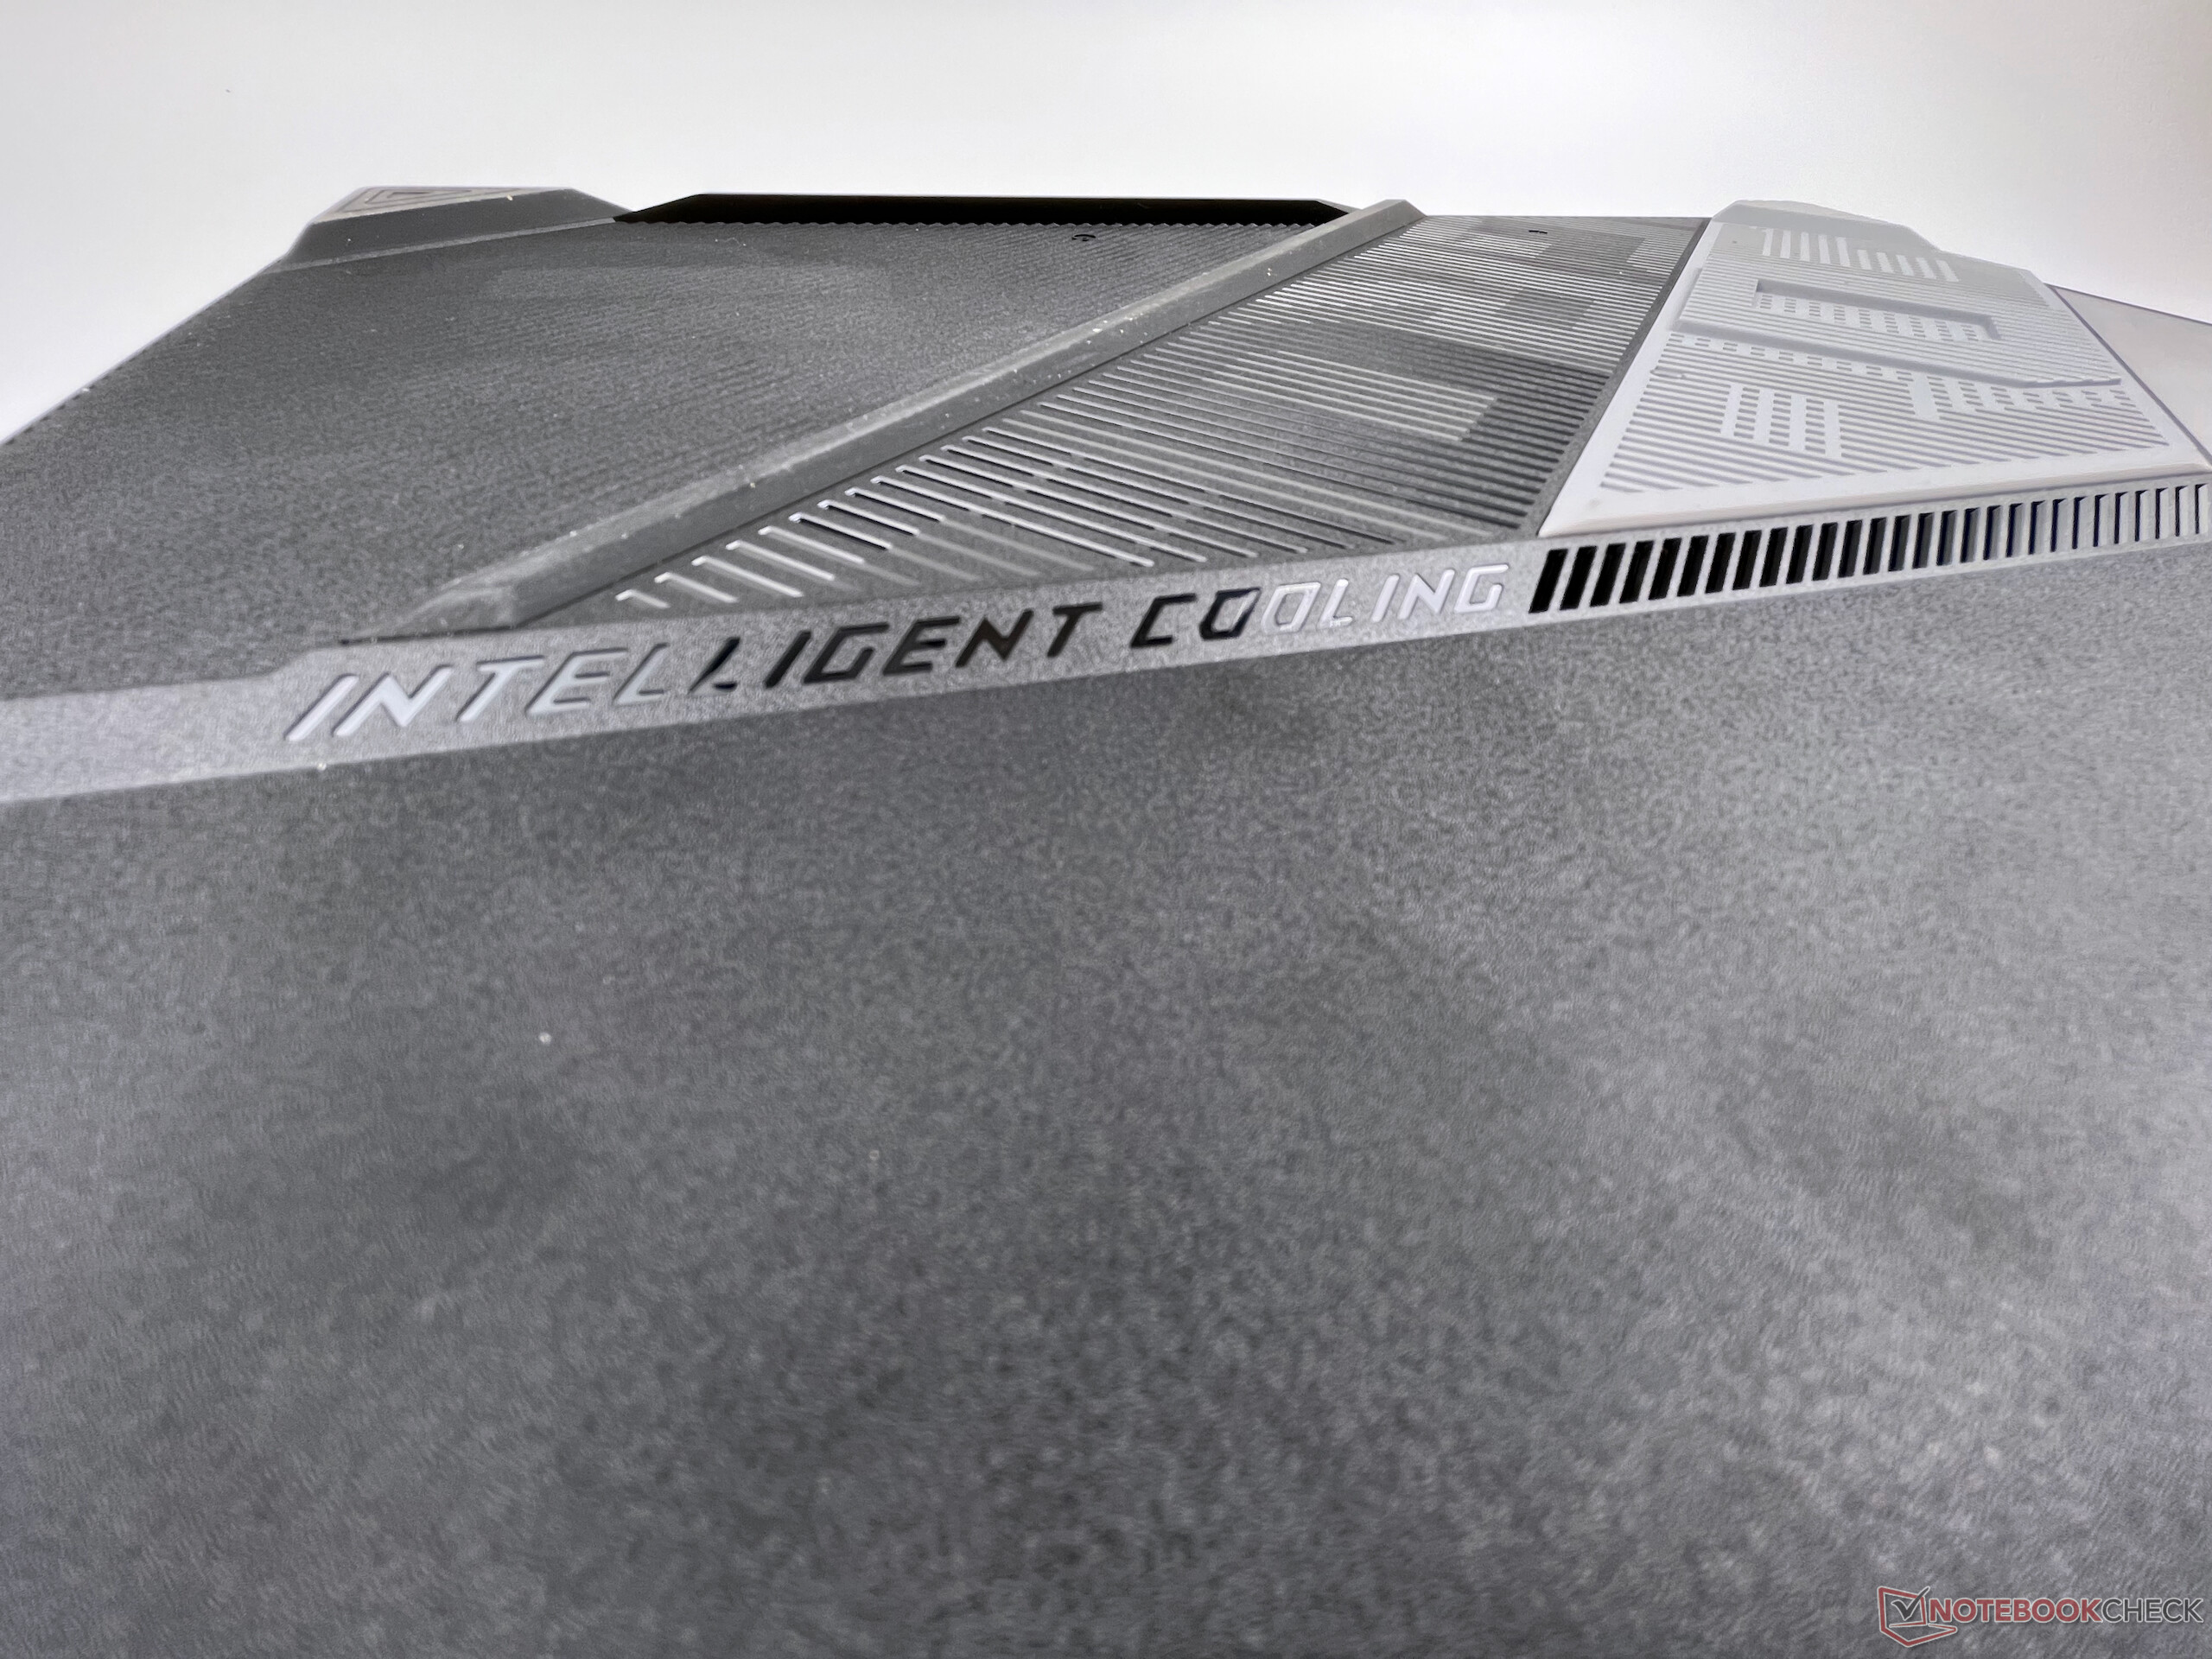
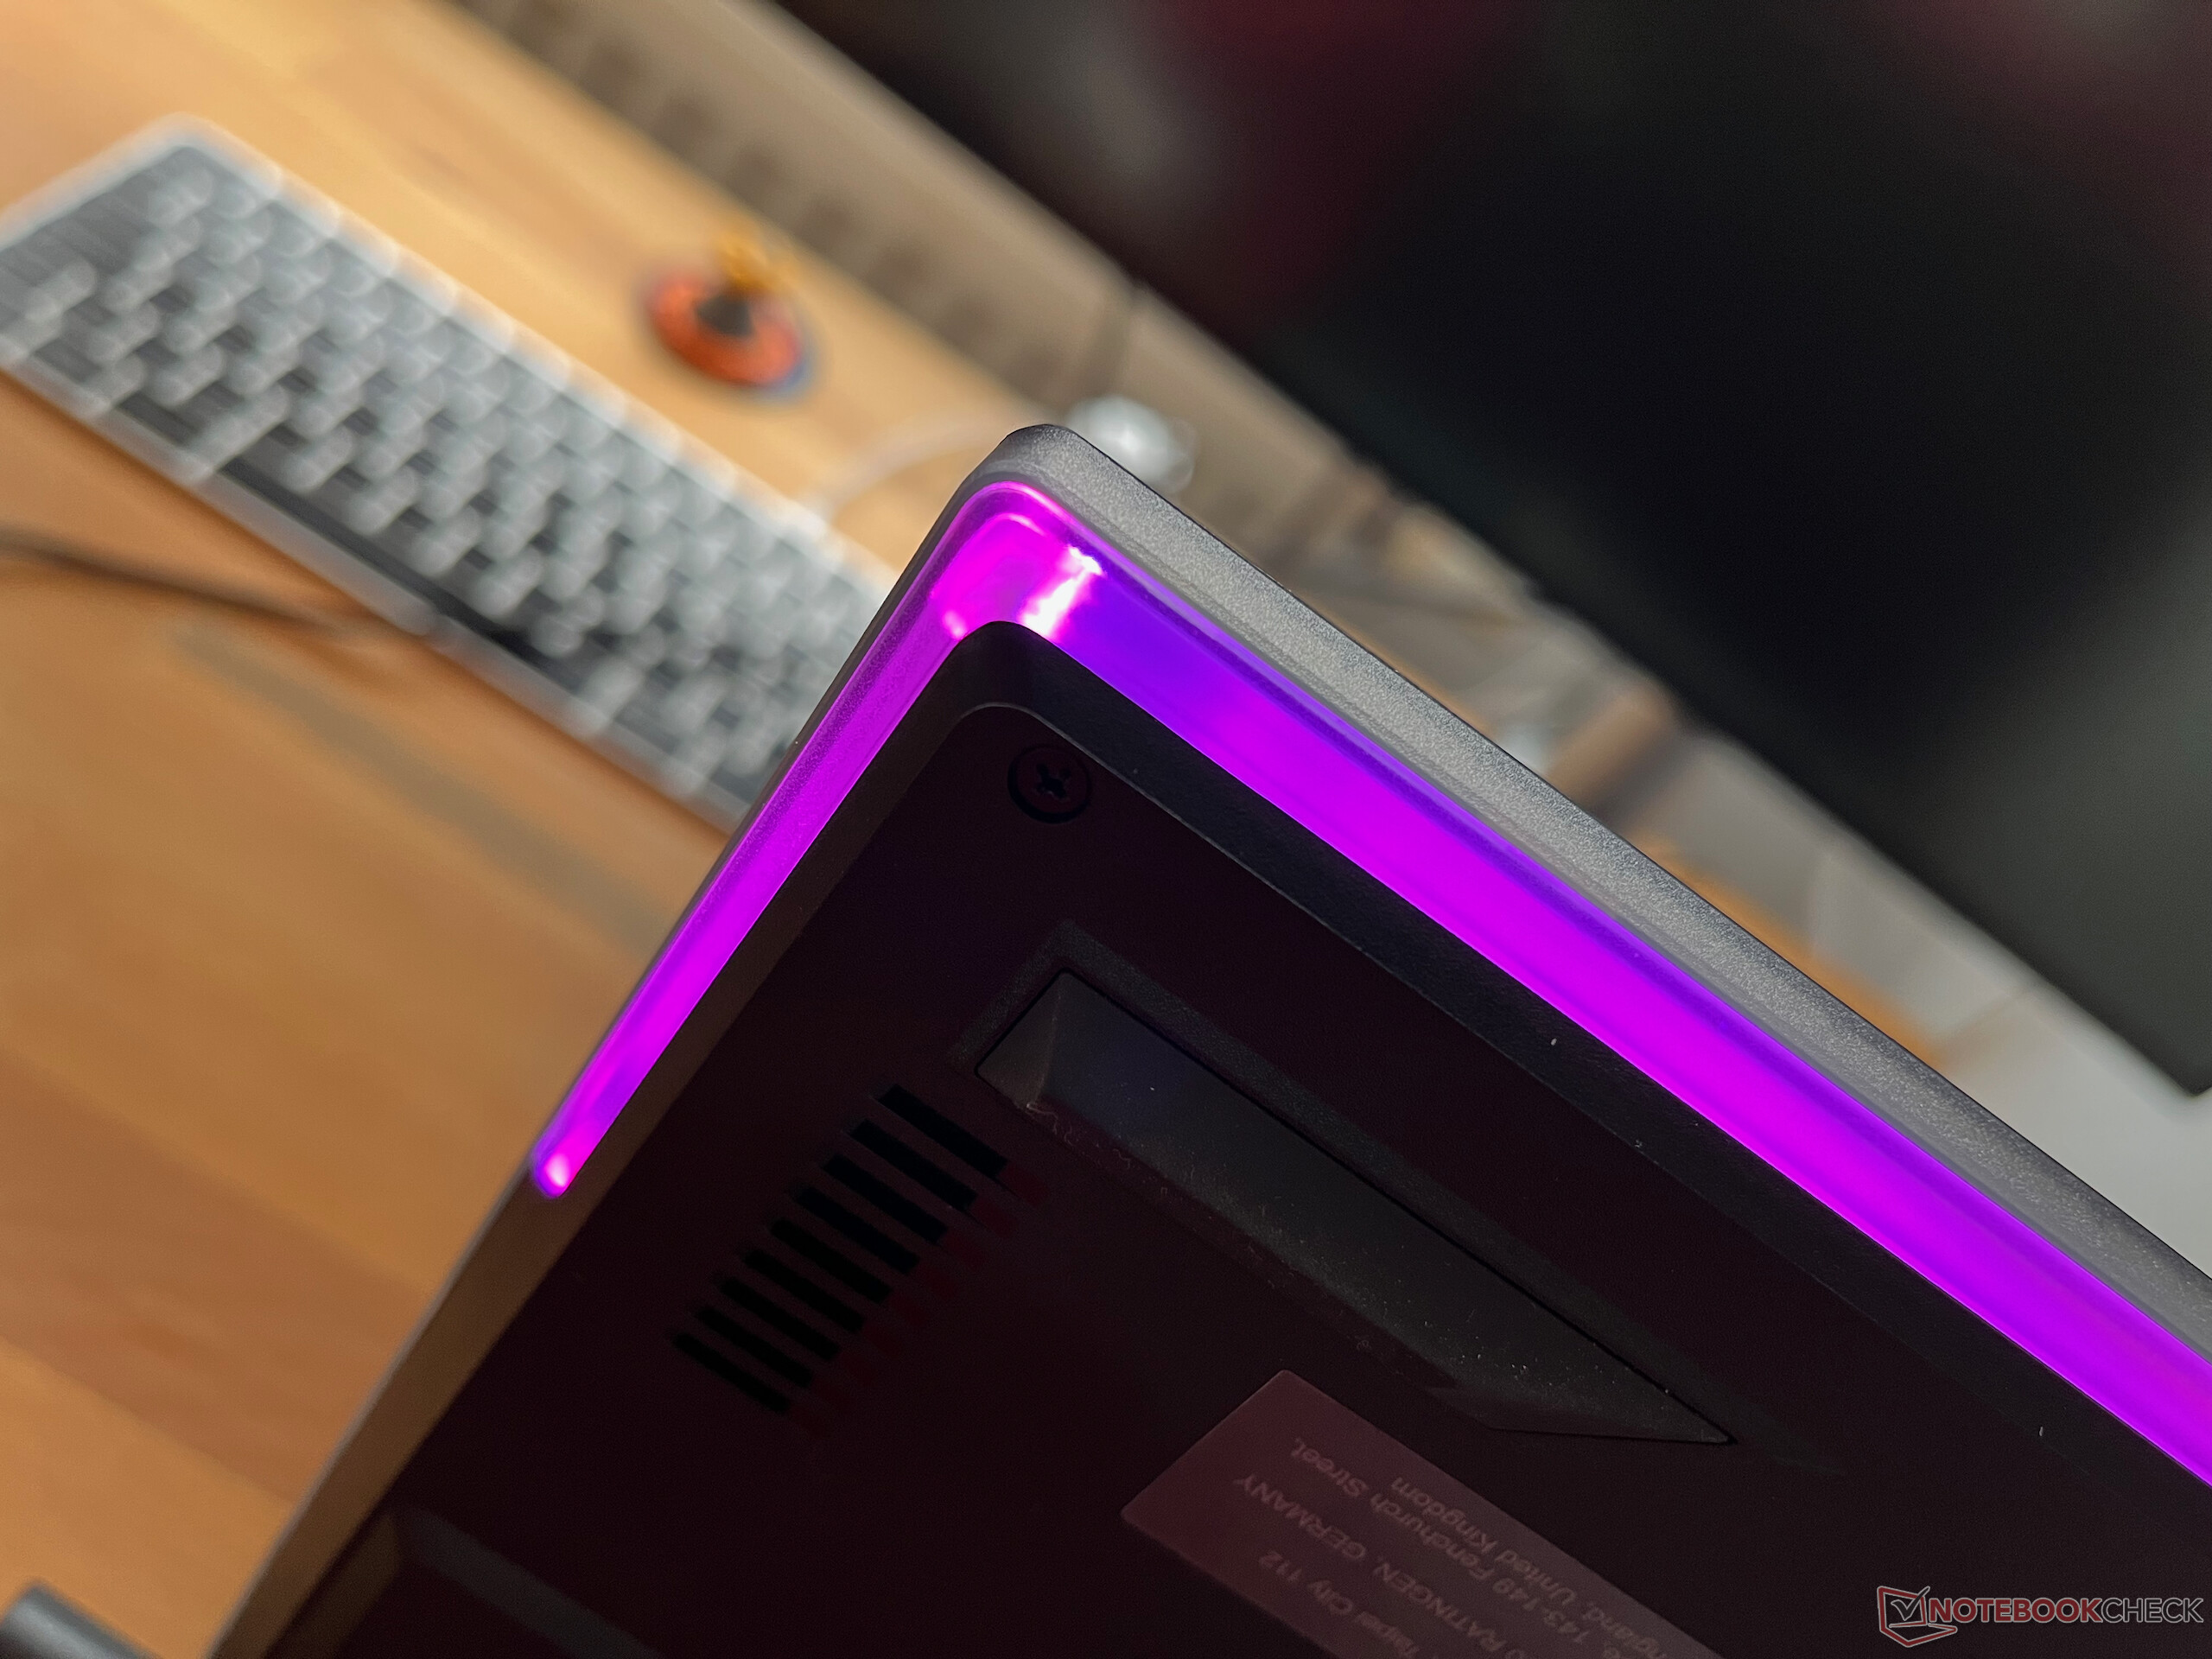
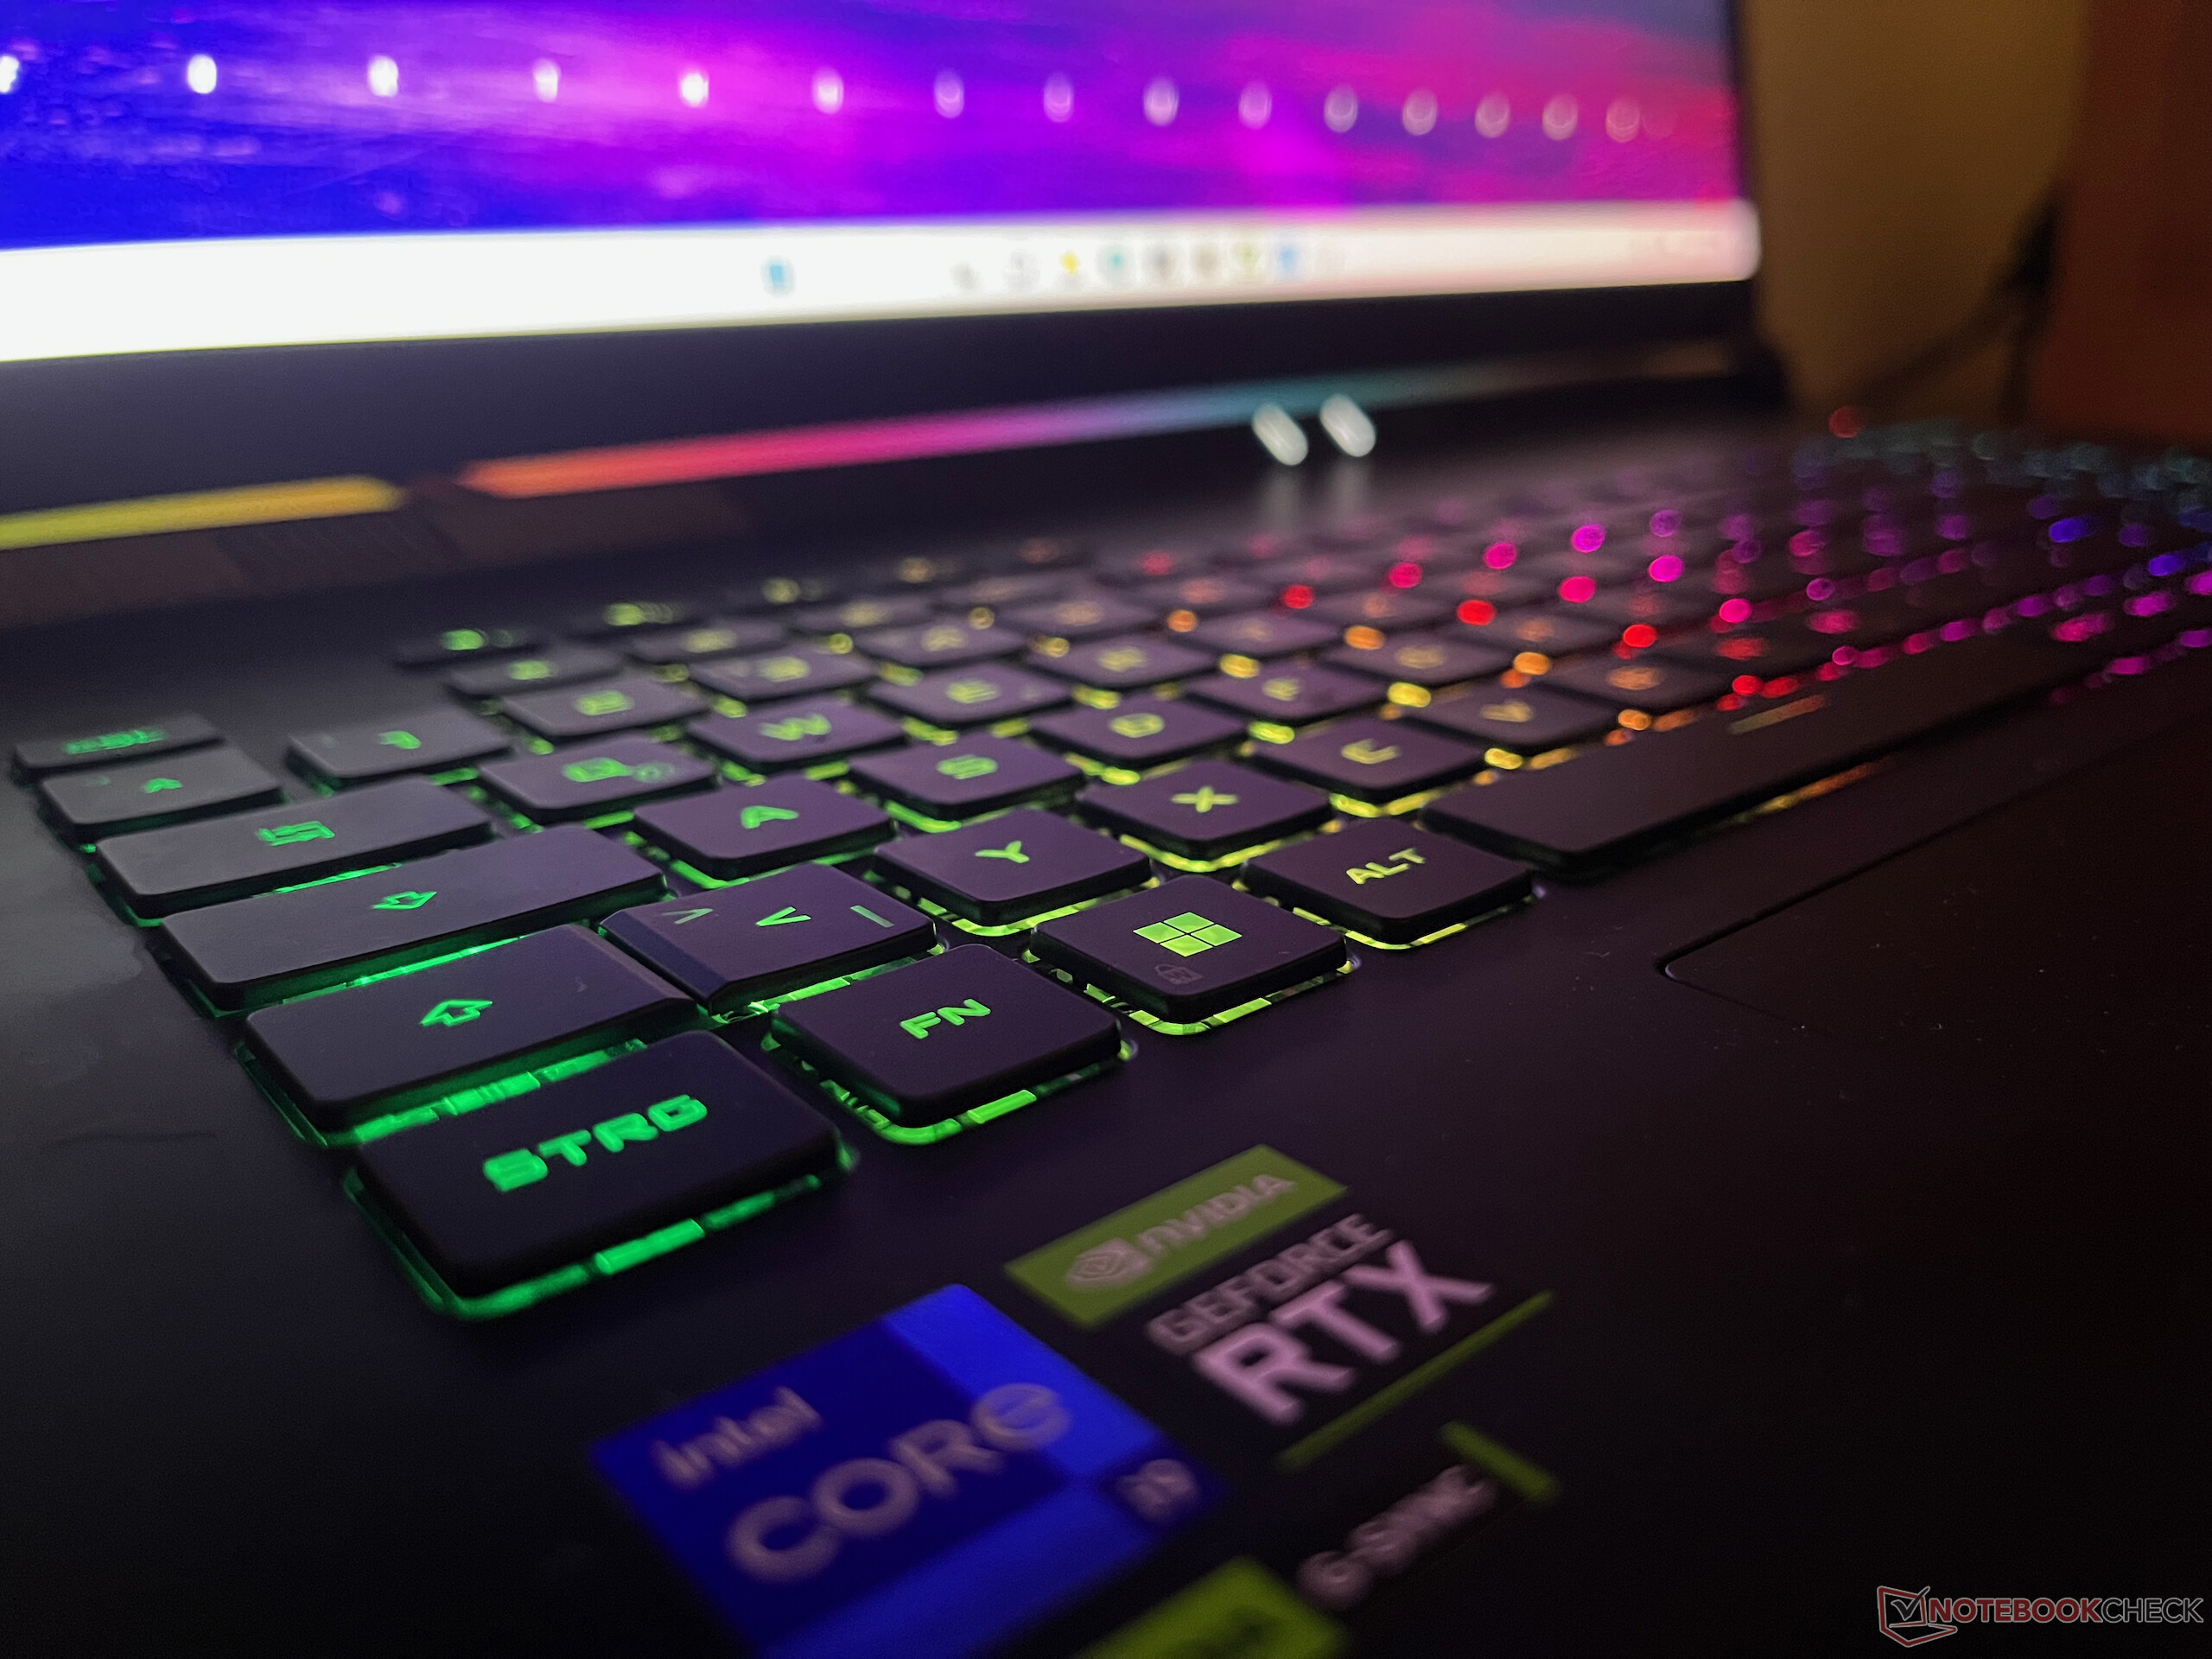
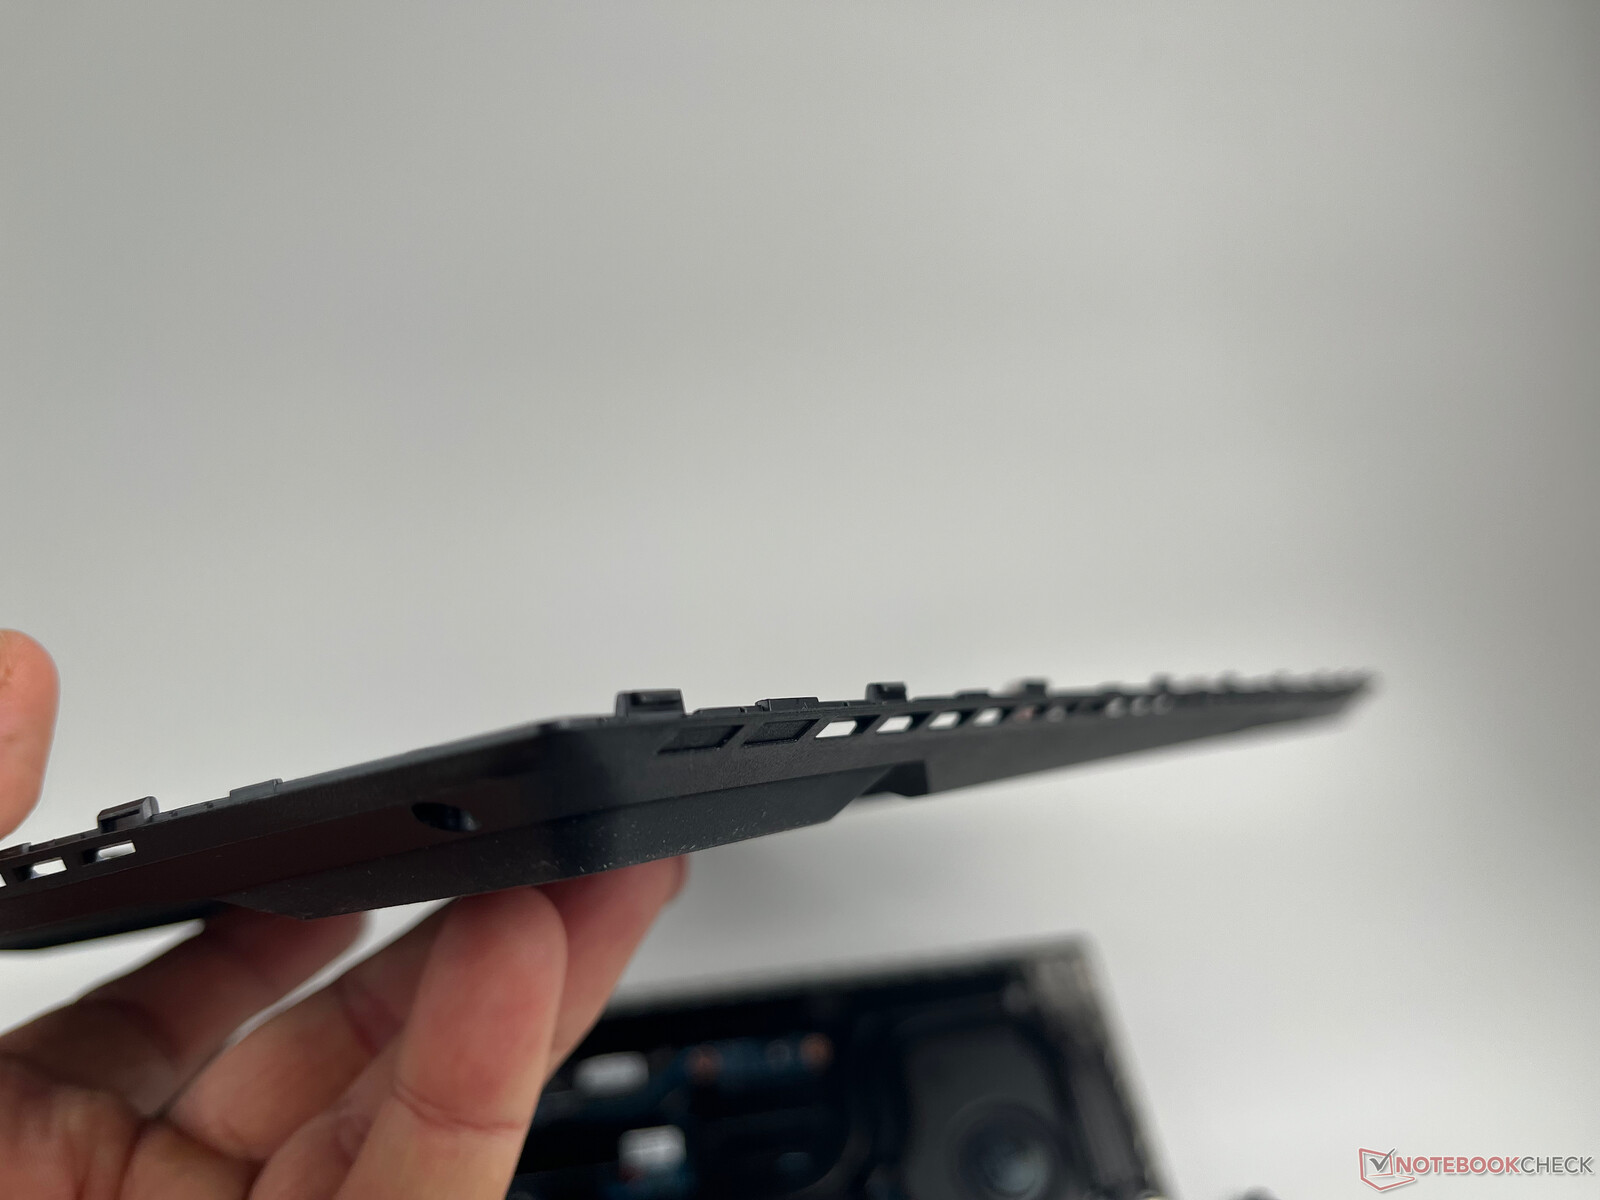
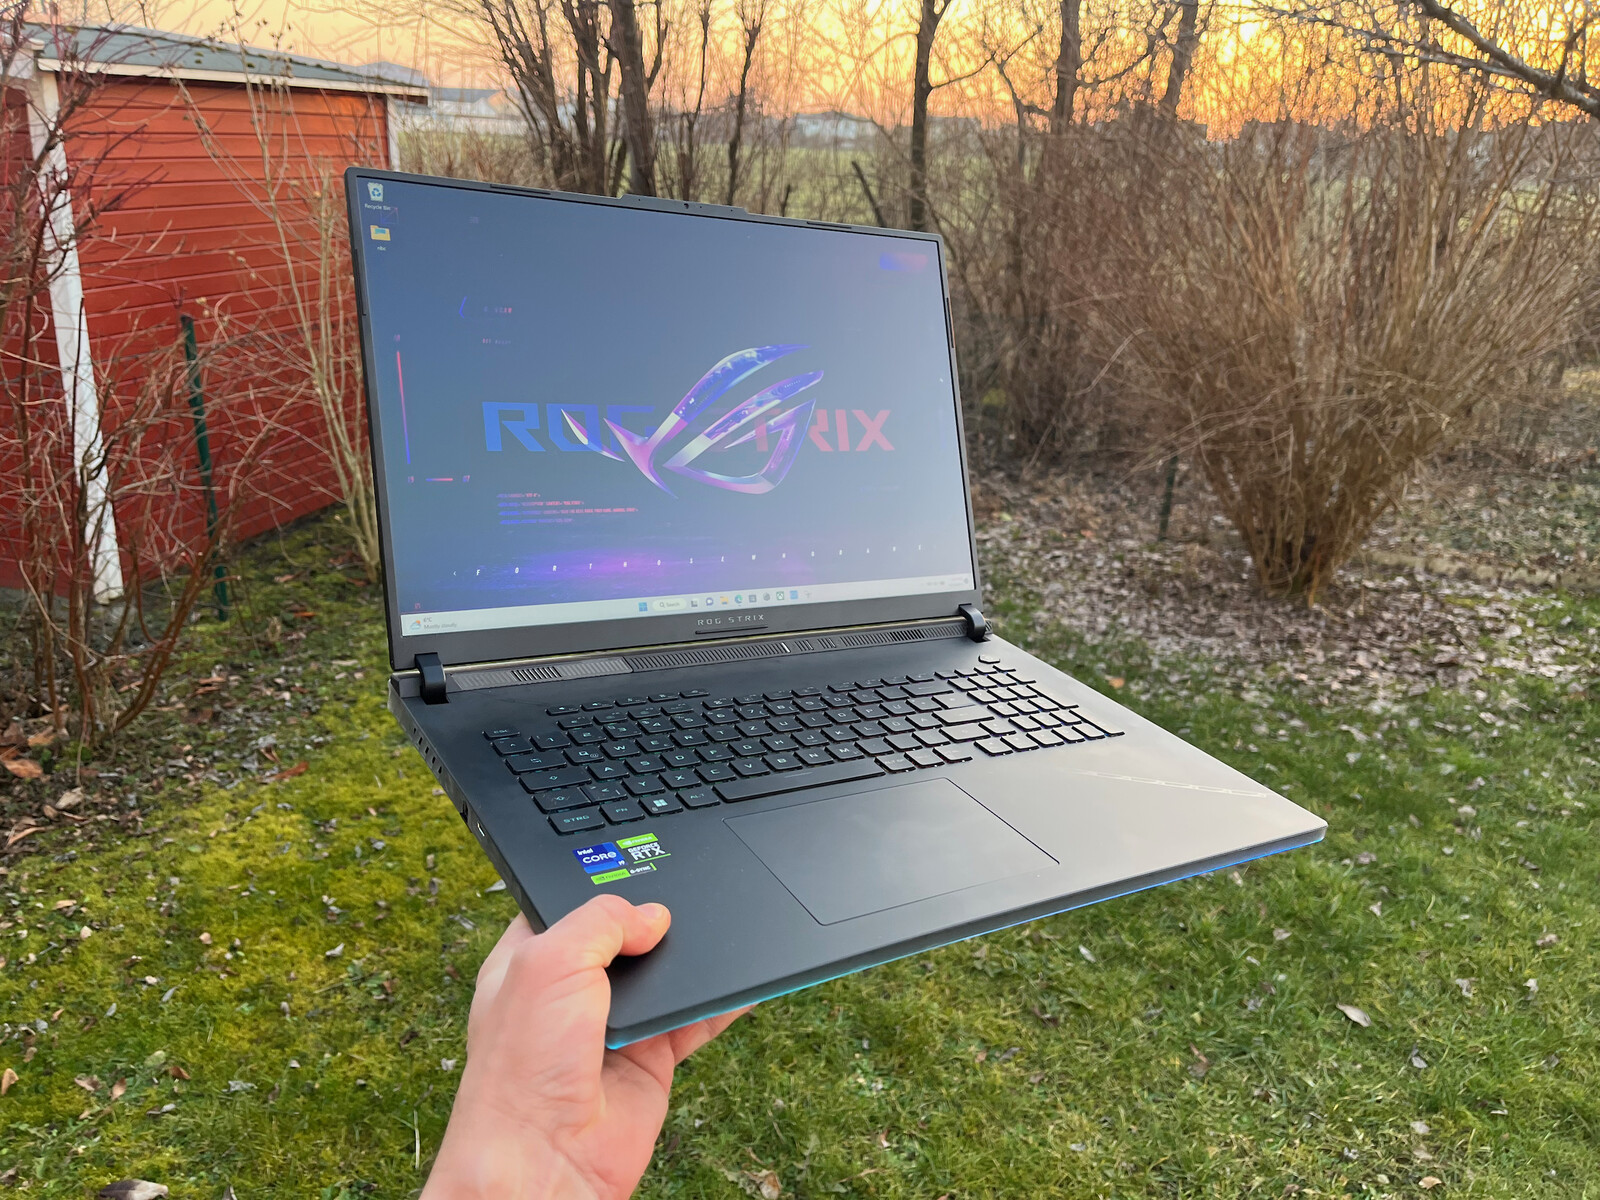
Fodralet är tänkt att göra poäng med massiv användning av RGB-ljusdioder och genomskinliga delar av fodralet. Samtidigt är den grundläggande designen relativt diskret och ganska attraktiv. Endast de genomskinliga ytorna på sidorna ser lite billiga ut. Själva basenheten är tillverkad av plast och ger inte mycket av en högkvalitativ känsla. Den vrider sig också något när man lyfter upp den. Å andra sidan är displaylocket i aluminium betydligt stabilare och ger också tillräckligt skydd för displayen.
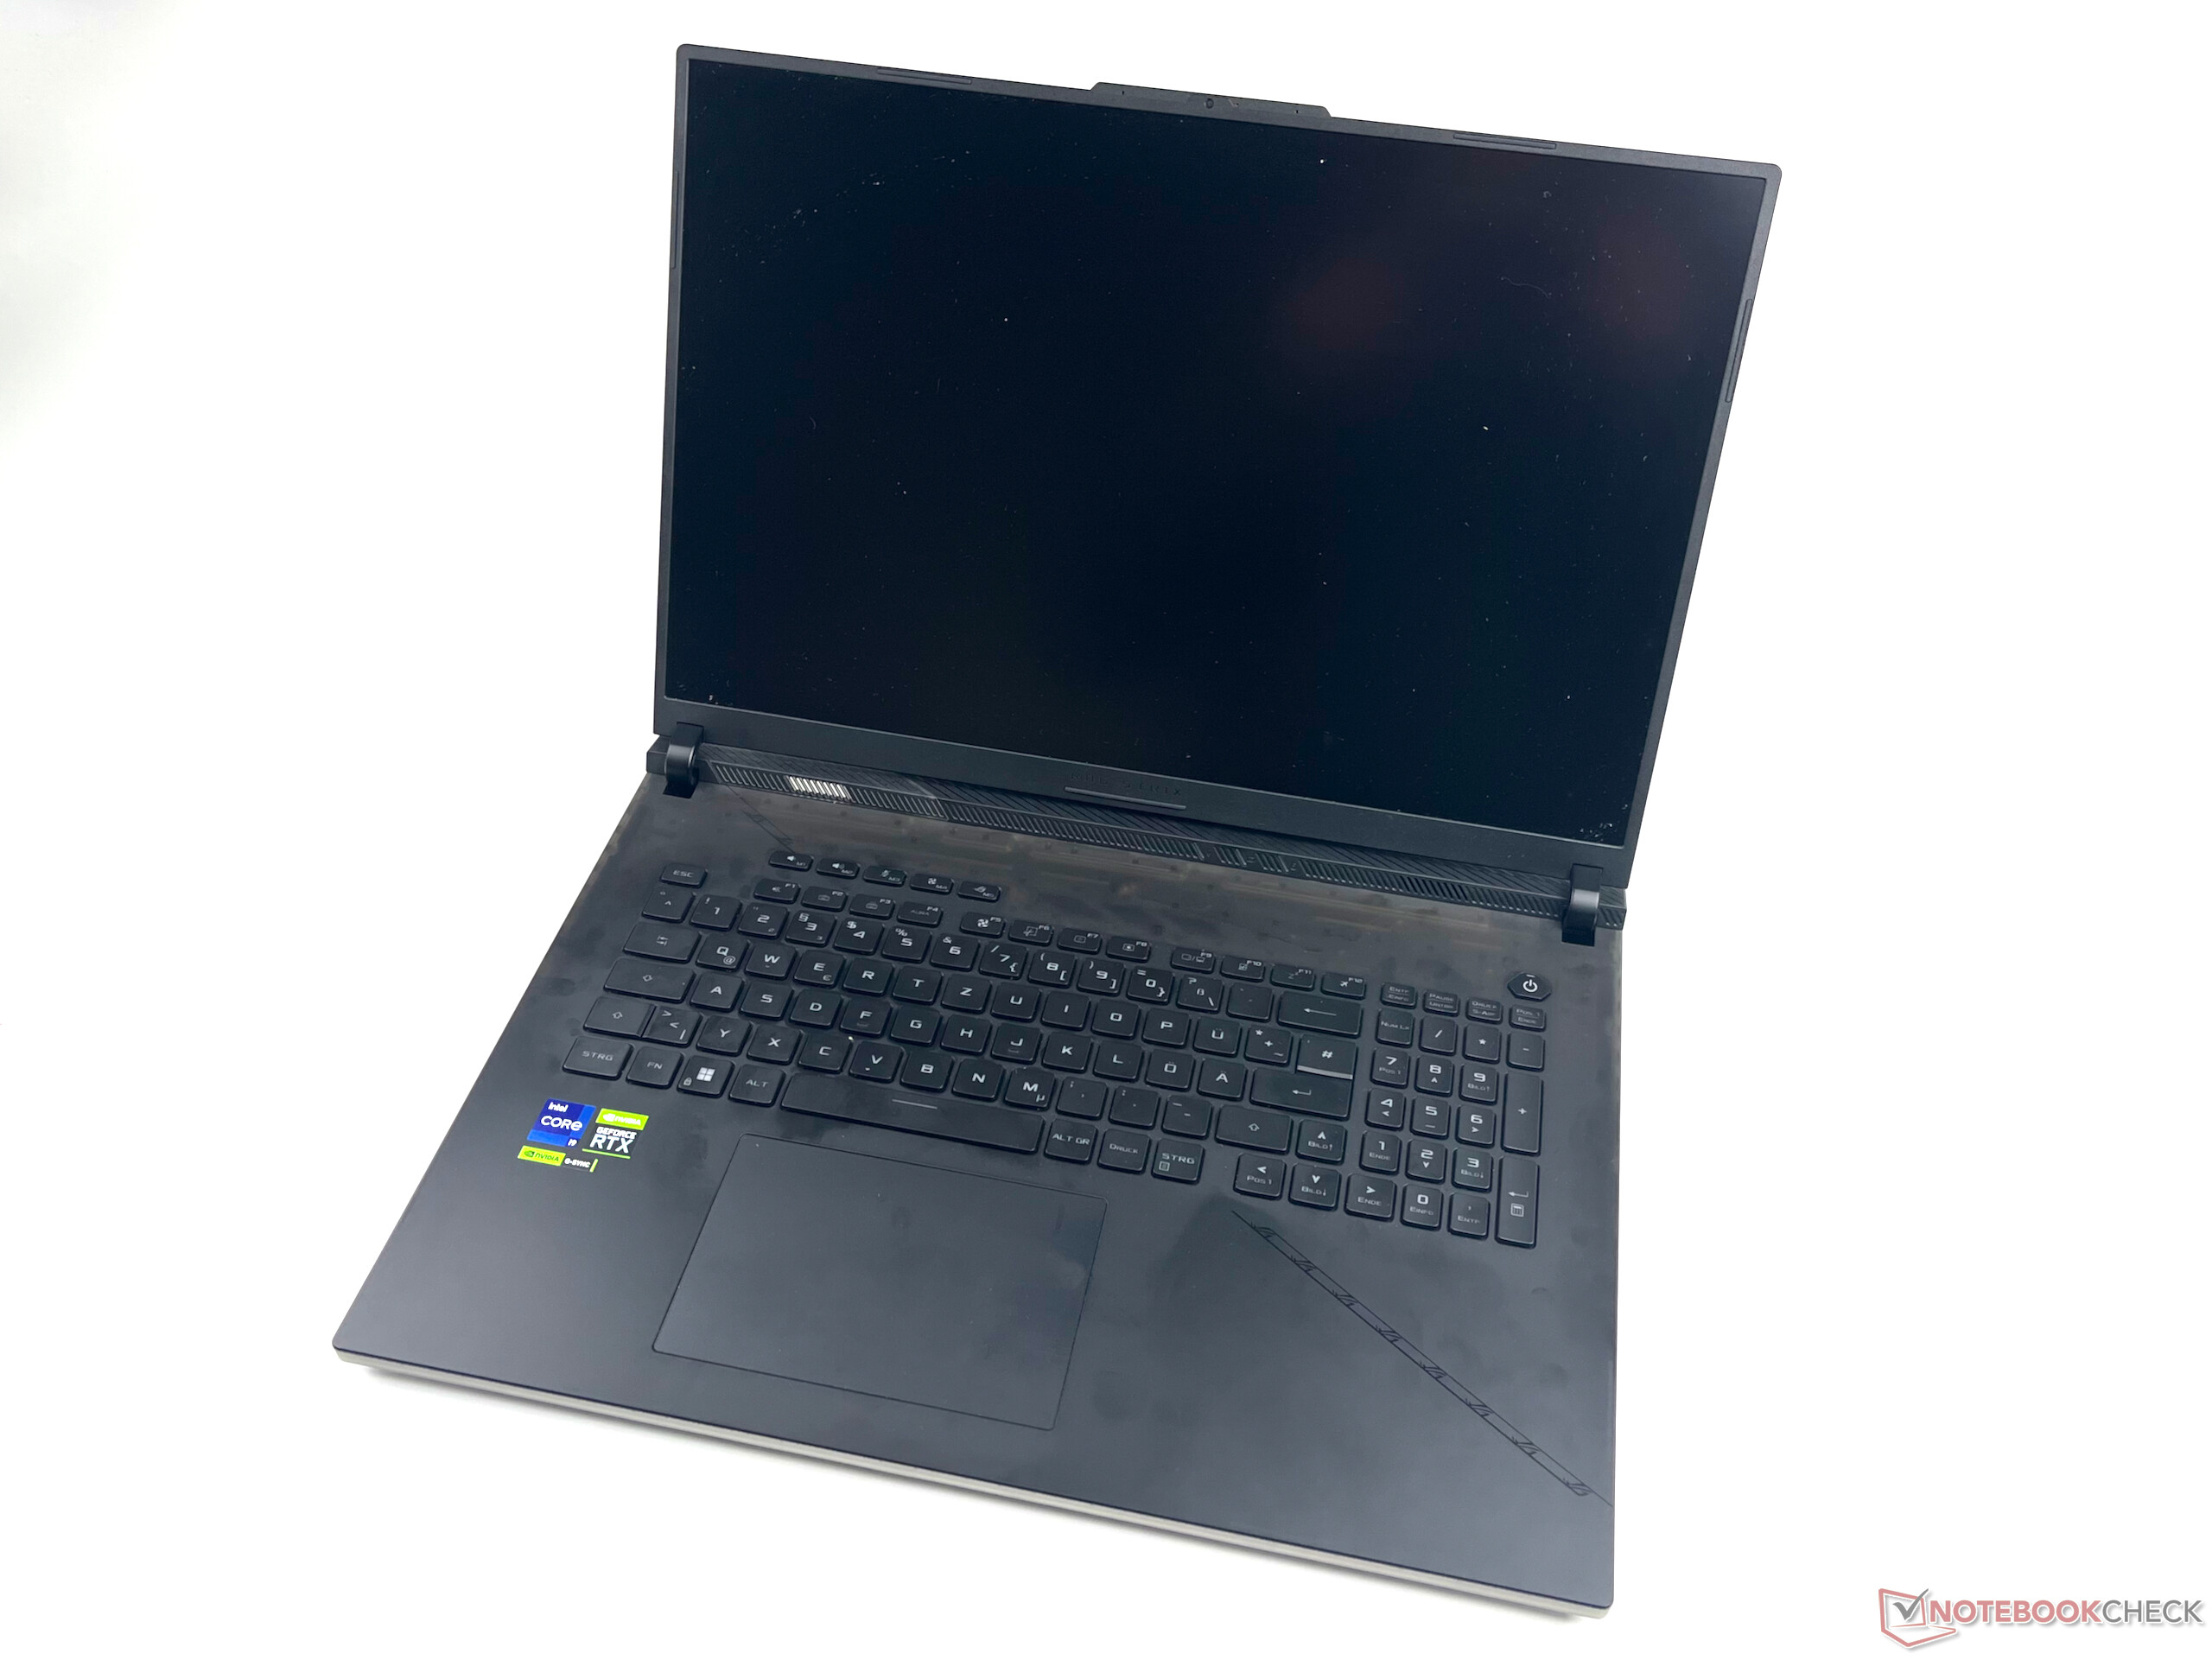
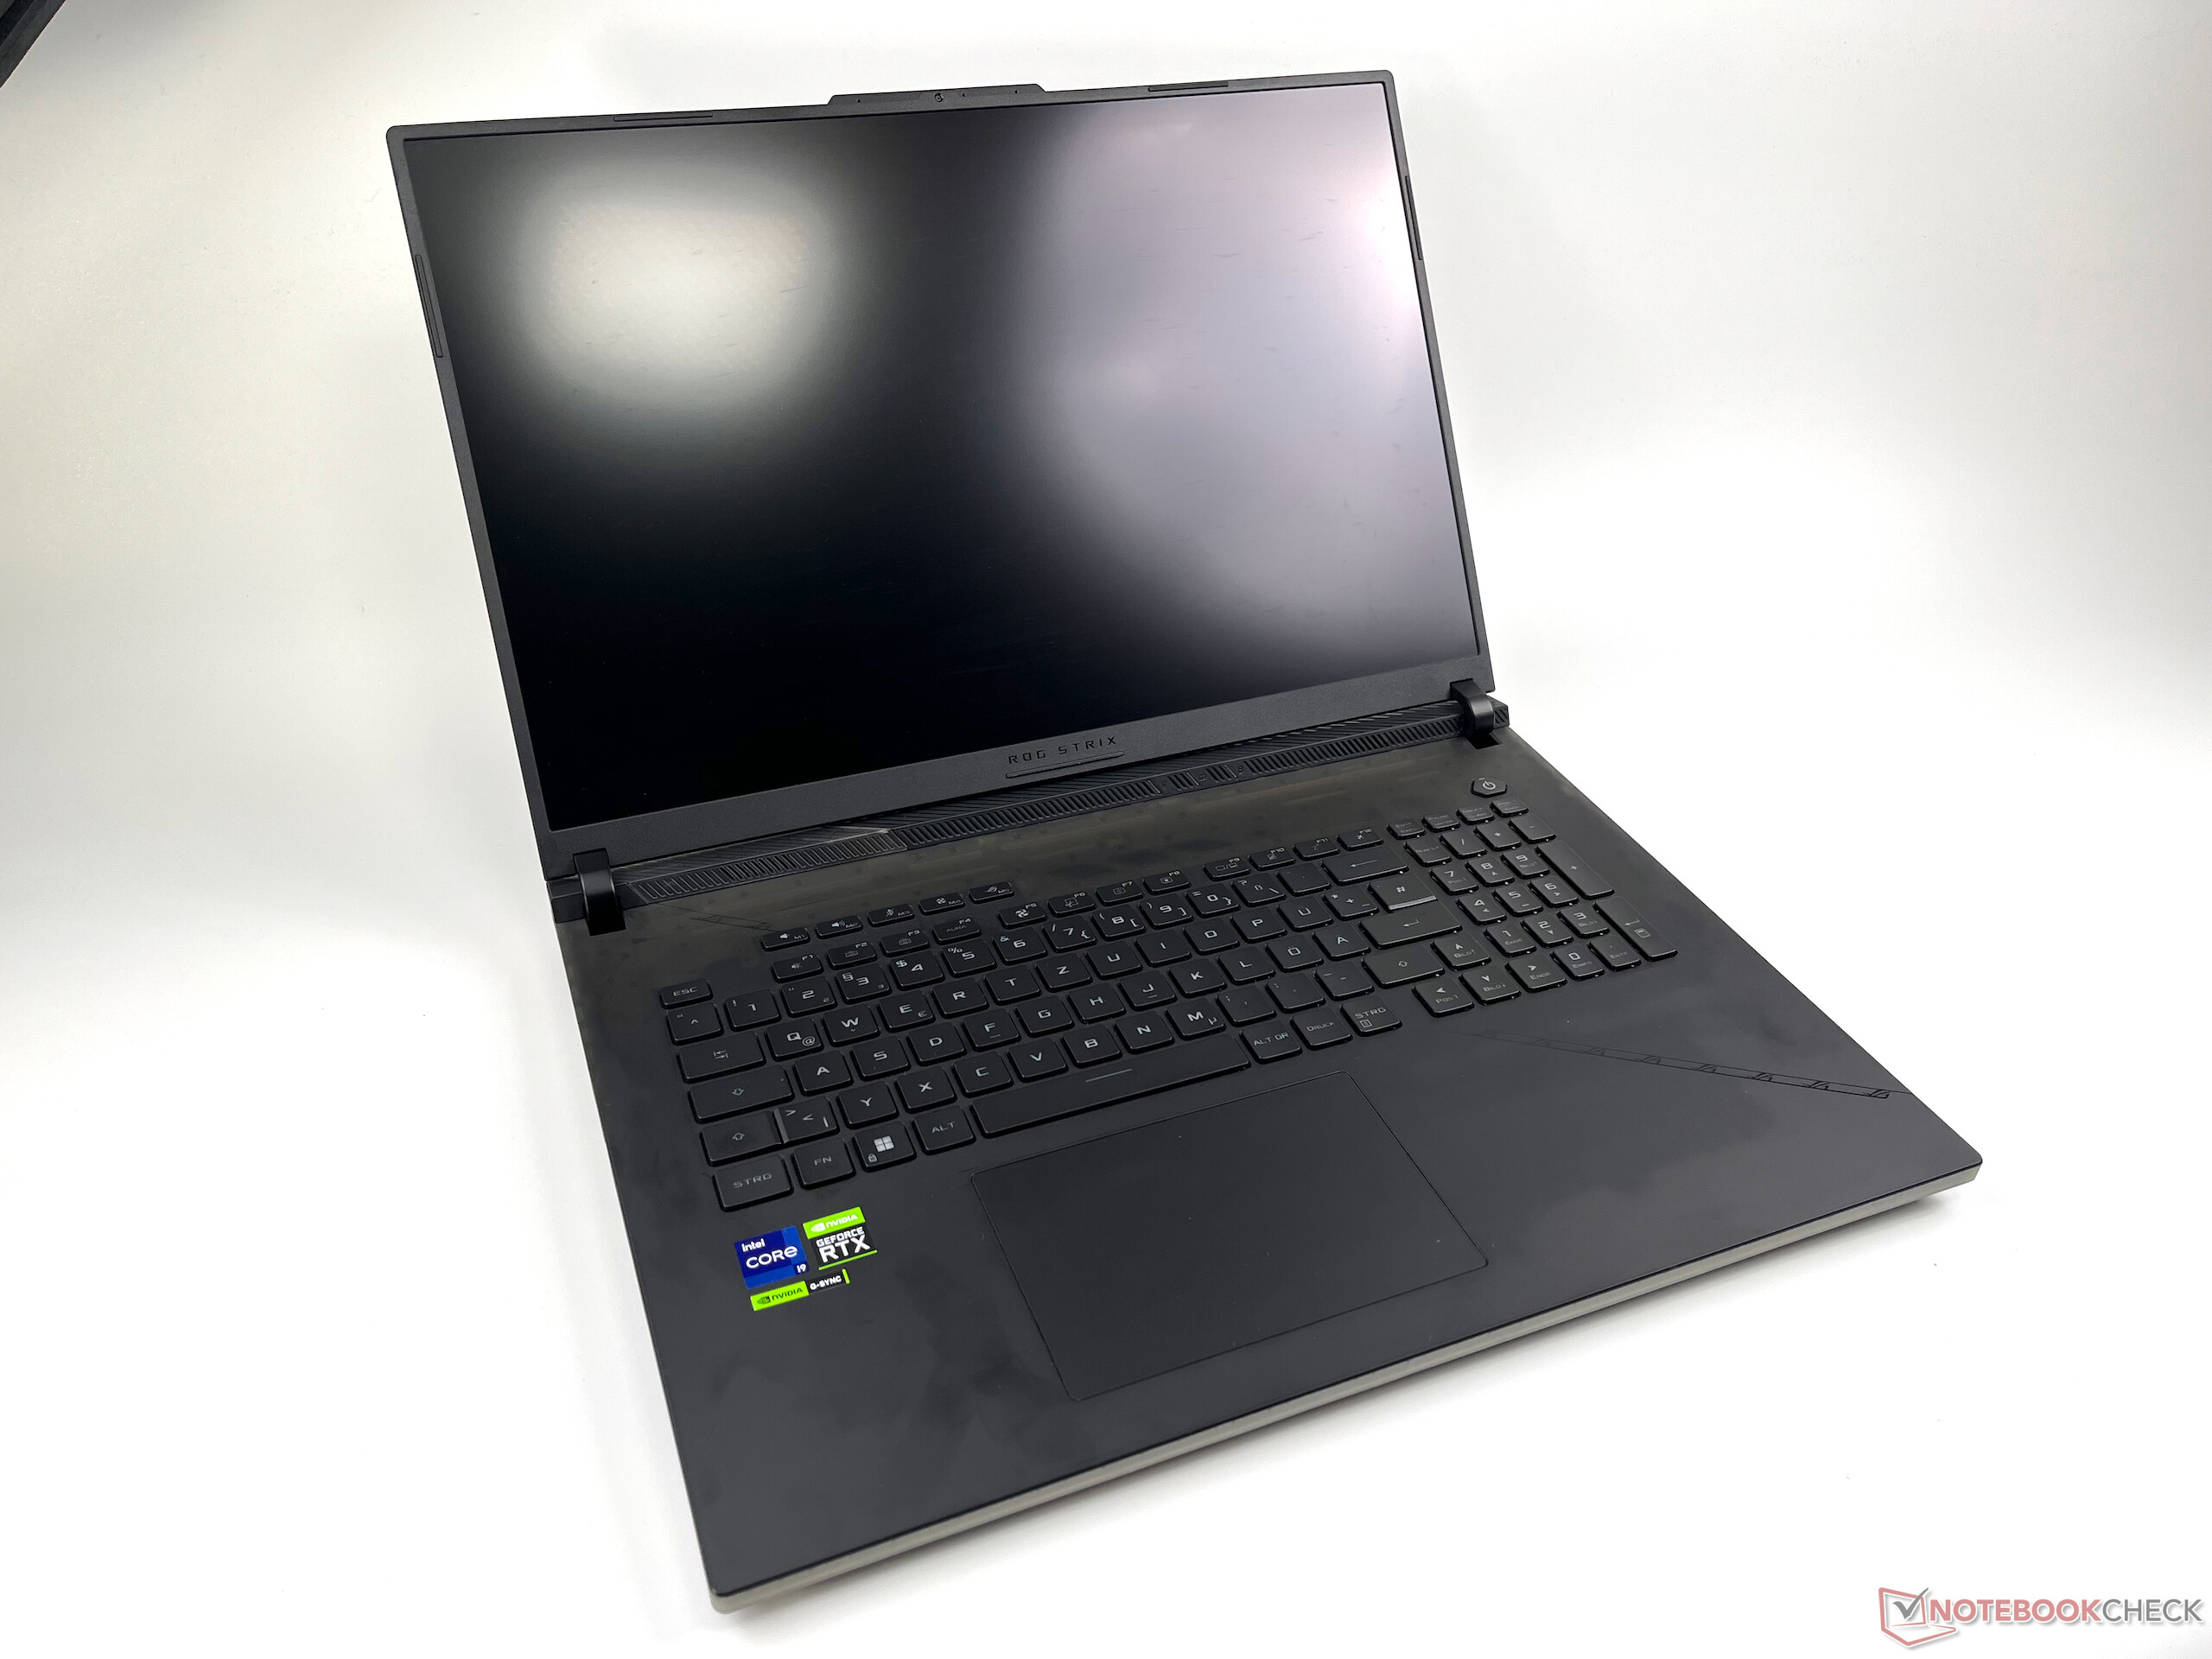

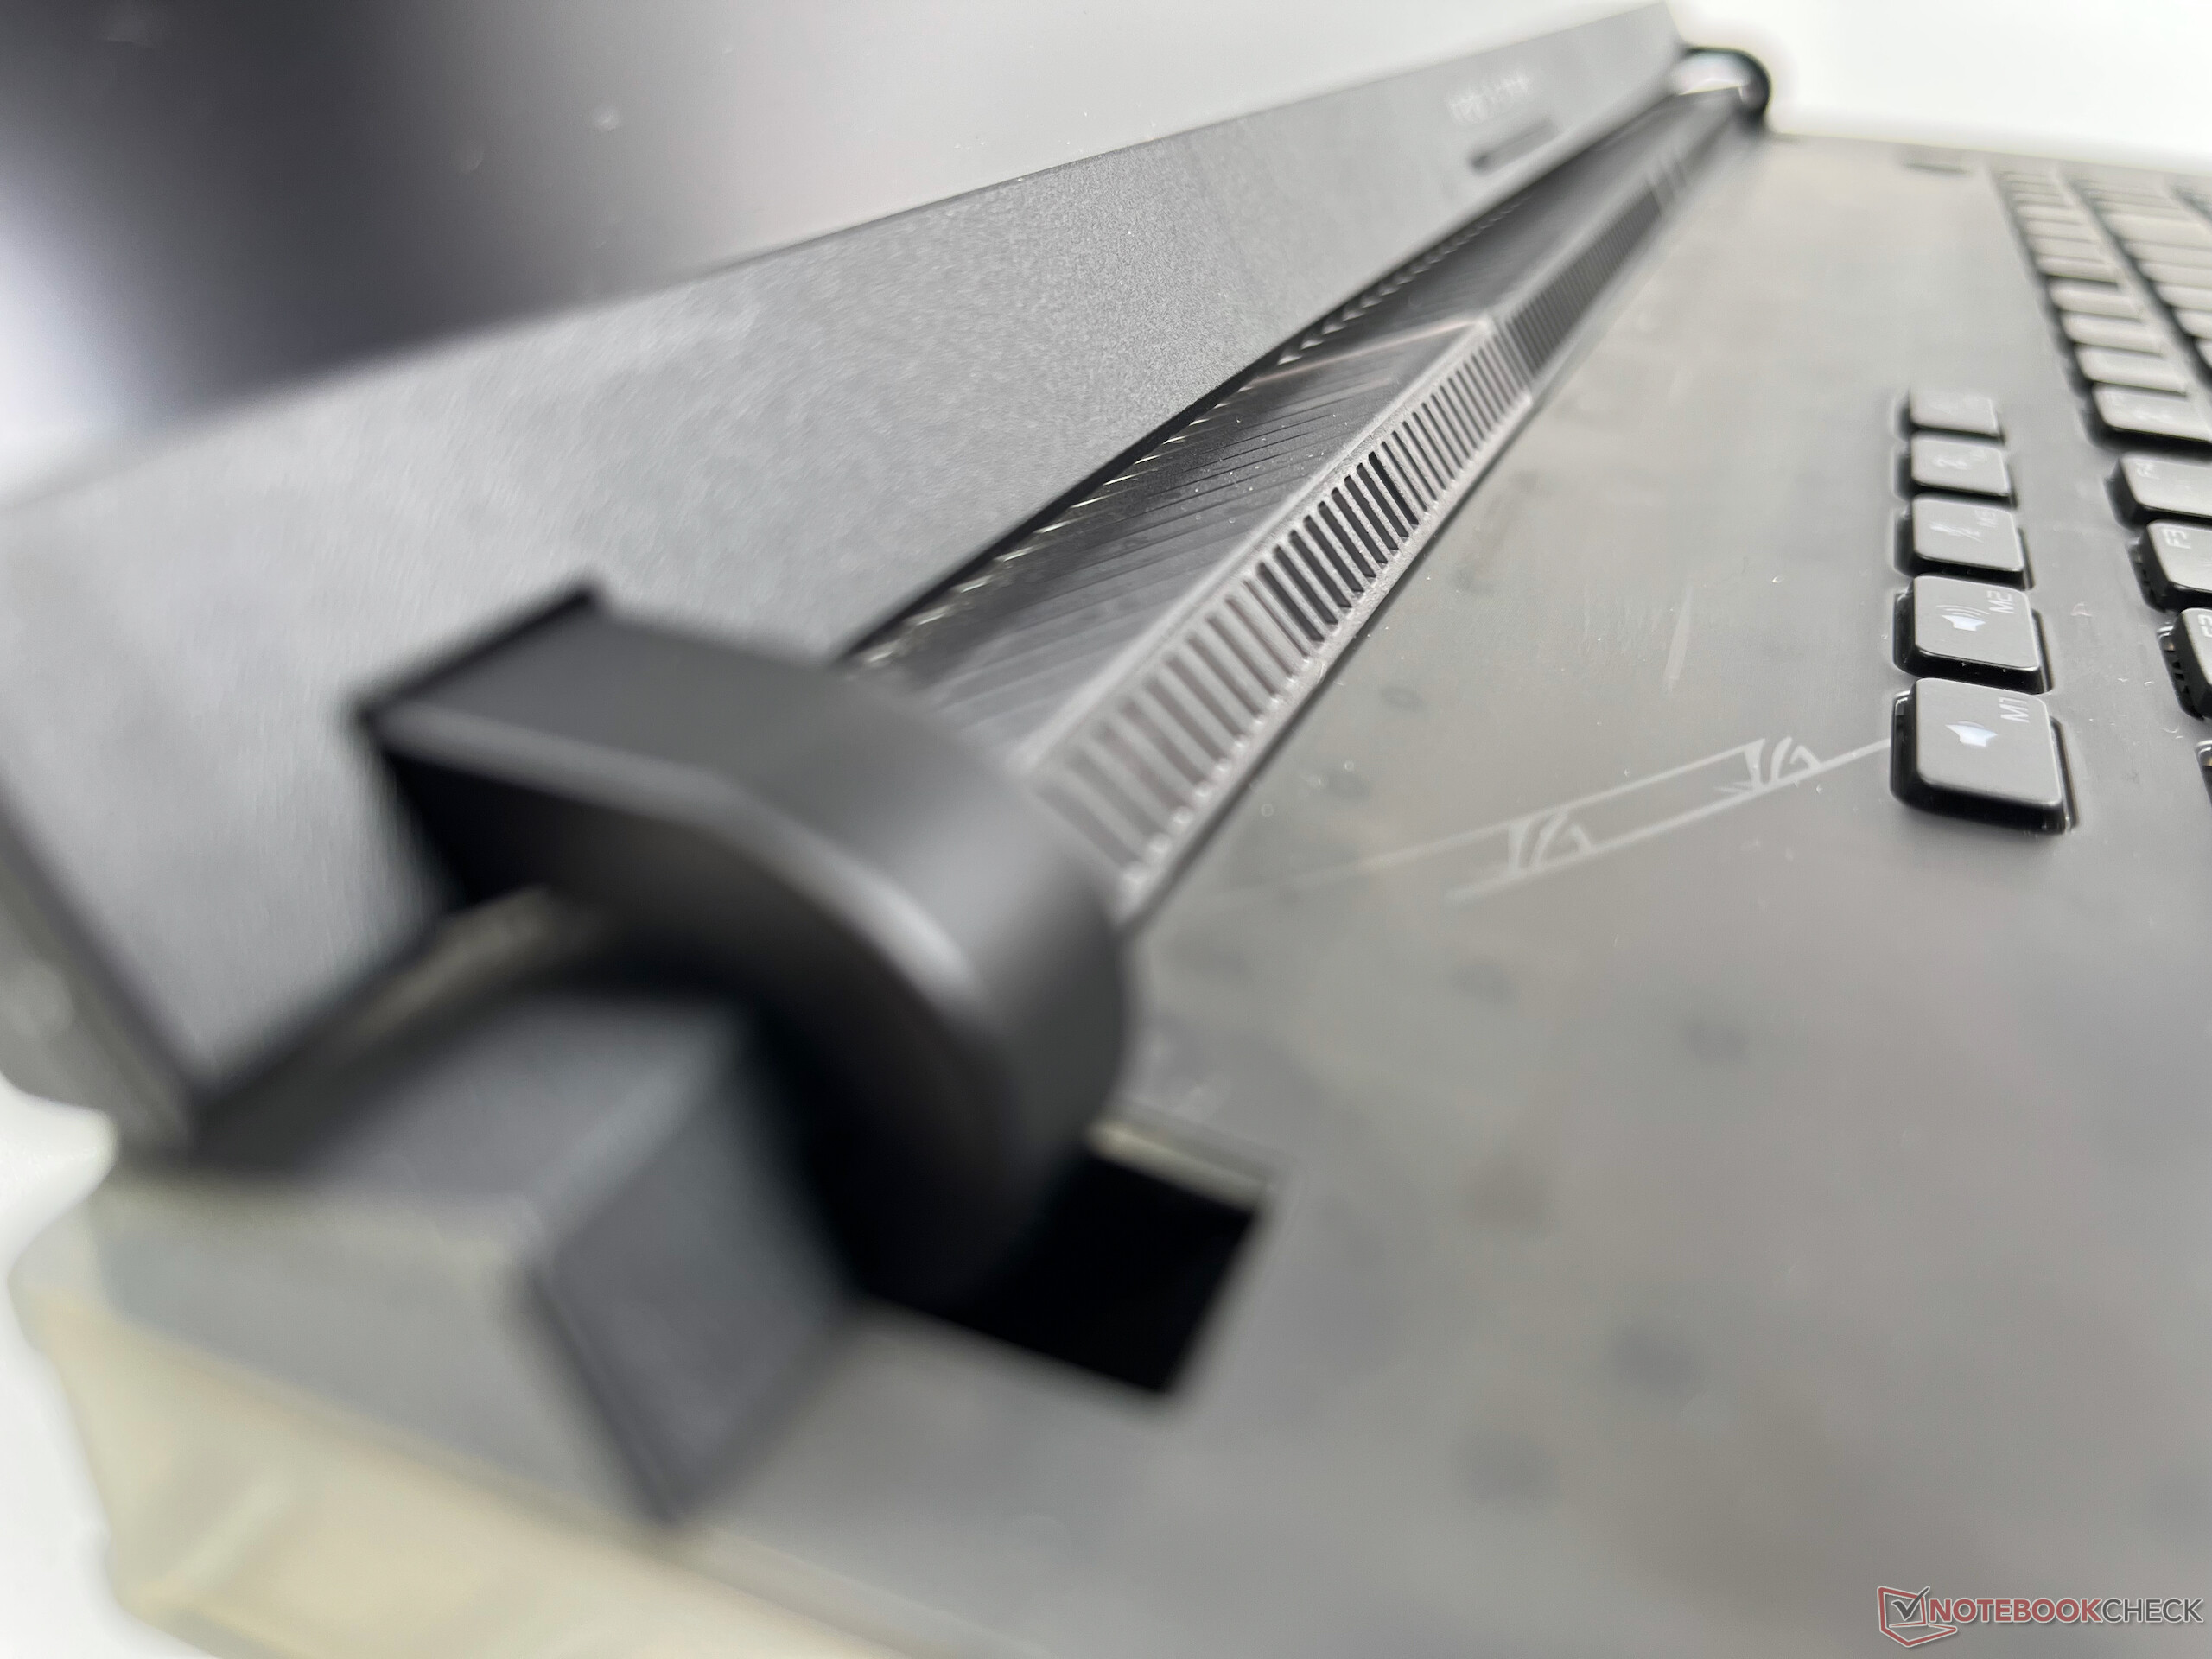
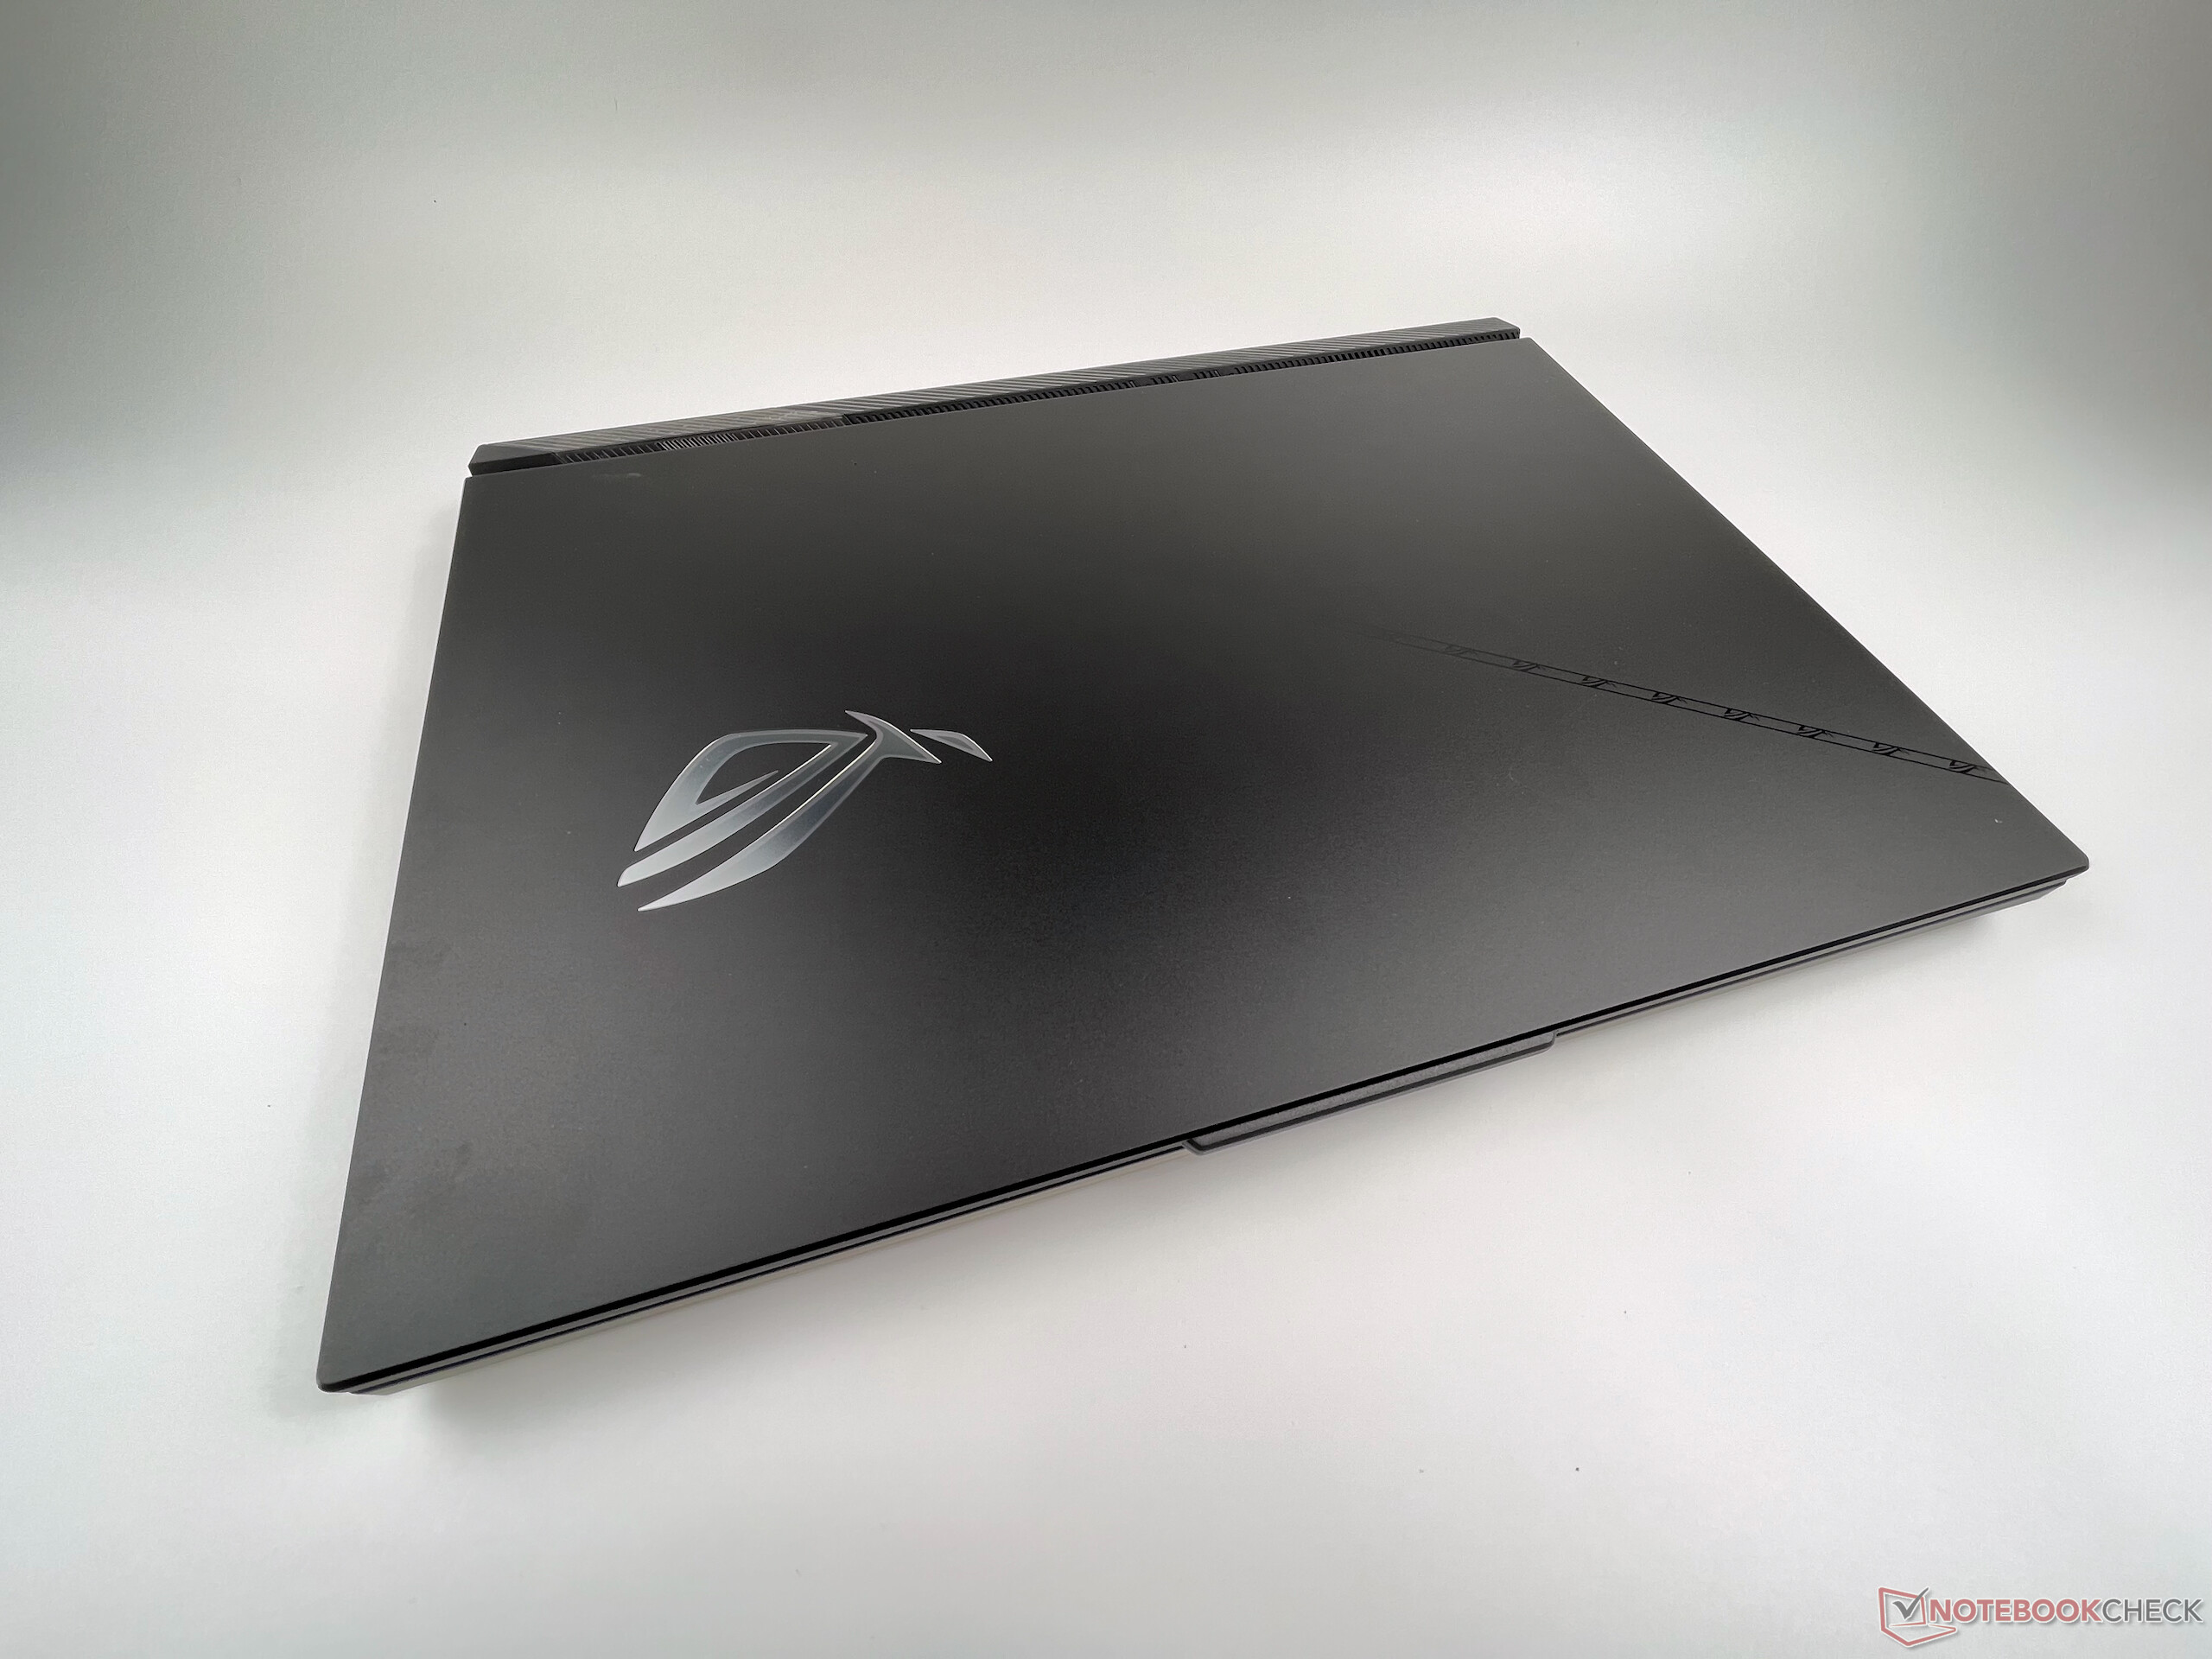
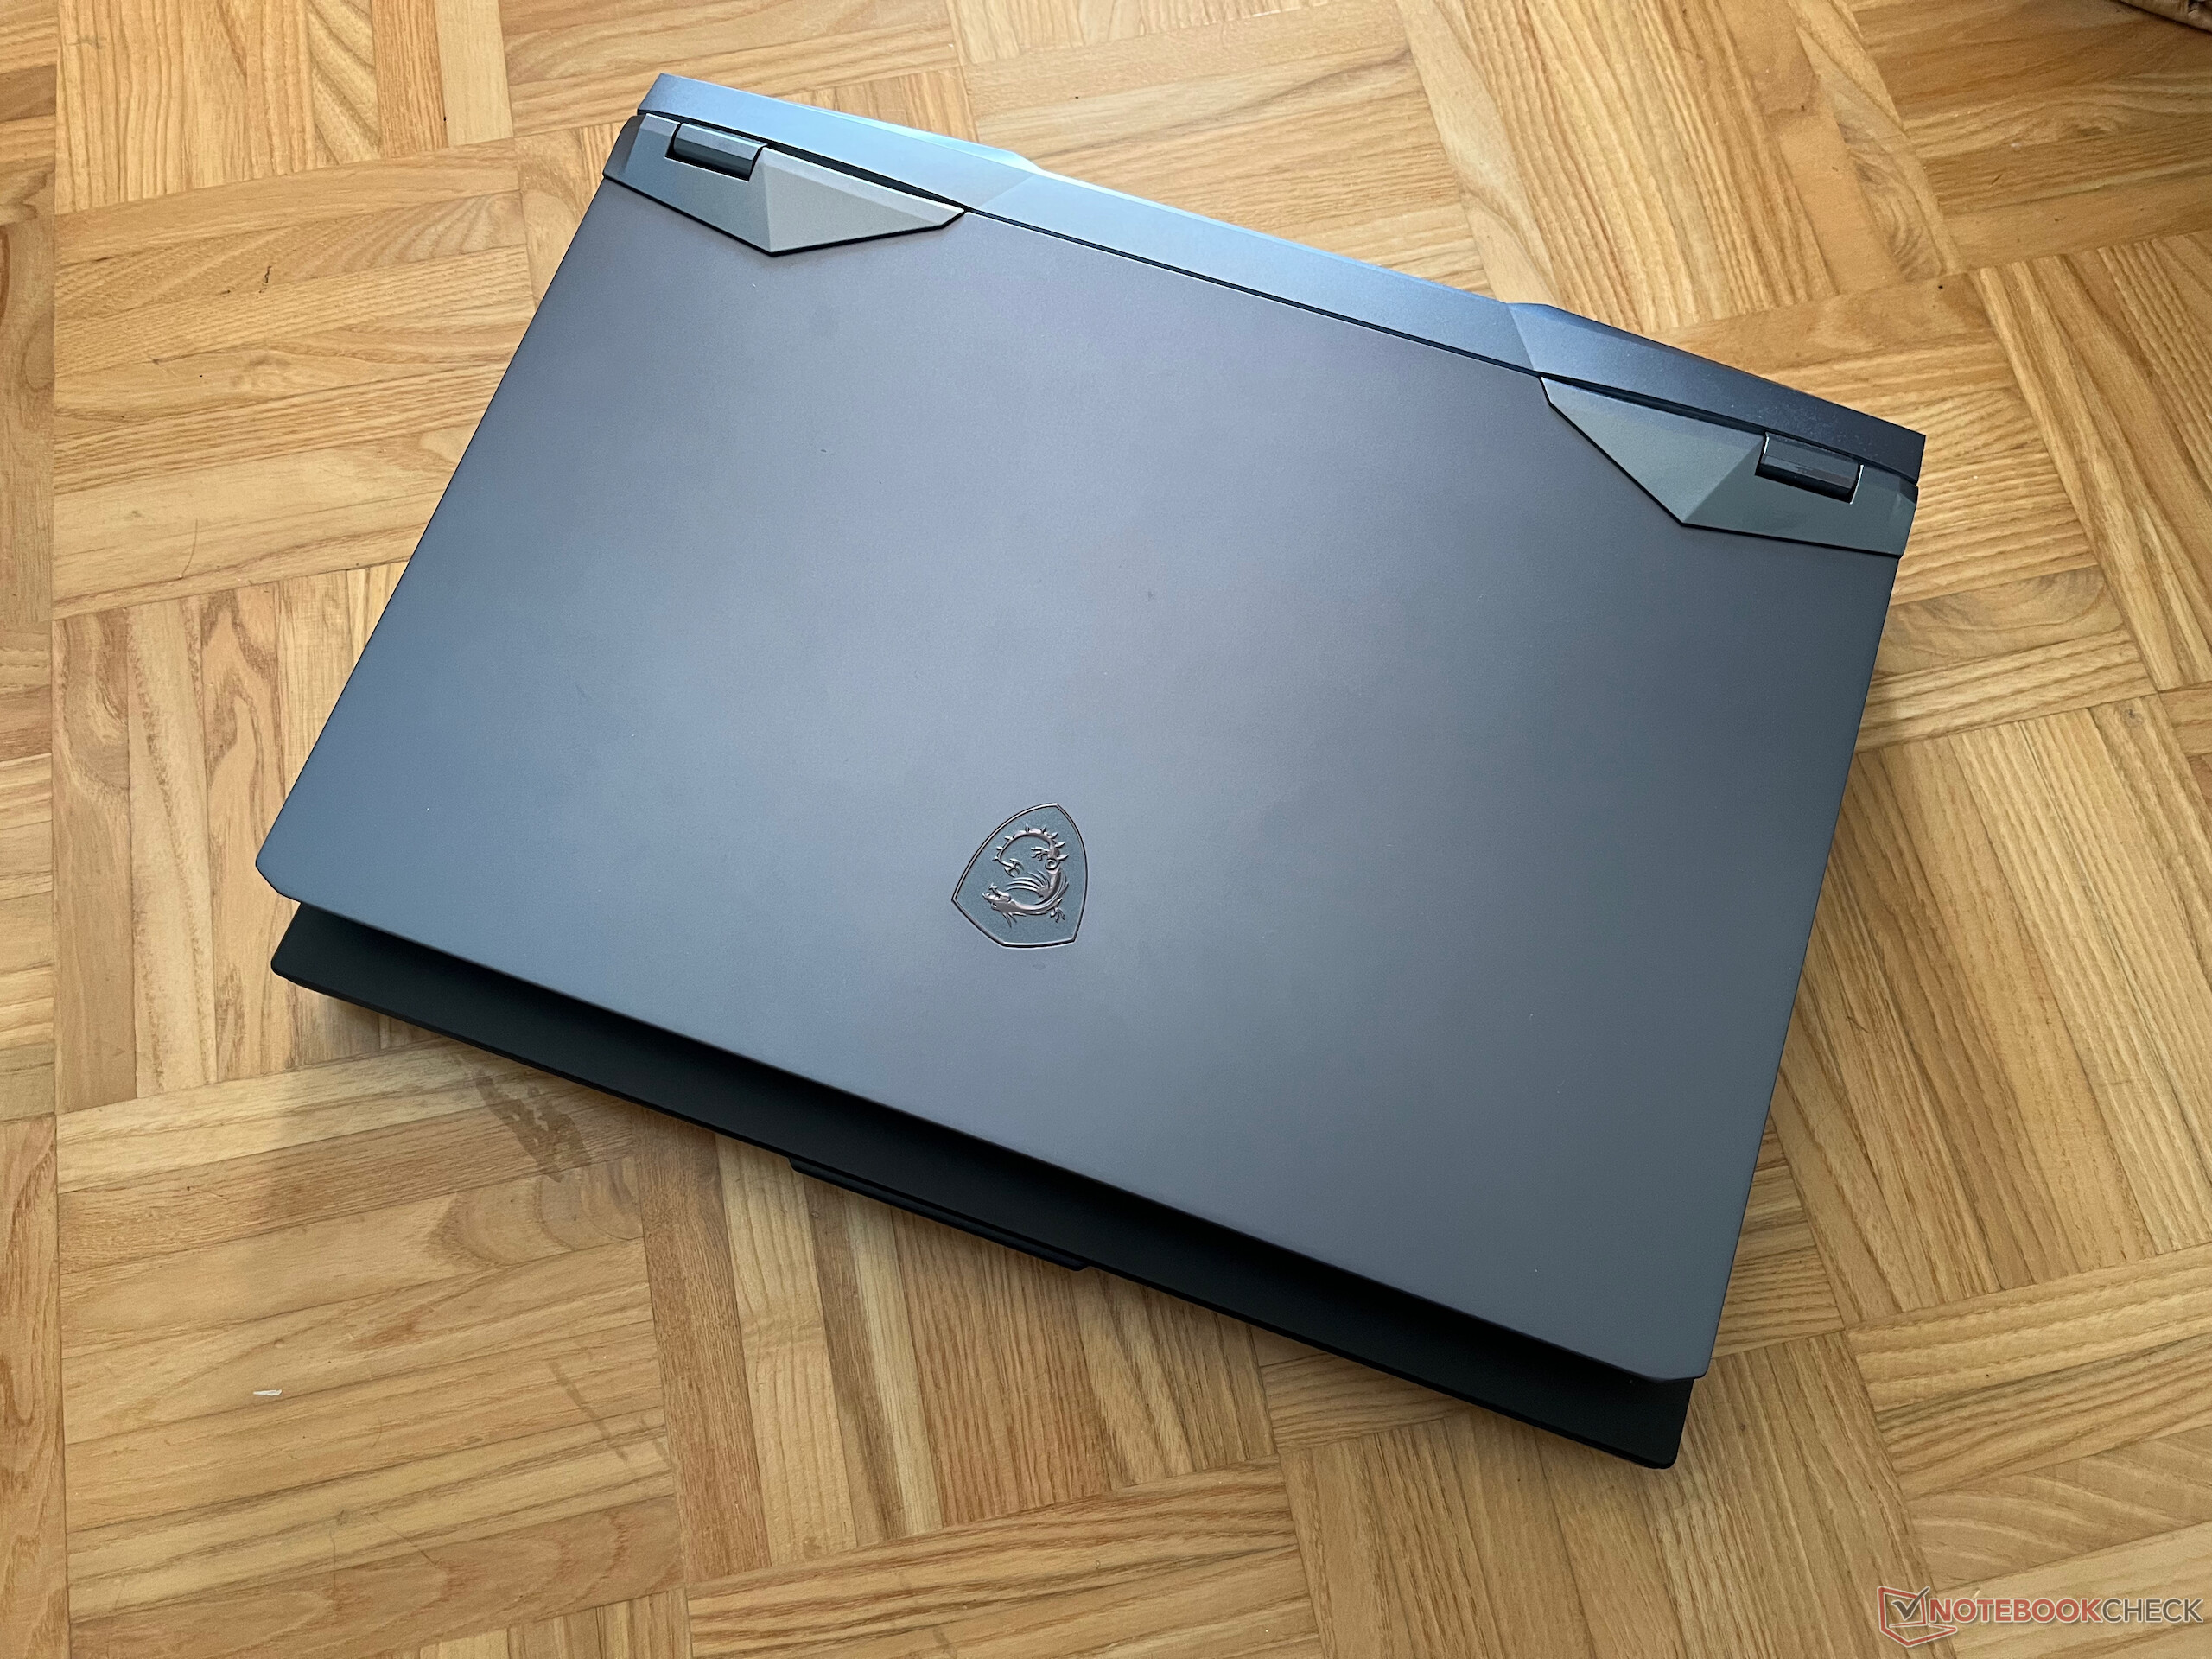
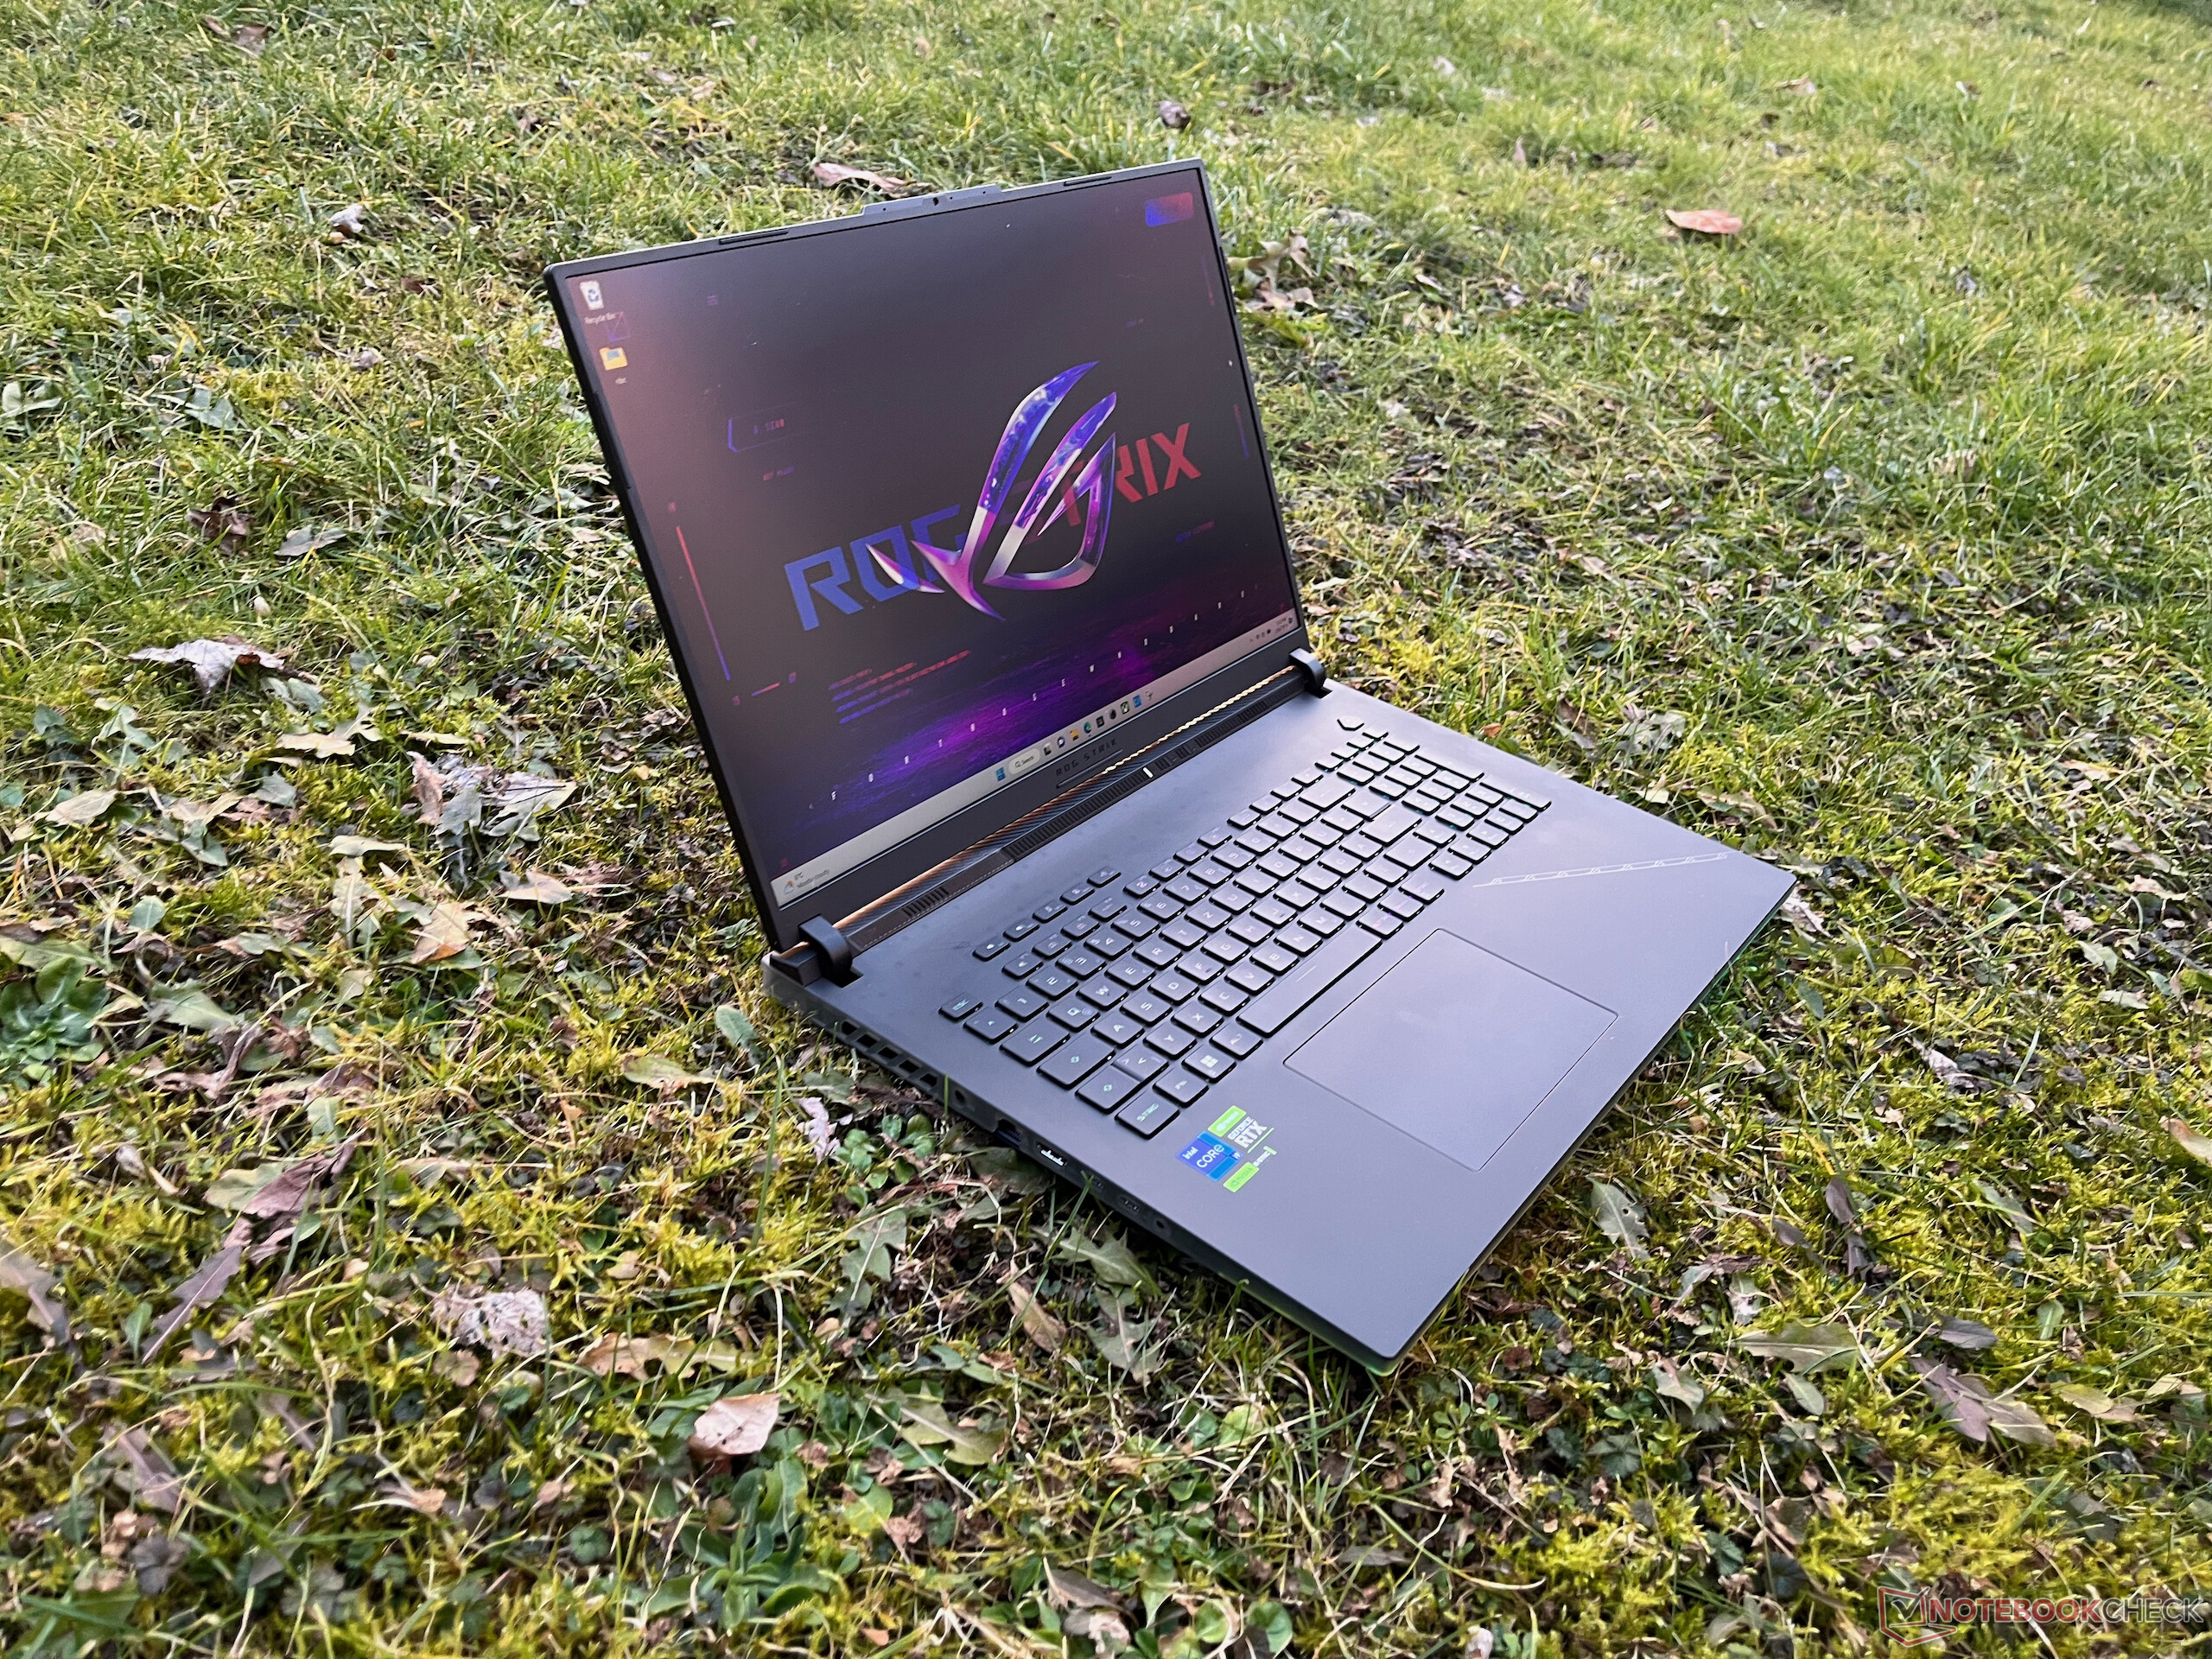
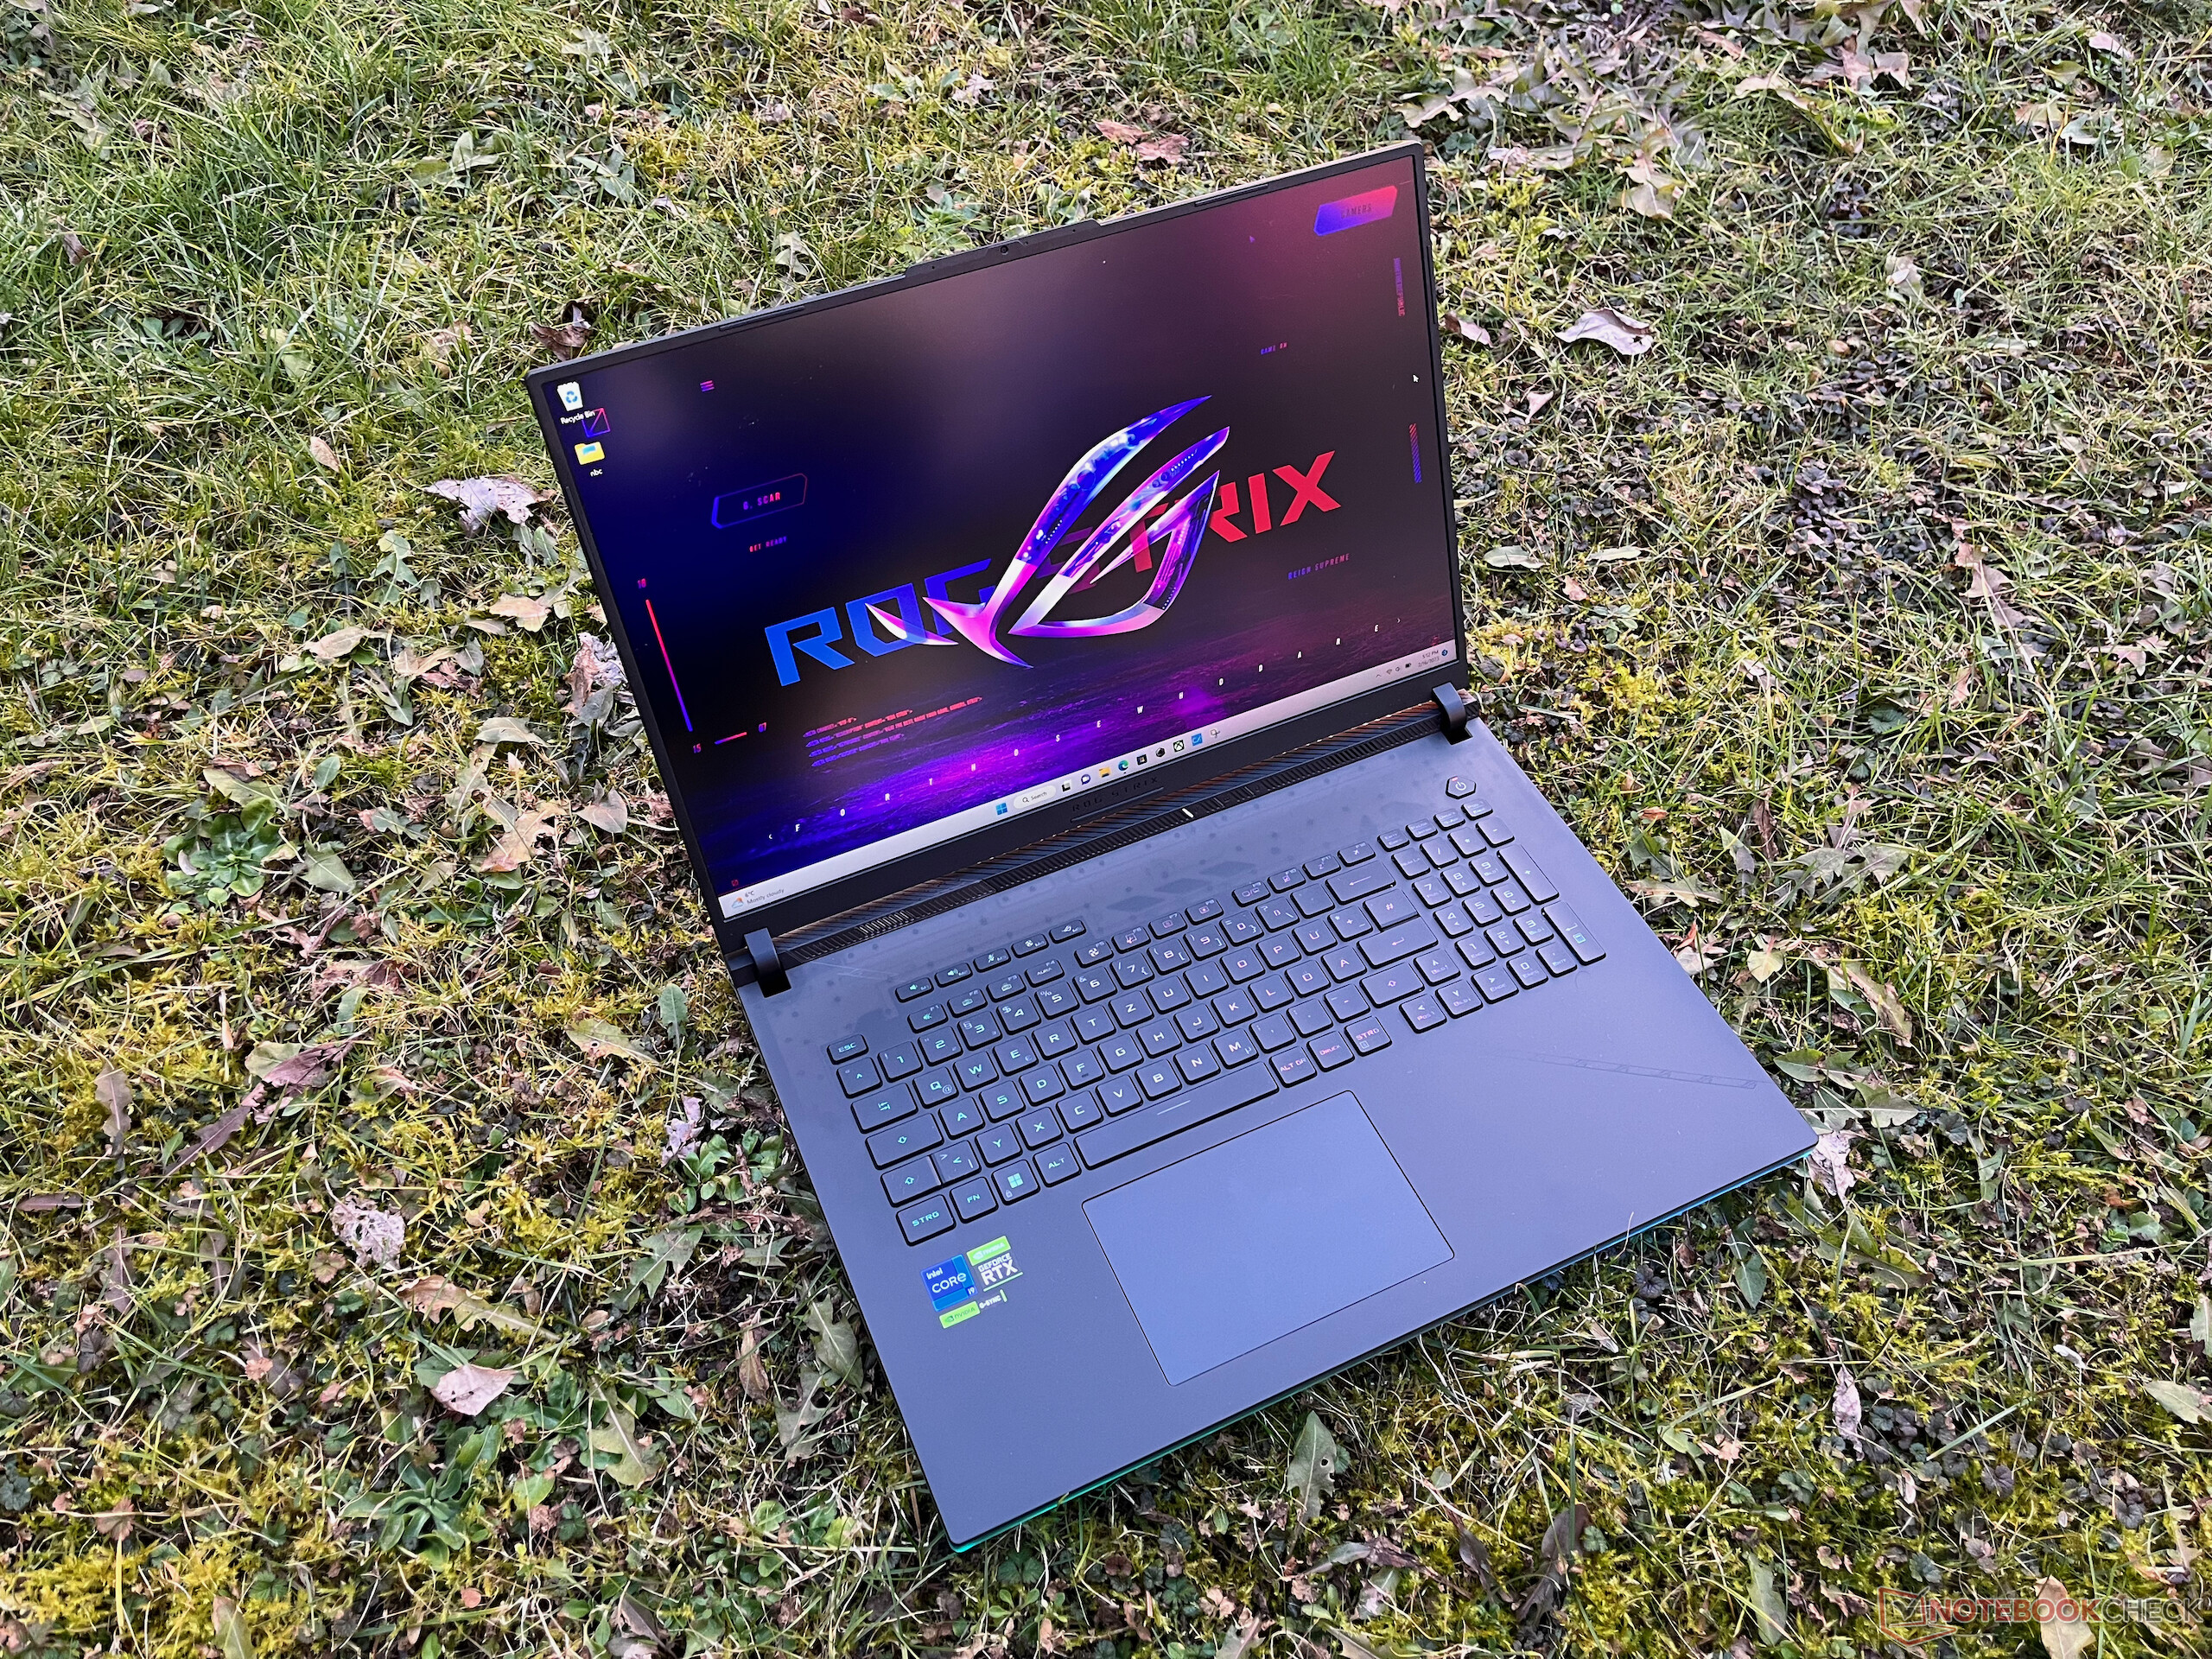
Storleken bestäms av den gigantiska 18-tumsskärmen, som är betydligt större än de flesta bärbara 17-tumsdatorer. Å andra sidan är basenheten inte riktigt lika massiv, vilket gör att den bärbara datorn verkar lite mindre än vad den egentligen är.
Utrustning
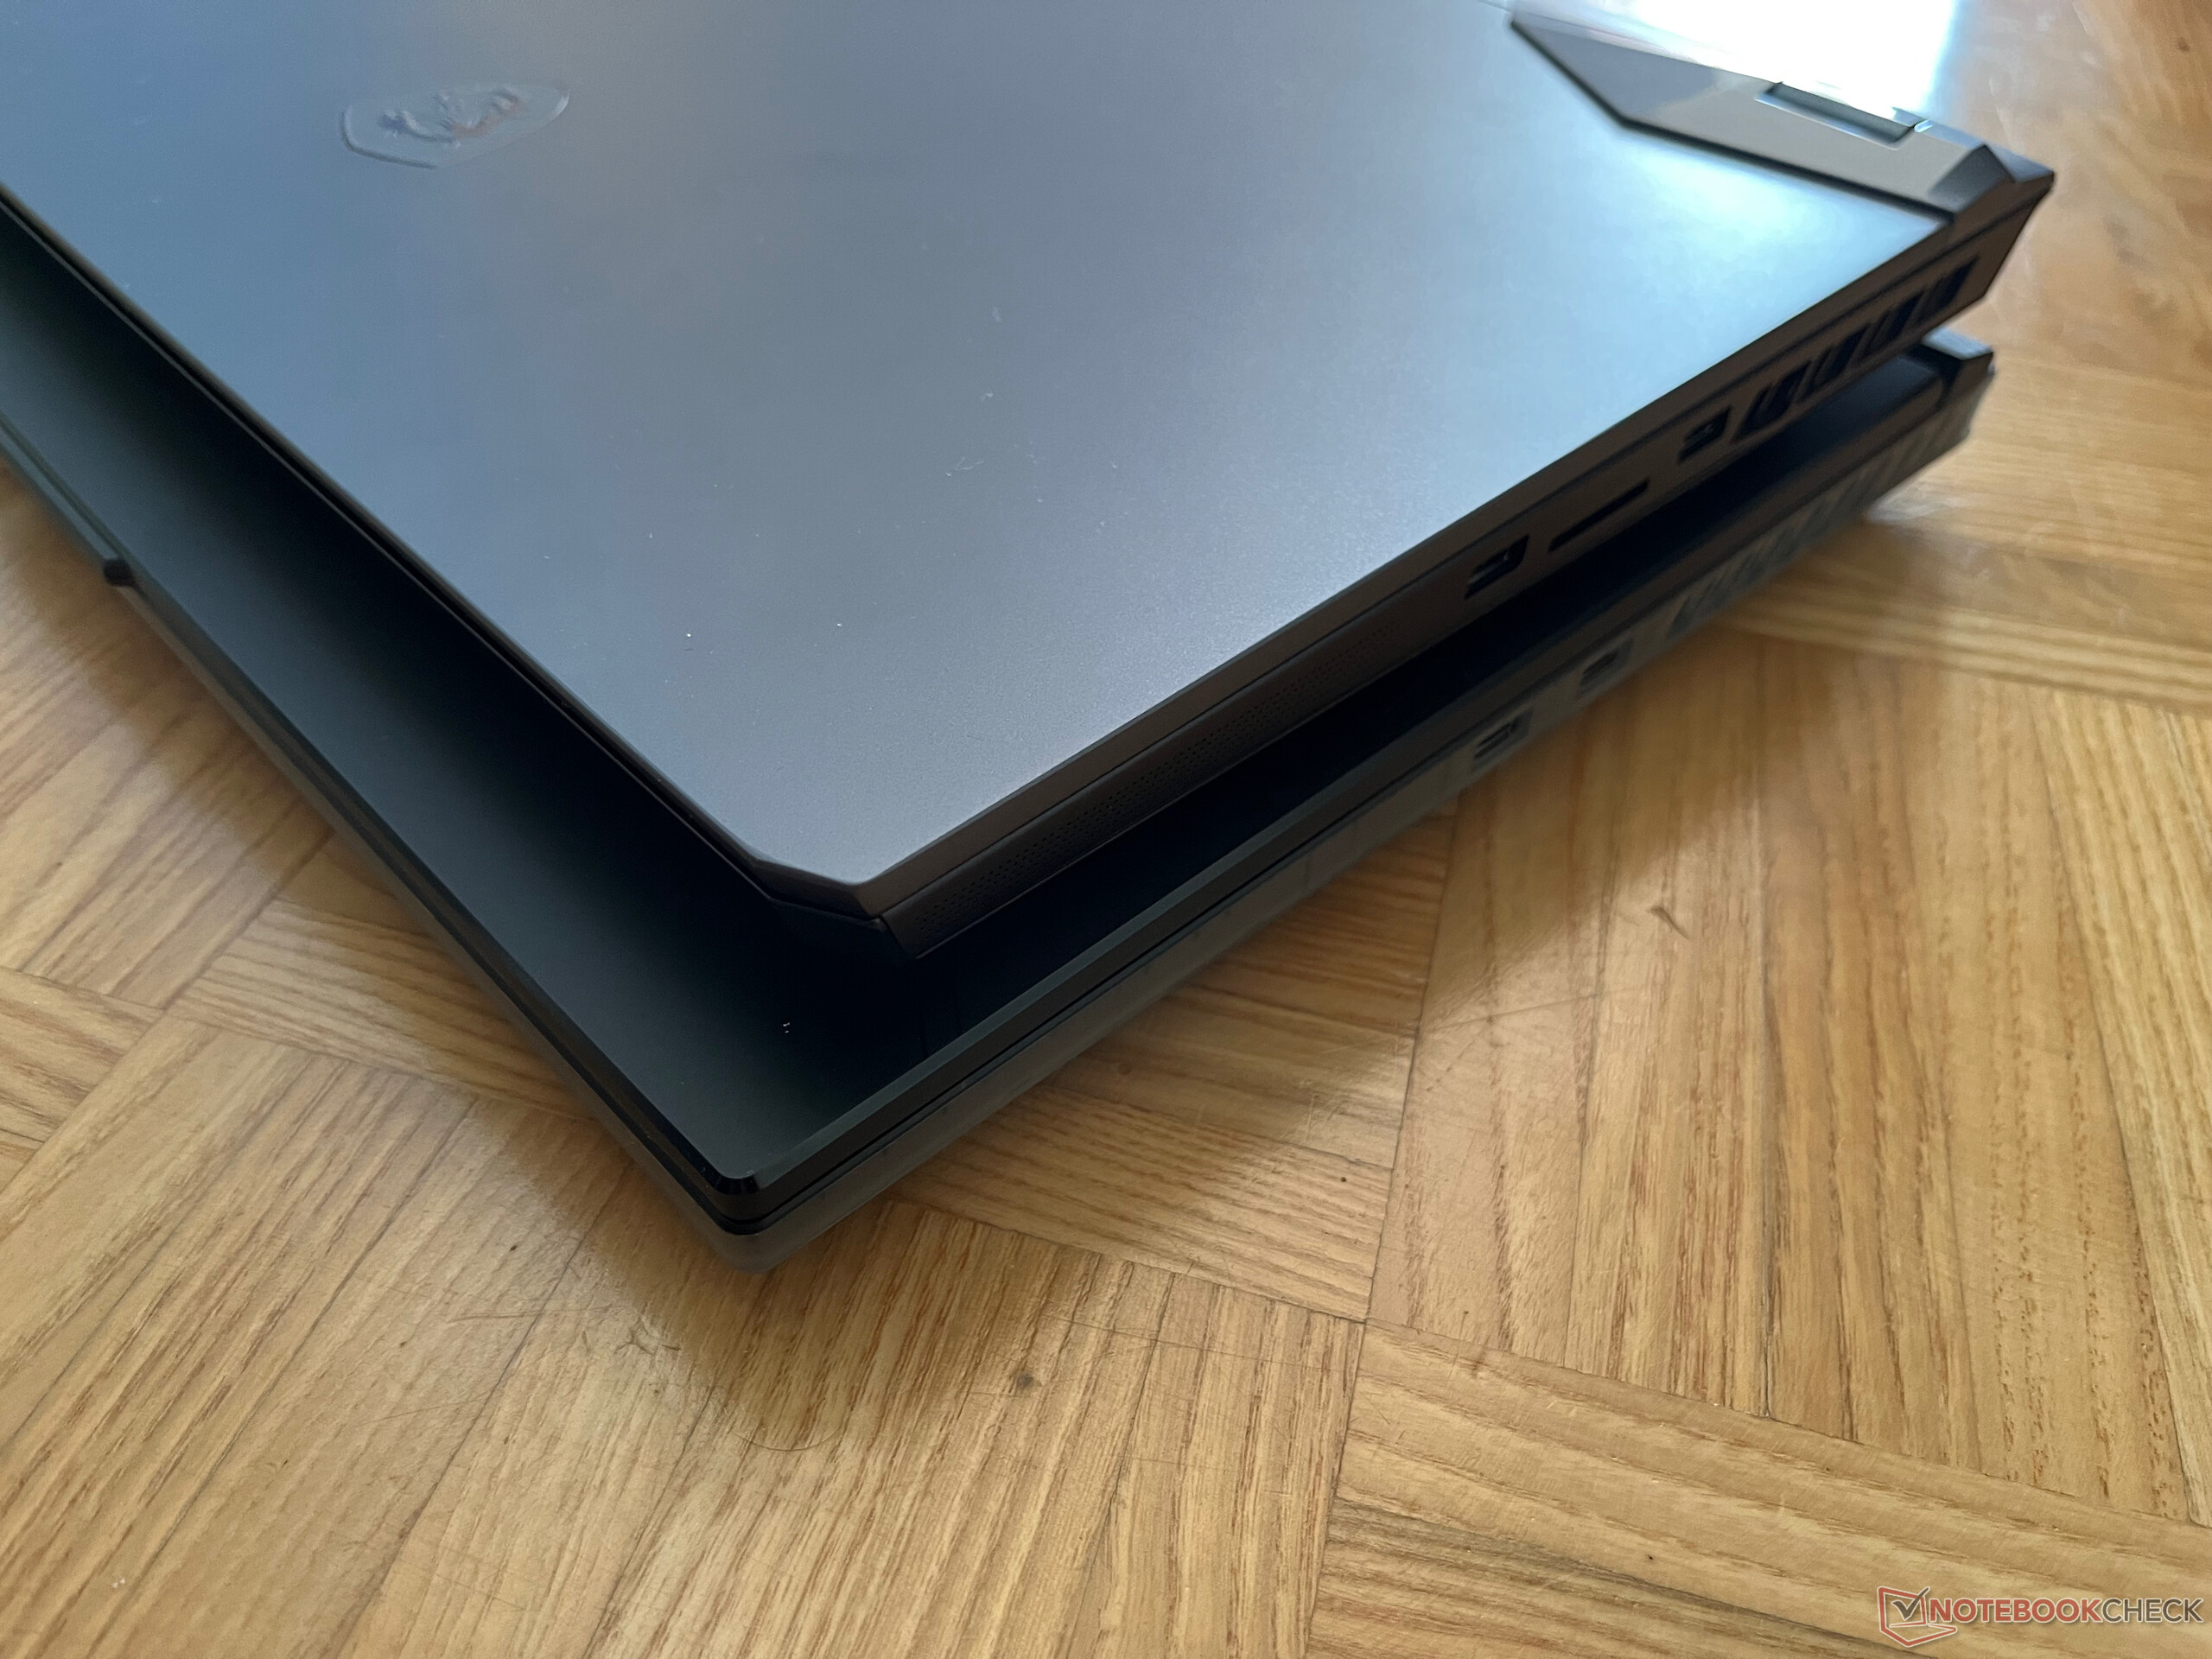
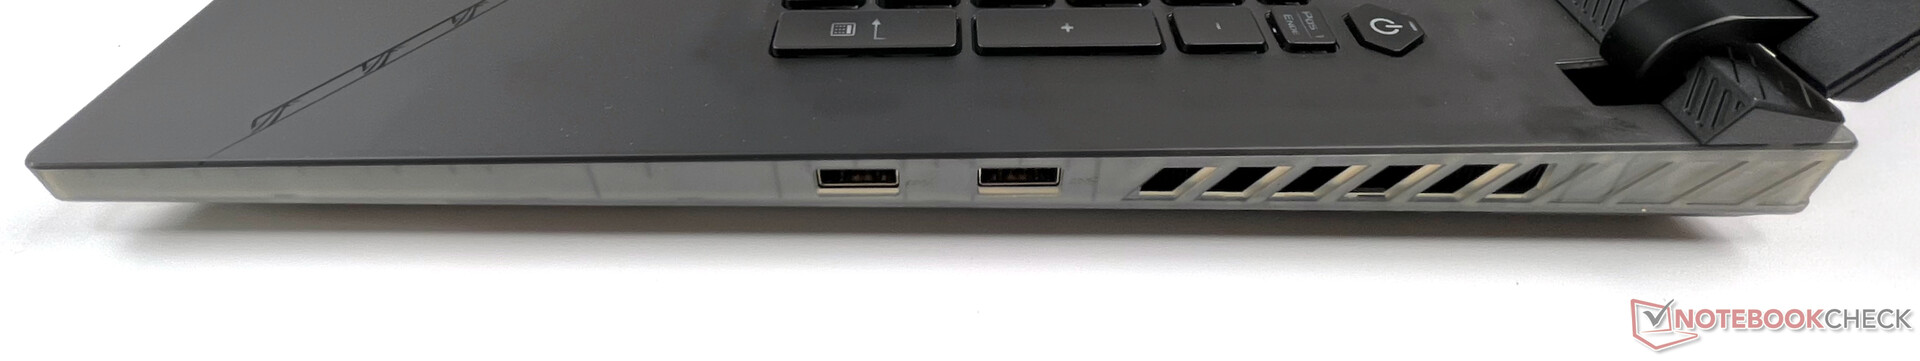
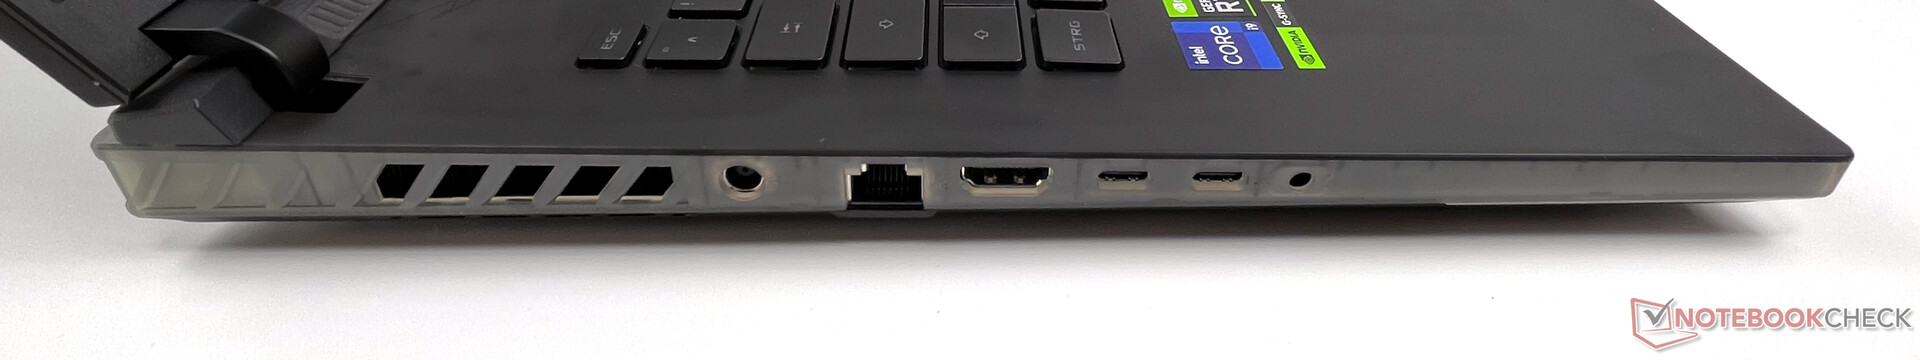
Alla portar finns på vänster och höger sida av höljet. Tyvärr är detta inte optimalt vid skrivbordsanvändning, eftersom du alltid kan se kablarna. Dessutom är båda USB-A-anslutningarna placerade på höger sida mot mitten, vilket gör att kablarnas läge är mindre än idealiskt för högerhänta musanvändare. För vänsterhänta användare skulle nätverkskabeln vara i vägen.
Vi har också några klagomål på anslutningsutrustningen. Endast en av de två USB-C-portarna stöder Thunderbolt, och den andra stöder Power Delivery med vissa begränsningar. I vårt test kunde MacBook Air M1-laddaren ladda den bärbara datorn med 30 watt, men utan notifiering i Windows. Anker Nano 2 med 45 watt laddade inte den bärbara datorn alls. På den positiva sidan vill vi också nämna nätverksanslutningen med 2,5 Gbit.
Kommunikation
När det gäller kommunikationsalternativ erbjuder Asus ett snabbt Intel Wi-Fi 6E AX211-kort i M.2-format för trådlösa anslutningar och ett Realtek RTL8125-chip för trådbundna 2,5 Gbit LAN-anslutningar. Båda fungerade utan störningar i vårt test, men AX211-kortet hittade inte 6-GHz-nätverket i vår Asus ROG Rapture GT-AX11000-router. Tyvärr är Wi-Fi 6E fortfarande en hit-and-miss i vårt test när det gäller att hitta nätverket.
Å andra sidan är datahastigheterna i Wi-Fi 6-nätverket utmärkta och utan några droppar.
Webbkamera
Den inbyggda 720p HD-kameran uppfyller tyvärr bara de lägsta kraven på videotelefoni. Goda ljusförhållanden är viktiga här eftersom de resultat vi får med bakgrundsbelysning eller i mörker knappast är användbara.


")
")
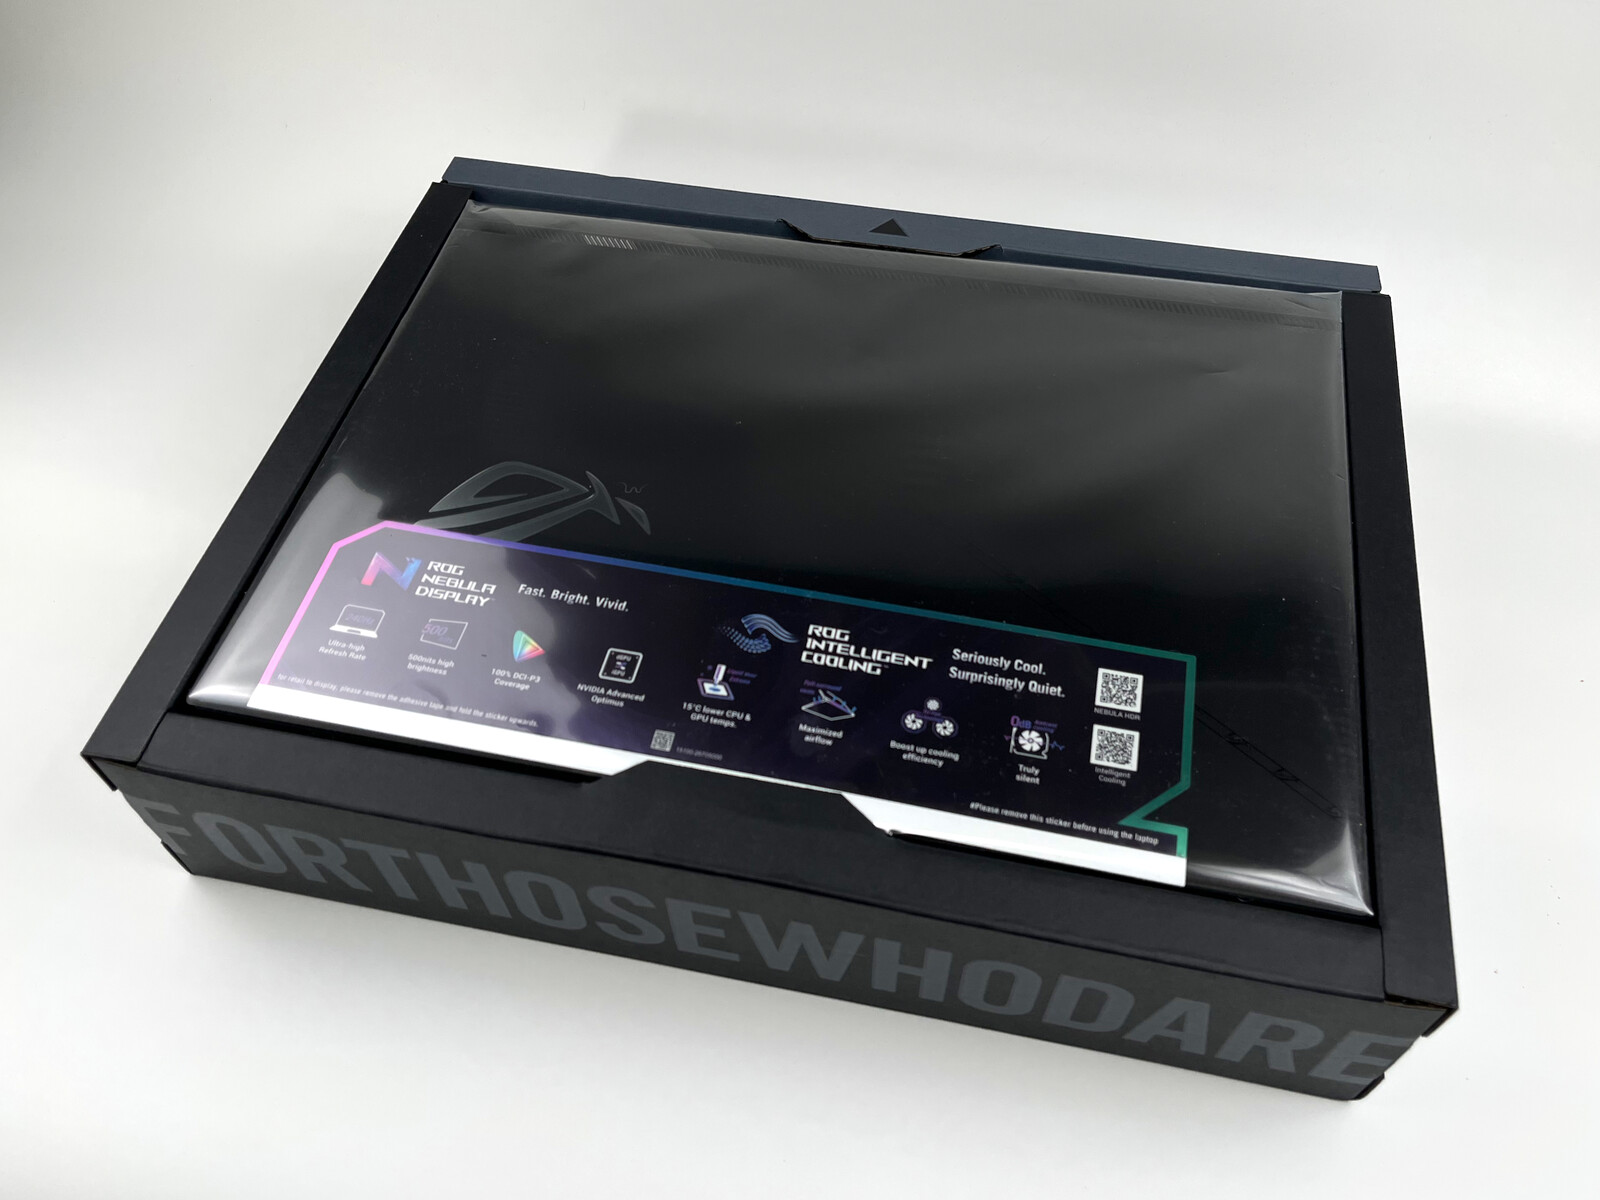
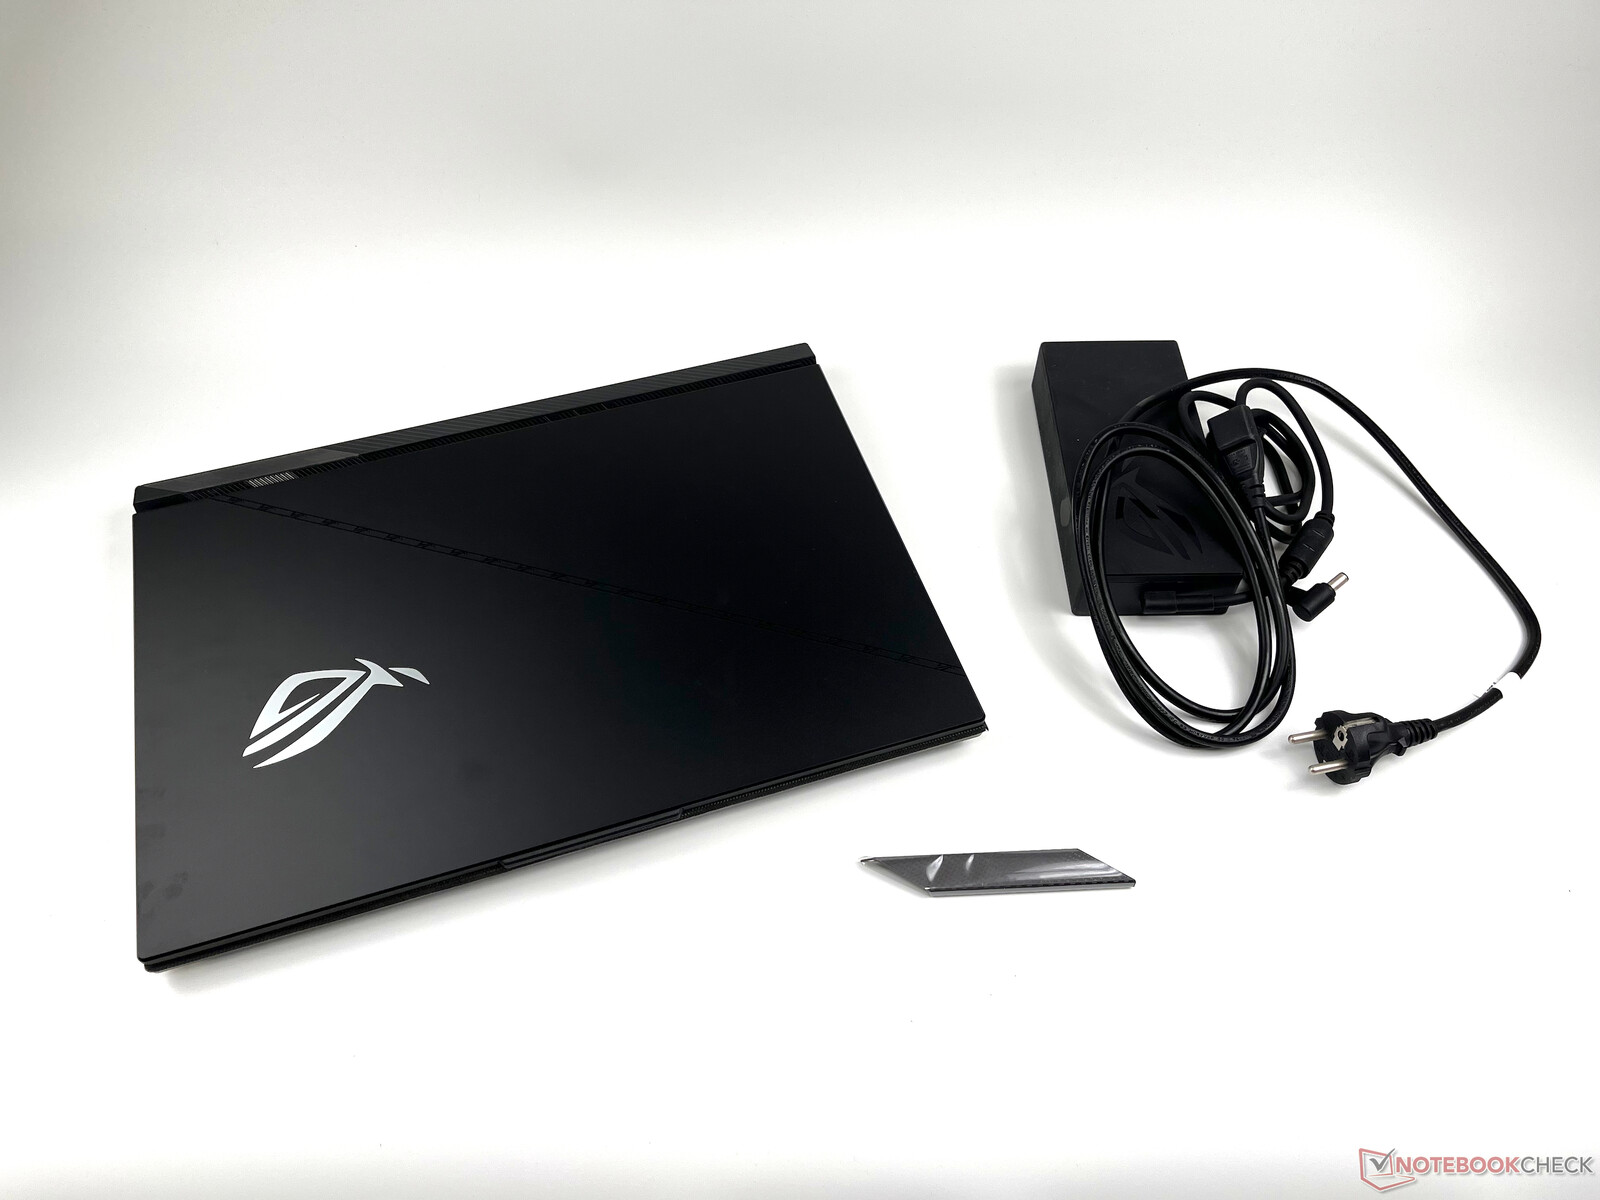
Tillbehör
Lådan innehåller endast ett extra "Armor Cap" som kan bytas ut till vänster under displayen. Locket fästs magnetiskt och kan vara tänkt att ge dig ett alternativ för att anpassa enheten.
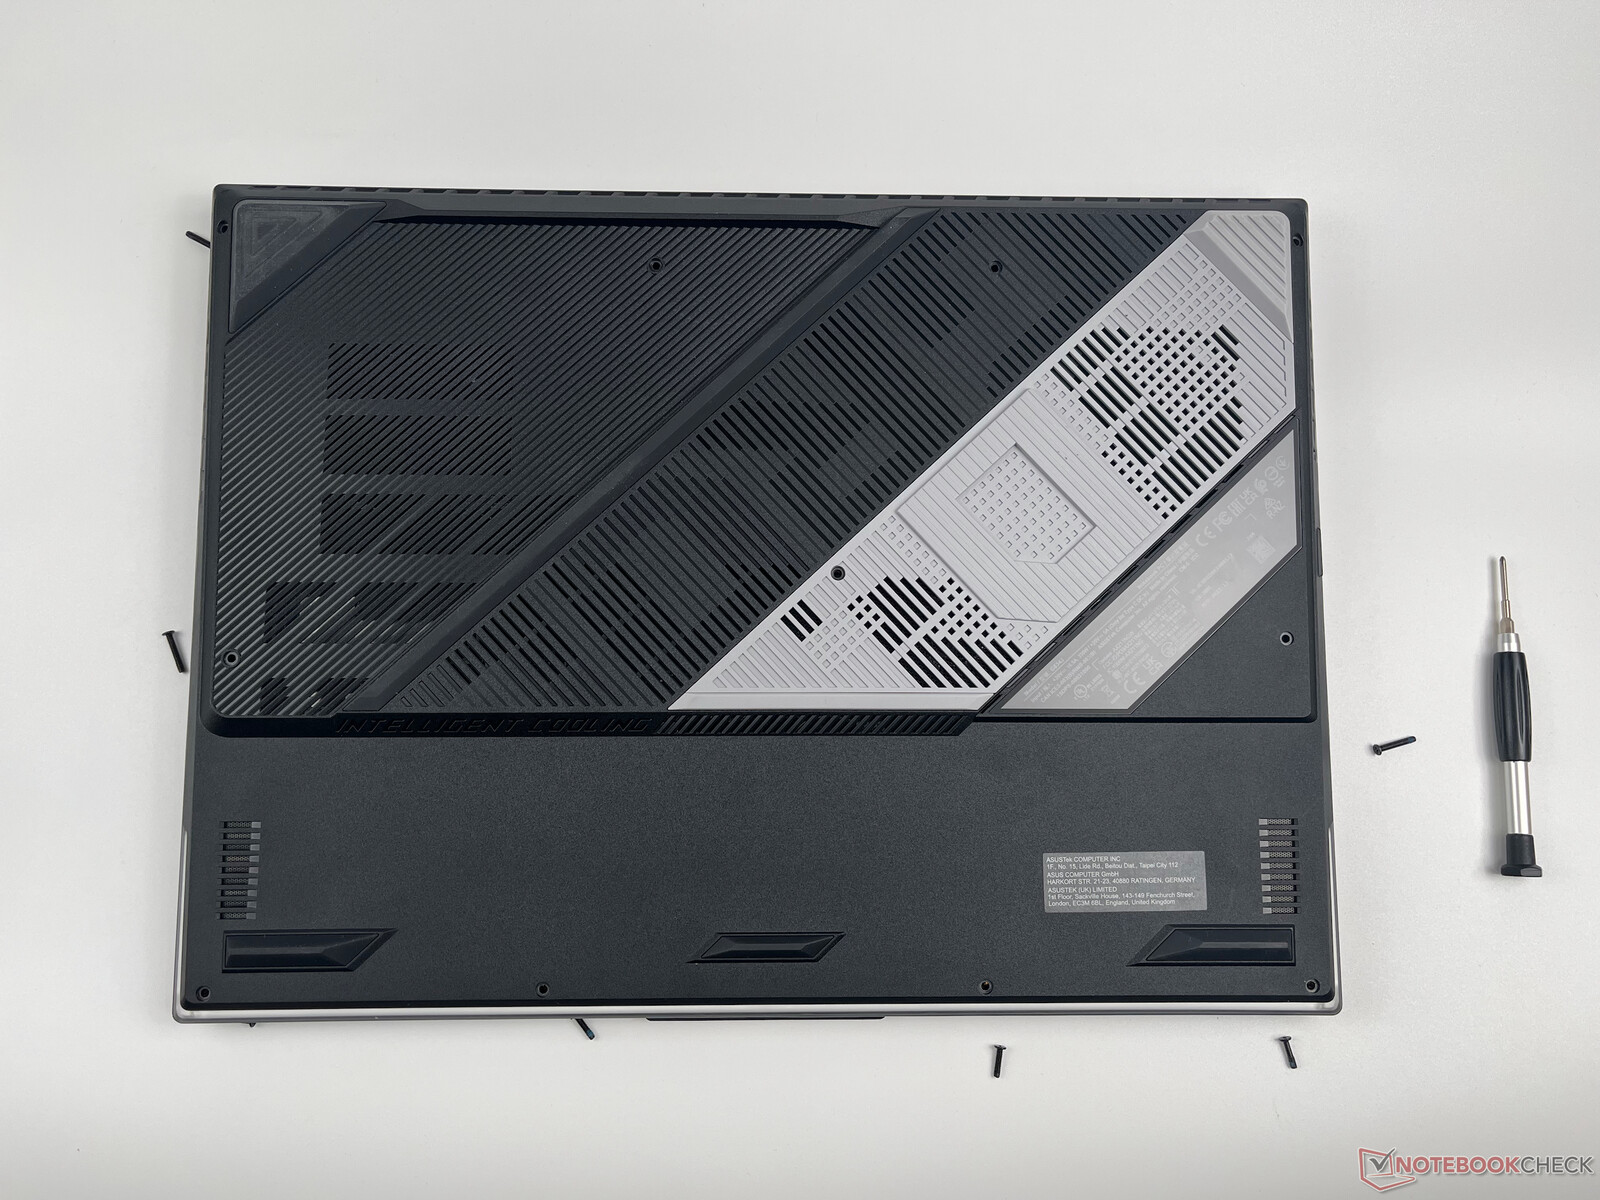
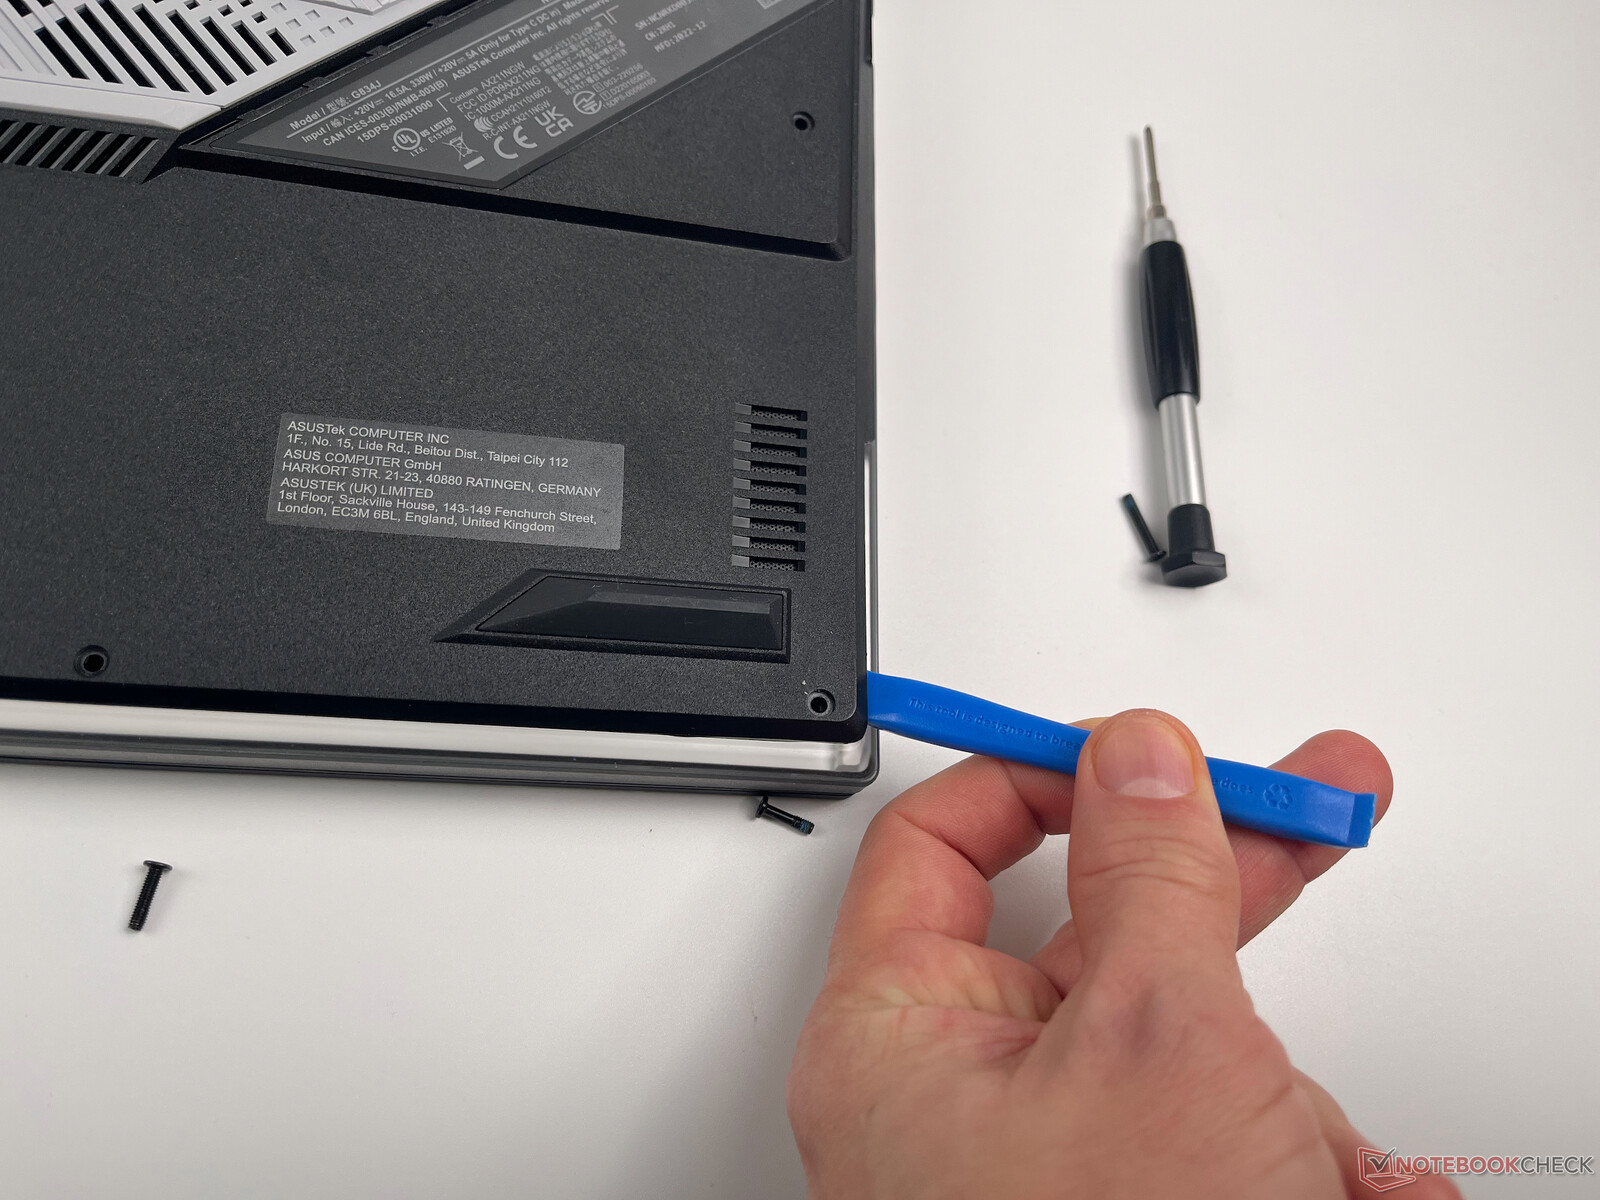
Underhåll
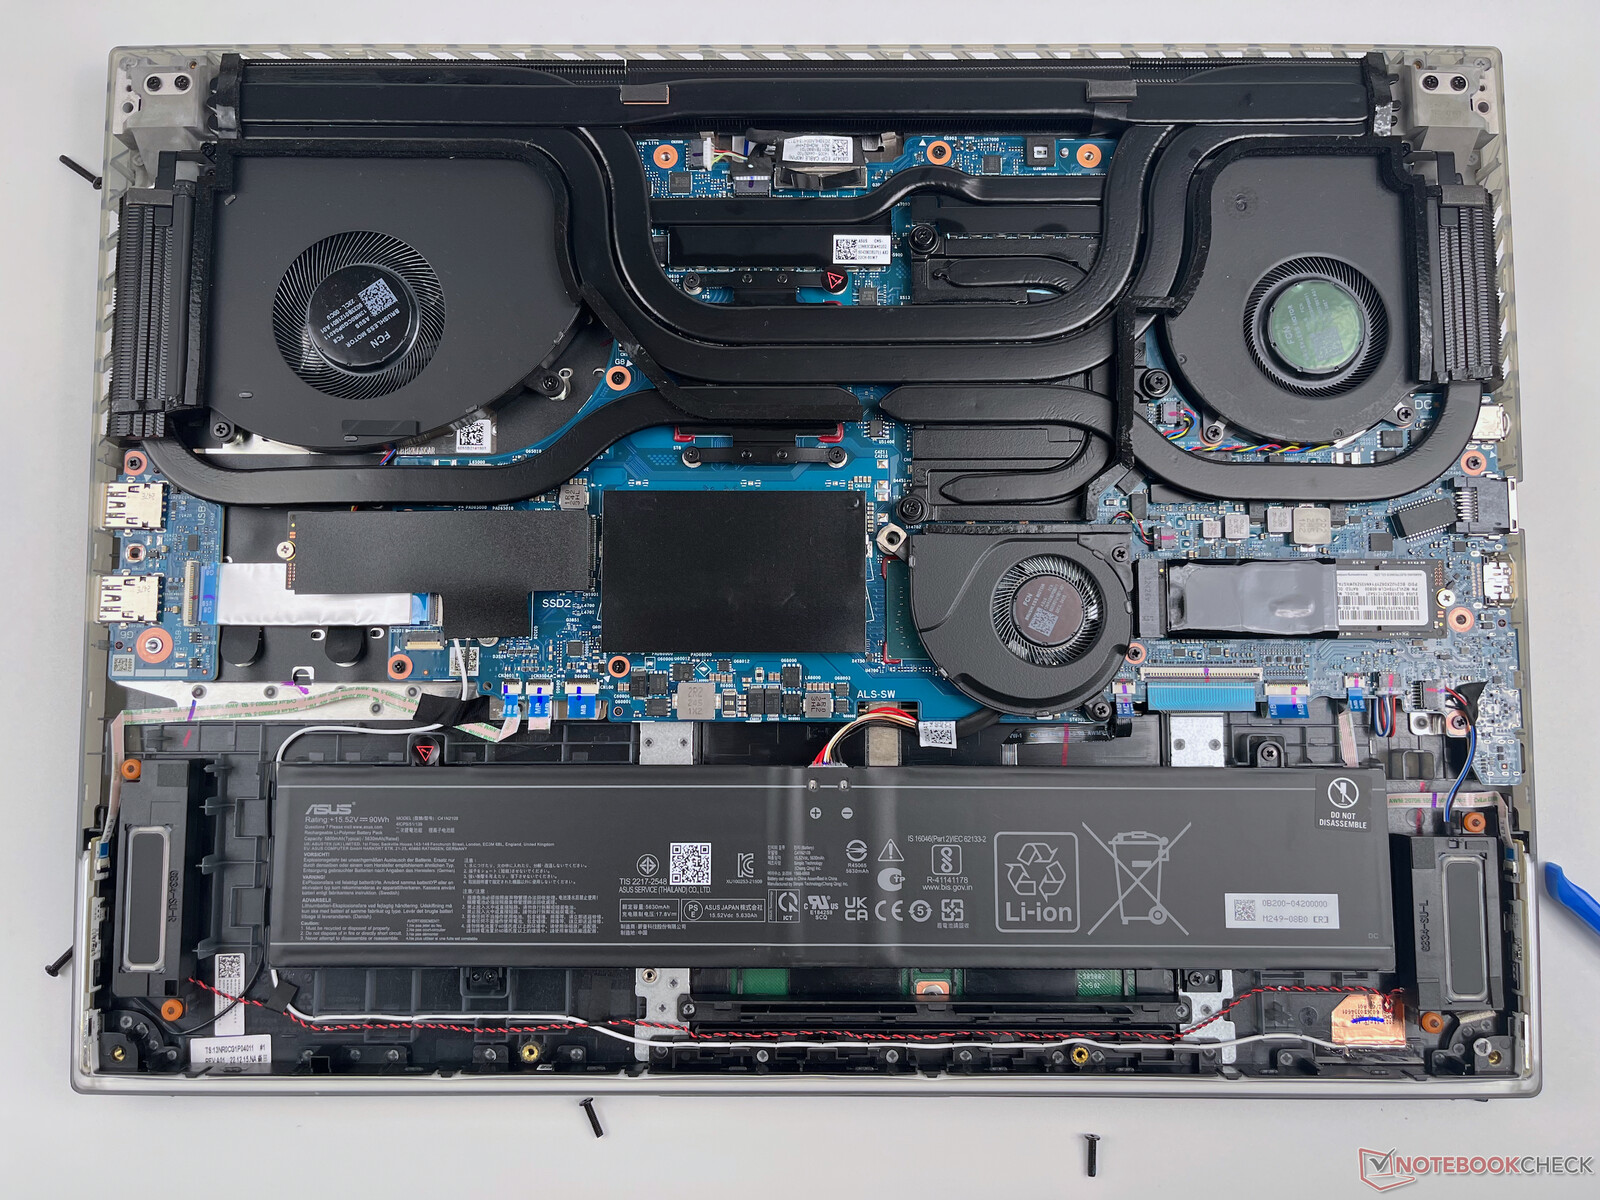
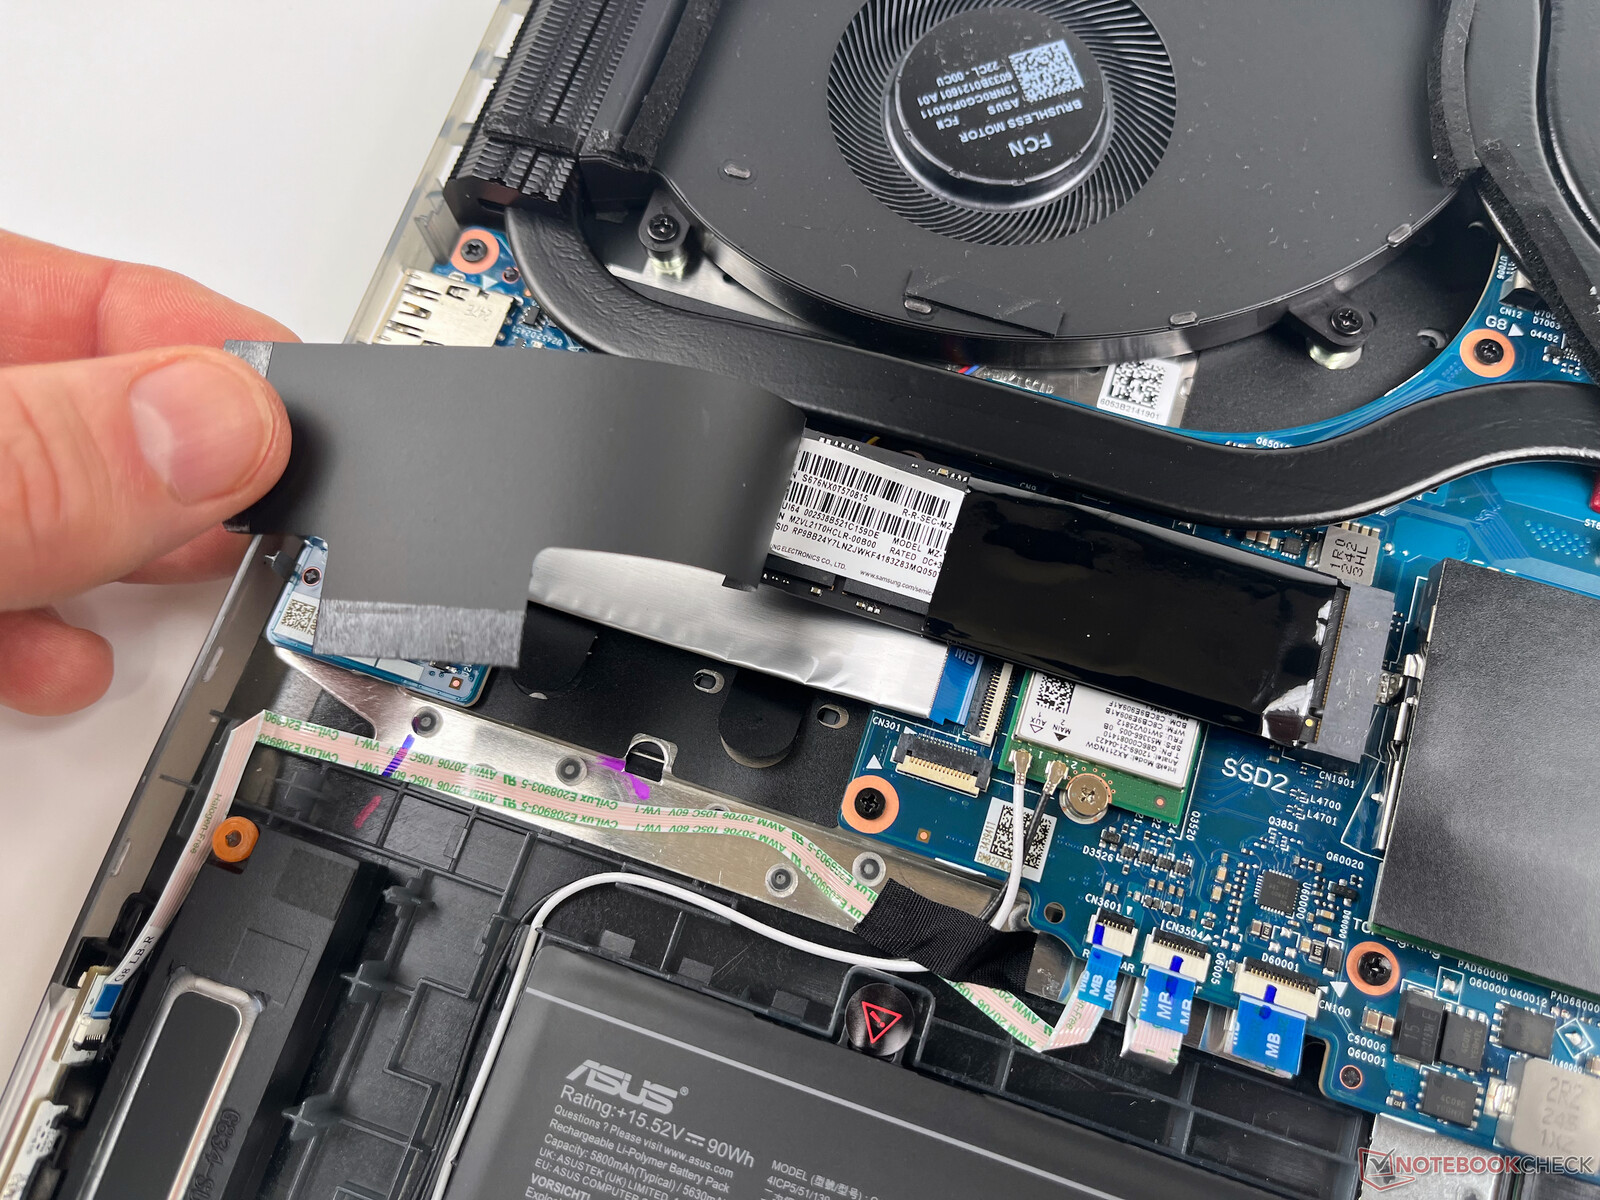
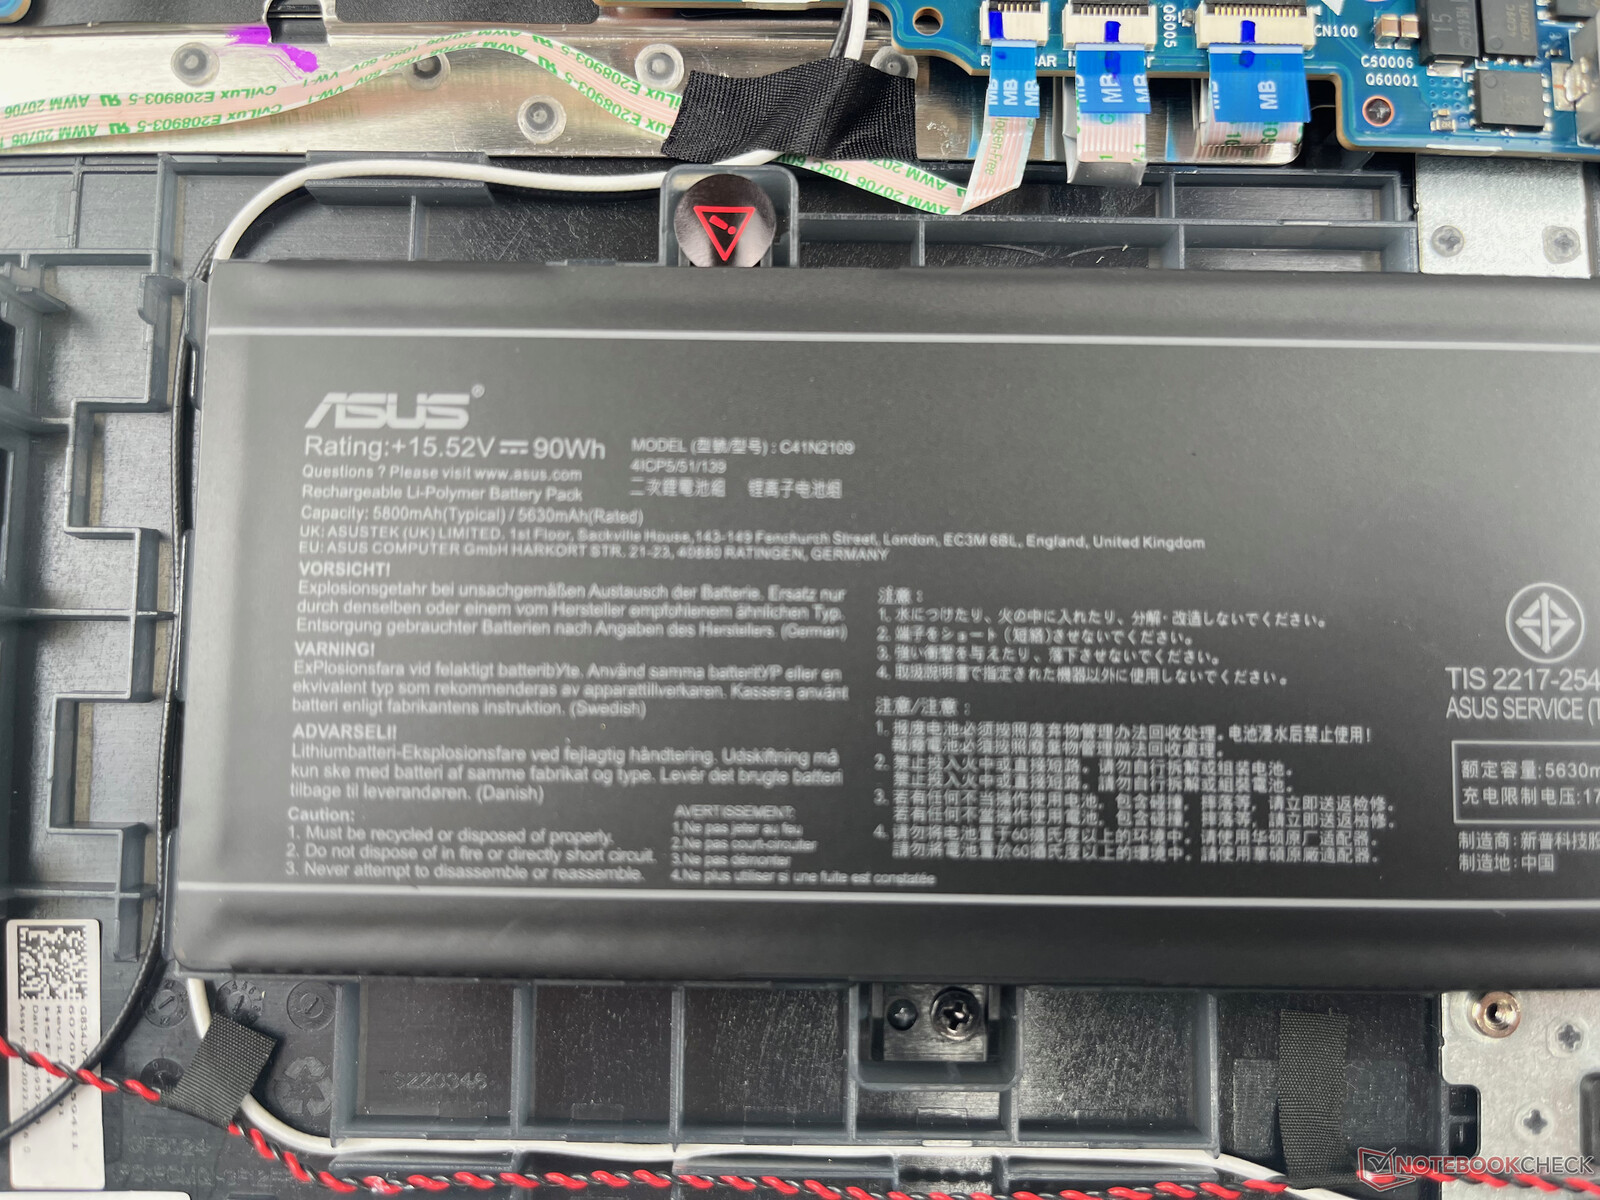
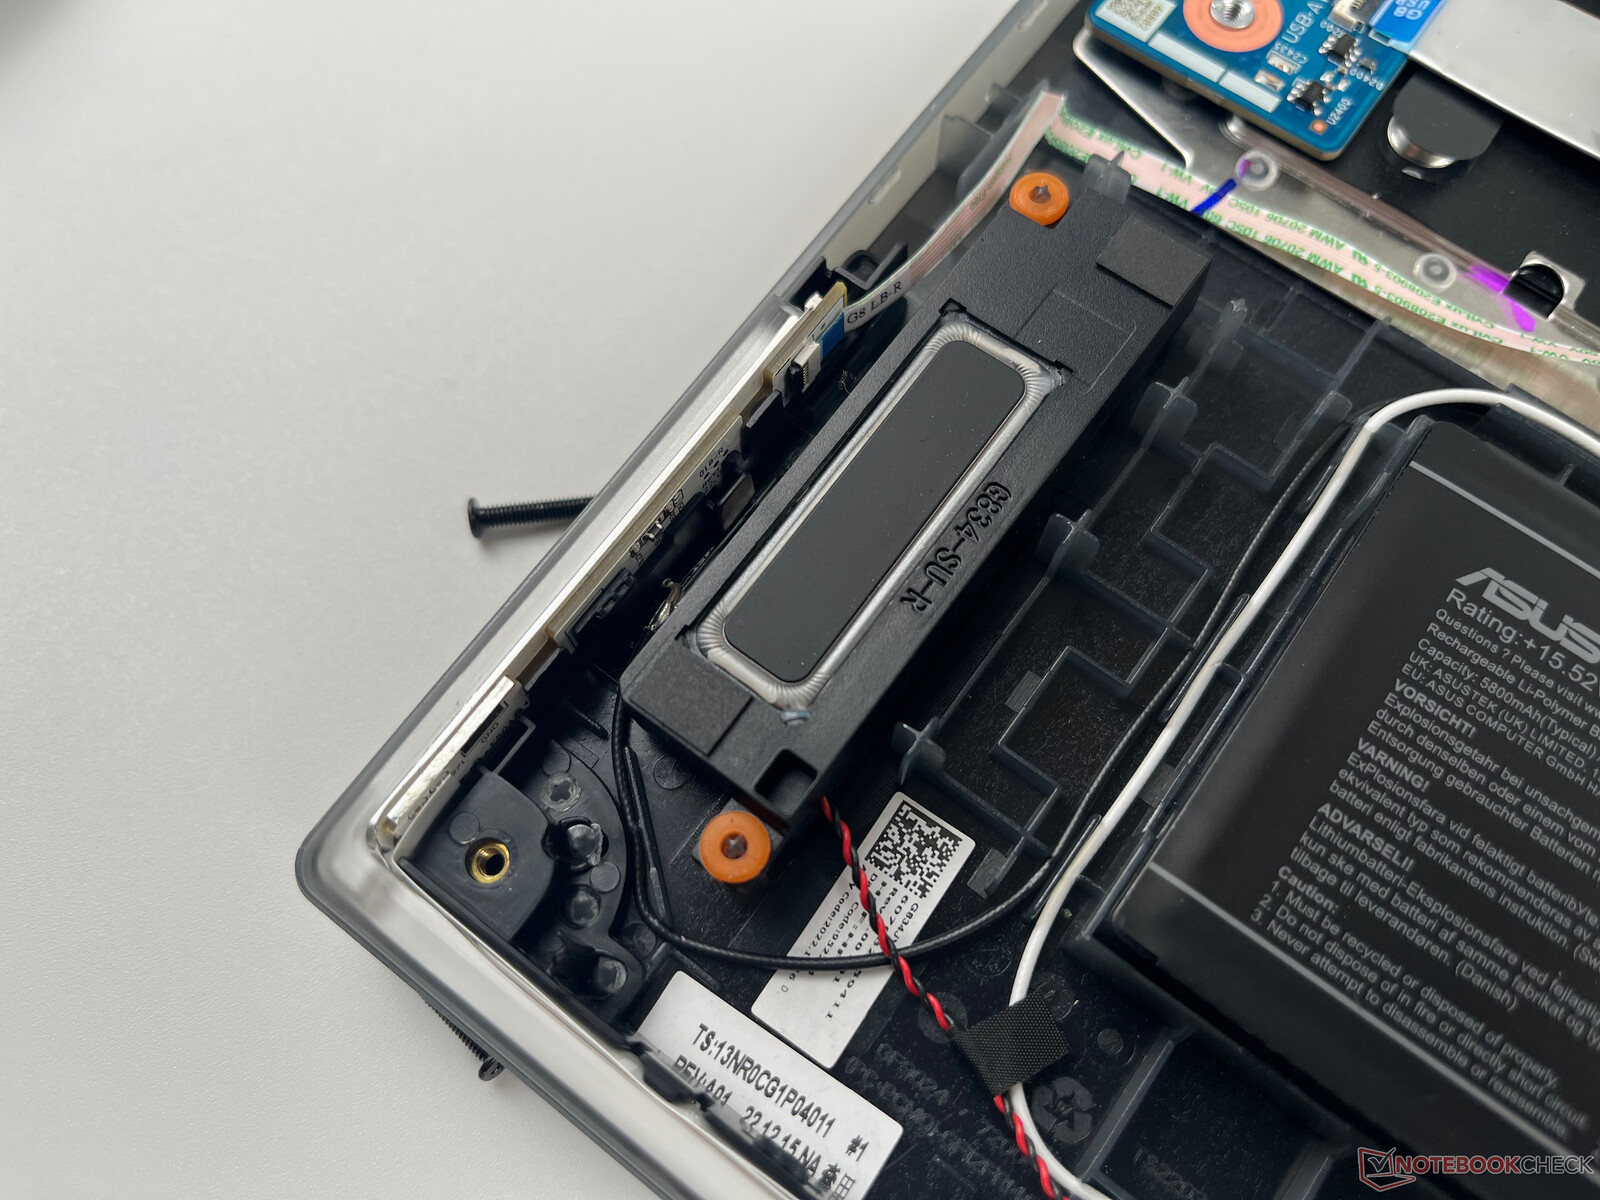
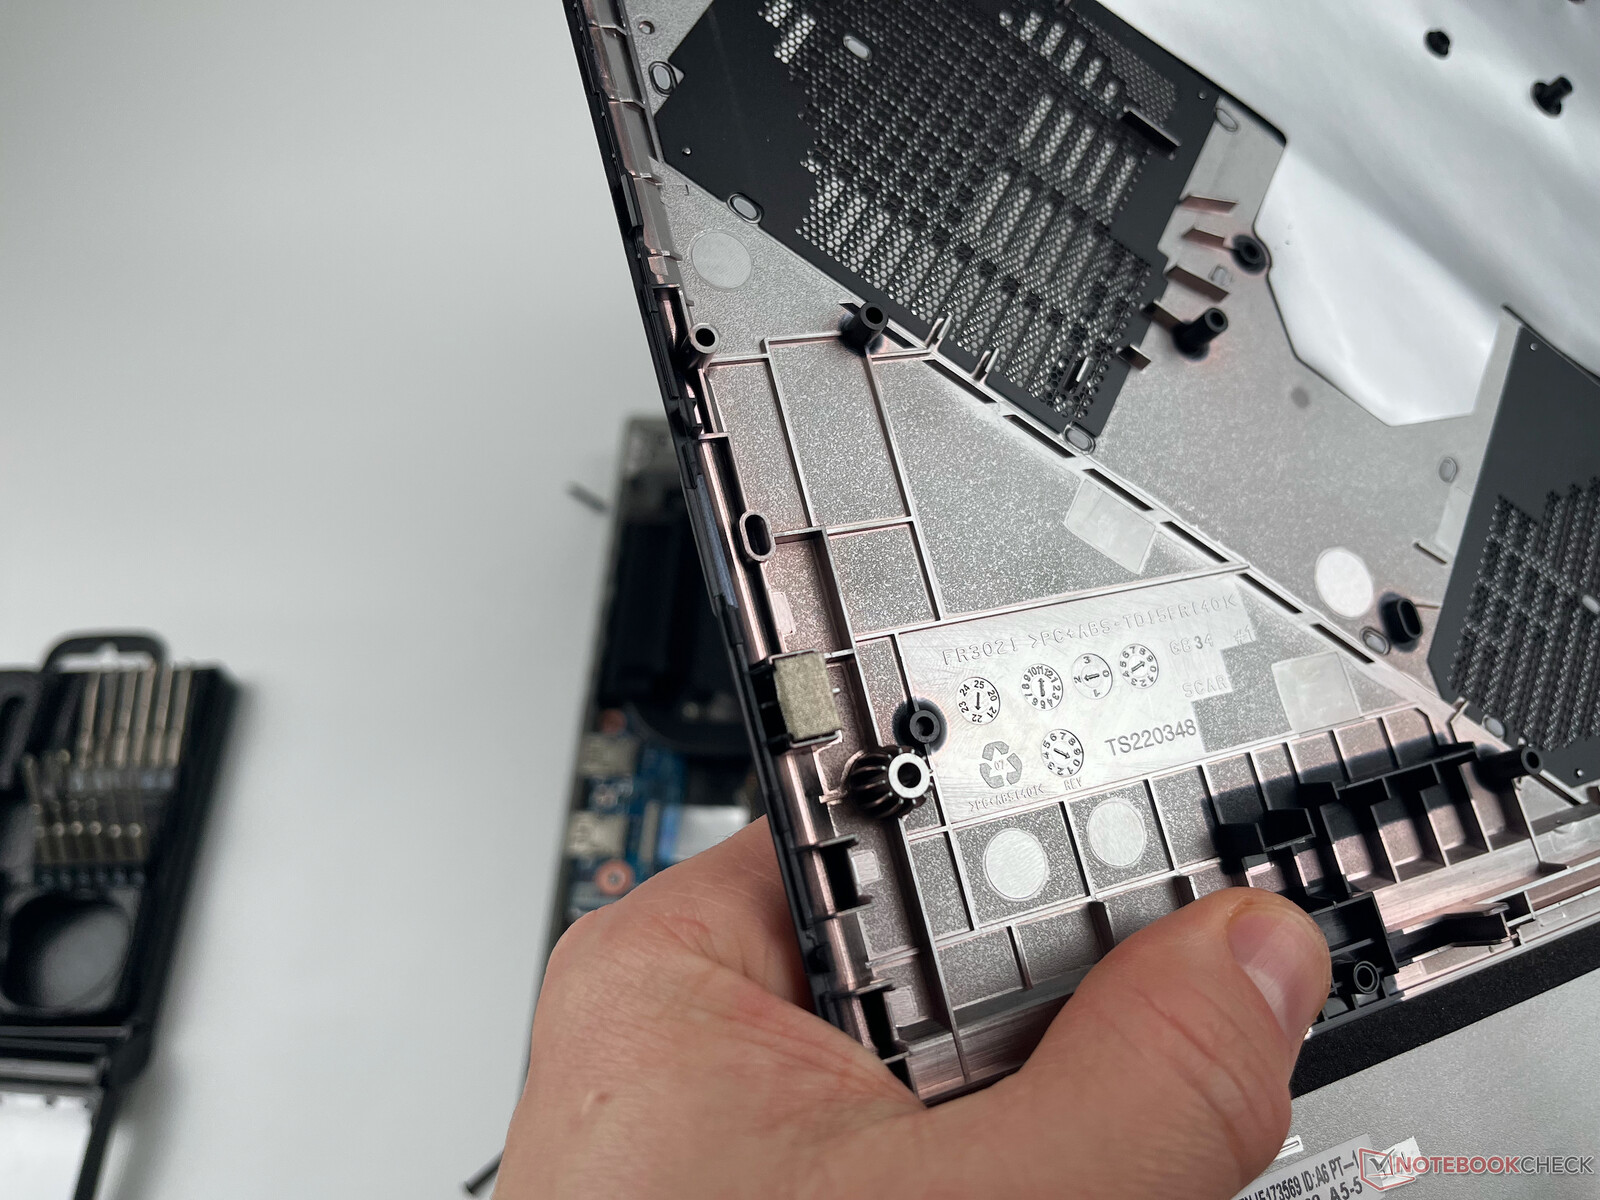
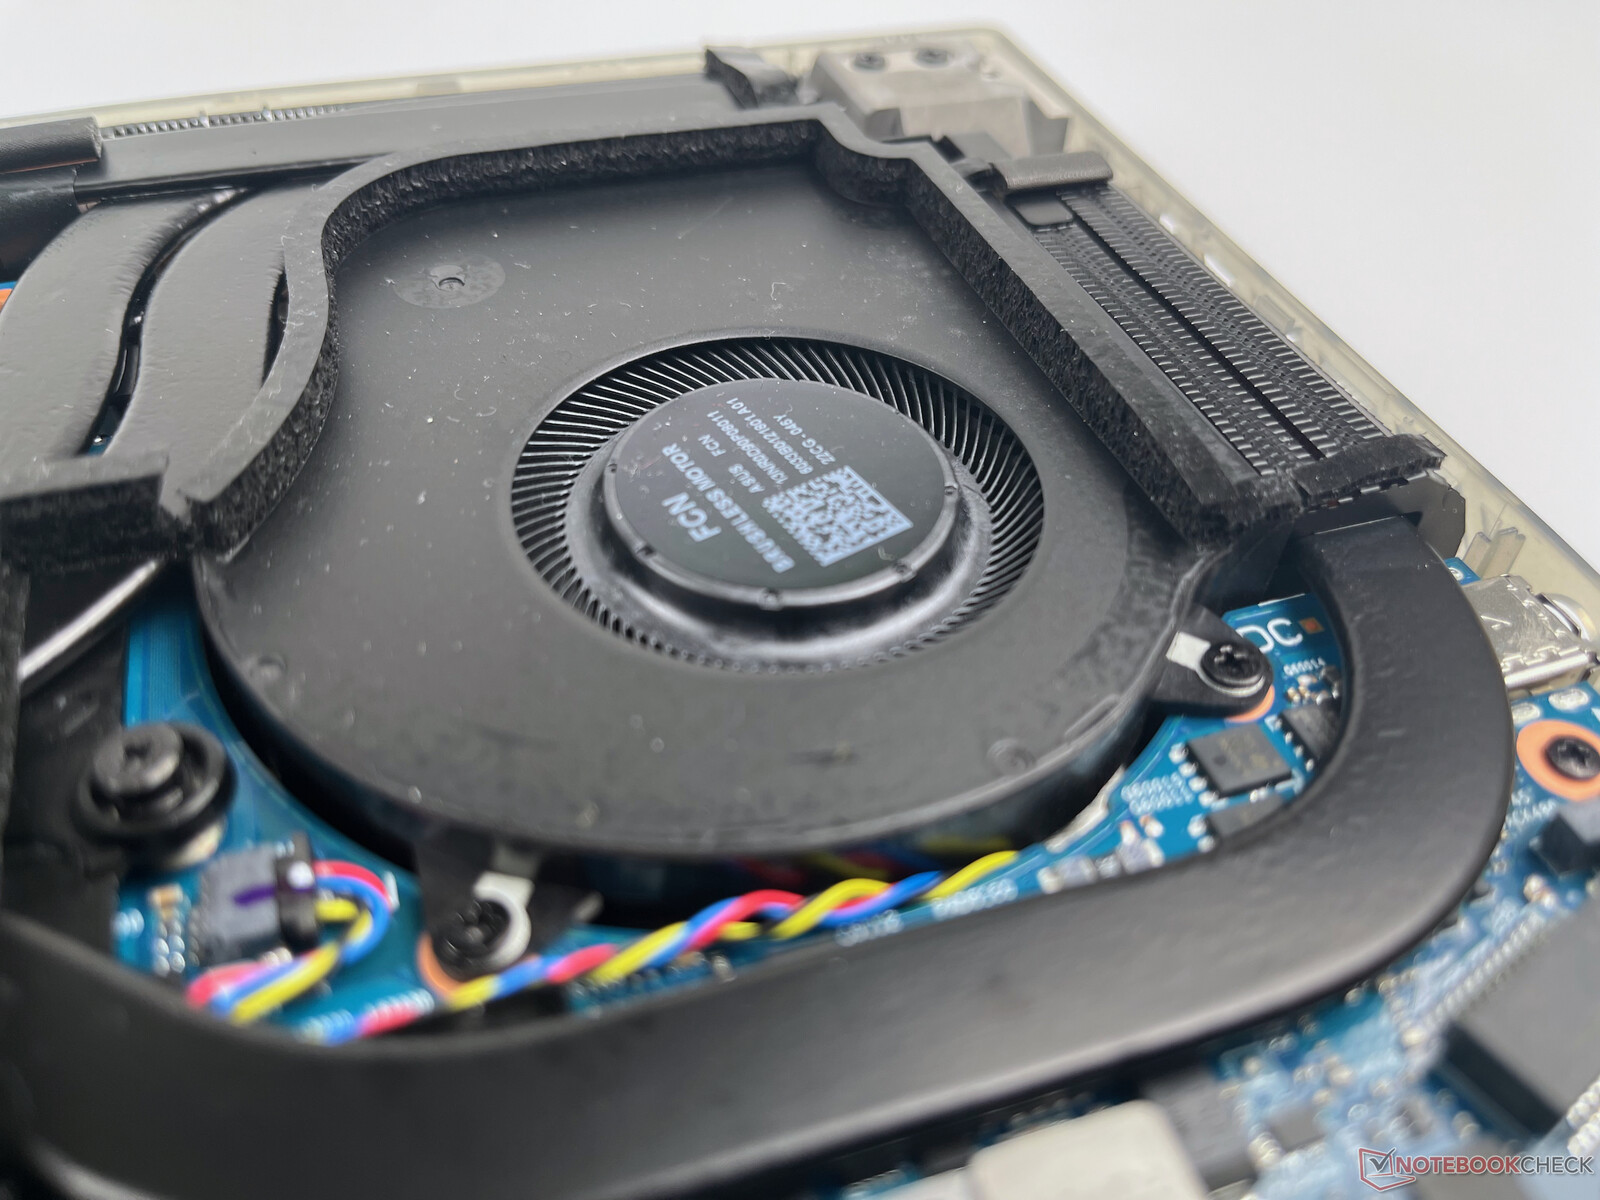
Insidan av ROG Strix G18-serien är relativt lättillgänglig från botten av höljet. Du måste först ta bort de många Philips-skruvarna och sedan lossa plastklämmorna på kanterna med ett brytverktyg. Detta var relativt enkelt att göra med vår testenhet (med början från de främre hörnen), och lyckligtvis gick inget av plastklämmorna sönder när man öppnade fodralet.
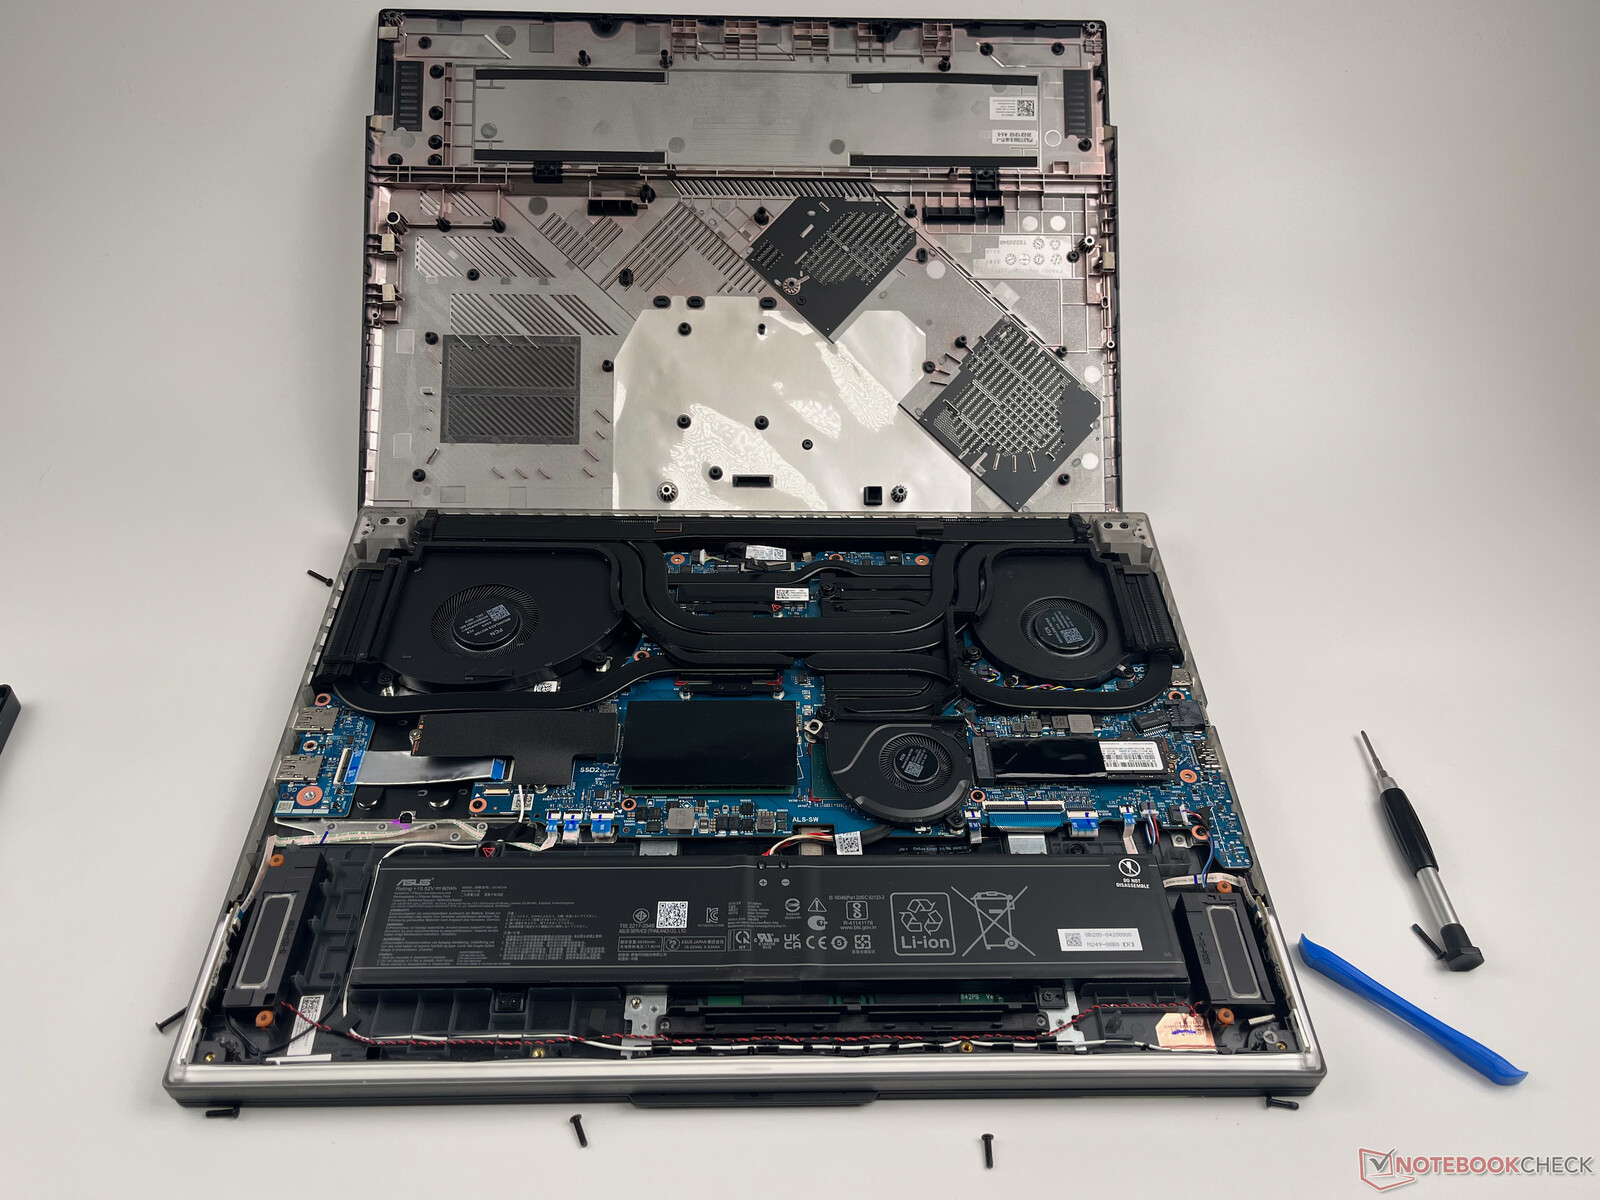
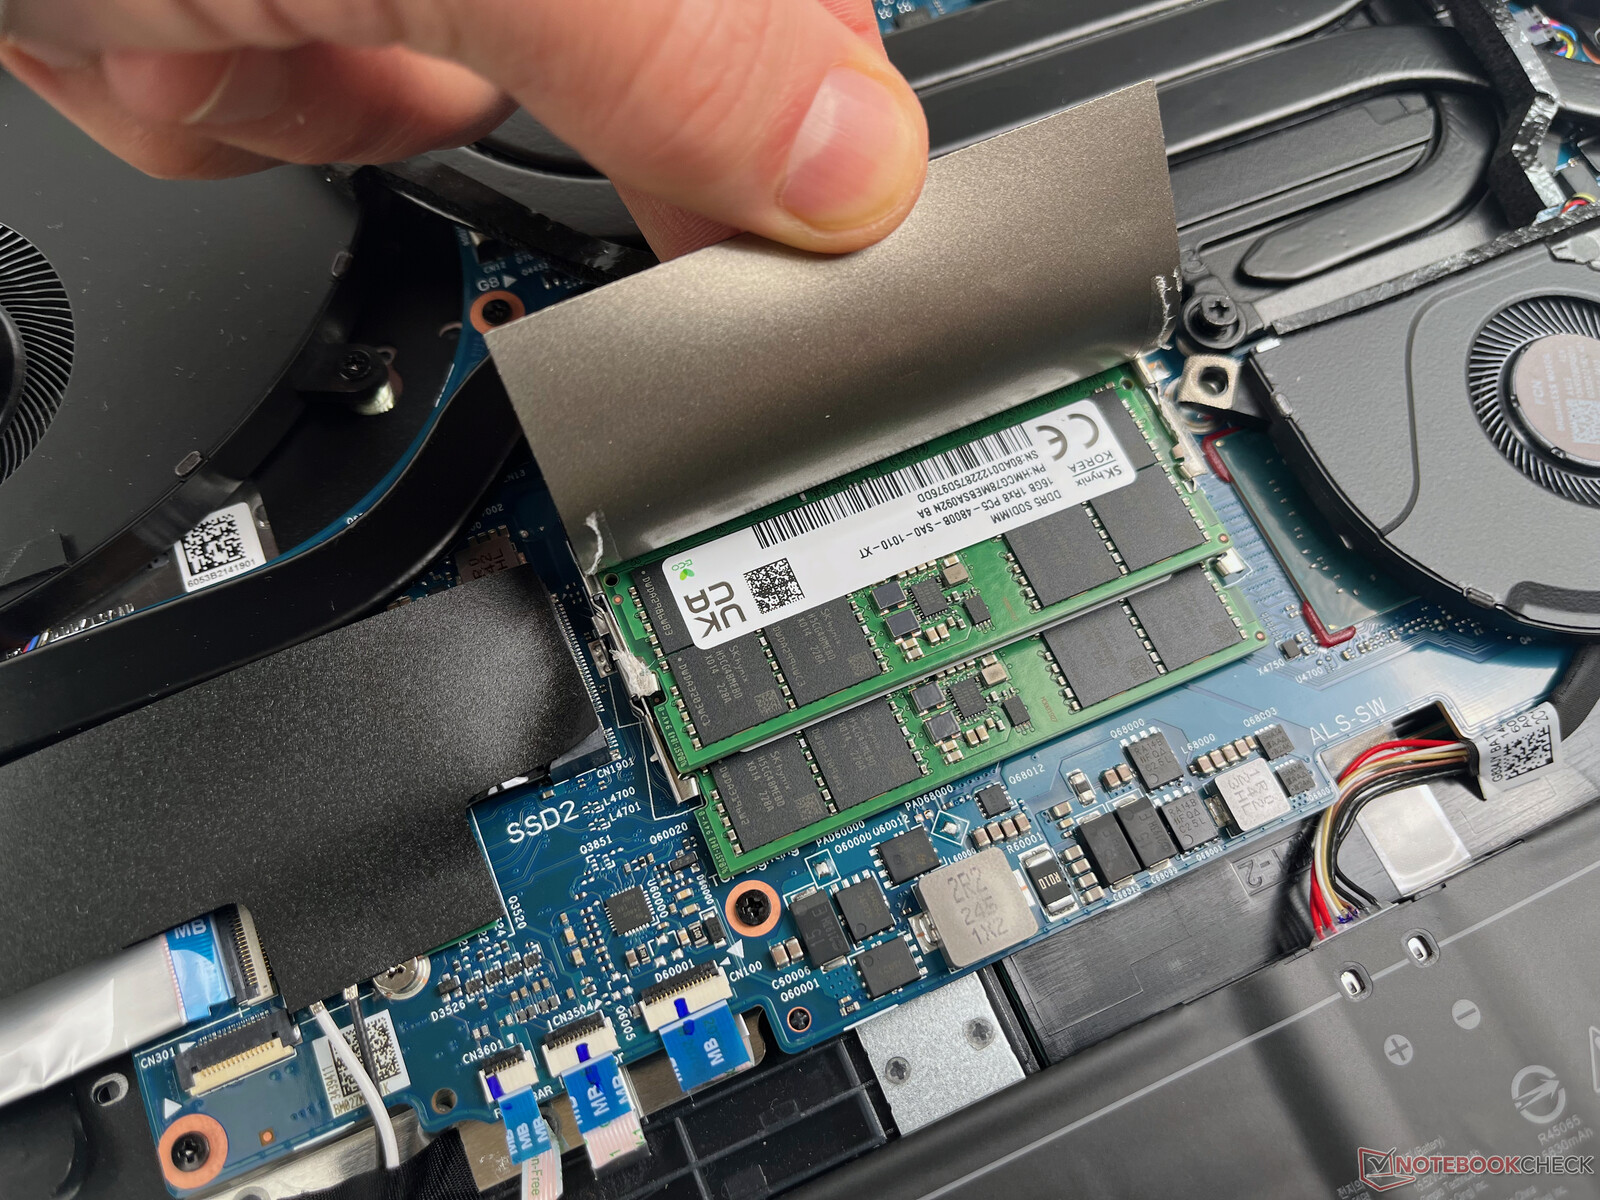
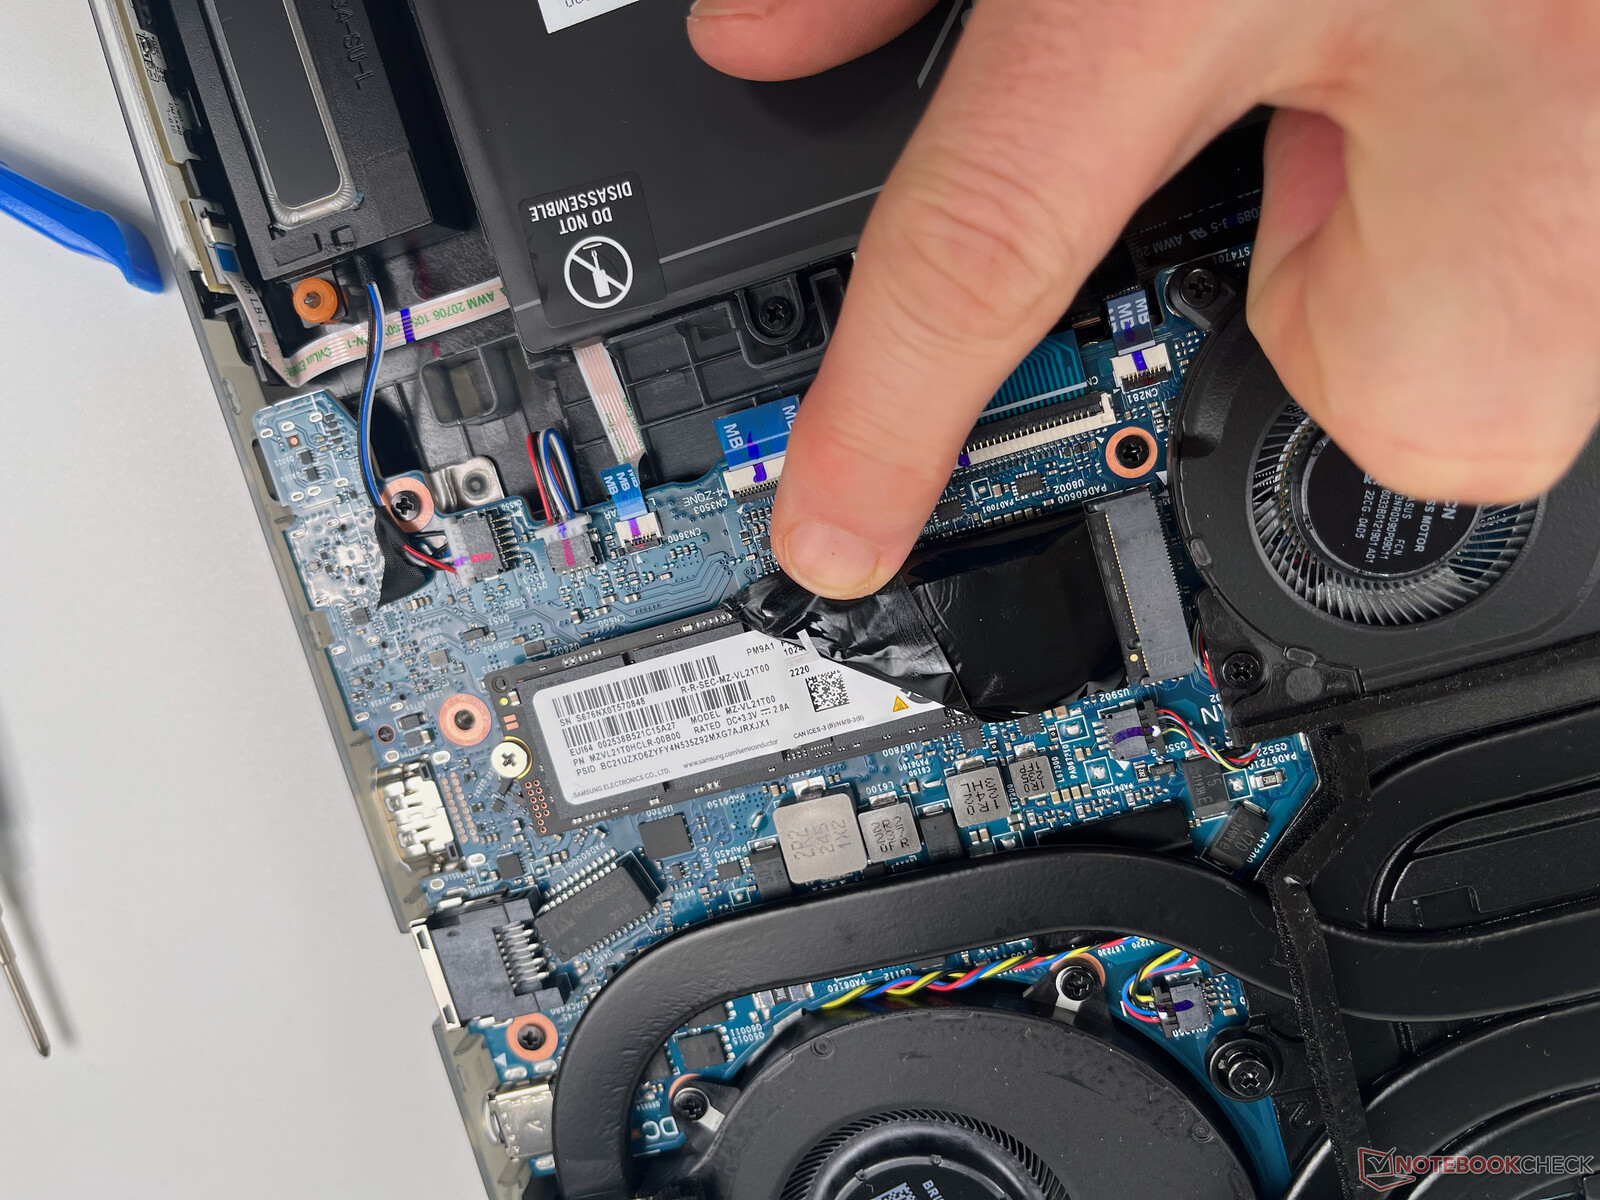
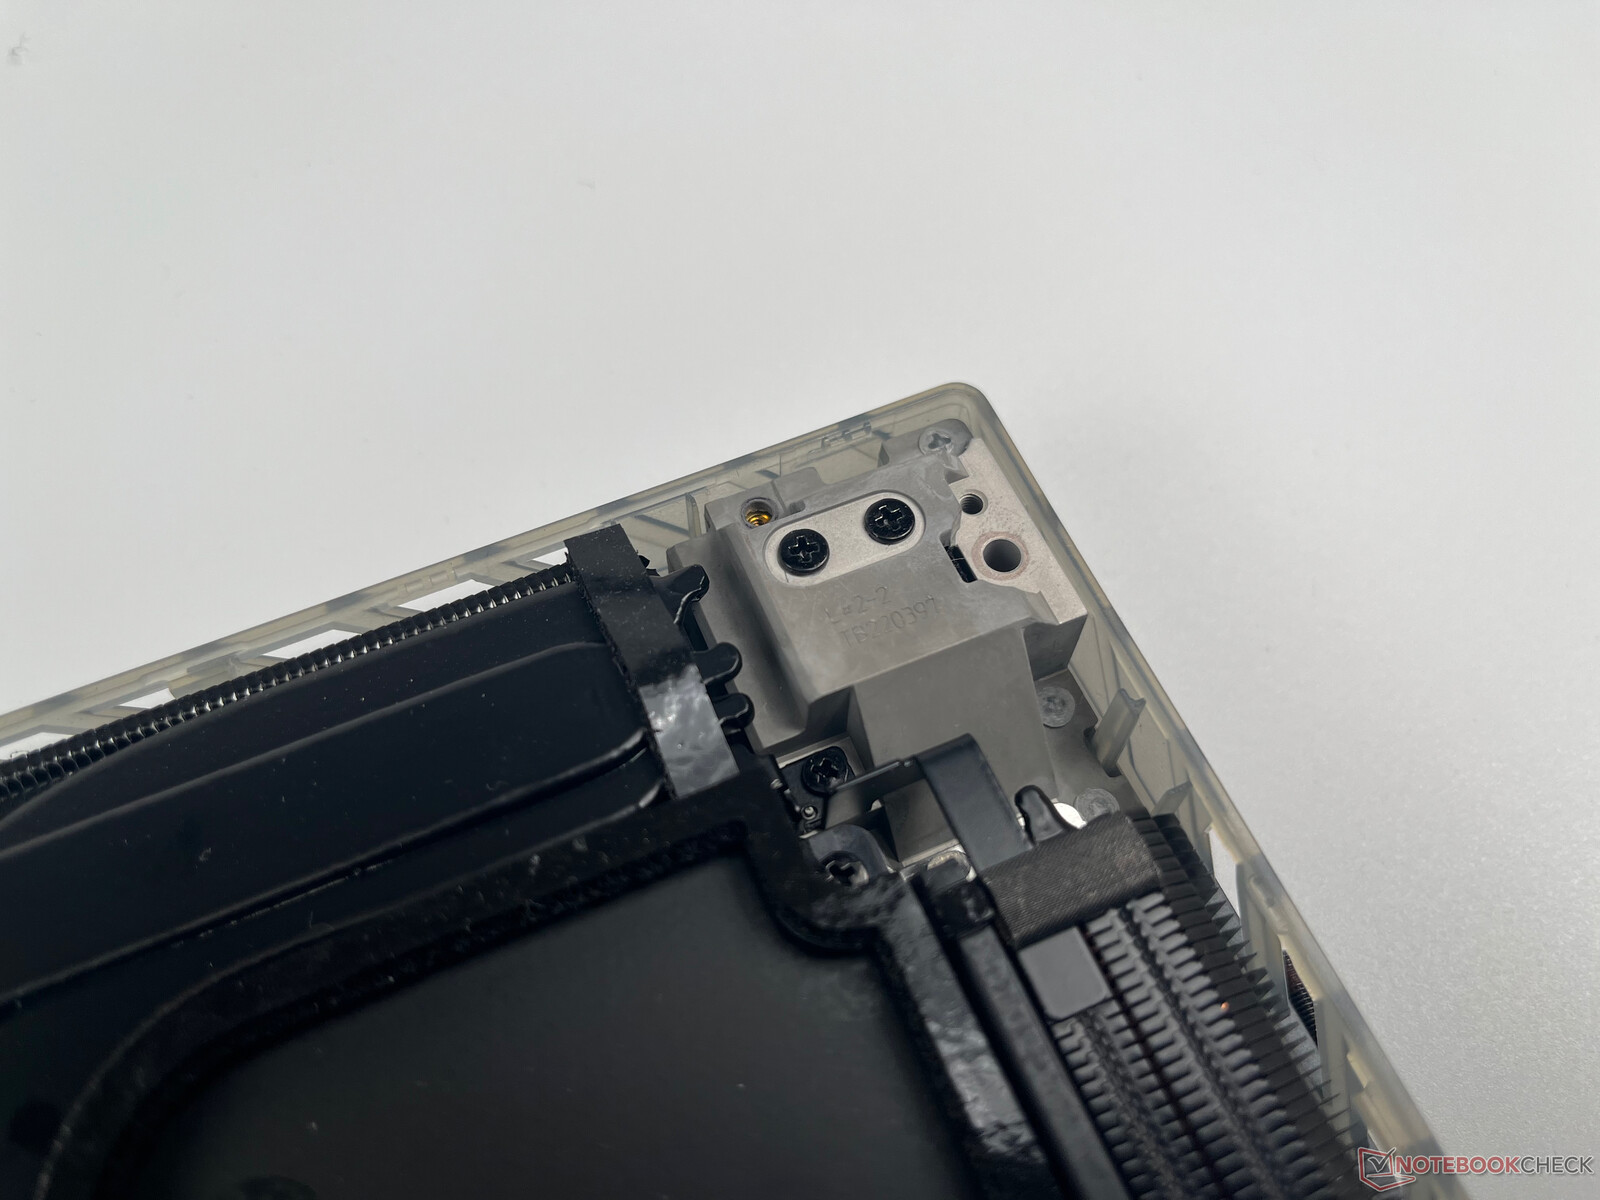
Inuti den bärbara datorn ser vi två M.2-2280-platser för PCIe SSD-diskar (båda upptagna för RAID-0-systemet), en M.2-plats för WLAN-kortet och två minnesplatser (också båda upptagna) för maximalt 64 GB GDDR5 RAM-minne. Alla fläktarna är också åtkomliga och kan enkelt rengöras. Batteriet är fastskruvat i höljet, så det borde också vara relativt enkelt att byta ut.
Garanti
Asus erbjuder endast den vanliga garantin på ett år (två år för de modeller som erbjuds i Tyskland). Någon garanti för reservdelar eller liknande nämns inte.
Input Devices
Tangentbord
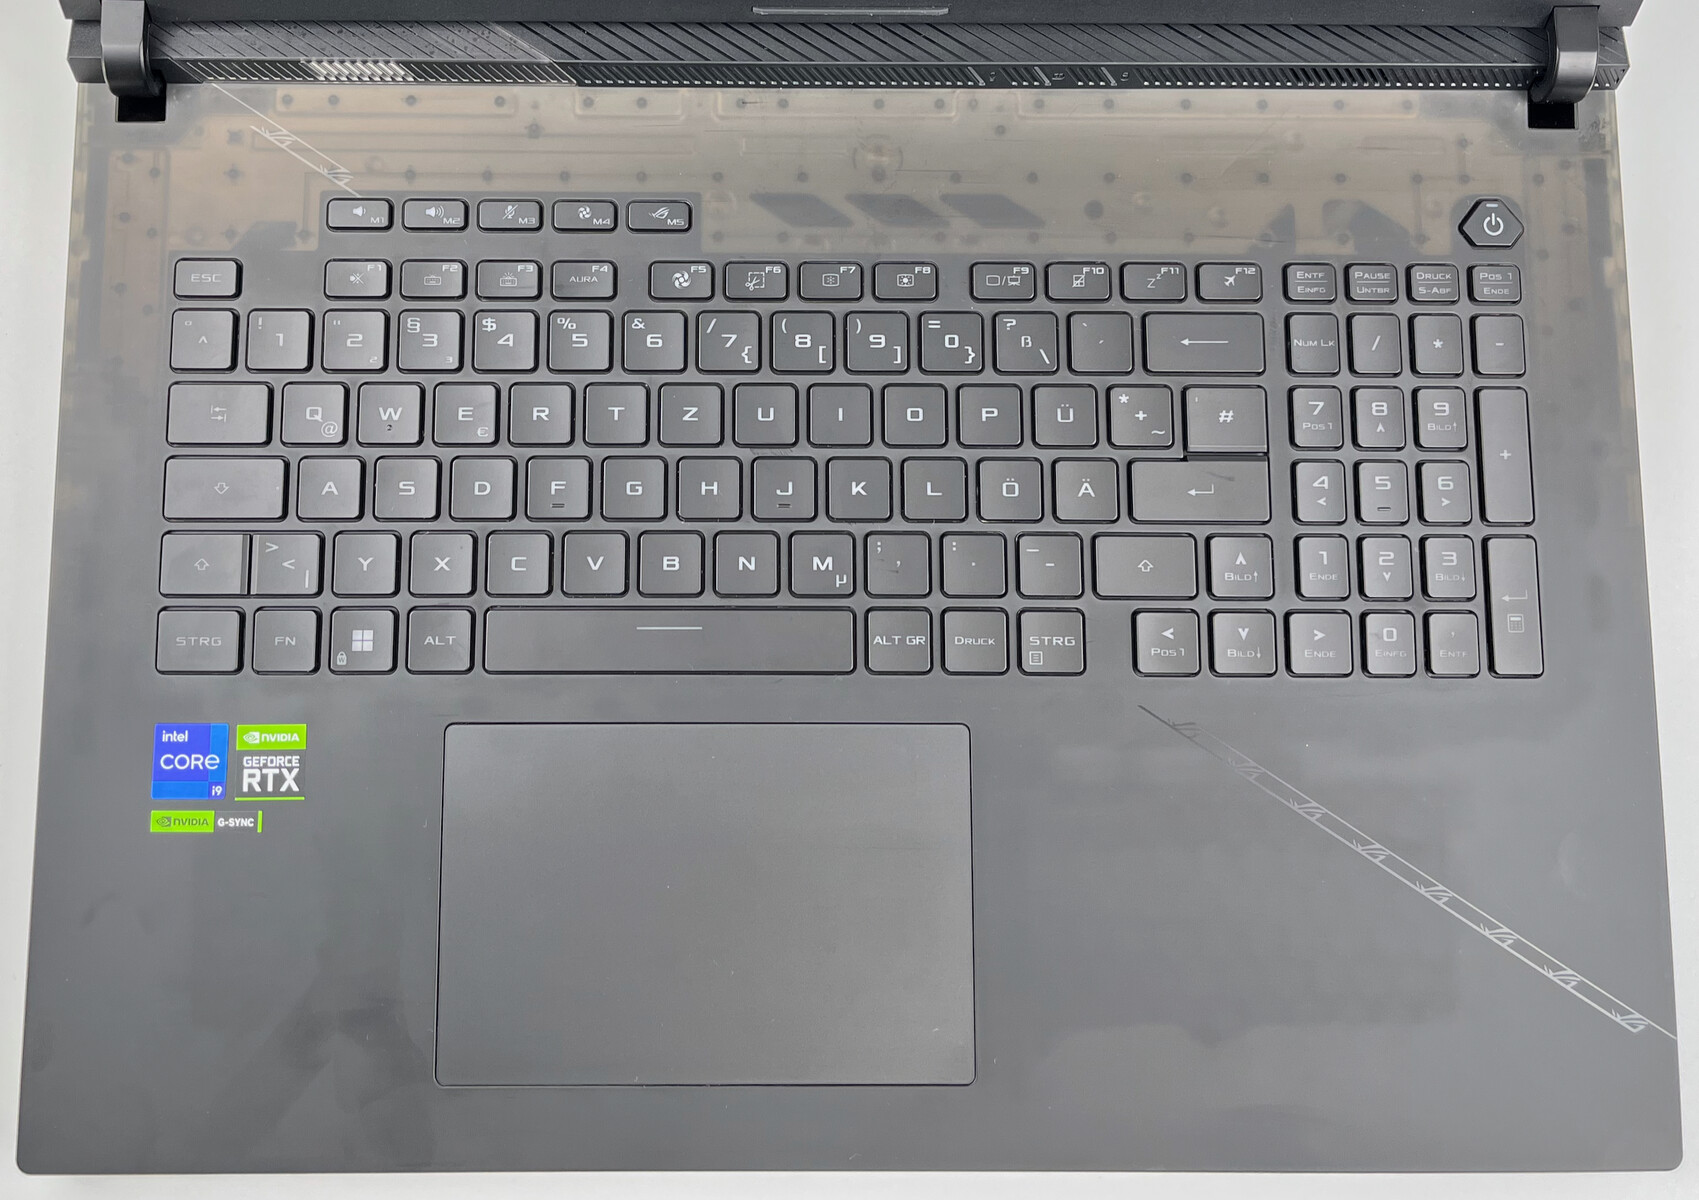
Förutom sifferblocket har det fullstora tangentbordet som används här också fem specialtangenter ovanför raden F1-F12 med dubbel användning. Chicklet-tangenterna erbjuder tillräcklig tangentrörelse och ett tyst slag. Under det första skrivtestet nådde författaren upp till drygt 85 ord per minut med 96 % noggrannhet. Den inbyggda RGB-bakgrundsbelysningen på de separata tangenterna kan anpassas med många animationer. I n-key rollover-testet ser vi inga begränsningar (24 samtidiga tangenter nås maximalt).
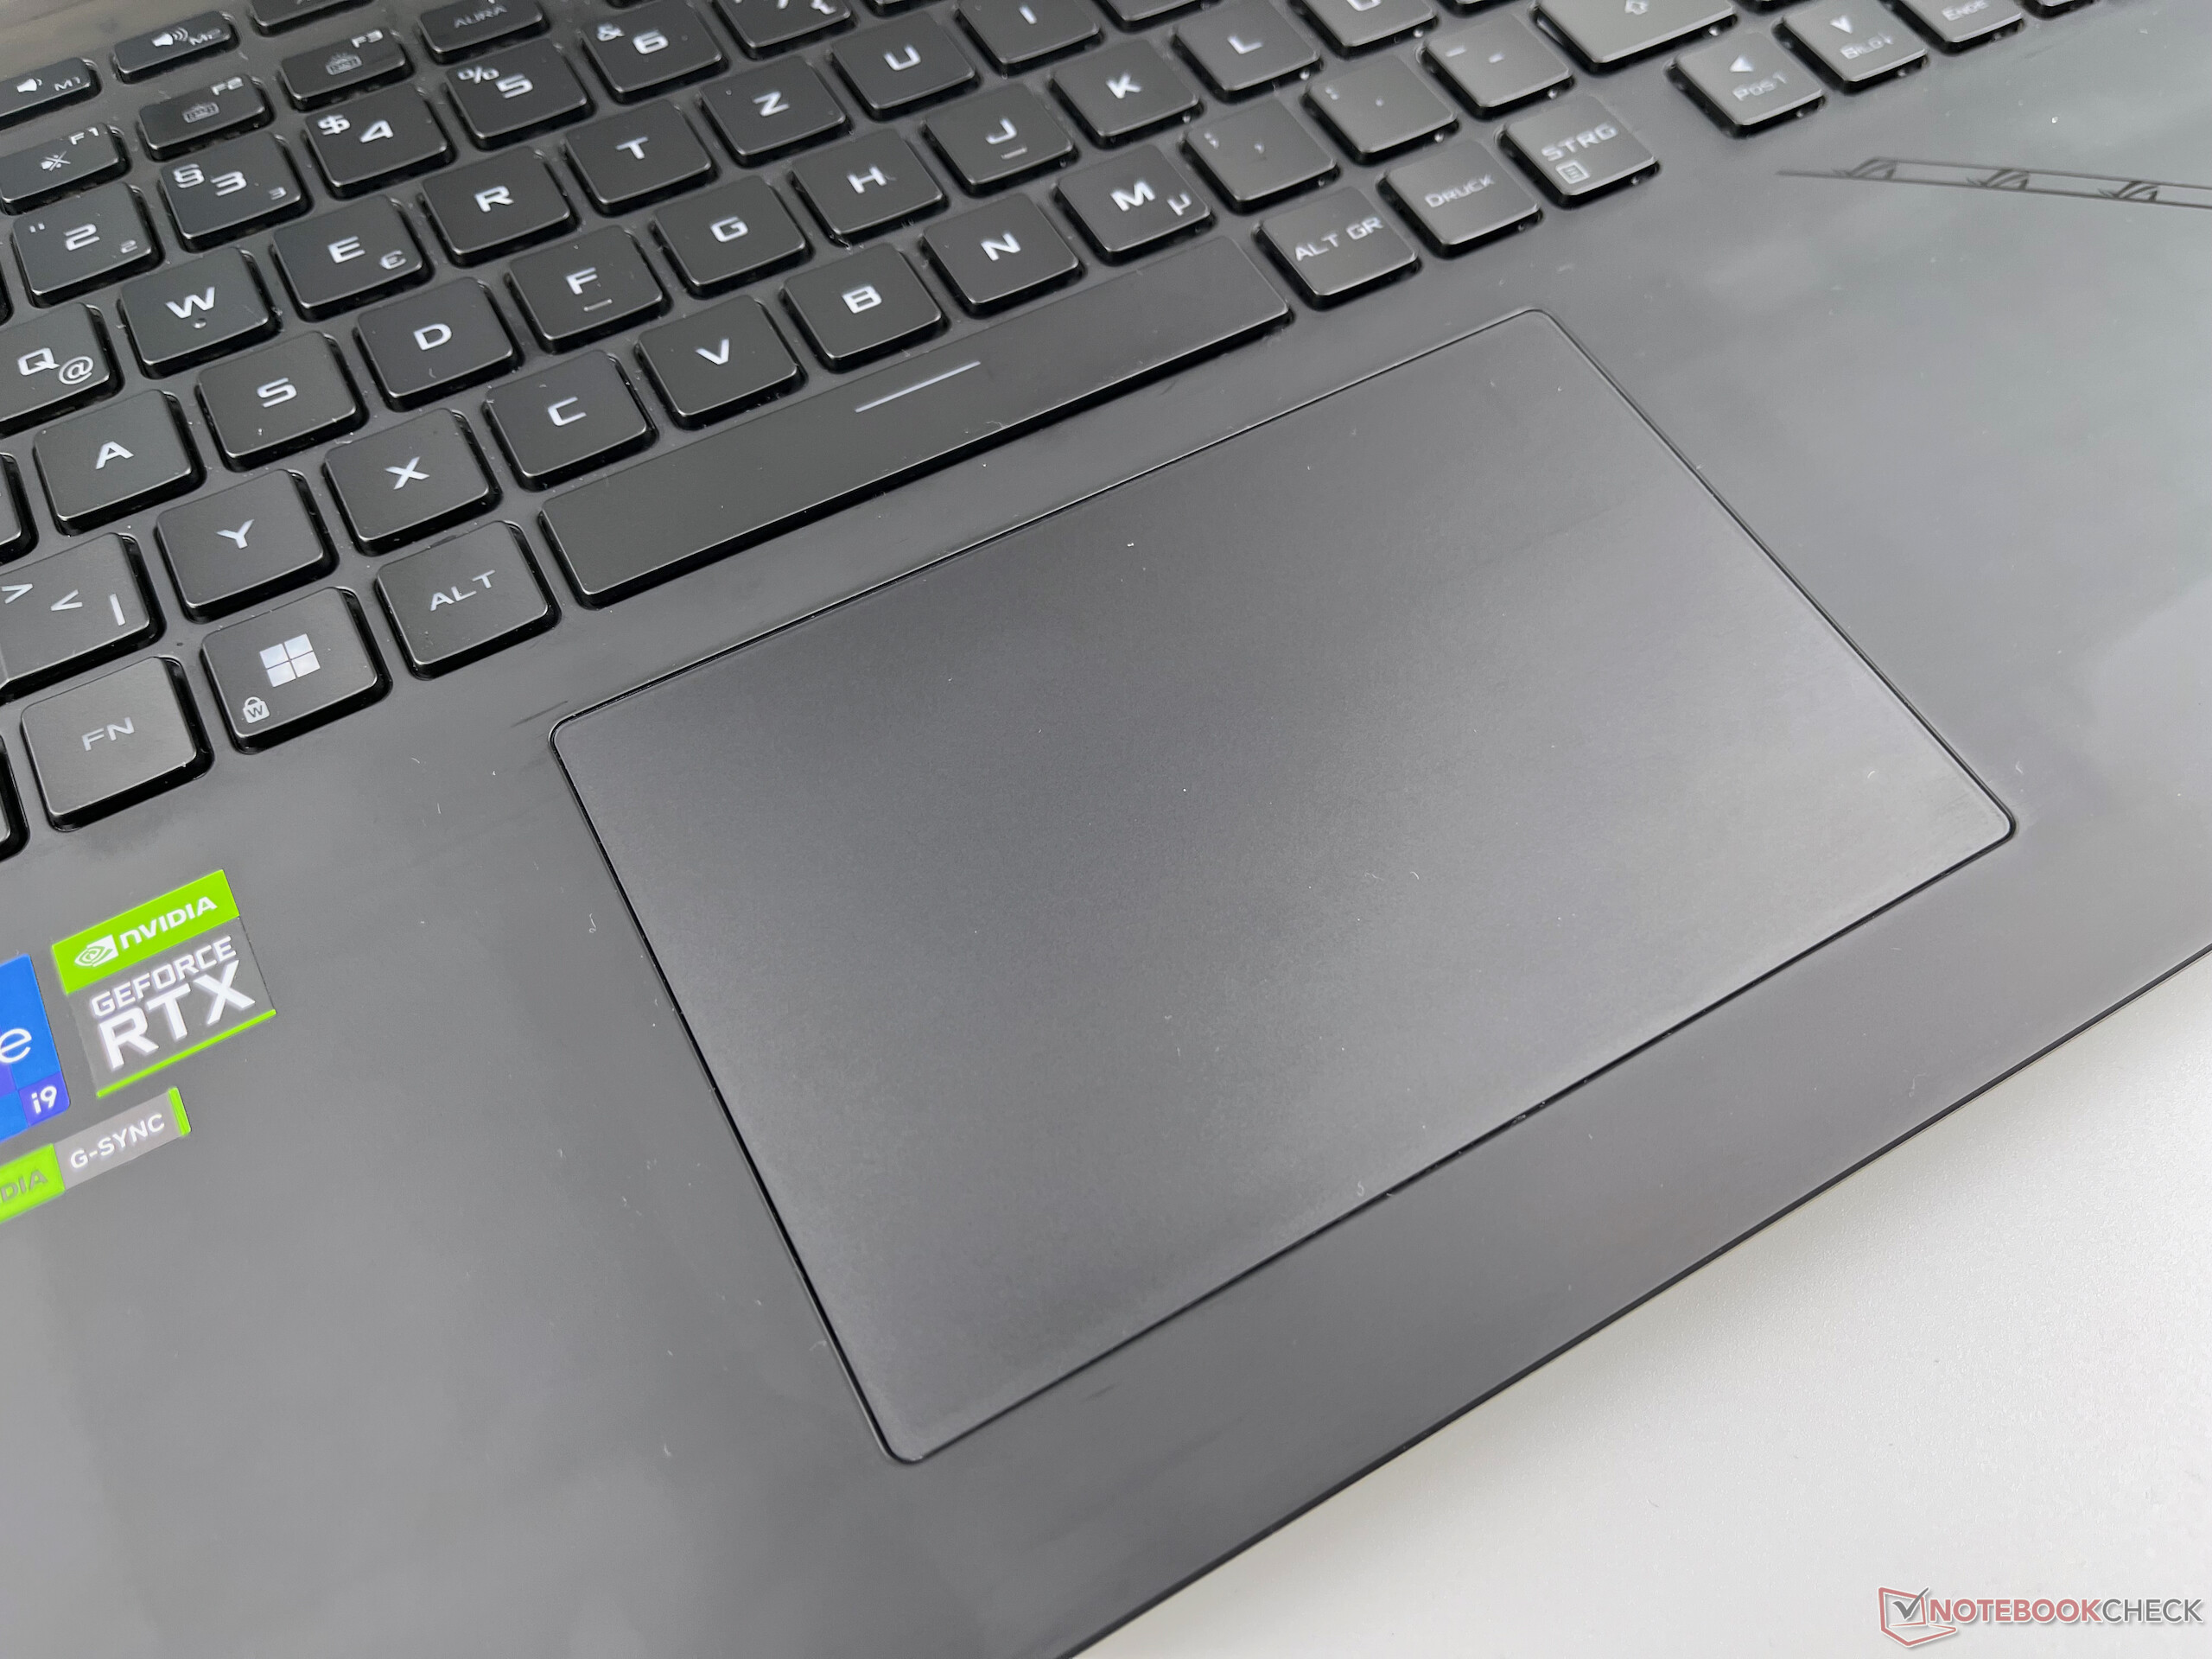
Pekplatta
Den stora pekplattan har en glasyta och utmärkta glidegenskaper. Multitouch fungerade felfritt i vårt test, och de nedre 4/5 av ytan kan också klickas bekvämt. Ett klick i det högra nedre hörnet känns dock ofta igen som ett tryck på höger musknapp, vilket leder till en del felaktiga inmatningar.
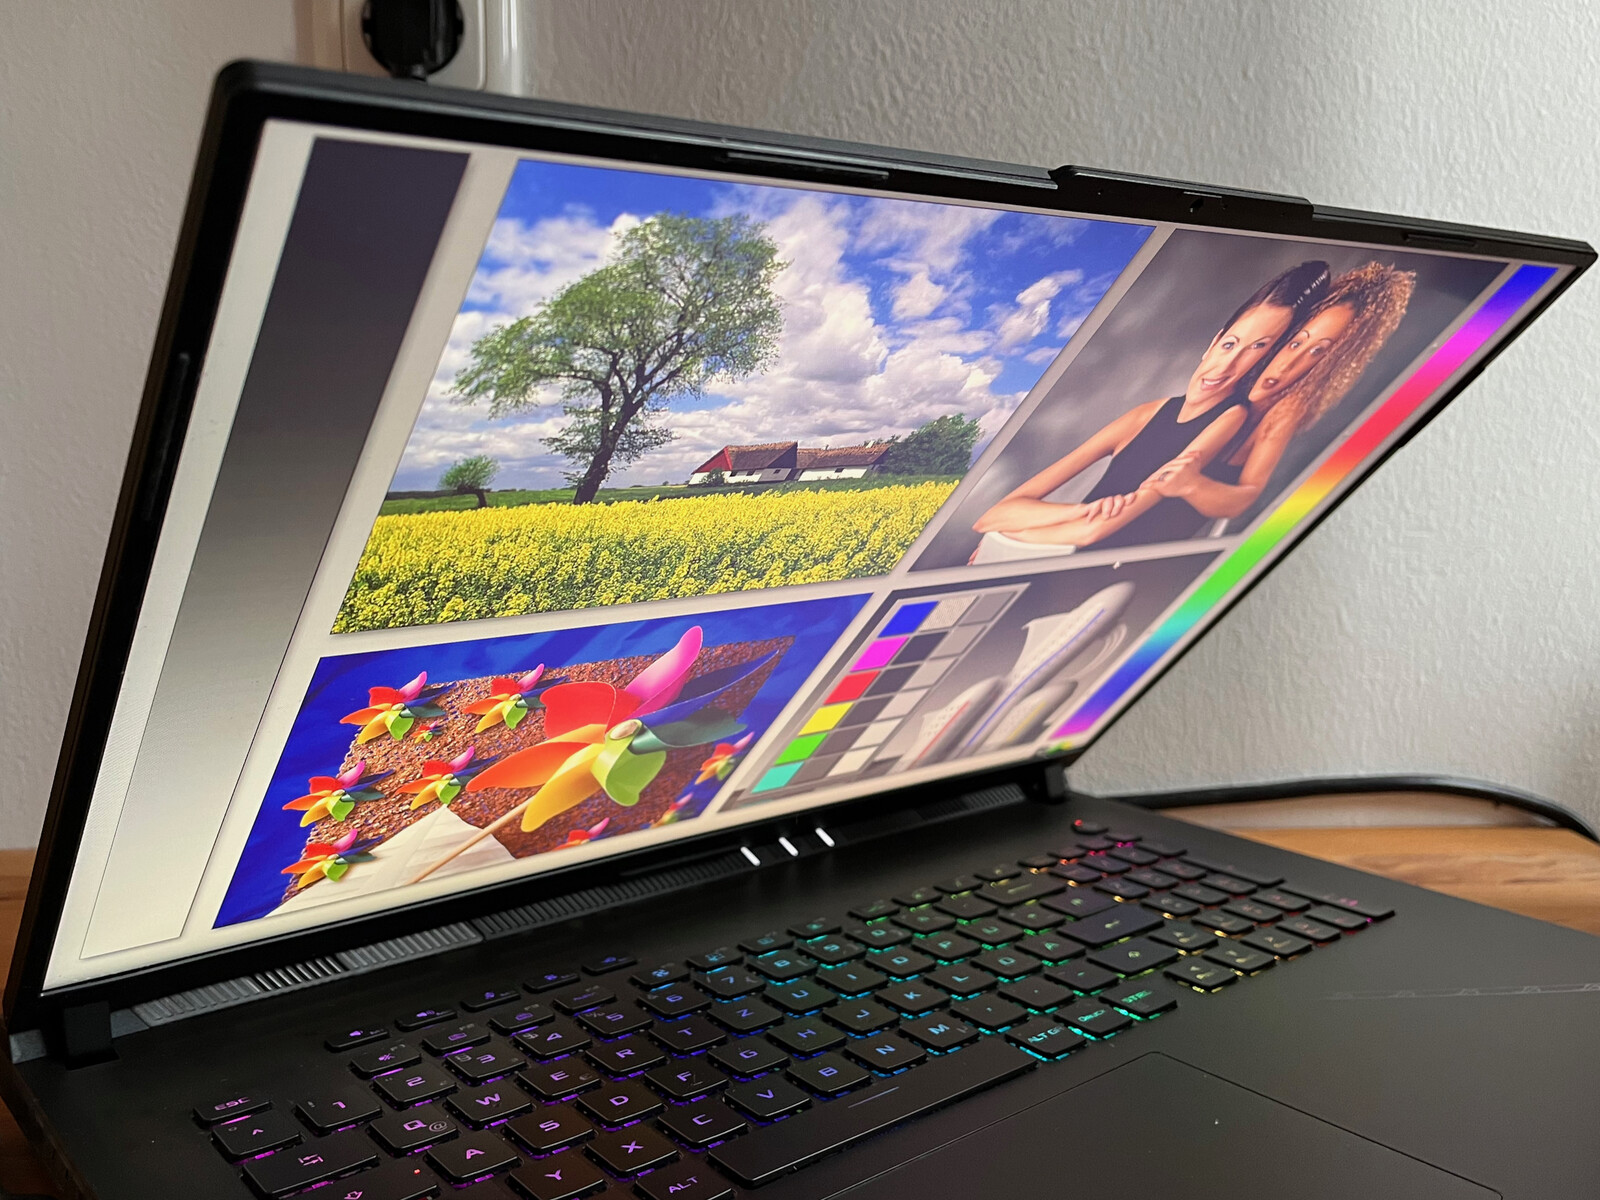
Visa
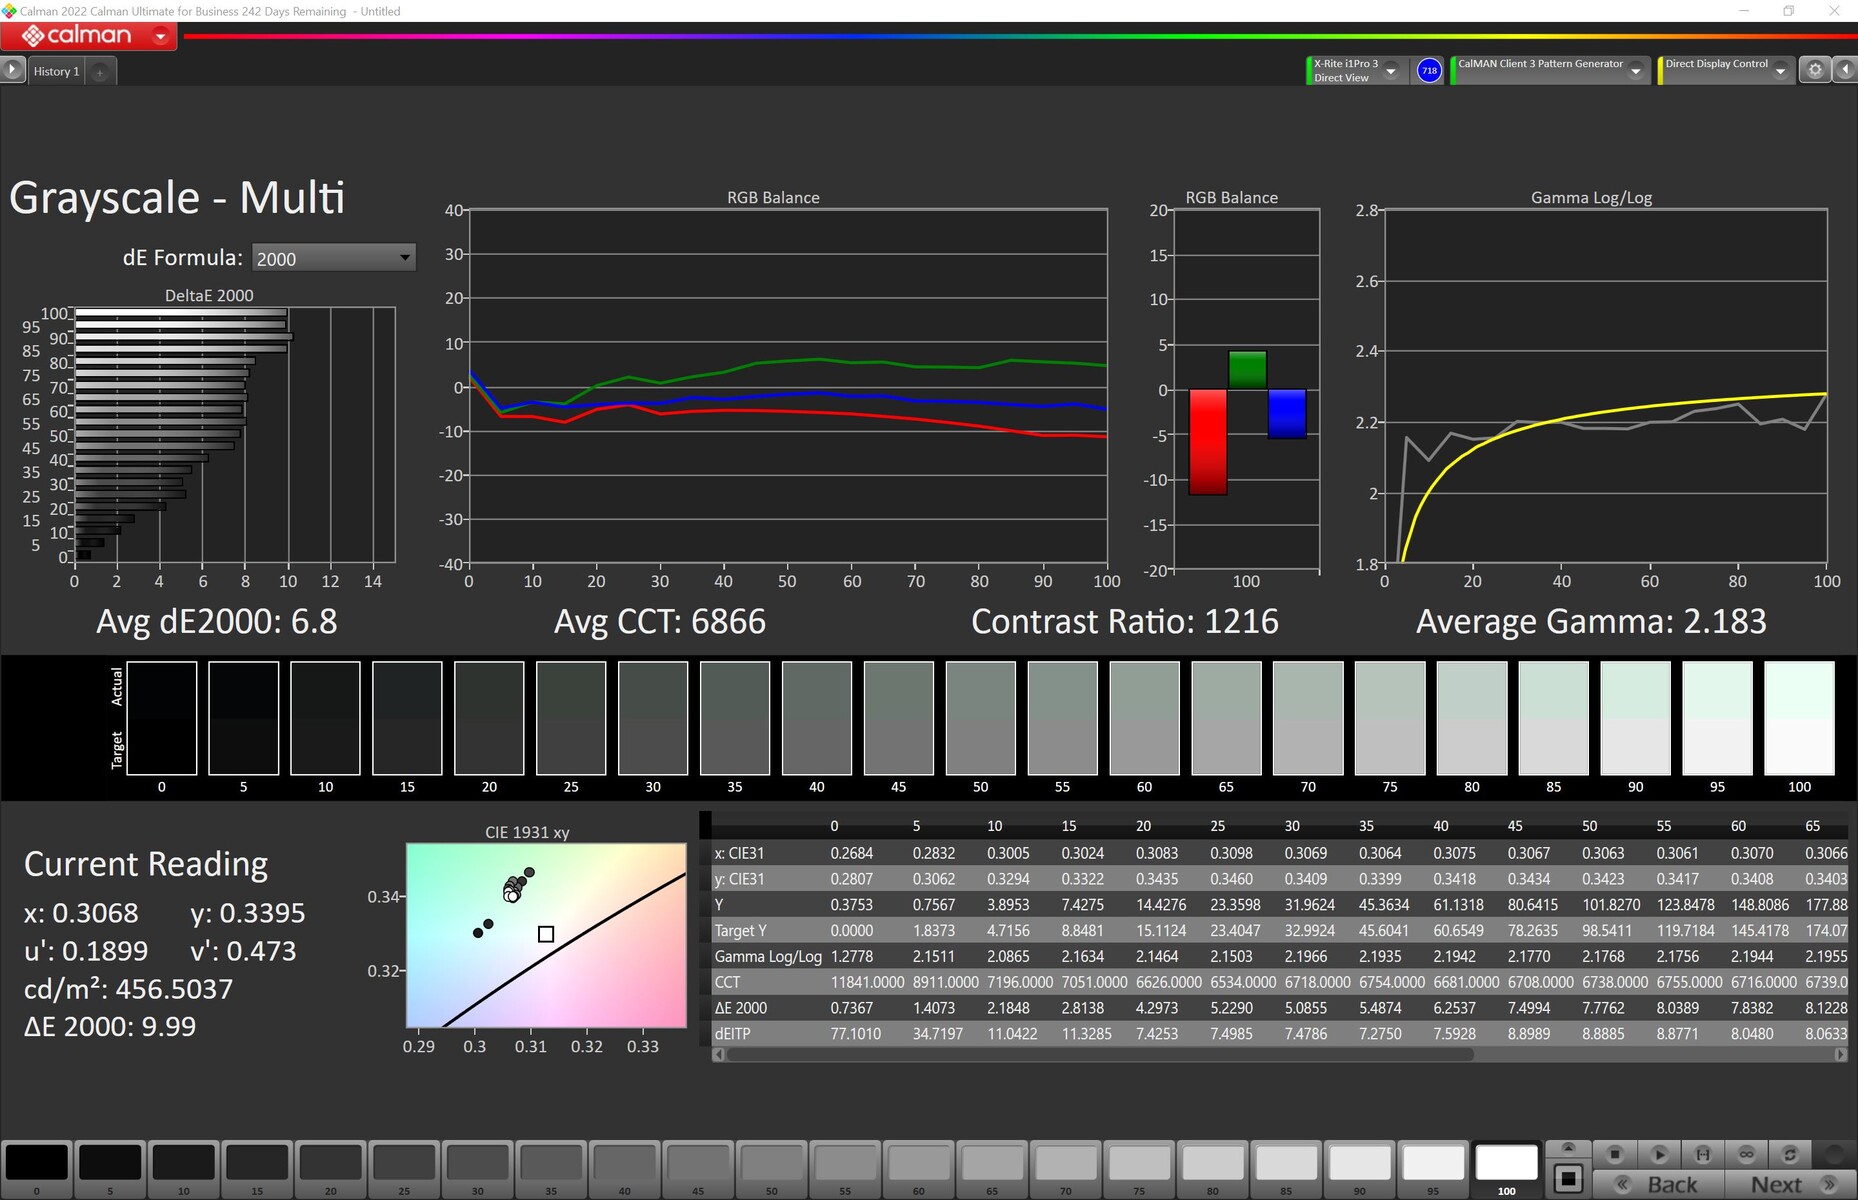
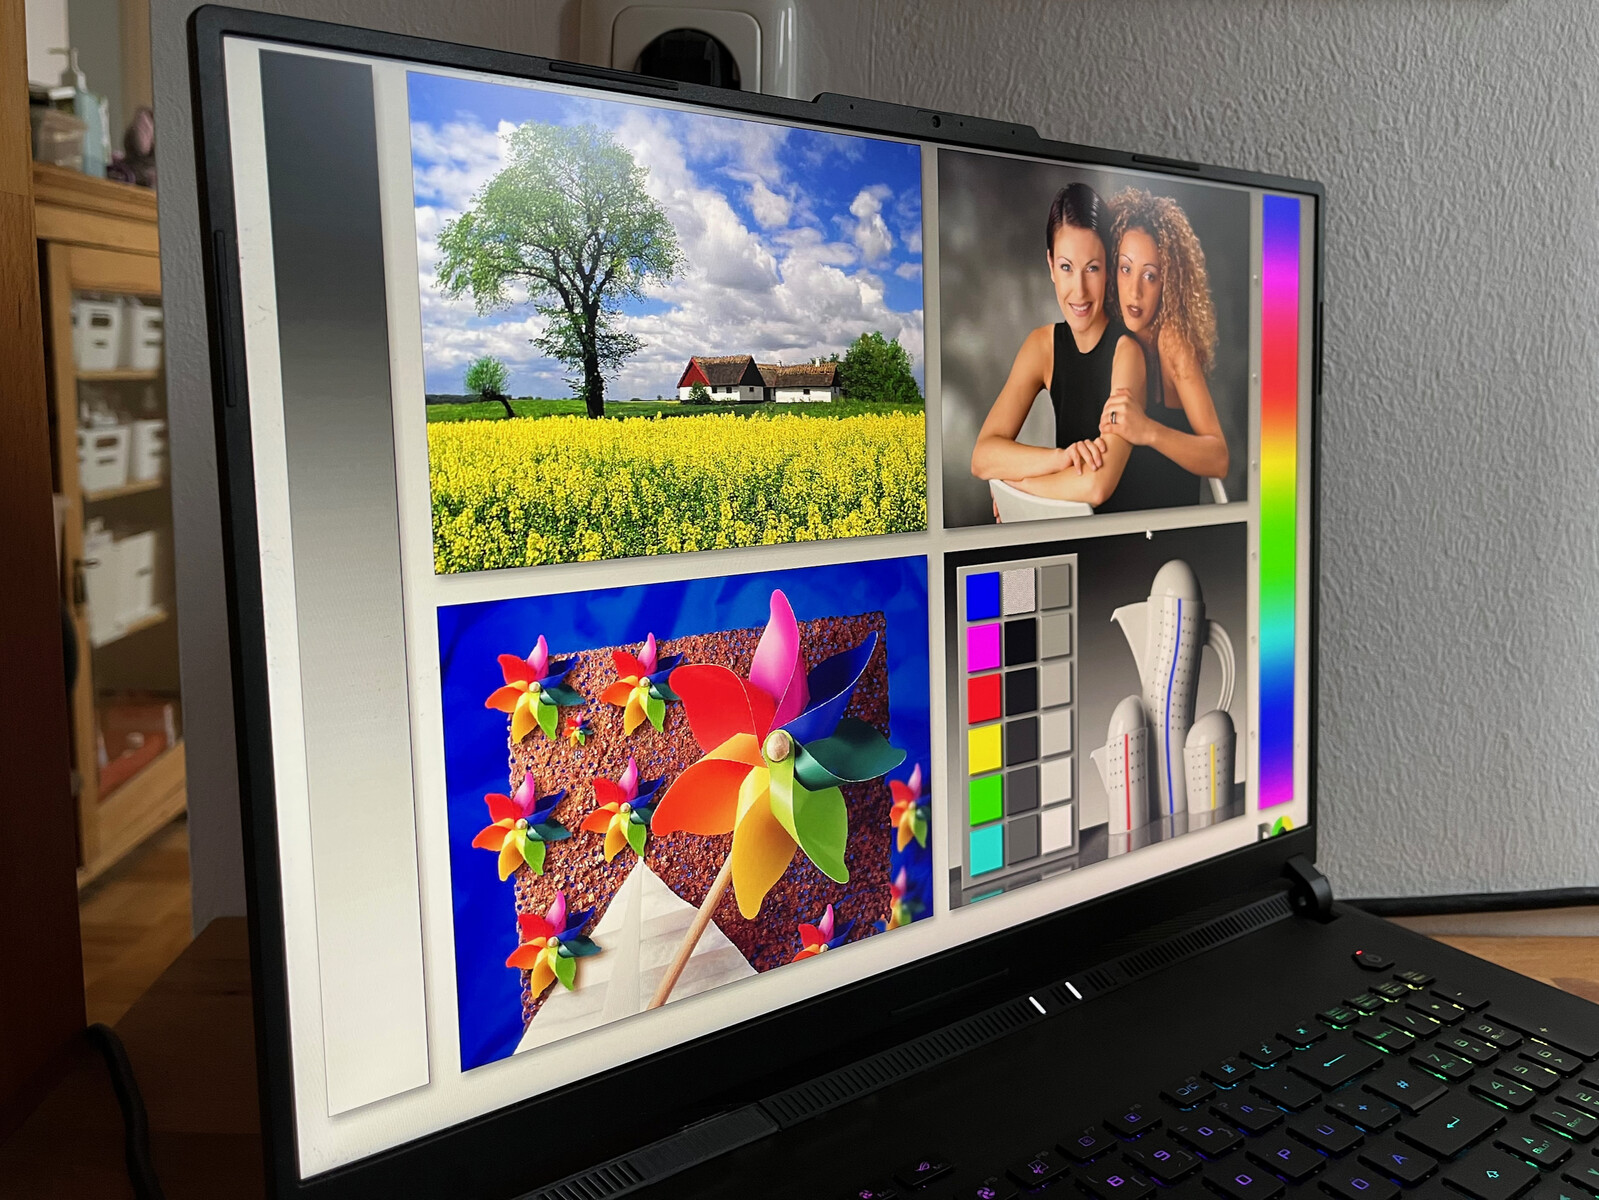
Den nya 18-tumsskärmen har många funktioner som G-Sync, 240 Hz, QHD+, snabb svarstid på 3 ms och DCI-P3-färgrymdstäckning enligt specifikationsbladet. När det gäller ljusstyrka når den stora 18-tumsskärmen inte riktigt upp till de utlovade 500 nits. Ljusstyrkan är dock definitivt alltid tillräcklig inomhus, och ljusfördelningen är också bra med 86 %. Vår testenhet uppvisar ingen synlig blödning av bakgrundsbelysningen.
| |||||||||||||||||||||||||
Distribution av ljusstyrkan: 86 %
Mitt på batteriet: 490 cd/m²
Kontrast: 907:1 (Svärta: 0.54 cd/m²)
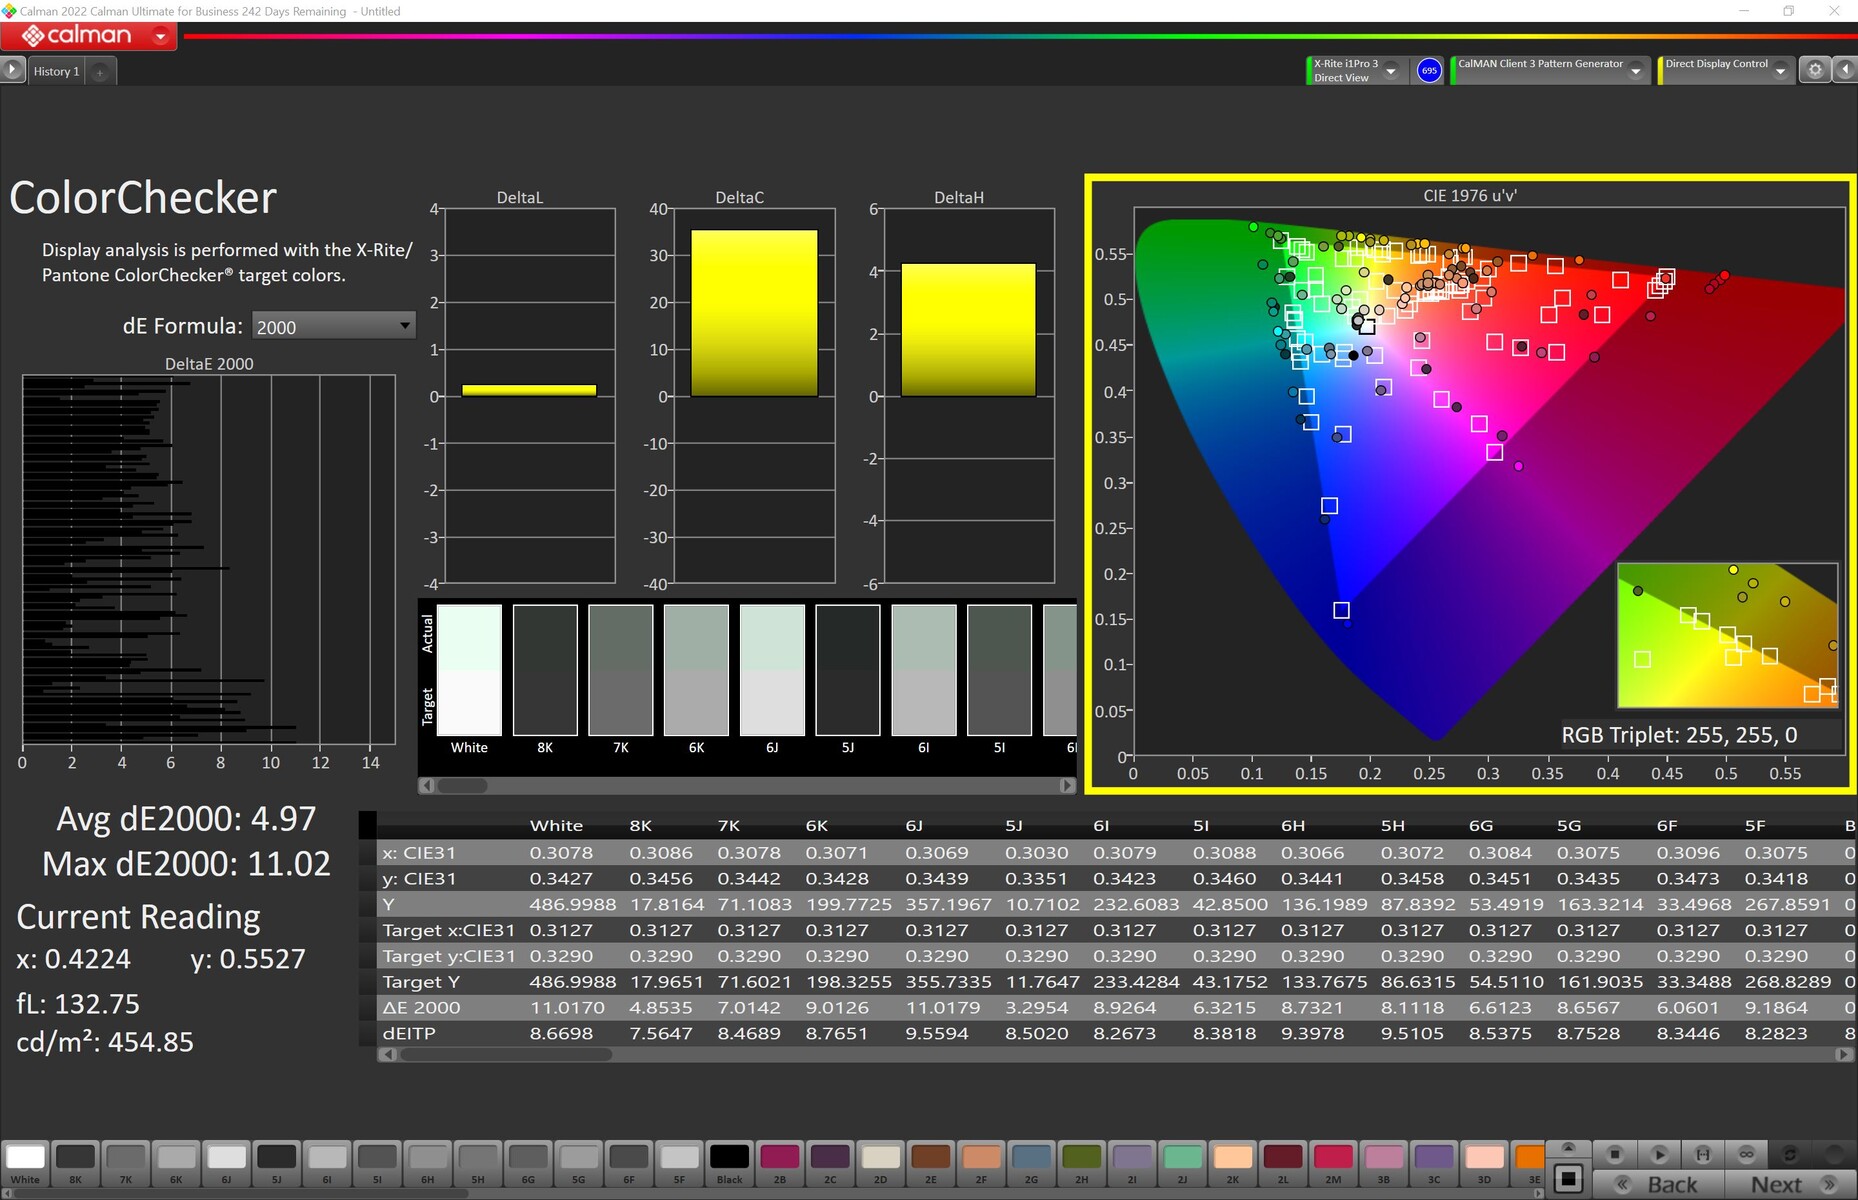
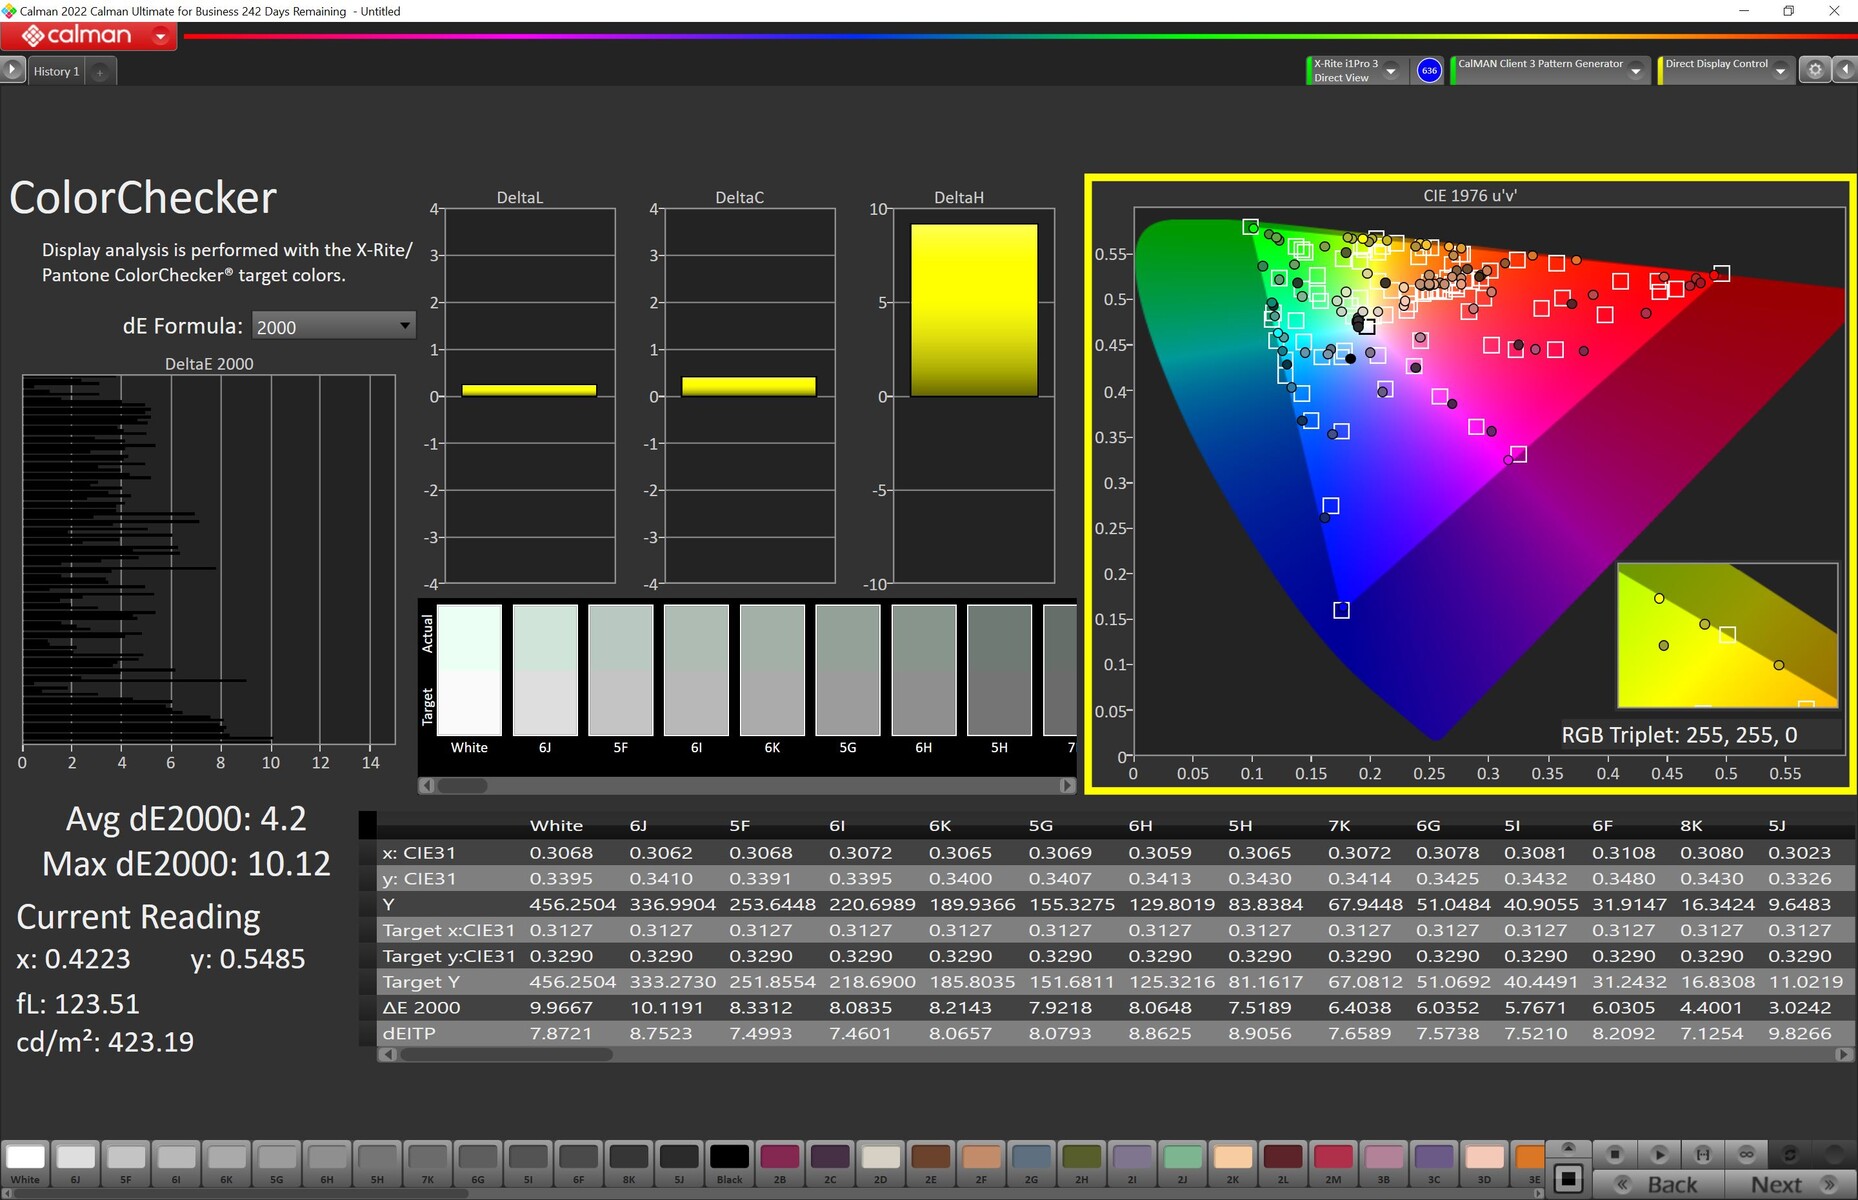
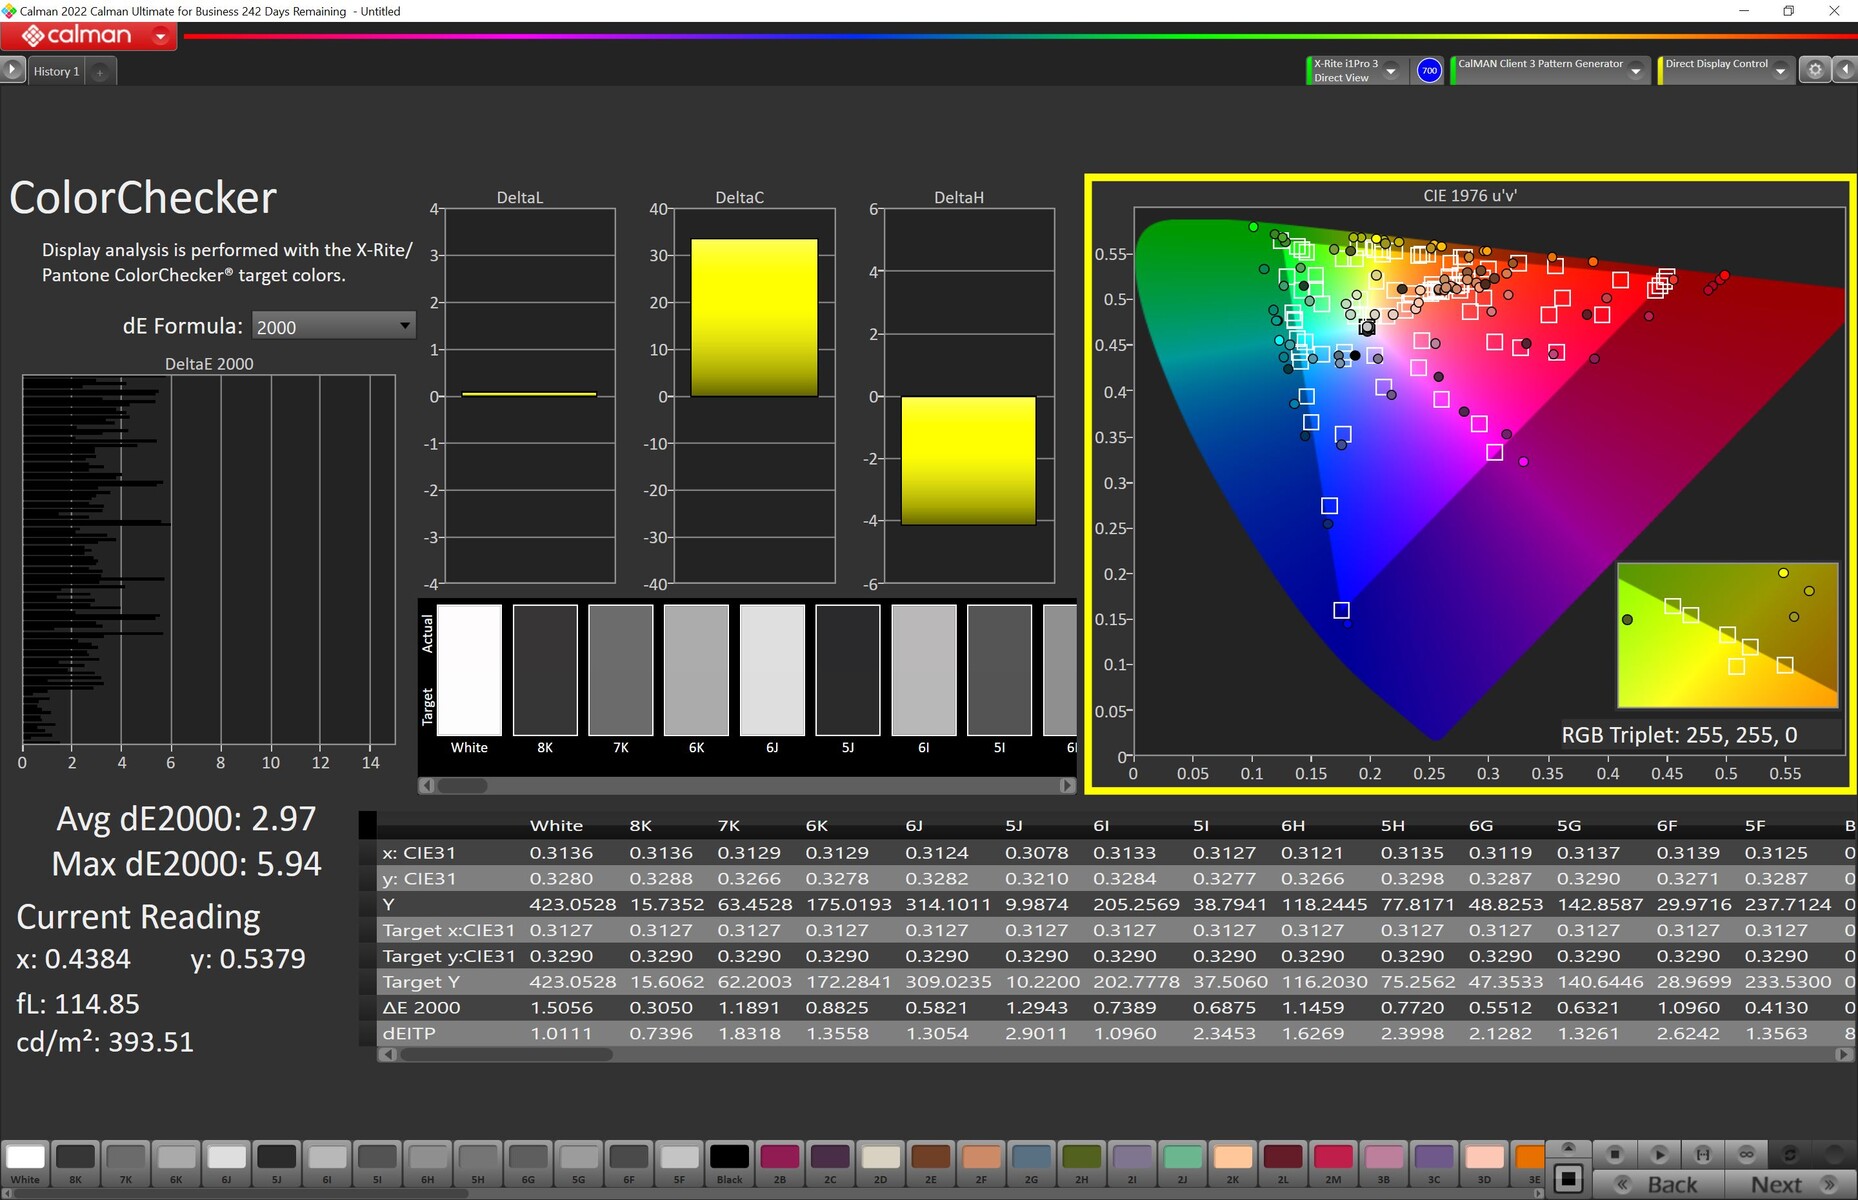
ΔE ColorChecker Calman: 4.97 | ∀{0.5-29.43 Ø4.72}
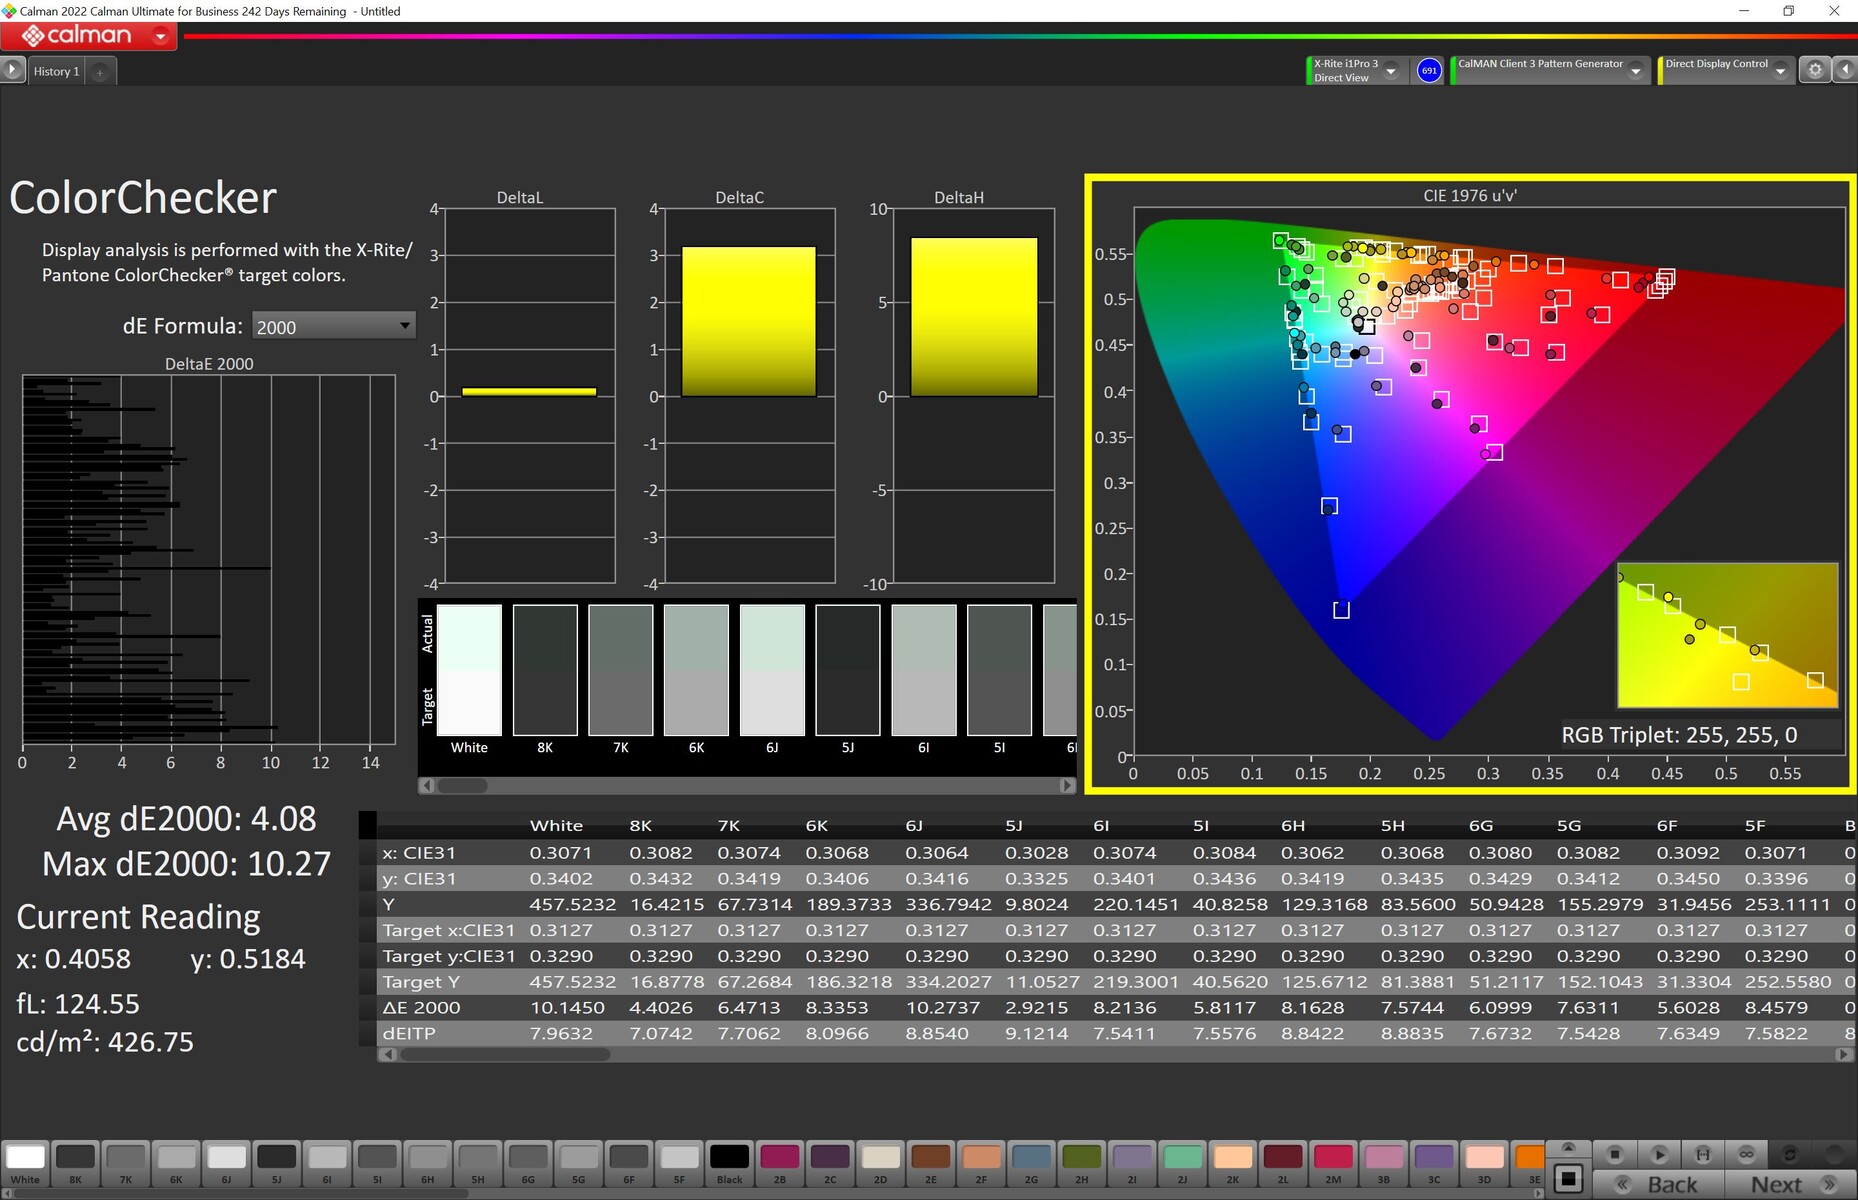
calibrated: 2.97
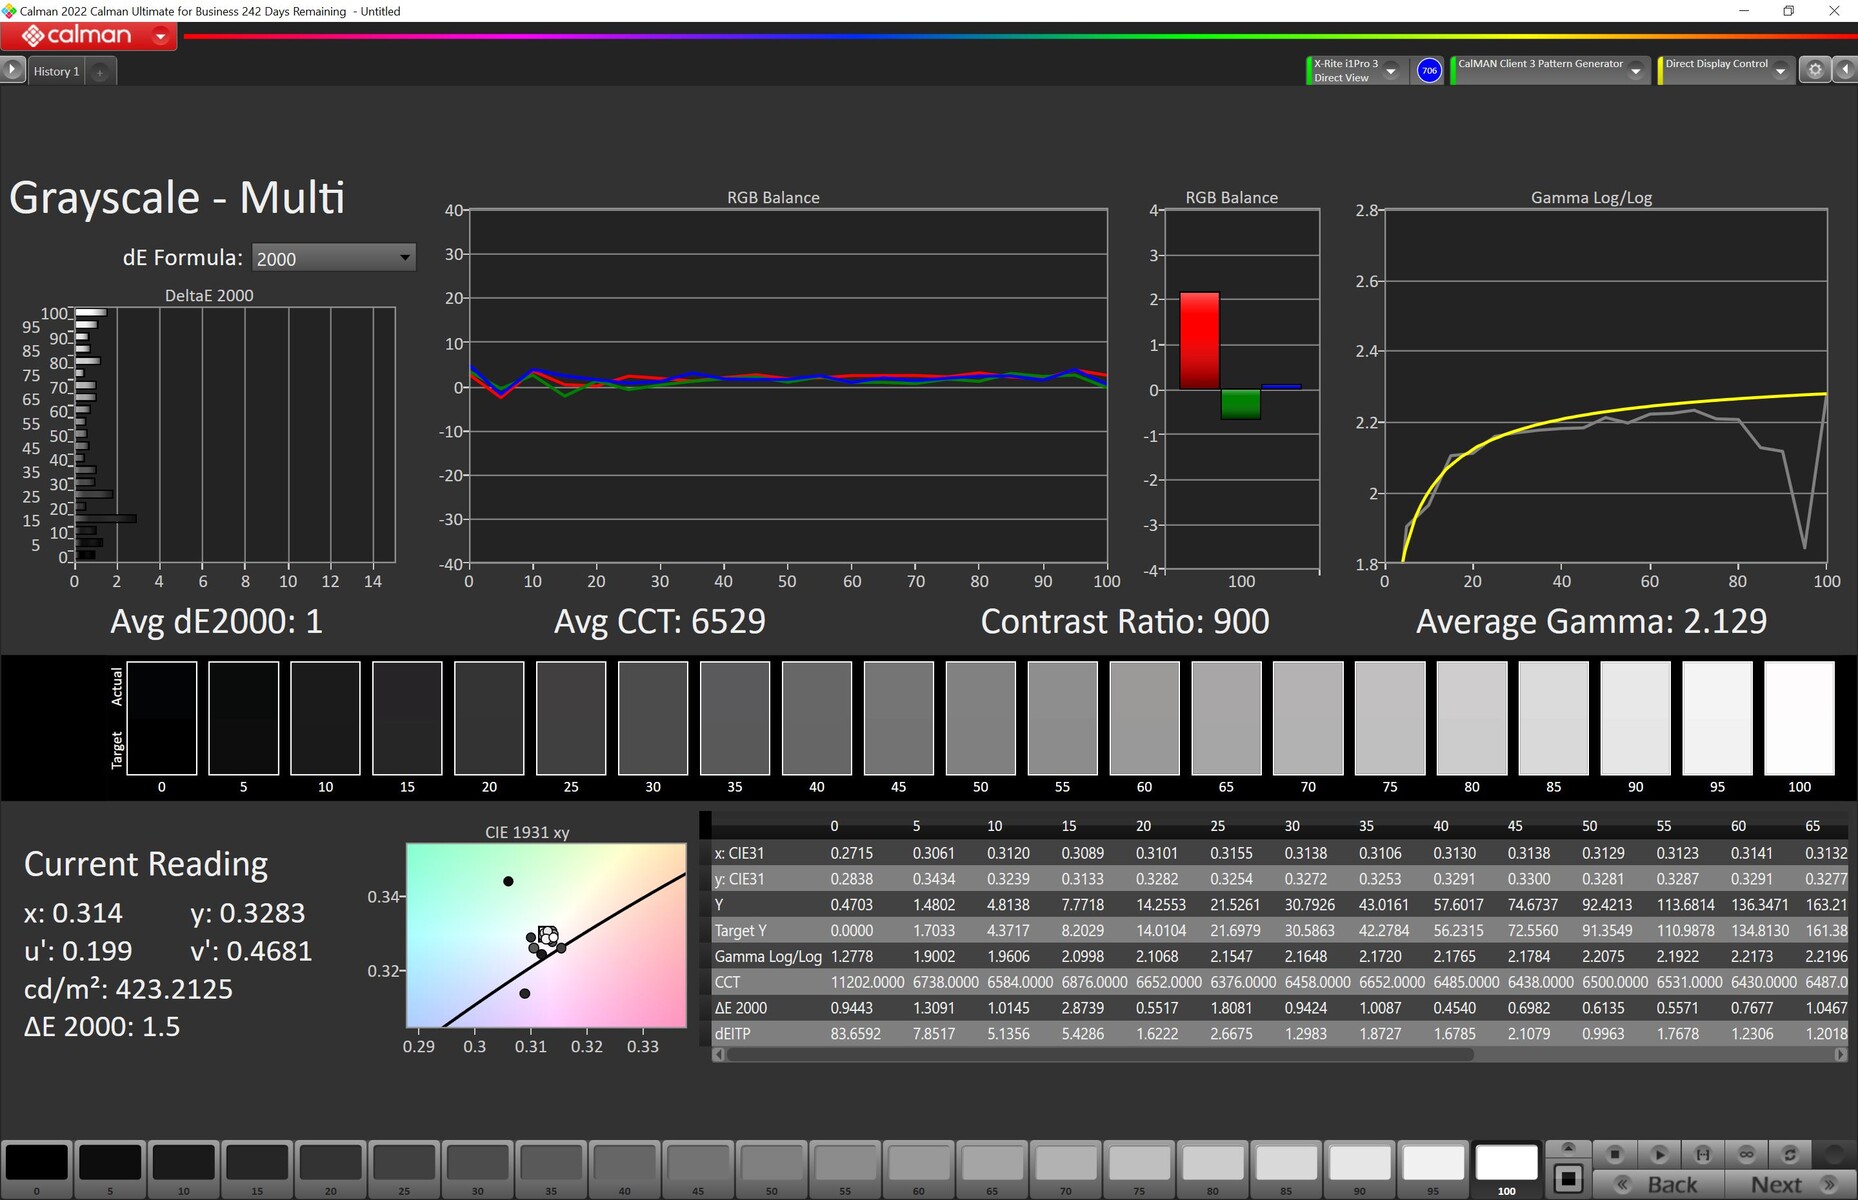
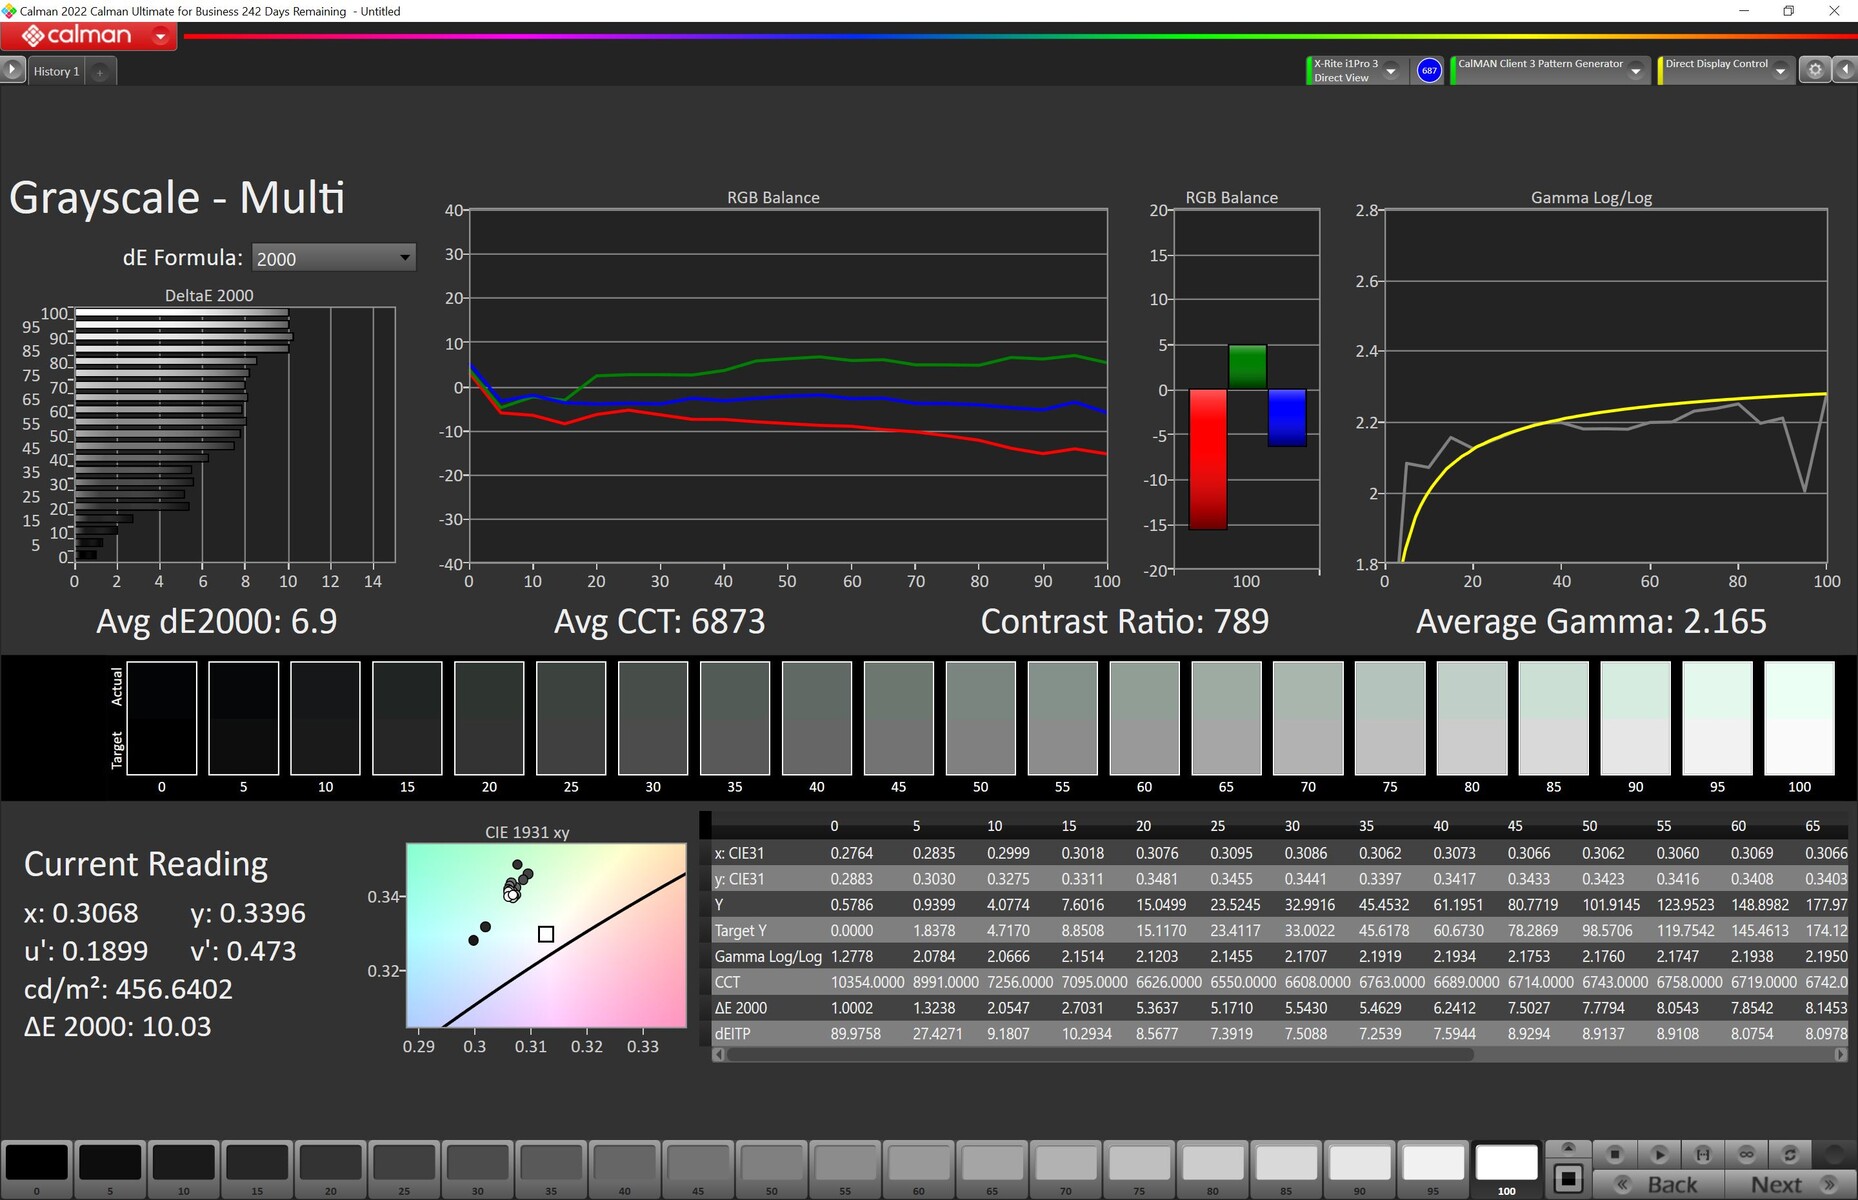
ΔE Greyscale Calman: 7.2 | ∀{0.09-98 Ø4.97}
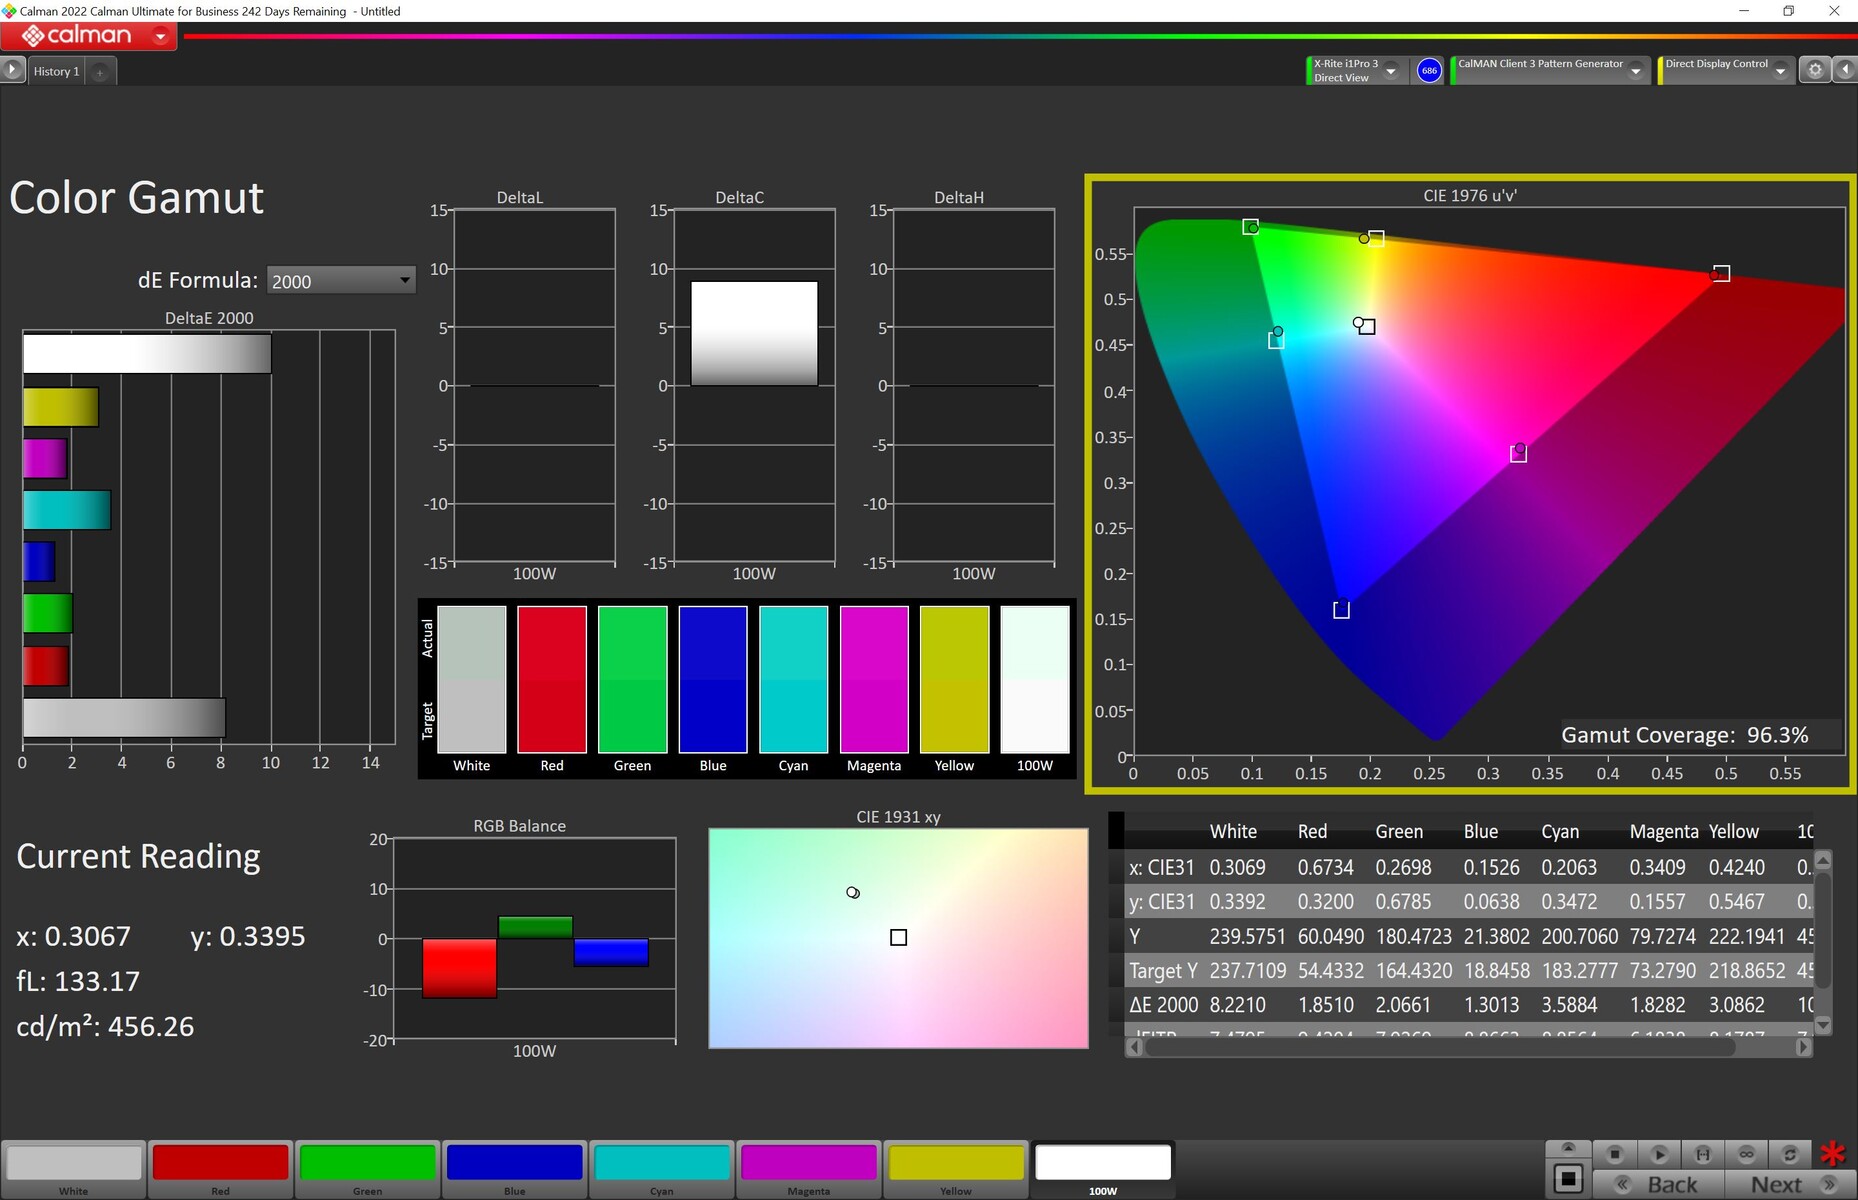
100% sRGB (Calman 2D)
84.9% AdobeRGB 1998 (Argyll 3D)
99.9% sRGB (Argyll 3D)
97.2% Display P3 (Argyll 3D)
Gamma: 2.161
CCT: 6515 K
| Asus ROG Strix Scar 18 2023 G834JY-N6005W NE180QDM-NZ2, IPS, 2560x1600, 18" | Razer Blade 18 RTX 4070 AU Optronics B180QAN01.0, IPS, 2560x1600, 18" | MSI Titan GT77 HX 13VI B173ZAN06.C, Mini-LED, 3840x2160, 17.3" | Asus ROG Strix Scar 17 SE G733CX-LL014W NE173QHM-NZ2, IPS, 2560x1440, 17.3" | |
|---|---|---|---|---|
| Display | 0% | 2% | 0% | |
| Display P3 Coverage (%) | 97.2 | 96.9 0% | 94.9 -2% | 97.1 0% |
| sRGB Coverage (%) | 99.9 | 99.8 0% | 99.9 0% | 99.9 0% |
| AdobeRGB 1998 Coverage (%) | 84.9 | 85.3 0% | 92.4 9% | 84.8 0% |
| Response Times | 15% | -410% | -11% | |
| Response Time Grey 50% / Grey 80% * (ms) | 5.41 ? | 4.2 ? 22% | 38.4 ? -610% | 5.7 ? -5% |
| Response Time Black / White * (ms) | 8.62 ? | 8 ? 7% | 26.6 ? -209% | 10.1 ? -17% |
| PWM Frequency (Hz) | 2380 ? | |||
| Screen | 22% | 74253% | 29% | |
| Brightness middle (cd/m²) | 490 | 549.6 12% | 606 24% | 320 -35% |
| Brightness (cd/m²) | 468 | 524 12% | 602 29% | 303 -35% |
| Brightness Distribution (%) | 86 | 89 3% | 93 8% | 87 1% |
| Black Level * (cd/m²) | 0.54 | 0.53 2% | 0.0001 100% | 0.3 44% |
| Contrast (:1) | 907 | 1037 14% | 6060000 668037% | 1067 18% |
| Colorchecker dE 2000 * | 4.97 | 3.32 33% | 4.8 3% | 1.1 78% |
| Colorchecker dE 2000 max. * | 11.02 | 6.63 40% | 8.2 26% | 2.7 75% |
| Colorchecker dE 2000 calibrated * | 2.97 | 2.7 9% | 1.8 39% | |
| Greyscale dE 2000 * | 7.2 | 2 72% | 6.5 10% | 1.1 85% |
| Gamma | 2.161 102% | 2.29 96% | 2.63 84% | 2.13 103% |
| CCT | 6515 100% | 6319 103% | 6596 99% | 6599 98% |
| Totalt genomsnitt (program/inställningar) | 12% /
16% | 24615% /
47676% | 6% /
16% |
* ... mindre är bättre
Det uppmätta färgutrymmet täcker Display-P3-färgutrymmet till 97 % och är därför också lämpligt för krävande uppgifter (efter en kalibrering). När det gäller färgnoggrannhet beror resultatet på vilken förinställning som används. I Armory Crate-verktyget erbjuder Asus fyra olika lägen under GameVisual: Native, sRGB, DCI-P3 och Display P3. I läget Native hade skärmen på vår testenhet en lätt märkbar och mätbar blå nyans som också manifesterades som ett ΔE-värde på nästan 5. Efter kalibrering med vår i1Pro 3 uppnådde vi ett betydligt bättre resultat - särskilt också i de extrema värdena. Efter kalibreringen lämpar sig skärmen även för bildbehandling.

I NE180QDM-NZ2-panelen som används här styrs inte skärmens ljusstyrka via PWM, och vi märkte inget flimmer med vår mätutrustning (på alla ljusstyrkor). Vi kunde bekräfta den utlovade svarstiden på 3 ms under gråtonbytena. För att uppnå detta använder Asus en minimal överstyrning, men vi märkte inga negativa effekter. I kombination med uppdateringsfrekvensen på 240 Hz är skärmen därför idealisk för spel.
Visa svarstider
| ↔ Svarstid svart till vitt | ||
|---|---|---|
| 8.62 ms ... stiga ↗ och falla ↘ kombinerat | ↗ 3.68 ms stiga | 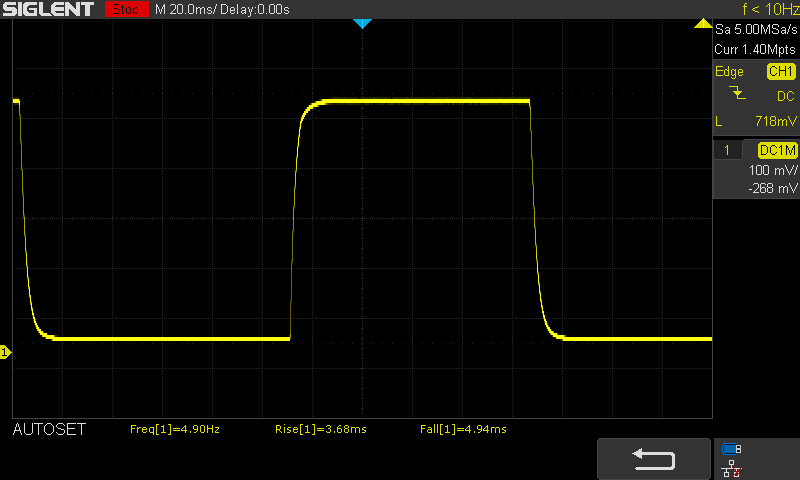 |
| ↘ 4.94 ms hösten | ||
| Skärmen visar snabba svarsfrekvenser i våra tester och bör passa för spel. I jämförelse sträcker sig alla testade enheter från 0.1 (minst) till 240 (maximalt) ms. » 24 % av alla enheter är bättre. Det betyder att den uppmätta svarstiden är bättre än genomsnittet av alla testade enheter (19.8 ms). | ||
| ↔ Svarstid 50 % grått till 80 % grått | ||
| 5.41 ms ... stiga ↗ och falla ↘ kombinerat | ↗ 2.57 ms stiga | 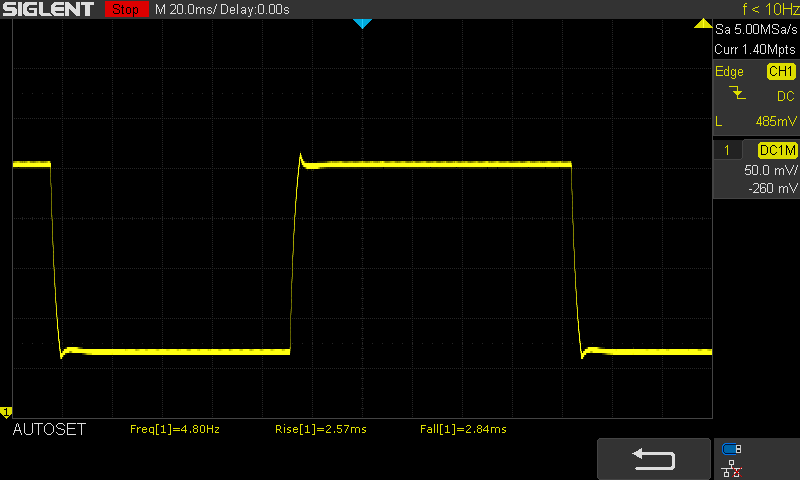 |
| ↘ 2.84 ms hösten | ||
| Skärmen visar väldigt snabba svarsfrekvenser i våra tester och borde vara mycket väl lämpad för fartfyllt spel. I jämförelse sträcker sig alla testade enheter från 0.165 (minst) till 636 (maximalt) ms. » 18 % av alla enheter är bättre. Det betyder att den uppmätta svarstiden är bättre än genomsnittet av alla testade enheter (31 ms). | ||
Skärmflimmer / PWM (Puls-Width Modulation)
| Skärmflimmer / PWM upptäcktes inte |  | ||
Som jämförelse: 52 % av alla testade enheter använder inte PWM för att dämpa skärmen. Om PWM upptäcktes mättes ett medelvärde av 7772 (minst: 5 - maximum: 343500) Hz. | |||
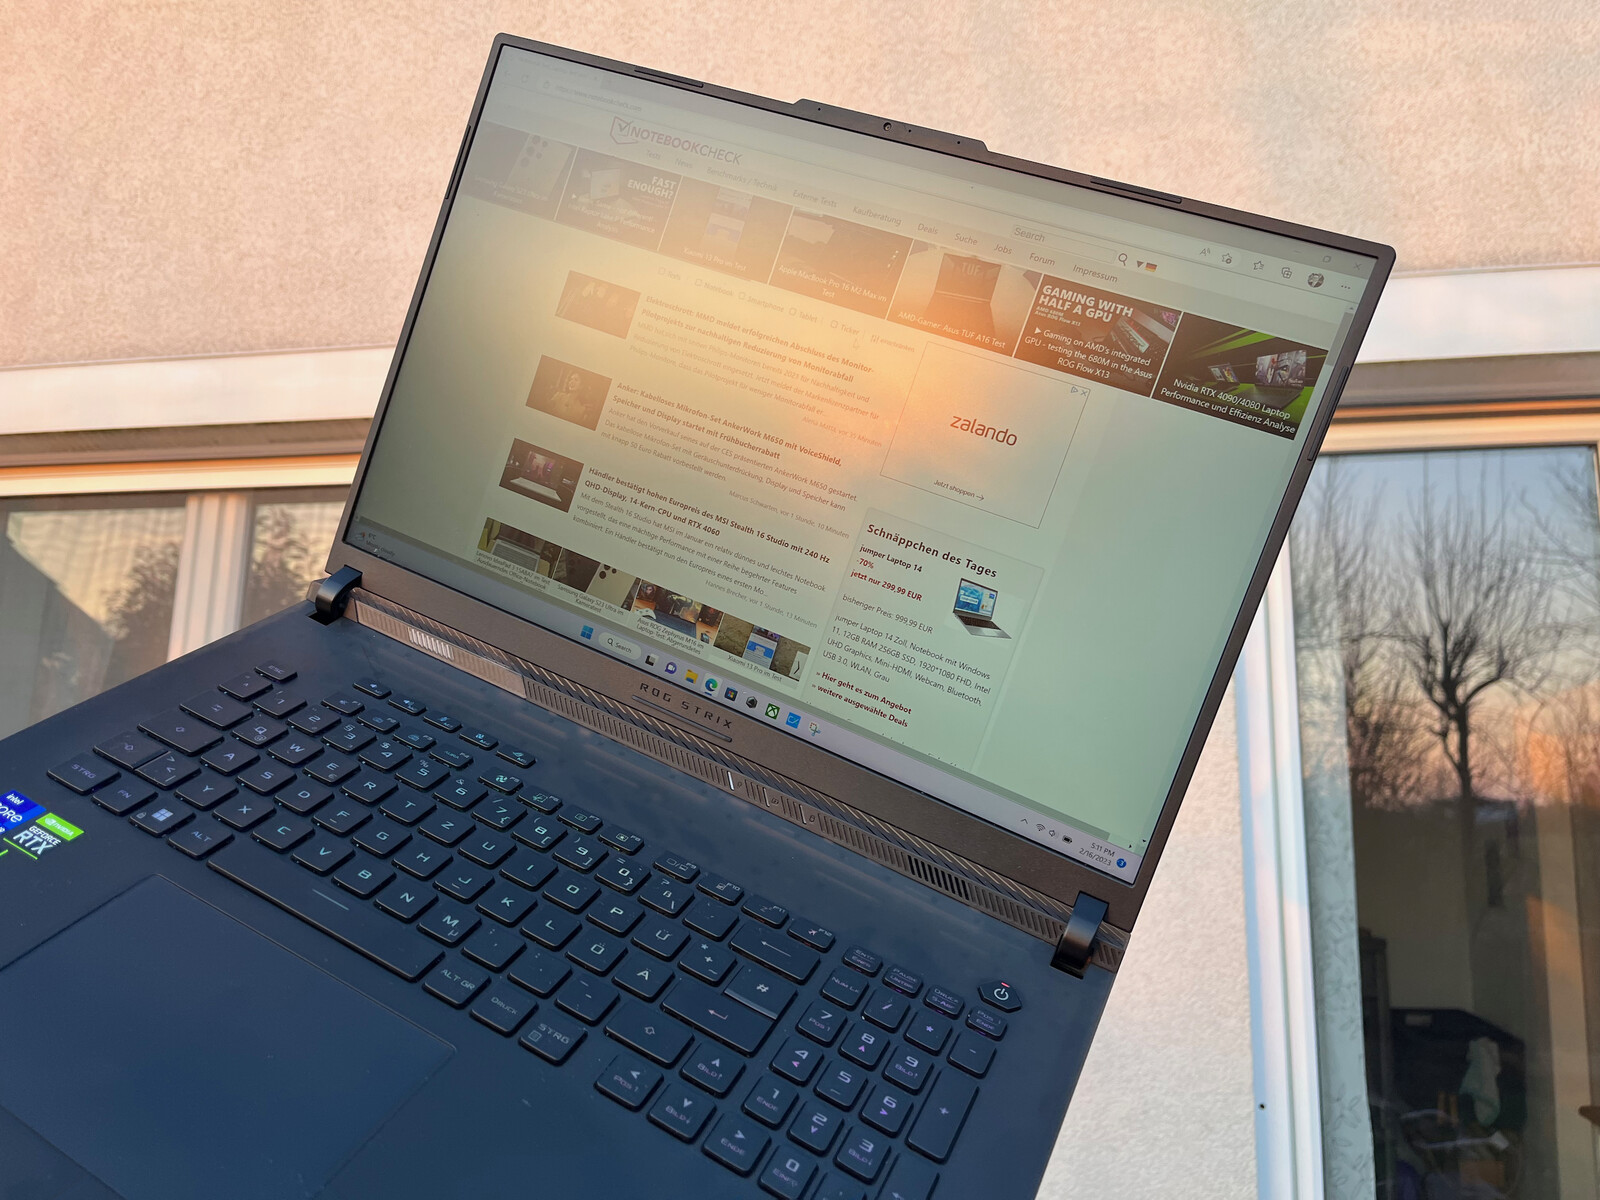
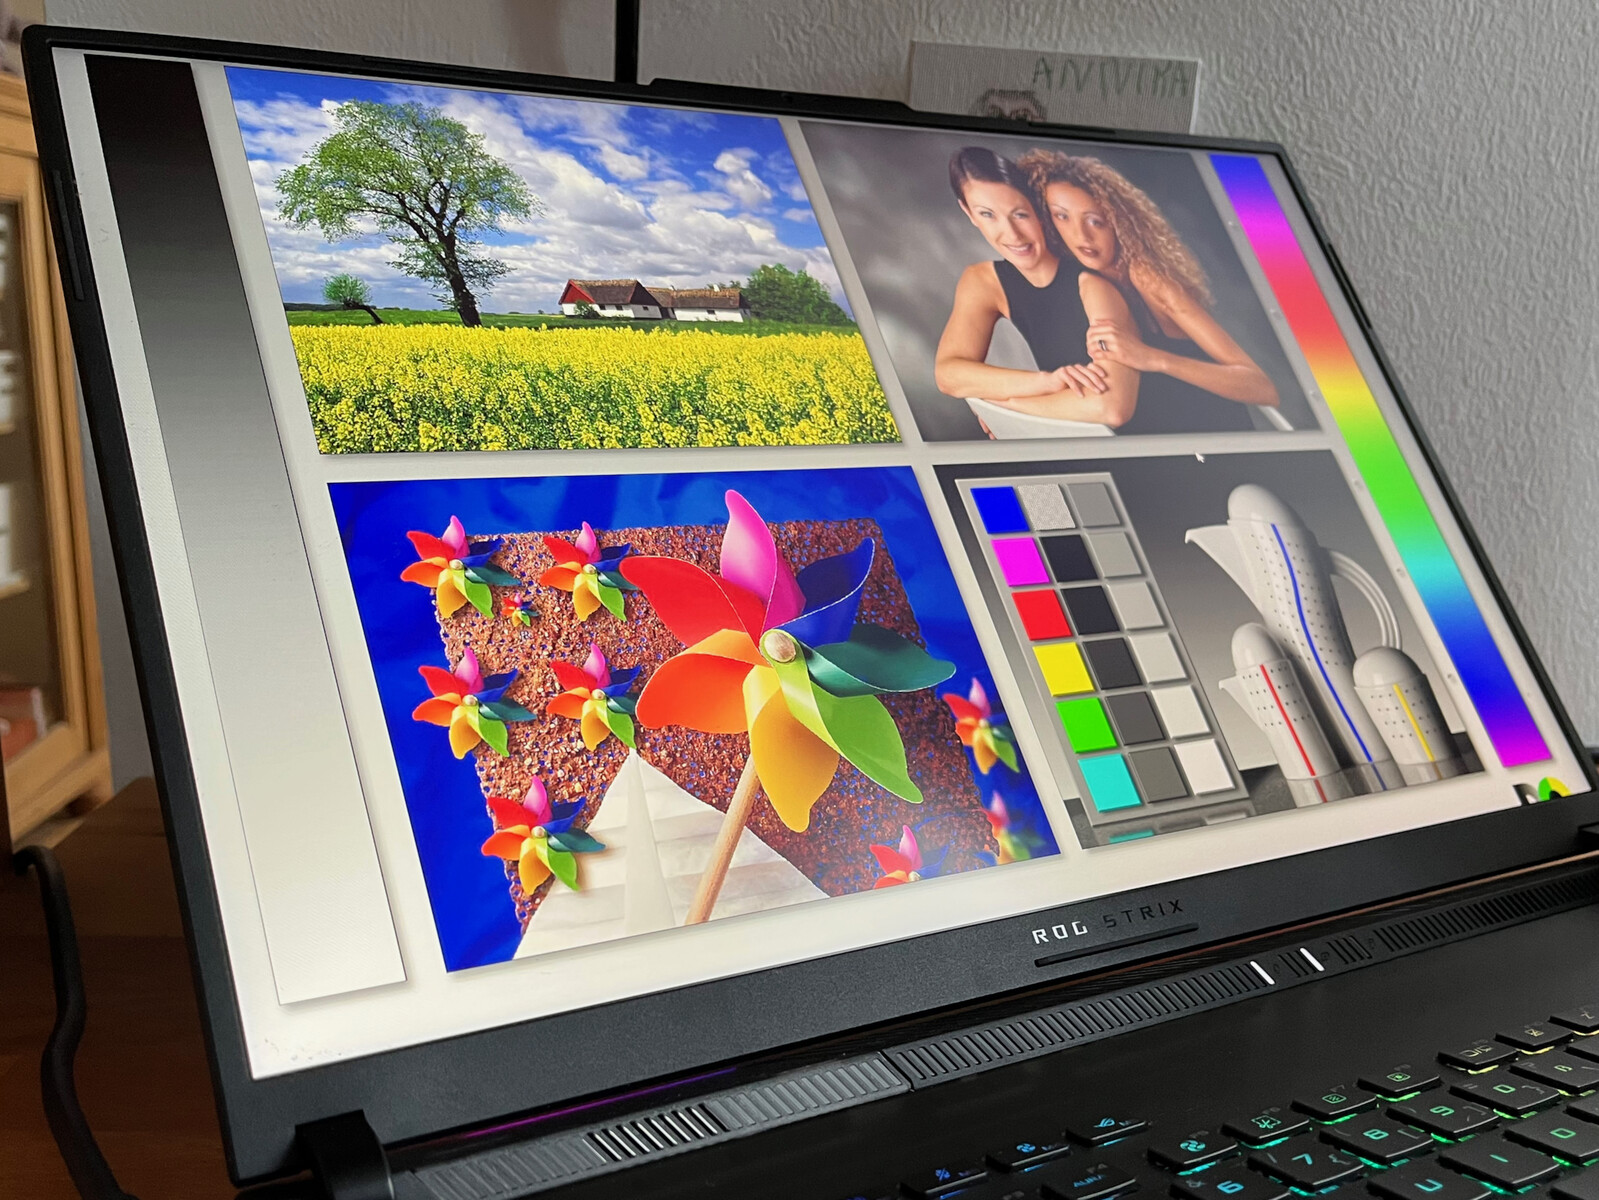
Tack vare den matta skärmytan och den goda maximala ljusstyrkan kan ROG Strix Scar 18 teoretiskt sett även användas utomhus. Även om nästan 500 nits är otillräckliga för den skarpa sommarsolen räcker de fullt ut i skuggan eller kvällssolen som på vår bild.
Tack vare IPS-panelen är betraktningsvinklarna utmärkta. Ljusförlusten från branta betraktningsvinklar håller sig inom gränserna, och färgförvrängningar är inte märkbara subjektivt sett.

Prestanda
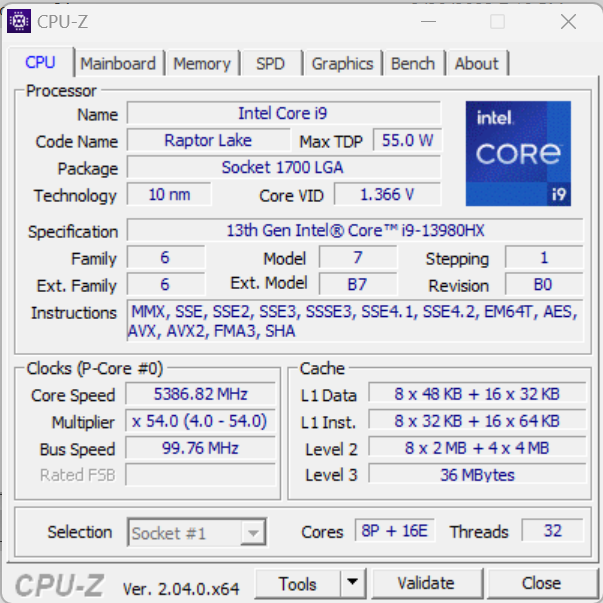
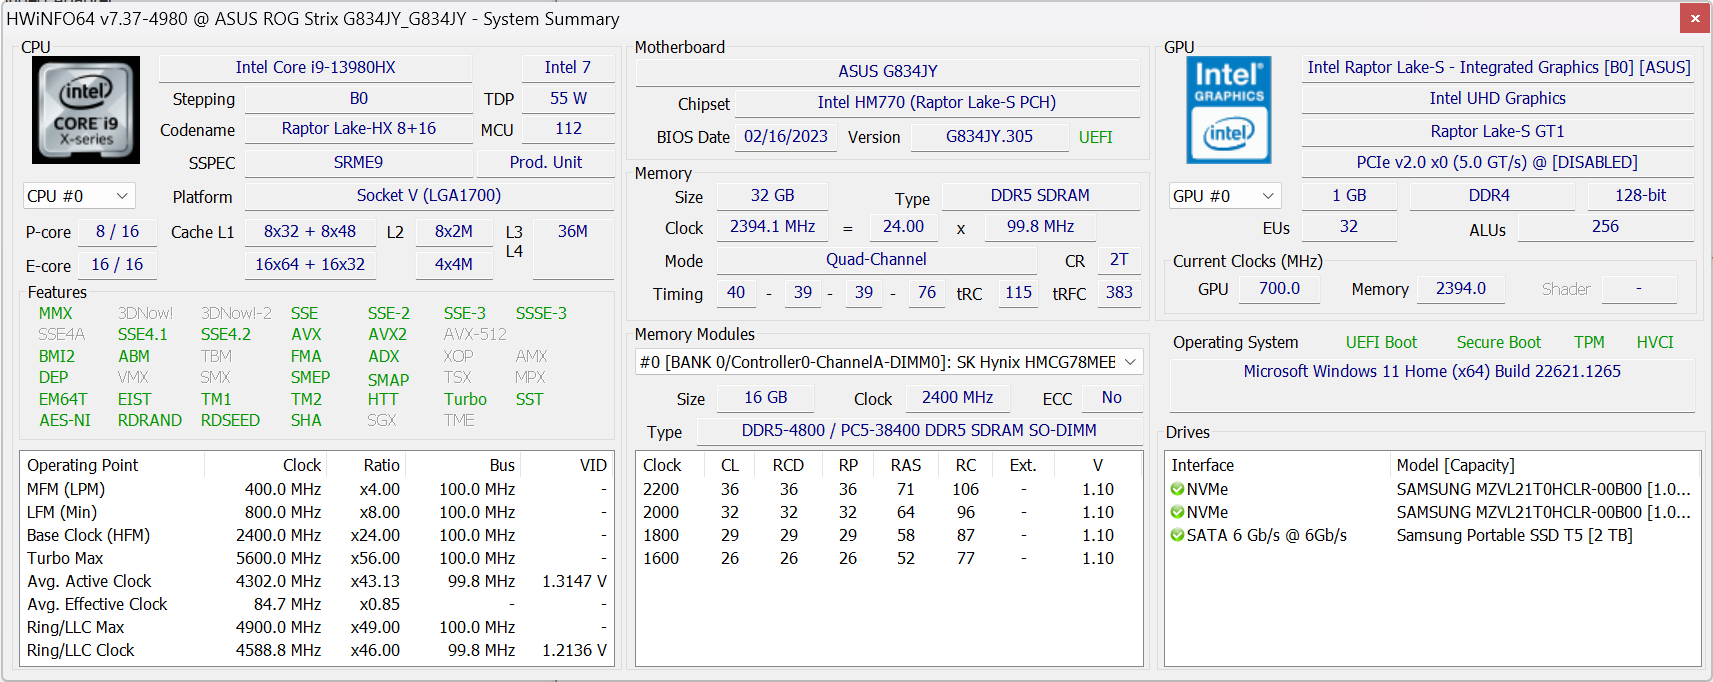
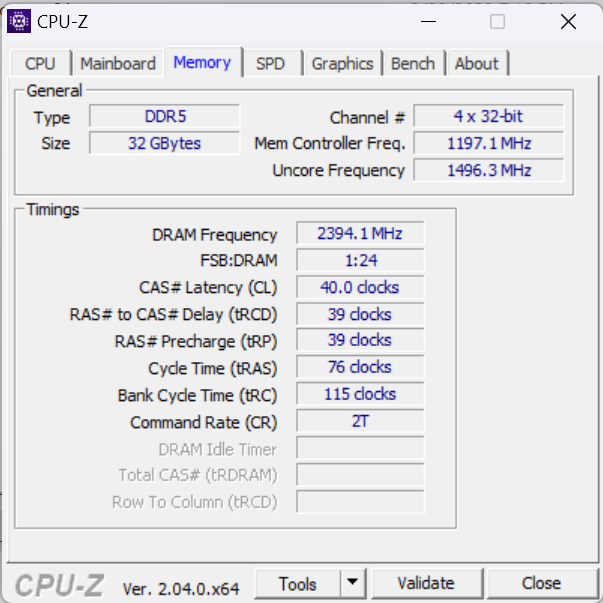
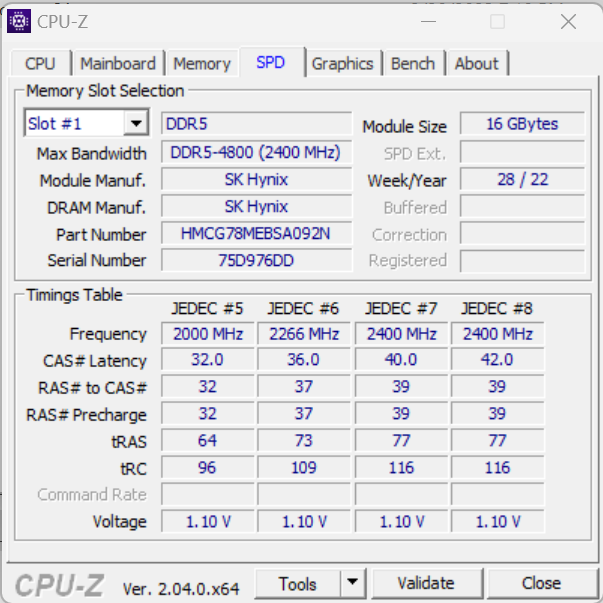
Vår testenhet av Scar 18 kan göra flera poäng i prestandamätningarna. Asus använder det för närvarande snabbaste mobila grafikkortet, GeForce RTX 4090, vilket också möjliggör en maximal strömförbrukning på 175 watt. Asus har inte heller sparat på processorn och använder den mobila toppmodellen från Intel. DenIntel Core i9-13980HXär baserad på den nya Raptor Lake-serien och erbjuder 24 kärnor och en maximal boost på avsevärda 5,6 GHz. Lagringsmängden är också ansenlig med 32 GB DDR5 RAM-minne. Lagringshastigheten är dock med 4800 MB/s något lägre än i vissa modeller från konkurrenterna. Slutligen finns det också två SSD-enheter på 1 TB i ett RAID-0-system.
Testförhållanden
Vi körde våra prestandatester i Turbo-läge och Ultimate GPU-läge. Med detta är RTX 4090-anslutningen fixerad via MUX och överklockad minimalt med 50 MHz. Dessutom testade vi även prestandaläget (standardläge i leveranstillstånd) och Standard GPU-läge (MSHybrid Optimus-omkoppling).
Processor
TheIntel Core i9-13980HX är Intels nuvarande toppmodell för bärbara datorer. Den är baserad på den nya Raptor Lake-serien och är tekniskt sett jämförbar med Core i9-13900K-processor för stationära datorer. Processorn innehåller 8 Raptor Cove Performance-kärnor med Hyper-Threading och en klockfrekvens på upp till 5,6 GHz. De mindre Gracemont Efficiency-kärnorna erbjuder inte Hyper-Threading och har en klockfrekvens på upp till 4 GHz. Sammantaget kan CPU:n använda 32 MB nivå 2-cache och anges av Intel till 157 watt (PL2) och 55 watt (PL1) TDP. Asus anger att CPU:n går på 65 watt (PL1), men PL1- och PL2-värdena i HWInfo64 visar 175 watt. I riktmärkena börjar processorn med 175 watt och stöter sedan på den termiska gränsen vid 96 °C (205 °F), varefter TDP sänks till 135 watt. I Silent mode sänks TDP till 100 W / 65 W, vilket också leder till en betydligt sämre prestanda.
I våra processorjämförelser kan i9-13980HX i ROG Strix 18 också placera sig knappt före konkurrenternas CPU:er 13900HX och 13950HX. Detta gäller dock endast för turboläget, och i prestandaläget placerar sig Strix Scar 18 endast i mitten av fältet av de nya 13000HX-processorerna. Men även då överträffas de äldre enheterna med i9-12950HX-processorer fortfarande klart.
Cinebench R15 Multi Constant Load Test
Cinebench R23: Multi Core | Single Core
Cinebench R20: CPU (Multi Core) | CPU (Single Core)
Cinebench R15: CPU Multi 64Bit | CPU Single 64Bit
Blender: v2.79 BMW27 CPU
7-Zip 18.03: 7z b 4 | 7z b 4 -mmt1
Geekbench 5.5: Multi-Core | Single-Core
HWBOT x265 Benchmark v2.2: 4k Preset
LibreOffice : 20 Documents To PDF
R Benchmark 2.5: Overall mean
| CPU Performance rating | |
| Intel Core i9-13900K @253W | |
| Intel NUC13 Raptor Canyon | |
| Asus ROG Strix Scar 18 2023 G834JY-N6005W | |
| MSI Titan GT77 HX 13VI | |
| Lenovo Legion Pro 7 16IRX8H | |
| Genomsnitt Intel Core i9-13980HX | |
| Razer Blade 18 RTX 4070 | |
| Schenker XMG Neo 16 Raptor Lake | |
| Asus ROG Strix Scar 18 2023 G834JY-N6005W | |
| Razer Blade 16 Early 2023 | |
| Genomsnitt av klass Gaming | |
| MSI Raider GE77 HX 12UHS | |
| Asus ROG Strix Scar 17 SE G733CX-LL014W | |
| Dell Precision 7000 7670 Performance | |
| Cinebench R23 / Multi Core | |
| Intel Core i9-13900K @253W | |
| MSI Titan GT77 HX 13VI | |
| Intel NUC13 Raptor Canyon | |
| Asus ROG Strix Scar 18 2023 G834JY-N6005W | |
| Genomsnitt Intel Core i9-13980HX (28301 - 33052, n=11) | |
| Lenovo Legion Pro 7 16IRX8H | |
| Schenker XMG Neo 16 Raptor Lake | |
| Schenker XMG Neo 16 Raptor Lake | |
| Schenker XMG Neo 16 Raptor Lake | |
| Razer Blade 18 RTX 4070 | |
| Asus ROG Strix Scar 18 2023 G834JY-N6005W | |
| Razer Blade 16 Early 2023 | |
| Genomsnitt av klass Gaming (10488 - 40970, n=111, senaste 2 åren) | |
| MSI Raider GE77 HX 12UHS | |
| Asus ROG Strix Scar 17 SE G733CX-LL014W | |
| Dell Precision 7000 7670 Performance | |
| Cinebench R23 / Single Core | |
| Intel Core i9-13900K @253W | |
| Intel NUC13 Raptor Canyon | |
| Asus ROG Strix Scar 18 2023 G834JY-N6005W | |
| MSI Titan GT77 HX 13VI | |
| Asus ROG Strix Scar 18 2023 G834JY-N6005W | |
| Genomsnitt Intel Core i9-13980HX (1825 - 2169, n=9) | |
| Razer Blade 18 RTX 4070 | |
| Schenker XMG Neo 16 Raptor Lake | |
| Lenovo Legion Pro 7 16IRX8H | |
| Razer Blade 16 Early 2023 | |
| Genomsnitt av klass Gaming (1166 - 2356, n=111, senaste 2 åren) | |
| MSI Raider GE77 HX 12UHS | |
| Asus ROG Strix Scar 17 SE G733CX-LL014W | |
| Dell Precision 7000 7670 Performance | |
| Cinebench R20 / CPU (Multi Core) | |
| Intel Core i9-13900K @253W | |
| Intel NUC13 Raptor Canyon | |
| MSI Titan GT77 HX 13VI | |
| Asus ROG Strix Scar 18 2023 G834JY-N6005W | |
| Genomsnitt Intel Core i9-13980HX (10353 - 12437, n=10) | |
| Lenovo Legion Pro 7 16IRX8H | |
| Schenker XMG Neo 16 Raptor Lake | |
| Razer Blade 18 RTX 4070 | |
| Asus ROG Strix Scar 18 2023 G834JY-N6005W | |
| Genomsnitt av klass Gaming (4029 - 16108, n=110, senaste 2 åren) | |
| MSI Raider GE77 HX 12UHS | |
| Razer Blade 16 Early 2023 | |
| Asus ROG Strix Scar 17 SE G733CX-LL014W | |
| Dell Precision 7000 7670 Performance | |
| Cinebench R20 / CPU (Single Core) | |
| Intel Core i9-13900K @253W | |
| Intel NUC13 Raptor Canyon | |
| Asus ROG Strix Scar 18 2023 G834JY-N6005W | |
| MSI Titan GT77 HX 13VI | |
| Asus ROG Strix Scar 18 2023 G834JY-N6005W | |
| Razer Blade 18 RTX 4070 | |
| Genomsnitt Intel Core i9-13980HX (717 - 825, n=10) | |
| Lenovo Legion Pro 7 16IRX8H | |
| Genomsnitt av klass Gaming (442 - 895, n=110, senaste 2 åren) | |
| Schenker XMG Neo 16 Raptor Lake | |
| MSI Raider GE77 HX 12UHS | |
| Razer Blade 16 Early 2023 | |
| Asus ROG Strix Scar 17 SE G733CX-LL014W | |
| Dell Precision 7000 7670 Performance | |
| Cinebench R15 / CPU Multi 64Bit | |
| Intel Core i9-13900K @253W | |
| Intel NUC13 Raptor Canyon | |
| MSI Titan GT77 HX 13VI | |
| Schenker XMG Neo 16 Raptor Lake | |
| Schenker XMG Neo 16 Raptor Lake | |
| Lenovo Legion Pro 7 16IRX8H | |
| Asus ROG Strix Scar 18 2023 G834JY-N6005W | |
| Genomsnitt Intel Core i9-13980HX (4358 - 5172, n=11) | |
| Razer Blade 16 Early 2023 | |
| Razer Blade 18 RTX 4070 | |
| Asus ROG Strix Scar 18 2023 G834JY-N6005W | |
| Genomsnitt av klass Gaming (1578 - 6271, n=109, senaste 2 åren) | |
| MSI Raider GE77 HX 12UHS | |
| Asus ROG Strix Scar 17 SE G733CX-LL014W | |
| Dell Precision 7000 7670 Performance | |
| Cinebench R15 / CPU Single 64Bit | |
| Intel Core i9-13900K @253W | |
| Intel NUC13 Raptor Canyon | |
| Asus ROG Strix Scar 18 2023 G834JY-N6005W | |
| Asus ROG Strix Scar 18 2023 G834JY-N6005W | |
| Genomsnitt Intel Core i9-13980HX (289 - 312, n=11) | |
| Lenovo Legion Pro 7 16IRX8H | |
| MSI Titan GT77 HX 13VI | |
| Razer Blade 18 RTX 4070 | |
| Schenker XMG Neo 16 Raptor Lake | |
| Schenker XMG Neo 16 Raptor Lake | |
| Genomsnitt av klass Gaming (188.8 - 343, n=110, senaste 2 åren) | |
| MSI Raider GE77 HX 12UHS | |
| Asus ROG Strix Scar 17 SE G733CX-LL014W | |
| Razer Blade 16 Early 2023 | |
| Dell Precision 7000 7670 Performance | |
| Blender / v2.79 BMW27 CPU | |
| Dell Precision 7000 7670 Performance | |
| Asus ROG Strix Scar 17 SE G733CX-LL014W | |
| Genomsnitt av klass Gaming (80 - 330, n=108, senaste 2 åren) | |
| MSI Raider GE77 HX 12UHS | |
| Razer Blade 16 Early 2023 | |
| Asus ROG Strix Scar 18 2023 G834JY-N6005W | |
| Schenker XMG Neo 16 Raptor Lake | |
| Razer Blade 18 RTX 4070 | |
| Genomsnitt Intel Core i9-13980HX (97 - 136, n=10) | |
| Lenovo Legion Pro 7 16IRX8H | |
| Asus ROG Strix Scar 18 2023 G834JY-N6005W | |
| Intel NUC13 Raptor Canyon | |
| MSI Titan GT77 HX 13VI | |
| Intel Core i9-13900K @253W | |
| 7-Zip 18.03 / 7z b 4 | |
| Intel Core i9-13900K @253W | |
| MSI Titan GT77 HX 13VI | |
| Intel NUC13 Raptor Canyon | |
| Asus ROG Strix Scar 18 2023 G834JY-N6005W | |
| Lenovo Legion Pro 7 16IRX8H | |
| Schenker XMG Neo 16 Raptor Lake | |
| Genomsnitt Intel Core i9-13980HX (104616 - 129804, n=10) | |
| Razer Blade 18 RTX 4070 | |
| Asus ROG Strix Scar 18 2023 G834JY-N6005W | |
| Razer Blade 16 Early 2023 | |
| Genomsnitt av klass Gaming (33491 - 148086, n=109, senaste 2 åren) | |
| MSI Raider GE77 HX 12UHS | |
| Asus ROG Strix Scar 17 SE G733CX-LL014W | |
| Dell Precision 7000 7670 Performance | |
| 7-Zip 18.03 / 7z b 4 -mmt1 | |
| Intel Core i9-13900K @253W | |
| Intel NUC13 Raptor Canyon | |
| Asus ROG Strix Scar 18 2023 G834JY-N6005W | |
| Lenovo Legion Pro 7 16IRX8H | |
| Asus ROG Strix Scar 18 2023 G834JY-N6005W | |
| Genomsnitt Intel Core i9-13980HX (6230 - 7163, n=10) | |
| MSI Titan GT77 HX 13VI | |
| Razer Blade 18 RTX 4070 | |
| Schenker XMG Neo 16 Raptor Lake | |
| Razer Blade 16 Early 2023 | |
| Genomsnitt av klass Gaming (4199 - 7436, n=109, senaste 2 åren) | |
| MSI Raider GE77 HX 12UHS | |
| Asus ROG Strix Scar 17 SE G733CX-LL014W | |
| Dell Precision 7000 7670 Performance | |
| Geekbench 5.5 / Multi-Core | |
| Intel Core i9-13900K @253W | |
| Intel NUC13 Raptor Canyon | |
| Lenovo Legion Pro 7 16IRX8H | |
| Asus ROG Strix Scar 18 2023 G834JY-N6005W | |
| Schenker XMG Neo 16 Raptor Lake | |
| MSI Titan GT77 HX 13VI | |
| Genomsnitt Intel Core i9-13980HX (18475 - 22200, n=10) | |
| Razer Blade 18 RTX 4070 | |
| Asus ROG Strix Scar 18 2023 G834JY-N6005W | |
| Razer Blade 16 Early 2023 | |
| Genomsnitt av klass Gaming (6460 - 27010, n=109, senaste 2 åren) | |
| MSI Raider GE77 HX 12UHS | |
| Asus ROG Strix Scar 17 SE G733CX-LL014W | |
| Dell Precision 7000 7670 Performance | |
| Geekbench 5.5 / Single-Core | |
| Intel Core i9-13900K @253W | |
| Asus ROG Strix Scar 18 2023 G834JY-N6005W | |
| Intel NUC13 Raptor Canyon | |
| Asus ROG Strix Scar 18 2023 G834JY-N6005W | |
| Genomsnitt Intel Core i9-13980HX (1796 - 2139, n=10) | |
| Genomsnitt av klass Gaming (986 - 2474, n=109, senaste 2 åren) | |
| MSI Titan GT77 HX 13VI | |
| Razer Blade 18 RTX 4070 | |
| Lenovo Legion Pro 7 16IRX8H | |
| Schenker XMG Neo 16 Raptor Lake | |
| MSI Raider GE77 HX 12UHS | |
| Dell Precision 7000 7670 Performance | |
| Asus ROG Strix Scar 17 SE G733CX-LL014W | |
| Razer Blade 16 Early 2023 | |
| HWBOT x265 Benchmark v2.2 / 4k Preset | |
| Intel Core i9-13900K @253W | |
| Intel NUC13 Raptor Canyon | |
| Asus ROG Strix Scar 18 2023 G834JY-N6005W | |
| MSI Titan GT77 HX 13VI | |
| Lenovo Legion Pro 7 16IRX8H | |
| Genomsnitt Intel Core i9-13980HX (27 - 33.4, n=9) | |
| Razer Blade 18 RTX 4070 | |
| Schenker XMG Neo 16 Raptor Lake | |
| Asus ROG Strix Scar 18 2023 G834JY-N6005W | |
| Razer Blade 16 Early 2023 | |
| Genomsnitt av klass Gaming (11.5 - 44.3, n=109, senaste 2 åren) | |
| MSI Raider GE77 HX 12UHS | |
| Asus ROG Strix Scar 17 SE G733CX-LL014W | |
| Dell Precision 7000 7670 Performance | |
| LibreOffice / 20 Documents To PDF | |
| Genomsnitt av klass Gaming (19 - 88.8, n=109, senaste 2 åren) | |
| Razer Blade 16 Early 2023 | |
| MSI Titan GT77 HX 13VI | |
| Schenker XMG Neo 16 Raptor Lake | |
| Lenovo Legion Pro 7 16IRX8H | |
| Dell Precision 7000 7670 Performance | |
| Razer Blade 18 RTX 4070 | |
| Genomsnitt Intel Core i9-13980HX (35 - 51.4, n=10) | |
| MSI Raider GE77 HX 12UHS | |
| Intel NUC13 Raptor Canyon | |
| Asus ROG Strix Scar 18 2023 G834JY-N6005W | |
| Asus ROG Strix Scar 18 2023 G834JY-N6005W | |
| Asus ROG Strix Scar 17 SE G733CX-LL014W | |
| Intel Core i9-13900K @253W | |
| R Benchmark 2.5 / Overall mean | |
| Dell Precision 7000 7670 Performance | |
| Genomsnitt av klass Gaming (0.3439 - 0.759, n=110, senaste 2 åren) | |
| Asus ROG Strix Scar 17 SE G733CX-LL014W | |
| MSI Raider GE77 HX 12UHS | |
| Razer Blade 16 Early 2023 | |
| MSI Titan GT77 HX 13VI | |
| Lenovo Legion Pro 7 16IRX8H | |
| Genomsnitt Intel Core i9-13980HX (0.3793 - 0.4462, n=10) | |
| Razer Blade 18 RTX 4070 | |
| Asus ROG Strix Scar 18 2023 G834JY-N6005W | |
| Intel NUC13 Raptor Canyon | |
| Schenker XMG Neo 16 Raptor Lake | |
| Asus ROG Strix Scar 18 2023 G834JY-N6005W | |
| Intel Core i9-13900K @253W | |
Cinebench R23: Multi Core | Single Core
Cinebench R20: CPU (Multi Core) | CPU (Single Core)
Cinebench R15: CPU Multi 64Bit | CPU Single 64Bit
Blender: v2.79 BMW27 CPU
7-Zip 18.03: 7z b 4 | 7z b 4 -mmt1
Geekbench 5.5: Multi-Core | Single-Core
HWBOT x265 Benchmark v2.2: 4k Preset
LibreOffice : 20 Documents To PDF
R Benchmark 2.5: Overall mean
* ... mindre är bättre
AIDA64: FP32 Ray-Trace | FPU Julia | CPU SHA3 | CPU Queen | FPU SinJulia | FPU Mandel | CPU AES | CPU ZLib | FP64 Ray-Trace | CPU PhotoWorxx
| Performance rating | |
| Intel Core i9-13900K @253W | |
| Intel NUC13 Raptor Canyon | |
| Asus ROG Strix Scar 18 2023 G834JY-N6005W | |
| MSI Titan GT77 HX 13VI | |
| Lenovo Legion Pro 7 16IRX8H | |
| Genomsnitt Intel Core i9-13980HX | |
| Schenker XMG Neo 16 Raptor Lake | |
| Razer Blade 18 RTX 4070 | |
| Genomsnitt av klass Gaming | |
| Asus ROG Strix Scar 18 2023 G834JY-N6005W | |
| Razer Blade 16 Early 2023 | |
| MSI Raider GE77 HX 12UHS | |
| Asus ROG Strix Scar 17 SE G733CX-LL014W | |
| Dell Precision 7000 7670 Performance | |
| AIDA64 / FP32 Ray-Trace | |
| Intel Core i9-13900K @253W | |
| Genomsnitt av klass Gaming (10227 - 85542, n=108, senaste 2 åren) | |
| MSI Titan GT77 HX 13VI | |
| Asus ROG Strix Scar 18 2023 G834JY-N6005W | |
| Intel NUC13 Raptor Canyon | |
| Schenker XMG Neo 16 Raptor Lake | |
| Lenovo Legion Pro 7 16IRX8H | |
| Genomsnitt Intel Core i9-13980HX (21332 - 29553, n=9) | |
| Razer Blade 18 RTX 4070 | |
| Razer Blade 16 Early 2023 | |
| Razer Blade 16 Early 2023 | |
| Razer Blade 16 Early 2023 | |
| Asus ROG Strix Scar 18 2023 G834JY-N6005W | |
| MSI Raider GE77 HX 12UHS | |
| Asus ROG Strix Scar 17 SE G733CX-LL014W | |
| Dell Precision 7000 7670 Performance | |
| AIDA64 / FPU Julia | |
| Intel Core i9-13900K @253W | |
| MSI Titan GT77 HX 13VI | |
| Intel NUC13 Raptor Canyon | |
| Asus ROG Strix Scar 18 2023 G834JY-N6005W | |
| Genomsnitt av klass Gaming (51376 - 238426, n=108, senaste 2 åren) | |
| Lenovo Legion Pro 7 16IRX8H | |
| Genomsnitt Intel Core i9-13980HX (108001 - 148168, n=9) | |
| Razer Blade 18 RTX 4070 | |
| Schenker XMG Neo 16 Raptor Lake | |
| Asus ROG Strix Scar 18 2023 G834JY-N6005W | |
| Razer Blade 16 Early 2023 | |
| Razer Blade 16 Early 2023 | |
| Razer Blade 16 Early 2023 | |
| MSI Raider GE77 HX 12UHS | |
| Asus ROG Strix Scar 17 SE G733CX-LL014W | |
| Dell Precision 7000 7670 Performance | |
| AIDA64 / CPU SHA3 | |
| Intel Core i9-13900K @253W | |
| MSI Titan GT77 HX 13VI | |
| Asus ROG Strix Scar 18 2023 G834JY-N6005W | |
| Intel NUC13 Raptor Canyon | |
| Lenovo Legion Pro 7 16IRX8H | |
| Schenker XMG Neo 16 Raptor Lake | |
| Genomsnitt Intel Core i9-13980HX (5264 - 7142, n=9) | |
| Razer Blade 16 Early 2023 | |
| Razer Blade 16 Early 2023 | |
| Razer Blade 16 Early 2023 | |
| Razer Blade 18 RTX 4070 | |
| Asus ROG Strix Scar 18 2023 G834JY-N6005W | |
| Genomsnitt av klass Gaming (2180 - 9817, n=108, senaste 2 åren) | |
| MSI Raider GE77 HX 12UHS | |
| Asus ROG Strix Scar 17 SE G733CX-LL014W | |
| Dell Precision 7000 7670 Performance | |
| AIDA64 / CPU Queen | |
| Intel Core i9-13900K @253W | |
| Intel NUC13 Raptor Canyon | |
| Asus ROG Strix Scar 18 2023 G834JY-N6005W | |
| Asus ROG Strix Scar 18 2023 G834JY-N6005W | |
| MSI Titan GT77 HX 13VI | |
| Genomsnitt Intel Core i9-13980HX (126758 - 143409, n=9) | |
| Razer Blade 18 RTX 4070 | |
| Schenker XMG Neo 16 Raptor Lake | |
| Razer Blade 16 Early 2023 | |
| Razer Blade 16 Early 2023 | |
| Lenovo Legion Pro 7 16IRX8H | |
| Genomsnitt av klass Gaming (49785 - 173351, n=96, senaste 2 åren) | |
| Asus ROG Strix Scar 17 SE G733CX-LL014W | |
| Dell Precision 7000 7670 Performance | |
| MSI Raider GE77 HX 12UHS | |
| AIDA64 / FPU SinJulia | |
| Intel Core i9-13900K @253W | |
| Intel NUC13 Raptor Canyon | |
| Asus ROG Strix Scar 18 2023 G834JY-N6005W | |
| MSI Titan GT77 HX 13VI | |
| Schenker XMG Neo 16 Raptor Lake | |
| Genomsnitt Intel Core i9-13980HX (13785 - 17117, n=9) | |
| Razer Blade 18 RTX 4070 | |
| Asus ROG Strix Scar 18 2023 G834JY-N6005W | |
| Razer Blade 16 Early 2023 | |
| Razer Blade 16 Early 2023 | |
| Razer Blade 16 Early 2023 | |
| Lenovo Legion Pro 7 16IRX8H | |
| Genomsnitt av klass Gaming (4424 - 33636, n=108, senaste 2 åren) | |
| MSI Raider GE77 HX 12UHS | |
| Asus ROG Strix Scar 17 SE G733CX-LL014W | |
| Dell Precision 7000 7670 Performance | |
| AIDA64 / FPU Mandel | |
| Intel Core i9-13900K @253W | |
| Genomsnitt av klass Gaming (25115 - 128721, n=108, senaste 2 åren) | |
| MSI Titan GT77 HX 13VI | |
| Asus ROG Strix Scar 18 2023 G834JY-N6005W | |
| Intel NUC13 Raptor Canyon | |
| Lenovo Legion Pro 7 16IRX8H | |
| Genomsnitt Intel Core i9-13980HX (53398 - 73758, n=9) | |
| Schenker XMG Neo 16 Raptor Lake | |
| Razer Blade 18 RTX 4070 | |
| Asus ROG Strix Scar 18 2023 G834JY-N6005W | |
| Razer Blade 16 Early 2023 | |
| Razer Blade 16 Early 2023 | |
| Razer Blade 16 Early 2023 | |
| MSI Raider GE77 HX 12UHS | |
| Asus ROG Strix Scar 17 SE G733CX-LL014W | |
| Dell Precision 7000 7670 Performance | |
| AIDA64 / CPU AES | |
| Intel Core i9-13900K @253W | |
| MSI Raider GE77 HX 12UHS | |
| Asus ROG Strix Scar 17 SE G733CX-LL014W | |
| Razer Blade 16 Early 2023 | |
| Razer Blade 16 Early 2023 | |
| Razer Blade 16 Early 2023 | |
| MSI Titan GT77 HX 13VI | |
| Asus ROG Strix Scar 18 2023 G834JY-N6005W | |
| Intel NUC13 Raptor Canyon | |
| Lenovo Legion Pro 7 16IRX8H | |
| Genomsnitt Intel Core i9-13980HX (105169 - 136520, n=9) | |
| Schenker XMG Neo 16 Raptor Lake | |
| Razer Blade 18 RTX 4070 | |
| Asus ROG Strix Scar 18 2023 G834JY-N6005W | |
| Genomsnitt av klass Gaming (39258 - 247074, n=108, senaste 2 åren) | |
| Dell Precision 7000 7670 Performance | |
| AIDA64 / CPU ZLib | |
| Intel Core i9-13900K @253W | |
| MSI Titan GT77 HX 13VI | |
| Asus ROG Strix Scar 18 2023 G834JY-N6005W | |
| Intel NUC13 Raptor Canyon | |
| Lenovo Legion Pro 7 16IRX8H | |
| Genomsnitt Intel Core i9-13980HX (1513 - 2039, n=9) | |
| Schenker XMG Neo 16 Raptor Lake | |
| Razer Blade 16 Early 2023 | |
| Razer Blade 16 Early 2023 | |
| Razer Blade 16 Early 2023 | |
| Razer Blade 18 RTX 4070 | |
| Asus ROG Strix Scar 18 2023 G834JY-N6005W | |
| Genomsnitt av klass Gaming (574 - 2531, n=108, senaste 2 åren) | |
| MSI Raider GE77 HX 12UHS | |
| Asus ROG Strix Scar 17 SE G733CX-LL014W | |
| Dell Precision 7000 7670 Performance | |
| AIDA64 / FP64 Ray-Trace | |
| Intel Core i9-13900K @253W | |
| Genomsnitt av klass Gaming (5509 - 45446, n=108, senaste 2 åren) | |
| MSI Titan GT77 HX 13VI | |
| Asus ROG Strix Scar 18 2023 G834JY-N6005W | |
| Intel NUC13 Raptor Canyon | |
| Lenovo Legion Pro 7 16IRX8H | |
| Genomsnitt Intel Core i9-13980HX (11431 - 16325, n=9) | |
| Schenker XMG Neo 16 Raptor Lake | |
| Razer Blade 18 RTX 4070 | |
| Razer Blade 16 Early 2023 | |
| Razer Blade 16 Early 2023 | |
| Razer Blade 16 Early 2023 | |
| Asus ROG Strix Scar 18 2023 G834JY-N6005W | |
| MSI Raider GE77 HX 12UHS | |
| Asus ROG Strix Scar 17 SE G733CX-LL014W | |
| Dell Precision 7000 7670 Performance | |
| AIDA64 / CPU PhotoWorxx | |
| Razer Blade 16 Early 2023 | |
| Razer Blade 16 Early 2023 | |
| Razer Blade 16 Early 2023 | |
| Razer Blade 18 RTX 4070 | |
| Intel Core i9-13900K @253W | |
| Lenovo Legion Pro 7 16IRX8H | |
| MSI Raider GE77 HX 12UHS | |
| Genomsnitt Intel Core i9-13980HX (37069 - 52949, n=9) | |
| Intel NUC13 Raptor Canyon | |
| Schenker XMG Neo 16 Raptor Lake | |
| Genomsnitt av klass Gaming (12271 - 89891, n=108, senaste 2 åren) | |
| Asus ROG Strix Scar 18 2023 G834JY-N6005W | |
| Asus ROG Strix Scar 18 2023 G834JY-N6005W | |
| Dell Precision 7000 7670 Performance | |
| Asus ROG Strix Scar 17 SE G733CX-LL014W | |
| MSI Titan GT77 HX 13VI | |
AIDA64: FP32 Ray-Trace | FPU Julia | CPU SHA3 | CPU Queen | FPU SinJulia | FPU Mandel | CPU AES | CPU ZLib | FP64 Ray-Trace | CPU PhotoWorxx
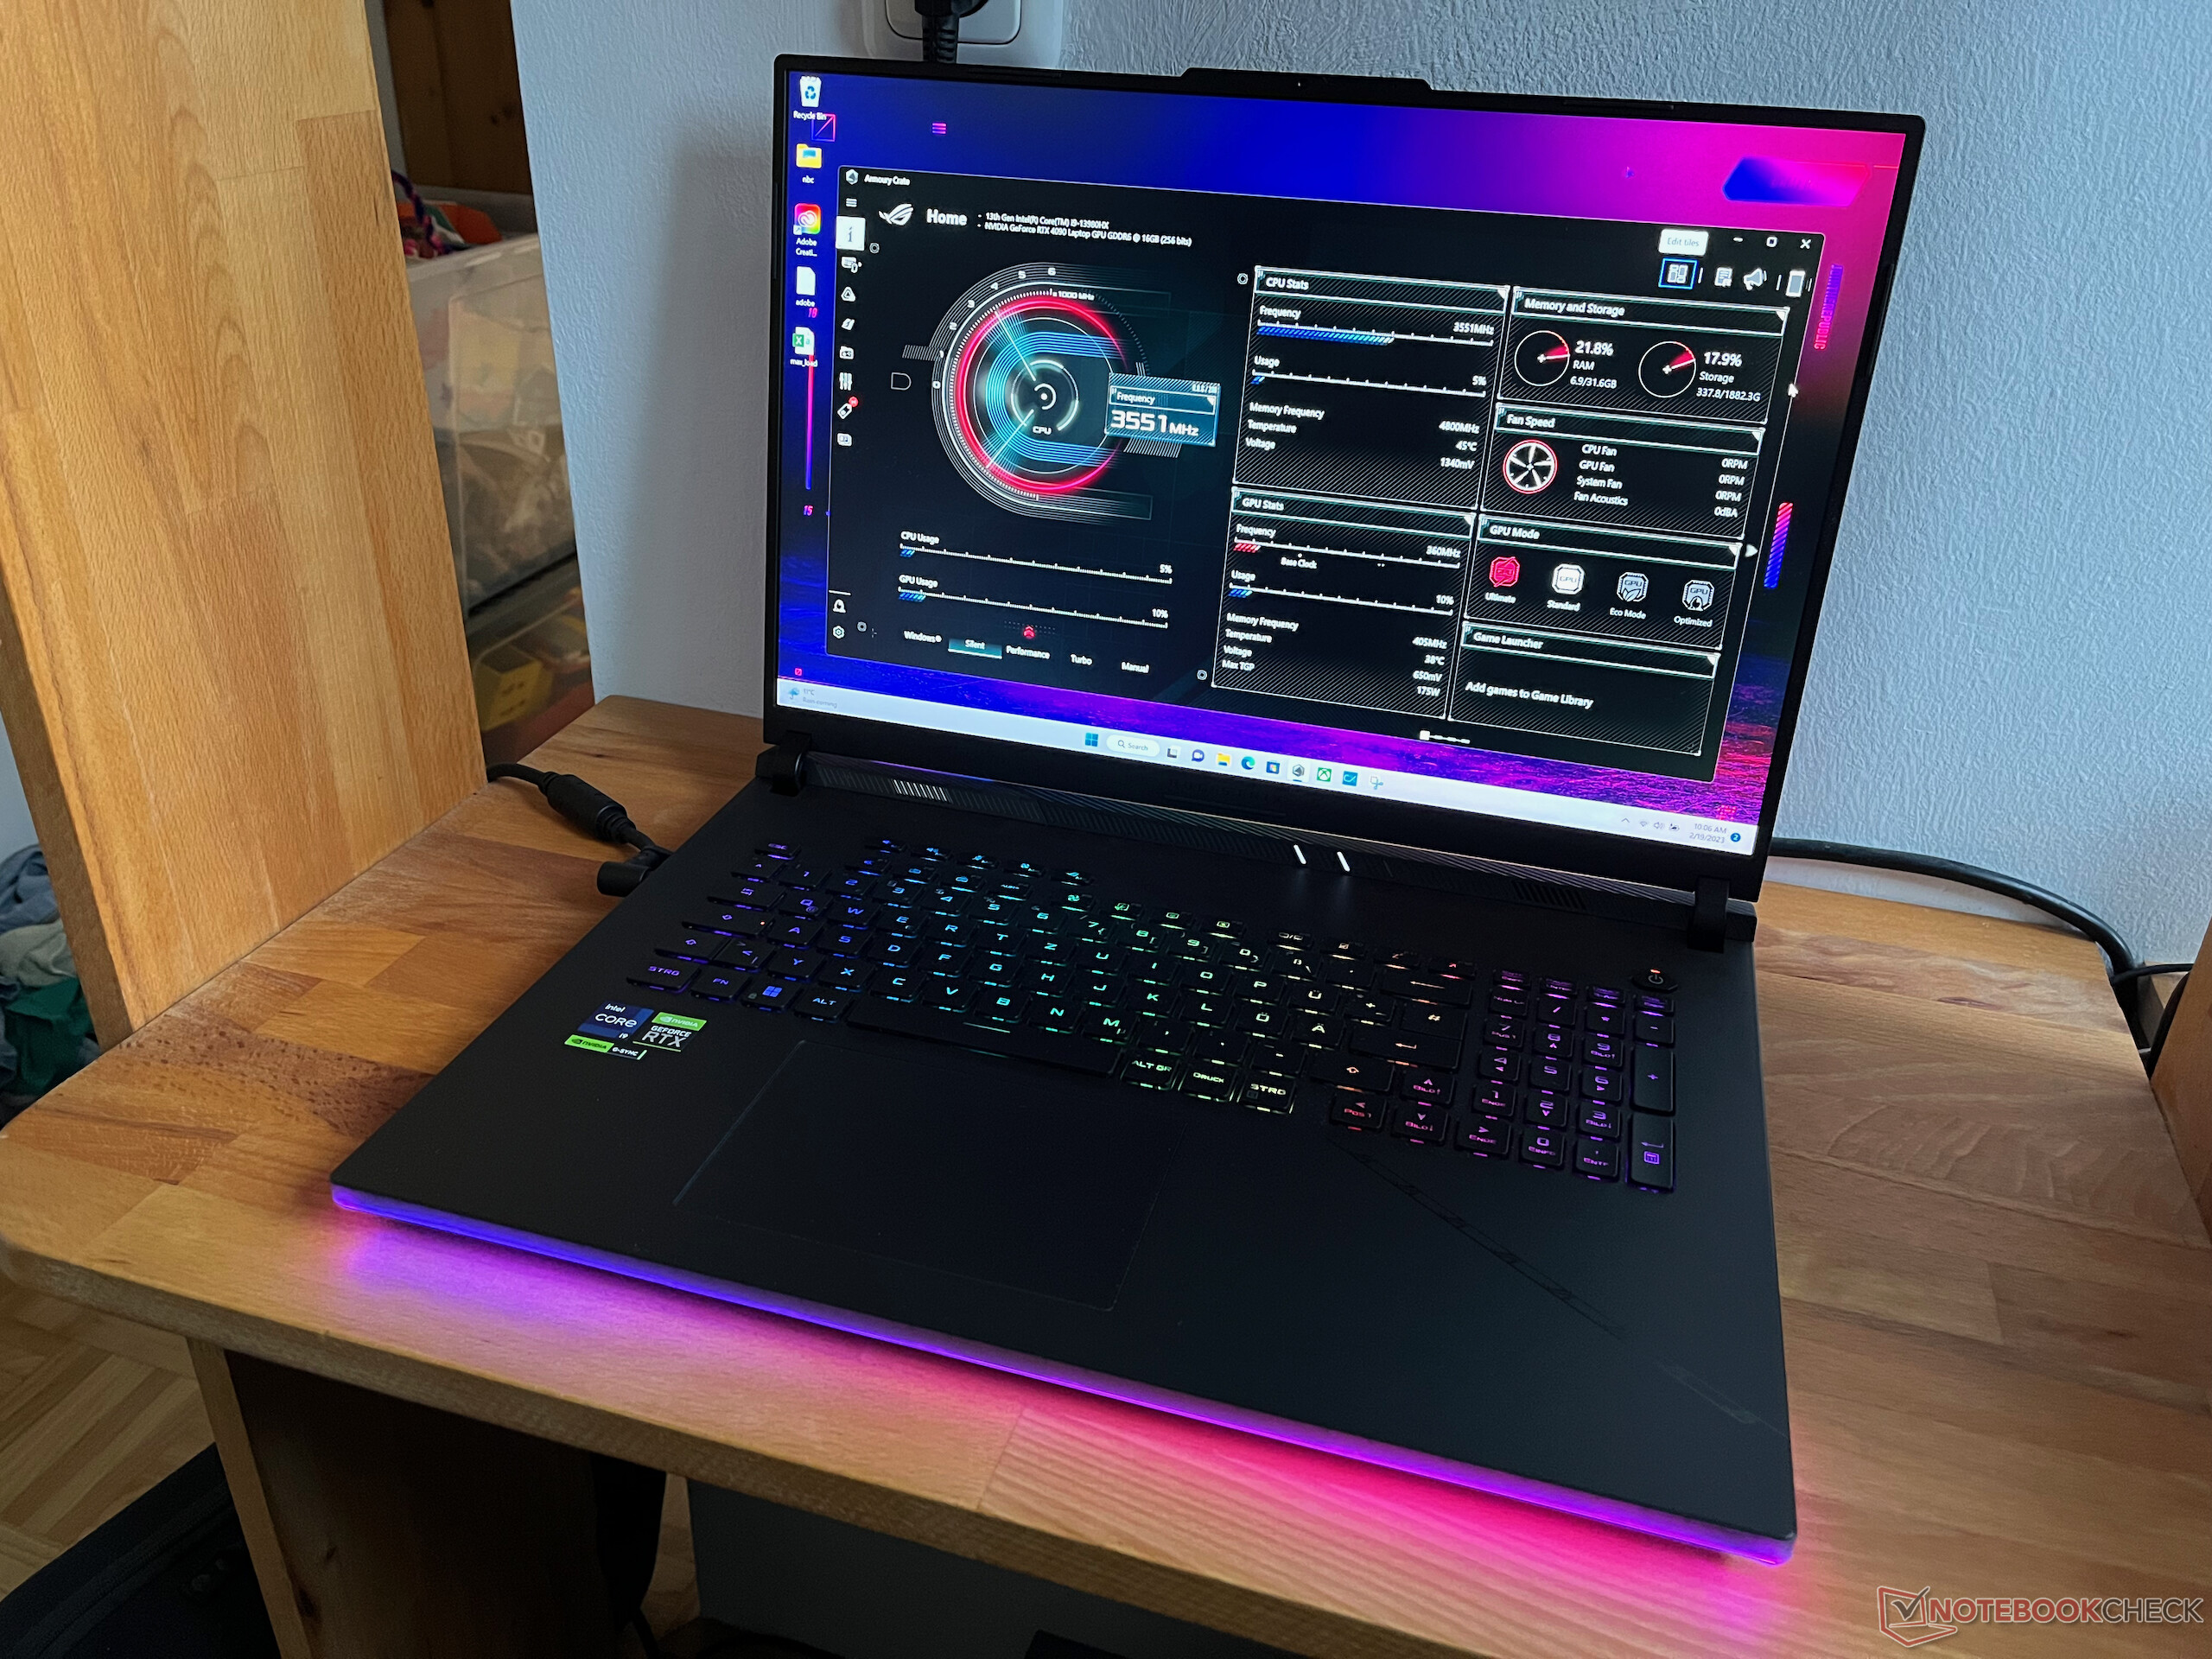
Systemets prestanda
Den kraftfulla hårdvaran kan också göra poäng i den allmänna systemprestandan. I PCMark 10 når Scar 18 en topposition som för närvarande bara knappt överträffas av kraftfulla stationära datorer och MSI Titan GT77 HX 13VI. I CrossMark är resultatet också i toppklass. Även om vissa bärbara datorer kan placera sig före Strix Scar 18 är avståndet mycket litet på högst 4 % (med MSI Titan GT77 12UHS för närvarande som den snabbaste bärbara datorn och den snabbaste stationära datorn som uppnår ett 24 % högre resultat).
I lagringsjämförelsen kan man lätt se effekten av DDR5-4800-lagringen. Systemen med det snabbare DDR5-5600-huvudminnet, såsom Razer Blade 16, kan fortfarande uppnå en betydande fördel. Detta är ett av de få områden där Asus inte använder de snabbaste komponenterna som finns tillgängliga, men påverkan är relativt liten i praktiken.
CrossMark: Overall | Productivity | Creativity | Responsiveness
| PCMark 10 / Score | |
| Intel NUC13 Raptor Canyon | |
| MSI Titan GT77 HX 13VI | |
| Genomsnitt Intel Core i9-13980HX, NVIDIA GeForce RTX 4090 Laptop GPU (8650 - 9068, n=4) | |
| Asus ROG Strix Scar 18 2023 G834JY-N6005W | |
| Genomsnitt av klass Gaming (5828 - 11574, n=96, senaste 2 åren) | |
| Razer Blade 16 Early 2023 | |
| Lenovo Legion Pro 7 16IRX8H | |
| Razer Blade 18 RTX 4070 | |
| Asus ROG Strix Scar 17 SE G733CX-LL014W | |
| MSI Raider GE77 HX 12UHS | |
| Dell Precision 7000 7670 Performance | |
| PCMark 10 / Essentials | |
| MSI Titan GT77 HX 13VI | |
| Lenovo Legion Pro 7 16IRX8H | |
| Razer Blade 18 RTX 4070 | |
| Intel NUC13 Raptor Canyon | |
| Dell Precision 7000 7670 Performance | |
| Genomsnitt Intel Core i9-13980HX, NVIDIA GeForce RTX 4090 Laptop GPU (11215 - 11644, n=3) | |
| Razer Blade 16 Early 2023 | |
| Genomsnitt av klass Gaming (8810 - 12600, n=100, senaste 2 åren) | |
| Asus ROG Strix Scar 17 SE G733CX-LL014W | |
| MSI Raider GE77 HX 12UHS | |
| PCMark 10 / Productivity | |
| Intel NUC13 Raptor Canyon | |
| Genomsnitt av klass Gaming (6845 - 21327, n=98, senaste 2 åren) | |
| Lenovo Legion Pro 7 16IRX8H | |
| Genomsnitt Intel Core i9-13980HX, NVIDIA GeForce RTX 4090 Laptop GPU (10125 - 11067, n=3) | |
| Asus ROG Strix Scar 17 SE G733CX-LL014W | |
| MSI Titan GT77 HX 13VI | |
| MSI Raider GE77 HX 12UHS | |
| Razer Blade 18 RTX 4070 | |
| Razer Blade 16 Early 2023 | |
| Dell Precision 7000 7670 Performance | |
| PCMark 10 / Digital Content Creation | |
| MSI Titan GT77 HX 13VI | |
| Intel NUC13 Raptor Canyon | |
| Genomsnitt Intel Core i9-13980HX, NVIDIA GeForce RTX 4090 Laptop GPU (15052 - 16012, n=3) | |
| Razer Blade 16 Early 2023 | |
| Genomsnitt av klass Gaming (7602 - 19657, n=98, senaste 2 åren) | |
| Razer Blade 18 RTX 4070 | |
| Lenovo Legion Pro 7 16IRX8H | |
| Asus ROG Strix Scar 17 SE G733CX-LL014W | |
| MSI Raider GE77 HX 12UHS | |
| Dell Precision 7000 7670 Performance | |
| CrossMark / Overall | |
| Intel Core i9-13900K @253W | |
| Intel NUC13 Raptor Canyon | |
| MSI Raider GE77 HX 12UHS | |
| MSI Titan GT77 HX 13VI | |
| Razer Blade 18 RTX 4070 | |
| Asus ROG Strix Scar 17 SE G733CX-LL014W | |
| Asus ROG Strix Scar 18 2023 G834JY-N6005W | |
| Genomsnitt Intel Core i9-13980HX, NVIDIA GeForce RTX 4090 Laptop GPU (1935 - 2176, n=4) | |
| Asus ROG Strix Scar 18 2023 G834JY-N6005W | |
| Schenker XMG Neo 16 Raptor Lake | |
| Genomsnitt av klass Gaming (1366 - 2409, n=96, senaste 2 åren) | |
| Dell Precision 7000 7670 Performance | |
| Razer Blade 16 Early 2023 | |
| CrossMark / Productivity | |
| Intel Core i9-13900K @253W | |
| Intel NUC13 Raptor Canyon | |
| MSI Raider GE77 HX 12UHS | |
| MSI Titan GT77 HX 13VI | |
| Razer Blade 18 RTX 4070 | |
| Asus ROG Strix Scar 17 SE G733CX-LL014W | |
| Asus ROG Strix Scar 18 2023 G834JY-N6005W | |
| Genomsnitt Intel Core i9-13980HX, NVIDIA GeForce RTX 4090 Laptop GPU (1764 - 2005, n=4) | |
| Asus ROG Strix Scar 18 2023 G834JY-N6005W | |
| Genomsnitt av klass Gaming (1386 - 2254, n=96, senaste 2 åren) | |
| Schenker XMG Neo 16 Raptor Lake | |
| Dell Precision 7000 7670 Performance | |
| Razer Blade 16 Early 2023 | |
| CrossMark / Creativity | |
| Intel Core i9-13900K @253W | |
| Intel NUC13 Raptor Canyon | |
| Asus ROG Strix Scar 18 2023 G834JY-N6005W | |
| MSI Titan GT77 HX 13VI | |
| Genomsnitt Intel Core i9-13980HX, NVIDIA GeForce RTX 4090 Laptop GPU (2267 - 2469, n=4) | |
| Razer Blade 18 RTX 4070 | |
| Asus ROG Strix Scar 18 2023 G834JY-N6005W | |
| Schenker XMG Neo 16 Raptor Lake | |
| Asus ROG Strix Scar 17 SE G733CX-LL014W | |
| MSI Raider GE77 HX 12UHS | |
| Genomsnitt av klass Gaming (1343 - 2729, n=96, senaste 2 åren) | |
| Dell Precision 7000 7670 Performance | |
| Razer Blade 16 Early 2023 | |
| CrossMark / Responsiveness | |
| Intel Core i9-13900K @253W | |
| MSI Raider GE77 HX 12UHS | |
| Asus ROG Strix Scar 17 SE G733CX-LL014W | |
| Intel NUC13 Raptor Canyon | |
| Razer Blade 18 RTX 4070 | |
| MSI Titan GT77 HX 13VI | |
| Genomsnitt av klass Gaming (1226 - 2334, n=96, senaste 2 åren) | |
| Genomsnitt Intel Core i9-13980HX, NVIDIA GeForce RTX 4090 Laptop GPU (1556 - 1904, n=4) | |
| Asus ROG Strix Scar 18 2023 G834JY-N6005W | |
| Asus ROG Strix Scar 18 2023 G834JY-N6005W | |
| Schenker XMG Neo 16 Raptor Lake | |
| Dell Precision 7000 7670 Performance | |
| Razer Blade 16 Early 2023 | |
CrossMark: Overall | Productivity | Creativity | Responsiveness
| PCMark 10 Score | 8764 poäng | |
Hjälp | ||
| AIDA64 / Memory Copy | |
| Razer Blade 16 Early 2023 | |
| Razer Blade 16 Early 2023 | |
| Razer Blade 16 Early 2023 | |
| Lenovo Legion Pro 7 16IRX8H | |
| Razer Blade 18 RTX 4070 | |
| Intel Core i9-13900K @253W | |
| Genomsnitt av klass Gaming (21750 - 129946, n=108, senaste 2 åren) | |
| Genomsnitt Intel Core i9-13980HX (62189 - 80776, n=9) | |
| MSI Raider GE77 HX 12UHS | |
| Intel NUC13 Raptor Canyon | |
| Asus ROG Strix Scar 18 2023 G834JY-N6005W | |
| Schenker XMG Neo 16 Raptor Lake | |
| Asus ROG Strix Scar 18 2023 G834JY-N6005W | |
| Dell Precision 7000 7670 Performance | |
| MSI Titan GT77 HX 13VI | |
| Asus ROG Strix Scar 17 SE G733CX-LL014W | |
| AIDA64 / Memory Read | |
| Razer Blade 16 Early 2023 | |
| Razer Blade 16 Early 2023 | |
| Razer Blade 16 Early 2023 | |
| Razer Blade 18 RTX 4070 | |
| Lenovo Legion Pro 7 16IRX8H | |
| Intel Core i9-13900K @253W | |
| Genomsnitt Intel Core i9-13980HX (62624 - 89096, n=9) | |
| Schenker XMG Neo 16 Raptor Lake | |
| Asus ROG Strix Scar 18 2023 G834JY-N6005W | |
| Asus ROG Strix Scar 18 2023 G834JY-N6005W | |
| Genomsnitt av klass Gaming (22956 - 118858, n=108, senaste 2 åren) | |
| Intel NUC13 Raptor Canyon | |
| MSI Raider GE77 HX 12UHS | |
| Asus ROG Strix Scar 17 SE G733CX-LL014W | |
| Dell Precision 7000 7670 Performance | |
| MSI Titan GT77 HX 13VI | |
| AIDA64 / Memory Write | |
| Razer Blade 16 Early 2023 | |
| Razer Blade 16 Early 2023 | |
| Razer Blade 16 Early 2023 | |
| Genomsnitt av klass Gaming (22297 - 135096, n=108, senaste 2 åren) | |
| Razer Blade 18 RTX 4070 | |
| Intel Core i9-13900K @253W | |
| Lenovo Legion Pro 7 16IRX8H | |
| Genomsnitt Intel Core i9-13980HX (59912 - 79917, n=9) | |
| Intel NUC13 Raptor Canyon | |
| Schenker XMG Neo 16 Raptor Lake | |
| Asus ROG Strix Scar 18 2023 G834JY-N6005W | |
| MSI Raider GE77 HX 12UHS | |
| Asus ROG Strix Scar 18 2023 G834JY-N6005W | |
| Asus ROG Strix Scar 17 SE G733CX-LL014W | |
| Dell Precision 7000 7670 Performance | |
| MSI Titan GT77 HX 13VI | |
| AIDA64 / Memory Latency | |
| Genomsnitt av klass Gaming (75.3 - 259, n=108, senaste 2 åren) | |
| Razer Blade 16 Early 2023 | |
| Razer Blade 16 Early 2023 | |
| Razer Blade 16 Early 2023 | |
| Intel NUC13 Raptor Canyon | |
| MSI Titan GT77 HX 13VI | |
| Schenker XMG Neo 16 Raptor Lake | |
| Asus ROG Strix Scar 18 2023 G834JY-N6005W | |
| Asus ROG Strix Scar 18 2023 G834JY-N6005W | |
| Genomsnitt Intel Core i9-13980HX (79.4 - 93.2, n=9) | |
| Asus ROG Strix Scar 17 SE G733CX-LL014W | |
| Dell Precision 7000 7670 Performance | |
| Razer Blade 18 RTX 4070 | |
| MSI Raider GE77 HX 12UHS | |
| Lenovo Legion Pro 7 16IRX8H | |
| Intel Core i9-13900K @253W | |
* ... mindre är bättre
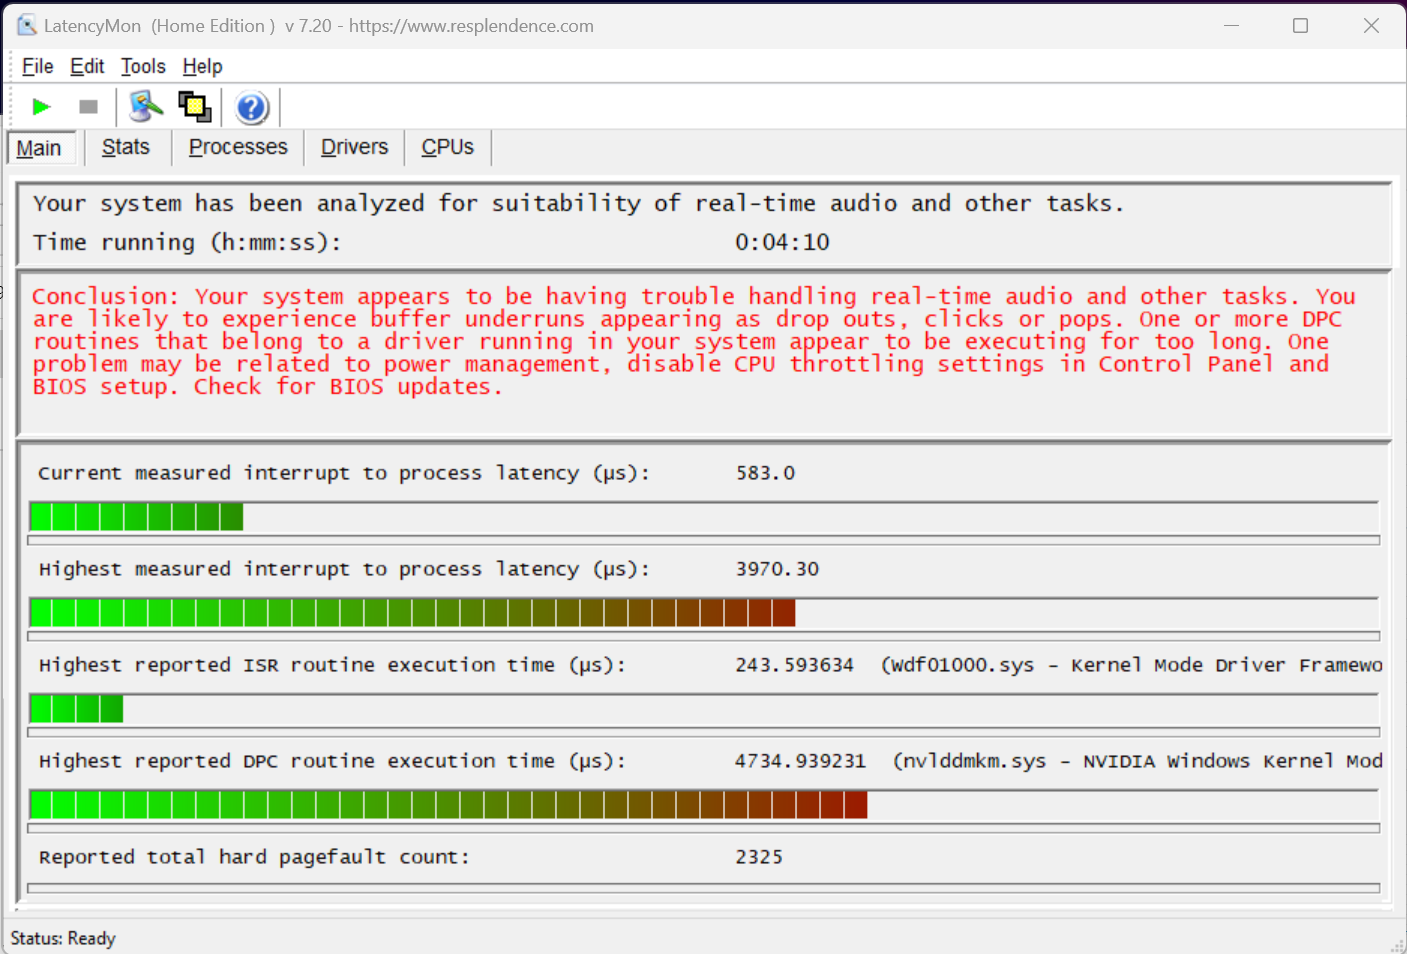
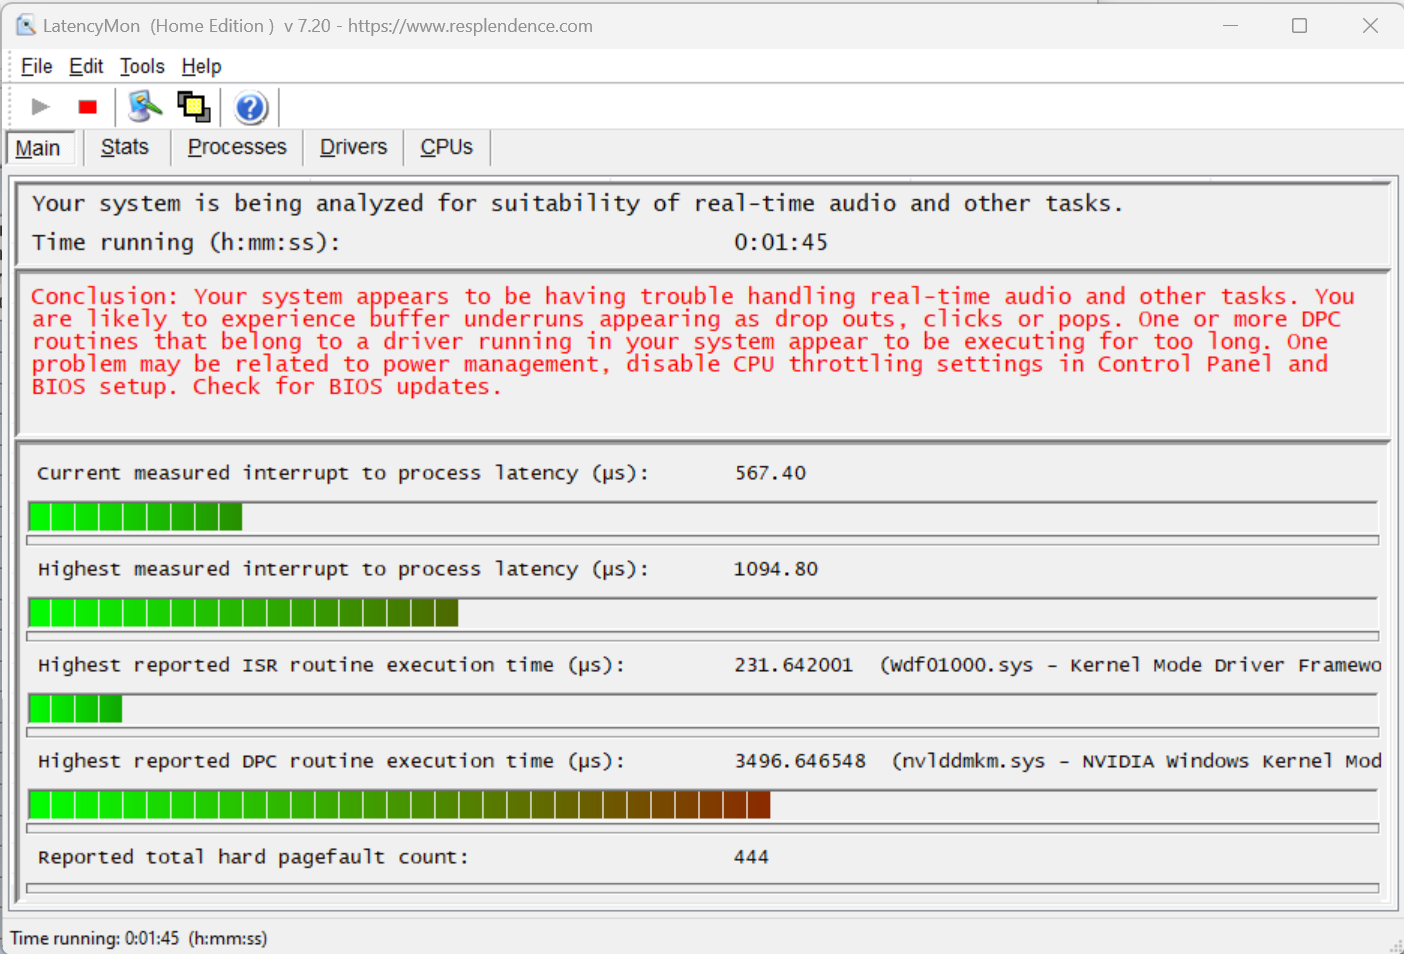
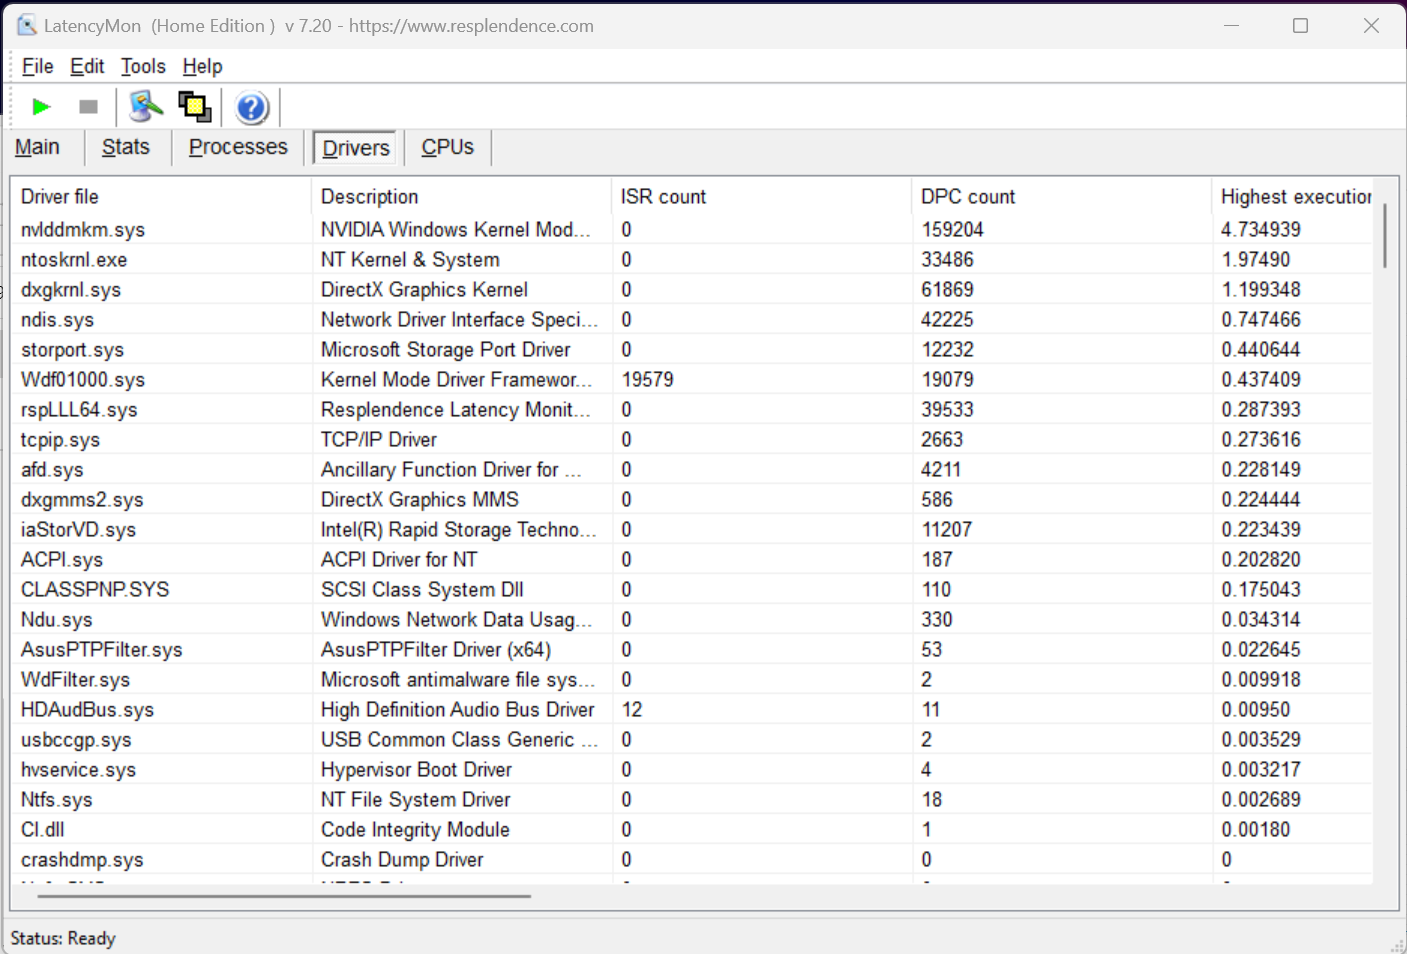
DPC-latenstider
När det gäller DPC-latenserna placerar sig Asus bärbara dator endast i mitten av fältet av alla testade bärbara datorer. Enligt LatencyMon är det Nvidia-drivrutinen som är fel här, vilket kan skapa vissa problem i realtidsapplikationer. Vi körde våra tester i Turbo-läge med Ultimate GPU (ingen Optimus), vilket teoretiskt sett är bättre lämpat än hybridläget eller energisparläget. Tyvärr är den svaga DPC-prestandan inget undantag i den här enhetsklassen.
| DPC Latencies / LatencyMon - interrupt to process latency (max), Web, Youtube, Prime95 | |
| MSI Titan GT77 HX 13VI | |
| Asus ROG Strix Scar 17 SE G733CX-LL014W | |
| Razer Blade 16 Early 2023 | |
| Dell Precision 7000 7670 Performance | |
| MSI Raider GE77 HX 12UHS | |
| Razer Blade 18 RTX 4070 | |
| Asus ROG Strix Scar 18 2023 G834JY-N6005W | |
| Lenovo Legion Pro 7 16IRX8H | |
* ... mindre är bättre
Lagringslösning
Asus använder två snabba Samsung PM9A1 SSD-diskar, vardera med 1 TB lagringsutrymme, i ett RAID-0-system i Scar 18 G834JY-N6005W. Även om hastigheten ökar något med detta ökar också sannolikheten för fel och strömförbrukningen. I jämförelsen med Legion 5 Pro 16IAH7H med samma RAID-system överträffas dock Asus Scar - till och med med en betydande marginal. Detta beror dock inte på termiska problem, utan prestandan förblir konstant vid konstant belastning.

* ... mindre är bättre
Disk Throttling: DiskSpd Read Loop, Queue Depth 8
Grafikkort
Det främsta kännetecknet i Asus ROG Strix Scar 18 är helt klart den Nvidia GeForce RTX 4090 GPU för bärbar dator. Även om namnet antyder en likhet med RTX 4090 Desktop GPUär den mobila versionen relaterad till RTX 4080 för stationära datorer (samma chip), och prestandan är fortfarande lägre än för en stationära RTX 4070 Ti. Men Asus erbjuder åtminstone den snabbaste versionen av RTX 4090 Mobile med 175 watt TGP (150 watt + 25 watt Dynamic Boost) och överklockar även GPU:n något med 50 MHz.
Jämfört med RTX 4090 iMSI Titan GT77 HX 13VIplacerar sig Strix G18 fortfarande knappt bakom, trots överklockningen. De bärbara RTX 4080-datorerna överträffas också klart, och bärbara datorer med den gamla RTX 3080 Ti GPU för bärbara datorertoppmodell ligger fortfarande långt efter.
| 3DMark 06 Standard Score | 67702 poäng | |
| 3DMark 11 Performance | 46985 poäng | |
| 3DMark Ice Storm Standard Score | 277937 poäng | |
| 3DMark Cloud Gate Standard Score | 70984 poäng | |
| 3DMark Fire Strike Score | 36408 poäng | |
| 3DMark Fire Strike Extreme Score | 24278 poäng | |
| 3DMark Time Spy Score | 20166 poäng | |
Hjälp | ||
* ... mindre är bättre
Spelprestanda
Spelbenchmarks visar en liknande bild som redan i de syntetiska benchmarks. Som en särskild funktion erbjuder RTX 4000-serien nu även stöd för DLSS 3 med ramgenerering. I spel som stöds kan RTX 4090 här utvinna en betydande ökning av bildfrekvensen. Detta gör också raytracing-effekter i 4K möjliga med jämna bildfrekvenser. Skärmens 240 Hz kan dock bara utnyttjas fullt ut i mindre krävande spel i den ursprungliga upplösningen på 2 560 x 1 600 pixlar.
| GTA V - 1920x1080 Highest AA:4xMSAA + FX AF:16x | |
| Intel NUC13 Raptor Canyon | |
| Lenovo Legion Pro 7 16IRX8H | |
| Asus ROG Strix Scar 18 2023 G834JY-N6005W | |
| Asus ROG Strix Scar 18 2023 G834JY-N6005W | |
| MSI Titan GT77 HX 13VI | |
| Razer Blade 16 Early 2023 | |
| Schenker XMG Neo 16 Raptor Lake | |
| MSI Raider GE77 HX 12UHS | |
| Genomsnitt av klass Gaming (48.3 - 186.9, n=99, senaste 2 åren) | |
| Asus ROG Strix Scar 17 SE G733CX-LL014W | |
| Razer Blade 18 RTX 4070 | |
| Dell Precision 7000 7670 Performance | |
| Final Fantasy XV Benchmark - 1920x1080 High Quality | |
| MSI Titan GT77 HX 13VI | |
| Schenker XMG Neo 16 Raptor Lake | |
| Intel NUC13 Raptor Canyon | |
| Asus ROG Strix Scar 18 2023 G834JY-N6005W | |
| Asus ROG Strix Scar 18 2023 G834JY-N6005W | |
| Lenovo Legion Pro 7 16IRX8H | |
| Razer Blade 16 Early 2023 | |
| Genomsnitt av klass Gaming (41 - 215, n=100, senaste 2 åren) | |
| MSI Raider GE77 HX 12UHS | |
| Asus ROG Strix Scar 17 SE G733CX-LL014W | |
| Razer Blade 18 RTX 4070 | |
| Dell Precision 7000 7670 Performance | |
| Strange Brigade - 1920x1080 ultra AA:ultra AF:16 | |
| MSI Titan GT77 HX 13VI | |
| Asus ROG Strix Scar 18 2023 G834JY-N6005W | |
| Intel NUC13 Raptor Canyon | |
| Schenker XMG Neo 16 Raptor Lake | |
| Asus ROG Strix Scar 18 2023 G834JY-N6005W | |
| Razer Blade 16 Early 2023 | |
| Lenovo Legion Pro 7 16IRX8H | |
| Genomsnitt av klass Gaming (76.3 - 456, n=90, senaste 2 åren) | |
| Asus ROG Strix Scar 17 SE G733CX-LL014W | |
| MSI Raider GE77 HX 12UHS | |
| Razer Blade 18 RTX 4070 | |
| Dell Precision 7000 7670 Performance | |
| Dota 2 Reborn - 1920x1080 ultra (3/3) best looking | |
| Intel NUC13 Raptor Canyon | |
| Razer Blade 16 Early 2023 | |
| Asus ROG Strix Scar 18 2023 G834JY-N6005W | |
| Asus ROG Strix Scar 18 2023 G834JY-N6005W | |
| MSI Titan GT77 HX 13VI | |
| Lenovo Legion Pro 7 16IRX8H | |
| Razer Blade 18 RTX 4070 | |
| Schenker XMG Neo 16 Raptor Lake | |
| Asus ROG Strix Scar 17 SE G733CX-LL014W | |
| MSI Raider GE77 HX 12UHS | |
| Dell Precision 7000 7670 Performance | |
| Genomsnitt av klass Gaming (84.8 - 248, n=111, senaste 2 åren) | |
I vårt belastningstest med Witcher 3 och även i 3DMark Time Spy stresstestet har Asus G834JY en stabil prestanda utan några fall. De synliga svängningarna i The Witcher 3 beror på växlingarna mellan dag och natt.
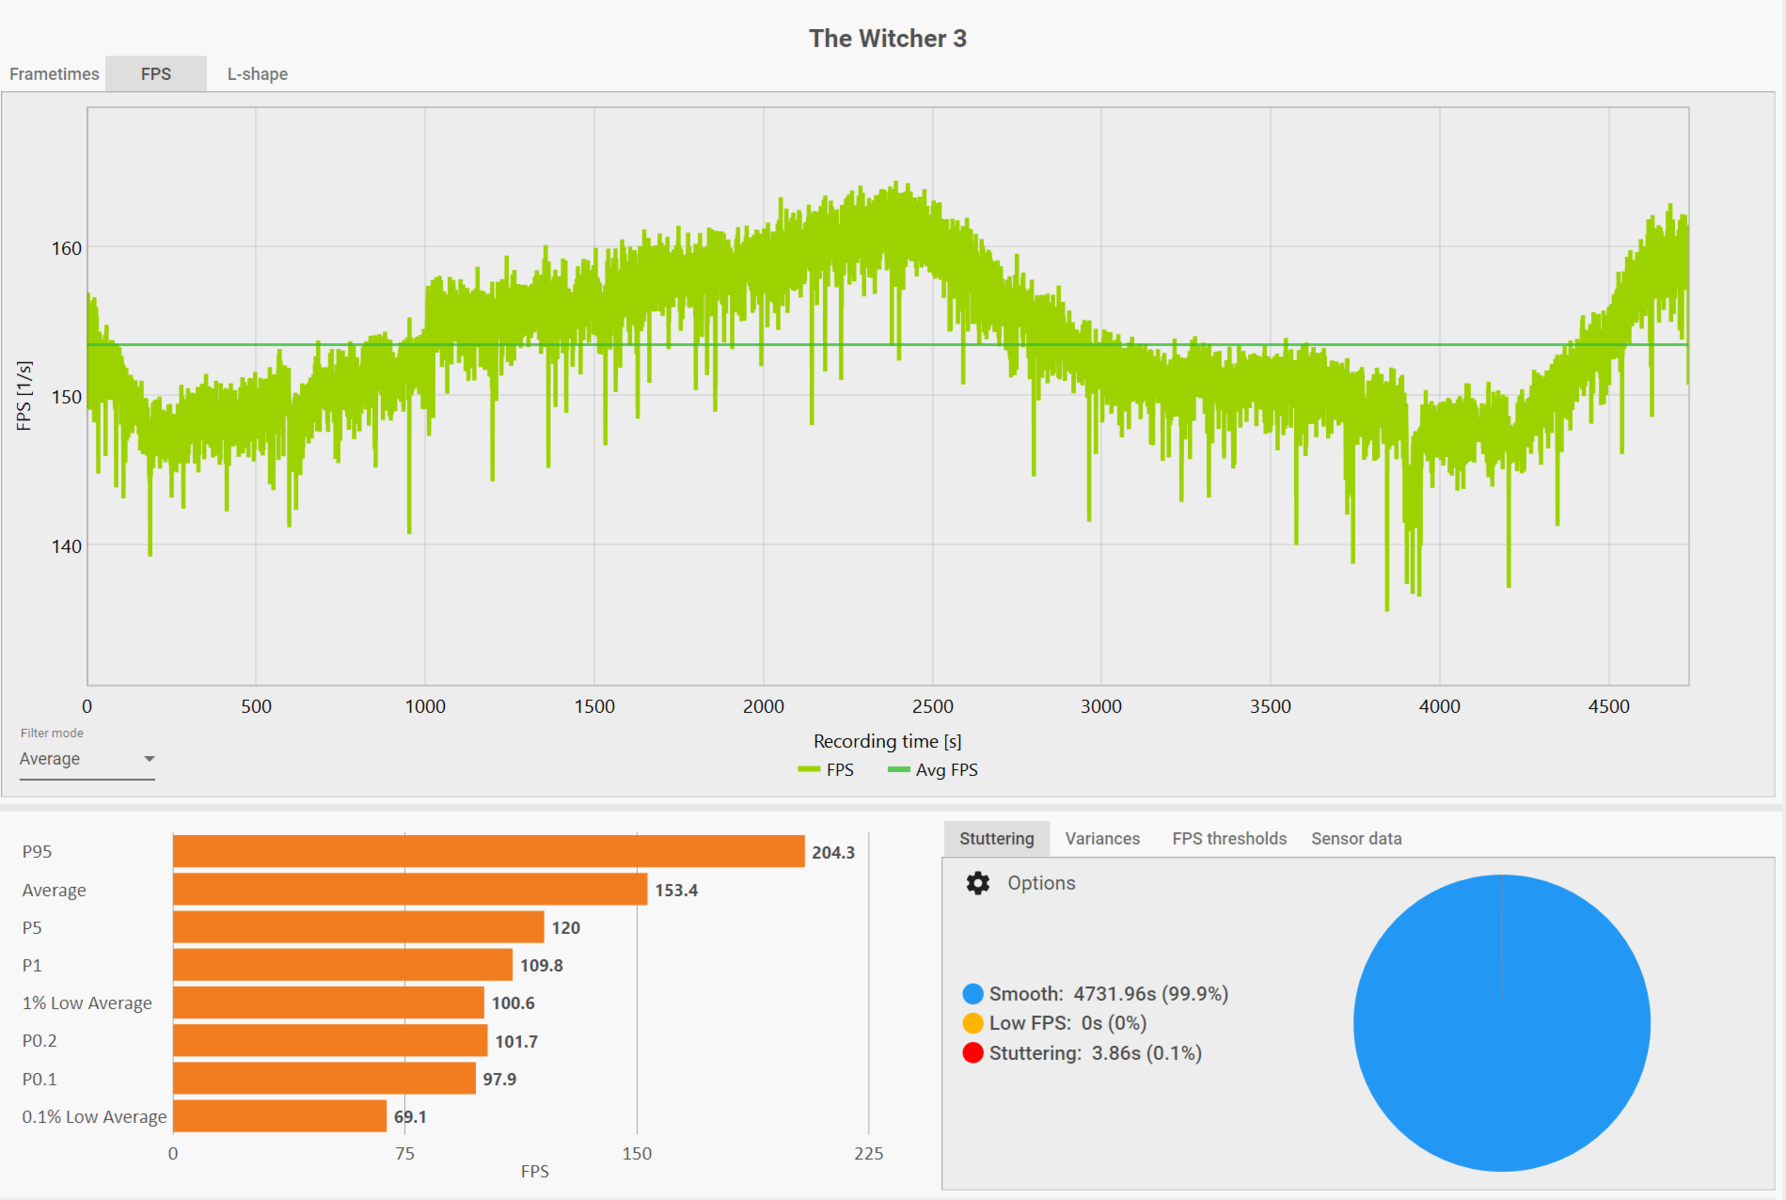
The Witcher 3 FPS Chart
| låg | med. | hög | ultra | QHD | 4K DLSS | 4K | |
|---|---|---|---|---|---|---|---|
| Counter-Strike: GO (2012) | 516 | 314 | |||||
| GTA V (2015) | 187.4 | 185.7 | 184.8 | 141.3 | 139.1 | 175.7 | |
| Dota 2 Reborn (2015) | 237 | 207.7 | 201.75 | 190.2 | 178.6 | ||
| Deus Ex Mankind Divided (2016) | 169 | ||||||
| Final Fantasy XV Benchmark (2018) | 224 | 208 | 177.6 | 146.7 | 90.1 | ||
| X-Plane 11.11 (2018) | 211 | 186.8 | 142.8 | ||||
| Far Cry 5 (2018) | 197 | 181 | 172 | 158 | 153 | 107 | |
| Strange Brigade (2018) | 496 | 403 | 386 | 366 | 292 | 154.7 | |
| Shadow of the Tomb Raider (2018) | 143.7 | 121.2 | 87.3 | ||||
| Control (2019) | 184.4 | 123.2 | 72.6 | ||||
| Horizon Zero Dawn (2020) | 184 | 154 | 145 | 127 | 92 | ||
| Flight Simulator 2020 (2020) | 74 | 74 | 96.8 | 51.2 | |||
| Battlefield 2042 (2021) | 172.6 | 138.9 | 85.4 | ||||
| Halo Infinite (2021) | 128.9 | 77 | 57.3 | ||||
| Elden Ring (2022) | 60 | 60 | 60 | 60 | 60 | 60 | |
| Cyberpunk 2077 1.6 (2022) | 119.7 | 94.5 | |||||
| Vampire Bloodhunt (2022) | 290 | 242 | 138.3 | ||||
| F1 22 (2022) | 319 | 308 | 273 | 124.5 | 75 | 42.4 | |
| FIFA 23 (2022) | 183.7 | 182.6 | 162.4 | ||||
| A Plague Tale Requiem (2022) | 96.8 | 72 | 82.3 | 41 | |||
| Uncharted Legacy of Thieves Collection (2022) | 108.2 | 103.1 | 62.9 | ||||
| Call of Duty Modern Warfare 2 2022 (2022) | 170 | 127 | 112 | 81 | |||
| Spider-Man Miles Morales (2022) | 109.1 | 103.8 | 73.2 | ||||
| Need for Speed Unbound (2022) | 124.2 | 111.8 | 84.3 | ||||
| High On Life (2023) | 180.3 | 120.2 | 52 | ||||
| The Witcher 3 v4 (2023) | 137.6 | 96.6 | 49 |
Utsläpp
Bullernivåer
Under belastning kämpar de tre inbyggda fläktarna hörbart med de kraftfulla komponenterna. Även om bulleregenskaperna fortfarande är mycket bekväma är upp till 55,8 dB (fläktarna vid 4900, 5500 och 6400 varv per minut) fortfarande mycket högljudda. Vid spelande kan ljudet från de bra högtalarna dränkas lite, vilket föreslår att du använder hörlurar här. Om du använder 240 Hz-skärmen vid spelande och den når höga bildfrekvenser producerar vår testenhet tyvärr ett tydligt märkbart spolningsvisslande. Detta är hörbart från och med 100 fps och kan bli lite irriterande beroende på spel.
Vid tomgångsdrift kan de tre fläktarna också förbli avstängda under långa perioder, men endast i Silent-läget och vid användning av den integrerade GPU:n. För det mesta förblir de dock inte helt avstängda när man surfar, utan de lägsta fläktnivåerna vid 2000 - 3000 varv per minut är behagligt tysta med mindre än 33 dB(A).
Ljudnivå
| Låg belastning |
| 23.9 / 32.6 / 32.6 dB(A) |
| Hög belastning |
| 35.9 / 55.8 dB(A) |
 | ||
30 dB tyst 40 dB(A) hörbar 50 dB(A) högt ljud |
||
min: | ||
| Asus ROG Strix Scar 18 2023 G834JY-N6005W GeForce RTX 4090 Laptop GPU, i9-13980HX, 2x Samsung PM9A1 MZVL21T0HCLR (RAID 0) | Razer Blade 18 RTX 4070 GeForce RTX 4070 Laptop GPU, i9-13950HX, SSSTC CA6-8D1024 | Lenovo Legion Pro 7 16IRX8H GeForce RTX 4080 Laptop GPU, i9-13900HX, Samsung PM9A1 MZVL21T0HCLR | Razer Blade 16 Early 2023 GeForce RTX 4080 Laptop GPU, i9-13950HX, SSSTC CA6-8D1024 | MSI Titan GT77 HX 13VI GeForce RTX 4090 Laptop GPU, i9-13950HX, Samsung PM9A1 MZVL22T0HBLB | MSI Raider GE77 HX 12UHS GeForce RTX 3080 Ti Laptop GPU, i9-12900HX, Samsung PM9A1 MZVL22T0HBLB | Asus ROG Strix Scar 17 SE G733CX-LL014W GeForce RTX 3080 Ti Laptop GPU, i9-12950HX, Samsung PM9A1 MZVL22T0HBLB | |
|---|---|---|---|---|---|---|---|
| Noise | 8% | -5% | 11% | -9% | -17% | 13% | |
| av / miljö * (dB) | 23.9 | 23.5 2% | 24 -0% | 23 4% | 24.6 -3% | 26 -9% | 23.9 -0% |
| Idle Minimum * (dB) | 23.9 | 23.8 -0% | 26 -9% | 23 4% | 29.2 -22% | 26 -9% | 23.9 -0% |
| Idle Average * (dB) | 32.6 | 23.8 27% | 28 14% | 23 29% | 29.2 10% | 34 -4% | 23.9 27% |
| Idle Maximum * (dB) | 32.6 | 26.8 18% | 34 -4% | 23.6 28% | 29.2 10% | 46 -41% | 23.9 27% |
| Load Average * (dB) | 35.9 | 37.3 -4% | 47 -31% | 39 -9% | 50.7 -41% | 50 -39% | 34.3 4% |
| Load Maximum * (dB) | 55.8 | 53.5 4% | 56 -0% | 51.3 8% | 61 -9% | 57 -2% | 45.9 18% |
| Witcher 3 ultra * (dB) | 48 | 55 | 51.6 | 53.3 | 55 |
* ... mindre är bättre
Temperaturer
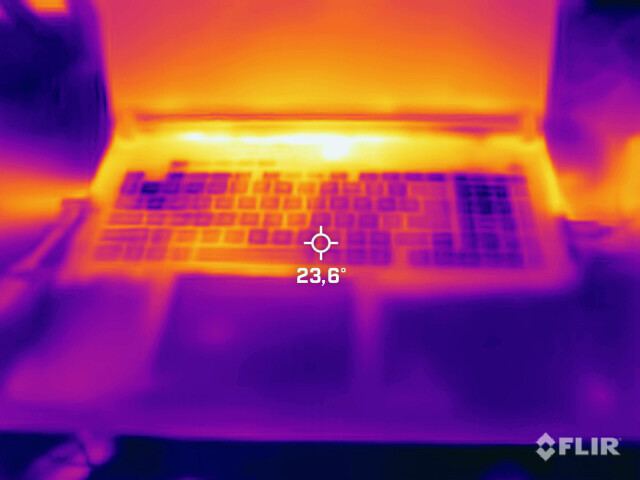
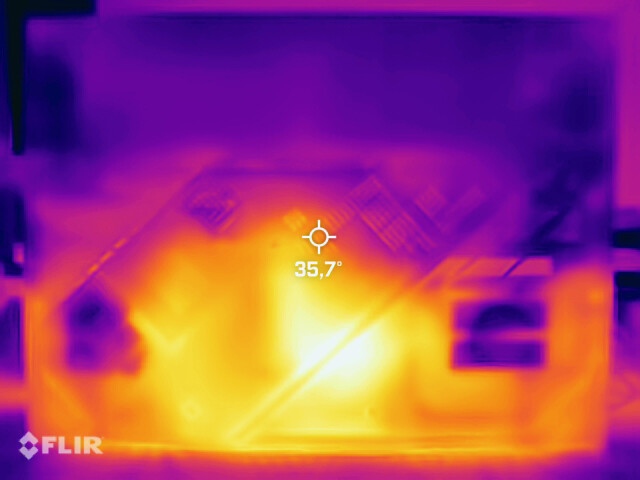
Temperaturerna ger blandade resultat. De relevanta områden i höljet som berörs, t.ex. handflatorna och tangentbordet, förblir behagligt svala, även under längre belastningsscenarier. Men den heta punkten i det övre området av fodralet blir relativt varm vid upp till 55 °C (131 °F) när man spelar.
(-) Den maximala temperaturen på ovansidan är 54 °C / 129 F, jämfört med genomsnittet av 40.4 °C / 105 F , allt från 21.2 till 68.8 °C för klassen Gaming.
(-) Botten värms upp till maximalt 46 °C / 115 F, jämfört med genomsnittet av 43.2 °C / 110 F
(+) Vid tomgångsbruk är medeltemperaturen för ovansidan 27.2 °C / 81 F, jämfört med enhetsgenomsnittet på 33.9 °C / ### class_avg_f### F.
(±) När du spelar The Witcher 3 är medeltemperaturen för ovansidan 36 °C / 97 F, jämfört med enhetsgenomsnittet på 33.9 °C / ## #class_avg_f### F.
(+) Handledsstöden och pekplattan är kallare än hudtemperaturen med maximalt 28 °C / 82.4 F och är därför svala att ta på.
(±) Medeltemperaturen för handledsstödsområdet på liknande enheter var 28.8 °C / 83.8 F (+0.8 °C / 1.4 F).
| Asus ROG Strix Scar 18 2023 G834JY-N6005W Intel Core i9-13980HX, NVIDIA GeForce RTX 4090 Laptop GPU | Razer Blade 16 Early 2023 Intel Core i9-13950HX, NVIDIA GeForce RTX 4080 Laptop GPU | MSI Titan GT77 HX 13VI Intel Core i9-13950HX, NVIDIA GeForce RTX 4090 Laptop GPU | MSI Raider GE77 HX 12UHS Intel Core i9-12900HX, NVIDIA GeForce RTX 3080 Ti Laptop GPU | Asus ROG Strix Scar 17 SE G733CX-LL014W Intel Core i9-12950HX, NVIDIA GeForce RTX 3080 Ti Laptop GPU | |
|---|---|---|---|---|---|
| Heat | 9% | 13% | -23% | -4% | |
| Maximum Upper Side * (°C) | 54 | 40 26% | 40.6 25% | 53 2% | 48.8 10% |
| Maximum Bottom * (°C) | 46 | 37.6 18% | 41.1 11% | 58 -26% | 52.4 -14% |
| Idle Upper Side * (°C) | 30 | 32.4 -8% | 26.2 13% | 38 -27% | 30.4 -1% |
| Idle Bottom * (°C) | 31 | 31.4 -1% | 30.3 2% | 43 -39% | 34.1 -10% |
* ... mindre är bättre
Stresstest
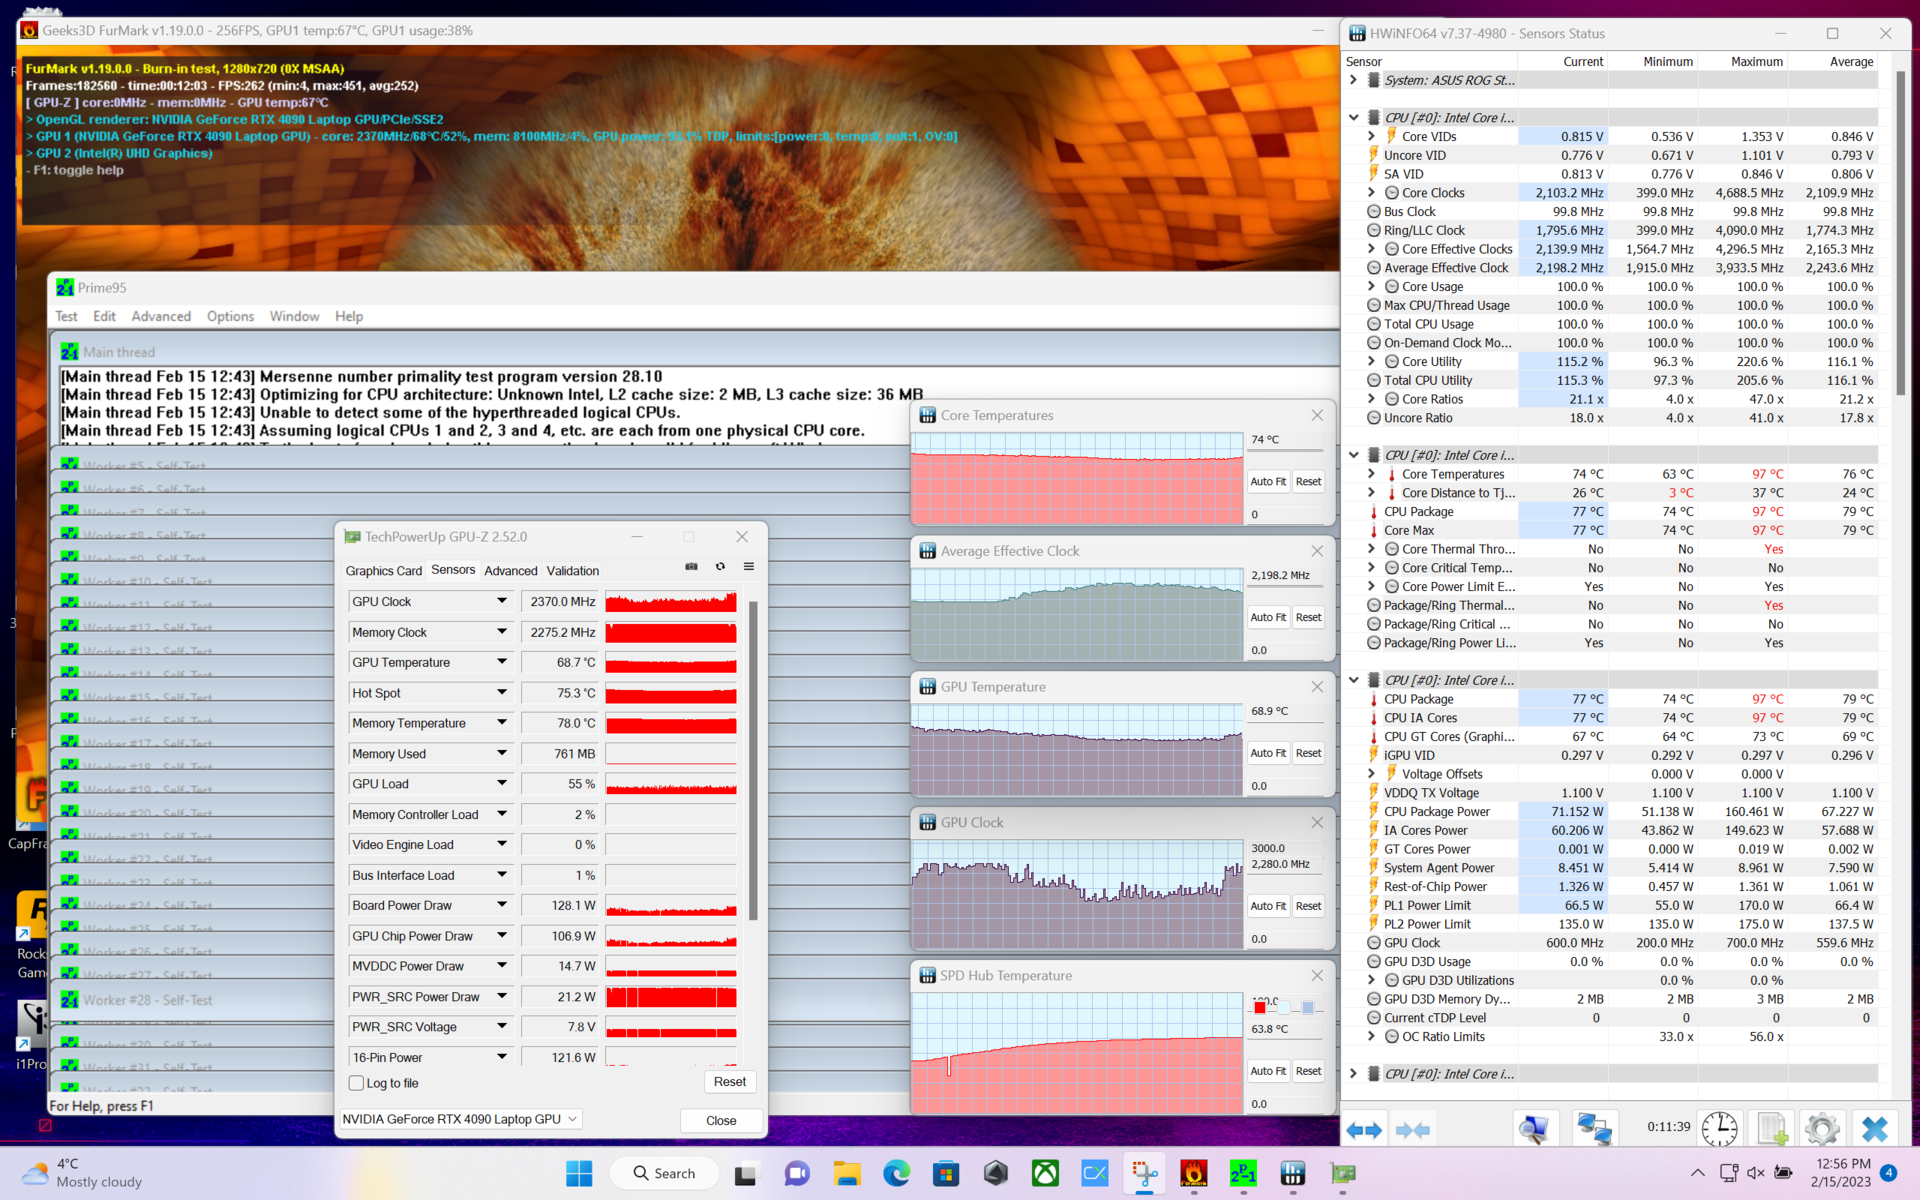
CPU:ns interna temperaturer varierar kraftigt under stresstestet. Detta kan härledas till de ständigt justerade klockfrekvenserna som hela tiden pressar CPU:n nära 100 °C-gränsen. I GPU:n är situationen betydligt mindre kritisk och RTX 4090 når endast en maximal temperatur på 70 °C (158 °F).
Under spelandet förblir CPU-temperaturerna något mindre extrema. Vi mäter mellan 81 °C (178 °F, Cyberpunk 2077) och 90 °C (194 °F, The Witcher 3). Å andra sidan, vid mellan 72 °C (162 °F, Cyberpunk 2077) och 77 °C (171 °F, The Witcher 3), blir GPU:n något varmare än under stresstestet.
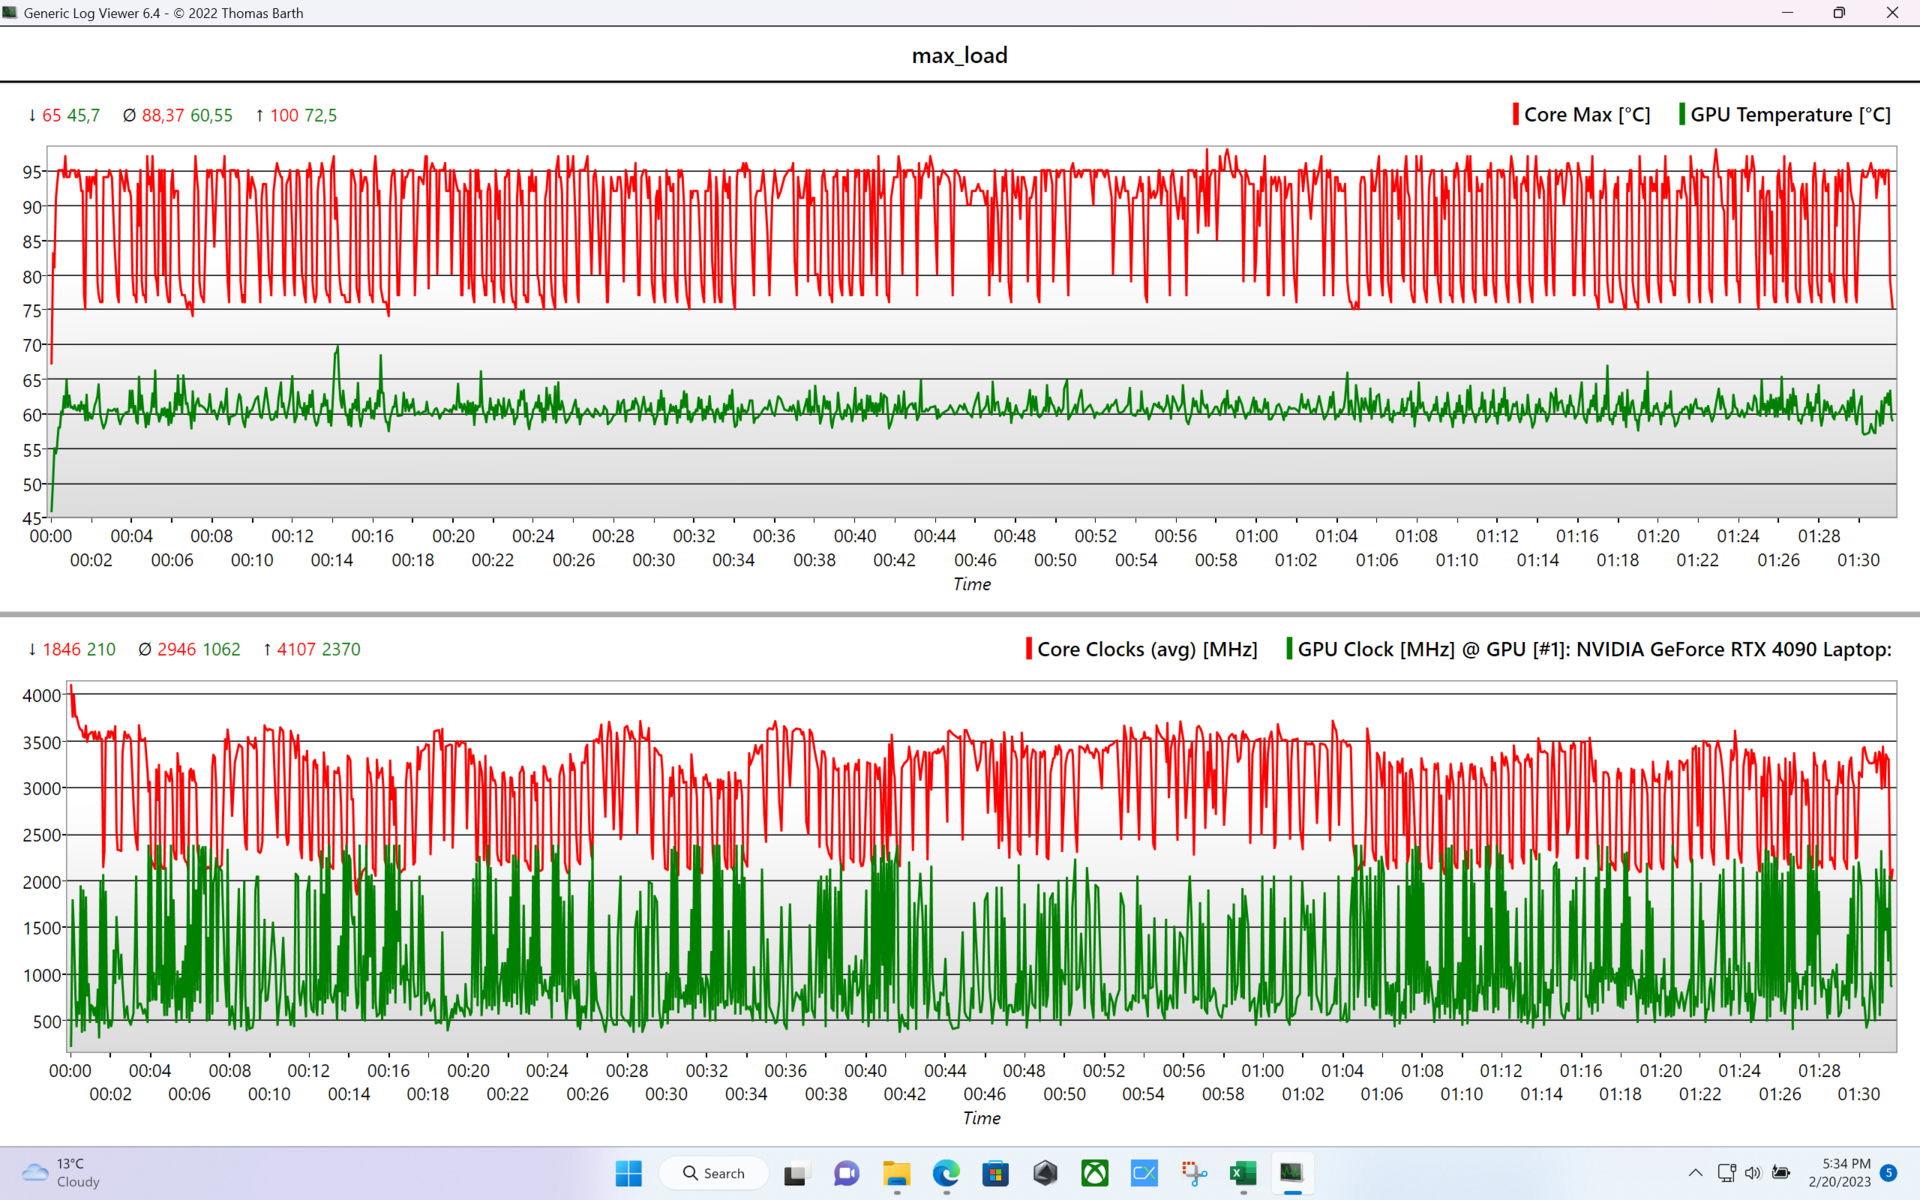
| E-Cores CPU-klocka (GHz) | P-CoresCPU-klocka (GHz) | GPU-klocka (MHz) | Genomsnittlig CPU-temperatur (°C) | Genomsnittlig GPU-temperatur (°C) | |
| System Idle (tyst) | 1.4 | 1.8 | 0 | 42 | 0 |
| System Idle (Turbo) | 1,6 | 2,1 | 210 | 44 | 39 |
| Prime95 Stress (Turbo) | 3 | 3.5 | 210 | 92 | 56 |
| Prime95 + FurMark Stress (Turbo) | 1.6 | 2.1 | 2260 | 80 | 73 |
| Witcher 3 Stress | 3,7 | 4,6 | 1995 | 90 | 77 |
Högtalare
De inbyggda högtalarna är relativt bastunga men ger en subjektivt attraktiv prestanda som är lämplig för den bärbara datorns speländamål. Under vardagliga förhållanden är den maximala volymen också tillräckligt högljudd.
Asus ROG Strix Scar 18 2023 G834JY-N6005W ljudanalys
(+) | högtalare kan spela relativt högt (82.7 dB)
Bas 100 - 315 Hz
(+) | bra bas - bara 4.8% från medianen
(±) | linjäriteten för basen är genomsnittlig (7% delta till föregående frekvens)
Mellan 400 - 2000 Hz
(±) | högre mellan - i genomsnitt 9% högre än median
(+) | mids är linjära (5% delta till föregående frekvens)
Högsta 2 - 16 kHz
(+) | balanserade toppar - endast 3.7% från medianen
(+) | toppar är linjära (6.1% delta till föregående frekvens)
Totalt 100 - 16 000 Hz
(±) | linjäriteten för det totala ljudet är genomsnittlig (19% skillnad mot median)
Jämfört med samma klass
» 63% av alla testade enheter i den här klassen var bättre, 8% liknande, 28% sämre
» Den bästa hade ett delta på 6%, genomsnittet var 18%, sämst var 132%
Jämfört med alla testade enheter
» 45% av alla testade enheter var bättre, 7% liknande, 48% sämre
» Den bästa hade ett delta på 4%, genomsnittet var 24%, sämst var 134%
Apple MacBook Pro 16 2021 M1 Pro ljudanalys
(+) | högtalare kan spela relativt högt (84.7 dB)
Bas 100 - 315 Hz
(+) | bra bas - bara 3.8% från medianen
(+) | basen är linjär (5.2% delta till föregående frekvens)
Mellan 400 - 2000 Hz
(+) | balanserad mellan - endast 1.3% från medianen
(+) | mids är linjära (2.1% delta till föregående frekvens)
Högsta 2 - 16 kHz
(+) | balanserade toppar - endast 1.9% från medianen
(+) | toppar är linjära (2.7% delta till föregående frekvens)
Totalt 100 - 16 000 Hz
(+) | det totala ljudet är linjärt (4.6% skillnad mot median)
Jämfört med samma klass
» 0% av alla testade enheter i den här klassen var bättre, 0% liknande, 100% sämre
» Den bästa hade ett delta på 5%, genomsnittet var 17%, sämst var 45%
Jämfört med alla testade enheter
» 0% av alla testade enheter var bättre, 0% liknande, 100% sämre
» Den bästa hade ett delta på 4%, genomsnittet var 24%, sämst var 134%
Energihantering
Effektförbrukning
På grund av den kraftfulla hårdvaran är systemets energiförbrukning mycket hög. Det som sticker ut är den mycket höga standbyförbrukningen som alltid växlar mellan 5 och 10 watt. Felet kan också vara LED-belysningen med animation även under standby.
| Av/Standby | |
| Låg belastning | |
| Hög belastning |
|
Förklaring:
min: | |
| Asus ROG Strix Scar 18 2023 G834JY-N6005W i9-13980HX, GeForce RTX 4090 Laptop GPU, 2x Samsung PM9A1 MZVL21T0HCLR (RAID 0), IPS, 2560x1600, 18" | Razer Blade 16 Early 2023 i9-13950HX, GeForce RTX 4080 Laptop GPU, SSSTC CA6-8D1024, IPS, 2560x1600, 16" | MSI Titan GT77 HX 13VI i9-13950HX, GeForce RTX 4090 Laptop GPU, Samsung PM9A1 MZVL22T0HBLB, Mini-LED, 3840x2160, 17.3" | MSI Raider GE77 HX 12UHS i9-12900HX, GeForce RTX 3080 Ti Laptop GPU, Samsung PM9A1 MZVL22T0HBLB, IPS, 3840x2160, 17.3" | Asus ROG Strix Scar 17 SE G733CX-LL014W i9-12950HX, GeForce RTX 3080 Ti Laptop GPU, Samsung PM9A1 MZVL22T0HBLB, IPS, 2560x1440, 17.3" | Genomsnitt av klass Gaming | |
|---|---|---|---|---|---|---|
| Power Consumption | 9% | 13% | 15% | 6% | 28% | |
| Idle Minimum * (Watt) | 17.3 | 15.2 12% | 14 19% | 13 25% | 19.3 -12% | 13.1 ? 24% |
| Idle Average * (Watt) | 27 | 22.8 16% | 21.6 20% | 19 30% | 26.5 2% | 18.8 ? 30% |
| Idle Maximum * (Watt) | 46 | 49.8 -8% | 24.8 46% | 29 37% | 27.1 41% | 24.4 ? 47% |
| Load Average * (Watt) | 133 | 121.2 9% | 122.5 8% | 143 -8% | 141 -6% | 108.5 ? 18% |
| Load Maximum * (Watt) | 329 | 273.7 17% | 418 -27% | 352 -7% | 307.9 6% | 254 ? 23% |
| Witcher 3 ultra * (Watt) | 242 | 265 | 247 | 225 |
* ... mindre är bättre
Power Consumption The Witcher 3 / Stress Test
Power Consumption with External Monitor
Batteritid
På grund av de strömslukande komponenterna kan batteriet med en kapacitet på 90 Wh inte producera några rekordvärden. I Optimus-läget (med avaktiverad GPU), Silent-profilen och med ljusstyrkan sänkt till 150 cd/m² kan du ändå arbeta i flera timmar utanför nätet. Vårt WLAN-test pågick i något mer än 7 timmar i det här läget. Om du däremot vill spela spel i batteridrift måste du inte bara nöja dig med en betydligt sämre prestanda, utan batteritiden räckte ändå bara i ungefär en timme i vårt test (utan begränsning av bildfrekvensen) med The Witcher 3.
Batteriet var helt laddat efter 1 timme 40 minuter med systemet avstängt eller 1 timme 45 minuter i tomgångsdrift. Strömförsörjningen gav maximalt 117 watt vid den tidpunkten.
| Asus ROG Strix Scar 18 2023 G834JY-N6005W i9-13980HX, GeForce RTX 4090 Laptop GPU, 90 Wh | Razer Blade 16 Early 2023 i9-13950HX, GeForce RTX 4080 Laptop GPU, 95.2 Wh | MSI Titan GT77 HX 13VI i9-13950HX, GeForce RTX 4090 Laptop GPU, 99.9 Wh | MSI Raider GE77 HX 12UHS i9-12900HX, GeForce RTX 3080 Ti Laptop GPU, 99.99 Wh | Asus ROG Strix Scar 17 SE G733CX-LL014W i9-12950HX, GeForce RTX 3080 Ti Laptop GPU, 90 Wh | Genomsnitt av klass Gaming | |
|---|---|---|---|---|---|---|
| Batteridrifttid | 21% | 6% | 30% | -41% | 26% | |
| H.264 (h) | 7 | 6 -14% | 6.5 -7% | 8.26 ? 18% | ||
| WiFi v1.3 (h) | 7.1 | 6.1 -14% | 5.3 -25% | 5.4 -24% | 4.2 -41% | 6.98 ? -2% |
| Witcher 3 ultra (h) | 0.9 | |||||
| Load (h) | 0.9 | 1.4 56% | 1.4 56% | 2 122% | 1.47 ? 63% | |
| Reader / Idle (h) | 8.9 | 9.8 | 8.71 ? |
För
Emot
Dom
Asus ROG Strix SCAR 18 (2023) G834JY är en bärbar dator för gaming i toppklass som Asus har utrustat med de mest kraftfulla mobila komponenterna som finns tillgängliga för närvarande. Det stora höljet rymmer en mycket bra 18-tums skärm som ger gamers snabba svarstider, G-SYNC och bra bildkvalitet. Men höjdpunkten i G834JY är säkert den kraftfulla hårdvaran med en Core i9-13980HX, GeForce RTX 4090 Laptop GPU (175 W TGP) och RAID-0 NVMe SSD. Även om dessa komponenter producerar en massiv mängd värme under belastning håller Asus detta väl i schack med ett kylsystem med tre fläktar, ett ångkammarvärmeledningsrör och flytande metallpasta.
ROG Strix SCAR 18 är ett väl avrundat helhetspaket med imponerande prestandavärden till ett högt pris.
Våra enda punkter att klaga på är mindre, som spolviftandet i vår testenhet vid höga bildfrekvenser, den dåliga webbkameran eller placeringen av portarna, som kan vara mindre än optimal i vissa fall.
Som alternativ kan du få 18-tumsmodeller med RTX 4090 GPU från Alienware (m18 R1) och Razer (Blade 18). MSI erbjuder den minimalt snabbare Titan GT77 HX 13VI med en 17-tumsskärm. De som kan nöja sig med något mindre prestanda kan ta en titt på de RTX 4080-baserade modellerna, som är betydligt mer prisvärda. G834JZ-versionen av Scar 18 kan också utgöra ett intressant alternativ här.
Pris och tillgänglighet
G834JY-N6000W som vi testade är för närvarande endast tillgänglig i England för £3999.99 (listpris). Vissa amerikanska butiker erbjuder G834JY-XS97 för närvarande för 3899,99 dollar(slut på lager hos Asus), och Amazon erbjuder G834JY-XS97 för 5390 dollar.
Asus ROG Strix Scar 18 2023 G834JY-N6005W
- 03/07/2023 v7 (old)
Klaus Hinum
Genomskinlighet
Valet av enheter som ska granskas görs av vår redaktion. Testprovet gavs till författaren som ett lån av tillverkaren eller återförsäljaren för denna recension. Långivaren hade inget inflytande på denna recension och inte heller fick tillverkaren en kopia av denna recension innan publiceringen. Det fanns ingen skyldighet att publicera denna recension. Som ett oberoende medieföretag är Notebookcheck inte föremål för auktoritet från tillverkare, återförsäljare eller förlag.
This is how Notebookcheck is testingEvery year, Notebookcheck independently reviews hundreds of laptops and smartphones using standardized procedures to ensure that all results are comparable. We have continuously developed our test methods for around 20 years and set industry standards in the process. In our test labs, high-quality measuring equipment is utilized by experienced technicians and editors. These tests involve a multi-stage validation process. Our complex rating system is based on hundreds of well-founded measurements and benchmarks, which maintains objectivity.
Price comparison

