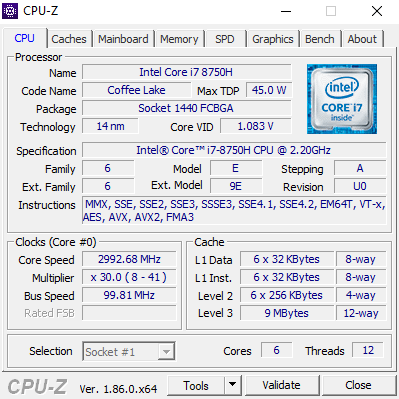
Test: MSI P65 Creator 8RF (i7-8750H, GTX 1070 Max-Q, 512 GB SSD, 144 Hz) Laptop (Sammanfattning)


| |||||||||||||||||||||||||
Distribution av ljusstyrkan: 85 %
Mitt på batteriet: 238 cd/m²
Kontrast: 1068:1 (Svärta: 0.22 cd/m²)
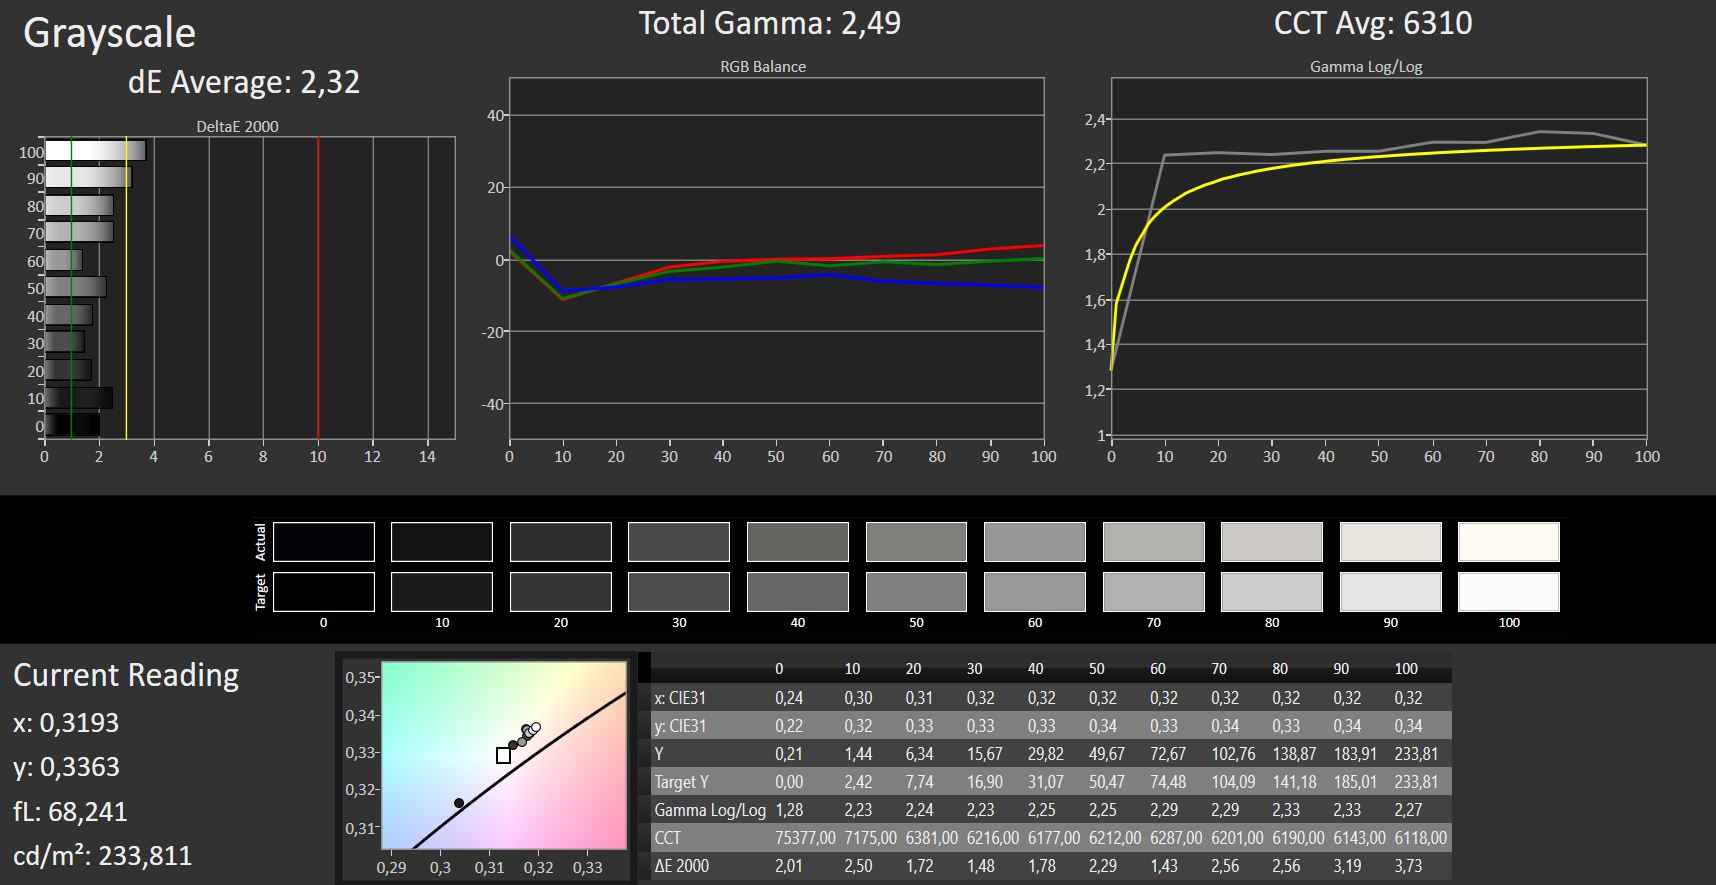
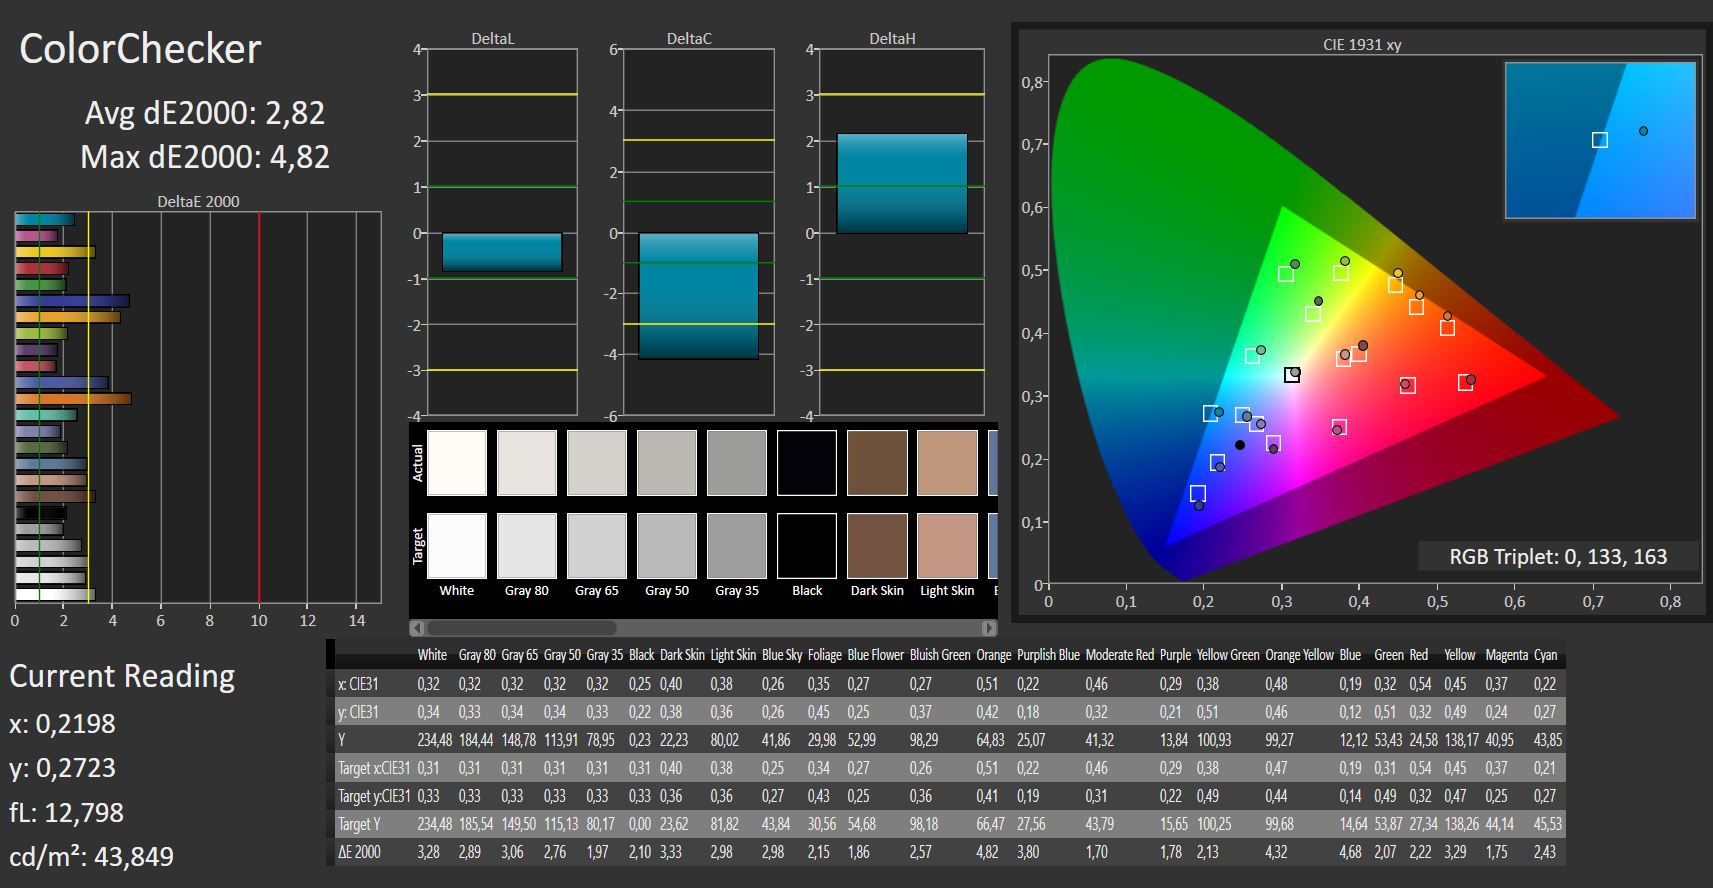
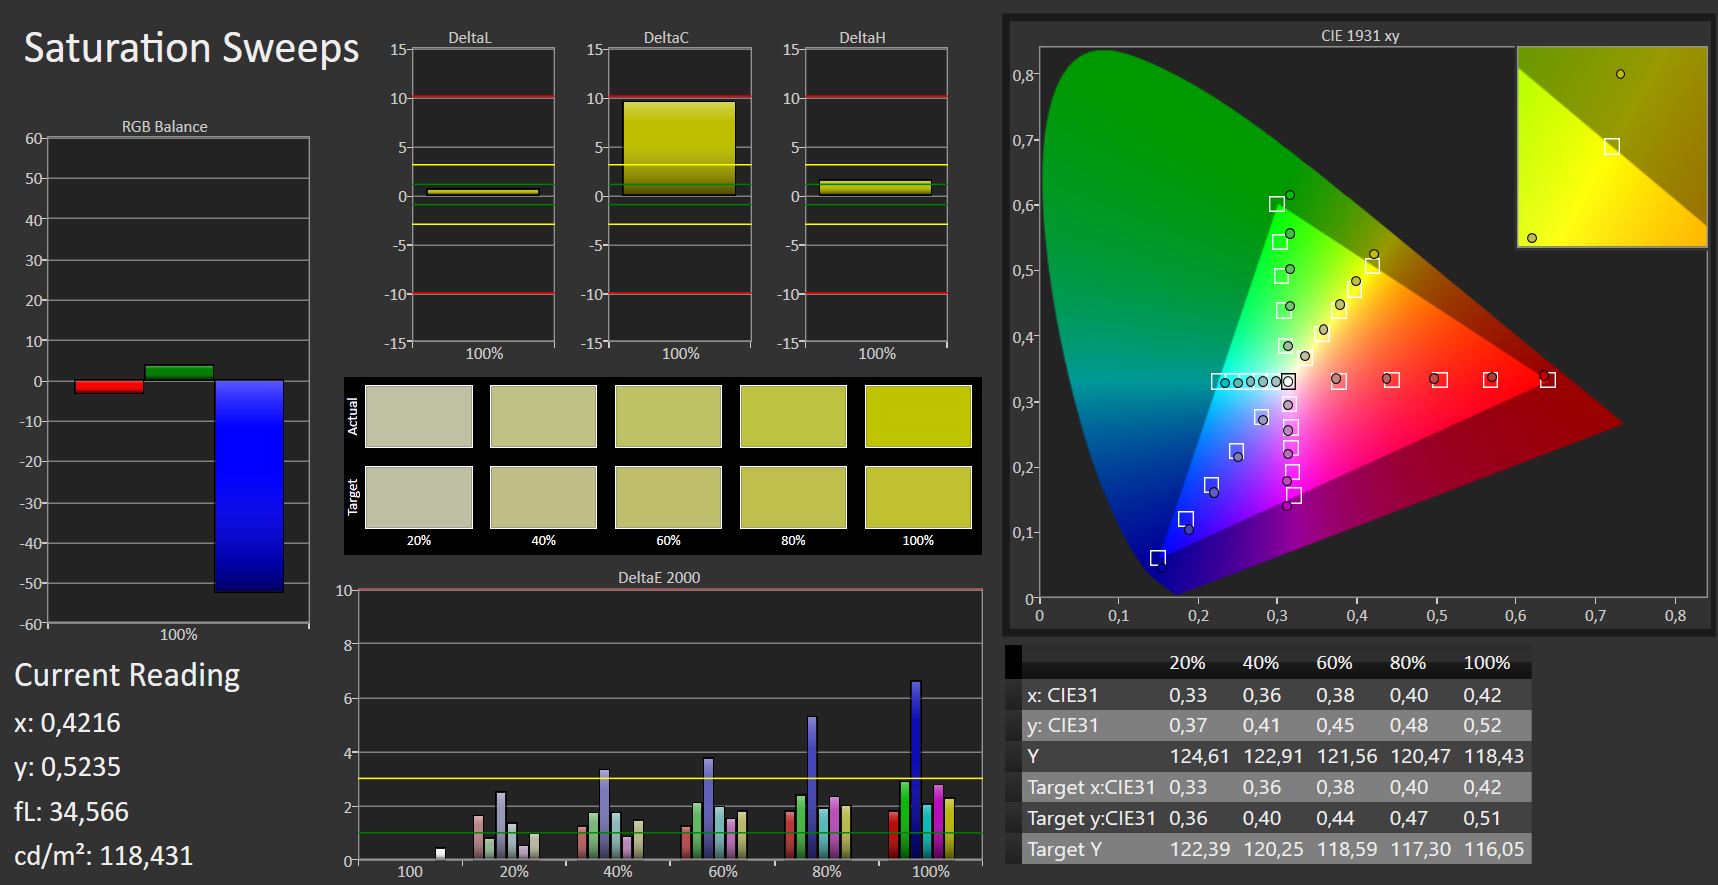
ΔE ColorChecker Calman: 2.82 | ∀{0.5-29.43 Ø4.73}
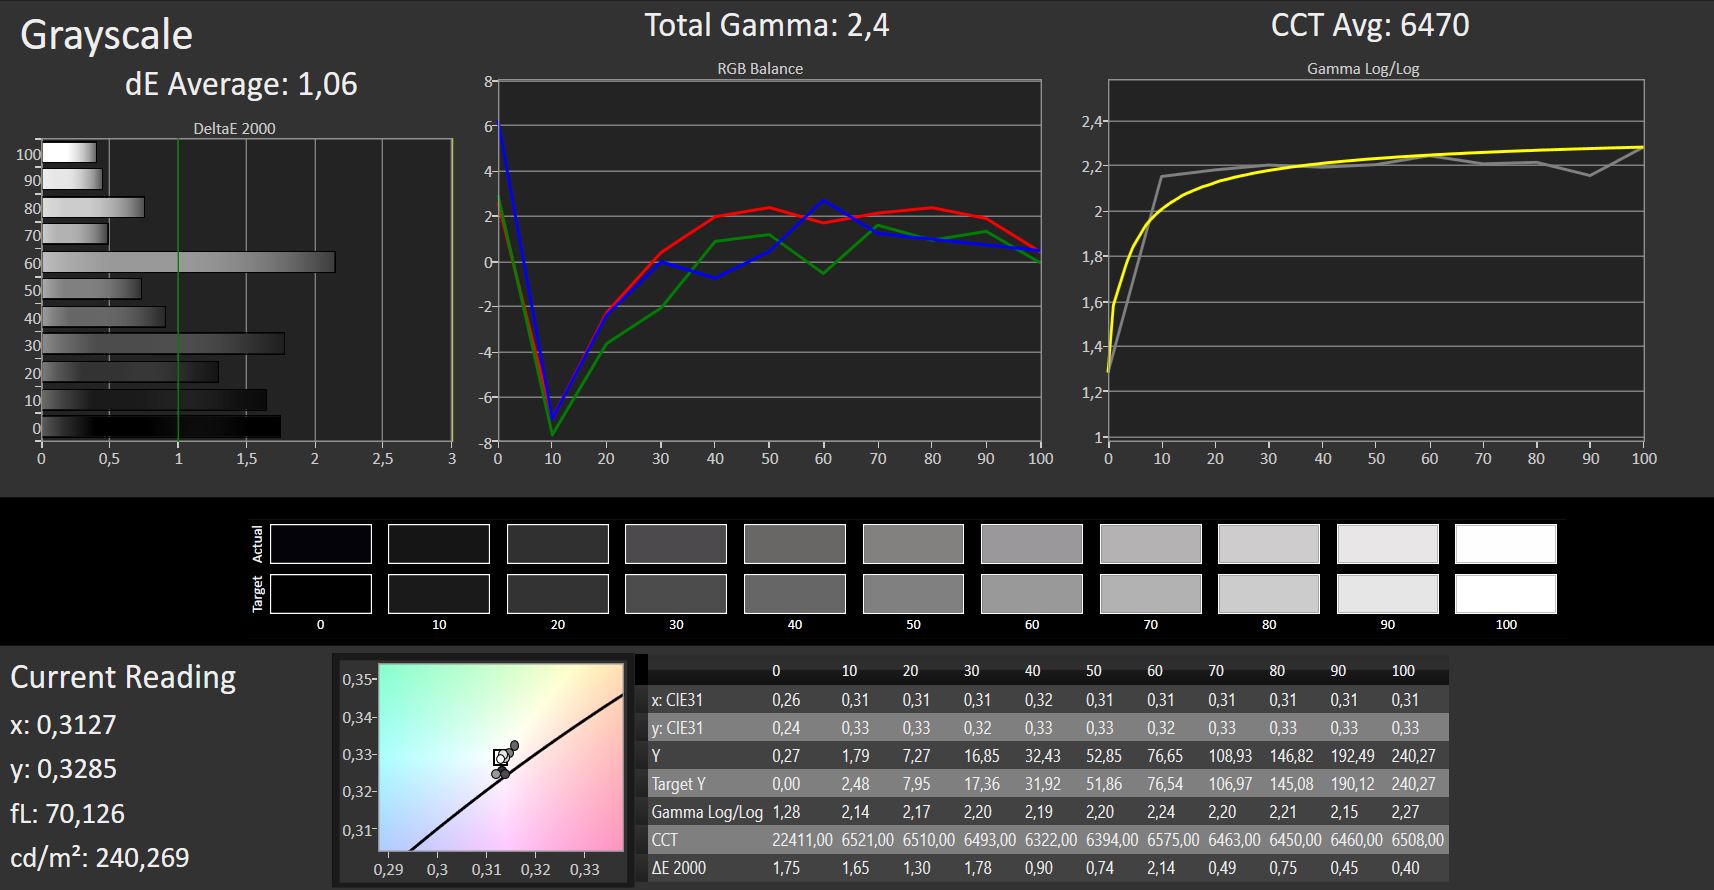
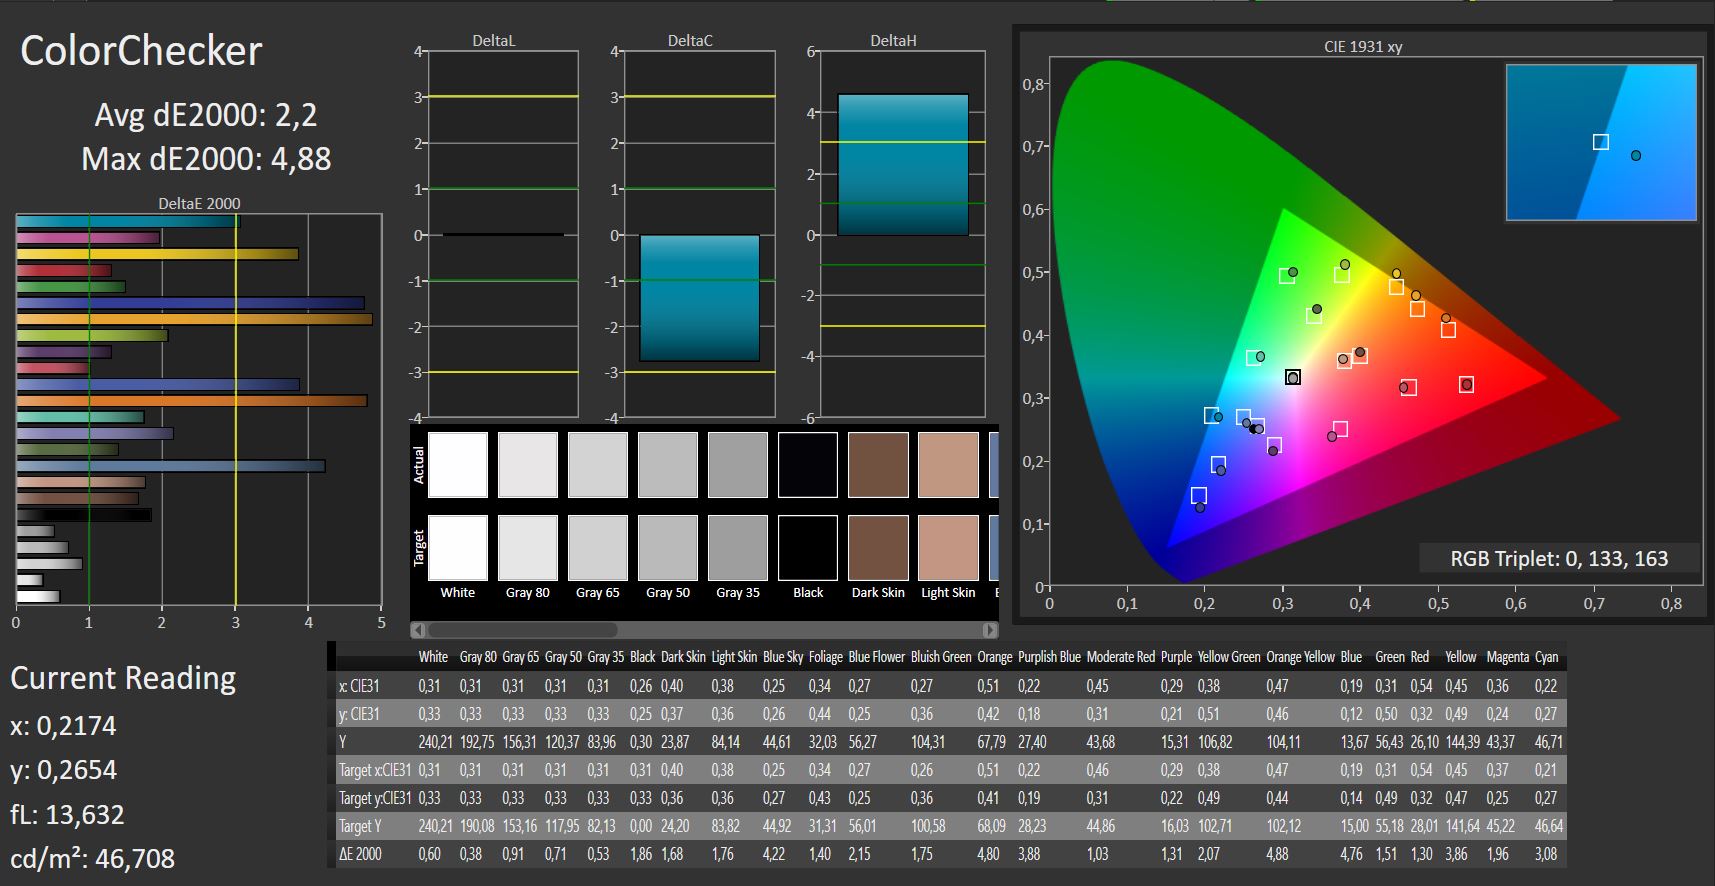
calibrated: 4.88
ΔE Greyscale Calman: 2.32 | ∀{0.09-98 Ø4.97}
92% sRGB (Argyll 1.6.3 3D)
59% AdobeRGB 1998 (Argyll 1.6.3 3D)
65.9% AdobeRGB 1998 (Argyll 3D)
91.1% sRGB (Argyll 3D)
65.1% Display P3 (Argyll 3D)
Gamma: 2.49
CCT: 6310 K
| MSI P65 8RF-451 - Creator AU Optronics B156HAN08.0 (AUO80ED), IPS, 1920x1080, 15.6" | Asus ZenBook Pro 15 UX580GE AU Optronics B156ZAN03.1, IPS, 3840x2160, 15.6" | Gigabyte Aero 15X v8 LGD05C0, IPS, 1920x1080, 15.6" | Asus GL504GS AU Optronics B156HAN08.2 (AUO82ED), IPS, 1920x1080, 15.6" | MSI GS65 8RF-019DE Stealth Thin AU Optronics B156HAN08.0 (AUO80ED), IPS, 1920x1080, 15.6" | Lenovo ThinkPad X1 Extreme-20MF000XGE B156ZAN03.2, IPS, 3840x2160, 15.6" | |
|---|---|---|---|---|---|---|
| Display | 31% | -0% | 0% | 2% | 31% | |
| Display P3 Coverage (%) | 65.1 | 85.9 32% | 63.6 -2% | 66.4 2% | 66.2 2% | 86.3 33% |
| sRGB Coverage (%) | 91.1 | 100 10% | 93.8 3% | 90.2 -1% | 92.1 1% | 100 10% |
| AdobeRGB 1998 Coverage (%) | 65.9 | 99.1 50% | 64.9 -2% | 66 0% | 67.2 2% | 99.4 51% |
| Response Times | -141% | -4% | 38% | -13% | -238% | |
| Response Time Grey 50% / Grey 80% * (ms) | 16 ? | 44 ? -175% | 16.8 ? -5% | 7.2 ? 55% | 17.6 ? -10% | 61.6 ? -285% |
| Response Time Black / White * (ms) | 11 ? | 22.8 ? -107% | 11.2 ? -2% | 8.8 ? 20% | 12.8 ? -16% | 32 ? -191% |
| PWM Frequency (Hz) | ||||||
| Screen | -2% | 18% | 3% | 13% | 2% | |
| Brightness middle (cd/m²) | 235 | 357.6 52% | 313 33% | 271 15% | 254 8% | 396 69% |
| Brightness (cd/m²) | 235 | 350 49% | 300 28% | 261 11% | 262 11% | 380 62% |
| Brightness Distribution (%) | 85 | 85 0% | 78 -8% | 86 1% | 89 5% | 90 6% |
| Black Level * (cd/m²) | 0.22 | 0.35 -59% | 0.33 -50% | 0.32 -45% | 0.22 -0% | 0.28 -27% |
| Contrast (:1) | 1068 | 1022 -4% | 948 -11% | 847 -21% | 1155 8% | 1414 32% |
| Colorchecker dE 2000 * | 2.82 | 4.12 -46% | 1.29 54% | 2.61 7% | 2.37 16% | 4 -42% |
| Colorchecker dE 2000 max. * | 4.82 | 9.91 -106% | 2.04 58% | 4.93 -2% | 4.71 2% | 7.6 -58% |
| Colorchecker dE 2000 calibrated * | 4.88 | 4.23 13% | 2.33 52% | 1.84 62% | 0.9 82% | |
| Greyscale dE 2000 * | 2.32 | 1.8 22% | 0.69 70% | 1.97 15% | 1.58 32% | 6.1 -163% |
| Gamma | 2.49 88% | 2.17 101% | 2.43 91% | 2.4 92% | 2.48 89% | 2.25 98% |
| CCT | 6310 103% | 6613 98% | 6550 99% | 6398 102% | 6785 96% | 7786 83% |
| Color Space (Percent of AdobeRGB 1998) (%) | 59 | 87.5 48% | 60 2% | 59 0% | 60 2% | 88.5 50% |
| Color Space (Percent of sRGB) (%) | 92 | 100 9% | 94 2% | 90 -2% | 92 0% | 100 9% |
| Totalt genomsnitt (program/inställningar) | -37% /
-13% | 5% /
11% | 14% /
7% | 1% /
8% | -68% /
-23% |
* ... mindre är bättre

Visa svarstider
| ↔ Svarstid svart till vitt | ||
|---|---|---|
| 11 ms ... stiga ↗ och falla ↘ kombinerat | ↗ 7 ms stiga | 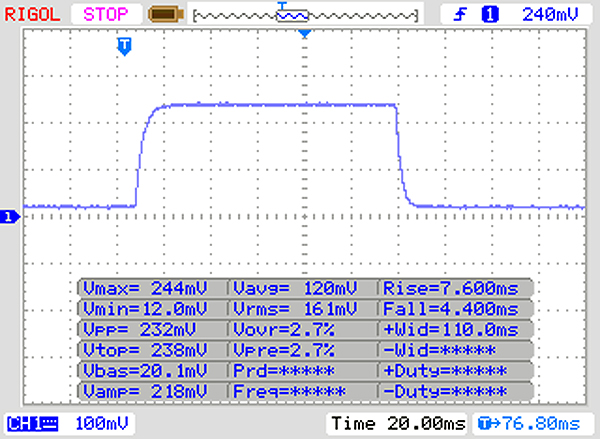 |
| ↘ 4 ms hösten | ||
| Skärmen visar bra svarsfrekvens i våra tester, men kan vara för långsam för konkurrenskraftiga spelare. I jämförelse sträcker sig alla testade enheter från 0.1 (minst) till 240 (maximalt) ms. » 29 % av alla enheter är bättre. Det betyder att den uppmätta svarstiden är bättre än genomsnittet av alla testade enheter (19.9 ms). | ||
| ↔ Svarstid 50 % grått till 80 % grått | ||
| 16 ms ... stiga ↗ och falla ↘ kombinerat | ↗ 9 ms stiga | 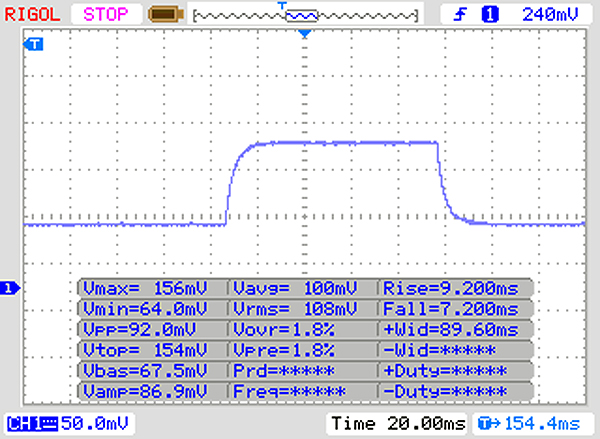 |
| ↘ 7 ms hösten | ||
| Skärmen visar bra svarsfrekvens i våra tester, men kan vara för långsam för konkurrenskraftiga spelare. I jämförelse sträcker sig alla testade enheter från 0.165 (minst) till 636 (maximalt) ms. » 30 % av alla enheter är bättre. Det betyder att den uppmätta svarstiden är bättre än genomsnittet av alla testade enheter (31.1 ms). | ||
Skärmflimmer / PWM (Puls-Width Modulation)
| Skärmflimmer / PWM upptäcktes inte | 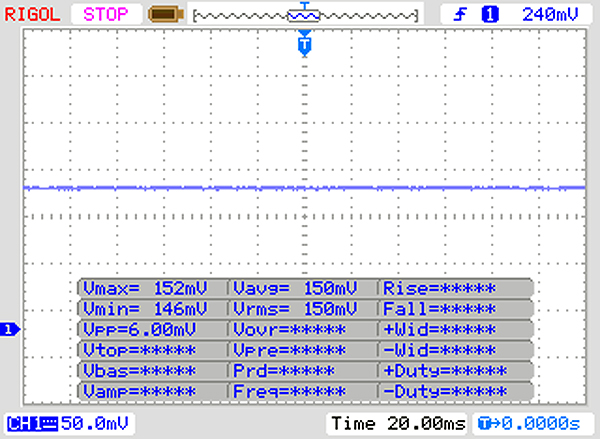 | ||
Som jämförelse: 52 % av alla testade enheter använder inte PWM för att dämpa skärmen. Om PWM upptäcktes mättes ett medelvärde av 7798 (minst: 5 - maximum: 343500) Hz. | |||
| HWBOT x265 Benchmark v2.2 - 4k Preset | |
| Genomsnitt av klass Multimedia (5.26 - 36.1, n=63, senaste 2 åren) | |
| Genomsnitt Intel Core i7-8750H (7.56 - 9.55, n=5) | |
| MSI P65 8RF-451 - Creator | |
| Blender - v2.79 BMW27 CPU | |
| MSI P65 8RF-451 - Creator | |
| Genomsnitt Intel Core i7-8750H (396 - 486, n=6) | |
| Genomsnitt av klass Multimedia (100 - 557, n=65, senaste 2 åren) | |
* ... mindre är bättre
| PCMark 8 Home Score Accelerated v2 | 4446 poäng | |
| PCMark 8 Creative Score Accelerated v2 | 5264 poäng | |
| PCMark 8 Work Score Accelerated v2 | 5651 poäng | |
| PCMark 10 Score | 4910 poäng | |
Hjälp | ||
| MSI P65 8RF-451 - Creator Kingston RBUSNS8154P3512GJ | Asus ZenBook Pro 15 UX580GE Samsung SSD PM961 1TB M.2 PCIe 3.0 x4 NVMe (MZVLW1T0) | Gigabyte Aero 15X v8 Toshiba NVMe THNSN5512GPU7 | Asus GL504GS Samsung SSD PM981 MZVLB512HAJQ | MSI GS65 8RF-019DE Stealth Thin Samsung SSD PM981 MZVLB512HAJQ | Lenovo ThinkPad X1 Extreme-20MF000XGE Samsung SSD PM981 MZVLB1T0HALR | |
|---|---|---|---|---|---|---|
| CrystalDiskMark 5.2 / 6 | 33% | 21% | 42% | 35% | 71% | |
| Write 4K (MB/s) | 89.2 | 125 40% | 94.4 6% | 97.9 10% | 95.3 7% | 123.7 39% |
| Read 4K (MB/s) | 34.36 | 44.68 30% | 37.65 10% | 41.23 20% | 40.13 17% | 44.07 28% |
| Write Seq (MB/s) | 949 | 1059 12% | 1335 41% | 1852 95% | 1883 98% | 2215 133% |
| Read Seq (MB/s) | 899 | 772 -14% | 1404 56% | 1761 96% | 1322 47% | 2242 149% |
| Write 4K Q32T1 (MB/s) | 371.4 | 507 37% | 268.6 -28% | 297.7 -20% | 309.9 -17% | 313.9 -15% |
| Read 4K Q32T1 (MB/s) | 399 | 614 54% | 332.8 -17% | 344.2 -14% | 353.7 -11% | 359.8 -10% |
| Write Seq Q32T1 (MB/s) | 1035 | 1763 70% | 1375 33% | 1864 80% | 1919 85% | 2404 132% |
| Read Seq Q32T1 (MB/s) | 1603 | 2171 35% | 2627 64% | 2738 71% | 2466 54% | 3333 108% |
| AS SSD | 72% | 19% | 83% | 72% | 123% | |
| Seq Read (MB/s) | 850 | 2099 147% | 2213 160% | 1837 116% | 1266 49% | 2703 218% |
| Seq Write (MB/s) | 869 | 1729 99% | 1163 34% | 1730 99% | 1834 111% | 2336 169% |
| 4K Read (MB/s) | 36.43 | 37.78 4% | 23.36 -36% | 53.3 46% | 48.94 34% | 56.8 56% |
| 4K Write (MB/s) | 84.4 | 100.9 20% | 80.4 -5% | 105.7 25% | 107.2 27% | 130.9 55% |
| 4K-64 Read (MB/s) | 839 | 1431 71% | 847 1% | 1305 56% | 1170 39% | 1805 115% |
| 4K-64 Write (MB/s) | 602 | 1273 111% | 742 23% | 1704 183% | 1760 192% | 1782 196% |
| Access Time Read * (ms) | 0.104 | 0.04 62% | 0.119 -14% | 0.049 53% | 0.073 30% | 0.034 67% |
| Access Time Write * (ms) | 0.044 | 0.036 18% | 0.046 -5% | 0.035 20% | 0.035 20% | 0.028 36% |
| Score Read (Points) | 960 | 1679 75% | 1092 14% | 1542 61% | 1346 40% | 2132 122% |
| Score Write (Points) | 773 | 1547 100% | 939 21% | 1983 157% | 2051 165% | 2147 178% |
| Score Total (Points) | 2233 | 4065 82% | 2536 14% | 4318 93% | 4122 85% | 5355 140% |
| Totalt genomsnitt (program/inställningar) | 53% /
55% | 20% /
20% | 63% /
66% | 54% /
56% | 97% /
101% |
* ... mindre är bättre

| LuxMark v2.0 64Bit | |
| Room GPUs-only | |
| Genomsnitt NVIDIA GeForce GTX 1070 Max-Q (2460 - 2586, n=2) | |
| MSI P65 8RF-451 - Creator | |
| MSI WS63 7RF-290US | |
| Asus ZenBook Pro 15 UX580GE | |
| Genomsnitt av klass Multimedia (603 - 1429, n=5, senaste 2 åren) | |
| Sala GPUs-only | |
| MSI P65 8RF-451 - Creator | |
| Genomsnitt NVIDIA GeForce GTX 1070 Max-Q (4877 - 4998, n=2) | |
| MSI WS63 7RF-290US | |
| Asus ZenBook Pro 15 UX580GE | |
| Genomsnitt av klass Multimedia (801 - 3762, n=5, senaste 2 åren) | |
| 3DMark 06 Standard Score | 33475 poäng | |
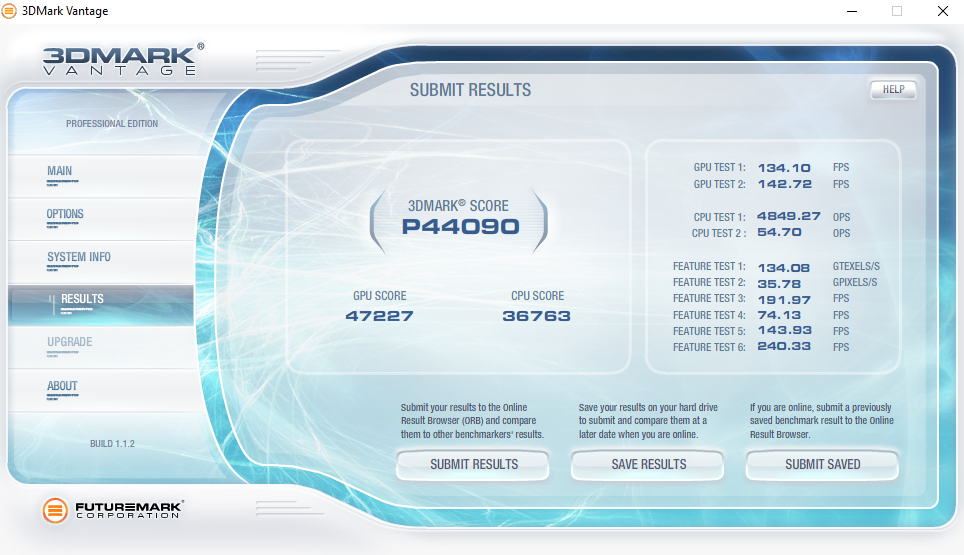
| 3DMark Vantage P Result | 44090 poäng | |
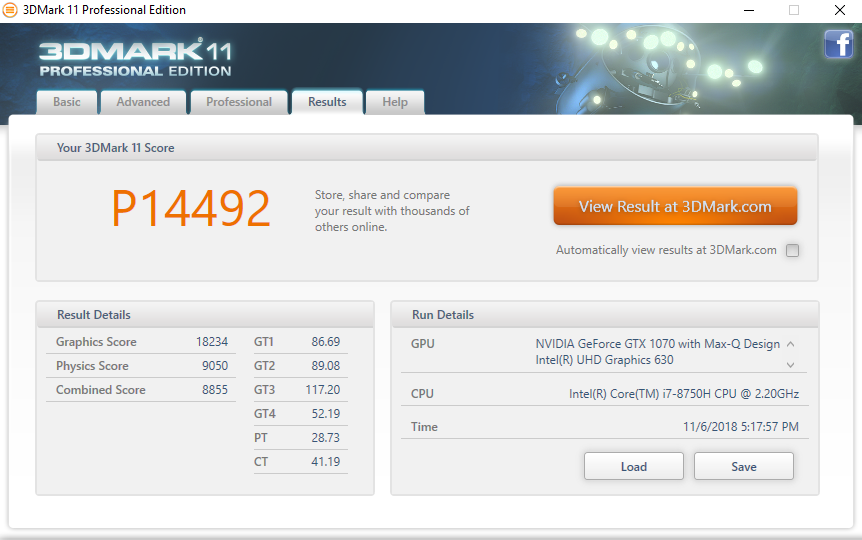
| 3DMark 11 Performance | 14492 poäng | |
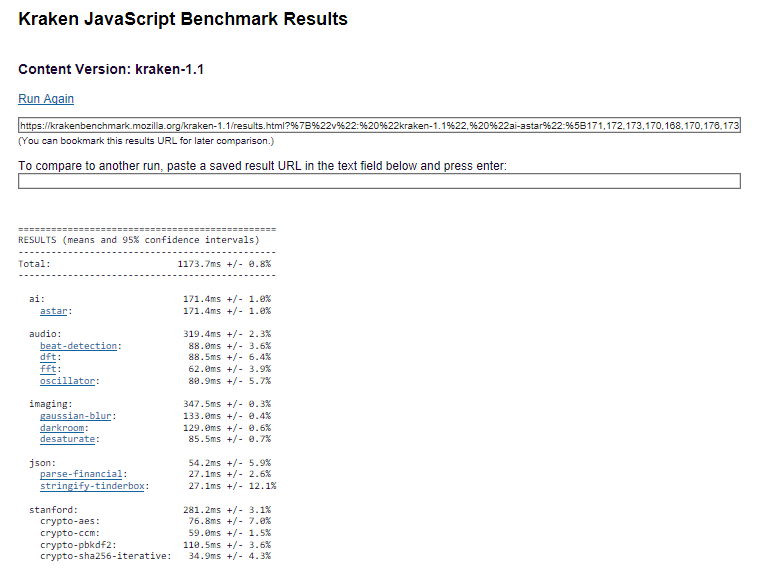
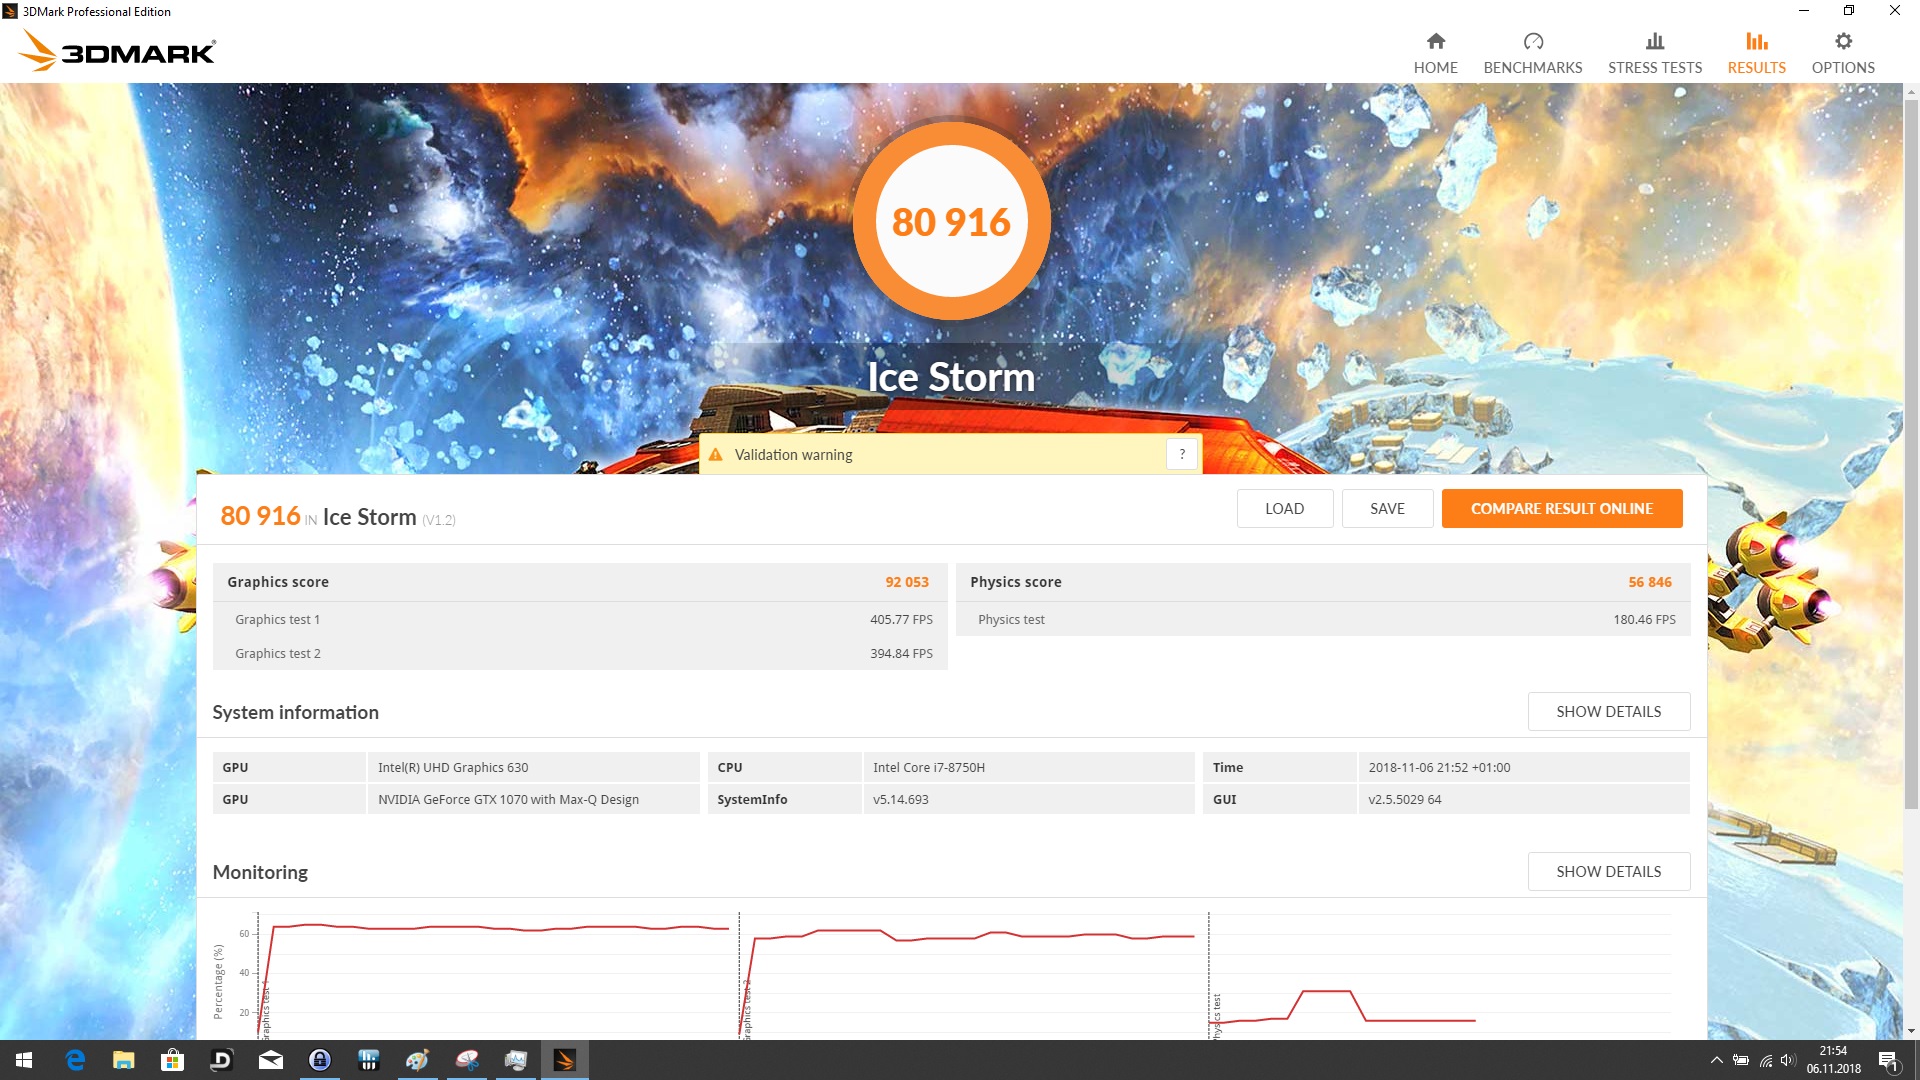
| 3DMark Ice Storm Standard Score | 80916 poäng | |
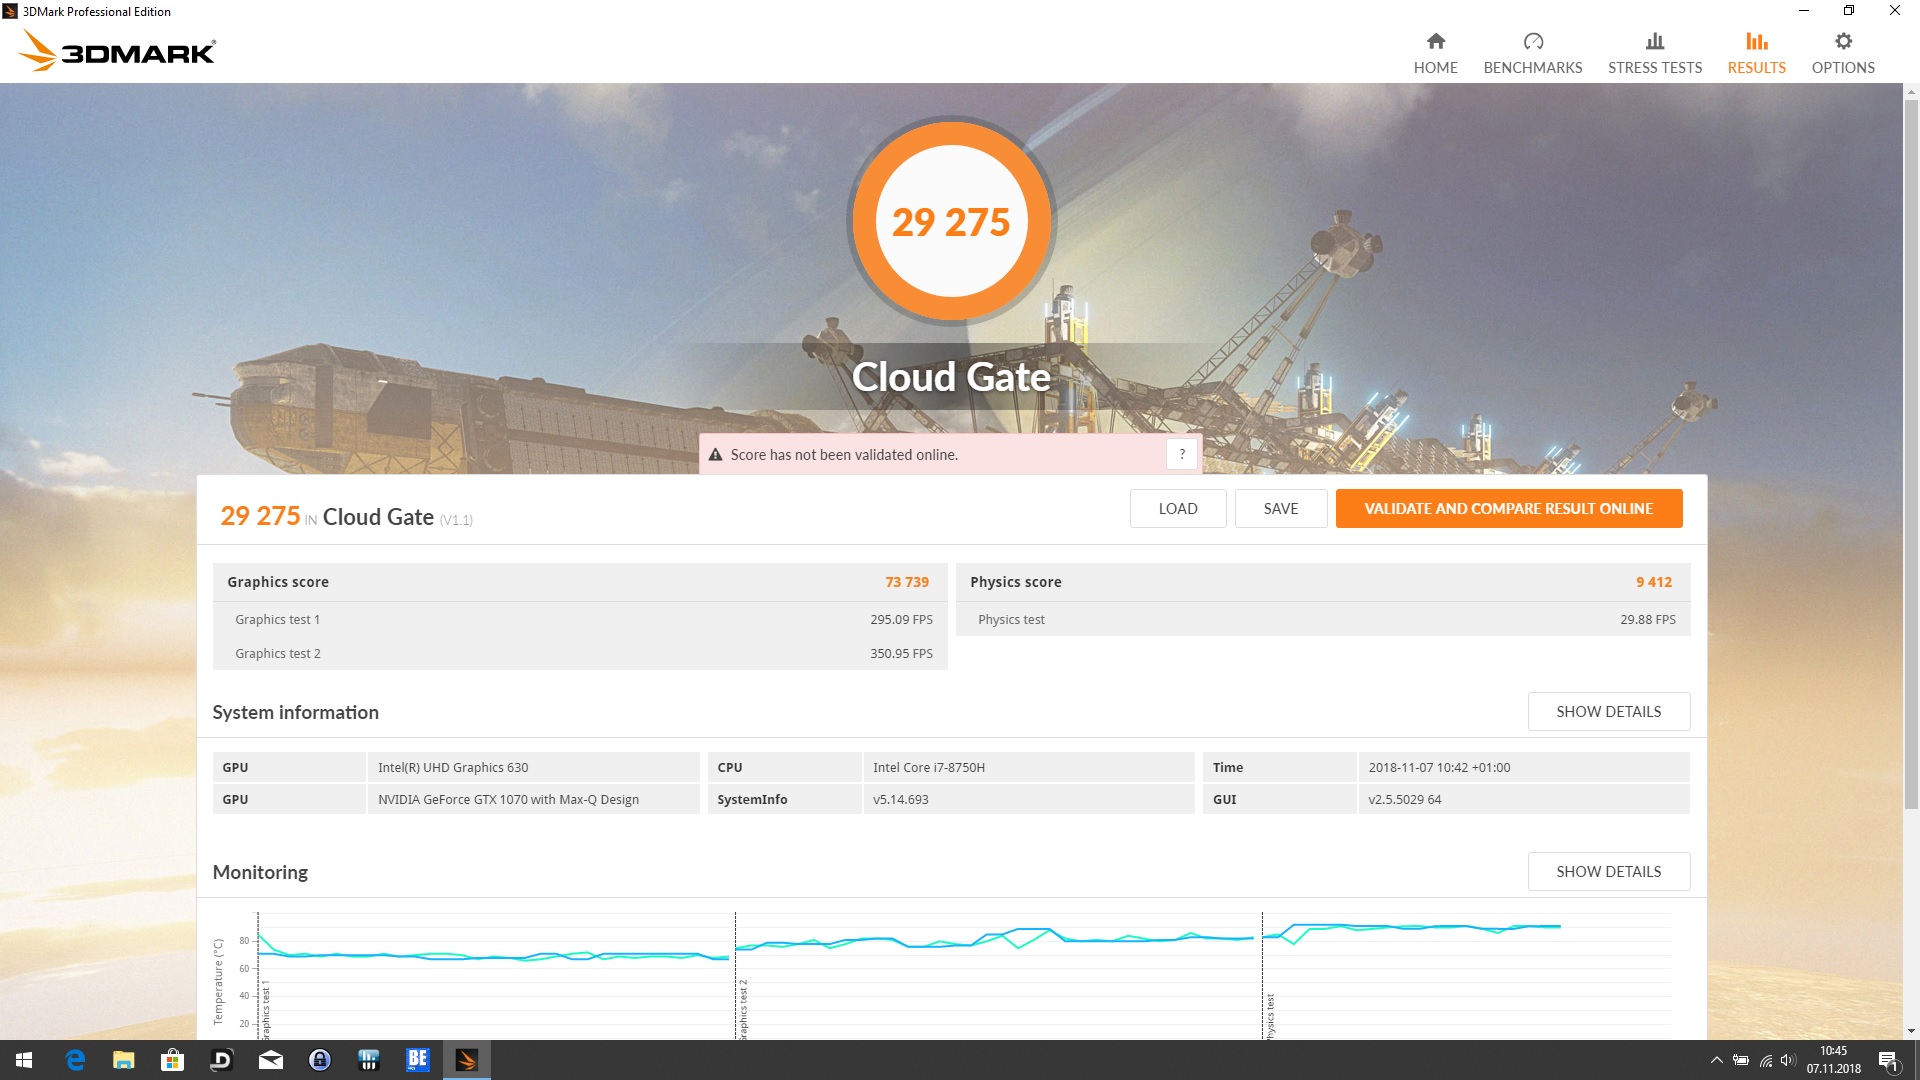
| 3DMark Cloud Gate Standard Score | 29275 poäng | |
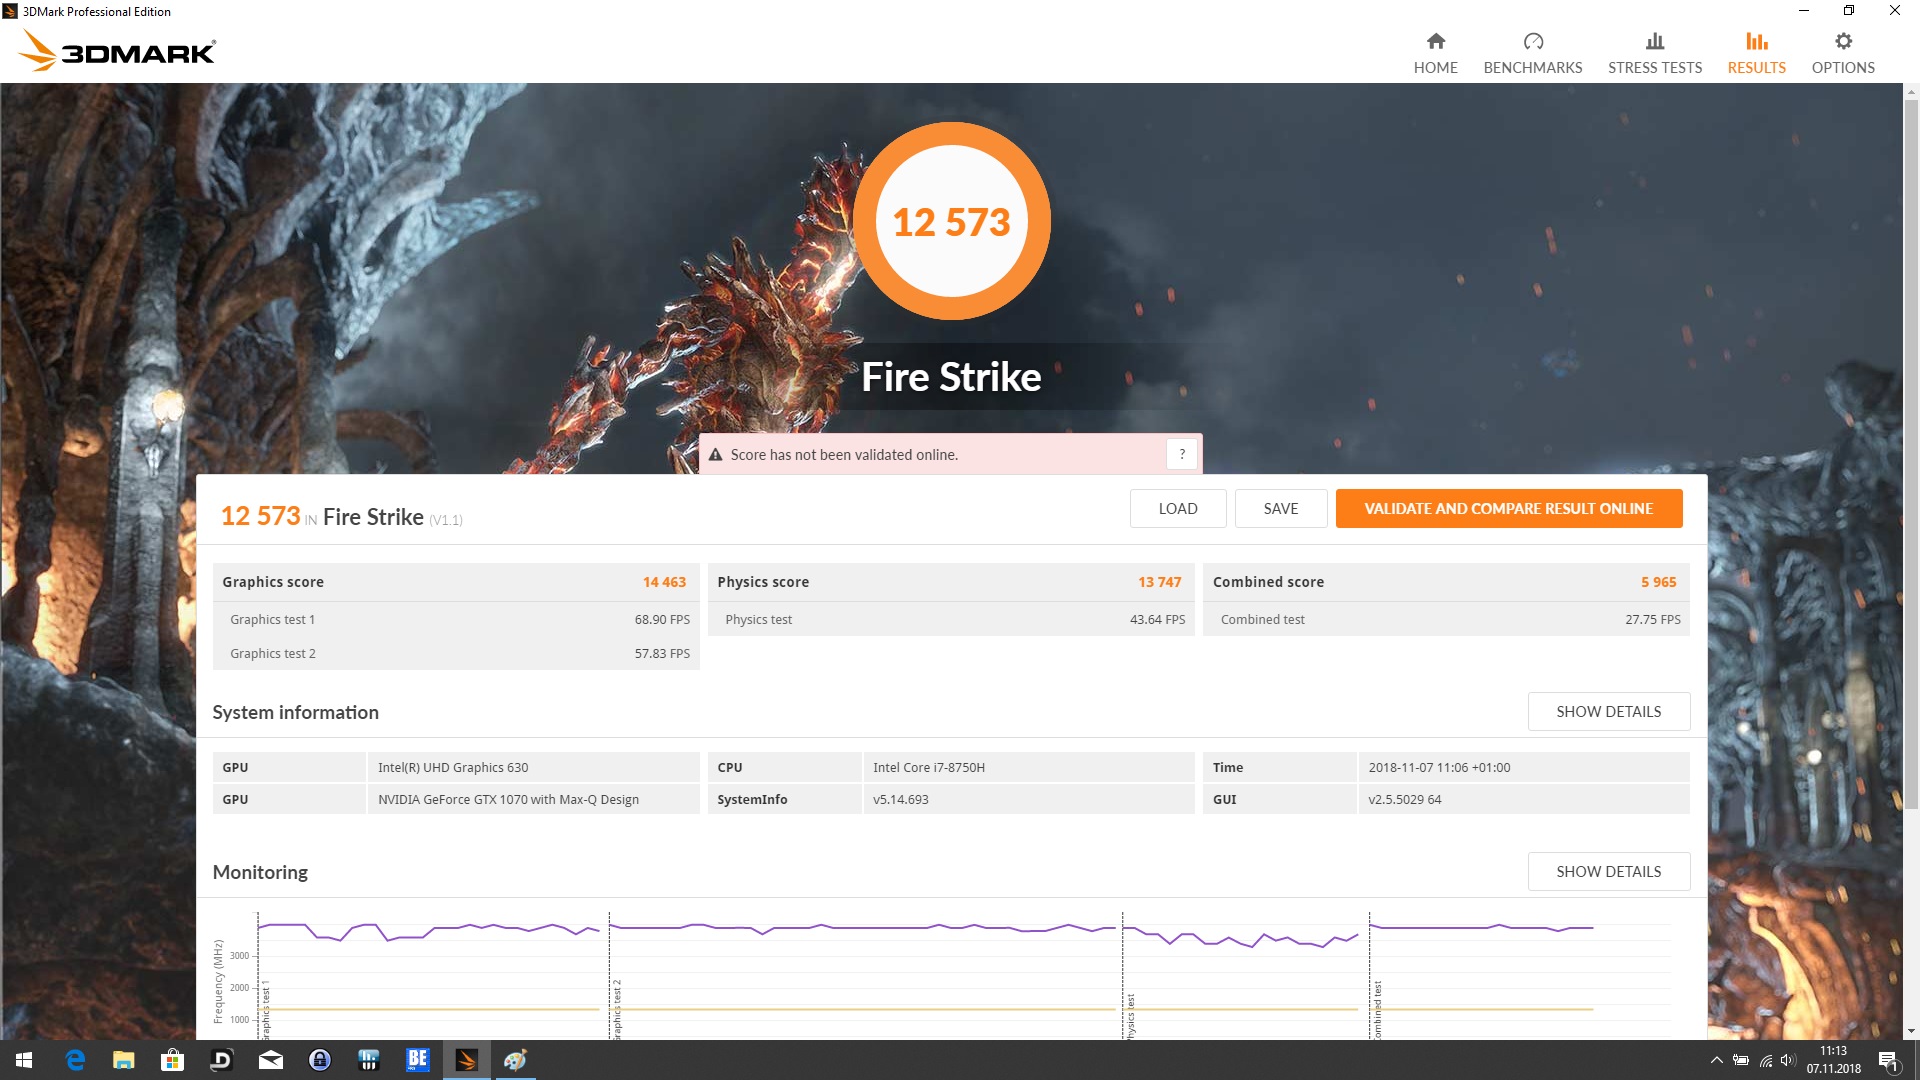
| 3DMark Fire Strike Score | 12573 poäng | |
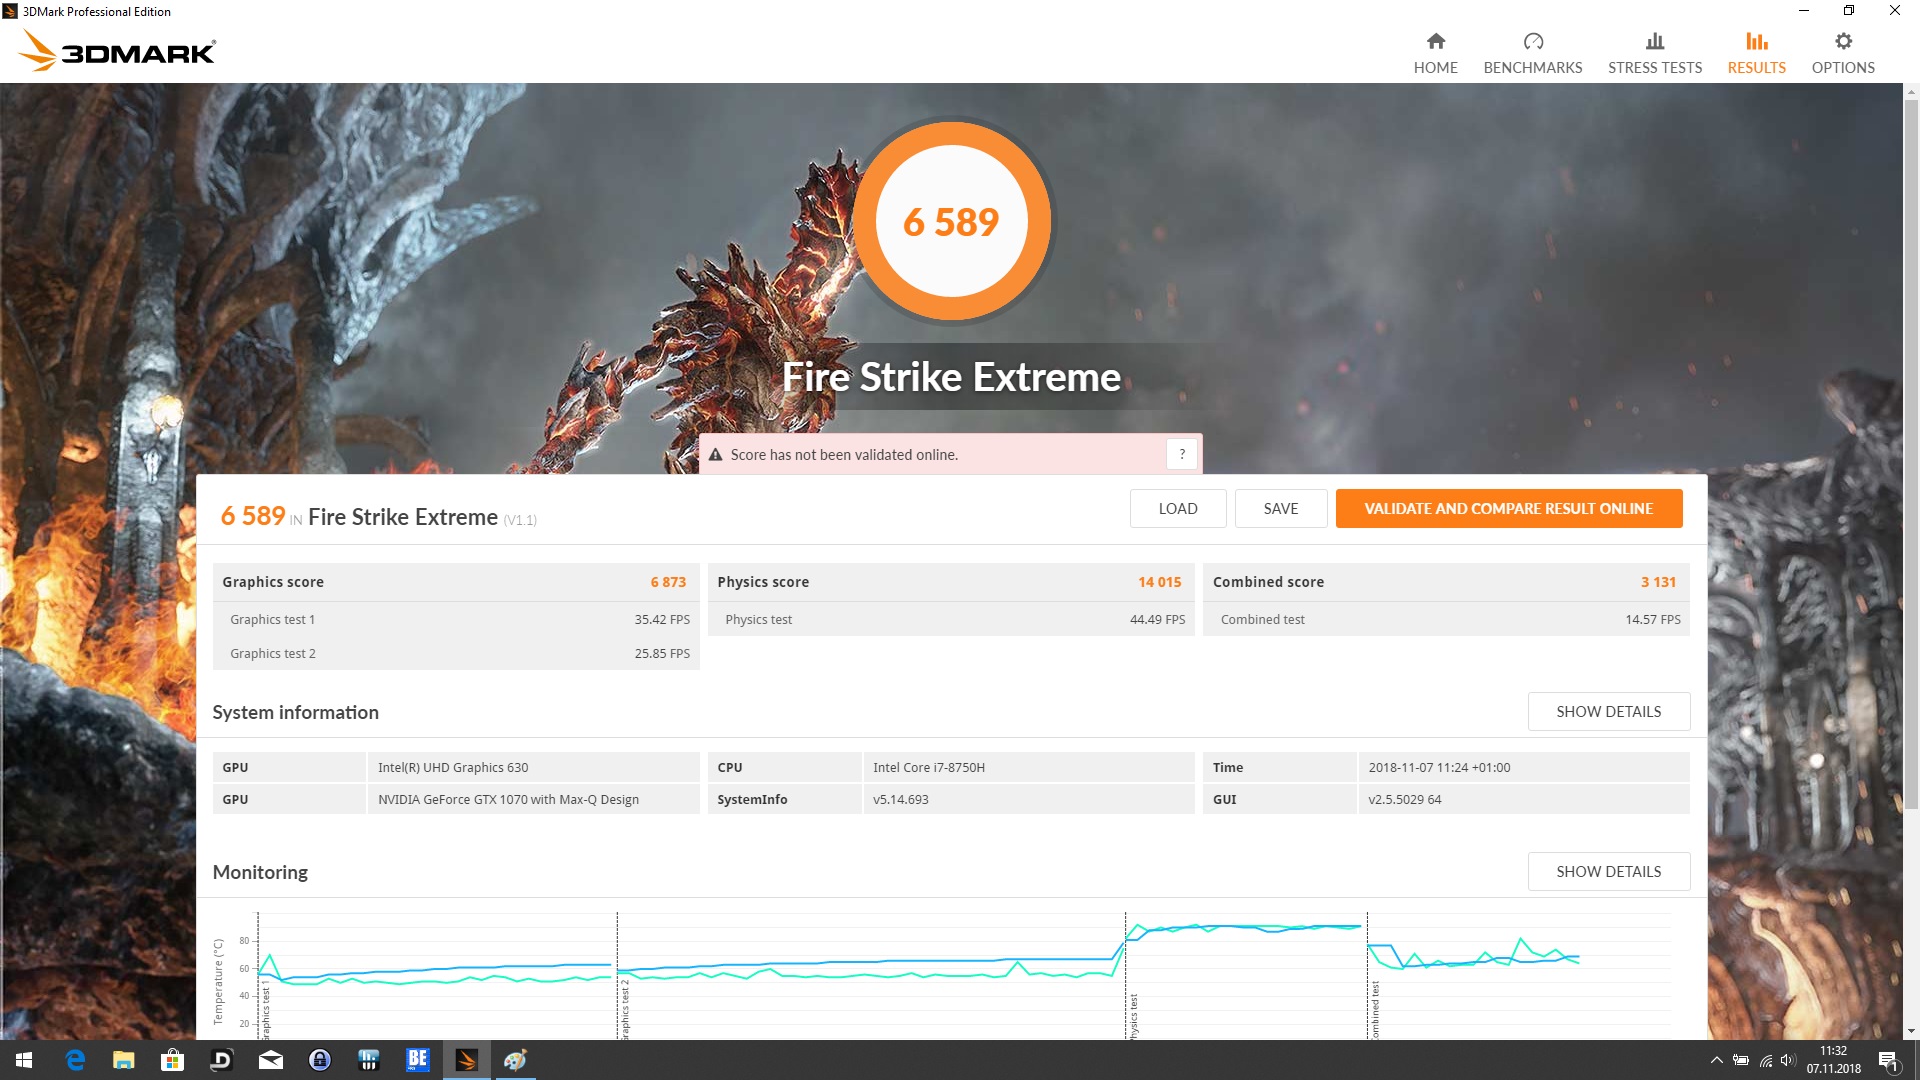
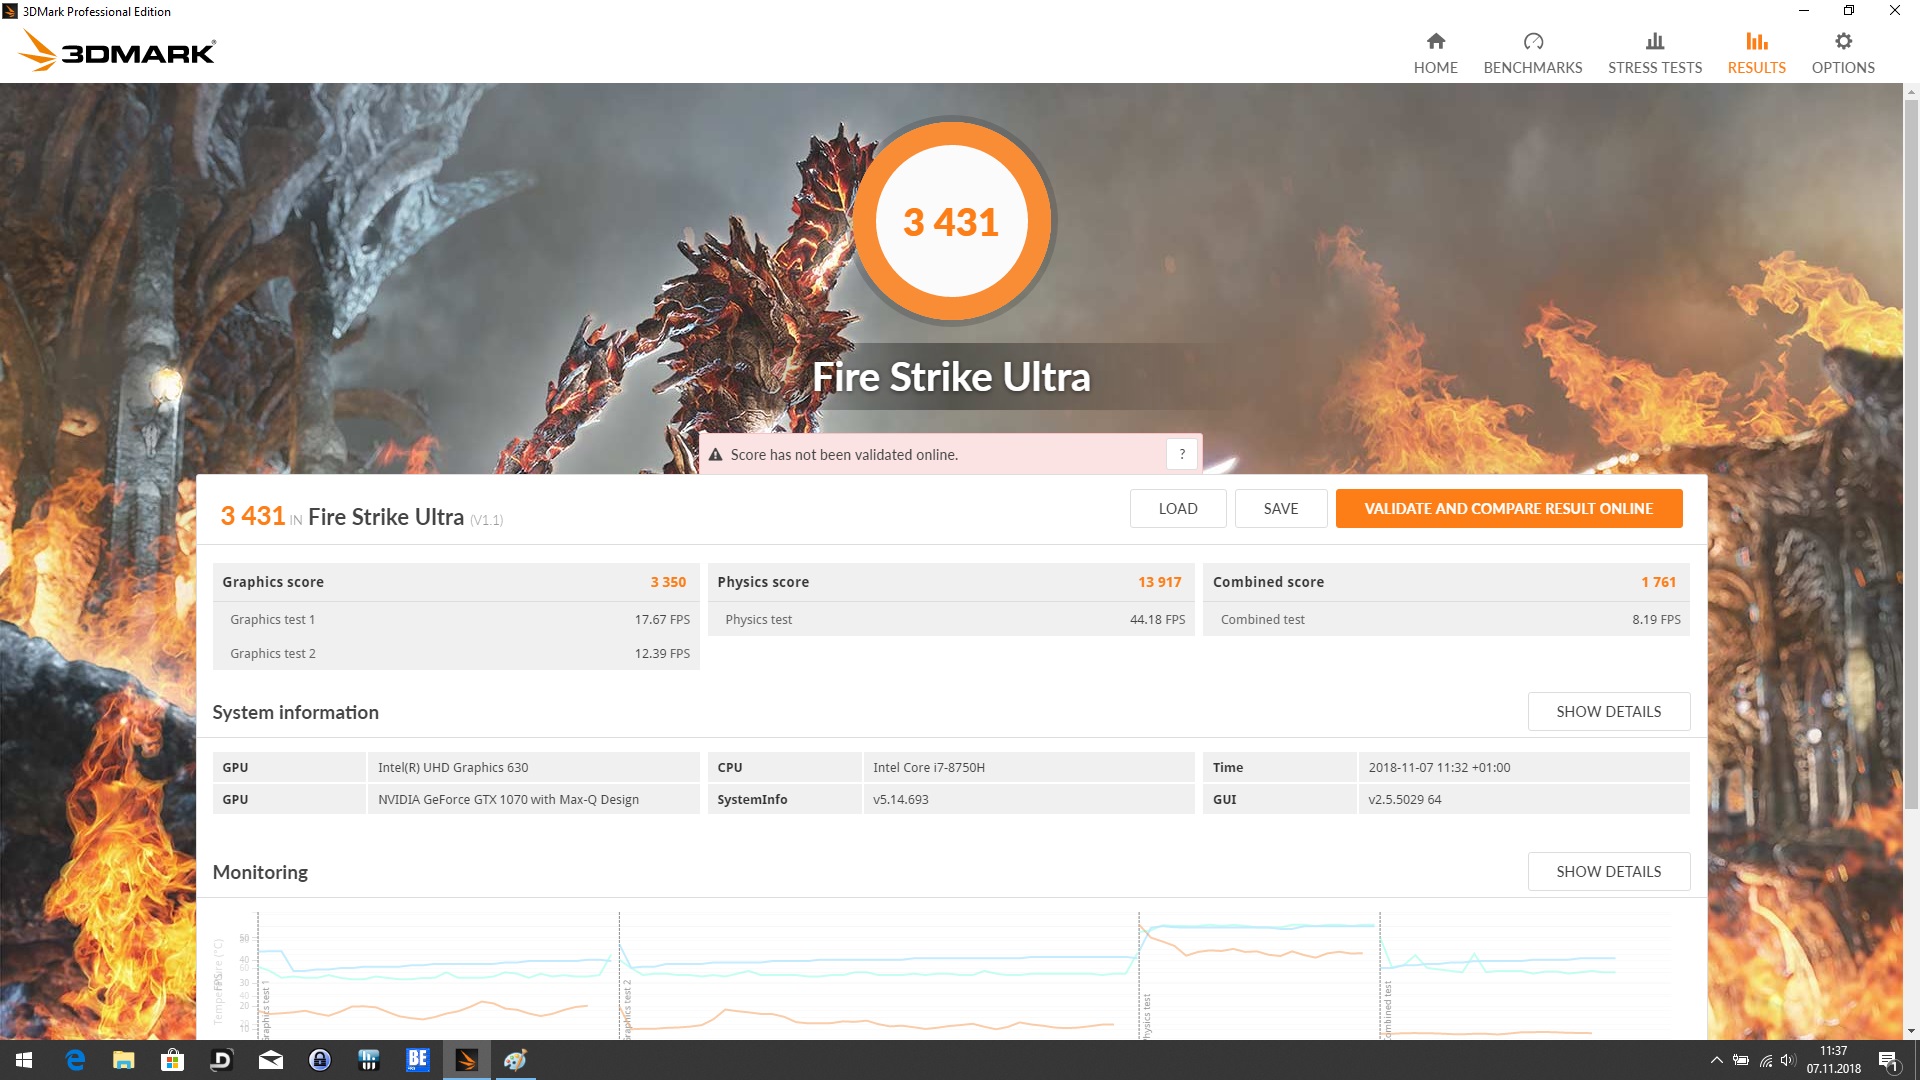
| 3DMark Fire Strike Extreme Score | 6589 poäng | |
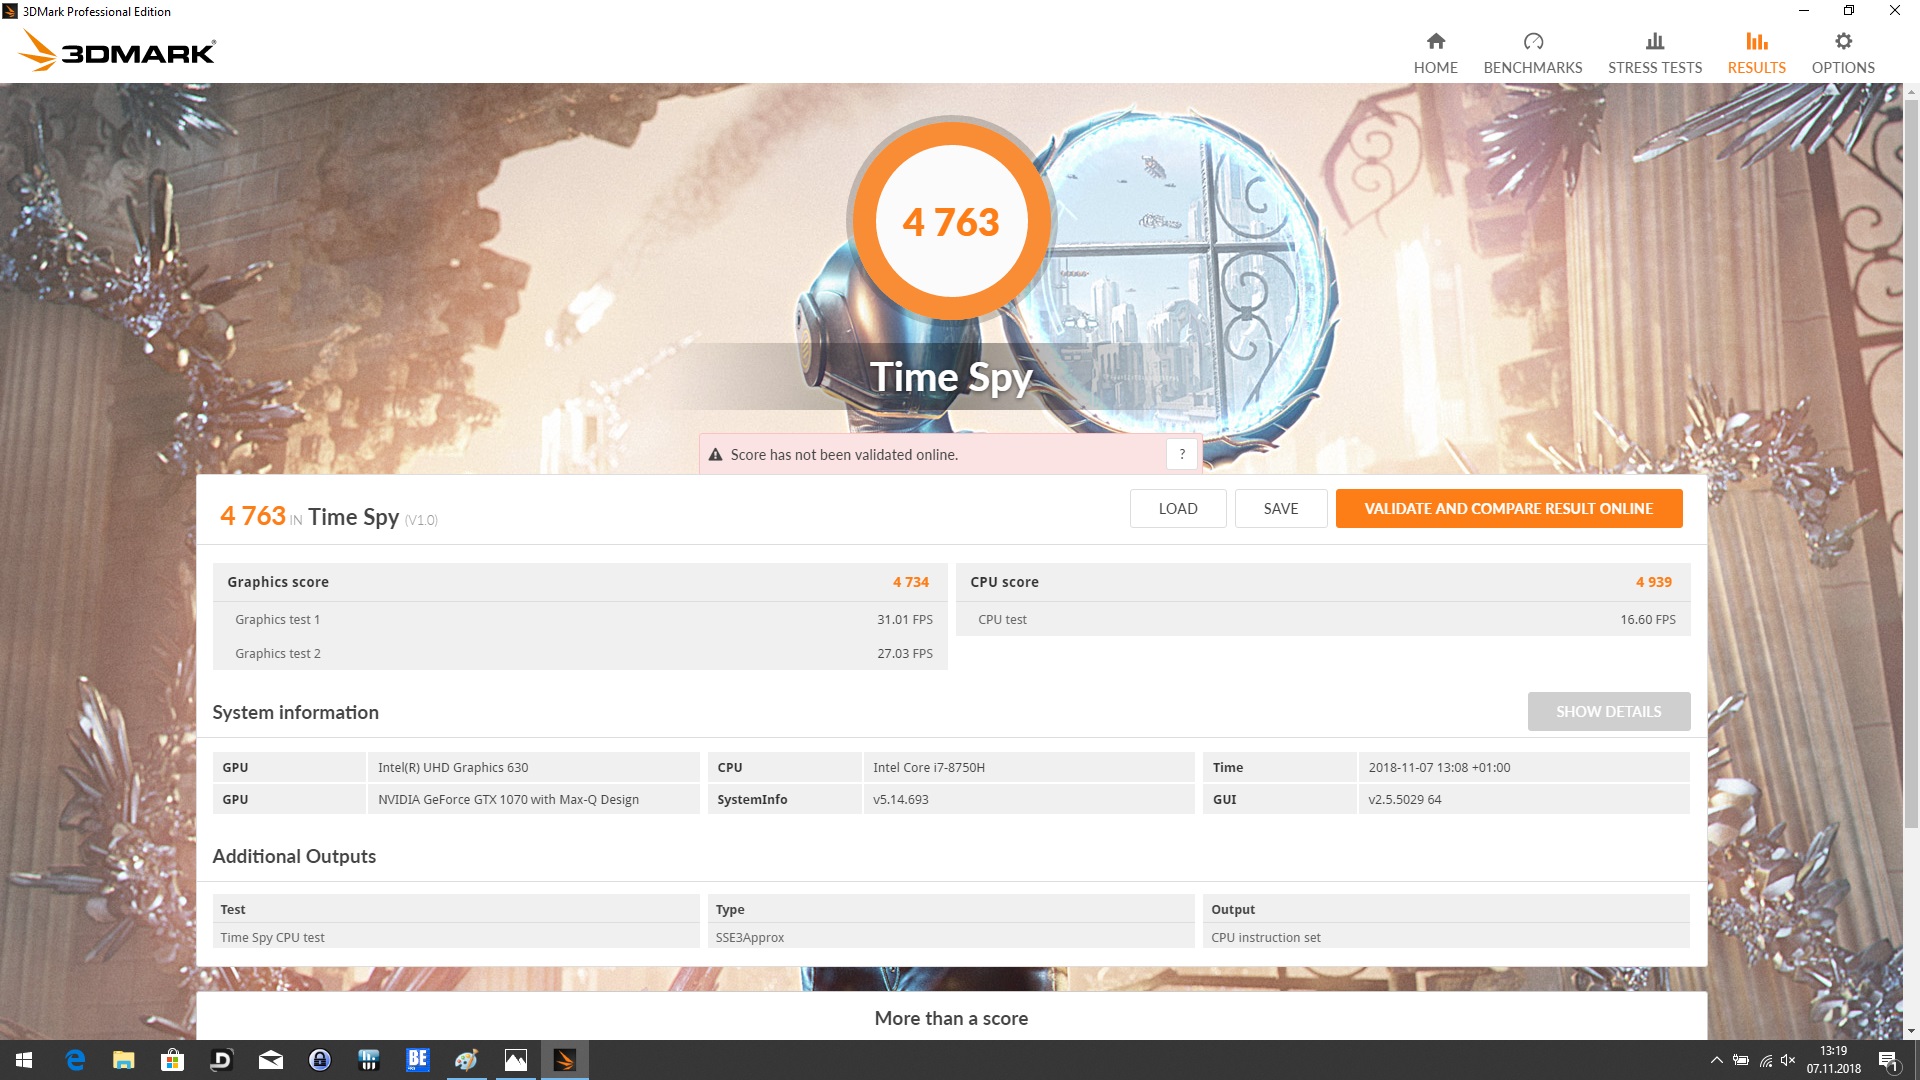
| 3DMark Time Spy Score | 4763 poäng | |
Hjälp | ||
| The Witcher 3 - 1920x1080 Ultra Graphics & Postprocessing (HBAO+) | |
| Asus GL504GS | |
| MSI GS65 8RF-019DE Stealth Thin | |
| Gigabyte Aero 15X v8 | |
| MSI P65 8RF-451 - Creator | |
| Genomsnitt NVIDIA GeForce GTX 1070 Max-Q (46 - 55.3, n=19) | |
| Genomsnitt av klass Multimedia (11 - 121, n=13, senaste 2 åren) | |
| MSI WS63 7RF-290US | |
| Lenovo ThinkPad X1 Extreme-20MF000XGE | |
| Asus ZenBook Pro 15 UX580GE | |
| Shadow of the Tomb Raider - 1920x1080 Highest Preset AA:T | |
| Genomsnitt av klass Multimedia (23 - 129, n=8, senaste 2 åren) | |
| Genomsnitt NVIDIA GeForce GTX 1070 Max-Q (58 - 61, n=3) | |
| MSI P65 8RF-451 - Creator | |
| Lenovo ThinkPad X1 Extreme-20MF000XGE | |
| F1 2018 - 1920x1080 Ultra High Preset AA:T AF:16x | |
| MSI P65 8RF-451 - Creator | |
| Genomsnitt NVIDIA GeForce GTX 1070 Max-Q (70 - 76, n=3) | |
| Lenovo ThinkPad X1 Extreme-20MF000XGE | |
| Forza Horizon 4 - 1920x1080 Ultra Preset AA:2xMS | |
| Genomsnitt NVIDIA GeForce GTX 1070 Max-Q (78 - 80, n=2) | |
| MSI P65 8RF-451 - Creator | |
| låg | med. | hög | ultra | 4K | |
|---|---|---|---|---|---|
| BioShock Infinite (2013) | 249.1 | 222.1 | 204.7 | 118 | |
| The Witcher 3 (2015) | 218.5 | 156.7 | 93.2 | 51.5 | 27.7 |
| Rise of the Tomb Raider (2016) | 131.1 | 126.7 | 85.7 | 77.1 | 32.1 |
| Battlefield 1 (2016) | 123.2 | 105.5 | 91.5 | 90.7 | 39.1 |
| Assassin´s Creed Origins (2017) | 70 | 64 | 62 | 53 | 26 |
| Far Cry 5 (2018) | 103 | 81 | 77 | 74 | 27 |
| F1 2018 (2018) | 163 | 130 | 100 | 76 | 59 |
| Shadow of the Tomb Raider (2018) | 91 | 65 | 62 | 58 | 20 |
| Forza Horizon 4 (2018) | 127 | 101 | 95 | 78 | 43 |
| Assassin´s Creed Odyssey (2018) | 64 | 62 | 52 | 39 | 21 |
Ljudnivå
| Låg belastning |
| 32.1 / 32.1 / 32.4 dB(A) |
| Hög belastning |
| 39 / 40.2 dB(A) |
 | ||
30 dB tyst 40 dB(A) hörbar 50 dB(A) högt ljud |
||
min: | ||
| MSI P65 8RF-451 - Creator Intel Core i7-8750H, NVIDIA GeForce GTX 1070 Max-Q | Asus ZenBook Pro 15 UX580GE Intel Core i9-8950HK, NVIDIA GeForce GTX 1050 Ti Mobile | Lenovo ThinkPad X1 Extreme-20MF000XGE Intel Core i7-8750H, NVIDIA GeForce GTX 1050 Ti Max-Q | Gigabyte Aero 15X v8 Intel Core i7-8750H, NVIDIA GeForce GTX 1070 Max-Q | Asus GL504GS Intel Core i7-8750H, NVIDIA GeForce GTX 1070 Mobile | MSI GS65 8RF-019DE Stealth Thin Intel Core i7-8750H, NVIDIA GeForce GTX 1070 Max-Q | MSI WS63 7RF-290US Intel Core i7-7700HQ, NVIDIA Quadro P3000 | |
|---|---|---|---|---|---|---|---|
| Noise | 2% | 6% | -9% | -13% | -2% | 3% | |
| av / miljö * (dB) | 30.7 | 28 9% | 28.8 6% | 29 6% | 29 6% | 30 2% | 28.1 8% |
| Idle Minimum * (dB) | 32.1 | 28.6 11% | 28.8 10% | 30 7% | 32 -0% | 30 7% | 28.1 12% |
| Idle Average * (dB) | 32.1 | 29.9 7% | 28.8 10% | 31 3% | 33 -3% | 31 3% | 28.1 12% |
| Idle Maximum * (dB) | 32.4 | 30.5 6% | 31.3 3% | 35 -8% | 40 -23% | 34 -5% | 32 1% |
| Load Average * (dB) | 39 | 42.5 -9% | 36.4 7% | 49 -26% | 49 -26% | 43 -10% | 38 3% |
| Load Maximum * (dB) | 40.2 | 44.8 -11% | 39.2 2% | 54 -34% | 53 -32% | 44 -9% | 47.2 -17% |
| Witcher 3 ultra * (dB) | 44.8 | 36.4 | 51 | 51 | 42 | 35.8 |
* ... mindre är bättre
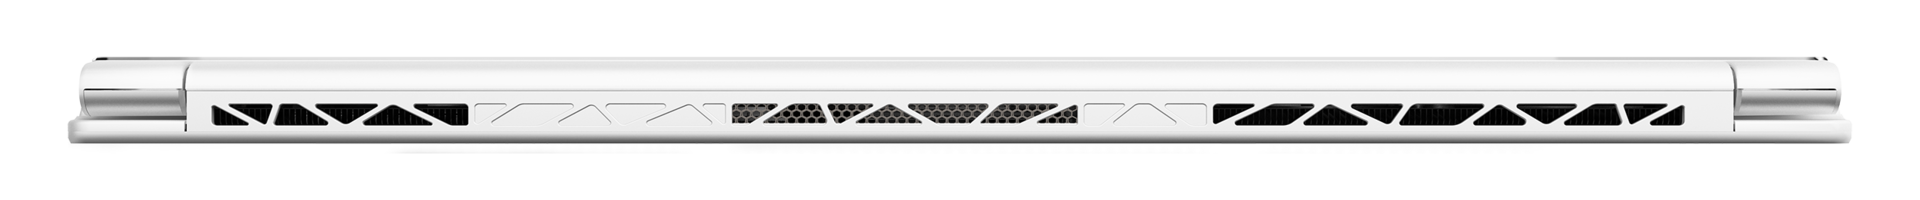
(-) Den maximala temperaturen på ovansidan är 46.6 °C / 116 F, jämfört med genomsnittet av 36.8 °C / 98 F , allt från 21 till 71 °C för klassen Multimedia.
(-) Botten värms upp till maximalt 56.6 °C / 134 F, jämfört med genomsnittet av 39.1 °C / 102 F
(+) Vid tomgångsbruk är medeltemperaturen för ovansidan 27 °C / 81 F, jämfört med enhetsgenomsnittet på 31.3 °C / ### class_avg_f### F.
(-) Handledsstöden och pekplattan kan bli väldigt varma vid beröring med maximalt 41.7 °C / 107.1 F.
(-) Medeltemperaturen för handledsstödsområdet på liknande enheter var 28.7 °C / 83.7 F (-13 °C / -23.4 F).
| MSI P65 8RF-451 - Creator GeForce GTX 1070 Max-Q, i7-8750H, Kingston RBUSNS8154P3512GJ | Asus ZenBook Pro 15 UX580GE GeForce GTX 1050 Ti Mobile, i9-8950HK, Samsung SSD PM961 1TB M.2 PCIe 3.0 x4 NVMe (MZVLW1T0) | Lenovo ThinkPad X1 Extreme-20MF000XGE GeForce GTX 1050 Ti Max-Q, i7-8750H, Samsung SSD PM981 MZVLB1T0HALR | Gigabyte Aero 15X v8 GeForce GTX 1070 Max-Q, i7-8750H, Toshiba NVMe THNSN5512GPU7 | Asus GL504GS GeForce GTX 1070 Mobile, i7-8750H, Samsung SSD PM981 MZVLB512HAJQ | MSI GS65 8RF-019DE Stealth Thin GeForce GTX 1070 Max-Q, i7-8750H, Samsung SSD PM981 MZVLB512HAJQ | MSI WS63 7RF-290US Quadro P3000, i7-7700HQ, Samsung SM961 MZVKW512HMJP m.2 PCI-e | |
|---|---|---|---|---|---|---|---|
| Heat | -5% | 7% | -6% | -17% | 3% | -2% | |
| Maximum Upper Side * (°C) | 46.6 | 42.4 9% | 45.4 3% | 53 -14% | 55 -18% | 49 -5% | 46.4 -0% |
| Maximum Bottom * (°C) | 56.6 | 50.8 10% | 53.4 6% | 65 -15% | 55 3% | 63 -11% | 62 -10% |
| Idle Upper Side * (°C) | 28.8 | 33 -15% | 26.3 9% | 26 10% | 36 -25% | 24 17% | 28.2 2% |
| Idle Bottom * (°C) | 28.5 | 35.2 -24% | 26.2 8% | 30 -5% | 36 -26% | 25 12% | 28.8 -1% |
* ... mindre är bättre
MSI P65 8RF-451 - Creator ljudanalys
(±) | högtalarljudstyrkan är genomsnittlig men bra (76.8 dB)
Bas 100 - 315 Hz
(-) | nästan ingen bas - i genomsnitt 15.5% lägre än medianen
(+) | basen är linjär (3.6% delta till föregående frekvens)
Mellan 400 - 2000 Hz
(±) | högre mellan - i genomsnitt 7.3% högre än median
(±) | linjäriteten för mids är genomsnittlig (7.3% delta till föregående frekvens)
Högsta 2 - 16 kHz
(±) | högre toppar - i genomsnitt 7.1% högre än medianen
(+) | toppar är linjära (6.8% delta till föregående frekvens)
Totalt 100 - 16 000 Hz
(±) | linjäriteten för det totala ljudet är genomsnittlig (20.4% skillnad mot median)
Jämfört med samma klass
» 69% av alla testade enheter i den här klassen var bättre, 8% liknande, 23% sämre
» Den bästa hade ett delta på 5%, genomsnittet var 17%, sämst var 45%
Jämfört med alla testade enheter
» 53% av alla testade enheter var bättre, 8% liknande, 39% sämre
» Den bästa hade ett delta på 4%, genomsnittet var 24%, sämst var 134%
Asus ZenBook Pro 15 UX580GE ljudanalys
(±) | högtalarljudstyrkan är genomsnittlig men bra (79.9 dB)
Bas 100 - 315 Hz
(-) | nästan ingen bas - i genomsnitt 22.3% lägre än medianen
(±) | linjäriteten för basen är genomsnittlig (11.5% delta till föregående frekvens)
Mellan 400 - 2000 Hz
(+) | balanserad mellan - endast 2.4% från medianen
(±) | linjäriteten för mids är genomsnittlig (7.5% delta till föregående frekvens)
Högsta 2 - 16 kHz
(+) | balanserade toppar - endast 4% från medianen
(+) | toppar är linjära (6.2% delta till föregående frekvens)
Totalt 100 - 16 000 Hz
(±) | linjäriteten för det totala ljudet är genomsnittlig (17.7% skillnad mot median)
Jämfört med samma klass
» 51% av alla testade enheter i den här klassen var bättre, 7% liknande, 42% sämre
» Den bästa hade ett delta på 5%, genomsnittet var 17%, sämst var 45%
Jämfört med alla testade enheter
» 35% av alla testade enheter var bättre, 8% liknande, 57% sämre
» Den bästa hade ett delta på 4%, genomsnittet var 24%, sämst var 134%
| Av/Standby | |
| Låg belastning | |
| Hög belastning |
|
Förklaring:
min: | |
| MSI P65 8RF-451 - Creator i7-8750H, GeForce GTX 1070 Max-Q, Kingston RBUSNS8154P3512GJ, IPS, 1920x1080, 15.6" | Asus ZenBook Pro 15 UX580GE i9-8950HK, GeForce GTX 1050 Ti Mobile, Samsung SSD PM961 1TB M.2 PCIe 3.0 x4 NVMe (MZVLW1T0), IPS, 3840x2160, 15.6" | Lenovo ThinkPad X1 Extreme-20MF000XGE i7-8750H, GeForce GTX 1050 Ti Max-Q, Samsung SSD PM981 MZVLB1T0HALR, IPS, 3840x2160, 15.6" | Gigabyte Aero 15X v8 i7-8750H, GeForce GTX 1070 Max-Q, Toshiba NVMe THNSN5512GPU7, IPS, 1920x1080, 15.6" | Asus GL504GS i7-8750H, GeForce GTX 1070 Mobile, Samsung SSD PM981 MZVLB512HAJQ, IPS, 1920x1080, 15.6" | MSI GS65 8RF-019DE Stealth Thin i7-8750H, GeForce GTX 1070 Max-Q, Samsung SSD PM981 MZVLB512HAJQ, IPS, 1920x1080, 15.6" | MSI WS63 7RF-290US i7-7700HQ, Quadro P3000, Samsung SM961 MZVKW512HMJP m.2 PCI-e, IPS, 1920x1080, 15.6" | Genomsnitt NVIDIA GeForce GTX 1070 Max-Q | Genomsnitt av klass Multimedia | |
|---|---|---|---|---|---|---|---|---|---|
| Power Consumption | -24% | 2% | -34% | -124% | -3% | -6% | -23% | 26% | |
| Idle Minimum * (Watt) | 7.4 | 11.7 -58% | 7.6 -3% | 14 -89% | 29 -292% | 7 5% | 11 -49% | 11.4 ? -54% | 5.71 ? 23% |
| Idle Average * (Watt) | 11.7 | 18.5 -58% | 14.8 -26% | 18 -54% | 32 -174% | 11 6% | 14.2 -21% | 15.7 ? -34% | 10.1 ? 14% |
| Idle Maximum * (Watt) | 16.8 | 22.8 -36% | 17.6 -5% | 22 -31% | 38 -126% | 20 -19% | 14.6 13% | 20.7 ? -23% | 12.4 ? 26% |
| Load Average * (Watt) | 94 | 97.5 -4% | 86 9% | 91 3% | 100 -6% | 98 -4% | 77.7 17% | 98.1 ? -4% | 65 ? 31% |
| Load Maximum * (Watt) | 177 | 111.1 37% | 118.9 33% | 173 2% | 217 -23% | 182 -3% | 161.7 9% | 173.8 ? 2% | 112.2 ? 37% |
| Witcher 3 ultra * (Watt) | 102.9 | 85 | 142 | 170 | 132 | 89.1 |
* ... mindre är bättre

| MSI P65 8RF-451 - Creator i7-8750H, GeForce GTX 1070 Max-Q, 82 Wh | Asus ZenBook Pro 15 UX580GE i9-8950HK, GeForce GTX 1050 Ti Mobile, 71 Wh | Lenovo ThinkPad X1 Extreme-20MF000XGE i7-8750H, GeForce GTX 1050 Ti Max-Q, 80 Wh | Gigabyte Aero 15X v8 i7-8750H, GeForce GTX 1070 Max-Q, 94.24 Wh | Asus GL504GS i7-8750H, GeForce GTX 1070 Mobile, 66 Wh | MSI GS65 8RF-019DE Stealth Thin i7-8750H, GeForce GTX 1070 Max-Q, 82 Wh | Genomsnitt av klass Multimedia | |
|---|---|---|---|---|---|---|---|
| Batteridrifttid | 23% | 23% | 55% | -50% | -1% | 126% | |
| Reader / Idle (h) | 7.5 | 14 87% | 11.5 53% | 12.7 69% | 2.9 -61% | 8.5 13% | 25.2 ? 236% |
| H.264 (h) | 5.9 | 6.2 5% | 8.4 42% | 2.5 -58% | 5.9 0% | 16.4 ? 178% | |
| WiFi v1.3 (h) | 7.1 | 6.3 -11% | 6.4 -10% | 8.6 21% | 2.4 -66% | 6 -15% | 12 ? 69% |
| Load (h) | 1.4 | 1.3 -7% | 2 43% | 2.6 86% | 1.2 -14% | 1.4 0% | 1.675 ? 20% |
| Witcher 3 ultra (h) | 1.1 |
För
Emot

Läs den fullständiga versionen av den här recensionen på engelska här.
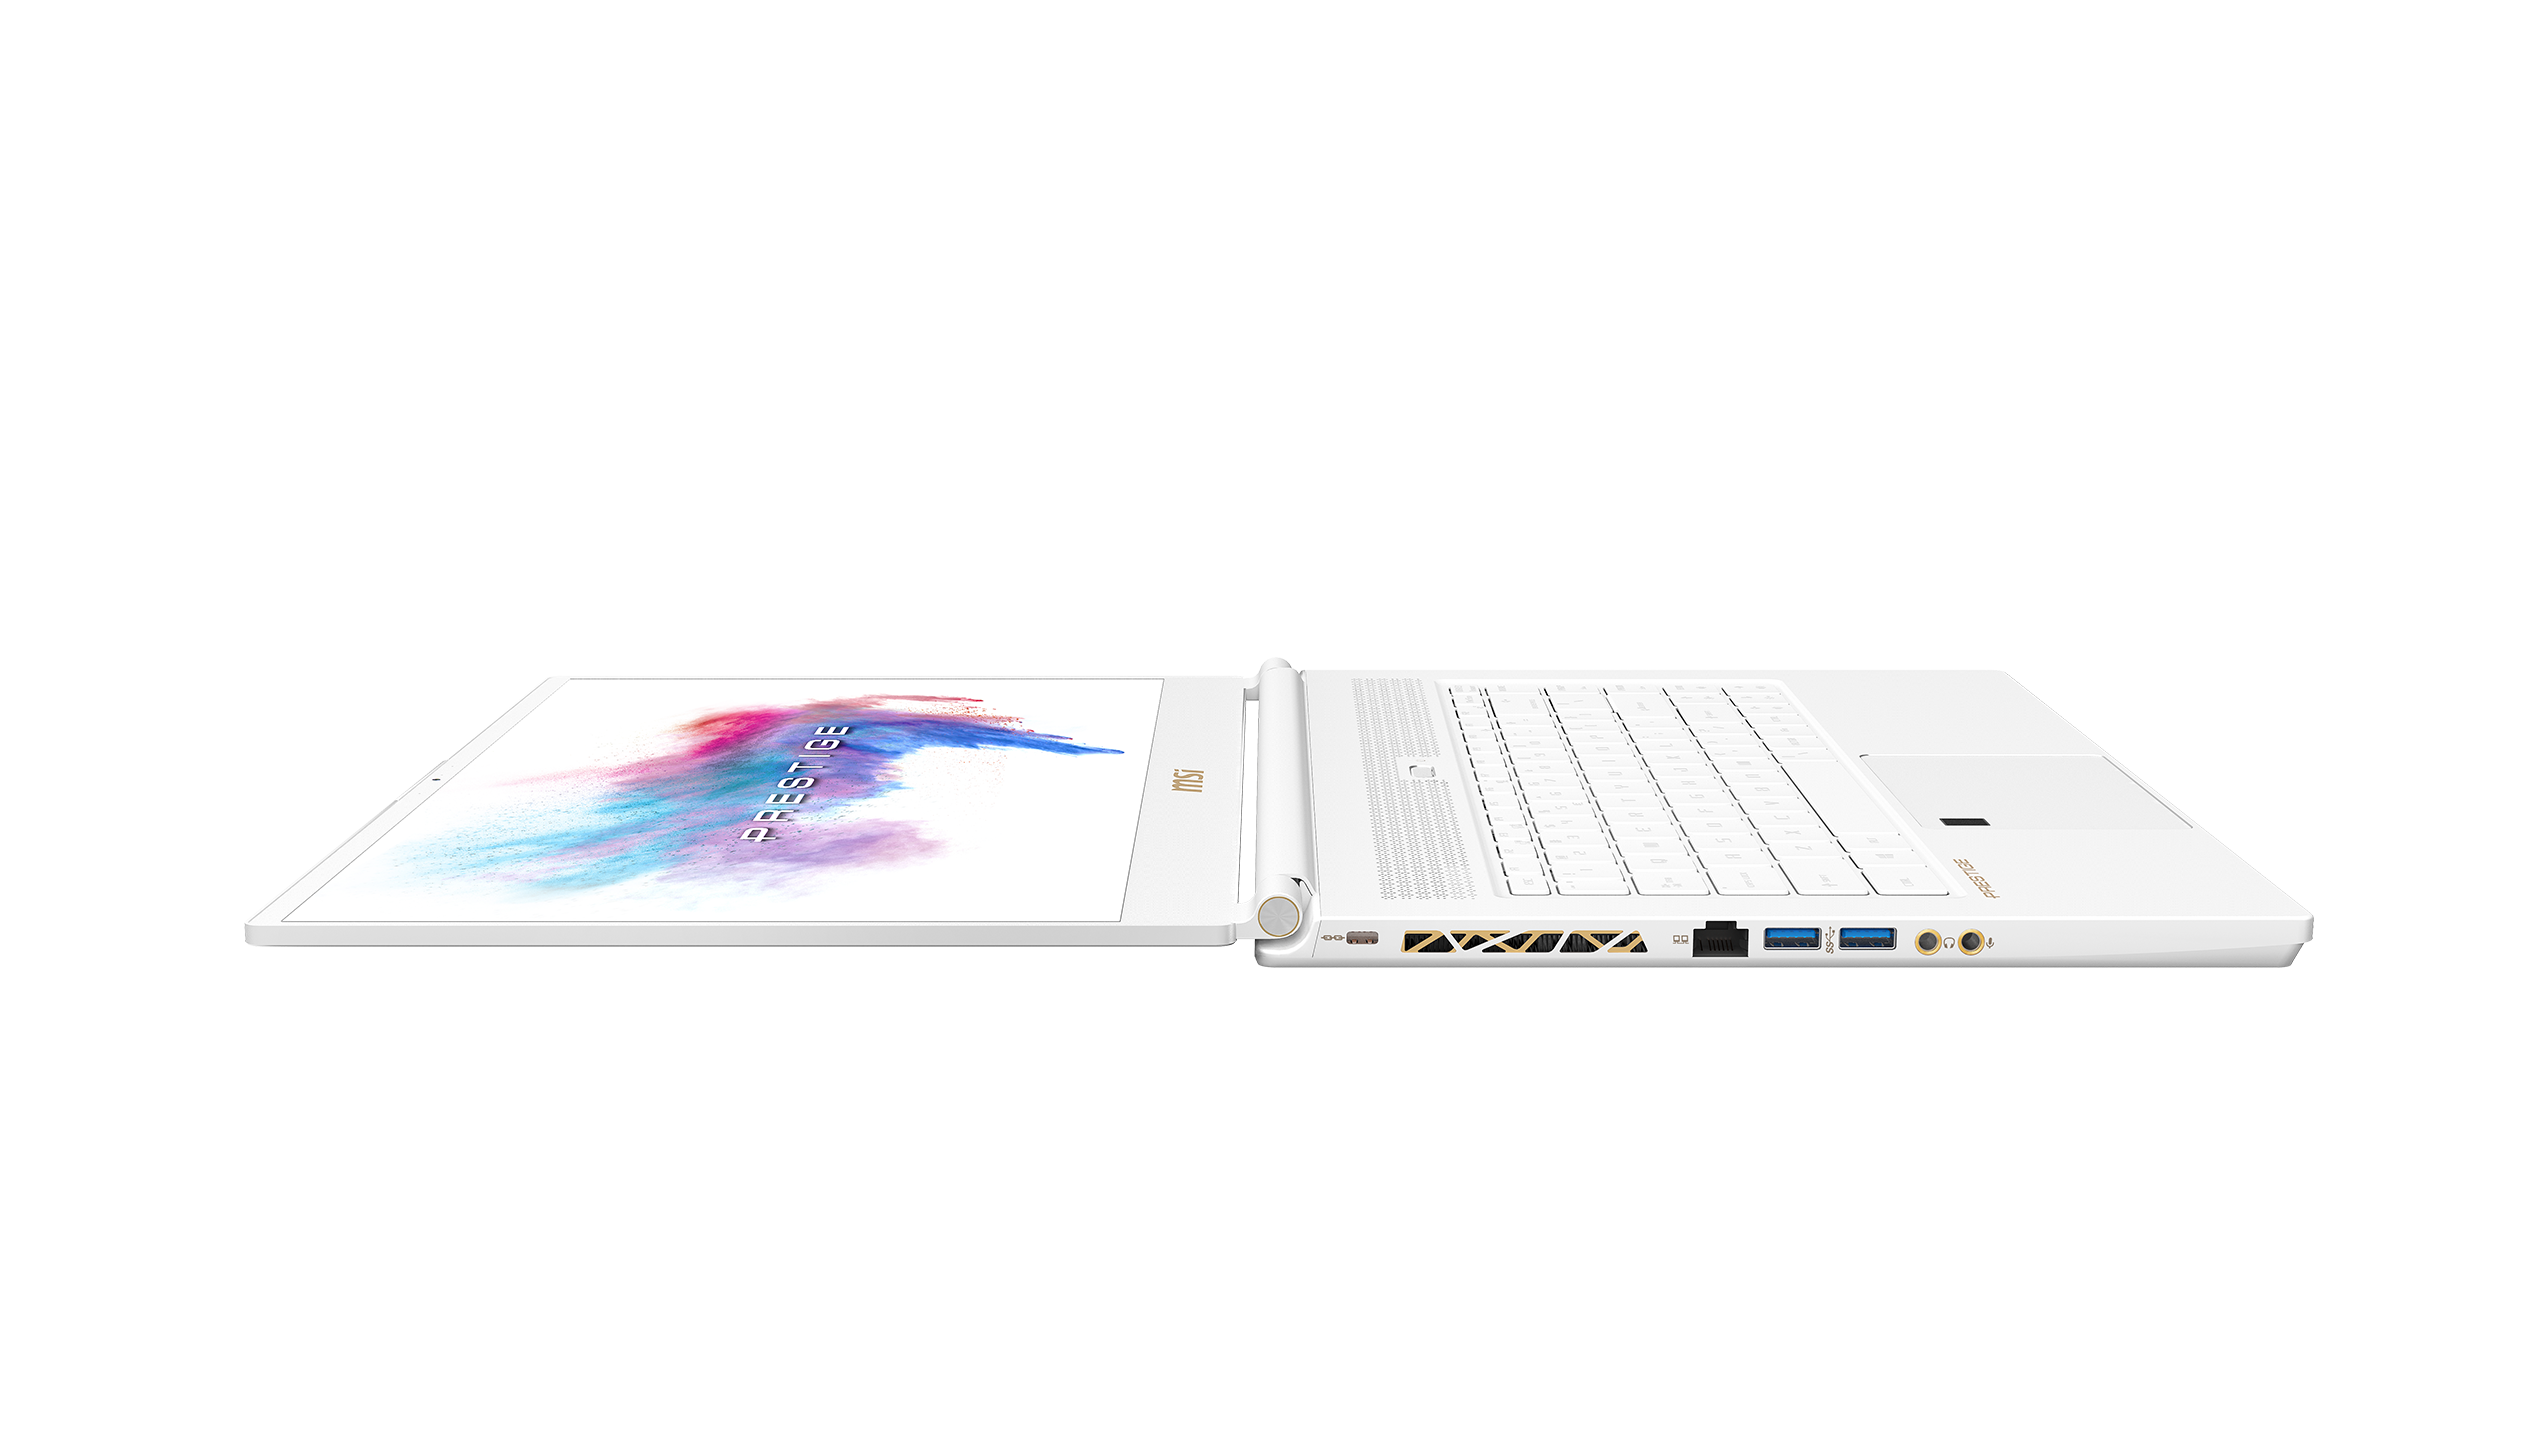
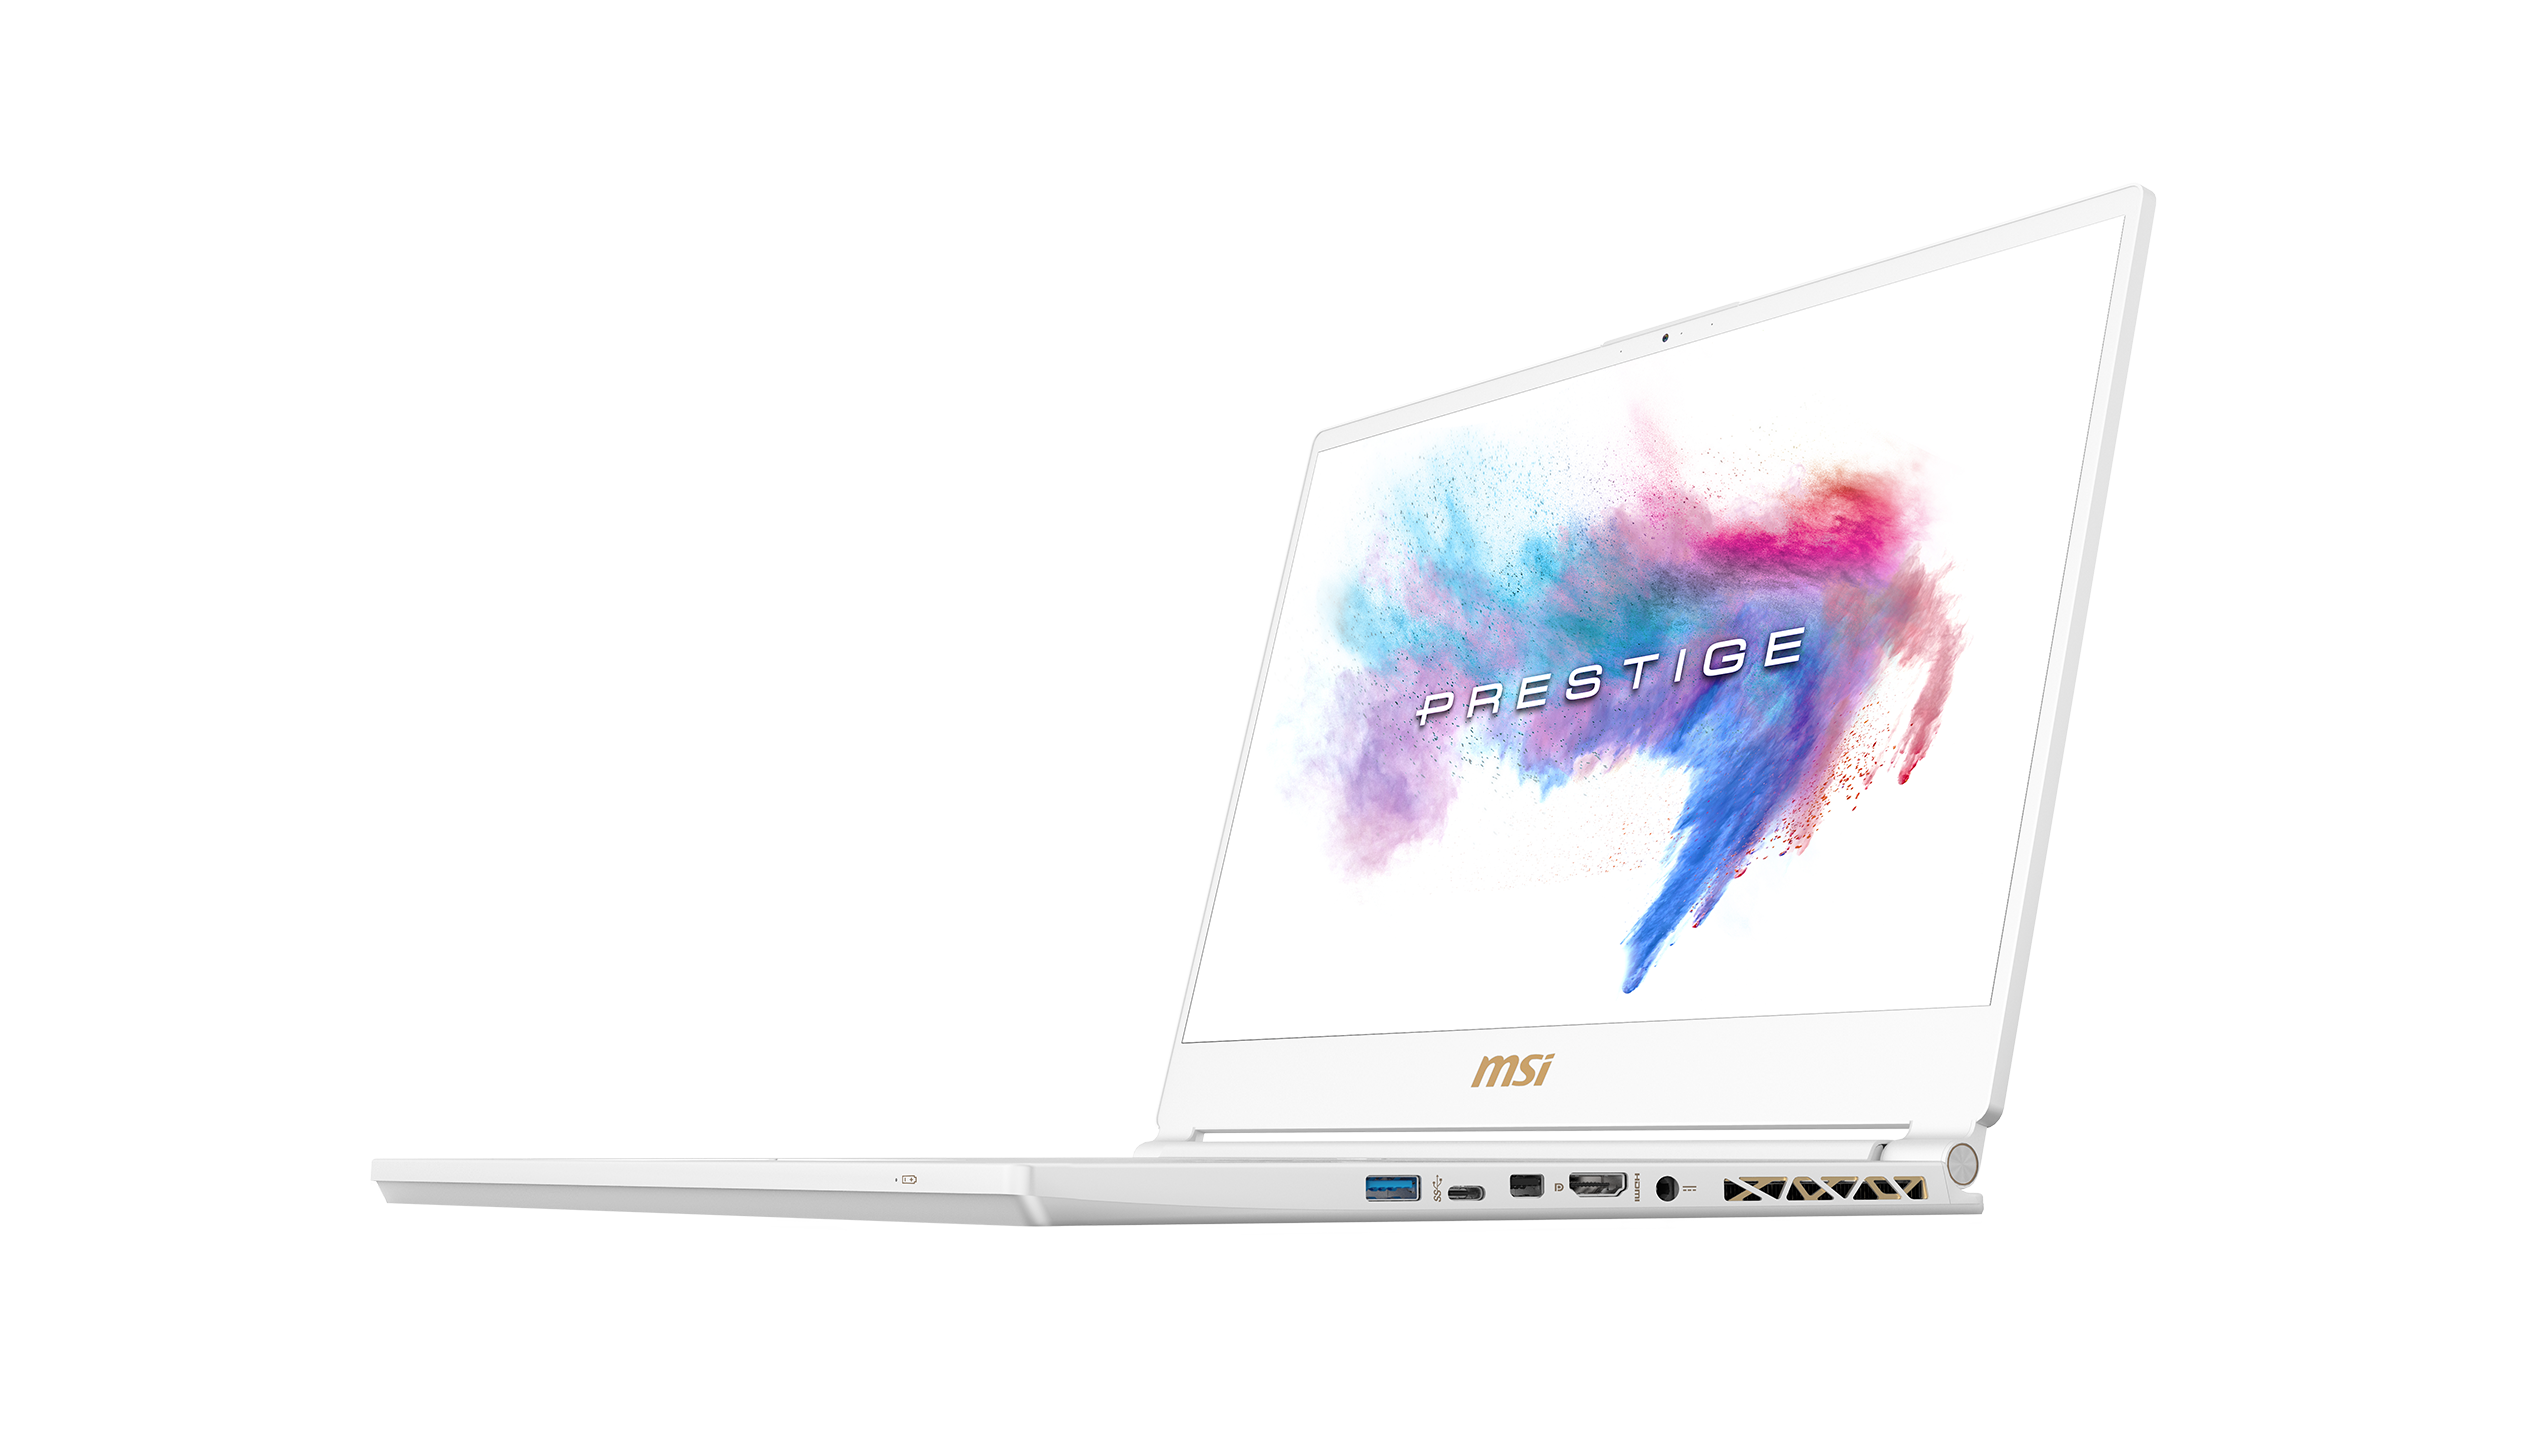
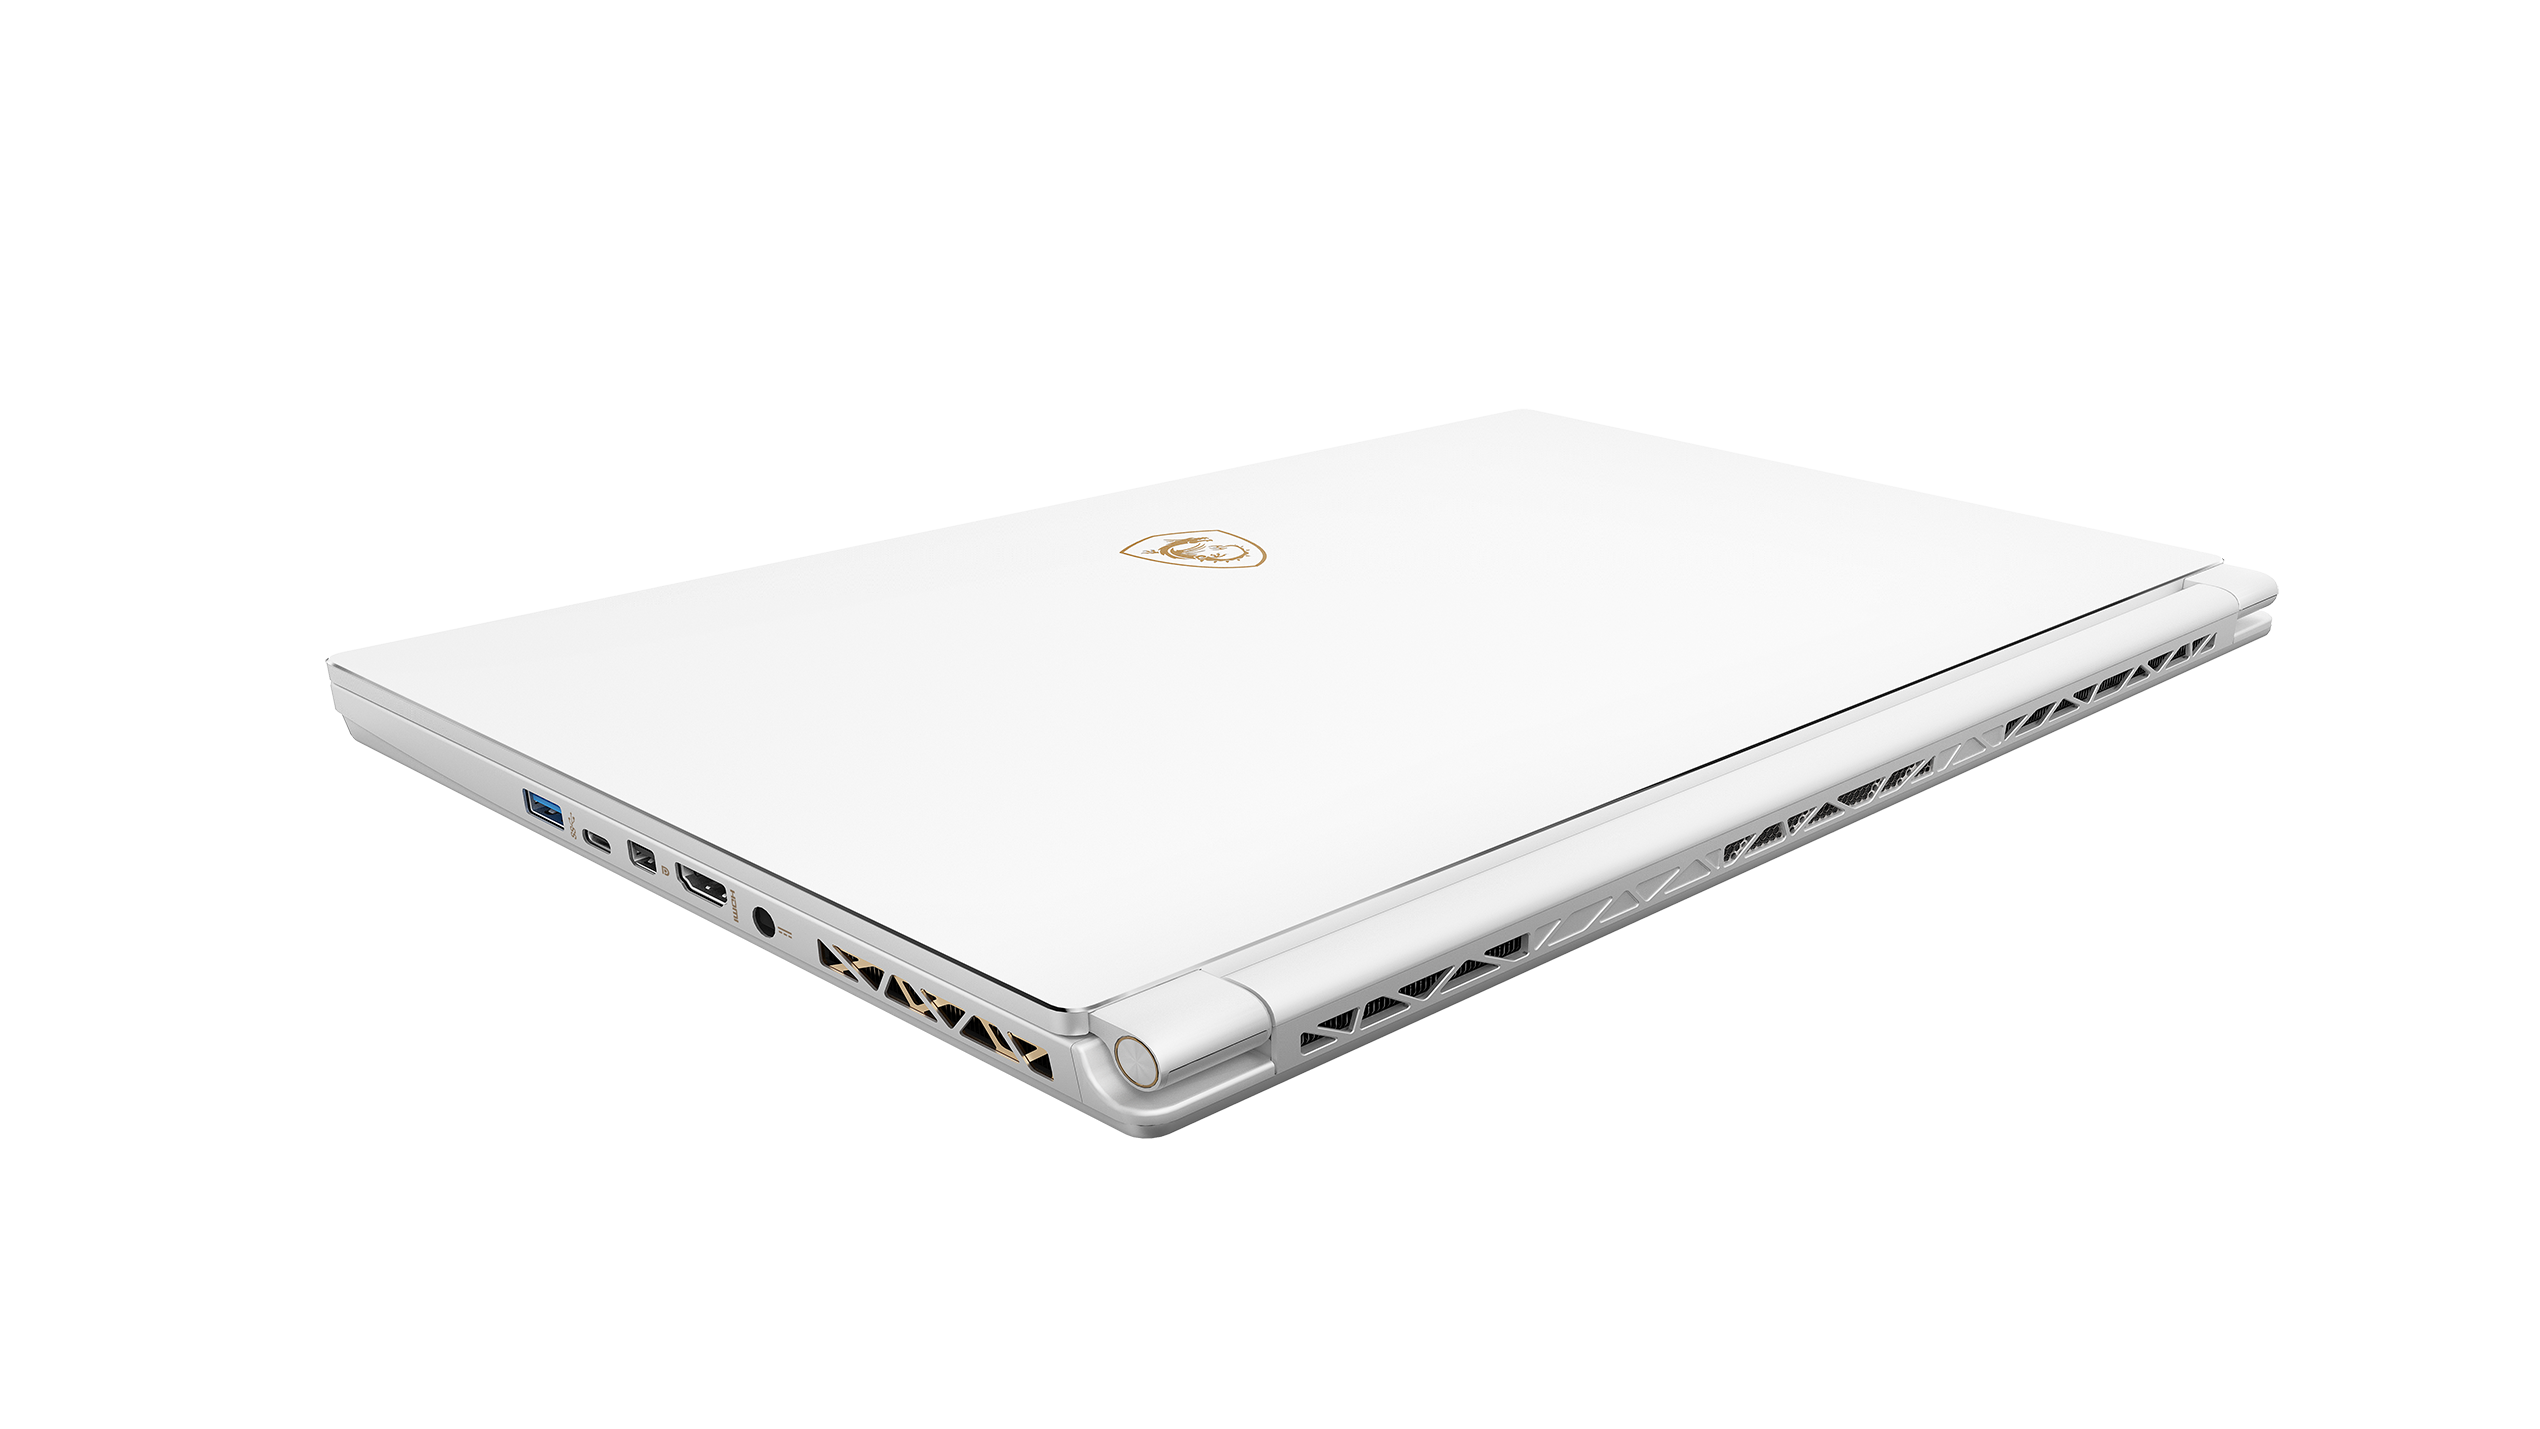
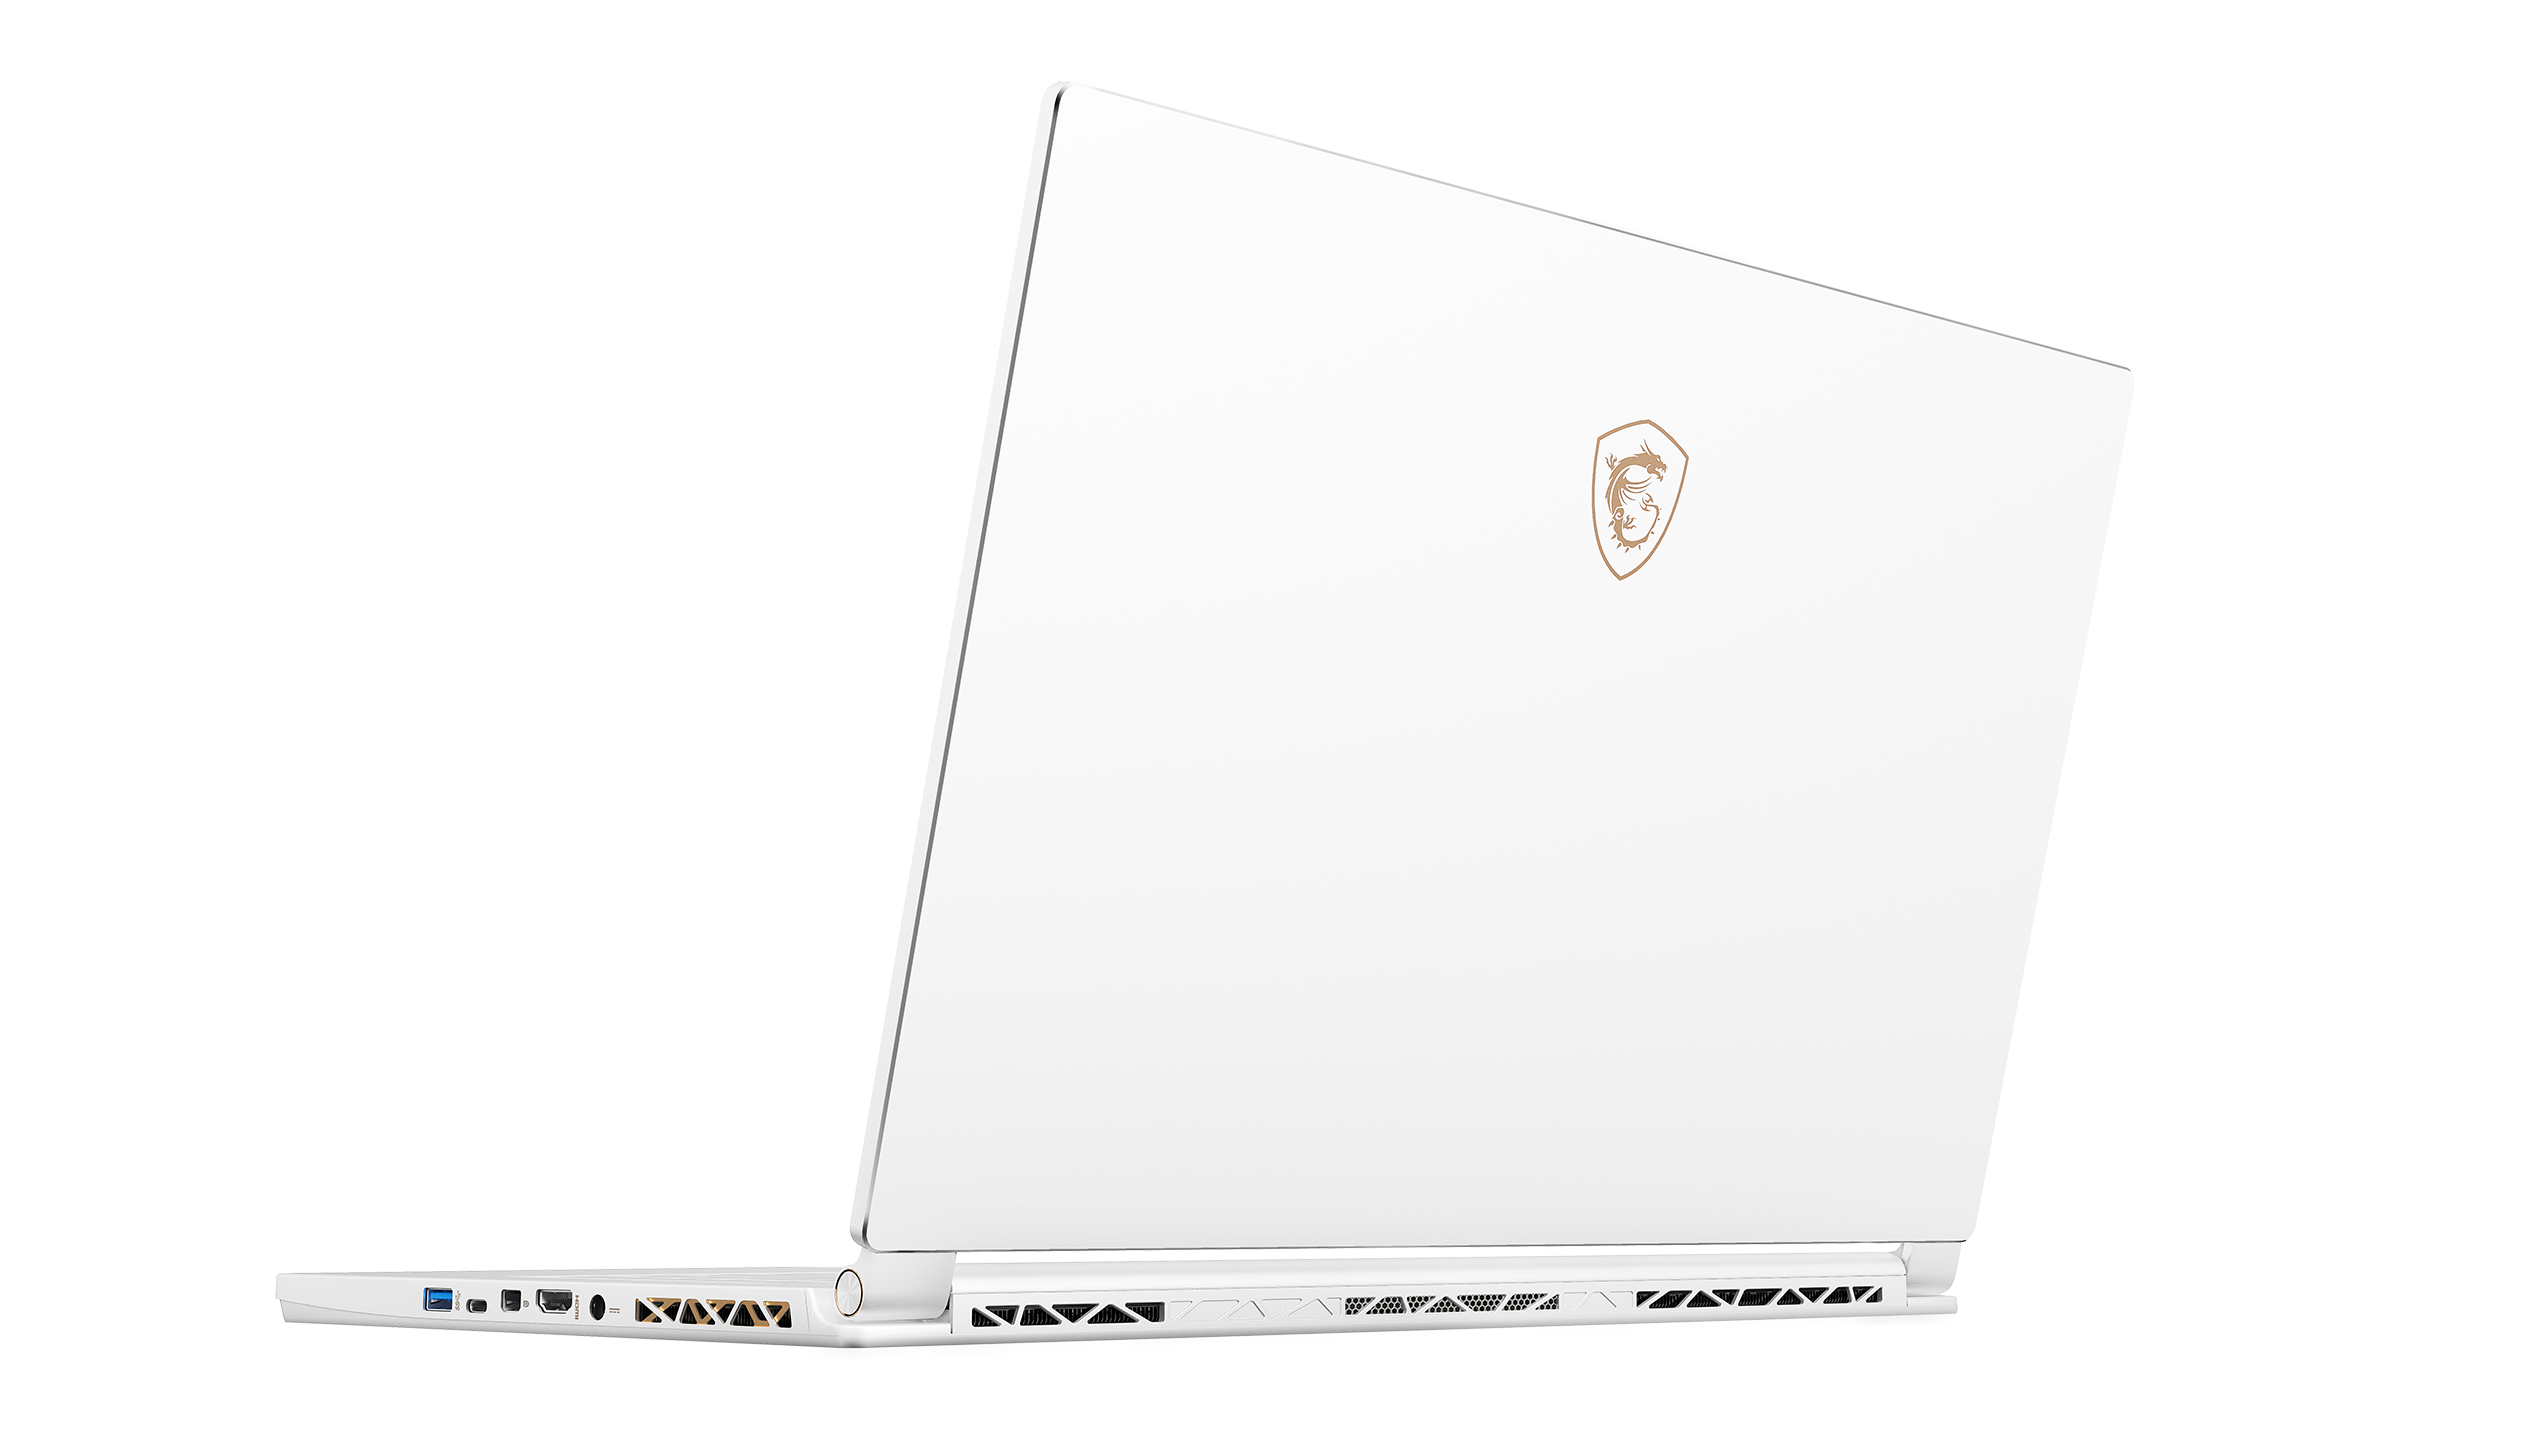
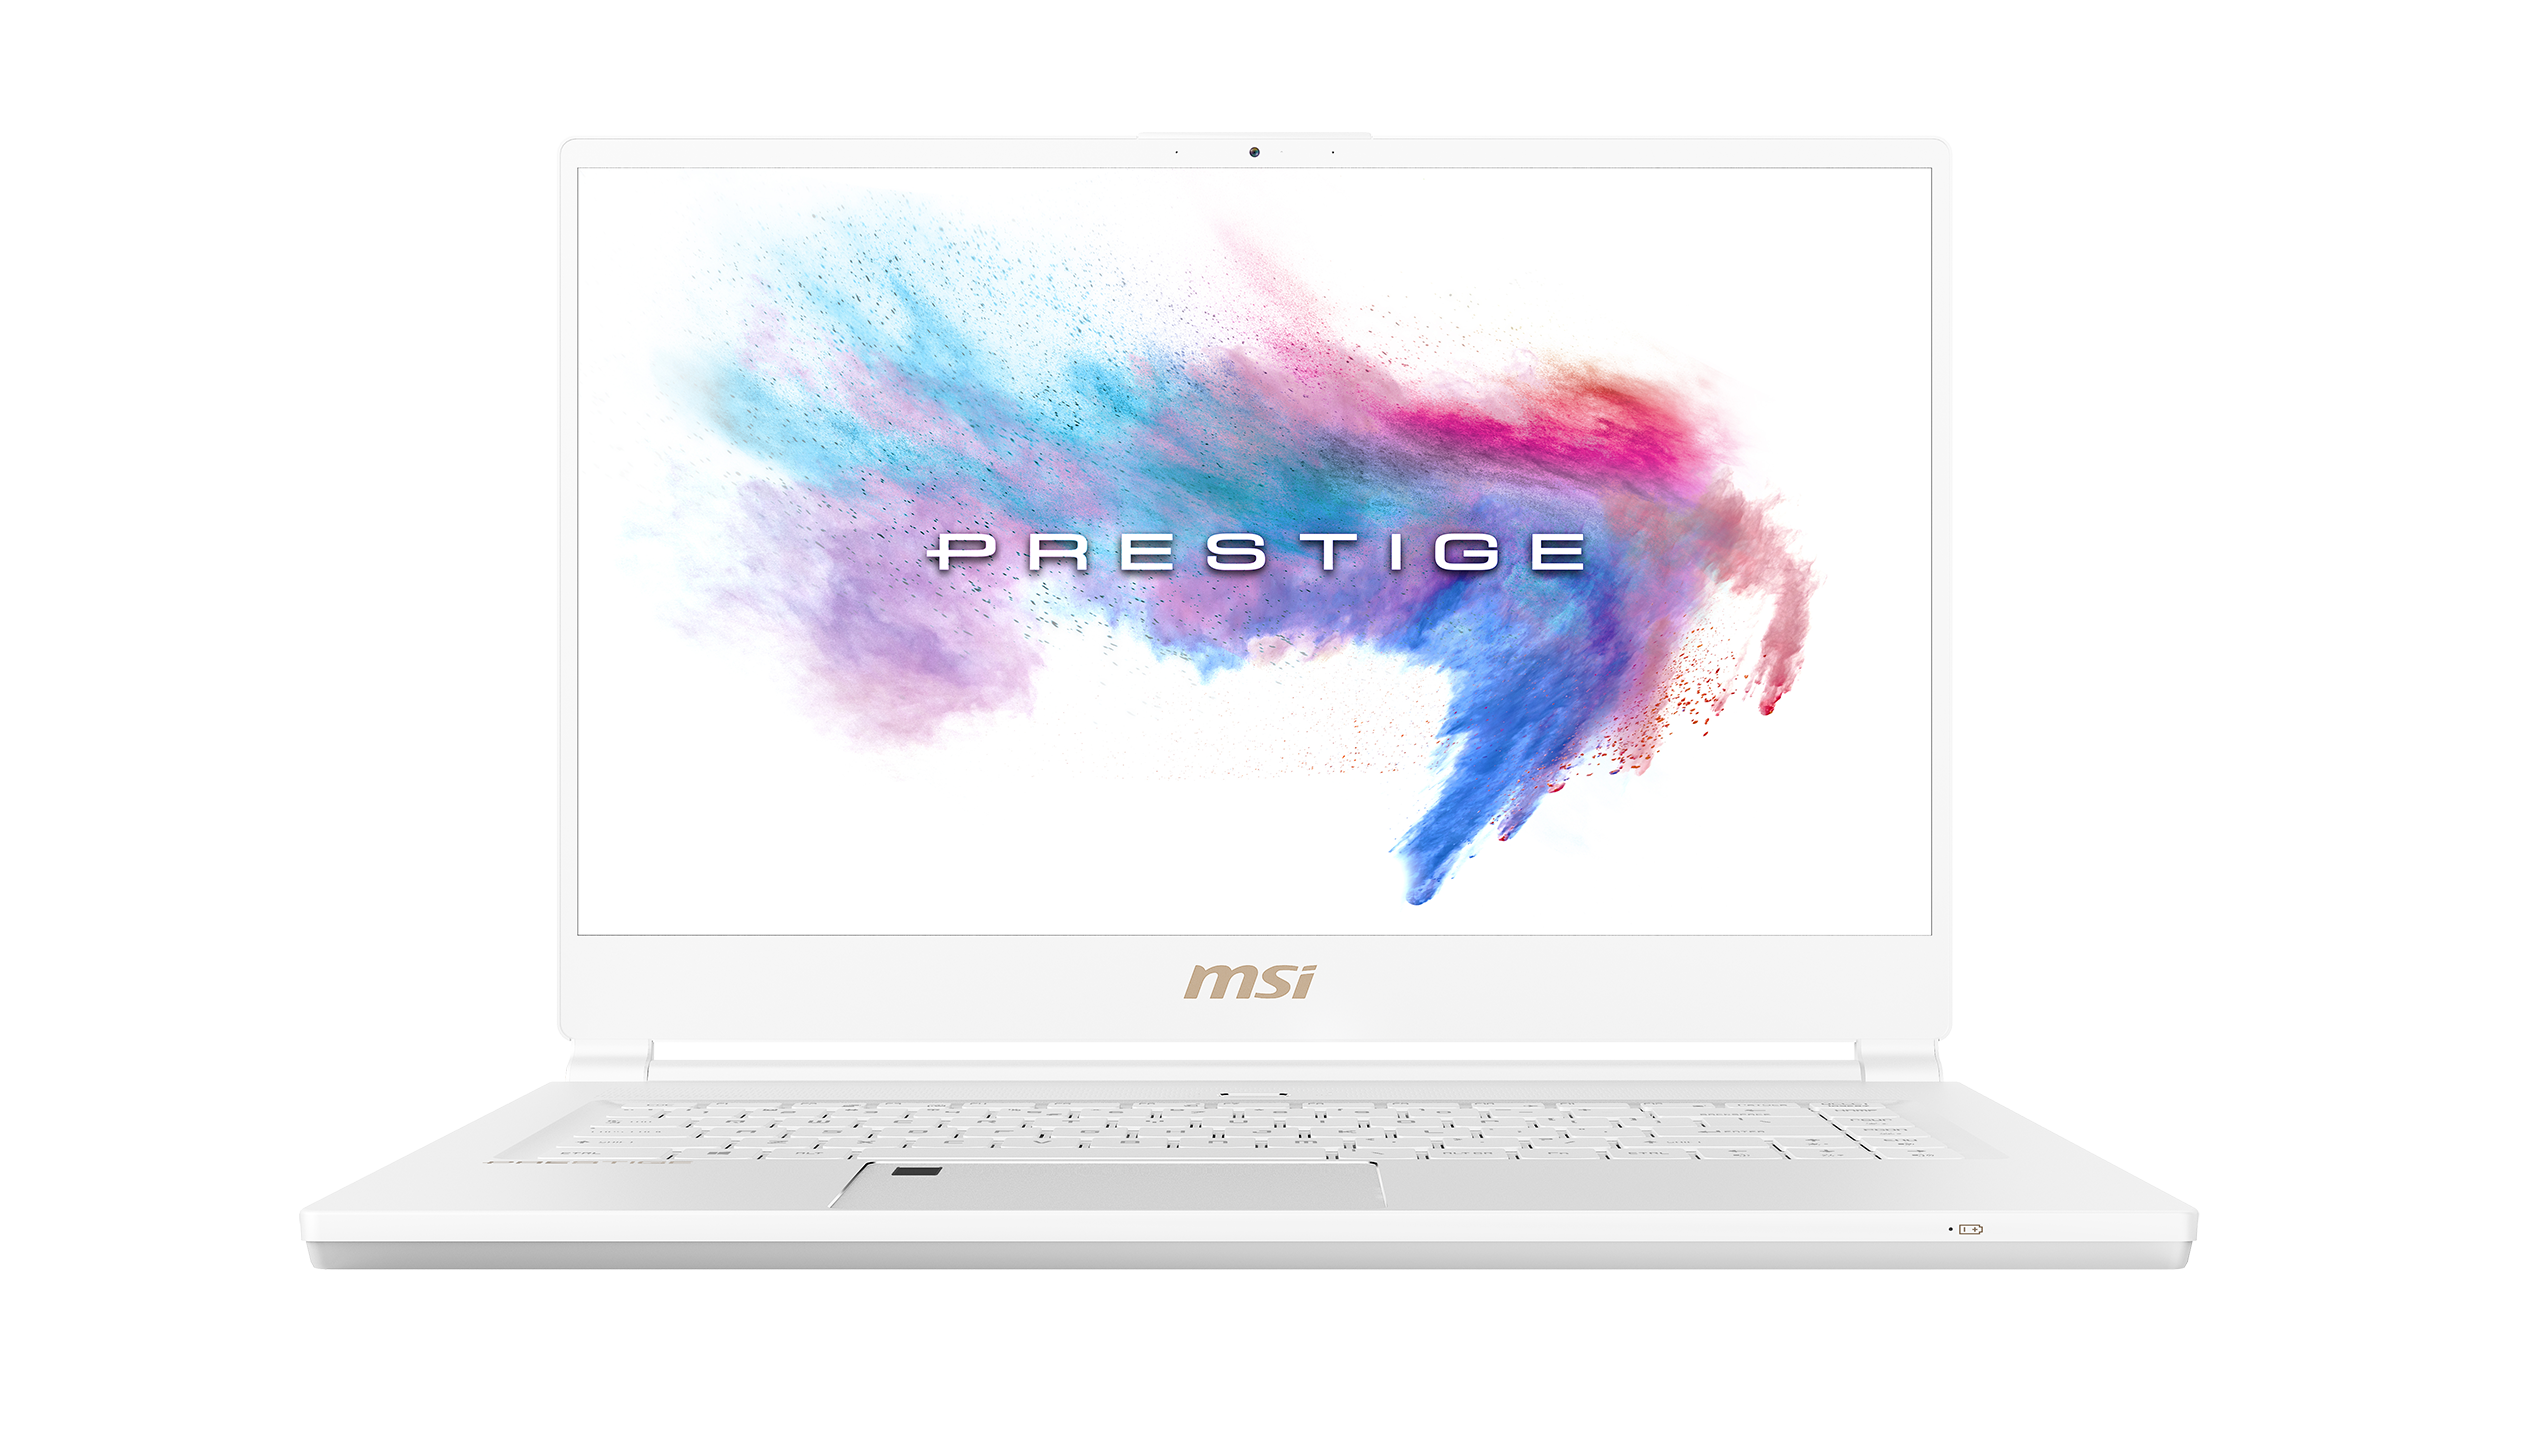
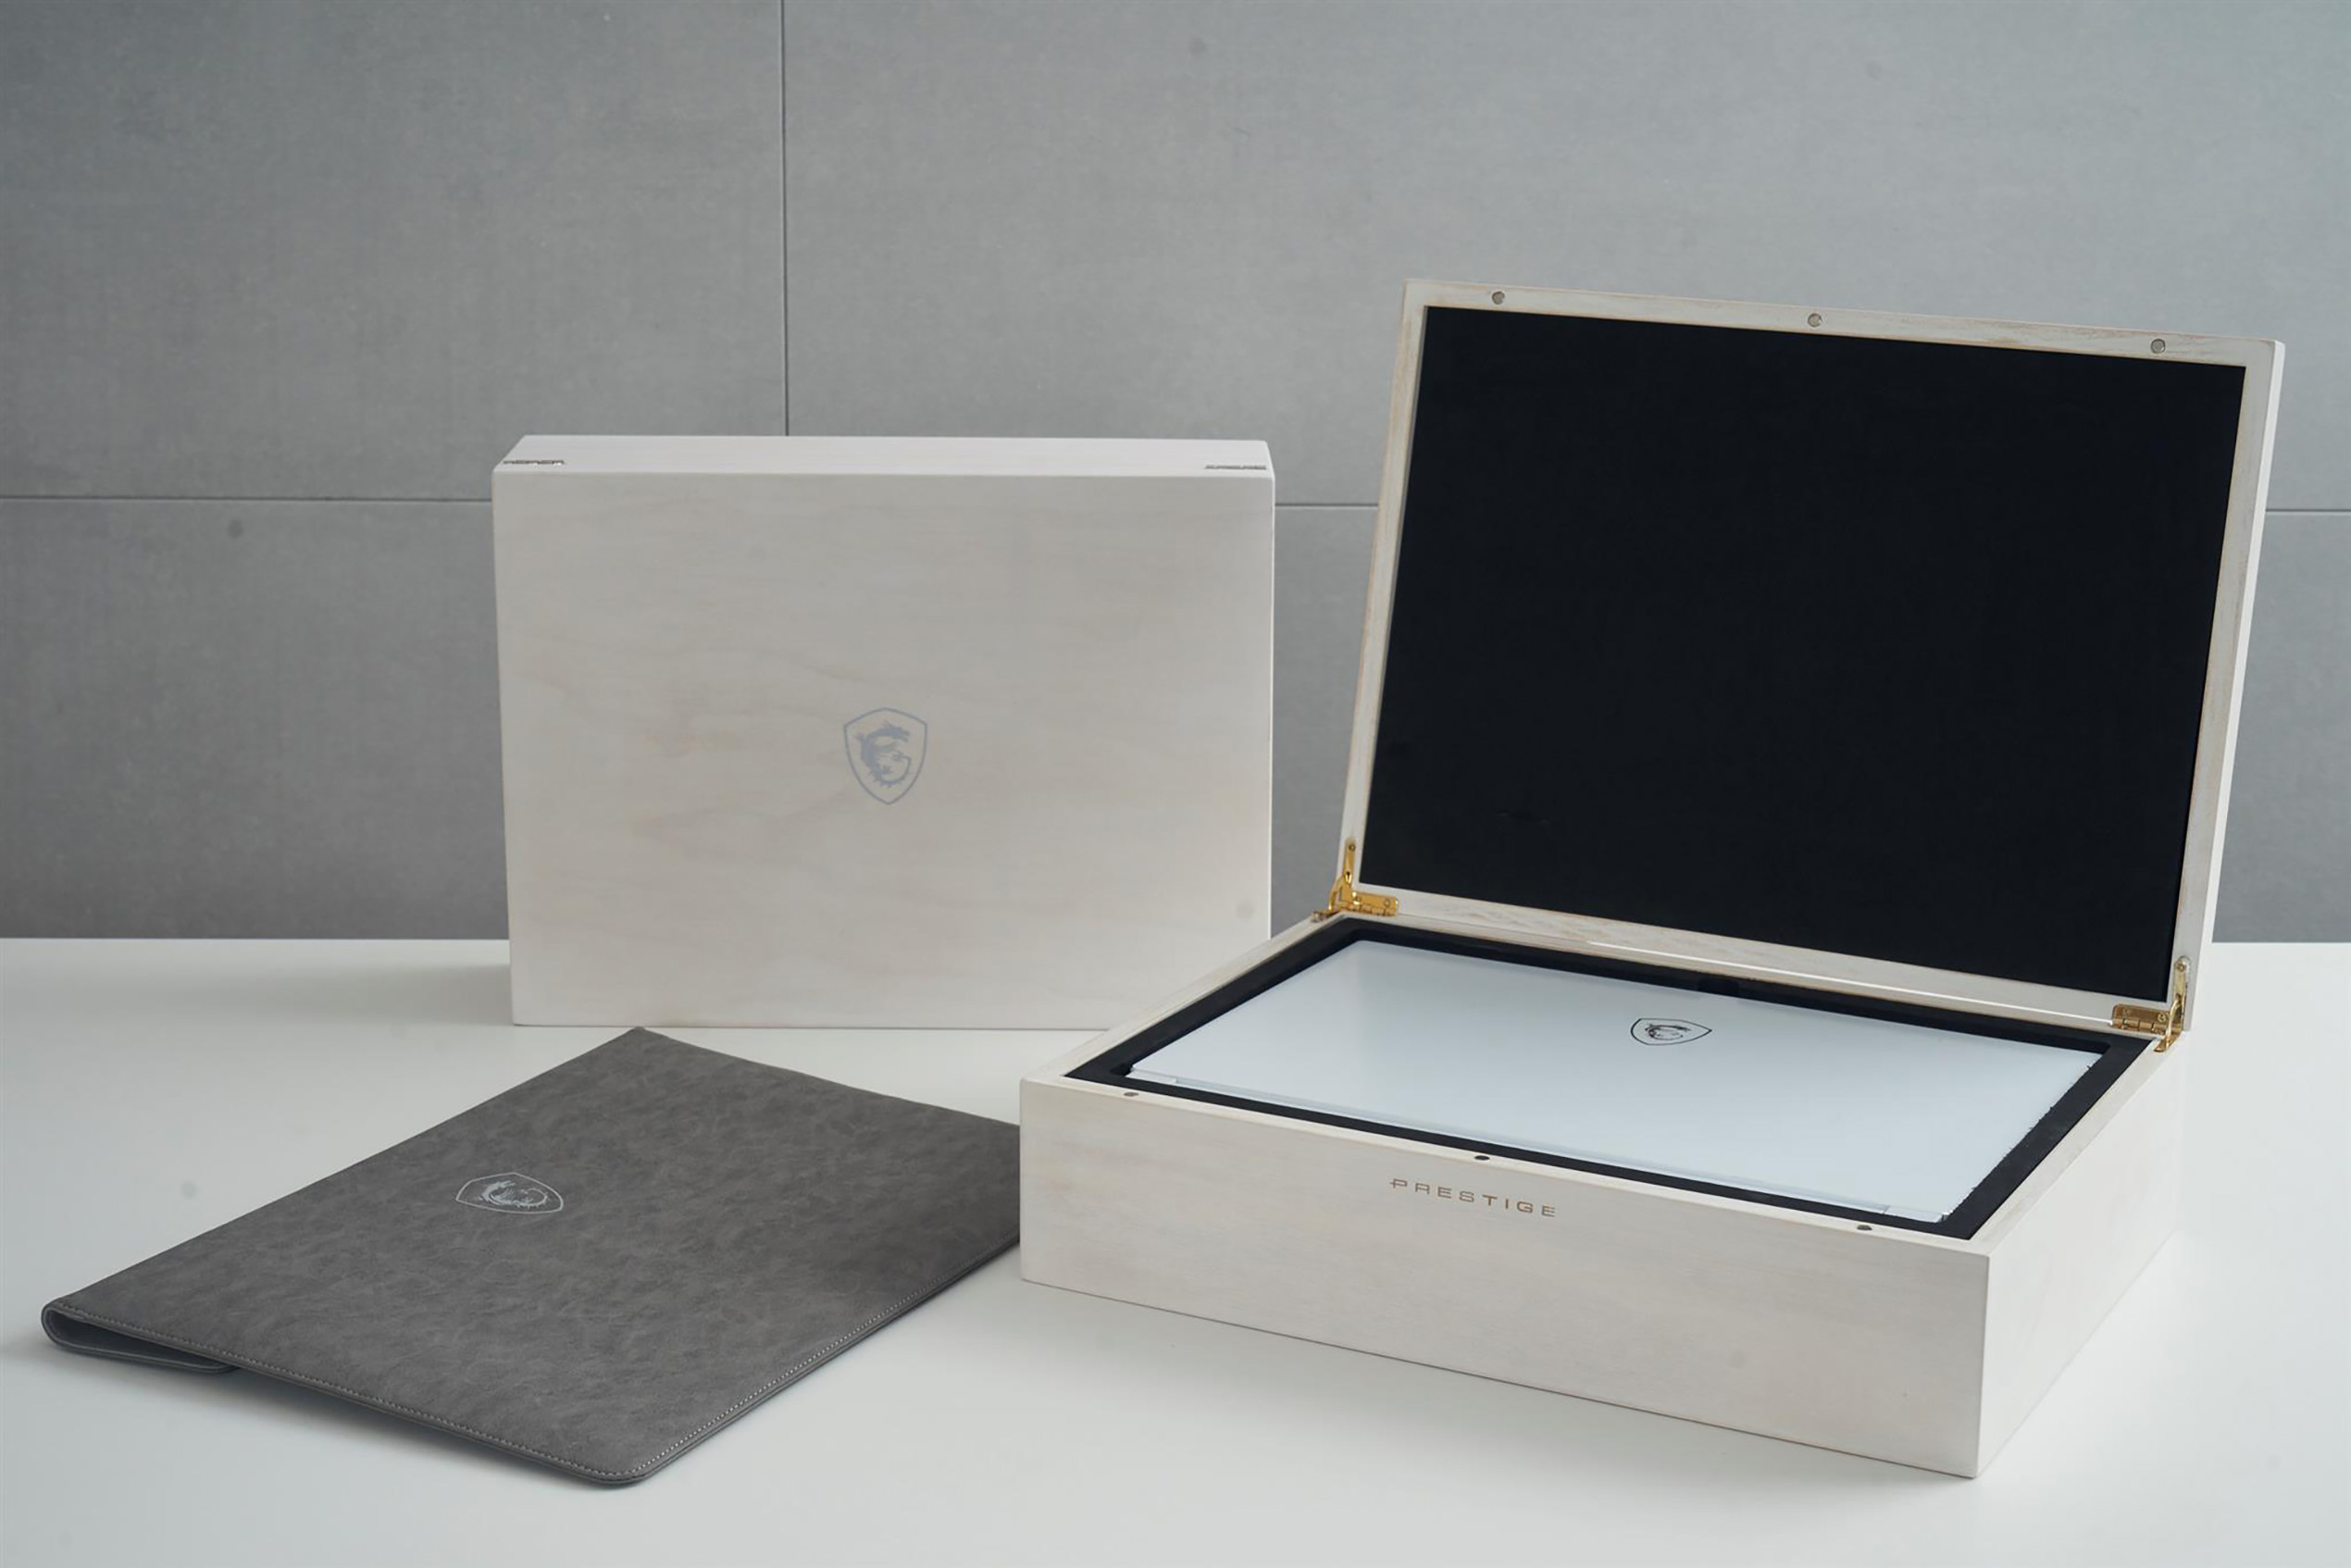
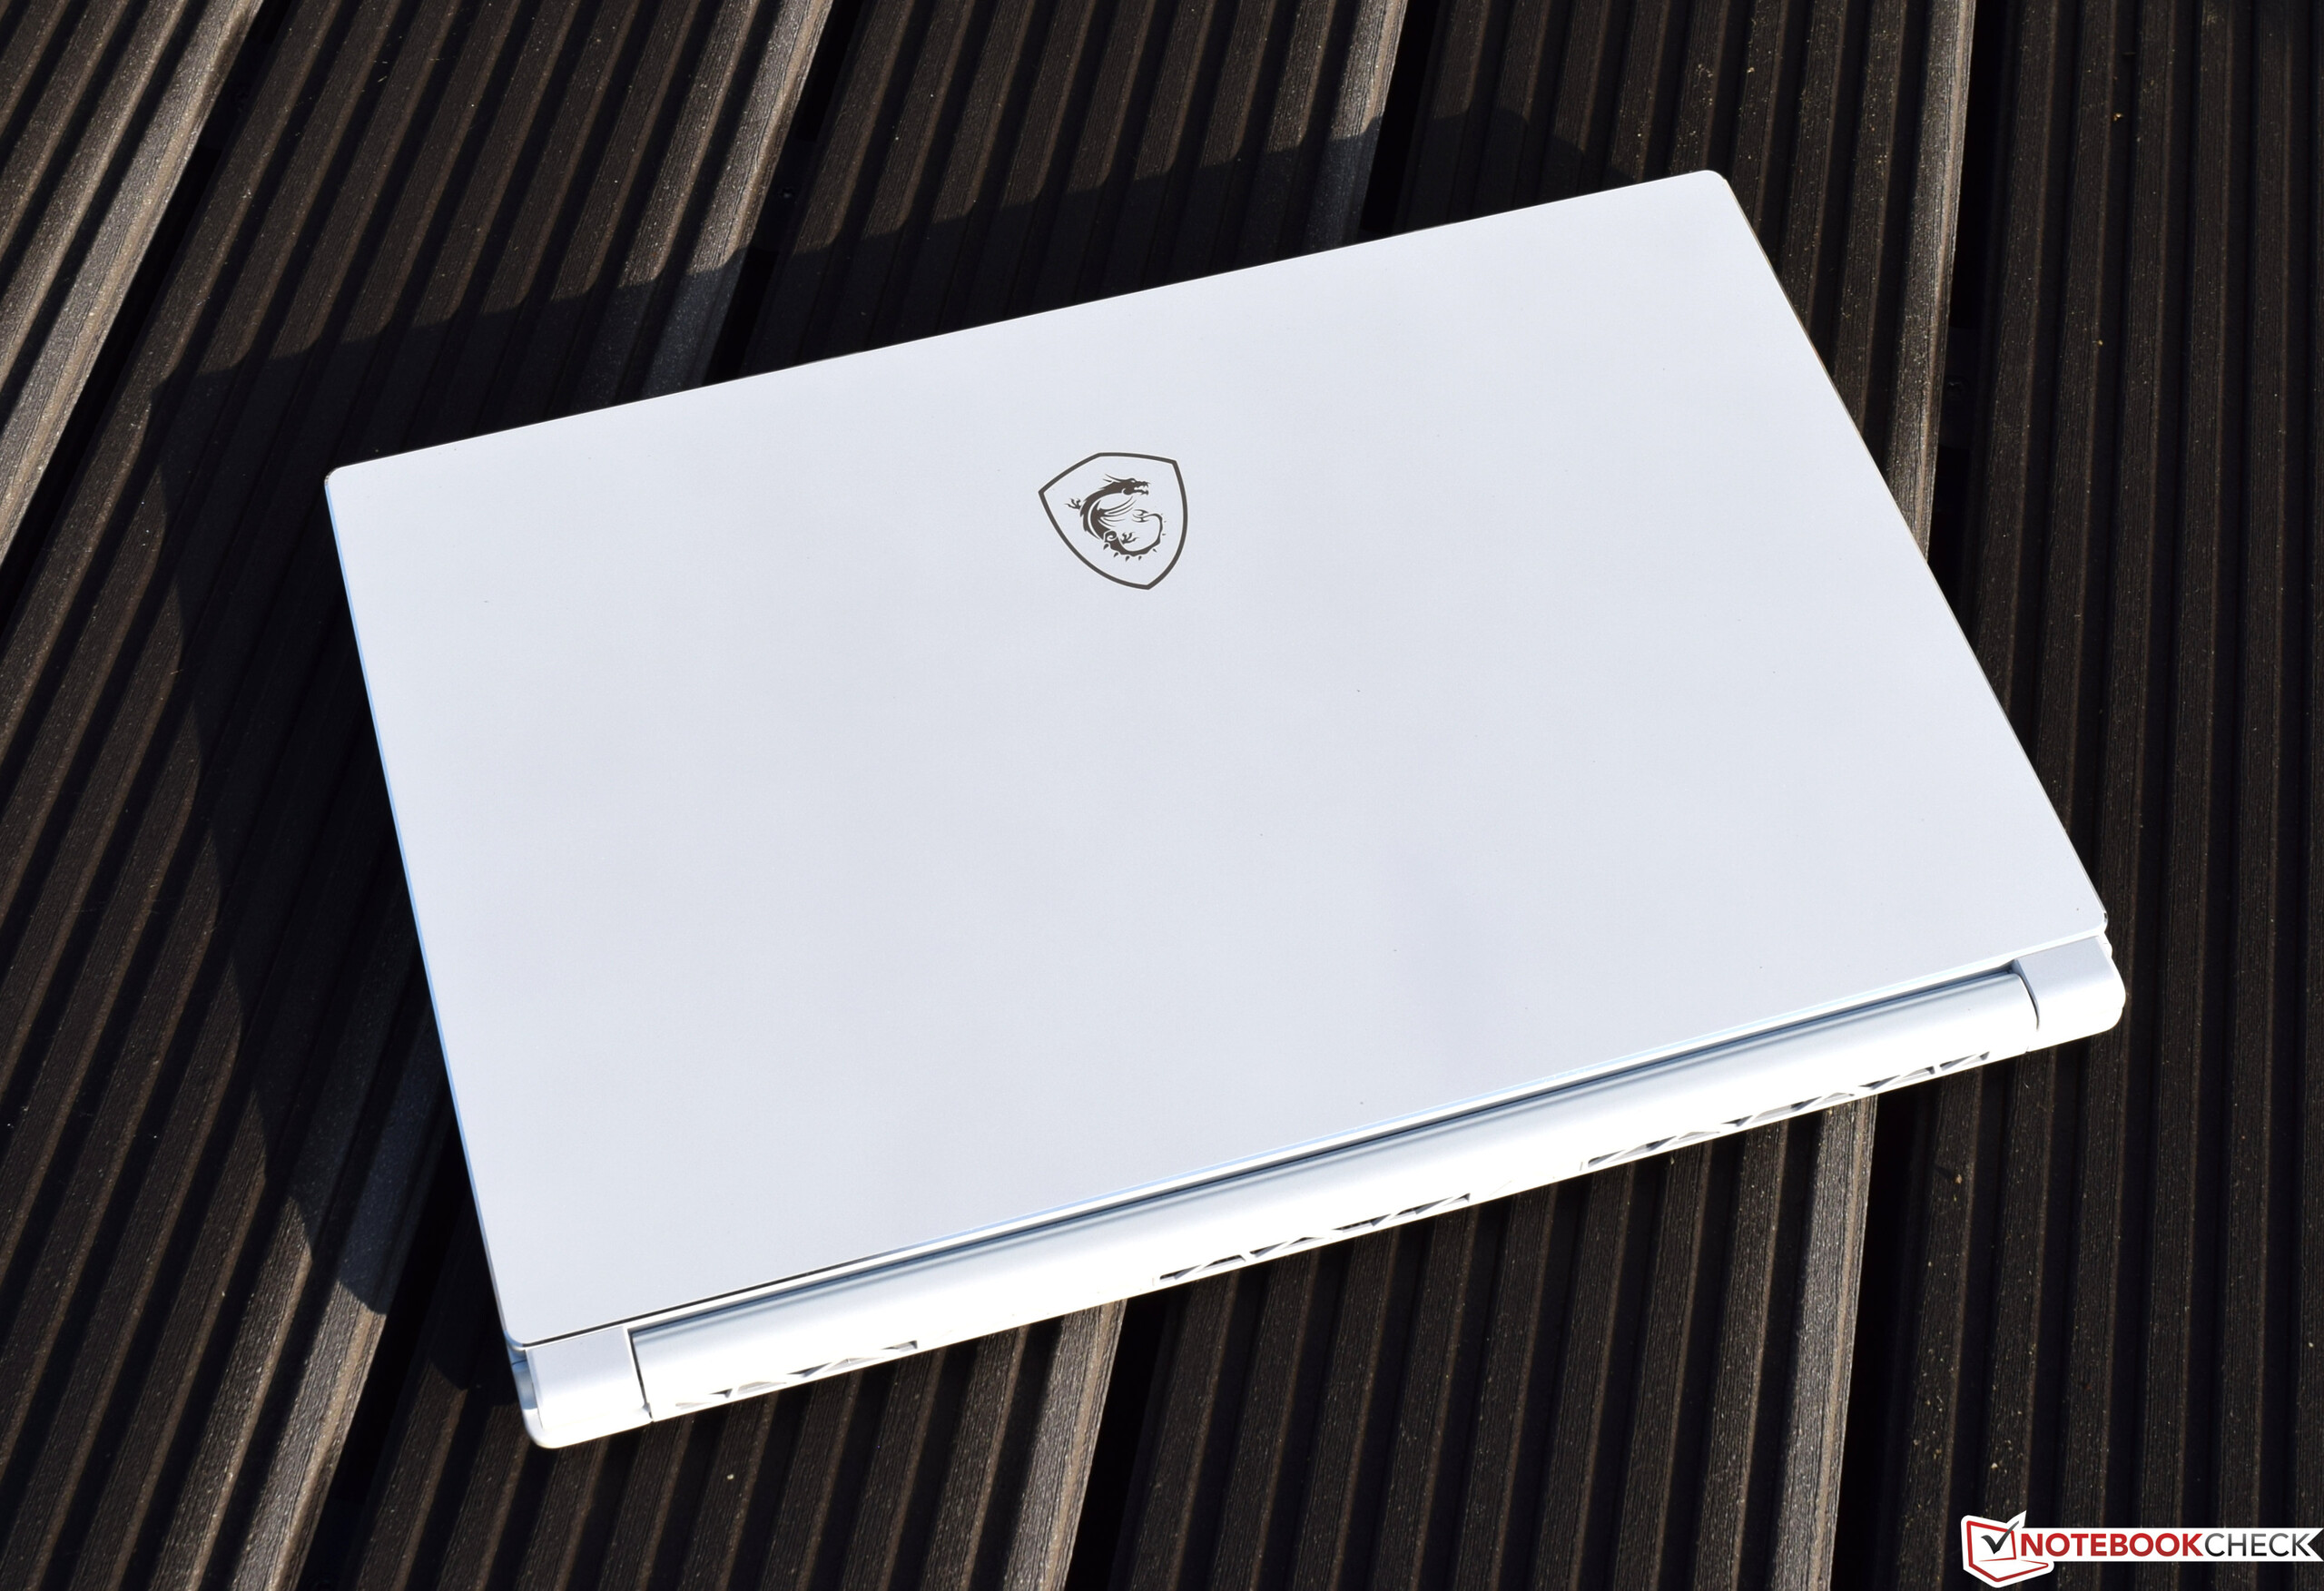
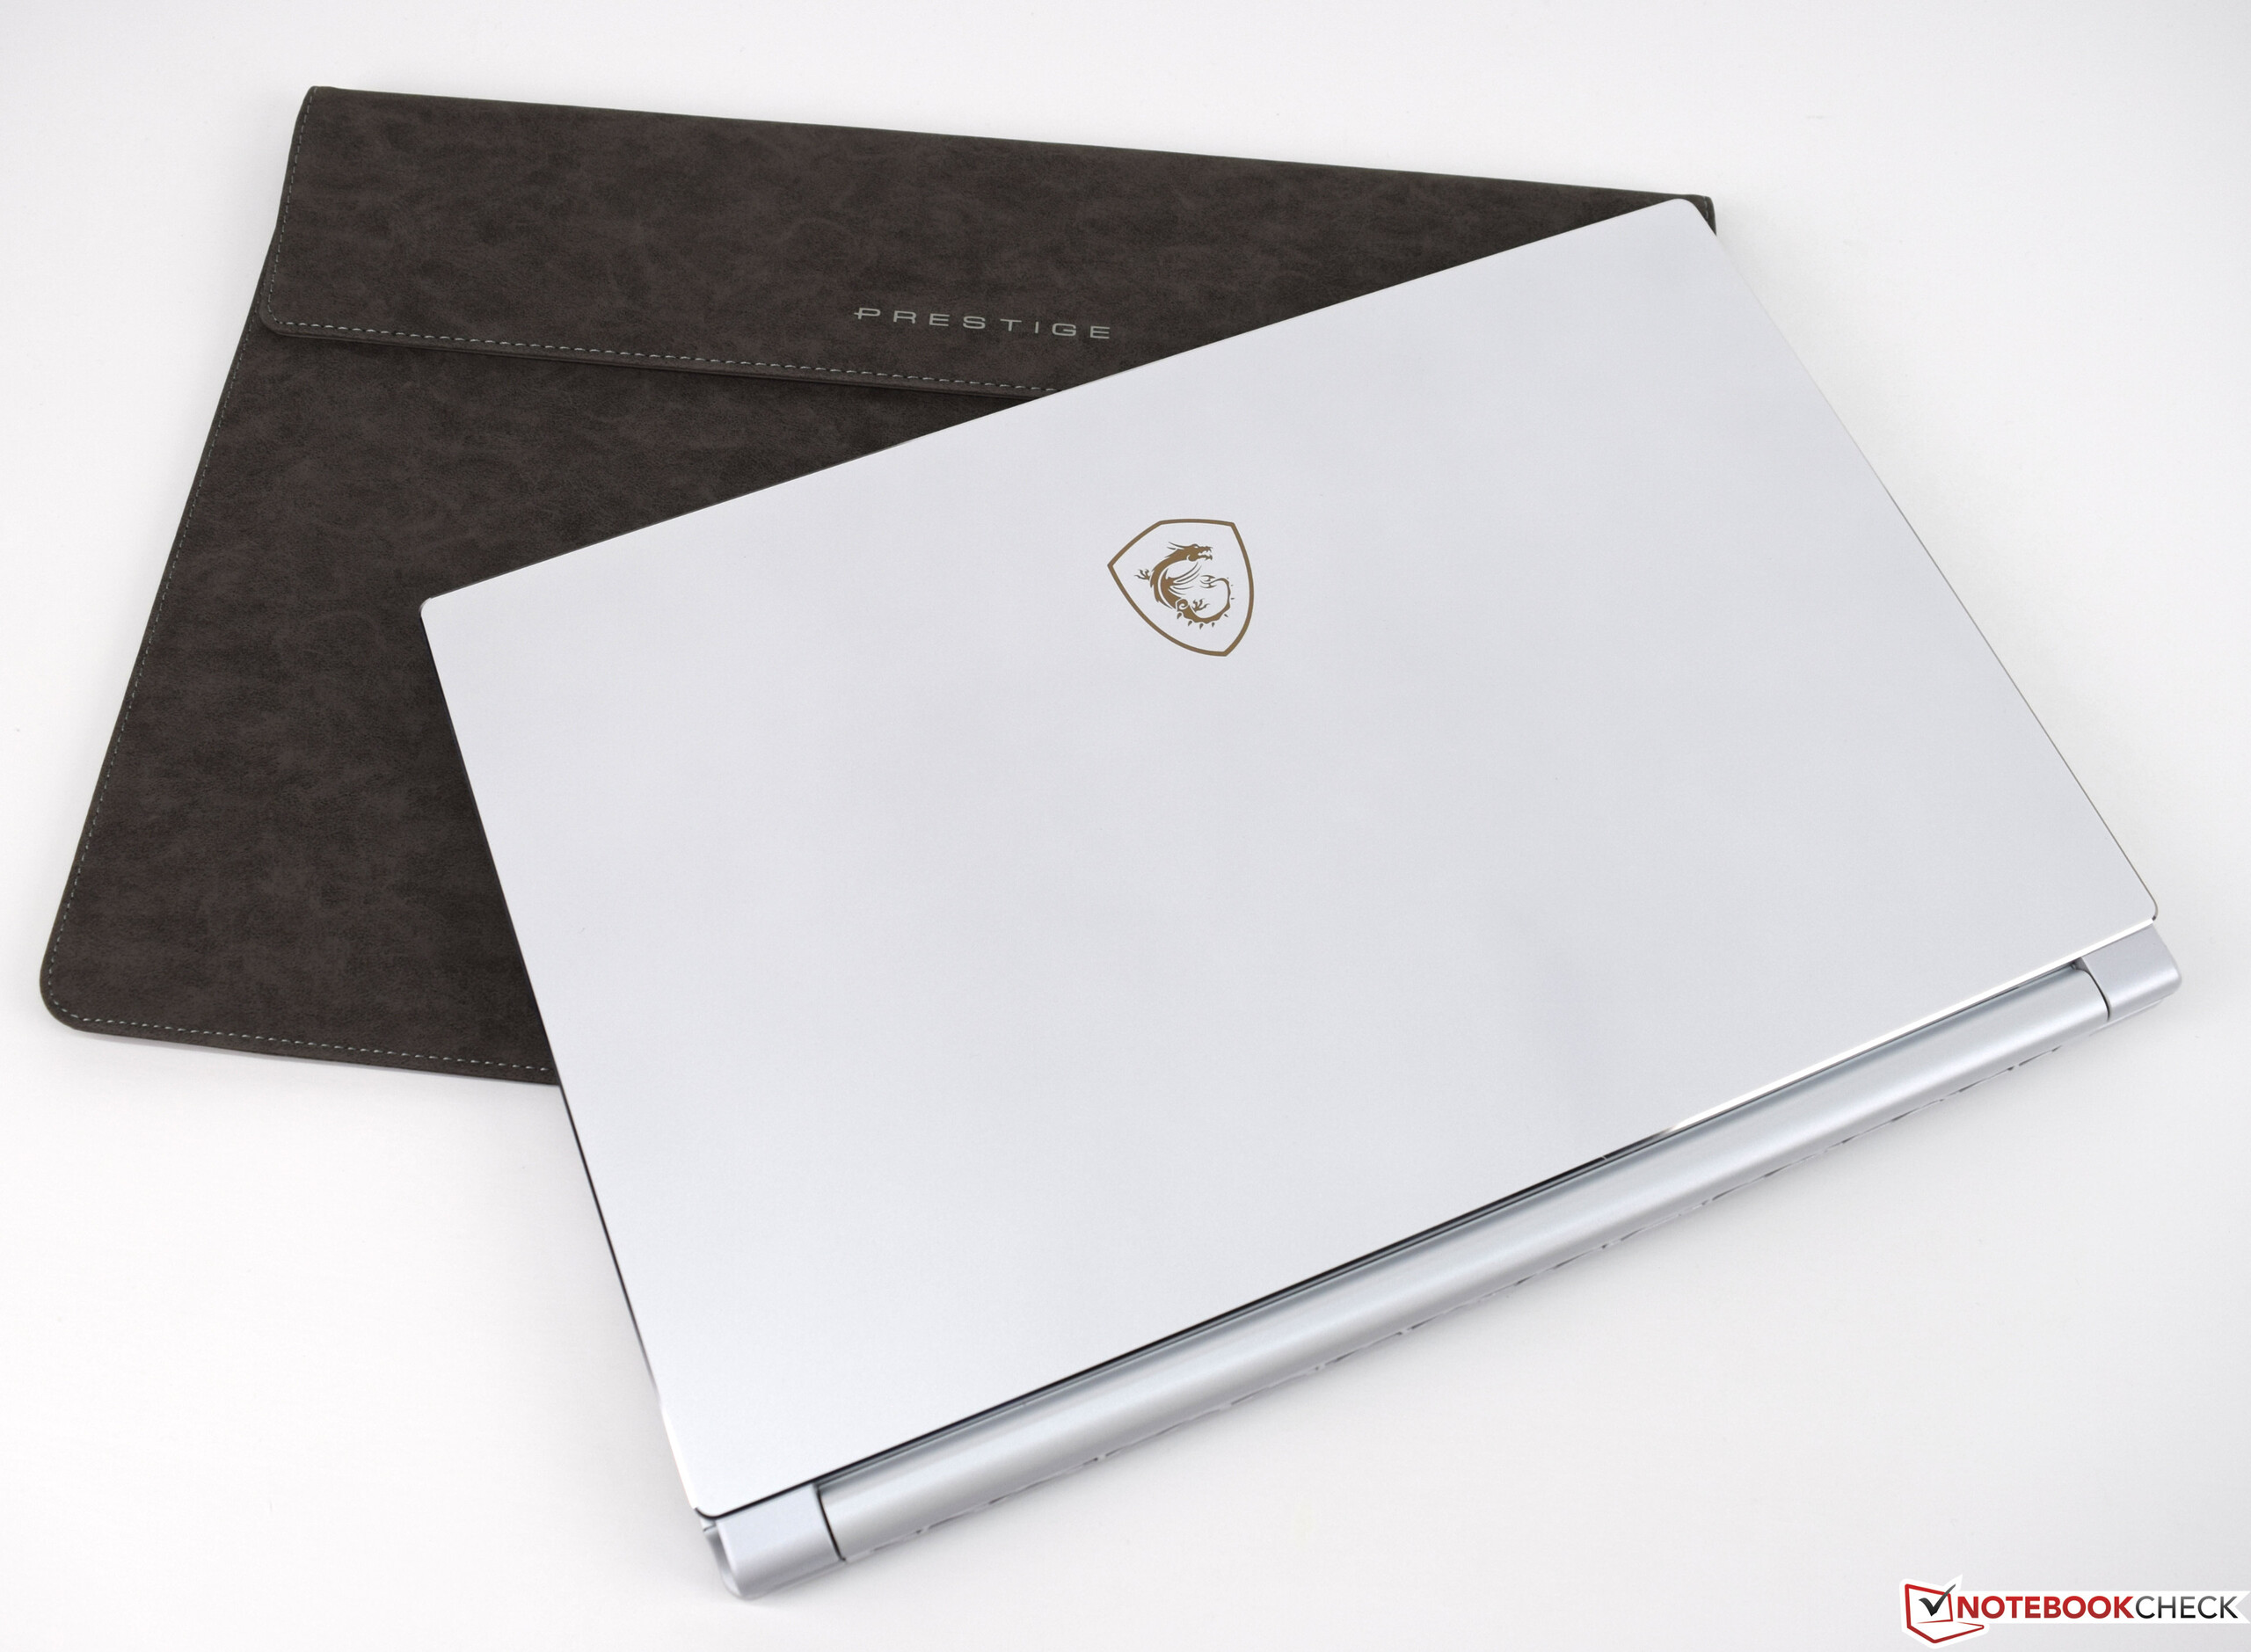
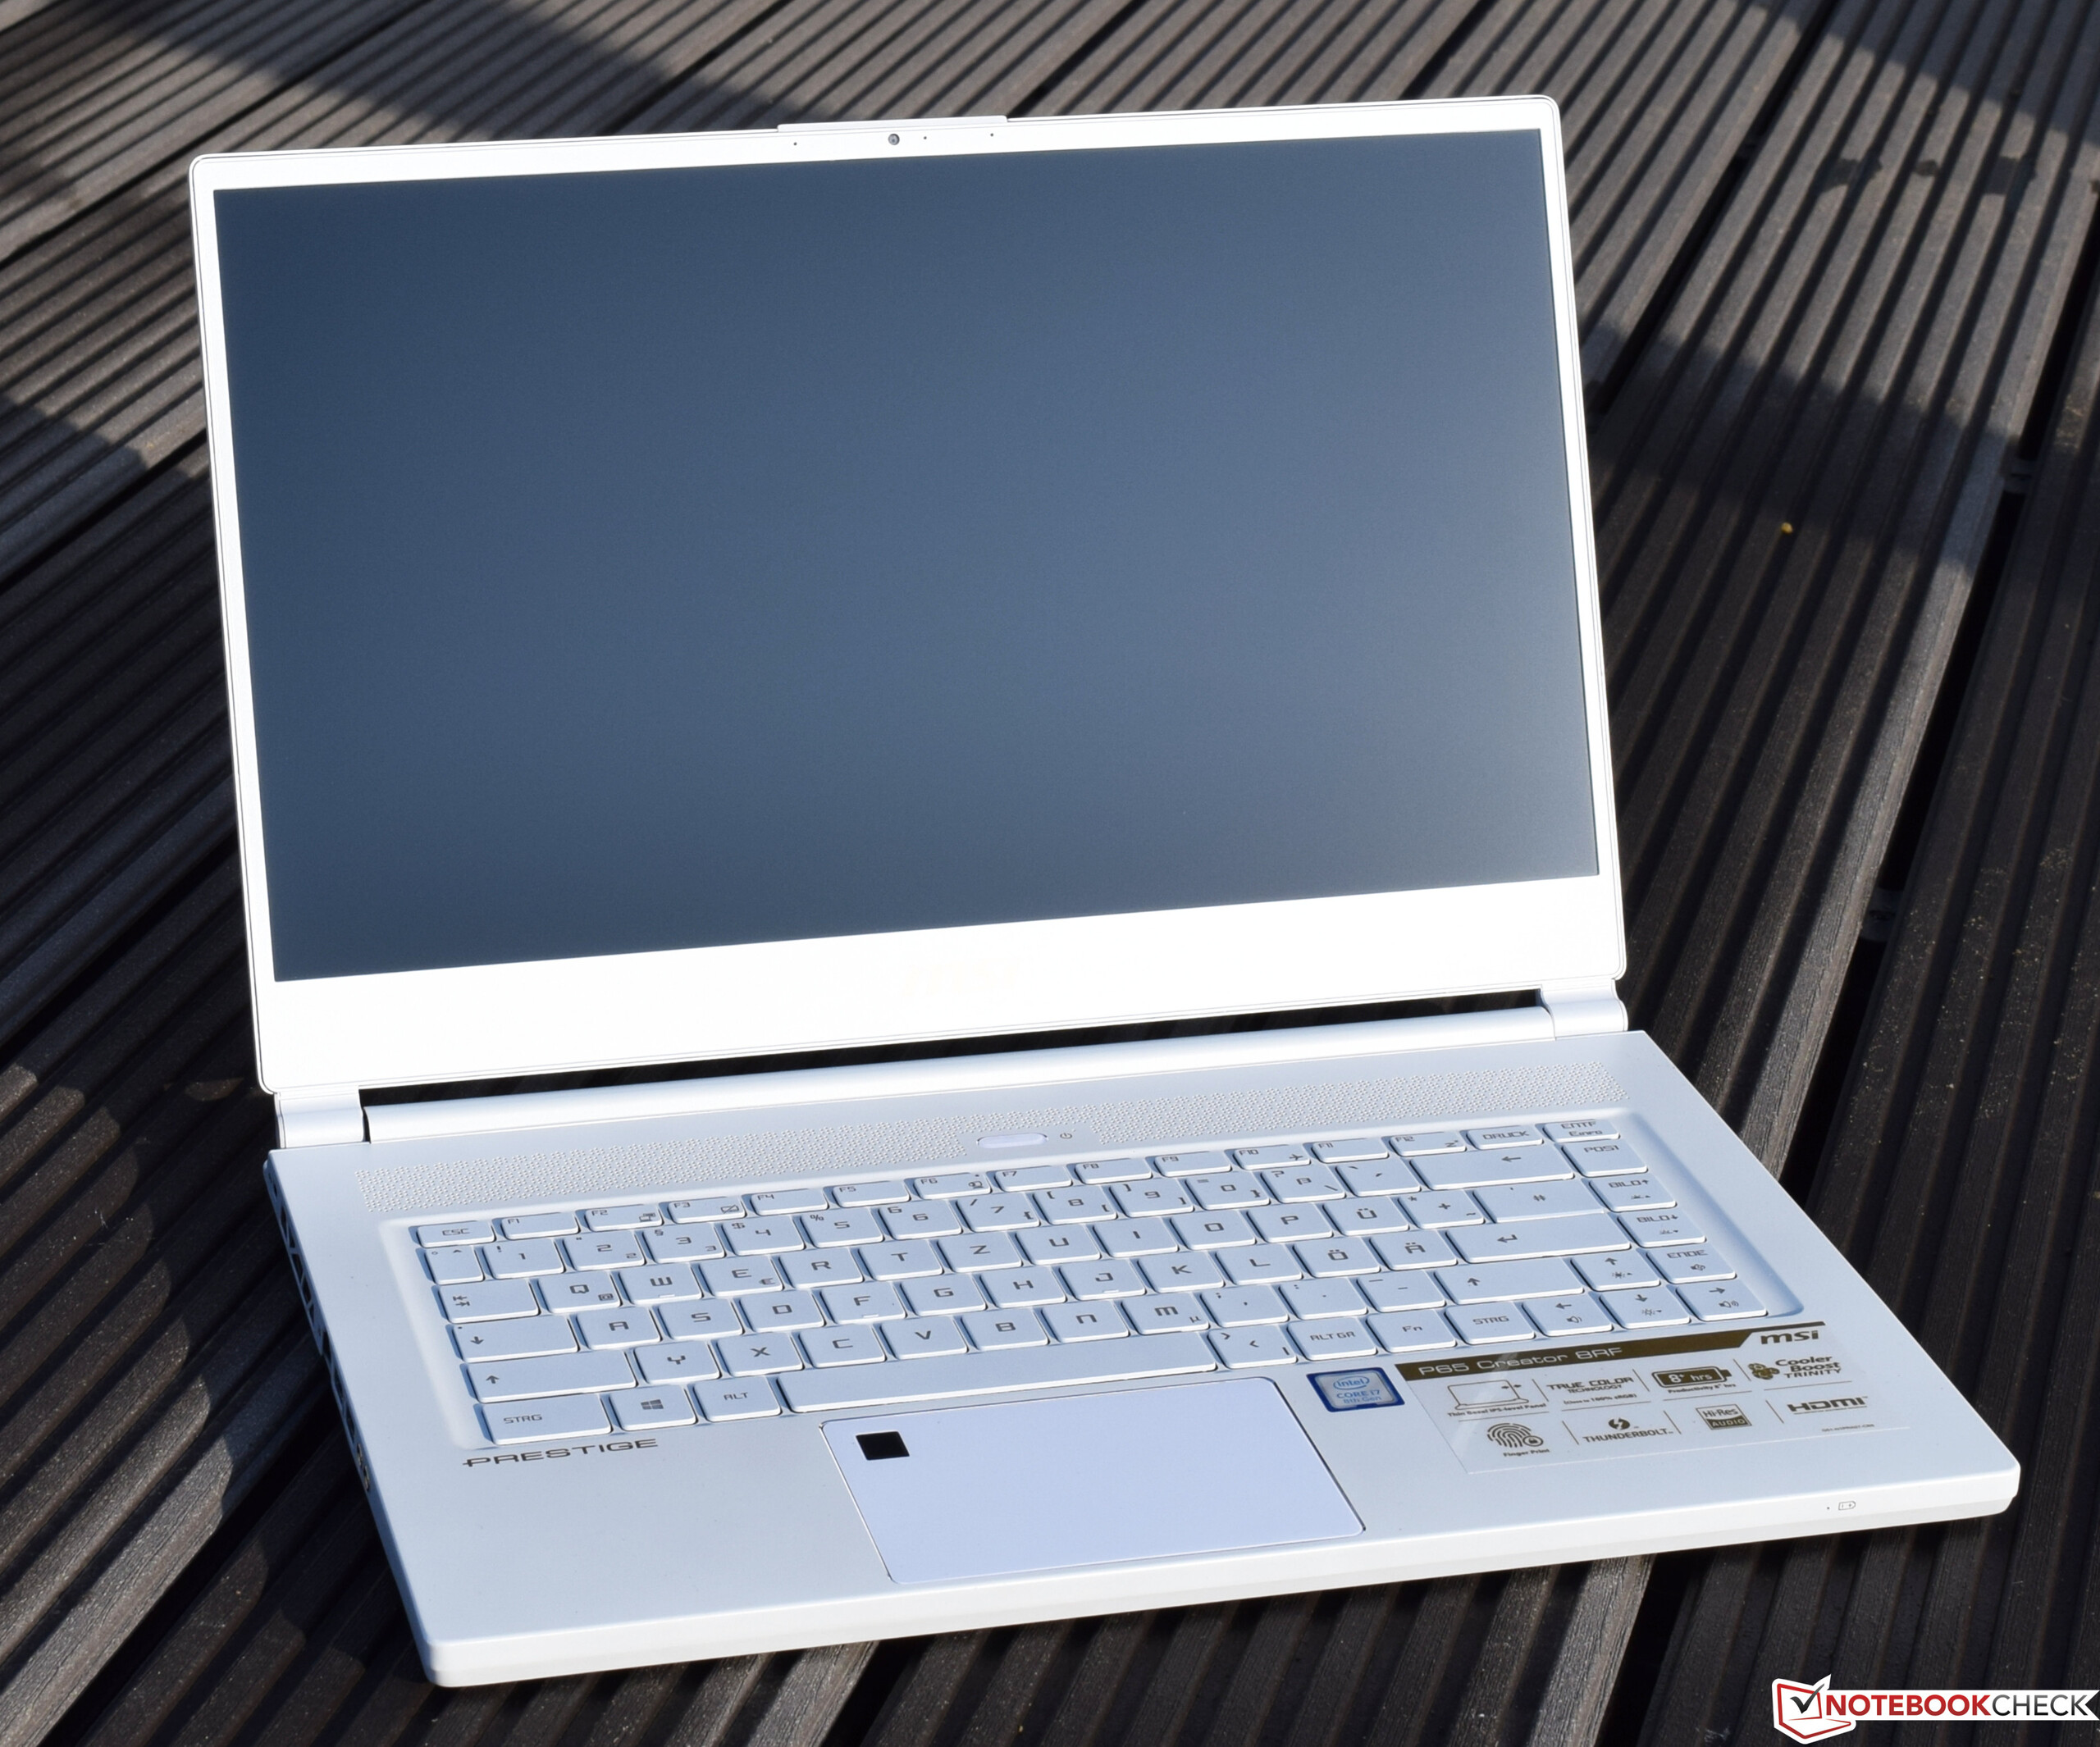
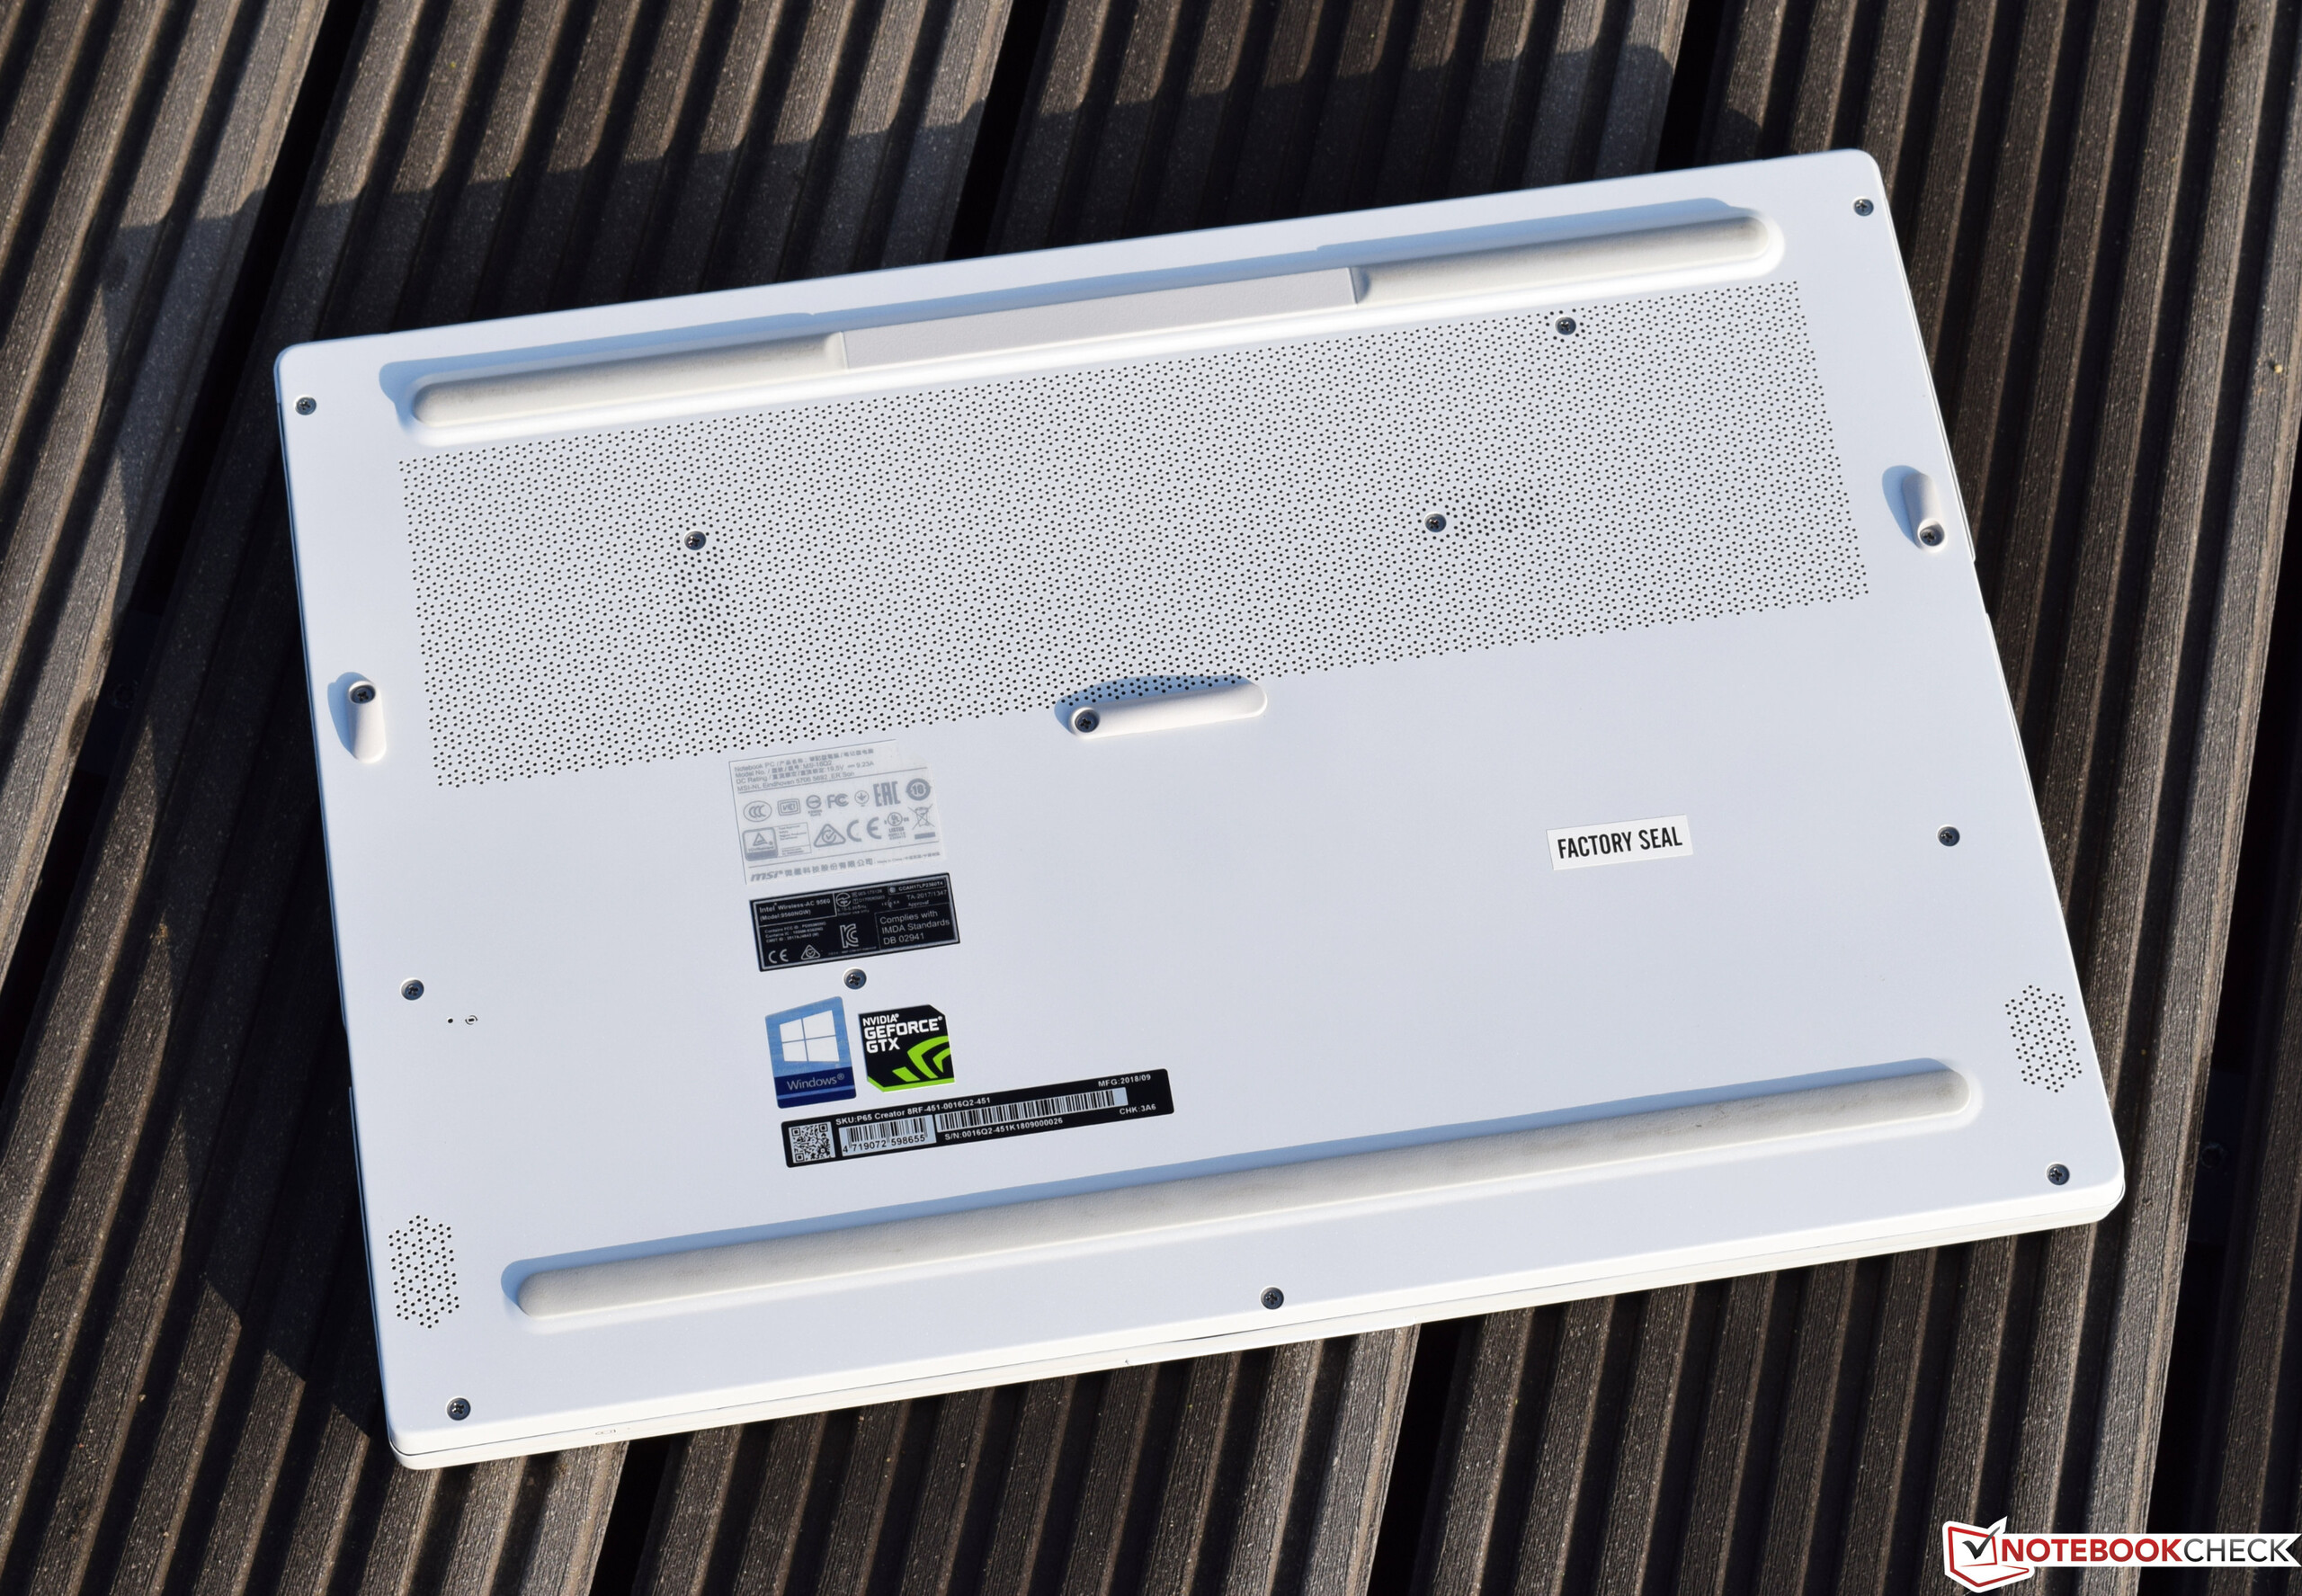
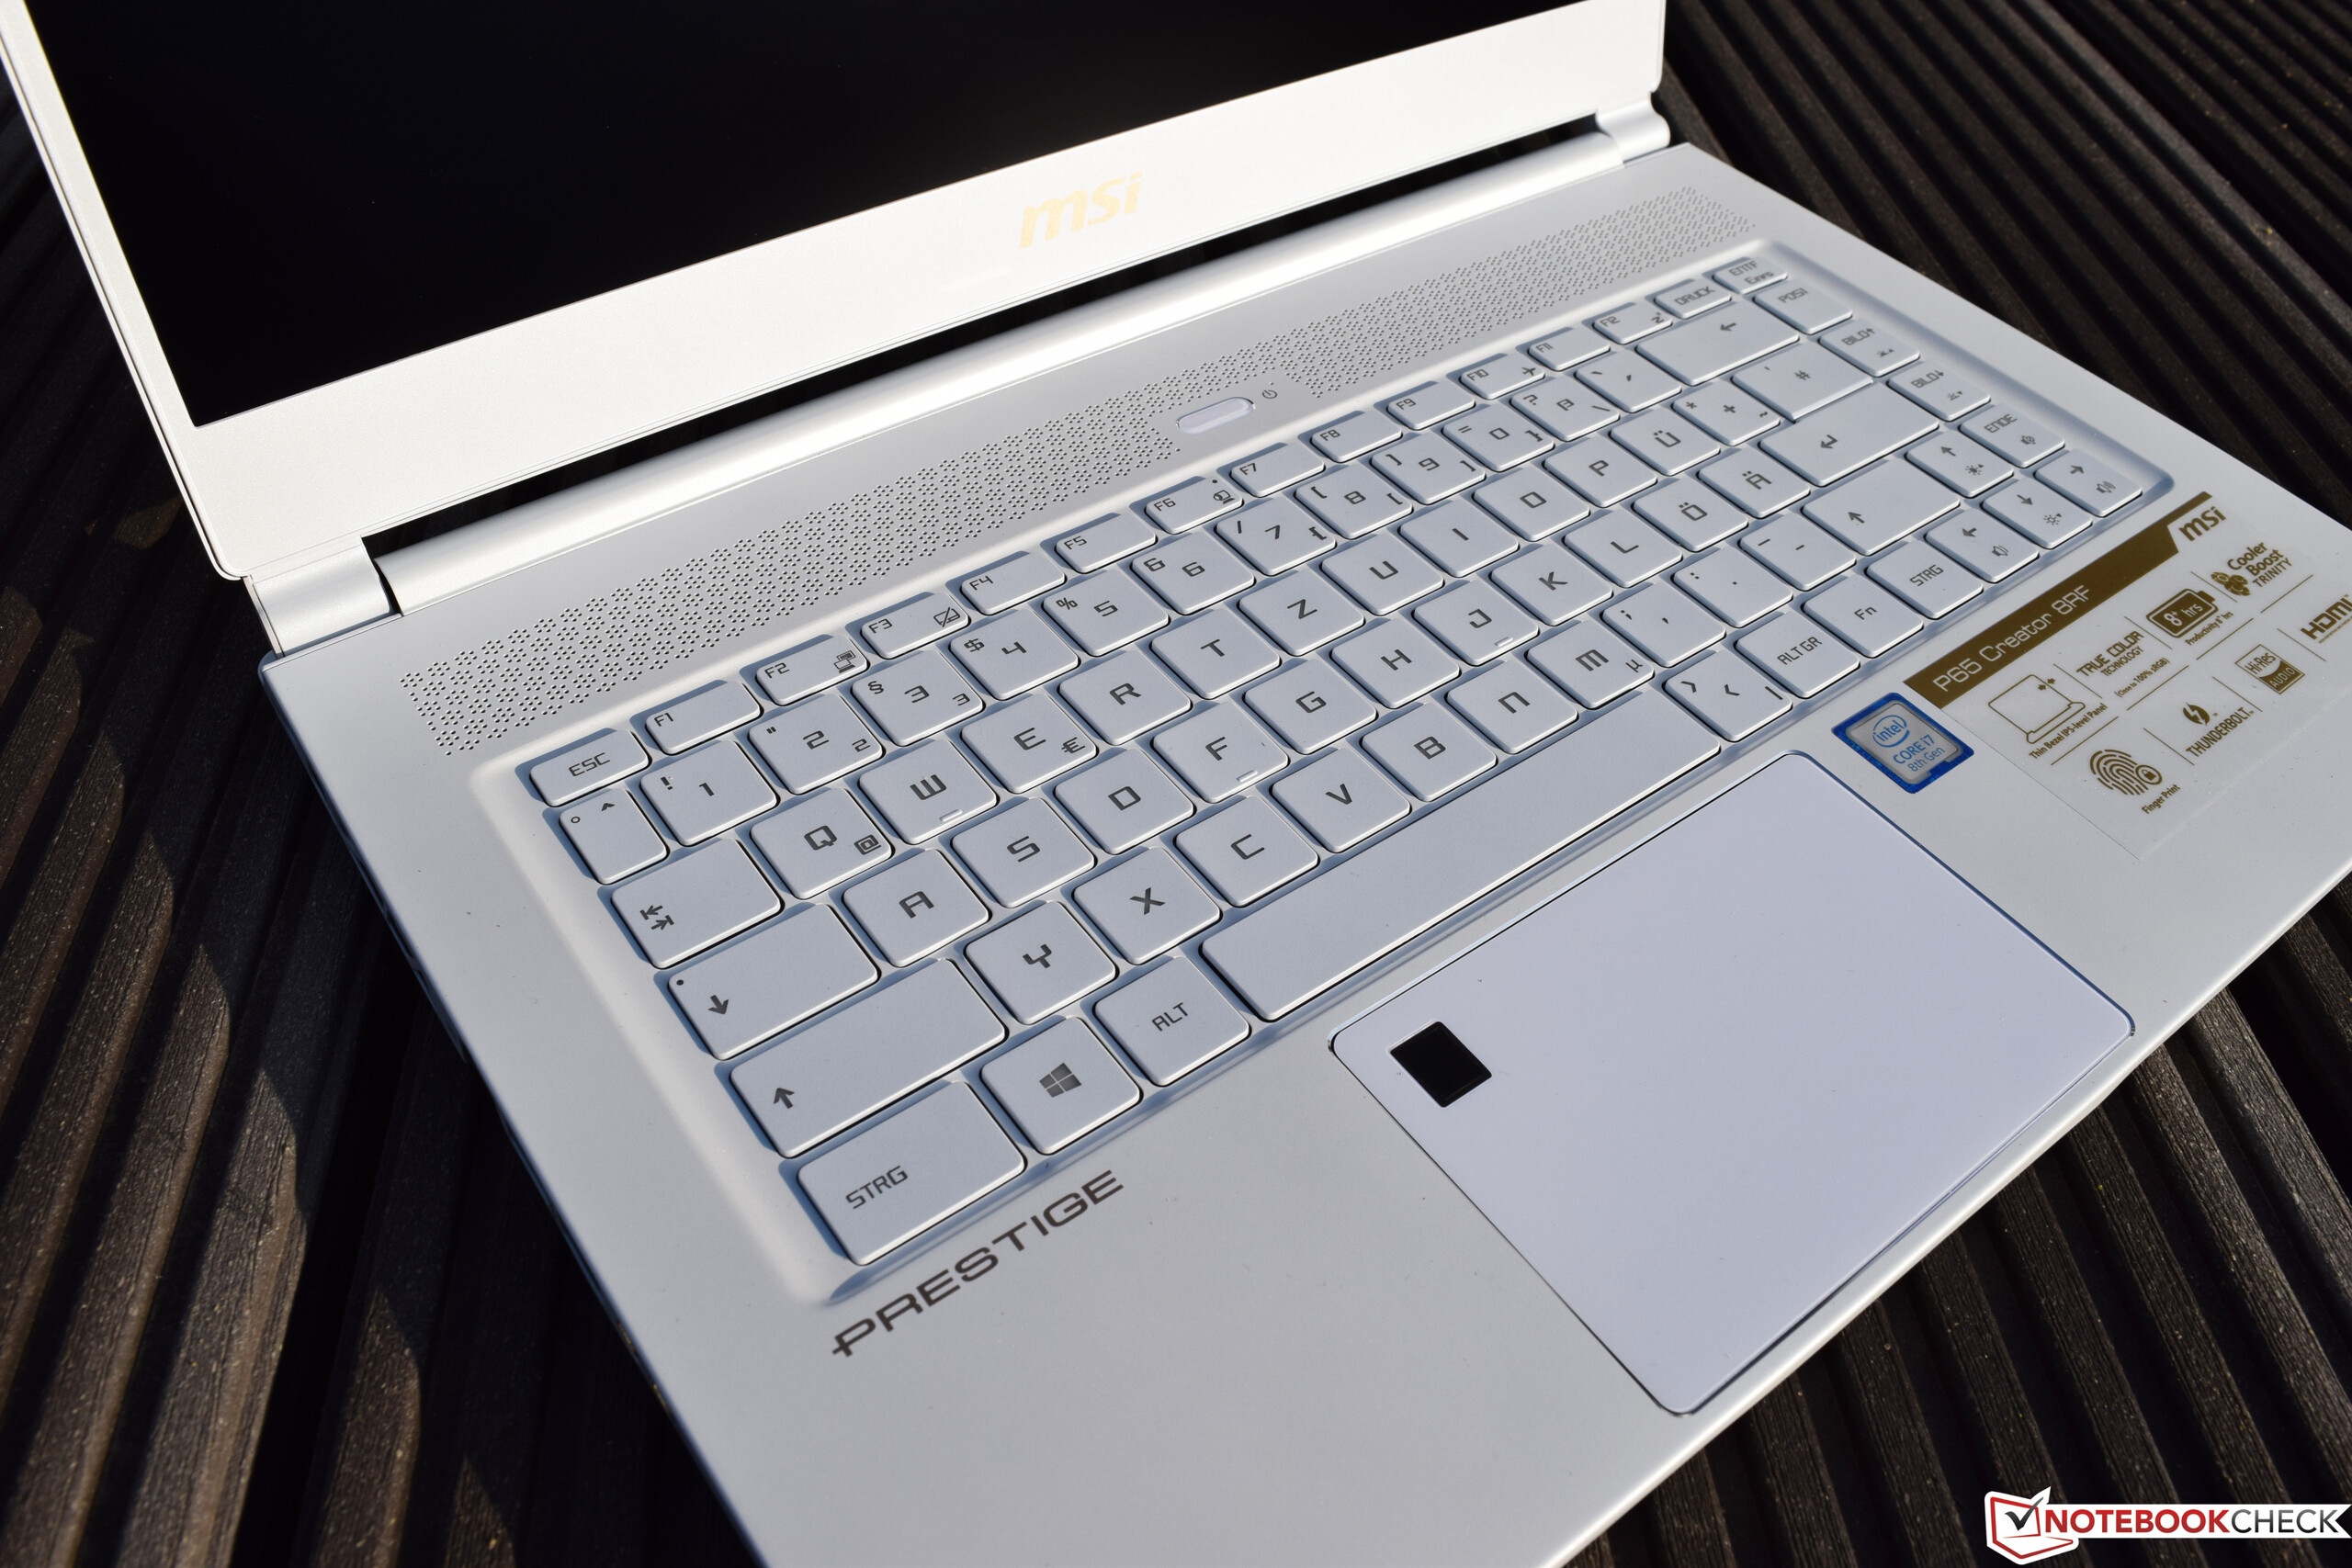
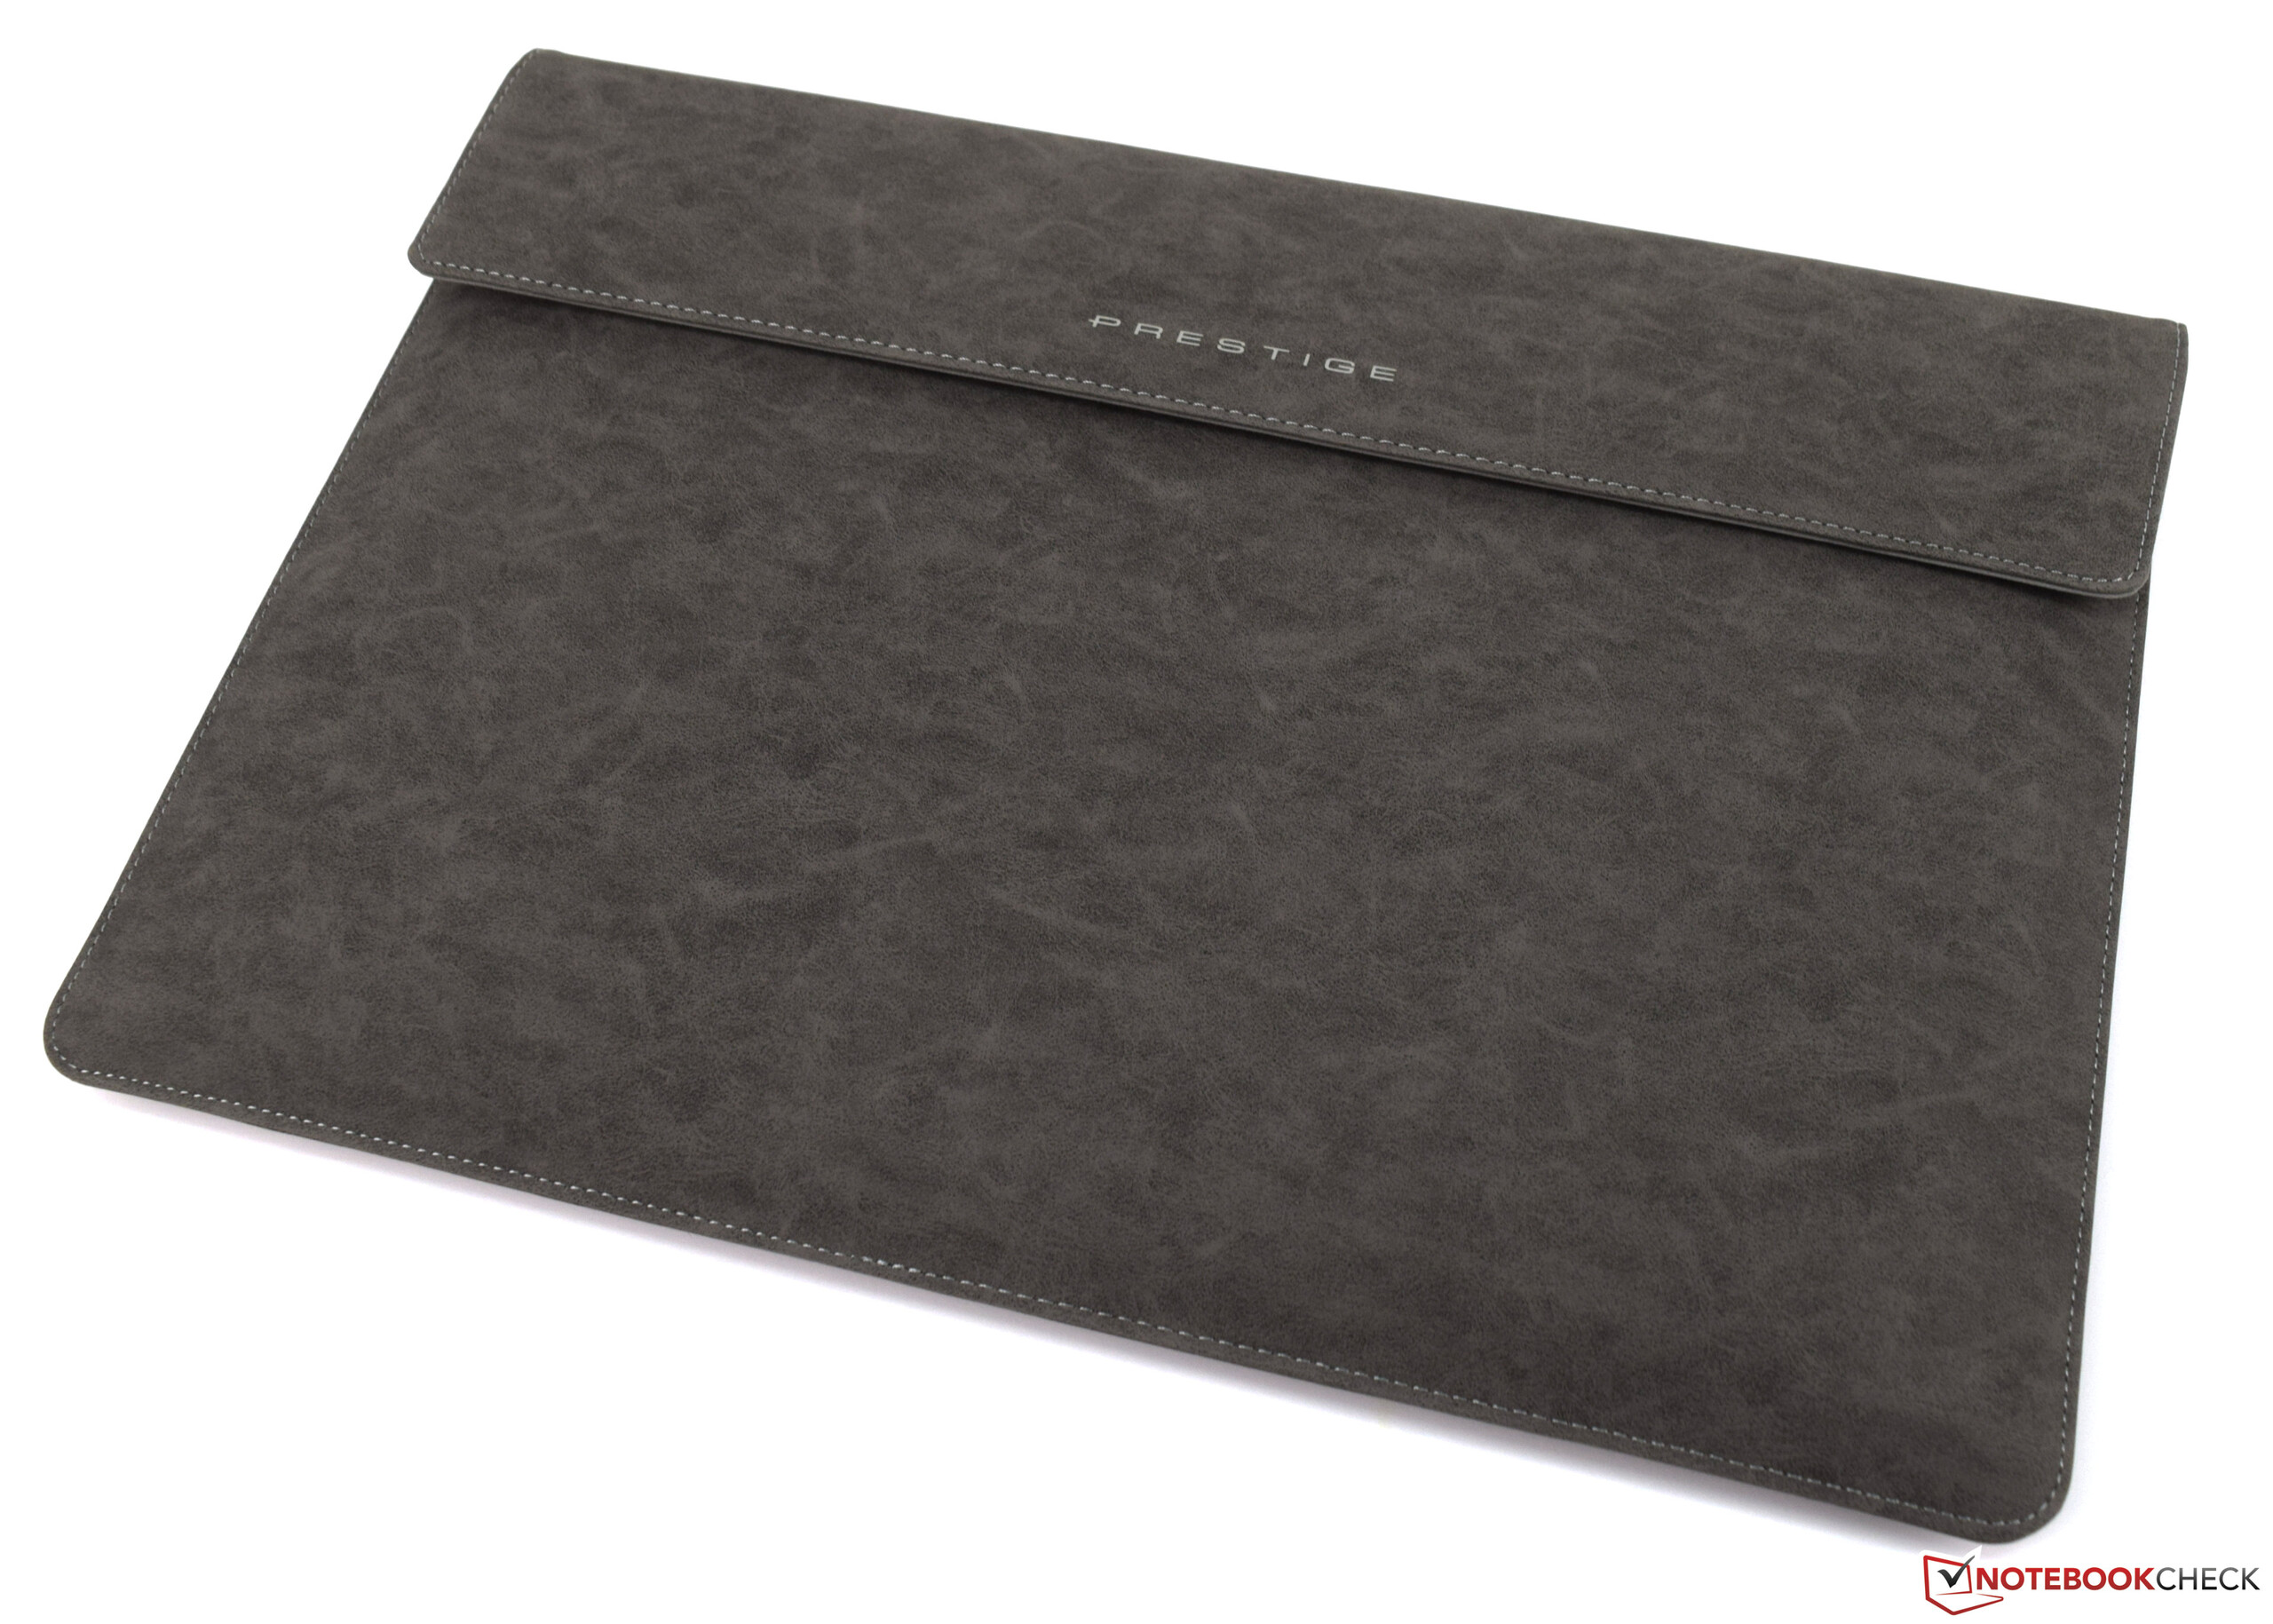
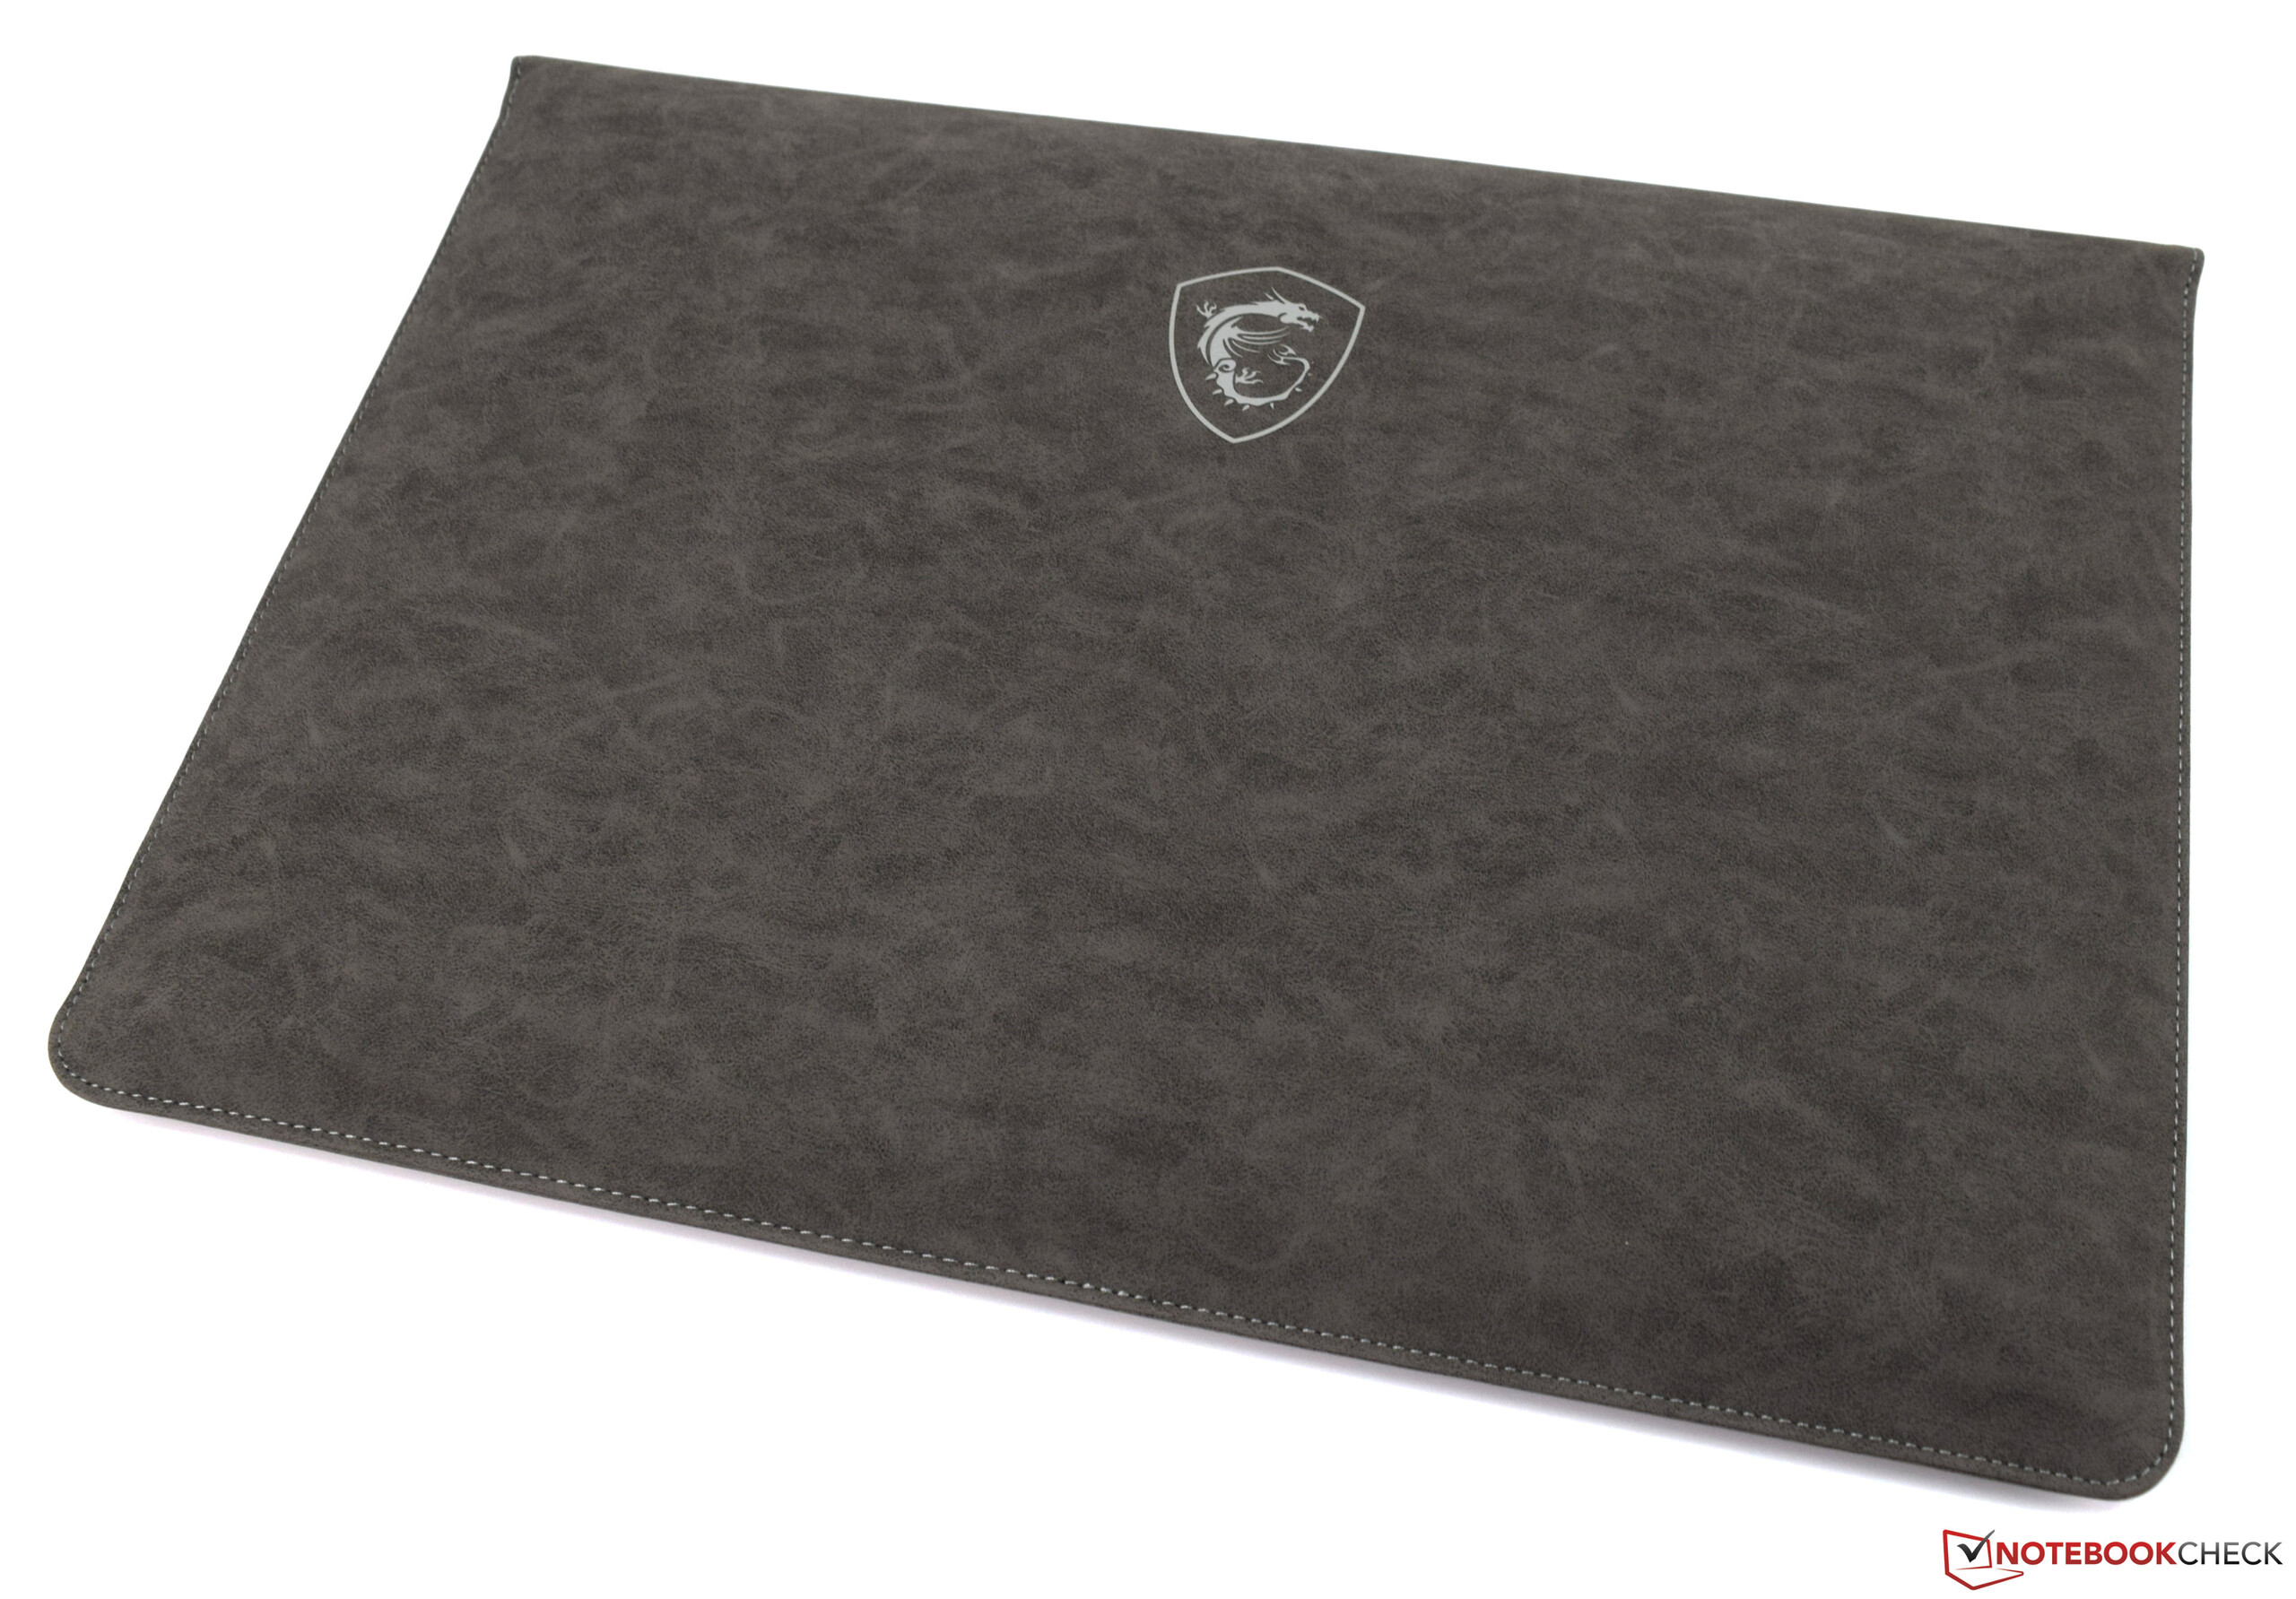
Som namnet antyder är MSI:s P65 8RF Creator baserad på GS65 8RF. Men den riktar sig i huvudsak åt kreativa användare som vill köra mjukvara som Adobe Photoshop eller Adobe Premiere på resande fot. Denna begränsade utgåva erbjuder mer än bara ett vitt hölje; den har även en kraftfull GPU och högkvalitativ förpackning, inklusive ett skyddsfodral. Dessutom går det att få en gratis förlängning på garantin till totalt 36 månader genom att registrera produkten hos MSI.
Frågan är: För vem är denna enhet gjord? Om du letar efter en tjusig och unik enhet kan P65 8RF vara rätt laptop för dig. Den ser snyggt ut under presentationer och behöver ändå inte offra spelprestandan samtidigt som avsaknaden av gaming-bling gör att den upplevs som väldigt seriös. Det är här P65 8RF verkligen skiner.
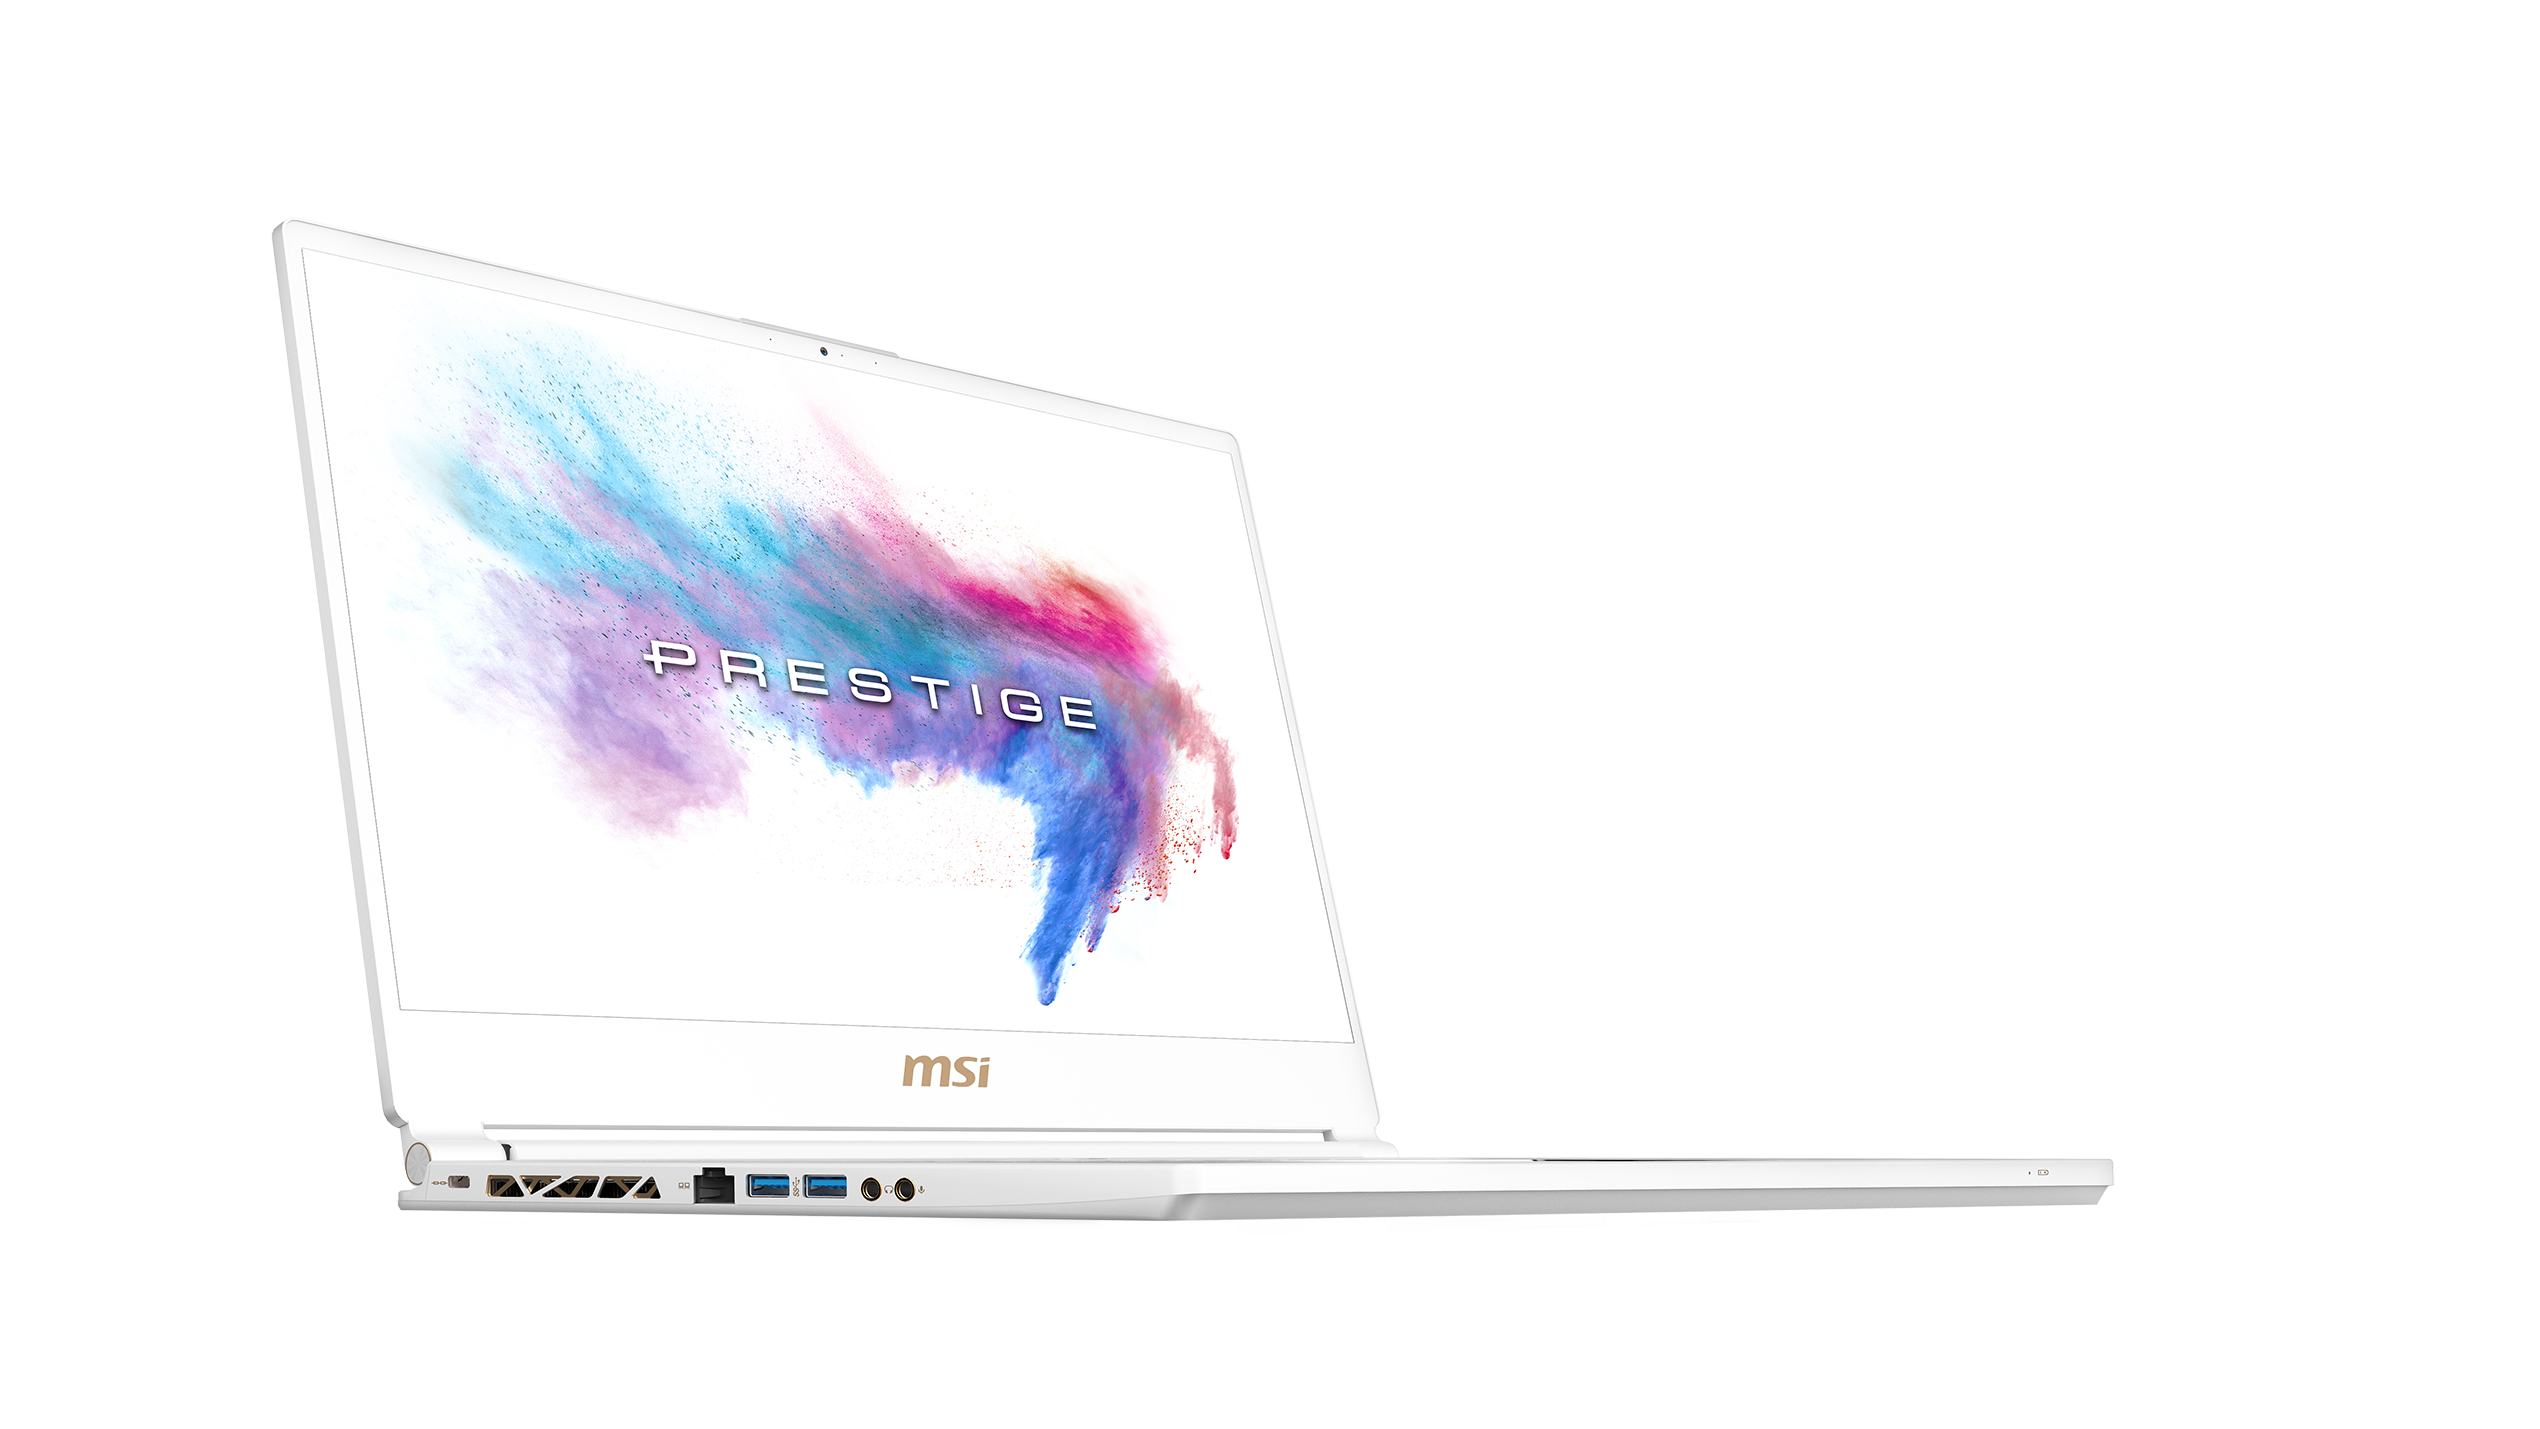
MSI P65 8RF är som att både äta upp kakan och ha kvar den. Under dagen spelar den sin roll som tjusig företagskollega. På natten kan den till och med användas för att köra de senaste spelen i smidig 1080p med maximala detaljer.
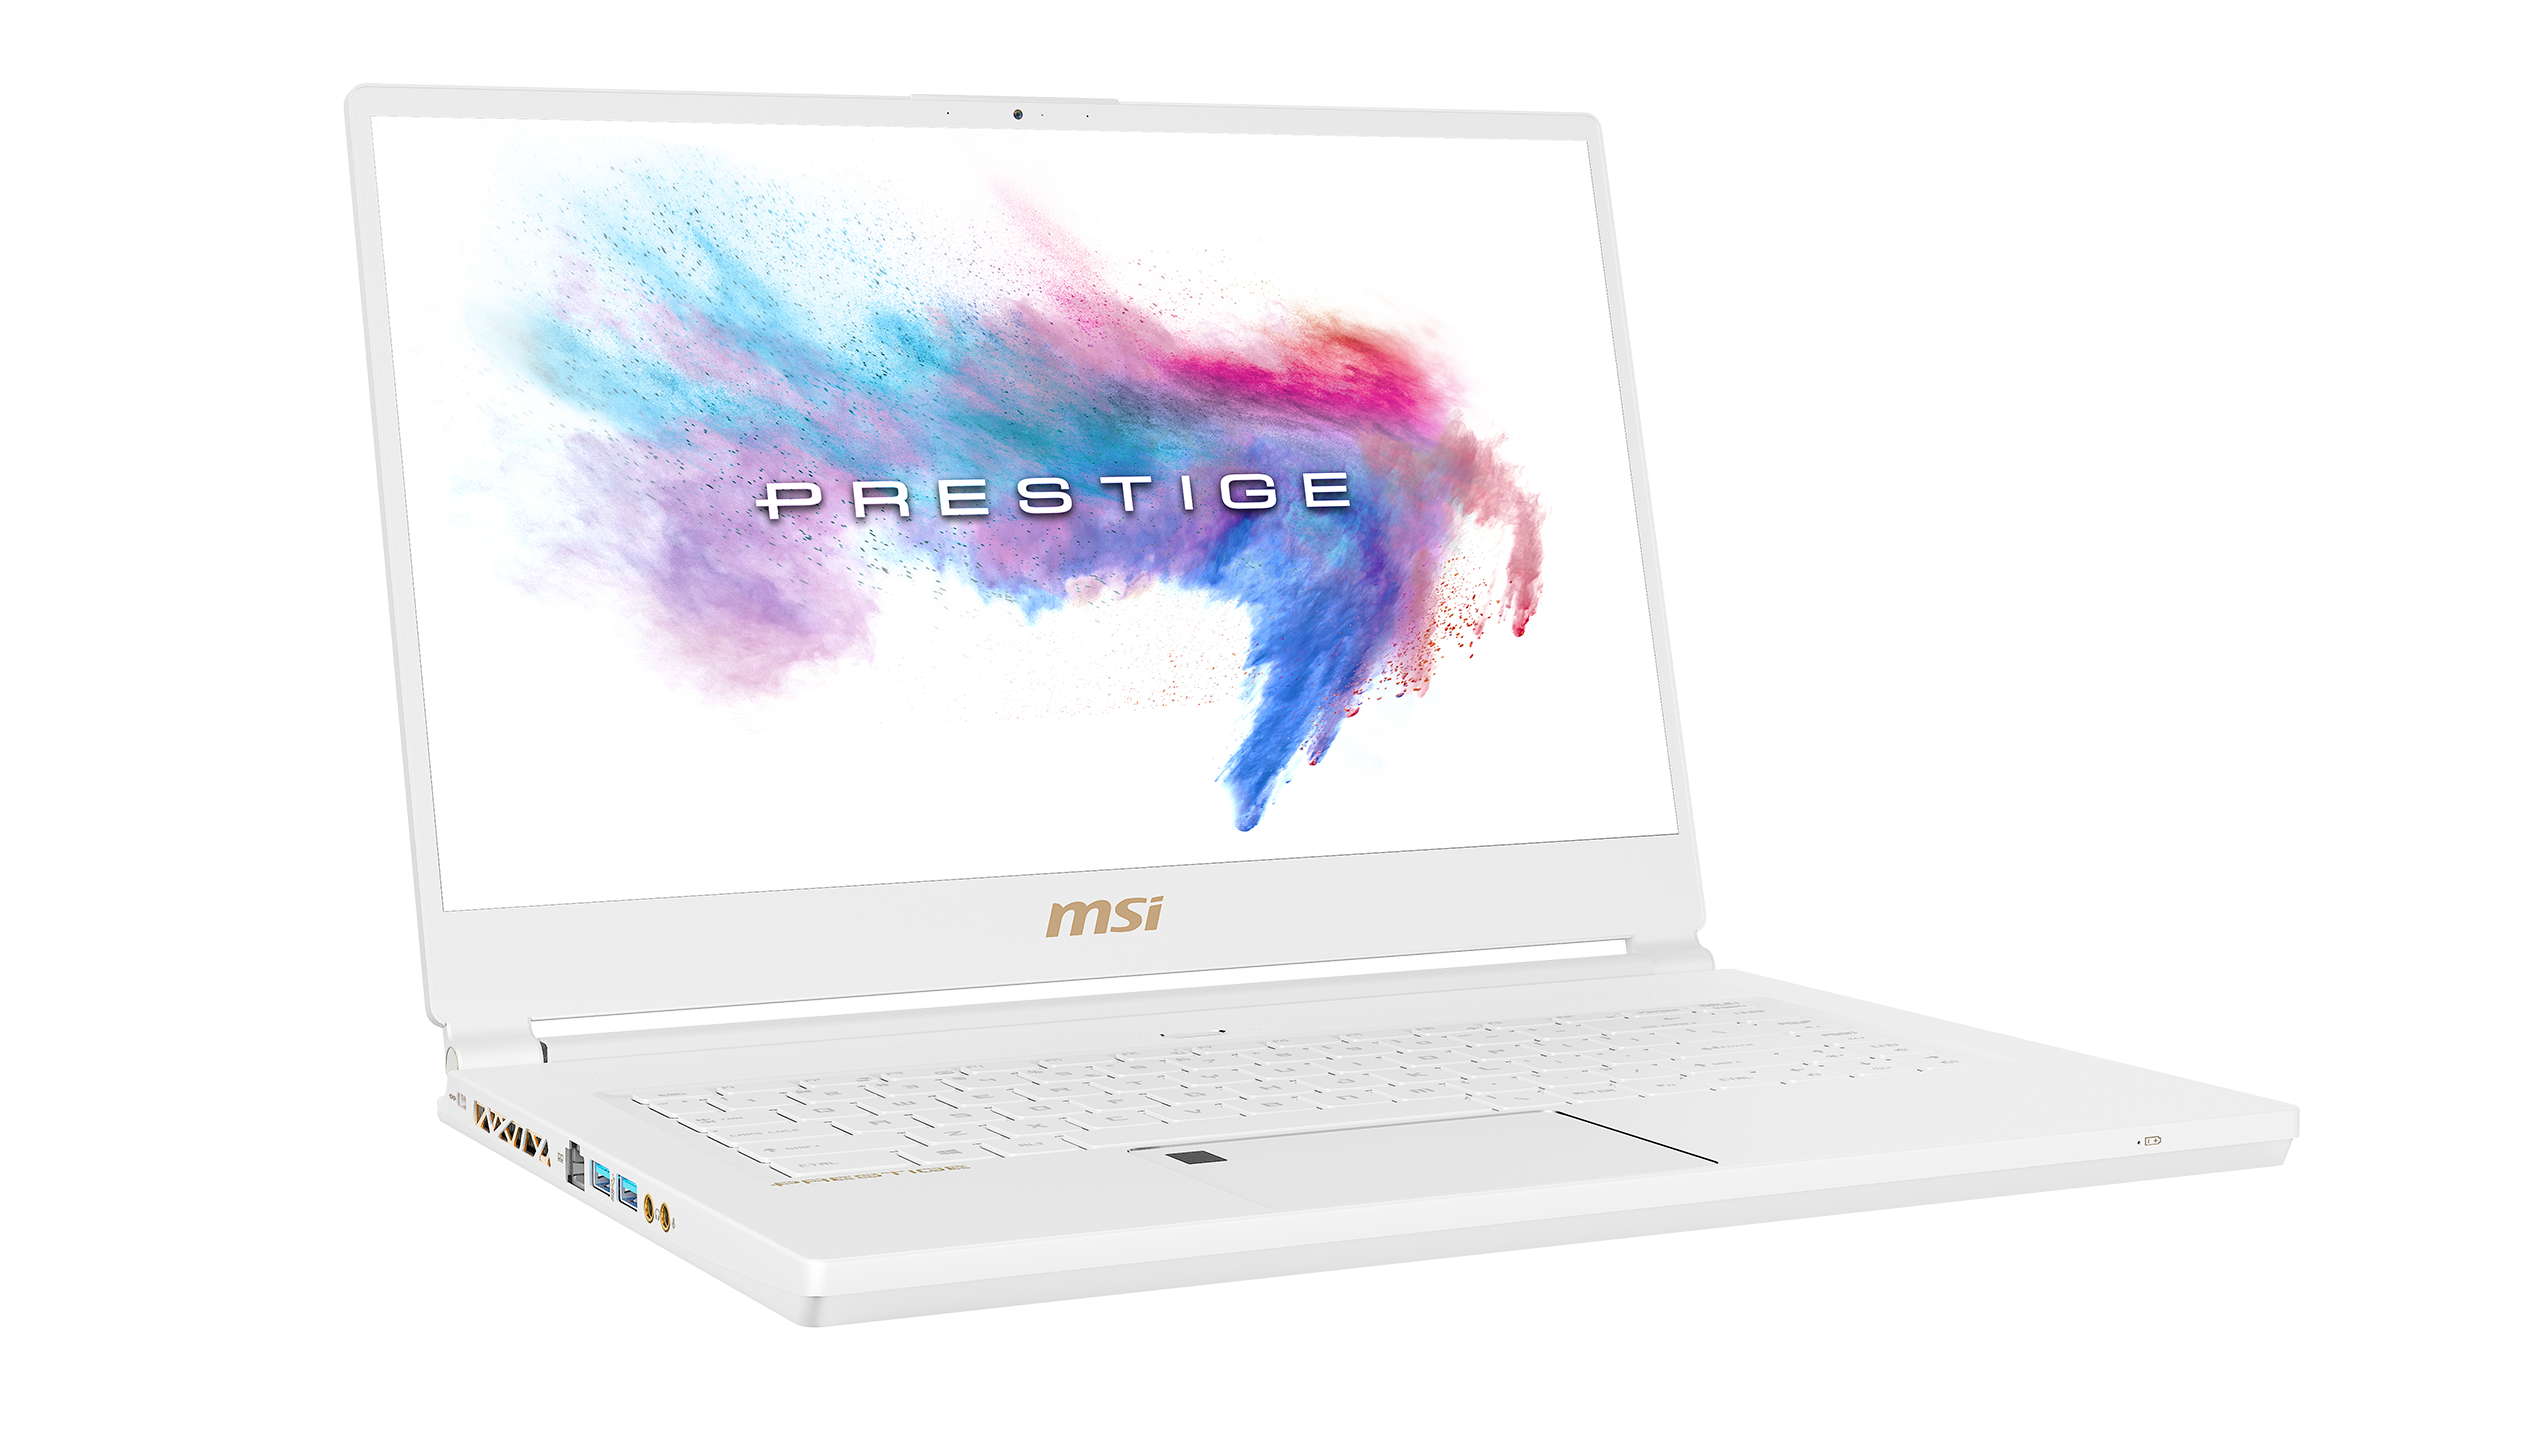
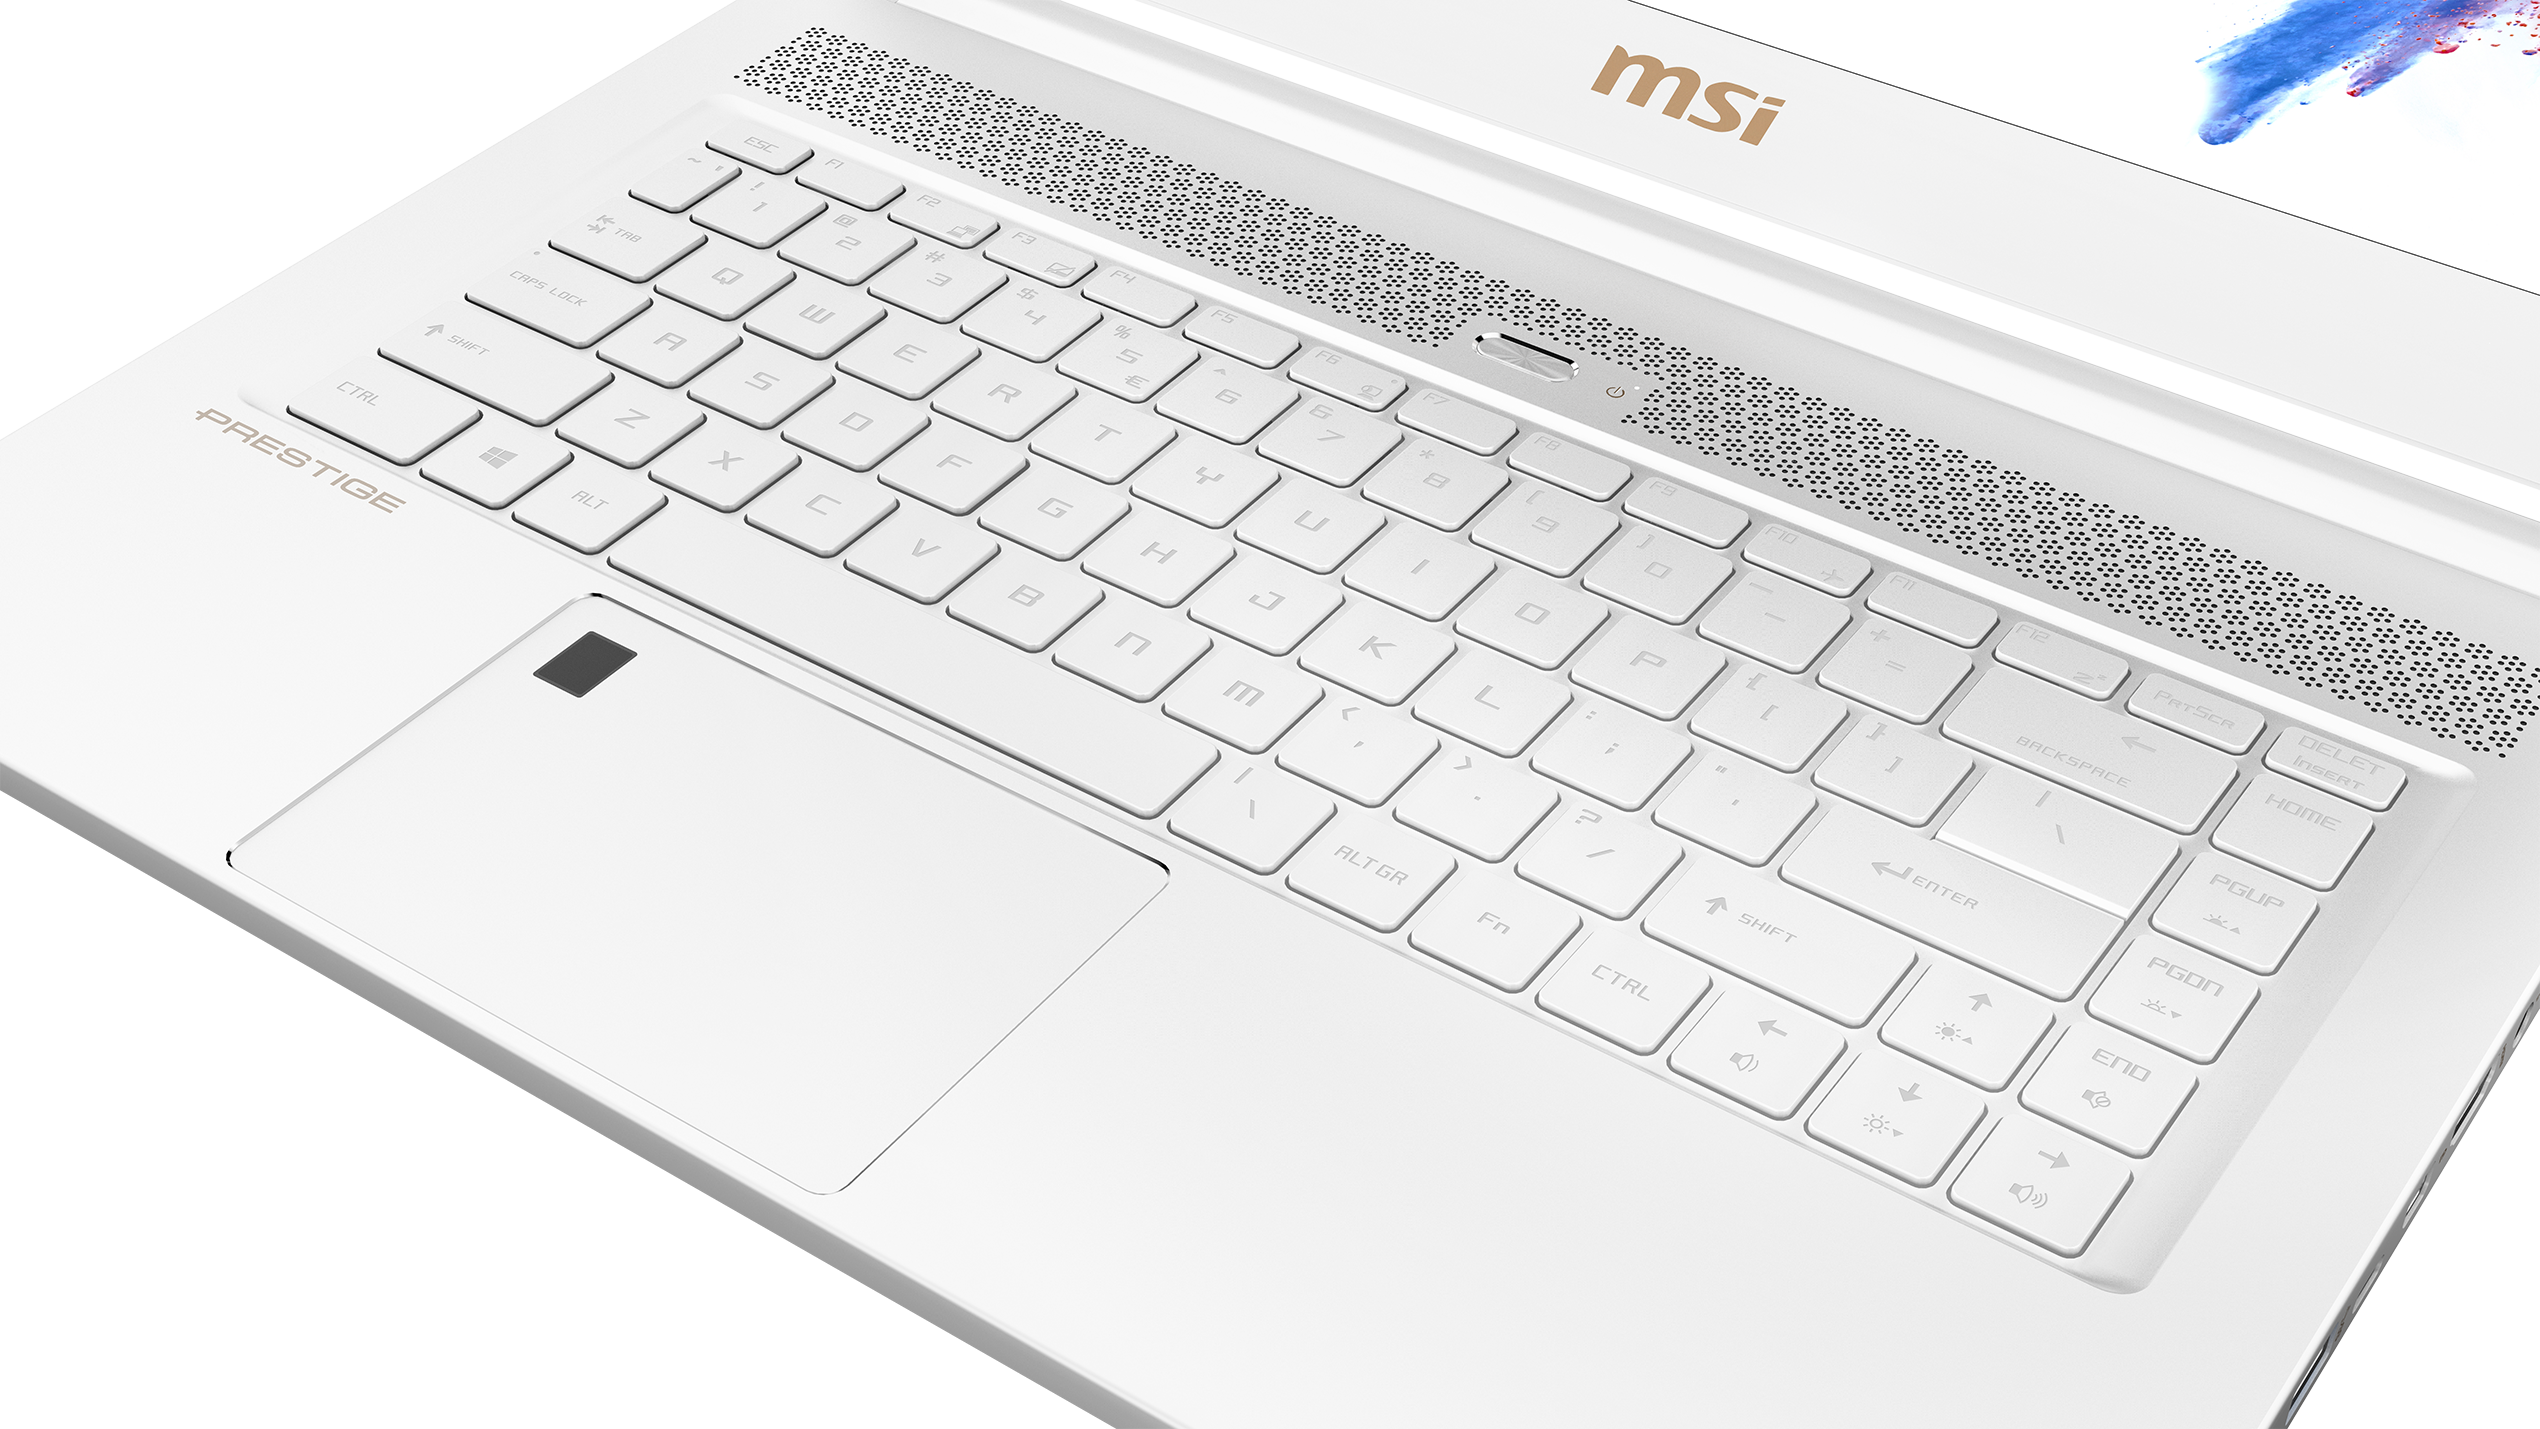
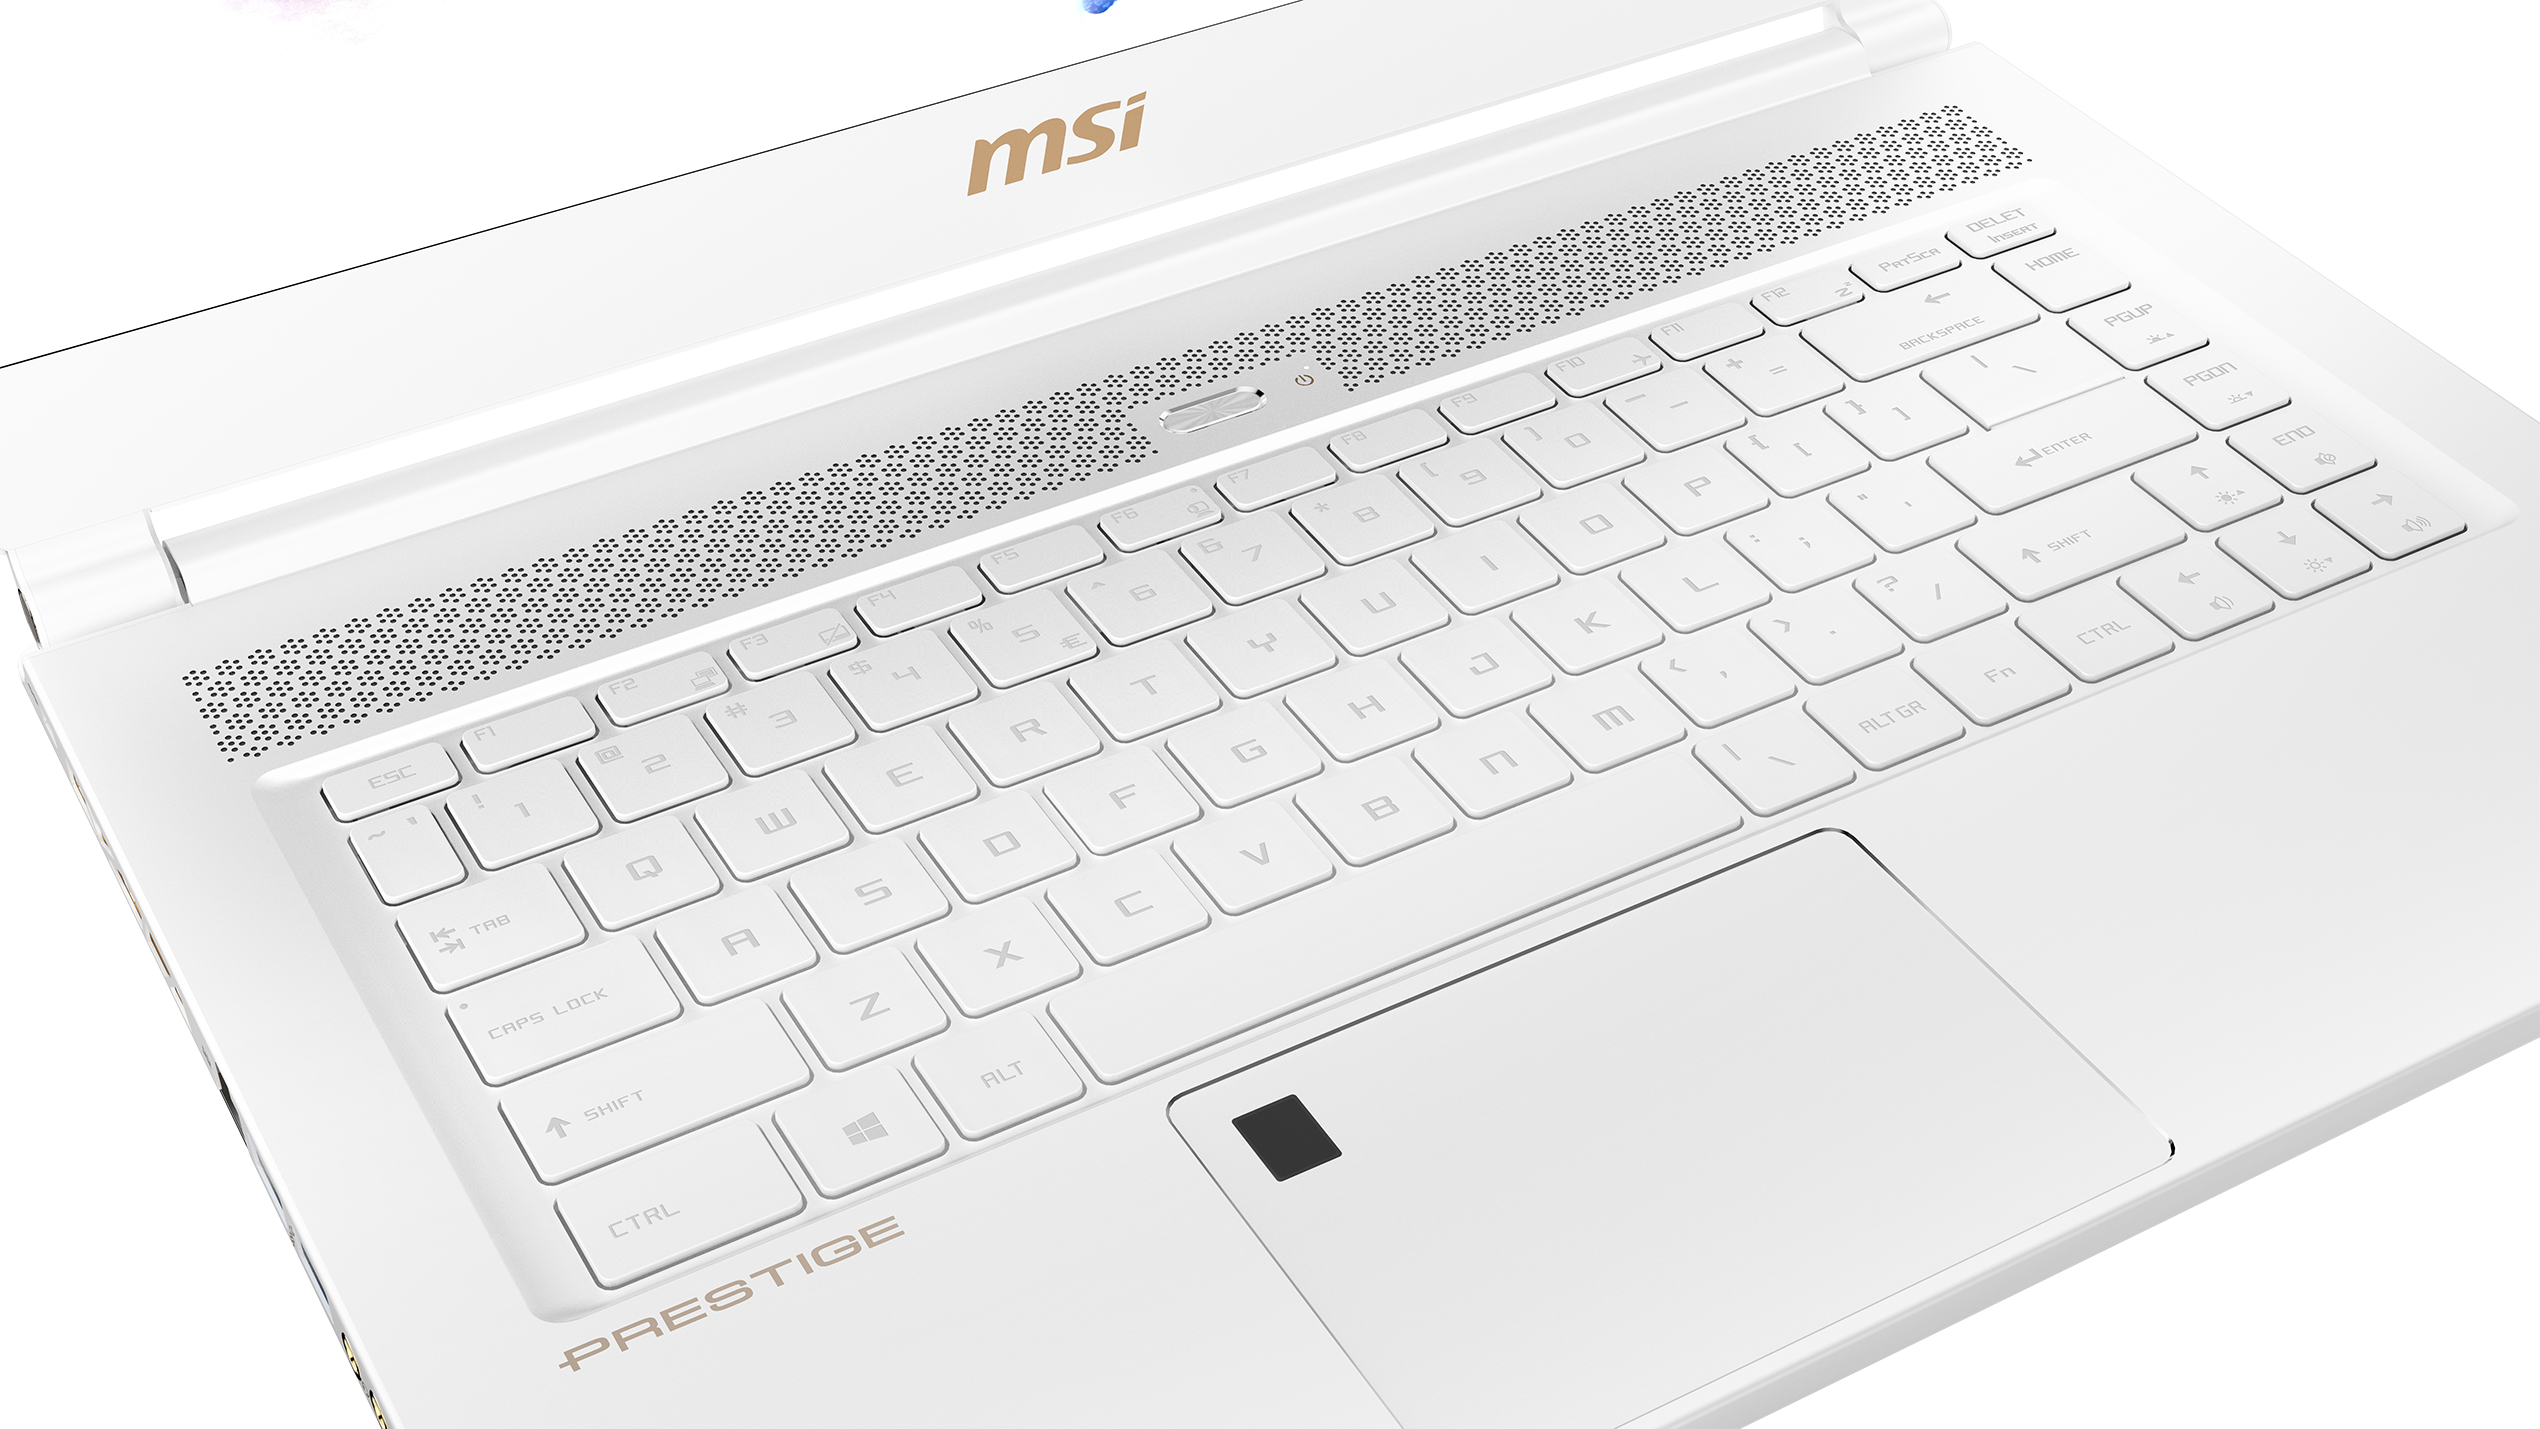
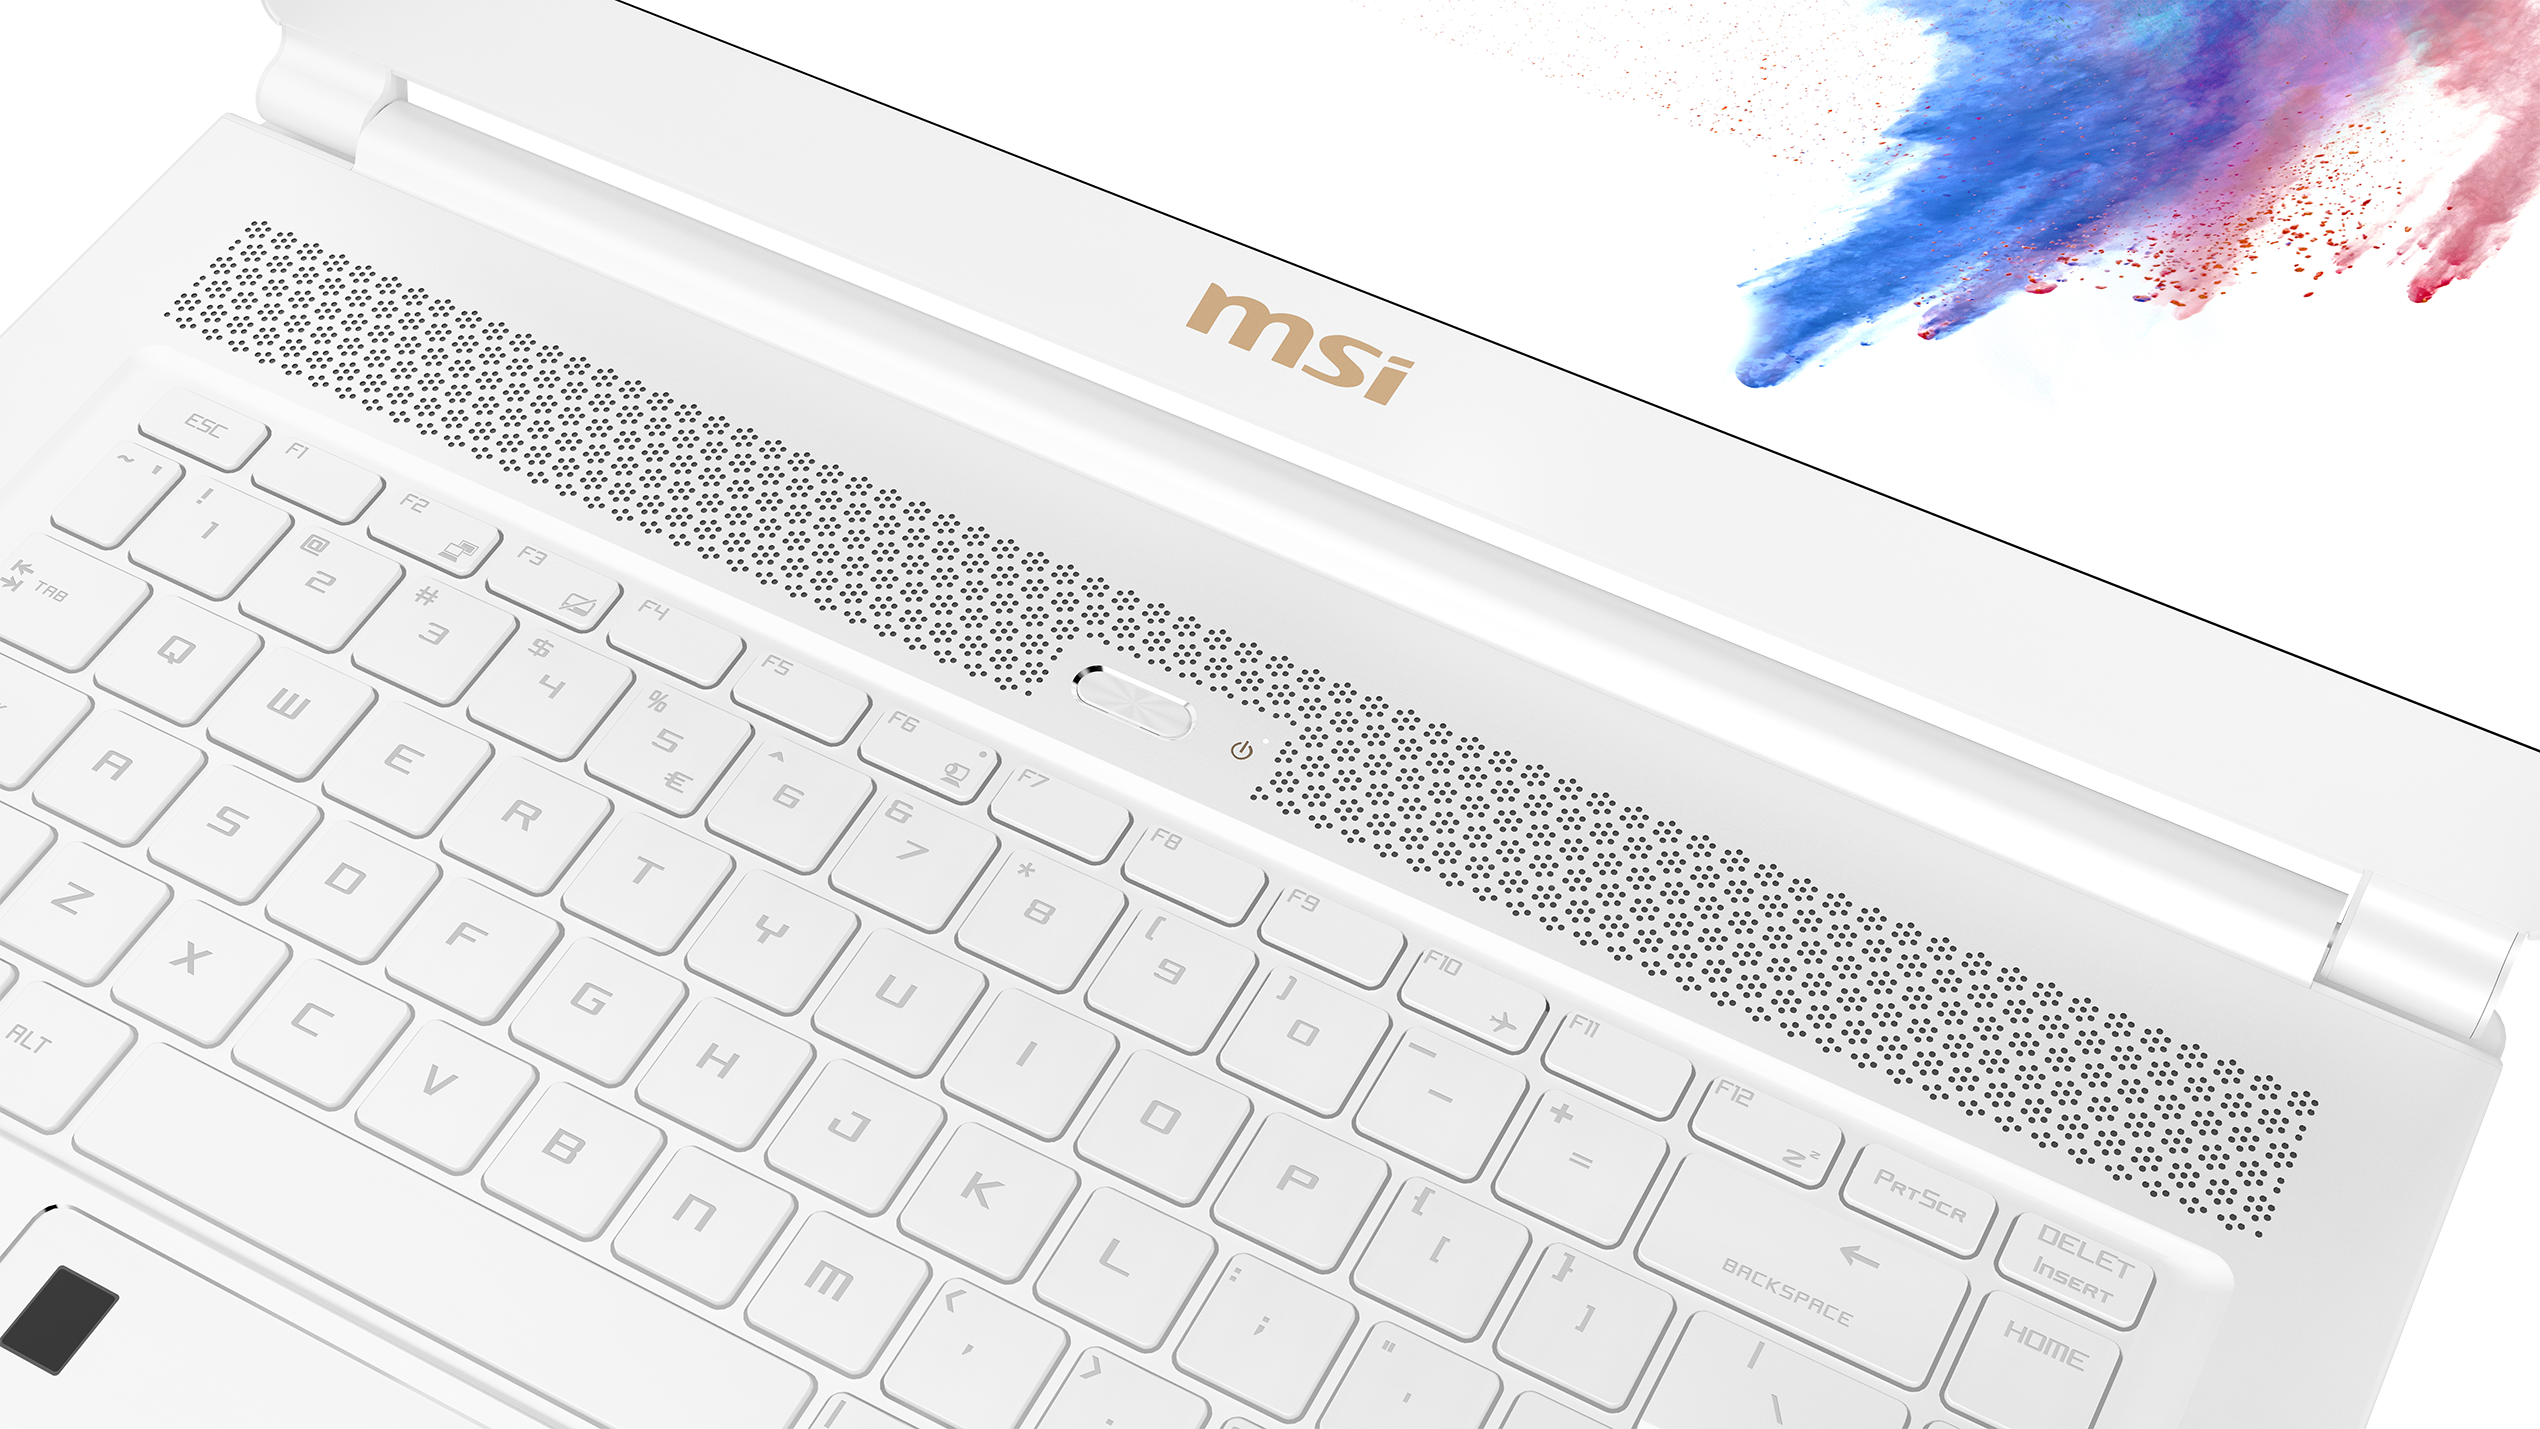
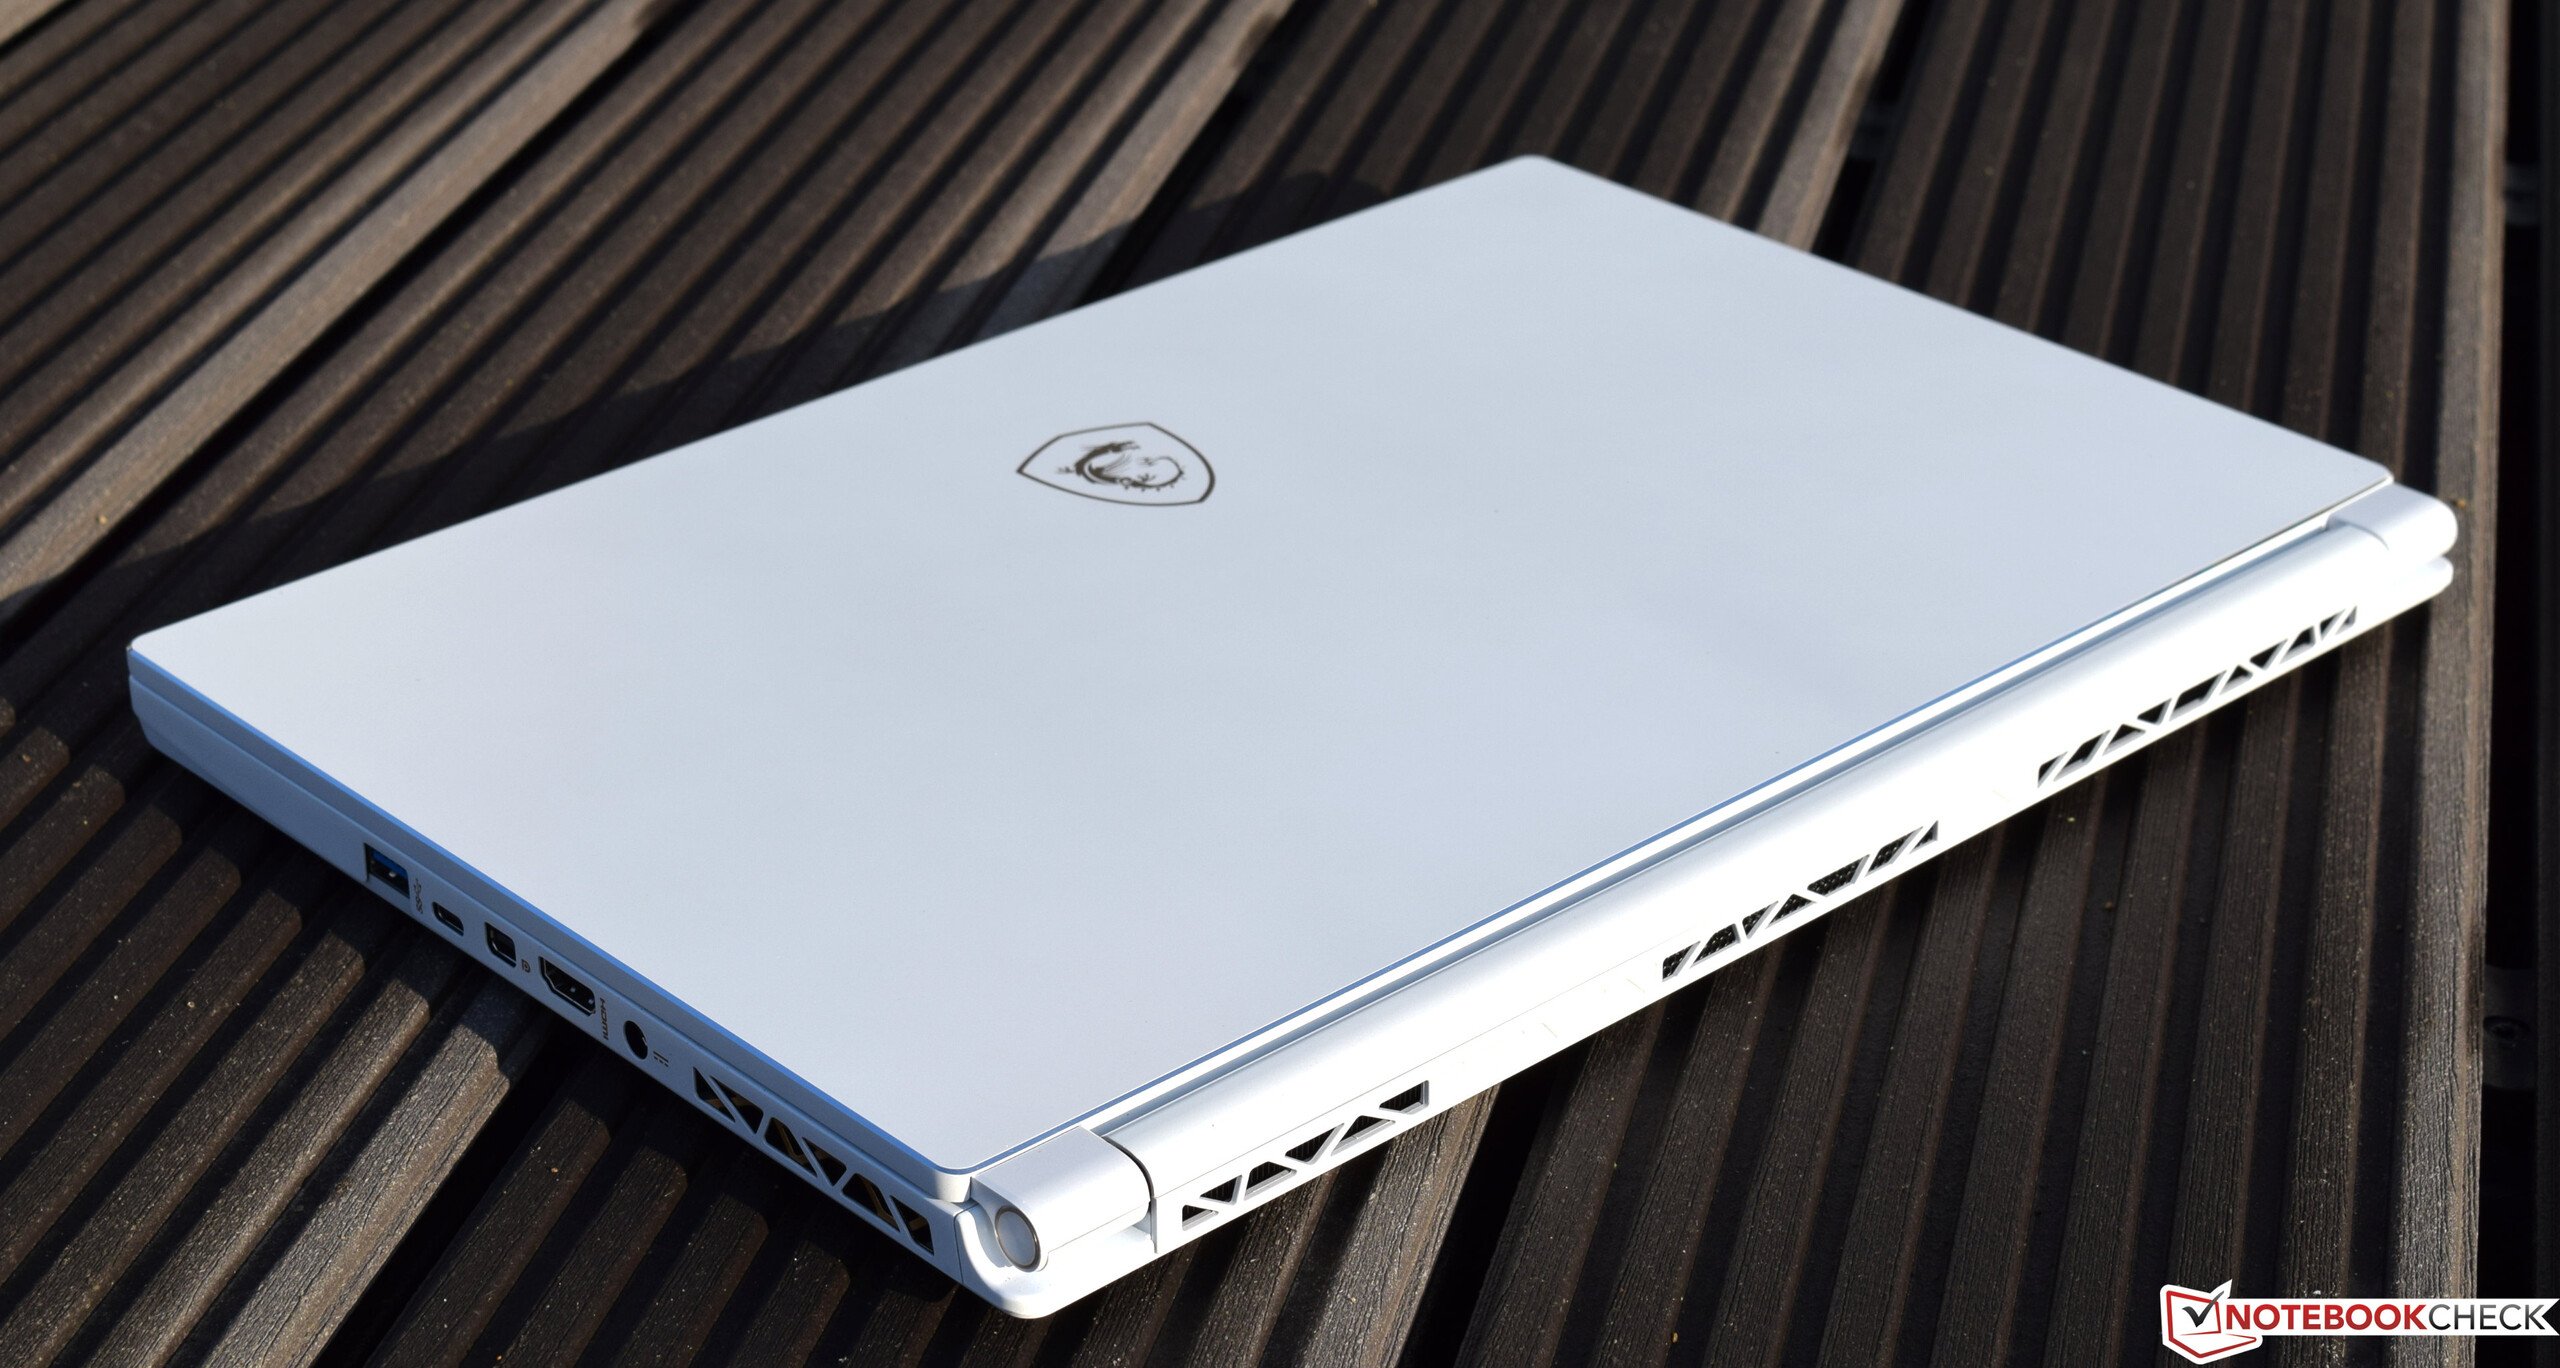
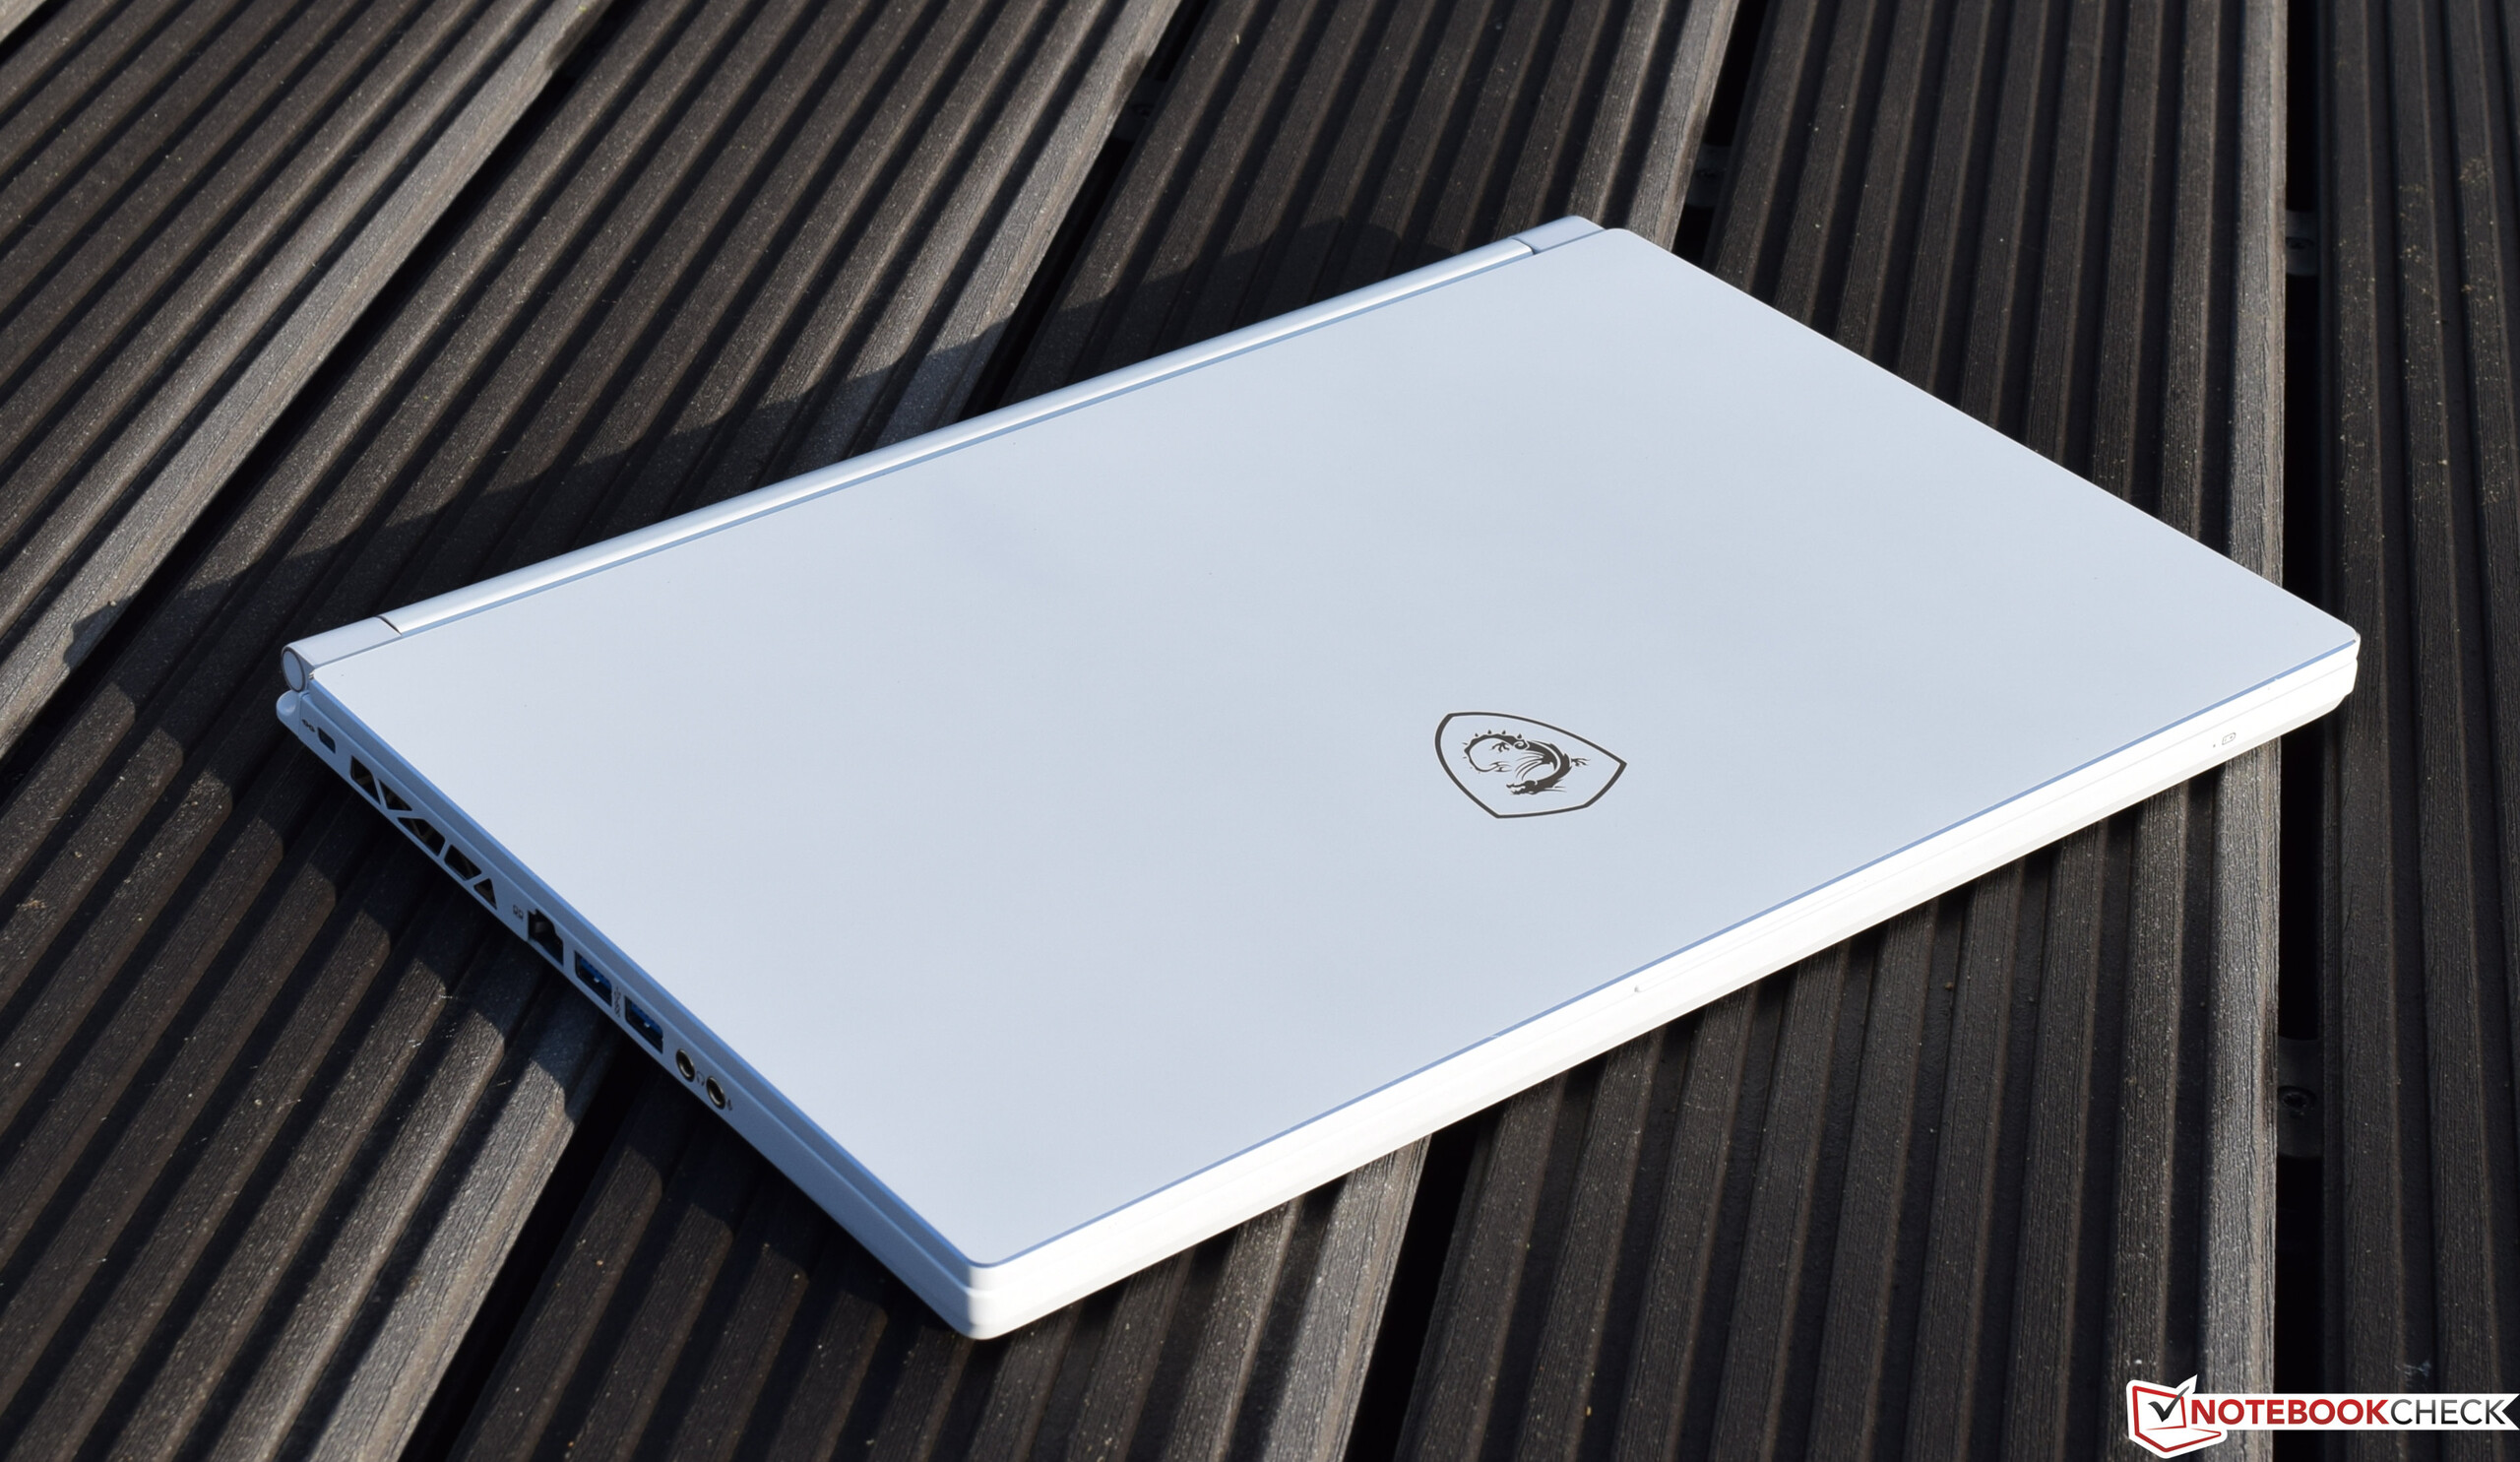
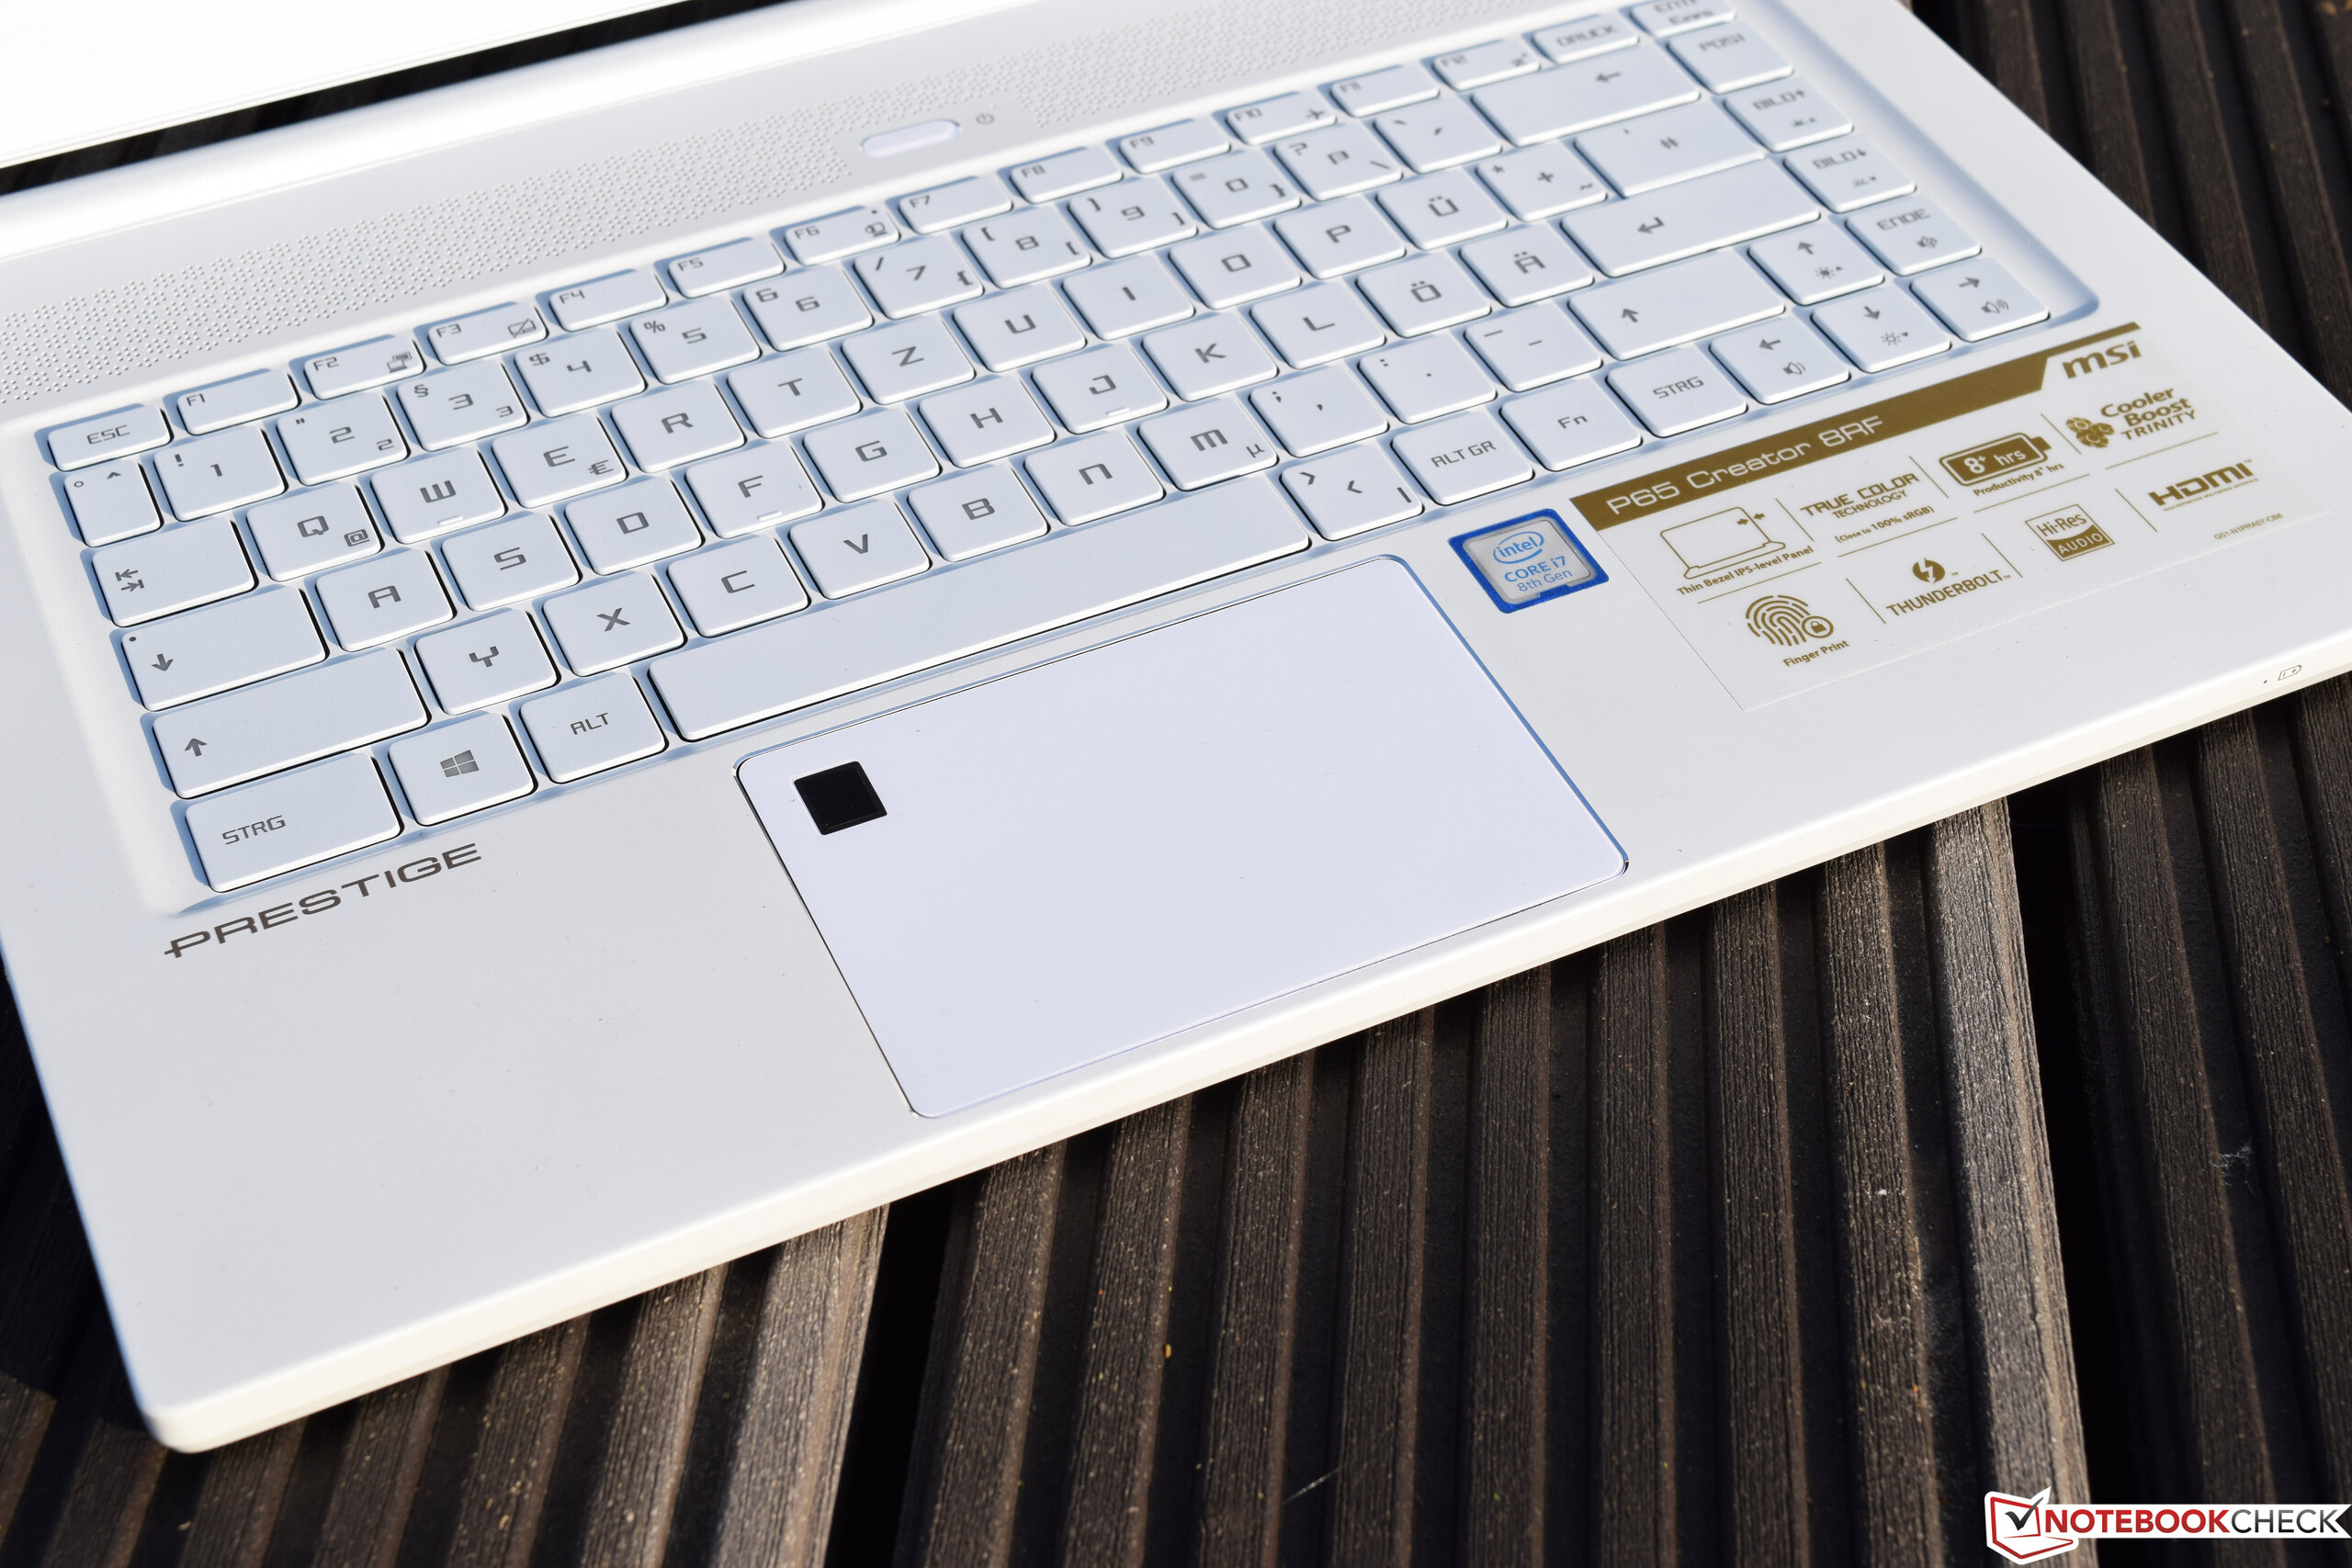
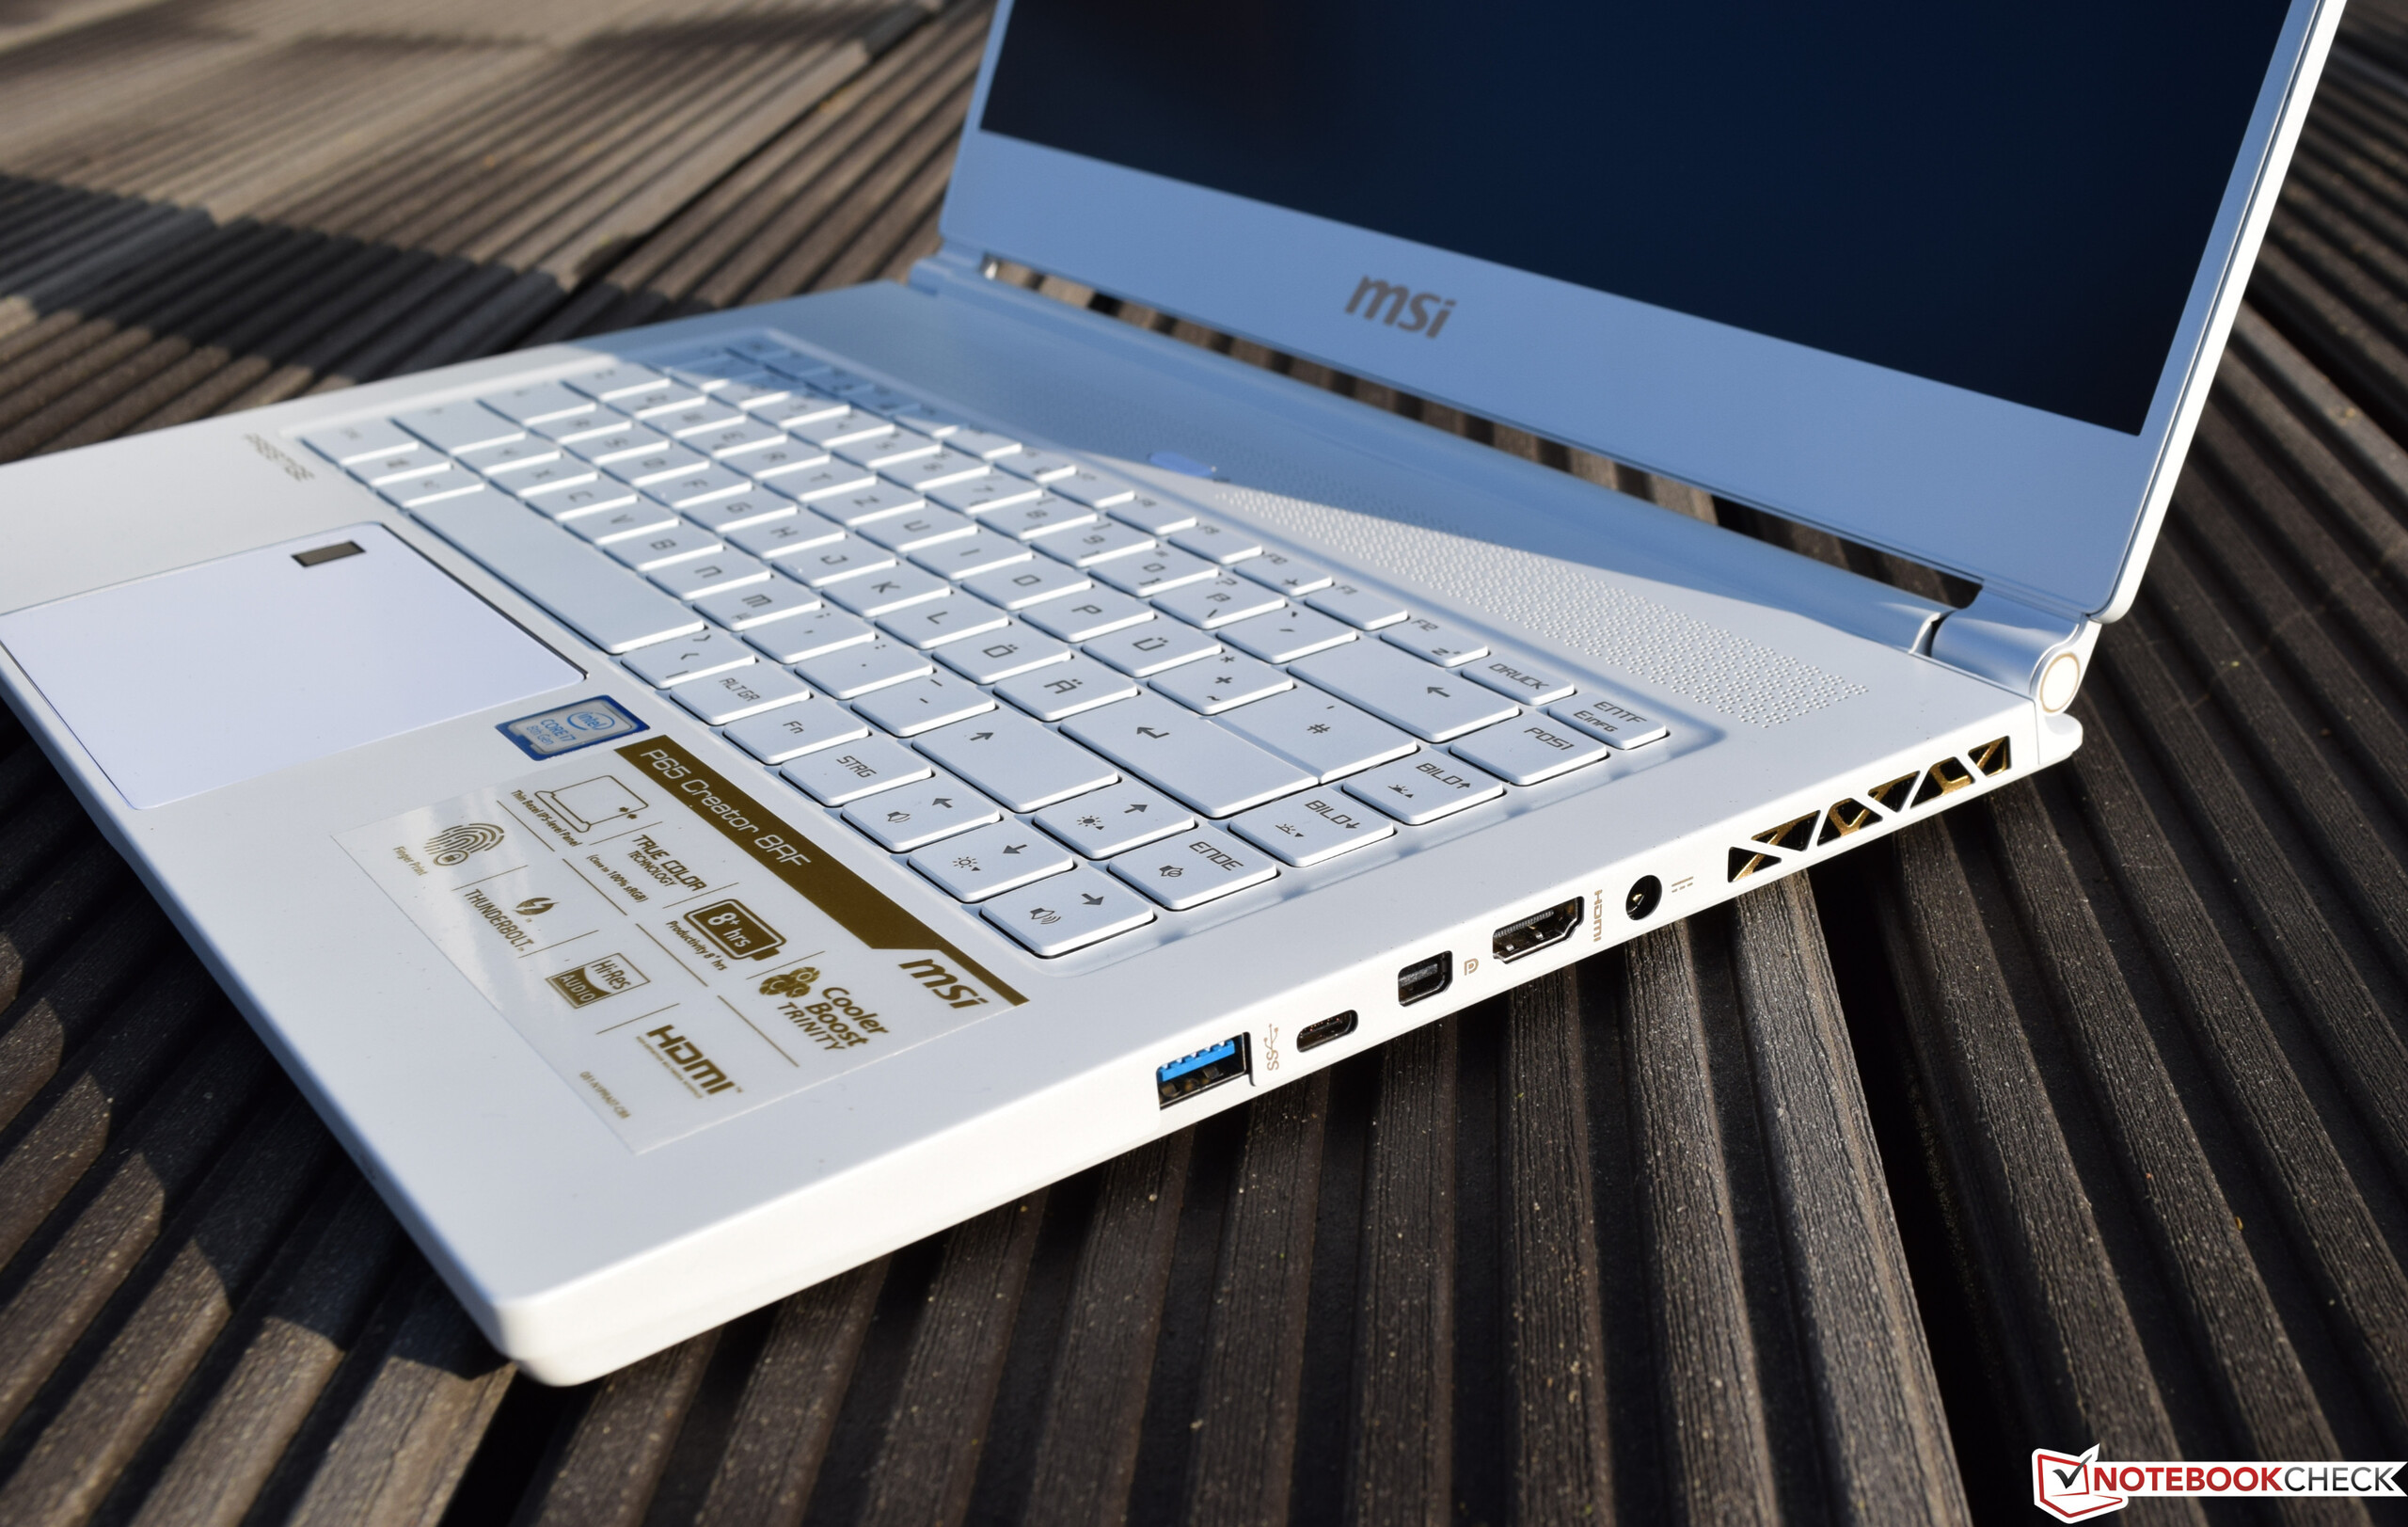
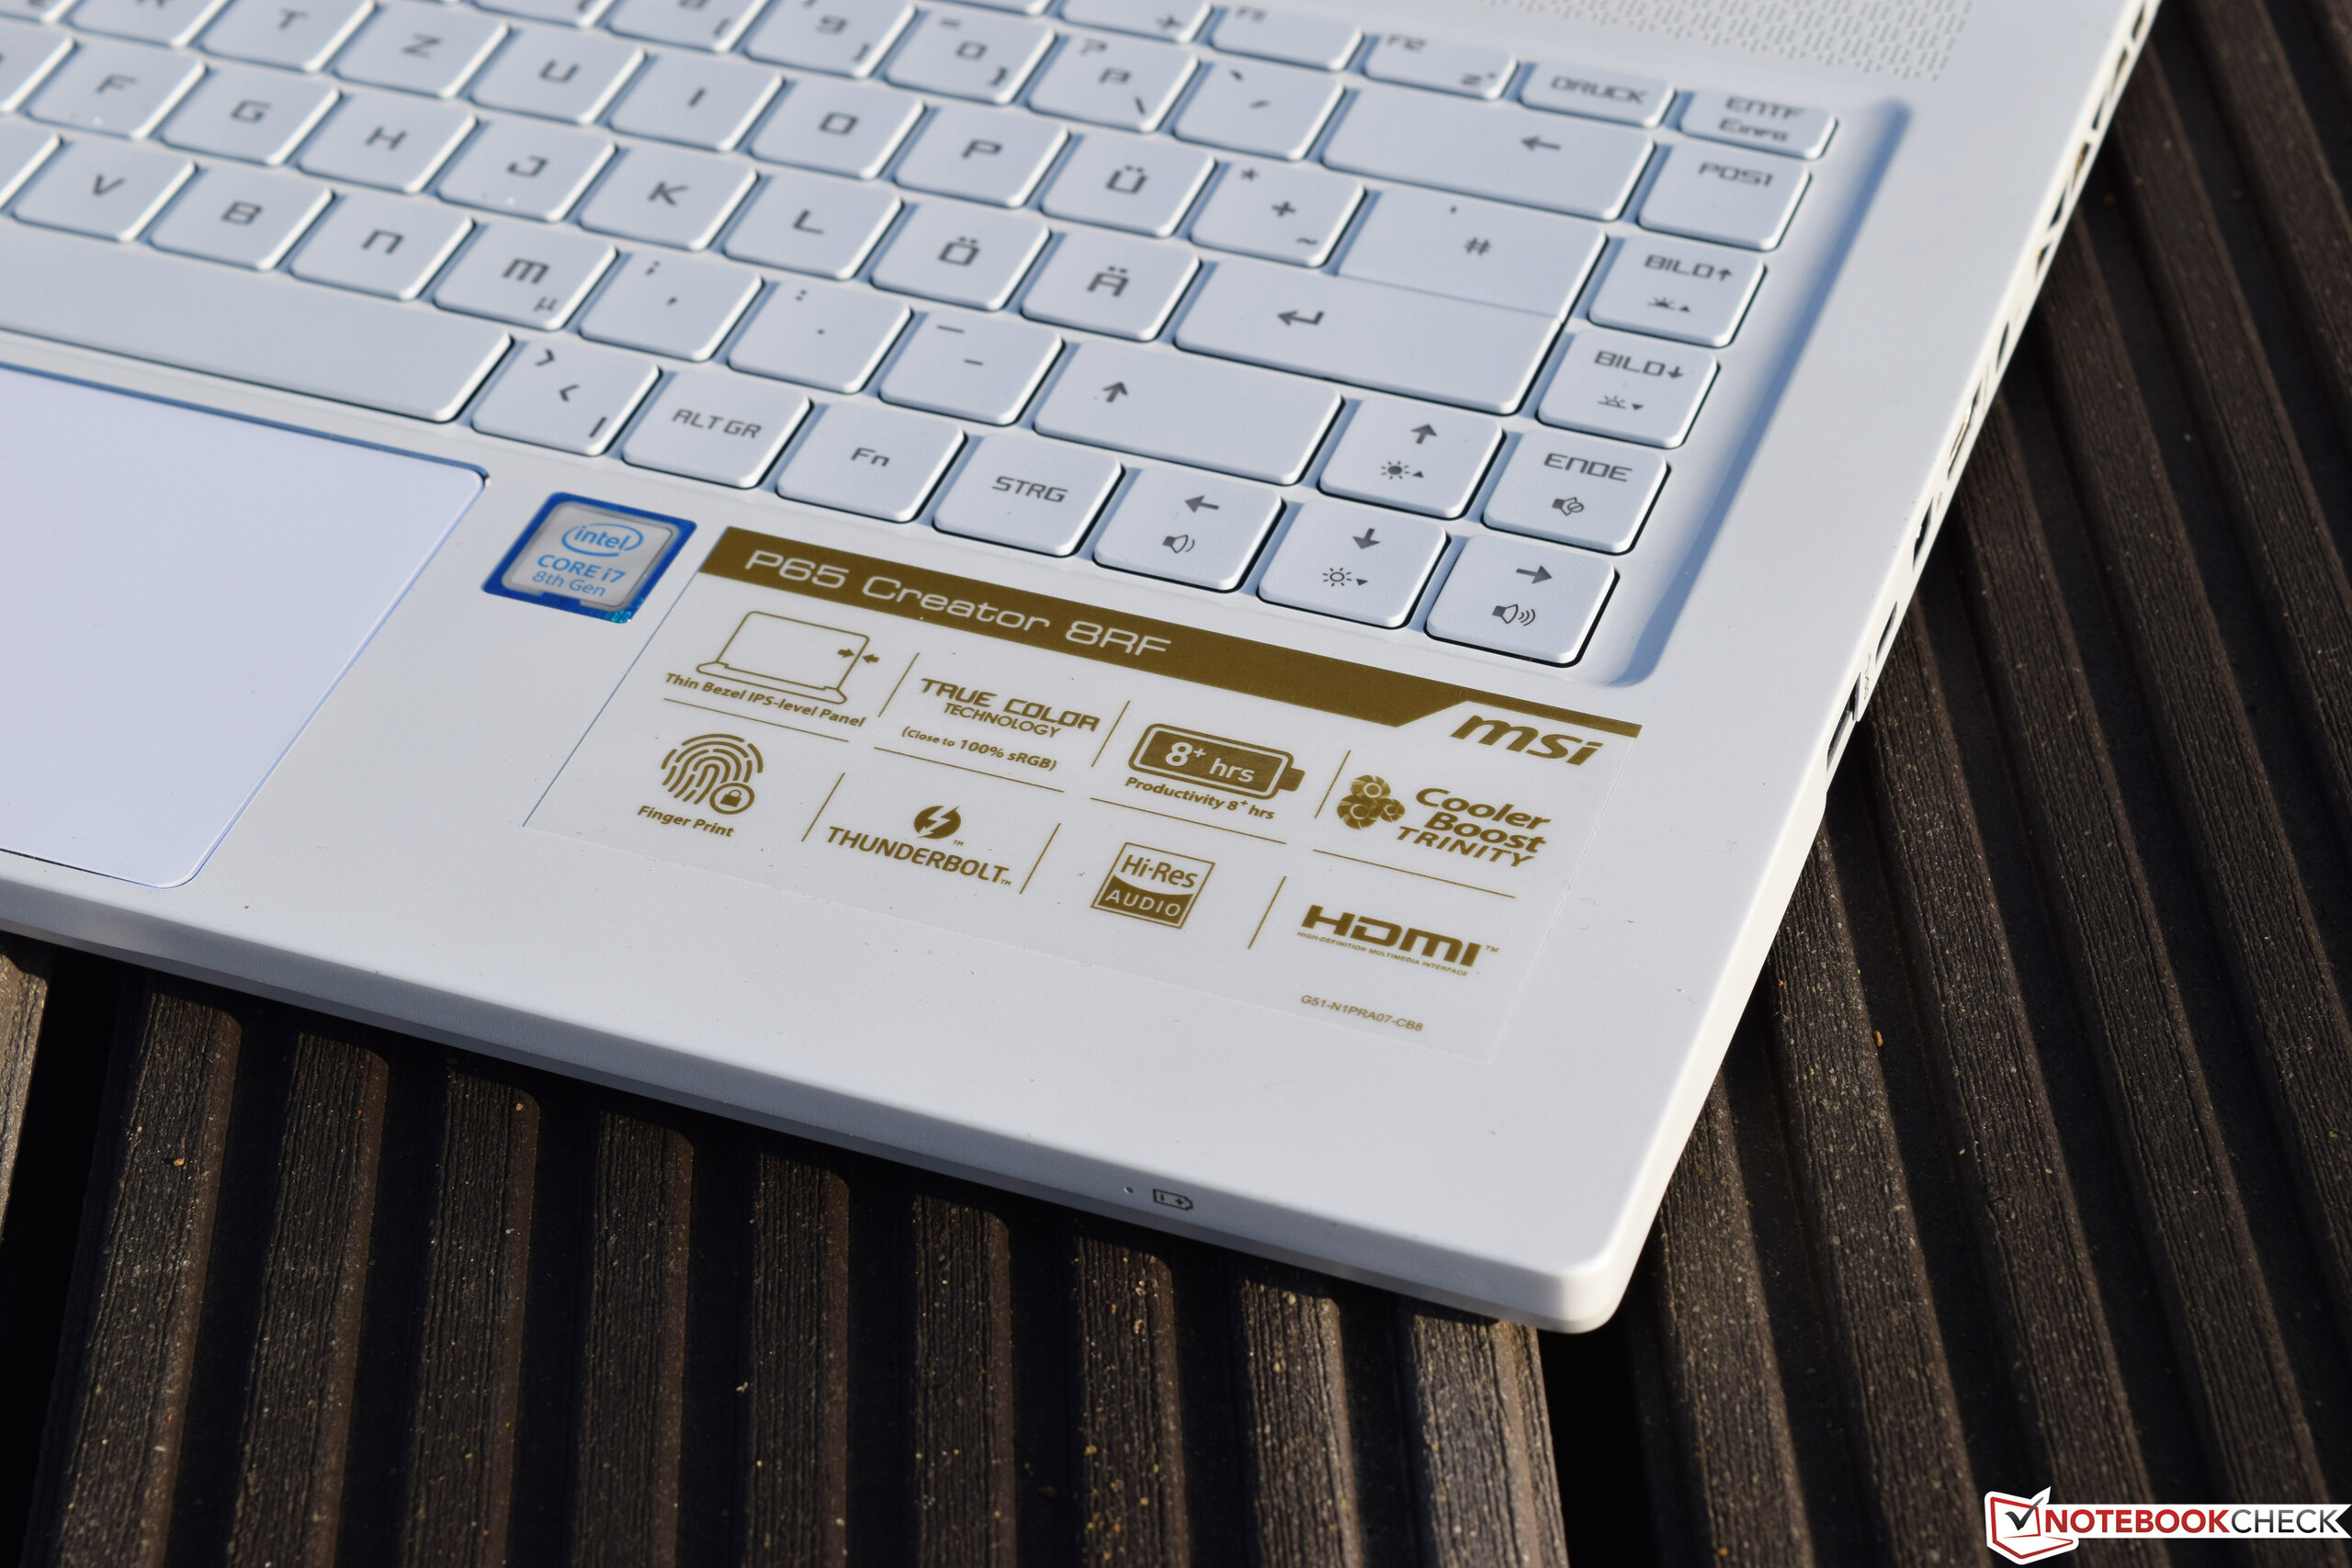
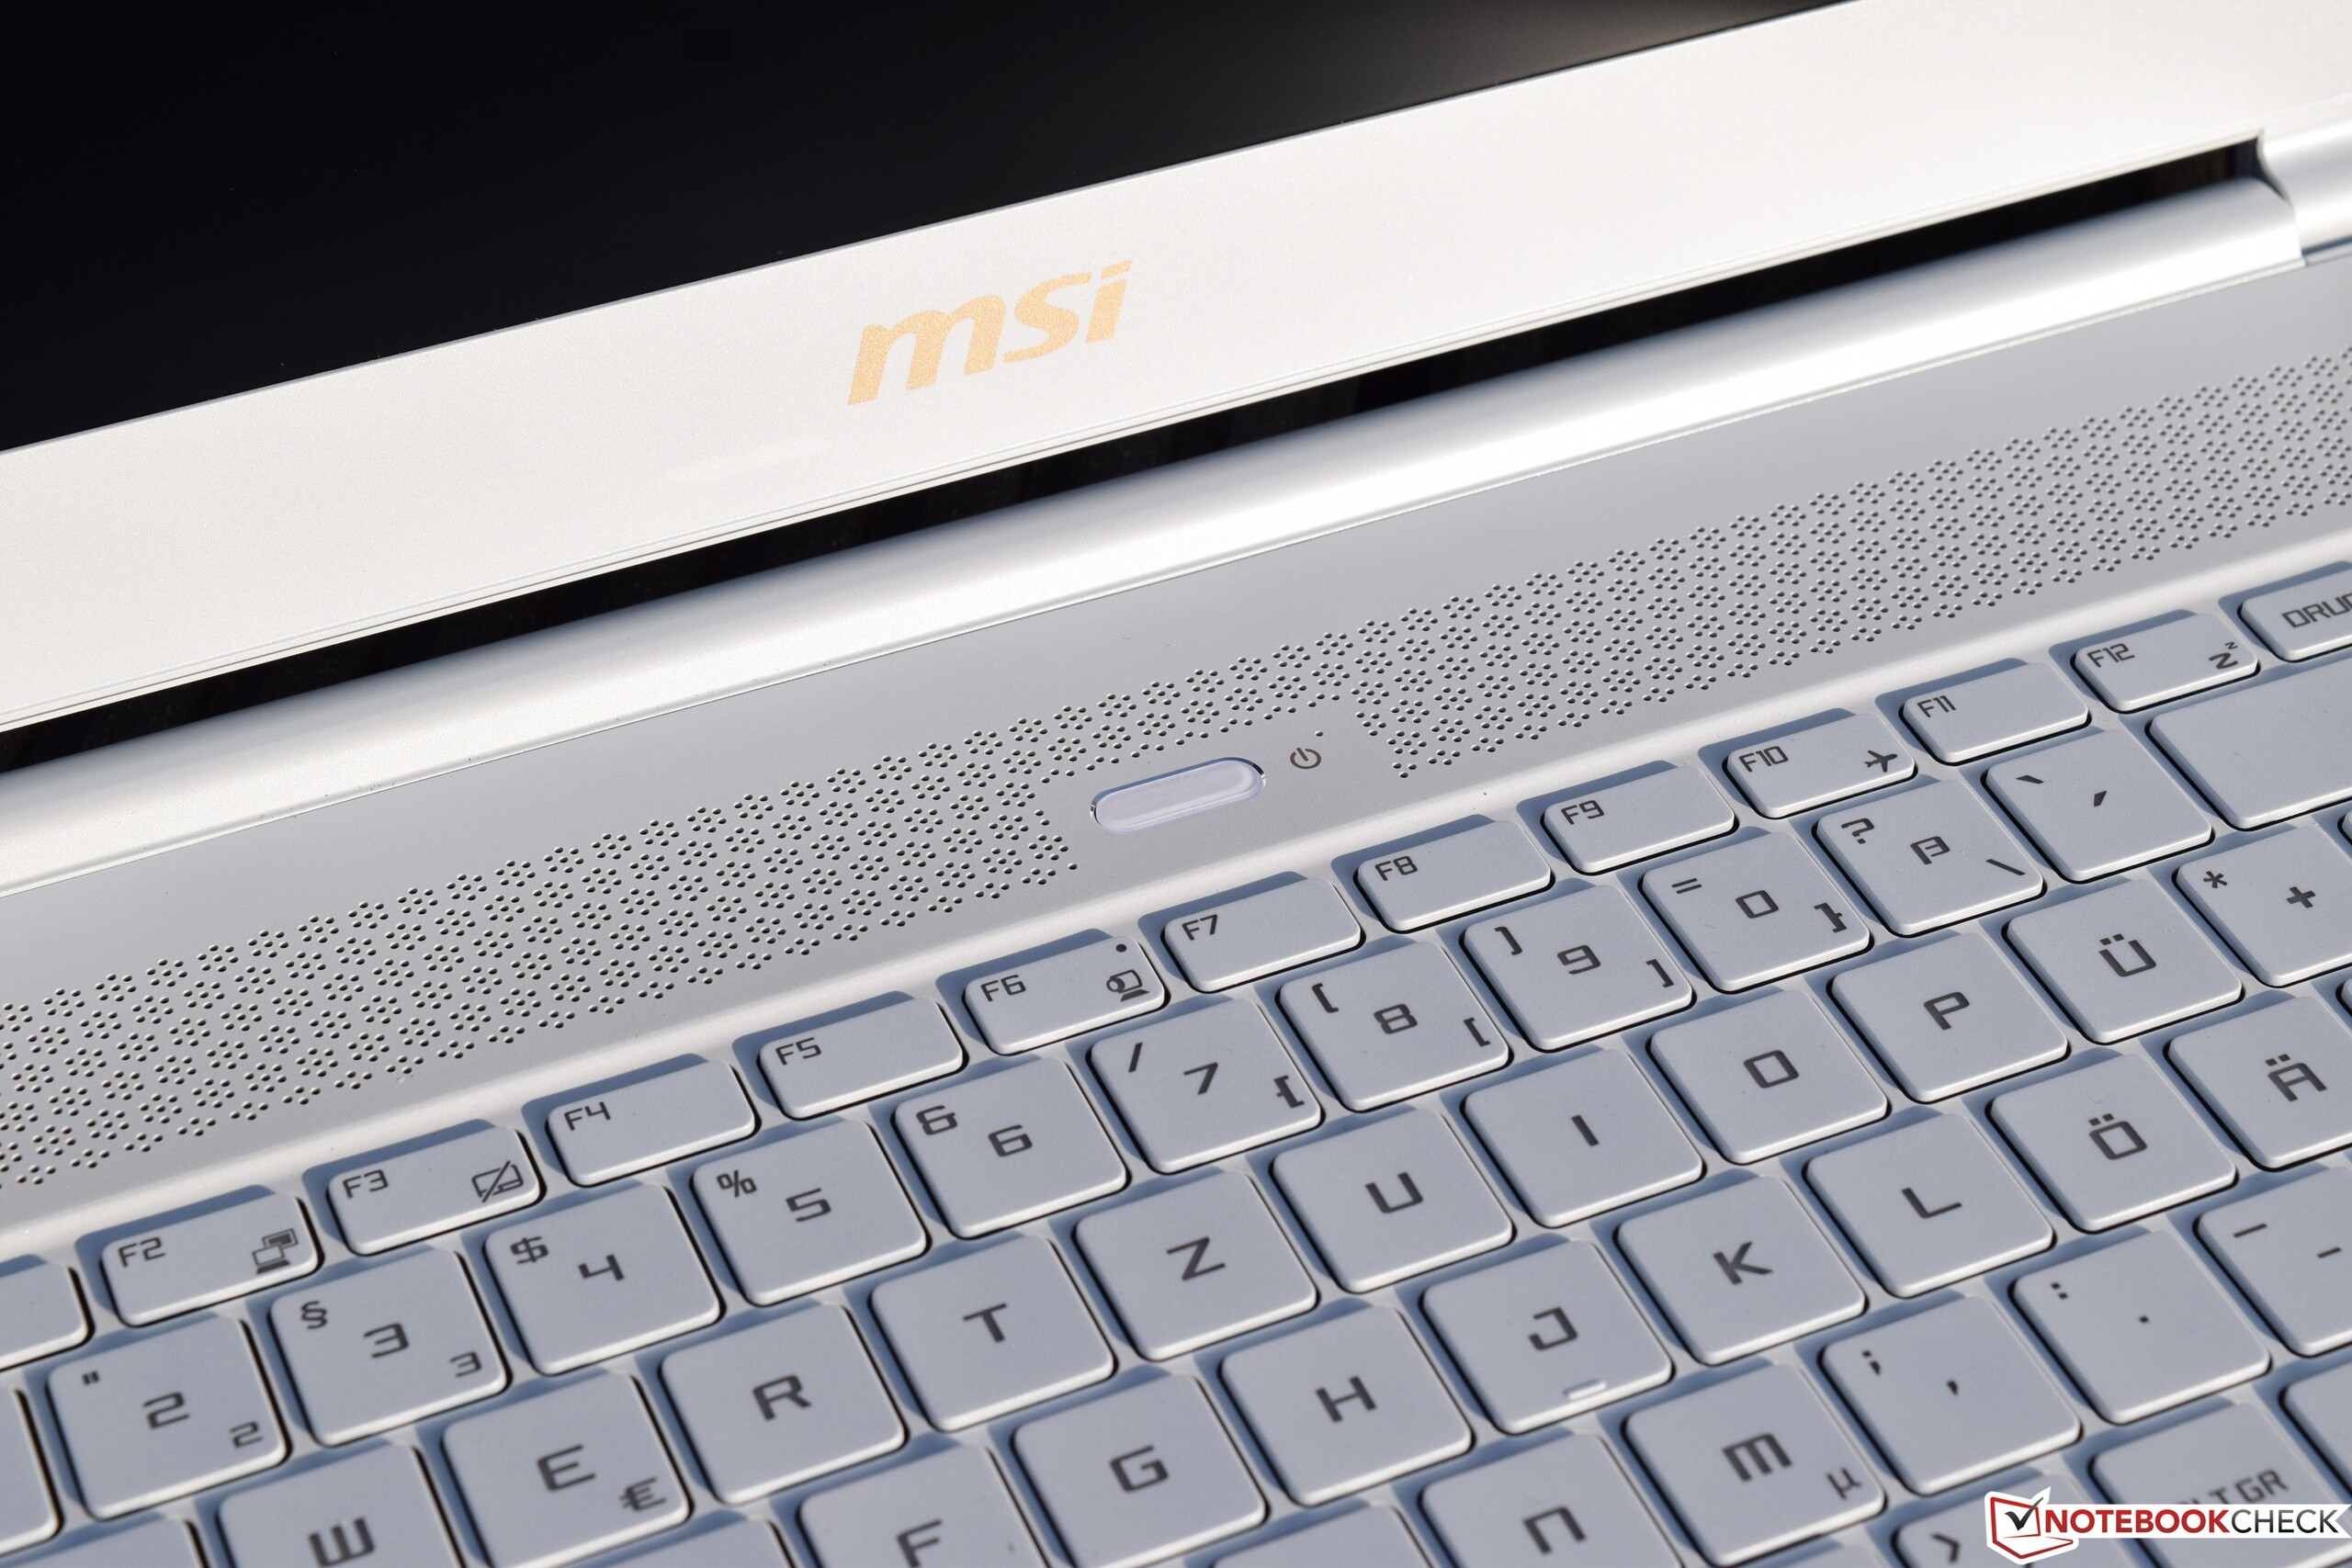
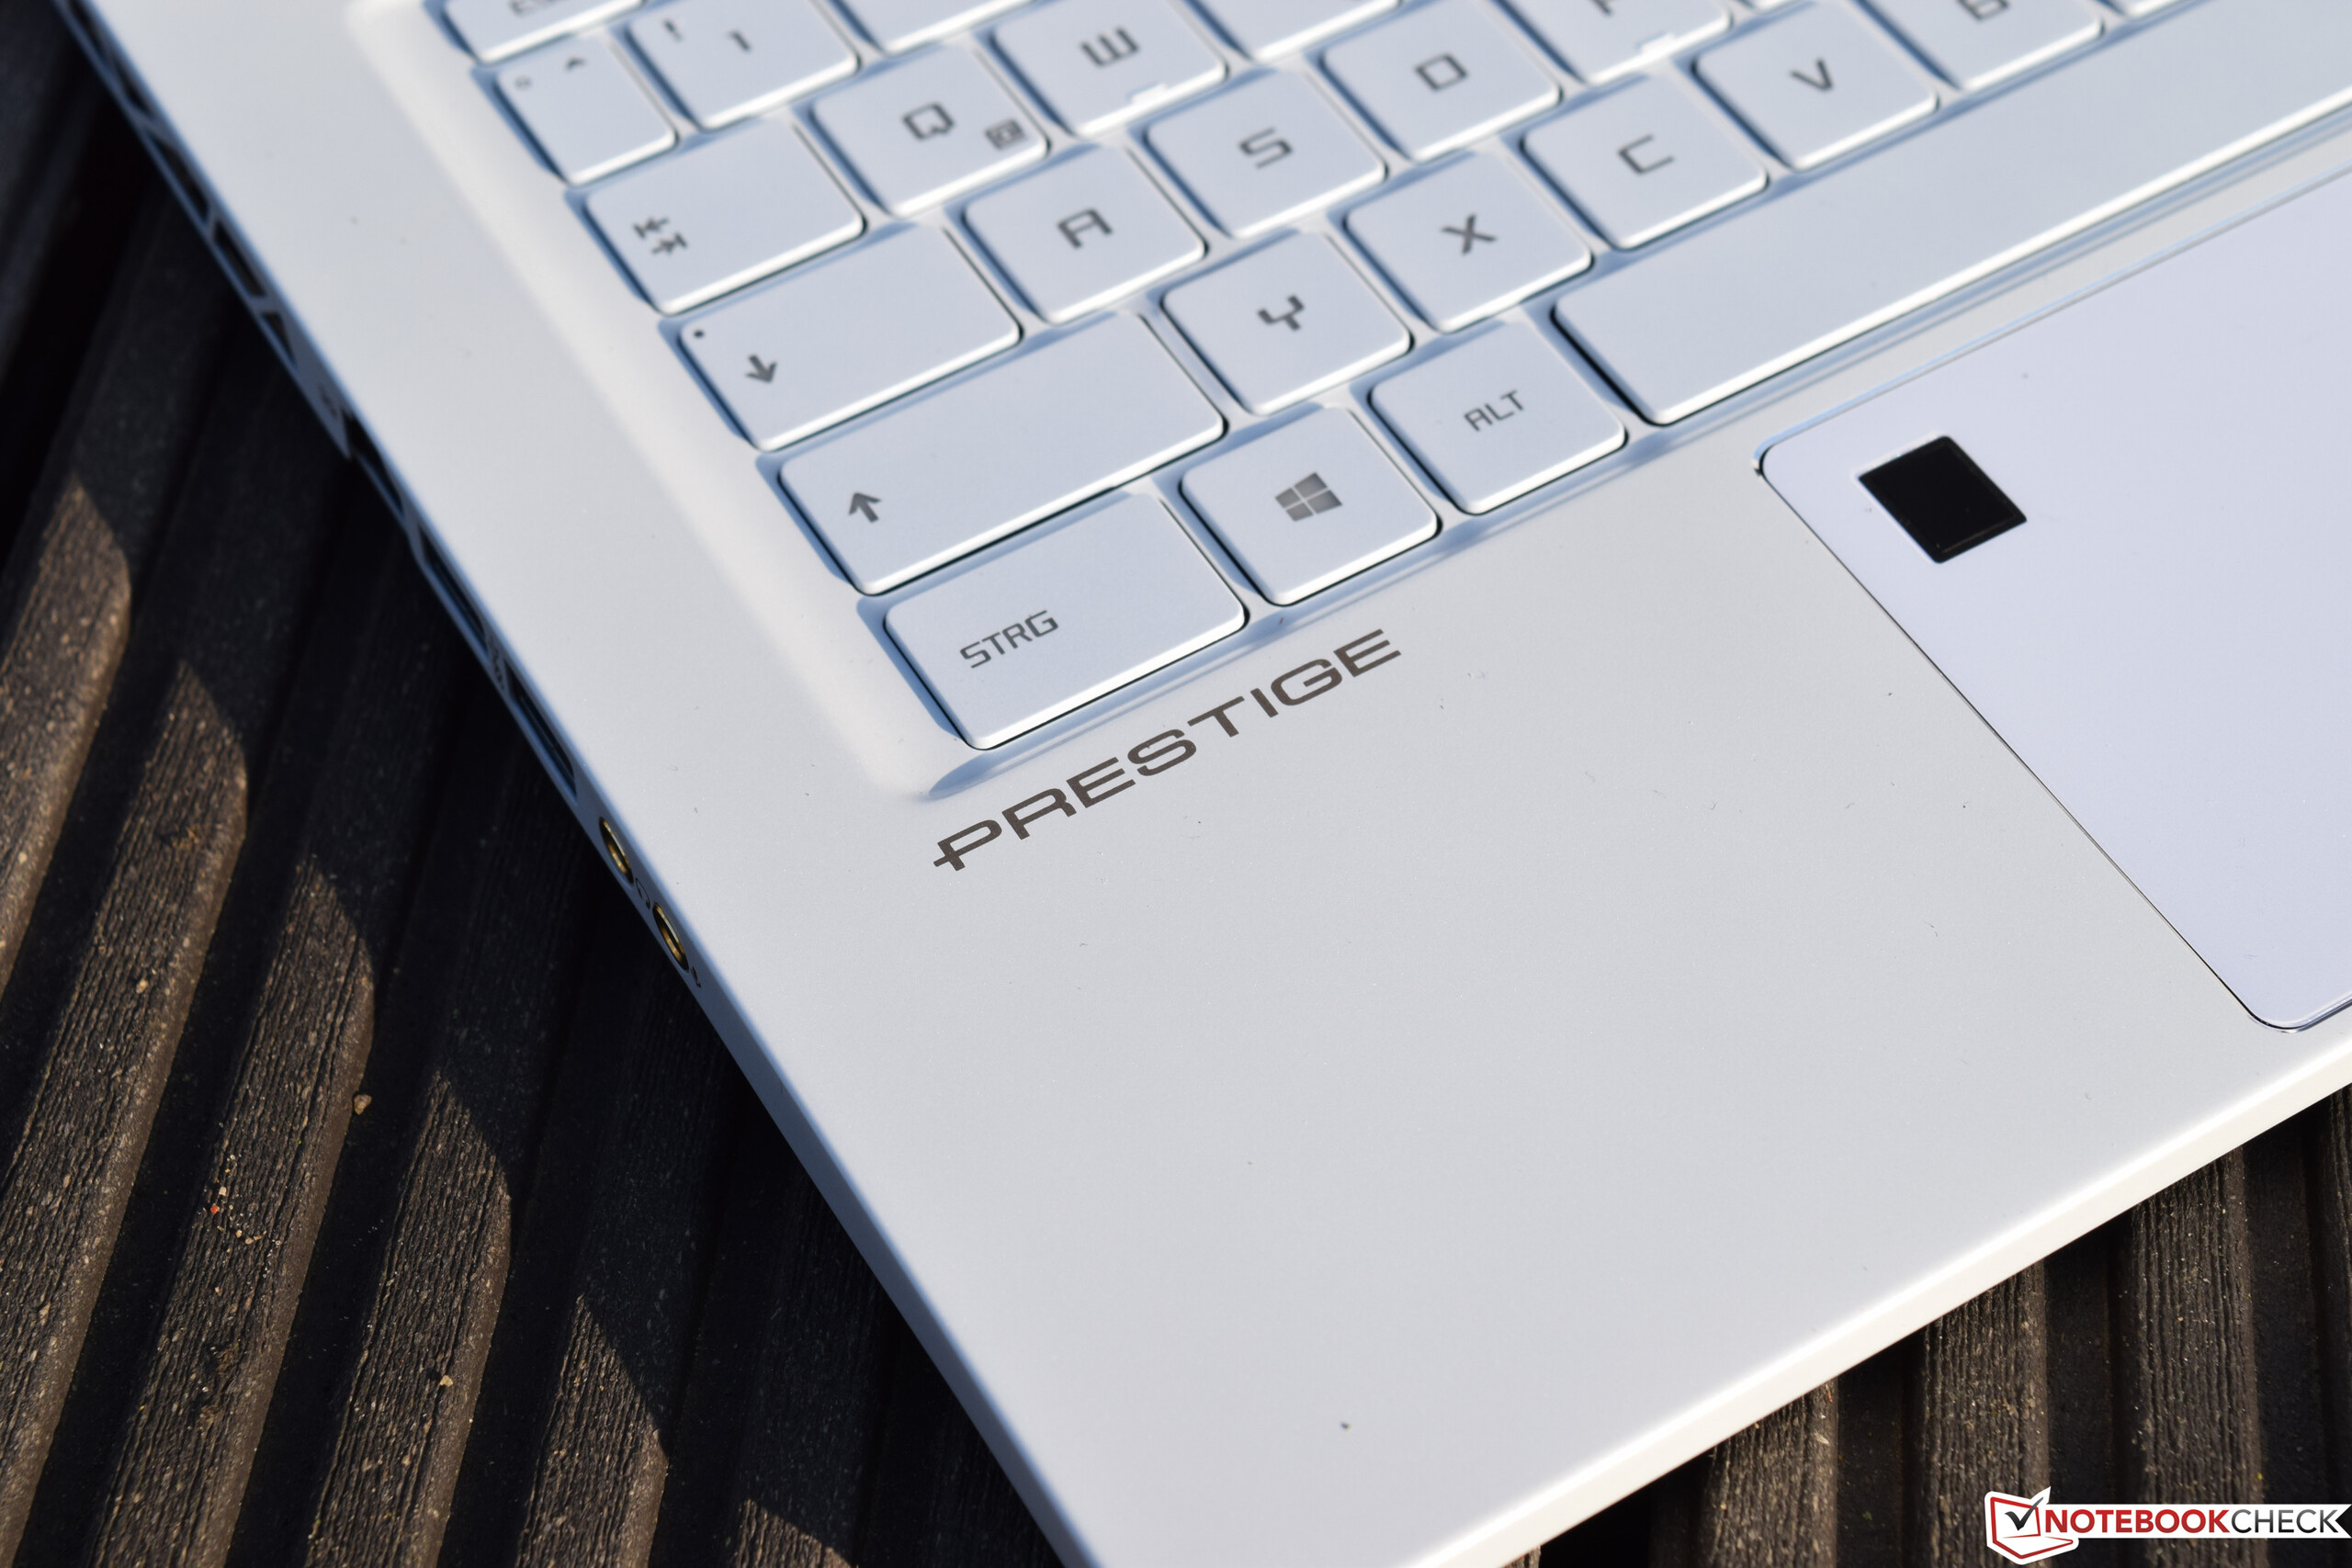
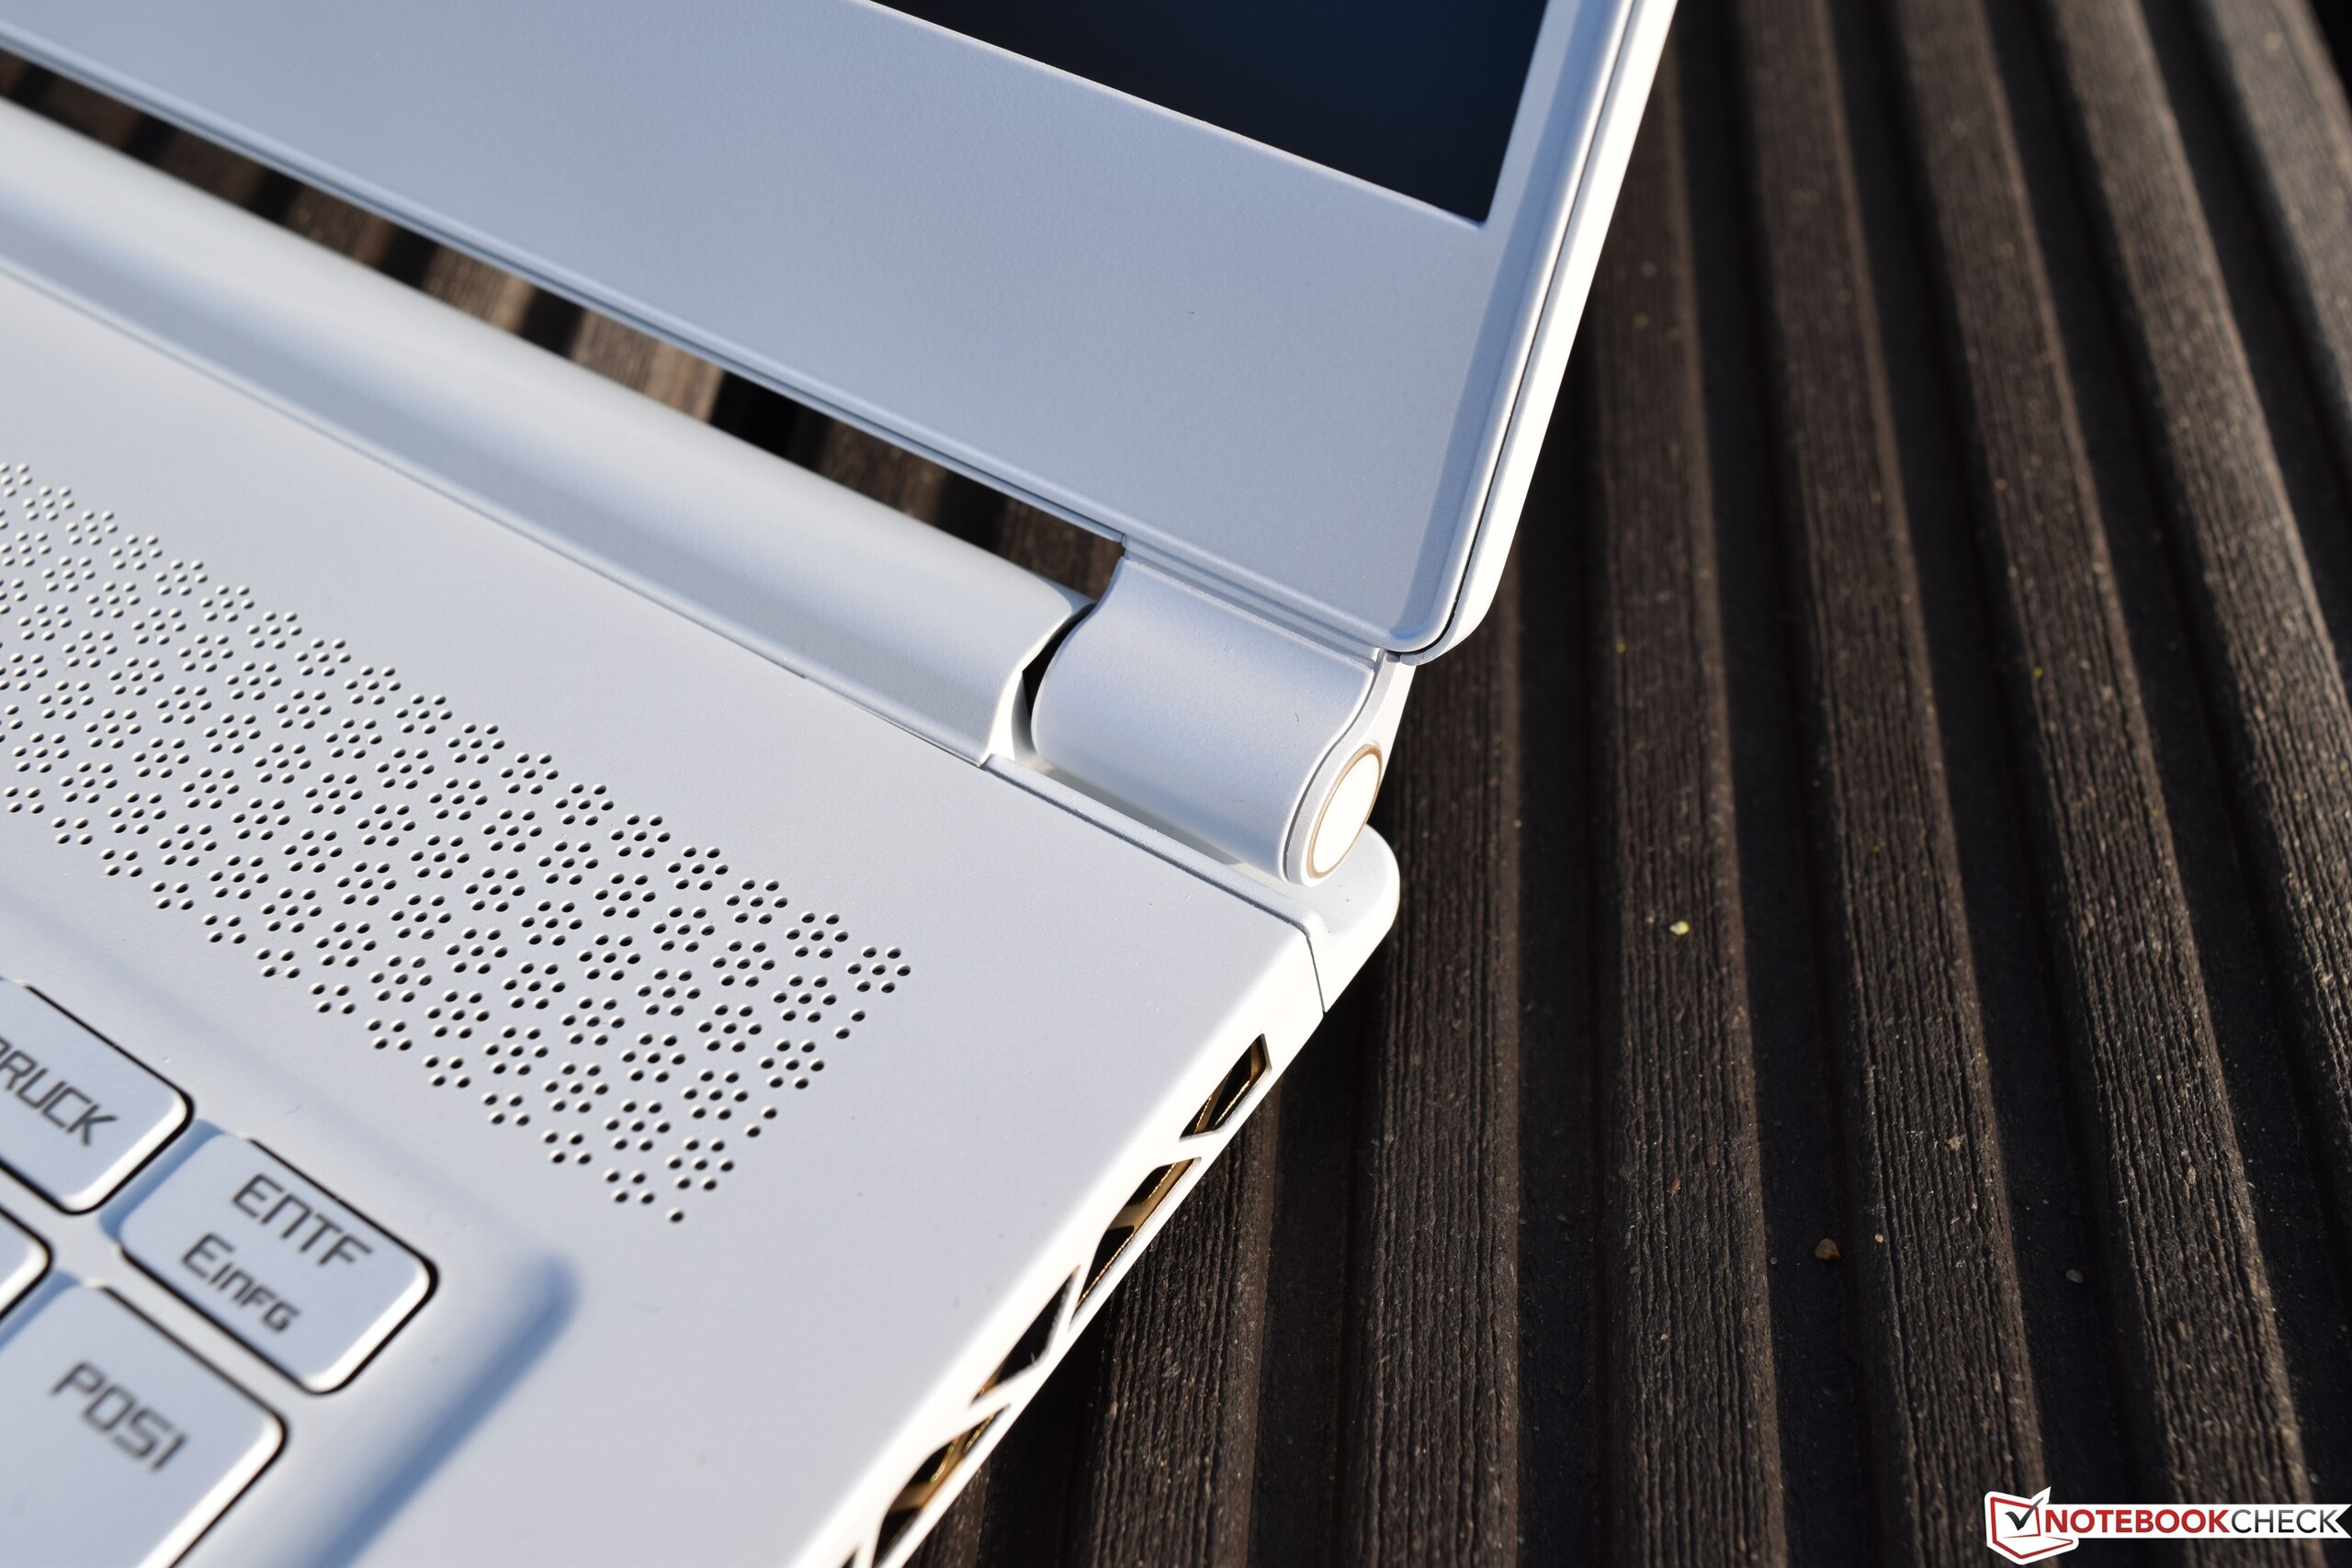
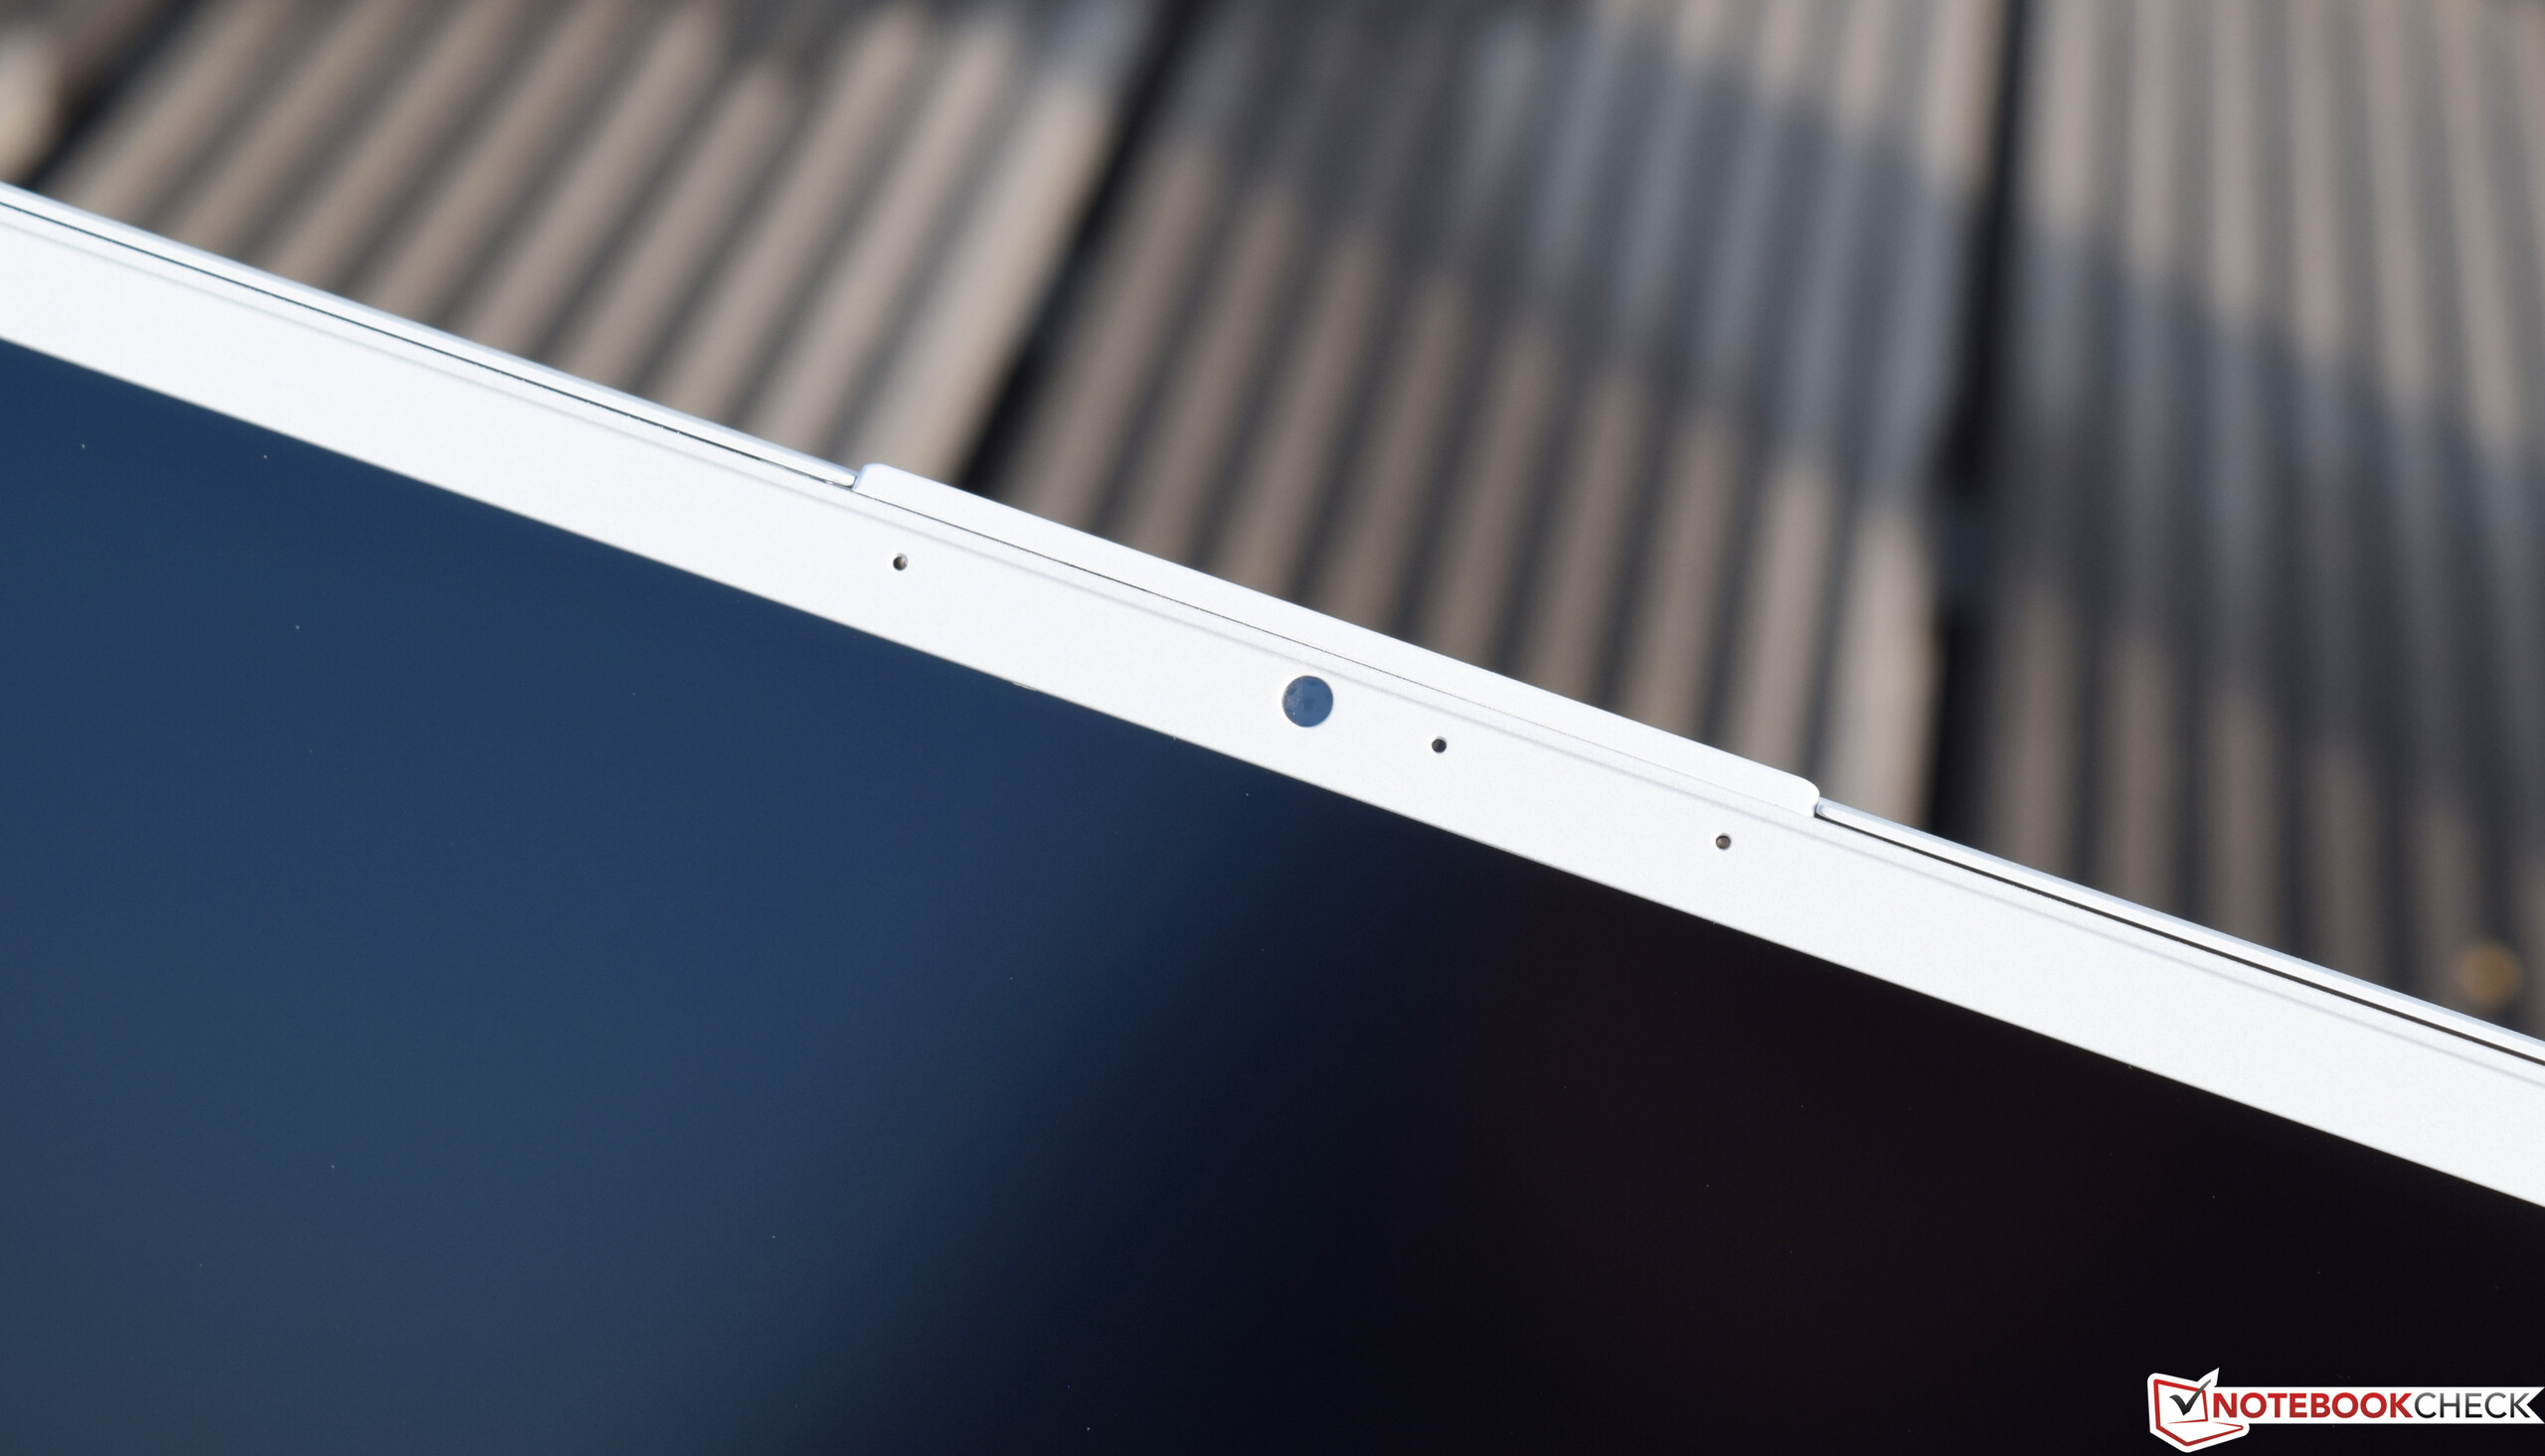
Höljet är en välgjord kompromiss mellan mobilitet och stabilitet. Materialvalet är riktigt lyxigt, men vi hade önskat oss en mer robust design. Skärmen är en blandad kompott. Å ena sidan har den stöd för 144 Hz och snabba responstider. Å andra sidan är den för mörk och praktiskt taget oanvändbar utomhus. Tangentbordet var heller inte det bästa. Det var otroligt svårt att läsa etiketterna och det ovanliga upplägget tog längre tid att lära sig än vi kände oss bekväma med.
Prestandan är däremot på en nivå du aldrig hade väntat dig från en såpass tunn och lätt enhet. Intels Core i7-8750H fungerade bra trots faktum att prestandan blev lidande av ihållande belastning och Nvidias GeForce GTX 1070 Max-Q levererade otrolig prestanda med tanke på den tunna designen.
För en kostnad på över 23.000 kronor kostar den ungefär lika mycket som GS65 8RF, men den har en del extrasaker som fingeravtrycksläsaren och den förlängda garantin. Om du vill undvika den typiska svarta designen och RGB-bling så kan du vilja överväga P65.
Om du väljer att köpa P65 Creator inkluderar MSI ett mjukvarupaket värt över 3.000 kronor för att du ska komma igång med din kreativa resa (gäller fram tills 31:e December 2018).
MSI P65 8RF-451 - Creator
- 11/10/2018 v6 (old)
Sebastian Bade
Price comparison
