Test: Gigabyte Aero 15 Classic-XA (i7-9750H, RTX 2070 Max-Q) Laptop (Sammanfattning)
| SD Card Reader | |
| average JPG Copy Test (av. of 3 runs) | |
| Gigabyte Aero 15-X9 (Toshiba Exceria Pro SDXC 64 GB UHS-II) | |
| Gigabyte Aero 15 Classic-XA (Toshiba Exceria Pro SDXC 64 GB UHS-II) | |
| Genomsnitt av klass Gaming (20.9 - 210, n=54, senaste 2 åren) | |
| Schenker XMG Neo 15 Turing (Toshiba Exceria Pro SDXC 64 GB UHS-II) | |
| maximum AS SSD Seq Read Test (1GB) | |
| Gigabyte Aero 15-X9 (Toshiba Exceria Pro SDXC 64 GB UHS-II) | |
| Gigabyte Aero 15 Classic-XA (Toshiba Exceria Pro SDXC 64 GB UHS-II) | |
| Genomsnitt av klass Gaming (25.5 - 261, n=51, senaste 2 åren) | |
| Schenker XMG Neo 15 Turing (Toshiba Exceria Pro SDXC 64 GB UHS-II) | |
| |||||||||||||||||||||||||
Distribution av ljusstyrkan: 89 %
Mitt på batteriet: 266 cd/m²
Kontrast: 858:1 (Svärta: 0.31 cd/m²)
ΔE ColorChecker Calman: 2.78 | ∀{0.5-29.43 Ø4.72}
calibrated: 0.91
ΔE Greyscale Calman: 3.58 | ∀{0.09-98 Ø4.97}
96% sRGB (Argyll 1.6.3 3D)
62% AdobeRGB 1998 (Argyll 1.6.3 3D)
66.5% AdobeRGB 1998 (Argyll 3D)
95.5% sRGB (Argyll 3D)
65.3% Display P3 (Argyll 3D)
Gamma: 2.46
CCT: 7186 K
| Gigabyte Aero 15 Classic-XA Sharp LQ156M1JW03 (SHP14C5), IGZO, 1920x1080, | Gigabyte Aero 15-X9 LGD05C0, IPS, 1920x1080, | Razer Blade 15 RTX 2070 Max-Q LG Philips LGD05C0, IPS, 1920x1080, | Asus Zephyrus S GX531GX AU Optronics B156HAN08.2, IPS, 1920x1080, | Schenker XMG Neo 15 Turing BOEhydis NV156FHM-N4G (BOE07AF), IPS, 1920x1080, | Acer Predator Triton 500 AU Optronics B156HAN08.2 (AUO82ED), IPS, 1920x1080, | Lenovo Legion Y740-15ICHg LP156WFG-SPB2, IPS, 1920x1080, | |
|---|---|---|---|---|---|---|---|
| Display | -3% | -0% | -1% | -3% | -2% | -3% | |
| Display P3 Coverage (%) | 65.3 | 63.5 -3% | 65.3 0% | 65.6 0% | 63.5 -3% | 64.2 -2% | 63.5 -3% |
| sRGB Coverage (%) | 95.5 | 93.1 -3% | 94.9 -1% | 92.2 -3% | 92.3 -3% | 92.6 -3% | 92.4 -3% |
| AdobeRGB 1998 Coverage (%) | 66.5 | 64.5 -3% | 66.3 0% | 66.9 1% | 65 -2% | 65.7 -1% | 64.7 -3% |
| Response Times | -15% | -8% | 34% | 27% | 24% | -21% | |
| Response Time Grey 50% / Grey 80% * (ms) | 15.2 ? | 16.4 ? -8% | 16.8 ? -11% | 7 ? 54% | 8.8 ? 42% | 8 ? 47% | 18.8 ? -24% |
| Response Time Black / White * (ms) | 11.2 ? | 13.6 ? -21% | 11.6 ? -4% | 9.6 ? 14% | 10 ? 11% | 11.2 ? -0% | 13.2 ? -18% |
| PWM Frequency (Hz) | 23580 ? | 1000 ? | |||||
| Screen | 16% | -4% | -11% | -18% | -18% | -17% | |
| Brightness middle (cd/m²) | 266 | 250 -6% | 314.7 18% | 323.6 22% | 268 1% | 304 14% | 320.4 20% |
| Brightness (cd/m²) | 248 | 235 -5% | 312 26% | 315 27% | 270 9% | 299 21% | 298 20% |
| Brightness Distribution (%) | 89 | 85 -4% | 90 1% | 91 2% | 84 -6% | 89 0% | 85 -4% |
| Black Level * (cd/m²) | 0.31 | 0.29 6% | 0.38 -23% | 0.29 6% | 0.24 23% | 0.27 13% | 0.42 -35% |
| Contrast (:1) | 858 | 862 0% | 828 -3% | 1116 30% | 1117 30% | 1126 31% | 763 -11% |
| Colorchecker dE 2000 * | 2.78 | 1.46 47% | 2.56 8% | 3.31 -19% | 4.51 -62% | 4.66 -68% | 3.21 -15% |
| Colorchecker dE 2000 max. * | 5.96 | 2.47 59% | 4.89 18% | 5.74 4% | 9.58 -61% | 9.65 -62% | 5.54 7% |
| Colorchecker dE 2000 calibrated * | 0.91 | 1.71 -88% | 2.73 -200% | 1.57 -73% | 1.72 -89% | 2.36 -159% | |
| Greyscale dE 2000 * | 3.58 | 1.27 65% | 3.4 5% | 2.9 19% | 5.36 -50% | 5.53 -54% | 3.6 -1% |
| Gamma | 2.46 89% | 2.4 92% | 2.3 96% | 2.29 96% | 2.51 88% | 2.5 88% | 2.27 97% |
| CCT | 7186 90% | 6749 96% | 6435 101% | 6765 96% | 7826 83% | 8028 81% | 6503 100% |
| Color Space (Percent of AdobeRGB 1998) (%) | 62 | 60 -3% | 60.7 -2% | 59.7 -4% | 59 -5% | 60 -3% | 59 -5% |
| Color Space (Percent of sRGB) (%) | 96 | 93 -3% | 94.6 -1% | 91.8 -4% | 92 -4% | 93 -3% | 92 -4% |
| Totalt genomsnitt (program/inställningar) | -1% /
8% | -4% /
-4% | 7% /
-3% | 2% /
-10% | 1% /
-10% | -14% /
-15% |
* ... mindre är bättre
Visa svarstider
| ↔ Svarstid svart till vitt | ||
|---|---|---|
| 11.2 ms ... stiga ↗ och falla ↘ kombinerat | ↗ 6.8 ms stiga | 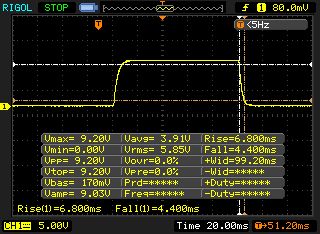 |
| ↘ 4.4 ms hösten | ||
| Skärmen visar bra svarsfrekvens i våra tester, men kan vara för långsam för konkurrenskraftiga spelare. I jämförelse sträcker sig alla testade enheter från 0.1 (minst) till 240 (maximalt) ms. » 30 % av alla enheter är bättre. Det betyder att den uppmätta svarstiden är bättre än genomsnittet av alla testade enheter (19.8 ms). | ||
| ↔ Svarstid 50 % grått till 80 % grått | ||
| 15.2 ms ... stiga ↗ och falla ↘ kombinerat | ↗ 7.6 ms stiga | 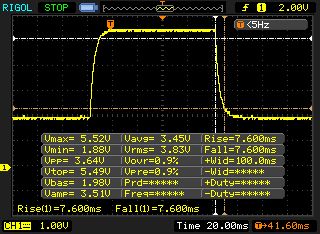 |
| ↘ 7.6 ms hösten | ||
| Skärmen visar bra svarsfrekvens i våra tester, men kan vara för långsam för konkurrenskraftiga spelare. I jämförelse sträcker sig alla testade enheter från 0.165 (minst) till 636 (maximalt) ms. » 29 % av alla enheter är bättre. Det betyder att den uppmätta svarstiden är bättre än genomsnittet av alla testade enheter (31 ms). | ||
Skärmflimmer / PWM (Puls-Width Modulation)
| Skärmflimmer / PWM upptäckt | 23580 Hz | ≤ 24 % ljusstyrka inställning | 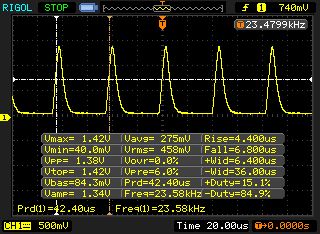 |
Displayens bakgrundsbelysning flimrar vid 23580 Hz (i värsta fall, t.ex. med PWM) Flimrande upptäckt vid en ljusstyrkeinställning på 24 % och lägre. Det ska inte finnas något flimmer eller PWM över denna ljusstyrkeinställning. Frekvensen för 23580 Hz är ganska hög, så de flesta användare som är känsliga för PWM bör inte märka något flimmer. Som jämförelse: 52 % av alla testade enheter använder inte PWM för att dämpa skärmen. Om PWM upptäcktes mättes ett medelvärde av 7781 (minst: 5 - maximum: 343500) Hz. | |||
| Cinebench R10 | |
| Rendering Single 32Bit | |
| Genomsnitt av klass Gaming (7457 - 11779, n=8, senaste 2 åren) | |
| Gigabyte Aero 15 Classic-XA | |
| Schenker XMG Neo 15 Turing | |
| Gigabyte Aero 15-X9 | |
| Rendering Multiple CPUs 32Bit | |
| Genomsnitt av klass Gaming (42932 - 81339, n=8, senaste 2 åren) | |
| Gigabyte Aero 15-X9 | |
| Gigabyte Aero 15 Classic-XA | |
| Schenker XMG Neo 15 Turing | |
| Geekbench 3 | |
| 32 Bit Multi-Core Score | |
| Gigabyte Aero 15 Classic-XA | |
| Schenker XMG Neo 15 Turing | |
| Gigabyte Aero 15-X9 | |
| 32 Bit Single-Core Score | |
| Gigabyte Aero 15 Classic-XA | |
| Schenker XMG Neo 15 Turing | |
| Gigabyte Aero 15-X9 | |
| Geekbench 4.4 | |
| 64 Bit Multi-Core Score | |
| Genomsnitt av klass Gaming (89200 - 97490, n=2, senaste 2 åren) | |
| Gigabyte Aero 15 Classic-XA | |
| Schenker XMG Neo 15 Turing | |
| Gigabyte Aero 15-X9 | |
| 64 Bit Single-Core Score | |
| Genomsnitt av klass Gaming (9335 - 9492, n=2, senaste 2 åren) | |
| Gigabyte Aero 15 Classic-XA | |
| Schenker XMG Neo 15 Turing | |
| Gigabyte Aero 15-X9 | |
| Mozilla Kraken 1.1 - Total | |
| Gigabyte Aero 15-X9 (Edge 44) | |
| Razer Blade 15 RTX 2070 Max-Q (Edge 44.17763.1.0) | |
| Schenker XMG Neo 15 Turing (Edge 44) | |
| Lenovo Legion Y740-15ICHg (Microsoft Edge 44.17763.1.0) | |
| Asus Zephyrus S GX531GX (Edge 42.17134.1.0) | |
| Gigabyte Aero 15 Classic-XA (Edge 44) | |
| Genomsnitt av klass Gaming (391 - 590, n=104, senaste 2 åren) | |
| Octane V2 - Total Score | |
| Genomsnitt av klass Gaming (89353 - 139447, n=29, senaste 2 åren) | |
| Gigabyte Aero 15 Classic-XA (Edge 44) | |
| Schenker XMG Neo 15 Turing (Edge 44) | |
| Lenovo Legion Y740-15ICHg (Microsoft Edge 44.17763.1.0) | |
| Gigabyte Aero 15-X9 (Edge 44) | |
| Asus Zephyrus S GX531GX (Edge 42.17134.1.0) | |
| Razer Blade 15 RTX 2070 Max-Q (Edge 44.17763.1.0) | |
| WebXPRT 3 - Overall | |
| Genomsnitt av klass Gaming (242 - 532, n=99, senaste 2 åren) | |
| Gigabyte Aero 15 Classic-XA (Edge 44) | |
| JetStream 1.1 - 1.1 Total | |
| Genomsnitt av klass Gaming (533 - 647, n=4, senaste 2 åren) | |
| Razer Blade 15 RTX 2070 Max-Q (Edge 44.17763.1.0) | |
| Schenker XMG Neo 15 Turing (Edge 44) | |
| Asus Zephyrus S GX531GX (Edge 42.17134.1.0) | |
| Lenovo Legion Y740-15ICHg (Microsoft Edge 44.17763.1.0) | |
| Gigabyte Aero 15 Classic-XA (Edge 44) | |
| Gigabyte Aero 15-X9 (Edge 44) | |
* ... mindre är bättre
| PCMark 7 Score | 6854 poäng | |
| PCMark 8 Home Score Accelerated v2 | 4851 poäng | |
| PCMark 8 Creative Score Accelerated v2 | 5574 poäng | |
| PCMark 8 Work Score Accelerated v2 | 6035 poäng | |
| PCMark 10 Score | 5697 poäng | |
Hjälp | ||

| Gigabyte Aero 15 Classic-XA Intel SSD 760p SSDPEKKW512G8 | Gigabyte Aero 15-X9 Intel SSD 760p SSDPEKKW010T8 | Razer Blade 15 RTX 2070 Max-Q Samsung SSD PM981 MZVLB512HAJQ | Asus Zephyrus S GX531GX Intel SSD 660p SSDPEKNW512G8 | Schenker XMG Neo 15 Turing Samsung SSD 970 EVO Plus 1TB | Acer Predator Triton 500 2x WDC PC SN720 SDAPNTW-256G-1014 (RAID 0) | Lenovo Legion Y740-15ICHg Samsung SSD PM981 MZVLB256HAHQ | |
|---|---|---|---|---|---|---|---|
| CrystalDiskMark 5.2 / 6 | -15% | -13% | -33% | -6% | 7% | -20% | |
| Write 4K (MB/s) | 115.5 | 97.1 -16% | 93.9 -19% | 93.9 -19% | 92.5 -20% | 93.6 -19% | 81 -30% |
| Read 4K (MB/s) | 58 | 53.7 -7% | 40.56 -30% | 46.29 -20% | 40.45 -30% | 38.82 -33% | 36.03 -38% |
| Write Seq (MB/s) | 1555 | 1526 -2% | 1468 -6% | 974 -37% | 1197 -23% | 2455 58% | 1687 8% |
| Read Seq (MB/s) | 2590 | 2020 -22% | 1540 -41% | 1425 -45% | 1018 -61% | 2107 -19% | 1835 -29% |
| Write 4K Q32T1 (MB/s) | 369.3 | 285.6 -23% | 293.5 -21% | 259.4 -30% | 288.6 -22% | 298.7 -19% | 205.3 -44% |
| Read 4K Q32T1 (MB/s) | 441.7 | 321.8 -27% | 346 -22% | 296.5 -33% | 332 -25% | 338.7 -23% | 229 -48% |
| Write Seq Q32T1 (MB/s) | 1547 | 1533 -1% | 1941 25% | 977 -37% | 3317 114% | 2902 88% | 1683 9% |
| Read Seq Q32T1 (MB/s) | 2969 | 2351 -21% | 3266 10% | 1666 -44% | 3515 18% | 3536 19% | 3363 13% |
| 3DMark 06 Standard Score | 35193 poäng | |
| 3DMark 11 Performance | 18171 poäng | |
| 3DMark Ice Storm Standard Score | 113186 poäng | |
| 3DMark Cloud Gate Standard Score | 35891 poäng | |
| 3DMark Fire Strike Score | 15494 poäng | |
| 3DMark Time Spy Score | 6639 poäng | |
Hjälp | ||
| The Witcher 3 - 1920x1080 Ultra Graphics & Postprocessing (HBAO+) | |
| Genomsnitt av klass Gaming (95 - 240, n=8, senaste 2 åren) | |
| Asus Zephyrus S GX531GX | |
| Acer Predator Triton 500 | |
| Razer Blade 15 RTX 2070 Max-Q | |
| Gigabyte Aero 15 Classic-XA | |
| Schenker XMG Neo 15 Turing | |
| Gigabyte Aero 15-X9 | |
| Lenovo Legion Y740-15ICHg | |
| BioShock Infinite - 1920x1080 Ultra Preset, DX11 (DDOF) | |
| Lenovo Legion Y740-15ICHg | |
| Asus Zephyrus S GX531GX | |
| Razer Blade 15 RTX 2070 Max-Q | |
| Gigabyte Aero 15 Classic-XA | |
| Schenker XMG Neo 15 Turing | |
| Gigabyte Aero 15-X9 | |
| Far Cry 5 - 1920x1080 Ultra Preset AA:T | |
| Genomsnitt av klass Gaming (70 - 151, n=10, senaste 2 åren) | |
| Gigabyte Aero 15 Classic-XA | |
| Gigabyte Aero 15-X9 | |
| låg | med. | hög | ultra | |
|---|---|---|---|---|
| BioShock Infinite (2013) | 321.3 | 279.3 | 238 | 150.3 |
| The Witcher 3 (2015) | 273.1 | 189.2 | 113.2 | 64.1 |
| Final Fantasy XV Benchmark (2018) | 117.6 | 87.9 | 62.9 | |
| World of Tanks enCore (2018) | 490.3 | 218.9 | 129.1 | |
| Far Cry 5 (2018) | 127 | 100 | 95 | 89 |
| Forza Horizon 4 (2018) | 150 | 121 | 118 | 98 |
| Far Cry New Dawn (2019) | 113 | 93 | 87 | 79 |
| Metro Exodus (2019) | 128.8 | 79.8 | 56.3 | 47.7 |
| The Division 2 (2019) | 147 | 108 | 87 | 70 |
| Anno 1800 (2019) | 92 | 82.1 | 68.1 | 34 |
Ljudnivå
| Låg belastning |
| 31 / 34 / 39 dB(A) |
| Hög belastning |
| 46 / 55 dB(A) |
 | ||
30 dB tyst 40 dB(A) hörbar 50 dB(A) högt ljud |
||
min: | ||
| Gigabyte Aero 15 Classic-XA i7-9750H, GeForce RTX 2070 Max-Q | Gigabyte Aero 15-X9 i7-8750H, GeForce RTX 2070 Max-Q | Razer Blade 15 RTX 2070 Max-Q i7-8750H, GeForce RTX 2070 Max-Q | Asus Zephyrus S GX531GX i7-8750H, GeForce RTX 2080 Max-Q | Schenker XMG Neo 15 Turing i7-8750H, GeForce RTX 2070 Max-Q | Acer Predator Triton 500 i7-8750H, GeForce RTX 2080 Max-Q | Lenovo Legion Y740-15ICHg i7-8750H, GeForce RTX 2070 Max-Q | |
|---|---|---|---|---|---|---|---|
| Noise | 6% | 16% | 3% | 2% | 8% | 13% | |
| av / miljö * (dB) | 30 | 30 -0% | 28.8 4% | 28.7 4% | 30 -0% | 29 3% | 28 7% |
| Idle Minimum * (dB) | 31 | 32 -3% | 28.8 7% | 29.8 4% | 30 3% | 30 3% | 32.6 -5% |
| Idle Average * (dB) | 34 | 34 -0% | 28.8 15% | 32.4 5% | 32 6% | 32 6% | 32.7 4% |
| Idle Maximum * (dB) | 39 | 36 8% | 29.4 25% | 38 3% | 35 10% | 34 13% | 32.7 16% |
| Load Average * (dB) | 46 | 42 9% | 35.7 22% | 38.2 17% | 47 -2% | 44 4% | 33.3 28% |
| Witcher 3 ultra * (dB) | 53 | 44 17% | 42.5 20% | 56.6 -7% | 53 -0% | 46 13% | 41.6 22% |
| Load Maximum * (dB) | 55 | 48 13% | 45 18% | 56.6 -3% | 55 -0% | 47 15% | 45.2 18% |
* ... mindre är bättre
(-) Den maximala temperaturen på ovansidan är 58 °C / 136 F, jämfört med genomsnittet av 40.4 °C / 105 F , allt från 21.2 till 68.8 °C för klassen Gaming.
(-) Botten värms upp till maximalt 64 °C / 147 F, jämfört med genomsnittet av 43.2 °C / 110 F
(+) Vid tomgångsbruk är medeltemperaturen för ovansidan 28.1 °C / 83 F, jämfört med enhetsgenomsnittet på 33.9 °C / ### class_avg_f### F.
(-) När du spelar The Witcher 3 är medeltemperaturen för ovansidan 45.4 °C / 114 F, jämfört med enhetsgenomsnittet på 33.9 °C / ## #class_avg_f### F.
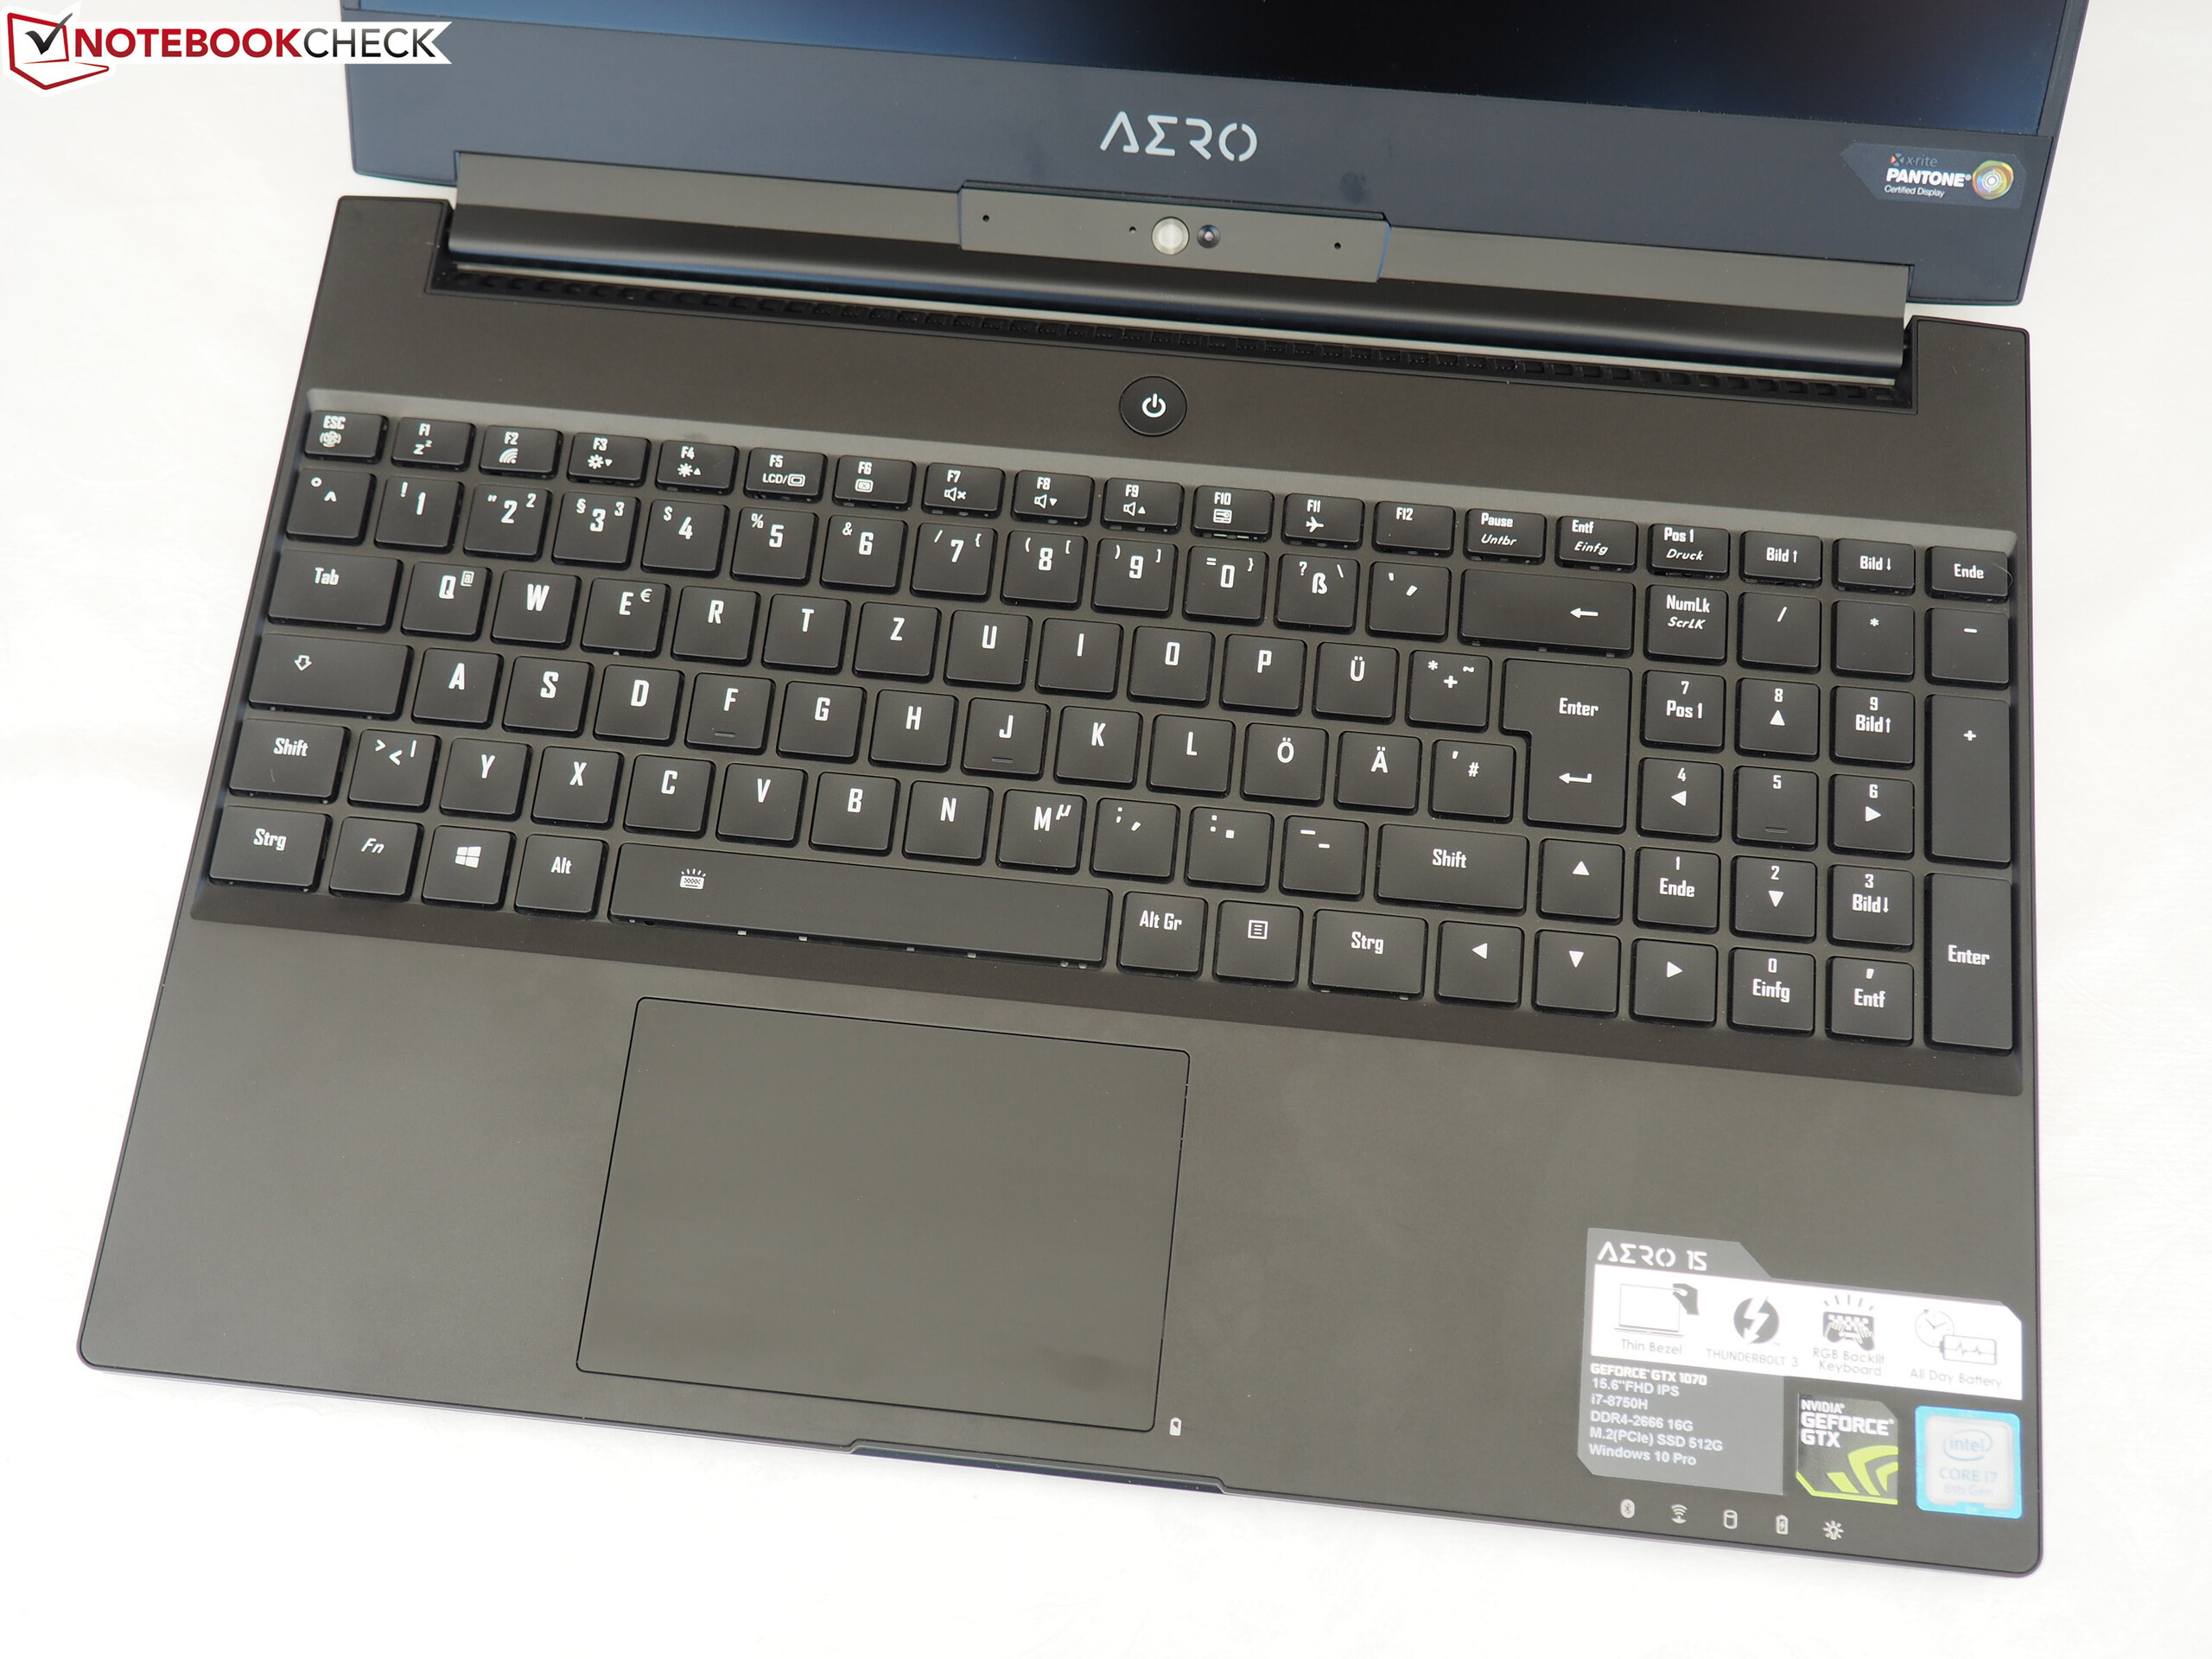
(-) Handledsstöden och pekplattan kan bli väldigt varma vid beröring med maximalt 40 °C / 104 F.
(-) Medeltemperaturen för handledsstödsområdet på liknande enheter var 28.8 °C / 83.8 F (-11.2 °C / -20.2 F).
| Gigabyte Aero 15 Classic-XA i7-9750H, GeForce RTX 2070 Max-Q | Gigabyte Aero 15-X9 i7-8750H, GeForce RTX 2070 Max-Q | Razer Blade 15 RTX 2070 Max-Q i7-8750H, GeForce RTX 2070 Max-Q | Asus Zephyrus S GX531GX i7-8750H, GeForce RTX 2080 Max-Q | Schenker XMG Neo 15 Turing i7-8750H, GeForce RTX 2070 Max-Q | Acer Predator Triton 500 i7-8750H, GeForce RTX 2080 Max-Q | Lenovo Legion Y740-15ICHg i7-8750H, GeForce RTX 2070 Max-Q | |
|---|---|---|---|---|---|---|---|
| Heat | 6% | 17% | 10% | -2% | 2% | 9% | |
| Maximum Upper Side * (°C) | 58 | 56 3% | 49 16% | 47 19% | 58 -0% | 49 16% | 37.6 35% |
| Maximum Bottom * (°C) | 64 | 66 -3% | 49 23% | 48.6 24% | 68 -6% | 58 9% | 45.2 29% |
| Idle Upper Side * (°C) | 30 | 27 10% | 25.4 15% | 28.8 4% | 30 -0% | 33 -10% | 32.2 -7% |
| Idle Bottom * (°C) | 31 | 27 13% | 27.2 12% | 33.2 -7% | 31 -0% | 33 -6% | 37.2 -20% |
* ... mindre är bättre
Gigabyte Aero 15 Classic-XA ljudanalys
(+) | högtalare kan spela relativt högt (82 dB)
Bas 100 - 315 Hz
(-) | nästan ingen bas - i genomsnitt 17% lägre än medianen
(±) | linjäriteten för basen är genomsnittlig (10.2% delta till föregående frekvens)
Mellan 400 - 2000 Hz
(+) | balanserad mellan - endast 4.7% från medianen
(+) | mids är linjära (6.2% delta till föregående frekvens)
Högsta 2 - 16 kHz
(+) | balanserade toppar - endast 2.3% från medianen
(+) | toppar är linjära (5.5% delta till föregående frekvens)
Totalt 100 - 16 000 Hz
(±) | linjäriteten för det totala ljudet är genomsnittlig (15.5% skillnad mot median)
Jämfört med samma klass
» 35% av alla testade enheter i den här klassen var bättre, 7% liknande, 58% sämre
» Den bästa hade ett delta på 6%, genomsnittet var 18%, sämst var 132%
Jämfört med alla testade enheter
» 23% av alla testade enheter var bättre, 4% liknande, 73% sämre
» Den bästa hade ett delta på 4%, genomsnittet var 24%, sämst var 134%
Razer Blade 15 RTX 2070 Max-Q ljudanalys
(-) | inte särskilt höga högtalare (71.6 dB)
Bas 100 - 315 Hz
(±) | reducerad bas - i genomsnitt 7.7% lägre än medianen
(±) | linjäriteten för basen är genomsnittlig (11.1% delta till föregående frekvens)
Mellan 400 - 2000 Hz
(±) | högre mellan - i genomsnitt 7.8% högre än median
(±) | linjäriteten för mids är genomsnittlig (9.5% delta till föregående frekvens)
Högsta 2 - 16 kHz
(+) | balanserade toppar - endast 3% från medianen
(±) | linjäriteten för toppar är genomsnittlig (7.2% delta till föregående frekvens)
Totalt 100 - 16 000 Hz
(±) | linjäriteten för det totala ljudet är genomsnittlig (23.9% skillnad mot median)
Jämfört med samma klass
» 86% av alla testade enheter i den här klassen var bättre, 5% liknande, 9% sämre
» Den bästa hade ett delta på 6%, genomsnittet var 18%, sämst var 132%
Jämfört med alla testade enheter
» 72% av alla testade enheter var bättre, 6% liknande, 22% sämre
» Den bästa hade ett delta på 4%, genomsnittet var 24%, sämst var 134%
| Av/Standby | |
| Låg belastning | |
| Hög belastning |
|
Förklaring:
min: | |
| Gigabyte Aero 15 Classic-XA i7-9750H, GeForce RTX 2070 Max-Q | Gigabyte Aero 15-X9 i7-8750H, GeForce RTX 2070 Max-Q | Razer Blade 15 RTX 2070 Max-Q i7-8750H, GeForce RTX 2070 Max-Q | Asus Zephyrus S GX531GX i7-8750H, GeForce RTX 2080 Max-Q | Schenker XMG Neo 15 Turing i7-8750H, GeForce RTX 2070 Max-Q | Acer Predator Triton 500 i7-8750H, GeForce RTX 2080 Max-Q | Lenovo Legion Y740-15ICHg i7-8750H, GeForce RTX 2070 Max-Q | |
|---|---|---|---|---|---|---|---|
| Power Consumption | 21% | 26% | 6% | 23% | 9% | 5% | |
| Idle Minimum * (Watt) | 21 | 16 24% | 10.4 50% | 16.1 23% | 13 38% | 16 24% | 22.9 -9% |
| Idle Average * (Watt) | 23 | 18 22% | 14.6 37% | 20.9 9% | 16 30% | 22 4% | 27.2 -18% |
| Idle Maximum * (Watt) | 32 | 23 28% | 16.3 49% | 27 16% | 21 34% | 32 -0% | 27.5 14% |
| Load Average * (Watt) | 97 | 88 9% | 88.5 9% | 93.4 4% | 84 13% | 89 8% | 83.4 14% |
| Witcher 3 ultra * (Watt) | 148 | 120 19% | 155.4 -5% | 168.2 -14% | 135 9% | 147 1% | 143.6 3% |
| Load Maximum * (Watt) | 213 | 167 22% | 182.4 14% | 215.3 -1% | 183 14% | 173 19% | 160.5 25% |
* ... mindre är bättre
| Gigabyte Aero 15 Classic-XA i7-9750H, GeForce RTX 2070 Max-Q, 94.24 Wh | Gigabyte Aero 15-X9 i7-8750H, GeForce RTX 2070 Max-Q, 94.24 Wh | Gigabyte Aero 15X v8 i7-8750H, GeForce GTX 1070 Max-Q, 94.24 Wh | Razer Blade 15 RTX 2070 Max-Q i7-8750H, GeForce RTX 2070 Max-Q, 80 Wh | Asus Zephyrus S GX531GX i7-8750H, GeForce RTX 2080 Max-Q, 50 Wh | Schenker XMG Neo 15 Turing i7-8750H, GeForce RTX 2070 Max-Q, 62.3 Wh | Acer Predator Triton 500 i7-8750H, GeForce RTX 2080 Max-Q, 82 Wh | Lenovo Legion Y740-15ICHg i7-8750H, GeForce RTX 2070 Max-Q, 57 Wh | |
|---|---|---|---|---|---|---|---|---|
| Batteridrifttid | -5% | 19% | -11% | -57% | -32% | -48% | -63% | |
| Reader / Idle (h) | 9.1 | 9.2 1% | 12.7 40% | 11.4 25% | 6.9 -24% | 5.6 -38% | 3.9 -57% | |
| H.264 (h) | 6.8 | 6.1 -10% | 8.4 24% | 4.9 -28% | ||||
| WiFi v1.3 (h) | 7 | 6.4 -9% | 8.6 23% | 6.5 -7% | 3 -57% | 5.1 -27% | 3.2 -54% | 2.8 -60% |
| Load (h) | 3 | 2.9 -3% | 2.6 -13% | 1.5 -50% | 1.6 -47% | 1.4 -53% | 0.8 -73% |
För
Emot
Läs den fullständiga versionen av den här recensionen på engelska här.
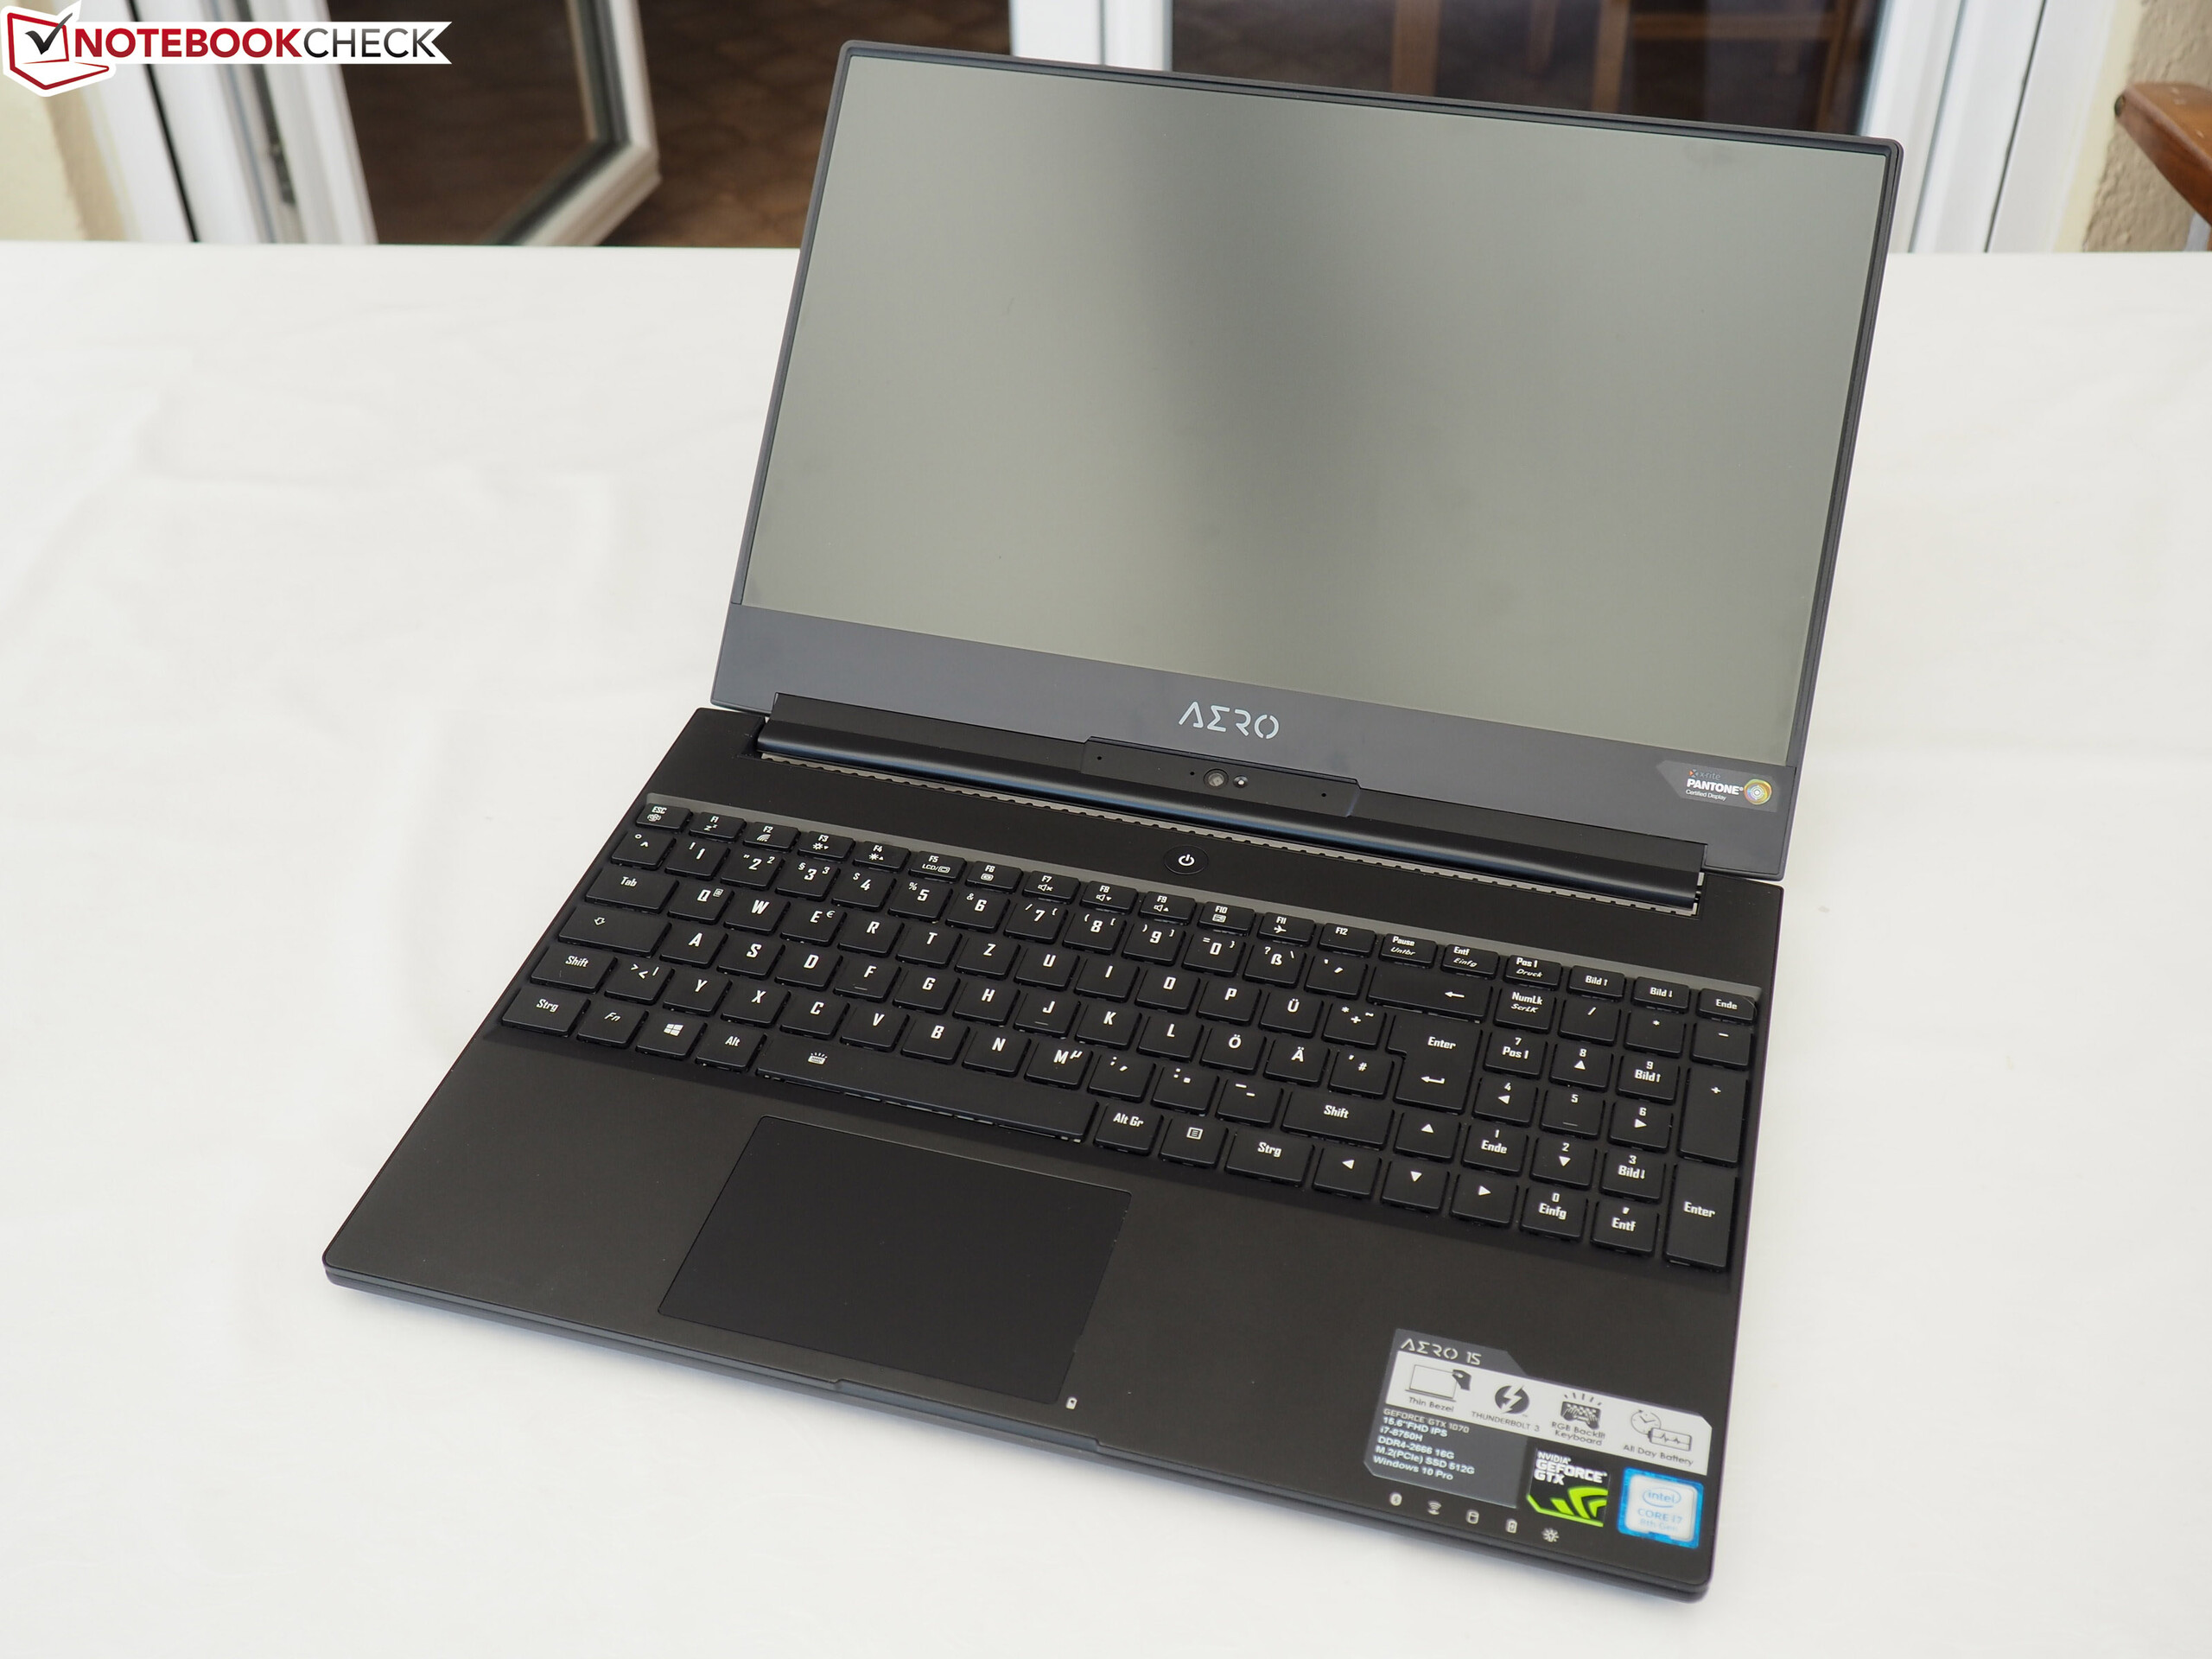
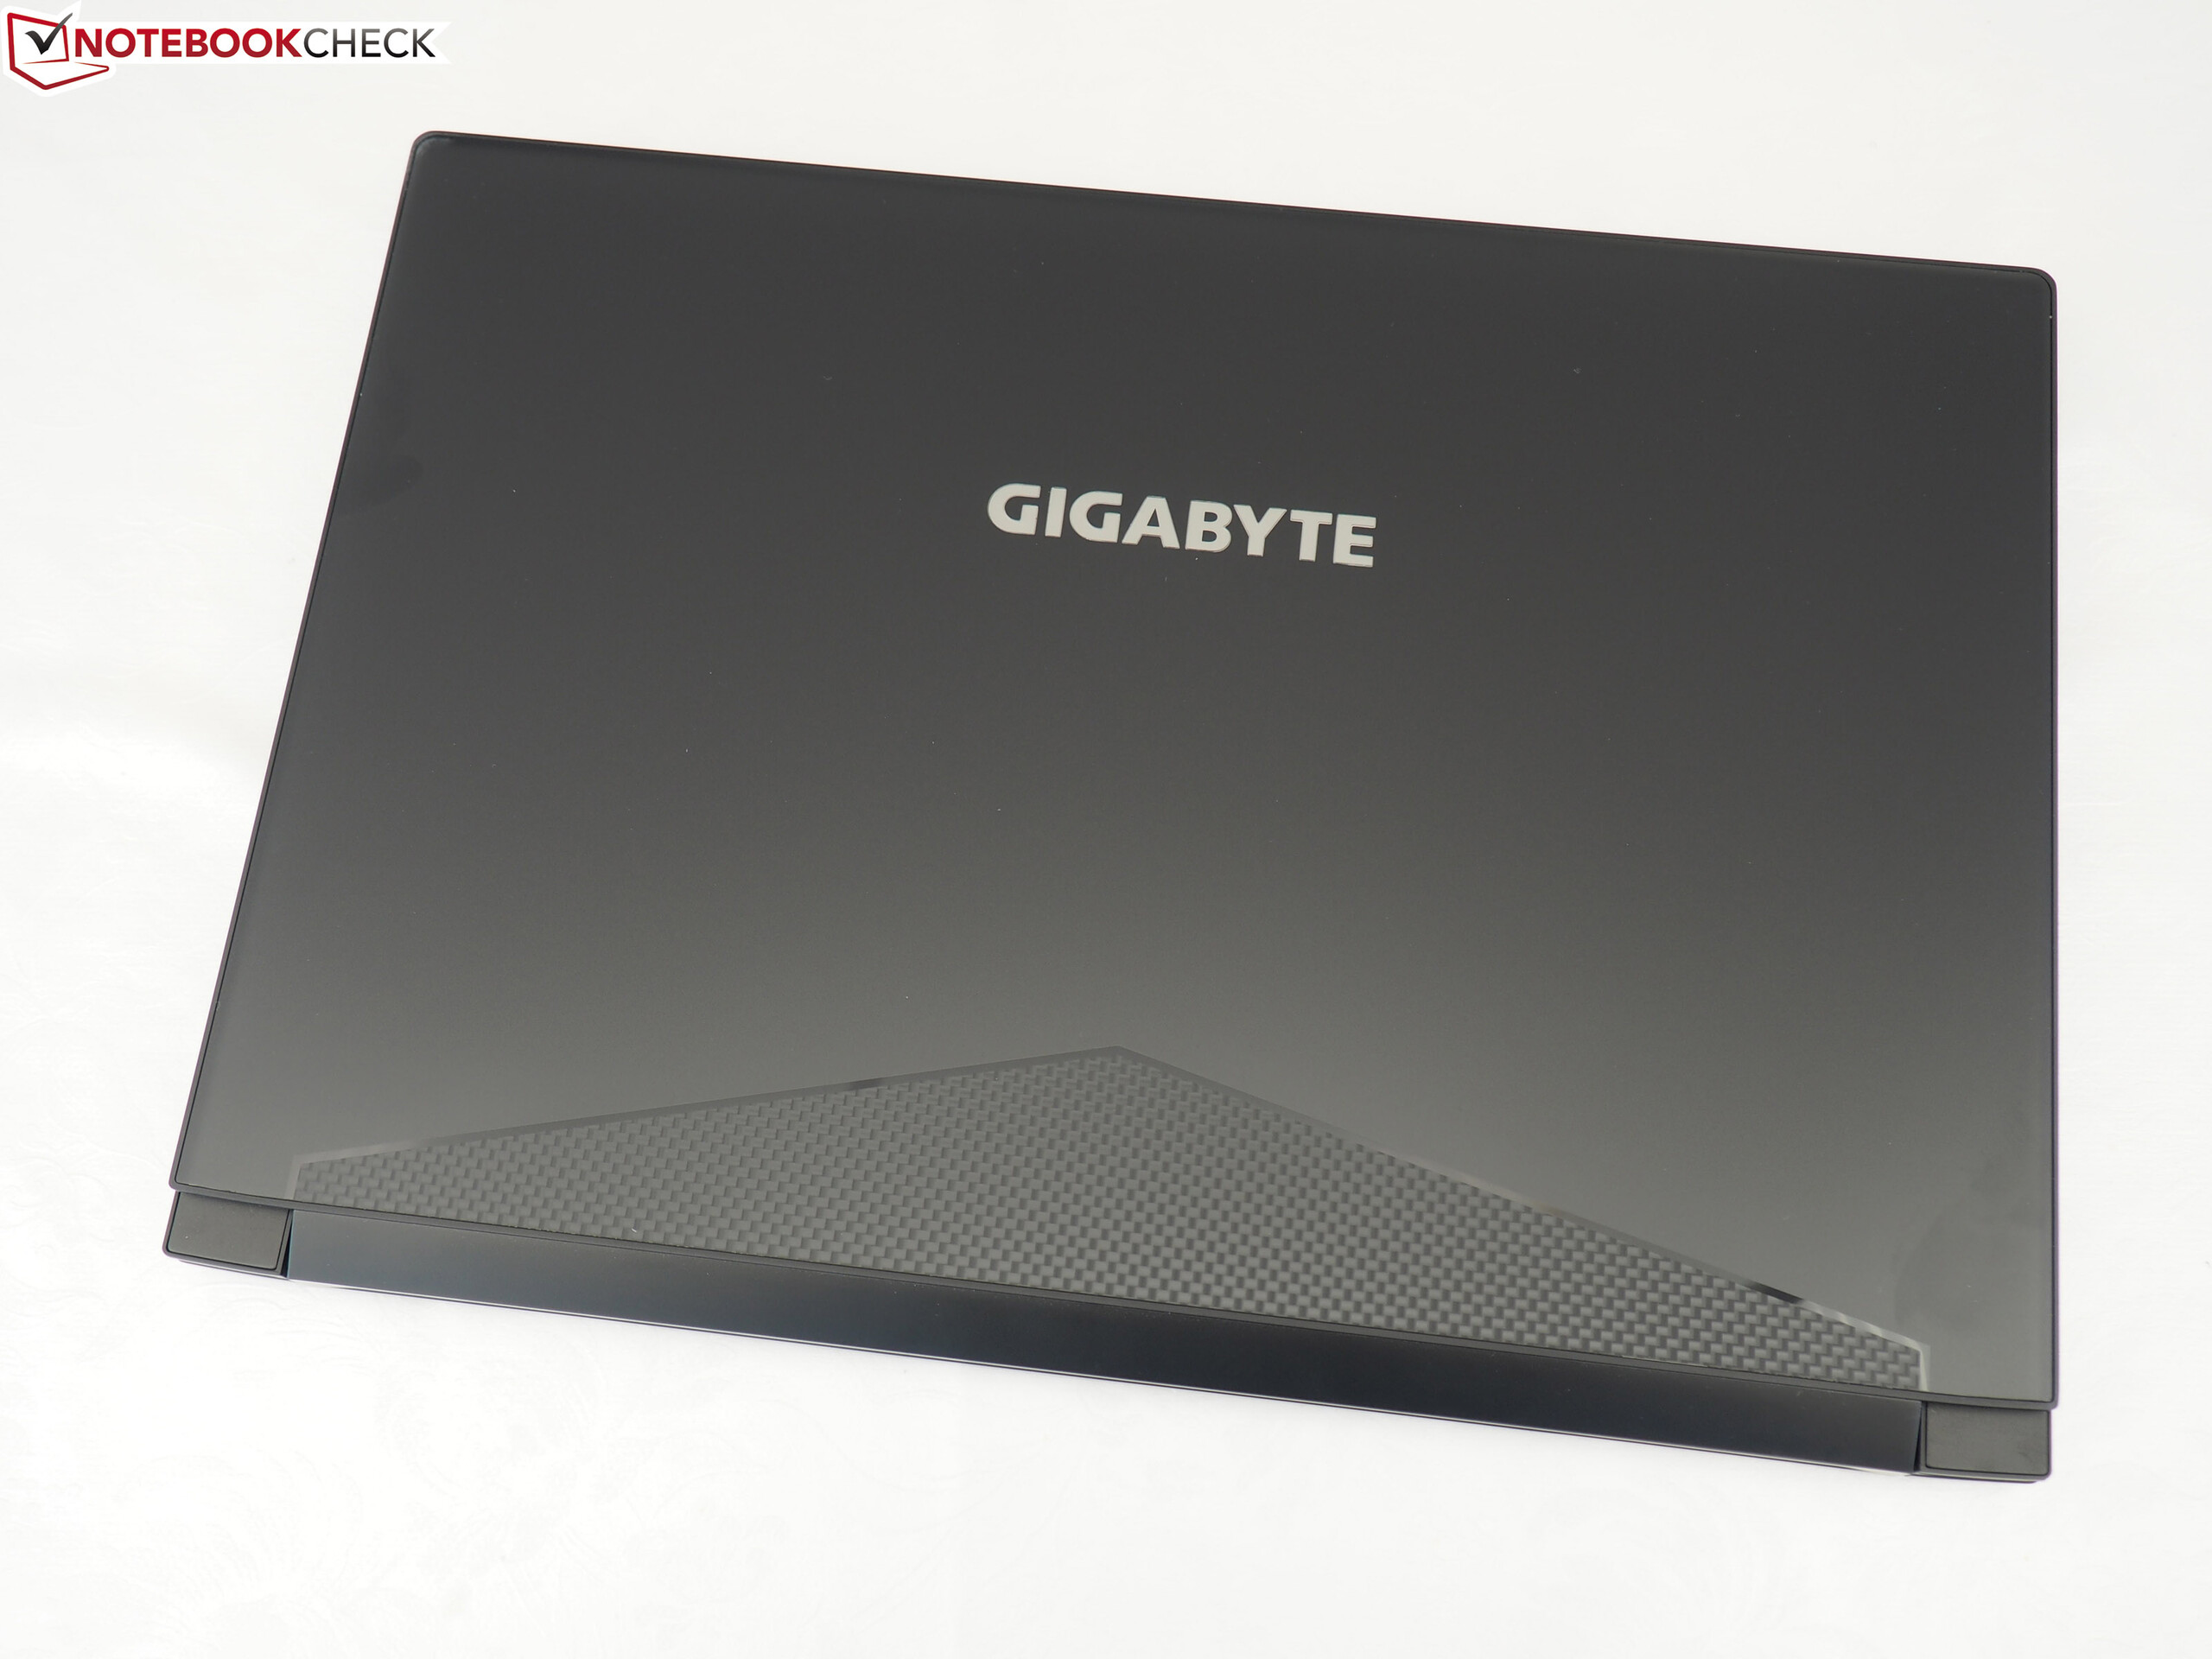
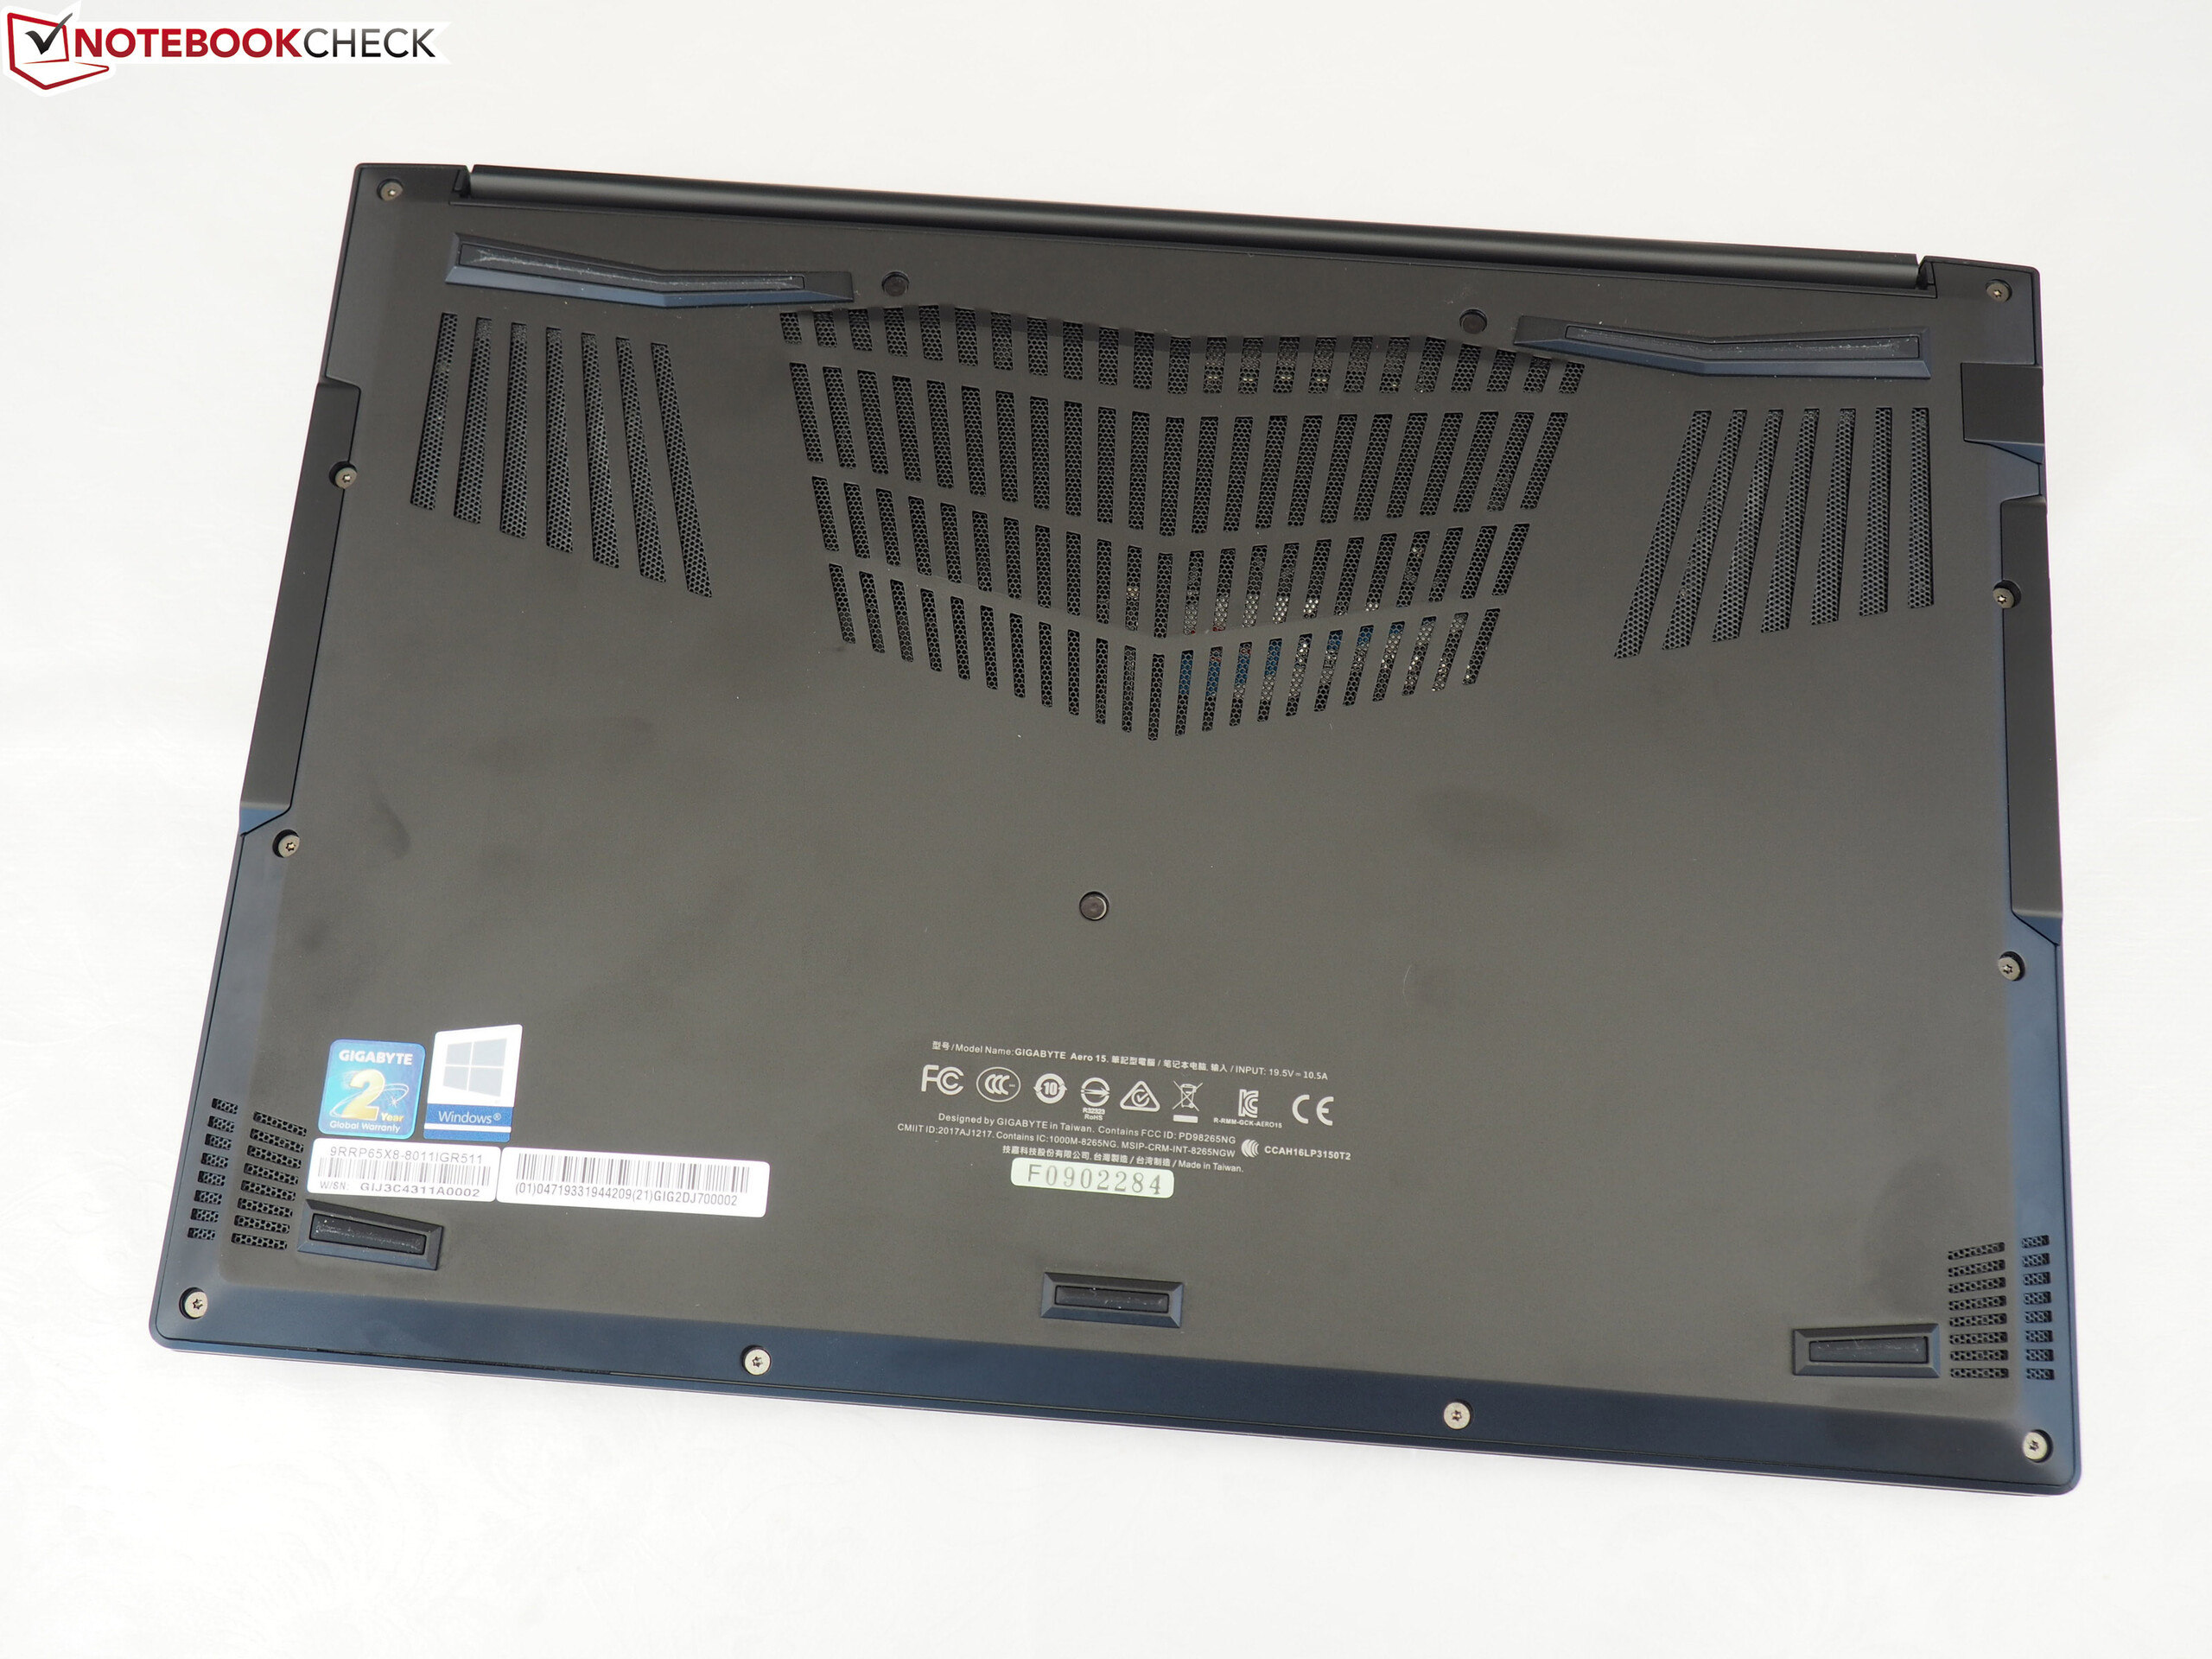
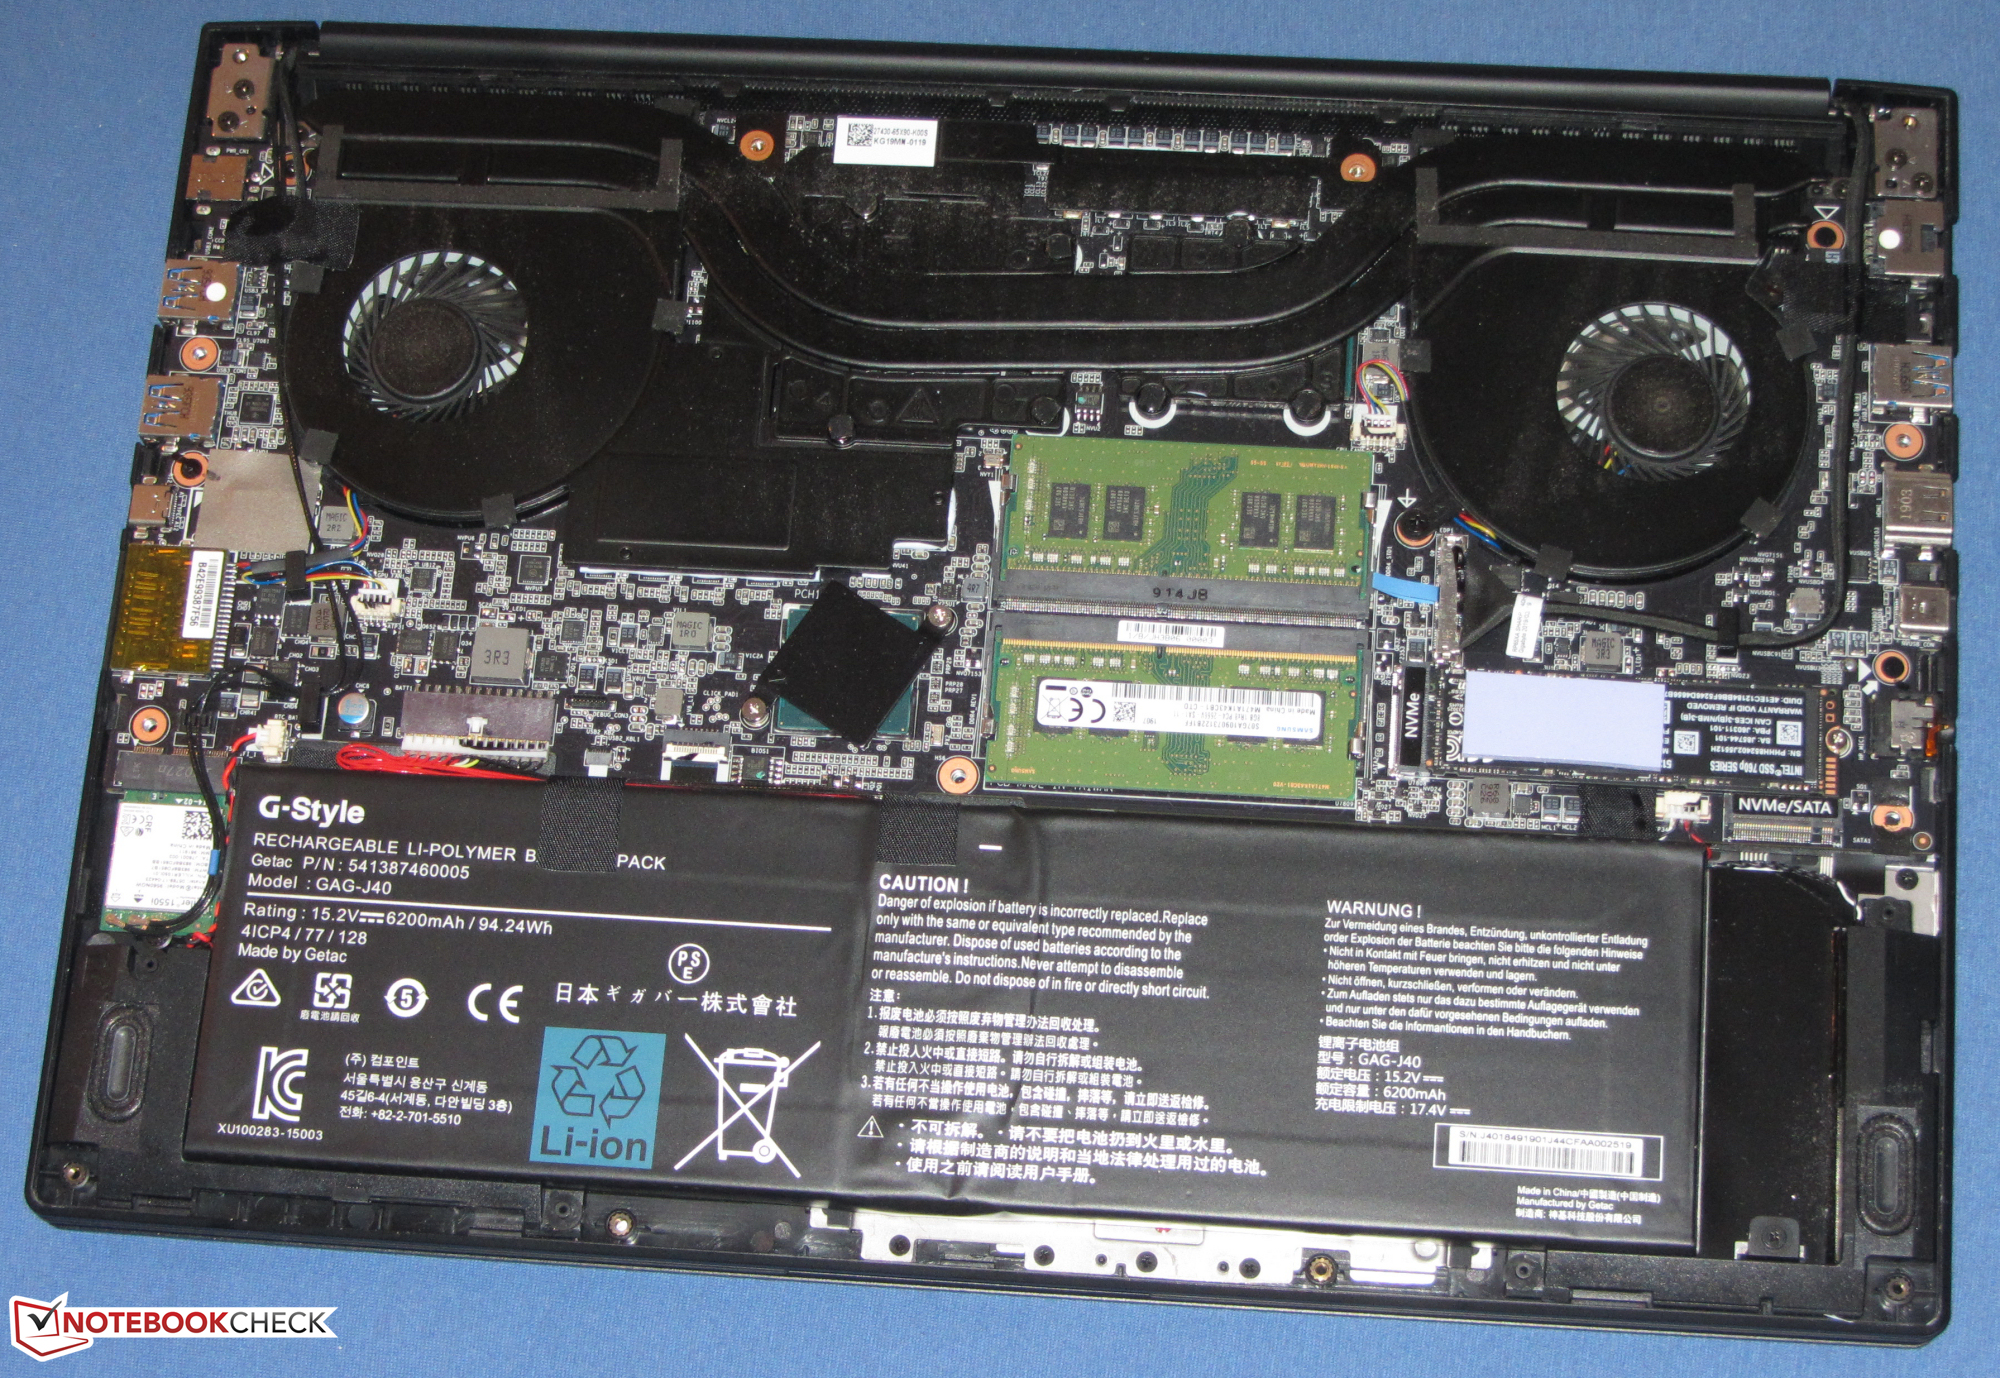
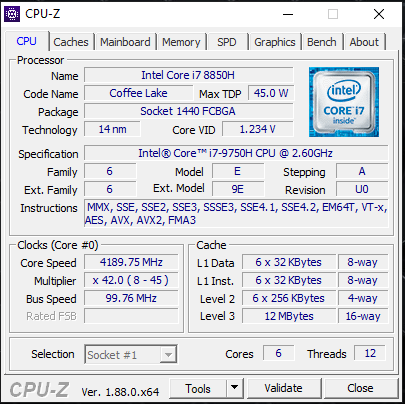
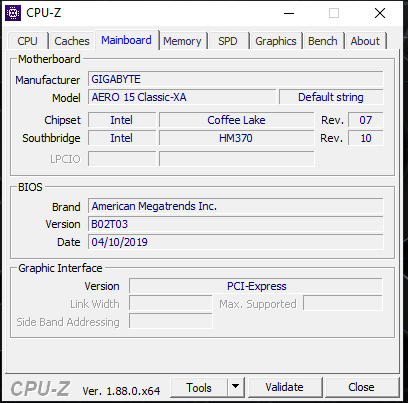
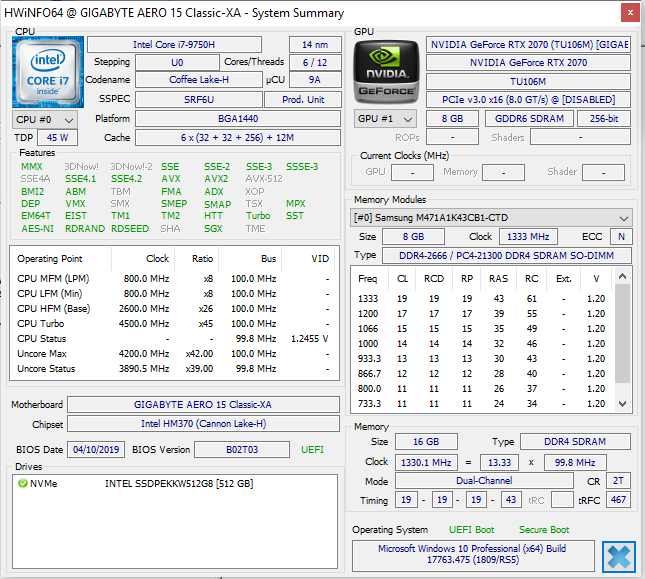
Att döma av ytan har Aero 15 Classic inte förändrats jämfört med sin föregångare Aero 15-X9. De riktiga förändringarna är på insidan: Den är utrustad med en splitter ny sexkärnig Core i7-9750H, efterföljaren till Core i7-8750H.
Nya Core i7-9750H ger inga egentliga fördelar.
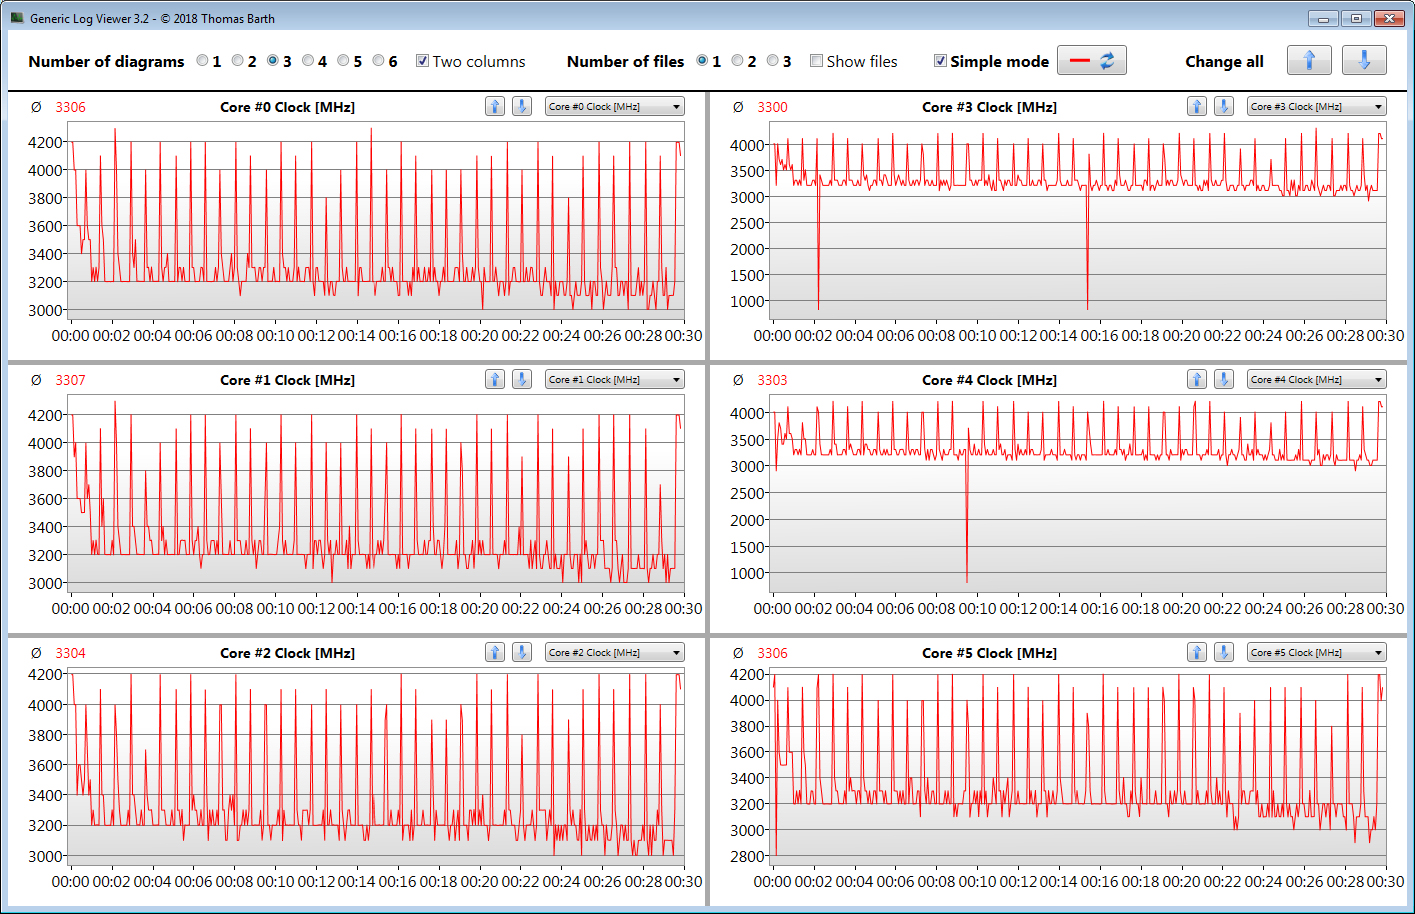
Den kan inte riktigt utnyttja den lite större mängden arbetsminne och resultaten är oftast på samma nivå som en i7-8750H. Dessutom minskar prestandan kontinuerligt vid hållande belastning, vilket vi noterade i vår CineBench R15-loop. Vi utgår från att kylsystemet och processorn inte passar ihop särskilt väl.
Men trots det lyckas kombinationen av en Core i7-9750H och ett GeForce RTX 2070 Max-Q visa alla aktuella spel smidigt på den matta Full HD-skärmen. Det går att spela spel på höga eller maximala inställningar. Den snabba NVMe SSD-enheten gör systemet smidigt och enheten har dessutom en ledig plats för en extra M.2 2280 SSD.
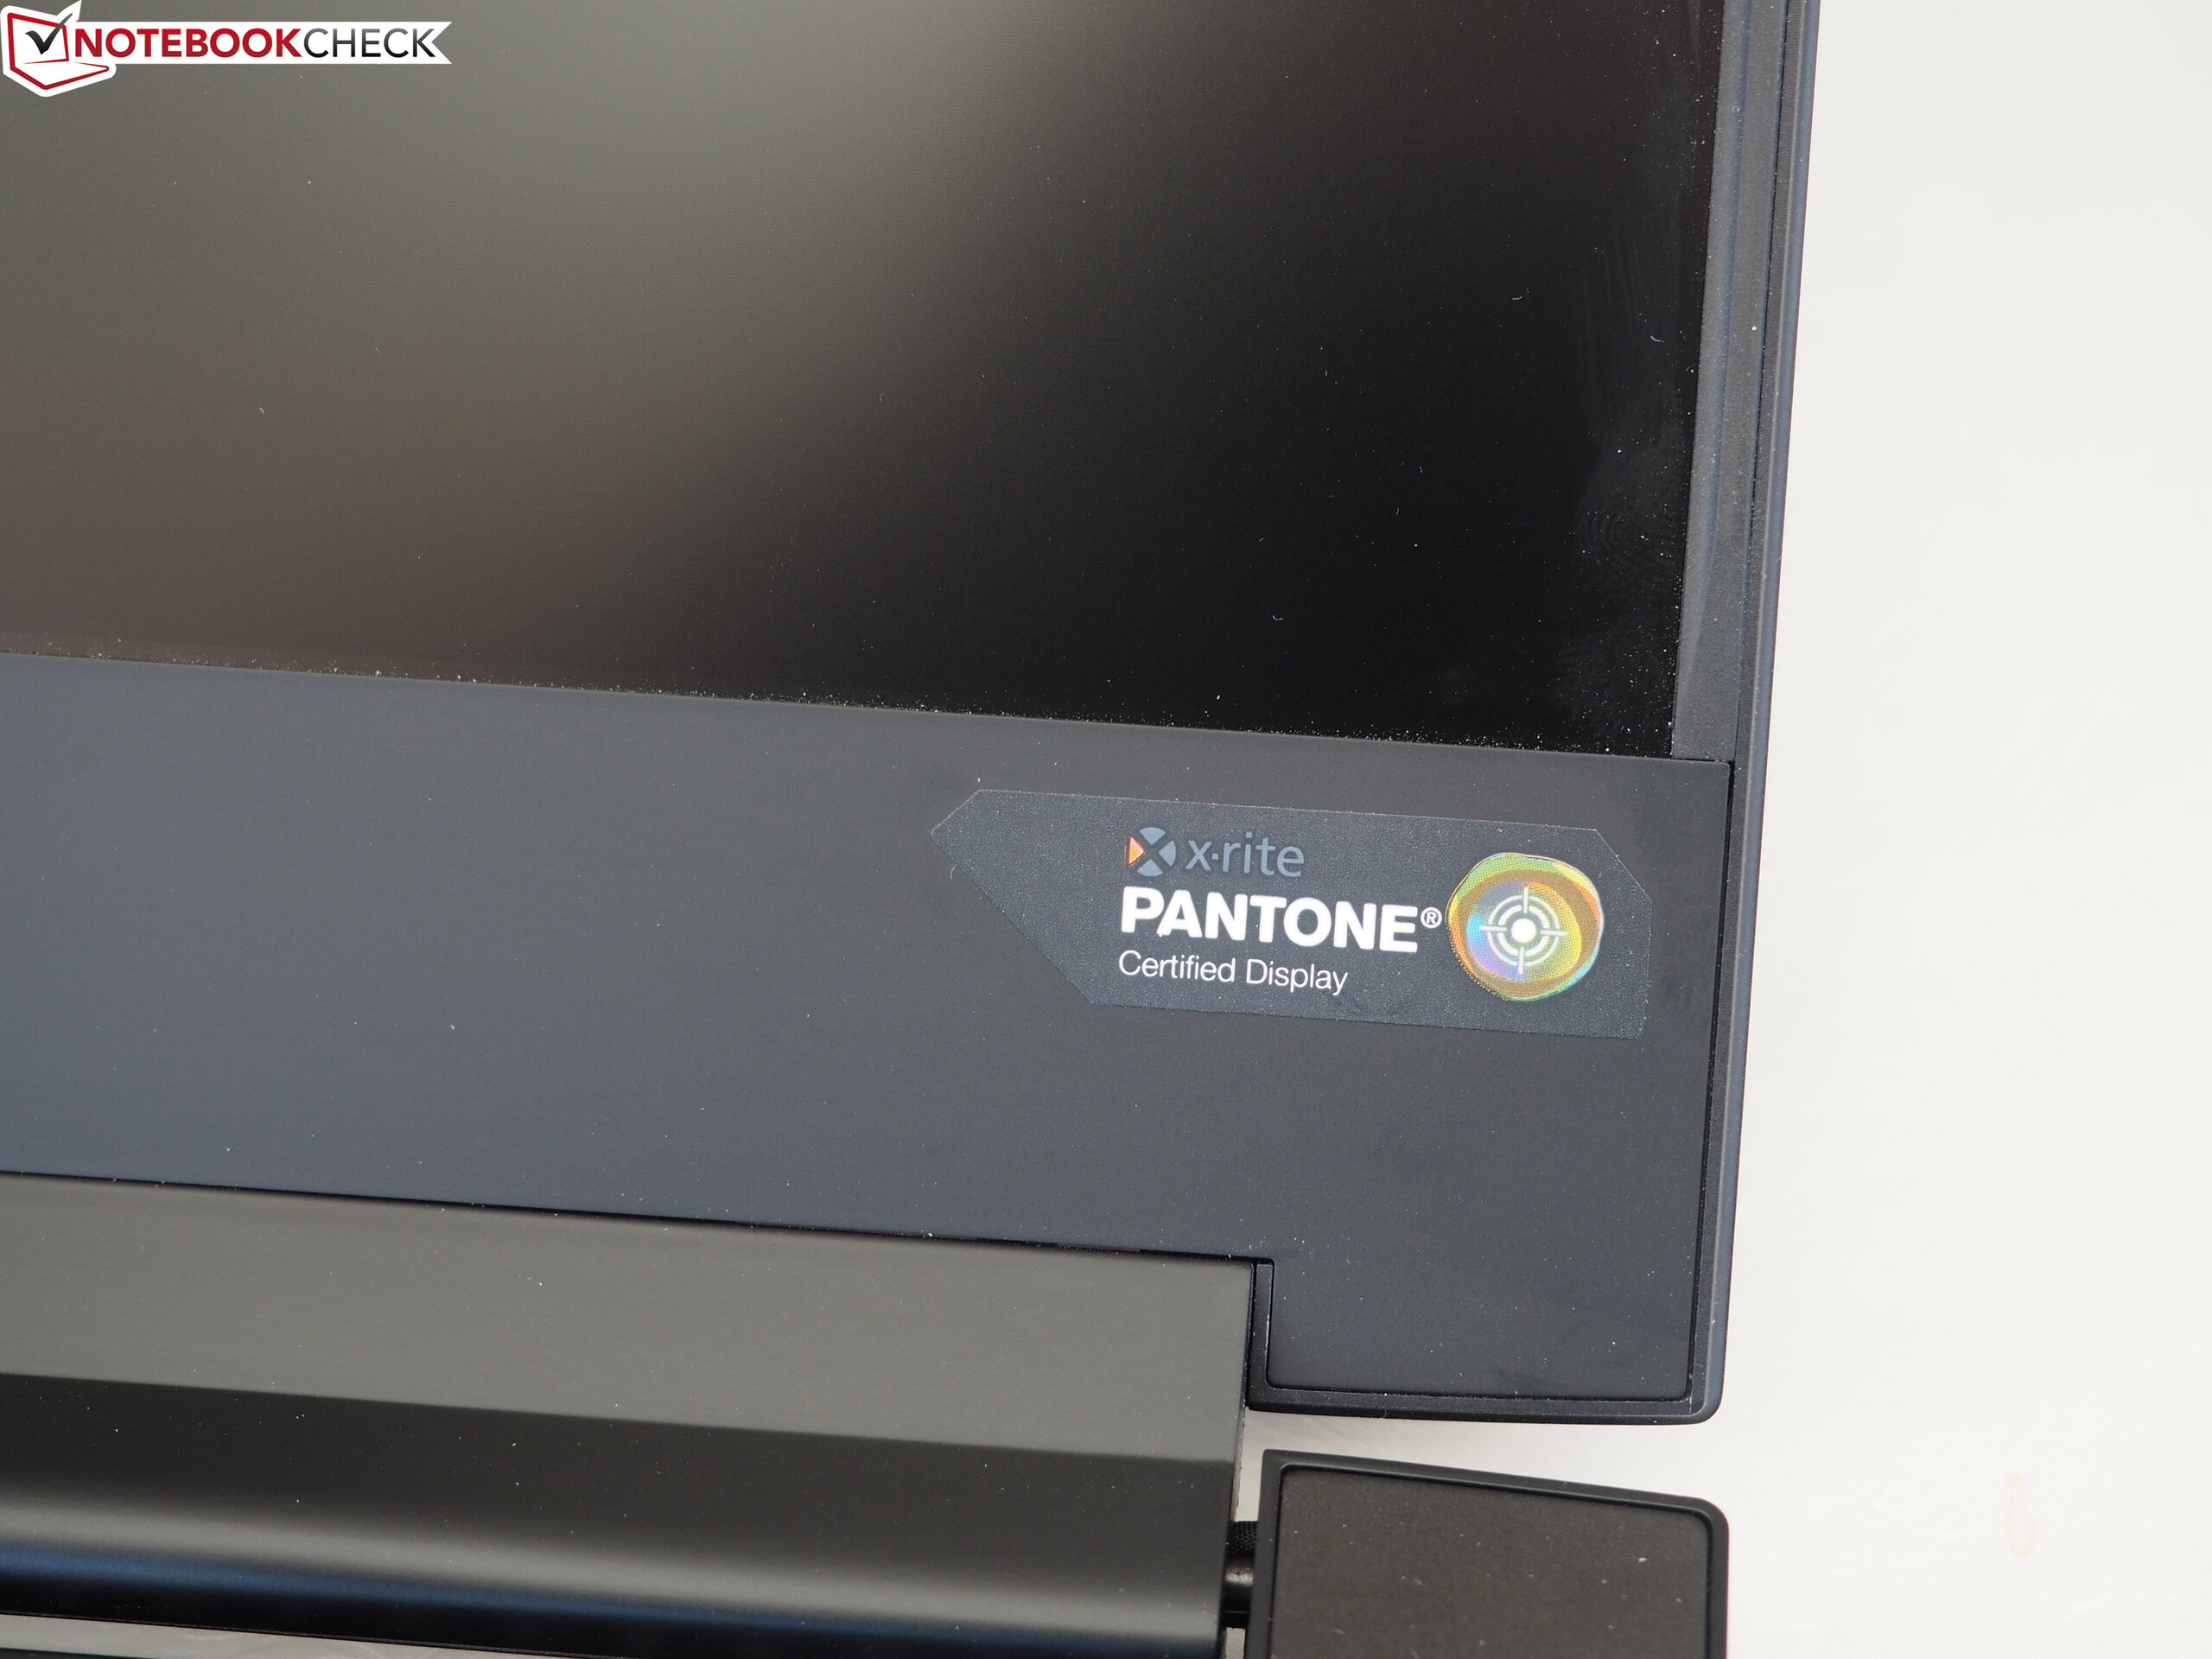
Den andra saken som ändrats på Aero 15 Classic är skärmen. Medans Aero 15-X9 var utrustad med en IPS-skärm med 144 Hz bilduppdatering så har Gigabyte gett Aero 15 Classic en IGZO-skärm med 240 Hz bilduppdatering, tillverkad av Sharp. Den nya skärmen har stabila betraktningsvinklar, korta responstider och, förstås, utmärkta färger. Ljusstyrkan och kontrastförhållandet gjorde oss dock besvikna. Båda var för låga med tanke på enhetens prisnivå. Batteritiden är utmärkt för en spellaptop.
Gigabyte Aero 15 Classic-XA
- 05/14/2020 v7 (old)
Sascha Mölck
Price comparison
