Test: Schenker Key 16 (Clevo P960EN-K) - En tunn laptop som övertygar med mycket datorkraft
| SD Card Reader | |
| average JPG Copy Test (av. of 3 runs) | |
| Gigabyte Aero 15-X9 (Toshiba Exceria Pro SDXC 64 GB UHS-II) | |
| Schenker Key 16 (Toshiba Exceria Pro SDXC 64 GB UHS-II) | |
| Schenker Key 15 Coffee Lake (Toshiba Exceria Pro SDXC 64 GB UHS-II) | |
| Genomsnitt av klass Gaming (20.9 - 210, n=54, senaste 2 åren) | |
| HP Omen 15-dc1303ng (Toshiba Exceria Pro SDXC 64 GB UHS-II) | |
| maximum AS SSD Seq Read Test (1GB) | |
| Gigabyte Aero 15-X9 (Toshiba Exceria Pro SDXC 64 GB UHS-II) | |
| Schenker Key 16 (Toshiba Exceria Pro SDXC 64 GB UHS-II) | |
| Schenker Key 15 Coffee Lake (Toshiba Exceria Pro SDXC 64 GB UHS-II) | |
| Genomsnitt av klass Gaming (25.5 - 261, n=51, senaste 2 åren) | |
| HP Omen 15-dc1303ng (Toshiba Exceria Pro SDXC 64 GB UHS-II) | |
| |||||||||||||||||||||||||
Distribution av ljusstyrkan: 88 %
Mitt på batteriet: 296 cd/m²
Kontrast: 1138:1 (Svärta: 0.26 cd/m²)
ΔE ColorChecker Calman: 2.24 | ∀{0.5-29.43 Ø4.72}
calibrated: 0.72
ΔE Greyscale Calman: 2.76 | ∀{0.09-98 Ø4.97}
99% sRGB (Argyll 1.6.3 3D)
60% AdobeRGB 1998 (Argyll 1.6.3 3D)
65.9% AdobeRGB 1998 (Argyll 3D)
94.9% sRGB (Argyll 3D)
63.8% Display P3 (Argyll 3D)
Gamma: 2.52
CCT: 6830 K
| Schenker Key 16 Chi Mei N161HCA-GA1 (CMN1602), IPS, 1920x1080, 16.1" | MSI GS65 Stealth 9SG Sharp LQ156M1JW03 (SHP14C5), IPS, 1920x1080, 15.6" | Acer Predator Triton 500 AU Optronics B156HAN08.2 (AUO82ED), IPS, 1920x1080, 15.6" | HP Omen 15-dc1303ng LG Philips LGD05C0, IPS, 1920x1080, 15.6" | Alienware m15 P79F Samsung SDCA029, 156WR04, OLED, 3840x2160, 15.6" | Razer Blade 15 RTX 2080 Max-Q Sharp LQ156M1JW03 (SHP14C5), IPS, 1920x1080, 15.6" | Gigabyte Aero 15-X9 LGD05C0, IPS, 1920x1080, 15.6" | |
|---|---|---|---|---|---|---|---|
| Display | 5% | -0% | -1% | 38% | 4% | -1% | |
| Display P3 Coverage (%) | 63.8 | 67.6 6% | 64.2 1% | 63.8 0% | 99.9 57% | 66.9 5% | 63.5 0% |
| sRGB Coverage (%) | 94.9 | 97.5 3% | 92.6 -2% | 93.4 -2% | 100 5% | 98.1 3% | 93.1 -2% |
| AdobeRGB 1998 Coverage (%) | 65.9 | 68.9 5% | 65.7 0% | 65 -1% | 100 52% | 68.5 4% | 64.5 -2% |
| Response Times | 5% | 24% | 8% | 82% | 15% | -11% | |
| Response Time Grey 50% / Grey 80% * (ms) | 18 ? | 13.6 ? 24% | 8 ? 56% | 14 ? 22% | 2.6 ? 86% | 12.8 ? 29% | 16.4 ? 9% |
| Response Time Black / White * (ms) | 10.4 ? | 12 ? -15% | 11.2 ? -8% | 11 ? -6% | 2.3 ? 78% | 10.4 ? -0% | 13.6 ? -31% |
| PWM Frequency (Hz) | 25510 ? | 23260 ? | 60.2 ? | 23810 ? | |||
| Screen | 3% | -44% | -23% | -29% | -3% | 5% | |
| Brightness middle (cd/m²) | 296 | 282.3 -5% | 304 3% | 316 7% | 452.1 53% | 293 -1% | 250 -16% |
| Brightness (cd/m²) | 271 | 269 -1% | 299 10% | 295 9% | 452 67% | 270 0% | 235 -13% |
| Brightness Distribution (%) | 88 | 90 2% | 89 1% | 84 -5% | 90 2% | 87 -1% | 85 -3% |
| Black Level * (cd/m²) | 0.26 | 0.32 -23% | 0.27 -4% | 0.42 -62% | 0.29 -12% | 0.29 -12% | |
| Contrast (:1) | 1138 | 882 -22% | 1126 -1% | 752 -34% | 1010 -11% | 862 -24% | |
| Colorchecker dE 2000 * | 2.24 | 1.17 48% | 4.66 -108% | 2.7 -21% | 6.34 -183% | 1.69 25% | 1.46 35% |
| Colorchecker dE 2000 max. * | 4.04 | 3.29 19% | 9.65 -139% | 5.65 -40% | 12.97 -221% | 3.37 17% | 2.47 39% |
| Colorchecker dE 2000 calibrated * | 0.72 | 1.06 -47% | 1.72 -139% | 1.58 -119% | 1.24 -72% | ||
| Greyscale dE 2000 * | 2.76 | 1.3 53% | 5.53 -100% | 2.35 15% | 2.8 -1% | 2.3 17% | 1.27 54% |
| Gamma | 2.52 87% | 2.2 100% | 2.5 88% | 2.41 91% | 2.21 100% | 2.3 96% | 2.4 92% |
| CCT | 6830 95% | 6643 98% | 8028 81% | 6904 94% | 6114 106% | 6758 96% | 6749 96% |
| Color Space (Percent of AdobeRGB 1998) (%) | 60 | 63.8 6% | 60 0% | 60 0% | 91 52% | 63 5% | 60 0% |
| Color Space (Percent of sRGB) (%) | 99 | 97.5 -2% | 93 -6% | 93 -6% | 100 1% | 98.5 -1% | 93 -6% |
| Totalt genomsnitt (program/inställningar) | 4% /
3% | -7% /
-27% | -5% /
-15% | 30% /
4% | 5% /
0% | -2% /
2% |
* ... mindre är bättre
Visa svarstider
| ↔ Svarstid svart till vitt | ||
|---|---|---|
| 10.4 ms ... stiga ↗ och falla ↘ kombinerat | ↗ 6 ms stiga | 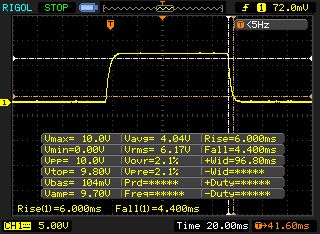 |
| ↘ 4.4 ms hösten | ||
| Skärmen visar bra svarsfrekvens i våra tester, men kan vara för långsam för konkurrenskraftiga spelare. I jämförelse sträcker sig alla testade enheter från 0.1 (minst) till 240 (maximalt) ms. » 28 % av alla enheter är bättre. Det betyder att den uppmätta svarstiden är bättre än genomsnittet av alla testade enheter (19.8 ms). | ||
| ↔ Svarstid 50 % grått till 80 % grått | ||
| 18 ms ... stiga ↗ och falla ↘ kombinerat | ↗ 8.8 ms stiga | 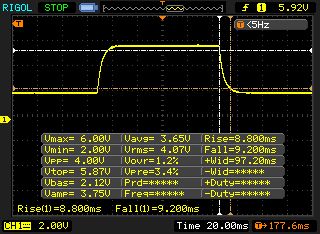 |
| ↘ 9.2 ms hösten | ||
| Skärmen visar bra svarsfrekvens i våra tester, men kan vara för långsam för konkurrenskraftiga spelare. I jämförelse sträcker sig alla testade enheter från 0.165 (minst) till 636 (maximalt) ms. » 32 % av alla enheter är bättre. Det betyder att den uppmätta svarstiden är bättre än genomsnittet av alla testade enheter (31 ms). | ||
Skärmflimmer / PWM (Puls-Width Modulation)
| Skärmflimmer / PWM upptäckt | 25510 Hz | ≤ 20 % ljusstyrka inställning | 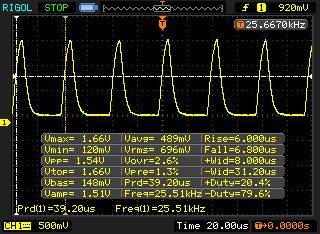 |
Displayens bakgrundsbelysning flimrar vid 25510 Hz (i värsta fall, t.ex. med PWM) Flimrande upptäckt vid en ljusstyrkeinställning på 20 % och lägre. Det ska inte finnas något flimmer eller PWM över denna ljusstyrkeinställning. Frekvensen för 25510 Hz är ganska hög, så de flesta användare som är känsliga för PWM bör inte märka något flimmer. Som jämförelse: 52 % av alla testade enheter använder inte PWM för att dämpa skärmen. Om PWM upptäcktes mättes ett medelvärde av 7772 (minst: 5 - maximum: 343500) Hz. | |||
| Cinebench R10 | |
| Rendering Single 32Bit | |
| Genomsnitt av klass Gaming (7457 - 11779, n=8, senaste 2 åren) | |
| Schenker Key 16 | |
| Gigabyte Aero 15-X9 | |
| Rendering Multiple CPUs 32Bit | |
| Genomsnitt av klass Gaming (42932 - 81339, n=8, senaste 2 åren) | |
| Gigabyte Aero 15-X9 | |
| Schenker Key 16 | |
| Cinebench R20 | |
| CPU (Single Core) | |
| Genomsnitt av klass Gaming (442 - 895, n=110, senaste 2 åren) | |
| Schenker Key 16 | |
| CPU (Multi Core) | |
| Genomsnitt av klass Gaming (4029 - 16108, n=110, senaste 2 åren) | |
| Schenker Key 16 | |
| Geekbench 3 | |
| 32 Bit Multi-Core Score | |
| Schenker Key 16 | |
| Gigabyte Aero 15-X9 | |
| 32 Bit Single-Core Score | |
| Schenker Key 16 | |
| Gigabyte Aero 15-X9 | |
| Geekbench 4.4 | |
| 64 Bit Multi-Core Score | |
| Genomsnitt av klass Gaming (89200 - 97490, n=2, senaste 2 åren) | |
| Schenker Key 16 | |
| Gigabyte Aero 15-X9 | |
| 64 Bit Single-Core Score | |
| Genomsnitt av klass Gaming (9335 - 9492, n=2, senaste 2 åren) | |
| Schenker Key 16 | |
| Gigabyte Aero 15-X9 | |
| Mozilla Kraken 1.1 - Total | |
| Gigabyte Aero 15-X9 (Edge 44) | |
| MSI GS65 Stealth 9SG (Edge 44.17763.1.0) | |
| Alienware m15 P79F | |
| Schenker Key 16 (Edge 44) | |
| Razer Blade 15 RTX 2080 Max-Q (Edge 44.17763.1.0) | |
| HP Omen 15-dc1303ng | |
| Genomsnitt av klass Gaming (391 - 590, n=106, senaste 2 åren) | |
| Octane V2 - Total Score | |
| Genomsnitt av klass Gaming (89353 - 139447, n=28, senaste 2 åren) | |
| HP Omen 15-dc1303ng | |
| Razer Blade 15 RTX 2080 Max-Q (Edge 44.17763.1.0) | |
| Schenker Key 16 (Edge 44) | |
| MSI GS65 Stealth 9SG (Edge 44.17763.1.0) | |
| Alienware m15 P79F (Edge 44.17763.1.0) | |
| Gigabyte Aero 15-X9 (Edge 44) | |
| JetStream 1.1 - 1.1 Total | |
| Genomsnitt av klass Gaming (549 - 647, n=3, senaste 2 åren) | |
| Razer Blade 15 RTX 2080 Max-Q (Edge 44.17763.1.0) | |
| Schenker Key 16 (Edge 44) | |
| MSI GS65 Stealth 9SG (Edge 44.17763.1.0) | |
| Gigabyte Aero 15-X9 (Edge 44) | |
| Alienware m15 P79F (Edge 44.17763.1.0) | |
| HP Omen 15-dc1303ng | |
* ... mindre är bättre
| PCMark 7 Score | 6701 poäng | |
| PCMark 8 Home Score Accelerated v2 | 4277 poäng | |
| PCMark 8 Creative Score Accelerated v2 | 4037 poäng | |
| PCMark 8 Work Score Accelerated v2 | 5617 poäng | |
| PCMark 10 Score | 5694 poäng | |
Hjälp | ||

| Schenker Key 16 Samsung SSD 970 EVO Plus 1TB | MSI GS65 Stealth 9SG Samsung SSD PM981 MZVLB512HAJQ | Acer Predator Triton 500 2x WDC PC SN720 SDAPNTW-256G-1014 (RAID 0) | HP Omen 15-dc1303ng Samsung SSD PM981 MZVLB256HAHQ | Alienware m15 P79F Toshiba XG5 KXG50ZNV512G | Razer Blade 15 RTX 2080 Max-Q Samsung SSD PM981 MZVLB512HAJQ | Gigabyte Aero 15-X9 Intel SSD 760p SSDPEKKW010T8 | |
|---|---|---|---|---|---|---|---|
| CrystalDiskMark 5.2 / 6 | -7% | -2% | -15% | 6% | 4% | -14% | |
| Write 4K (MB/s) | 112.5 | 91.3 -19% | 93.6 -17% | 50.2 -55% | 148.4 32% | 137.2 22% | 97.1 -14% |
| Read 4K (MB/s) | 43.79 | 40.73 -7% | 38.82 -11% | 35.32 -19% | 49.65 13% | 46.82 7% | 53.7 23% |
| Write Seq (MB/s) | 1944 | 1915 -1% | 2455 26% | 991 -49% | 1139 -41% | 1221 -37% | 1526 -22% |
| Read Seq (MB/s) | 1656 | 2051 24% | 2107 27% | 1526 -8% | 2353 42% | 1217 -27% | 2020 22% |
| Write 4K Q32T1 (MB/s) | 324.6 | 308.3 -5% | 298.7 -8% | 445.1 37% | 484.7 49% | 527 62% | 285.6 -12% |
| Read 4K Q32T1 (MB/s) | 407 | 417.4 3% | 338.7 -17% | 526 29% | 542 33% | 614 51% | 321.8 -21% |
| Write Seq Q32T1 (MB/s) | 3296 | 1922 -42% | 2902 -12% | 1647 -50% | 1139 -65% | 1986 -40% | 1533 -53% |
| Read Seq Q32T1 (MB/s) | 3555 | 3395 -5% | 3536 -1% | 3427 -4% | 3108 -13% | 3234 -9% | 2351 -34% |
| 3DMark 06 Standard Score | 36601 poäng | |
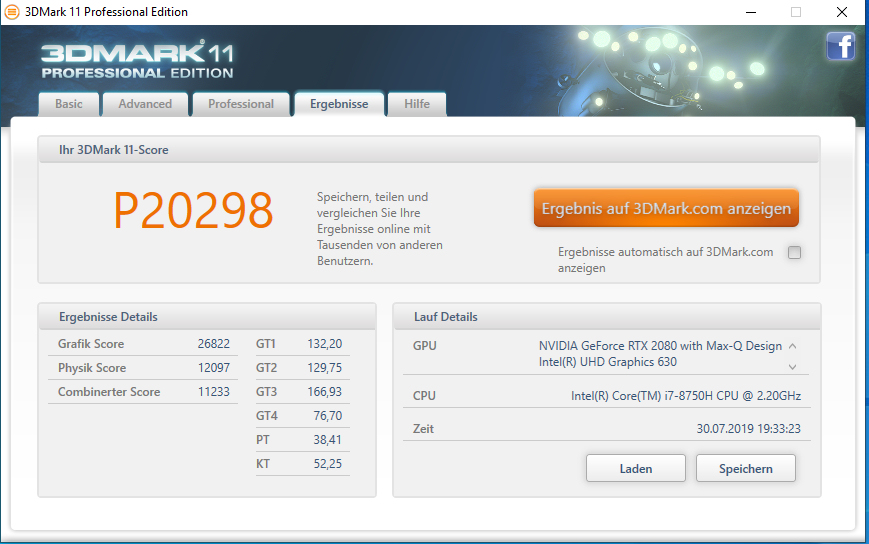
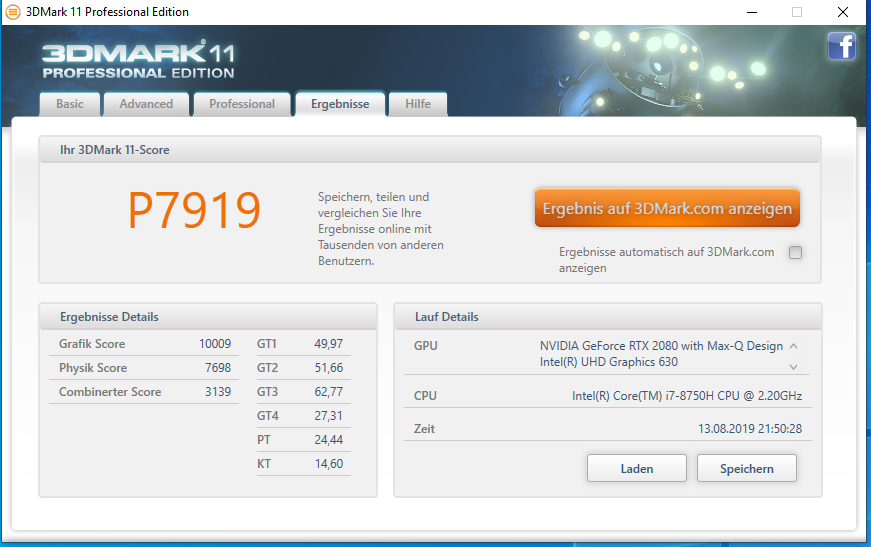
| 3DMark 11 Performance | 20298 poäng | |
| 3DMark Ice Storm Standard Score | 116851 poäng | |
| 3DMark Cloud Gate Standard Score | 34938 poäng | |
| 3DMark Fire Strike Score | 17301 poäng | |
| 3DMark Time Spy Score | 7484 poäng | |
Hjälp | ||
| The Witcher 3 - 1920x1080 Ultra Graphics & Postprocessing (HBAO+) | |
| Genomsnitt av klass Gaming (95 - 240, n=8, senaste 2 åren) | |
| Razer Blade 15 RTX 2080 Max-Q | |
| Schenker Key 16 | |
| Acer Predator Triton 500 | |
| MSI GS65 Stealth 9SG | |
| Alienware m15 P79F | |
| Gigabyte Aero 15-X9 | |
| BioShock Infinite - 1920x1080 Ultra Preset, DX11 (DDOF) | |
| Razer Blade 15 RTX 2080 Max-Q | |
| Schenker Key 16 | |
| MSI GS65 Stealth 9SG | |
| Alienware m15 P79F | |
| Gigabyte Aero 15-X9 | |
| HP Omen 15-dc1303ng | |
| Far Cry New Dawn - 1920x1080 Ultra Preset | |
| Schenker Key 16 | |
| Rage 2 - 1920x1080 Ultra Preset (Resolution Scale Off) | |
| Schenker Key 16 | |
| For Honor - 1920x1080 Extreme Preset AA:T AF:16x | |
| Schenker Key 16 | |
| X-Plane 11.11 - 1920x1080 high (fps_test=3) | |
| Genomsnitt av klass Gaming (52.1 - 143.5, n=114, senaste 2 åren) | |
| Schenker Key 16 | |
| Gigabyte Aero 15-X9 | |

| låg | med. | hög | ultra | |
|---|---|---|---|---|
| BioShock Infinite (2013) | 297.6 | 268 | 255.1 | 165.7 |
| The Witcher 3 (2015) | 294.7 | 236.6 | 146.6 | 77.4 |
| For Honor (2017) | 267.2 | 165.2 | 156.5 | 123.4 |
| Final Fantasy XV Benchmark (2018) | 125.2 | 100.1 | 75.9 | |
| X-Plane 11.11 (2018) | 101.9 | 89.2 | 74.8 | |
| Far Cry 5 (2018) | 122 | 103 | 97 | 93 |
| Far Cry New Dawn (2019) | 110 | 95 | 90 | 81 |
| Rage 2 (2019) | 204.2 | 111 | 93.5 | 91.9 |
| Total War: Three Kingdoms (2019) | 224.8 | 126.1 | 88.8 | 65.5 |
| F1 2019 (2019) | 188 | 165 | 137 | 114 |
Ljudnivå
| Låg belastning |
| 30 / 31 / 34 dB(A) |
| Hög belastning |
| 47 / 49 dB(A) |
 | ||
30 dB tyst 40 dB(A) hörbar 50 dB(A) högt ljud |
||
min: | ||
| Schenker Key 16 i7-8750H, GeForce RTX 2080 Max-Q | MSI GS65 Stealth 9SG i7-9750H, GeForce RTX 2080 Max-Q | Acer Predator Triton 500 i7-8750H, GeForce RTX 2080 Max-Q | HP Omen 15-dc1303ng i7-8750H, GeForce RTX 2070 Max-Q | Alienware m15 P79F i7-8750H, GeForce RTX 2070 Max-Q | Razer Blade 15 RTX 2080 Max-Q i7-9750H, GeForce RTX 2080 Max-Q | Gigabyte Aero 15-X9 i7-8750H, GeForce RTX 2070 Max-Q | Genomsnitt av klass Gaming | |
|---|---|---|---|---|---|---|---|---|
| Noise | 4% | 2% | 0% | -10% | 11% | -0% | 10% | |
| av / miljö * (dB) | 30 | 28.3 6% | 29 3% | 30.5 -2% | 28.2 6% | 28.3 6% | 30 -0% | 24.1 ? 20% |
| Idle Minimum * (dB) | 30 | 30.4 -1% | 30 -0% | 32.8 -9% | 30.3 -1% | 28.8 4% | 32 -7% | 25.9 ? 14% |
| Idle Average * (dB) | 31 | 30.5 2% | 32 -3% | 32.8 -6% | 35.4 -14% | 28.8 7% | 34 -10% | 27.4 ? 12% |
| Idle Maximum * (dB) | 34 | 30.6 10% | 34 -0% | 32.8 4% | 50.3 -48% | 29 15% | 36 -6% | 29.9 ? 12% |
| Load Average * (dB) | 47 | 37.6 20% | 44 6% | 42.5 10% | 50.3 -7% | 33.5 29% | 42 11% | 43 ? 9% |
| Witcher 3 ultra * (dB) | 48 | 46 4% | 46 4% | 50.2 -5% | 45 6% | 44 8% | ||
| Load Maximum * (dB) | 49 | 55.1 -12% | 47 4% | 47.5 3% | 50.2 -2% | 45.2 8% | 48 2% | 54.1 ? -10% |
* ... mindre är bättre
(-) Den maximala temperaturen på ovansidan är 51 °C / 124 F, jämfört med genomsnittet av 40.4 °C / 105 F , allt från 21.2 till 68.8 °C för klassen Gaming.
(-) Botten värms upp till maximalt 59 °C / 138 F, jämfört med genomsnittet av 43.2 °C / 110 F
(+) Vid tomgångsbruk är medeltemperaturen för ovansidan 30.4 °C / 87 F, jämfört med enhetsgenomsnittet på 33.9 °C / ### class_avg_f### F.
(-) När du spelar The Witcher 3 är medeltemperaturen för ovansidan 43.9 °C / 111 F, jämfört med enhetsgenomsnittet på 33.9 °C / ## #class_avg_f### F.
(-) Handledsstöden och pekplattan kan bli väldigt varma vid beröring med maximalt 44 °C / 111.2 F.
(-) Medeltemperaturen för handledsstödsområdet på liknande enheter var 28.8 °C / 83.8 F (-15.2 °C / -27.4 F).
| Schenker Key 16 i7-8750H, GeForce RTX 2080 Max-Q | MSI GS65 Stealth 9SG i7-9750H, GeForce RTX 2080 Max-Q | Acer Predator Triton 500 i7-8750H, GeForce RTX 2080 Max-Q | HP Omen 15-dc1303ng i7-8750H, GeForce RTX 2070 Max-Q | Alienware m15 P79F i7-8750H, GeForce RTX 2070 Max-Q | Razer Blade 15 RTX 2080 Max-Q i7-9750H, GeForce RTX 2080 Max-Q | Gigabyte Aero 15-X9 i7-8750H, GeForce RTX 2070 Max-Q | Genomsnitt av klass Gaming | |
|---|---|---|---|---|---|---|---|---|
| Heat | 10% | 3% | -0% | -7% | 12% | 5% | 9% | |
| Maximum Upper Side * (°C) | 51 | 45.6 11% | 49 4% | 47.6 7% | 55.6 -9% | 47 8% | 56 -10% | 45.2 ? 11% |
| Maximum Bottom * (°C) | 59 | 53.8 9% | 58 2% | 59.6 -1% | 62.4 -6% | 49.2 17% | 66 -12% | 48.1 ? 18% |
| Idle Upper Side * (°C) | 32 | 28.6 11% | 33 -3% | 33.8 -6% | 36 -13% | 28.6 11% | 27 16% | 31.1 ? 3% |
| Idle Bottom * (°C) | 36 | 33.2 8% | 33 8% | 36.5 -1% | 36 -0% | 31.4 13% | 27 25% | 34.2 ? 5% |
* ... mindre är bättre
Schenker Key 16 ljudanalys
(+) | högtalare kan spela relativt högt (83 dB)
Bas 100 - 315 Hz
(-) | nästan ingen bas - i genomsnitt 35.5% lägre än medianen
(±) | linjäriteten för basen är genomsnittlig (12.3% delta till föregående frekvens)
Mellan 400 - 2000 Hz
(+) | balanserad mellan - endast 4.2% från medianen
(±) | linjäriteten för mids är genomsnittlig (9.7% delta till föregående frekvens)
Högsta 2 - 16 kHz
(+) | balanserade toppar - endast 3.2% från medianen
(+) | toppar är linjära (2.6% delta till föregående frekvens)
Totalt 100 - 16 000 Hz
(±) | linjäriteten för det totala ljudet är genomsnittlig (24.5% skillnad mot median)
Jämfört med samma klass
» 88% av alla testade enheter i den här klassen var bättre, 4% liknande, 8% sämre
» Den bästa hade ett delta på 6%, genomsnittet var 18%, sämst var 132%
Jämfört med alla testade enheter
» 74% av alla testade enheter var bättre, 6% liknande, 20% sämre
» Den bästa hade ett delta på 4%, genomsnittet var 24%, sämst var 134%
Schenker Key 15 Coffee Lake ljudanalys
(±) | högtalarljudstyrkan är genomsnittlig men bra (76 dB)
Bas 100 - 315 Hz
(-) | nästan ingen bas - i genomsnitt 26.7% lägre än medianen
(±) | linjäriteten för basen är genomsnittlig (10.8% delta till föregående frekvens)
Mellan 400 - 2000 Hz
(±) | högre mellan - i genomsnitt 5.7% högre än median
(±) | linjäriteten för mids är genomsnittlig (9.6% delta till föregående frekvens)
Högsta 2 - 16 kHz
(+) | balanserade toppar - endast 1.4% från medianen
(+) | toppar är linjära (3.8% delta till föregående frekvens)
Totalt 100 - 16 000 Hz
(±) | linjäriteten för det totala ljudet är genomsnittlig (24.6% skillnad mot median)
Jämfört med samma klass
» 89% av alla testade enheter i den här klassen var bättre, 3% liknande, 8% sämre
» Den bästa hade ett delta på 6%, genomsnittet var 18%, sämst var 132%
Jämfört med alla testade enheter
» 75% av alla testade enheter var bättre, 5% liknande, 20% sämre
» Den bästa hade ett delta på 4%, genomsnittet var 24%, sämst var 134%
| Av/Standby | |
| Låg belastning | |
| Hög belastning |
|
Förklaring:
min: | |
| Schenker Key 16 i7-8750H, GeForce RTX 2080 Max-Q | MSI GS65 Stealth 9SG i7-9750H, GeForce RTX 2080 Max-Q | Acer Predator Triton 500 i7-8750H, GeForce RTX 2080 Max-Q | HP Omen 15-dc1303ng i7-8750H, GeForce RTX 2070 Max-Q | Alienware m15 P79F i7-8750H, GeForce RTX 2070 Max-Q | Razer Blade 15 RTX 2080 Max-Q i7-9750H, GeForce RTX 2080 Max-Q | Gigabyte Aero 15-X9 i7-8750H, GeForce RTX 2070 Max-Q | Genomsnitt av klass Gaming | |
|---|---|---|---|---|---|---|---|---|
| Power Consumption | -30% | -24% | -8% | -3% | -8% | -9% | -25% | |
| Idle Minimum * (Watt) | 10 | 18.3 -83% | 16 -60% | 14.7 -47% | 10.9 -9% | 12.5 -25% | 16 -60% | 13.1 ? -31% |
| Idle Average * (Watt) | 15 | 22 -47% | 22 -47% | 18.6 -24% | 12.3 18% | 15.3 -2% | 18 -20% | 18.8 ? -25% |
| Idle Maximum * (Watt) | 22 | 28.8 -31% | 32 -45% | 22.6 -3% | 19 14% | 20.7 6% | 23 -5% | 24.4 ? -11% |
| Load Average * (Watt) | 88 | 93 -6% | 89 -1% | 90 -2% | 96 -9% | 90.2 -3% | 88 -0% | 108.5 ? -23% |
| Witcher 3 ultra * (Watt) | 145 | 142.6 2% | 147 -1% | 161.7 -12% | 162 -12% | 120 17% | ||
| Load Maximum * (Watt) | 191 | 215.9 -13% | 173 9% | 120 37% | 229.1 -20% | 209.3 -10% | 167 13% | 254 ? -33% |
* ... mindre är bättre
| Schenker Key 16 i7-8750H, GeForce RTX 2080 Max-Q, 62 Wh | MSI GS65 Stealth 9SG i7-9750H, GeForce RTX 2080 Max-Q, 82 Wh | Acer Predator Triton 500 i7-8750H, GeForce RTX 2080 Max-Q, 82 Wh | HP Omen 15-dc1303ng i7-8750H, GeForce RTX 2070 Max-Q, 70 Wh | Alienware m15 P79F i7-8750H, GeForce RTX 2070 Max-Q, 90 Wh | Razer Blade 15 RTX 2080 Max-Q i7-9750H, GeForce RTX 2080 Max-Q, 80 Wh | Gigabyte Aero 15-X9 i7-8750H, GeForce RTX 2070 Max-Q, 94.24 Wh | Genomsnitt av klass Gaming | |
|---|---|---|---|---|---|---|---|---|
| Batteridrifttid | 9% | -23% | -30% | -5% | 41% | 39% | 19% | |
| Reader / Idle (h) | 9.8 | 5.6 -43% | 5 -49% | 15.9 62% | 9.2 -6% | 8.71 ? -11% | ||
| H.264 (h) | 6 | 6.1 2% | 8.26 ? 38% | |||||
| WiFi v1.3 (h) | 5.5 | 6 9% | 3.2 -42% | 3.3 -40% | 5.2 -5% | 6.6 20% | 6.4 16% | 6.98 ? 27% |
| Load (h) | 1.2 | 1.4 17% | 1.2 0% | 1.7 42% | 2.9 142% | 1.47 ? 23% |
För
Emot
Läs den fullständiga versionen av den här recensionen på engelska här.
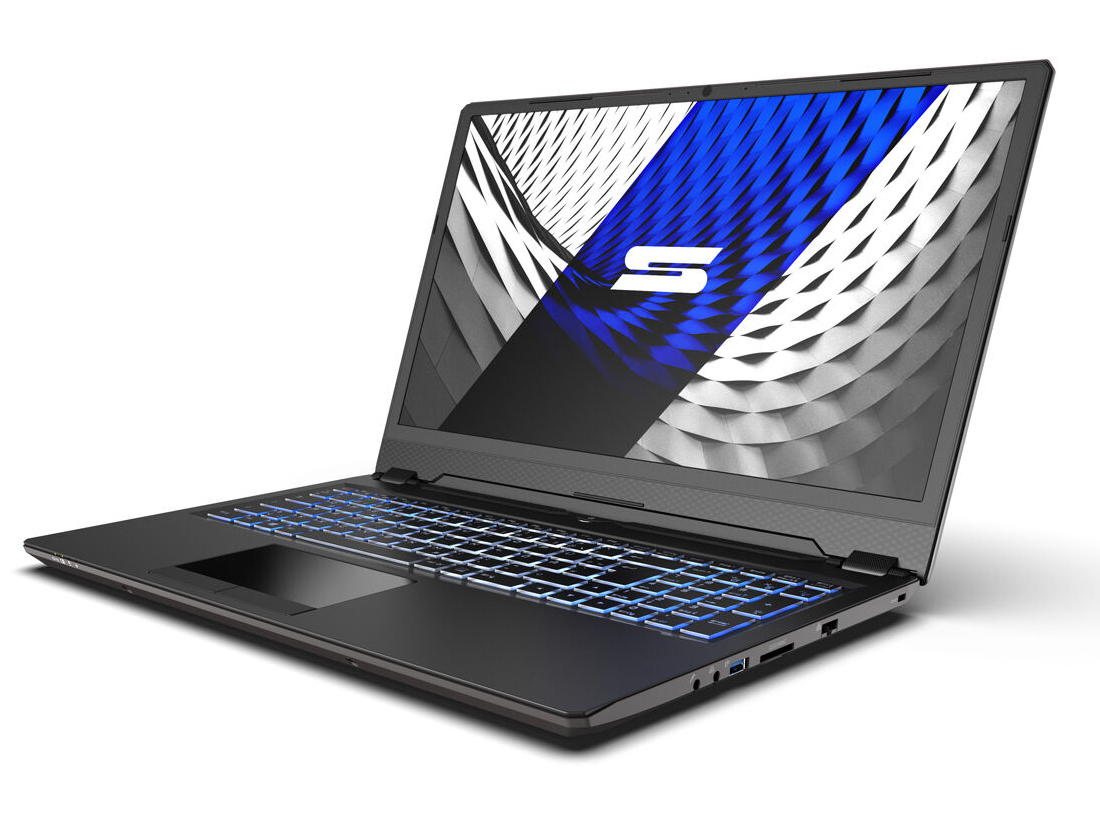
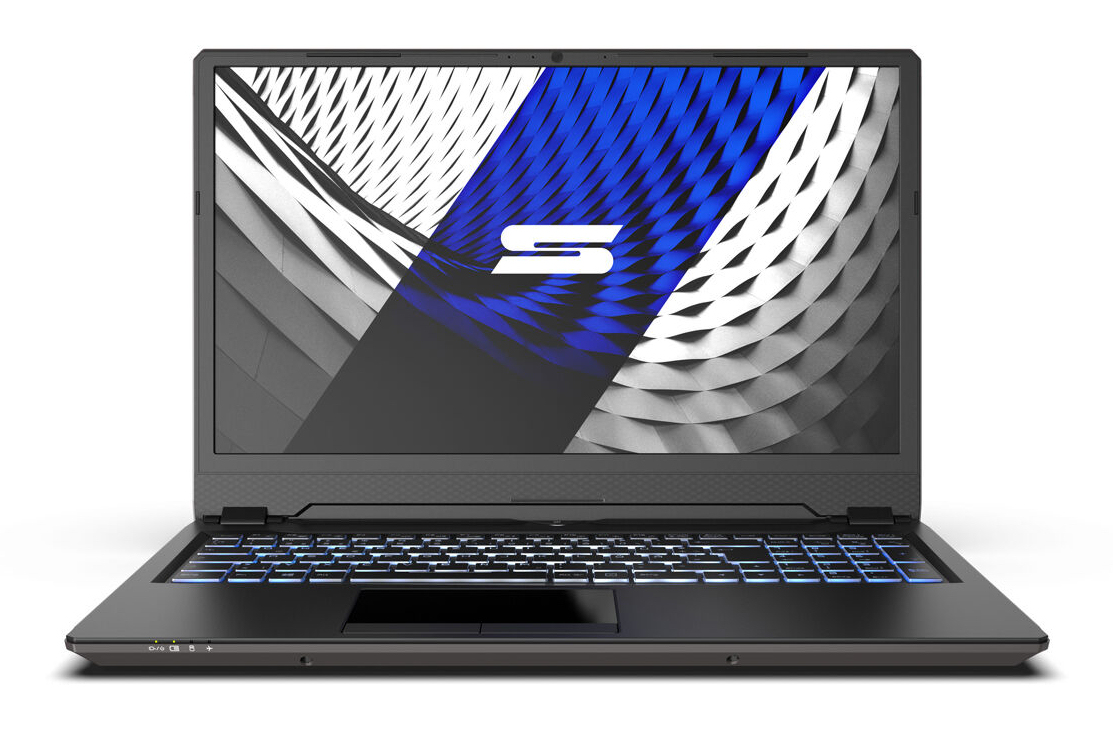
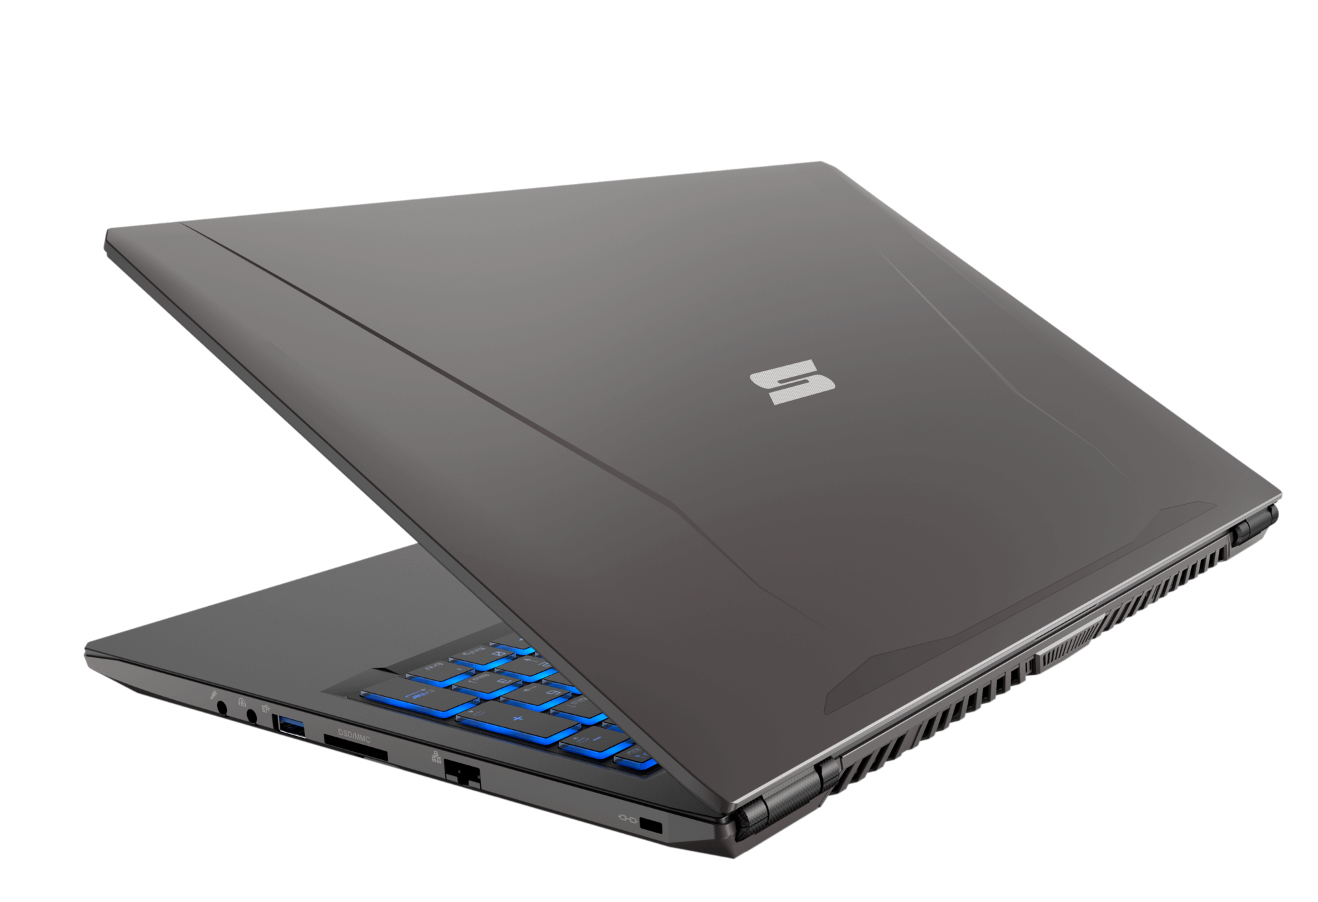
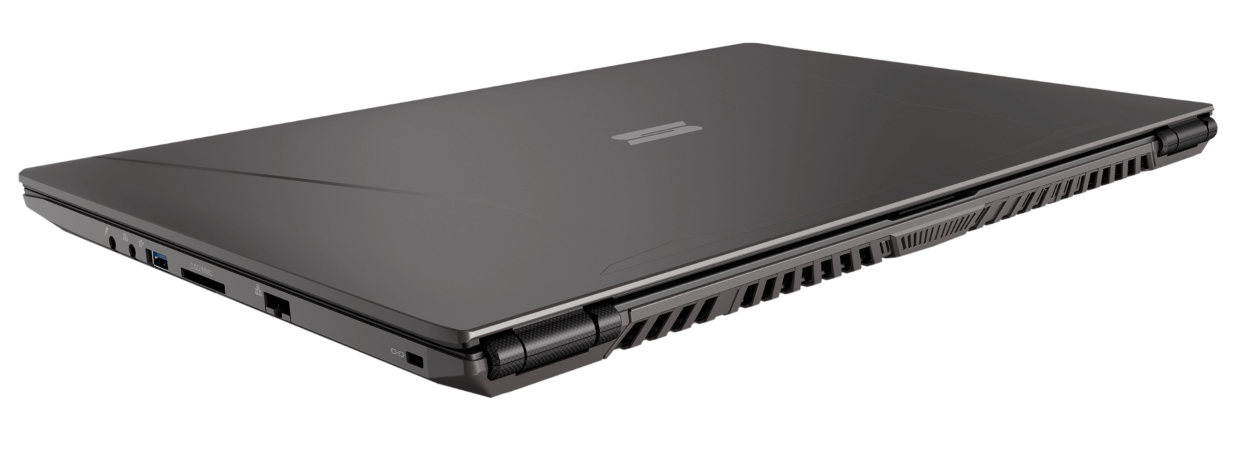
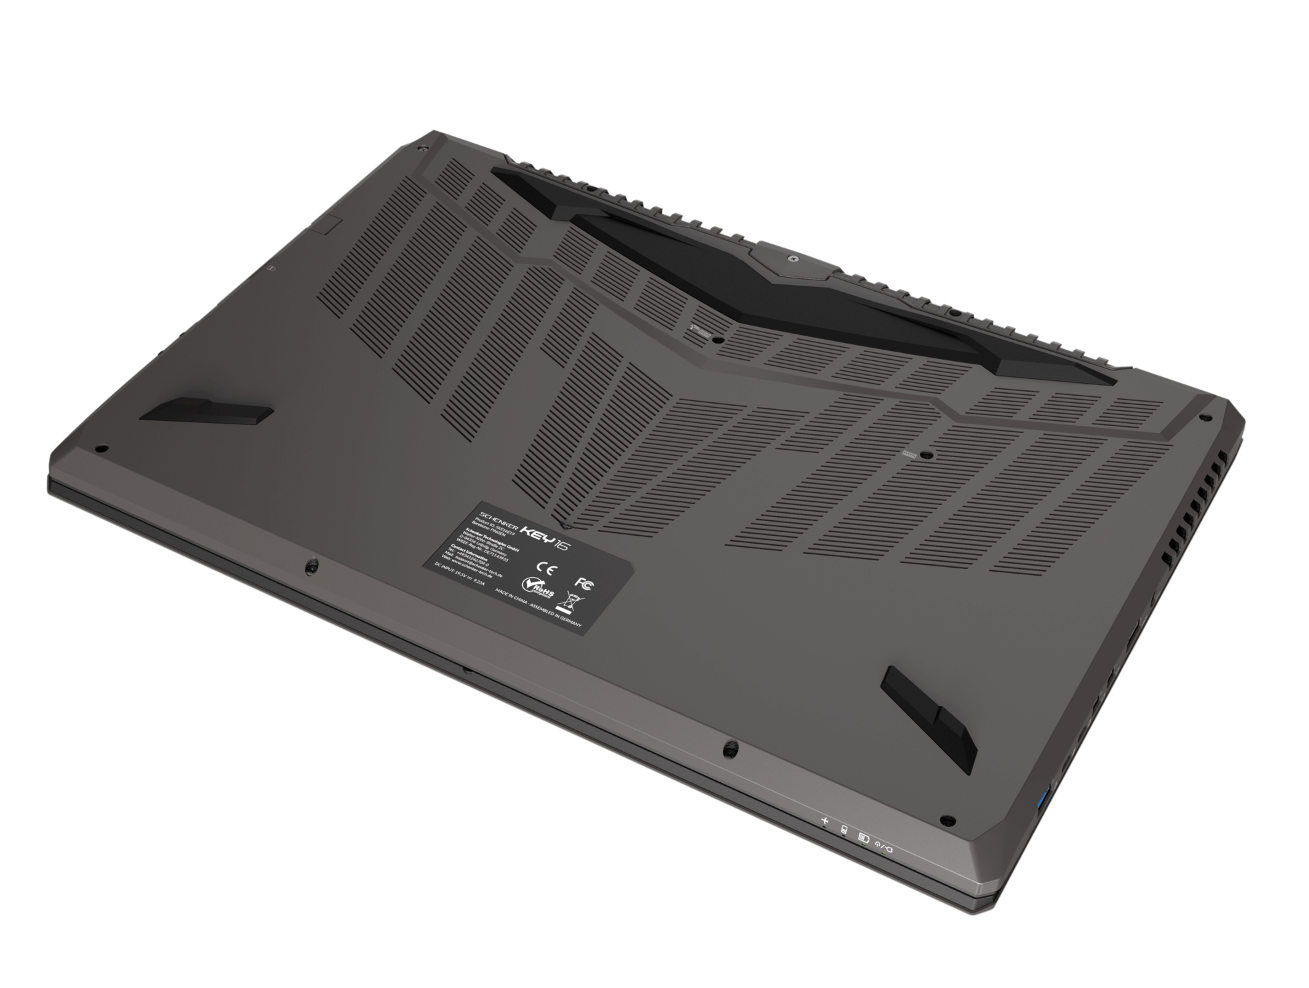
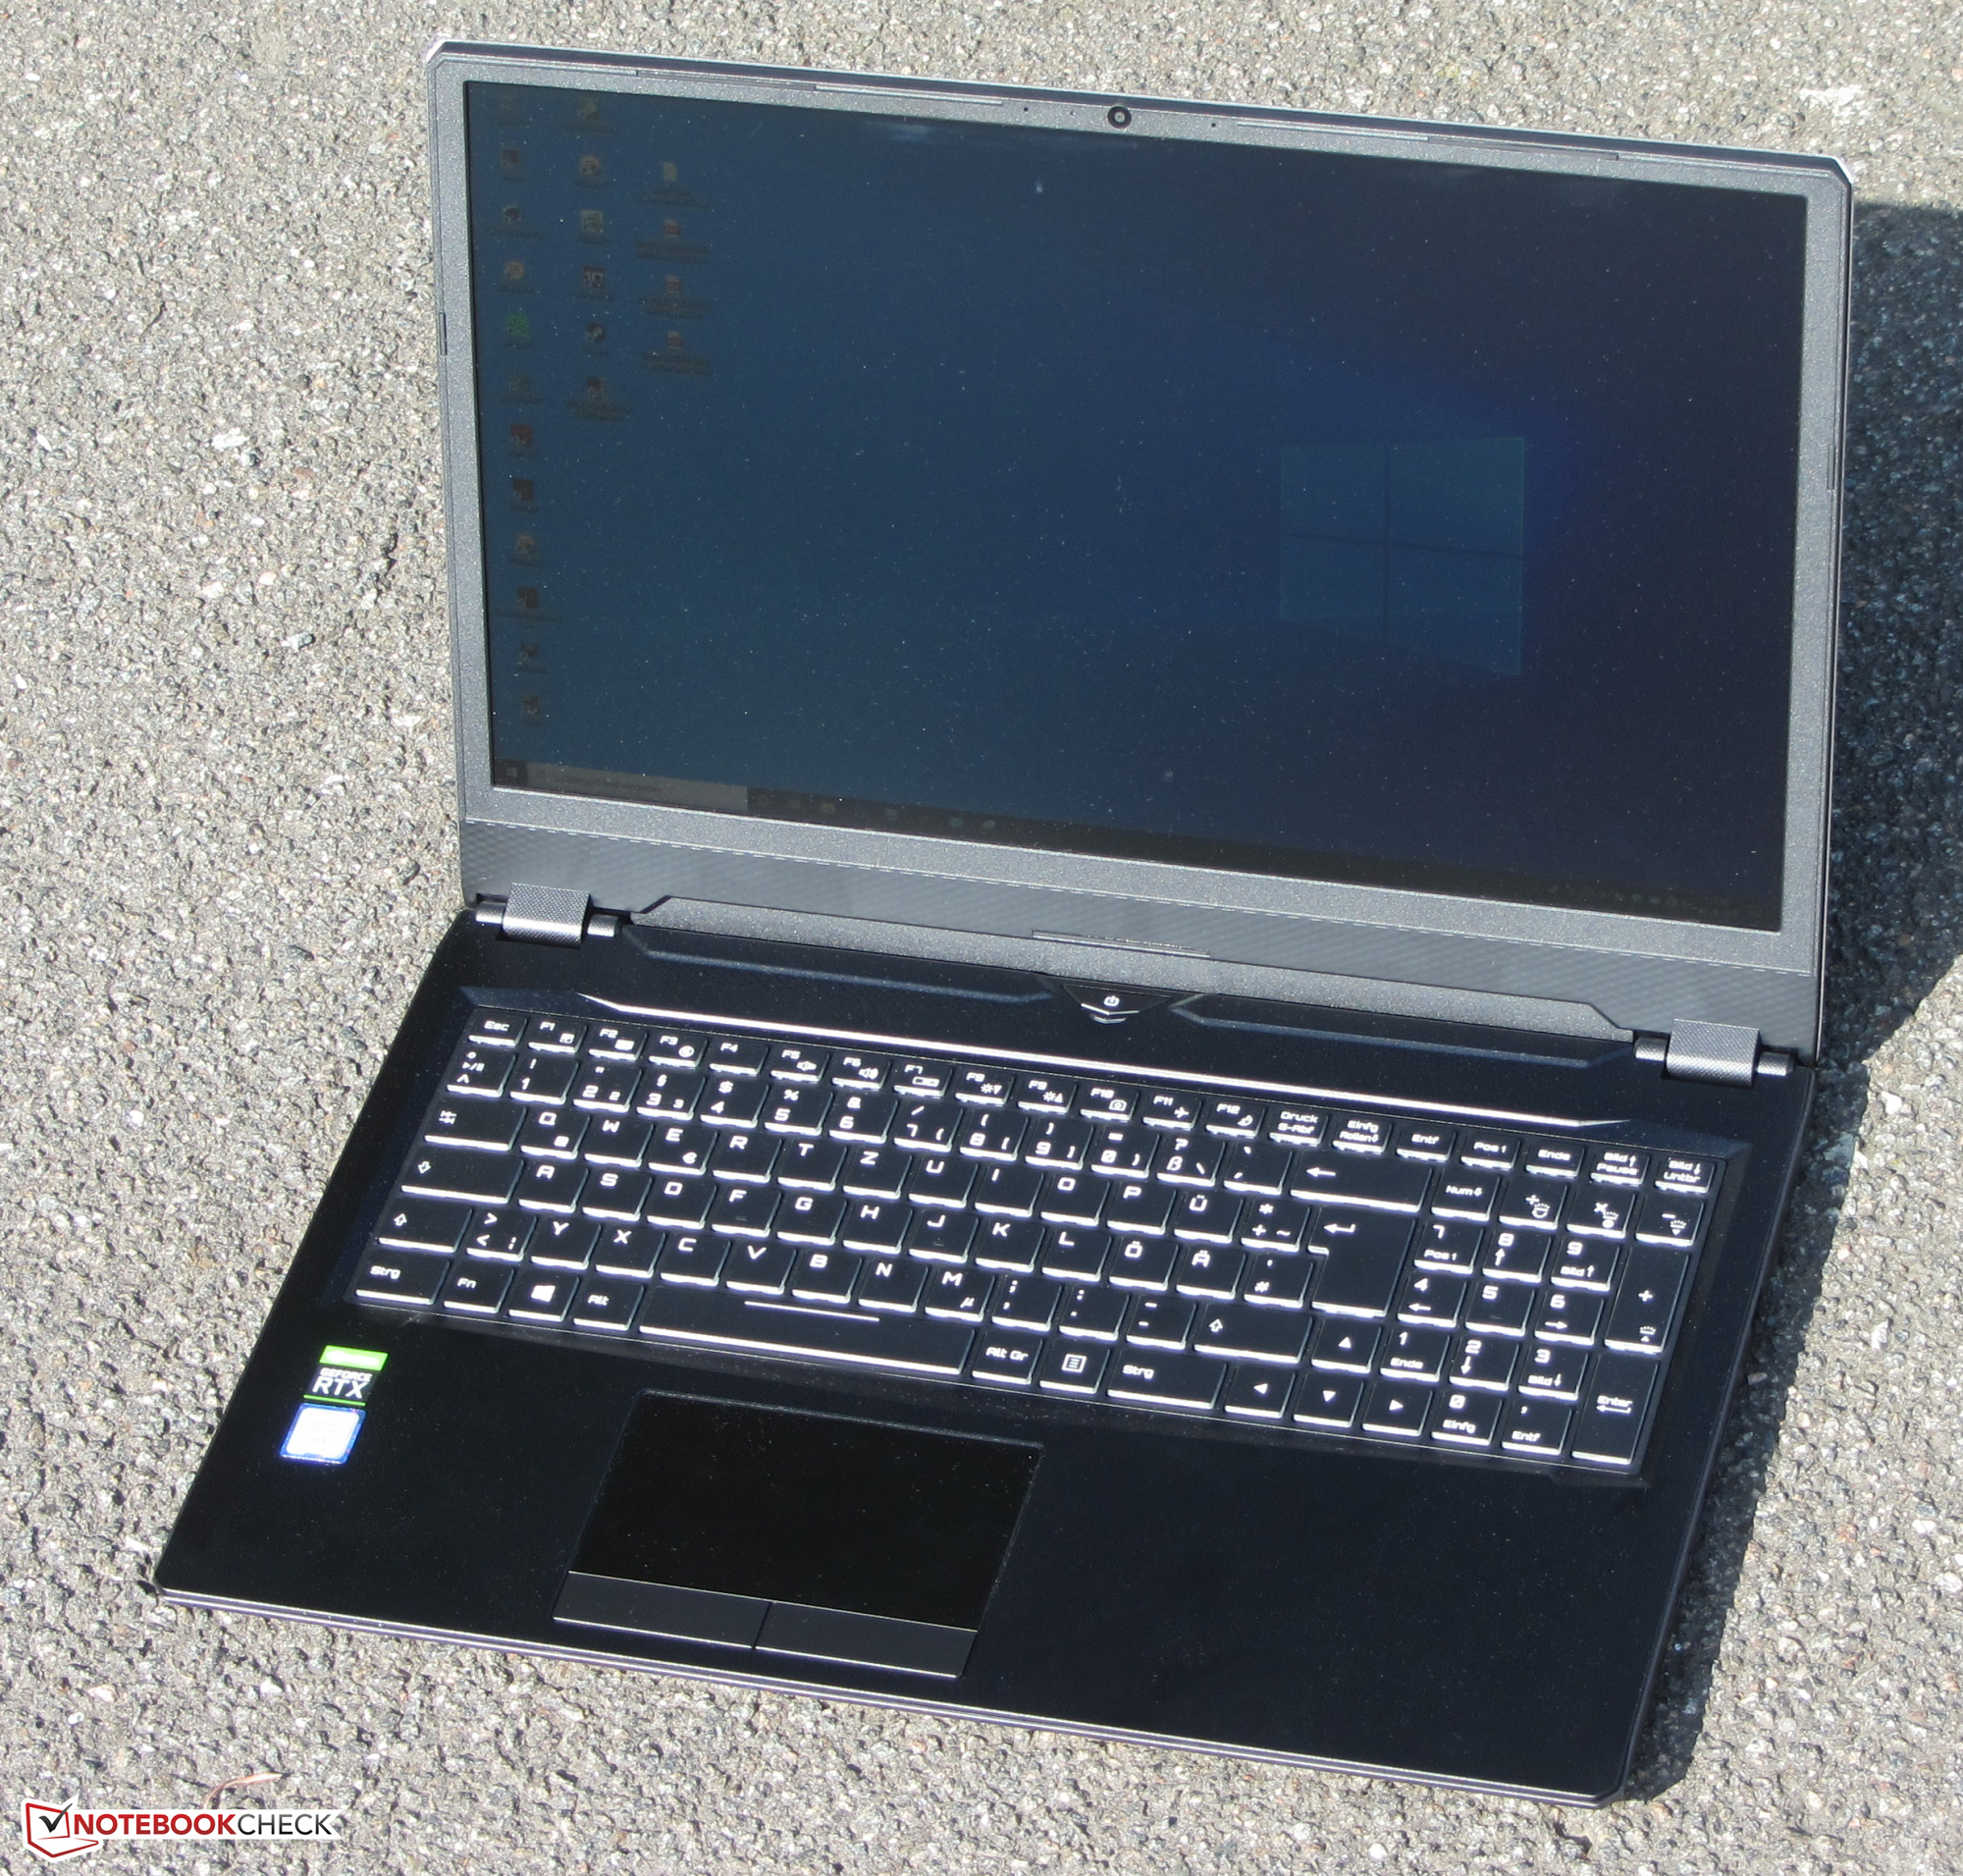
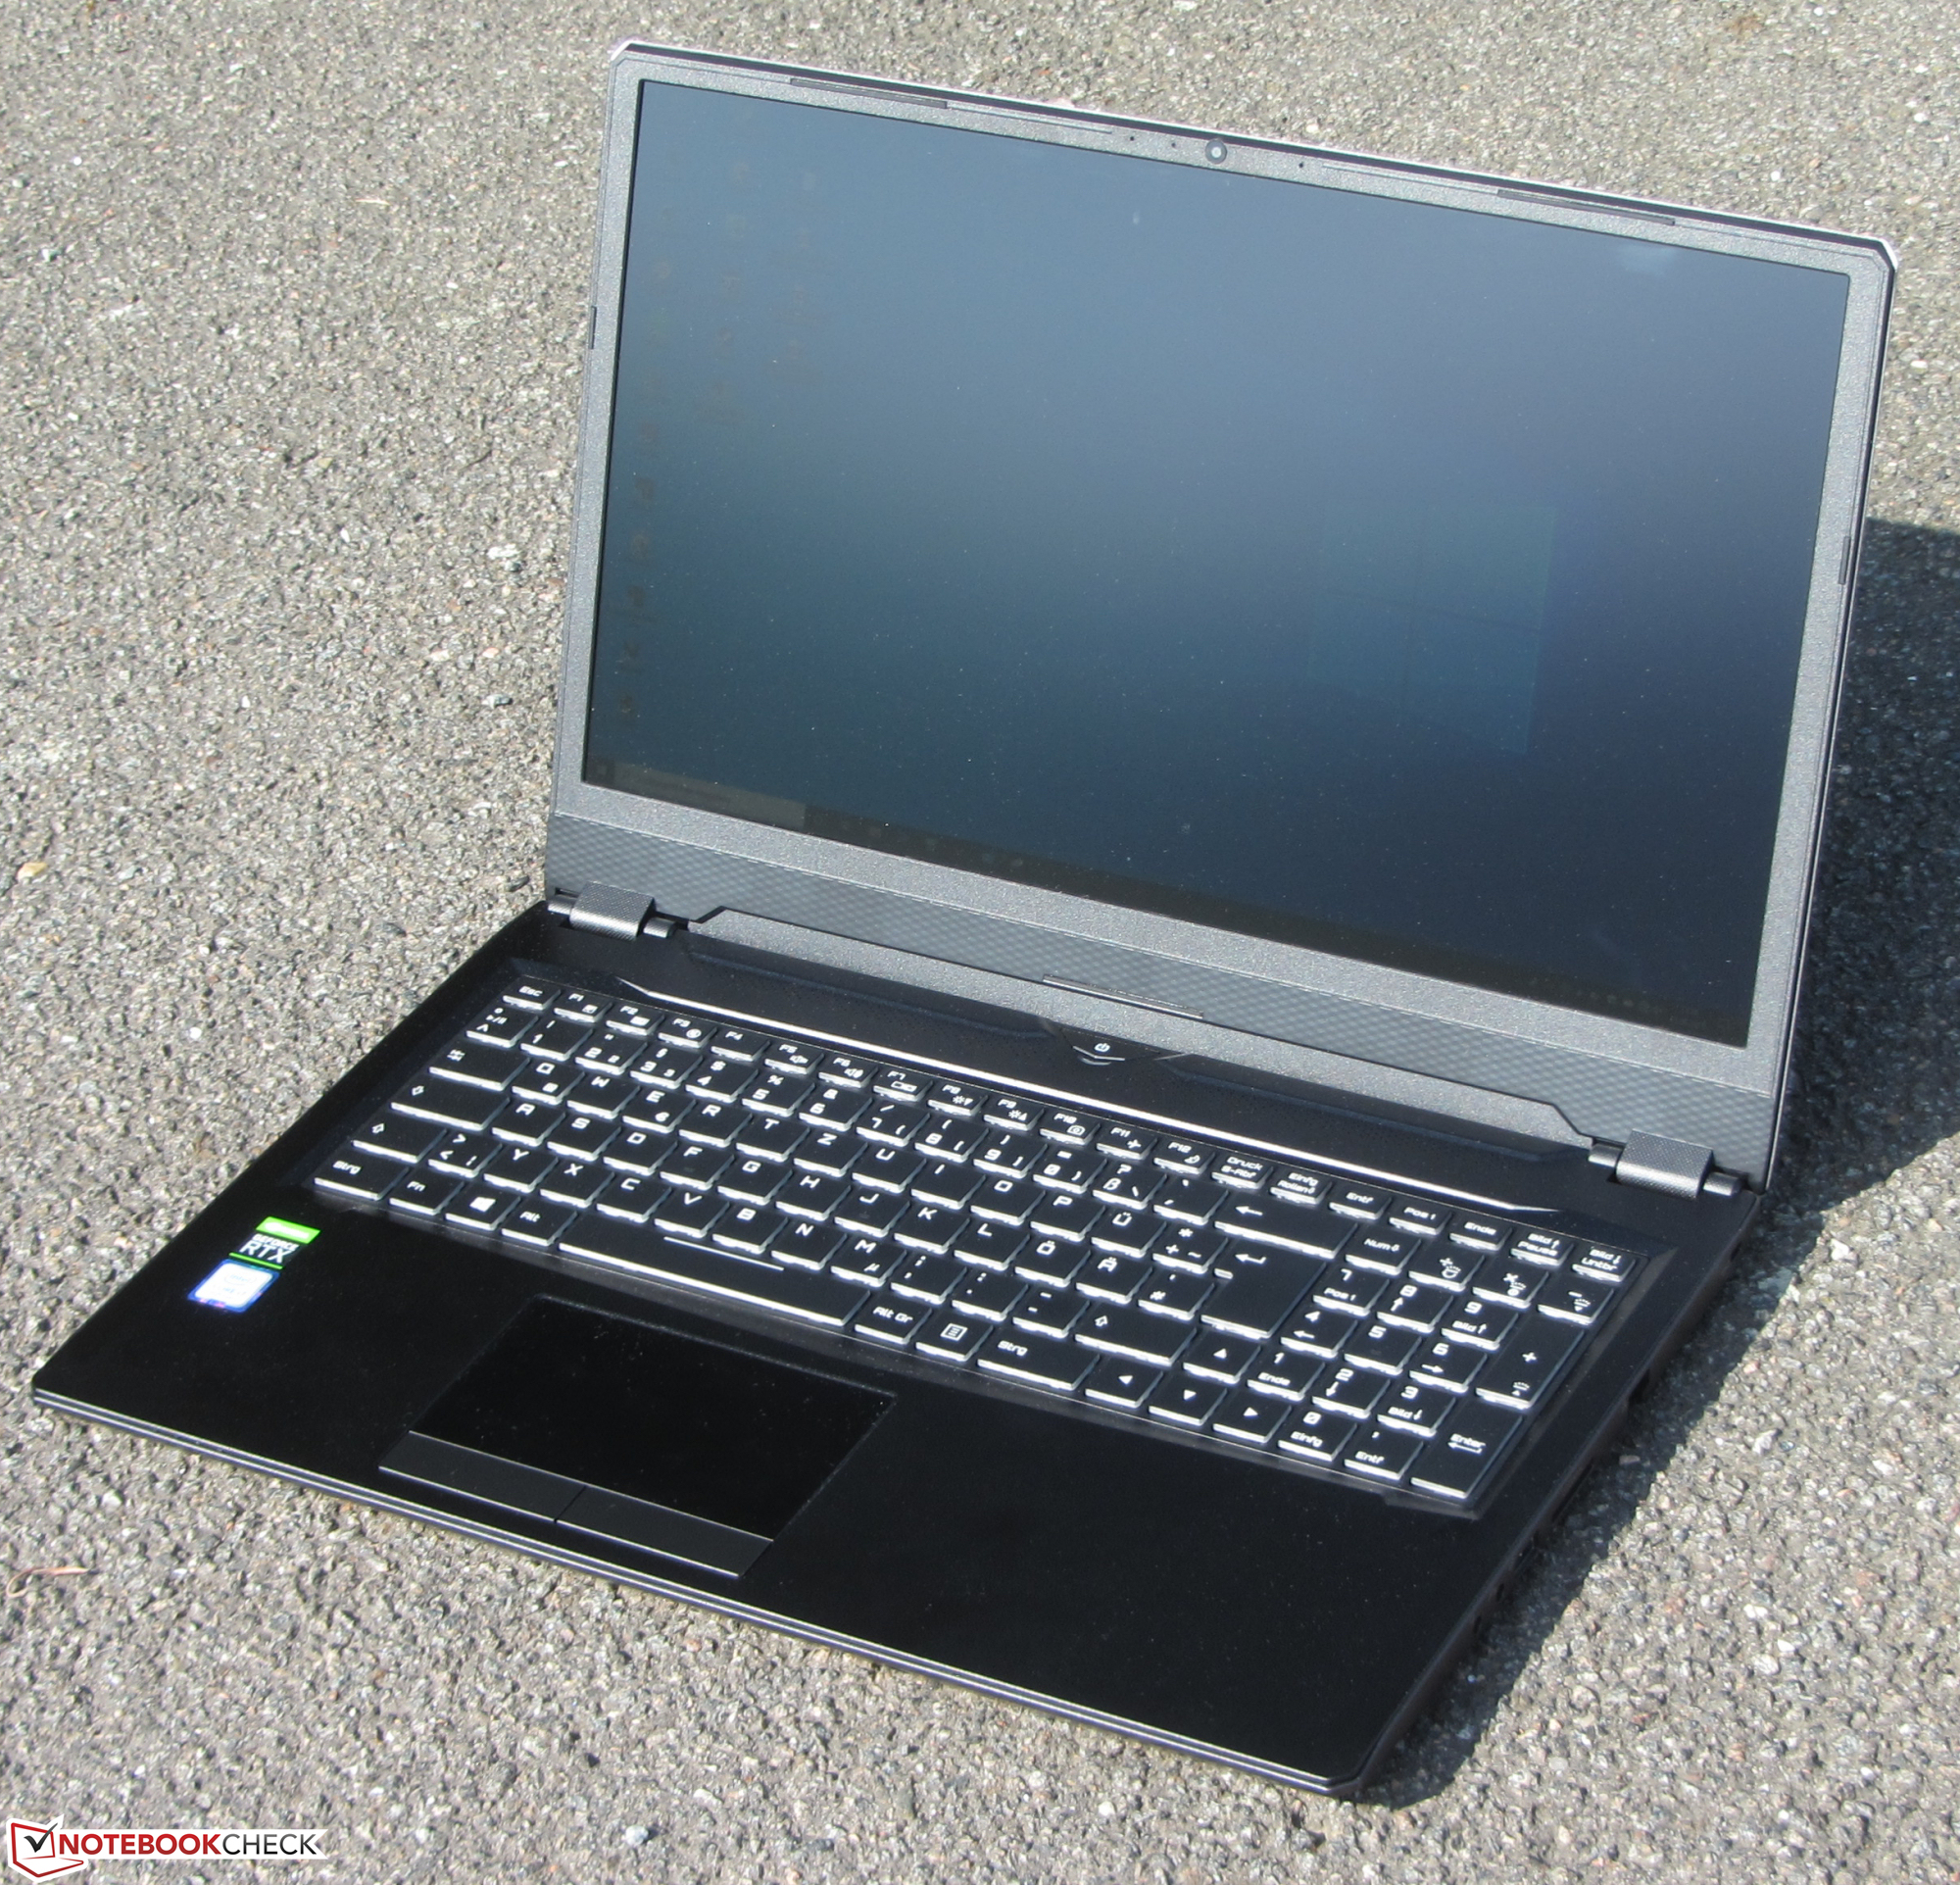
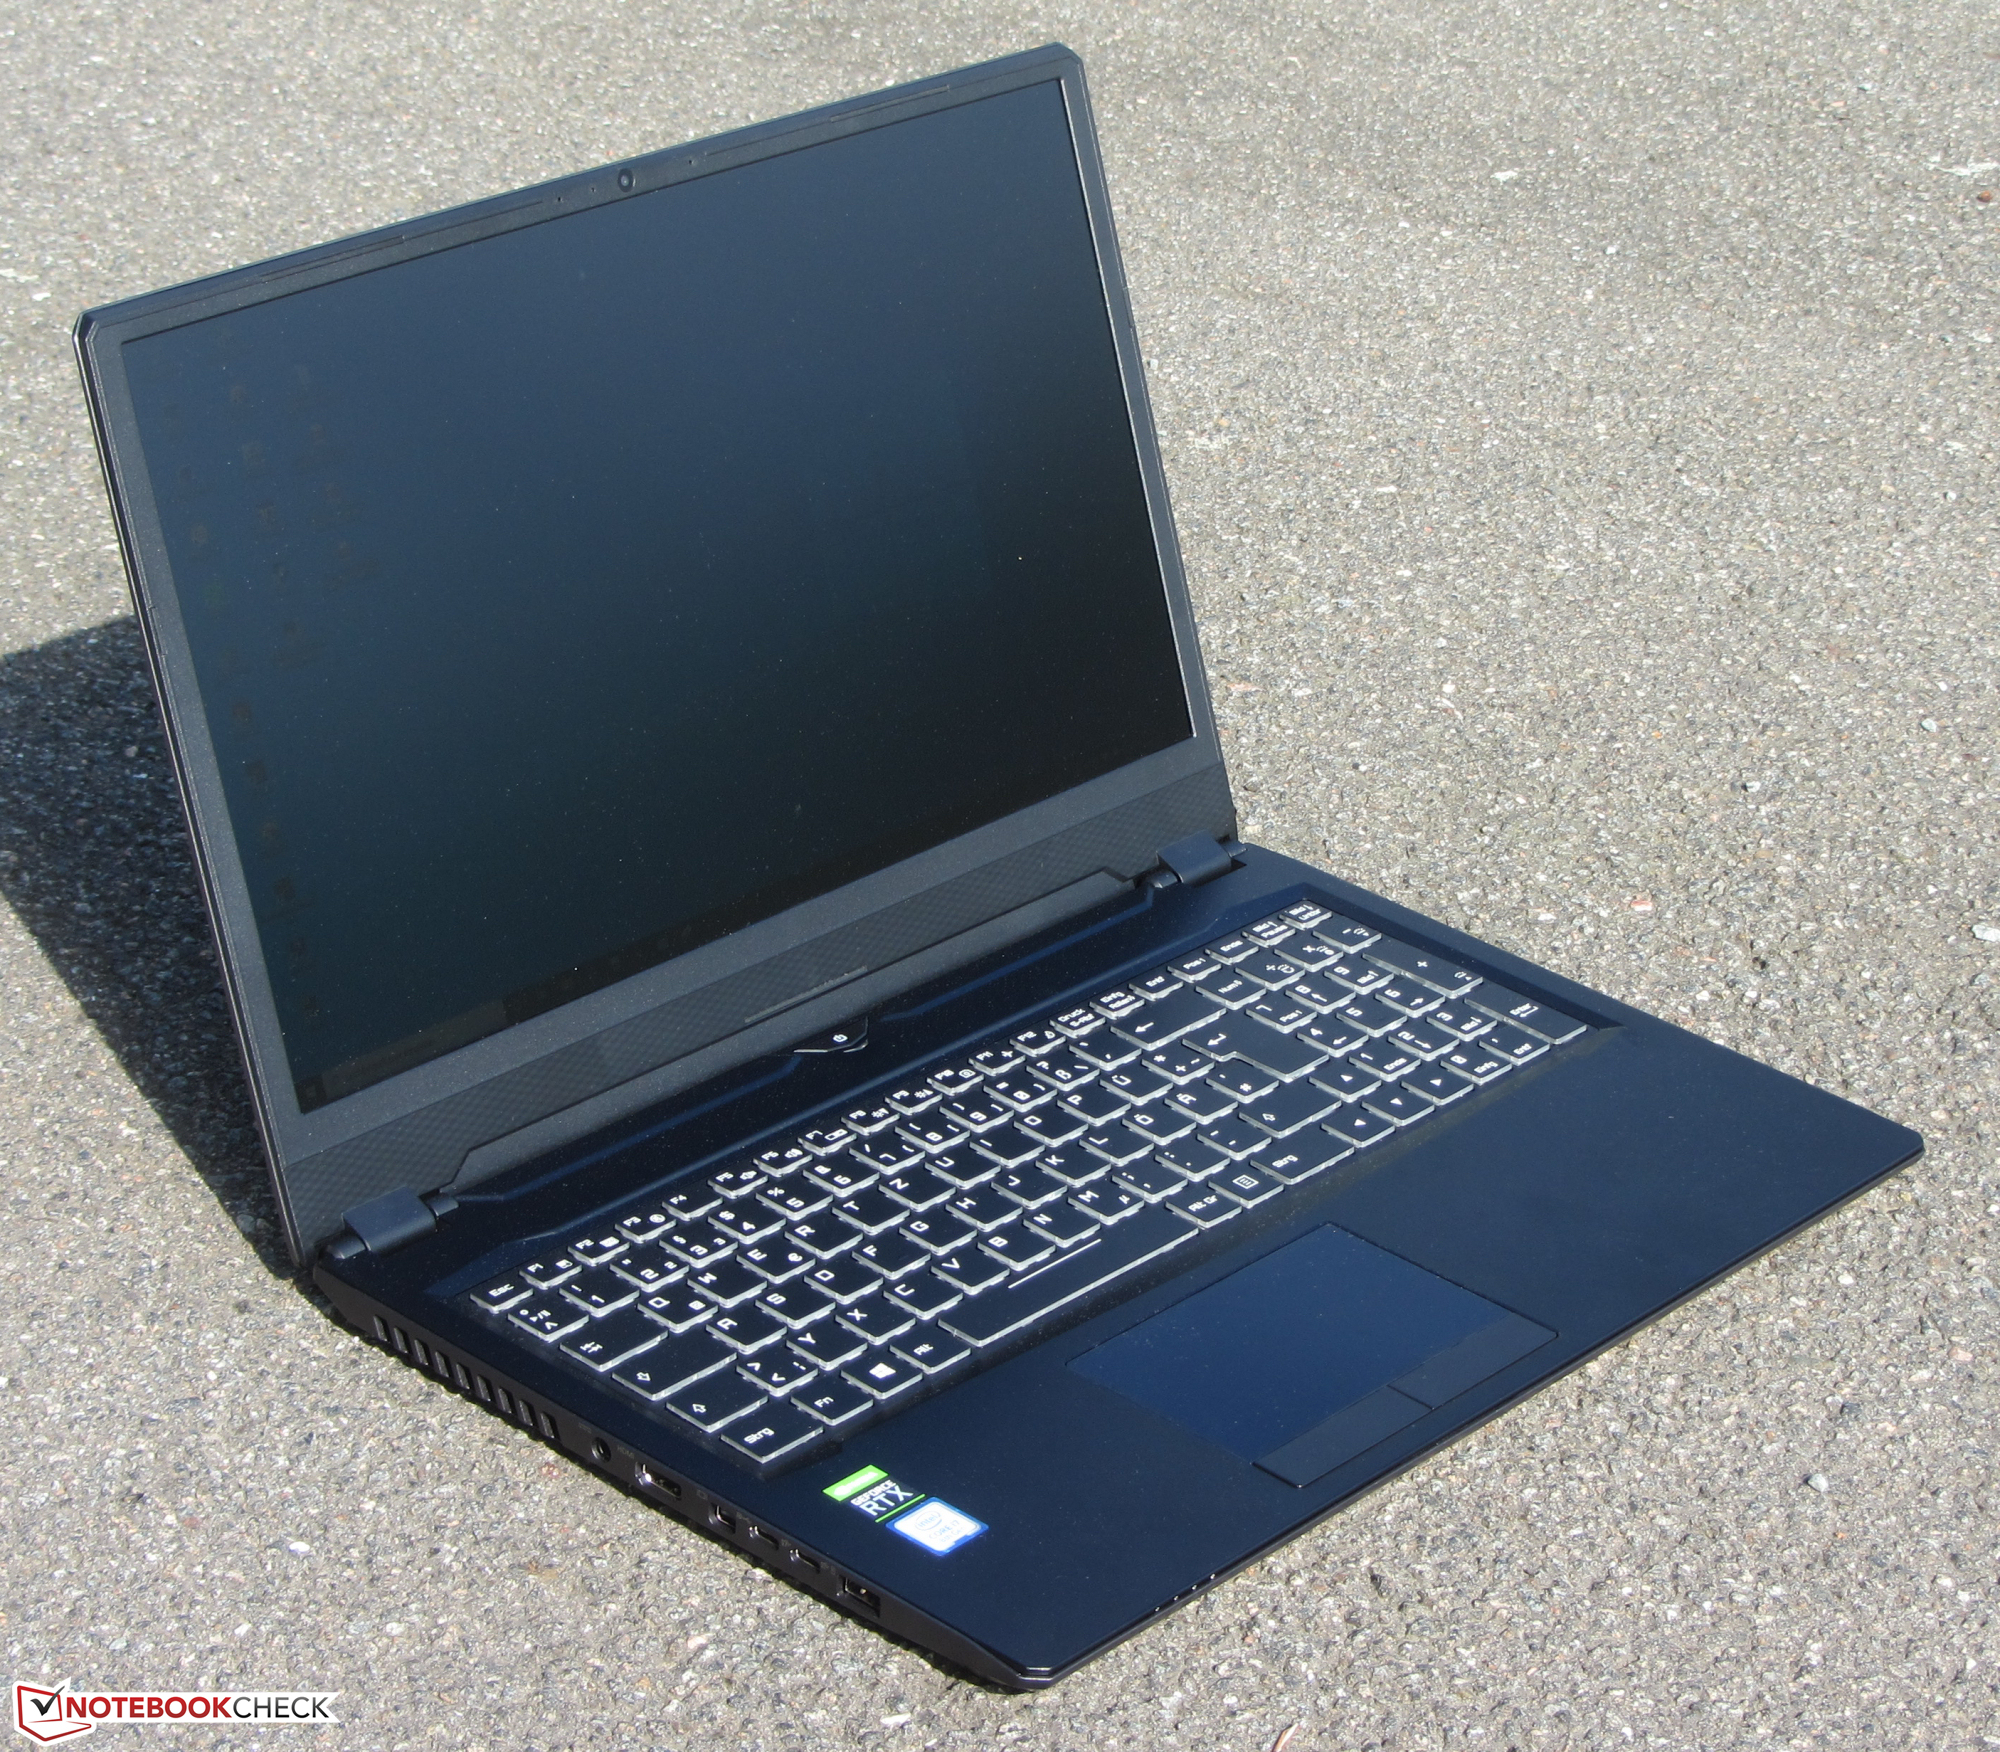
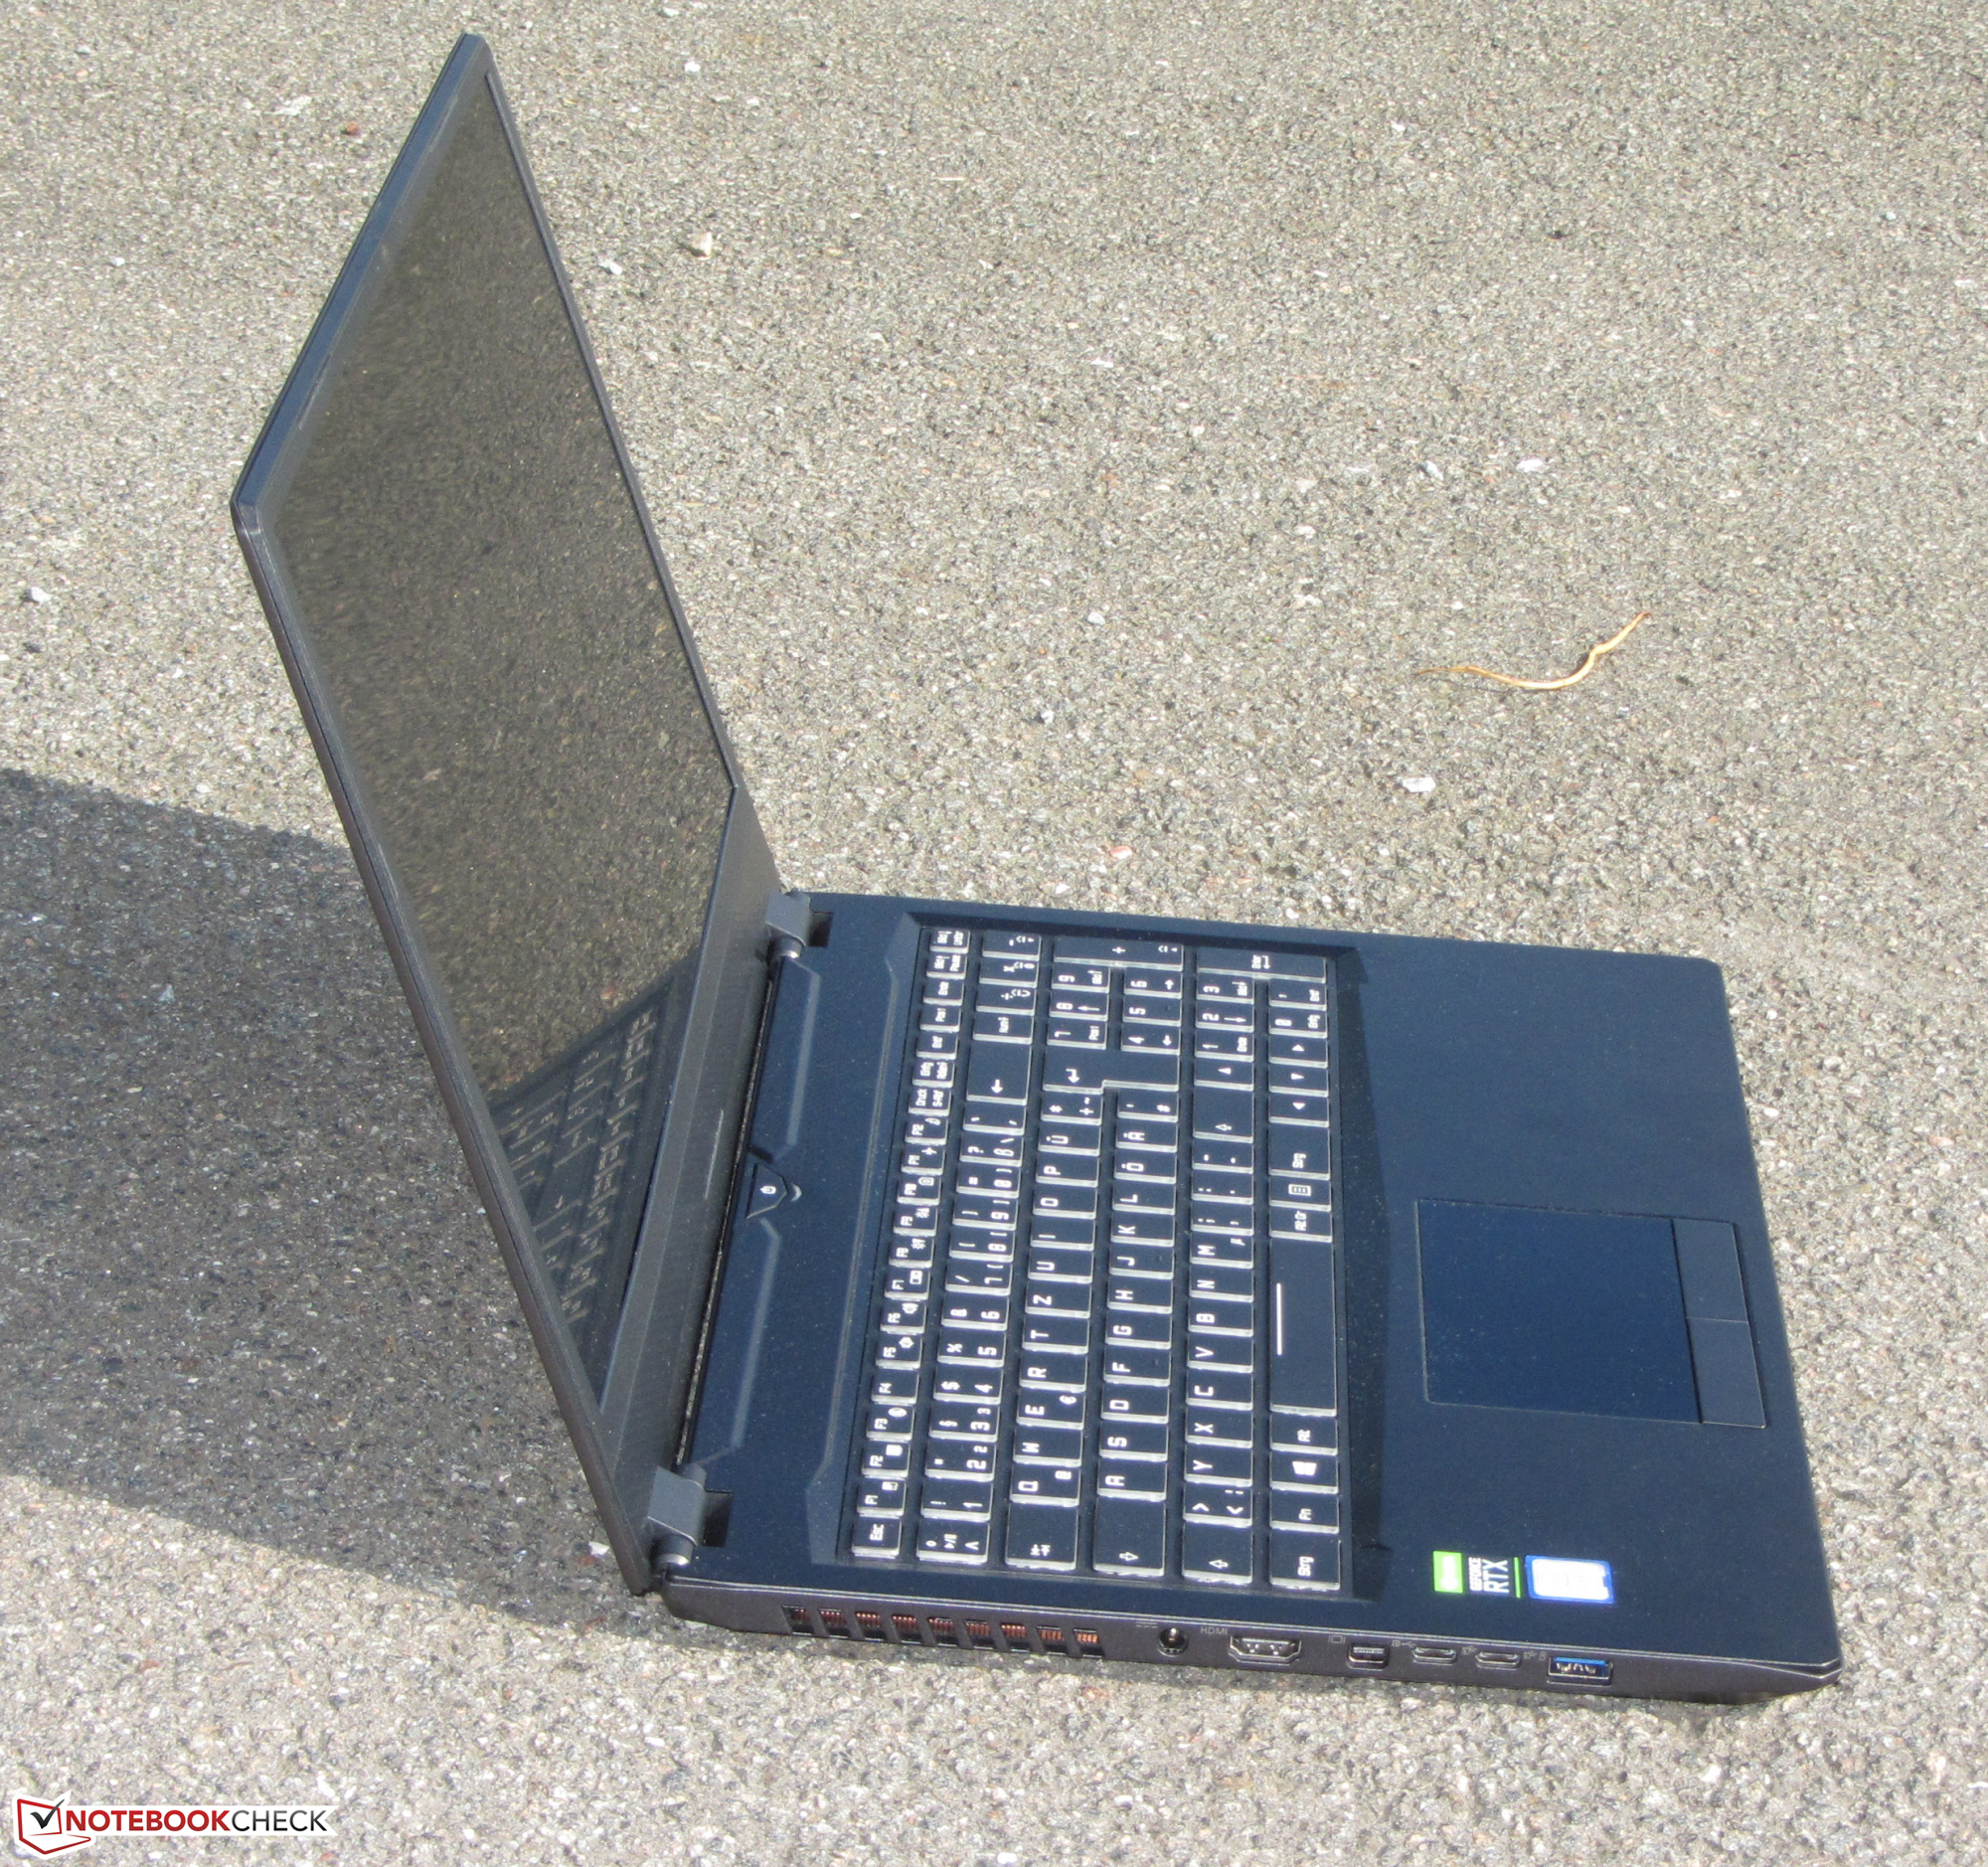
Med sin Key 16 erbjuder Schenker en tunn bärbar speldator som får poäng för sitt eleganta metallhölje. Trots att den har en skärm på 16.1 tum är den knappt större än de vanliga enheterna på 15.6 tum.
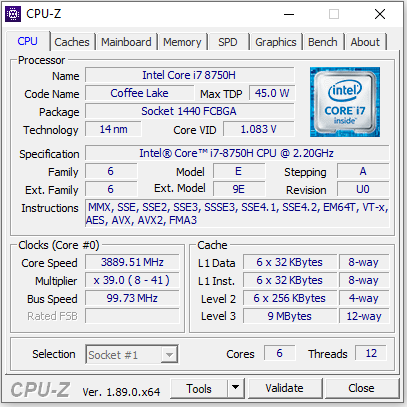
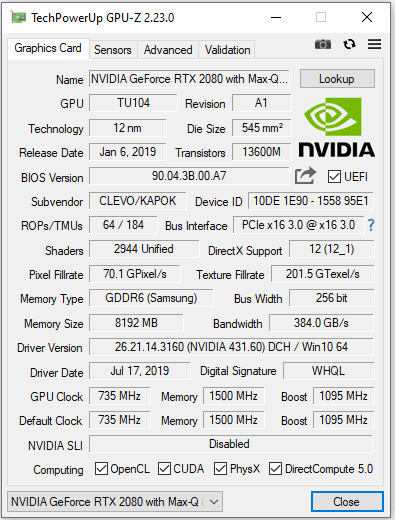
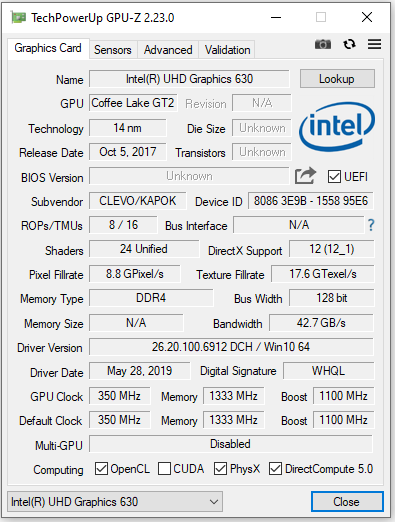
Kombinationen av en Core i7-8750H processor och en GeForce RTX 2080 Max-Q grafikkärna klarar av att visa alla moderna datorspel på den matta Full HD-skärmen. Det går alltid att välja höga eller maximala grafikinställningar.
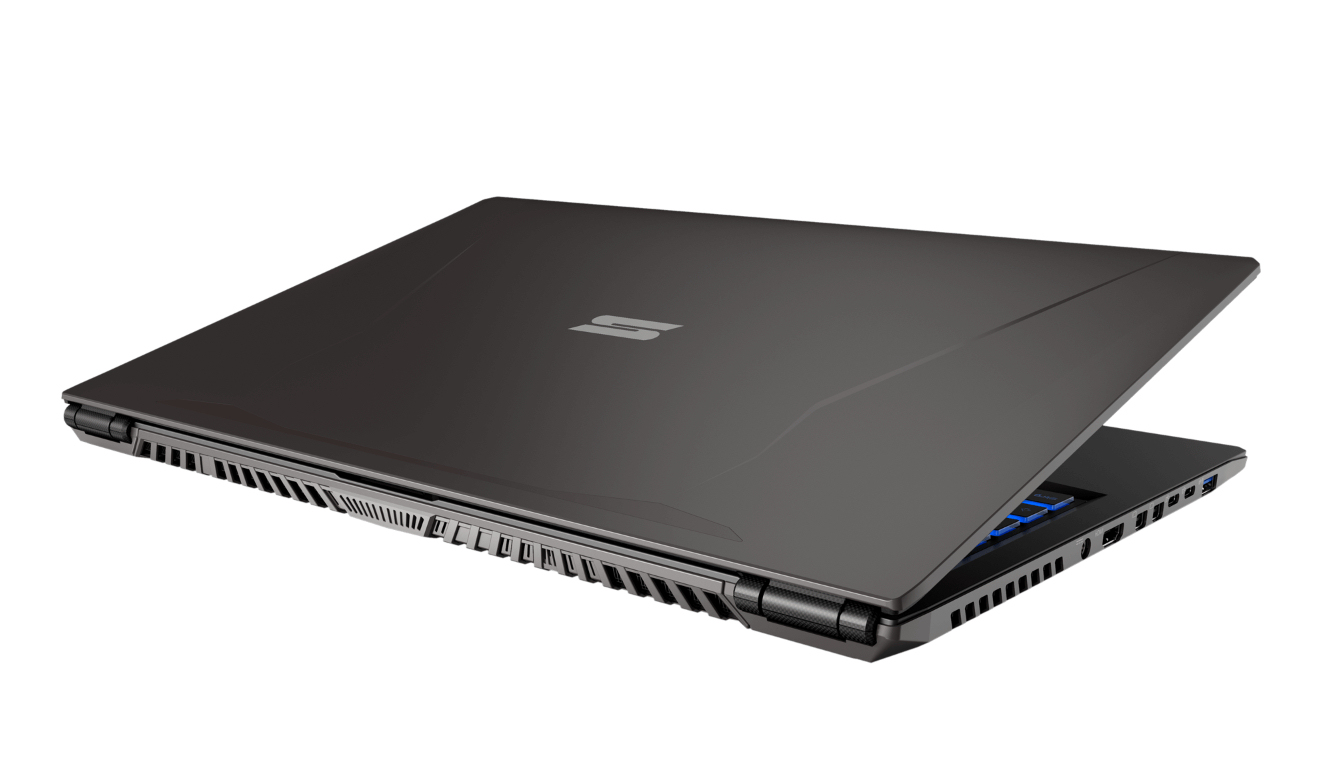
Schenker har fått plats med mycket datorkraft i ett elegant och tunt hölje.
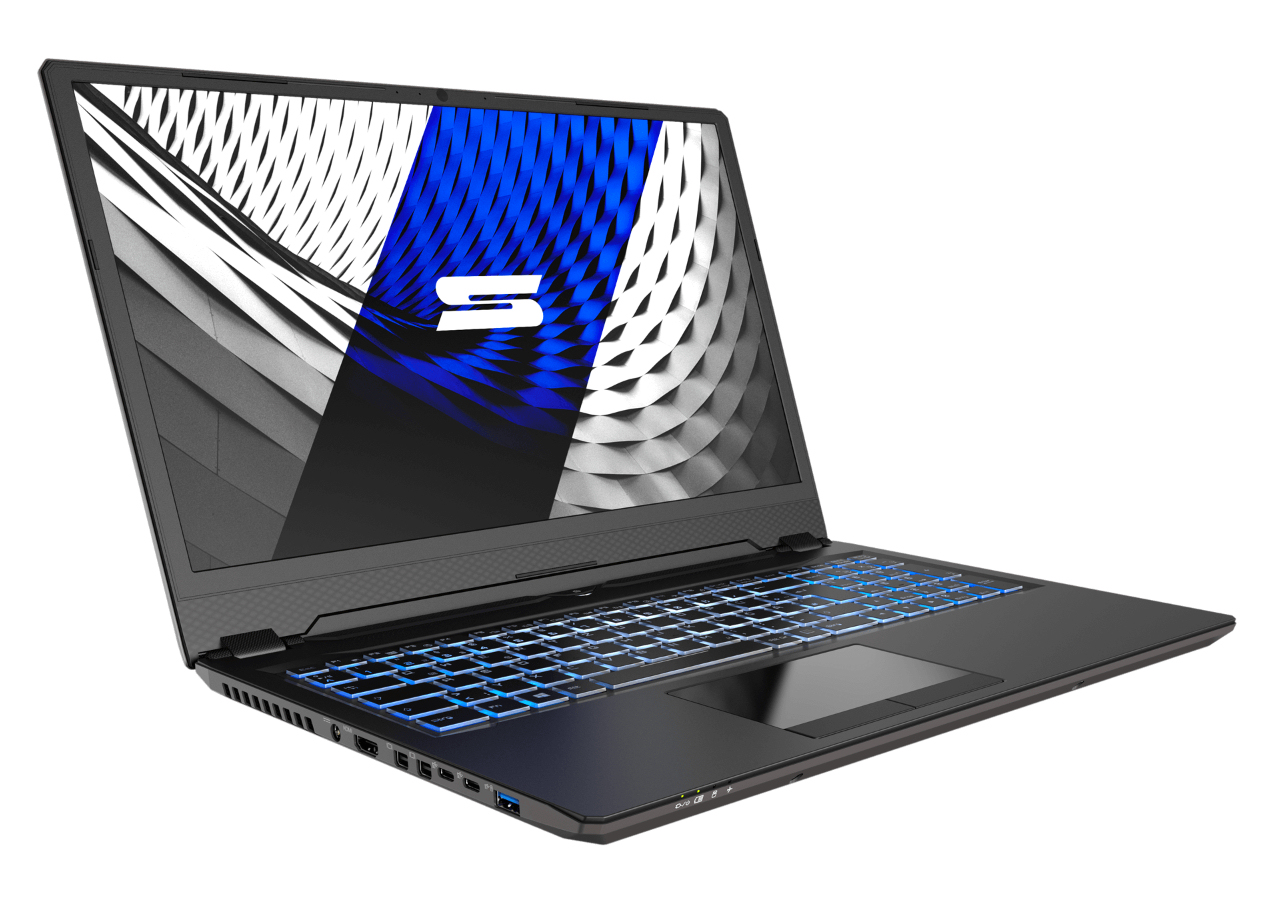
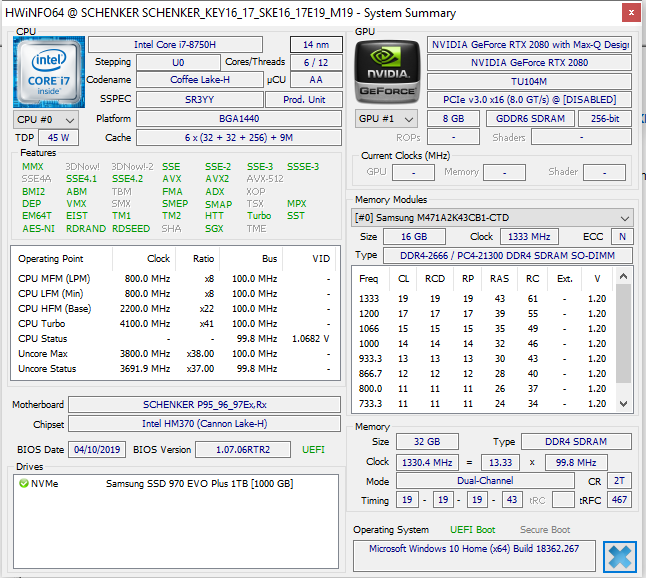
En snabb NVMe SSD säkrar att systemet körs snabbt och smidigt. Det finns dessutom plats för ytterligare en M.2 SSD (NVMe eller SATA). Om du använder två NVMe SSD-enheter kan de kopplas samman i en RAID-konfiguration (0 eller 1). Det går också att lägga till en lagringsenhet på 2.5 tum. Uppgraderingar eller service kräver dock att man öppnar höljet, vilket visade sig vara ganska komplicerat.
IPS-skärmen med 144 Hz bilduppdatering får poäng för korta responstider, stabila betraktningsvinklar, bra kontrast och utmärkt färgåtergivning. Men skärmen kunde haft bättre ljusstyrka även om den räcker till för användning inomhus.
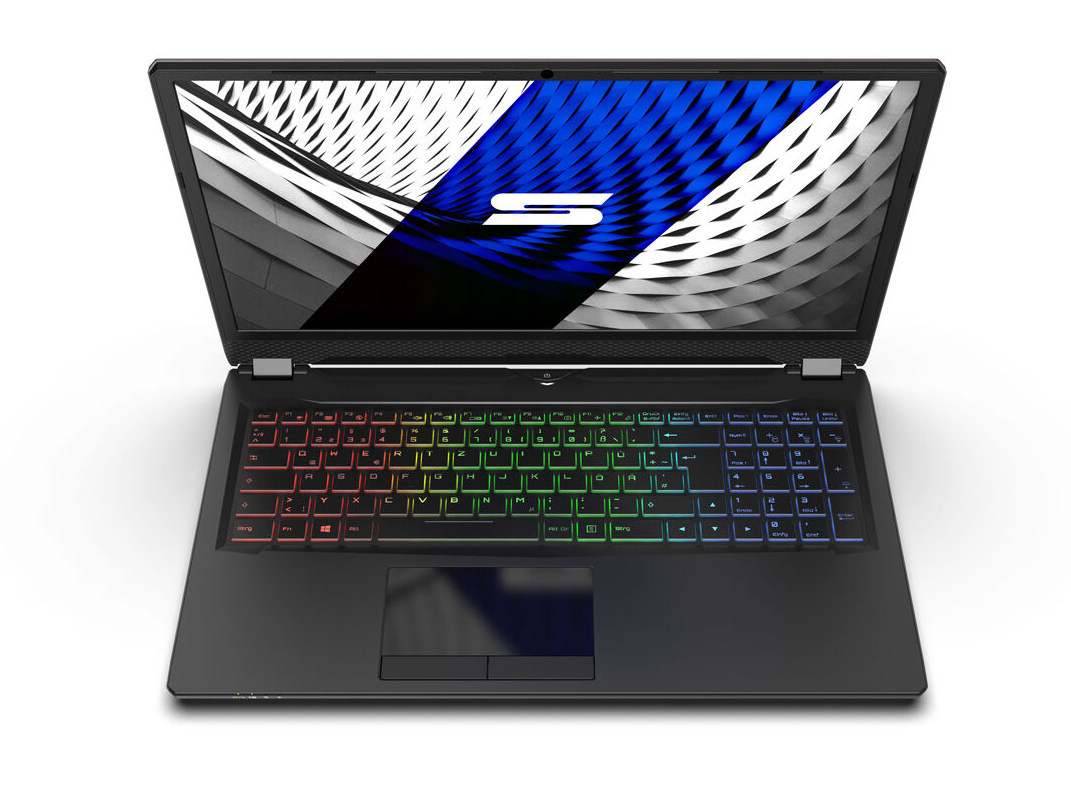
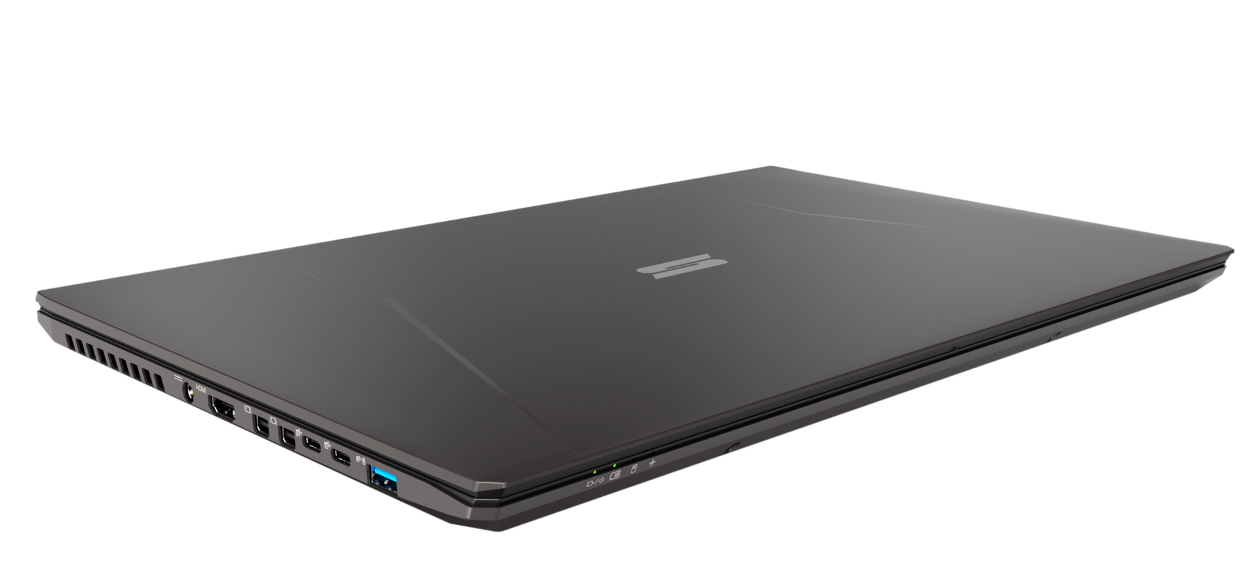
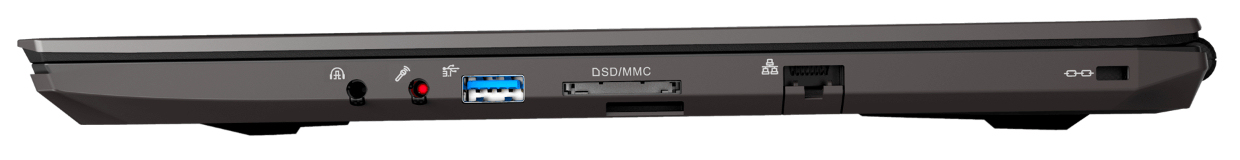
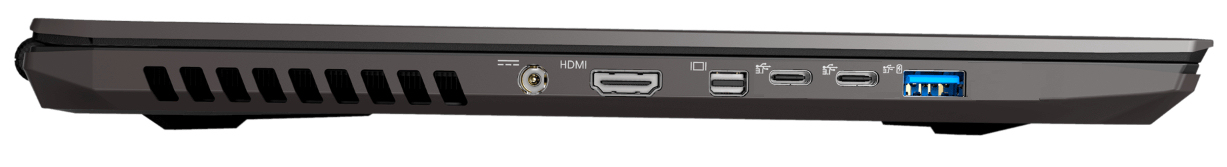
Även om batteritiden inte är särskilt inspirerande är den okej för en laptop i den här prestandaklassen. Chiclet-tangentbordet (RGB-belyst) visar sig passa bra för vardagsuppgifter. Detta åtföljs av en välavvägd mängd portar. Vi saknar dock en Thunderbolt 3-anslutning.
Schenker Key 16
- 09/20/2019 v7 (old)
Sascha Mölck
Price comparison
