Test: Lenovo IdeaPad L340 Gaming - Stel klickplatta påverkar det roliga (Sammanfattning)

| Networking | |
| iperf3 transmit AX12 | |
| HP Omen 15-dc1020ng | |
| Asus TUF FX505DT-EB73 | |
| Lenovo IdeaPad L340-15IRH 81LK00BMGE | |
| Lenovo Ideapad L340-17IRH 81LL001YGE | |
| Asus ROG Zephyrus G15 GA502DU | |
| iperf3 receive AX12 | |
| HP Omen 15-dc1020ng | |
| Asus TUF FX505DT-EB73 | |
| Asus ROG Zephyrus G15 GA502DU | |
| Lenovo IdeaPad L340-15IRH 81LK00BMGE | |
| Lenovo Ideapad L340-17IRH 81LL001YGE | |
| |||||||||||||||||||||||||
Distribution av ljusstyrkan: 83 %
Mitt på batteriet: 275 cd/m²
Kontrast: 1528:1 (Svärta: 0.18 cd/m²)
ΔE ColorChecker Calman: 5.4 | ∀{0.5-29.43 Ø4.72}
calibrated: 4.4
ΔE Greyscale Calman: 3.7 | ∀{0.09-98 Ø4.97}
63.6% sRGB (Argyll 1.6.3 3D)
40.8% AdobeRGB 1998 (Argyll 1.6.3 3D)
44.31% AdobeRGB 1998 (Argyll 3D)
63.8% sRGB (Argyll 3D)
42.81% Display P3 (Argyll 3D)
Gamma: 2.12
CCT: 6376 K
| Lenovo IdeaPad L340-15IRH 81LK00BMGE CMN 156HCA-EAB, , 1920x1080, 15.6" | Lenovo Ideapad L340-17IRH 81LL001YGE Chi Mei N173HCE-E31, , 1920x1080, 17.3" | HP Omen 15-dc1020ng LGD05CE, , 1920x1080, 15.6" | Asus TUF FX505DT-EB73 Panda LM156LF-GL, , 1920x1080, 15.6" | Asus ROG Zephyrus G15 GA502DU Panda LM156LF-CL03, , 1920x1080, 15.6" | |
|---|---|---|---|---|---|
| Display | 50% | -10% | -8% | -6% | |
| Display P3 Coverage (%) | 42.81 | 66.3 55% | 38.37 -10% | 39.56 -8% | 40.33 -6% |
| sRGB Coverage (%) | 63.8 | 92.7 45% | 57.6 -10% | 59.5 -7% | 60.6 -5% |
| AdobeRGB 1998 Coverage (%) | 44.31 | 66.6 50% | 39.69 -10% | 40.91 -8% | 41.69 -6% |
| Response Times | 28% | 8% | 22% | 17% | |
| Response Time Grey 50% / Grey 80% * (ms) | 45.6 ? | 32 ? 30% | 40 ? 12% | 30.4 ? 33% | 34 ? 25% |
| Response Time Black / White * (ms) | 30.8 ? | 23 ? 25% | 29.6 ? 4% | 27.6 ? 10% | 28 ? 9% |
| PWM Frequency (Hz) | 25910 ? | 250 ? | 21280 ? | ||
| Screen | 22% | -6% | -15% | -10% | |
| Brightness middle (cd/m²) | 275 | 318 16% | 251 -9% | 286.2 4% | 240.1 -13% |
| Brightness (cd/m²) | 253 | 292 15% | 232 -8% | 267 6% | 231 -9% |
| Brightness Distribution (%) | 83 | 85 2% | 76 -8% | 84 1% | 85 2% |
| Black Level * (cd/m²) | 0.18 | 0.21 -17% | 0.17 6% | 0.33 -83% | 0.34 -89% |
| Contrast (:1) | 1528 | 1514 -1% | 1476 -3% | 867 -43% | 706 -54% |
| Colorchecker dE 2000 * | 5.4 | 4.04 25% | 6.2 -15% | 5.45 -1% | 4.2 22% |
| Colorchecker dE 2000 max. * | 21.3 | 6.59 69% | 18.6 13% | 18.08 15% | 17.8 16% |
| Colorchecker dE 2000 calibrated * | 4.4 | 2.06 53% | 4.8 -9% | 4.47 -2% | 4.09 7% |
| Greyscale dE 2000 * | 3.7 | 4.21 -14% | 4.2 -14% | 5.3 -43% | 2.8 24% |
| Gamma | 2.12 104% | 2.5 88% | 2.32 95% | 2.1 105% | 2.2 100% |
| CCT | 6376 102% | 7189 90% | 7454 87% | 7679 85% | 6925 94% |
| Color Space (Percent of AdobeRGB 1998) (%) | 40.8 | 60 47% | 36.5 -11% | 37.6 -8% | 38.4 -6% |
| Color Space (Percent of sRGB) (%) | 63.6 | 93 46% | 57.4 -10% | 59.1 -7% | 60.4 -5% |
| Totalt genomsnitt (program/inställningar) | 33% /
28% | -3% /
-5% | -0% /
-9% | 0% /
-6% |
* ... mindre är bättre
Visa svarstider
| ↔ Svarstid svart till vitt | ||
|---|---|---|
| 30.8 ms ... stiga ↗ och falla ↘ kombinerat | ↗ 16.8 ms stiga | 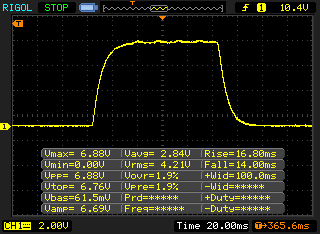 |
| ↘ 14 ms hösten | ||
| Skärmen visar långsamma svarsfrekvenser i våra tester och kommer att vara otillfredsställande för spelare. I jämförelse sträcker sig alla testade enheter från 0.1 (minst) till 240 (maximalt) ms. » 83 % av alla enheter är bättre. Detta innebär att den uppmätta svarstiden är sämre än genomsnittet av alla testade enheter (19.8 ms). | ||
| ↔ Svarstid 50 % grått till 80 % grått | ||
| 45.6 ms ... stiga ↗ och falla ↘ kombinerat | ↗ 23.6 ms stiga | 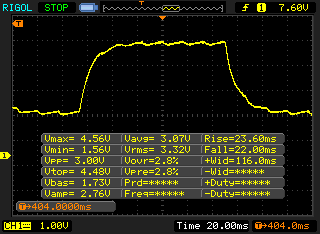 |
| ↘ 22 ms hösten | ||
| Skärmen visar långsamma svarsfrekvenser i våra tester och kommer att vara otillfredsställande för spelare. I jämförelse sträcker sig alla testade enheter från 0.165 (minst) till 636 (maximalt) ms. » 78 % av alla enheter är bättre. Detta innebär att den uppmätta svarstiden är sämre än genomsnittet av alla testade enheter (31 ms). | ||
Skärmflimmer / PWM (Puls-Width Modulation)
| Skärmflimmer / PWM upptäckt | 25910 Hz | ≤ 20 % ljusstyrka inställning | 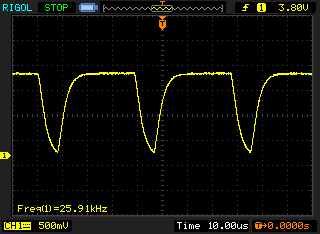 |
Displayens bakgrundsbelysning flimrar vid 25910 Hz (i värsta fall, t.ex. med PWM) Flimrande upptäckt vid en ljusstyrkeinställning på 20 % och lägre. Det ska inte finnas något flimmer eller PWM över denna ljusstyrkeinställning. Frekvensen för 25910 Hz är ganska hög, så de flesta användare som är känsliga för PWM bör inte märka något flimmer. Som jämförelse: 52 % av alla testade enheter använder inte PWM för att dämpa skärmen. Om PWM upptäcktes mättes ett medelvärde av 7763 (minst: 5 - maximum: 343500) Hz. | |||
| PCMark 8 Home Score Accelerated v2 | 3416 poäng | |
| PCMark 8 Work Score Accelerated v2 | 4556 poäng | |
| PCMark 10 Score | 4400 poäng | |
Hjälp | ||
| Lenovo IdeaPad L340-15IRH 81LK00BMGE WDC PC SN520 SDAPMUW-512 | Lenovo Ideapad L340-17IRH 81LL001YGE WDC PC SN520 SDAPMUW-512 | HP Omen 15-dc1020ng WDC PC SN720 SDAQNTW-512G | Asus TUF FX505DT-EB73 Intel SSD 660p SSDPEKNW512G8 | Asus ROG Zephyrus G15 GA502DU Intel SSD 660p SSDPEKNW512G8 | Genomsnitt WDC PC SN520 SDAPMUW-512 | |
|---|---|---|---|---|---|---|
| CrystalDiskMark 5.2 / 6 | 8% | 50% | 9% | 1% | 11% | |
| Write 4K (MB/s) | 103.6 | 100.7 -3% | 112.1 8% | 137.5 33% | 132.2 28% | 115.1 ? 11% |
| Read 4K (MB/s) | 39.91 | 40.26 1% | 42.01 5% | 57 43% | 55.5 39% | 41.4 ? 4% |
| Write Seq (MB/s) | 1160 | 1196 3% | 1964 69% | 984 -15% | 986 -15% | 1208 ? 4% |
| Read Seq (MB/s) | 990 | 1091 10% | 2065 109% | 1564 58% | 1318 33% | 1121 ? 13% |
| Write 4K Q32T1 (MB/s) | 283.4 | 376 33% | 318.2 12% | 237.4 -16% | 220.3 -22% | 421 ? 49% |
| Read 4K Q32T1 (MB/s) | 344.5 | 418.6 22% | 406.7 18% | 340.7 -1% | 315.5 -8% | 393 ? 14% |
| Write Seq Q32T1 (MB/s) | 1455 | 1459 0% | 2534 74% | 959 -34% | 987 -32% | 1388 ? -5% |
| Read Seq Q32T1 (MB/s) | 1690 | 1684 0% | 3438 103% | 1732 2% | 1416 -16% | 1697 ? 0% |
| AS SSD | 11% | 50% | -16% | -20% | 8% | |
| Seq Read (MB/s) | 1090 | 1278 17% | 2955 171% | 1019 -7% | 907 -17% | 1287 ? 18% |
| Seq Write (MB/s) | 1354 | 1327 -2% | 2440 80% | 889 -34% | 926 -32% | 1170 ? -14% |
| 4K Read (MB/s) | 37.77 | 39.59 5% | 40.56 7% | 48.22 28% | 47.26 25% | 40.2 ? 6% |
| 4K Write (MB/s) | 94 | 77 -18% | 118.6 26% | 115.5 23% | 98.7 5% | 104.3 ? 11% |
| 4K-64 Read (MB/s) | 996 | 1027 3% | 1283 29% | 321.5 -68% | 321.5 -68% | 1003 ? 1% |
| 4K-64 Write (MB/s) | 986 | 1270 29% | 1538 56% | 787 -20% | 736 -25% | 1066 ? 8% |
| Access Time Read * (ms) | 0.105 | 0.058 45% | 0.084 20% | 0.065 38% | 0.064 39% | 0.07767 ? 26% |
| Access Time Write * (ms) | 0.039 | 0.036 8% | 0.032 18% | 0.047 -21% | 0.045 -15% | 0.033 ? 15% |
| Score Read (Points) | 1143 | 1195 5% | 1619 42% | 472 -59% | 459 -60% | 1172 ? 3% |
| Score Write (Points) | 1215 | 1480 22% | 1901 56% | 992 -18% | 927 -24% | 1287 ? 6% |
| Score Total (Points) | 2961 | 3294 11% | 4323 46% | 1717 -42% | 1641 -45% | 3059 ? 3% |
| Copy ISO MB/s (MB/s) | 954 | 1418 | 942 | 905 | 954 ? | |
| Copy Program MB/s (MB/s) | 370.5 | 392.5 | 444.5 | 496.9 | 371 ? | |
| Copy Game MB/s (MB/s) | 745 | 907 | 867 | 819 | 745 ? | |
| Totalt genomsnitt (program/inställningar) | 10% /
10% | 50% /
50% | -4% /
-6% | -10% /
-11% | 10% /
9% |
* ... mindre är bättre

| 3DMark 11 - 1280x720 Performance GPU | |
| Genomsnitt av klass Gaming (21841 - 80022, n=106, senaste 2 åren) | |
| Asus ROG Zephyrus G15 GA502DU | |
| Asus TUF FX505DT-EB73 | |
| HP Omen 15-dc1020ng | |
| Lenovo IdeaPad L340-15IRH 81LK00BMGE | |
| Lenovo Ideapad L340-17IRH 81LL001YGE | |
| Genomsnitt NVIDIA GeForce GTX 1650 Mobile (10885 - 13575, n=30) | |
| 3DMark | |
| 1280x720 Cloud Gate Standard Graphics | |
| Genomsnitt av klass Gaming (86886 - 223650, n=62, senaste 2 åren) | |
| HP Omen 15-dc1020ng | |
| Lenovo Ideapad L340-17IRH 81LL001YGE | |
| Genomsnitt NVIDIA GeForce GTX 1650 Mobile (38016 - 66073, n=21) | |
| Lenovo IdeaPad L340-15IRH 81LK00BMGE | |
| Asus ROG Zephyrus G15 GA502DU | |
| Asus TUF FX505DT-EB73 | |
| 1920x1080 Fire Strike Graphics | |
| Genomsnitt av klass Gaming (12242 - 62849, n=118, senaste 2 åren) | |
| Asus ROG Zephyrus G15 GA502DU | |
| HP Omen 15-dc1020ng | |
| Asus TUF FX505DT-EB73 | |
| Lenovo Ideapad L340-17IRH 81LL001YGE | |
| Lenovo IdeaPad L340-15IRH 81LK00BMGE | |
| Genomsnitt NVIDIA GeForce GTX 1650 Mobile (7741 - 9810, n=32) | |
| 2560x1440 Time Spy Graphics | |
| Genomsnitt av klass Gaming (5012 - 26212, n=118, senaste 2 åren) | |
| Asus ROG Zephyrus G15 GA502DU | |
| Asus TUF FX505DT-EB73 | |
| HP Omen 15-dc1020ng | |
| Lenovo IdeaPad L340-15IRH 81LK00BMGE | |
| Genomsnitt NVIDIA GeForce GTX 1650 Mobile (2900 - 3700, n=31) | |
| 3DMark 11 Performance | 11307 poäng | |
| 3DMark Cloud Gate Standard Score | 20115 poäng | |
| 3DMark Fire Strike Score | 7833 poäng | |
| 3DMark Time Spy Score | 3459 poäng | |
Hjälp | ||
| BioShock Infinite - 1920x1080 Ultra Preset, DX11 (DDOF) | |
| Asus ROG Zephyrus G15 GA502DU | |
| HP Omen 15-dc1020ng | |
| Genomsnitt NVIDIA GeForce GTX 1650 Mobile (68.5 - 99.4, n=18) | |
| Lenovo Ideapad L340-17IRH 81LL001YGE | |
| Lenovo IdeaPad L340-15IRH 81LK00BMGE | |
| Asus TUF FX505DT-EB73 | |
| Dota 2 Reborn - 1920x1080 high (2/3) | |
| Genomsnitt av klass Gaming (82.8 - 275, n=109, senaste 2 åren) | |
| Genomsnitt NVIDIA GeForce GTX 1650 Mobile (63.3 - 127, n=20) | |
| HP Omen 15-dc1020ng | |
| Lenovo IdeaPad L340-15IRH 81LK00BMGE | |
| Anno 1800 | |
| 1280x720 Low Graphics Quality (DX11) | |
| Genomsnitt av klass Gaming (n=1senaste 2 åren) | |
| Genomsnitt NVIDIA GeForce GTX 1650 Mobile (49.2 - 74.9, n=4) | |
| Lenovo IdeaPad L340-15IRH 81LK00BMGE | |
| 1920x1080 Medium Graphics Quality (DX11) | |
| Genomsnitt av klass Gaming (n=1senaste 2 åren) | |
| Genomsnitt NVIDIA GeForce GTX 1650 Mobile (43.3 - 69.8, n=5) | |
| Lenovo IdeaPad L340-15IRH 81LK00BMGE | |
| 1920x1080 High Graphics Quality (DX11) | |
| Genomsnitt av klass Gaming (n=1senaste 2 åren) | |
| Genomsnitt NVIDIA GeForce GTX 1650 Mobile (34 - 44.7, n=5) | |
| Lenovo IdeaPad L340-15IRH 81LK00BMGE | |
| 1920x1080 Ultra Graphics Quality (DX11) | |
| Genomsnitt av klass Gaming (n=1senaste 2 åren) | |
| Genomsnitt NVIDIA GeForce GTX 1650 Mobile (17.4 - 22.7, n=5) | |
| Lenovo IdeaPad L340-15IRH 81LK00BMGE | |
| X-Plane 11.11 | |
| 1920x1080 high (fps_test=3) | |
| Genomsnitt av klass Gaming (52.1 - 143.5, n=113, senaste 2 åren) | |
| Genomsnitt NVIDIA GeForce GTX 1650 Mobile (44.5 - 77.3, n=18) | |
| HP Omen 15-dc1020ng | |
| Lenovo IdeaPad L340-15IRH 81LK00BMGE | |
| 1920x1080 med (fps_test=2) | |
| Genomsnitt av klass Gaming (63.8 - 181.2, n=107, senaste 2 åren) | |
| Genomsnitt NVIDIA GeForce GTX 1650 Mobile (50.5 - 93.6, n=18) | |
| HP Omen 15-dc1020ng | |
| Lenovo IdeaPad L340-15IRH 81LK00BMGE | |
| låg | med. | hög | ultra | |
|---|---|---|---|---|
| BioShock Infinite (2013) | 191 | 160.8 | 148.6 | 78.7 |
| The Witcher 3 (2015) | 34.5 | |||
| Dota 2 Reborn (2015) | 114 | 97 | 79 | 73 |
| X-Plane 11.11 (2018) | 73 | 61 | 54.1 | |
| Anno 1800 (2019) | 53.8 | 43.3 | 33.98 | 17.35 |
Ljudnivå
| Låg belastning |
| 28.4 / 28.4 / 28.4 dB(A) |
| Hög belastning |
| 30.1 / 40.2 dB(A) |
 | ||
30 dB tyst 40 dB(A) hörbar 50 dB(A) högt ljud |
||
min: | ||
(±) Den maximala temperaturen på ovansidan är 44.8 °C / 113 F, jämfört med genomsnittet av 40.4 °C / 105 F , allt från 21.2 till 68.8 °C för klassen Gaming.
(-) Botten värms upp till maximalt 58.1 °C / 137 F, jämfört med genomsnittet av 43.2 °C / 110 F
(+) Vid tomgångsbruk är medeltemperaturen för ovansidan 27.3 °C / 81 F, jämfört med enhetsgenomsnittet på 33.9 °C / ### class_avg_f### F.
(±) När du spelar The Witcher 3 är medeltemperaturen för ovansidan 37.9 °C / 100 F, jämfört med enhetsgenomsnittet på 33.9 °C / ## #class_avg_f### F.
(+) Handledsstöden och pekplattan når maximal hudtemperatur (34.6 °C / 94.3 F) och är därför inte varma.
(-) Medeltemperaturen för handledsstödsområdet på liknande enheter var 28.8 °C / 83.8 F (-5.8 °C / -10.5 F).
Lenovo IdeaPad L340-15IRH 81LK00BMGE ljudanalys
(-) | inte särskilt höga högtalare (66.7 dB)
Bas 100 - 315 Hz
(-) | nästan ingen bas - i genomsnitt 18.9% lägre än medianen
(±) | linjäriteten för basen är genomsnittlig (12.8% delta till föregående frekvens)
Mellan 400 - 2000 Hz
(+) | balanserad mellan - endast 3.5% från medianen
(+) | mids är linjära (6.7% delta till föregående frekvens)
Högsta 2 - 16 kHz
(+) | balanserade toppar - endast 2% från medianen
(±) | linjäriteten för toppar är genomsnittlig (8.6% delta till föregående frekvens)
Totalt 100 - 16 000 Hz
(±) | linjäriteten för det totala ljudet är genomsnittlig (23.5% skillnad mot median)
Jämfört med samma klass
» 85% av alla testade enheter i den här klassen var bättre, 5% liknande, 10% sämre
» Den bästa hade ett delta på 6%, genomsnittet var 18%, sämst var 132%
Jämfört med alla testade enheter
» 70% av alla testade enheter var bättre, 6% liknande, 24% sämre
» Den bästa hade ett delta på 4%, genomsnittet var 24%, sämst var 134%
Apple MacBook 12 (Early 2016) 1.1 GHz ljudanalys
(+) | högtalare kan spela relativt högt (83.6 dB)
Bas 100 - 315 Hz
(±) | reducerad bas - i genomsnitt 11.3% lägre än medianen
(±) | linjäriteten för basen är genomsnittlig (14.2% delta till föregående frekvens)
Mellan 400 - 2000 Hz
(+) | balanserad mellan - endast 2.4% från medianen
(+) | mids är linjära (5.5% delta till föregående frekvens)
Högsta 2 - 16 kHz
(+) | balanserade toppar - endast 2% från medianen
(+) | toppar är linjära (4.5% delta till föregående frekvens)
Totalt 100 - 16 000 Hz
(+) | det totala ljudet är linjärt (10.2% skillnad mot median)
Jämfört med samma klass
» 7% av alla testade enheter i den här klassen var bättre, 2% liknande, 91% sämre
» Den bästa hade ett delta på 5%, genomsnittet var 18%, sämst var 53%
Jämfört med alla testade enheter
» 5% av alla testade enheter var bättre, 1% liknande, 94% sämre
» Den bästa hade ett delta på 4%, genomsnittet var 24%, sämst var 134%
| Av/Standby | |
| Låg belastning | |
| Hög belastning |
|
Förklaring:
min: | |
| Lenovo IdeaPad L340-15IRH 81LK00BMGE i5-9300H, GeForce GTX 1650 Mobile, WDC PC SN520 SDAPMUW-512, IPS, 1920x1080, 15.6" | Lenovo Ideapad L340-17IRH 81LL001YGE i5-9300H, GeForce GTX 1650 Mobile, WDC PC SN520 SDAPMUW-512, IPS, 1920x1080, 17.3" | HP Omen 15-dc1020ng i5-9300H, GeForce GTX 1650 Mobile, WDC PC SN720 SDAQNTW-512G, IPS, 1920x1080, 15.6" | Asus TUF FX505DT-EB73 R7 3750H, GeForce GTX 1650 Mobile, Intel SSD 660p SSDPEKNW512G8, IPS, 1920x1080, 15.6" | Asus ROG Zephyrus G15 GA502DU R7 3750H, GeForce GTX 1660 Ti Max-Q, Intel SSD 660p SSDPEKNW512G8, IPS, 1920x1080, 15.6" | Genomsnitt NVIDIA GeForce GTX 1650 Mobile | Genomsnitt av klass Gaming | |
|---|---|---|---|---|---|---|---|
| Power Consumption | -5% | -13% | -30% | -82% | -27% | -148% | |
| Idle Minimum * (Watt) | 3.8 | 3.4 11% | 4.04 -6% | 7 -84% | 7.4 -95% | 4.96 ? -31% | 13 ? -242% |
| Idle Average * (Watt) | 6.6 | 7.7 -17% | 7.2 -9% | 9.9 -50% | 8.6 -30% | 8.61 ? -30% | 18.7 ? -183% |
| Idle Maximum * (Watt) | 8.9 | 9.6 -8% | 11.4 -28% | 12 -35% | 39.1 -339% | 14.8 ? -66% | 24.3 ? -173% |
| Load Average * (Watt) | 78.4 | 75 4% | 80.8 -3% | 68.4 13% | 65.9 16% | 81.7 ? -4% | 108.2 ? -38% |
| Witcher 3 ultra * (Watt) | 82 | 92 -12% | 93.6 -14% | 94.9 -16% | 106.9 -30% | ||
| Load Maximum * (Watt) | 124 | 135 -9% | 144.5 -17% | 130.9 -6% | 141.3 -14% | 131.9 ? -6% | 254 ? -105% |
* ... mindre är bättre
| Lenovo IdeaPad L340-15IRH 81LK00BMGE i5-9300H, GeForce GTX 1650 Mobile, 45 Wh | Lenovo Ideapad L340-17IRH 81LL001YGE i5-9300H, GeForce GTX 1650 Mobile, 45 Wh | HP Omen 15-dc1020ng i5-9300H, GeForce GTX 1650 Mobile, 52.5 Wh | Asus TUF FX505DT-EB73 R7 3750H, GeForce GTX 1650 Mobile, 48 Wh | Asus ROG Zephyrus G15 GA502DU R7 3750H, GeForce GTX 1660 Ti Max-Q, 76 Wh | Genomsnitt av klass Gaming | |
|---|---|---|---|---|---|---|
| Batteridrifttid | 2% | 43% | 10% | 79% | 26% | |
| Reader / Idle (h) | 7.8 | 15.9 104% | 7.8 0% | 15.3 96% | 8.71 ? 12% | |
| WiFi v1.3 (h) | 6.1 | 6.2 2% | 6.4 5% | 4.8 -21% | 8 31% | 7 ? 15% |
| Load (h) | 1 | 1.2 20% | 1.5 50% | 2.1 110% | 1.51 ? 51% | |
| Witcher 3 ultra (h) | 1 |
För
Emot
Omdöme - Bara mindre brister

Läs den fullständiga versionen av den här recensionen på engelska här.
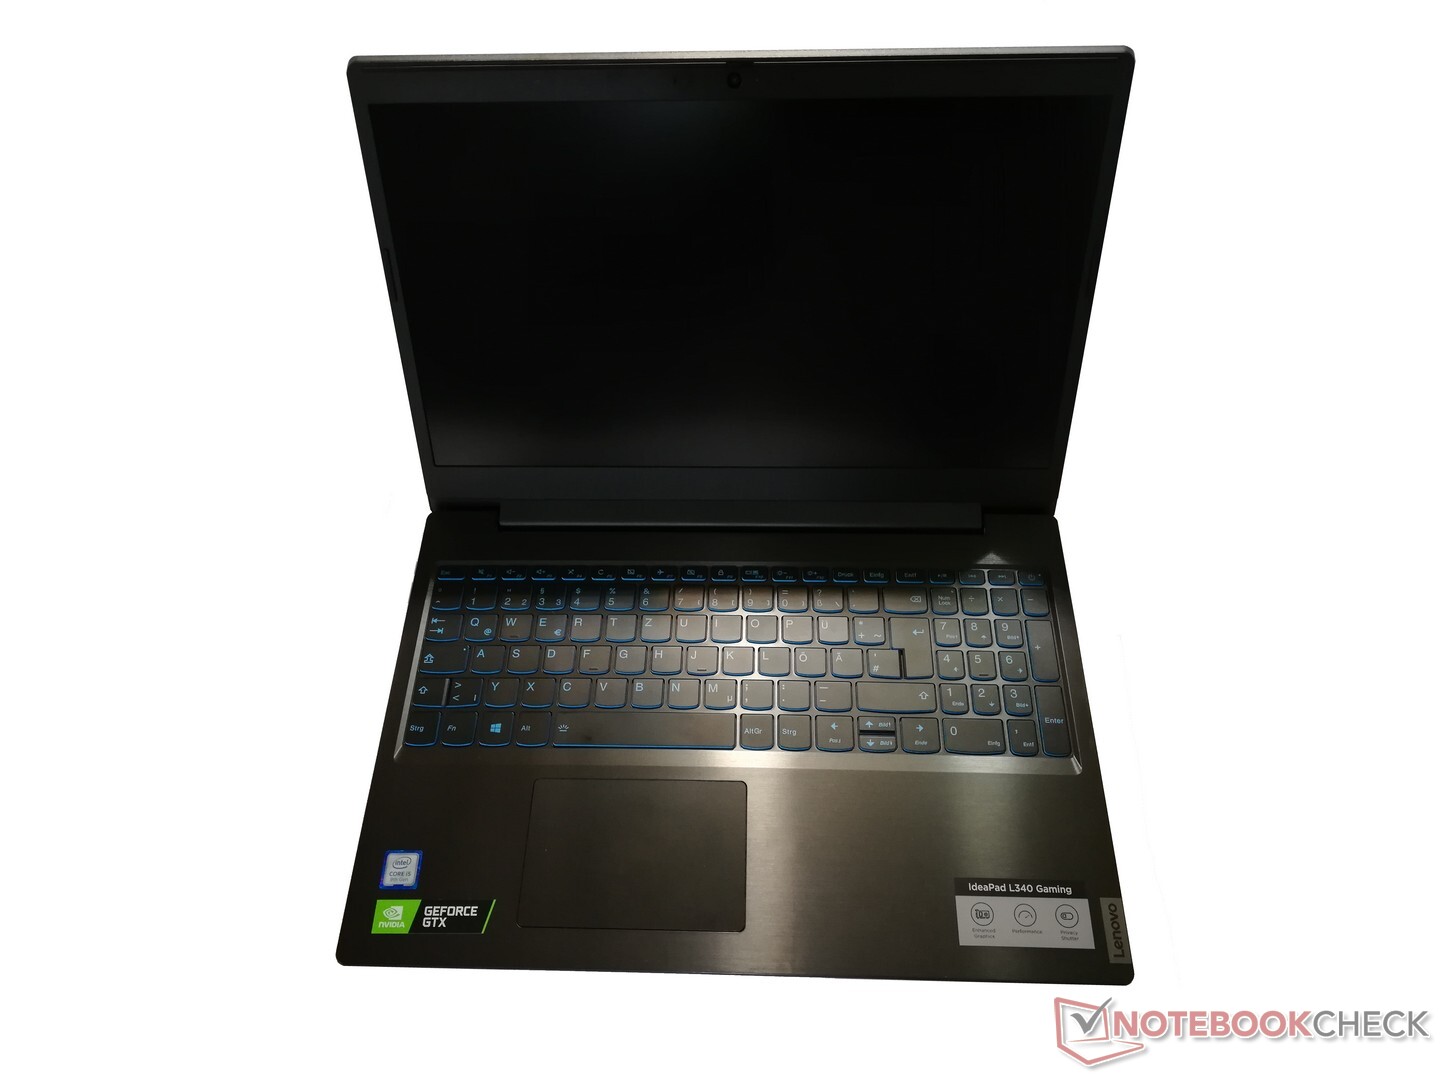
Lenovo IdeaPad L340-15IRH Gaming visar att till och med budgetdatorer med aningen lägre grafikprestanda kan passa bra till spel. Men man får stå ut med en del i utbyte, exempelvis en aningen svag klickplatta samt att datorn saknar minneskortsläsare. Den kunde också haft snabbare WiFi.
Lenovo IdeaPad L340-15IRH Gaming kan spela spel utan problem till ett lågt pris.
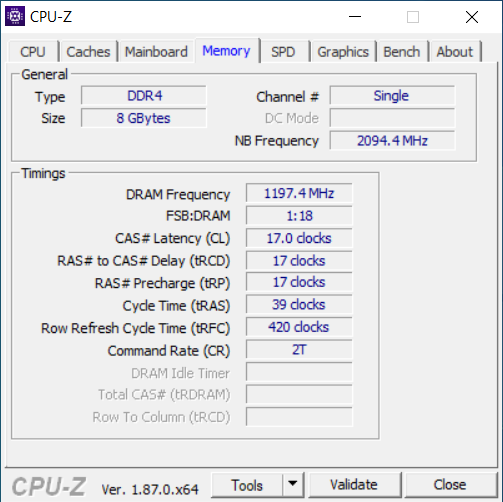
Tillsammans med bra servicemöjligheter och en ljusstark skärm med bra kontrast och svärta är det mycket Lenovo gör rätt. Även om processorn lyckades prestera bra i det motsvarande testet och inte visade upp några tapp i prestanda blev vi förvånade över att prestandan var dålig i testet som rörde generell systemprestanda. Enkelkanals-RAM och SSD-enheten kan vara misstänkta. Även om den sistnämnda kan bytas ut har man tyvärr inget val när det kommer till minnet. Vid vardagsbruk märks dock inte de måttfulla PCMark-resultaten.
Lenovo IdeaPad L340-15IRH 81LK00BMGE
- 09/28/2019 v7 (old)
Mike Wobker