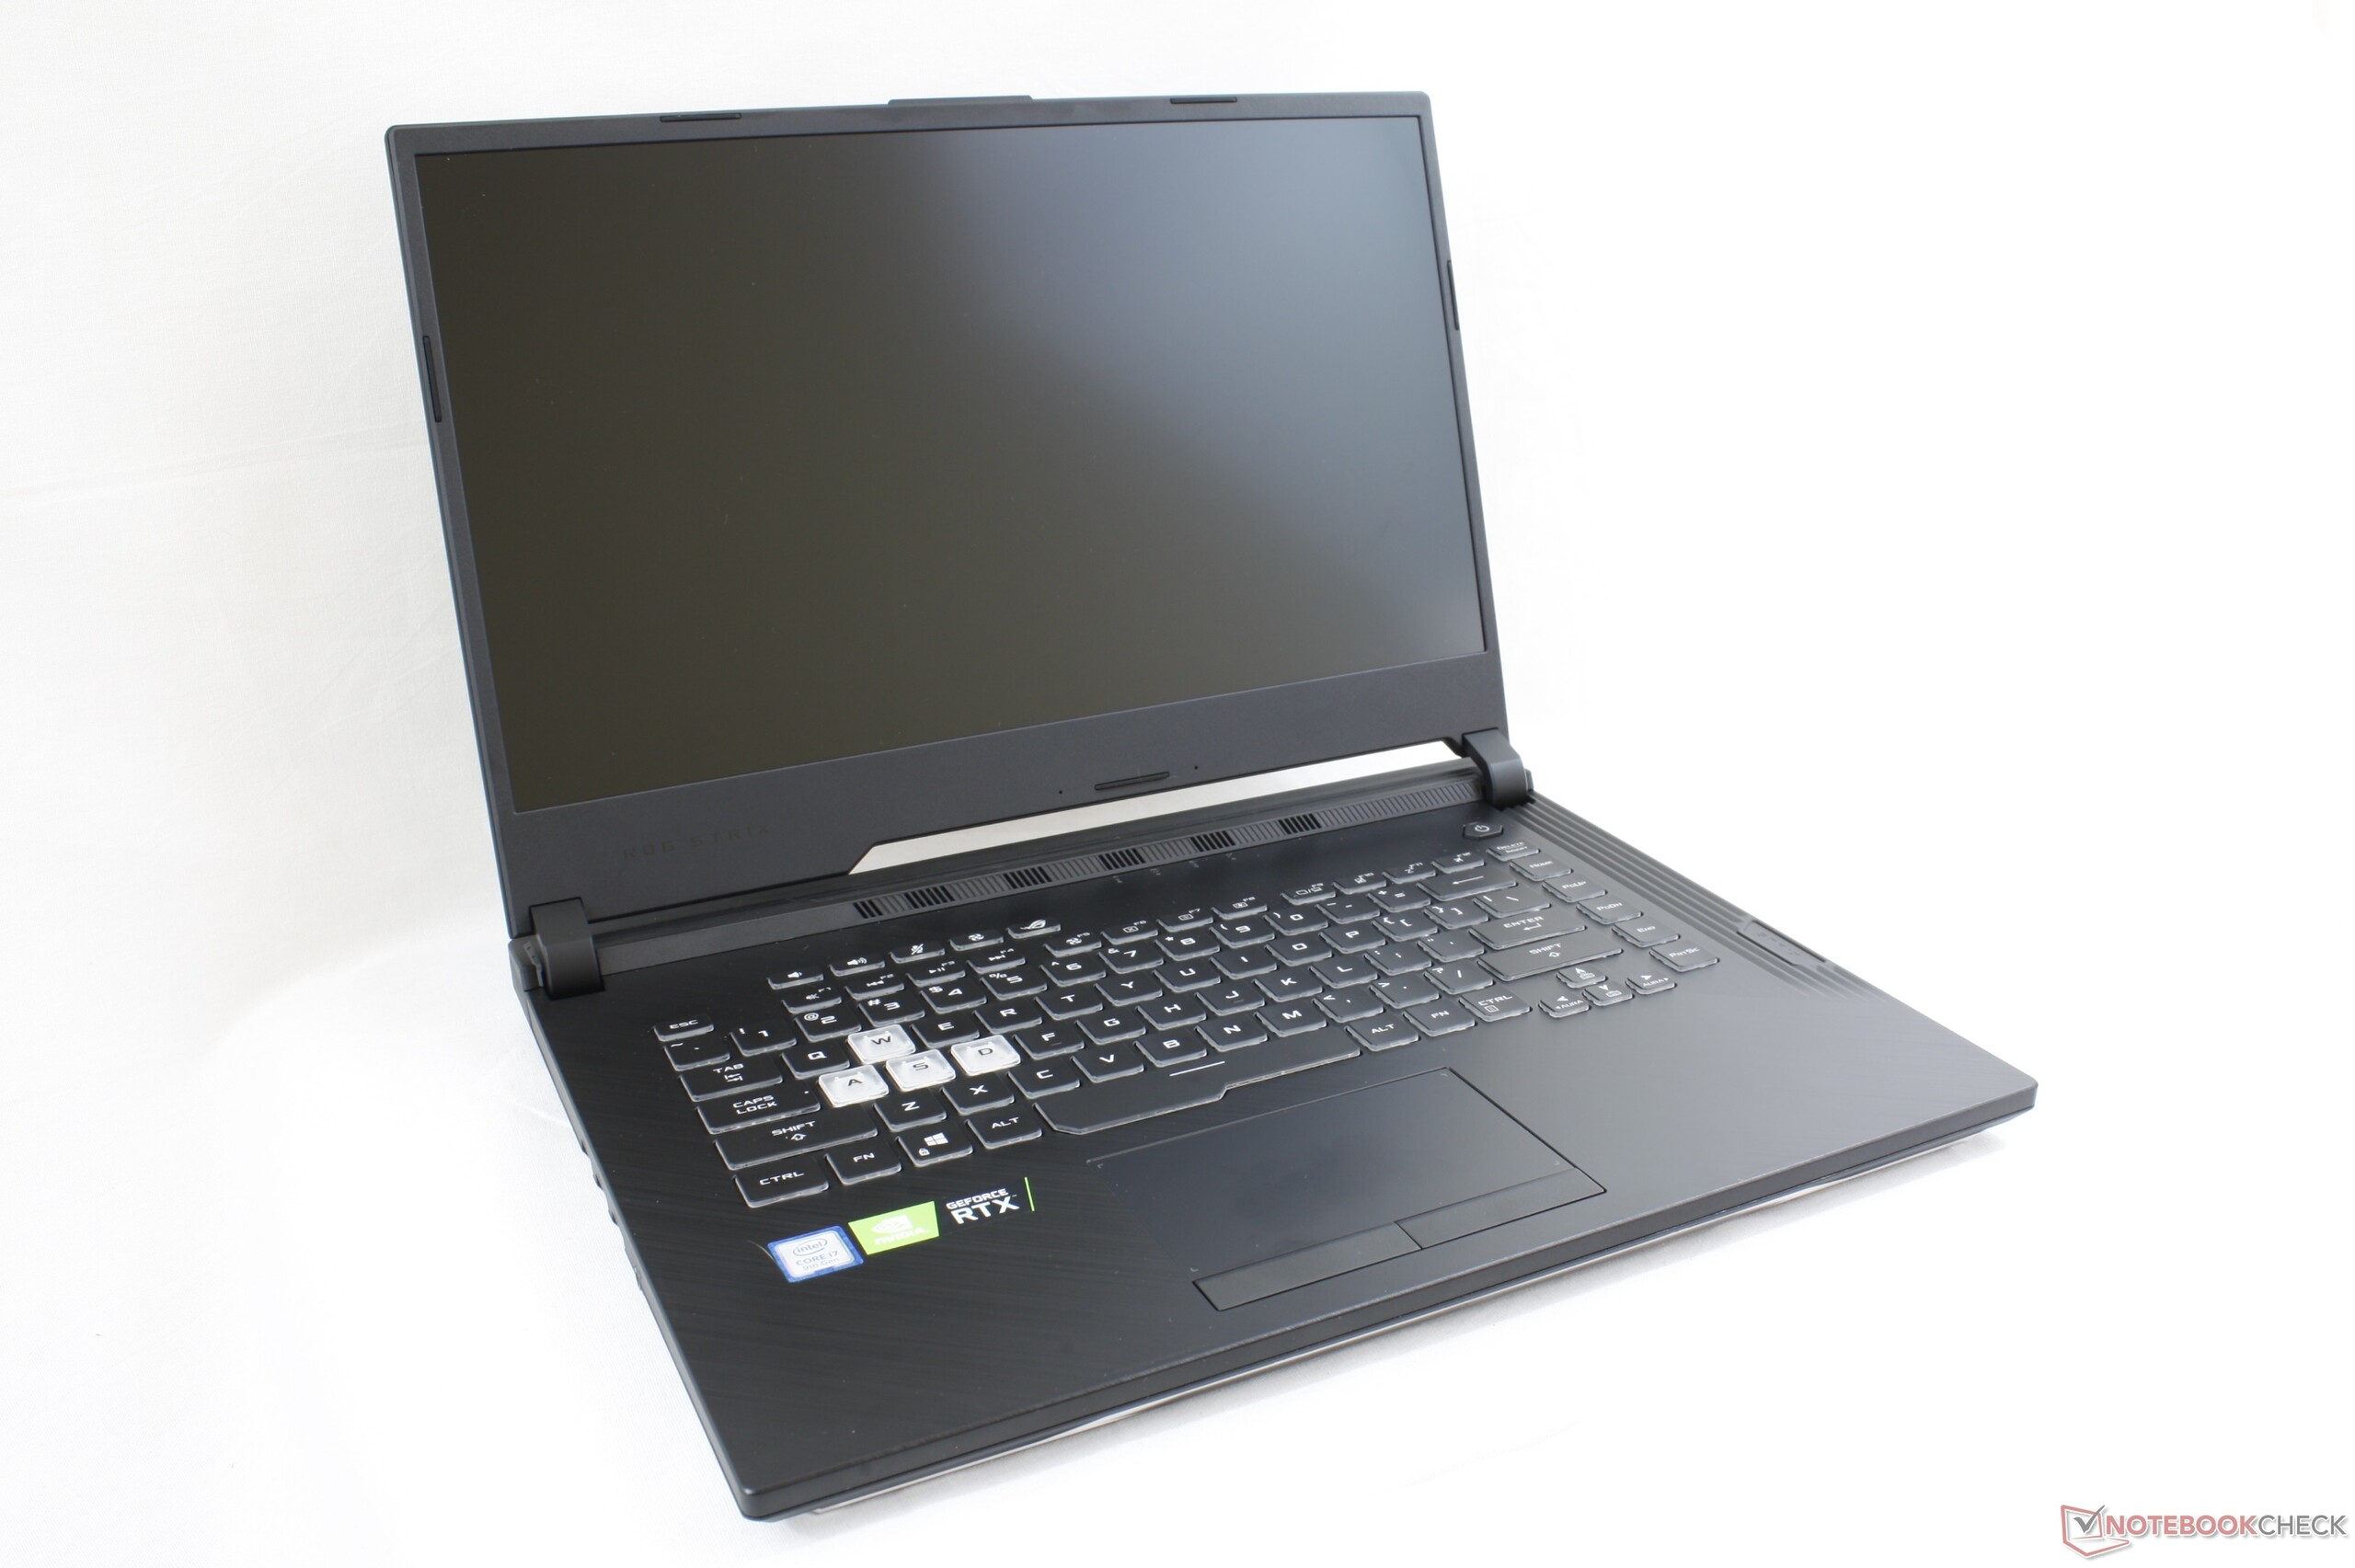
Test: Asus ROG Strix G GL531GV - Som en Zephyrus, fast billigare
| Networking | |
| iperf3 transmit AX12 | |
| Asus Zephyrus S GX502GW | |
| Dell G7 15-7588 | |
| Asus TUF FX505DT-EB73 | |
| Asus Strix GL531GV-PB74 | |
| iperf3 receive AX12 | |
| Asus Zephyrus S GX502GW | |
| Dell G7 15-7588 | |
| Asus Strix GL531GV-PB74 | |
| Asus TUF FX505DT-EB73 | |
| |||||||||||||||||||||||||
Distribution av ljusstyrkan: 86 %
Mitt på batteriet: 290.1 cd/m²
Kontrast: 537:1 (Svärta: 0.54 cd/m²)
ΔE ColorChecker Calman: 5.16 | ∀{0.5-29.43 Ø4.72}
calibrated: 4.35
ΔE Greyscale Calman: 4.4 | ∀{0.09-98 Ø4.97}
60% sRGB (Argyll 1.6.3 3D)
38.1% AdobeRGB 1998 (Argyll 1.6.3 3D)
41.48% AdobeRGB 1998 (Argyll 3D)
60.3% sRGB (Argyll 3D)
40.13% Display P3 (Argyll 3D)
Gamma: 2.1
CCT: 7362 K
| Asus Strix GL531GV-PB74 Panda LM156LF-GL02, IPS, 15.6", 1920x1080 | Asus TUF FX505DT-EB73 Panda LM156LF-GL, IPS, 15.6", 1920x1080 | Asus Zephyrus S GX502GW AU Optronics B156HAN08.2 (AUO82ED), IPS, 15.6", 1920x1080 | Dell G7 15-7588 LG Philips LGD053F, IPS, 15.6", 1920x1080 | Lenovo Legion Y740-15ICHg LP156WFG-SPB2, IPS, 15.6", 1920x1080 | Aorus 15-SA LG Philips LP156WFG-SPB2 (LGD05E8), IPS, 15.6", 1920x1080 | MSI GF63 8RC AU Optronics B156HAN02.1, IPS, 15.6", 1920x1080 | |
|---|---|---|---|---|---|---|---|
| Display | -1% | 57% | -6% | 56% | 58% | -2% | |
| Display P3 Coverage (%) | 40.13 | 39.56 -1% | 64.9 62% | 37.82 -6% | 63.5 58% | 64.3 60% | 39.43 -2% |
| sRGB Coverage (%) | 60.3 | 59.5 -1% | 91 51% | 56.2 -7% | 92.4 53% | 93.6 55% | 59.3 -2% |
| AdobeRGB 1998 Coverage (%) | 41.48 | 40.91 -1% | 65.9 59% | 39.2 -5% | 64.7 56% | 65.6 58% | 40.73 -2% |
| Response Times | -13% | 69% | -27% | 38% | 45% | -17% | |
| Response Time Grey 50% / Grey 80% * (ms) | 26 ? | 30.4 ? -17% | 7.2 ? 72% | 38.8 ? -49% | 18.8 ? 28% | 15.6 ? 40% | 33.2 ? -28% |
| Response Time Black / White * (ms) | 25.6 ? | 27.6 ? -8% | 8.8 ? 66% | 26.8 ? -5% | 13.2 ? 48% | 12.8 ? 50% | 27.2 ? -6% |
| PWM Frequency (Hz) | |||||||
| Screen | 6% | 38% | -11% | 33% | 38% | 6% | |
| Brightness middle (cd/m²) | 290.1 | 286.2 -1% | 286 -1% | 250.9 -14% | 320.4 10% | 266 -8% | 266.6 -8% |
| Brightness (cd/m²) | 274 | 267 -3% | 275 0% | 246 -10% | 298 9% | 254 -7% | 257 -6% |
| Brightness Distribution (%) | 86 | 84 -2% | 90 5% | 89 3% | 85 -1% | 90 5% | 89 3% |
| Black Level * (cd/m²) | 0.54 | 0.33 39% | 0.37 31% | 0.34 37% | 0.42 22% | 0.28 48% | 0.29 46% |
| Contrast (:1) | 537 | 867 61% | 773 44% | 738 37% | 763 42% | 950 77% | 919 71% |
| Colorchecker dE 2000 * | 5.16 | 5.45 -6% | 2.19 58% | 7.34 -42% | 3.21 38% | 3.11 40% | 5.93 -15% |
| Colorchecker dE 2000 max. * | 18.09 | 18.08 -0% | 4.4 76% | 28.66 -58% | 5.54 69% | 5.84 68% | 16.28 10% |
| Colorchecker dE 2000 calibrated * | 4.35 | 4.47 -3% | 2.27 48% | 4.42 -2% | 2.36 46% | 1.37 69% | 3.6 17% |
| Greyscale dE 2000 * | 4.4 | 5.3 -20% | 2.2 50% | 6.8 -55% | 3.6 18% | 3.94 10% | 6.8 -55% |
| Gamma | 2.1 105% | 2.1 105% | 2.41 91% | 2.164 102% | 2.27 97% | 2.53 87% | 2.43 91% |
| CCT | 7362 88% | 7679 85% | 6405 101% | 6780 96% | 6503 100% | 6210 105% | 7192 90% |
| Color Space (Percent of AdobeRGB 1998) (%) | 38.1 | 37.6 -1% | 59 55% | 36 -6% | 59 55% | 60 57% | 37.6 -1% |
| Color Space (Percent of sRGB) (%) | 60 | 59.1 -1% | 91 52% | 56 -7% | 92 53% | 93 55% | 59.3 -1% |
| Totalt genomsnitt (program/inställningar) | -3% /
2% | 55% /
46% | -15% /
-12% | 42% /
38% | 47% /
42% | -4% /
1% |
* ... mindre är bättre
Visa svarstider
| ↔ Svarstid svart till vitt | ||
|---|---|---|
| 25.6 ms ... stiga ↗ och falla ↘ kombinerat | ↗ 14.8 ms stiga | 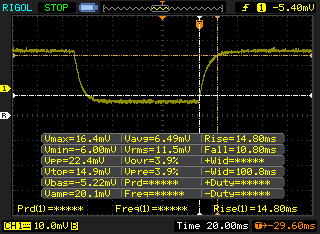 |
| ↘ 10.8 ms hösten | ||
| Skärmen visar relativt långsamma svarsfrekvenser i våra tester och kan vara för långsam för spelare. I jämförelse sträcker sig alla testade enheter från 0.1 (minst) till 240 (maximalt) ms. » 61 % av alla enheter är bättre. Detta innebär att den uppmätta svarstiden är sämre än genomsnittet av alla testade enheter (19.9 ms). | ||
| ↔ Svarstid 50 % grått till 80 % grått | ||
| 26 ms ... stiga ↗ och falla ↘ kombinerat | ↗ 13.6 ms stiga | 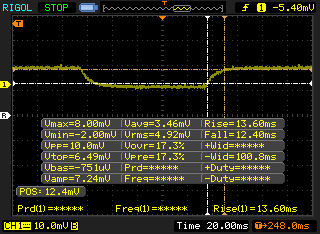 |
| ↘ 12.4 ms hösten | ||
| Skärmen visar relativt långsamma svarsfrekvenser i våra tester och kan vara för långsam för spelare. I jämförelse sträcker sig alla testade enheter från 0.165 (minst) till 636 (maximalt) ms. » 36 % av alla enheter är bättre. Det betyder att den uppmätta svarstiden är bättre än genomsnittet av alla testade enheter (31.1 ms). | ||
Skärmflimmer / PWM (Puls-Width Modulation)
| Skärmflimmer / PWM upptäcktes inte | 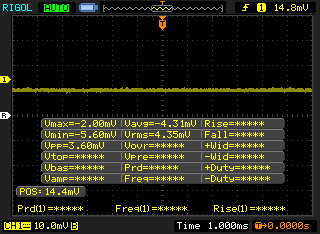 | ||
Som jämförelse: 52 % av alla testade enheter använder inte PWM för att dämpa skärmen. Om PWM upptäcktes mättes ett medelvärde av 7784 (minst: 5 - maximum: 343500) Hz. | |||
| Cinebench R10 | |
| Rendering Multiple CPUs 32Bit | |
| MSI GE75 9SG | |
| Medion Erazer X15805 | |
| Dell G7 15-7588 | |
| Genomsnitt Intel Core i7-9750H (28251 - 36304, n=13) | |
| Eurocom Tornado F5 | |
| Asus FX503VM-EH73 | |
| Rendering Single 32Bit | |
| Medion Erazer X15805 | |
| Eurocom Tornado F5 | |
| MSI GE75 9SG | |
| Genomsnitt Intel Core i7-9750H (6659 - 7214, n=13) | |
| Dell G7 15-7588 | |
| Asus FX503VM-EH73 | |
| wPrime 2.10 - 1024m | |
| MSI GF63 8RC-040XPL | |
| Asus FX503VM-EH73 | |
| Eurocom Tornado F5 | |
| Genomsnitt Intel Core i7-9750H (n=1) | |
| Dell G7 15-7588 | |
| MSI GE75 9SG | |
* ... mindre är bättre
| PCMark 8 Home Score Accelerated v2 | 4251 poäng | |
| PCMark 8 Work Score Accelerated v2 | 5419 poäng | |
| PCMark 10 Score | 5528 poäng | |
Hjälp | ||
| Asus Strix GL531GV-PB74 Intel SSD 660p SSDPEKNW512G8 | Asus TUF FX505DT-EB73 Intel SSD 660p SSDPEKNW512G8 | Asus Zephyrus S GX502GW 2x Intel SSD 660p SSDPEKNW512G8 (RAID 0) | Lenovo Legion Y740-15ICHg Samsung SSD PM981 MZVLB256HAHQ | Aorus 15-SA Intel SSD 760p SSDPEKKW512G8 | |
|---|---|---|---|---|---|
| AS SSD | -8% | 48% | 41% | 47% | |
| Seq Read (MB/s) | 1280 | 1019 -20% | 2506 96% | 1953 53% | 2601 103% |
| Seq Write (MB/s) | 905 | 889 -2% | 1712 89% | 1629 80% | 1507 67% |
| 4K Read (MB/s) | 48.73 | 48.22 -1% | 48.32 -1% | 33.2 -32% | 56.3 16% |
| 4K Write (MB/s) | 107 | 115.5 8% | 103.6 -3% | 88.1 -18% | 110.3 3% |
| 4K-64 Read (MB/s) | 321.1 | 321.5 0% | 624 94% | 757 136% | 877 173% |
| 4K-64 Write (MB/s) | 761 | 787 3% | 1253 65% | 1501 97% | 914 20% |
| Access Time Read * (ms) | 0.058 | 0.065 -12% | 0.08 -38% | 0.077 -33% | 0.05 14% |
| Access Time Write * (ms) | 0.046 | 0.047 -2% | 0.04 13% | 0.043 7% | 0.034 26% |
| Score Read (Points) | 498 | 472 -5% | 923 85% | 985 98% | 1193 140% |
| Score Write (Points) | 958 | 992 4% | 1528 59% | 1752 83% | 1175 23% |
| Score Total (Points) | 1711 | 1717 0% | 2896 69% | 3230 89% | 2938 72% |
| Copy ISO MB/s (MB/s) | 1519 | 942 -38% | 1872 23% | 2104 39% | |
| Copy Program MB/s (MB/s) | 749 | 444.5 -41% | 478.2 -36% | 387.7 -48% | |
| Copy Game MB/s (MB/s) | 943 | 867 -8% | 1165 24% | 1021 8% |
* ... mindre är bättre

| 3DMark 11 Performance | 17903 poäng | |
| 3DMark Cloud Gate Standard Score | 36566 poäng | |
| 3DMark Fire Strike Score | 14439 poäng | |
| 3DMark Time Spy Score | 6154 poäng | |
Hjälp | ||
| Shadow of the Tomb Raider - 1920x1080 Highest Preset AA:T | |
| MSI GE75 9SG | |
| MSI RTX 2060 Gaming Z 6G | |
| Alienware m15 P79F | |
| Genomsnitt NVIDIA GeForce RTX 2060 Mobile (54 - 86, n=22) | |
| Asus Zephyrus S GX502GW | |
| Asus Strix GL531GV-PB74 | |
| Asus ROG Strix G GL731GU-RB74 | |
| HP Pavilion Gaming 17-cd0085cl | |
| Asus TUF FX505DT-EB73 | |
| låg | med. | hög | ultra | |
|---|---|---|---|---|
| BioShock Infinite (2013) | 297 | 273.2 | 258.5 | 145.3 |
| The Witcher 3 (2015) | 266.7 | 189.9 | 117.4 | 63.3 |
| Shadow of the Tomb Raider (2018) | 122 | 92 | 86 | 74 |
| Asus Strix GL531GV-PB74 GeForce RTX 2060 Mobile, i7-9750H, Intel SSD 660p SSDPEKNW512G8 | Asus TUF FX505DT-EB73 GeForce GTX 1650 Mobile, R7 3750H, Intel SSD 660p SSDPEKNW512G8 | Asus Strix Scar III G531GW GeForce RTX 2070 Mobile, i9-9880H, Intel SSD 660p 1TB SSDPEKNW010T8 | Asus Zephyrus S GX502GW GeForce RTX 2070 Mobile, i7-9750H, 2x Intel SSD 660p SSDPEKNW512G8 (RAID 0) | Aorus 15-SA GeForce GTX 1660 Ti Mobile, i7-9750H, Intel SSD 760p SSDPEKKW512G8 | MSI GF63 8RC GeForce GTX 1050 Mobile, i5-8300H, Seagate BarraCuda Pro Compute 1TB ST1000LM049 | |
|---|---|---|---|---|---|---|
| Noise | 6% | -10% | -8% | -11% | 2% | |
| av / miljö * (dB) | 28.2 | 28.2 -0% | 29 -3% | 30 -6% | 29 -3% | 28 1% |
| Idle Minimum * (dB) | 28.8 | 28.2 2% | 30 -4% | 31 -8% | 32 -11% | 33.8 -17% |
| Idle Average * (dB) | 31.4 | 28.2 10% | 37 -18% | 33 -5% | 35 -11% | 34 -8% |
| Idle Maximum * (dB) | 33.3 | 31.4 6% | 39 -17% | 38 -14% | 41 -23% | 34.2 -3% |
| Load Average * (dB) | 46.2 | 39.8 14% | 54 -17% | 50 -8% | 54 -17% | 37.3 19% |
| Witcher 3 ultra * (dB) | 50.5 | 47 7% | 54 -7% | 53 -5% | 52 -3% | 43.4 14% |
| Load Maximum * (dB) | 51.3 | 50.2 2% | 54 -5% | 56 -9% | 56 -9% | 46 10% |
* ... mindre är bättre
Ljudnivå
| Låg belastning |
| 28.8 / 31.4 / 33.3 dB(A) |
| Hög belastning |
| 46.2 / 51.3 dB(A) |
 | ||
30 dB tyst 40 dB(A) hörbar 50 dB(A) högt ljud |
||
min: | ||
(±) Den maximala temperaturen på ovansidan är 43.4 °C / 110 F, jämfört med genomsnittet av 40.4 °C / 105 F , allt från 21.2 till 68.8 °C för klassen Gaming.
(-) Botten värms upp till maximalt 49.2 °C / 121 F, jämfört med genomsnittet av 43.2 °C / 110 F
(+) Vid tomgångsbruk är medeltemperaturen för ovansidan 27.6 °C / 82 F, jämfört med enhetsgenomsnittet på 33.9 °C / ### class_avg_f### F.
(±) När du spelar The Witcher 3 är medeltemperaturen för ovansidan 34.6 °C / 94 F, jämfört med enhetsgenomsnittet på 33.9 °C / ## #class_avg_f### F.
(+) Handledsstöden och pekplattan är kallare än hudtemperaturen med maximalt 27.6 °C / 81.7 F och är därför svala att ta på.
(±) Medeltemperaturen för handledsstödsområdet på liknande enheter var 28.8 °C / 83.8 F (+1.2 °C / 2.1 F).
Asus Strix GL531GV-PB74 ljudanalys
(+) | högtalare kan spela relativt högt (82.7 dB)
Analysis not possible as minimum curve is missing or too high
Apple MacBook 12 (Early 2016) 1.1 GHz ljudanalys
(+) | högtalare kan spela relativt högt (83.6 dB)
Bas 100 - 315 Hz
(±) | reducerad bas - i genomsnitt 11.3% lägre än medianen
(±) | linjäriteten för basen är genomsnittlig (14.2% delta till föregående frekvens)
Mellan 400 - 2000 Hz
(+) | balanserad mellan - endast 2.4% från medianen
(+) | mids är linjära (5.5% delta till föregående frekvens)
Högsta 2 - 16 kHz
(+) | balanserade toppar - endast 2% från medianen
(+) | toppar är linjära (4.5% delta till föregående frekvens)
Totalt 100 - 16 000 Hz
(+) | det totala ljudet är linjärt (10.2% skillnad mot median)
Jämfört med samma klass
» 7% av alla testade enheter i den här klassen var bättre, 2% liknande, 91% sämre
» Den bästa hade ett delta på 5%, genomsnittet var 18%, sämst var 53%
Jämfört med alla testade enheter
» 5% av alla testade enheter var bättre, 1% liknande, 94% sämre
» Den bästa hade ett delta på 4%, genomsnittet var 24%, sämst var 134%
| Av/Standby | |
| Låg belastning | |
| Hög belastning |
|
Förklaring:
min: | |
| Asus Strix GL531GV-PB74 i7-9750H, GeForce RTX 2060 Mobile, Intel SSD 660p SSDPEKNW512G8, IPS, 1920x1080, 15.6" | Asus TUF FX505DT-EB73 R7 3750H, GeForce GTX 1650 Mobile, Intel SSD 660p SSDPEKNW512G8, IPS, 1920x1080, 15.6" | Asus Zephyrus S GX502GW i7-9750H, GeForce RTX 2070 Mobile, 2x Intel SSD 660p SSDPEKNW512G8 (RAID 0), IPS, 1920x1080, 15.6" | Dell G7 15-7588 i7-8750H, GeForce GTX 1060 Max-Q, SK hynix SC311 SATA, IPS, 1920x1080, 15.6" | Lenovo Legion Y740-15ICHg i7-8750H, GeForce RTX 2070 Max-Q, Samsung SSD PM981 MZVLB256HAHQ, IPS, 1920x1080, 15.6" | Aorus 15-SA i7-9750H, GeForce GTX 1660 Ti Mobile, Intel SSD 760p SSDPEKKW512G8, IPS, 1920x1080, 15.6" | Asus Strix GL504GM i7-8750H, GeForce GTX 1060 Mobile, Toshiba NVMe THNSN5256GPU7, IPS, 1920x1080, 15.6" | |
|---|---|---|---|---|---|---|---|
| Power Consumption | 41% | -40% | 40% | -21% | -13% | 11% | |
| Idle Minimum * (Watt) | 10.9 | 7 36% | 24 -120% | 5.5 50% | 22.9 -110% | 20 -83% | 10 8% |
| Idle Average * (Watt) | 14.7 | 9.9 33% | 27 -84% | 7.6 48% | 27.2 -85% | 23 -56% | 16.9 -15% |
| Idle Maximum * (Watt) | 32.4 | 12 63% | 33 -2% | 9 72% | 27.5 15% | 29 10% | 21.1 35% |
| Load Average * (Watt) | 121.9 | 68.4 44% | 129 -6% | 94 23% | 83.4 32% | 87 29% | 112.4 8% |
| Witcher 3 ultra * (Watt) | 143.5 | 94.9 34% | 176 -23% | 116.3 19% | 143.6 -0% | 136 5% | 135.5 6% |
| Load Maximum * (Watt) | 209.6 | 130.9 38% | 216 -3% | 154.4 26% | 160.5 23% | 173 17% | 157.3 25% |
* ... mindre är bättre
| Asus Strix GL531GV-PB74 i7-9750H, GeForce RTX 2060 Mobile, 66 Wh | Asus TUF FX505DT-EB73 R7 3750H, GeForce GTX 1650 Mobile, 48 Wh | Asus Zephyrus S GX502GW i7-9750H, GeForce RTX 2070 Mobile, 76 Wh | Dell G7 15-7588 i7-8750H, GeForce GTX 1060 Max-Q, 56 Wh | Lenovo Legion Y740-15ICHg i7-8750H, GeForce RTX 2070 Max-Q, 57 Wh | Aorus 15-SA i7-9750H, GeForce GTX 1660 Ti Mobile, 62 Wh | Asus Strix Scar III G531GW i9-9880H, GeForce RTX 2070 Mobile, 66 Wh | |
|---|---|---|---|---|---|---|---|
| Batteridrifttid | 153% | 95% | 295% | 47% | 47% | 58% | |
| WiFi v1.3 (h) | 1.9 | 4.8 153% | 3.7 95% | 7.5 295% | 2.8 47% | 2.8 47% | 3 58% |
| Reader / Idle (h) | 7.8 | 5.9 | 10.9 | 3.9 | 3.5 | 5.5 | |
| Load (h) | 1.5 | 1 | 2.2 | 0.8 | 2 | 1.4 |
För
Emot

Läs den fullständiga versionen av den här recensionen på engelska här.
Många av våra kommentarar för 17.3-tumsversionen av Strix G GL731 gäller också för 15.6-tumsversionen Strix G GL531 då de delar samma generella designspråk och har liknande intern hårdvara. I synnerhet är det brister som svårutförd service, små piltangenter, kort batteritid och högljudda fläktar som skulle behöva åtgärdas till nästa generation. Möjligheten att ställa in tangentbordets belysning och LED-remsan separat hade varit särskilt bra att ha.
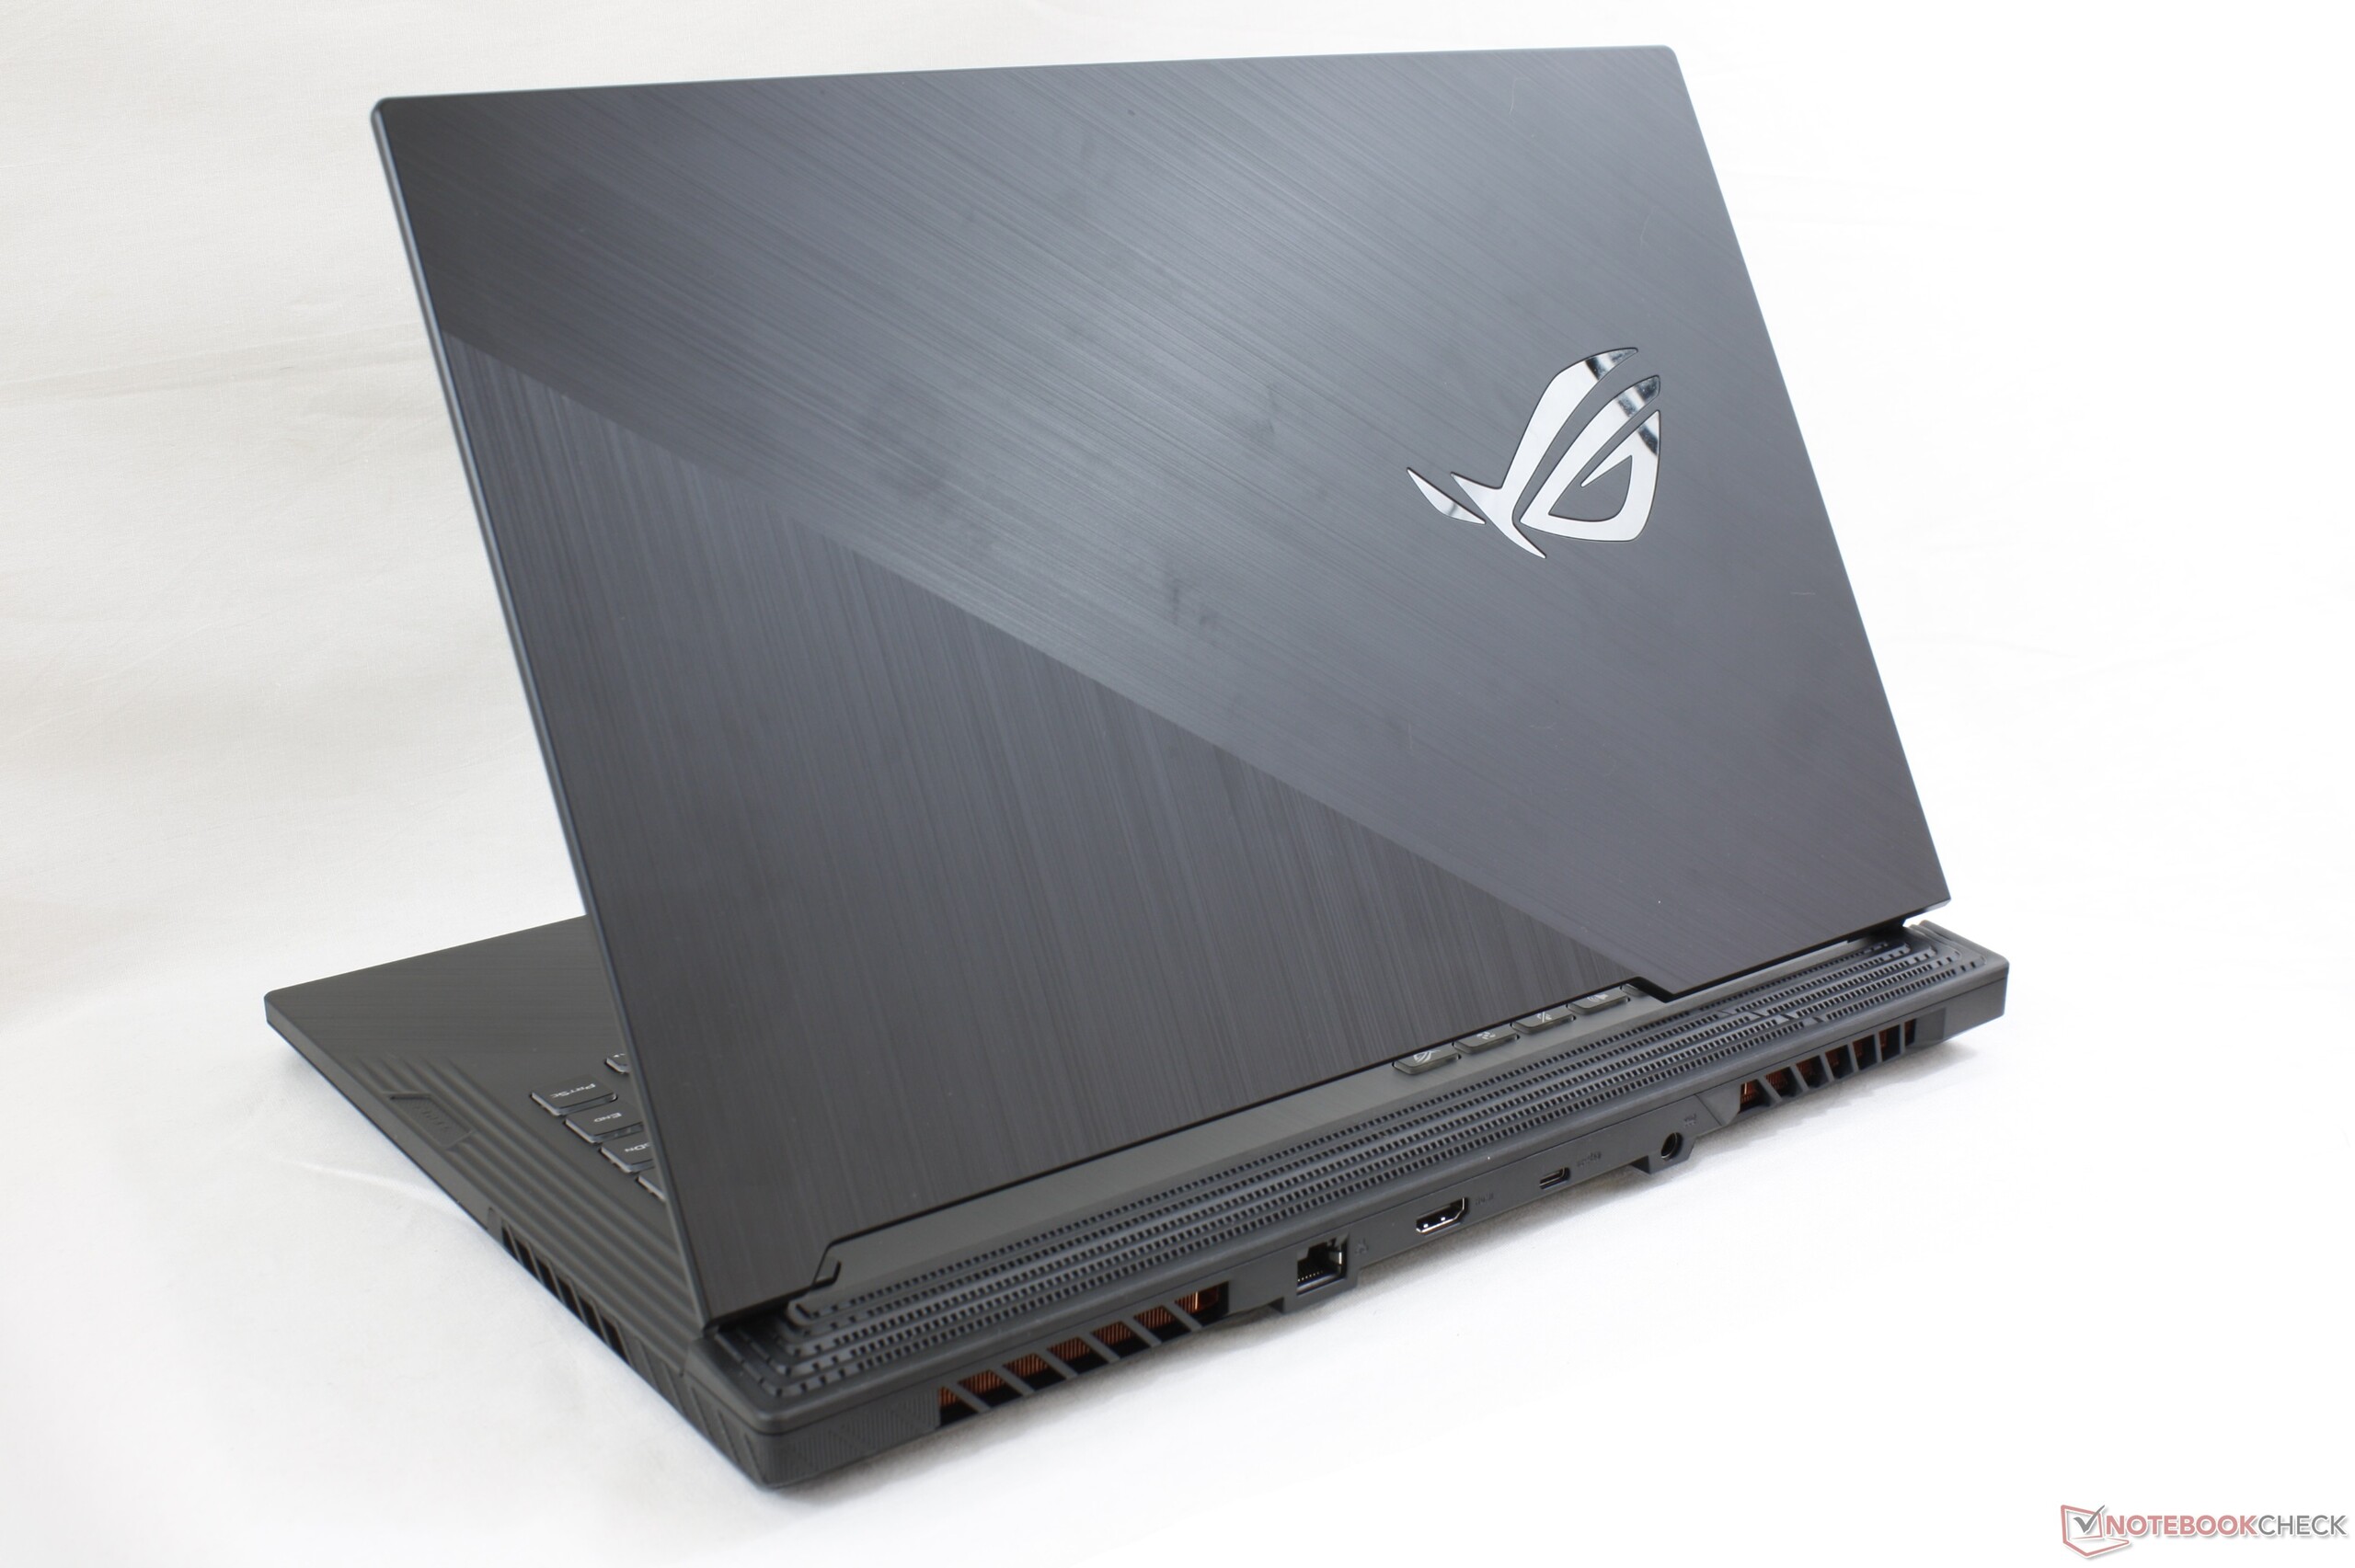
De största fördelarna med GL531 är chassits design och de kraftfulla högtalarna på 3.5 W. För en laptop som i huvudsak består av plast hjälper de texturerade ytorna verkligen med att få den att kännas mer som en toppskiktsmaskin jämfört med andra plastmodeller som Acer Nitro 5 eller MSI:s GP- och GL-serier.
Priset är den största fördelen. För runt 16.000 kronor kostar systemet flera tusen kronor mindre än Zephyrus S-serien samtidigt som den delar många av den sistnämndas kärnspecifikationer och prestandaalternativ. För att spara ännu mer pengar rekommenderar vi att välja varianten med GTX 1660 då den bara är runt 10 procent långsammare i spel om man inte räknar med RTX-specifika funktioner.
Den presterar som en Zephyrus utan att kosta lika mycket. Du får leva med en del irritationsmoment som svårutförd service, små piltangenter, högljudda fläktar och faktum att den saknar en webbkamera. I övrigt är själva spelprestandan lika hög som på de flesta entusiastmodeller.
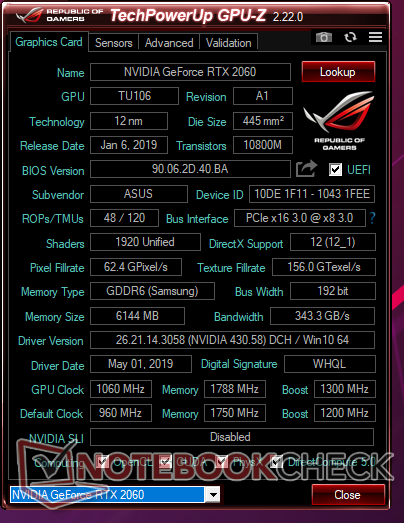
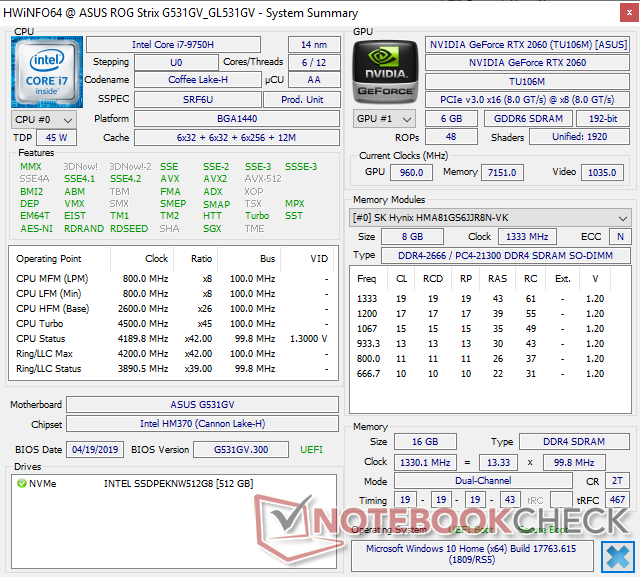
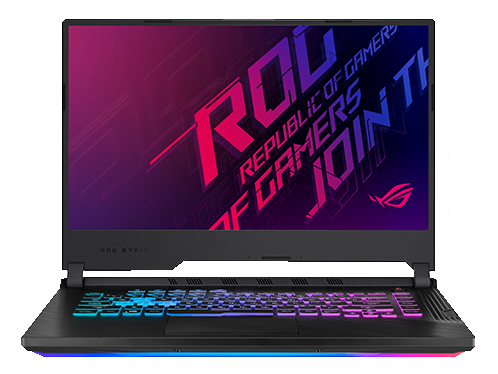
Asus Strix GL531GV-PB74
- 07/18/2020 v7 (old)
Allen Ngo
Price comparison
