Test: Dell G3 15 3579 (i5-8300H, GTX 1050, FHD) Laptop (Sammanfattning)
| SD Card Reader | |
| average JPG Copy Test (av. of 3 runs) | |
| MSI GS63VR 7RG-005 (Toshiba Exceria Pro SDXC 64 GB UHS-II) | |
| Dell Inspiron 15 7000 7577 4K (Toshiba Exceria Pro SDXC 64 GB UHS-II) | |
| Dell G3 15 3579 (Toshiba Exceria Pro SDXC 64 GB UHS-II) | |
| MSI GL63 8RC-069US (Toshiba Exceria Pro SDXC 64 GB UHS-II) | |
| maximum AS SSD Seq Read Test (1GB) | |
| MSI GS63VR 7RG-005 (Toshiba Exceria Pro SDXC 64 GB UHS-II) | |
| Dell Inspiron 15 7000 7577 4K (Toshiba Exceria Pro SDXC 64 GB UHS-II) | |
| Dell G3 15 3579 (Toshiba Exceria Pro SDXC 64 GB UHS-II) | |
| MSI GL63 8RC-069US (Toshiba Exceria Pro SDXC 64 GB UHS-II) | |
| Networking | |
| iperf3 transmit AX12 | |
| Lenovo Yoga 730-15IKB | |
| Dell Inspiron 15 7000 7577 4K | |
| Dell G3 15 3579 | |
| MSI GL63 8RC-069US | |
| iperf3 receive AX12 | |
| Dell Inspiron 15 7000 7577 4K | |
| Lenovo Yoga 730-15IKB | |
| MSI GL63 8RC-069US | |
| Dell G3 15 3579 | |
| |||||||||||||||||||||||||
Distribution av ljusstyrkan: 81 %
Mitt på batteriet: 208.2 cd/m²
Kontrast: 612:1 (Svärta: 0.34 cd/m²)
ΔE ColorChecker Calman: 4.65 | ∀{0.5-29.43 Ø4.71}
calibrated: 3.84
ΔE Greyscale Calman: 4.1 | ∀{0.09-98 Ø4.96}
57.9% sRGB (Argyll 1.6.3 3D)
36.7% AdobeRGB 1998 (Argyll 1.6.3 3D)
39.75% AdobeRGB 1998 (Argyll 3D)
57.9% sRGB (Argyll 3D)
38.48% Display P3 (Argyll 3D)
Gamma: 2.3
CCT: 7352 K
| Dell G3 15 3579 LG Philips LP156WF6, IPS, 15.6", 1920x1080 | MSI GL63 8RC-069US LG Philips LP156WF6-SPK6, IPS, 15.6", 1920x1080 | Asus FX504GD AU Optronics B156HTN03.8, TN LED, 15.6", 1920x1080 | Dell Inspiron 15 7000 7577 4K Name: AU Optronics B156ZAN, IPS, 15.6", 3840x2160 | Dell Inspiron 15 7000 7577 ID: LG Philips LGD053F, Name: 156WF6, Dell P/N: 4XK13, IPS, 15.6", 1920x1080 | |
|---|---|---|---|---|---|
| Display | 2% | -4% | 74% | 5% | |
| Display P3 Coverage (%) | 38.48 | 39.4 2% | 37.09 -4% | 68.4 78% | 40.4 5% |
| sRGB Coverage (%) | 57.9 | 59.2 2% | 55.8 -4% | 97.1 68% | 60.5 4% |
| AdobeRGB 1998 Coverage (%) | 39.75 | 40.72 2% | 38.34 -4% | 69.6 75% | 41.77 5% |
| Response Times | -4% | 3% | -16% | -24% | |
| Response Time Grey 50% / Grey 80% * (ms) | 32.4 ? | 33.6 ? -4% | 41.6 ? -28% | 35.2 ? -9% | 41 ? -27% |
| Response Time Black / White * (ms) | 23.2 ? | 24 ? -3% | 15.2 ? 34% | 28.4 ? -22% | 28 ? -21% |
| PWM Frequency (Hz) | |||||
| Screen | 6% | -19% | 33% | 25% | |
| Brightness middle (cd/m²) | 208.2 | 286.5 38% | 260 25% | 322.9 55% | 257 23% |
| Brightness (cd/m²) | 203 | 258 27% | 241 19% | 309 52% | 229 13% |
| Brightness Distribution (%) | 81 | 82 1% | 85 5% | 90 11% | 84 4% |
| Black Level * (cd/m²) | 0.34 | 0.34 -0% | 0.55 -62% | 0.36 -6% | 0.17 50% |
| Contrast (:1) | 612 | 843 38% | 473 -23% | 897 47% | 1512 147% |
| Colorchecker dE 2000 * | 4.65 | 5.57 -20% | 7 -51% | 3.99 14% | 5.34 -15% |
| Colorchecker dE 2000 max. * | 15.99 | 16.8 -5% | 22.52 -41% | 8.97 44% | 9.99 38% |
| Colorchecker dE 2000 calibrated * | 3.84 | 4.16 -8% | 5.27 -37% | ||
| Greyscale dE 2000 * | 4.1 | 4.6 -12% | 6.1 -49% | 5.3 -29% | 4.82 -18% |
| Gamma | 2.3 96% | 2.15 102% | 1.97 112% | 2.041 108% | 2.46 89% |
| CCT | 7352 88% | 7564 86% | 7894 82% | 6941 94% | 6587 99% |
| Color Space (Percent of AdobeRGB 1998) (%) | 36.7 | 37.4 2% | 35.5 -3% | 62.9 71% | 38 4% |
| Color Space (Percent of sRGB) (%) | 57.9 | 58.9 2% | 61 5% | 96.8 67% | 60 4% |
| Totalt genomsnitt (program/inställningar) | 1% /
4% | -7% /
-14% | 30% /
34% | 2% /
14% |
* ... mindre är bättre
Visa svarstider
| ↔ Svarstid svart till vitt | ||
|---|---|---|
| 23.2 ms ... stiga ↗ och falla ↘ kombinerat | ↗ 13.2 ms stiga | 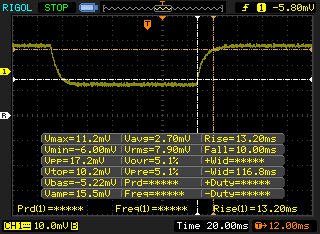 |
| ↘ 10 ms hösten | ||
| Skärmen visar bra svarsfrekvens i våra tester, men kan vara för långsam för konkurrenskraftiga spelare. I jämförelse sträcker sig alla testade enheter från 0.1 (minst) till 240 (maximalt) ms. » 53 % av alla enheter är bättre. Detta innebär att den uppmätta svarstiden är sämre än genomsnittet av alla testade enheter (19.8 ms). | ||
| ↔ Svarstid 50 % grått till 80 % grått | ||
| 32.4 ms ... stiga ↗ och falla ↘ kombinerat | ↗ 14.8 ms stiga | 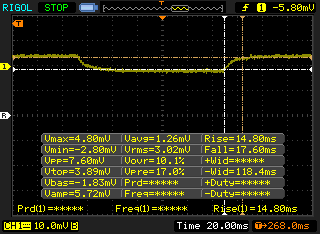 |
| ↘ 17.6 ms hösten | ||
| Skärmen visar långsamma svarsfrekvenser i våra tester och kommer att vara otillfredsställande för spelare. I jämförelse sträcker sig alla testade enheter från 0.165 (minst) till 636 (maximalt) ms. » 44 % av alla enheter är bättre. Det betyder att den uppmätta svarstiden liknar genomsnittet av alla testade enheter (31 ms). | ||
Skärmflimmer / PWM (Puls-Width Modulation)
| Skärmflimmer / PWM upptäcktes inte | 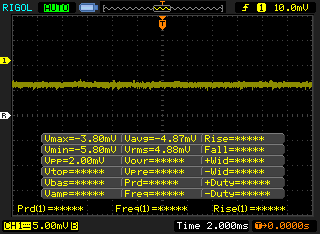 | ||
Som jämförelse: 52 % av alla testade enheter använder inte PWM för att dämpa skärmen. Om PWM upptäcktes mättes ett medelvärde av 7754 (minst: 5 - maximum: 343500) Hz. | |||
| PCMark 10 - Score | |
| Asus FX503VM-EH73 | |
| Lenovo Yoga 730-15IKB | |
| Dell Inspiron 15 7000 7577 4K | |
| MSI GL63 8RC-069US | |
| Genomsnitt Intel Core i5-8300H, NVIDIA GeForce GTX 1050 Mobile (3050 - 4479, n=6) | |
| Dell G3 15 3579 | |
| PCMark 8 Home Score Accelerated v2 | 3930 poäng | |
| PCMark 8 Work Score Accelerated v2 | 4922 poäng | |
| PCMark 10 Score | 3050 poäng | |
Hjälp | ||
| Dell G3 15 3579 Seagate Mobile HDD 1TB ST1000LX015-1U7172 | Asus VivoBook 15 F510UF-ES71 Seagate Mobile HDD 1TB ST1000LM035 | Asus FX504GD Seagate Mobile HDD 1TB ST1000LX015-1U7172 | Dell Latitude 7490 Toshiba KSG60ZMV256G | Dell Inspiron 15 7000 7577 Seagate Mobile HDD 1TB ST1000LX015-1U7172 | |
|---|---|---|---|---|---|
| CrystalDiskMark 5.2 / 6 | 117% | 18% | 10991% | 3% | |
| Write 4K (MB/s) | 0.202 | 1.283 535% | 0.27 34% | 79.4 39207% | 0.42 108% |
| Read 4K (MB/s) | 0.461 | 0.493 7% | 0.586 27% | 27.37 5837% | 0.41 -11% |
| Write Seq (MB/s) | 53.5 | 79.3 48% | 86.8 62% | 343.9 543% | 55.6 4% |
| Read Seq (MB/s) | 107.2 | 136.7 28% | 113.2 6% | 472.7 341% | 114.3 7% |
| Write 4K Q32T1 (MB/s) | 0.882 | 2.266 157% | 0.242 -73% | 206 23256% | 0.238 -73% |
| Read 4K Q32T1 (MB/s) | 1.057 | 1.068 1% | 0.963 -9% | 188.3 17715% | 0.942 -11% |
| Write Seq Q32T1 (MB/s) | 63.7 | 108.7 71% | 98.4 54% | 343.3 439% | 68.2 7% |
| Read Seq Q32T1 (MB/s) | 77.1 | 143.7 86% | 110.2 43% | 533 591% | 69.6 -10% |

| 3DMark | |
| 1280x720 Cloud Gate Standard Graphics | |
| Alienware 15 R4 | |
| MSI GV62 8RE-016US | |
| Razer Blade 15 GTX 1060 | |
| Asus Strix GL502VY-DS71 | |
| Alienware 13 R3 (i5-7300HQ, GTX 1050 Ti) | |
| Zotac GeForce GTX 1050 2GB | |
| Dell G3 15 3579 | |
| Genomsnitt NVIDIA GeForce GTX 1050 Mobile (14979 - 40201, n=40) | |
| Asus GL552VW-DH74 | |
| Acer Aspire E5-575G-549D | |
| HP Spectre x360 15-ch011nr | |
| 1920x1080 Fire Strike Graphics | |
| Alienware 15 R4 | |
| MSI GV62 8RE-016US | |
| Razer Blade 15 GTX 1060 | |
| Asus Strix GL502VY-DS71 | |
| Alienware 13 R3 (i5-7300HQ, GTX 1050 Ti) | |
| Zotac GeForce GTX 1050 2GB | |
| Dell G3 15 3579 | |
| Genomsnitt NVIDIA GeForce GTX 1050 Mobile (4935 - 6651, n=43) | |
| Asus GL552VW-DH74 | |
| HP Spectre x360 15-ch011nr | |
| Acer Aspire E5-575G-549D | |
| 3DMark 11 Performance | 7741 poäng | |
| 3DMark Cloud Gate Standard Score | 21325 poäng | |
| 3DMark Fire Strike Score | 5640 poäng | |
Hjälp | ||
| låg | med. | hög | ultra | |
|---|---|---|---|---|
| BioShock Infinite (2013) | 224 | 184 | 163 | 65.4 |
| The Witcher 3 (2015) | 113.9 | 68.9 | 39.4 | 22 |
| Rise of the Tomb Raider (2016) | 94.3 | 73.5 | 39.1 | 33 |
Ljudnivå
| Låg belastning |
| 29.8 / 29.8 / 30 dB(A) |
| Hög belastning |
| 38.6 / 49.4 dB(A) |
 | ||
30 dB tyst 40 dB(A) hörbar 50 dB(A) högt ljud |
||
min: | ||
| Dell G3 15 3579 GeForce GTX 1050 Mobile, i5-8300H, Seagate Mobile HDD 1TB ST1000LX015-1U7172 | MSI GL63 8RC-069US GeForce GTX 1050 Mobile, i5-8300H, Toshiba HG6 THNSNJ256G8NY | Lenovo Yoga 730-15IKB GeForce GTX 1050 Mobile, i5-8550U, SK Hynix PC401 512GB M.2 (HFS512GD9TNG) | Dell Inspiron 15 7000 7577 4K GeForce GTX 1060 Max-Q, i7-7700HQ, SK hynix SC311 M.2 | Alienware 13 R3 (i5-7300HQ, GTX 1050 Ti) GeForce GTX 1050 Ti Mobile, i5-7300HQ, Samsung PM961 MZVLW256HEHP | |
|---|---|---|---|---|---|
| Noise | -2% | 2% | 3% | 4% | |
| av / miljö * (dB) | 28 | 28.6 -2% | 30.5 -9% | 28.5 -2% | 29.7 -6% |
| Idle Minimum * (dB) | 29.8 | 28.6 4% | 30.5 -2% | 28.8 3% | 29.7 -0% |
| Idle Average * (dB) | 29.8 | 31.6 -6% | 30.5 -2% | 29.2 2% | 29.7 -0% |
| Idle Maximum * (dB) | 30 | 31.6 -5% | 30.5 -2% | 29.2 3% | 29.7 1% |
| Load Average * (dB) | 38.6 | 38.6 -0% | 37.5 3% | 34.6 10% | 32.7 15% |
| Witcher 3 ultra * (dB) | 46.9 | 40.6 13% | 44.1 6% | 36.4 22% | |
| Load Maximum * (dB) | 49.4 | 56.8 -15% | 37.5 24% | 49.3 -0% | 50 -1% |
* ... mindre är bättre
(-) Den maximala temperaturen på ovansidan är 47 °C / 117 F, jämfört med genomsnittet av 40.4 °C / 105 F , allt från 21.2 till 68.8 °C för klassen Gaming.
(-) Botten värms upp till maximalt 61.2 °C / 142 F, jämfört med genomsnittet av 43.2 °C / 110 F
(+) Vid tomgångsbruk är medeltemperaturen för ovansidan 30.3 °C / 87 F, jämfört med enhetsgenomsnittet på 33.9 °C / ### class_avg_f### F.
(+) När du spelar The Witcher 3 är medeltemperaturen för ovansidan 31.2 °C / 88 F, jämfört med enhetsgenomsnittet på 33.9 °C / ## #class_avg_f### F.
(+) Handledsstöden och pekplattan är kallare än hudtemperaturen med maximalt 31.6 °C / 88.9 F och är därför svala att ta på.
(-) Medeltemperaturen för handledsstödsområdet på liknande enheter var 28.8 °C / 83.8 F (-2.8 °C / -5.1 F).
Dell G3 15 3579 ljudanalys
(±) | högtalarljudstyrkan är genomsnittlig men bra (73.3 dB)
Bas 100 - 315 Hz
(-) | nästan ingen bas - i genomsnitt 15.5% lägre än medianen
(±) | linjäriteten för basen är genomsnittlig (13.3% delta till föregående frekvens)
Mellan 400 - 2000 Hz
(+) | balanserad mellan - endast 2.8% från medianen
(±) | linjäriteten för mids är genomsnittlig (7.3% delta till föregående frekvens)
Högsta 2 - 16 kHz
(+) | balanserade toppar - endast 3.3% från medianen
(±) | linjäriteten för toppar är genomsnittlig (9% delta till föregående frekvens)
Totalt 100 - 16 000 Hz
(±) | linjäriteten för det totala ljudet är genomsnittlig (18.1% skillnad mot median)
Jämfört med samma klass
» 57% av alla testade enheter i den här klassen var bättre, 8% liknande, 35% sämre
» Den bästa hade ett delta på 6%, genomsnittet var 18%, sämst var 132%
Jämfört med alla testade enheter
» 39% av alla testade enheter var bättre, 8% liknande, 54% sämre
» Den bästa hade ett delta på 4%, genomsnittet var 23%, sämst var 134%
Apple MacBook 12 (Early 2016) 1.1 GHz ljudanalys
(+) | högtalare kan spela relativt högt (83.6 dB)
Bas 100 - 315 Hz
(±) | reducerad bas - i genomsnitt 11.3% lägre än medianen
(±) | linjäriteten för basen är genomsnittlig (14.2% delta till föregående frekvens)
Mellan 400 - 2000 Hz
(+) | balanserad mellan - endast 2.4% från medianen
(+) | mids är linjära (5.5% delta till föregående frekvens)
Högsta 2 - 16 kHz
(+) | balanserade toppar - endast 2% från medianen
(+) | toppar är linjära (4.5% delta till föregående frekvens)
Totalt 100 - 16 000 Hz
(+) | det totala ljudet är linjärt (10.2% skillnad mot median)
Jämfört med samma klass
» 7% av alla testade enheter i den här klassen var bättre, 2% liknande, 90% sämre
» Den bästa hade ett delta på 5%, genomsnittet var 18%, sämst var 53%
Jämfört med alla testade enheter
» 5% av alla testade enheter var bättre, 1% liknande, 94% sämre
» Den bästa hade ett delta på 4%, genomsnittet var 23%, sämst var 134%
| Av/Standby | |
| Låg belastning | |
| Hög belastning |
|
Förklaring:
min: | |
| Dell G3 15 3579 i5-8300H, GeForce GTX 1050 Mobile, Seagate Mobile HDD 1TB ST1000LX015-1U7172, IPS, 1920x1080, 15.6" | MSI GL63 8RC-069US i5-8300H, GeForce GTX 1050 Mobile, Toshiba HG6 THNSNJ256G8NY, IPS, 1920x1080, 15.6" | Lenovo Yoga 730-15IKB i5-8550U, GeForce GTX 1050 Mobile, SK Hynix PC401 512GB M.2 (HFS512GD9TNG), IPS, 3840x2160, 15.6" | Asus FX504GD i5-8300H, GeForce GTX 1050 Mobile, Seagate Mobile HDD 1TB ST1000LX015-1U7172, TN LED, 1920x1080, 15.6" | Dell Inspiron 15 7000 7577 4K i7-7700HQ, GeForce GTX 1060 Max-Q, SK hynix SC311 M.2, IPS, 3840x2160, 15.6" | |
|---|---|---|---|---|---|
| Power Consumption | 7% | 27% | 8% | 11% | |
| Idle Minimum * (Watt) | 7.9 | 7.1 10% | 4.8 39% | 7.2 9% | 5.5 30% |
| Idle Average * (Watt) | 9.6 | 9.8 -2% | 10.1 -5% | 10.2 -6% | 10.5 -9% |
| Idle Maximum * (Watt) | 13 | 10.4 20% | 10.7 18% | 10.9 16% | 10.9 16% |
| Load Average * (Watt) | 93 | 88.8 5% | 44 53% | 93.3 -0% | 72 23% |
| Witcher 3 ultra * (Watt) | 100.6 | 93.3 7% | 95.8 5% | 97.4 3% | |
| Load Maximum * (Watt) | 132.7 | 132.5 -0% | 94.7 29% | 102.5 23% | 130.4 2% |
* ... mindre är bättre
| Dell G3 15 3579 i5-8300H, GeForce GTX 1050 Mobile, 56 Wh | MSI GL63 8RC-069US i5-8300H, GeForce GTX 1050 Mobile, 41 Wh | Lenovo Yoga 730-15IKB i5-8550U, GeForce GTX 1050 Mobile, 51.5 Wh | Asus FX504GD i5-8300H, GeForce GTX 1050 Mobile, 48 Wh | Dell Inspiron 15 7000 7577 4K i7-7700HQ, GeForce GTX 1060 Max-Q, 56 Wh | Asus FX503VM-EH73 i7-7700HQ, GeForce GTX 1060 Mobile, 64 Wh | |
|---|---|---|---|---|---|---|
| Batteridrifttid | -51% | -35% | -51% | -25% | -40% | |
| Reader / Idle (h) | 7.3 | 11.6 | 7.5 | 10 | 5.7 | |
| WiFi v1.3 (h) | 6.5 | 4.3 -34% | 6.2 -5% | 3.7 -43% | 5.4 -17% | 4.6 -29% |
| Load (h) | 2.2 | 0.7 -68% | 0.8 -64% | 0.9 -59% | 1.5 -32% | 1.1 -50% |
För
Emot
Läs den fullständiga versionen av den här recensionen på engelska här.
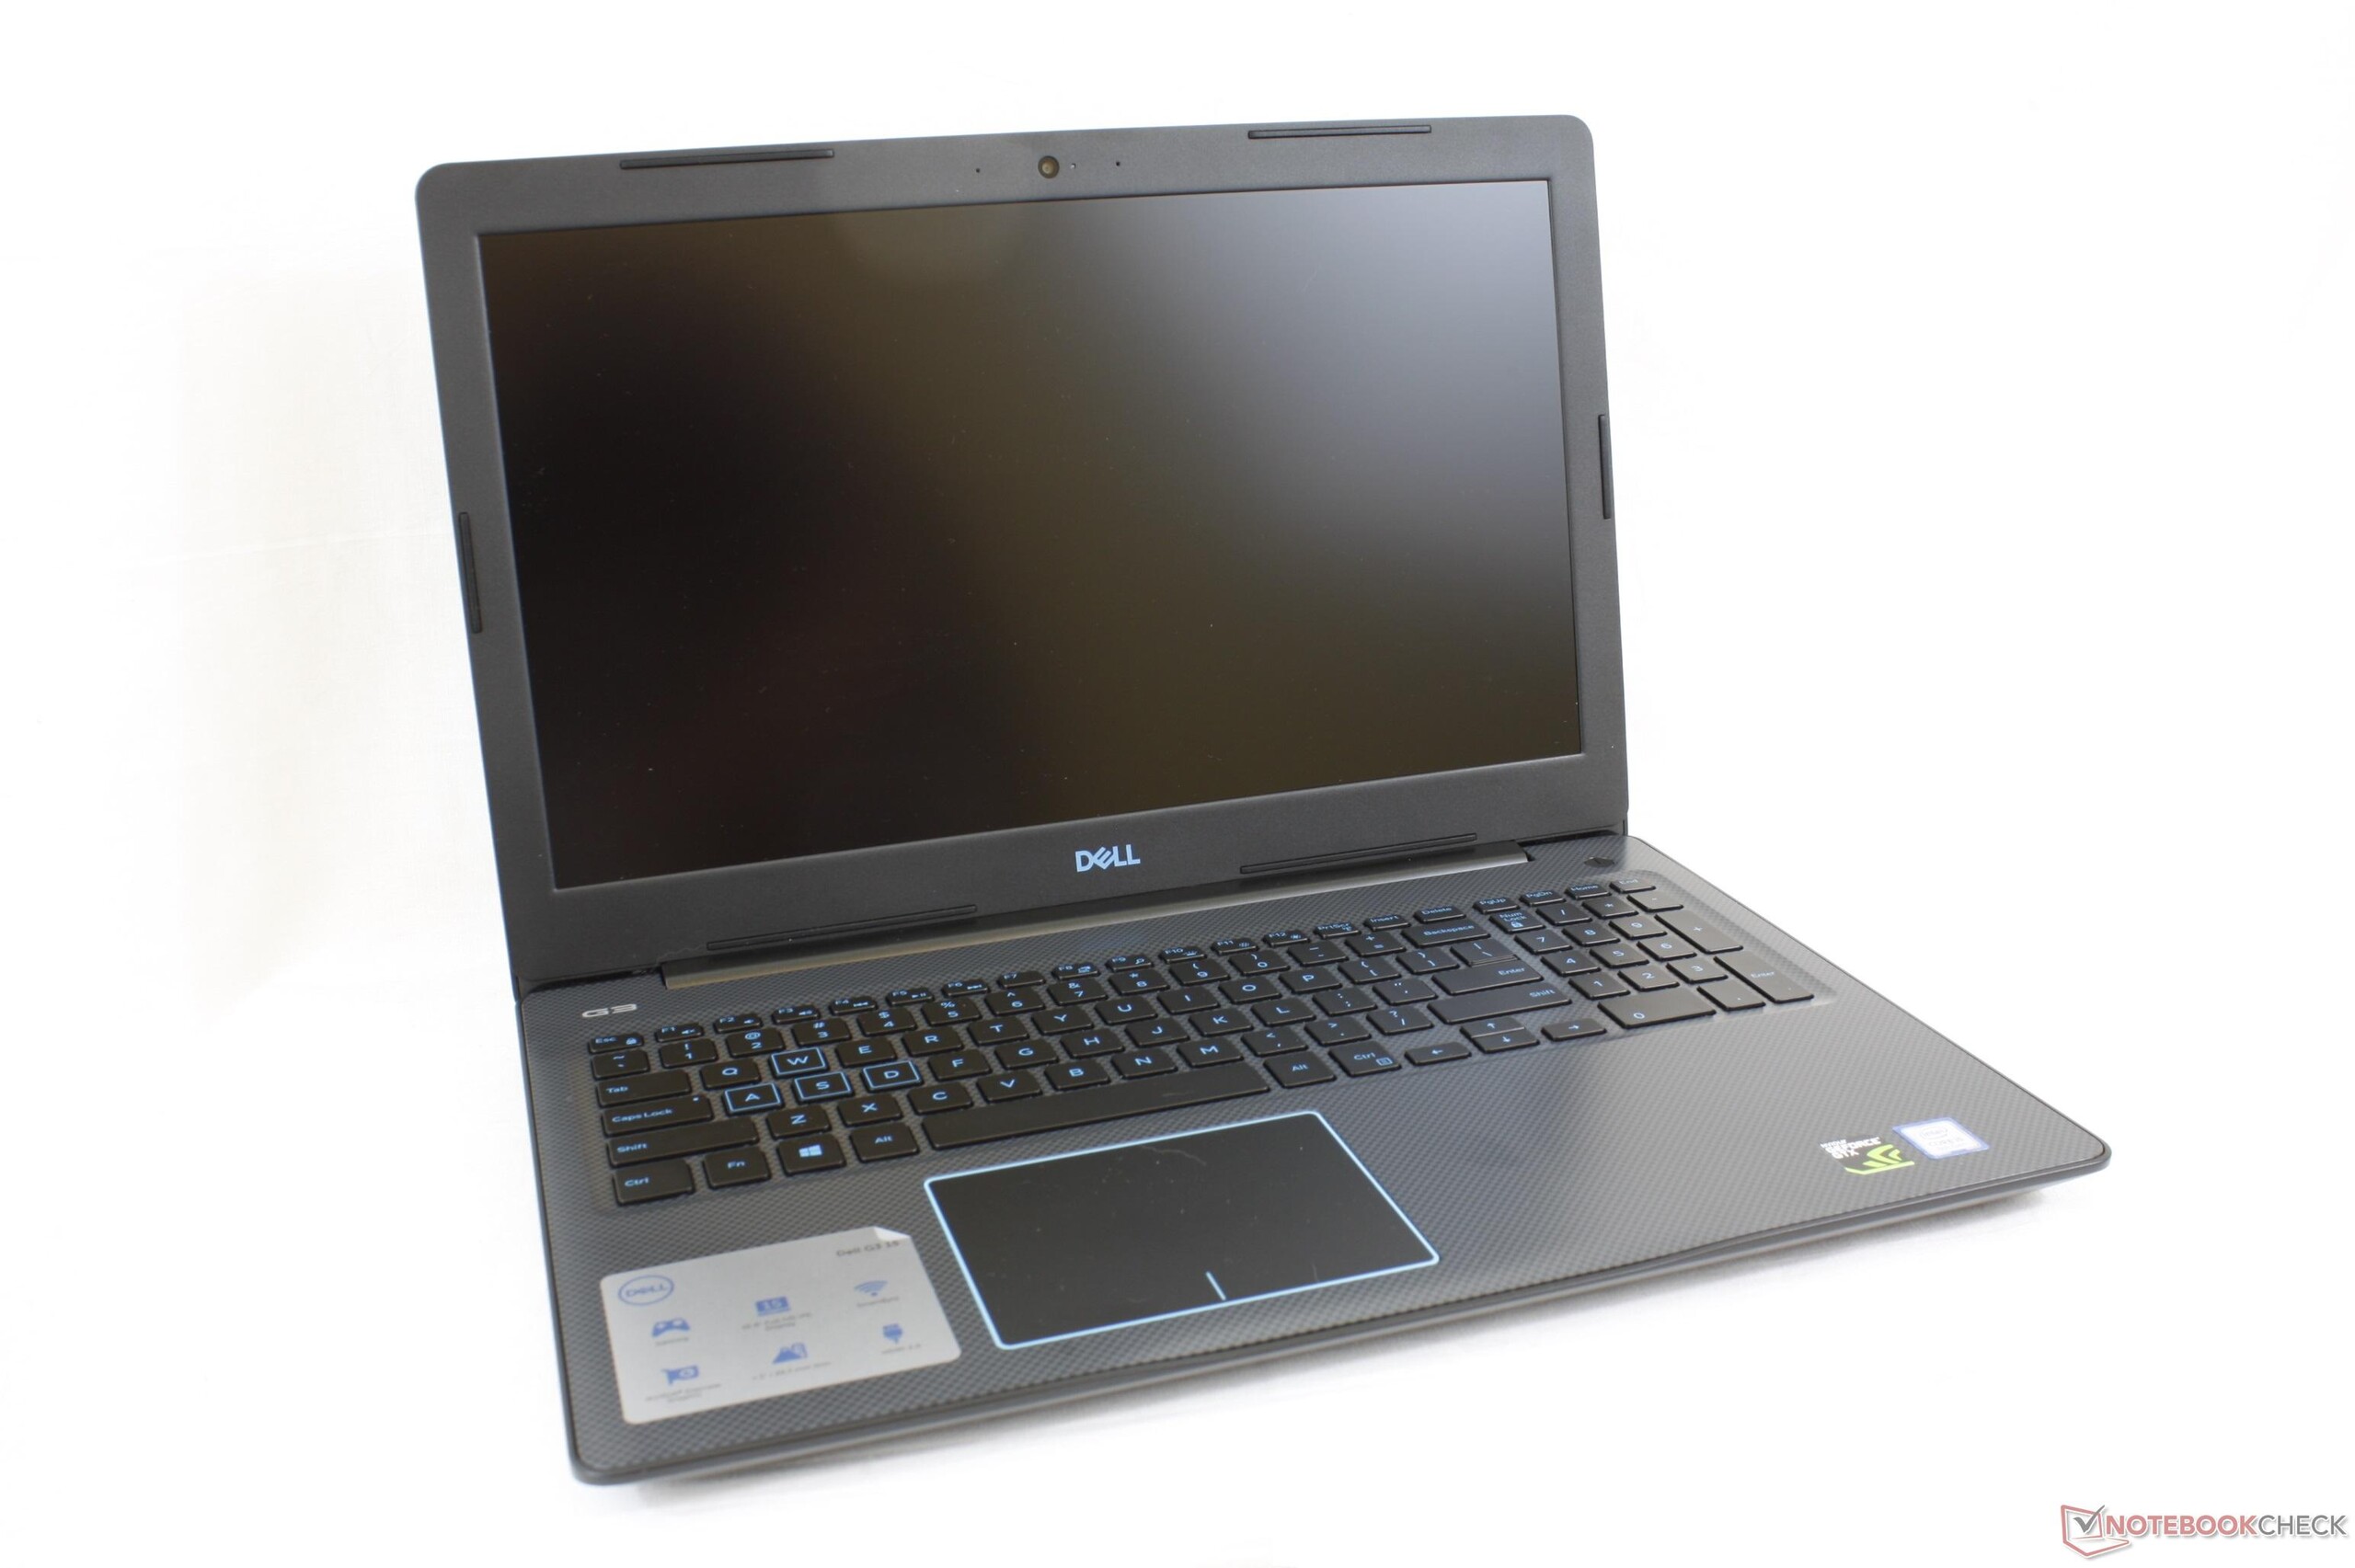
Dell G3 är tänkt att vara en billig spellaptop positionerad någonstans under G5-, G7- och Alienware-serierna. Den ger definitivt det intrycket då den onekligen känns mycket billigare och vekare än förra årets Inspiron 15 7577. De HP Pavilion-lika handledsstöden i plast, dom mjuka tangentbordsknapparna, den mjuka styrplattan, svårigheten att utföra service, långsamt 1x1 WLAN och en mörk skärm är alla saker som tyder på nedskärningar. Till och med USB Typ C är förvisat till att vara ett tillval istället för en standardfunktion. Det är svårt att ignorera de kostnadsbesparande åtgärder som G3 13 för med sig.
Lyckligtvis är kärnprestandan en höjdpunkt med denna laptop. Systemet kan upprätthålla höga Turbo Boost-klockfrekvenser mycket bättre än förväntat och den har svala kärntemperaturer vid spelande. Den nya designen är relativt lätt och liten för sitt pris och vi är glada att se att alternativet med den bottenlöst dåliga TN-skärmen tillslut är borta. Fläktens ljudnivå kunde förbättrats då systemet låter mer än många av dess konkurrenter med samma GPU.
Det är svårt att rekommendera G3 15 även om den har ett utgångspris på 9.000 kronor. Det vore bättre att investera i den äldre Inspiron 15 7577 med Core i7-7700HQ då den borde ge ungefär samma prestanda som vår G3 med i5-8300H. Inspiron-modellen är större och tyngre, men kompenserar för dessa tillkortakommanden med bättre servicemöjligheter, tystare fläktar, en Thunderbolt 3-port och betydligt bättre konstruktionskvalitet, hela vägen från toppen till botten.
G3 15 är Dells billigaste spellaptop hittills och den försöker inte dölja detta. Förra årets Inspiron 15 7567 och 7577 är bättre på i princip alla sätt, särskilt nu när dom går att få för samma pris.
Dell G3 15 3579
- 07/28/2018 v6 (old)
Allen Ngo
Price comparison
