Test: Dell Inspiron 15 7000 7577 (i5-7300HQ, GTX 1050, 1080p) Laptop (Sammanfattning)


| SD Card Reader | |
| average JPG Copy Test (av. of 3 runs) | |
| Dell Inspiron 15 7000 7577 (Toshiba Exceria Pro SDXC 64 GB UHS-II) | |
| MSI GL62M 7RD-077 (Toshiba Exceria Pro SDXC 64 GB UHS-II) | |
| Acer Aspire VX15 VX5-591G-589S (Toshiba Exceria Pro SDXC 64 GB UHS-II) | |
| Dell Inspiron 15 7000 7577 (Toshiba Exceria Pro SDXC 64 GB UHS-II) | |
| maximum AS SSD Seq Read Test (1GB) | |
| Dell Inspiron 15 7000 7577 (Toshiba Exceria Pro SDXC 64 GB UHS-II) | |
| Dell Inspiron 15 7000 7577 (Toshiba Exceria Pro SDXC 64 GB UHS-II) | |
| MSI GL62M 7RD-077 (Toshiba Exceria Pro SDXC 64 GB UHS-II) | |
| Acer Aspire VX15 VX5-591G-589S (Toshiba Exceria Pro SDXC 64 GB UHS-II) | |
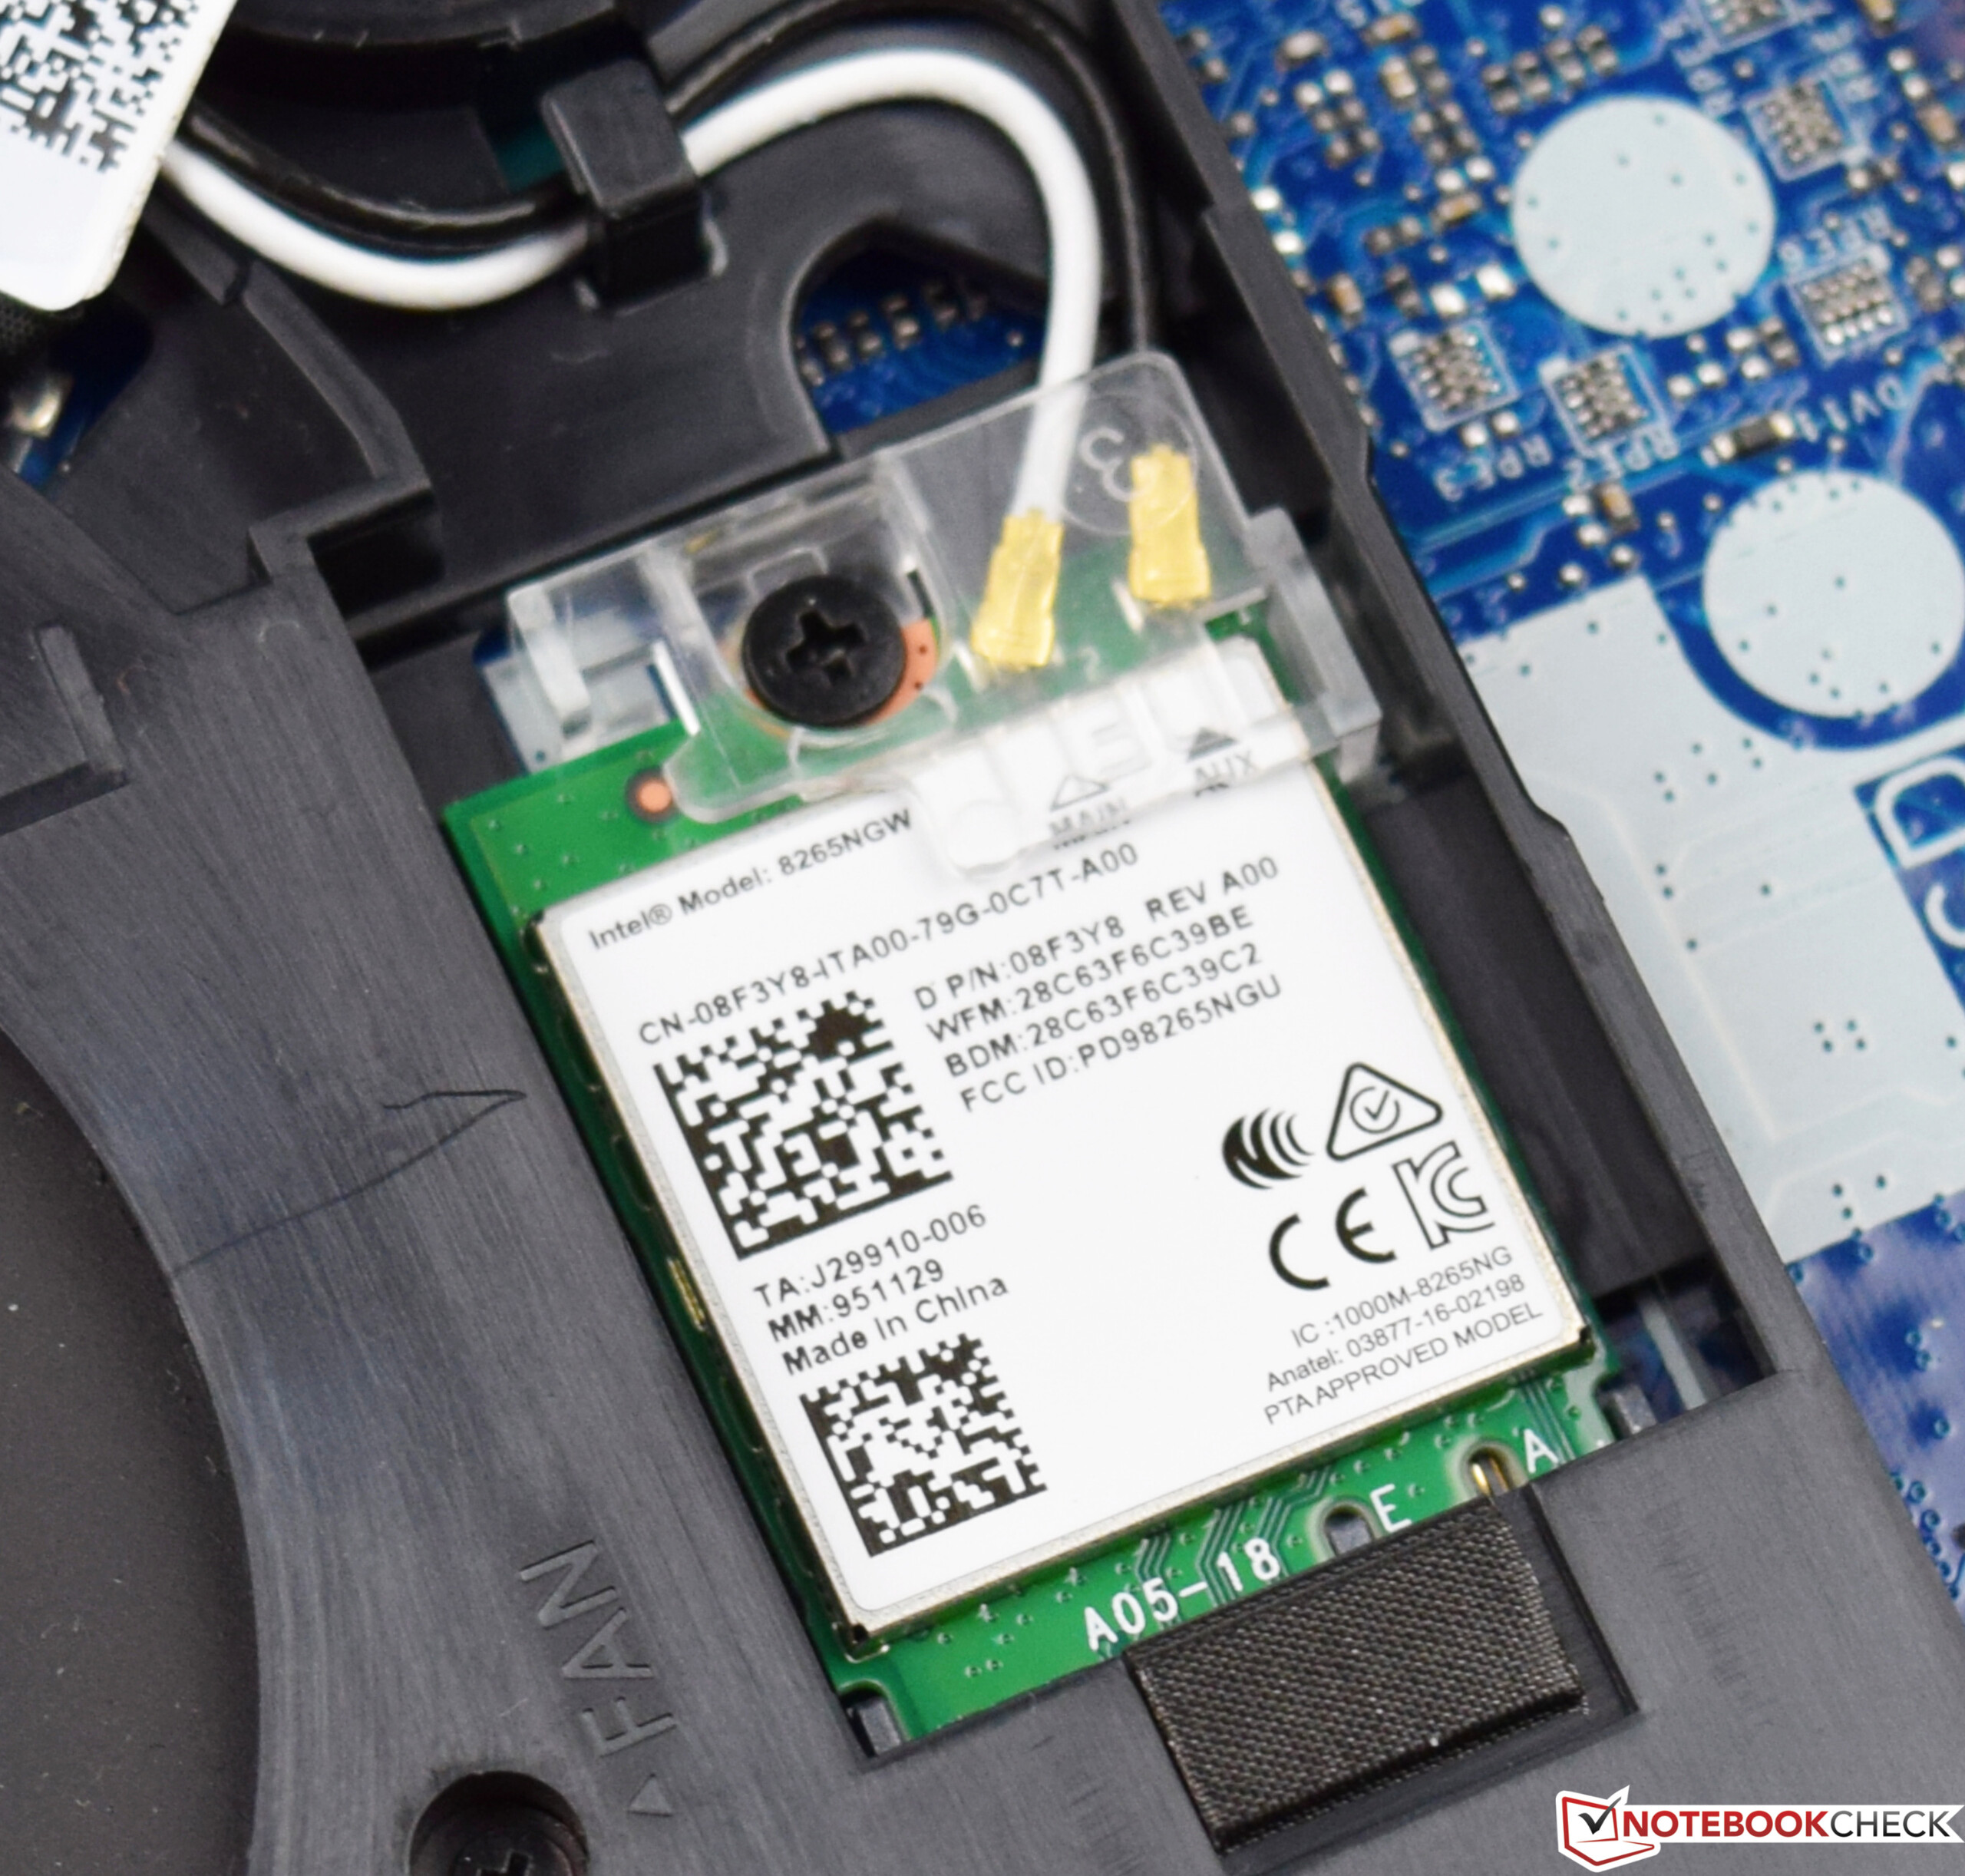
| Networking | |
| iperf3 transmit AX12 | |
| Dell Inspiron 15 7000 7577 | |
| Acer Aspire VX15 VX5-591G-589S | |
| Dell Inspiron 15 7000 7577 | |
| Lenovo Legion Y520-15IKBN 80WK0042GE | |
| MSI GL62M 7RD-077 (jseb) | |
| iperf3 receive AX12 | |
| Acer Aspire VX15 VX5-591G-589S | |
| Dell Inspiron 15 7000 7577 | |
| Dell Inspiron 15 7000 7577 | |
| MSI GL62M 7RD-077 (jseb) | |
| Lenovo Legion Y520-15IKBN 80WK0042GE | |
| |||||||||||||||||||||||||
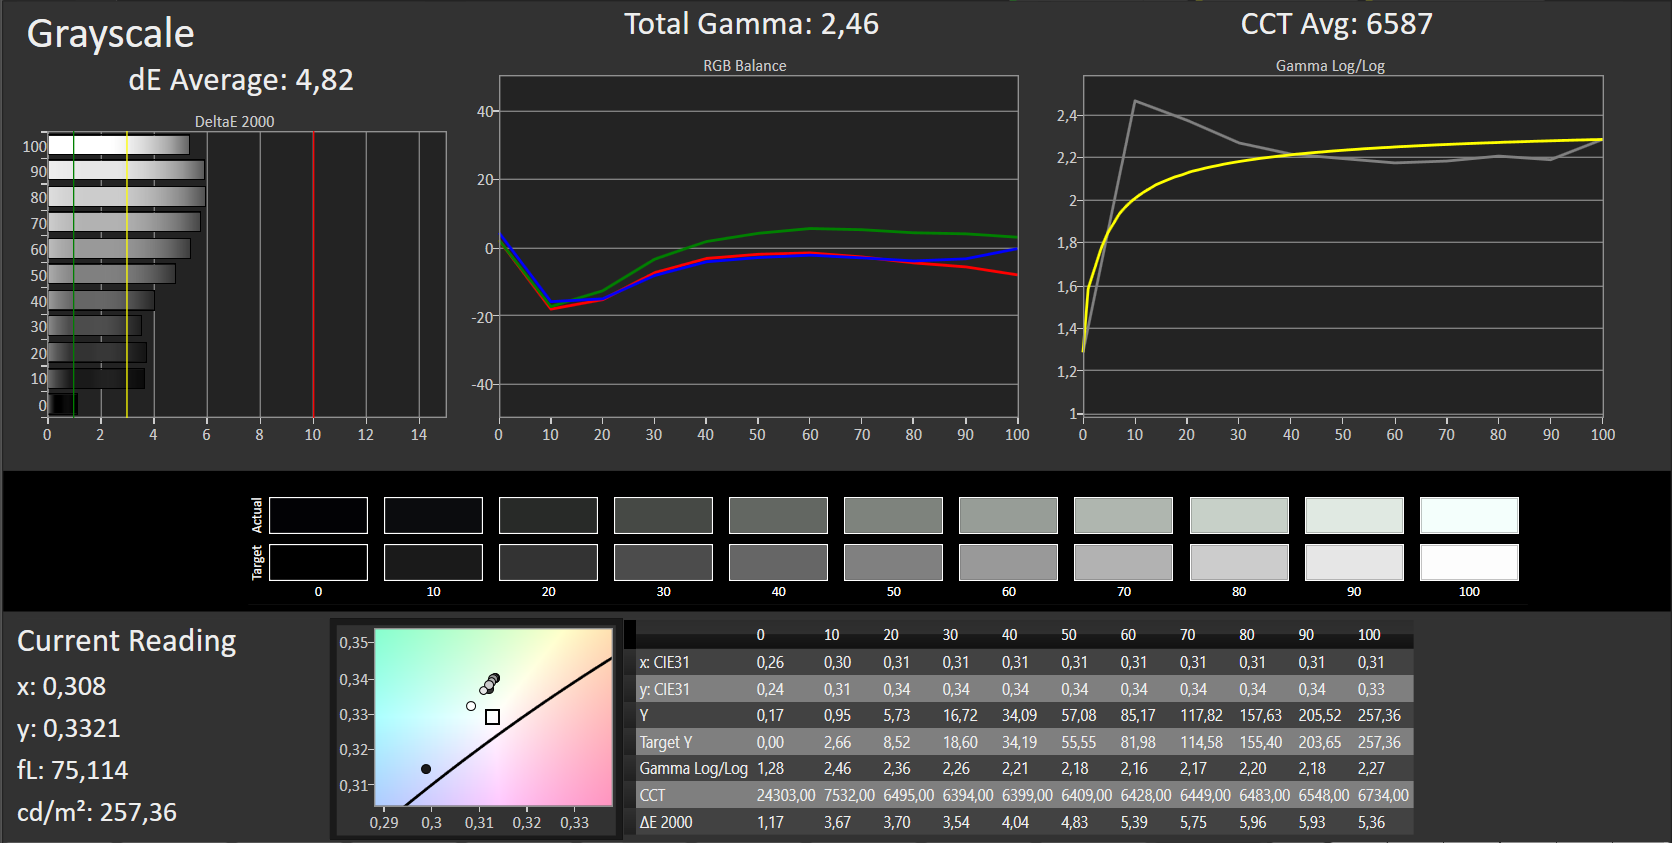
Distribution av ljusstyrkan: 84 %
Mitt på batteriet: 256 cd/m²
Kontrast: 1512:1 (Svärta: 0.17 cd/m²)
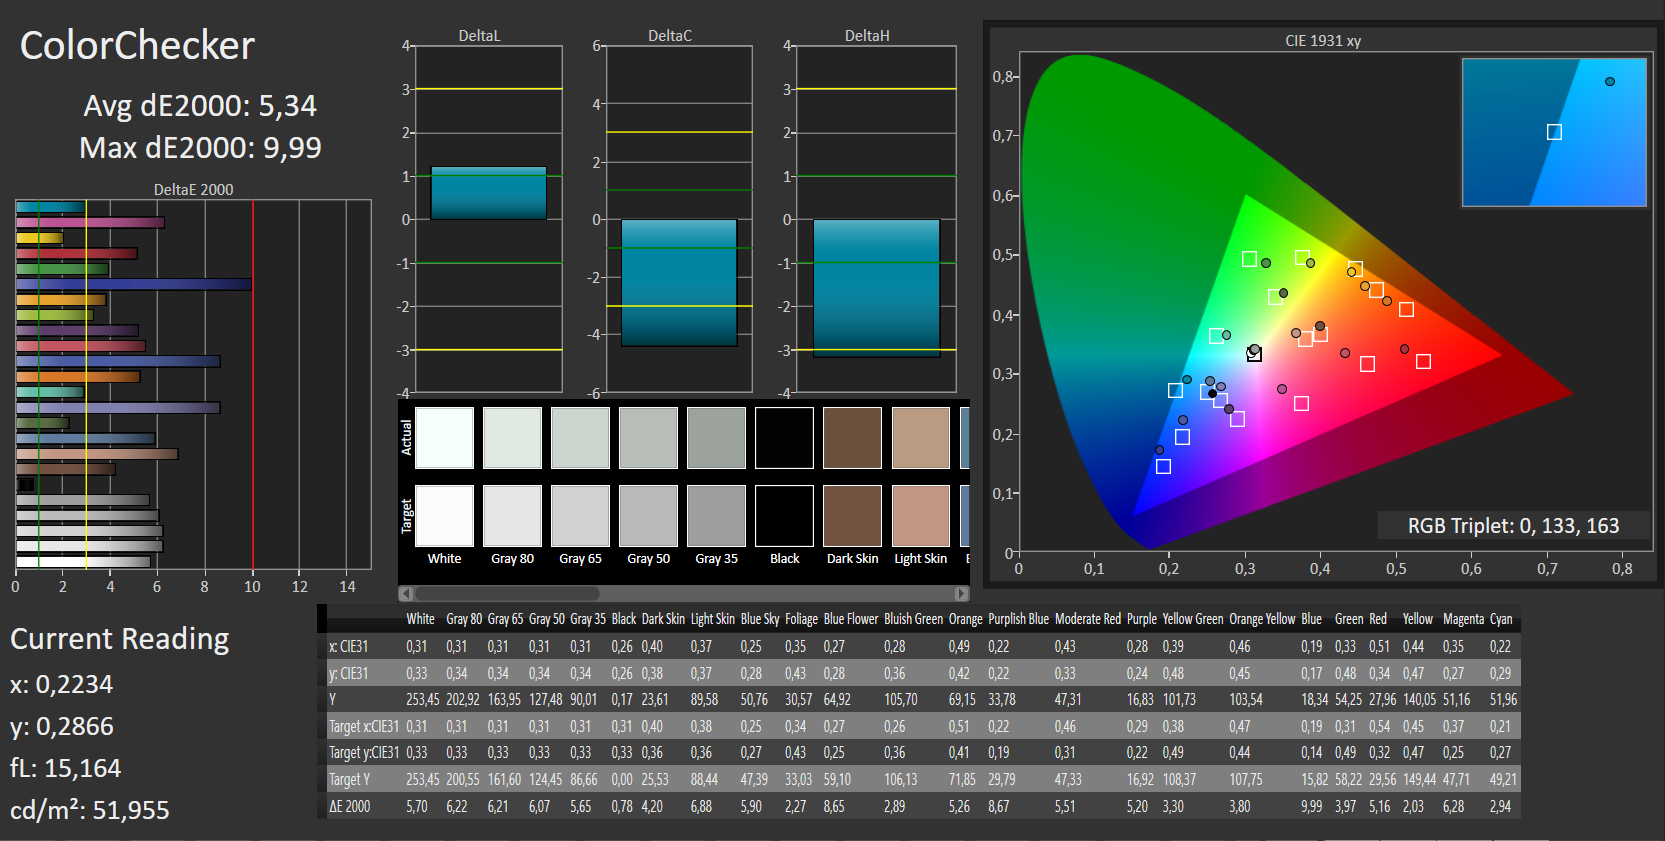
ΔE ColorChecker Calman: 5.34 | ∀{0.5-29.43 Ø4.71}
ΔE Greyscale Calman: 4.82 | ∀{0.09-98 Ø4.96}
60% sRGB (Argyll 1.6.3 3D)
38% AdobeRGB 1998 (Argyll 1.6.3 3D)
41.77% AdobeRGB 1998 (Argyll 3D)
60.5% sRGB (Argyll 3D)
40.4% Display P3 (Argyll 3D)
Gamma: 2.46
CCT: 6587 K
| Dell Inspiron 15 7000 7577 ID: LG Philips LGD053F, Name: 156WF6, Dell P/N: 4XK13, 1920x1080, 15.6" | Dell Inspiron 15 7000 7577 ID: LG Philips LGD053F, Name: 156WF6, Dell P/N: 4XK13, 1920x1080, 15.6" | Lenovo Legion Y520-15IKBN 80WK0042GE LG Philips LP156WF6-SPK3, 1920x1080, 15.6" | Acer Aspire VX15 VX5-591G-589S BOE CQ NV156HFM-N42, 1920x1080, 15.6" | MSI GL62M 7RD-077 Chi Mei N156HGE-EAL, 1920x1080, 15.6" | |
|---|---|---|---|---|---|
| Display | -8% | -3% | -1% | 92% | |
| Display P3 Coverage (%) | 40.4 | 37.07 -8% | 39.01 -3% | 40.56 0% | 85.4 111% |
| sRGB Coverage (%) | 60.5 | 55.6 -8% | 58.4 -3% | 59.4 -2% | 100 65% |
| AdobeRGB 1998 Coverage (%) | 41.77 | 38.32 -8% | 40.34 -3% | 41.9 0% | 83.8 101% |
| Response Times | 7% | 1% | -17% | -6% | |
| Response Time Grey 50% / Grey 80% * (ms) | 41 ? | 35.6 ? 13% | 39 ? 5% | 46 ? -12% | 44 ? -7% |
| Response Time Black / White * (ms) | 28 ? | 27.6 ? 1% | 29 ? -4% | 34 ? -21% | 29 ? -4% |
| PWM Frequency (Hz) | 21000 ? | 20000 ? | 198 ? | ||
| Screen | -21% | -19% | 0% | -39% | |
| Brightness middle (cd/m²) | 257 | 235.4 -8% | 283 10% | 277 8% | 258 0% |
| Brightness (cd/m²) | 229 | 223 -3% | 281 23% | 268 17% | 234 2% |
| Brightness Distribution (%) | 84 | 91 8% | 91 8% | 91 8% | 79 -6% |
| Black Level * (cd/m²) | 0.17 | 0.28 -65% | 0.39 -129% | 0.26 -53% | 0.54 -218% |
| Contrast (:1) | 1512 | 841 -44% | 726 -52% | 1065 -30% | 478 -68% |
| Colorchecker dE 2000 * | 5.34 | 5.6 -5% | 6.1 -14% | 5.05 5% | 9.74 -82% |
| Colorchecker dE 2000 max. * | 9.99 | 20.3 -103% | 11.08 -11% | 8.93 11% | 14.6 -46% |
| Greyscale dE 2000 * | 4.82 | 3.6 25% | 5.69 -18% | 2.97 38% | 11.59 -140% |
| Gamma | 2.46 89% | 2.23 99% | 2.44 90% | 2.39 92% | 2.19 100% |
| CCT | 6587 99% | 7214 90% | 6702 97% | 6466 101% | 11851 55% |
| Color Space (Percent of AdobeRGB 1998) (%) | 38 | 35.2 -7% | 37 -3% | 38 0% | 76 100% |
| Color Space (Percent of sRGB) (%) | 60 | 55.4 -8% | 58 -3% | 59 -2% | 100 67% |
| Totalt genomsnitt (program/inställningar) | -7% /
-15% | -7% /
-13% | -6% /
-2% | 16% /
-8% |
* ... mindre är bättre
Visa svarstider
| ↔ Svarstid svart till vitt | ||
|---|---|---|
| 28 ms ... stiga ↗ och falla ↘ kombinerat | ↗ 15 ms stiga | 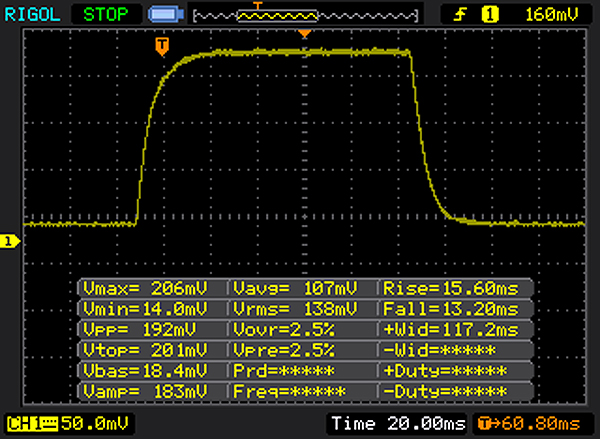 |
| ↘ 13 ms hösten | ||
| Skärmen visar relativt långsamma svarsfrekvenser i våra tester och kan vara för långsam för spelare. I jämförelse sträcker sig alla testade enheter från 0.1 (minst) till 240 (maximalt) ms. » 71 % av alla enheter är bättre. Detta innebär att den uppmätta svarstiden är sämre än genomsnittet av alla testade enheter (19.8 ms). | ||
| ↔ Svarstid 50 % grått till 80 % grått | ||
| 41 ms ... stiga ↗ och falla ↘ kombinerat | ↗ 20 ms stiga | 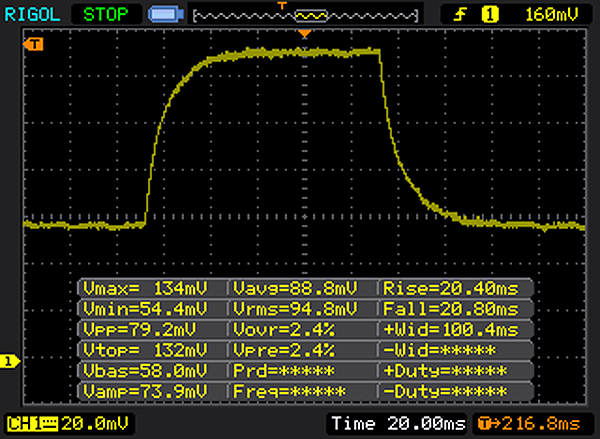 |
| ↘ 21 ms hösten | ||
| Skärmen visar långsamma svarsfrekvenser i våra tester och kommer att vara otillfredsställande för spelare. I jämförelse sträcker sig alla testade enheter från 0.165 (minst) till 636 (maximalt) ms. » 65 % av alla enheter är bättre. Detta innebär att den uppmätta svarstiden är sämre än genomsnittet av alla testade enheter (31 ms). | ||
Skärmflimmer / PWM (Puls-Width Modulation)
| Skärmflimmer / PWM upptäcktes inte | ||
Som jämförelse: 52 % av alla testade enheter använder inte PWM för att dämpa skärmen. Om PWM upptäcktes mättes ett medelvärde av 7754 (minst: 5 - maximum: 343500) Hz. | ||
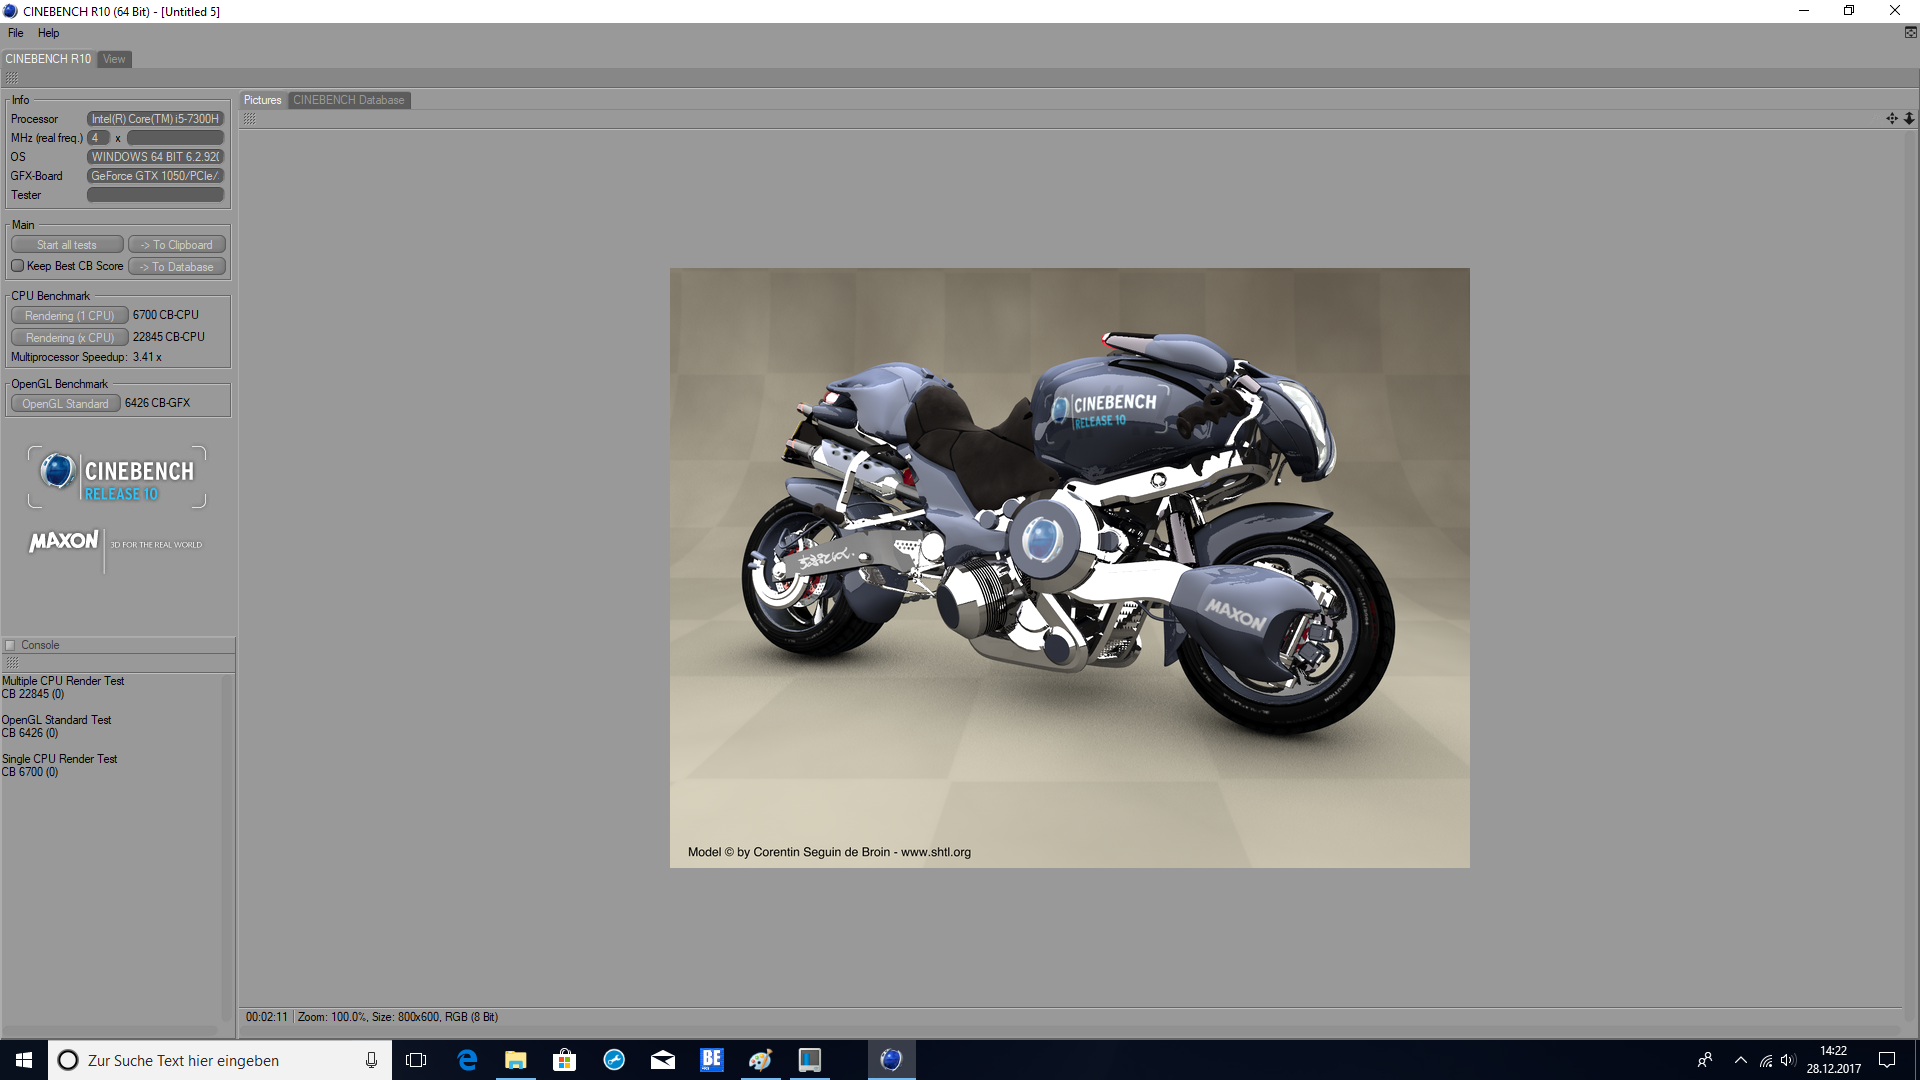
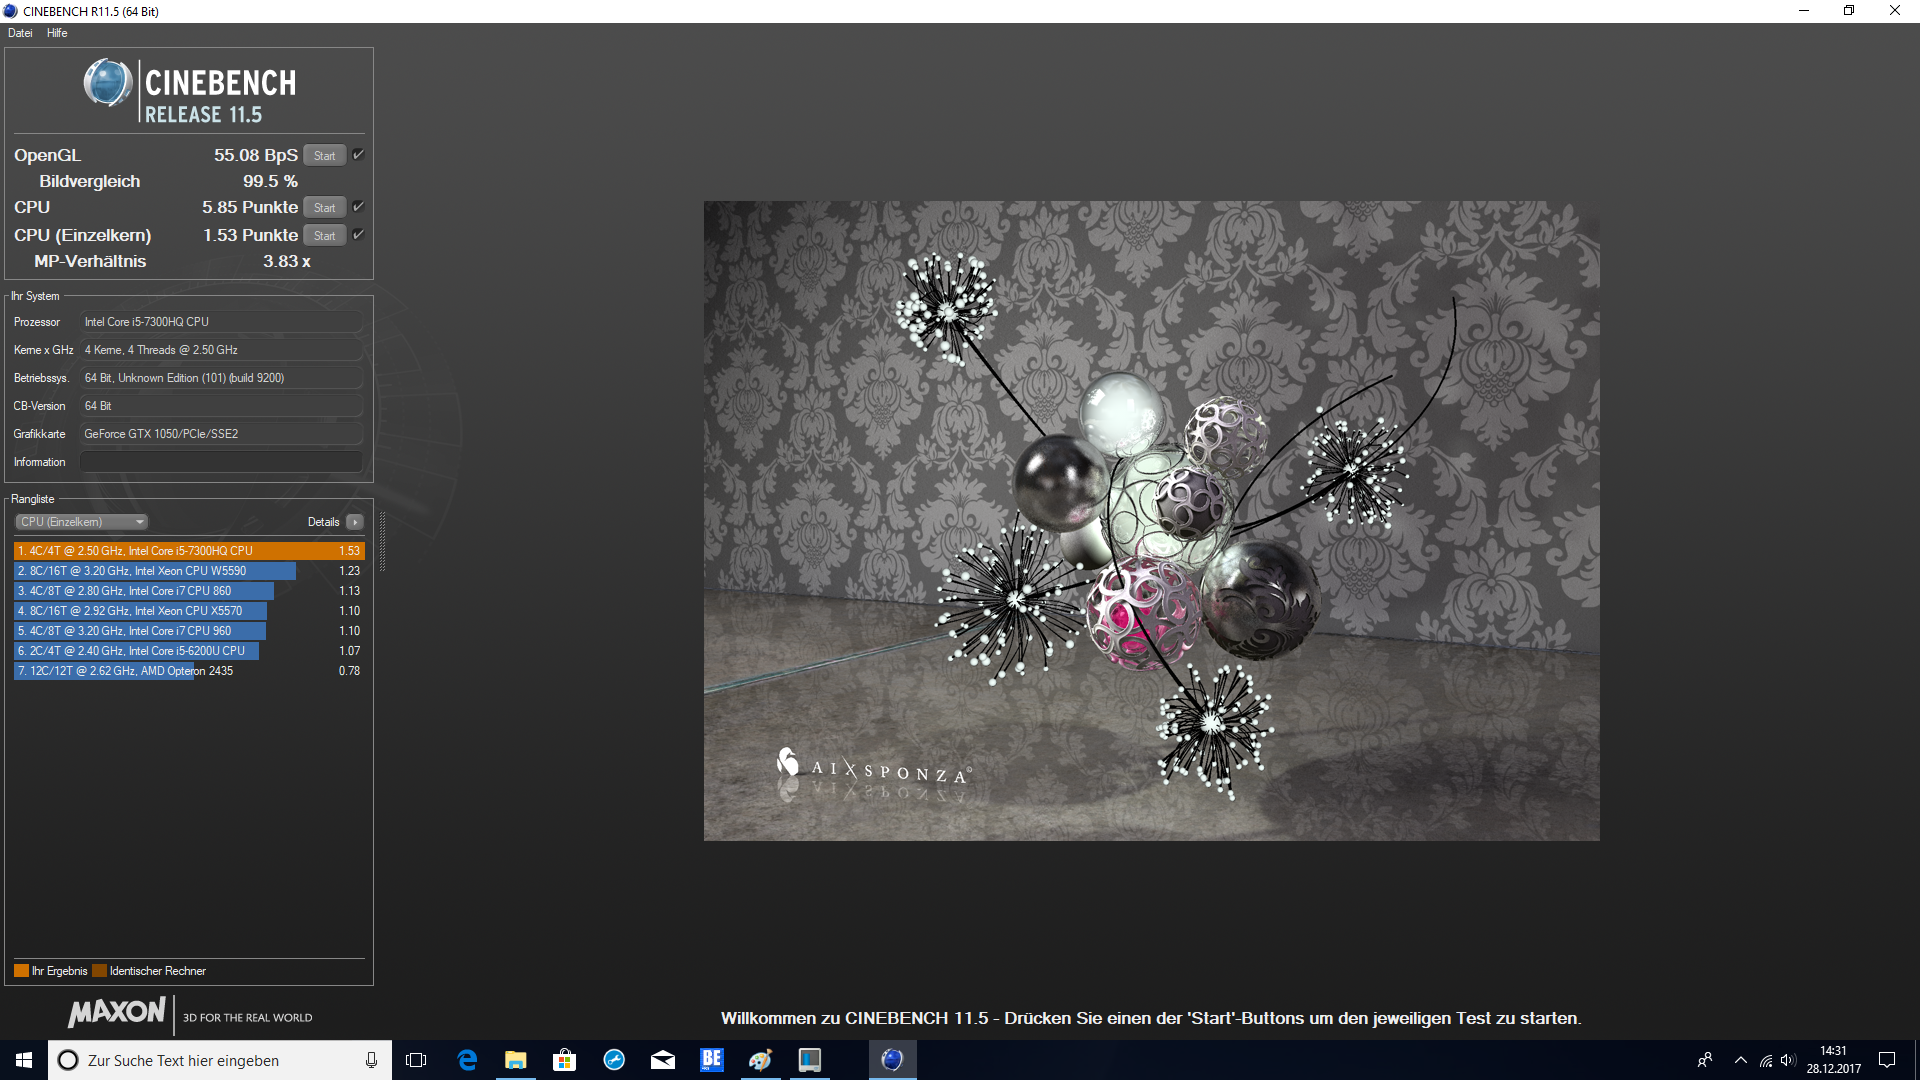
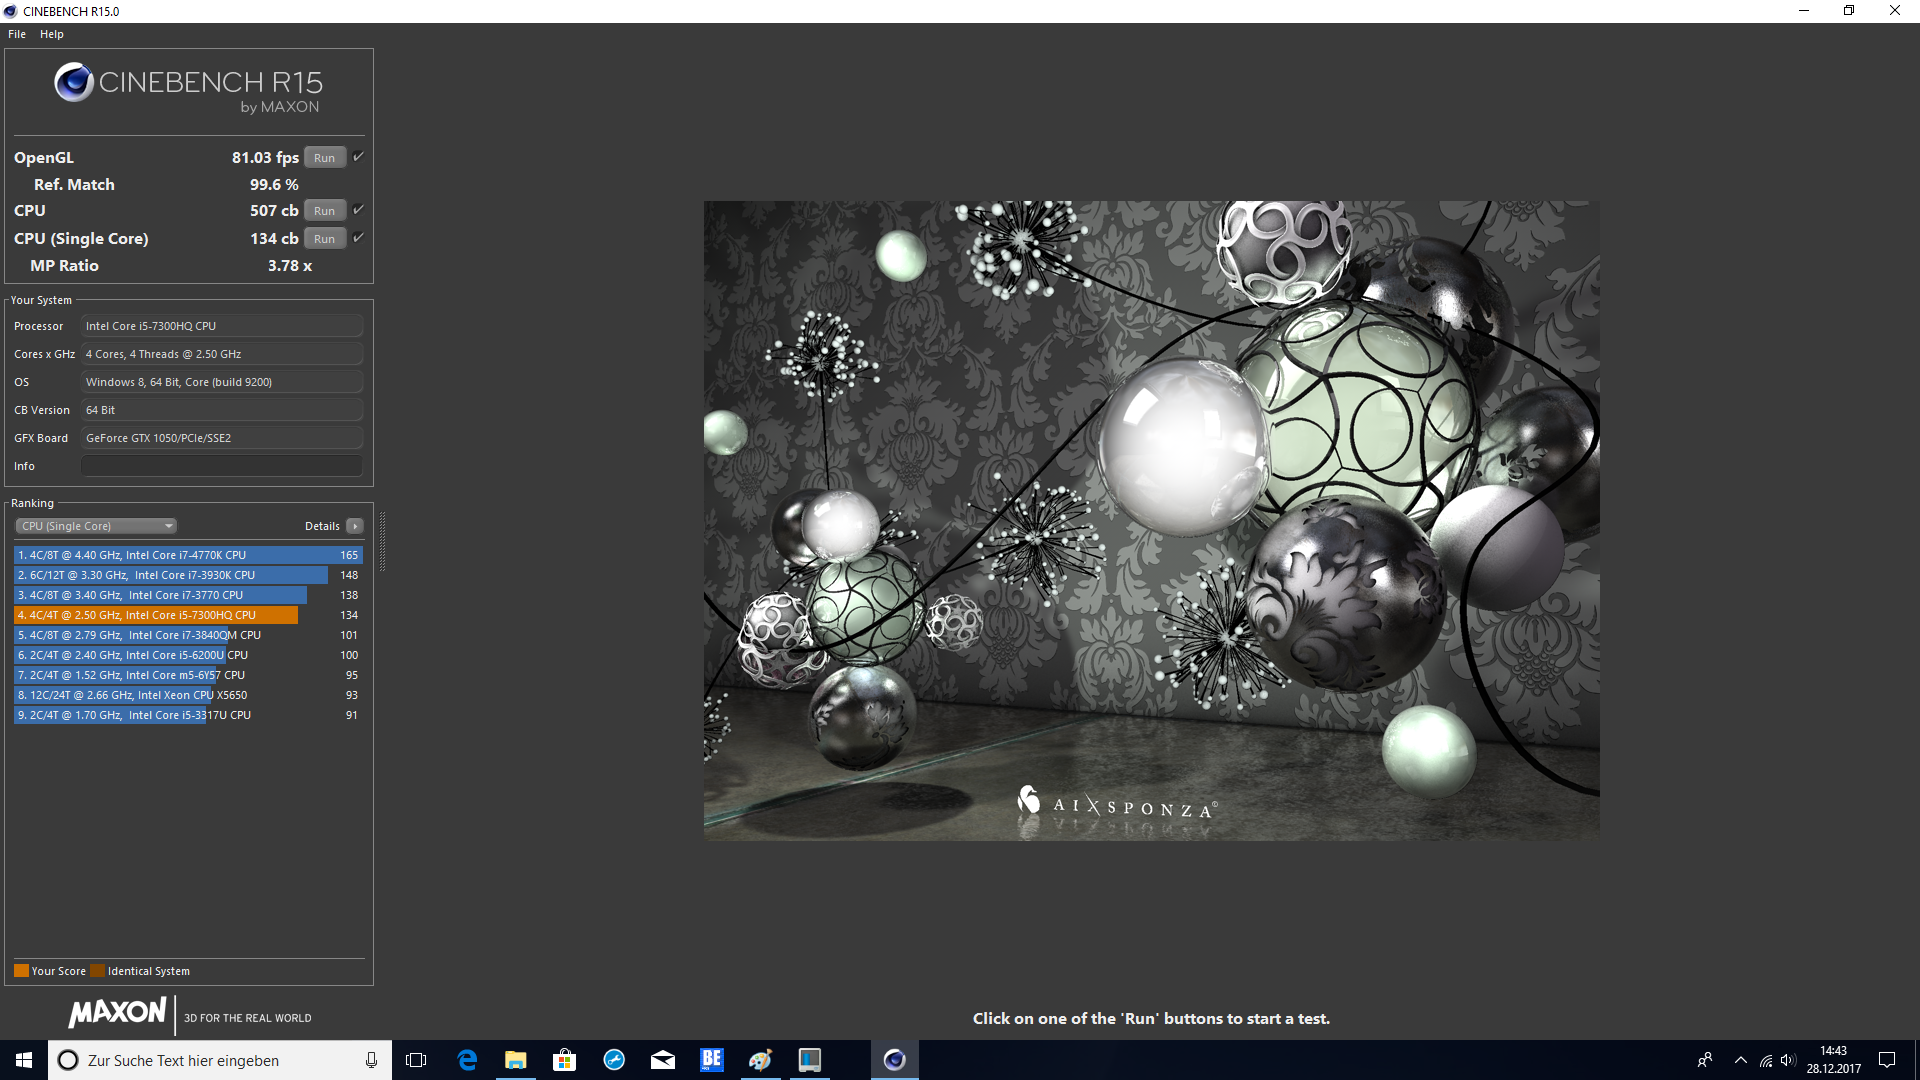
| Cinebench R15 | |
| CPU Single 64Bit | |
| Acer Aspire VX15 VX5-591G-589S | |
| MSI GL62M 7RD-077 | |
| Lenovo Legion Y520-15IKBN 80WK0042GE | |
| Dell Inspiron 15 7000 7577 | |
| Dell Inspiron 15 7000 7577 | |
| CPU Multi 64Bit | |
| MSI GL62M 7RD-077 | |
| Lenovo Legion Y520-15IKBN 80WK0042GE | |
| Dell Inspiron 15 7000 7577 | |
| Acer Aspire VX15 VX5-591G-589S | |
| Dell Inspiron 15 7000 7577 | |
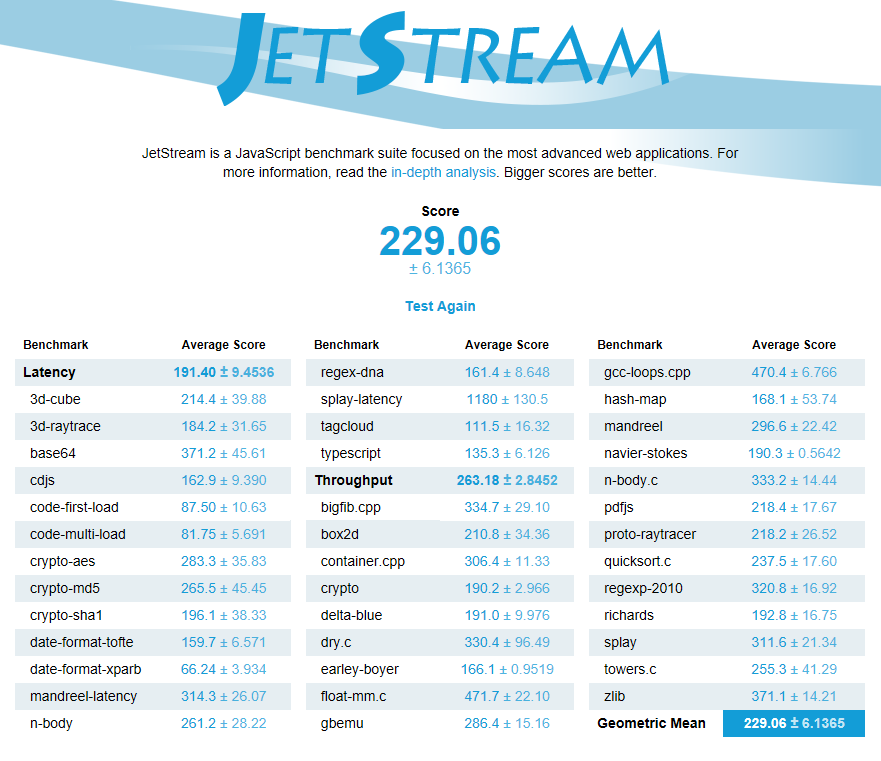
| JetStream 1.1 - 1.1 Total | |
| MSI GL62M 7RD-077 | |
| Acer Aspire VX15 VX5-591G-589S | |
| Lenovo Legion Y520-15IKBN 80WK0042GE | |
| Dell Inspiron 15 7000 7577 | |
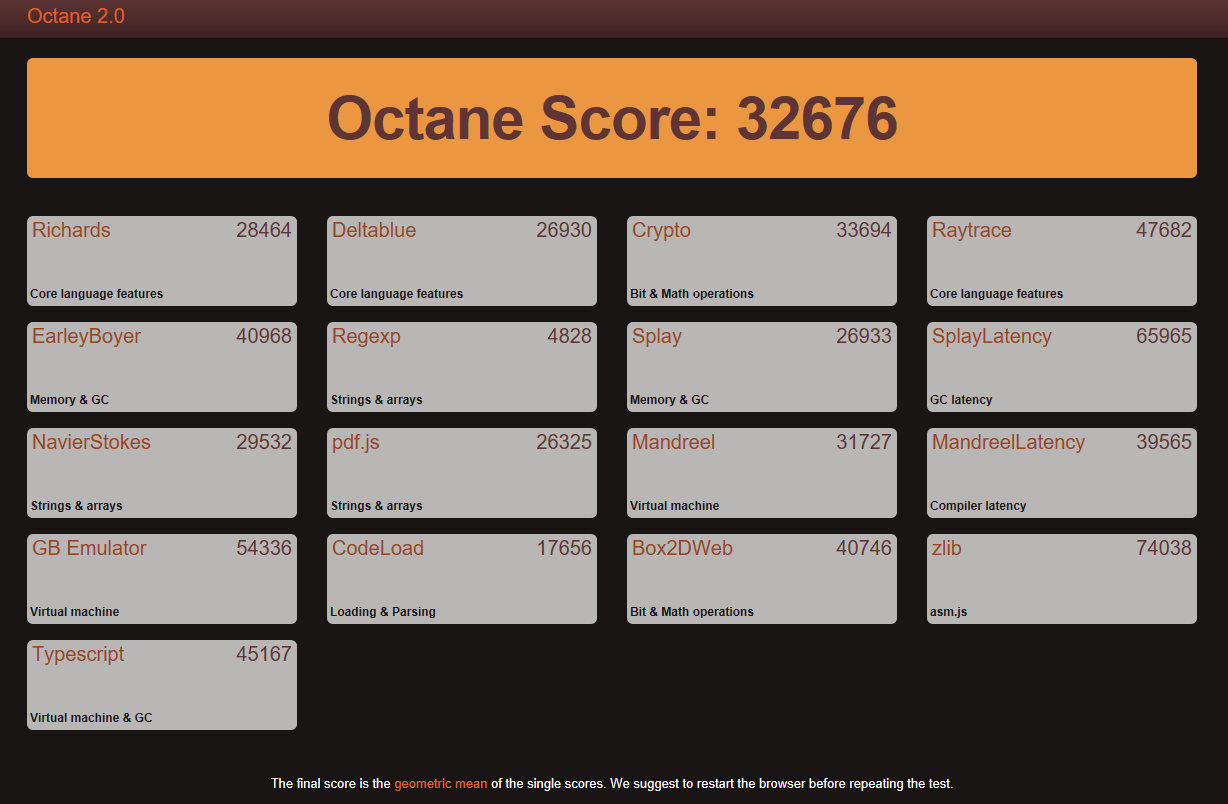
| Octane V2 - Total Score | |
| MSI GL62M 7RD-077 | |
| Lenovo Legion Y520-15IKBN 80WK0042GE | |
| Dell Inspiron 15 7000 7577 | |
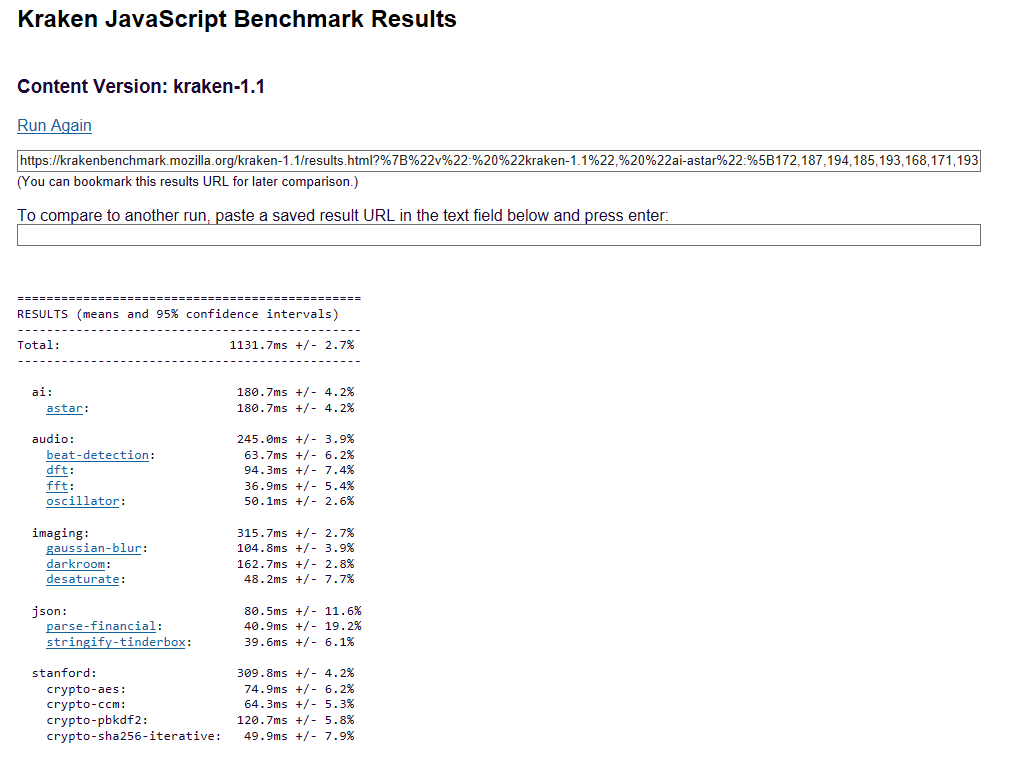
| Mozilla Kraken 1.1 - Total | |
| Dell Inspiron 15 7000 7577 | |
| Lenovo Legion Y520-15IKBN 80WK0042GE | |
| MSI GL62M 7RD-077 | |
* ... mindre är bättre
| PCMark 8 | |
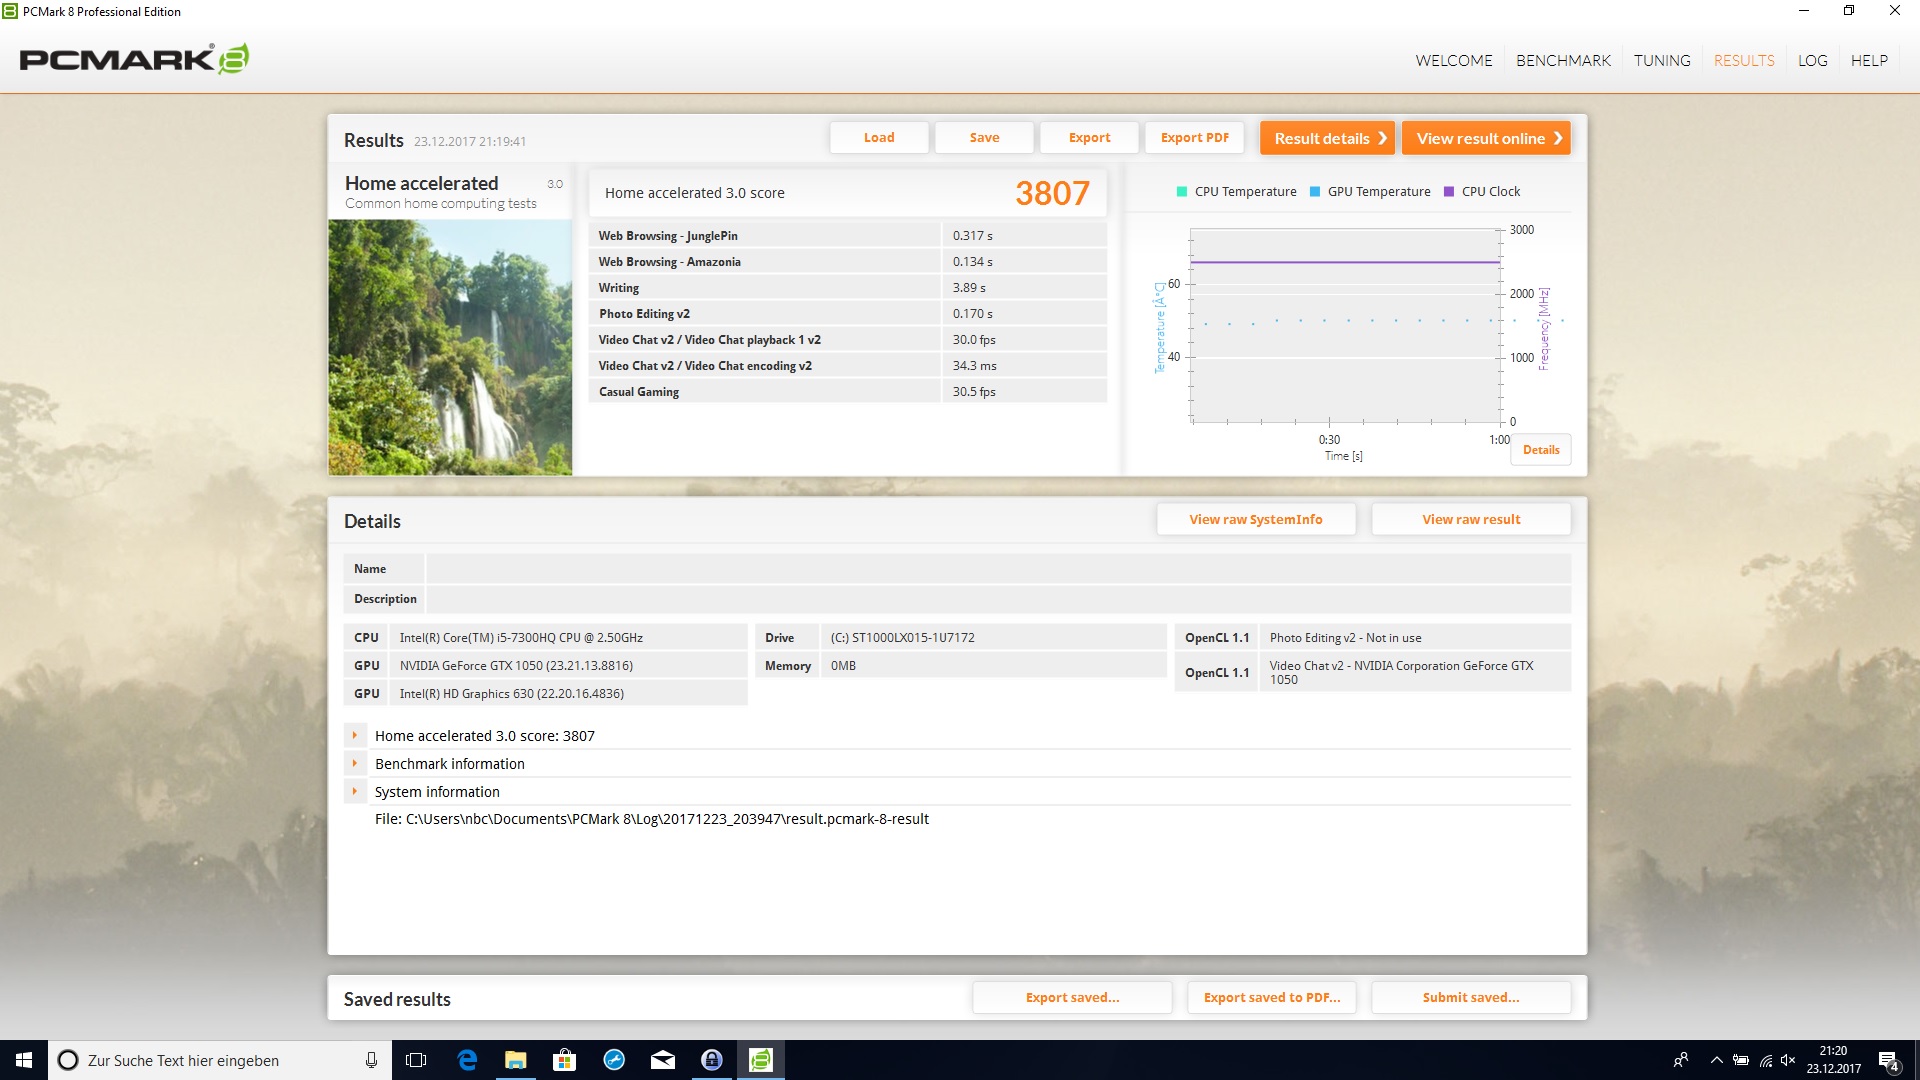
| Home Score Accelerated v2 | |
| MSI GL62M 7RD-077 | |
| Dell Inspiron 15 7000 7577 | |
| Dell Inspiron 15 7000 7577 | |
| Acer Aspire VX15 VX5-591G-589S | |
| Lenovo Legion Y520-15IKBN 80WK0042GE | |
| Work Score Accelerated v2 | |
| Dell Inspiron 15 7000 7577 | |
| Dell Inspiron 15 7000 7577 | |
| MSI GL62M 7RD-077 | |
| Lenovo Legion Y520-15IKBN 80WK0042GE | |
| PCMark 8 Home Score Accelerated v2 | 3807 poäng | |
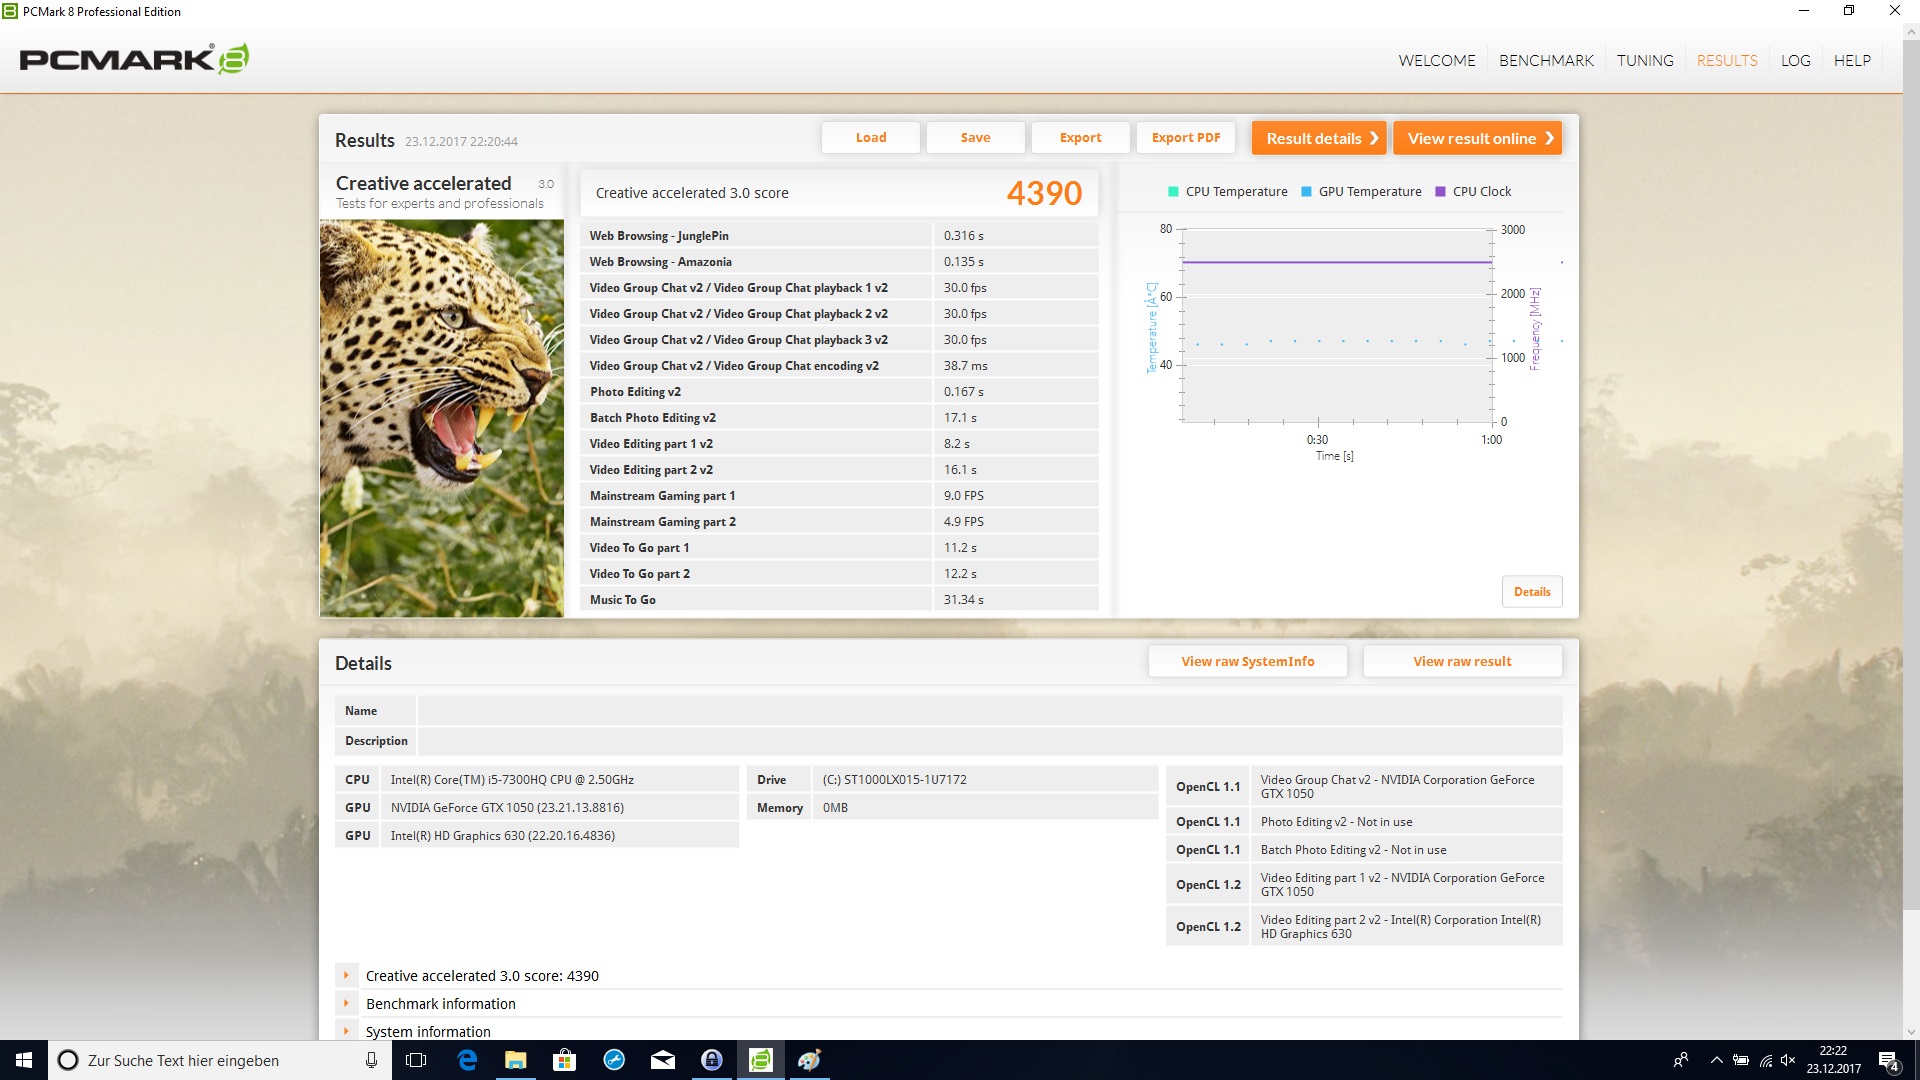
| PCMark 8 Creative Score Accelerated v2 | 4390 poäng | |
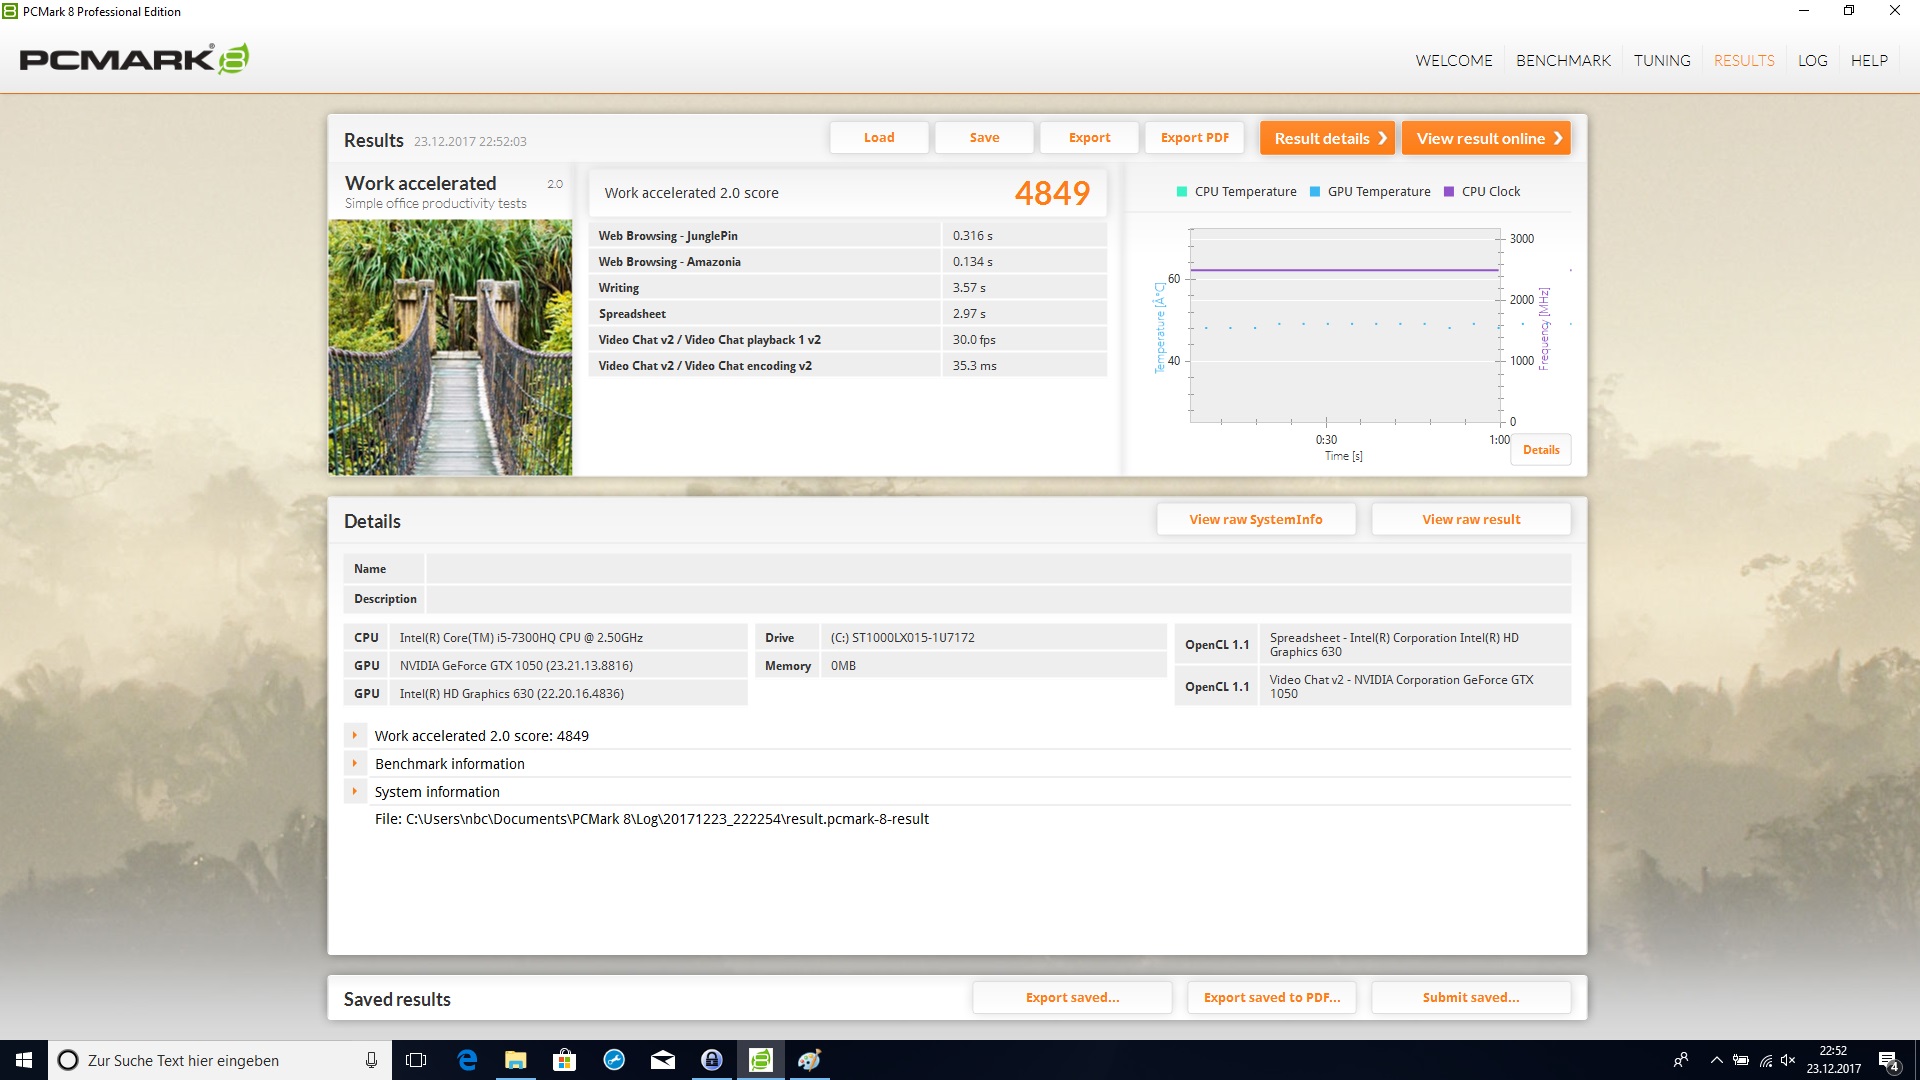
| PCMark 8 Work Score Accelerated v2 | 4849 poäng | |
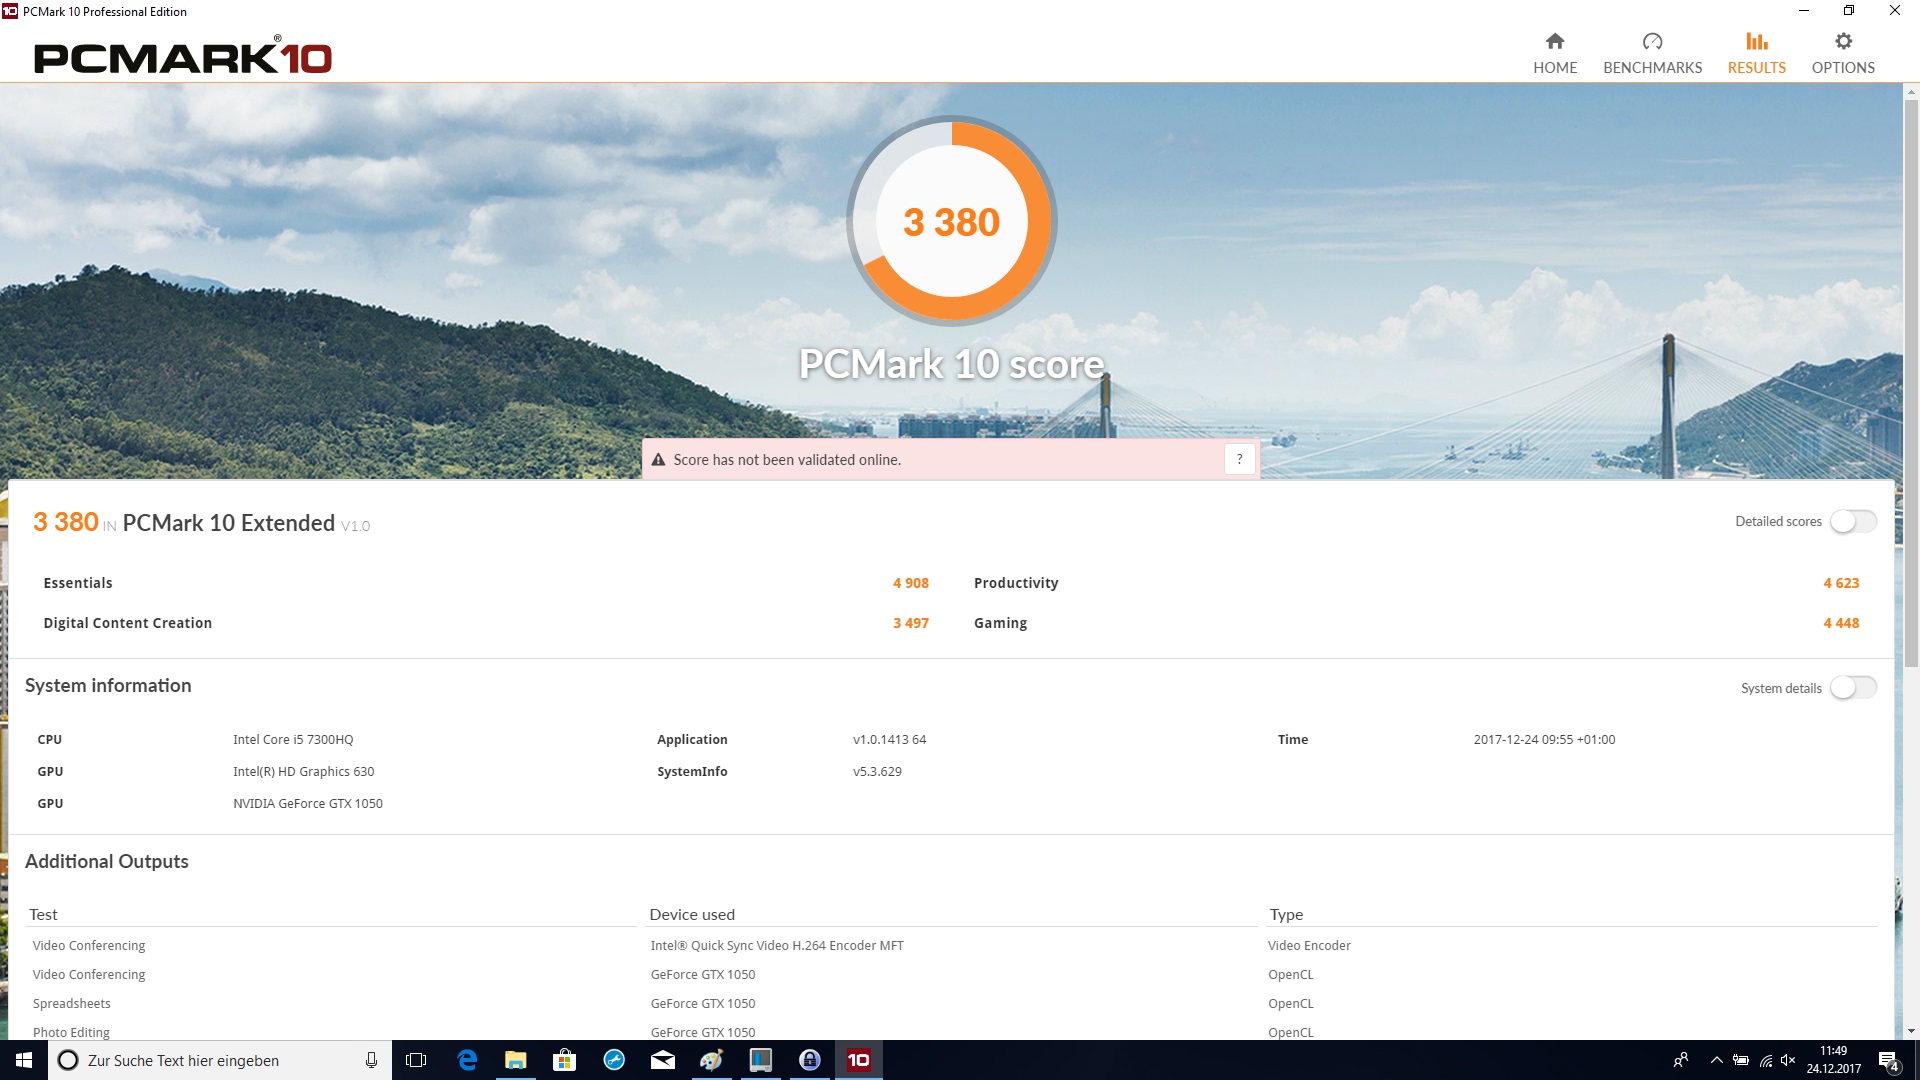
| PCMark 10 Score | 3380 poäng | |
Hjälp | ||
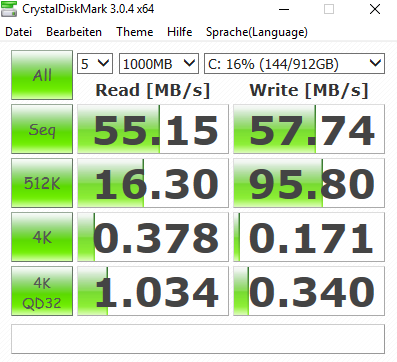
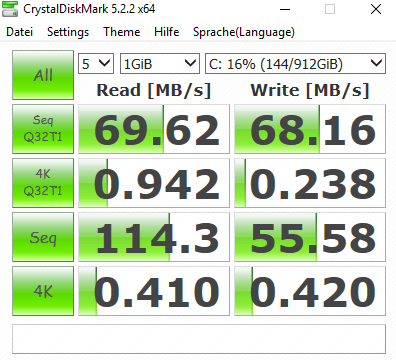
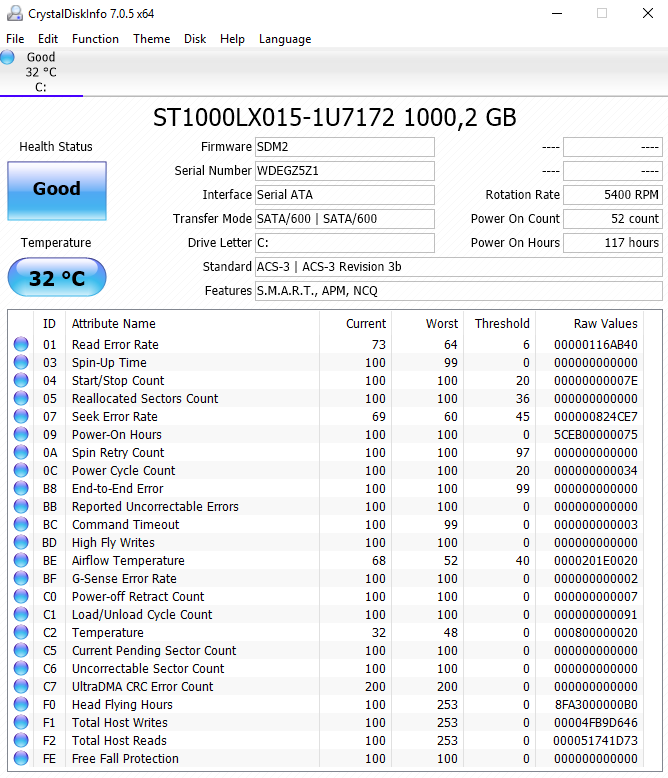
| Dell Inspiron 15 7000 7577 Seagate Mobile HDD 1TB ST1000LX015-1U7172 | Lenovo Legion Y520-15IKBN 80WK0042GE Samsung PM961 NVMe MZVLW128HEGR | Acer Aspire VX15 VX5-591G-589S Hynix HFS128G39TND | MSI GL62M 7RD-077 HGST Travelstar 7K1000 HTS721010A9E630 | |
|---|---|---|---|---|
| CrystalDiskMark 3.0 | 25854% | 18785% | 146% | |
| Read Seq (MB/s) | 55.2 | 2127 3753% | 510 824% | 112.4 104% |
| Write Seq (MB/s) | 57.7 | 796 1280% | 137.6 138% | 107.3 86% |
| Read 512 (MB/s) | 16.3 | 455.6 2695% | 362.1 2121% | 43.19 165% |
| Write 512 (MB/s) | 95.8 | 196.7 105% | 137.2 43% | 57 -41% |
| Read 4k (MB/s) | 0.378 | 46.07 12088% | 35.18 9207% | 0.494 31% |
| Write 4k (MB/s) | 0.171 | 154.8 90426% | 104.8 61187% | 1.122 556% |
| Read 4k QD32 (MB/s) | 1.034 | 480.9 46409% | 375.8 36244% | 1.088 5% |
| Write 4k QD32 (MB/s) | 0.34 | 170.6 50076% | 138.1 40518% | 1.234 263% |

| 3DMark | |
| 1280x720 Cloud Gate Standard Graphics | |
| Dell Inspiron 15 7000 7577 | |
| Lenovo Legion Y520-15IKBN 80WK0042GE | |
| MSI GL62M 7RD-077 | |
| Dell Inspiron 15 7000 7577 | |
| 1920x1080 Fire Strike Graphics | |
| Dell Inspiron 15 7000 7577 | |
| Lenovo Legion Y520-15IKBN 80WK0042GE | |
| MSI GL62M 7RD-077 | |
| Dell Inspiron 15 7000 7577 | |
| 3DMark 11 - 1280x720 Performance GPU | |
| Dell Inspiron 15 7000 7577 | |
| Lenovo Legion Y520-15IKBN 80WK0042GE | |
| MSI GL62M 7RD-077 | |
| Dell Inspiron 15 7000 7577 | |
| Acer Aspire VX15 VX5-591G-589S | |
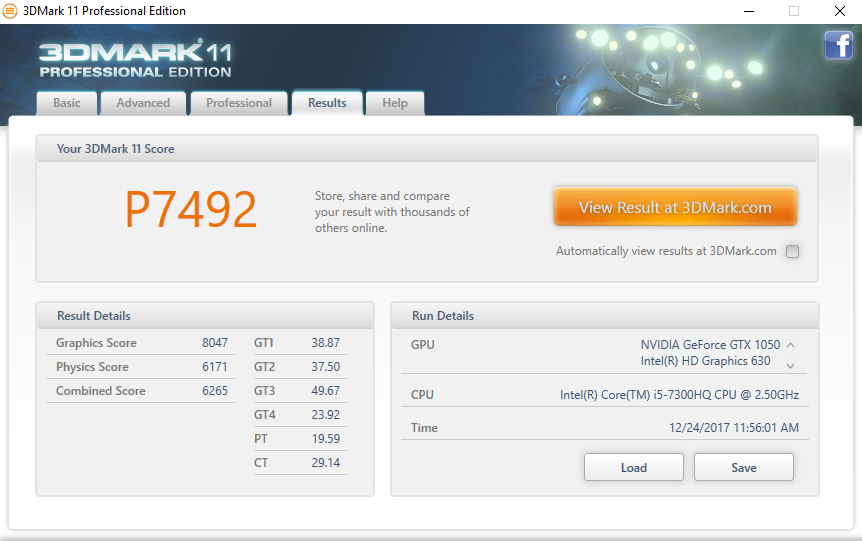
| 3DMark 11 Performance | 7492 poäng | |
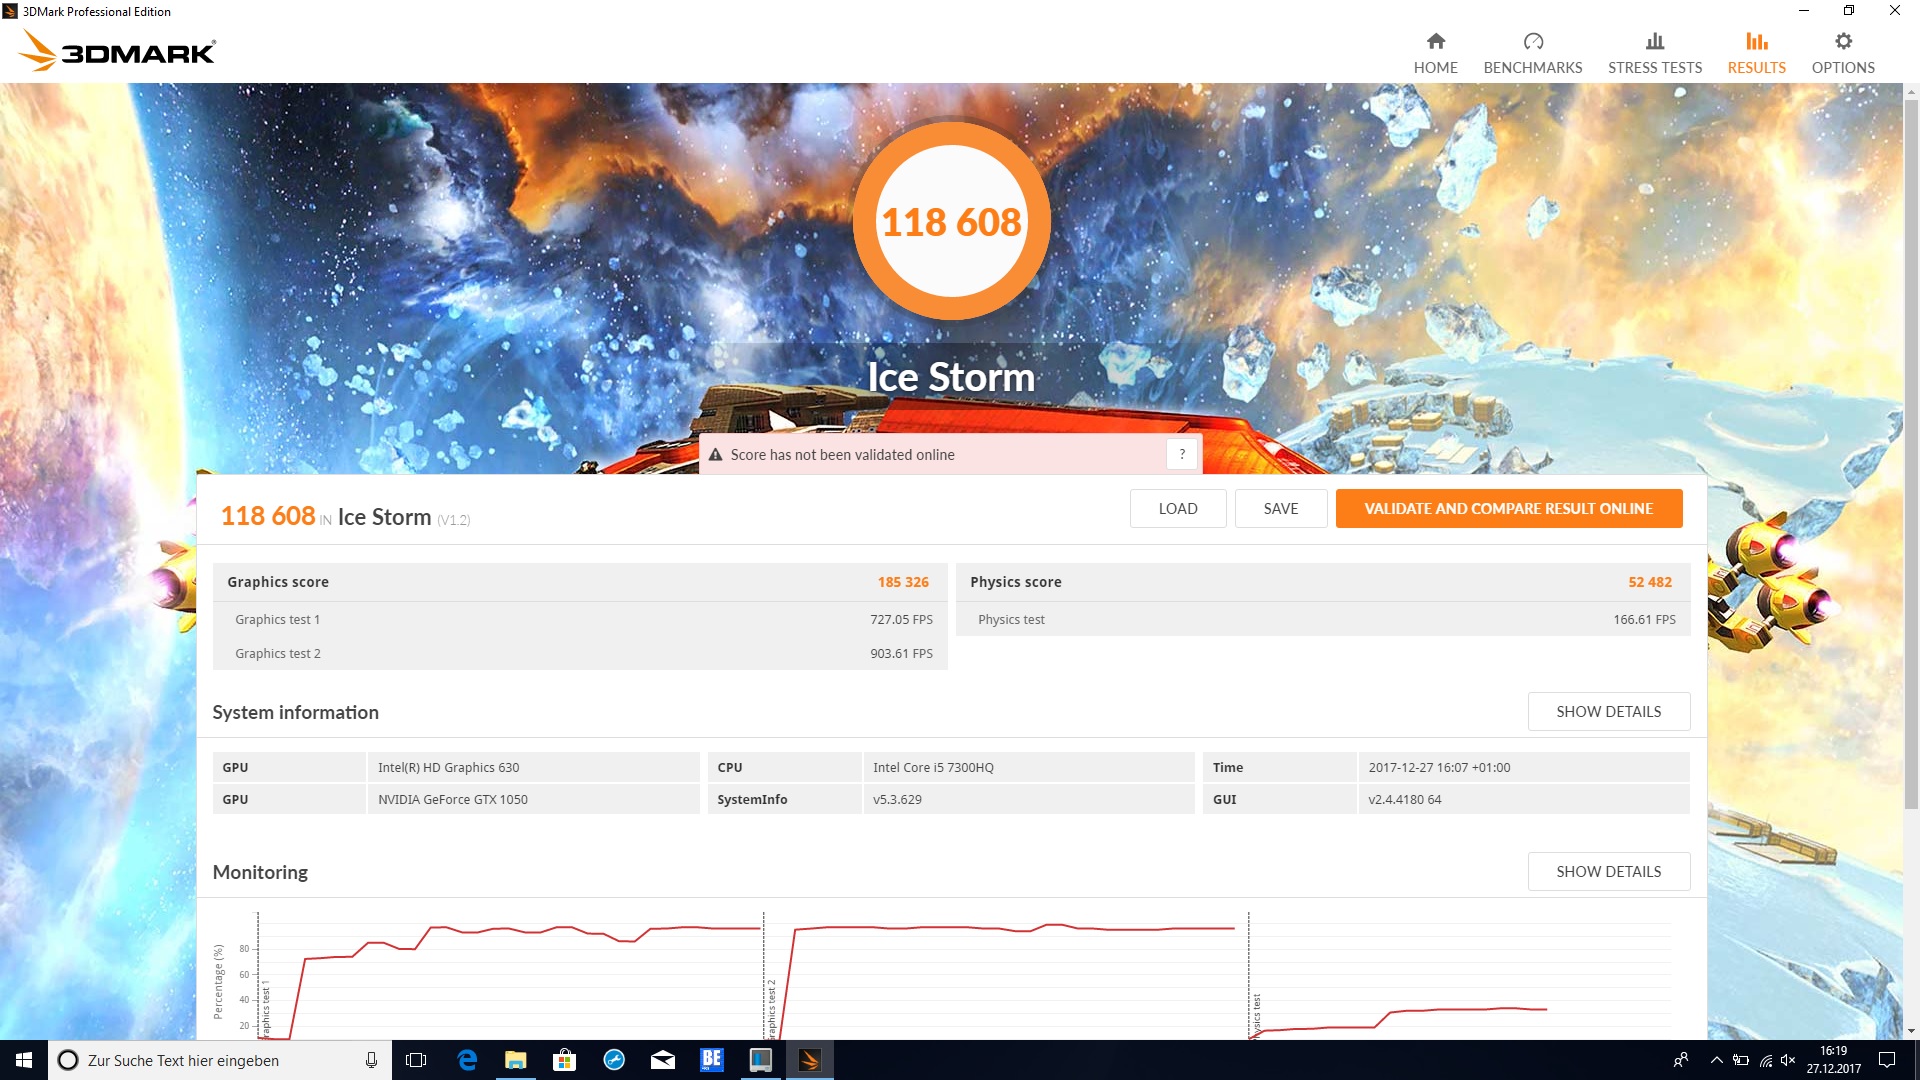
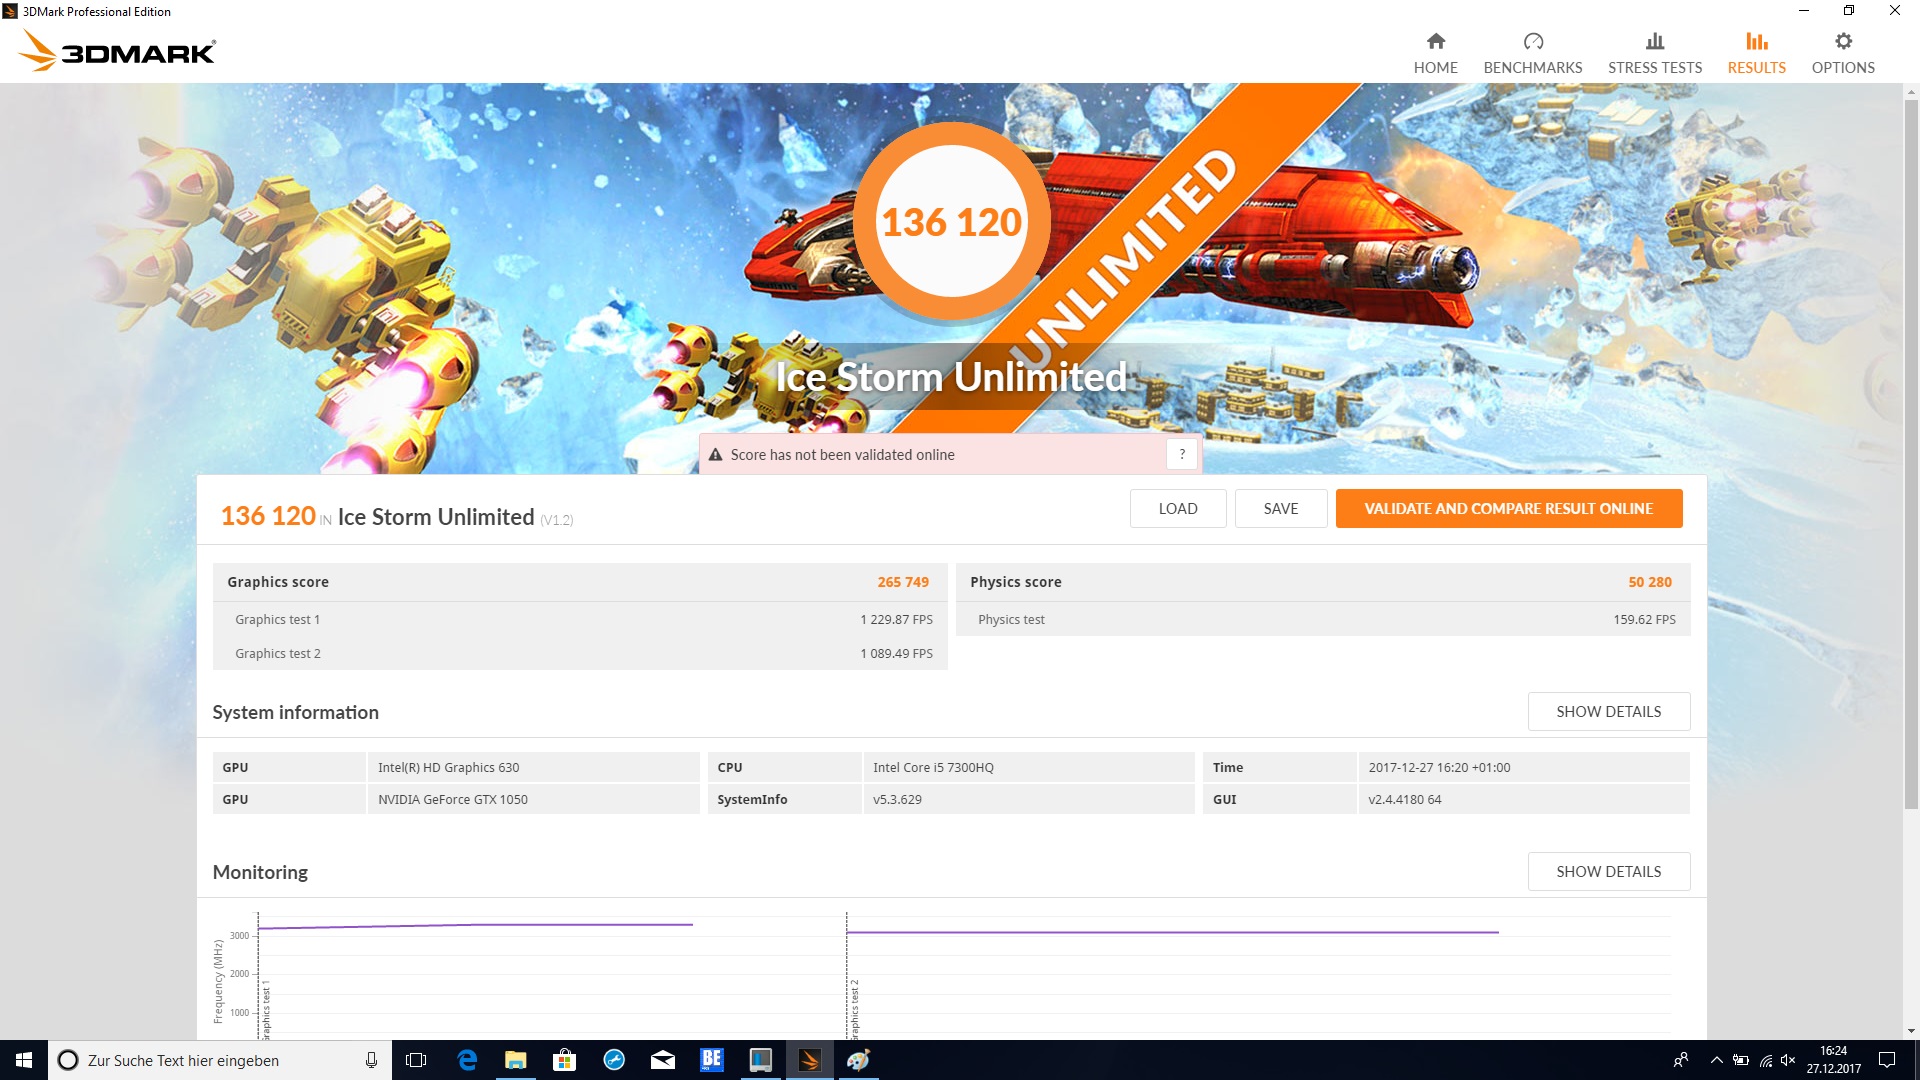
| 3DMark Ice Storm Standard Score | 118608 poäng | |
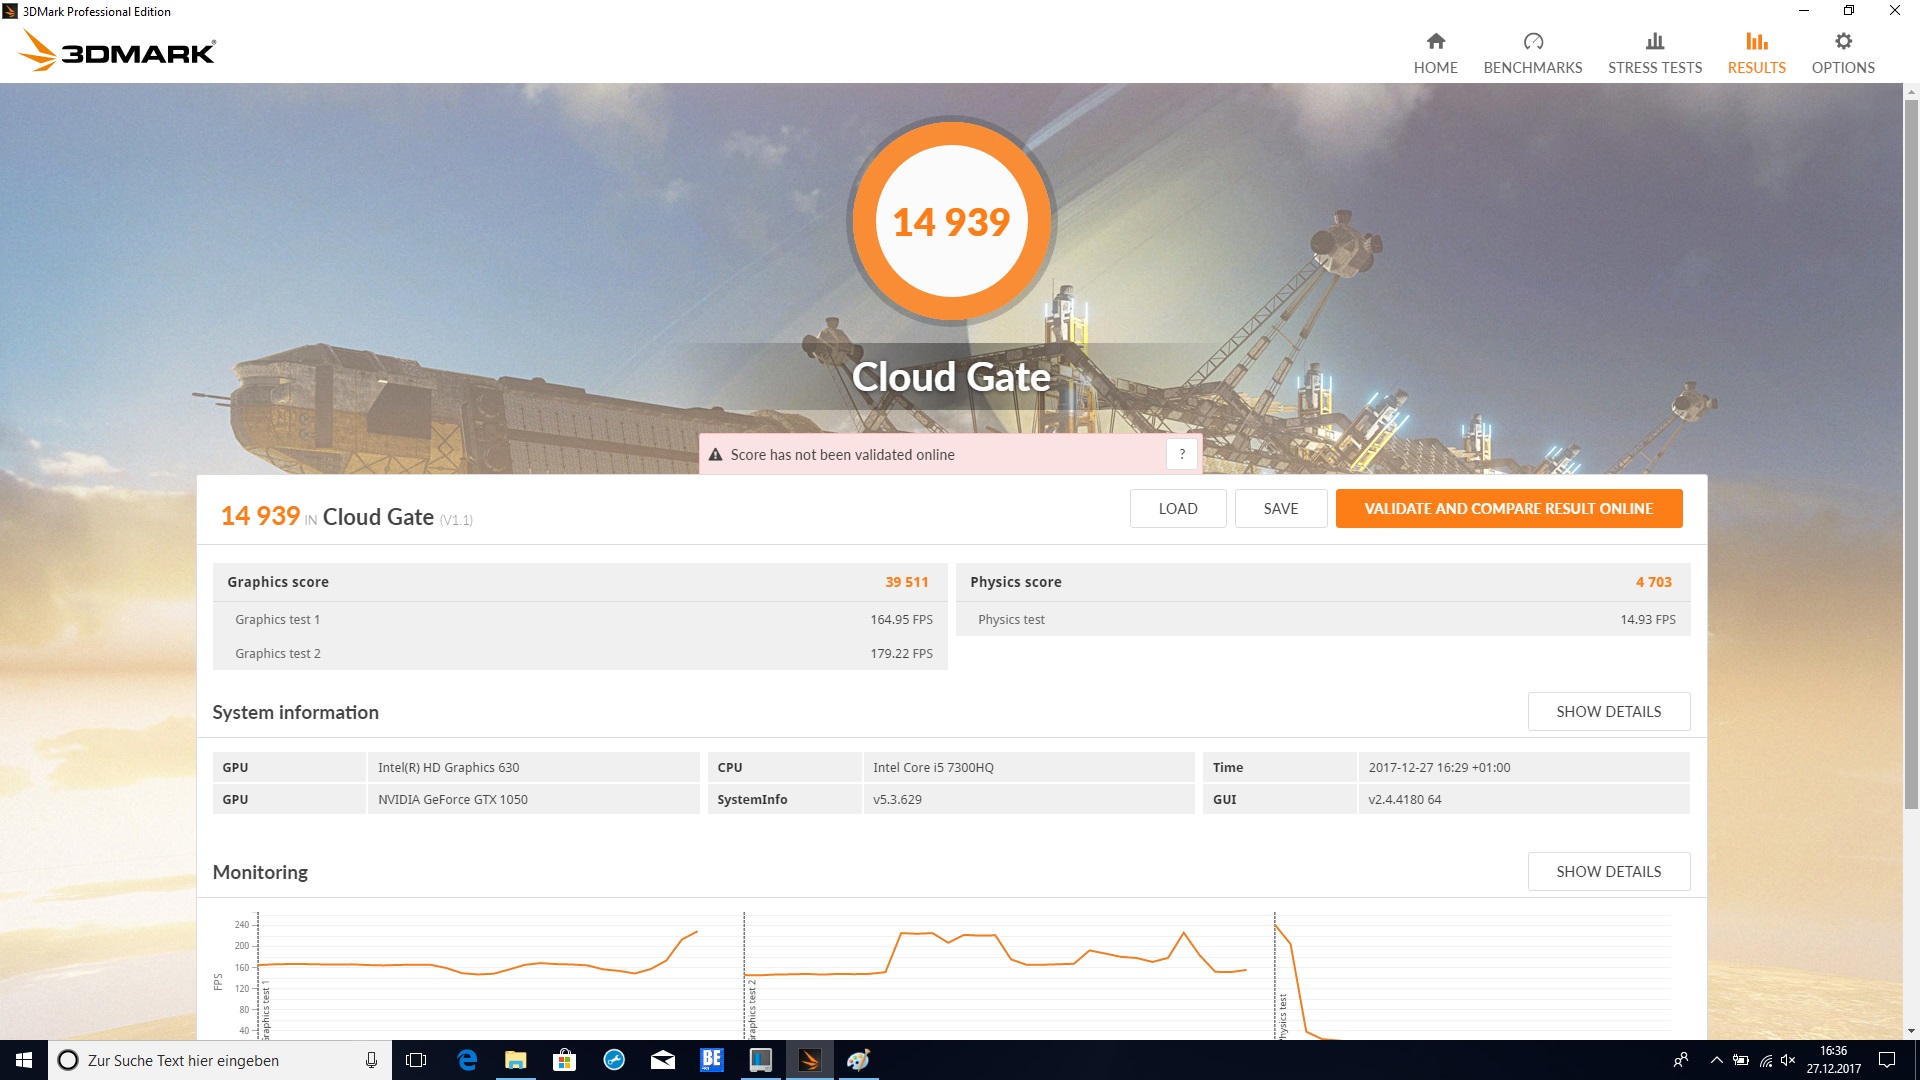
| 3DMark Cloud Gate Standard Score | 14939 poäng | |
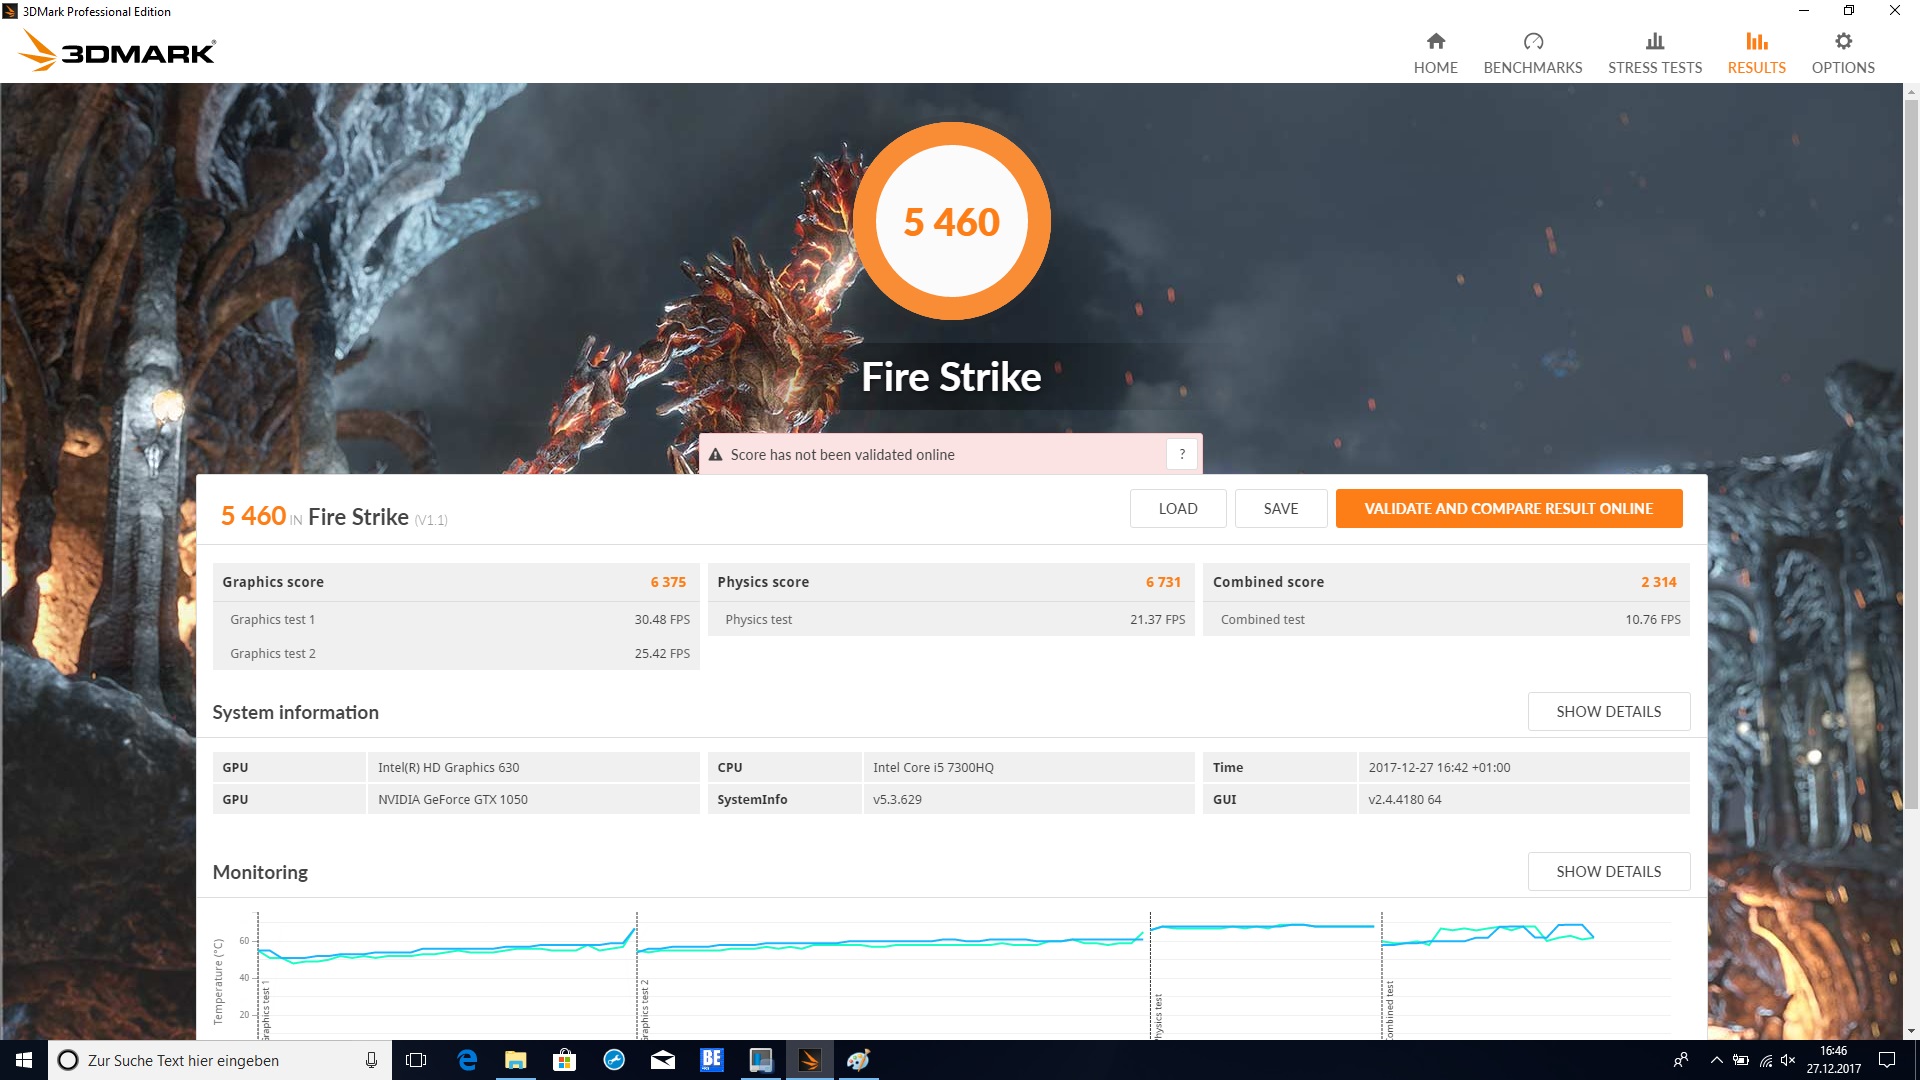
| 3DMark Fire Strike Score | 5460 poäng | |
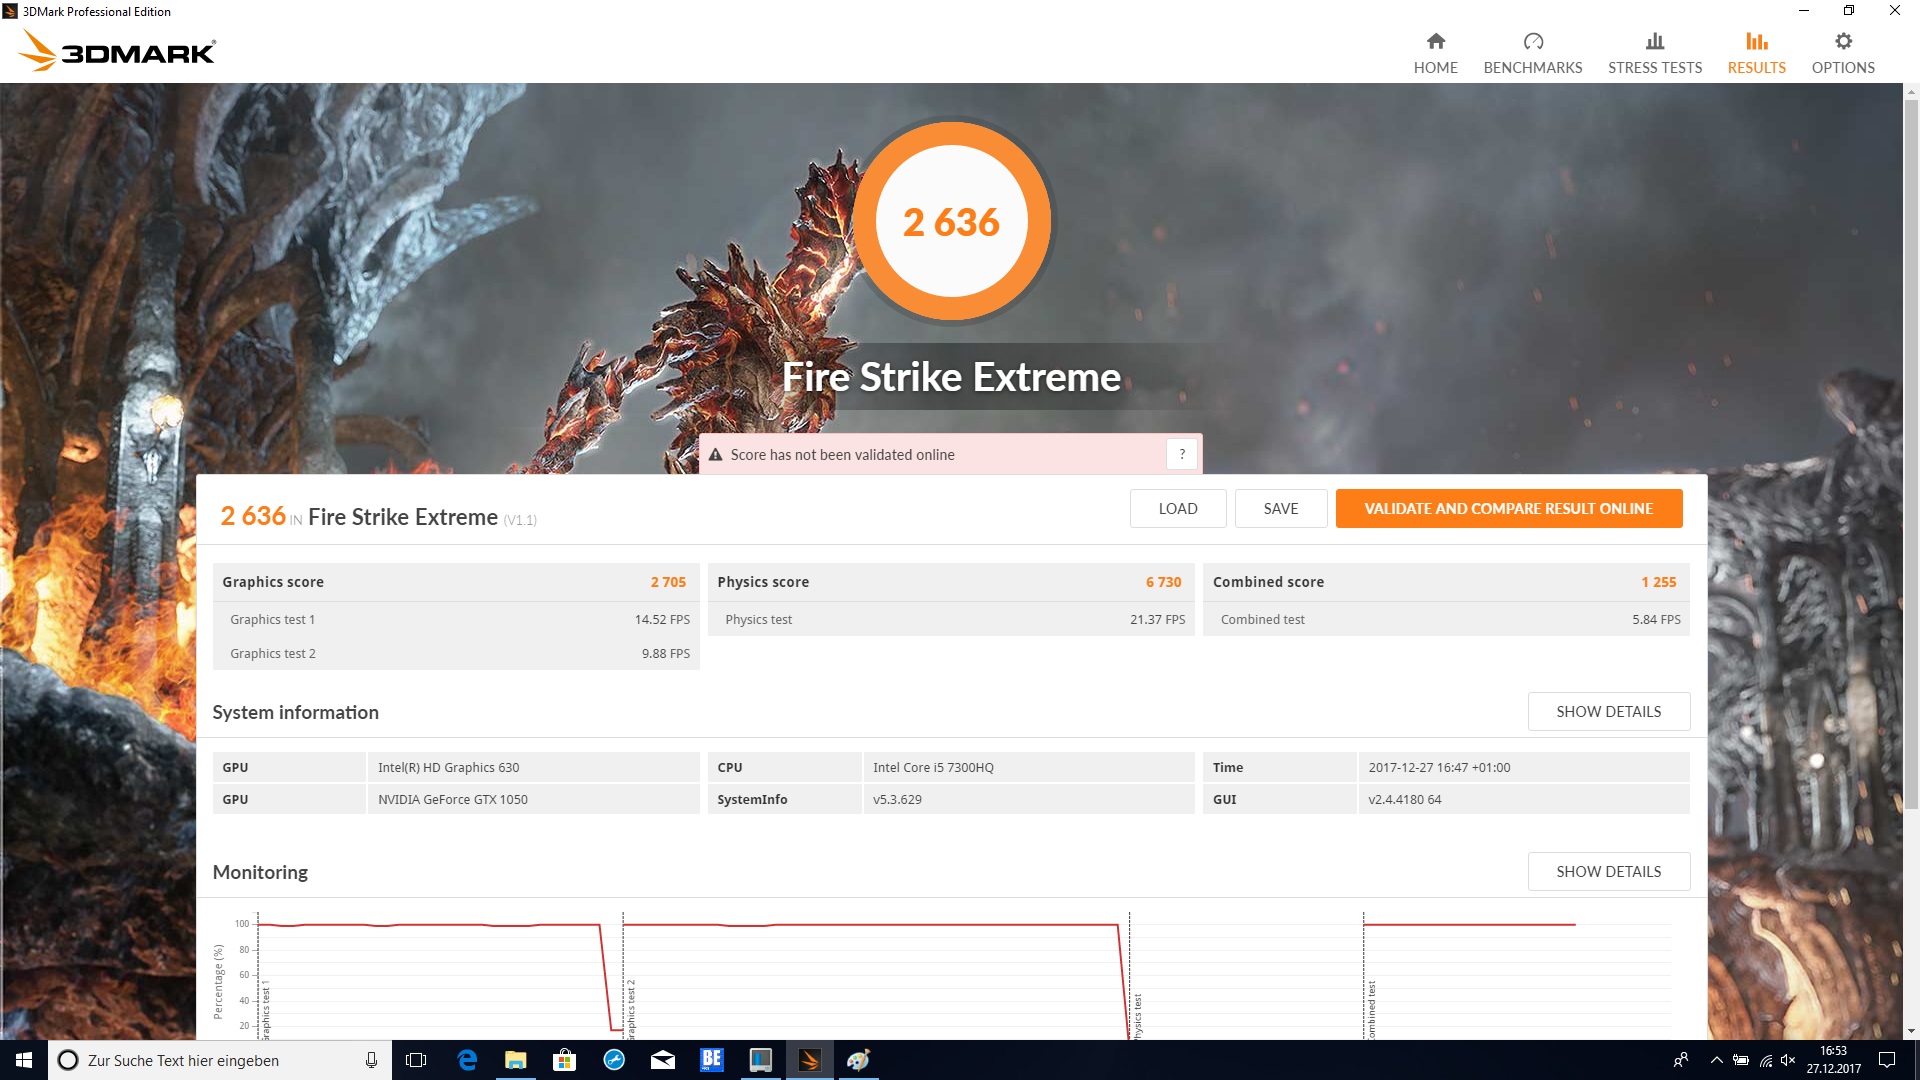
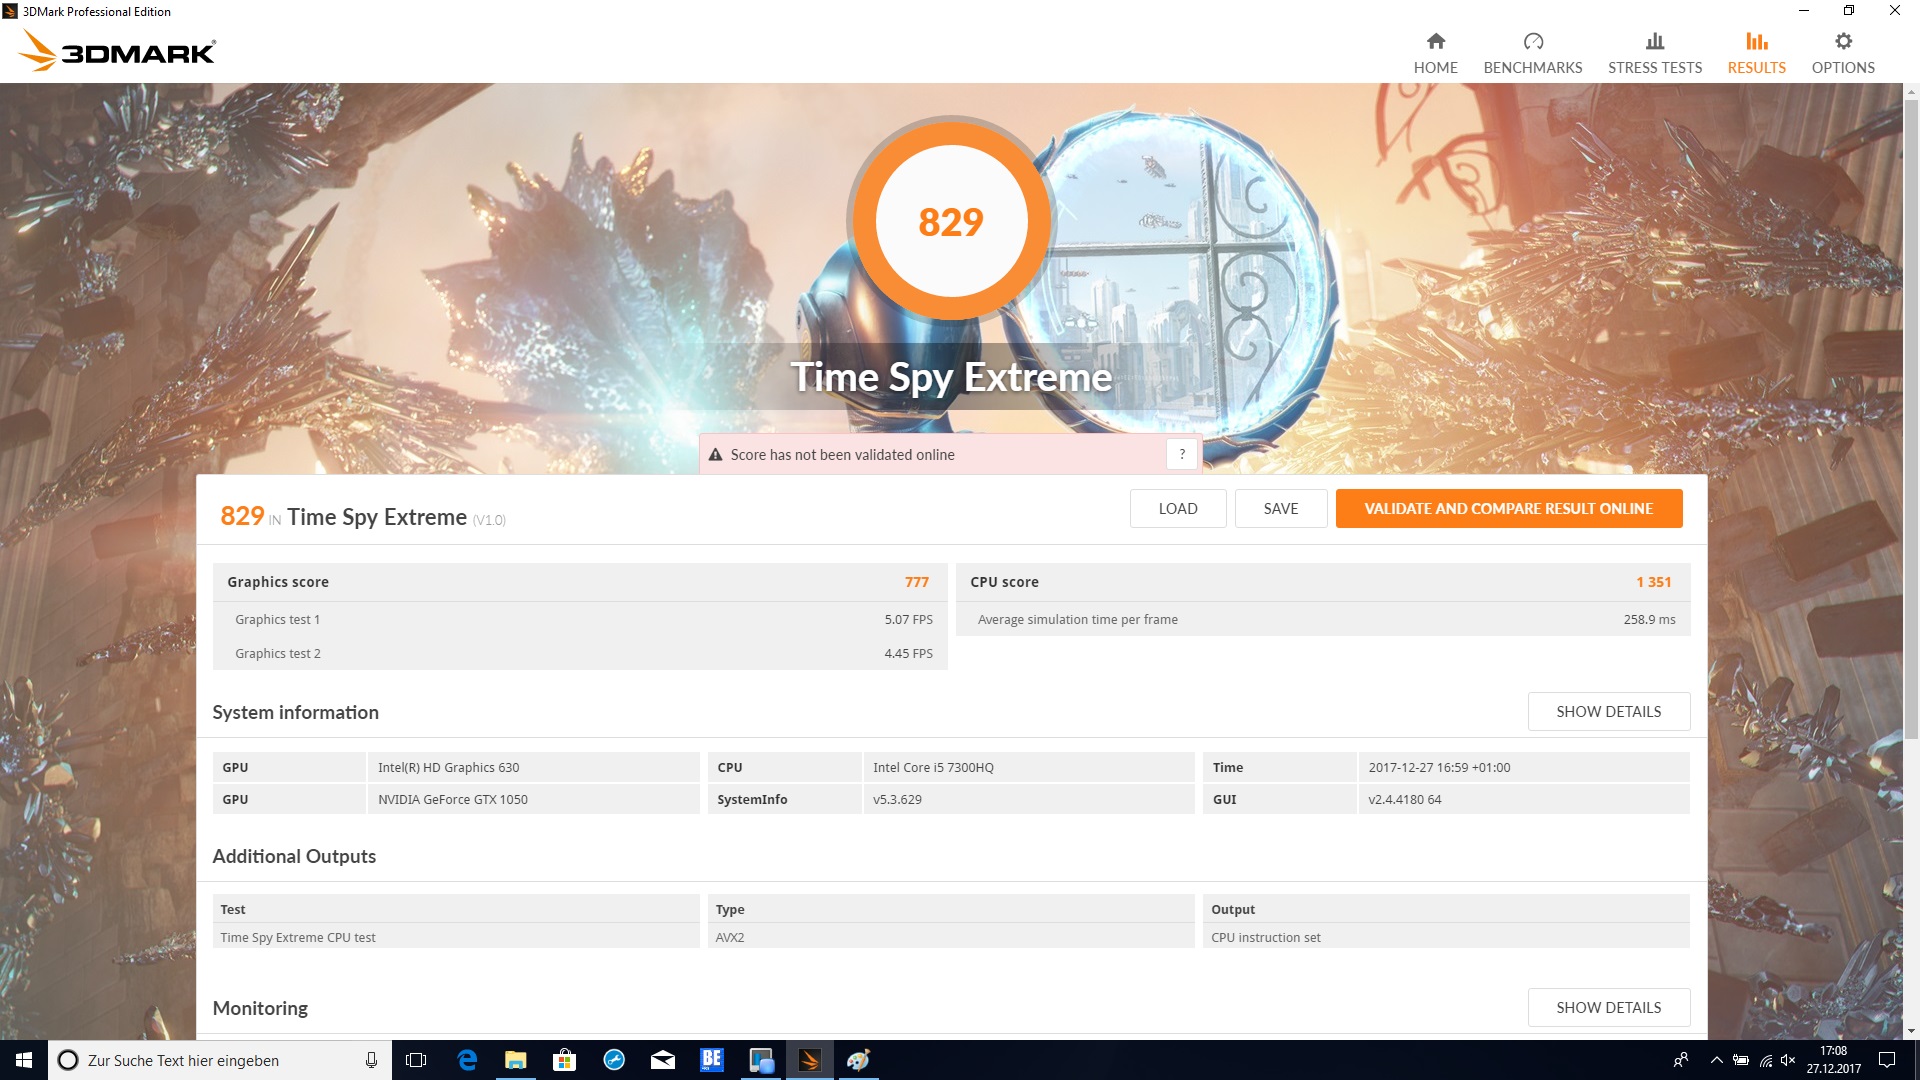
| 3DMark Fire Strike Extreme Score | 2636 poäng | |
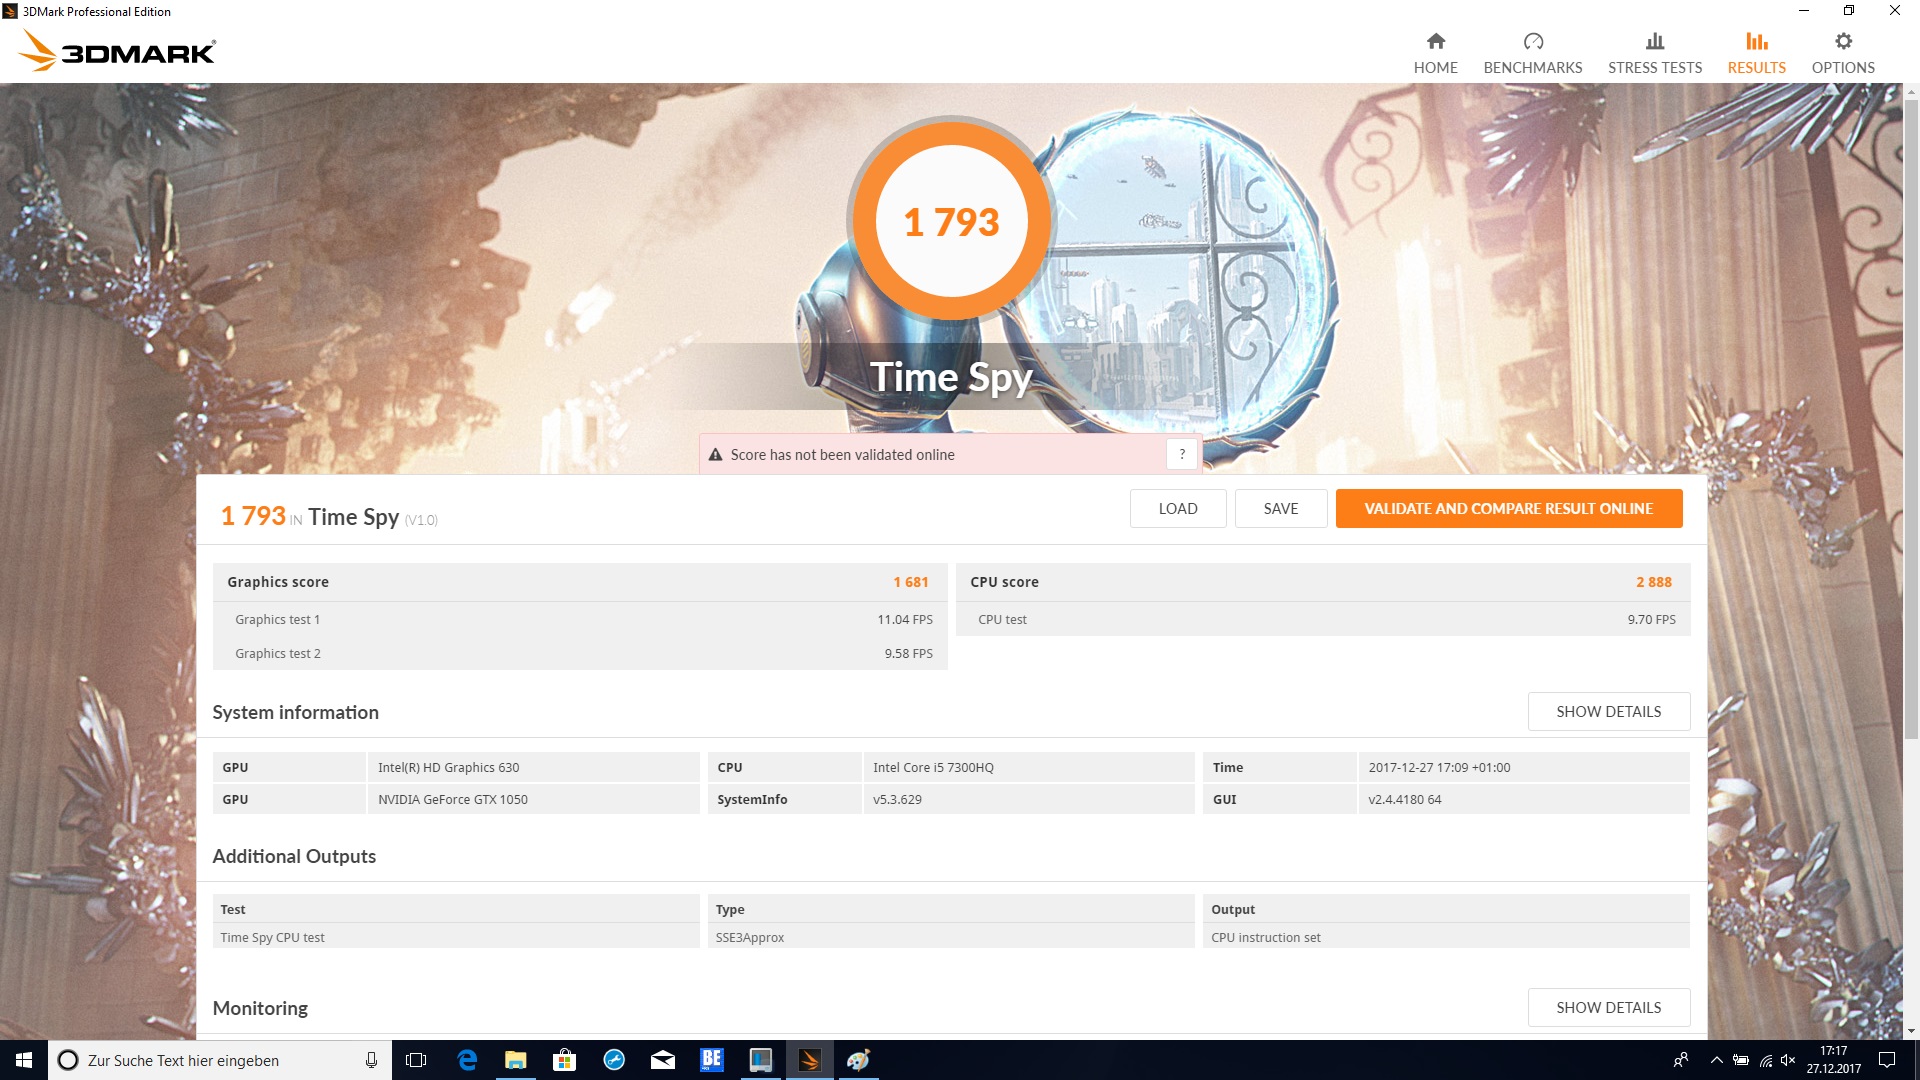
| 3DMark Time Spy Score | 1793 poäng | |
Hjälp | ||
| låg | med. | hög | ultra | |
|---|---|---|---|---|
| BioShock Infinite (2013) | 217.4 | 158.3 | 146.6 | 64.3 |
| Battlefield 4 (2013) | 170 | 143.7 | 124.3 | 51.5 |
| The Witcher 3 (2015) | 115.1 | 72.9 | 41 | 22.6 |
| Rise of the Tomb Raider (2016) | 124.2 | 73.8 | 39.6 | 33.1 |
Ljudnivå
| Låg belastning |
| 32.7 / 32.7 / 32.7 dB(A) |
| Hårddisk |
| 33 dB(A) |
| Hög belastning |
| 38.7 / 44.6 dB(A) |
 | ||
30 dB tyst 40 dB(A) hörbar 50 dB(A) högt ljud |
||
min: | ||
| Dell Inspiron 15 7000 7577 GeForce GTX 1050 Mobile, i5-7300HQ, Seagate Mobile HDD 1TB ST1000LX015-1U7172 | Dell Inspiron 15 7000 7577 GeForce GTX 1060 Max-Q, i5-7300HQ, Samsung PM961 MZVLW256HEHP | Lenovo Legion Y520-15IKBN 80WK0042GE GeForce GTX 1050 Ti Mobile, i5-7300HQ, Samsung PM961 NVMe MZVLW128HEGR | Acer Aspire VX15 VX5-591G-589S GeForce GTX 1050 Mobile, i5-7300HQ, Hynix HFS128G39TND | MSI GL62M 7RD-077 GeForce GTX 1050 Mobile, i7-7700HQ, HGST Travelstar 7K1000 HTS721010A9E630 | |
|---|---|---|---|---|---|
| Noise | 10% | 3% | 9% | -1% | |
| av / miljö * (dB) | 31 | 28 10% | 30.6 1% | 30 3% | 30.6 1% |
| Idle Minimum * (dB) | 32.7 | 28 14% | 31.9 2% | 30 8% | 32.5 1% |
| Idle Average * (dB) | 32.7 | 28 14% | 31.9 2% | 30 8% | 32.5 1% |
| Idle Maximum * (dB) | 32.7 | 28 14% | 31.9 2% | 31.1 5% | 32.5 1% |
| Load Average * (dB) | 38.7 | 30.3 22% | 34.6 11% | 31.3 19% | 36.4 6% |
| Witcher 3 ultra * (dB) | 39 | 39.5 -1% | 39.3 -1% | ||
| Load Maximum * (dB) | 44.6 | 46.5 -4% | 41.7 7% | 38.9 13% | 52.4 -17% |
* ... mindre är bättre
(+) Den maximala temperaturen på ovansidan är 35.9 °C / 97 F, jämfört med genomsnittet av 40.4 °C / 105 F , allt från 21.2 till 68.8 °C för klassen Gaming.
(±) Botten värms upp till maximalt 41.6 °C / 107 F, jämfört med genomsnittet av 43.2 °C / 110 F
(+) Vid tomgångsbruk är medeltemperaturen för ovansidan 26.4 °C / 80 F, jämfört med enhetsgenomsnittet på 33.9 °C / ### class_avg_f### F.
(+) När du spelar The Witcher 3 är medeltemperaturen för ovansidan 28.4 °C / 83 F, jämfört med enhetsgenomsnittet på 33.9 °C / ## #class_avg_f### F.
(+) Handledsstöden och pekplattan är kallare än hudtemperaturen med maximalt 29.1 °C / 84.4 F och är därför svala att ta på.
(±) Medeltemperaturen för handledsstödsområdet på liknande enheter var 28.8 °C / 83.8 F (-0.3 °C / -0.6 F).
| Dell Inspiron 15 7000 7577 GeForce GTX 1050 Mobile, i5-7300HQ, Seagate Mobile HDD 1TB ST1000LX015-1U7172 | Dell Inspiron 15 7000 7577 GeForce GTX 1060 Max-Q, i5-7300HQ, Samsung PM961 MZVLW256HEHP | Lenovo Legion Y520-15IKBN 80WK0042GE GeForce GTX 1050 Ti Mobile, i5-7300HQ, Samsung PM961 NVMe MZVLW128HEGR | Acer Aspire VX15 VX5-591G-589S GeForce GTX 1050 Mobile, i5-7300HQ, Hynix HFS128G39TND | MSI GL62M 7RD-077 GeForce GTX 1050 Mobile, i7-7700HQ, HGST Travelstar 7K1000 HTS721010A9E630 | |
|---|---|---|---|---|---|
| Heat | -3% | 11% | -11% | -3% | |
| Maximum Upper Side * (°C) | 35.9 | 44 -23% | 39.6 -10% | 47.2 -31% | 44.9 -25% |
| Maximum Bottom * (°C) | 41.6 | 43.8 -5% | 38.4 8% | 42.2 -1% | 38.2 8% |
| Idle Upper Side * (°C) | 27.9 | 26 7% | 22.8 18% | 31.8 -14% | 27.4 2% |
| Idle Bottom * (°C) | 30.5 | 28 8% | 22.1 28% | 29.5 3% | 29 5% |
* ... mindre är bättre
Dell Inspiron 15 7000 7577 ljudanalys
(-) | inte särskilt höga högtalare (71.9 dB)
Bas 100 - 315 Hz
(±) | reducerad bas - i genomsnitt 9.3% lägre än medianen
(+) | basen är linjär (6.1% delta till föregående frekvens)
Mellan 400 - 2000 Hz
(±) | högre mellan - i genomsnitt 6.1% högre än median
(+) | mids är linjära (5.7% delta till föregående frekvens)
Högsta 2 - 16 kHz
(±) | högre toppar - i genomsnitt 6% högre än medianen
(±) | linjäriteten för toppar är genomsnittlig (10.4% delta till föregående frekvens)
Totalt 100 - 16 000 Hz
(±) | linjäriteten för det totala ljudet är genomsnittlig (19% skillnad mot median)
Jämfört med samma klass
» 63% av alla testade enheter i den här klassen var bättre, 8% liknande, 28% sämre
» Den bästa hade ett delta på 6%, genomsnittet var 18%, sämst var 132%
Jämfört med alla testade enheter
» 45% av alla testade enheter var bättre, 7% liknande, 48% sämre
» Den bästa hade ett delta på 4%, genomsnittet var 23%, sämst var 134%
Lenovo Legion Y520-15IKBN 80WK0042GE ljudanalys
(-) | inte särskilt höga högtalare (65.8 dB)
Bas 100 - 315 Hz
(-) | nästan ingen bas - i genomsnitt 16.9% lägre än medianen
(±) | linjäriteten för basen är genomsnittlig (13.9% delta till föregående frekvens)
Mellan 400 - 2000 Hz
(+) | balanserad mellan - endast 4.6% från medianen
(±) | linjäriteten för mids är genomsnittlig (8.8% delta till föregående frekvens)
Högsta 2 - 16 kHz
(+) | balanserade toppar - endast 3.6% från medianen
(±) | linjäriteten för toppar är genomsnittlig (12.7% delta till föregående frekvens)
Totalt 100 - 16 000 Hz
(±) | linjäriteten för det totala ljudet är genomsnittlig (22.6% skillnad mot median)
Jämfört med samma klass
» 81% av alla testade enheter i den här klassen var bättre, 5% liknande, 14% sämre
» Den bästa hade ett delta på 6%, genomsnittet var 18%, sämst var 132%
Jämfört med alla testade enheter
» 67% av alla testade enheter var bättre, 6% liknande, 28% sämre
» Den bästa hade ett delta på 4%, genomsnittet var 23%, sämst var 134%
| Av/Standby | |
| Låg belastning | |
| Hög belastning |
|
Förklaring:
min: | |
| Dell Inspiron 15 7000 7577 i5-7300HQ, GeForce GTX 1050 Mobile, Seagate Mobile HDD 1TB ST1000LX015-1U7172, IPS, 1920x1080, 15.6" | Dell Inspiron 15 7000 7577 i5-7300HQ, GeForce GTX 1060 Max-Q, Samsung PM961 MZVLW256HEHP, IPS, 1920x1080, 15.6" | Lenovo Legion Y520-15IKBN 80WK0042GE i5-7300HQ, GeForce GTX 1050 Ti Mobile, Samsung PM961 NVMe MZVLW128HEGR, IPS, 1920x1080, 15.6" | Acer Aspire VX15 VX5-591G-589S i5-7300HQ, GeForce GTX 1050 Mobile, Hynix HFS128G39TND, IPS, 1920x1080, 15.6" | MSI GL62M 7RD-077 i7-7700HQ, GeForce GTX 1050 Mobile, HGST Travelstar 7K1000 HTS721010A9E630, TN LED, 1920x1080, 15.6" | |
|---|---|---|---|---|---|
| Power Consumption | 4% | 7% | -21% | -47% | |
| Idle Minimum * (Watt) | 5.3 | 7.1 -34% | 5.2 2% | 8.4 -58% | 10.6 -100% |
| Idle Average * (Watt) | 8.8 | 7.6 14% | 8.3 6% | 13.1 -49% | 14.5 -65% |
| Idle Maximum * (Watt) | 9.7 | 8.6 11% | 10.1 -4% | 14.2 -46% | 15 -55% |
| Load Average * (Watt) | 100 | 59.5 40% | 62.7 37% | 50 50% | 90 10% |
| Witcher 3 ultra * (Watt) | 87 | 89 -2% | 94 -8% | ||
| Load Maximum * (Watt) | 109 | 112.8 -3% | 100 8% | 111 -2% | 135 -24% |
* ... mindre är bättre

| Dell Inspiron 15 7000 7577 i5-7300HQ, GeForce GTX 1050 Mobile, 56 Wh | Dell Inspiron 15 7000 7577 i5-7300HQ, GeForce GTX 1060 Max-Q, 56 Wh | Lenovo Legion Y520-15IKBN 80WK0042GE i5-7300HQ, GeForce GTX 1050 Ti Mobile, 45 Wh | Acer Aspire VX15 VX5-591G-589S i5-7300HQ, GeForce GTX 1050 Mobile, 52.5 Wh | MSI GL62M 7RD-077 i7-7700HQ, GeForce GTX 1050 Mobile, 41 Wh | |
|---|---|---|---|---|---|
| Batteridrifttid | -4% | -16% | -19% | -44% | |
| Reader / Idle (h) | 11.1 | 11 -1% | 10.6 -5% | 6.5 -41% | |
| H.264 (h) | 5.2 | 4.5 -13% | 3.6 -31% | ||
| WiFi v1.3 (h) | 6.8 | 6.9 1% | 5.2 -24% | 5.5 -19% | 3.8 -44% |
| Load (h) | 1.8 | 1.6 -11% | 1.4 -22% | 0.7 -61% |
För
Emot
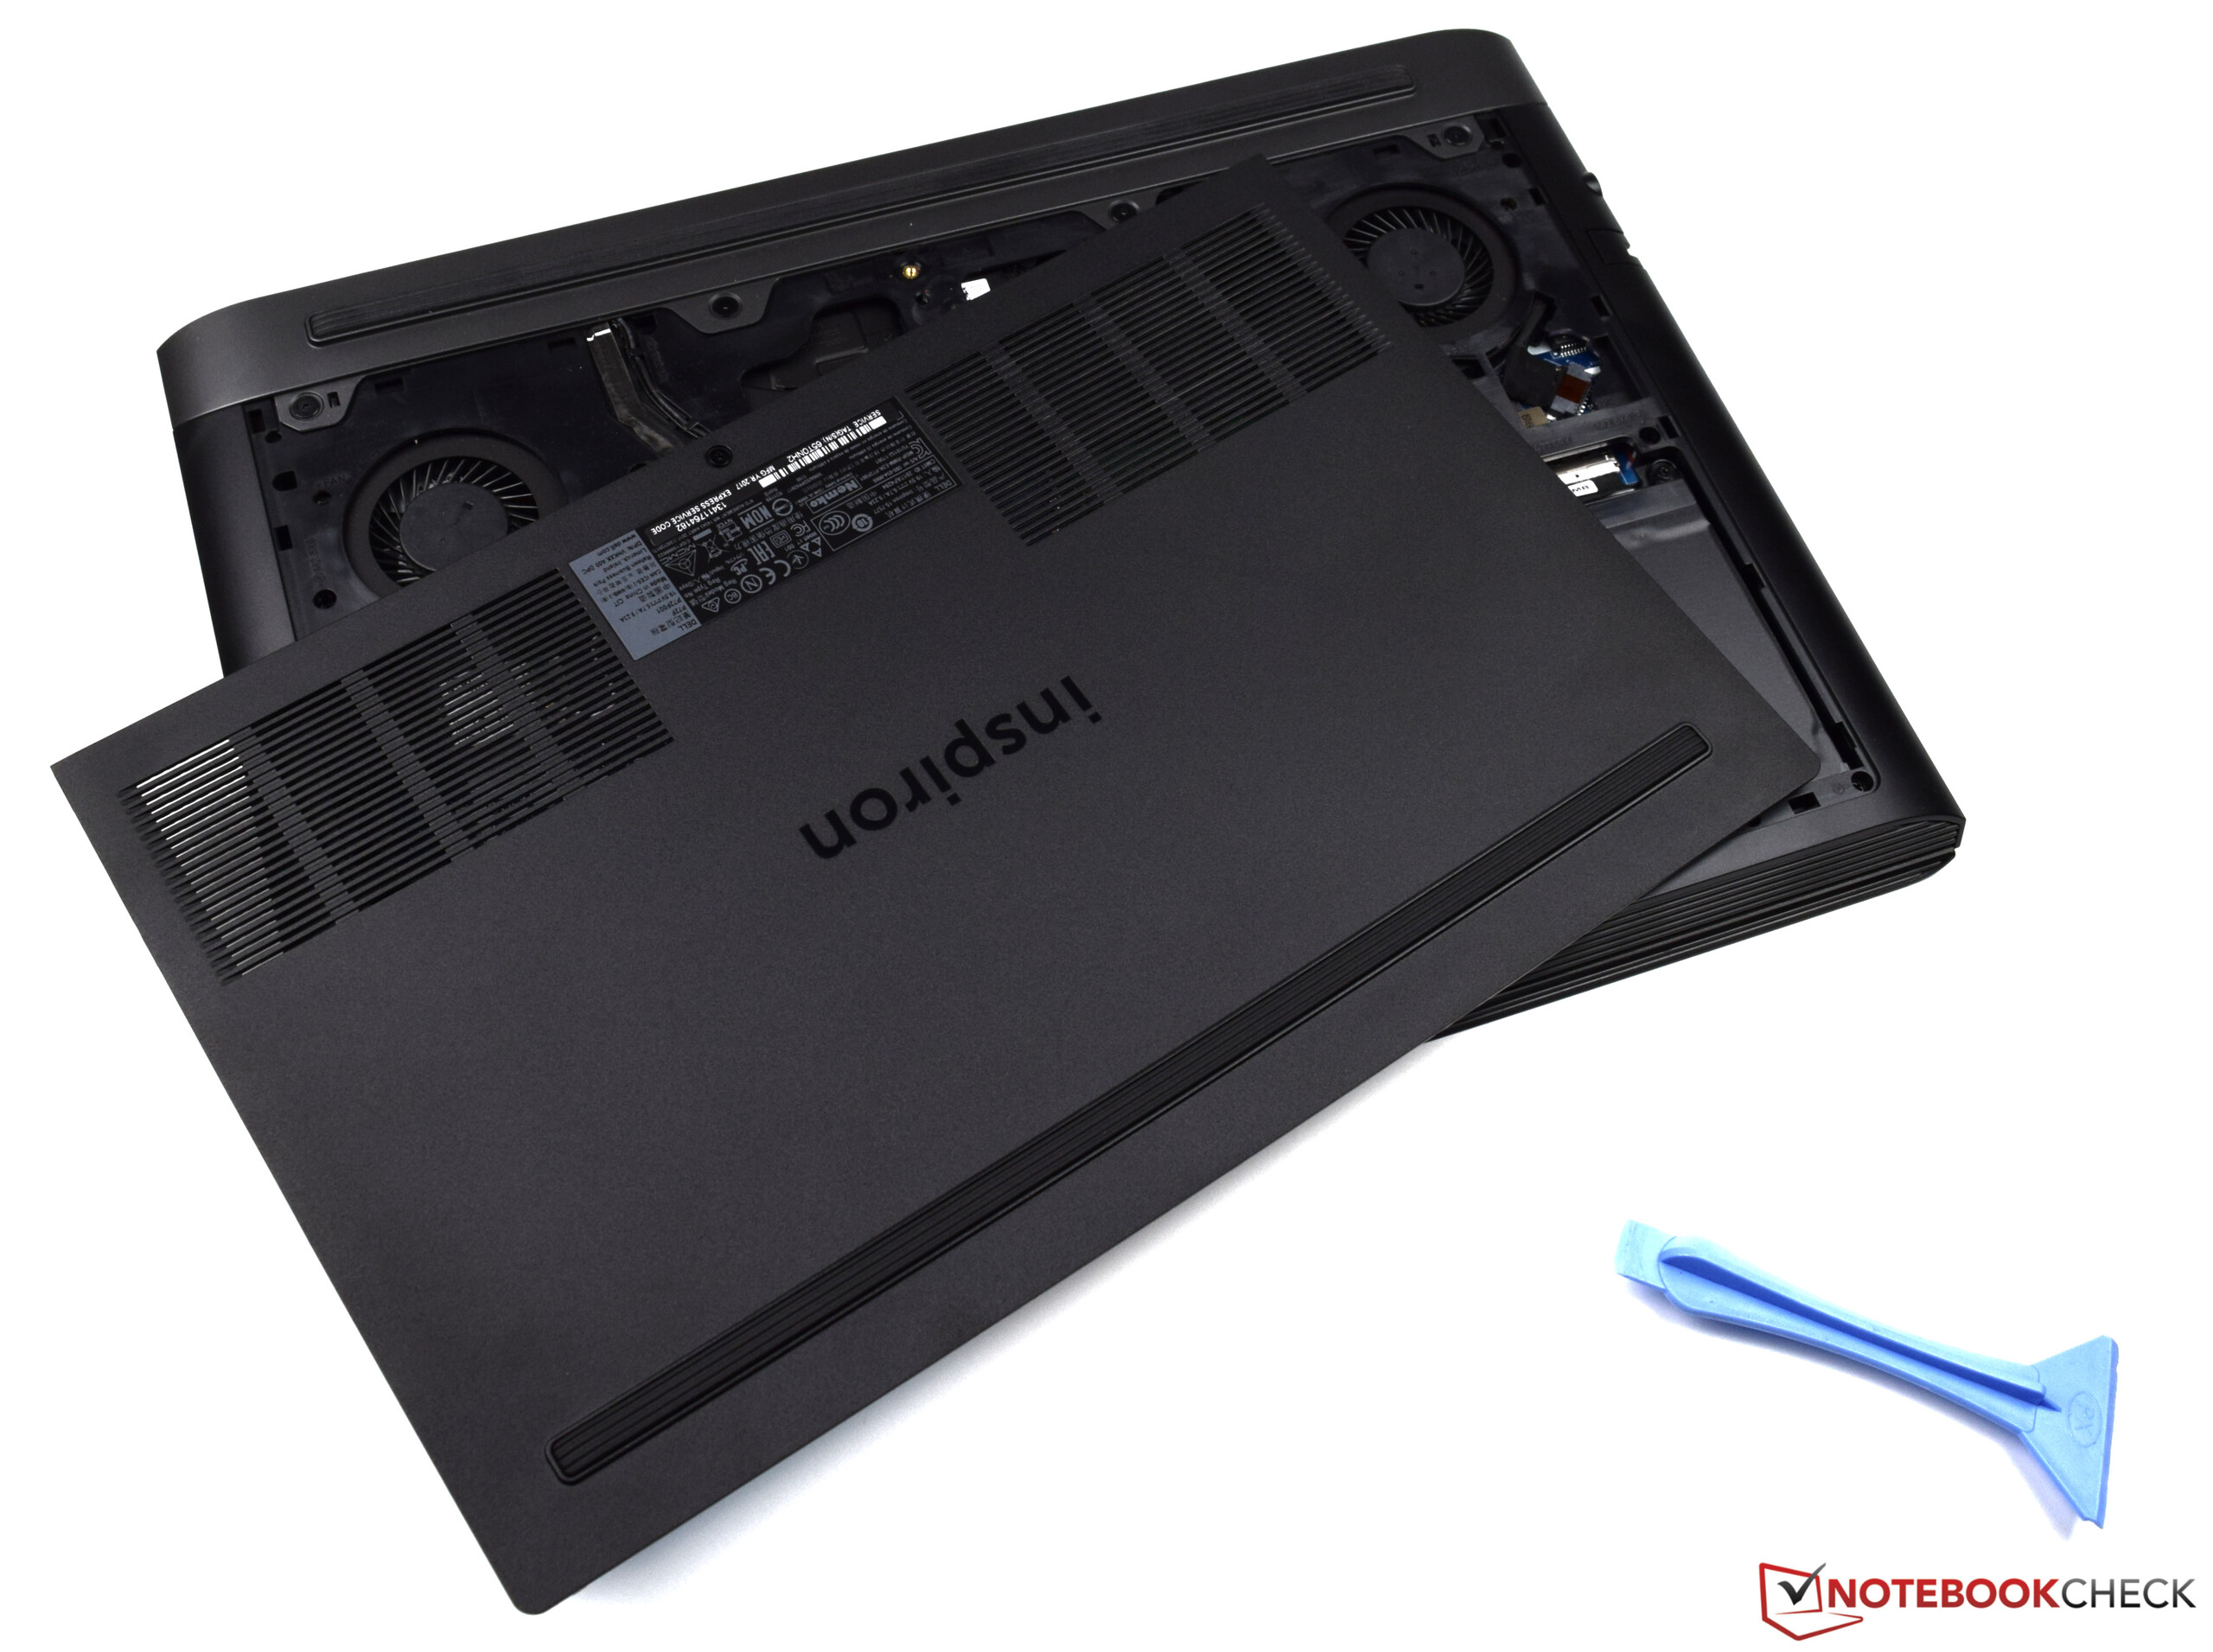
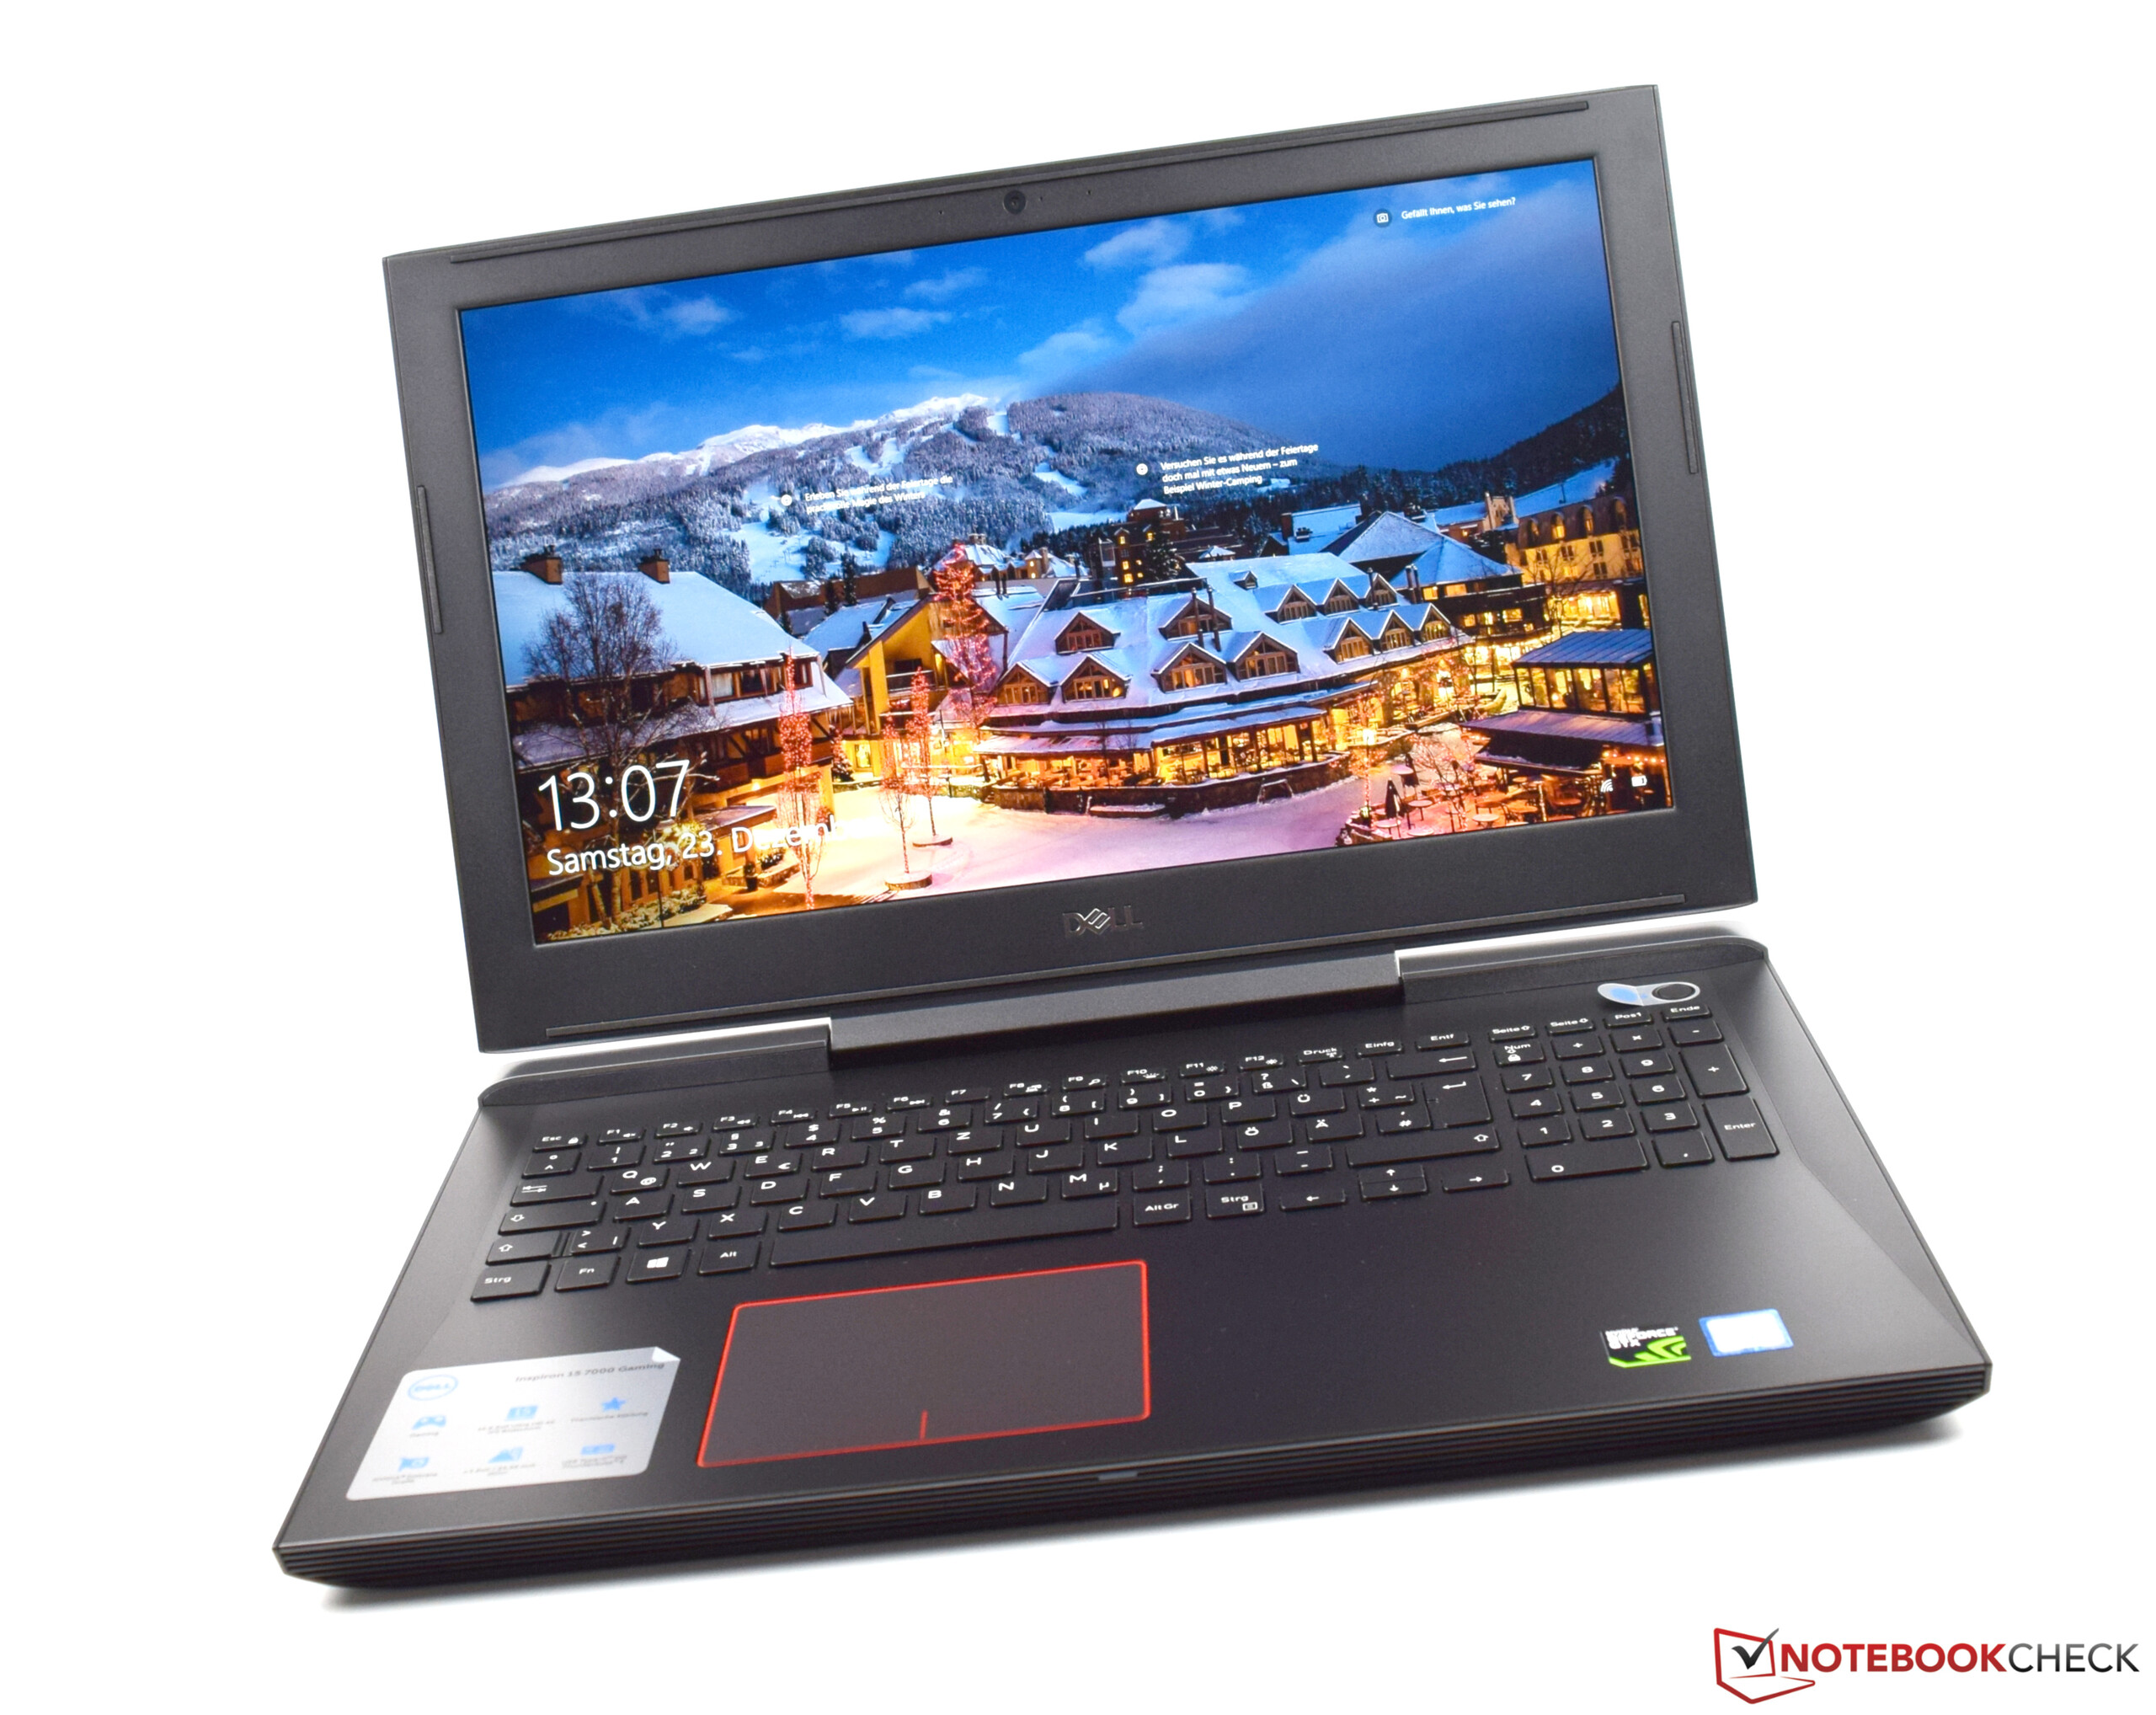
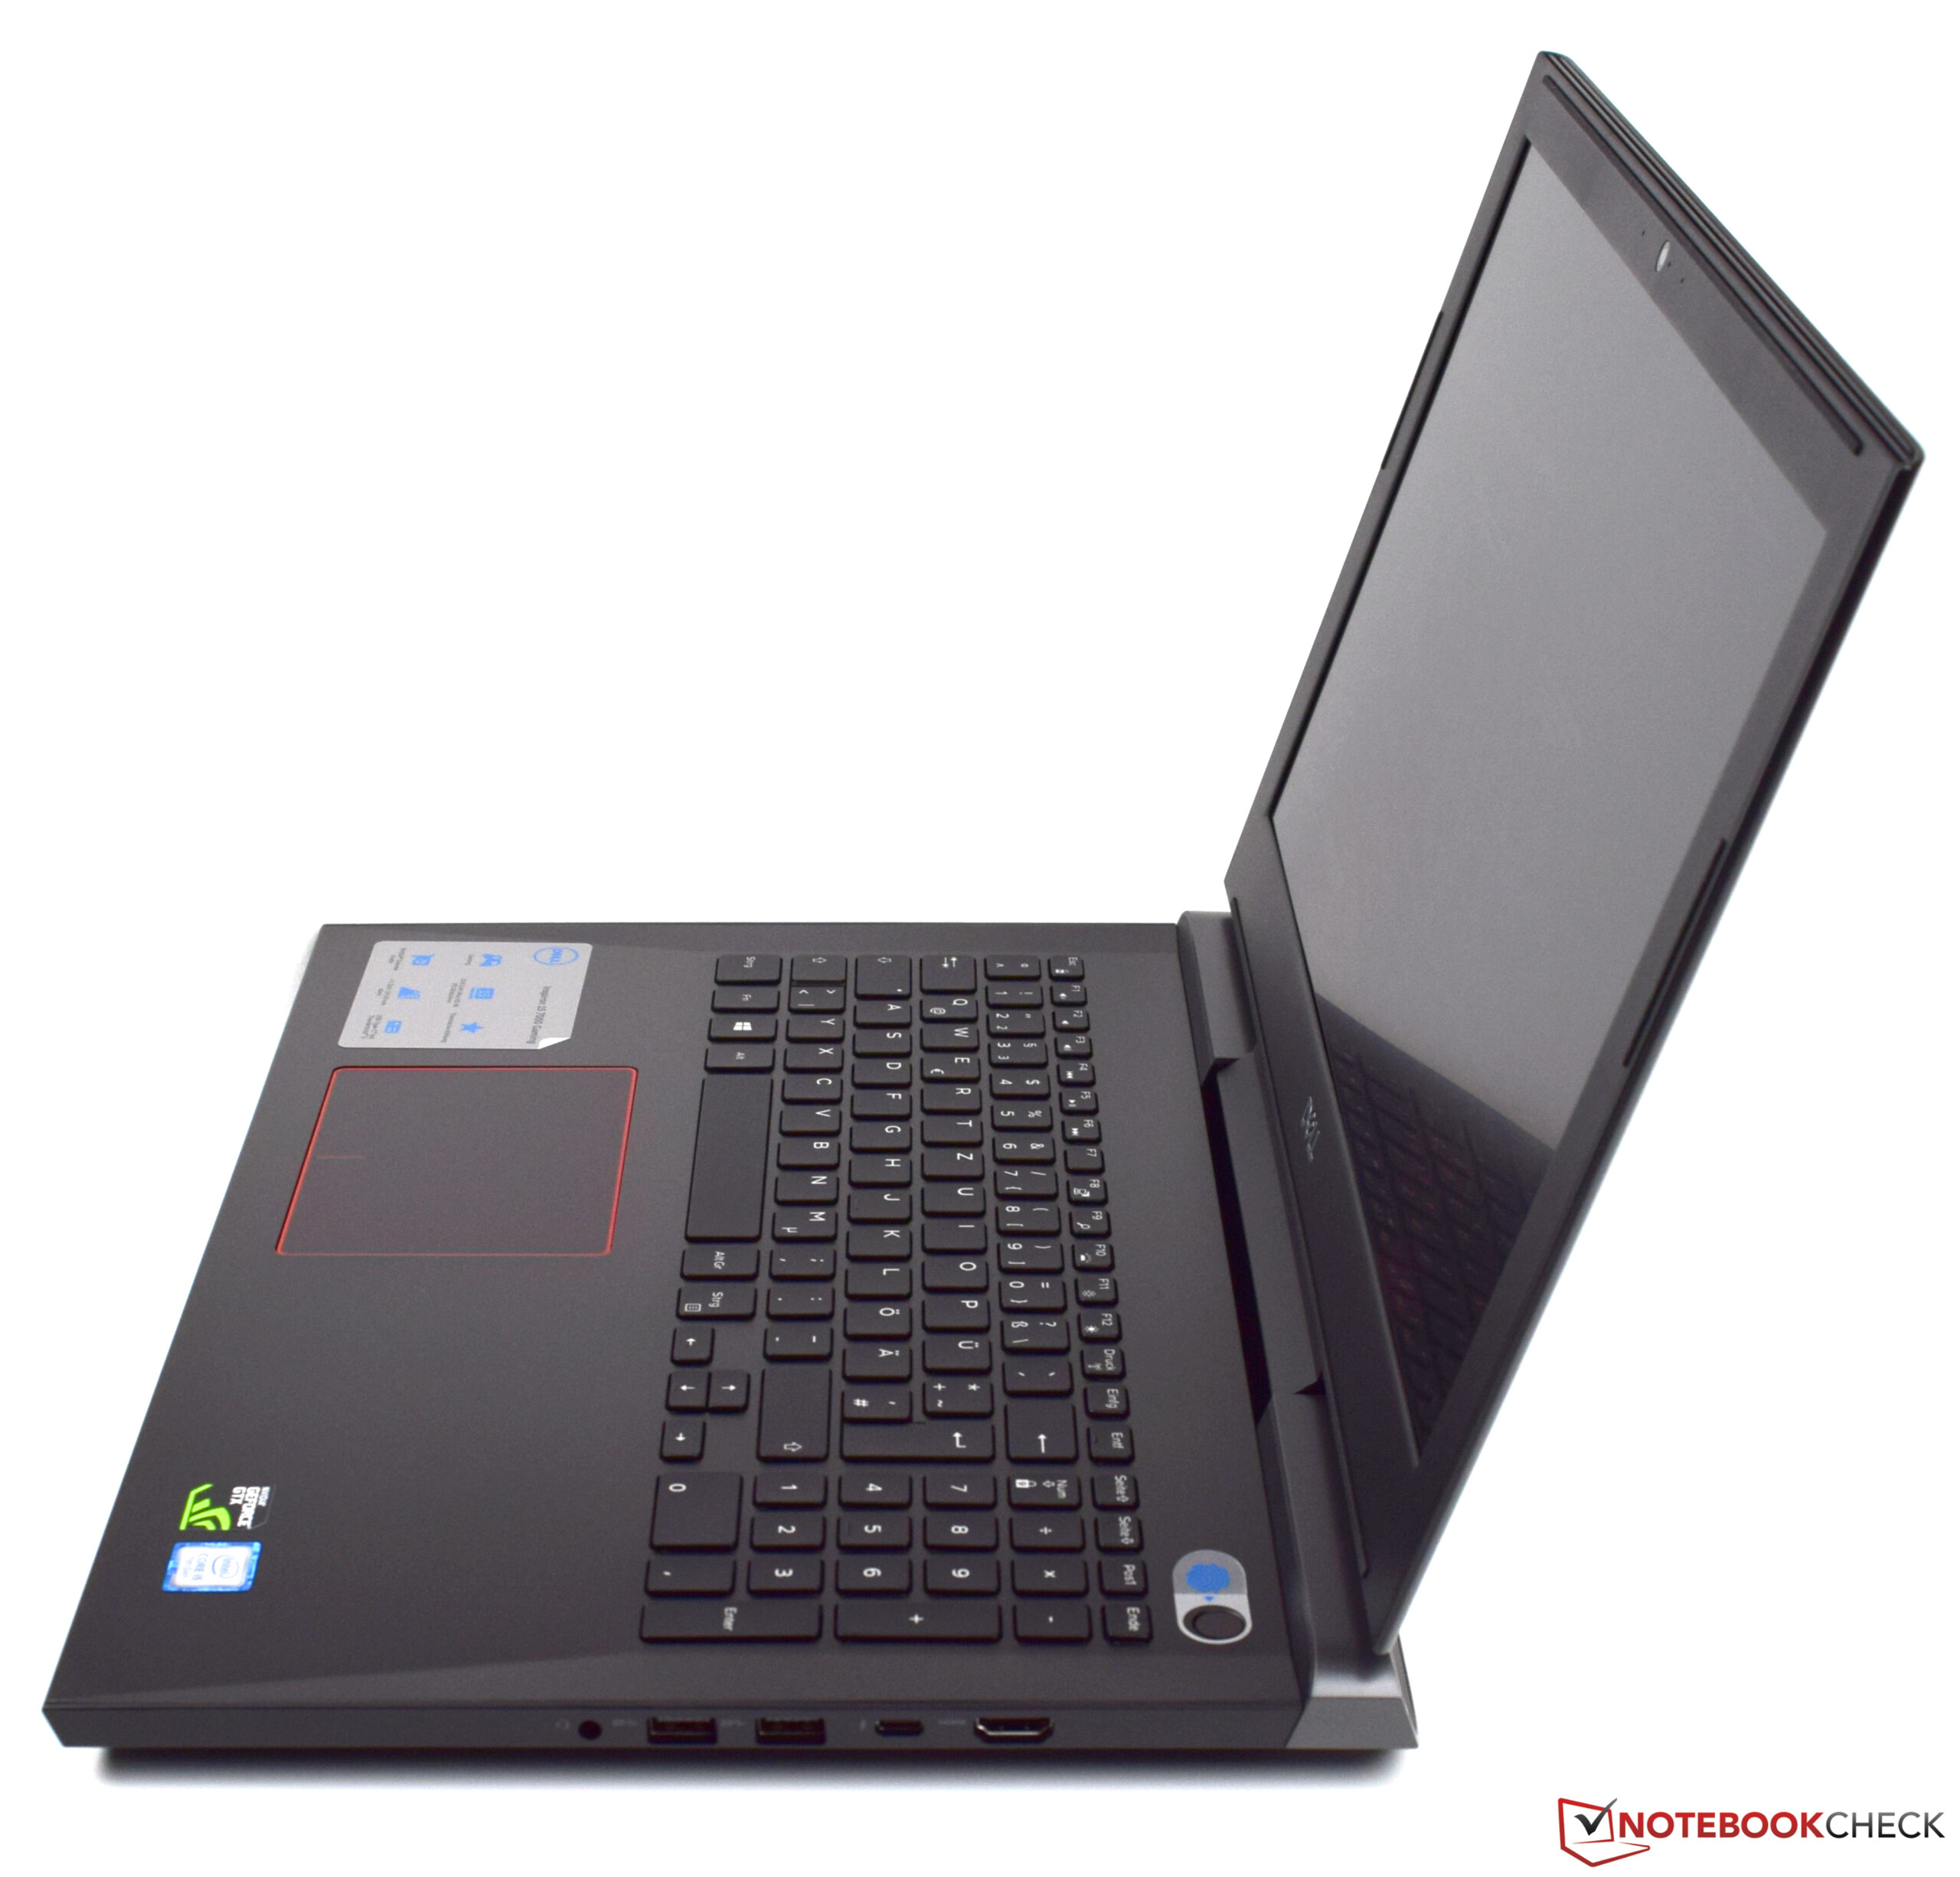
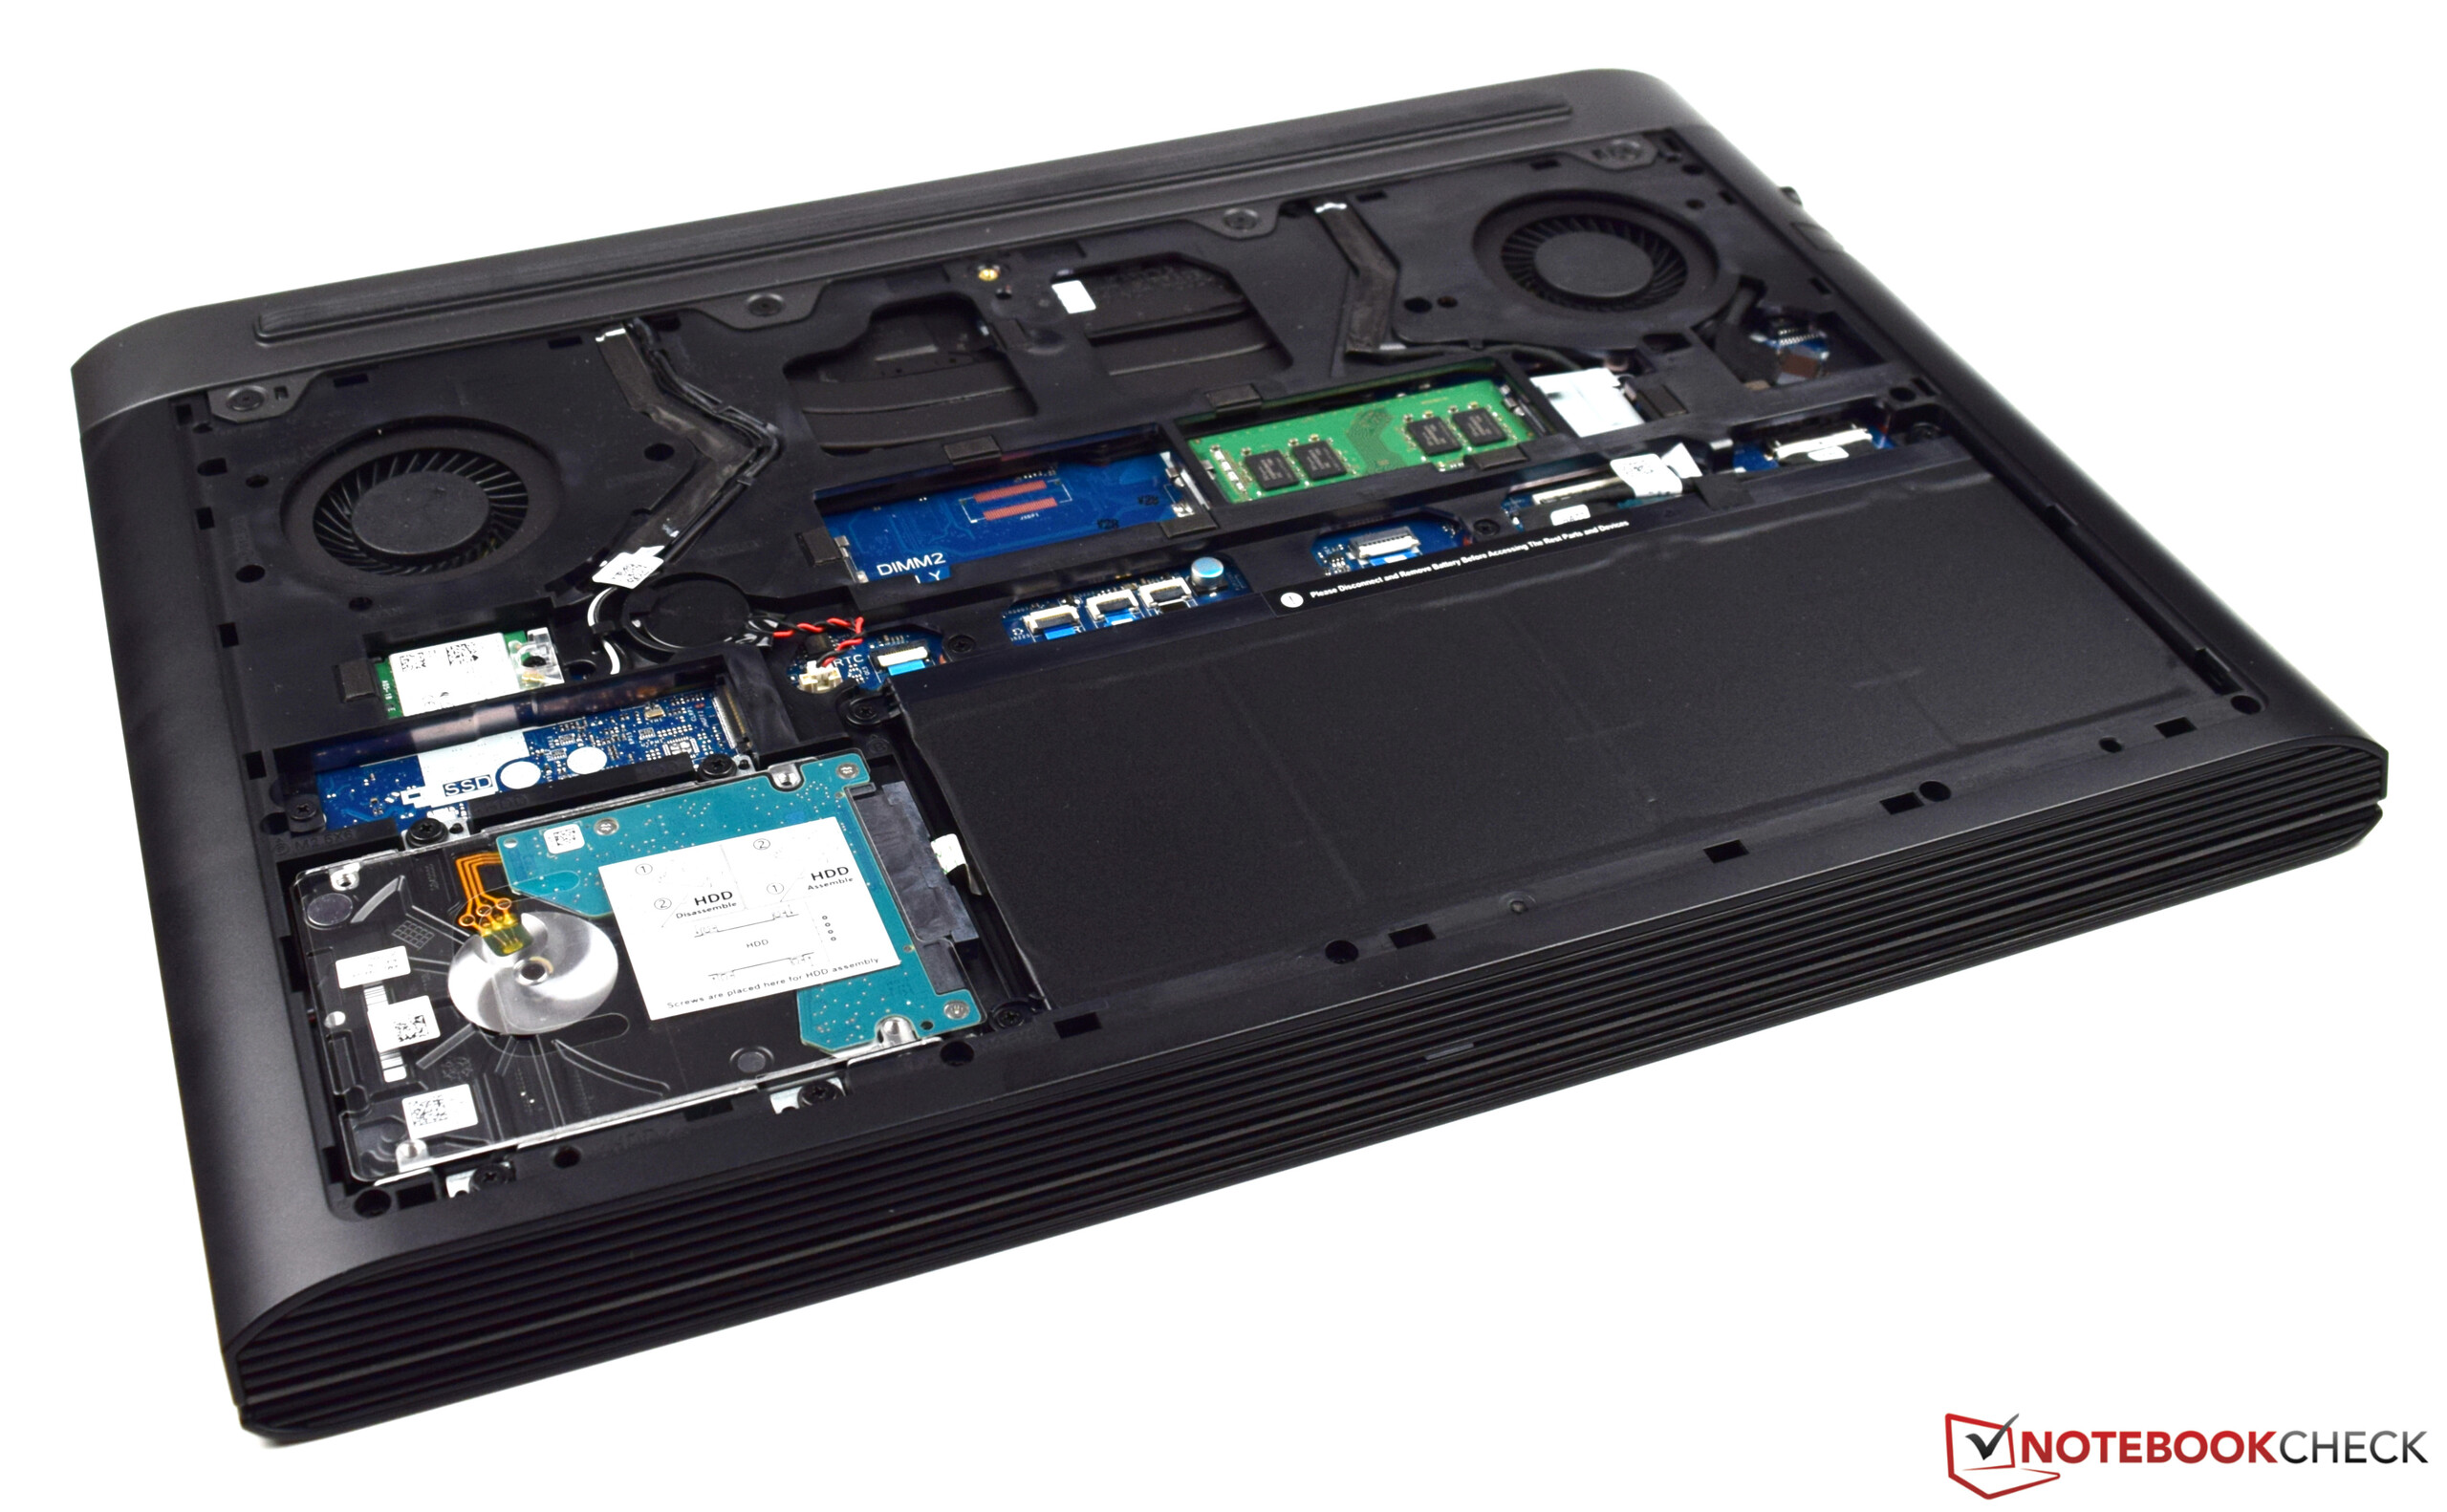
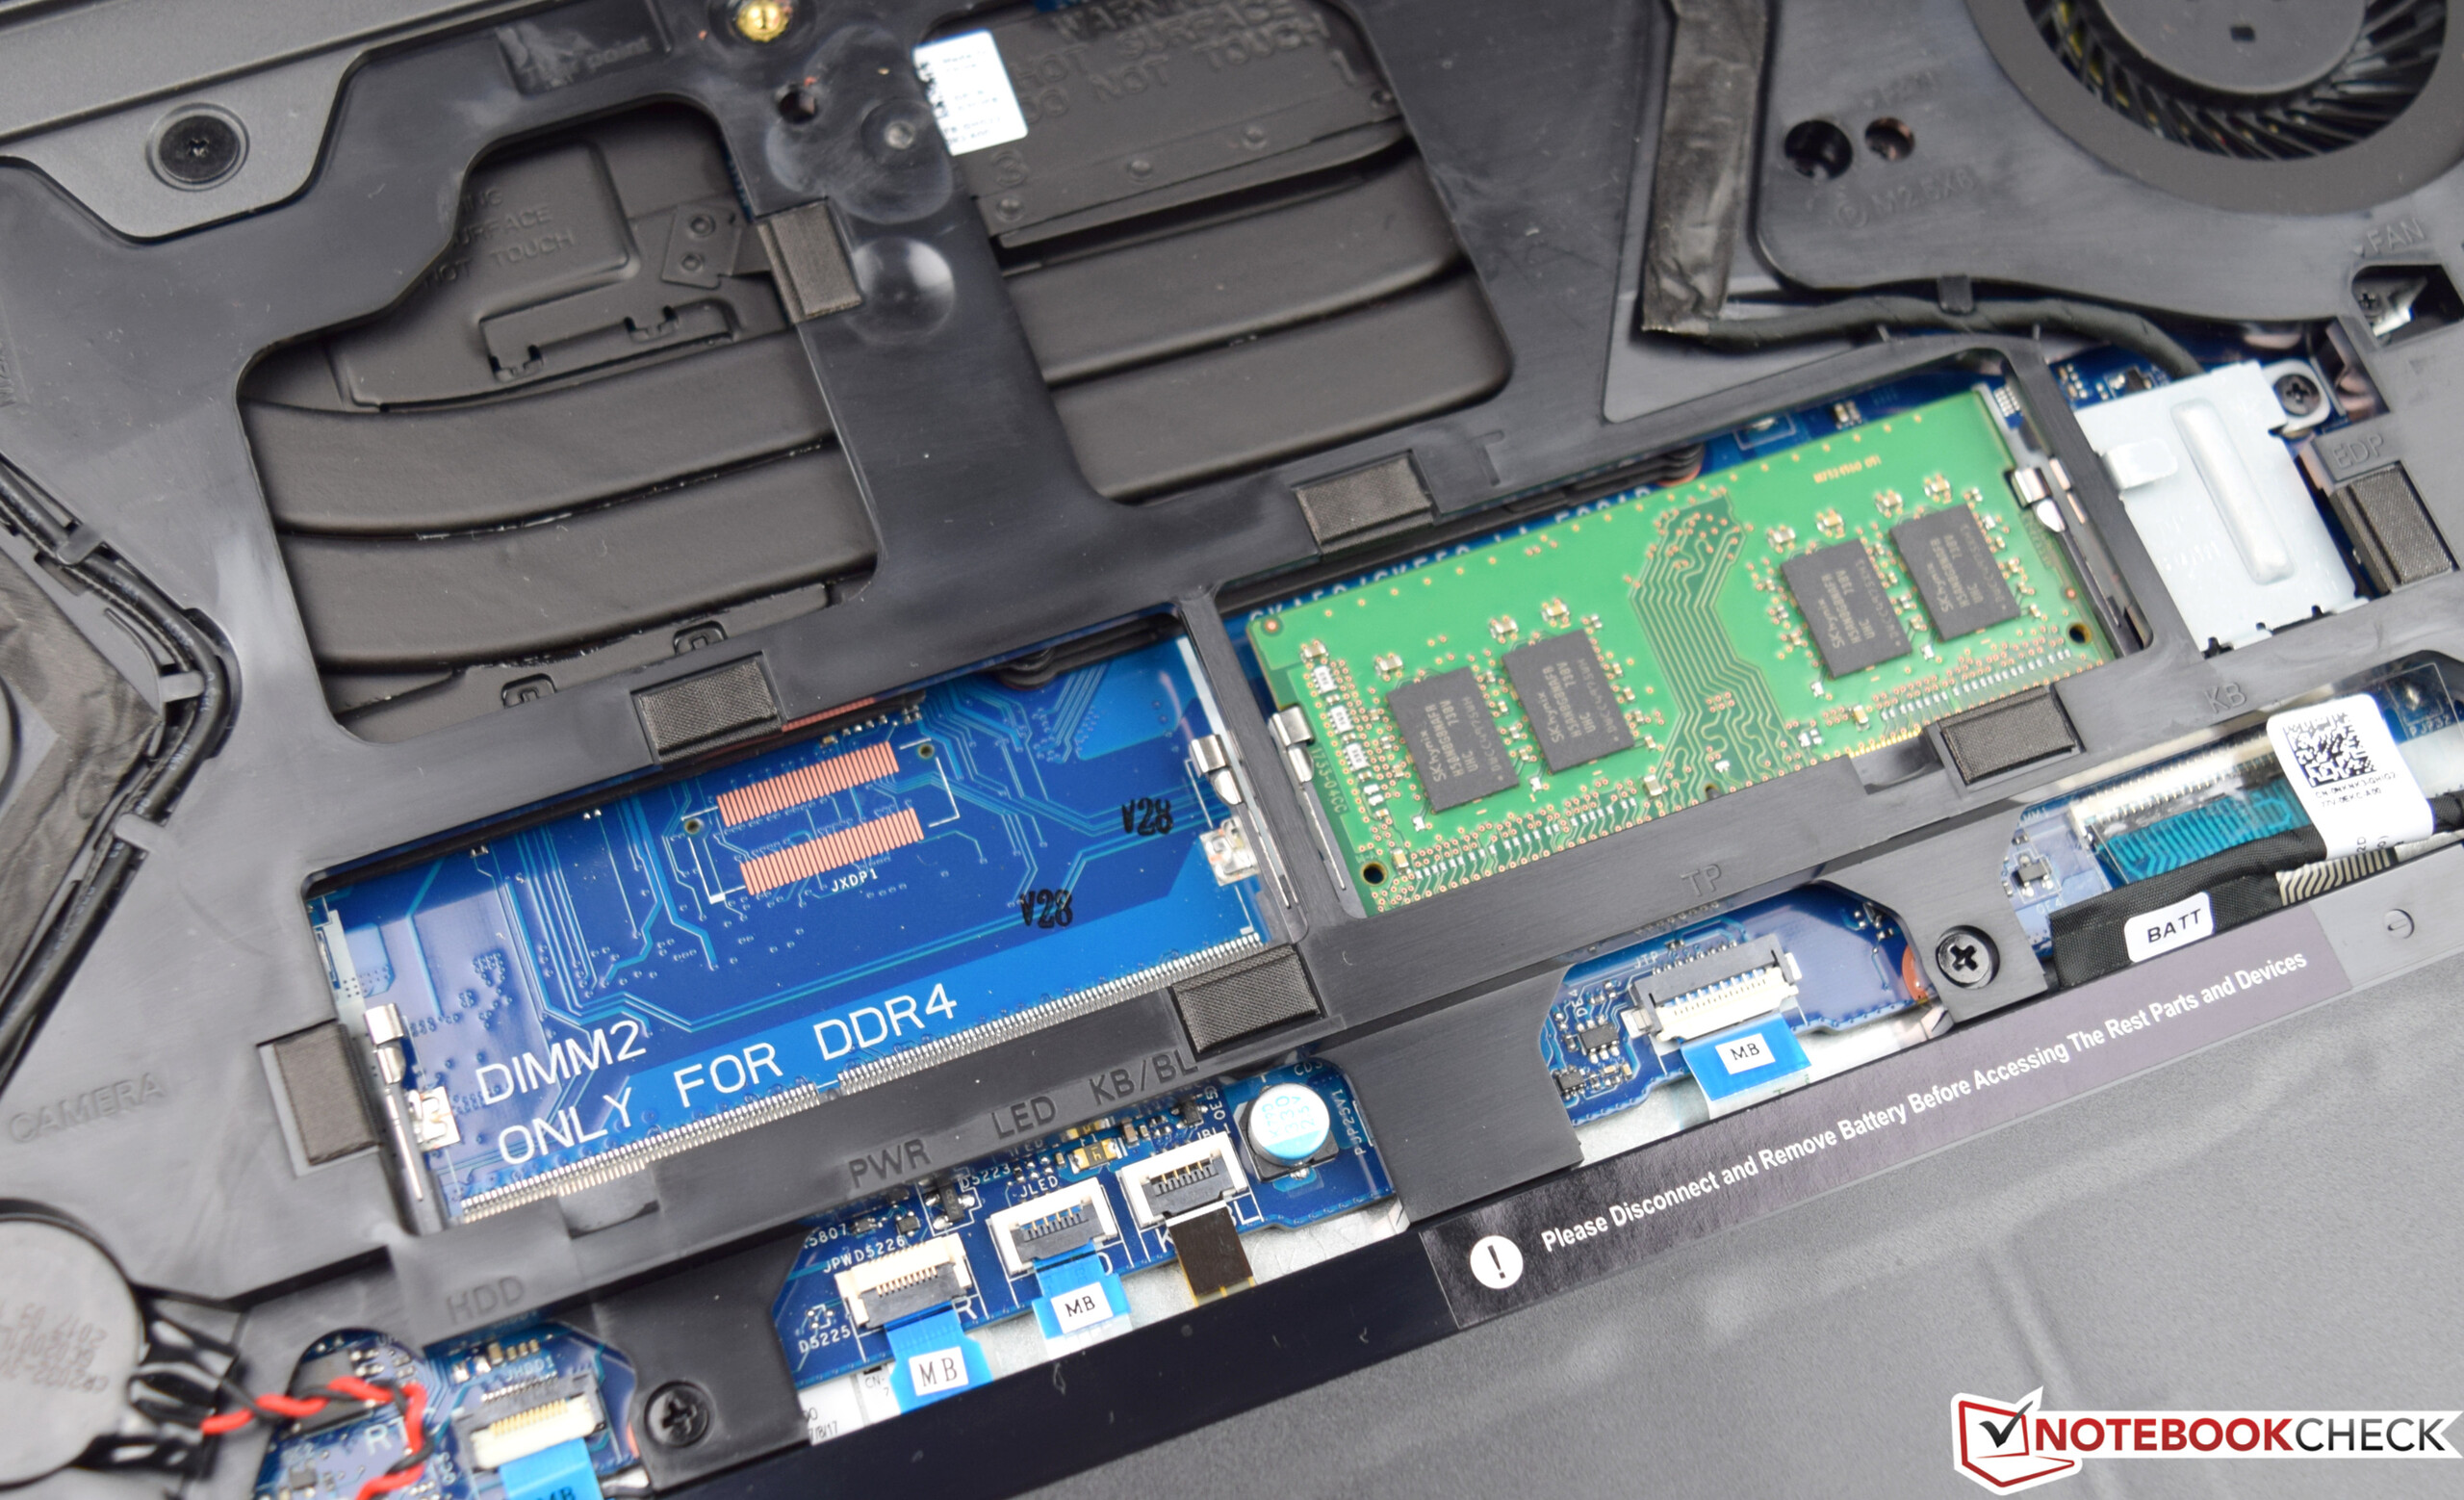
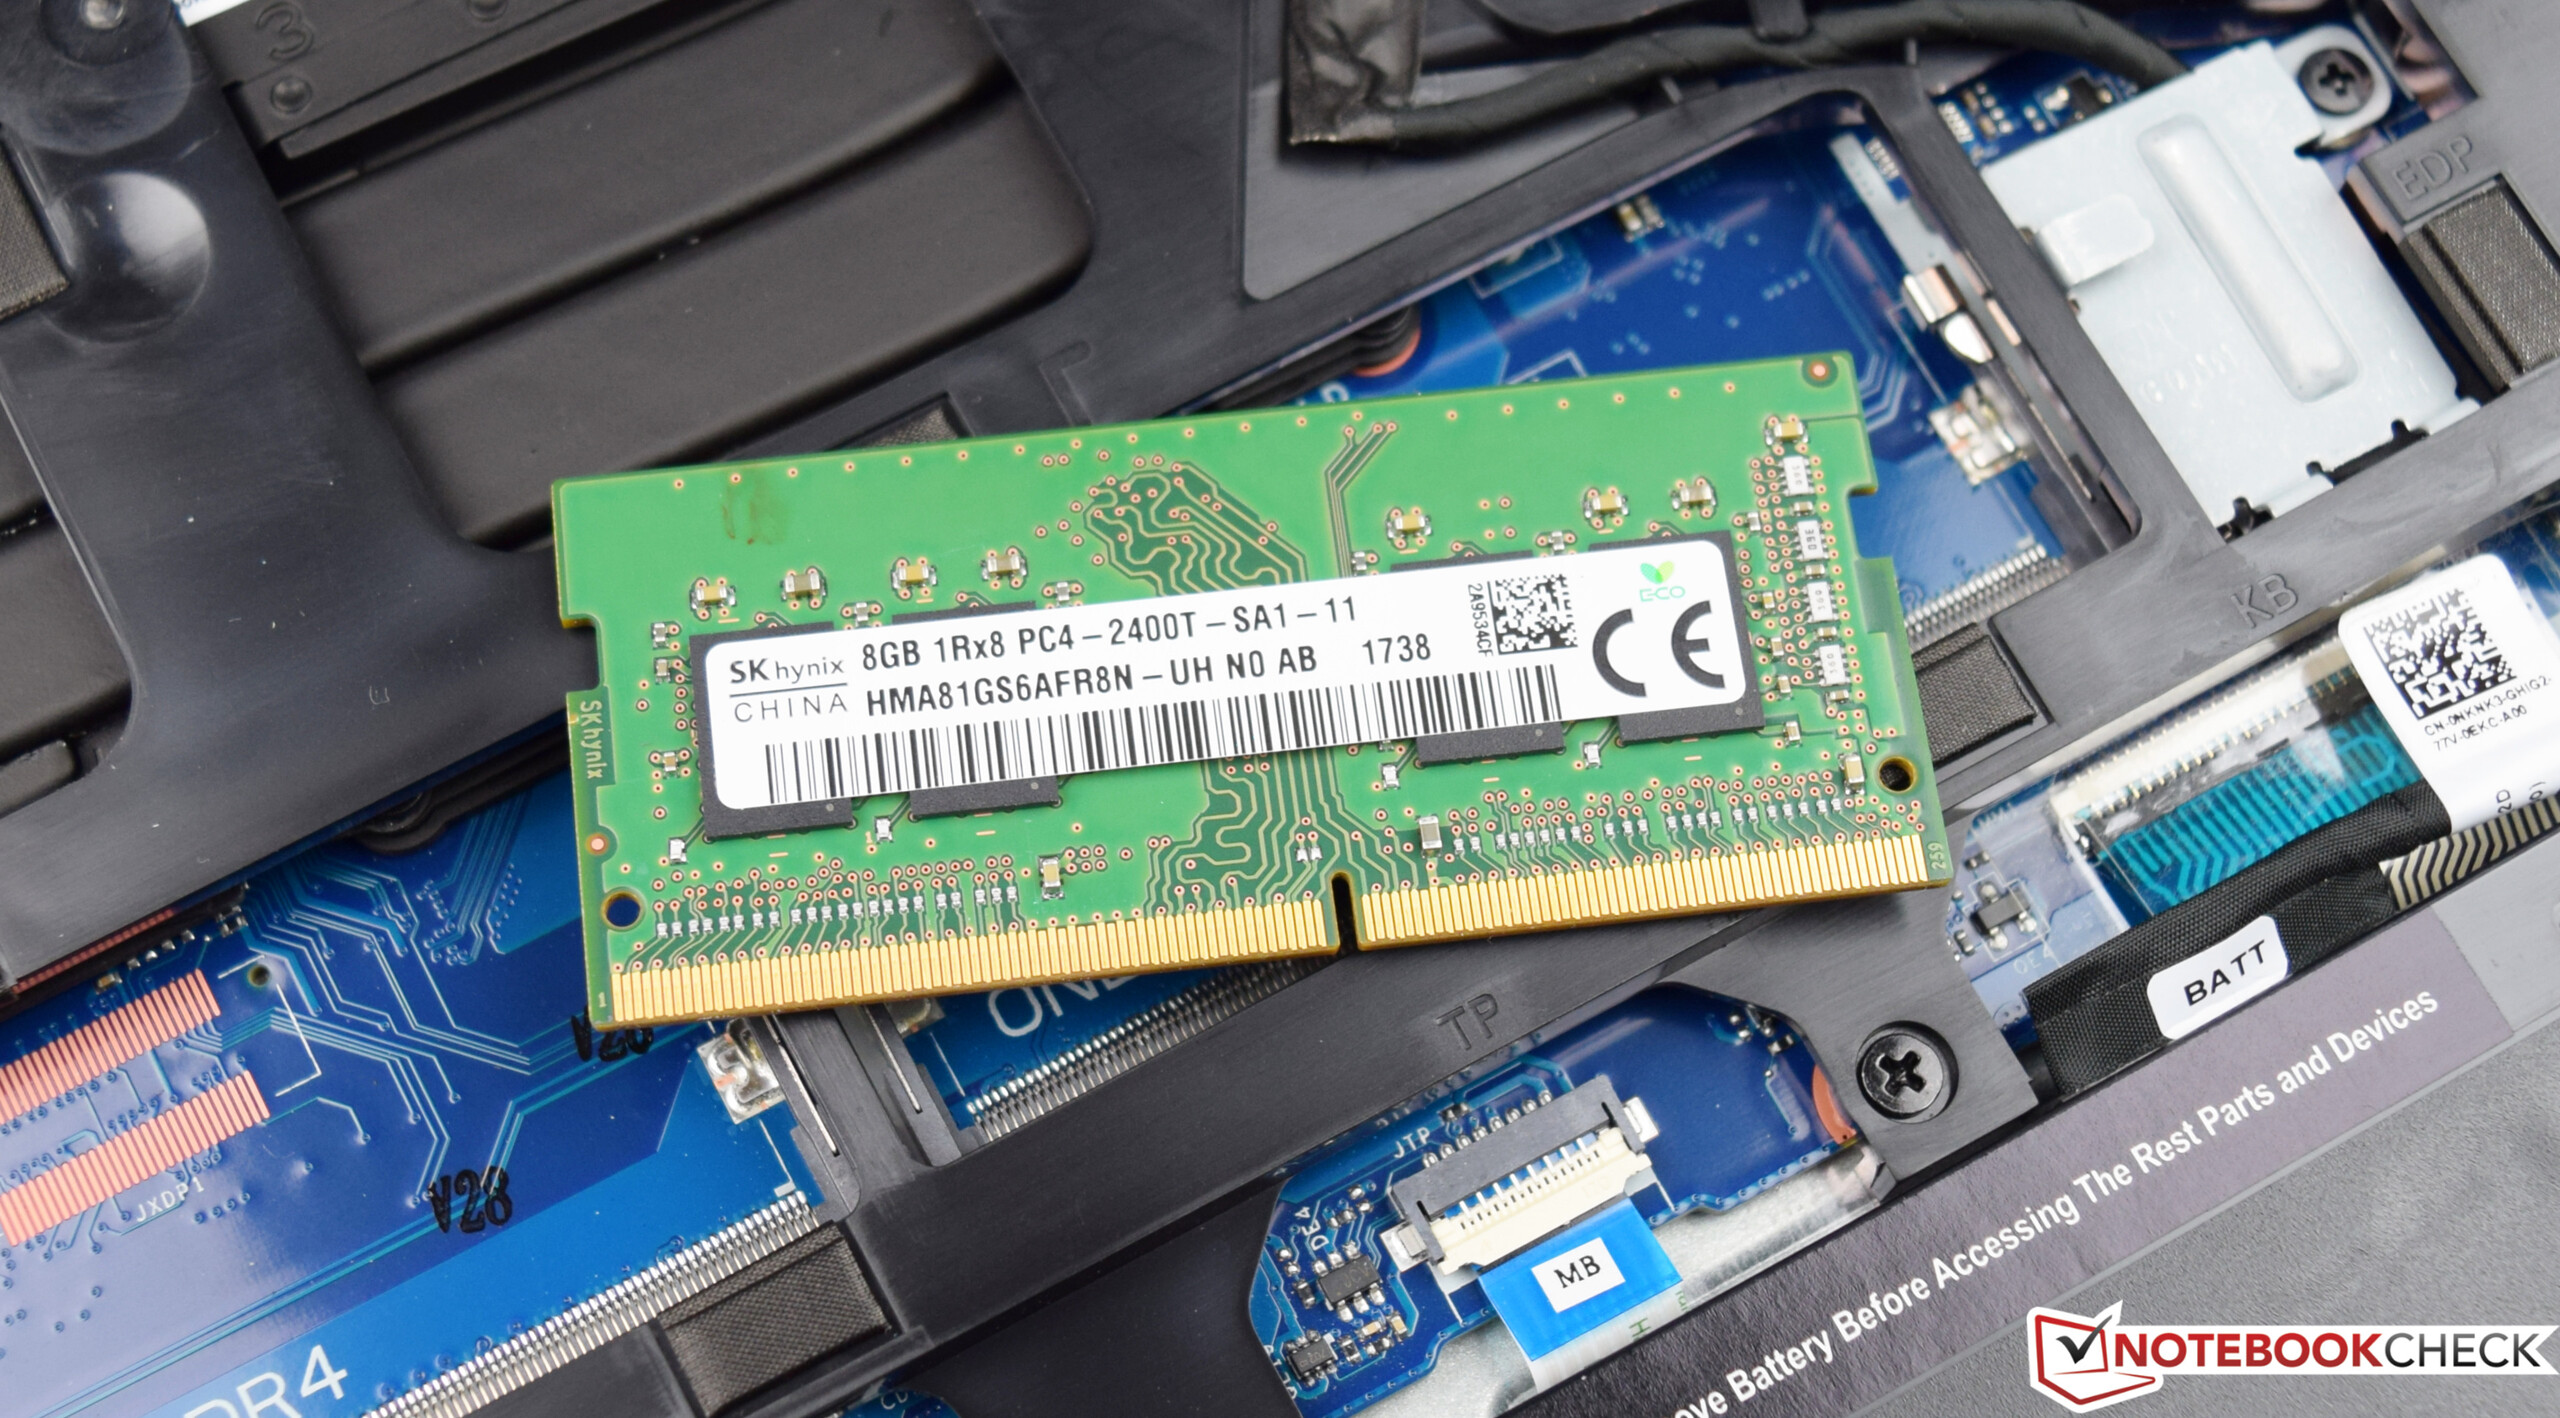
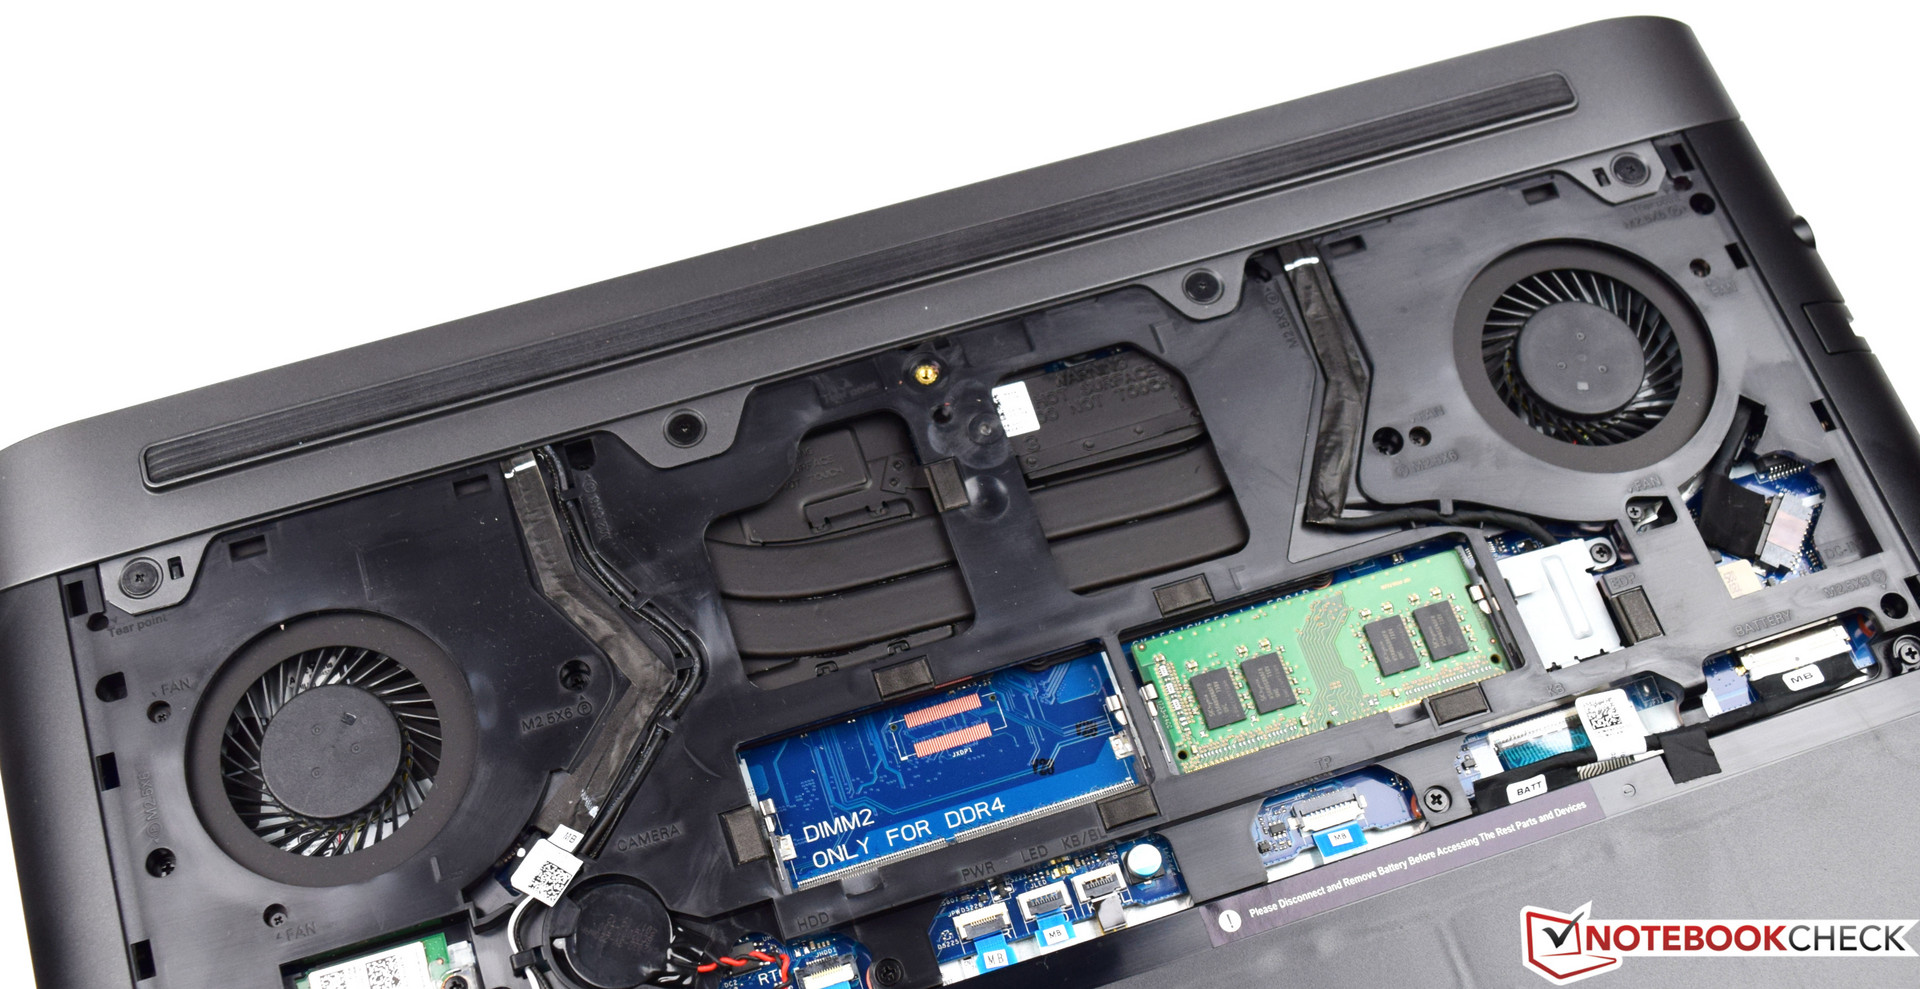
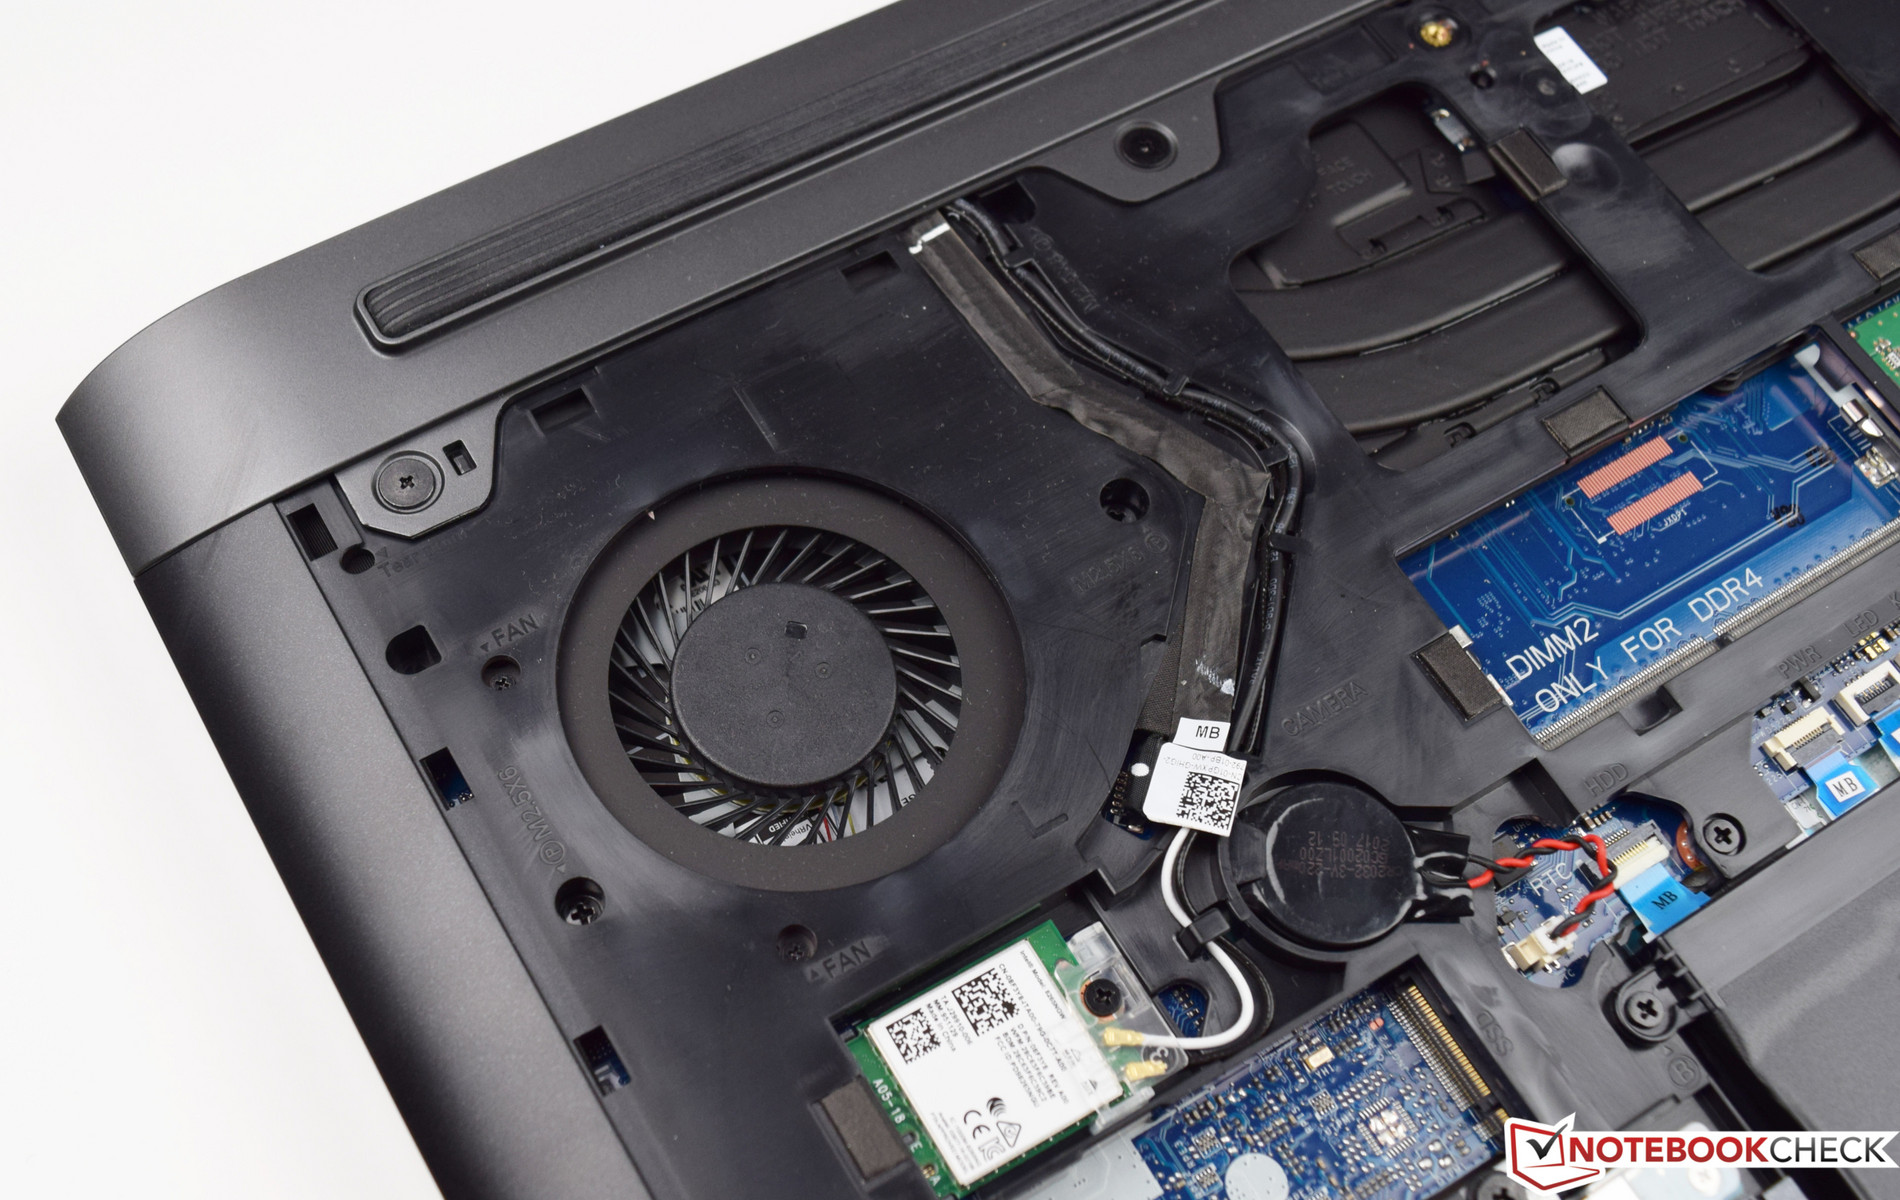
Dell har gjort många bra val med Inspiron 15 7000 7577 och kombinerar lämplighet för spel med ett batteri som håller länge. Enheten består av välkända komponenter såsom Intel Core i5-7300HQ, som fortfarande har en del liv kvar i sig. 8 GB DDR4 RAM är tillräckligt och att själv utöka själva minnet är enkelt. Det stabila och enkla höljet gav oss ett i huvudsak gott intryck, vilket även gäller prestandan hos Nvidia GeForce GTX 1050-kortet. För ~6 000 SEK får intresserade köpare en spellaptop som kan visa dom senaste spelen smidigt. Vi vill lyfta fram dom långa batteritiderna, vilket ofta saknas hos spellaptops.
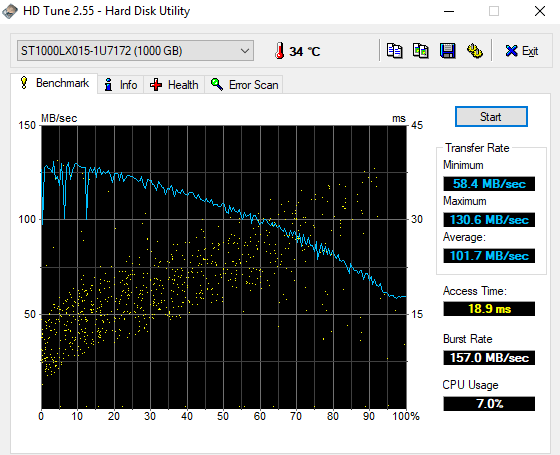
Dell presenterar en billig spellaptop - Inspiron 15 7000 7577. Men dess hybridlagringsenhet kan inte ersätta fördelarna hos en SSD.
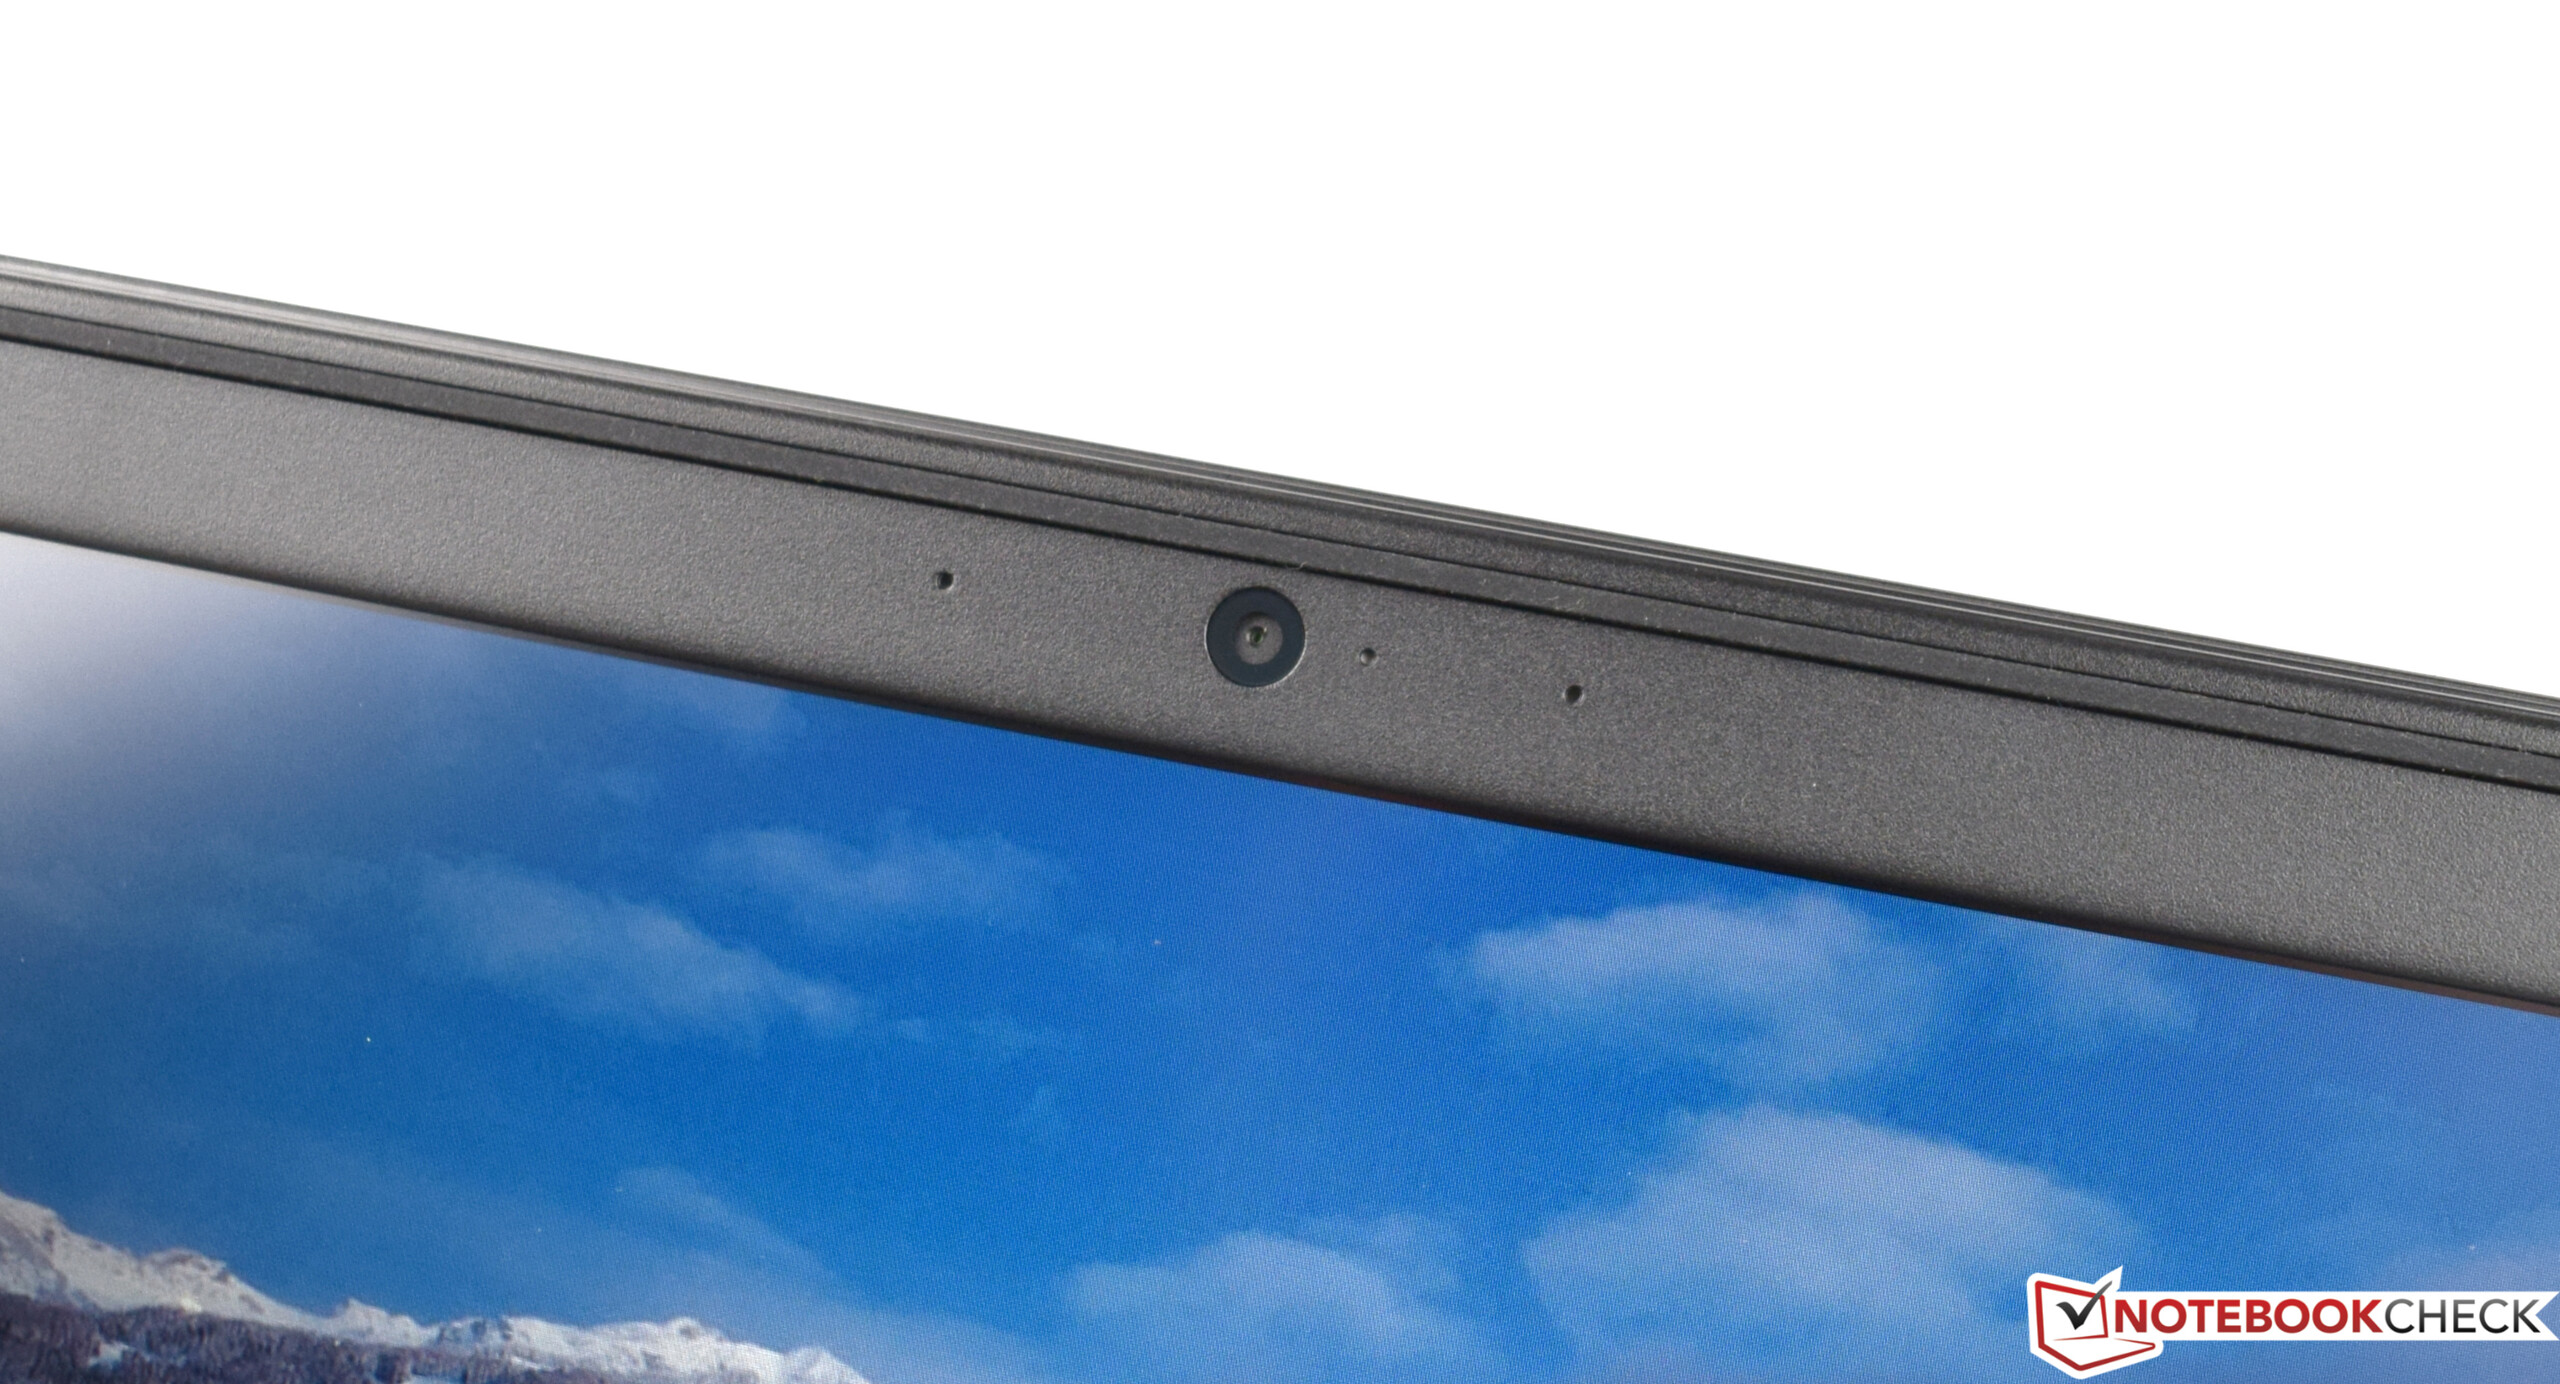
Vi måste dra av några poäng för avsaknaden av en SSD. Hybridlagringsenheten gör ett bra jobb, men till och med vardagsaktiviteter kan kräva en del väntande, vilket kan bli irriterande. Om du verkligen är intresserad av att köpa den här enheten borde du välja kombinationen med SSD och HDD. Skärmen gav oss också blandade intryck. Tack vare IPS-teknologi så imponerade den med väldigt bra betraktningsvinklar. Men den låga färgrymdstäckningen och ljusstyrkan kostade enheten ett par poäng.
Dell Inspiron 15 7000 7577
- 01/02/2018 v6 (old)
Sebastian Bade
Price comparison
