Test: Dell Inspiron 15 7000 7577 (i7-7700HQ, GTX 1060 Max-Q, 4K UHD) Laptop (Sammanfattning)
| SD Card Reader | |
| average JPG Copy Test (av. of 3 runs) | |
| Genomsnitt av klass Gaming (20.9 - 210, n=54, senaste 2 åren) | |
| Asus Zenbook Pro UX550VE-DB71T (Toshiba Exceria Pro SDXC 64 GB UHS-II) | |
| Dell Inspiron 15 7000 7577 4K (Toshiba Exceria Pro SDXC 64 GB UHS-II) | |
| MSI GF62VR 7RF-877 (Toshiba Exceria Pro SDXC 64 GB UHS-II) | |
| maximum AS SSD Seq Read Test (1GB) | |
| Genomsnitt av klass Gaming (25.5 - 261, n=51, senaste 2 åren) | |
| Asus Zenbook Pro UX550VE-DB71T (Toshiba Exceria Pro SDXC 64 GB UHS-II) | |
| Dell Inspiron 15 7000 7577 4K (Toshiba Exceria Pro SDXC 64 GB UHS-II) | |
| MSI GF62VR 7RF-877 (Toshiba Exceria Pro SDXC 64 GB UHS-II) | |
| Networking | |
| iperf3 transmit AX12 | |
| MSI GF62VR 7RF-877 | |
| Dell Inspiron 15 7000 7577 4K | |
| Asus Zenbook Pro UX550VE-DB71T | |
| iperf3 receive AX12 | |
| MSI GF62VR 7RF-877 | |
| Dell Inspiron 15 7000 7577 4K | |
| Asus Zenbook Pro UX550VE-DB71T | |
| |||||||||||||||||||||||||
Distribution av ljusstyrkan: 90 %
Mitt på batteriet: 322.9 cd/m²
Kontrast: 897:1 (Svärta: 0.36 cd/m²)
ΔE ColorChecker Calman: 3.99 | ∀{0.5-29.43 Ø4.71}
ΔE Greyscale Calman: 5.3 | ∀{0.09-98 Ø4.96}
96.8% sRGB (Argyll 1.6.3 3D)
62.9% AdobeRGB 1998 (Argyll 1.6.3 3D)
69.6% AdobeRGB 1998 (Argyll 3D)
97.1% sRGB (Argyll 3D)
68.4% Display P3 (Argyll 3D)
Gamma: 2.041
CCT: 6941 K
| Dell Inspiron 15 7000 7577 4K Name: AU Optronics B156ZAN, IPS, 15.6", 3840x2160 | Asus Zenbook Pro UX550VE-DB71T N156HCE-EN1 (CMN15E8), IPS, 15.6", 1920x1080 | MSI GF62VR 7RF-877 Chi Mei N156HGA-EAL, TN LED, 15.6", 1920x1080 | Asus GL503VD-DB74 LG Philips LP156WF6, IPS, 15.6", 1920x1080 | Apple MacBook Pro 15 2017 (2.8 GHz, 555) APPA031, IPS, 15.4", 2880x1800 | Dell Inspiron 15 7000 7577 ID: LG Philips LGD053F, Name: 156WF6, Dell P/N: 4XK13, IPS, 15.6", 1920x1080 | |
|---|---|---|---|---|---|---|
| Display | -6% | 16% | -10% | 23% | -40% | |
| Display P3 Coverage (%) | 68.4 | 64.3 -6% | 85.6 25% | 64.3 -6% | 97.9 43% | 40.4 -41% |
| sRGB Coverage (%) | 97.1 | 90.4 -7% | 99.9 3% | 84.4 -13% | 99.9 3% | 60.5 -38% |
| AdobeRGB 1998 Coverage (%) | 69.6 | 65.3 -6% | 83.9 21% | 61.7 -11% | 85.9 23% | 41.77 -40% |
| Response Times | -19% | -14% | 3% | -28% | -8% | |
| Response Time Grey 50% / Grey 80% * (ms) | 35.2 ? | 43.2 ? -23% | 49.6 ? -41% | 36.4 ? -3% | 48 ? -36% | 41 ? -16% |
| Response Time Black / White * (ms) | 28.4 ? | 32.8 ? -15% | 24.4 ? 14% | 26.2 ? 8% | 33.8 ? -19% | 28 ? 1% |
| PWM Frequency (Hz) | 25510 ? | 25510 ? | 21010 ? | 119000 ? | ||
| Screen | -15% | -56% | -4% | 42% | -5% | |
| Brightness middle (cd/m²) | 322.9 | 288.2 -11% | 223.9 -31% | 315.9 -2% | 545 69% | 257 -20% |
| Brightness (cd/m²) | 309 | 266 -14% | 208 -33% | 304 -2% | 523 69% | 229 -26% |
| Brightness Distribution (%) | 90 | 75 -17% | 88 -2% | 88 -2% | 86 -4% | 84 -7% |
| Black Level * (cd/m²) | 0.36 | 0.3 17% | 0.56 -56% | 0.37 -3% | 0.44 -22% | 0.17 53% |
| Contrast (:1) | 897 | 961 7% | 400 -55% | 854 -5% | 1239 38% | 1512 69% |
| Colorchecker dE 2000 * | 3.99 | 5.5 -38% | 9.7 -143% | 4.9 -23% | 1.6 60% | 5.34 -34% |
| Colorchecker dE 2000 max. * | 8.97 | 11.3 -26% | 19.7 -120% | 9.7 -8% | 3.8 58% | 9.99 -11% |
| Greyscale dE 2000 * | 5.3 | 7.9 -49% | 12.9 -143% | 3.8 28% | 1.9 64% | 4.82 9% |
| Gamma | 2.041 108% | 2.09 105% | 2.18 101% | 2.24 98% | 2.26 97% | 2.46 89% |
| CCT | 6941 94% | 6559 99% | 15225 43% | 6847 95% | 6834 95% | 6587 99% |
| Color Space (Percent of AdobeRGB 1998) (%) | 62.9 | 58.5 -7% | 75 19% | 55 -13% | 38 -40% | |
| Color Space (Percent of sRGB) (%) | 96.8 | 90 -7% | 100 3% | 84 -13% | 60 -38% | |
| Totalt genomsnitt (program/inställningar) | -13% /
-13% | -18% /
-36% | -4% /
-5% | 12% /
27% | -18% /
-12% |
* ... mindre är bättre
Visa svarstider
| ↔ Svarstid svart till vitt | ||
|---|---|---|
| 28.4 ms ... stiga ↗ och falla ↘ kombinerat | ↗ 16 ms stiga | 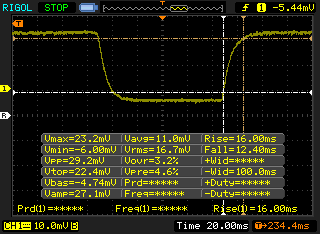 |
| ↘ 12.4 ms hösten | ||
| Skärmen visar relativt långsamma svarsfrekvenser i våra tester och kan vara för långsam för spelare. I jämförelse sträcker sig alla testade enheter från 0.1 (minst) till 240 (maximalt) ms. » 75 % av alla enheter är bättre. Detta innebär att den uppmätta svarstiden är sämre än genomsnittet av alla testade enheter (19.8 ms). | ||
| ↔ Svarstid 50 % grått till 80 % grått | ||
| 35.2 ms ... stiga ↗ och falla ↘ kombinerat | ↗ 17.2 ms stiga | 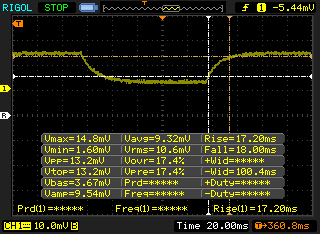 |
| ↘ 18 ms hösten | ||
| Skärmen visar långsamma svarsfrekvenser i våra tester och kommer att vara otillfredsställande för spelare. I jämförelse sträcker sig alla testade enheter från 0.165 (minst) till 636 (maximalt) ms. » 49 % av alla enheter är bättre. Detta innebär att den uppmätta svarstiden är sämre än genomsnittet av alla testade enheter (31 ms). | ||
Skärmflimmer / PWM (Puls-Width Modulation)
| Skärmflimmer / PWM upptäcktes inte | 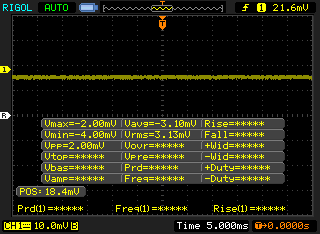 | ||
Som jämförelse: 52 % av alla testade enheter använder inte PWM för att dämpa skärmen. Om PWM upptäcktes mättes ett medelvärde av 7757 (minst: 5 - maximum: 343500) Hz. | |||
* ... mindre är bättre
| PCMark 8 Home Score Accelerated v2 | 3385 poäng | |
| PCMark 8 Creative Score Accelerated v2 | 4806 poäng | |
| PCMark 8 Work Score Accelerated v2 | 4102 poäng | |
| PCMark 10 Score | 4306 poäng | |
Hjälp | ||
| Dell Inspiron 15 7000 7577 4K SK hynix SC311 M.2 | Asus Zenbook Pro UX550VE-DB71T Samsung PM961 NVMe MZVLW512HMJP | MSI GF62VR 7RF-877 Intel SSD 600p SSDPEKKW256G7 | Dell Inspiron 15 7000 7577 Samsung PM961 MZVLW256HEHP | Genomsnitt SK hynix SC311 M.2 | |
|---|---|---|---|---|---|
| AS SSD | 337% | 114% | 207% | 1% | |
| Copy Game MB/s (MB/s) | 185.4 | 477.1 157% | 471.7 154% | 382.5 106% | 164.3 ? -11% |
| Copy Program MB/s (MB/s) | 142.2 | 294.6 107% | 286.5 101% | 274.8 93% | 138.6 ? -3% |
| Copy ISO MB/s (MB/s) | 363.6 | 1269 249% | 1069 194% | 814 124% | 246 ? -32% |
| Score Total (Points) | 578 | 3721 544% | 1324 129% | 2405 316% | 639 ? 11% |
| Score Write (Points) | 227 | 1421 526% | 693 205% | 594 162% | 228 ? 0% |
| Score Read (Points) | 234 | 1541 559% | 448 91% | 1241 430% | 273 ? 17% |
| Access Time Write * (ms) | 0.058 | 0.034 41% | 0.03 48% | 0.037 36% | 0.058 ? -0% |
| Access Time Read * (ms) | 0.126 | 0.054 57% | 0.09 29% | 0.058 54% | 0.1233 ? 2% |
| 4K-64 Write (MB/s) | 127.2 | 1160 812% | 551 333% | 375.8 195% | 131.4 ? 3% |
| 4K-64 Read (MB/s) | 156.6 | 1269 710% | 280.1 79% | 929 493% | 196.5 ? 25% |
| 4K Write (MB/s) | 74 | 112.8 52% | 118.3 60% | 100.2 35% | 69.6 ? -6% |
| 4K Read (MB/s) | 26.24 | 51 94% | 31.27 19% | 46.95 79% | 26.3 ? 0% |
| Seq Write (MB/s) | 259.9 | 1475 468% | 234.9 -10% | 1181 354% | 270 ? 4% |
| Seq Read (MB/s) | 508 | 2208 335% | 1371 170% | 2652 422% | 504 ? -1% |
* ... mindre är bättre

| 3DMark 11 Performance | 11855 poäng | |
| 3DMark Ice Storm Standard Score | 84441 poäng | |
| 3DMark Cloud Gate Standard Score | 24667 poäng | |
| 3DMark Fire Strike Score | 8861 poäng | |
| 3DMark Fire Strike Extreme Score | 4610 poäng | |
Hjälp | ||
| Rise of the Tomb Raider | |
| 1920x1080 Very High Preset AA:FX AF:16x | |
| MSI Gaming Z GeForce GTX 1070 OC Bios Desktop PC | |
| Nvidia GeForce GTX 1060 Founders Edition 6 GB | |
| Nvidia GeForce GTX 1060 Founders Edition 6 GB | |
| DogHouse Systems Mobius SS | |
| Dell Inspiron 15 7000 7577 4K | |
| MSI GeForce GTX 1050 Ti | |
| Zotac GeForce GTX 1050 2GB | |
| 3840x2160 High Preset AA:FX AF:4x | |
| MSI Gaming Z GeForce GTX 1070 OC Bios Desktop PC | |
| Nvidia GeForce GTX 1060 Founders Edition 6 GB | |
| Nvidia GeForce GTX 1060 Founders Edition 6 GB | |
| Dell Inspiron 15 7000 7577 4K | |
| Zotac GeForce GTX 1050 2GB | |
| låg | med. | hög | ultra | 4K | |
|---|---|---|---|---|---|
| BioShock Infinite (2013) | 100.4 | ||||
| Metro: Last Light (2013) | 74 | ||||
| Thief (2014) | 70.4 | ||||
| The Witcher 3 (2015) | 70.1 | 36.8 | 24.4 | ||
| Batman: Arkham Knight (2015) | 129 | 81 | 53 | 26 | |
| Metal Gear Solid V (2015) | 60 | 60 | 42 | ||
| Fallout 4 (2015) | 78.4 | 64.6 | 25.8 | ||
| Rise of the Tomb Raider (2016) | 45.3 | 22.8 | |||
| Ashes of the Singularity (2016) | 59.8 | 52.9 | 21 | ||
| Overwatch (2016) | 165.8 | 102 | 50.3 | ||
| Prey (2017) | 120 | 101 | 34.6 | ||
| Dirt 4 (2017) | 119.5 | 84.9 | 48.3 | 28.8 | |
| F1 2017 (2017) | 98 | 60 | 26 | ||
| Middle-earth: Shadow of War (2017) | 82 | 60 | 46 | 17 | |
| Destiny 2 (2017) | 94.7 | 85.4 | 71.4 | 17.6 | |
| Final Fantasy XV Benchmark (2018) | 73 | 47.2 | 33.9 | 14.6 |
Ljudnivå
| Låg belastning |
| 28.8 / 29.2 / 29.2 dB(A) |
| Hög belastning |
| 34.6 / 49.3 dB(A) |
 | ||
30 dB tyst 40 dB(A) hörbar 50 dB(A) högt ljud |
||
min: | ||
| Dell Inspiron 15 7000 7577 4K GeForce GTX 1060 Max-Q, i7-7700HQ, SK hynix SC311 M.2 | Asus Zenbook Pro UX550VE-DB71T GeForce GTX 1050 Ti Mobile, i7-7700HQ, Samsung PM961 NVMe MZVLW512HMJP | Acer Swift 3 SF315-41-R4W1 Vega 8, R5 2500U, Intel SSD 600p SSDPEKKW256G7 | Dell Inspiron 15 7000 7577 GeForce GTX 1050 Mobile, i5-7300HQ, Seagate Mobile HDD 1TB ST1000LX015-1U7172 | Asus Zephyrus GX501 GeForce GTX 1080 Max-Q, i7-7700HQ, Samsung SSD SM961 1TB M.2 MZVKW1T0HMLH | MSI GE63VR 7RF Raider GeForce GTX 1070 Mobile, i7-7700HQ, Toshiba HG6 THNSNJ256G8NY | |
|---|---|---|---|---|---|---|
| Noise | -6% | -1% | -5% | -7% | -20% | |
| av / miljö * (dB) | 28.5 | 28.3 1% | 31.8 -12% | 31 -9% | 31 -9% | 30 -5% |
| Idle Minimum * (dB) | 28.8 | 30.4 -6% | 31.8 -10% | 32.7 -14% | 32 -11% | 33 -15% |
| Idle Average * (dB) | 29.2 | 31 -6% | 32.1 -10% | 32.7 -12% | 33 -13% | 35 -20% |
| Idle Maximum * (dB) | 29.2 | 31.2 -7% | 32.1 -10% | 32.7 -12% | 34 -16% | 40 -37% |
| Load Average * (dB) | 34.6 | 43.3 -25% | 33 5% | 38.7 -12% | 39 -13% | 48 -39% |
| Witcher 3 ultra * (dB) | 44.1 | 46.2 -5% | 39 12% | 42 5% | 50 -13% | |
| Load Maximum * (dB) | 49.3 | 46.2 6% | 34.8 29% | 44.6 10% | 46 7% | 55 -12% |
* ... mindre är bättre
(±) Den maximala temperaturen på ovansidan är 42.6 °C / 109 F, jämfört med genomsnittet av 40.4 °C / 105 F , allt från 21.2 till 68.8 °C för klassen Gaming.
(-) Botten värms upp till maximalt 46.2 °C / 115 F, jämfört med genomsnittet av 43.2 °C / 110 F
(+) Vid tomgångsbruk är medeltemperaturen för ovansidan 27.1 °C / 81 F, jämfört med enhetsgenomsnittet på 33.9 °C / ### class_avg_f### F.
(+) När du spelar The Witcher 3 är medeltemperaturen för ovansidan 28.9 °C / 84 F, jämfört med enhetsgenomsnittet på 33.9 °C / ## #class_avg_f### F.
(+) Handledsstöden och pekplattan är kallare än hudtemperaturen med maximalt 27.2 °C / 81 F och är därför svala att ta på.
(±) Medeltemperaturen för handledsstödsområdet på liknande enheter var 28.8 °C / 83.8 F (+1.6 °C / 2.8 F).
| Av/Standby | |
| Låg belastning | |
| Hög belastning |
|
Förklaring:
min: | |
| Dell Inspiron 15 7000 7577 4K i7-7700HQ, GeForce GTX 1060 Max-Q, SK hynix SC311 M.2, IPS, 3840x2160, 15.6" | Asus Zenbook Pro UX550VE-DB71T i7-7700HQ, GeForce GTX 1050 Ti Mobile, Samsung PM961 NVMe MZVLW512HMJP, IPS, 1920x1080, 15.6" | Acer Swift 3 SF315-41-R4W1 R5 2500U, Vega 8, Intel SSD 600p SSDPEKKW256G7, IPS, 1920x1080, 15.6" | MSI GF62VR 7RF-877 i7-7700HQ, GeForce GTX 1060 Mobile, Intel SSD 600p SSDPEKKW256G7, TN LED, 1920x1080, 15.6" | Dell Inspiron 15 7000 7577 i5-7300HQ, GeForce GTX 1050 Mobile, Seagate Mobile HDD 1TB ST1000LX015-1U7172, IPS, 1920x1080, 15.6" | Asus Zephyrus GX501 i7-7700HQ, GeForce GTX 1080 Max-Q, Samsung SSD SM961 1TB M.2 MZVKW1T0HMLH, IPS, 1920x1080, 15.6" | |
|---|---|---|---|---|---|---|
| Power Consumption | 7% | 14% | -68% | 3% | -107% | |
| Idle Minimum * (Watt) | 5.5 | 6.3 -15% | 7.3 -33% | 16.2 -195% | 5.3 4% | 18 -227% |
| Idle Average * (Watt) | 10.5 | 7.9 25% | 9.7 8% | 18.2 -73% | 8.8 16% | 23 -119% |
| Idle Maximum * (Watt) | 10.9 | 8.1 26% | 13 -19% | 18.9 -73% | 9.7 11% | 31 -184% |
| Load Average * (Watt) | 72 | 84.9 -18% | 40.4 44% | 82.7 -15% | 100 -39% | 79 -10% |
| Witcher 3 ultra * (Watt) | 97.4 | 96.3 1% | 125.7 -29% | 87 11% | 148 -52% | |
| Load Maximum * (Watt) | 130.4 | 102.4 21% | 42.2 68% | 162.3 -24% | 109 16% | 196 -50% |
* ... mindre är bättre
| Dell Inspiron 15 7000 7577 4K i7-7700HQ, GeForce GTX 1060 Max-Q, 56 Wh | Asus Zenbook Pro UX550VE-DB71T i7-7700HQ, GeForce GTX 1050 Ti Mobile, 73 Wh | Acer Swift 3 SF315-41-R4W1 R5 2500U, Vega 8, 48 Wh | MSI GF62VR 7RF-877 i7-7700HQ, GeForce GTX 1060 Mobile, 41 Wh | Asus GL503VD-DB74 i7-7700HQ, GeForce GTX 1050 Mobile, 64 Wh | Dell Inspiron 15 7000 7577 i5-7300HQ, GeForce GTX 1050 Mobile, 56 Wh | |
|---|---|---|---|---|---|---|
| Batteridrifttid | 39% | 4% | -63% | -2% | 19% | |
| Reader / Idle (h) | 10 | 17.1 71% | 12.2 22% | 2.8 -72% | 10.8 8% | 11.1 11% |
| WiFi v1.3 (h) | 5.4 | 8.9 65% | 5.2 -4% | 1.9 -65% | 5.8 7% | 6.8 26% |
| Load (h) | 1.5 | 1.2 -20% | 1.4 -7% | 0.7 -53% | 1.2 -20% | 1.8 20% |
För
Emot
Läs den fullständiga versionen av den här recensionen på engelska här.
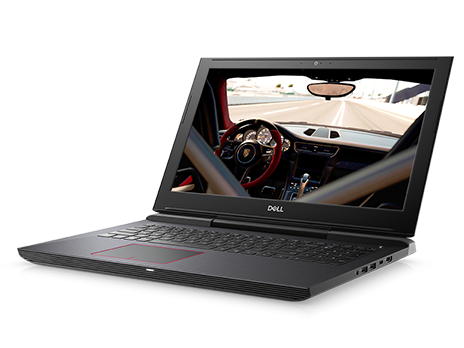
För spelsyften är UHD-skärmen med sin naturliga 4K-upplösning inte en perfekt match för ett system som drivs av en GTX 1060 Max-Q GPU. Om inte laptopen uteslutande ska användas för större kalkylbladsarbete och mindre krävande spel såsom Rocket League, LoL, Overwatch eller DOTA 2 så blir det svårt att rättfärdiga det oerhört höga priset på 4K UHD-skärmen jämfört med vad den vanliga FHD-modellen kostar. Man kommer behöva en mycket kraftigare GPU för att bättre utnyttja vad 4K UHD har att erbjuda.
Om det som nämnts ovan inte bekymrar så kan potentiella köpare bli nöjda över att 4K UHD-skärmen verkligen är ljusare än FHD-modellen och dessutom har mer exakta färger. Samma fördelar och nackdelar som nämnts i våra existerande sidor om Inspiron 15 7577 gäller fortfarande, inklusive den starka men tunga basen, dom mjuka men tysta tangentbordsknapparna och ett innanmäte som är lätt att komma åt.
4K UHD-versionen av Inspiron 15 7577 är på papperet överlägsen FHD SKU:erna, men gamers kommer klara sig bättre genom att spela dom flesta titlar i den 1080p-upplösning som GTX 1060 Max-Q är designad för.
Dell Inspiron 15 7000 7577 4K
- 02/19/2018 v6 (old)
Allen Ngo
Price comparison
