Test: Dell Inspiron 15 5579 (i5-8250U, SSD, IPS, Tryckkänslig) Omvandlingsbar (Sammanfattning)
| SD Card Reader | |
| average JPG Copy Test (av. of 3 runs) | |
| Lenovo ThinkPad L380 Yoga-20M7001BGE (Toshiba Exceria Pro M501 microSDXC 64GB) | |
| HP Envy x360 15-bq102ng (Toshiba Exceria Pro SDXC 64 GB UHS-II) | |
| Genomsnitt av klass Convertible (29.4 - 141, n=20, senaste 2 åren) | |
| Dell Inspiron 15 5578-1777 2-in-1 (Toshiba Exceria Pro SDXC 64 GB UHS-II) | |
| Dell Inspiron 15 5579-9672 (Toshiba Exceria Pro SDXC 64 GB UHS-II) | |
| Asus VivoBook Flip 15 TP510UA-E8073T (Toshiba Exceria Pro SDXC 64 GB UHS-II) | |
| Acer Spin 3 SP314-51-548L (Toshiba Exceria Pro SDXC 64 GB UHS-II) | |
| maximum AS SSD Seq Read Test (1GB) | |
| Genomsnitt av klass Convertible (67.5 - 254, n=19, senaste 2 åren) | |
| Lenovo ThinkPad L380 Yoga-20M7001BGE (Toshiba Exceria Pro M501 microSDXC 64GB) | |
| HP Envy x360 15-bq102ng (Toshiba Exceria Pro SDXC 64 GB UHS-II) | |
| Dell Inspiron 15 5578-1777 2-in-1 (Toshiba Exceria Pro SDXC 64 GB UHS-II) | |
| Dell Inspiron 15 5579-9672 (Toshiba Exceria Pro SDXC 64 GB UHS-II) | |
| Asus VivoBook Flip 15 TP510UA-E8073T (Toshiba Exceria Pro SDXC 64 GB UHS-II) | |
| Acer Spin 3 SP314-51-548L (Toshiba Exceria Pro SDXC 64 GB UHS-II) | |
| |||||||||||||||||||||||||
Distribution av ljusstyrkan: 84 %
Mitt på batteriet: 249 cd/m²
Kontrast: 1255:1 (Svärta: 0.2 cd/m²)
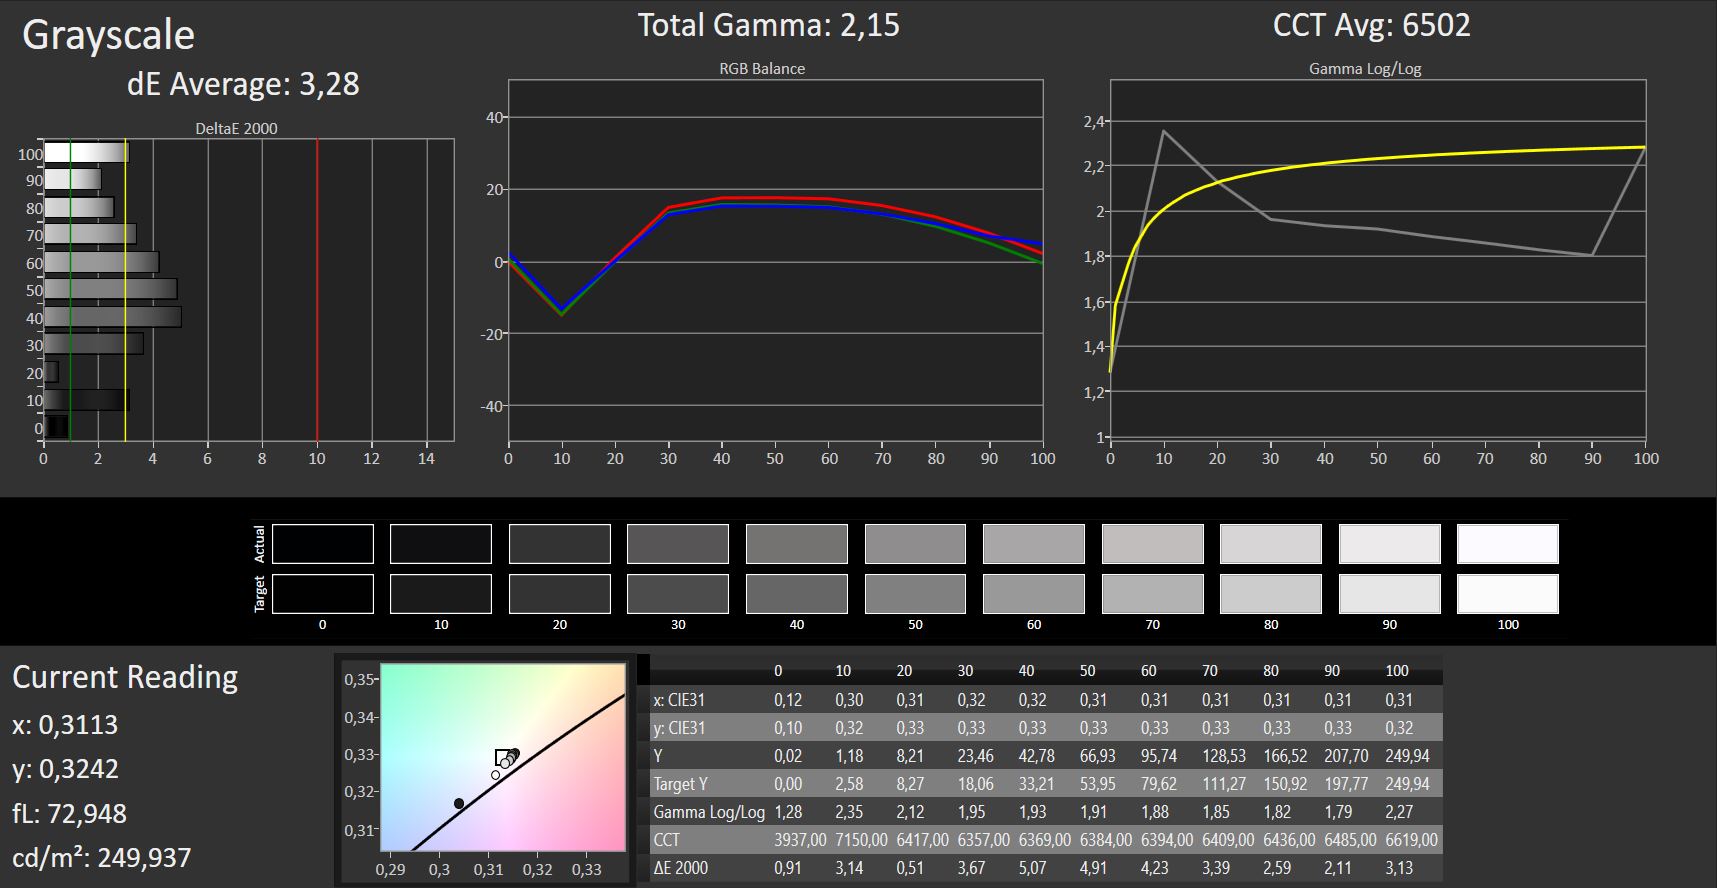
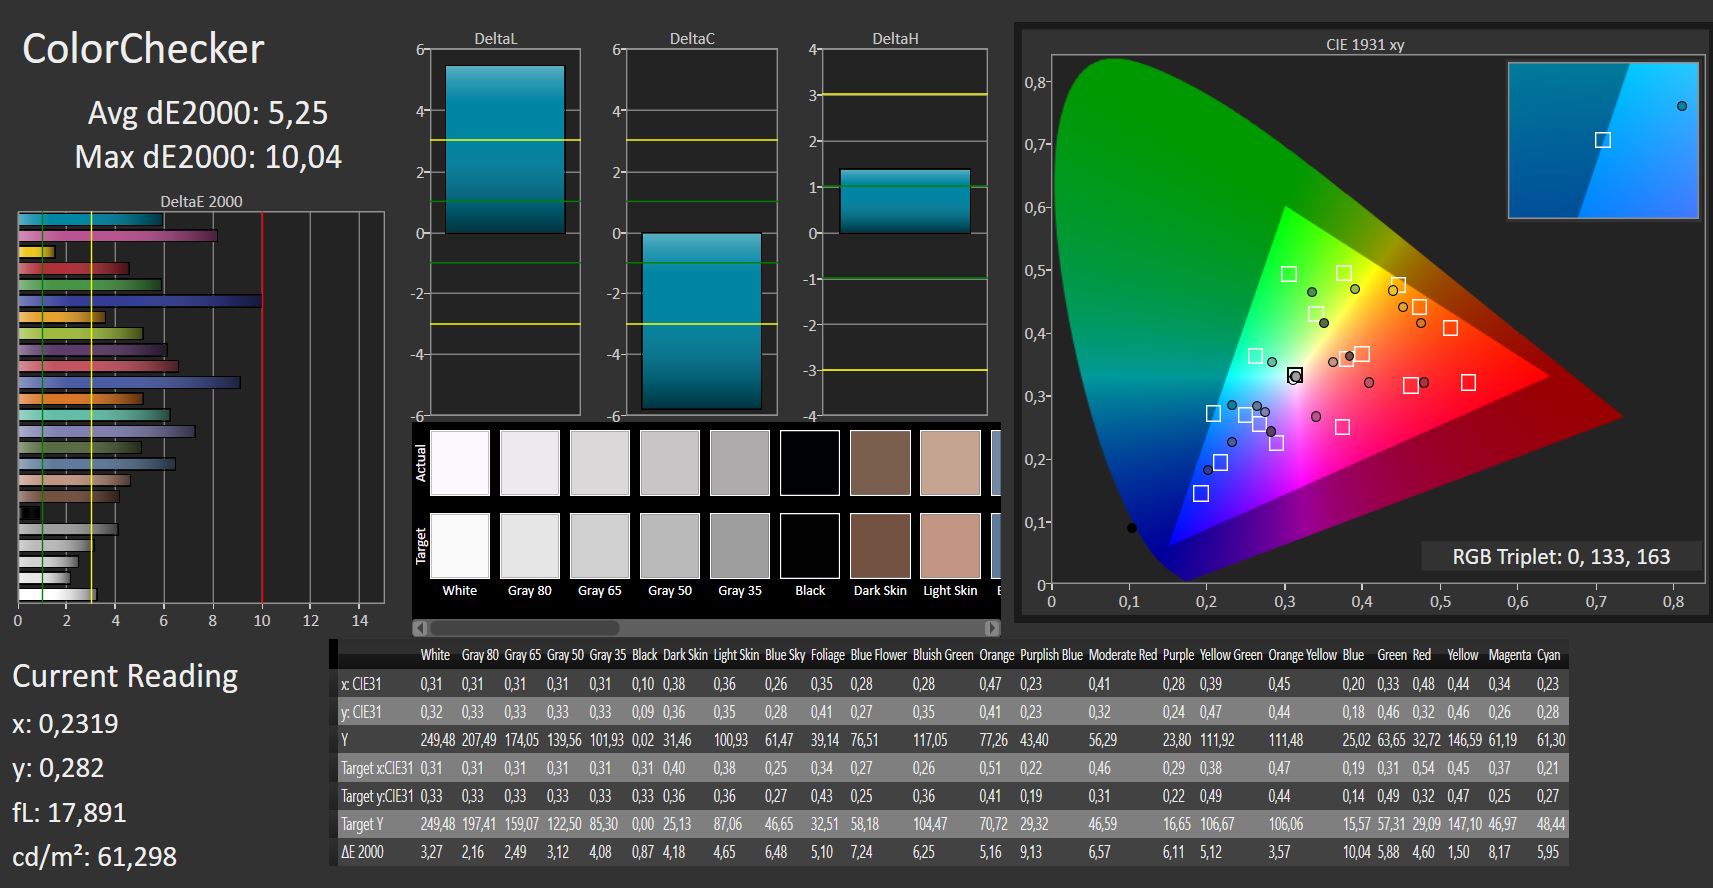
ΔE ColorChecker Calman: 5.25 | ∀{0.5-29.43 Ø4.71}
ΔE Greyscale Calman: 3.28 | ∀{0.09-98 Ø4.96}
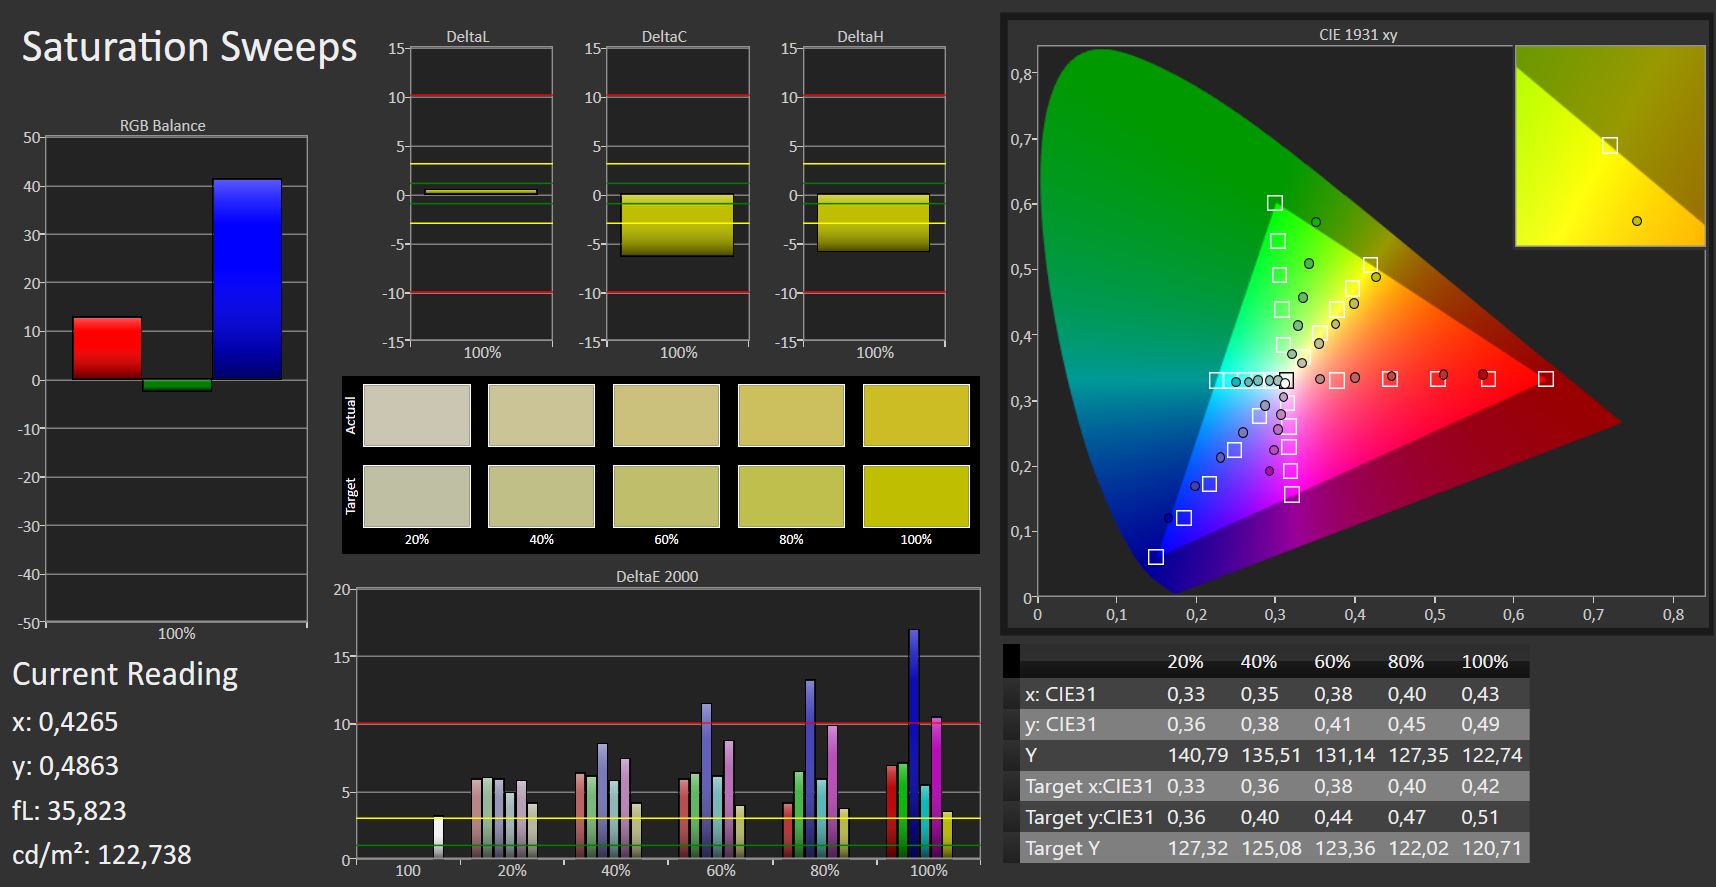
55% sRGB (Argyll 1.6.3 3D)
35% AdobeRGB 1998 (Argyll 1.6.3 3D)
38.23% AdobeRGB 1998 (Argyll 3D)
55.6% sRGB (Argyll 3D)
37% Display P3 (Argyll 3D)
Gamma: 2.15
CCT: 6502 K
| Dell Inspiron 15 5579-9672 AUO, B156HW01, 1920x1080, 15.6" | Dell Inspiron 15 5578-1777 2-in-1 LG Philips (Dell 156WF7), 1920x1080, 15.6" | HP Envy x360 15-bq102ng Chi Mei CM15E9, 1920x1080, 15.6" | Asus VivoBook Flip 15 TP510UA-E8073T AU Optronics B156HAN02.1, 1920x1080, 15.6" | Acer Spin 3 SP314-51-548L BOE CQ NV140FHM-N41, 1920x1080, 14" | Lenovo ThinkPad L380 Yoga-20M7001BGE M133NWF4-R3, 1920x1080, 13.3" | |
|---|---|---|---|---|---|---|
| Display | 13% | 12% | 6% | 7% | 74% | |
| Display P3 Coverage (%) | 37 | 41.74 13% | 41.36 12% | 39.19 6% | 39.68 7% | 65.1 76% |
| sRGB Coverage (%) | 55.6 | 62.8 13% | 62.2 12% | 58.9 6% | 58.9 6% | 95.5 72% |
| AdobeRGB 1998 Coverage (%) | 38.23 | 43.13 13% | 42.74 12% | 40.49 6% | 41 7% | 66.9 75% |
| Response Times | -2% | 6% | -4% | -13% | -6% | |
| Response Time Grey 50% / Grey 80% * (ms) | 41 ? | 55 ? -34% | 40 ? 2% | 44 ? -7% | 43 ? -5% | 47 ? -15% |
| Response Time Black / White * (ms) | 29 ? | 20 ? 31% | 26 ? 10% | 29 ? -0% | 35 ? -21% | 28 ? 3% |
| PWM Frequency (Hz) | 25000 ? | 1000 | 217 ? | |||
| Screen | -3% | 17% | -2% | 9% | 13% | |
| Brightness middle (cd/m²) | 251 | 244 -3% | 221 -12% | 229 -9% | 220 -12% | 323 29% |
| Brightness (cd/m²) | 240 | 242 1% | 207 -14% | 221 -8% | 221 -8% | 310 29% |
| Brightness Distribution (%) | 84 | 93 11% | 87 4% | 76 -10% | 78 -7% | 88 5% |
| Black Level * (cd/m²) | 0.2 | 0.25 -25% | 0.15 25% | 0.15 25% | 0.18 10% | 0.22 -10% |
| Contrast (:1) | 1255 | 976 -22% | 1473 17% | 1527 22% | 1222 -3% | 1468 17% |
| Colorchecker dE 2000 * | 5.25 | 4.94 6% | 4.35 17% | 5.03 4% | 3.98 24% | 5 5% |
| Colorchecker dE 2000 max. * | 10.04 | 7.3 27% | 8.98 11% | 8.89 11% | 7.69 23% | 9.56 5% |
| Greyscale dE 2000 * | 3.28 | 4.93 -50% | 3.09 6% | 5.56 -70% | 1.68 49% | 6.64 -102% |
| Gamma | 2.15 102% | 2.7 81% | 2.23 99% | 2.64 83% | 2.37 93% | 2.2 100% |
| CCT | 6502 100% | 7401 88% | 6068 107% | 7015 93% | 6382 102% | 6638 98% |
| Color Space (Percent of AdobeRGB 1998) (%) | 35 | 40 14% | 56 60% | 37 6% | 38 9% | 61 74% |
| Color Space (Percent of sRGB) (%) | 55 | 63 15% | 86 56% | 59 7% | 58 5% | 95 73% |
| Colorchecker dE 2000 calibrated * | 4 | |||||
| Totalt genomsnitt (program/inställningar) | 3% /
1% | 12% /
15% | 0% /
-1% | 1% /
6% | 27% /
22% |
* ... mindre är bättre
Visa svarstider
| ↔ Svarstid svart till vitt | ||
|---|---|---|
| 29 ms ... stiga ↗ och falla ↘ kombinerat | ↗ 17 ms stiga | 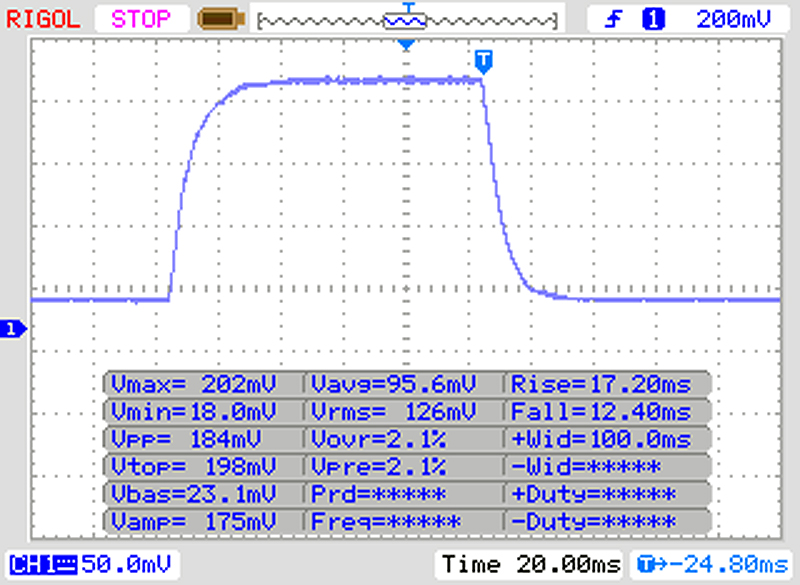 |
| ↘ 12 ms hösten | ||
| Skärmen visar relativt långsamma svarsfrekvenser i våra tester och kan vara för långsam för spelare. I jämförelse sträcker sig alla testade enheter från 0.1 (minst) till 240 (maximalt) ms. » 77 % av alla enheter är bättre. Detta innebär att den uppmätta svarstiden är sämre än genomsnittet av alla testade enheter (19.8 ms). | ||
| ↔ Svarstid 50 % grått till 80 % grått | ||
| 41 ms ... stiga ↗ och falla ↘ kombinerat | ↗ 19 ms stiga | 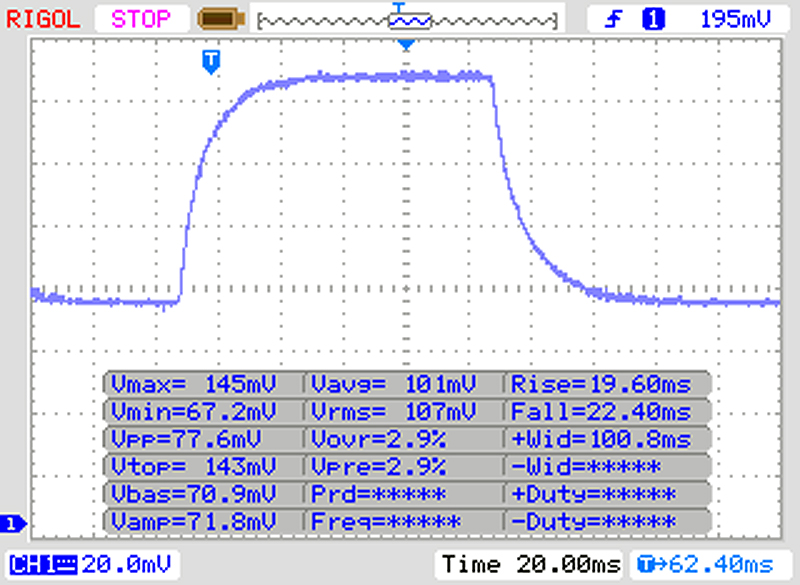 |
| ↘ 22 ms hösten | ||
| Skärmen visar långsamma svarsfrekvenser i våra tester och kommer att vara otillfredsställande för spelare. I jämförelse sträcker sig alla testade enheter från 0.165 (minst) till 636 (maximalt) ms. » 65 % av alla enheter är bättre. Detta innebär att den uppmätta svarstiden är sämre än genomsnittet av alla testade enheter (31 ms). | ||
Skärmflimmer / PWM (Puls-Width Modulation)
| Skärmflimmer / PWM upptäcktes inte | 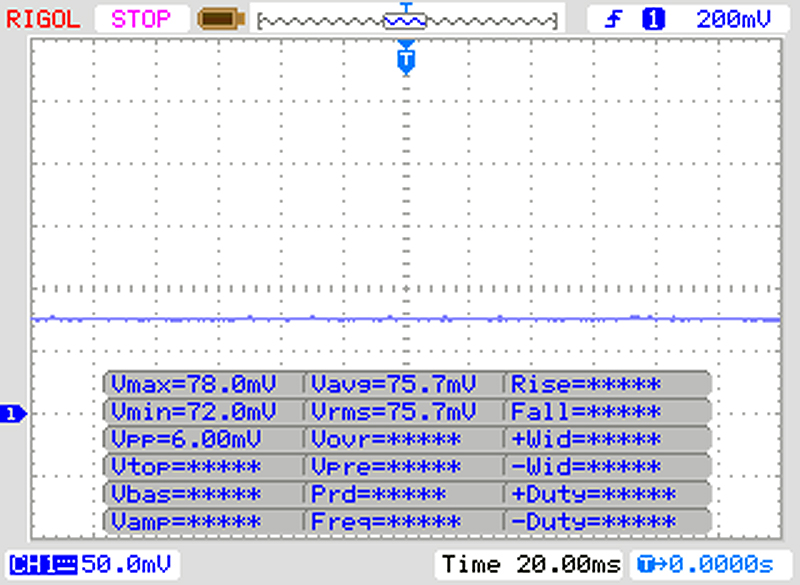 | ||
Som jämförelse: 52 % av alla testade enheter använder inte PWM för att dämpa skärmen. Om PWM upptäcktes mättes ett medelvärde av 7757 (minst: 5 - maximum: 343500) Hz. | |||
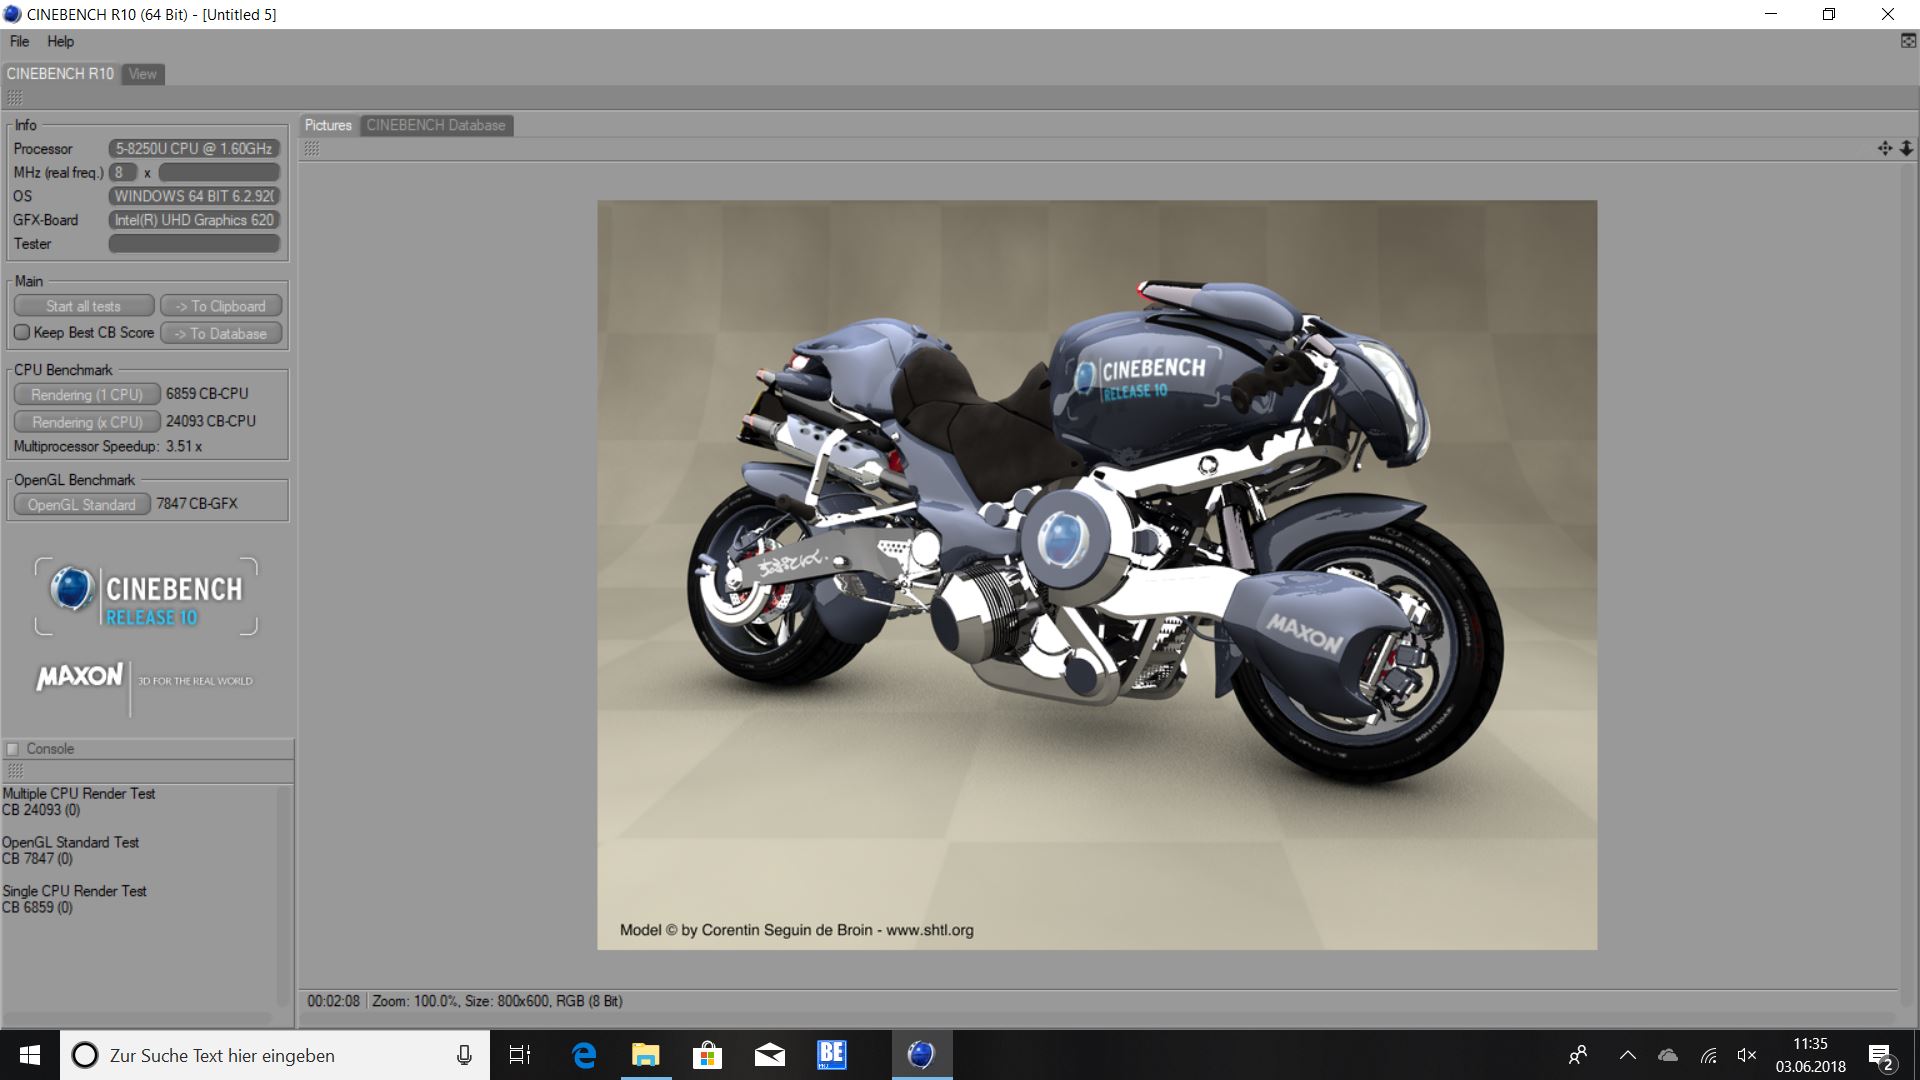
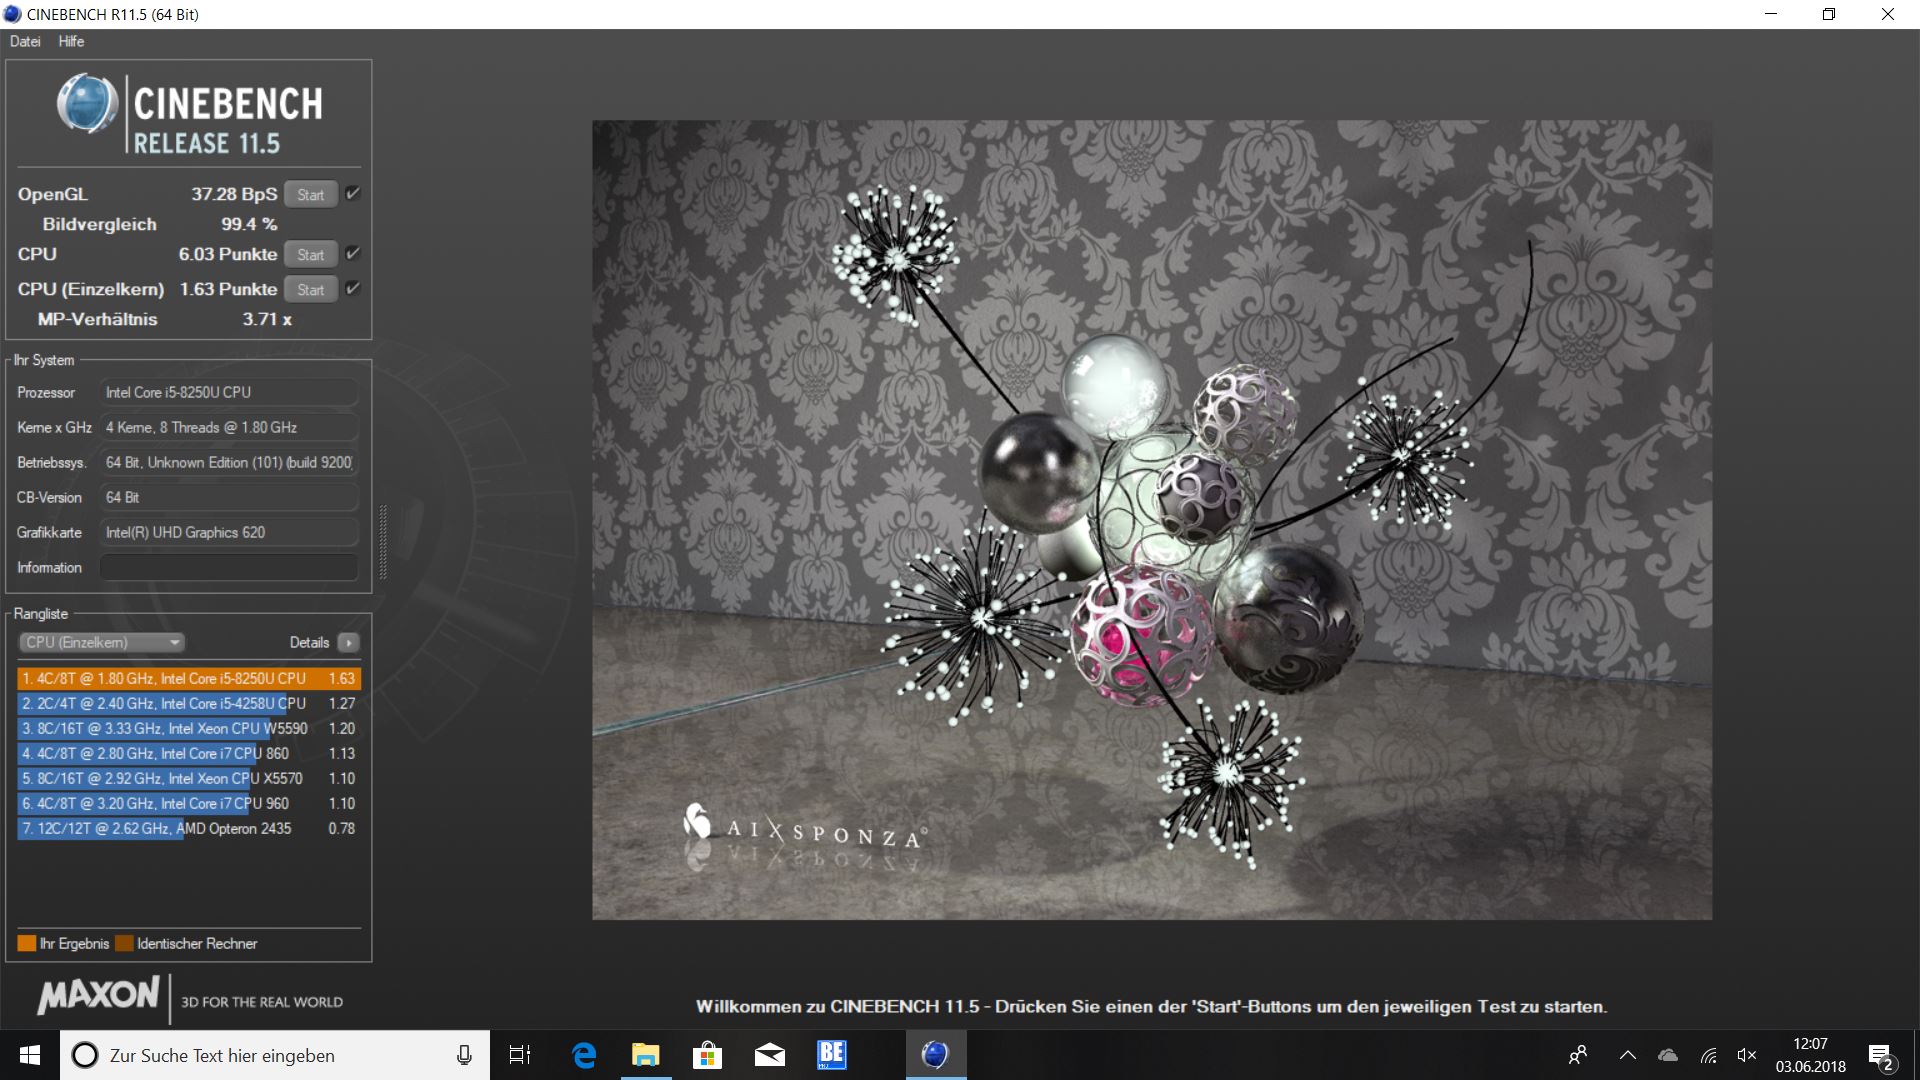
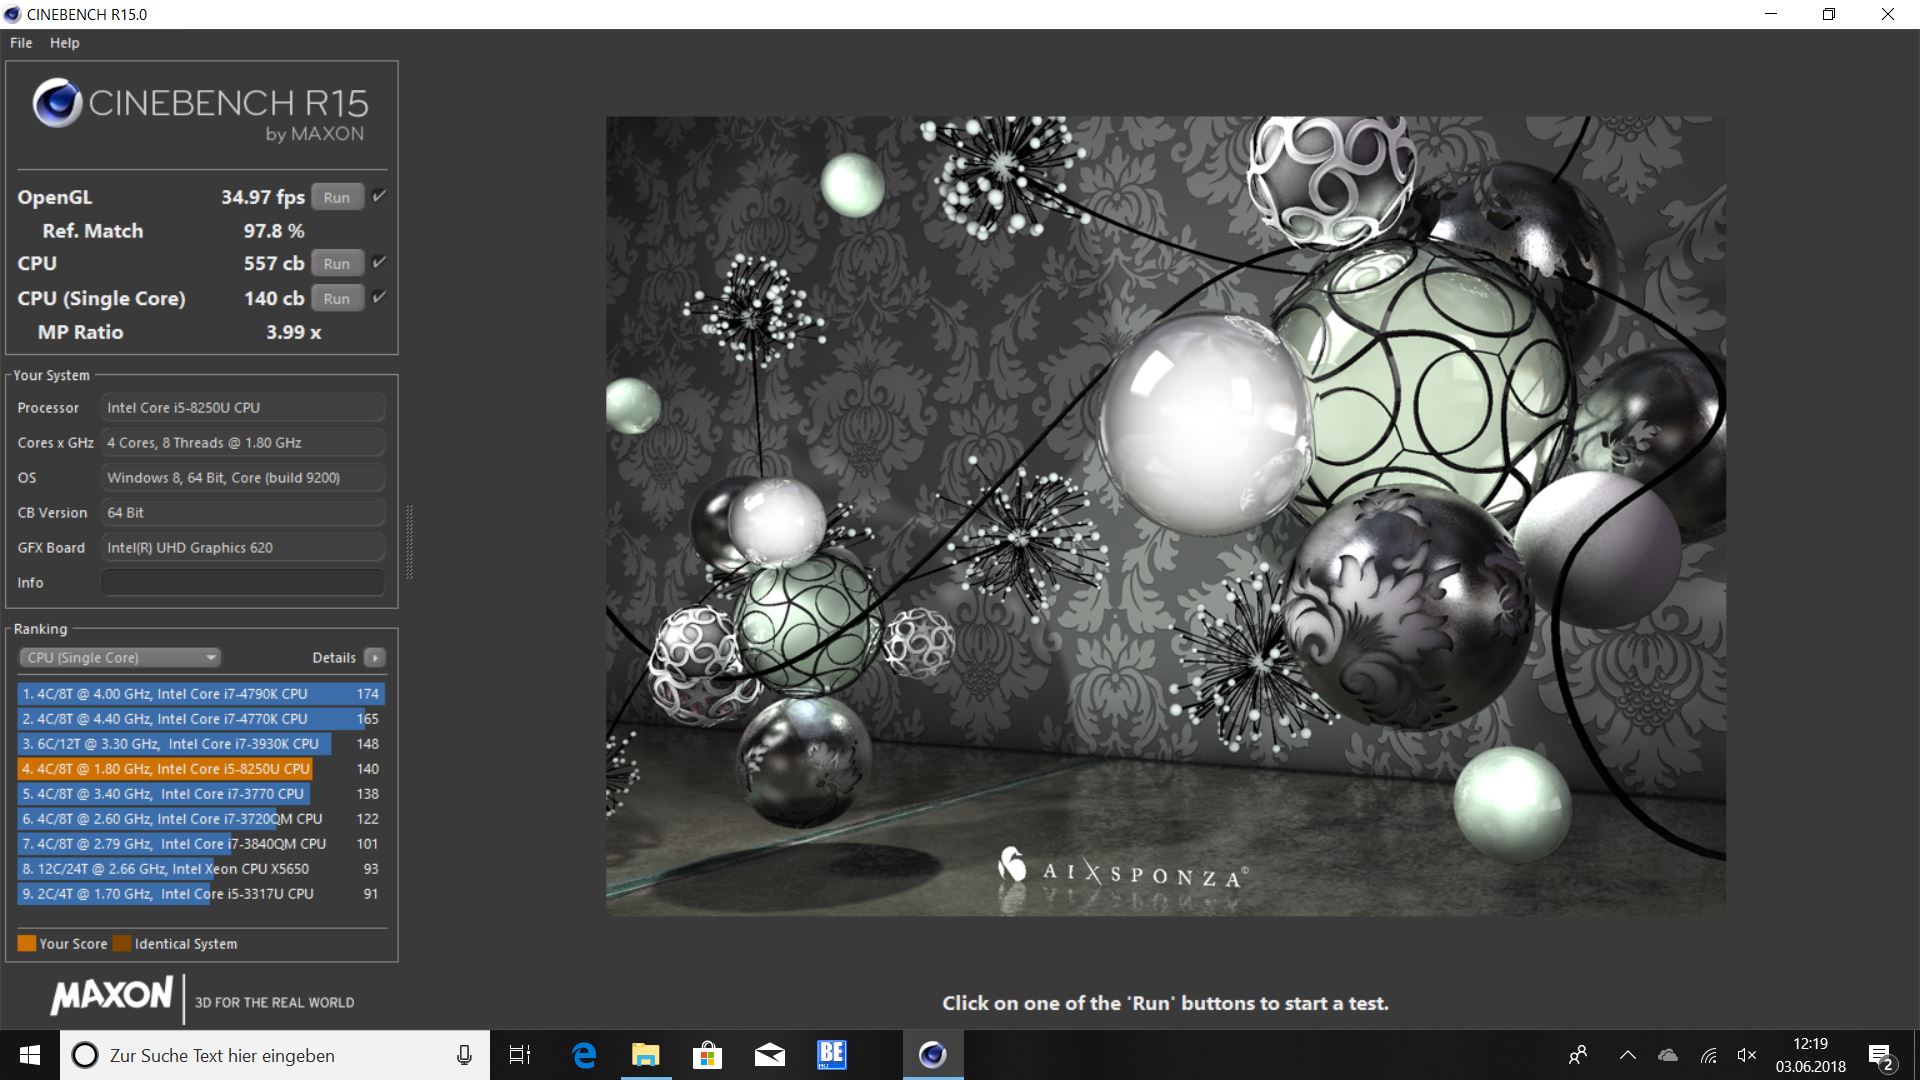
| Cinebench R10 | |
| Rendering Single CPUs 64Bit | |
| Genomsnitt av klass Convertible (12127 - 12555, n=2, senaste 2 åren) | |
| Genomsnitt Intel Core i5-8250U (5163 - 8153, n=13) | |
| Dell Inspiron 15 5579-9672 | |
| Rendering Multiple CPUs 64Bit | |
| Genomsnitt av klass Convertible (36094 - 50439, n=2, senaste 2 åren) | |
| Dell Inspiron 15 5579-9672 | |
| Genomsnitt Intel Core i5-8250U (11245 - 28932, n=13) | |
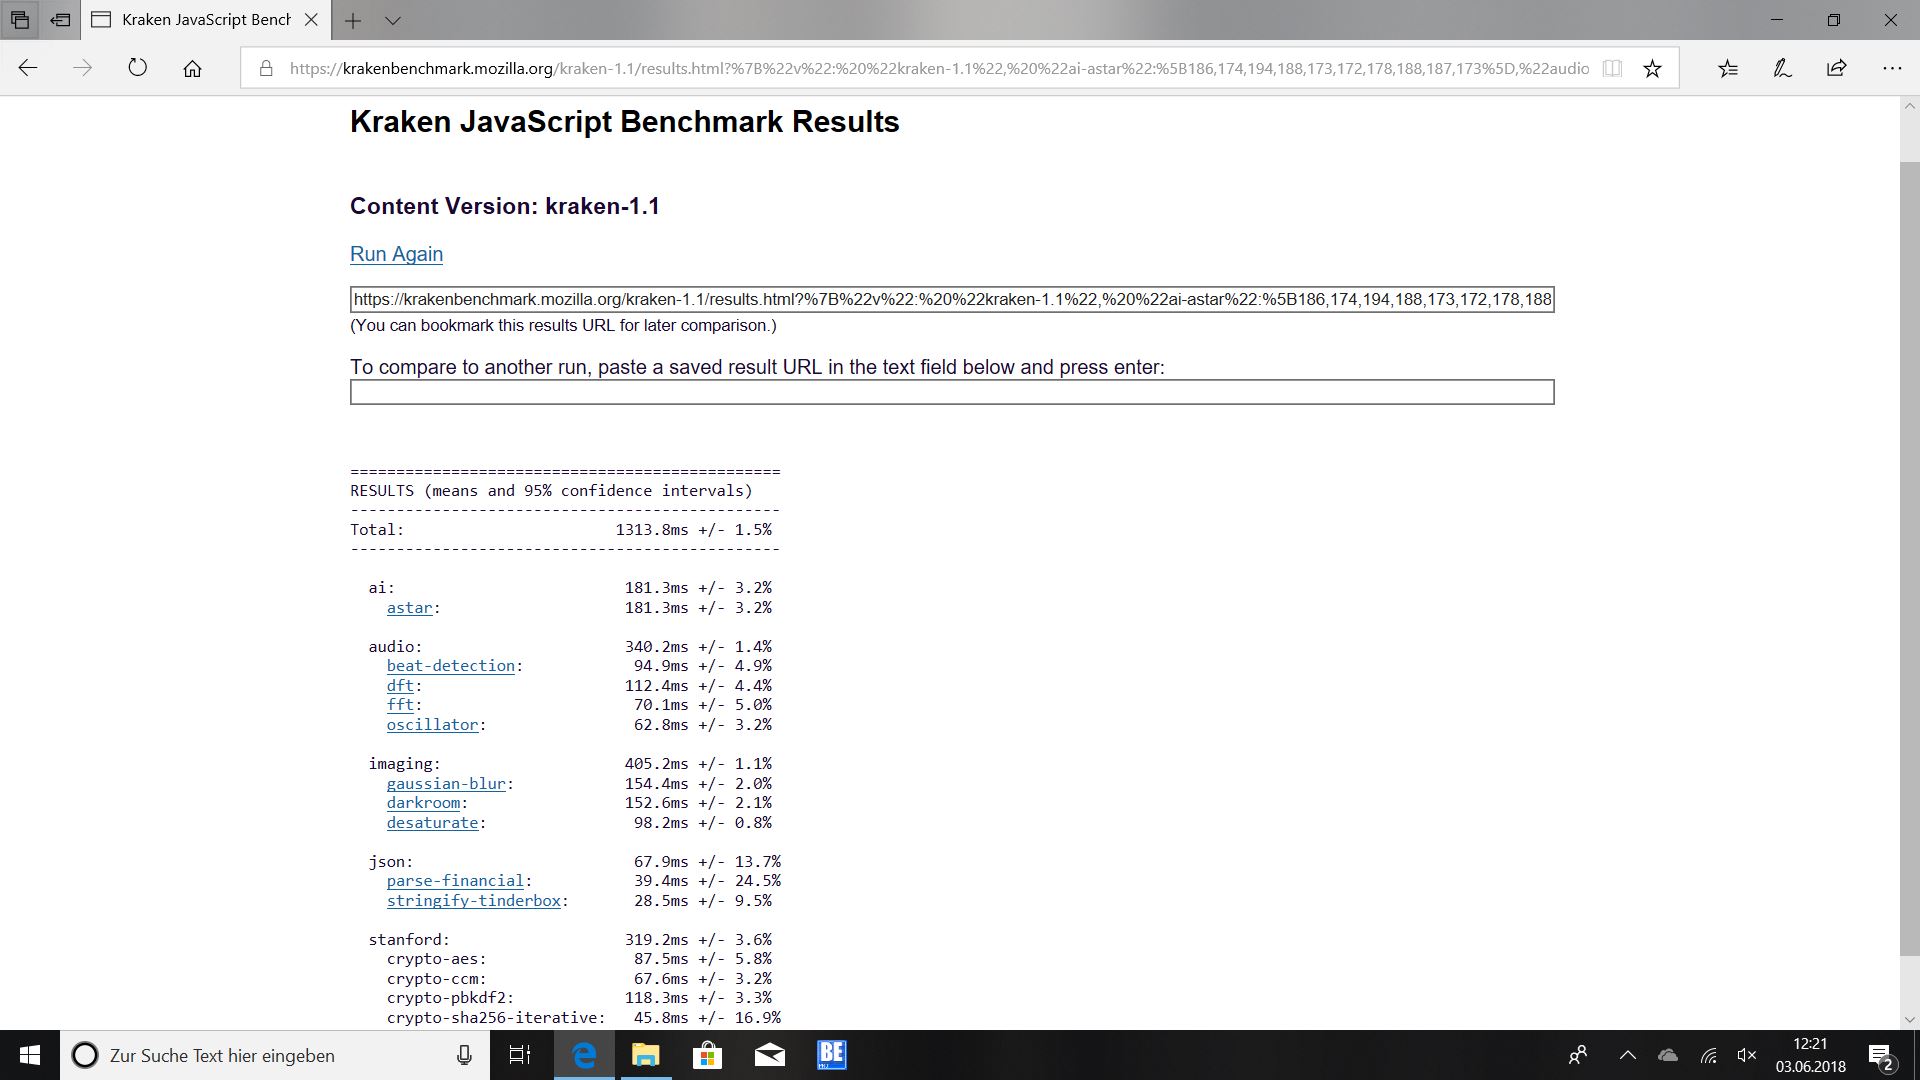
| HWBOT x265 Benchmark v2.2 - 4k Preset | |
| Genomsnitt av klass Convertible (3.43 - 36.2, n=47, senaste 2 åren) | |
| Genomsnitt Intel Core i5-8250U (3.02 - 4.78, n=8) | |
| Dell Inspiron 15 5579-9672 | |
* ... mindre är bättre
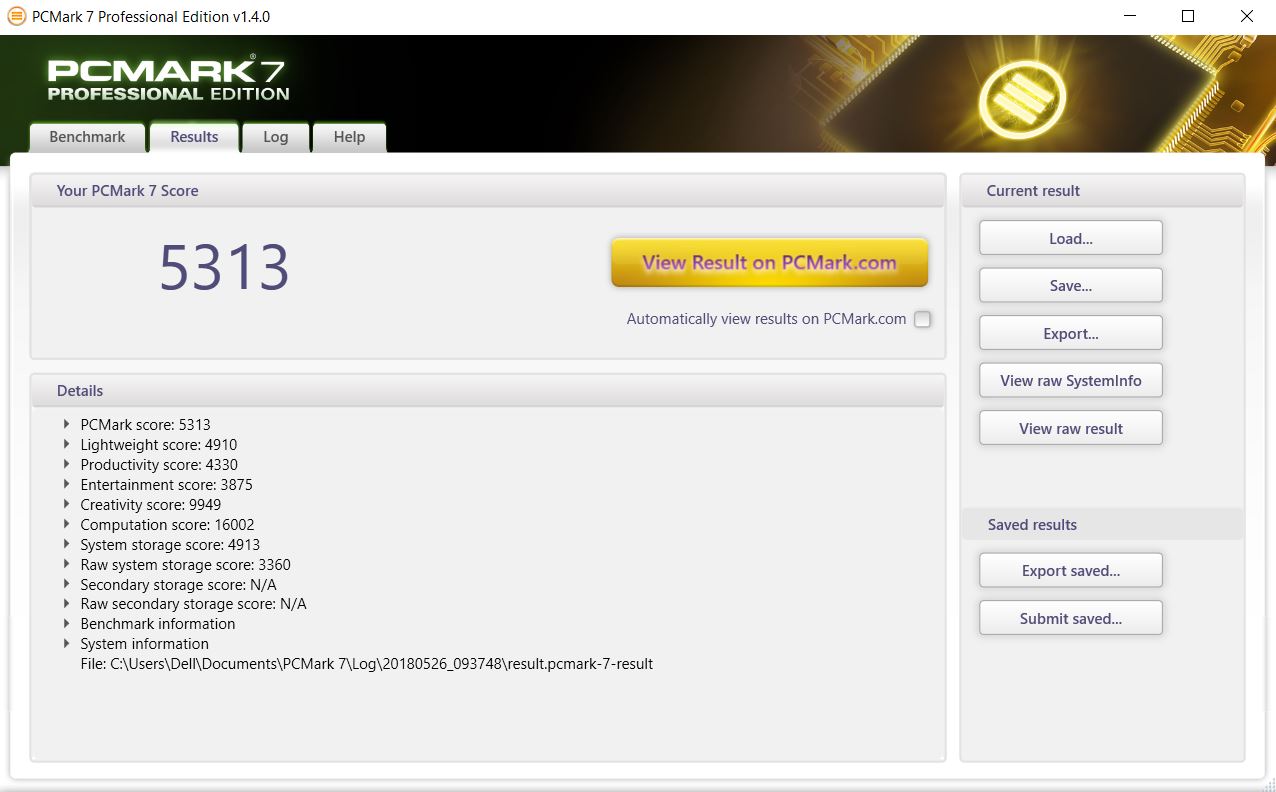
| PCMark 7 Score | 5313 poäng | |
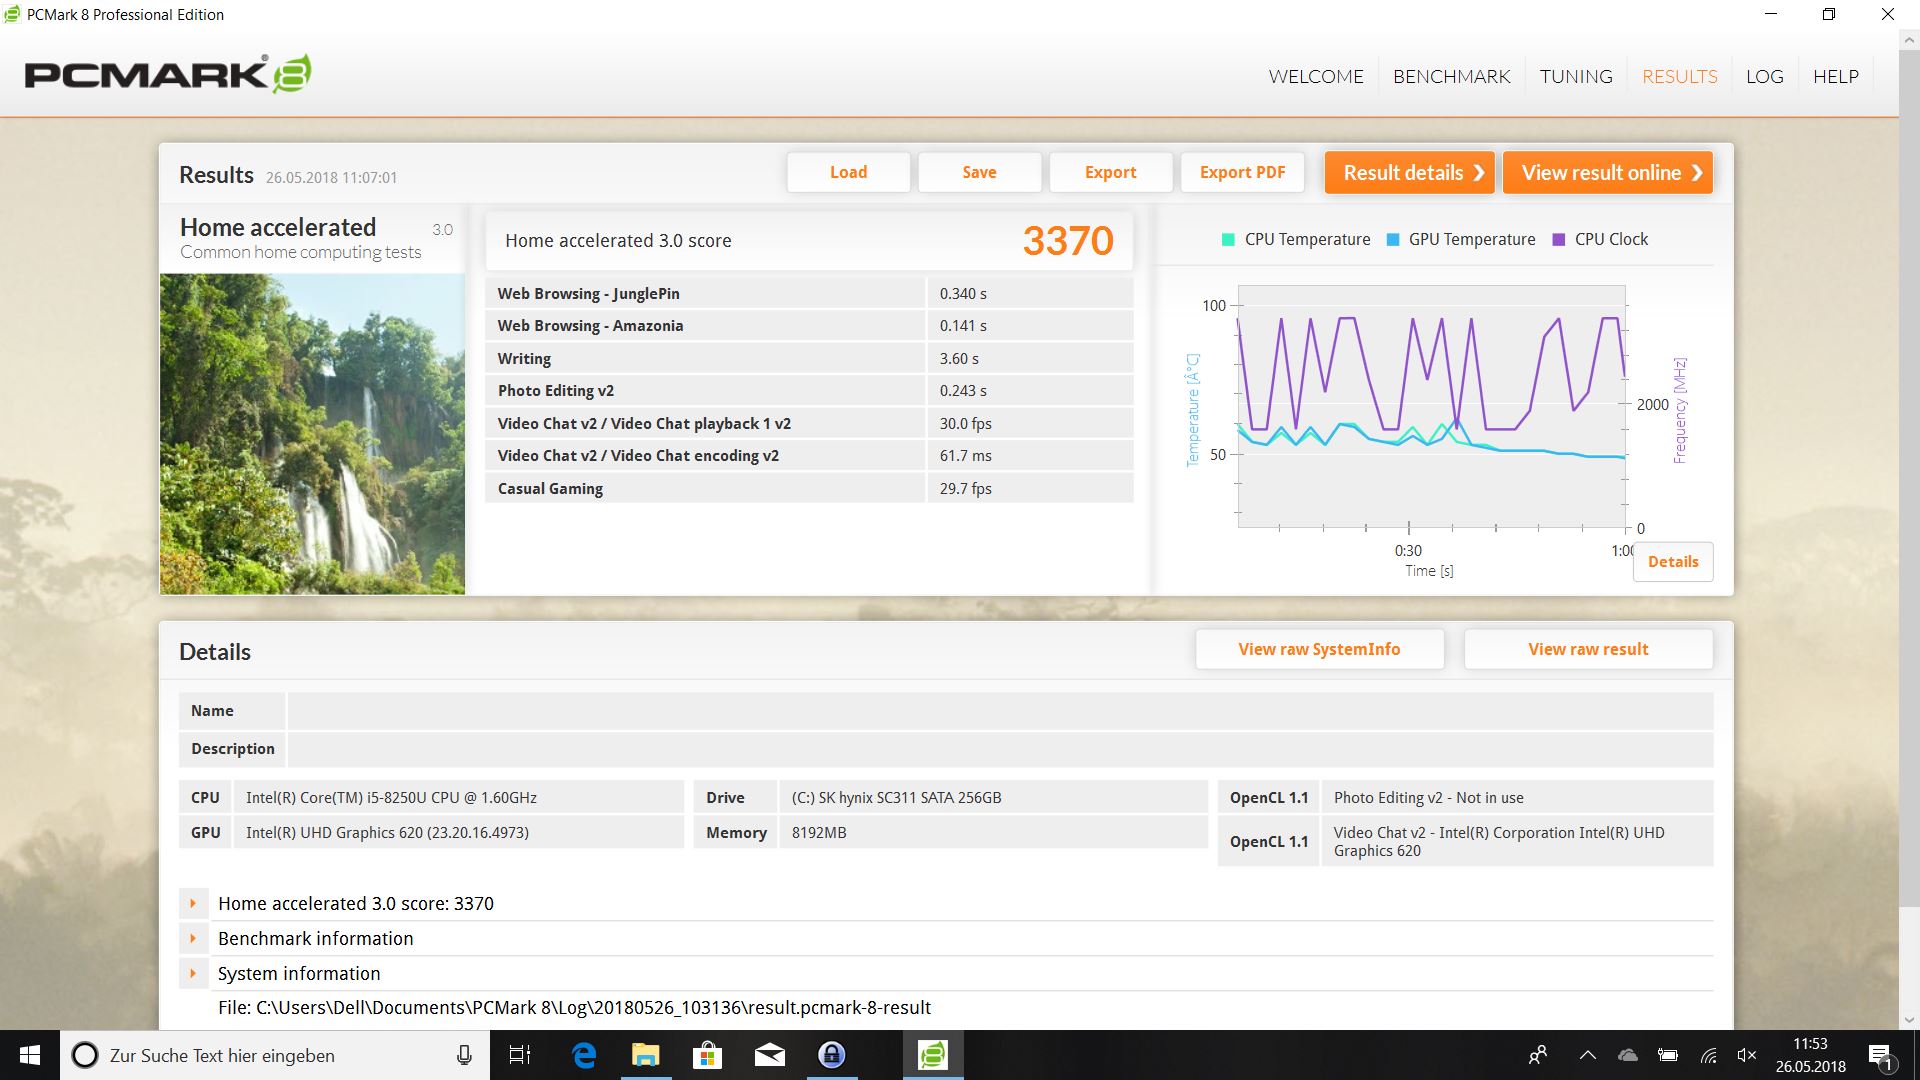
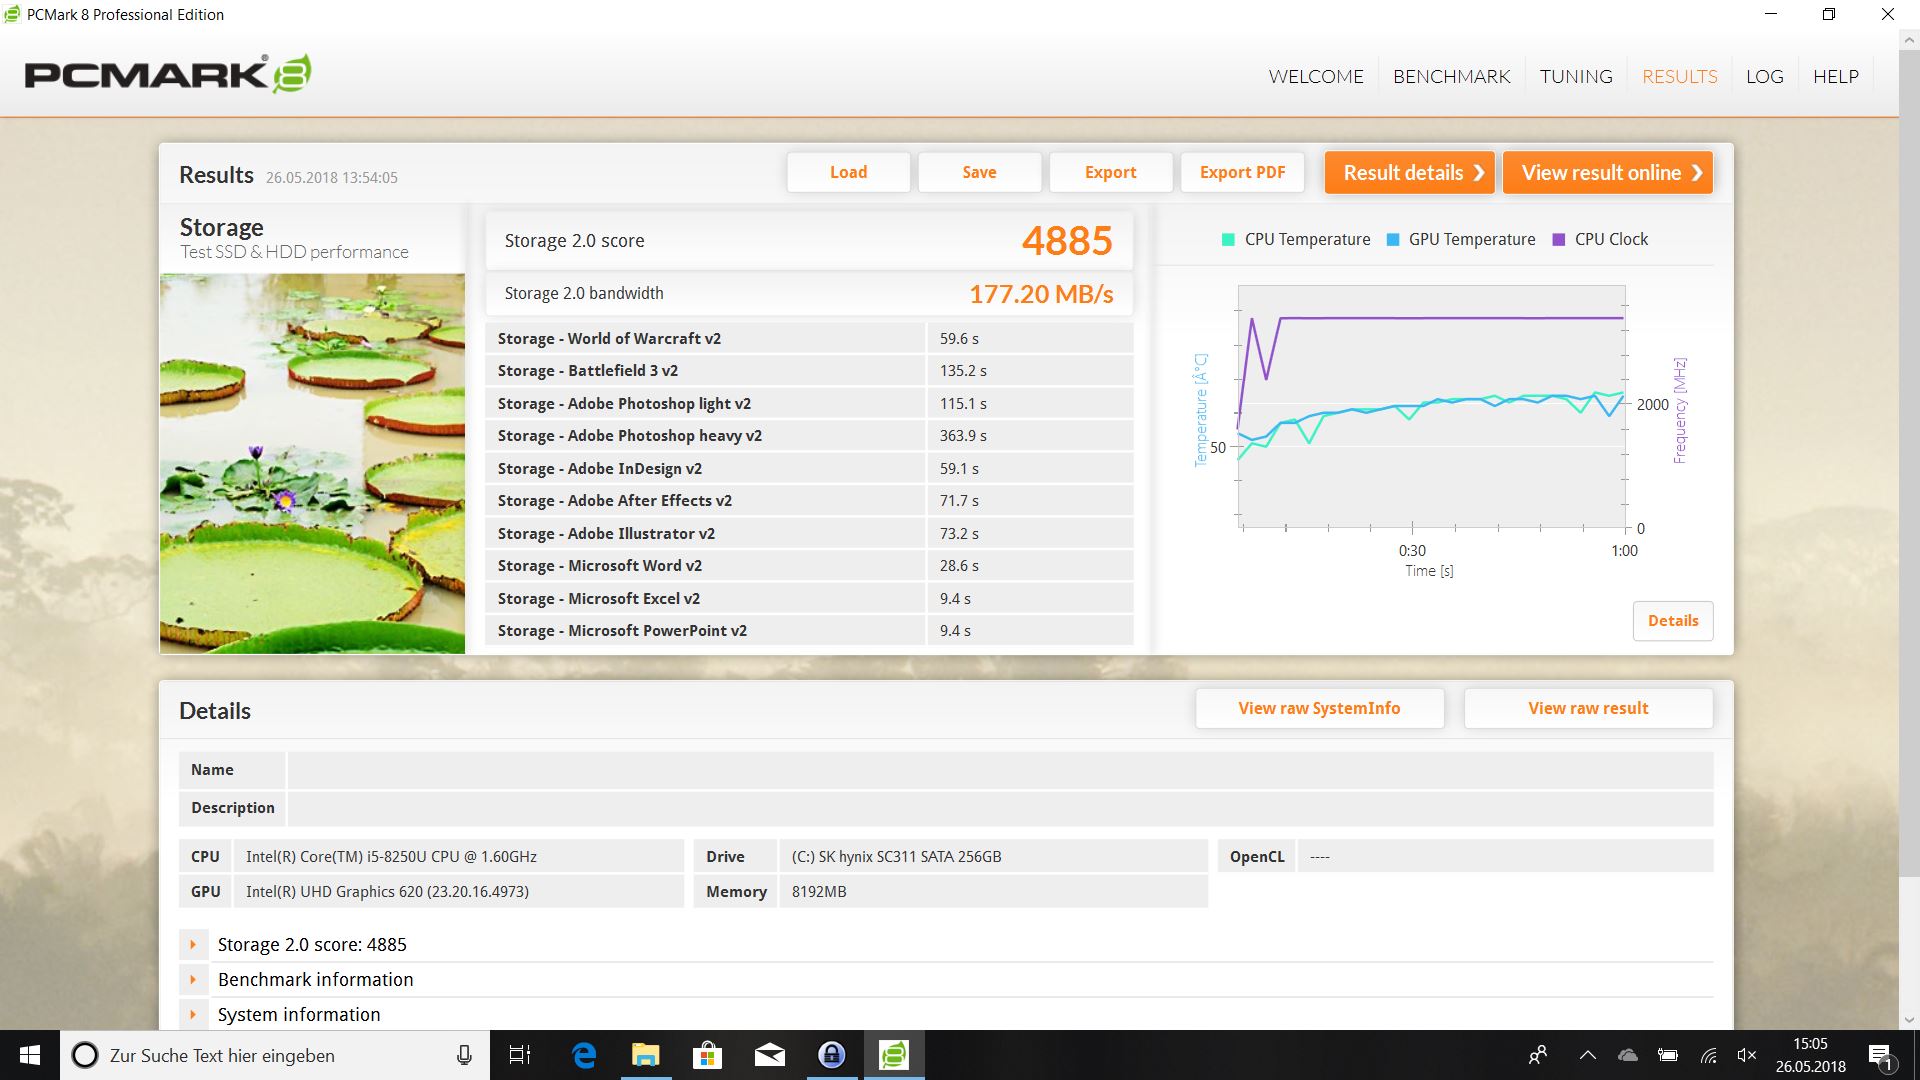
| PCMark 8 Home Score Accelerated v2 | 3370 poäng | |
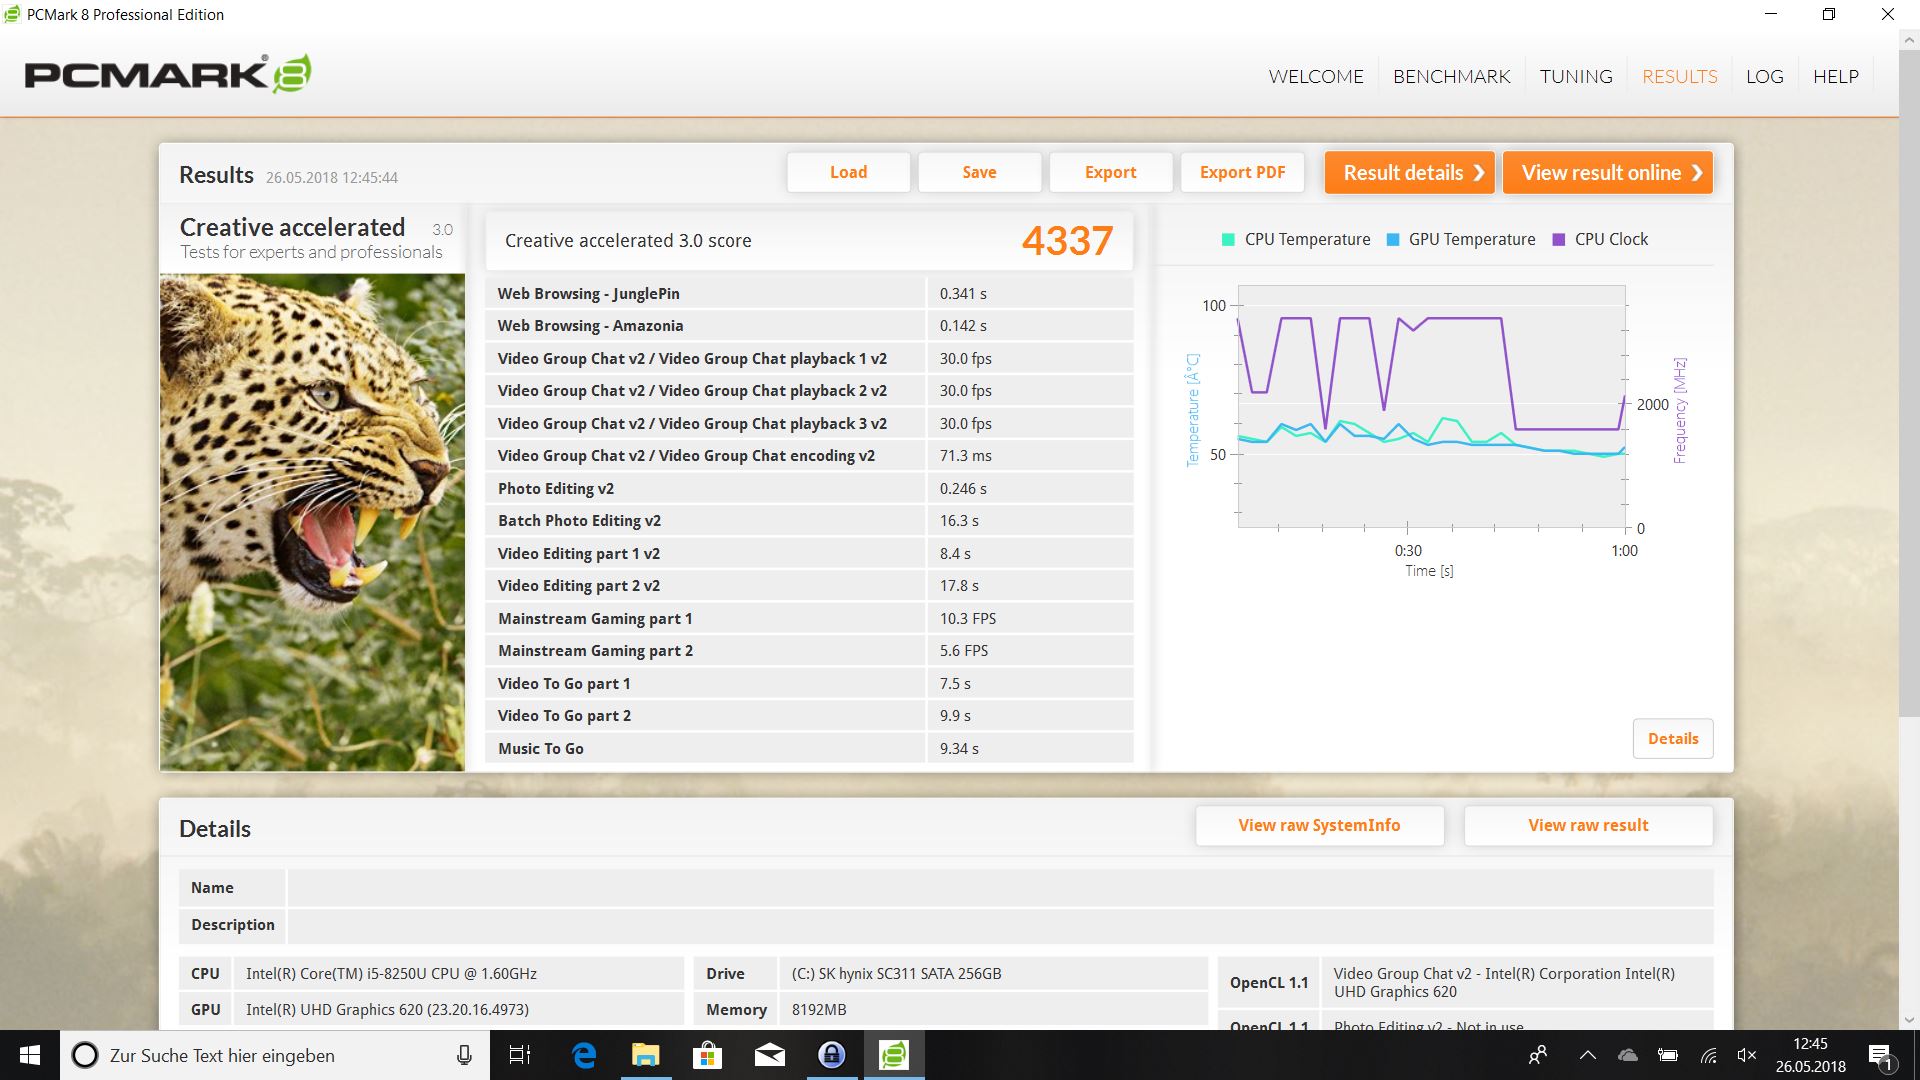
| PCMark 8 Creative Score Accelerated v2 | 4337 poäng | |
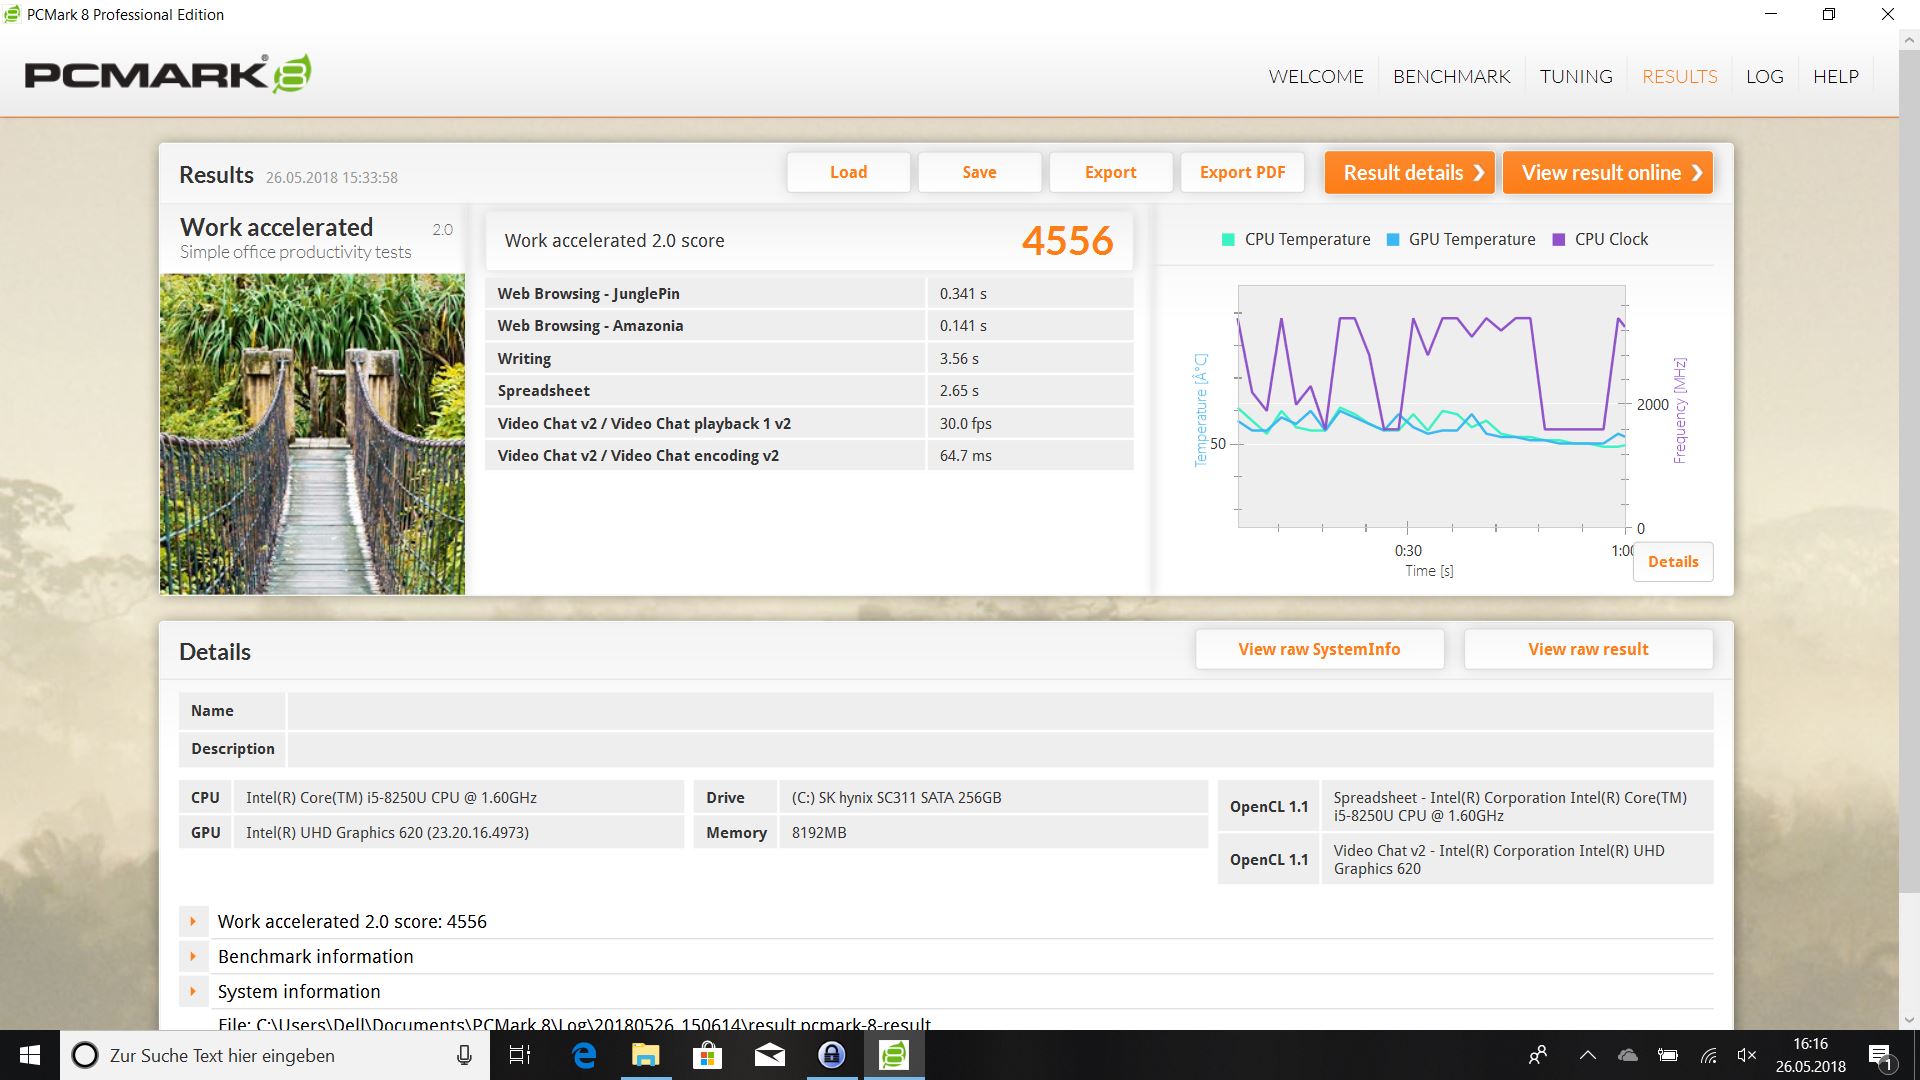
| PCMark 8 Work Score Accelerated v2 | 4556 poäng | |
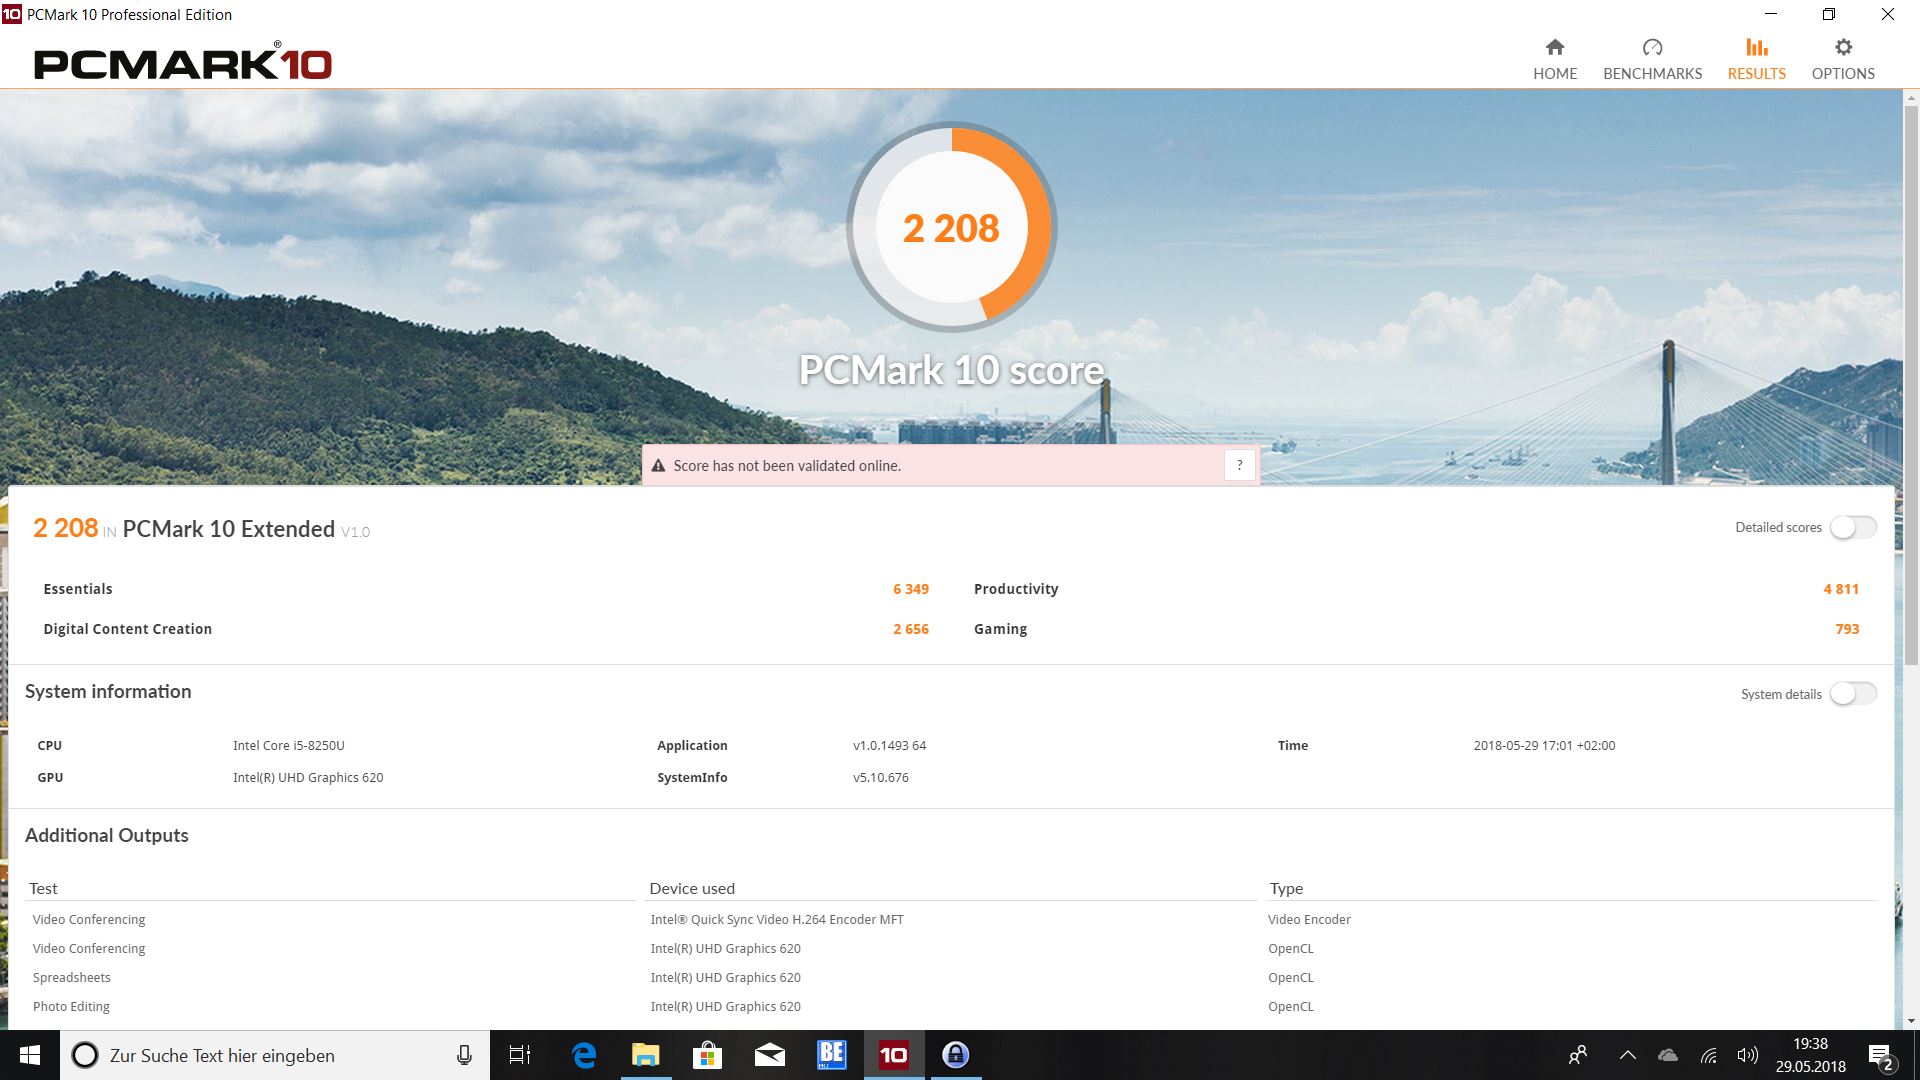
| PCMark 10 Score | 2208 poäng | |
Hjälp | ||
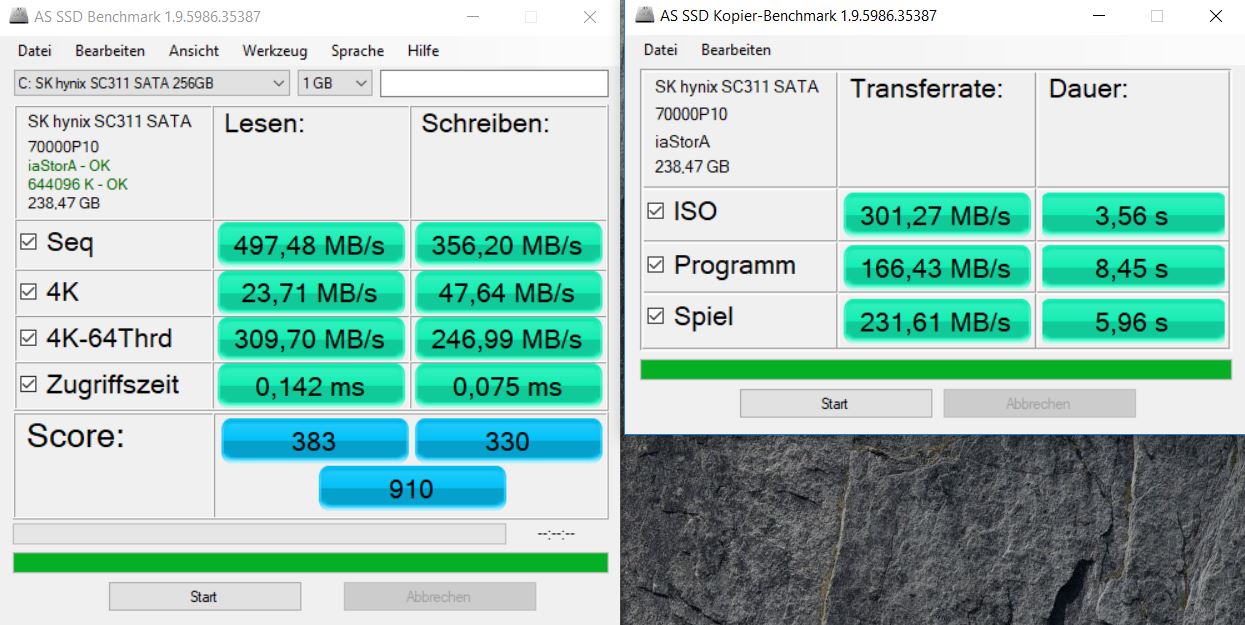
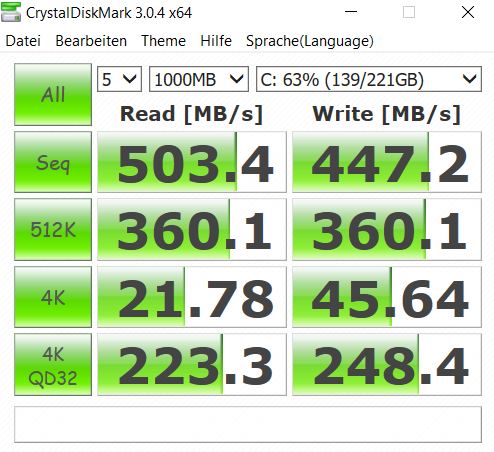
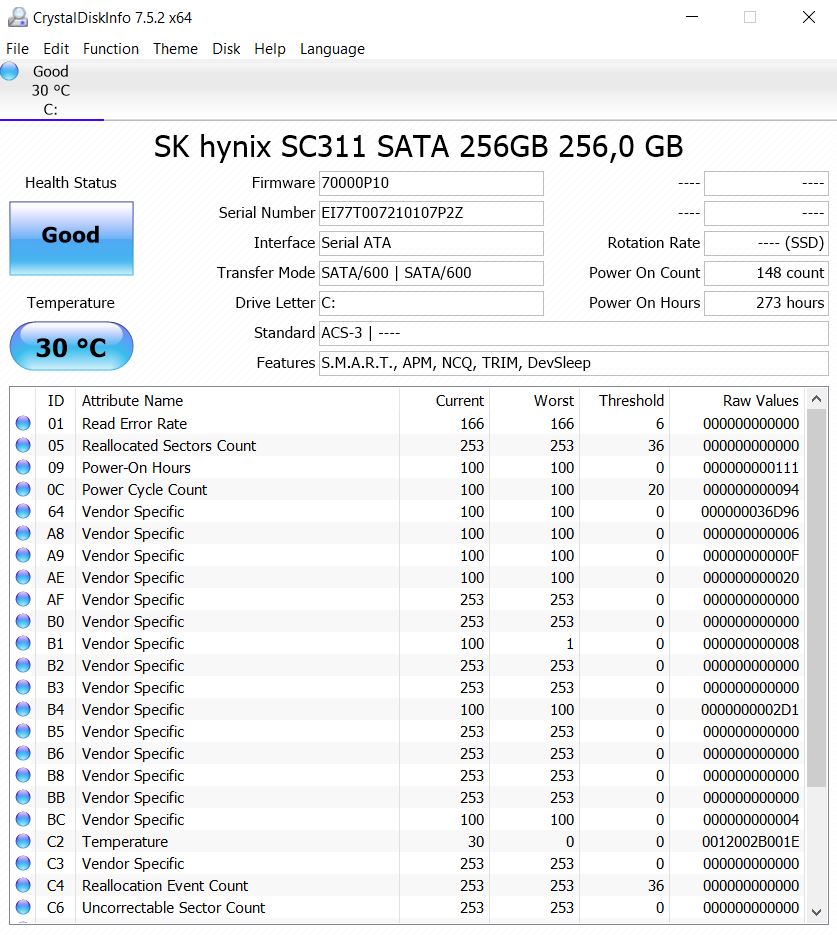
| Dell Inspiron 15 5579-9672 SK hynix SC311 SATA | Dell Inspiron 15 5578-1777 2-in-1 SanDisk X400 256GB, SATA (SD8SB8U-256G) | HP Envy x360 15-bq102ng Samsung PM961 MZVLW256HEHP | Asus VivoBook Flip 15 TP510UA-E8073T SanDisk SD8SN8U128G1002 | Acer Spin 3 SP314-51-548L Micron 1100 MTFDDAV256TBN | Lenovo ThinkPad L380 Yoga-20M7001BGE Samsung PM961 MZVLW256HEHP | |
|---|---|---|---|---|---|---|
| CrystalDiskMark 3.0 | 7% | 114% | -5% | 14% | 164% | |
| Read Seq (MB/s) | 503 | 503 0% | 1487 196% | 458.5 -9% | 484.3 -4% | 2073 312% |
| Write Seq (MB/s) | 447.2 | 465.3 4% | 1241 178% | 337.2 -25% | 439.8 -2% | 943 111% |
| Read 512 (MB/s) | 360.1 | 293 -19% | 923 156% | 319.1 -11% | 316.4 -12% | 1221 239% |
| Write 512 (MB/s) | 360.1 | 322.7 -10% | 797 121% | 186 -48% | 345.4 -4% | 819 127% |
| Read 4k (MB/s) | 21.78 | 28.9 33% | 49.38 127% | 28.39 30% | 27.17 25% | 53.5 146% |
| Write 4k (MB/s) | 45.64 | 55 21% | 97.3 113% | 56.6 24% | 86.7 90% | 127.4 179% |
| Read 4k QD32 (MB/s) | 223.3 | 314.5 41% | 295 32% | 321.1 44% | 246.7 10% | 396.6 78% |
| Write 4k QD32 (MB/s) | 248.4 | 209.2 -16% | 212.5 -14% | 128.5 -48% | 260.6 5% | 538 117% |

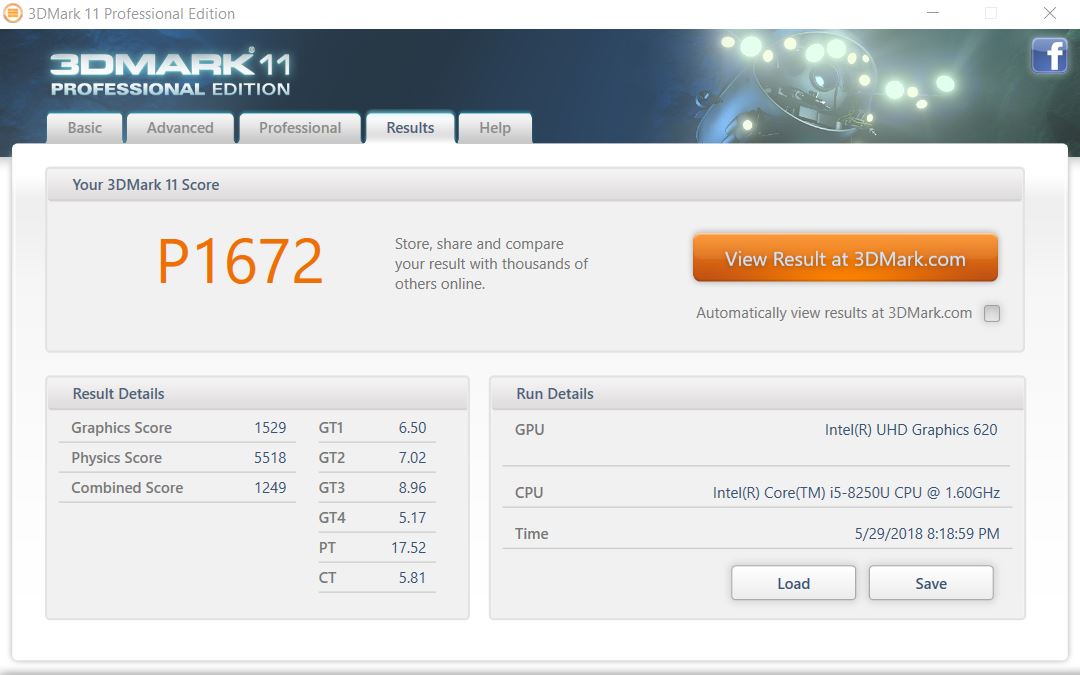
| 3DMark 11 Performance | 1672 poäng | |
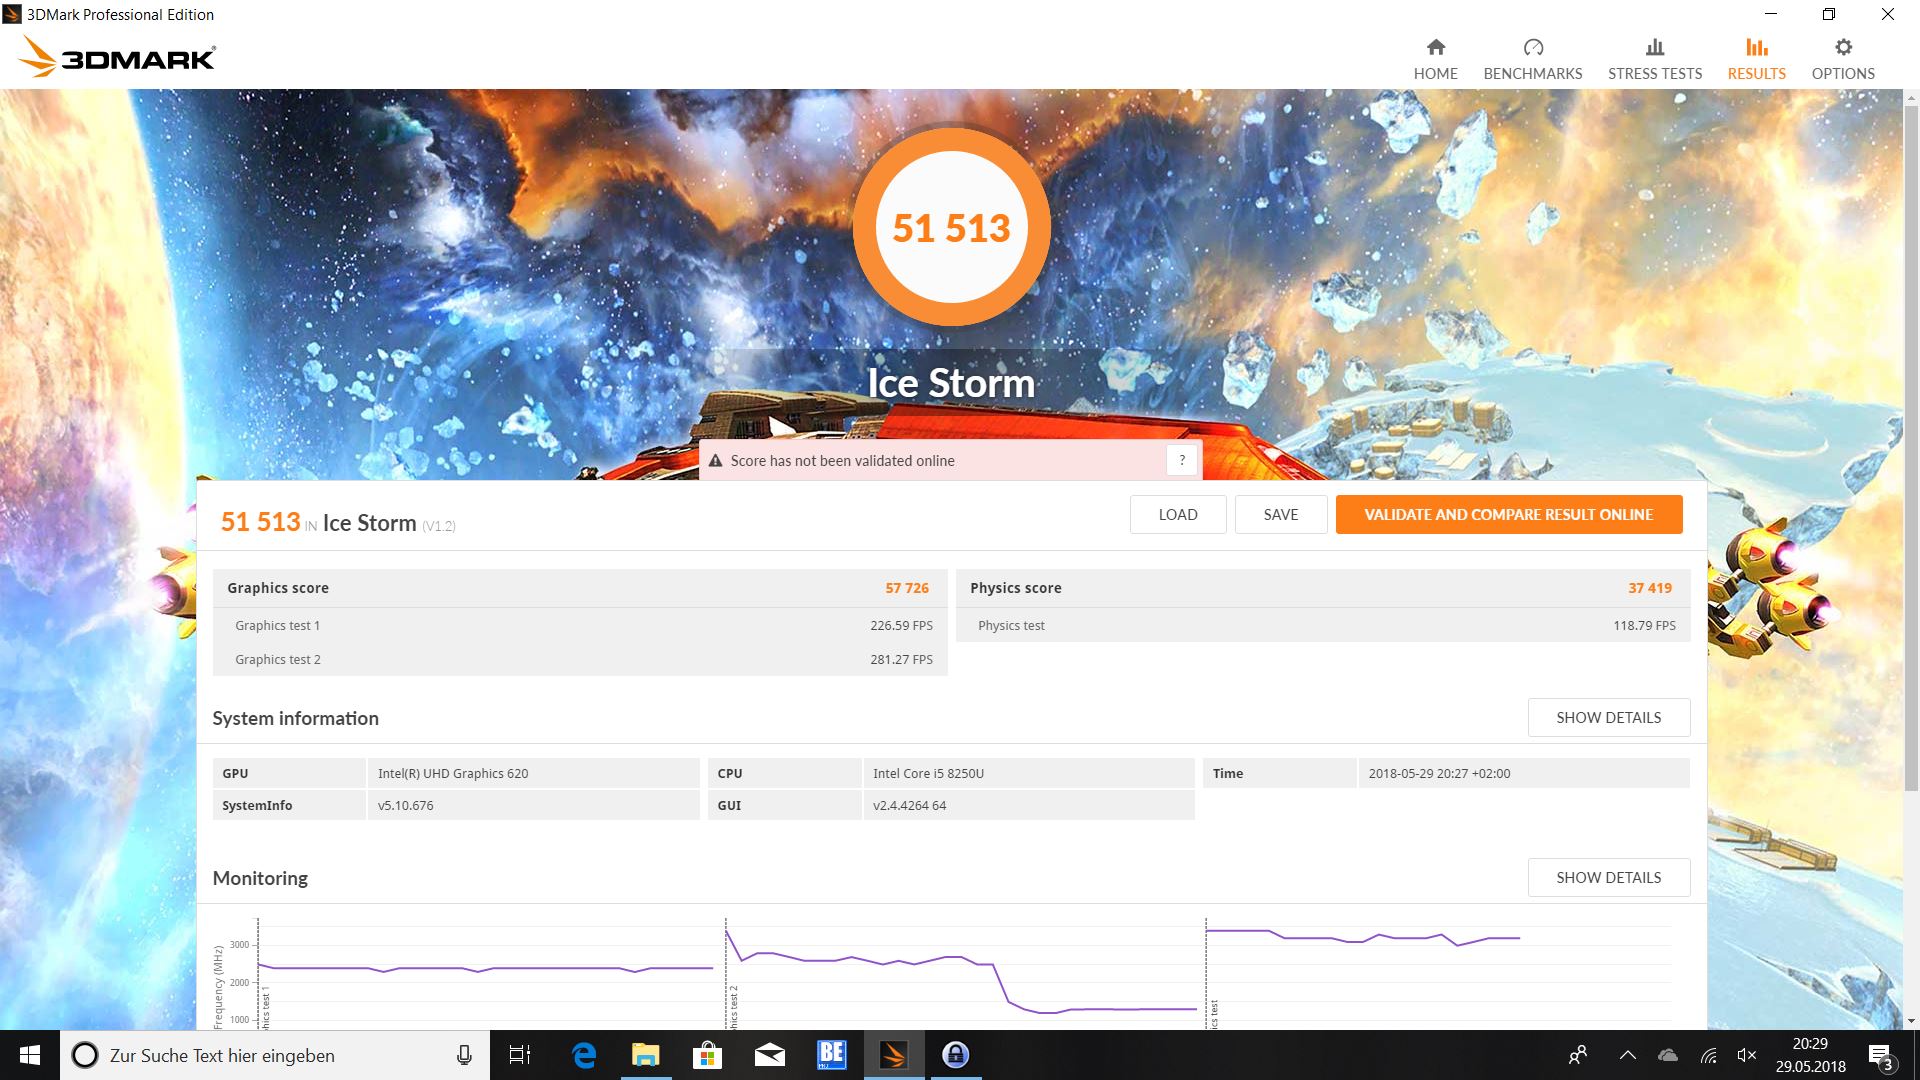
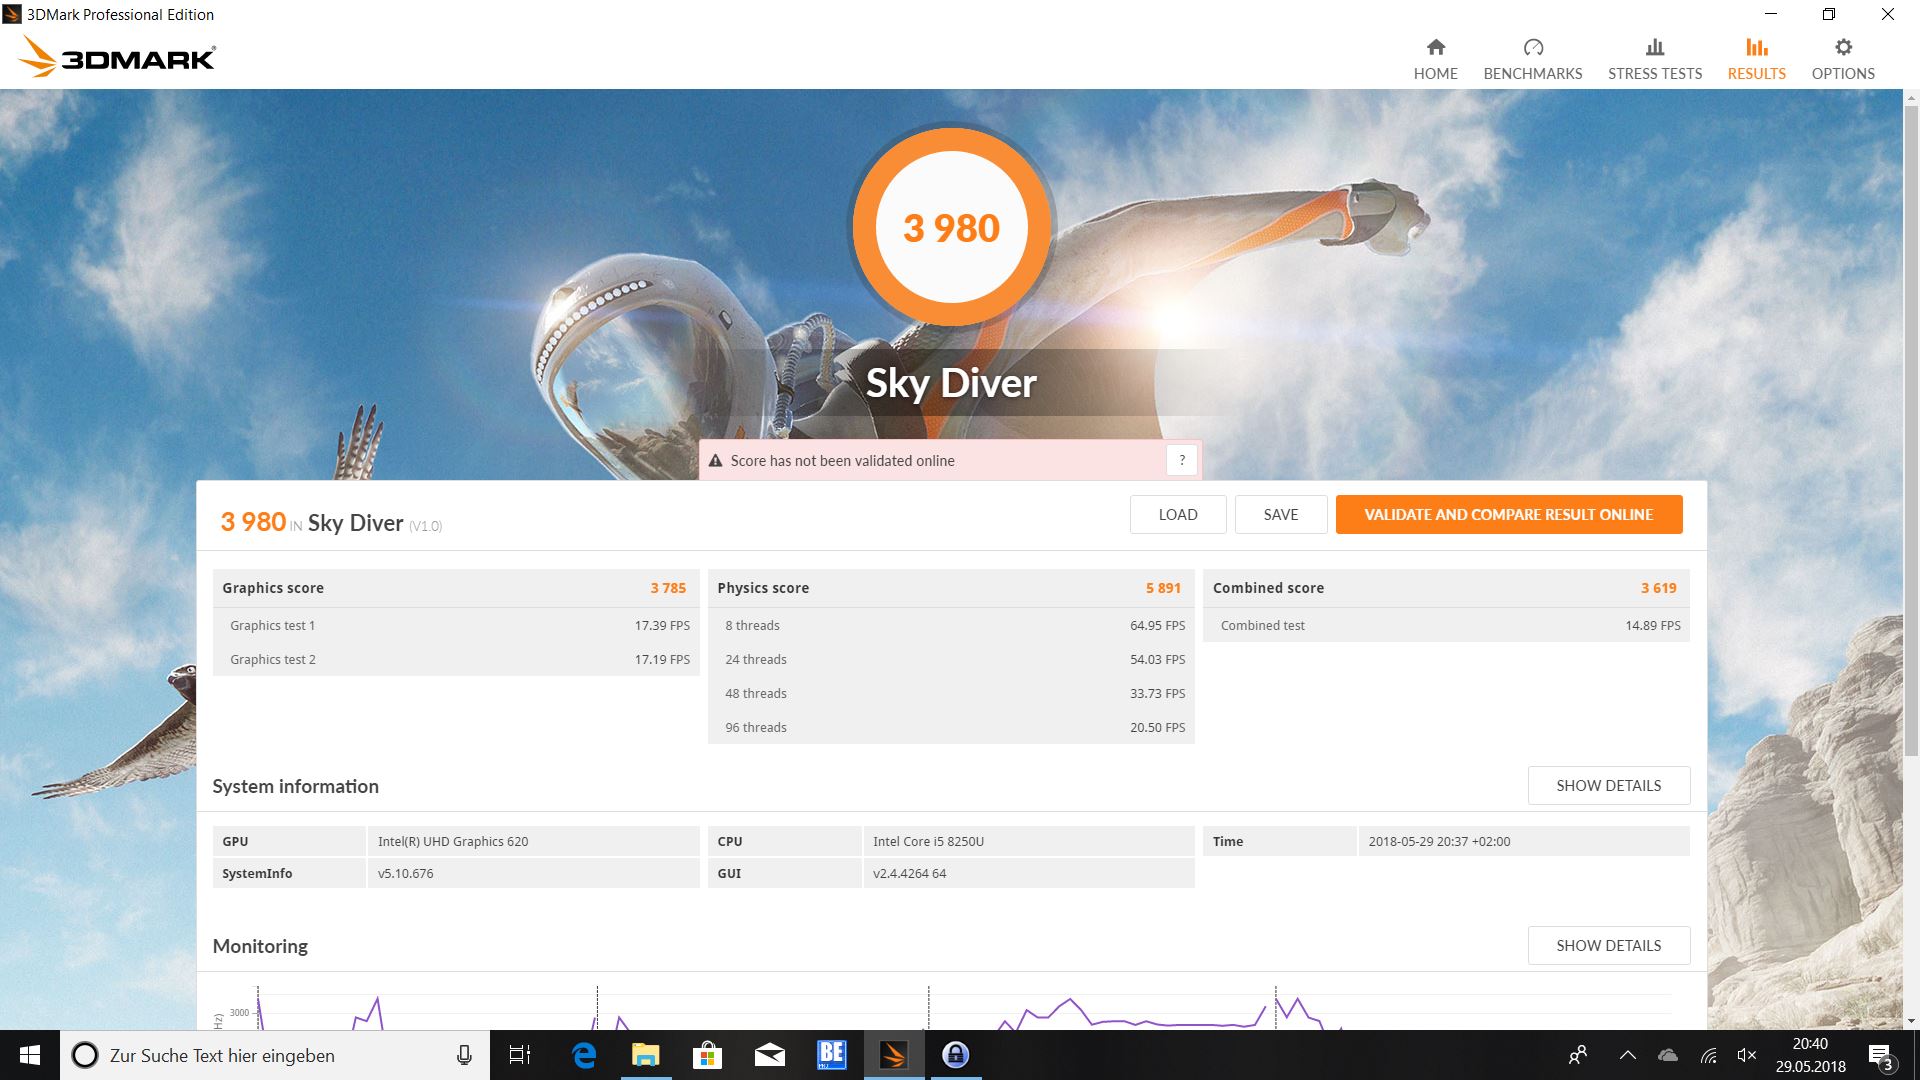
| 3DMark Ice Storm Standard Score | 51513 poäng | |
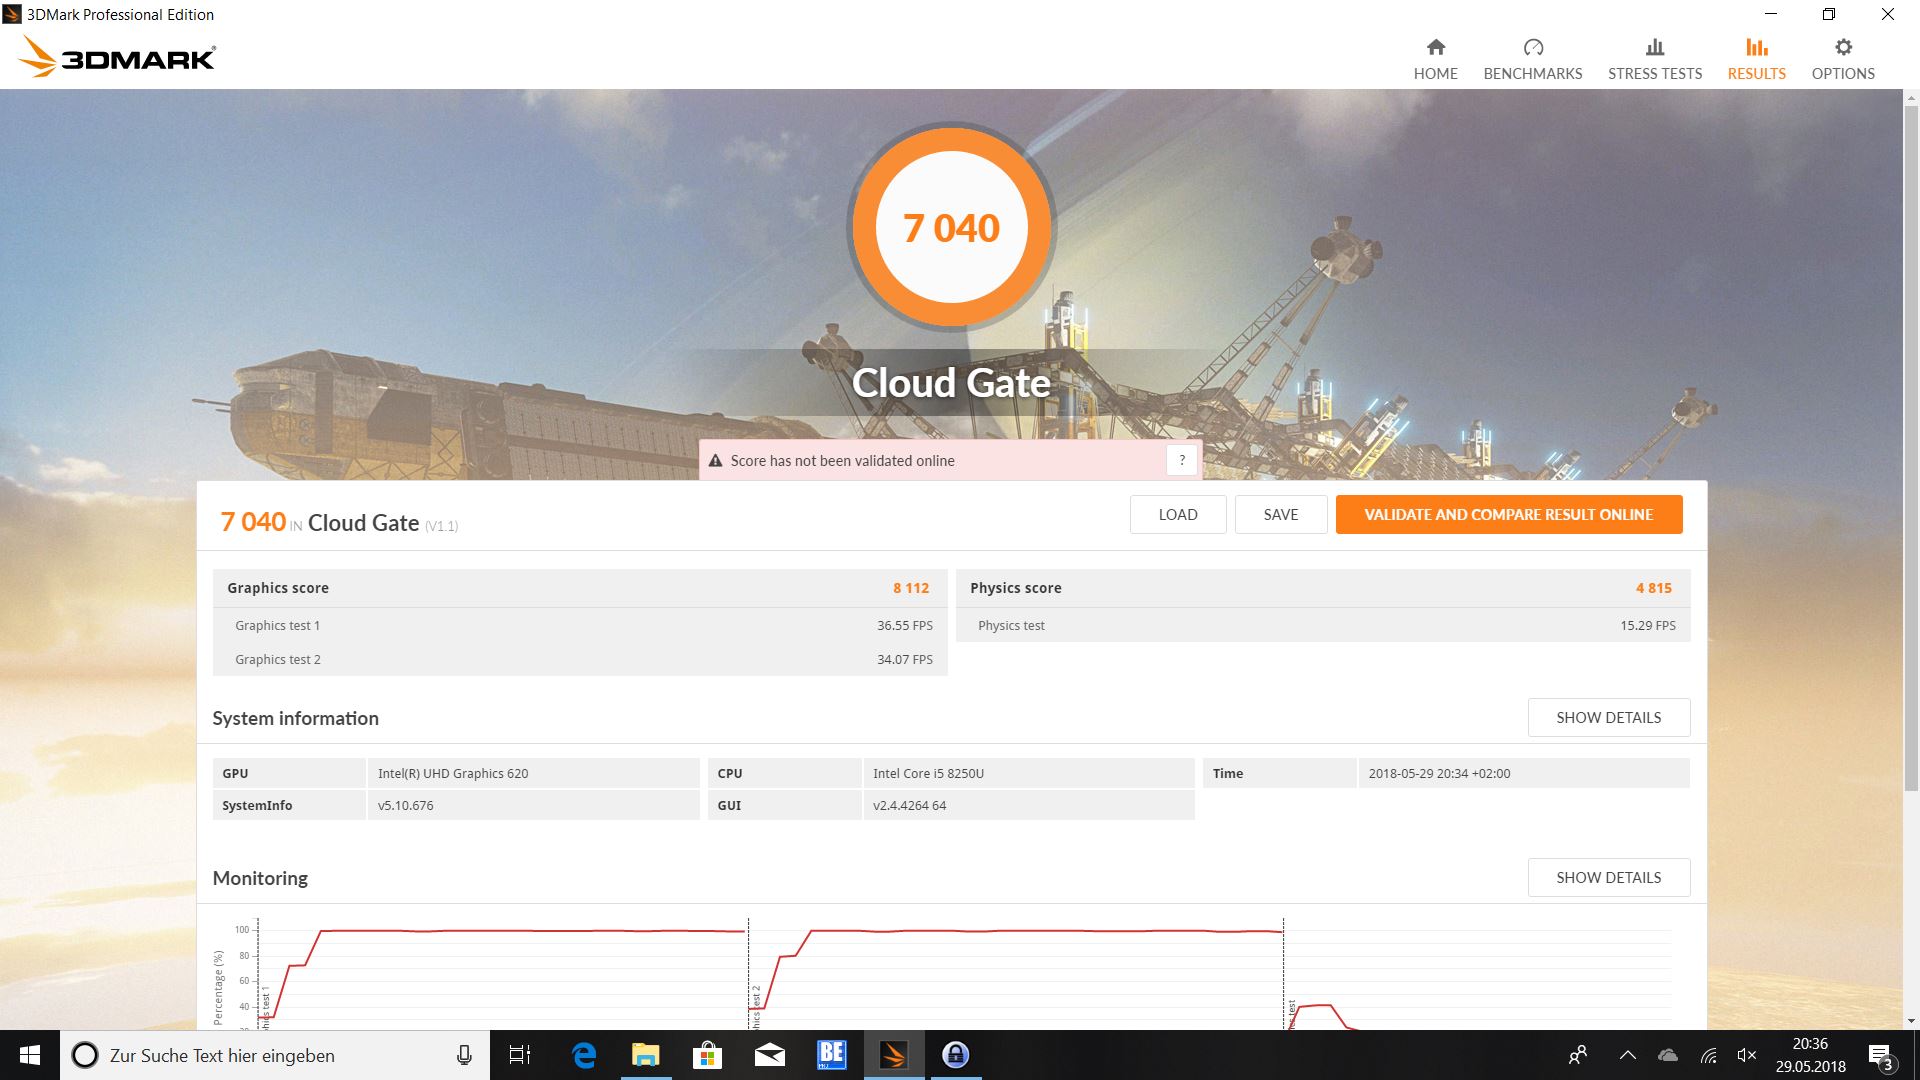
| 3DMark Cloud Gate Standard Score | 7040 poäng | |
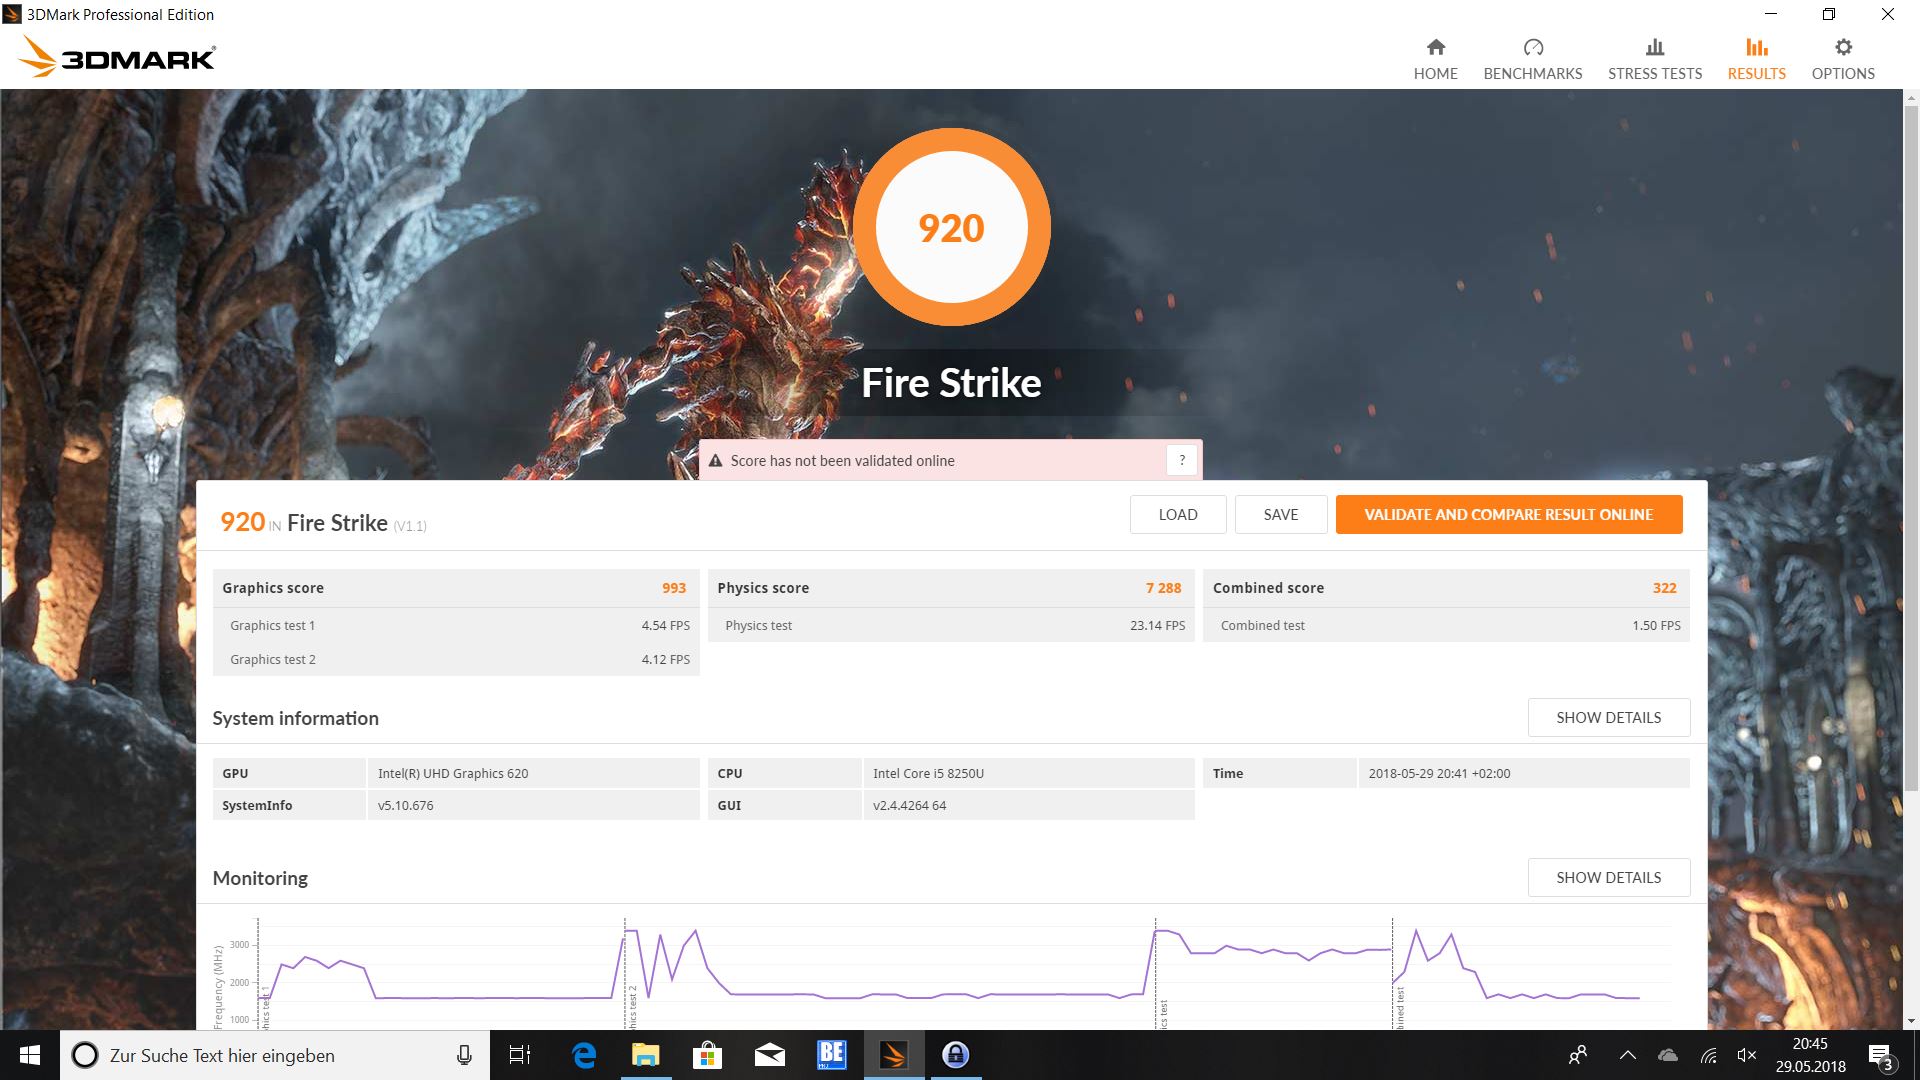
| 3DMark Fire Strike Score | 920 poäng | |
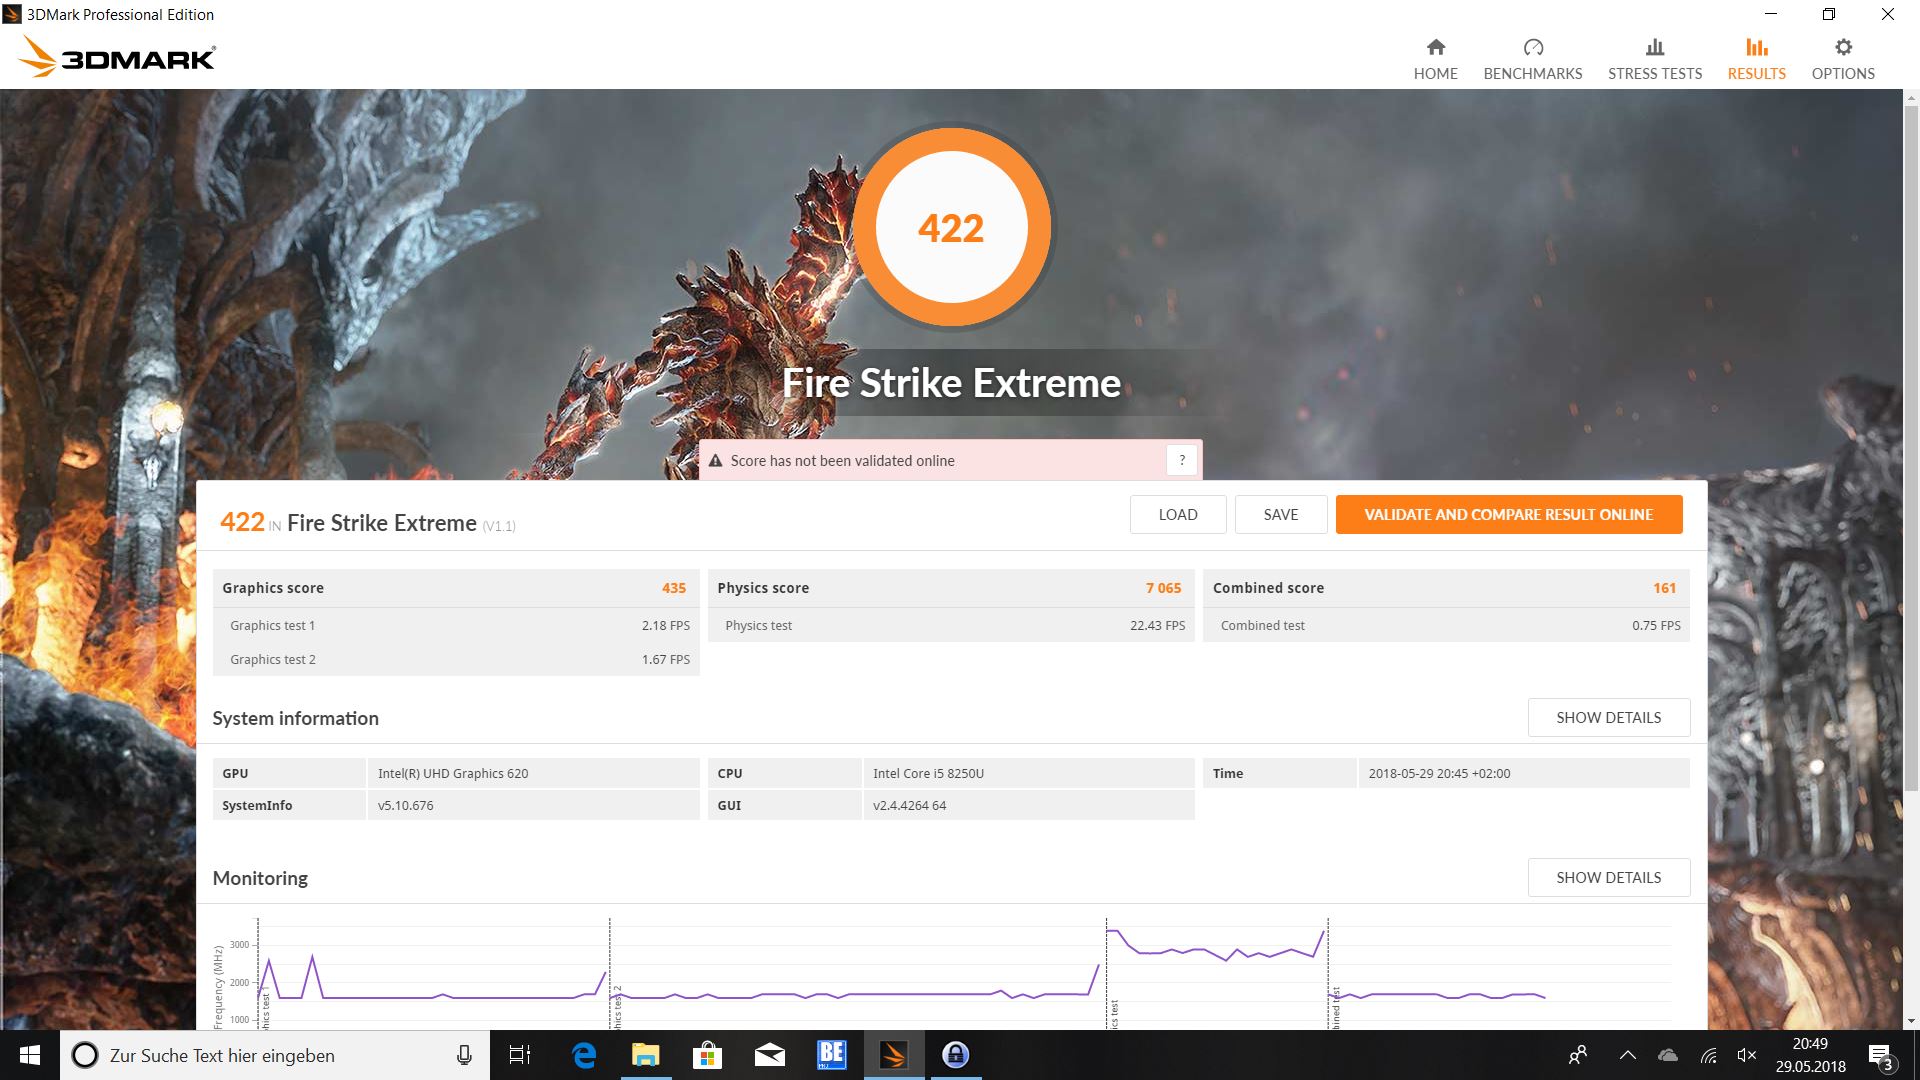
| 3DMark Fire Strike Extreme Score | 422 poäng | |
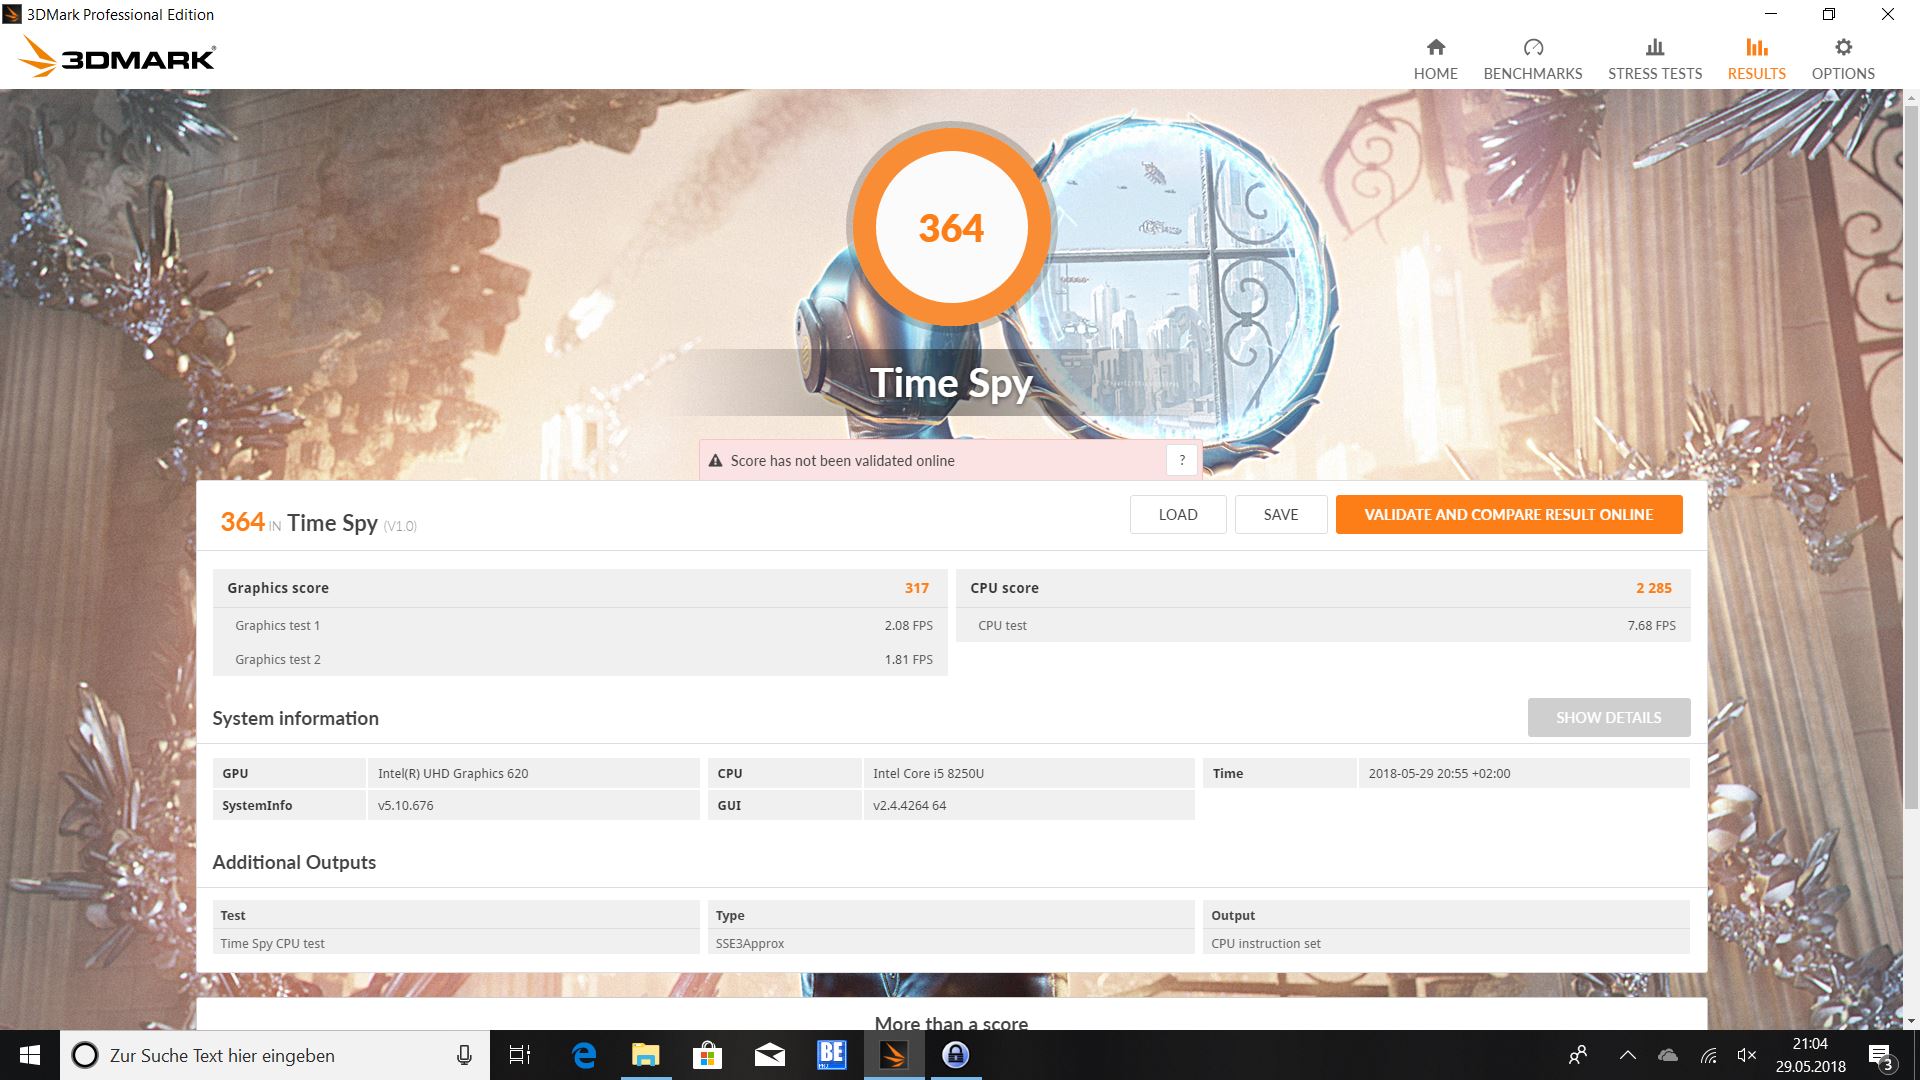
| 3DMark Time Spy Score | 364 poäng | |
Hjälp | ||
| låg | med. | hög | ultra | |
|---|---|---|---|---|
| BioShock Infinite (2013) | 48.1 | 27.1 | 22.4 | 7.4 |
| Battlefield 4 (2013) | 42.1 | 29.6 | 19.9 | 5.7 |
| The Witcher 3 (2015) | 15.2 | 9.9 | 5.5 | |
| Rise of the Tomb Raider (2016) | 18.6 | 11.4 | 6.5 | |
| Rocket League (2017) | 20.7 | 13.1 | ||
| FIFA 18 (2017) | 58.3 | 31.8 | 27.4 | 24.7 |
Ljudnivå
| Låg belastning |
| 30.4 / 30.4 / 31.2 dB(A) |
| Hög belastning |
| 31.5 / 31.5 dB(A) |
 | ||
30 dB tyst 40 dB(A) hörbar 50 dB(A) högt ljud |
||
min: | ||
| Dell Inspiron 15 5579-9672 UHD Graphics 620, i5-8250U, SK hynix SC311 SATA | Dell Inspiron 15 5578-1777 2-in-1 HD Graphics 620, i5-7200U, SanDisk X400 256GB, SATA (SD8SB8U-256G) | HP Envy x360 15-bq102ng Vega 8, R5 2500U, Samsung PM961 MZVLW256HEHP | Asus VivoBook Flip 15 TP510UA-E8073T UHD Graphics 620, i5-8250U, SanDisk SD8SN8U128G1002 | Acer Spin 3 SP314-51-548L UHD Graphics 620, i5-8250U, Micron 1100 MTFDDAV256TBN | Lenovo ThinkPad L380 Yoga-20M7001BGE UHD Graphics 620, i5-8250U, Samsung PM961 MZVLW256HEHP | |
|---|---|---|---|---|---|---|
| Noise | -2% | -7% | -3% | -9% | -1% | |
| av / miljö * (dB) | 30.4 | 30.6 -1% | 30.13 1% | 30.2 1% | 30 1% | 30.4 -0% |
| Idle Minimum * (dB) | 30.4 | 30.4 -0% | 30.13 1% | 30.9 -2% | 30 1% | 30.4 -0% |
| Idle Average * (dB) | 30.4 | 30.4 -0% | 30.13 1% | 30.9 -2% | 30 1% | 30.4 -0% |
| Idle Maximum * (dB) | 31.2 | 30.4 3% | 30.13 3% | 30.9 1% | 30 4% | 30.8 1% |
| Load Average * (dB) | 31.5 | 32.3 -3% | 38.8 -23% | 34.2 -9% | 38.5 -22% | 32.1 -2% |
| Load Maximum * (dB) | 31.5 | 35.2 -12% | 38.8 -23% | 34.2 -9% | 44 -40% | 32.9 -4% |
* ... mindre är bättre
(±) Den maximala temperaturen på ovansidan är 41.6 °C / 107 F, jämfört med genomsnittet av 35.4 °C / 96 F , allt från 19.6 till 60 °C för klassen Convertible.
(±) Botten värms upp till maximalt 41.9 °C / 107 F, jämfört med genomsnittet av 36.9 °C / 98 F
(+) Vid tomgångsbruk är medeltemperaturen för ovansidan 24.5 °C / 76 F, jämfört med enhetsgenomsnittet på 30.3 °C / ### class_avg_f### F.
(+) Handledsstöden och pekplattan är kallare än hudtemperaturen med maximalt 25 °C / 77 F och är därför svala att ta på.
(+) Medeltemperaturen för handledsstödsområdet på liknande enheter var 28 °C / 82.4 F (+3 °C / 5.4 F).
| Dell Inspiron 15 5579-9672 UHD Graphics 620, i5-8250U, SK hynix SC311 SATA | Dell Inspiron 15 5578-1777 2-in-1 HD Graphics 620, i5-7200U, SanDisk X400 256GB, SATA (SD8SB8U-256G) | HP Envy x360 15-bq102ng Vega 8, R5 2500U, Samsung PM961 MZVLW256HEHP | Asus VivoBook Flip 15 TP510UA-E8073T UHD Graphics 620, i5-8250U, SanDisk SD8SN8U128G1002 | Acer Spin 3 SP314-51-548L UHD Graphics 620, i5-8250U, Micron 1100 MTFDDAV256TBN | Lenovo ThinkPad L380 Yoga-20M7001BGE UHD Graphics 620, i5-8250U, Samsung PM961 MZVLW256HEHP | |
|---|---|---|---|---|---|---|
| Heat | 0% | -11% | 7% | -3% | -5% | |
| Maximum Upper Side * (°C) | 41.6 | 37.3 10% | 38 9% | 36 13% | 44.1 -6% | 45 -8% |
| Maximum Bottom * (°C) | 41.9 | 43.3 -3% | 37.1 11% | 37 12% | 41.6 1% | 44.5 -6% |
| Idle Upper Side * (°C) | 26.1 | 26.8 -3% | 38.6 -48% | 25.6 2% | 25.6 2% | |
| Idle Bottom * (°C) | 25.7 | 26.6 -4% | 29.2 -14% | 25.7 -0% | 27.7 -8% |
* ... mindre är bättre
Dell Inspiron 15 5579-9672 ljudanalys
(±) | högtalarljudstyrkan är genomsnittlig men bra (72.5 dB)
Bas 100 - 315 Hz
(-) | nästan ingen bas - i genomsnitt 20.7% lägre än medianen
(±) | linjäriteten för basen är genomsnittlig (11.9% delta till föregående frekvens)
Mellan 400 - 2000 Hz
(±) | högre mellan - i genomsnitt 7.8% högre än median
(±) | linjäriteten för mids är genomsnittlig (11.2% delta till föregående frekvens)
Högsta 2 - 16 kHz
(±) | högre toppar - i genomsnitt 5.1% högre än medianen
(+) | toppar är linjära (5.7% delta till föregående frekvens)
Totalt 100 - 16 000 Hz
(±) | linjäriteten för det totala ljudet är genomsnittlig (25.6% skillnad mot median)
Jämfört med samma klass
» 78% av alla testade enheter i den här klassen var bättre, 5% liknande, 17% sämre
» Den bästa hade ett delta på 6%, genomsnittet var 20%, sämst var 57%
Jämfört med alla testade enheter
» 79% av alla testade enheter var bättre, 4% liknande, 17% sämre
» Den bästa hade ett delta på 4%, genomsnittet var 23%, sämst var 134%
Lenovo ThinkPad L380 Yoga-20M7001BGE ljudanalys
(-) | inte särskilt höga högtalare (66.7 dB)
Bas 100 - 315 Hz
(-) | nästan ingen bas - i genomsnitt 17.5% lägre än medianen
(±) | linjäriteten för basen är genomsnittlig (13.8% delta till föregående frekvens)
Mellan 400 - 2000 Hz
(+) | balanserad mellan - endast 2.9% från medianen
(+) | mids är linjära (5.1% delta till föregående frekvens)
Högsta 2 - 16 kHz
(+) | balanserade toppar - endast 2.4% från medianen
(±) | linjäriteten för toppar är genomsnittlig (8.7% delta till föregående frekvens)
Totalt 100 - 16 000 Hz
(±) | linjäriteten för det totala ljudet är genomsnittlig (17.3% skillnad mot median)
Jämfört med samma klass
» 33% av alla testade enheter i den här klassen var bättre, 8% liknande, 59% sämre
» Den bästa hade ett delta på 6%, genomsnittet var 20%, sämst var 57%
Jämfört med alla testade enheter
» 32% av alla testade enheter var bättre, 8% liknande, 59% sämre
» Den bästa hade ett delta på 4%, genomsnittet var 23%, sämst var 134%
| Av/Standby | |
| Låg belastning | |
| Hög belastning |
|
Förklaring:
min: | |
| Dell Inspiron 15 5579-9672 i5-8250U, UHD Graphics 620, SK hynix SC311 SATA, IPS, 1920x1080, 15.6" | Dell Inspiron 15 5578-1777 2-in-1 i5-7200U, HD Graphics 620, SanDisk X400 256GB, SATA (SD8SB8U-256G), IPS, 1920x1080, 15.6" | HP Envy x360 15-bq102ng R5 2500U, Vega 8, Samsung PM961 MZVLW256HEHP, IPS, 1920x1080, 15.6" | Asus VivoBook Flip 15 TP510UA-E8073T i5-8250U, UHD Graphics 620, SanDisk SD8SN8U128G1002, IPS, 1920x1080, 15.6" | Acer Spin 3 SP314-51-548L i5-8250U, UHD Graphics 620, Micron 1100 MTFDDAV256TBN, IPS, 1920x1080, 14" | Lenovo ThinkPad L380 Yoga-20M7001BGE i5-8250U, UHD Graphics 620, Samsung PM961 MZVLW256HEHP, IPS LED, 1920x1080, 13.3" | Genomsnitt Intel UHD Graphics 620 | Genomsnitt av klass Convertible | |
|---|---|---|---|---|---|---|---|---|
| Power Consumption | -5% | -20% | -7% | 21% | 6% | -11% | -30% | |
| Idle Minimum * (Watt) | 3.9 | 4.3 -10% | 4.8 -23% | 3.9 -0% | 2.9 26% | 3.44 12% | 3.81 ? 2% | 4.2 ? -8% |
| Idle Average * (Watt) | 6.6 | 7.6 -15% | 7 -6% | 7.2 -9% | 5.2 21% | 6.9 -5% | 6.94 ? -5% | 6.89 ? -4% |
| Idle Maximum * (Watt) | 9.3 | 9.8 -5% | 9.5 -2% | 9.5 -2% | 5.4 42% | 9.2 1% | 8.75 ? 6% | 8.63 ? 7% |
| Load Average * (Watt) | 30.2 | 32.6 -8% | 40.8 -35% | 36.8 -22% | 29.4 3% | 27.6 9% | 35 ? -16% | 44.1 ? -46% |
| Load Maximum * (Watt) | 33.2 | 28.4 14% | 44.3 -33% | 33.1 -0% | 29.6 11% | 29 13% | 47.5 ? -43% | 66.5 ? -100% |
* ... mindre är bättre

| Dell Inspiron 15 5579-9672 i5-8250U, UHD Graphics 620, 42 Wh | Dell Inspiron 15 5578-1777 2-in-1 i5-7200U, HD Graphics 620, 42 Wh | HP Envy x360 15-bq102ng R5 2500U, Vega 8, 55.8 Wh | Asus VivoBook Flip 15 TP510UA-E8073T i5-8250U, UHD Graphics 620, 42 Wh | Acer Spin 3 SP314-51-548L i5-8250U, UHD Graphics 620, 52.5 Wh | Lenovo ThinkPad L380 Yoga-20M7001BGE i5-8250U, UHD Graphics 620, 45 Wh | |
|---|---|---|---|---|---|---|
| Batteridrifttid | -10% | -3% | -18% | 14% | 10% | |
| Reader / Idle (h) | 11.2 | 13.9 24% | ||||
| H.264 (h) | 6.7 | 8.5 27% | ||||
| WiFi v1.3 (h) | 7.3 | 6.6 -10% | 7.1 -3% | 6 -18% | 8.3 14% | 7 -4% |
| Load (h) | 1.8 | 1.7 -6% |
För
Emot

Läs den fullständiga versionen av den här recensionen på engelska här.
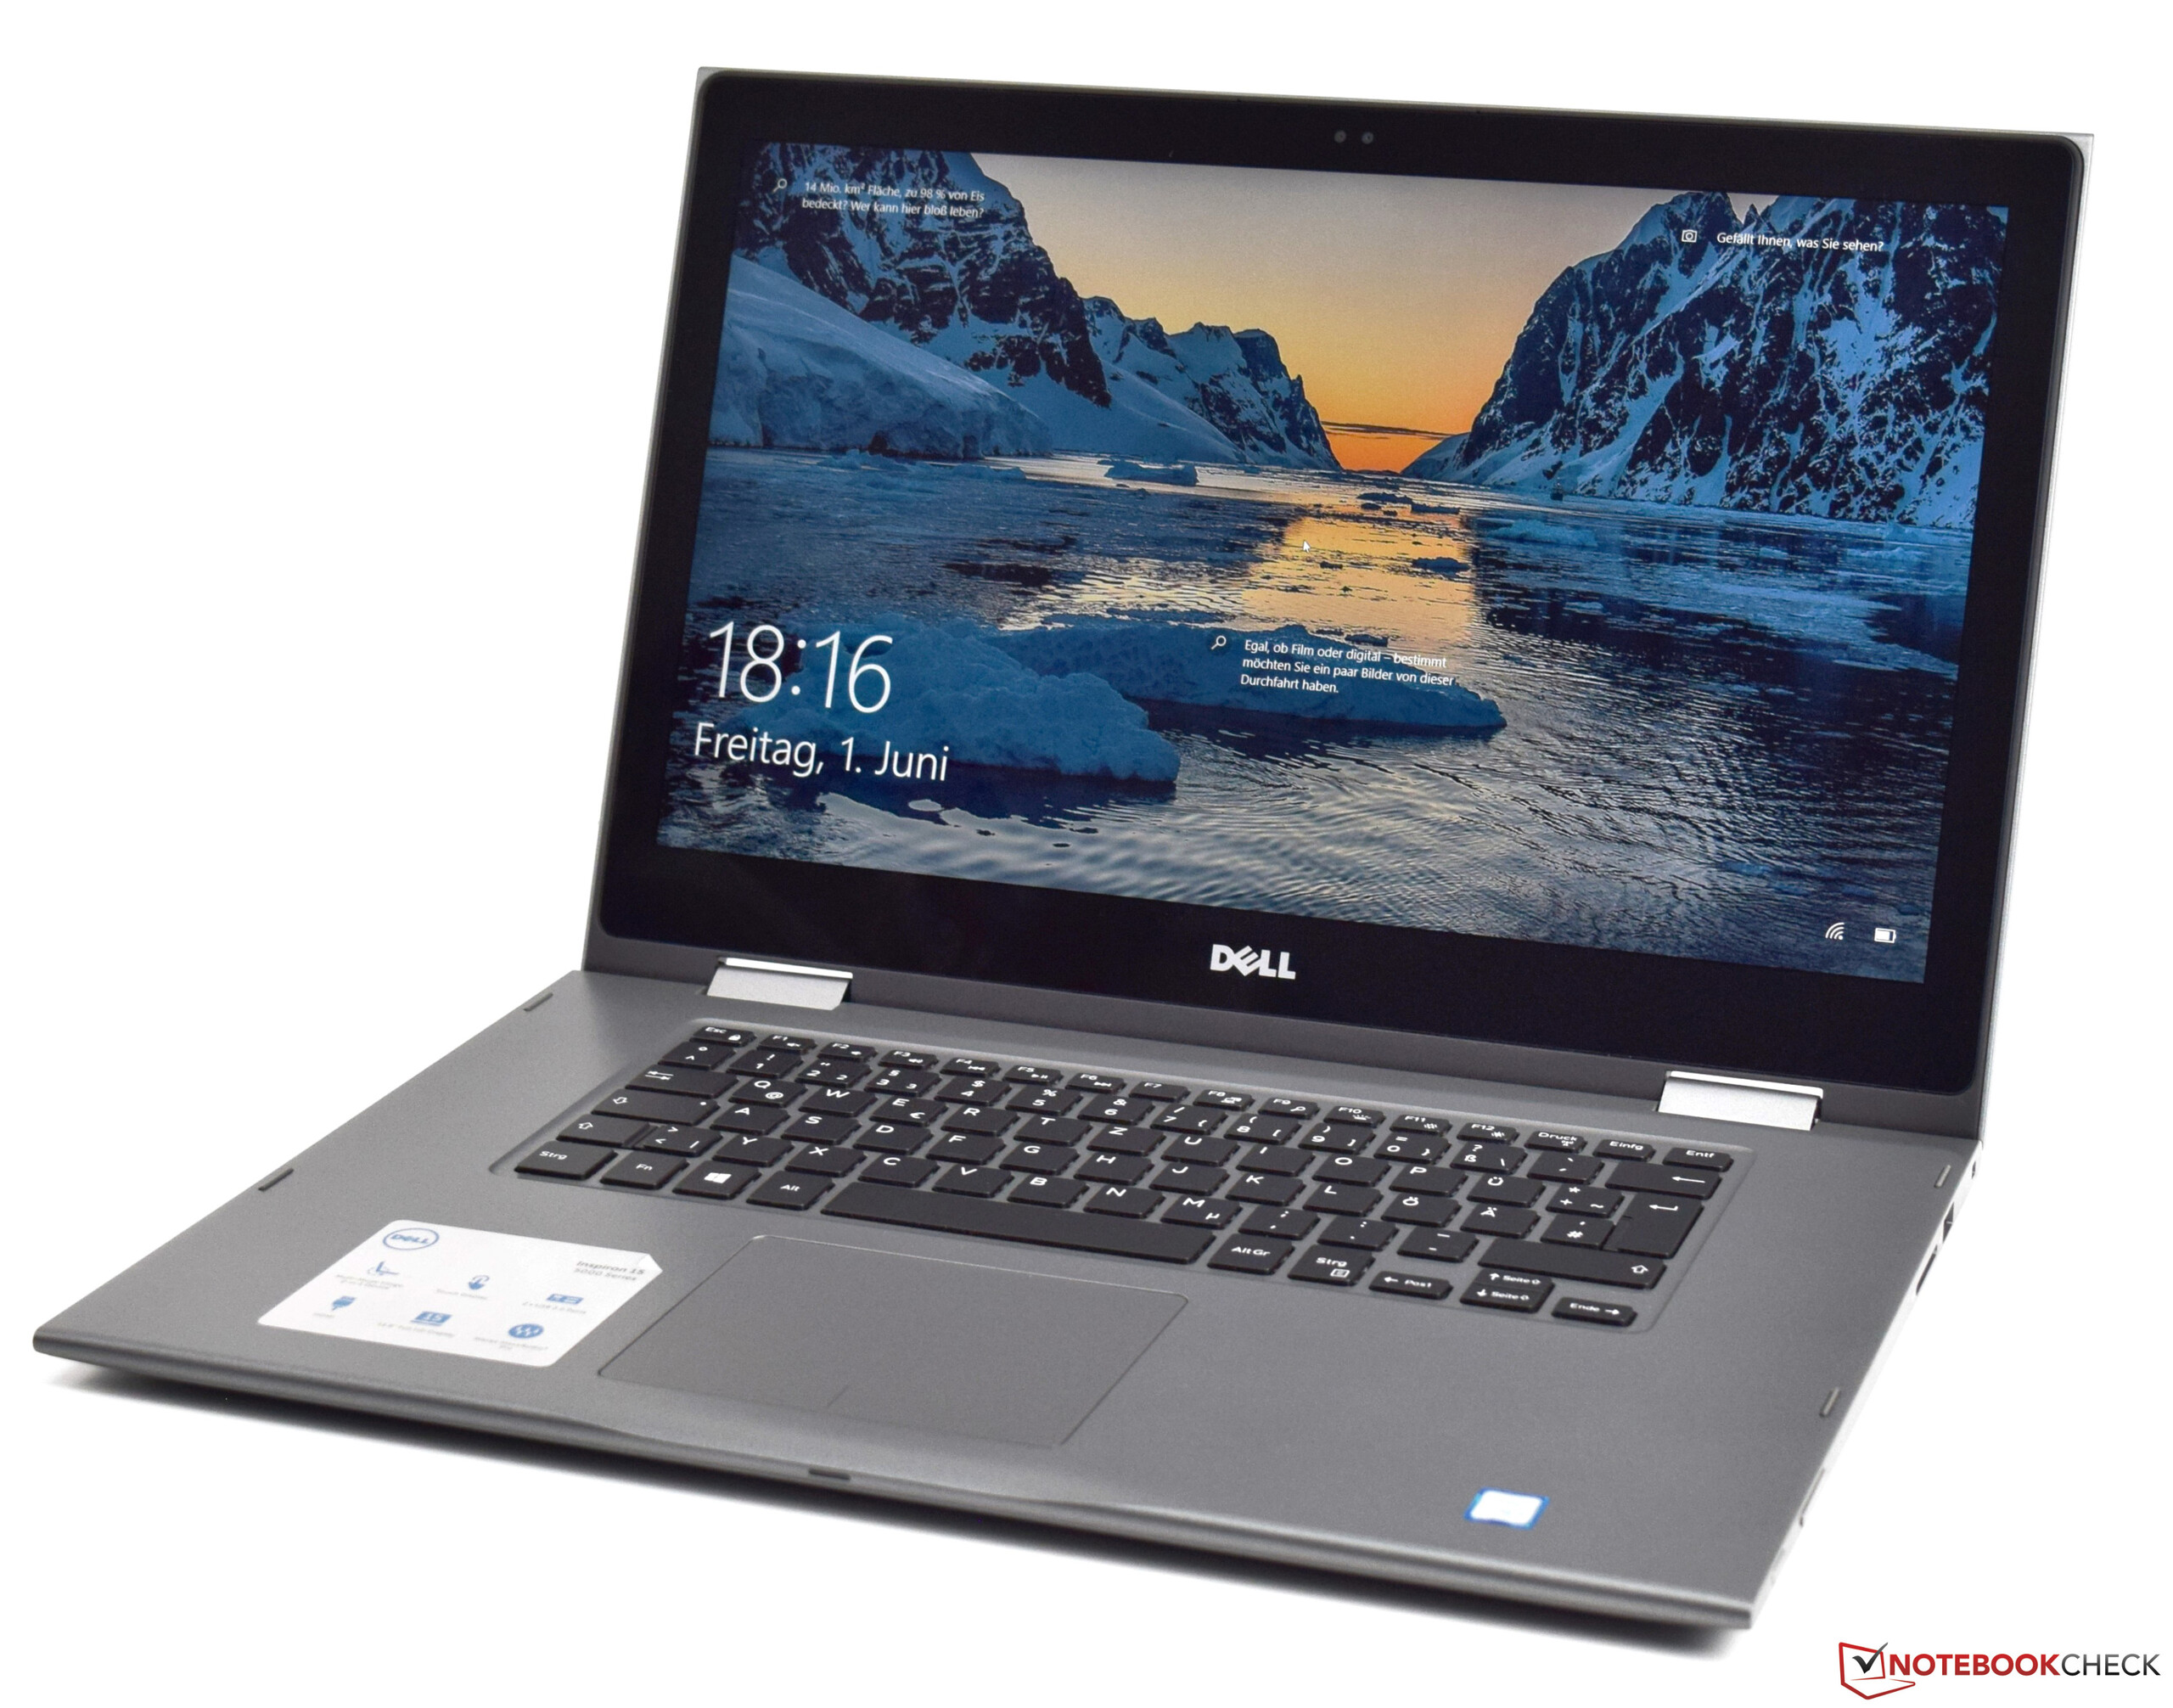
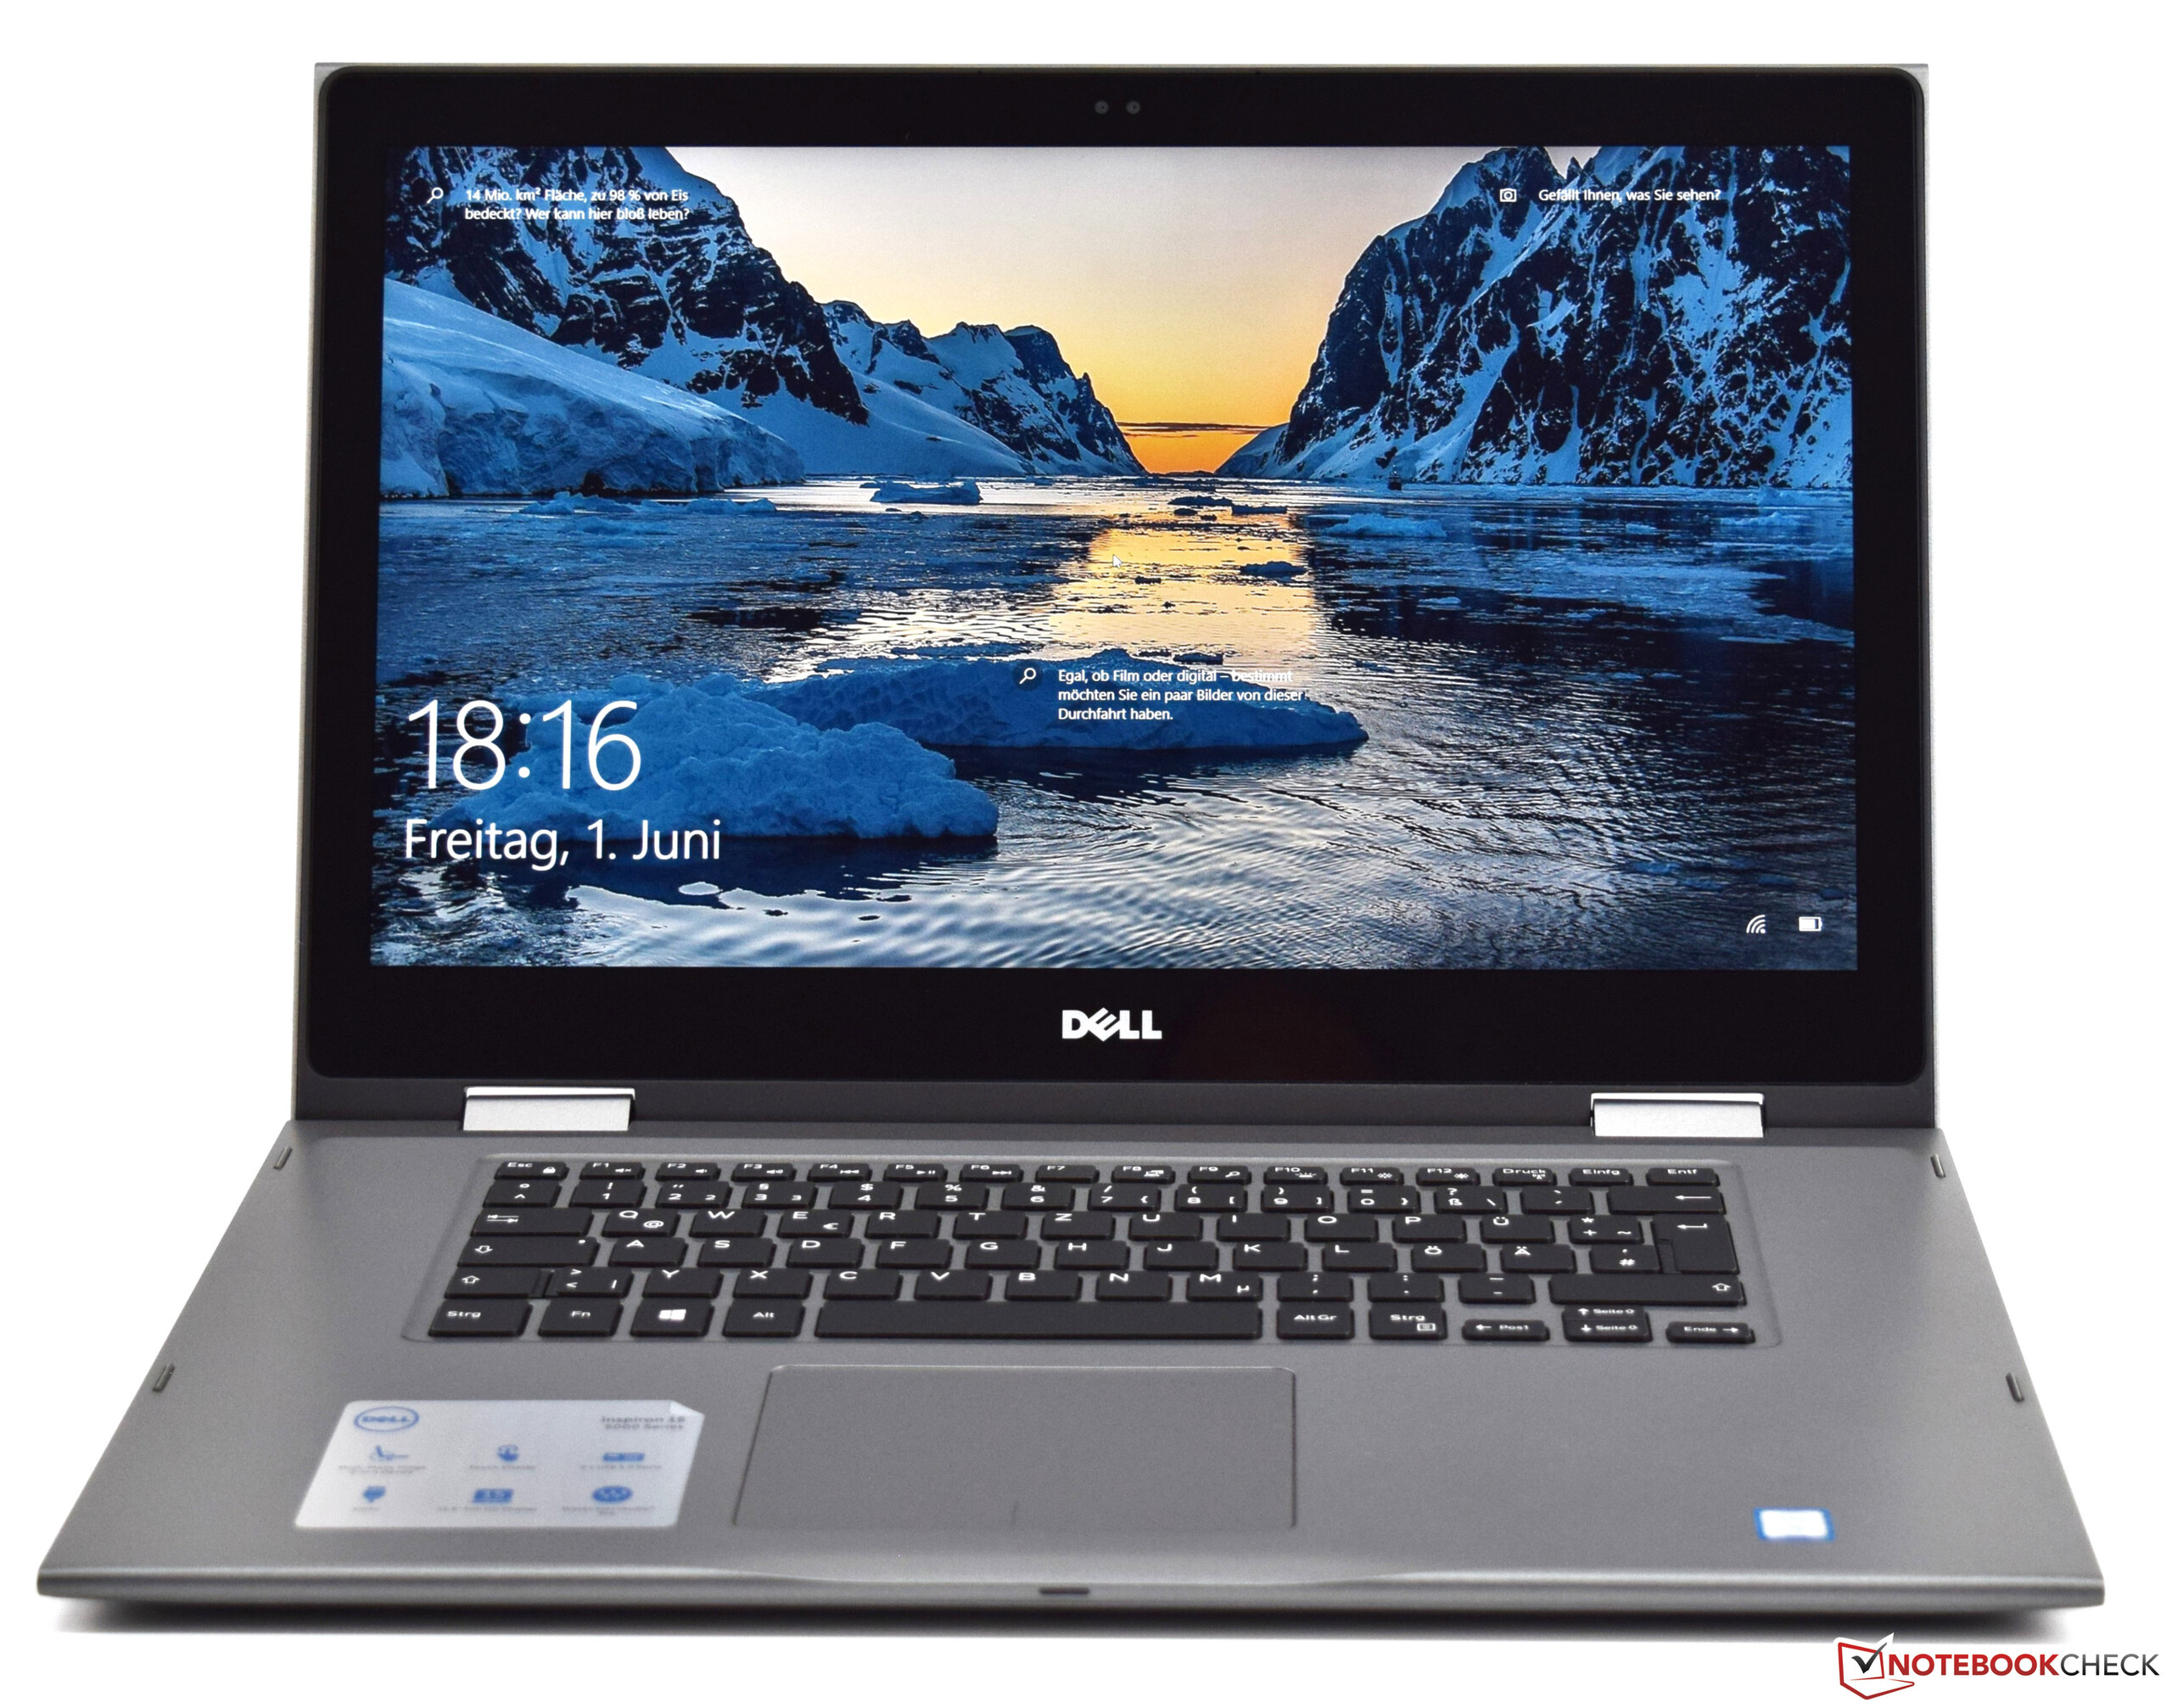
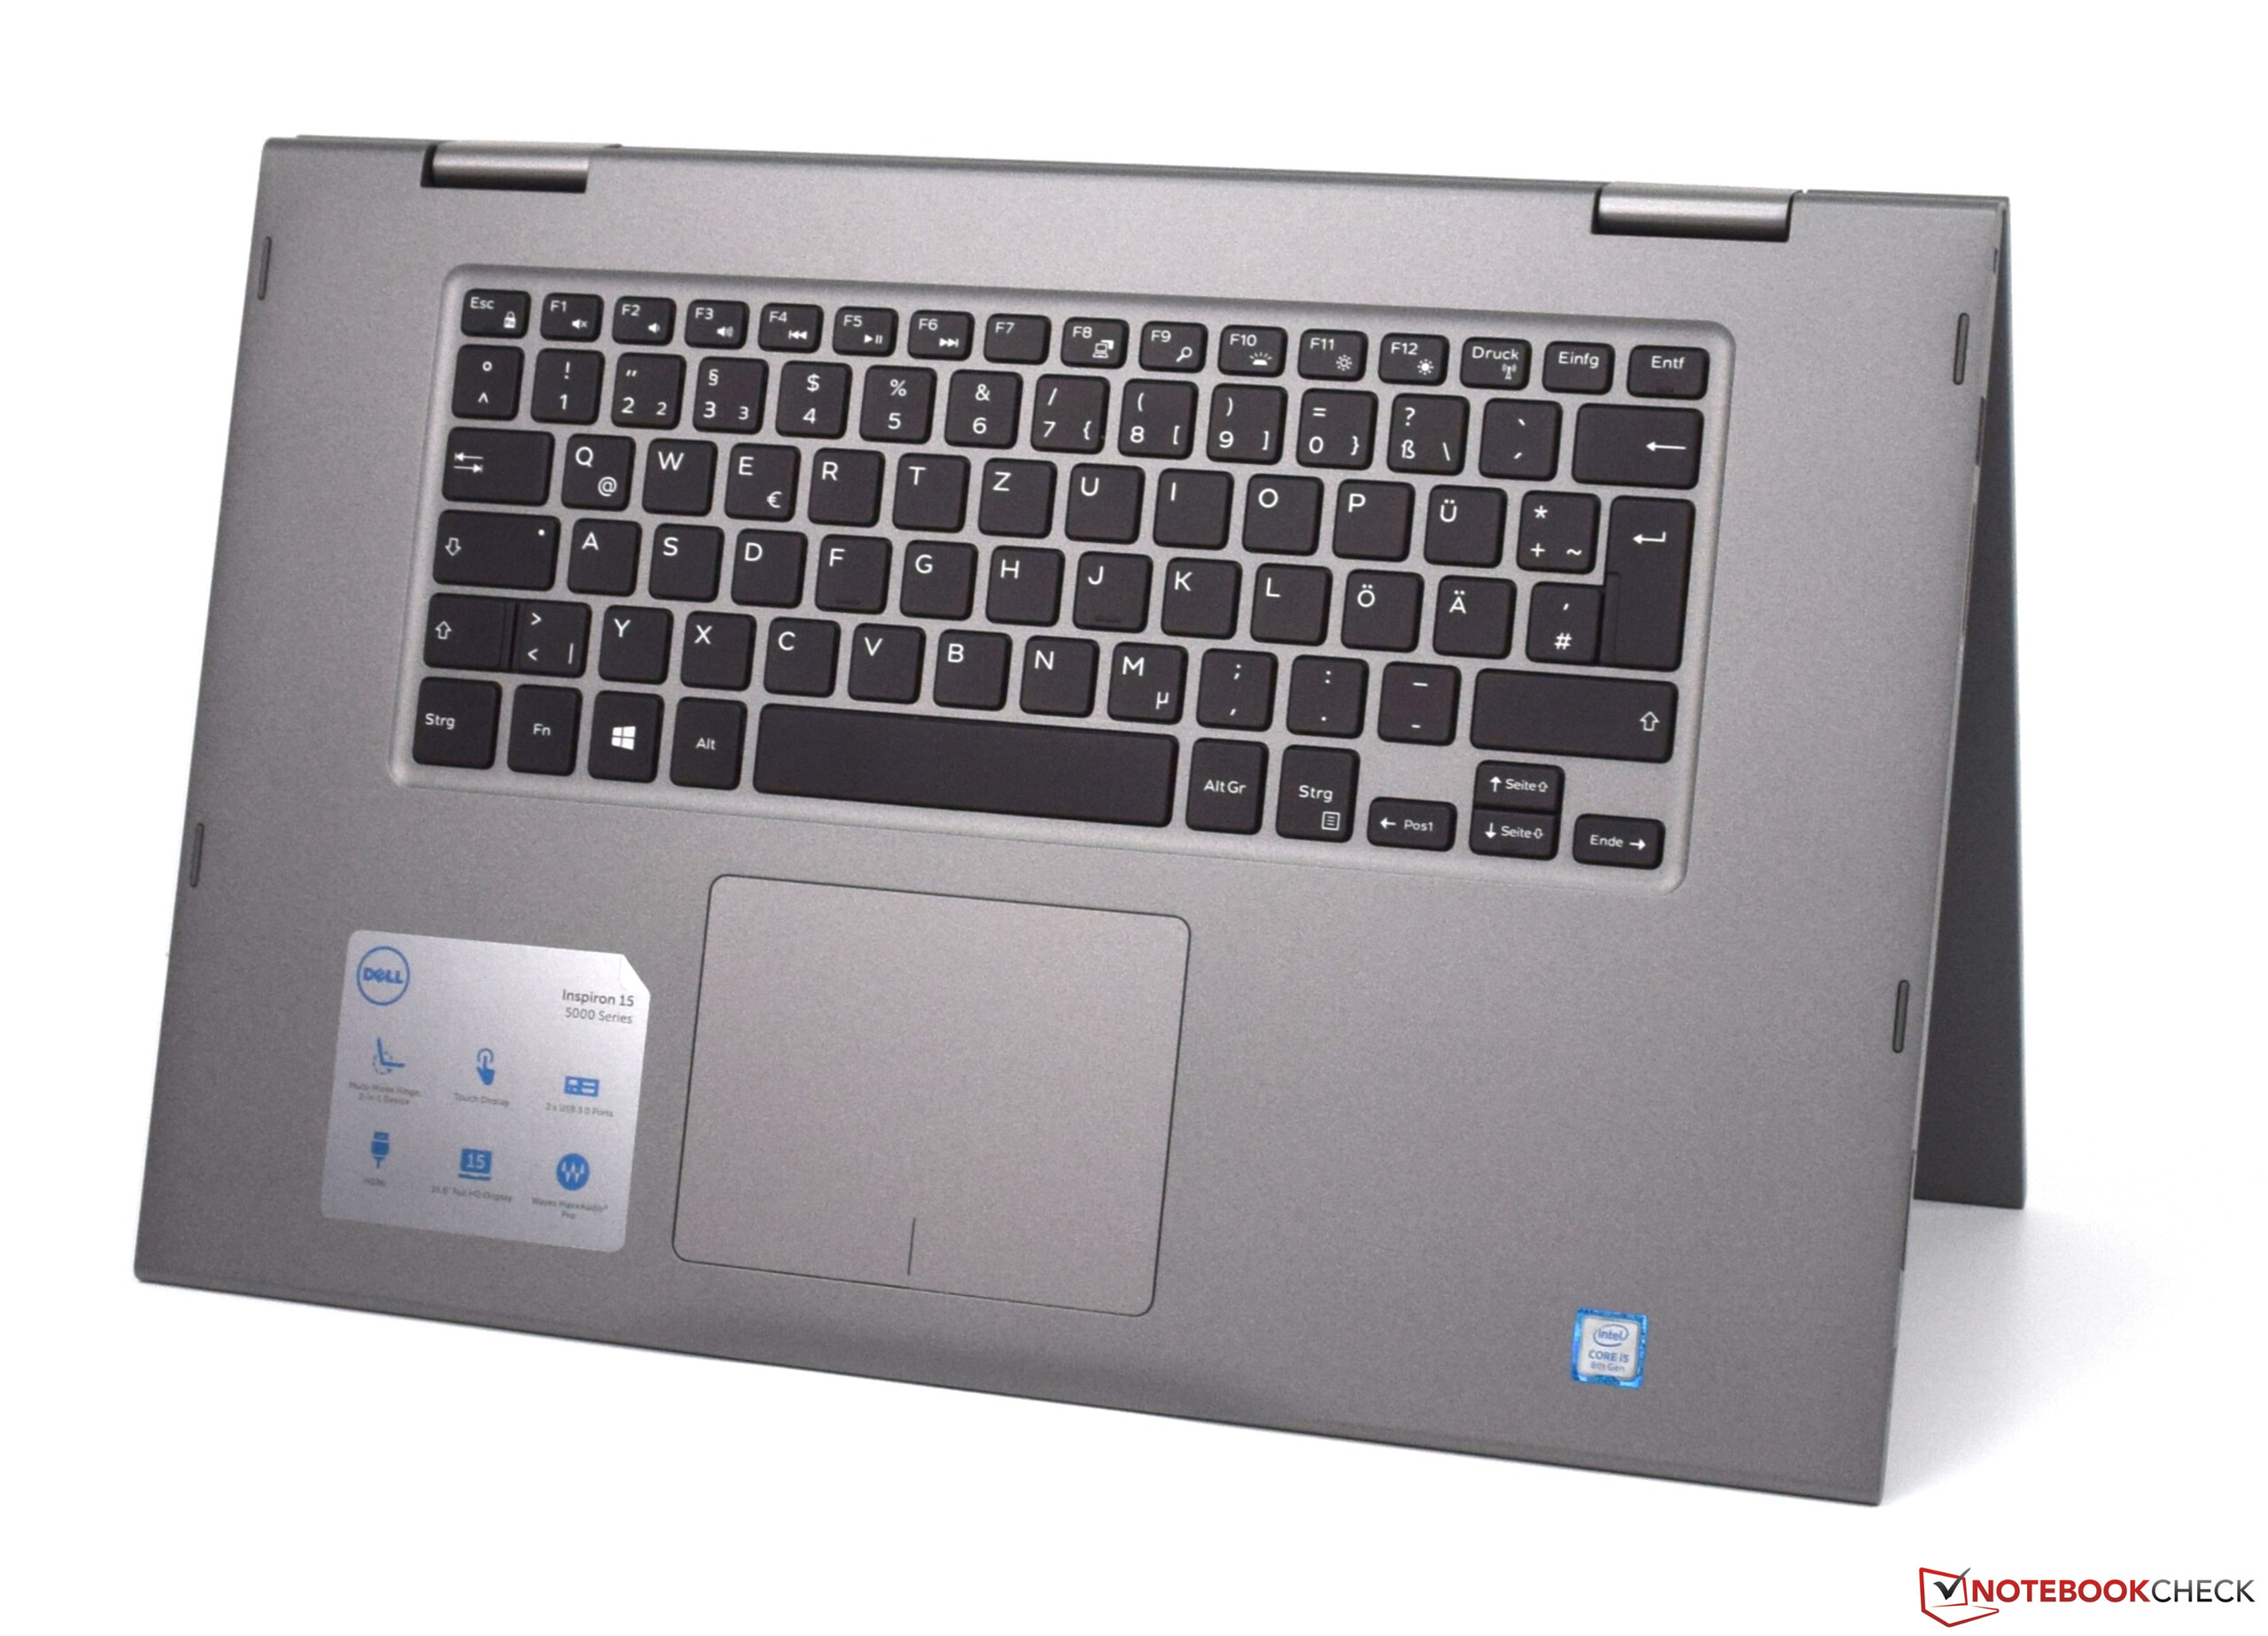
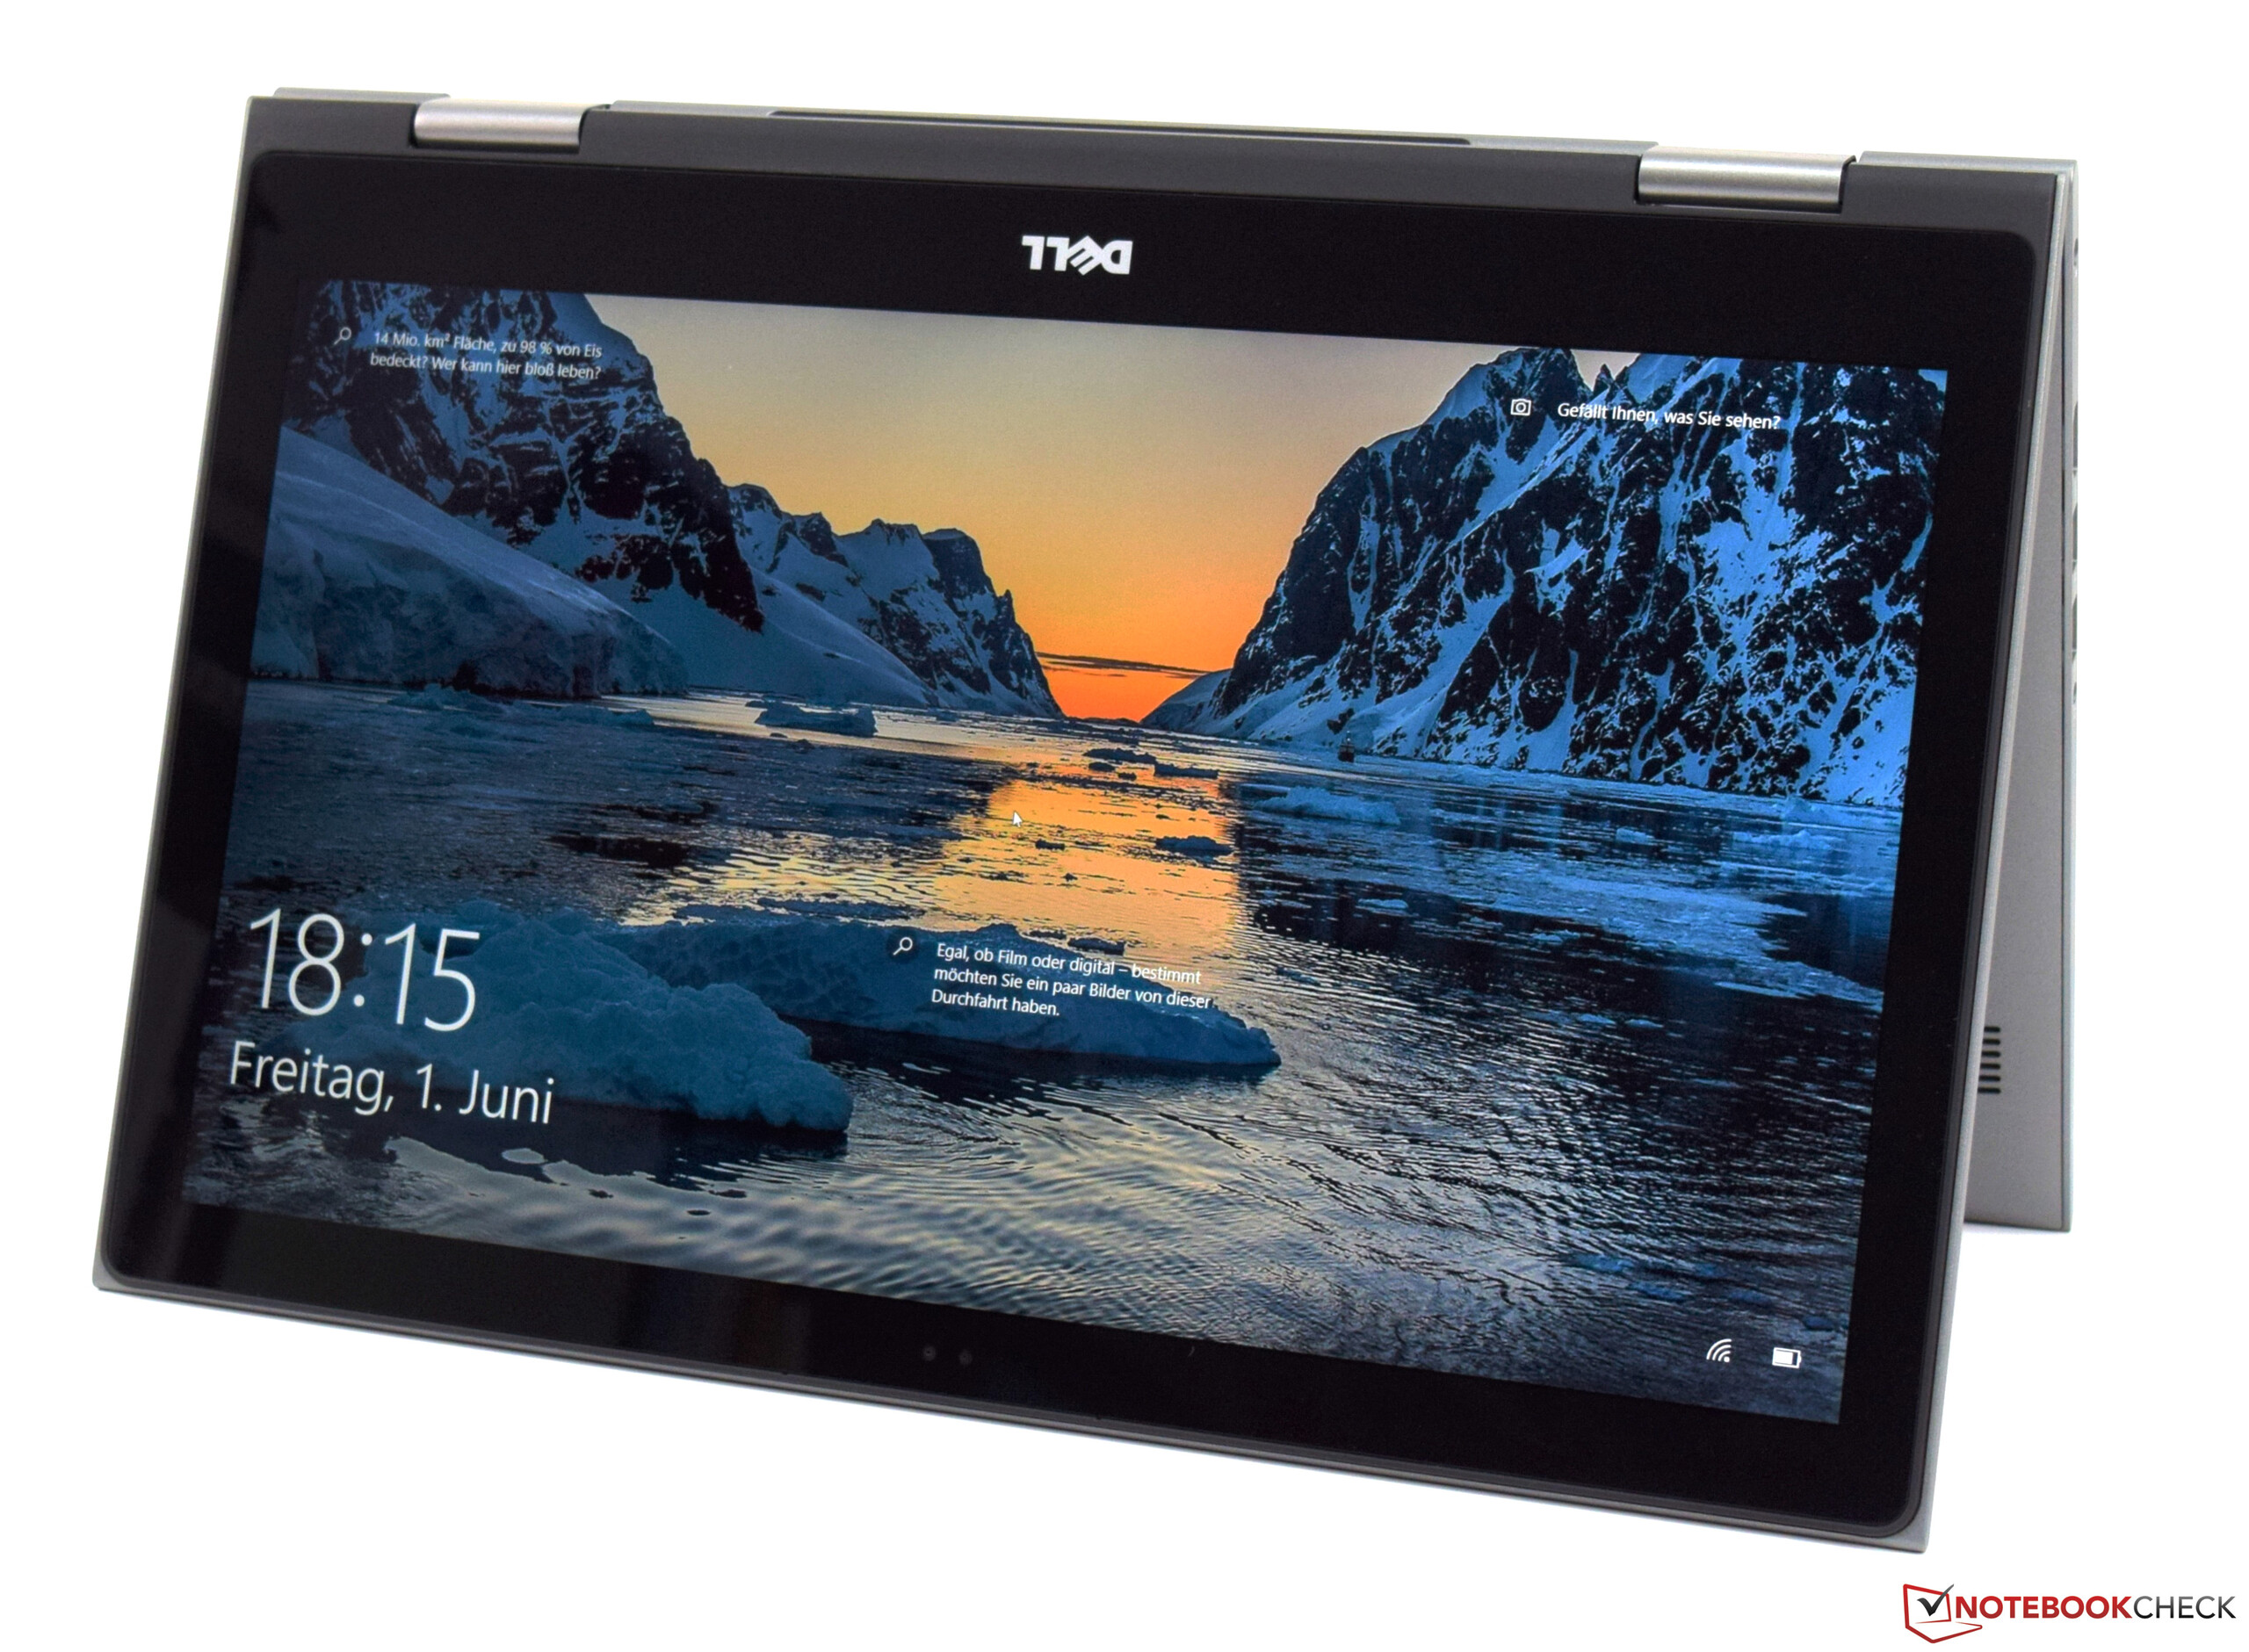
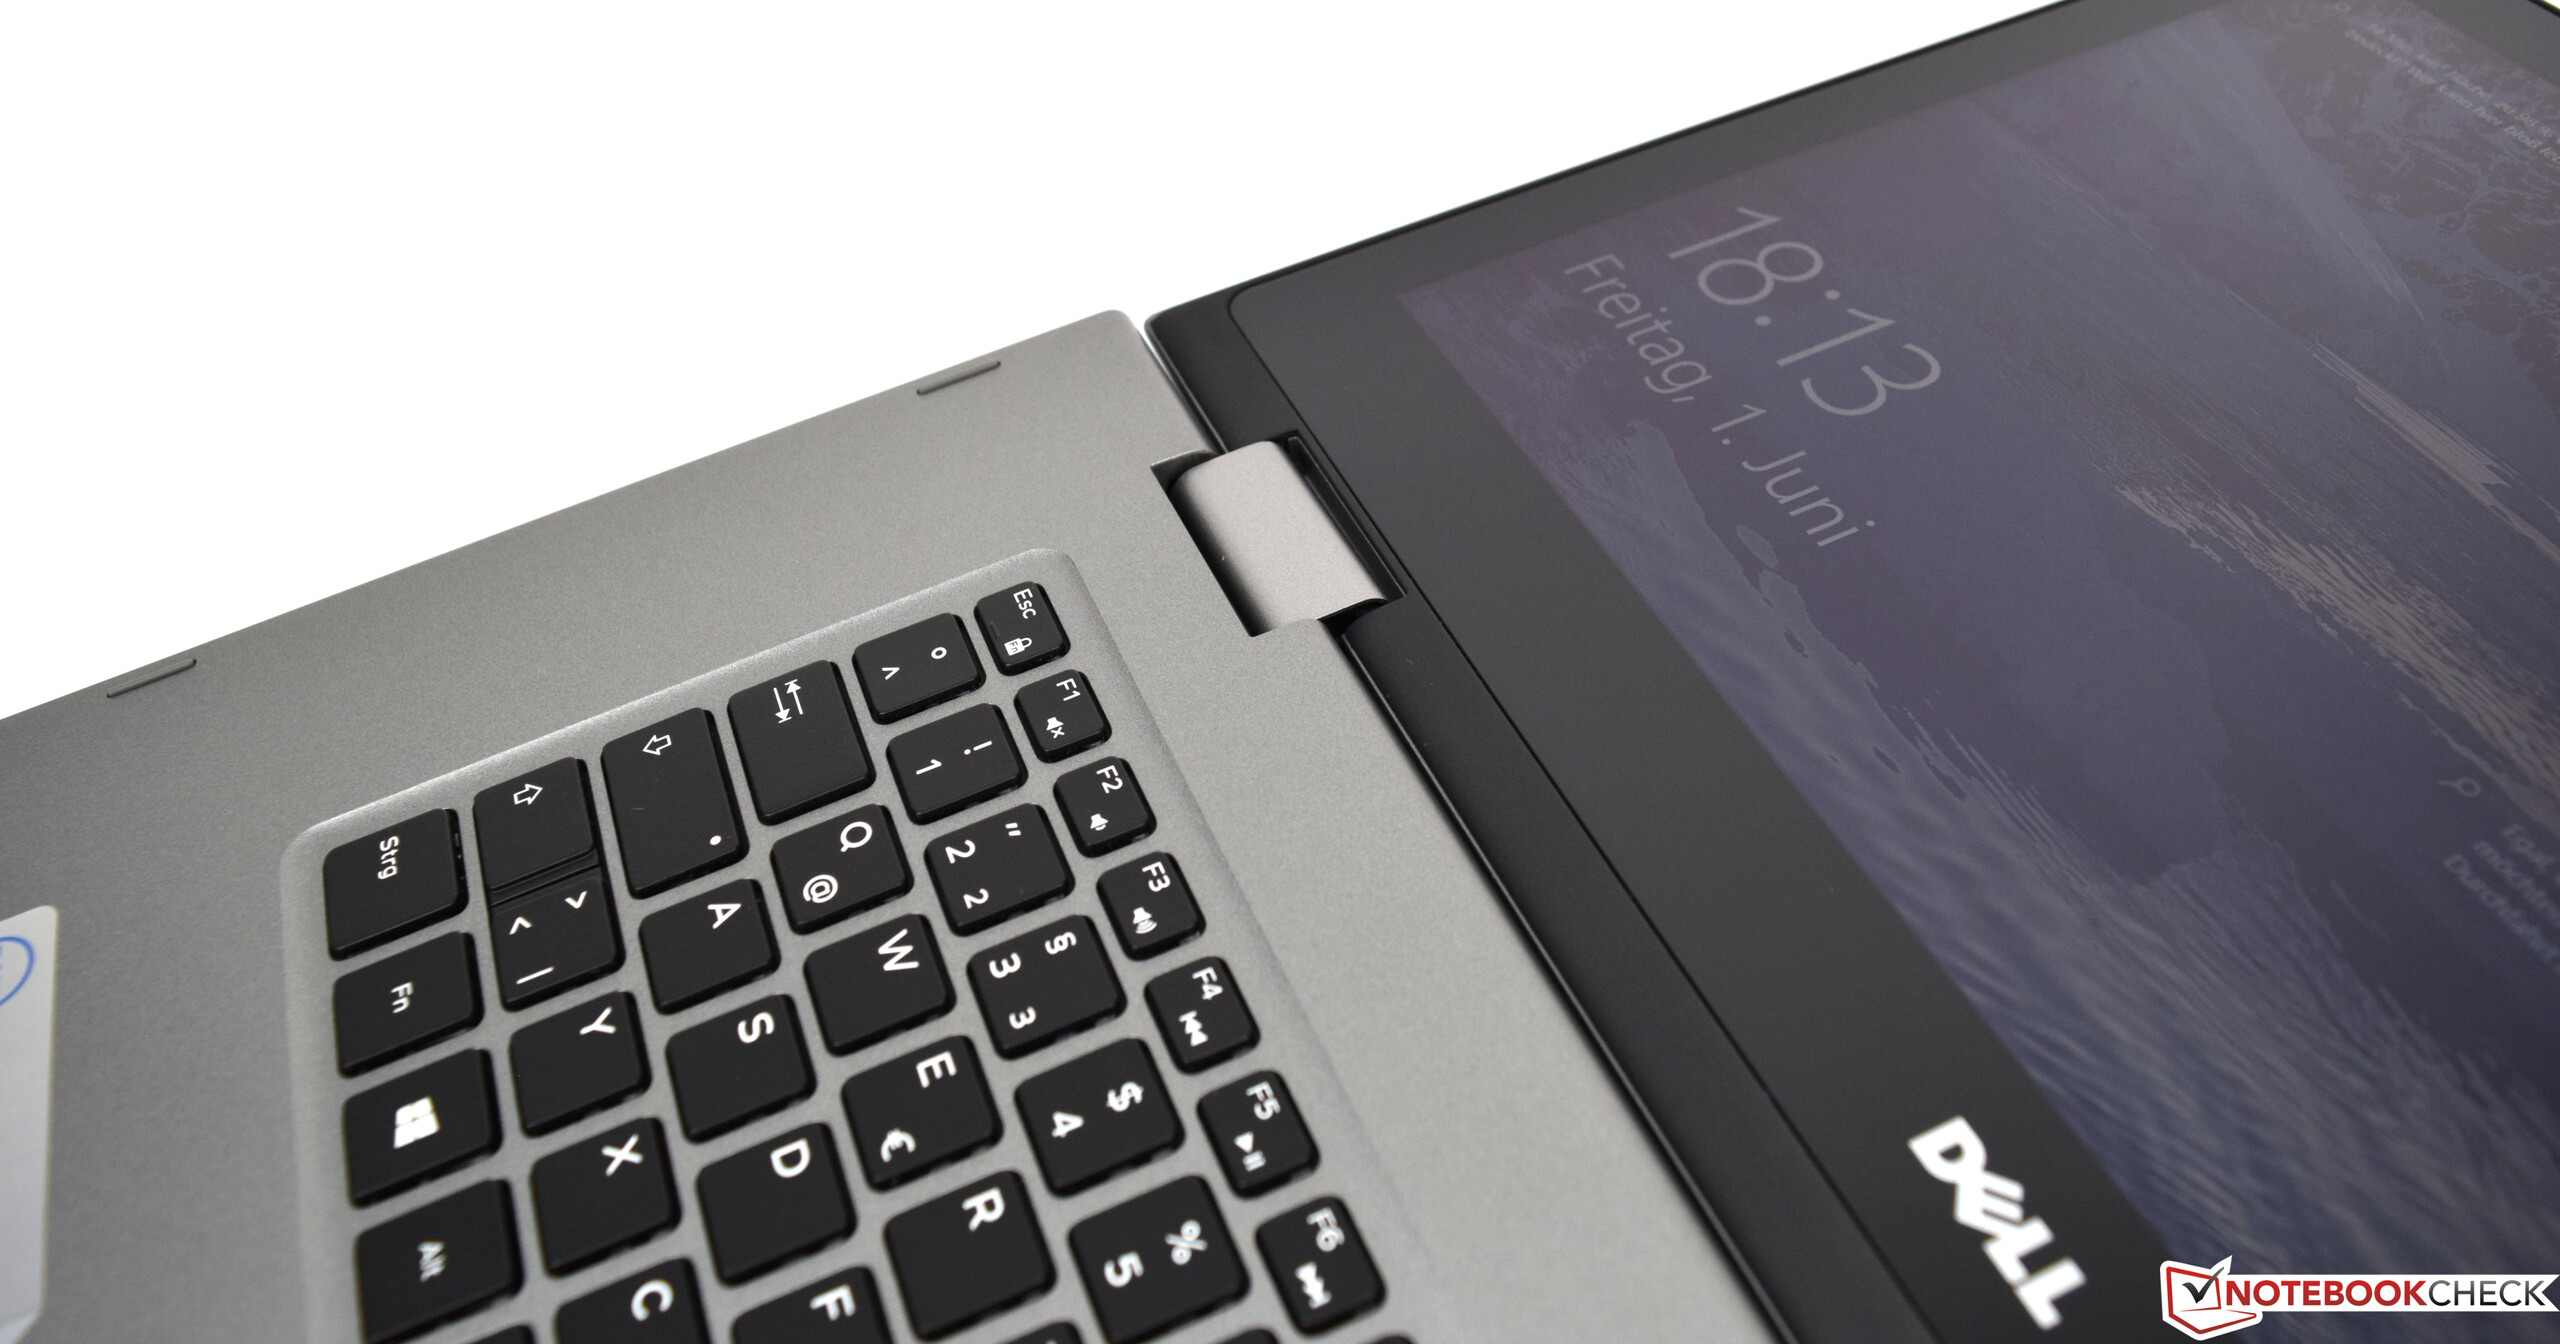
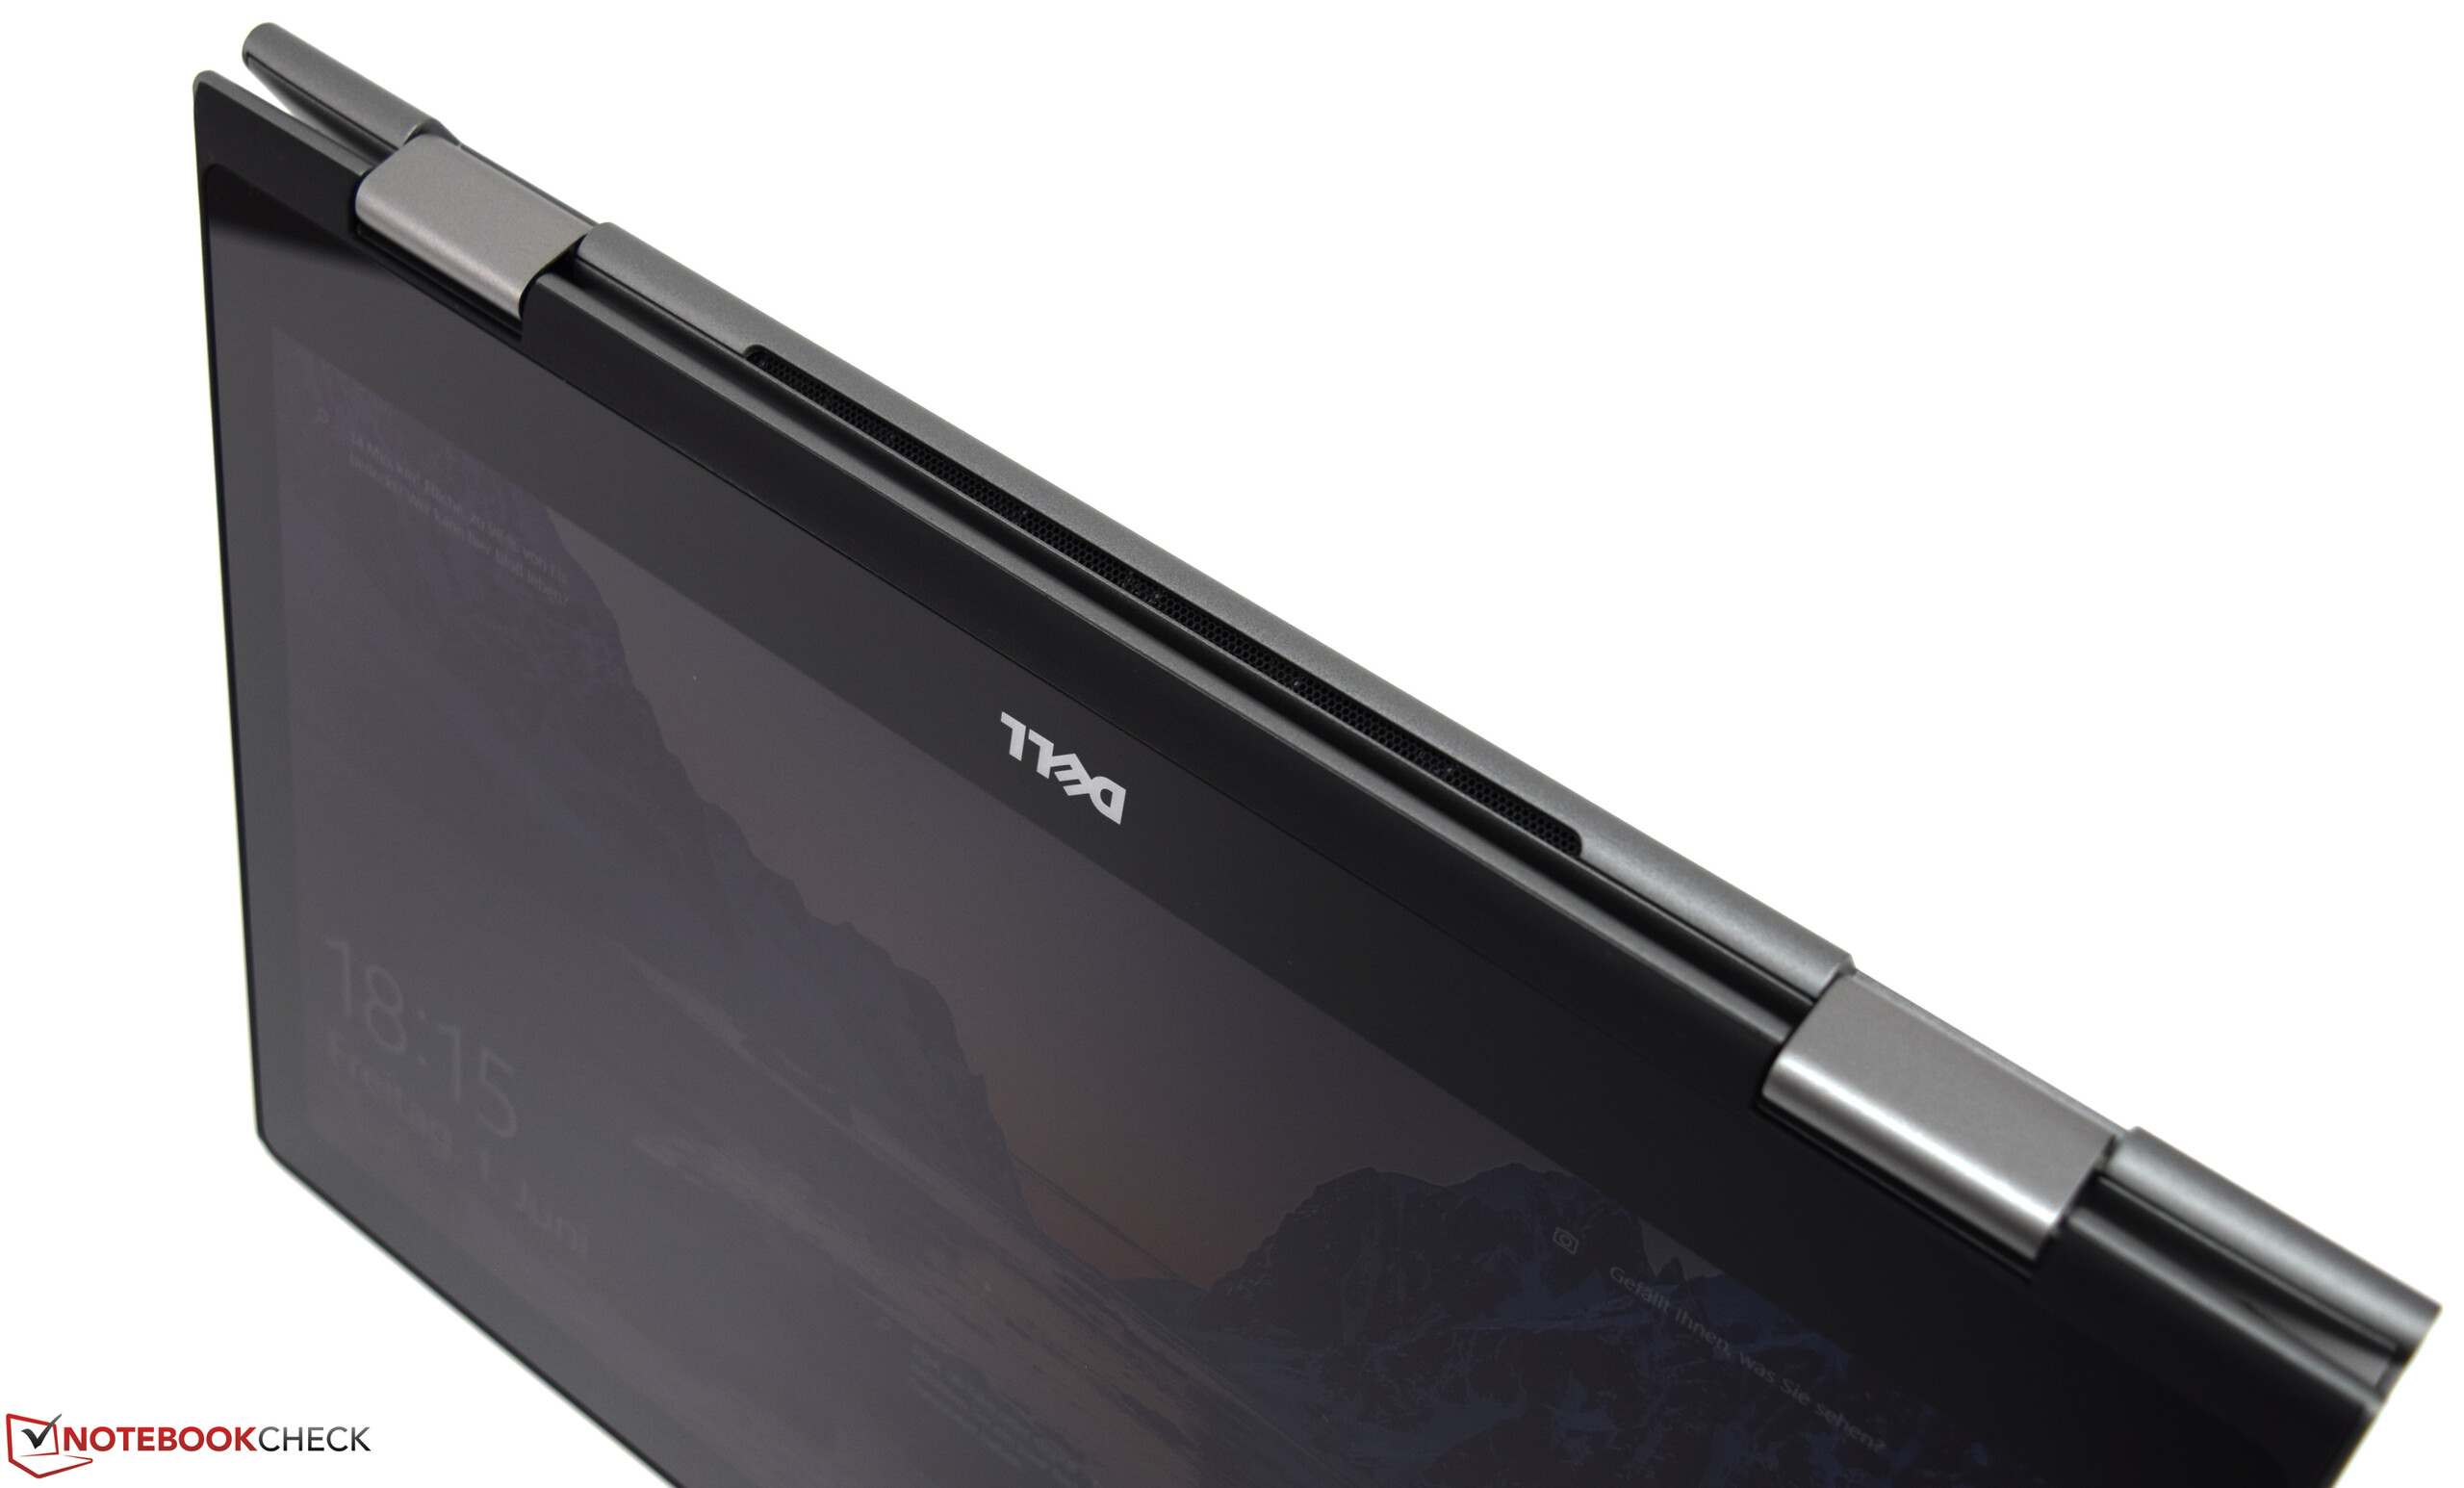
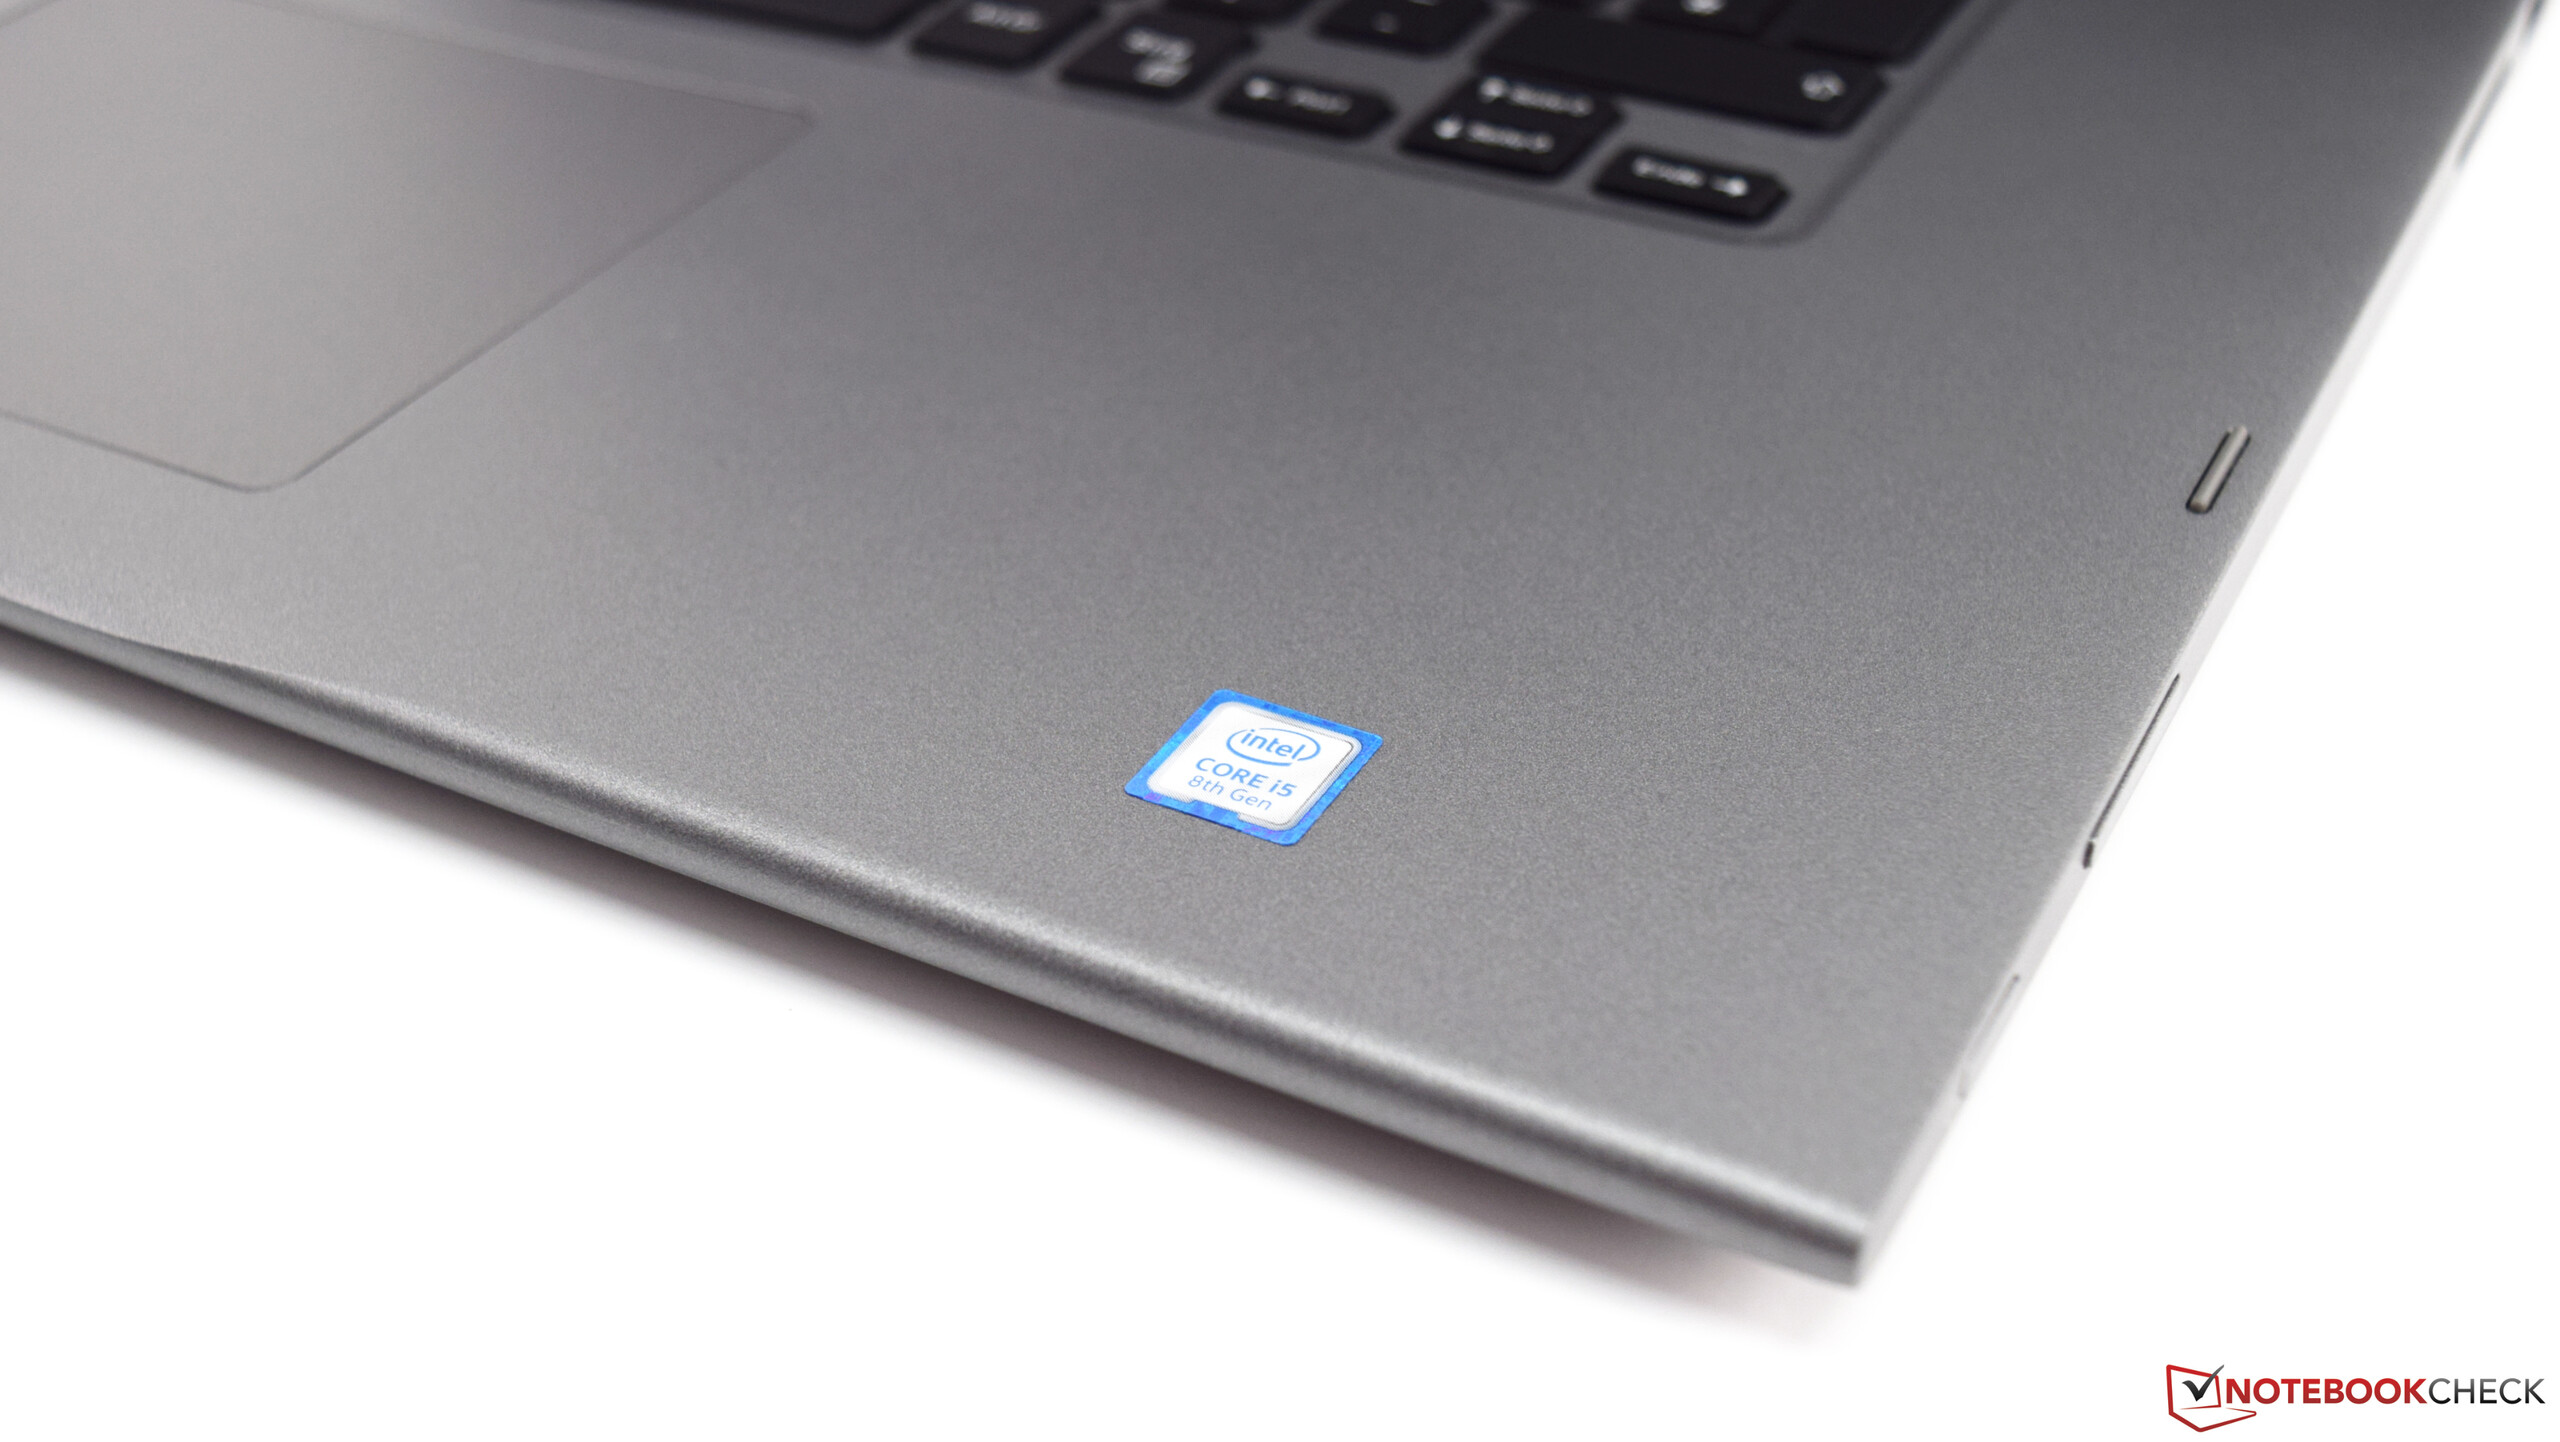
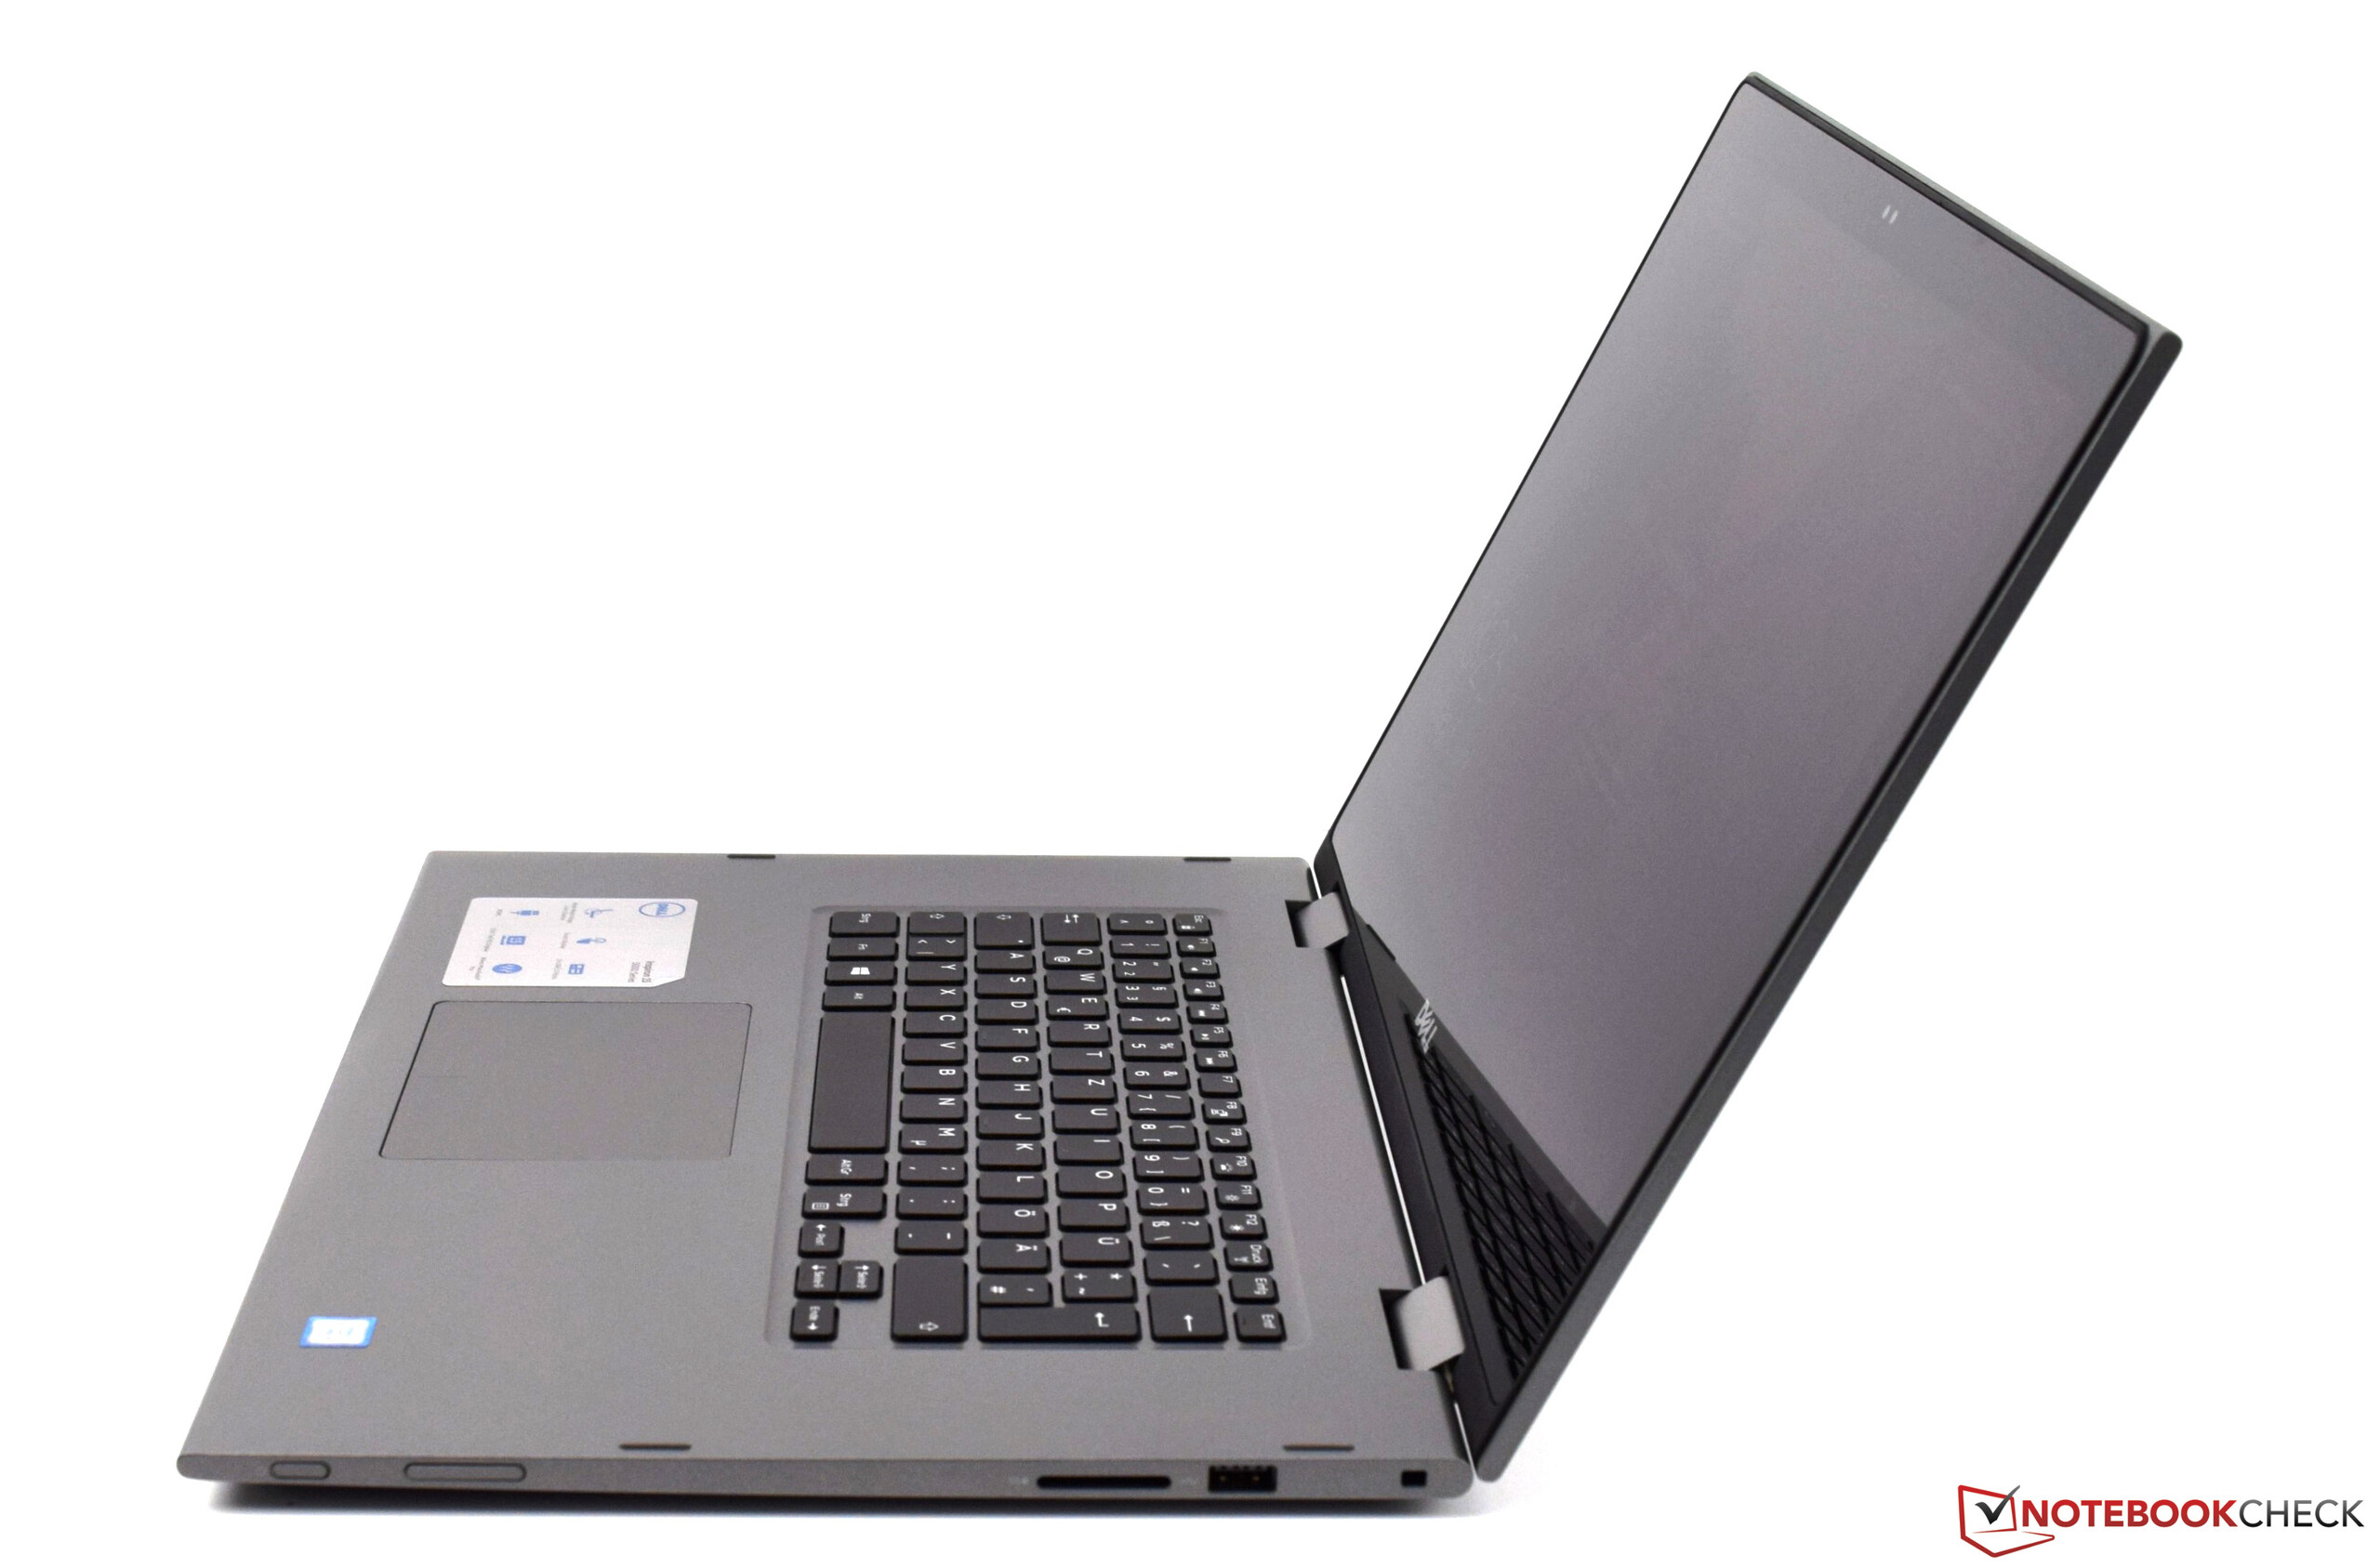
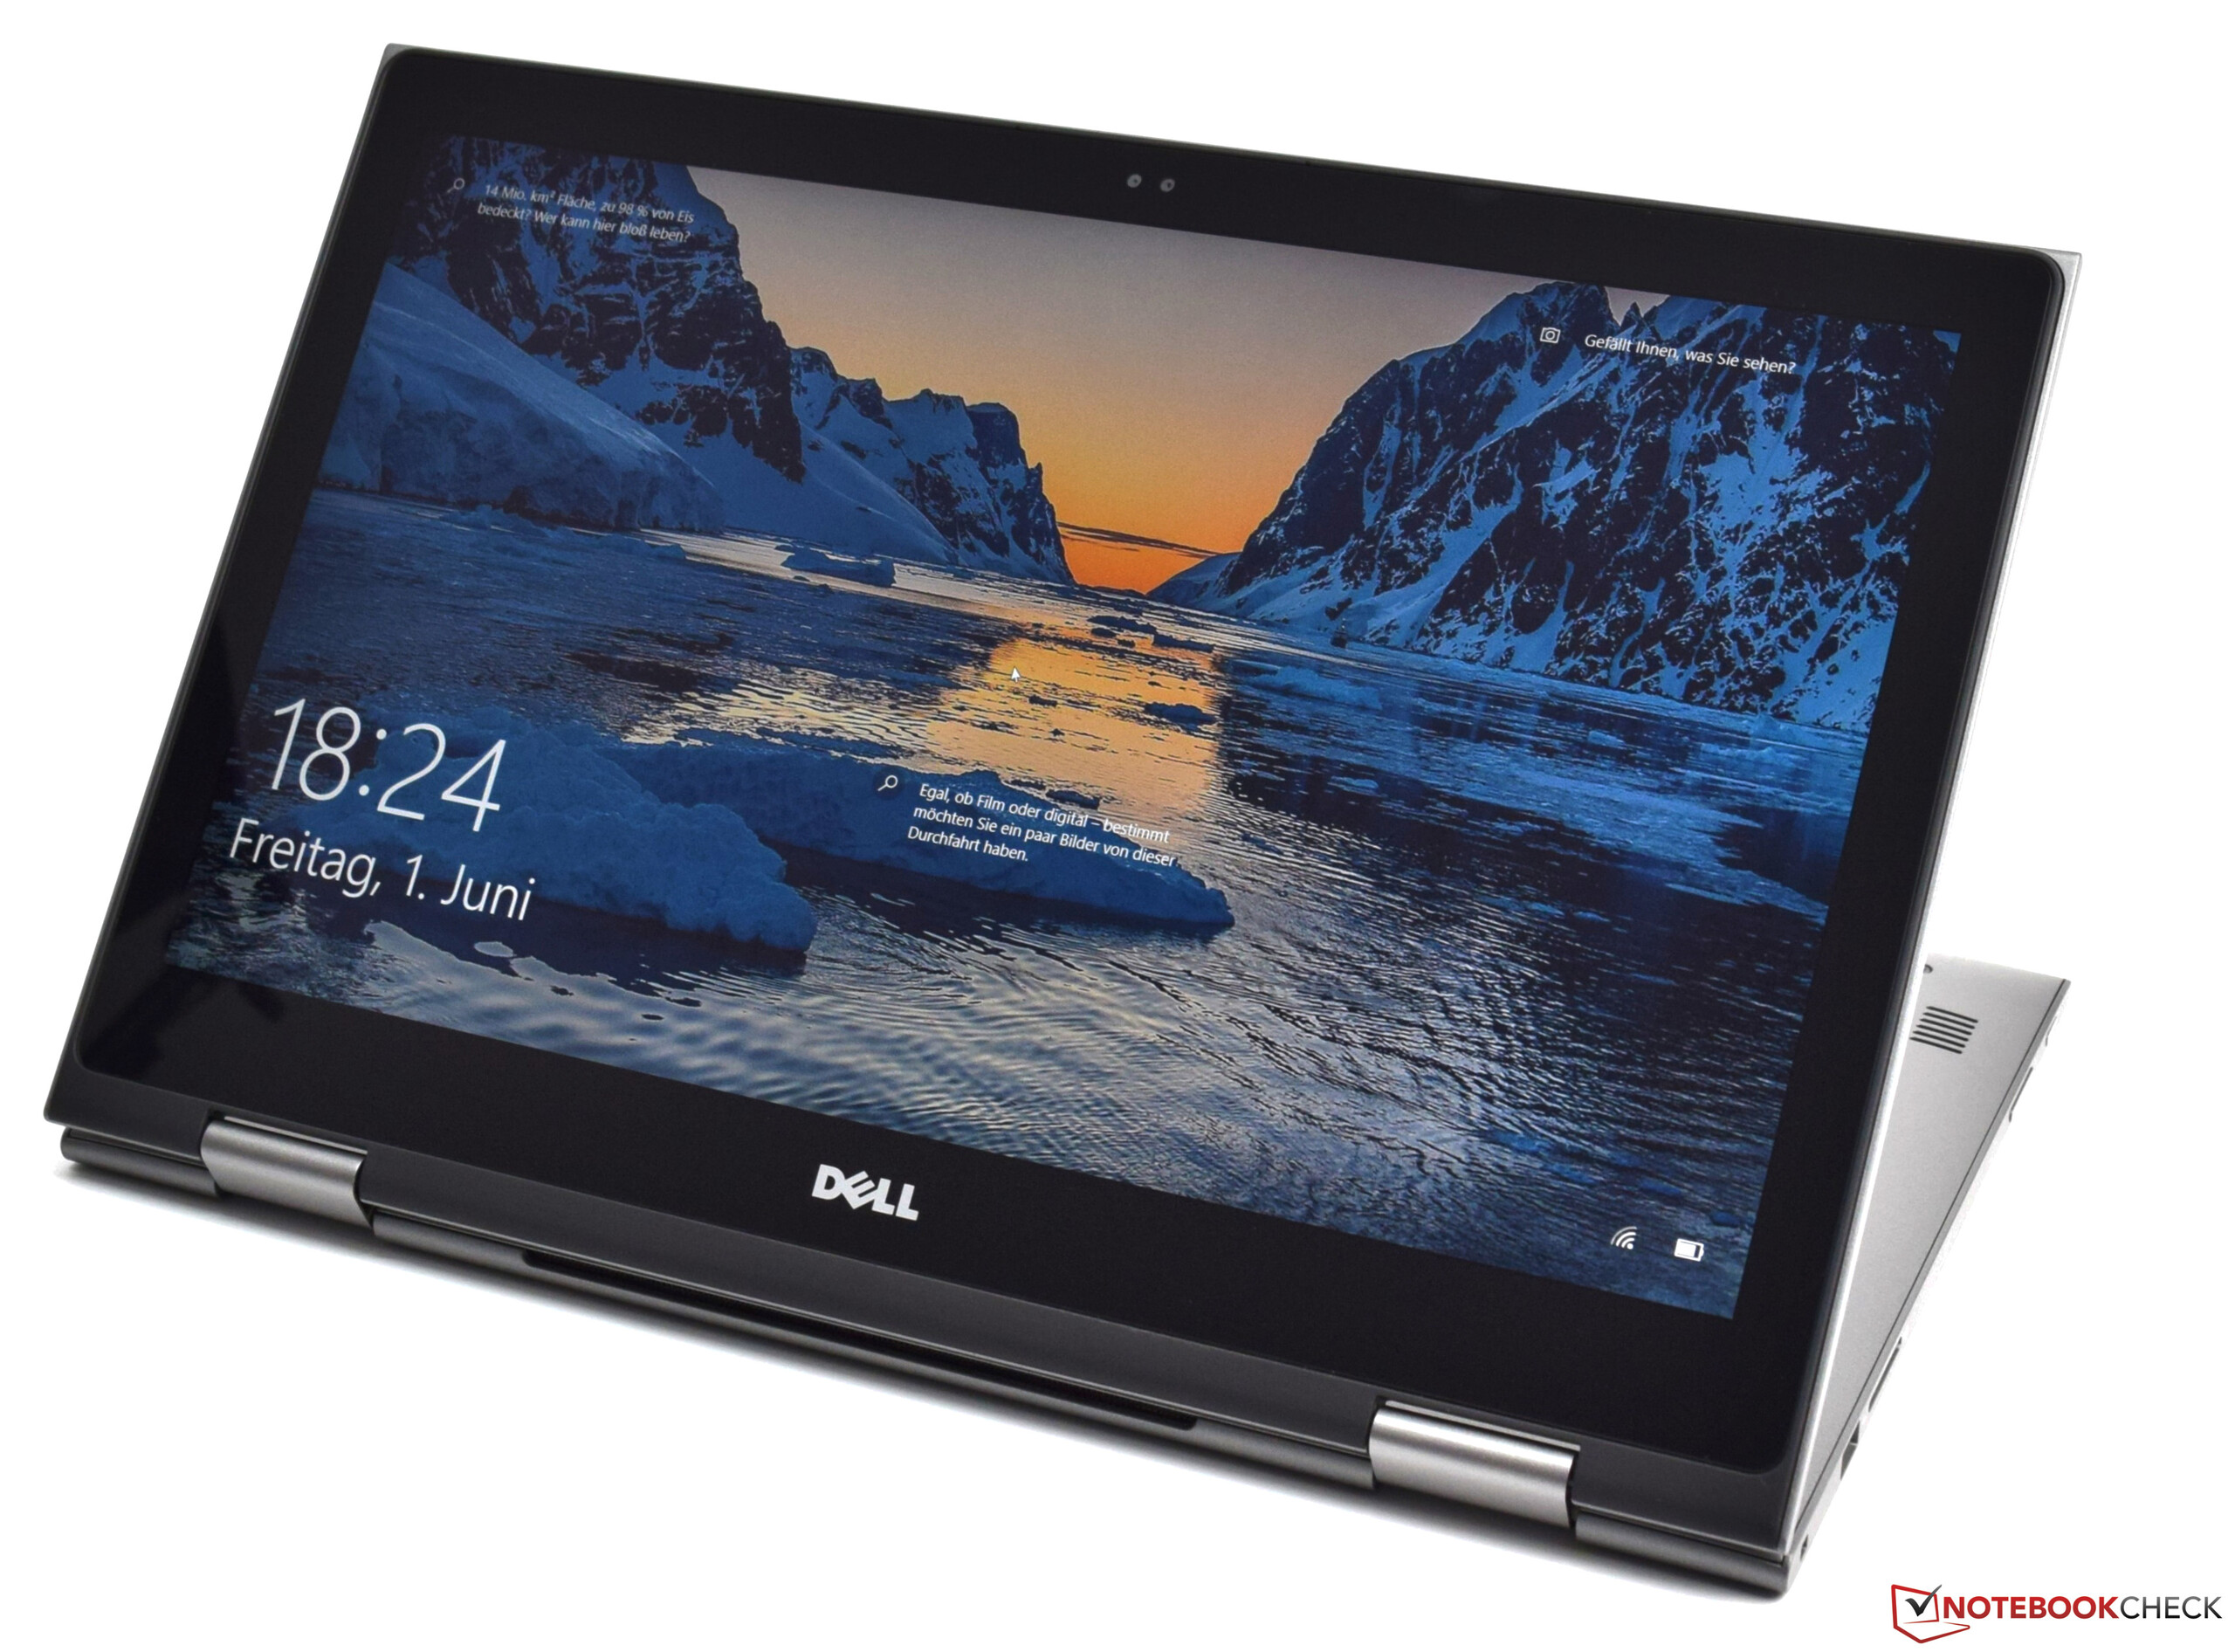
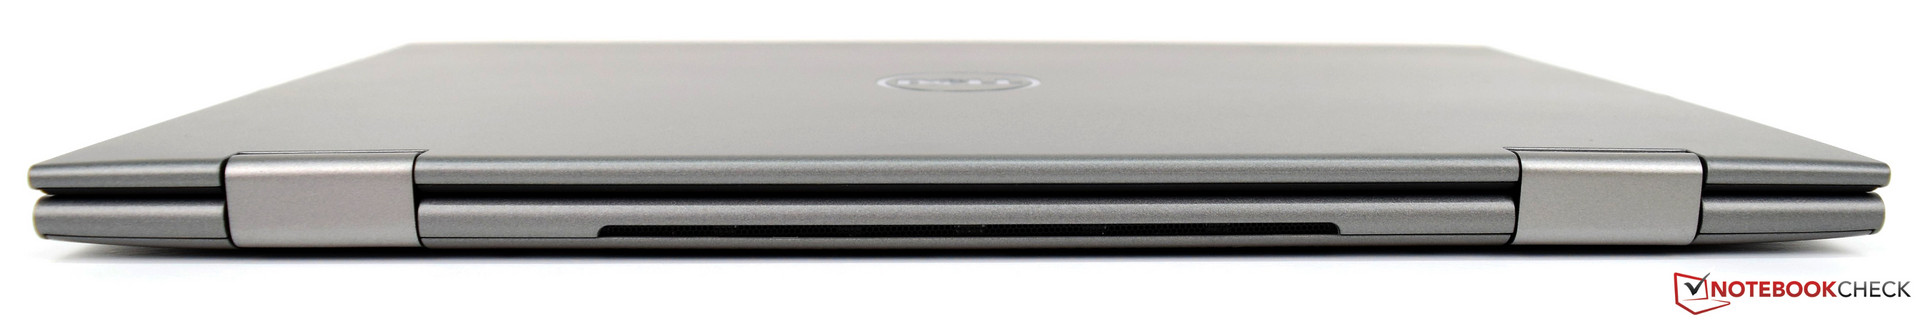
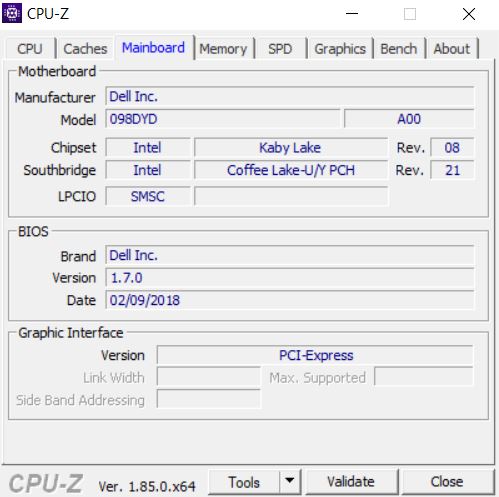
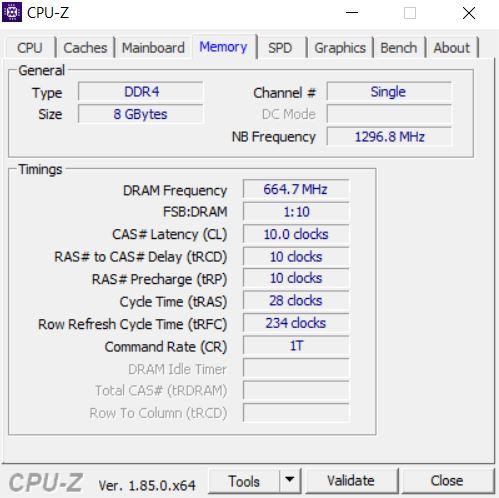
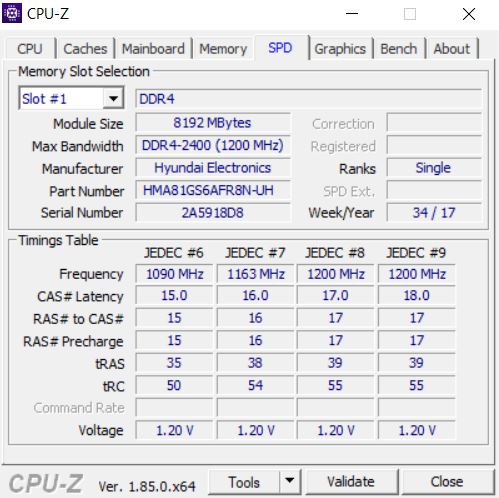
Dell Inspiron 15 5579 är en omvandlingsbar på 15.6 tum som bara har mindre uppgraderingar jämfört med den föregående modellen. Den är till och med identisk med föregångarens föregångare: Dell Inspiron 15 5568. Men den är kraftigare än någonsin tack vare Intels Core i5-8250U, och WiFi-prestandan har dessutom förbättrats dramatiskt och var mycket snabbare än på förra årets Dell Inspiron 15 5578. Utrustad med 8 GB DDR4 RAM och en SSD-enhet på 256 GB så kostar 5579 för tillfället ca 6.500 kronor.
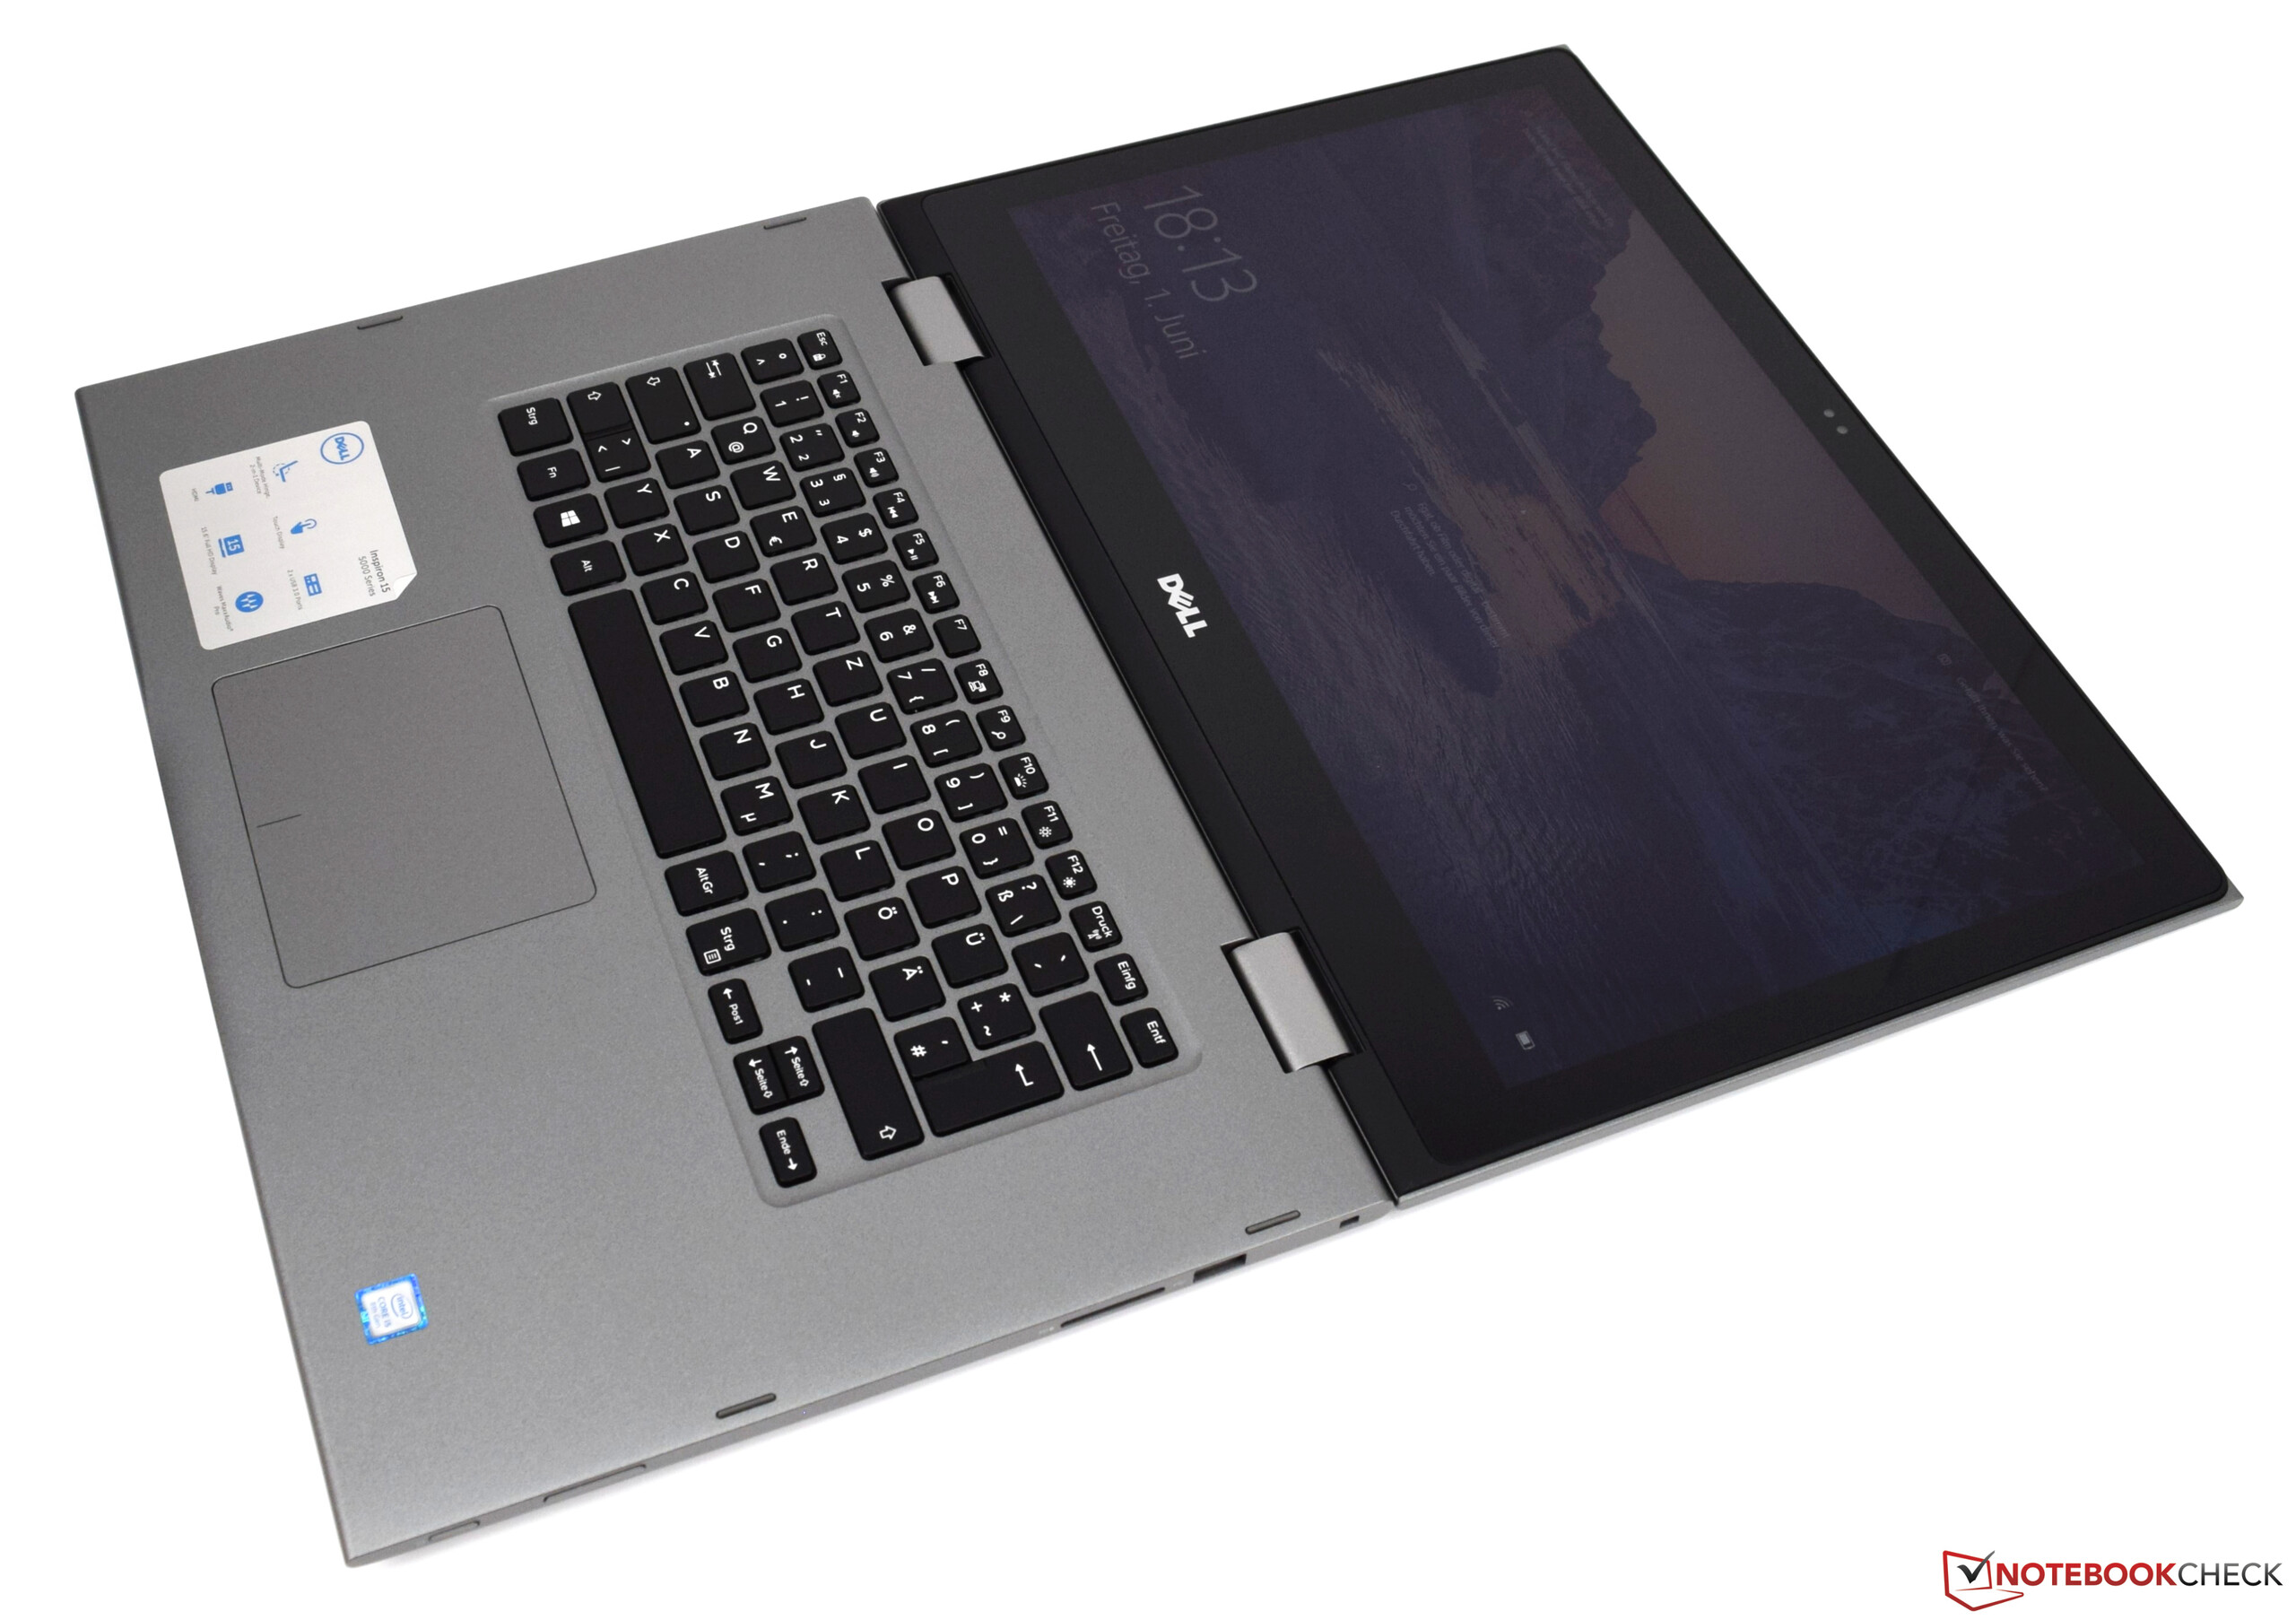
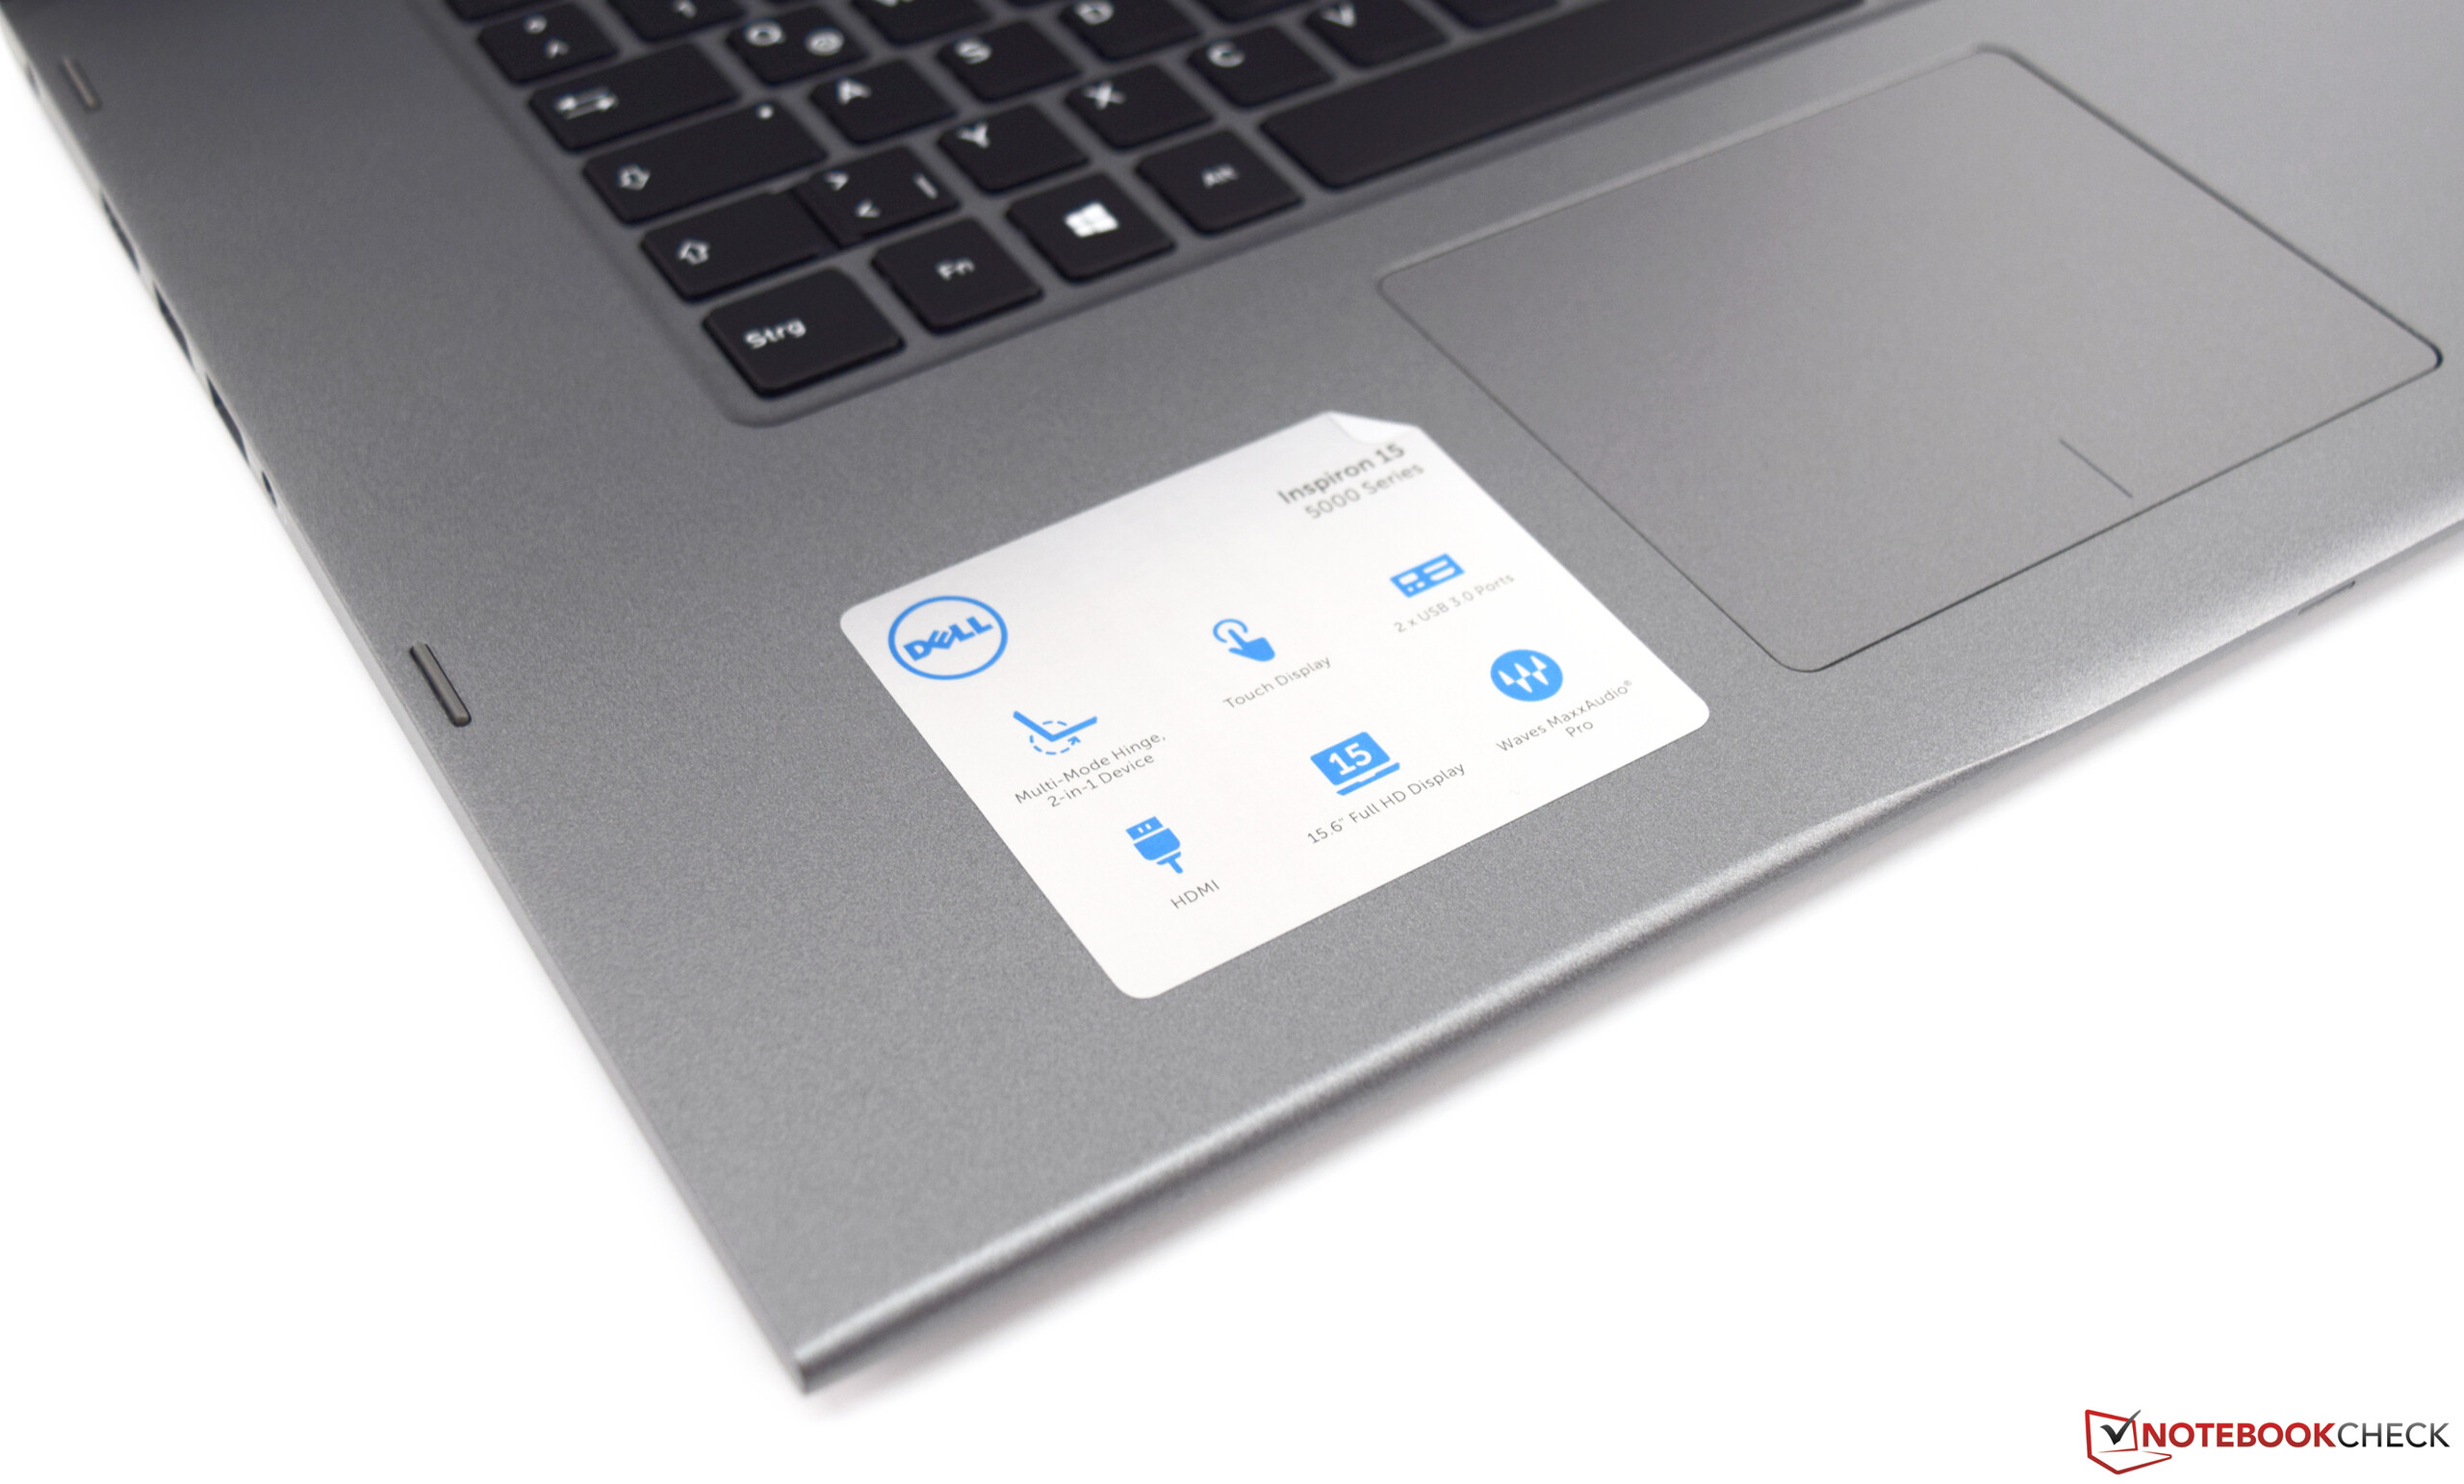
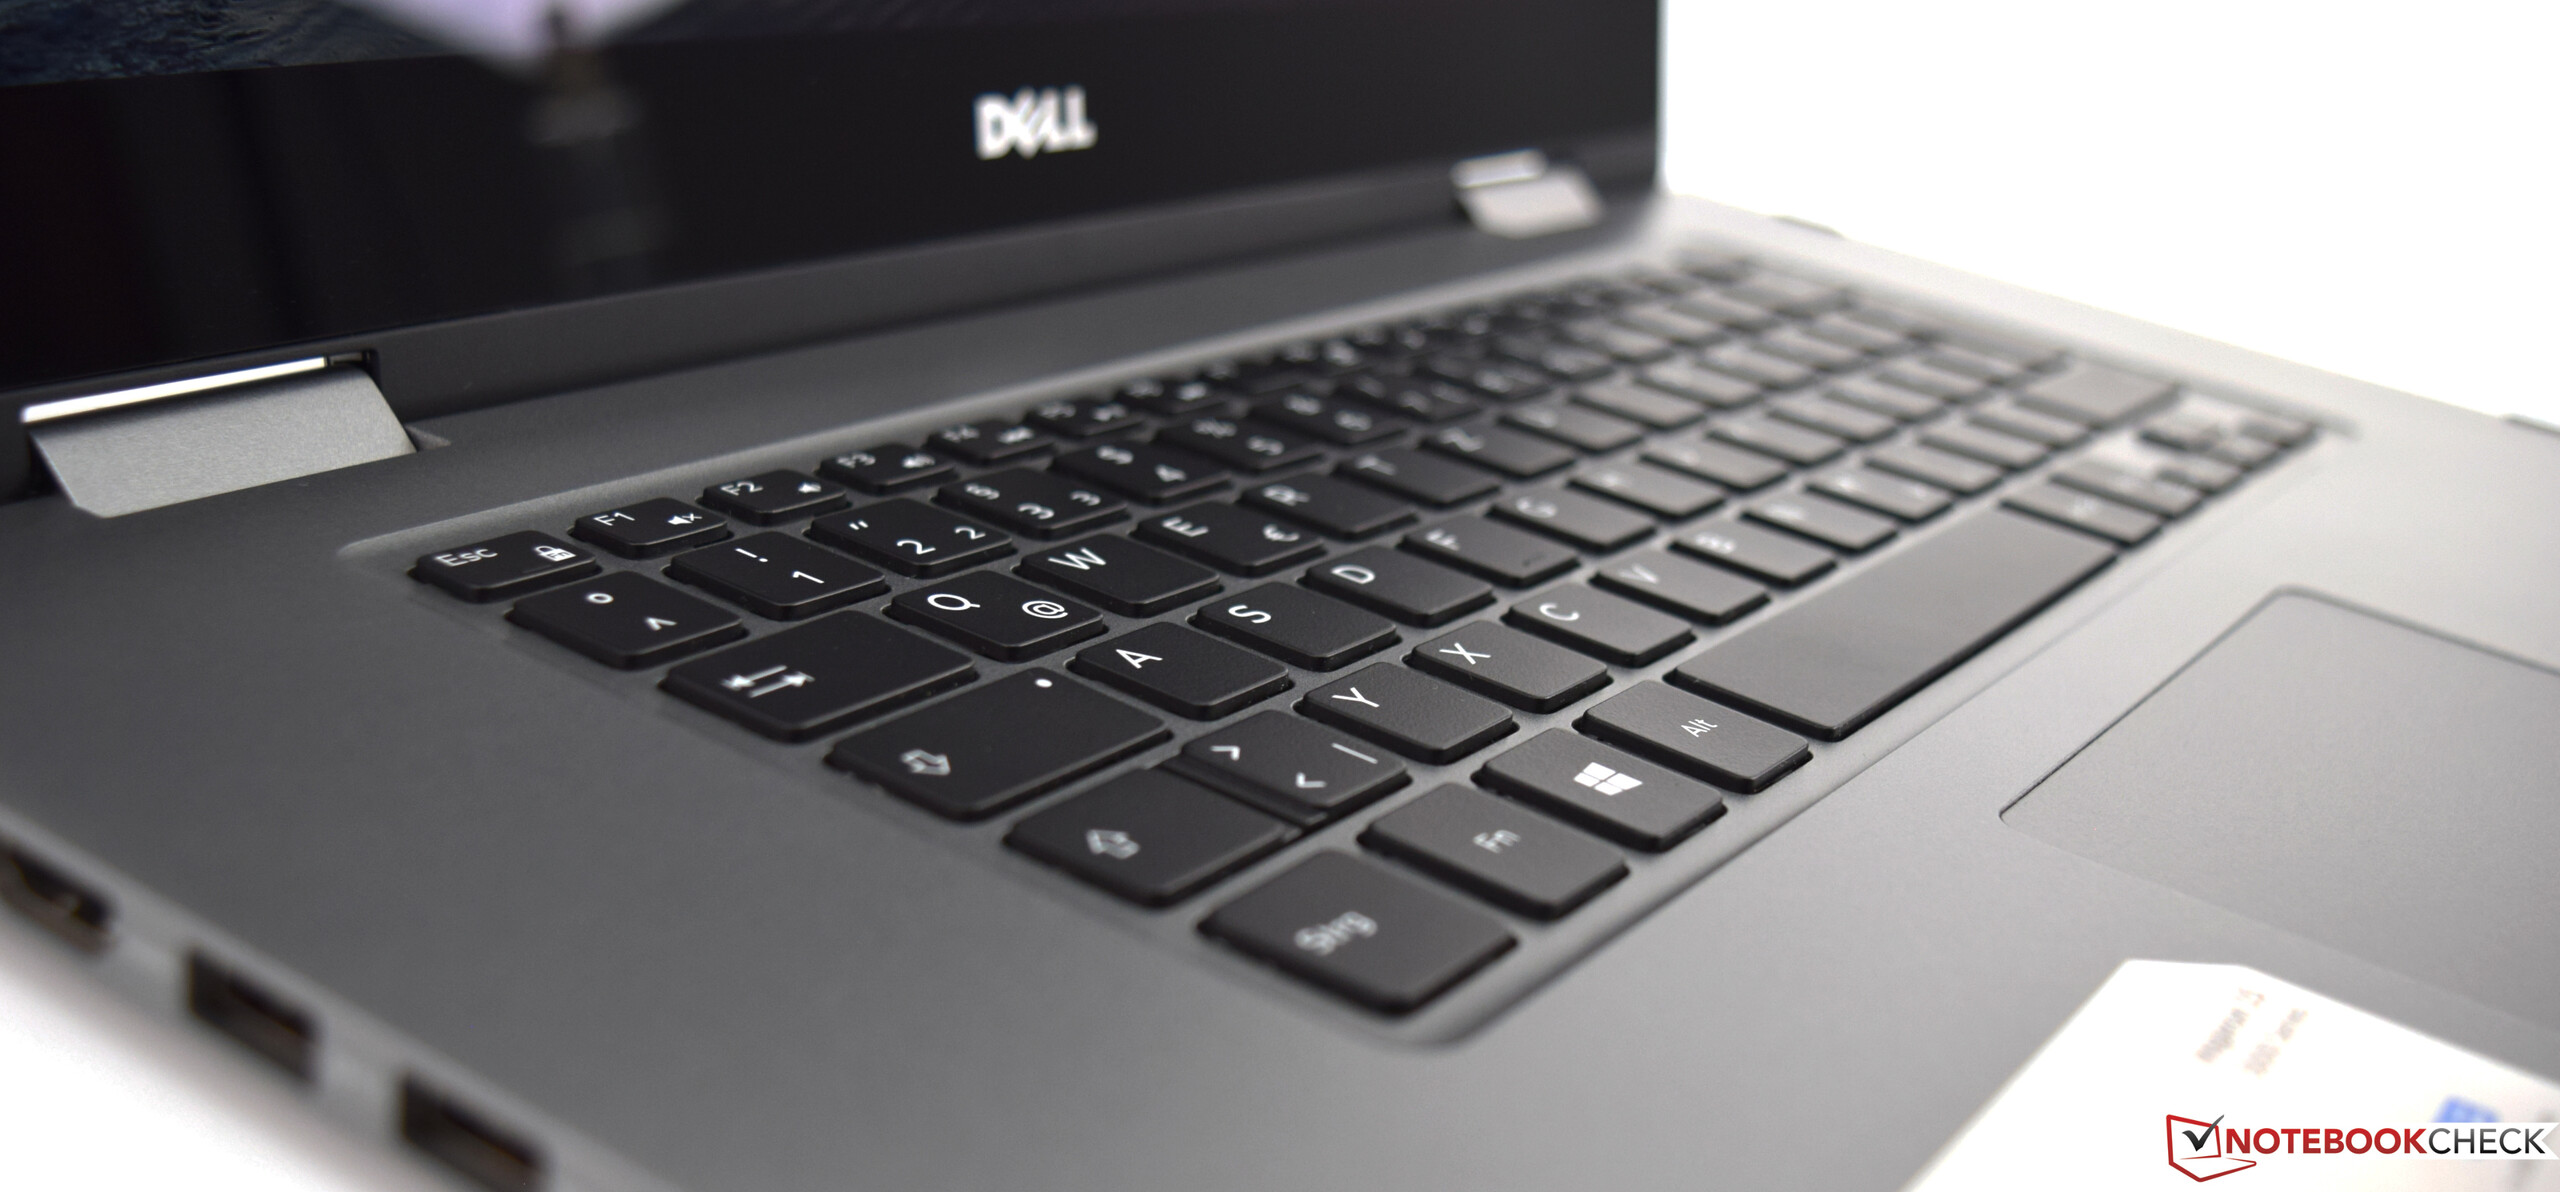
Priset är rätt för denna omvandlingsbara på 15.6 tum, och dom skapliga inmatningsenheterna kommer göra produktiva skribenter nöjda. Men modellens nackdelar är dess mörka skärm och avsaknaden av stöd för Active Pen.
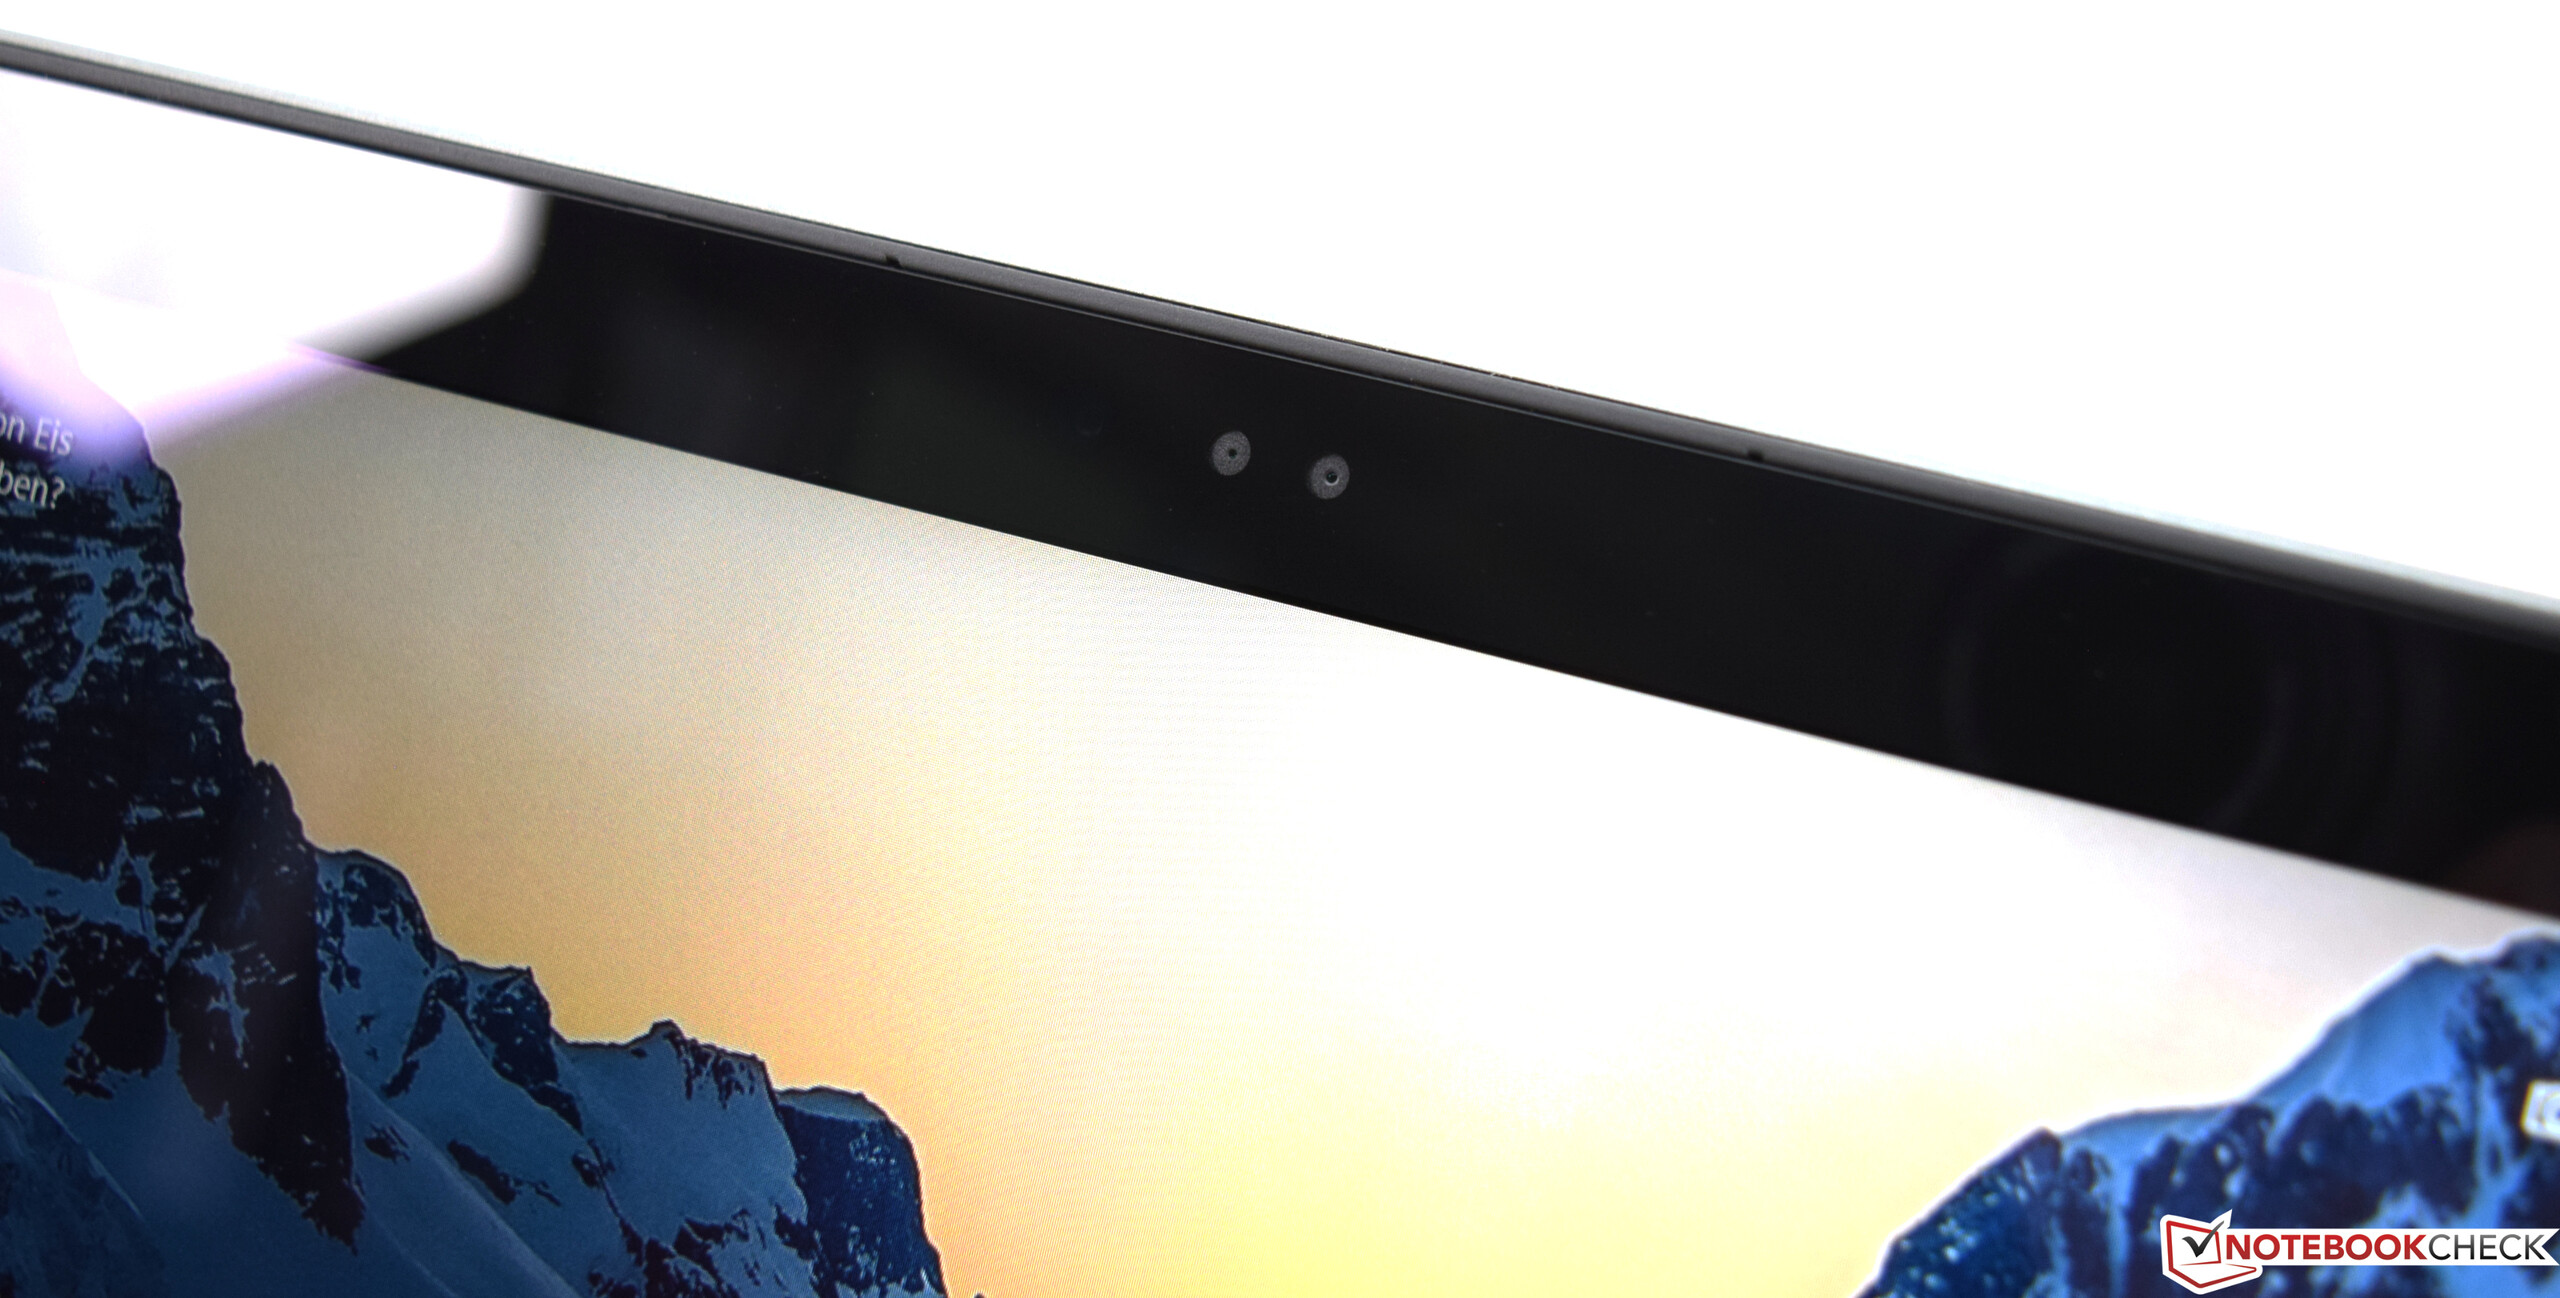
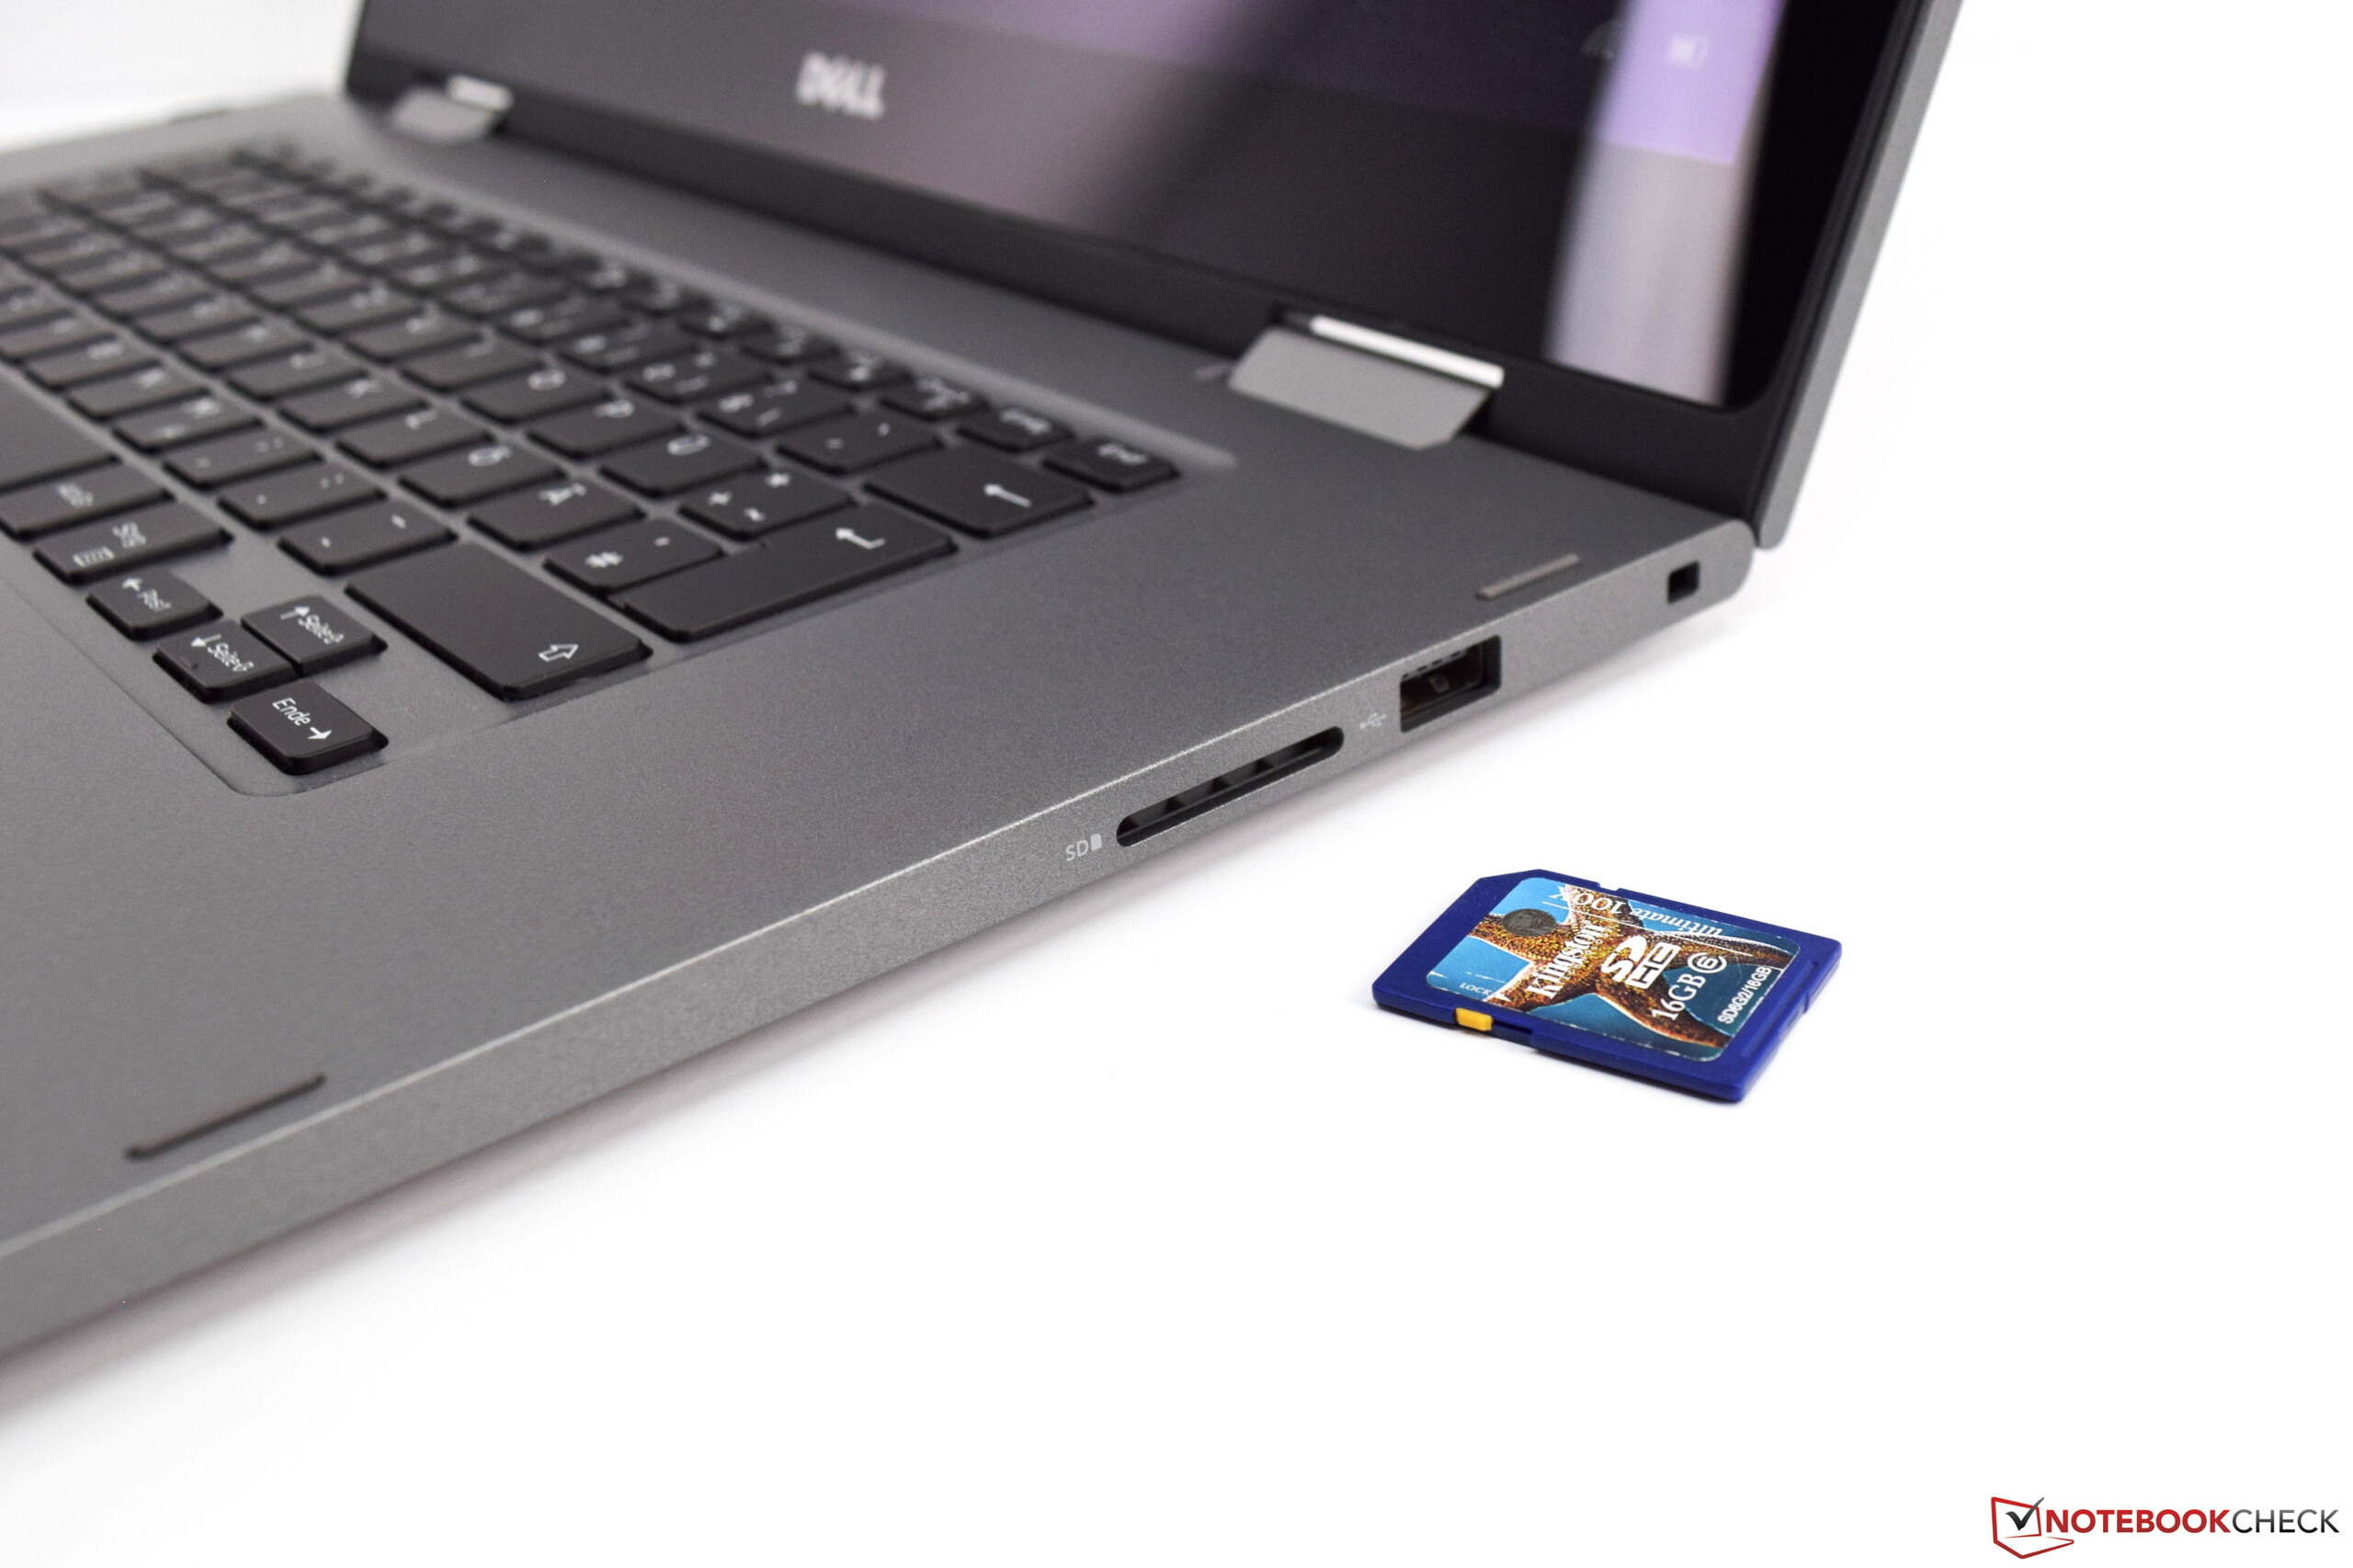
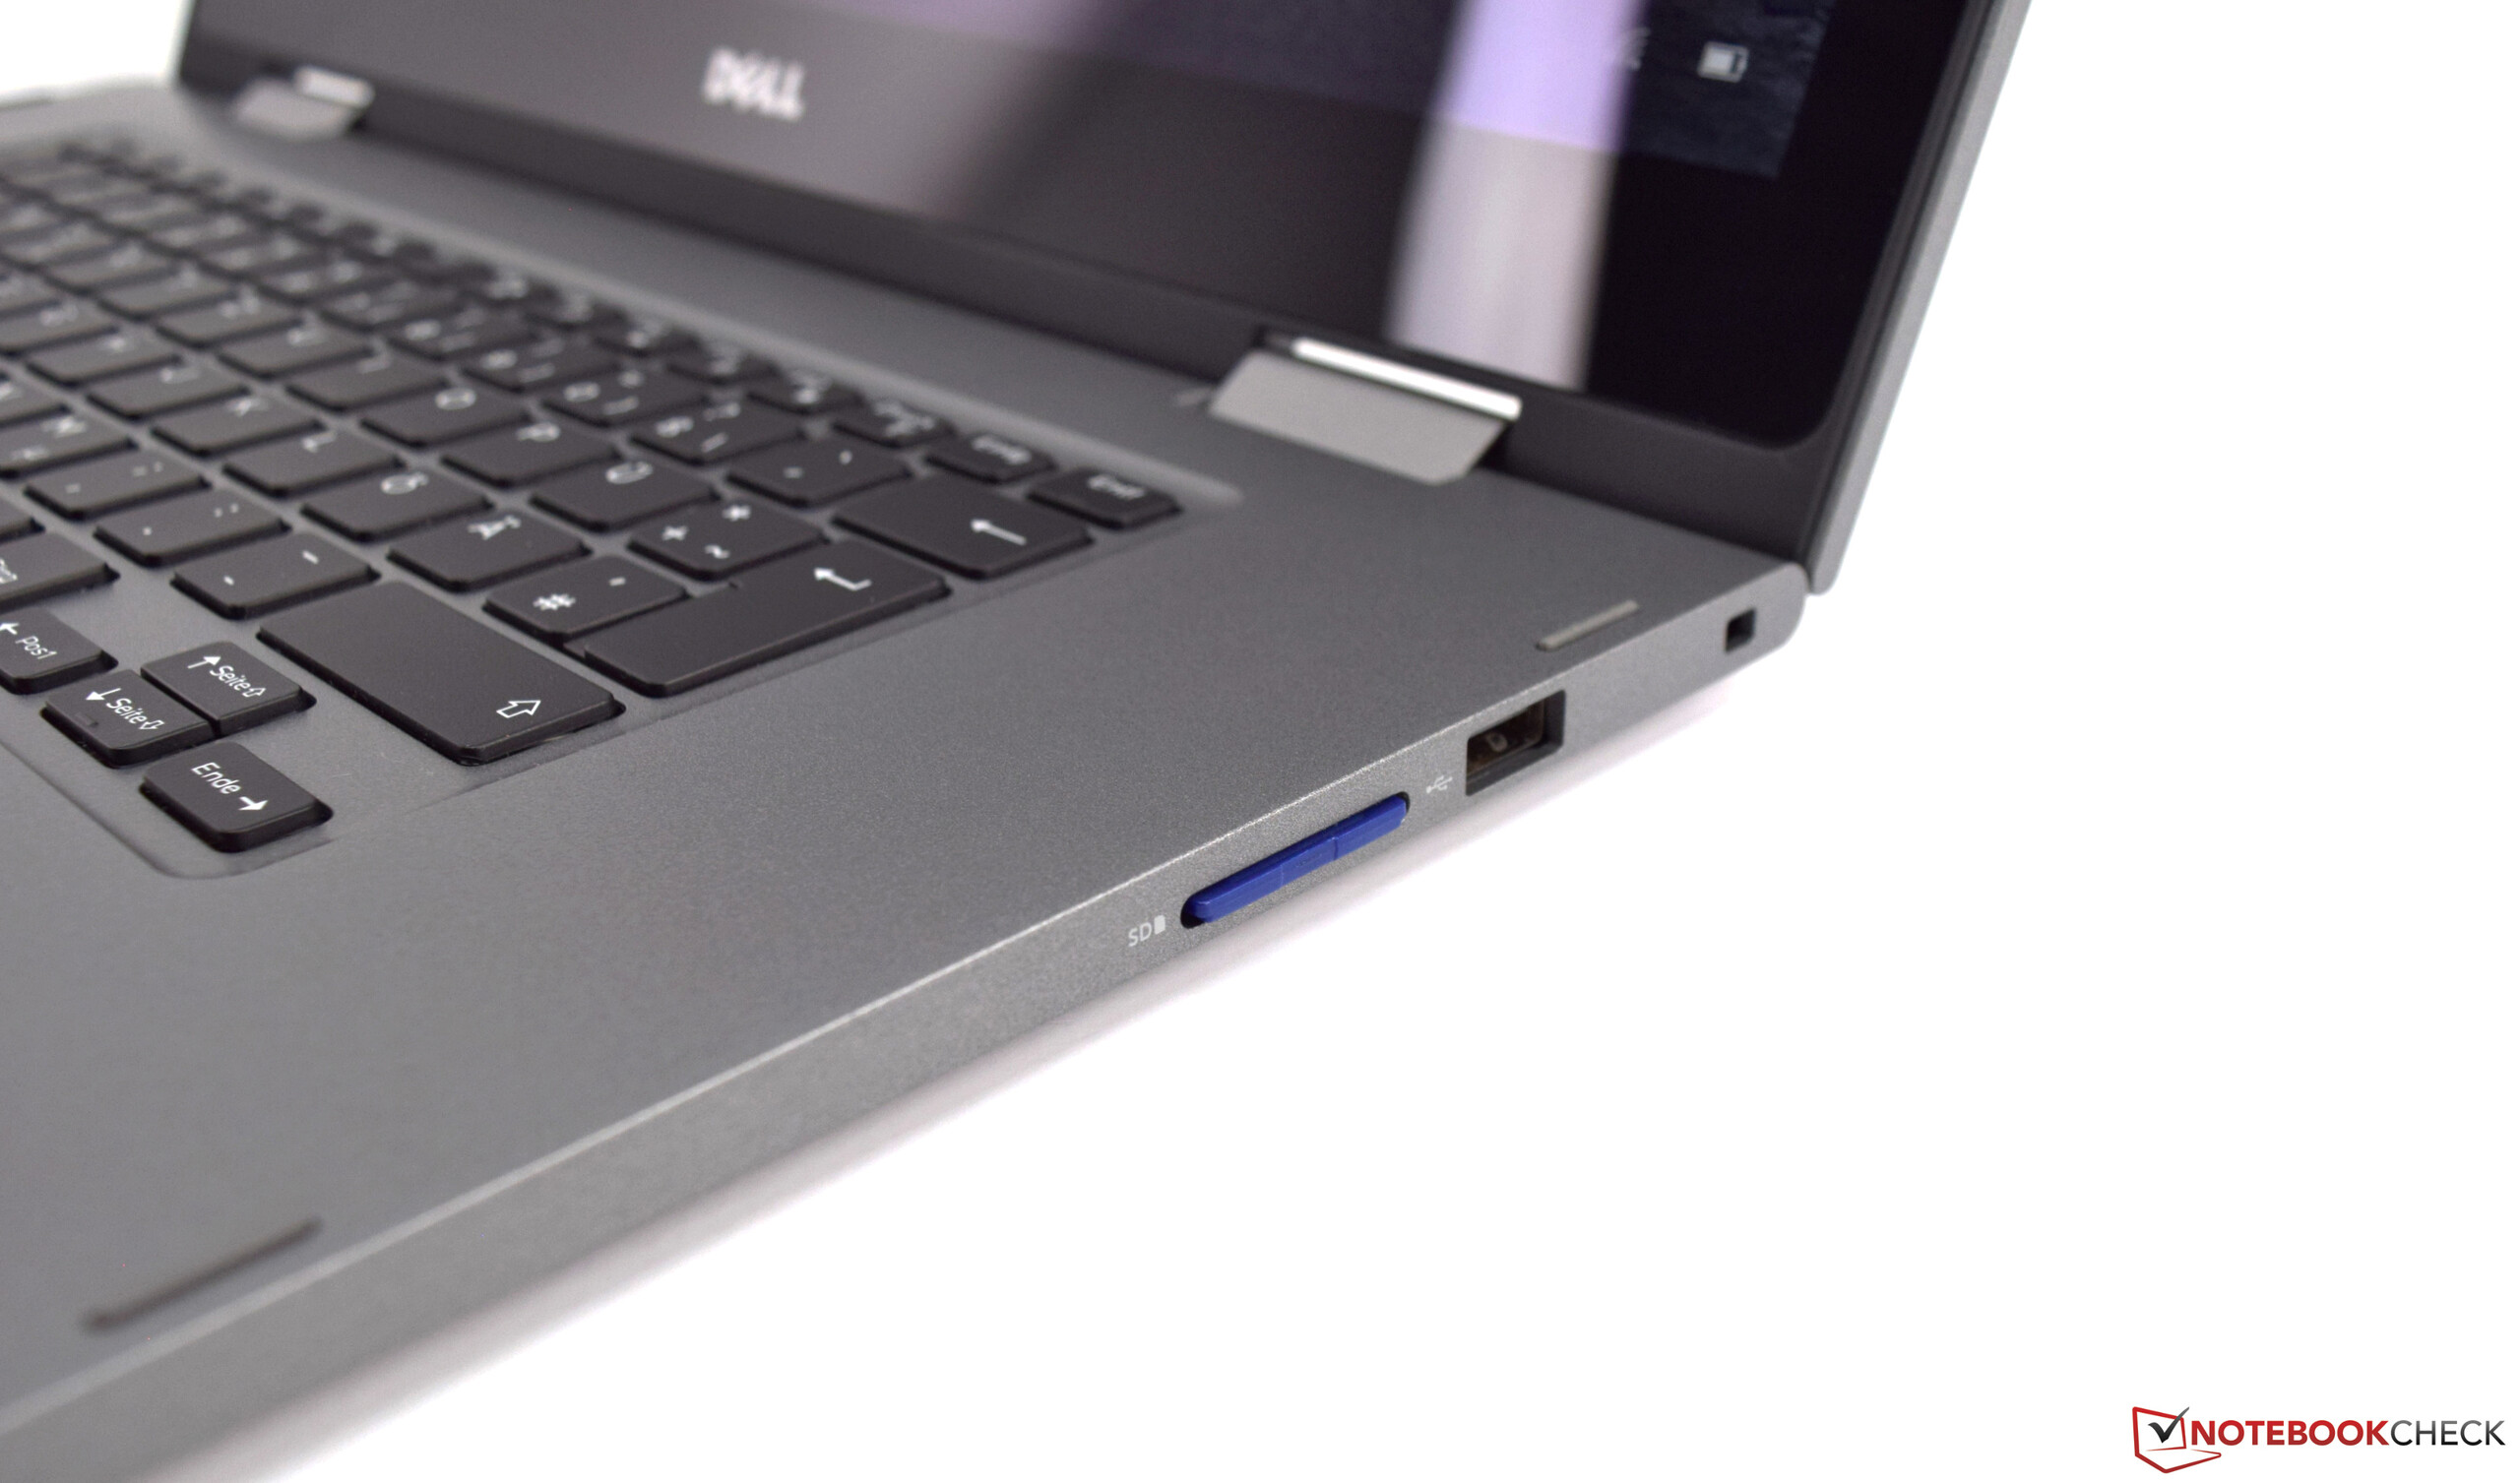
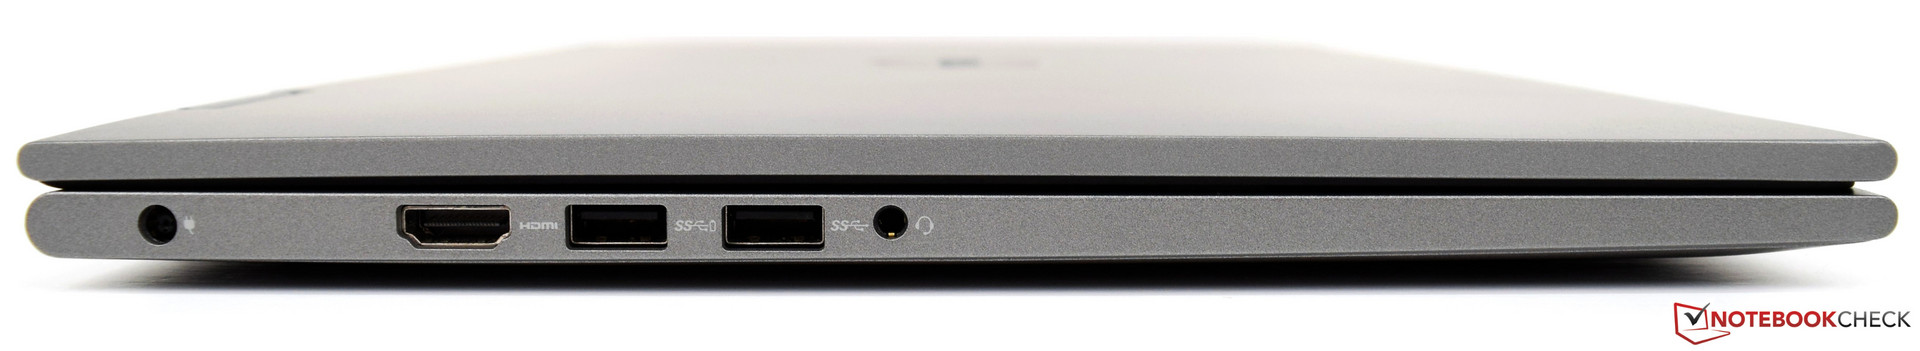
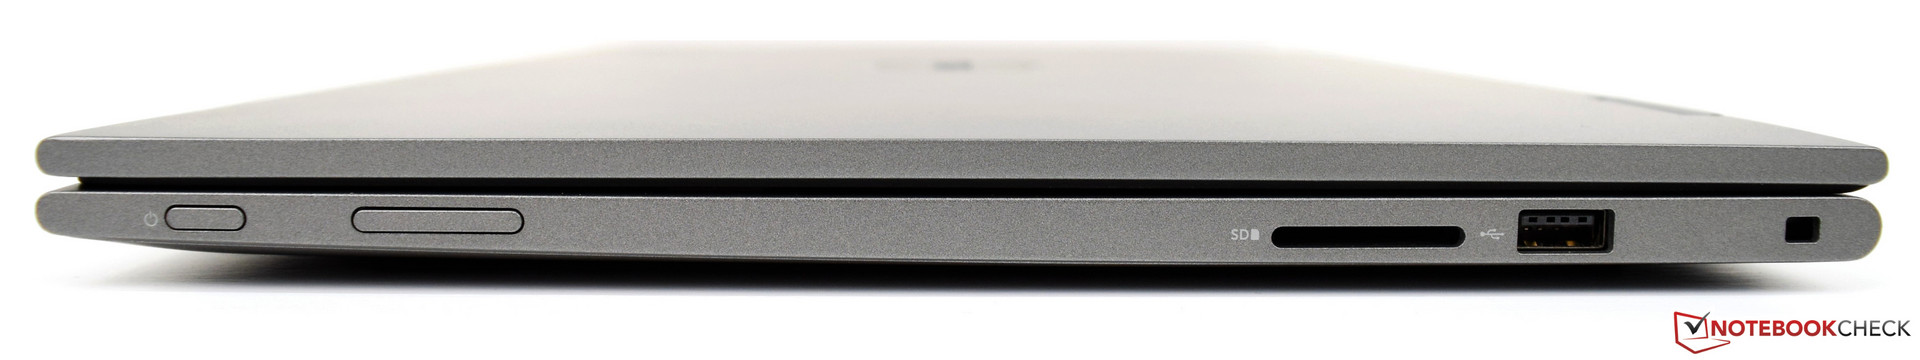
Tyvärr saknas av någon suspekt anledning moderna funktioner som USB-C eller DisplayPort. En SD-kortläsare finns, även om den är ansluten via USB 2.0. Vi gillade den tysta driften och datorns totalt sett acceptabla batteritid. Den inbyggda infraröda kameran är en trevlig bonus och skyndar på inloggningen till Windows betydligt.
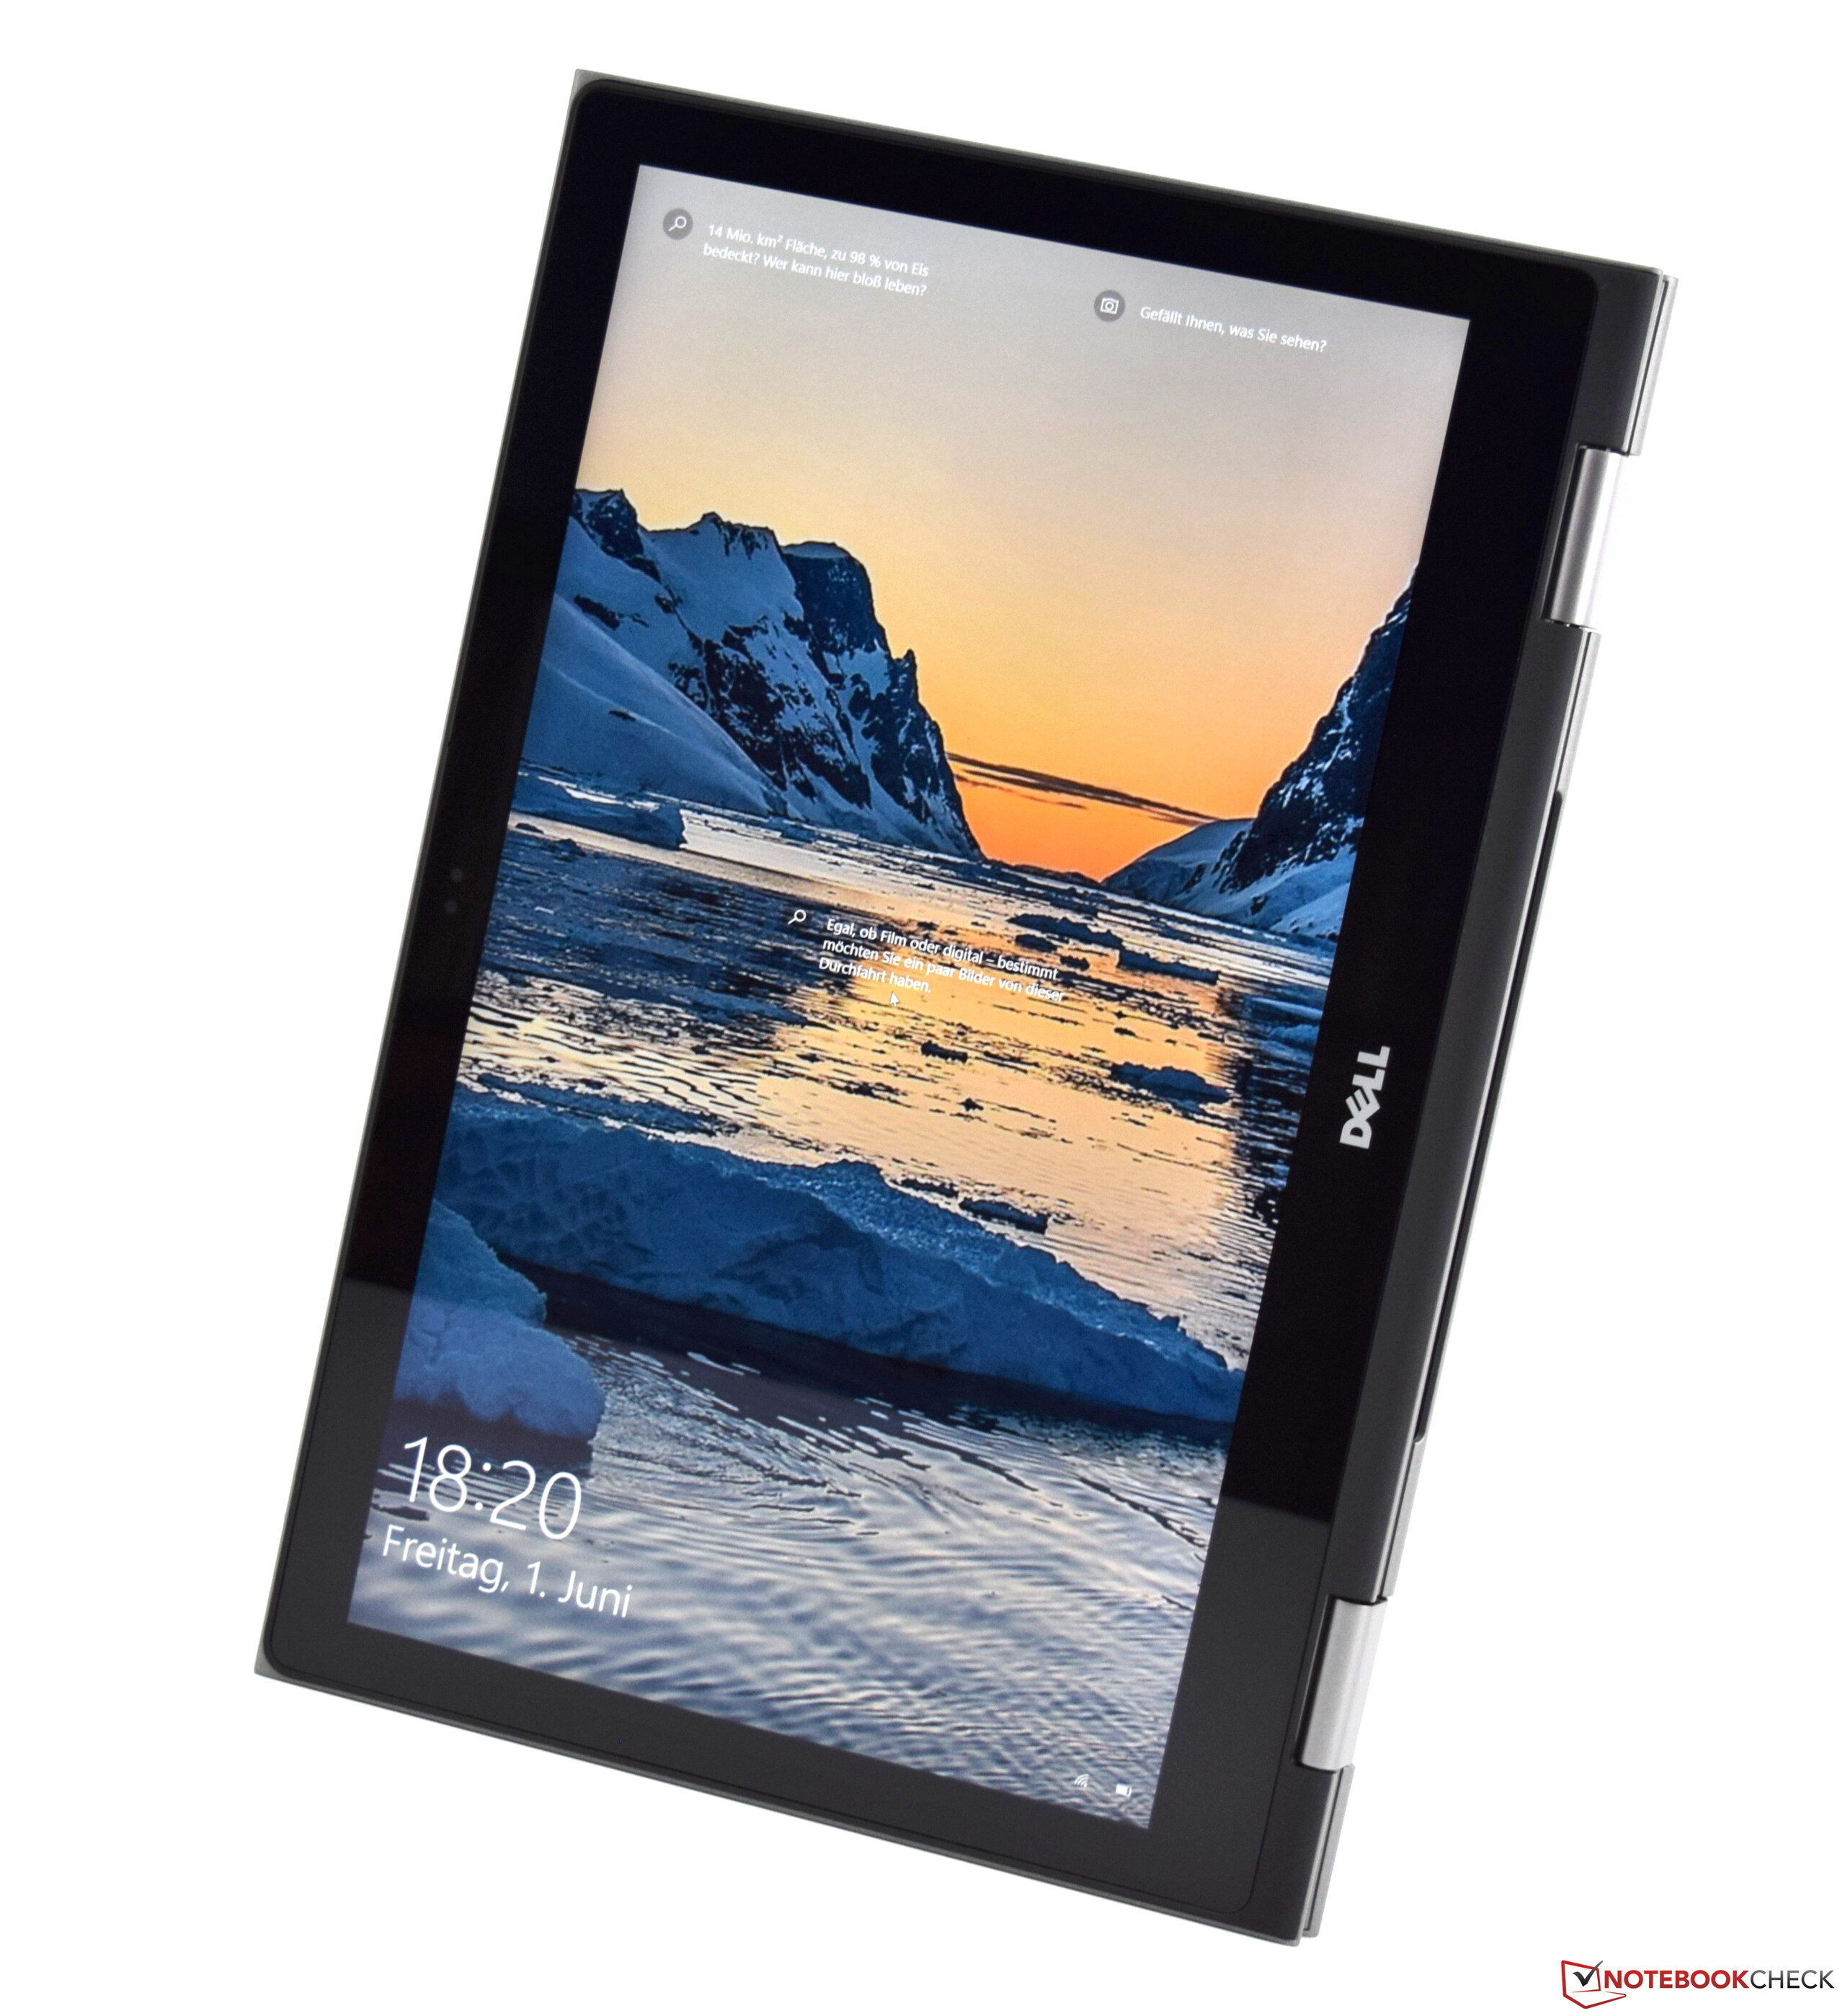
Skärmen, däremot, är en blandad kompott. Å ena sidan har den ett väldigt högt kontrastförhållande och tar inte till PWM för att kontrollera ljusstyrkan. Å andra sidan är färgrymdstäckning och ljusstyrka alldeles för låga.
Dell Inspiron 15 5579-9672
- 06/09/2018 v6 (old)
Sebastian Bade
Price comparison
