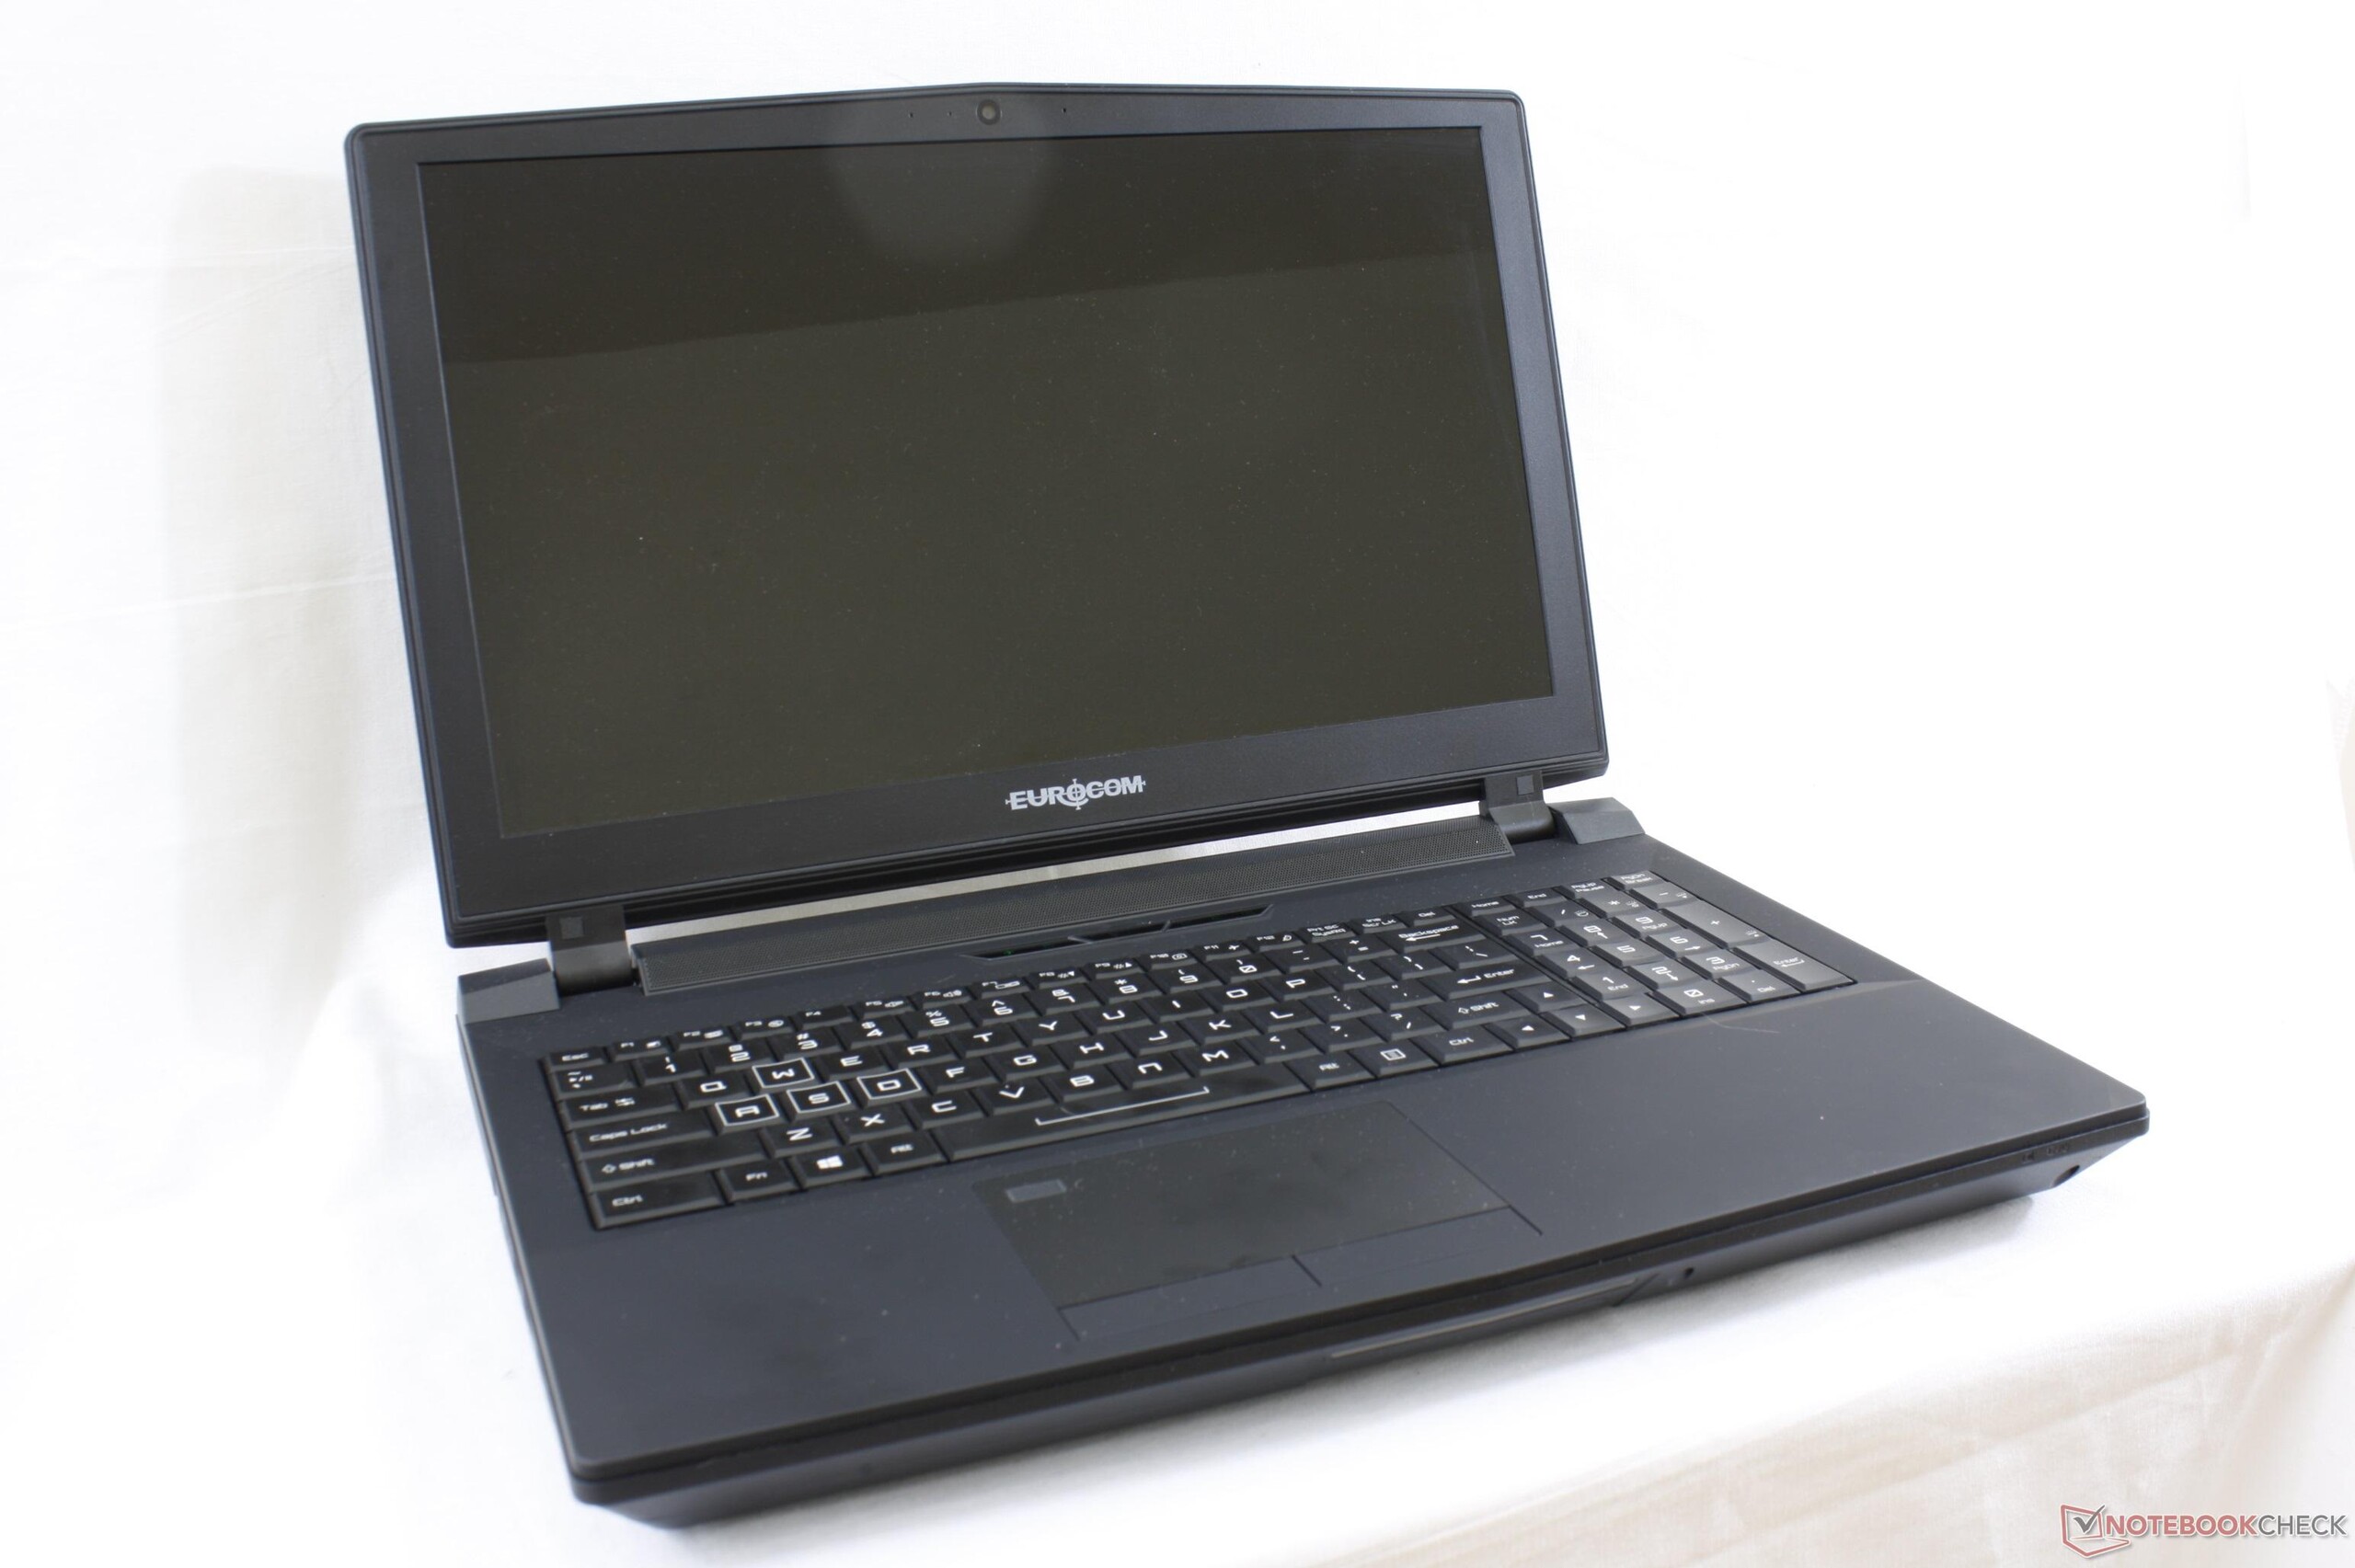
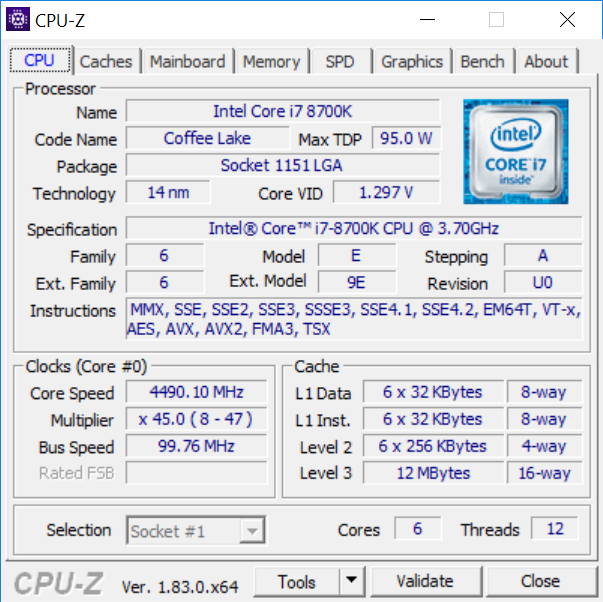
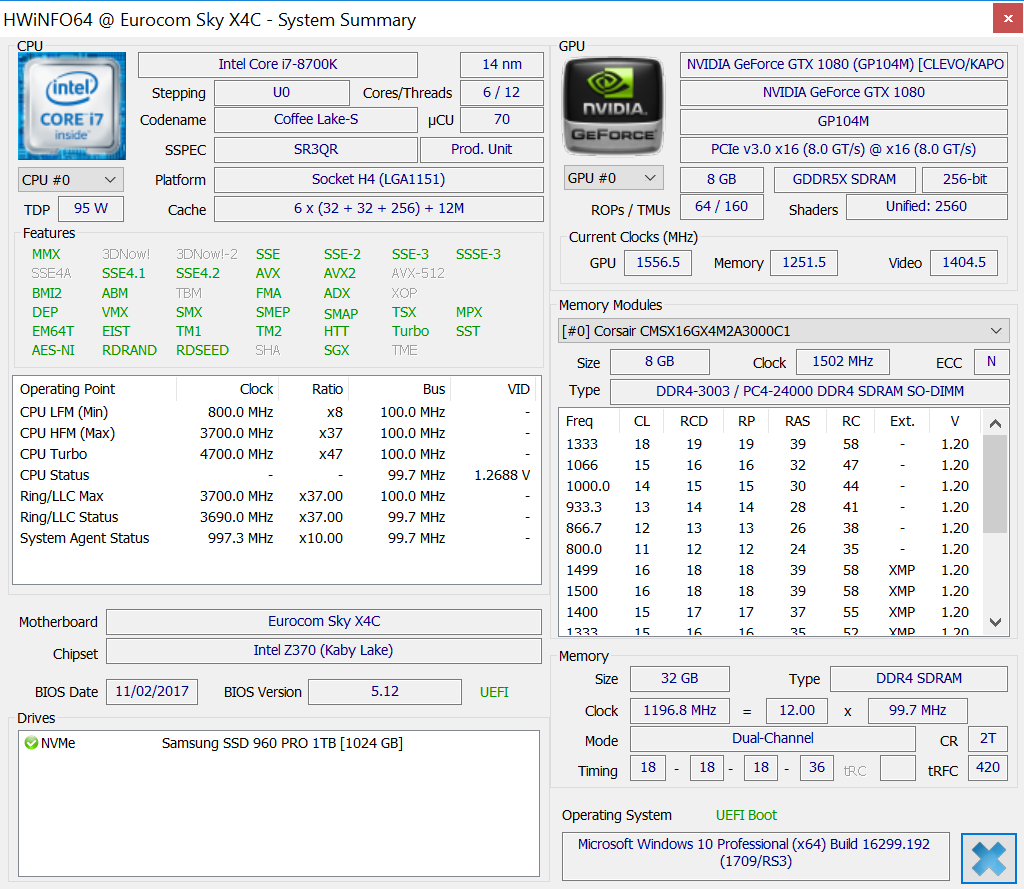
Test: Eurocom Sky X4C (i7-8700K, GTX 1080, Clevo P751TM1-G) Laptop (Sammanfattning)
| SD Card Reader | |
| average JPG Copy Test (av. of 3 runs) | |
| Eurocom Sky X4C (Toshiba Exceria Pro SDXC 64 GB UHS-II) | |
| Dell XPS 15 9560 (i7-7700HQ, UHD) (Toshiba Exceria Pro SDXC 64 GB UHS-II) | |
| Acer Predator 15 G9-593-751X (Toshiba Exceria Pro SDXC 64 GB UHS-II) | |
| maximum AS SSD Seq Read Test (1GB) | |
| Dell XPS 15 9560 (i7-7700HQ, UHD) (Toshiba Exceria Pro SDXC 64 GB UHS-II) | |
| Eurocom Sky X4C (Toshiba Exceria Pro SDXC 64 GB UHS-II) | |
| Acer Predator 15 G9-593-751X (Toshiba Exceria Pro SDXC 64 GB UHS-II) | |
| Networking | |
| iperf3 transmit AX12 | |
| Acer Predator 15 G9-593-751X | |
| Eurocom Sky X4C | |
| MSI GT62VR 7RE-223 | |
| iperf3 receive AX12 | |
| Acer Predator 15 G9-593-751X | |
| MSI GT62VR 7RE-223 | |
| Eurocom Sky X4C | |
| |||||||||||||||||||||||||
Distribution av ljusstyrkan: 81 %
Mitt på batteriet: 324.7 cd/m²
Kontrast: 1249:1 (Svärta: 0.26 cd/m²)
ΔE ColorChecker Calman: 4.67 | ∀{0.5-29.43 Ø4.71}
ΔE Greyscale Calman: 5.9 | ∀{0.09-98 Ø4.96}
96.1% sRGB (Argyll 1.6.3 3D)
61.1% AdobeRGB 1998 (Argyll 1.6.3 3D)
67.2% AdobeRGB 1998 (Argyll 3D)
96.5% sRGB (Argyll 3D)
65.1% Display P3 (Argyll 3D)
Gamma: 2.14
CCT: 7176 K
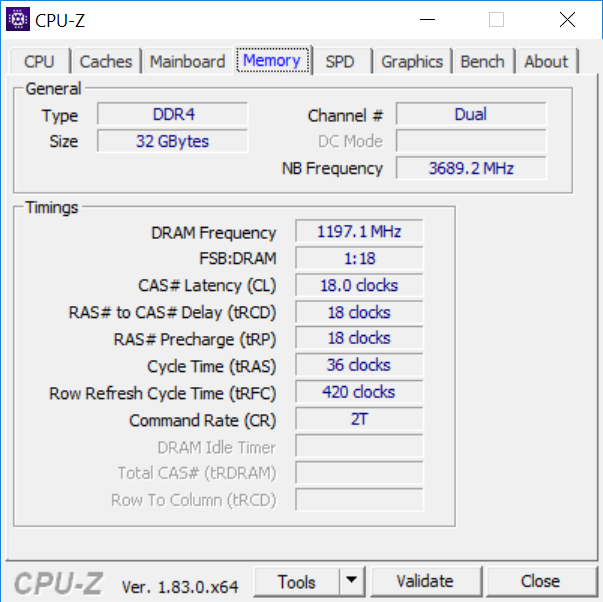
| Eurocom Sky X4C ID: SHP142A, Name: LQ156D1JX01B, IPS, 15.6", 3840x2160 | MSI GT62VR 7RE-223 LG Philips LP156WF6 (LGD046F), IPS, 15.6", 1920x1080 | Alienware 15 R3 HPJGK_B156HTN (AUO51ED), TN, 15.6", 1920x1080 | Asus Strix GL502VS-FY032T LG Philips LP156WF6-SPB6 (LGD046F), IPS, 15.6", 1920x1080 | EVGA SC15 ID: AUO42ED, Name: AU Optronics B156HAN04.2, , 15.6", 1920x1080 | Dell XPS 15 9560 (i7-7700HQ, UHD) IGZO IPS, 15.6", 3840x2160 | |
|---|---|---|---|---|---|---|
| Display | -9% | -2% | -8% | -5% | 30% | |
| Display P3 Coverage (%) | 65.1 | 63.9 -2% | 66 1% | 64.5 -1% | 62.3 -4% | 89.7 38% |
| sRGB Coverage (%) | 96.5 | 83.1 -14% | 90.5 -6% | 83.1 -14% | 89.6 -7% | 100 4% |
| AdobeRGB 1998 Coverage (%) | 67.2 | 60.8 -10% | 66.2 -1% | 60.8 -10% | 63.6 -5% | 100 49% |
| Response Times | 8% | 45% | 9% | -9% | -44% | |
| Response Time Grey 50% / Grey 80% * (ms) | 33.6 ? | 37 ? -10% | 25 ? 26% | 38 ? -13% | 41.6 ? -24% | 57.2 ? -70% |
| Response Time Black / White * (ms) | 33.2 ? | 25 ? 25% | 12 ? 64% | 23 ? 31% | 30.8 ? 7% | 39.2 ? -18% |
| PWM Frequency (Hz) | 1000 ? | 962 | ||||
| Screen | -5% | -33% | -6% | -1% | 1% | |
| Brightness middle (cd/m²) | 324.7 | 310 -5% | 386 19% | 315 -3% | 281.5 -13% | 370.1 14% |
| Brightness (cd/m²) | 318 | 311 -2% | 382 20% | 290 -9% | 253 -20% | 356 12% |
| Brightness Distribution (%) | 81 | 85 5% | 93 15% | 85 5% | 73 -10% | 87 7% |
| Black Level * (cd/m²) | 0.26 | 0.3 -15% | 0.39 -50% | 0.32 -23% | 0.27 -4% | 0.37 -42% |
| Contrast (:1) | 1249 | 1033 -17% | 990 -21% | 984 -21% | 1043 -16% | 1000 -20% |
| Colorchecker dE 2000 * | 4.67 | 4.82 -3% | 10.2 -118% | 4.88 -4% | 3.9 16% | 5.3 -13% |
| Colorchecker dE 2000 max. * | 8.16 | 10.14 -24% | 15.81 -94% | 8.88 -9% | 7.1 13% | 9.9 -21% |
| Greyscale dE 2000 * | 5.9 | 3.94 33% | 11.28 -91% | 4.17 29% | 3.8 36% | 4.6 22% |
| Gamma | 2.14 103% | 2.45 90% | 2.23 99% | 2.53 87% | 2.27 97% | 2.31 95% |
| CCT | 7176 91% | 6877 95% | 11383 57% | 6683 97% | 7322 89% | 6284 103% |
| Color Space (Percent of AdobeRGB 1998) (%) | 61.1 | 54 -12% | 59 -3% | 55 -10% | 57.8 -5% | 88.3 45% |
| Color Space (Percent of sRGB) (%) | 96.1 | 83 -14% | 90 -6% | 83 -14% | 89.3 -7% | 100 4% |
| Totalt genomsnitt (program/inställningar) | -2% /
-4% | 3% /
-16% | -2% /
-4% | -5% /
-3% | -4% /
1% |
* ... mindre är bättre
Visa svarstider
| ↔ Svarstid svart till vitt | ||
|---|---|---|
| 33.2 ms ... stiga ↗ och falla ↘ kombinerat | ↗ 21.2 ms stiga | 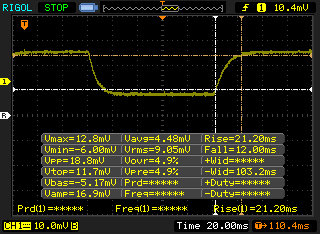 |
| ↘ 12 ms hösten | ||
| Skärmen visar långsamma svarsfrekvenser i våra tester och kommer att vara otillfredsställande för spelare. I jämförelse sträcker sig alla testade enheter från 0.1 (minst) till 240 (maximalt) ms. » 90 % av alla enheter är bättre. Detta innebär att den uppmätta svarstiden är sämre än genomsnittet av alla testade enheter (19.8 ms). | ||
| ↔ Svarstid 50 % grått till 80 % grått | ||
| 33.6 ms ... stiga ↗ och falla ↘ kombinerat | ↗ 19.6 ms stiga | 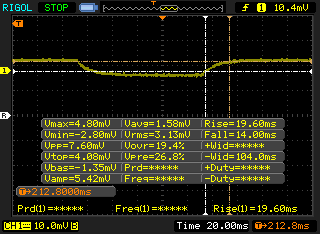 |
| ↘ 14 ms hösten | ||
| Skärmen visar långsamma svarsfrekvenser i våra tester och kommer att vara otillfredsställande för spelare. I jämförelse sträcker sig alla testade enheter från 0.165 (minst) till 636 (maximalt) ms. » 46 % av alla enheter är bättre. Det betyder att den uppmätta svarstiden liknar genomsnittet av alla testade enheter (31 ms). | ||
Skärmflimmer / PWM (Puls-Width Modulation)
| Skärmflimmer / PWM upptäckt | 1000 Hz | ≤ 20 % ljusstyrka inställning | 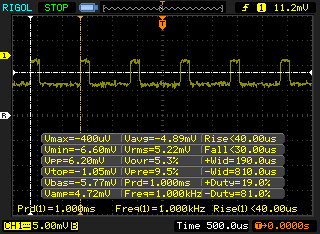 |
Displayens bakgrundsbelysning flimrar vid 1000 Hz (i värsta fall, t.ex. med PWM) Flimrande upptäckt vid en ljusstyrkeinställning på 20 % och lägre. Det ska inte finnas något flimmer eller PWM över denna ljusstyrkeinställning. Frekvensen för 1000 Hz är ganska hög, så de flesta användare som är känsliga för PWM bör inte märka något flimmer. Som jämförelse: 52 % av alla testade enheter använder inte PWM för att dämpa skärmen. Om PWM upptäcktes mättes ett medelvärde av 7754 (minst: 5 - maximum: 343500) Hz. | |||
| Cinebench R15 | |
| CPU Single 64Bit | |
| Eurocom Sky X4C | |
| Eurocom Tornado F5 | |
| Eurocom Sky X9C | |
| Smart7 Karme GX17E G2 | |
| Eurocom Tornado F5 Killer Edition | |
| Alienware 15 R3 Max-Q | |
| Eurocom Sky X7E2 | |
| AMD Ryzen 1800X - Asus Crosshair VI Hero | |
| Asus GL702ZC-GC104T | |
| Apple MacBook Pro 15 2016 (2.6 GHz, 450) | |
| Asus GL503VD-DB74 | |
| Dell Inspiron 15 7000 7577 | |
| CPU Multi 64Bit | |
| AMD Ryzen 1800X - Asus Crosshair VI Hero | |
| Asus GL702ZC-GC104T | |
| Eurocom Sky X9C | |
| Eurocom Sky X4C | |
| Smart7 Karme GX17E G2 | |
| Eurocom Tornado F5 | |
| Eurocom Sky X7E2 | |
| Alienware 15 R3 Max-Q | |
| Asus GL503VD-DB74 | |
| Apple MacBook Pro 15 2016 (2.6 GHz, 450) | |
| Eurocom Tornado F5 Killer Edition | |
| Dell Inspiron 15 7000 7577 | |
| Cinebench R11.5 | |
| CPU Single 64Bit | |
| Eurocom Sky X9C | |
| Eurocom Tornado F5 | |
| Eurocom Sky X4C | |
| Eurocom Tornado F5 Killer Edition | |
| Alienware 15 R3 Max-Q | |
| Asus GL503VD-DB74 | |
| AMD Ryzen 1800X - Asus Crosshair VI Hero | |
| Eurocom Sky X7E2 | |
| Asus GL702ZC-GC104T | |
| Apple MacBook Pro 15 2016 (2.6 GHz, 450) | |
| Dell Inspiron 15 7000 7577 | |
| CPU Multi 64Bit | |
| AMD Ryzen 1800X - Asus Crosshair VI Hero | |
| Asus GL702ZC-GC104T | |
| Eurocom Sky X9C | |
| Eurocom Sky X4C | |
| Eurocom Tornado F5 | |
| Eurocom Sky X7E2 | |
| Alienware 15 R3 Max-Q | |
| Asus GL503VD-DB74 | |
| Eurocom Tornado F5 Killer Edition | |
| Apple MacBook Pro 15 2016 (2.6 GHz, 450) | |
| Dell Inspiron 15 7000 7577 | |
| Cinebench R10 | |
| Rendering Multiple CPUs 32Bit | |
| Eurocom Sky X9C | |
| Eurocom Sky X4C | |
| AMD Ryzen 1800X - Asus Crosshair VI Hero | |
| Asus GL702ZC-GC104T | |
| Eurocom Tornado F5 | |
| Eurocom Sky X7E2 | |
| Eurocom Tornado F5 Killer Edition | |
| Alienware 15 R3 Max-Q | |
| Asus GL503VD-DB74 | |
| Dell Inspiron 15 7000 7577 | |
| Rendering Single 32Bit | |
| Eurocom Sky X9C | |
| Eurocom Sky X4C | |
| Eurocom Tornado F5 | |
| Eurocom Tornado F5 Killer Edition | |
| Eurocom Sky X7E2 | |
| Alienware 15 R3 Max-Q | |
| Asus GL503VD-DB74 | |
| Dell Inspiron 15 7000 7577 | |
| AMD Ryzen 1800X - Asus Crosshair VI Hero | |
| Asus GL702ZC-GC104T | |
| wPrime 2.10 - 1024m | |
| Dell Inspiron 15 7000 7577 | |
| Eurocom Tornado F5 Killer Edition | |
| Asus GL503VD-DB74 | |
| Eurocom Sky X7E2 | |
| Smart7 Karme GX17E G2 | |
| Eurocom Tornado F5 | |
| Eurocom Sky X4C | |
| Eurocom Sky X9C | |
| AMD Ryzen 1800X - Asus Crosshair VI Hero | |
* ... mindre är bättre
| PCMark 8 | |
| Home Score Accelerated v2 | |
| Eurocom Sky X4C | |
| Acer Predator 15 G9-593-751X | |
| EVGA SC15 | |
| MSI GT62VR 7RE-223 | |
| Eurocom Sky X9C | |
| Alienware 15 R3 | |
| Asus Strix GL502VS-FY032T | |
| Work Score Accelerated v2 | |
| Acer Predator 15 G9-593-751X | |
| MSI GT62VR 7RE-223 | |
| EVGA SC15 | |
| Alienware 15 R3 | |
| Eurocom Sky X4C | |
| Eurocom Sky X9C | |
| Asus Strix GL502VS-FY032T | |
| Creative Score Accelerated v2 | |
| Eurocom Sky X9C | |
| Eurocom Sky X4C | |
| Acer Predator 15 G9-593-751X | |
| MSI GT62VR 7RE-223 | |
| Alienware 15 R3 | |
| EVGA SC15 | |
| PCMark 10 - Score | |
| Eurocom Sky X4C | |
| Eurocom Sky X9C | |
| PCMark 8 Home Score Accelerated v2 | 5225 poäng | |
| PCMark 8 Creative Score Accelerated v2 | 9222 poäng | |
| PCMark 8 Work Score Accelerated v2 | 5181 poäng | |
| PCMark 10 Score | 6620 poäng | |
Hjälp | ||
| Eurocom Sky X4C Samsung SSD 960 Pro 1TB m.2 NVMe | Acer Predator 15 G9-593-751X Samsung SM951 MZVPV256HDGL m.2 PCI-e | MSI GT62VR 7RE-223 Samsung SSD PM871a MZNLN256HMHQ | Asus Strix GL502VS-FY032T SanDisk SD8SNAT256G1002 | EVGA SC15 Toshiba NVMe THNSN5256GPU7 | |
|---|---|---|---|---|---|
| AS SSD | -30% | -74% | -123% | -35% | |
| Copy Game MB/s (MB/s) | 1055 | 1091 3% | 377.8 -64% | 977 -7% | |
| Copy Program MB/s (MB/s) | 467.2 | 488.6 5% | 199 -57% | 442.3 -5% | |
| Copy ISO MB/s (MB/s) | 1908 | 1575 -17% | 354.7 -81% | 1071 -44% | |
| Score Total (Points) | 4615 | 2574 -44% | 1019 -78% | 598 -87% | 2474 -46% |
| Score Write (Points) | 1703 | 570 -67% | 304 -82% | 288 -83% | 896 -47% |
| Score Read (Points) | 1945 | 1350 -31% | 472 -76% | 207 -89% | 1081 -44% |
| Access Time Write * (ms) | 0.03 | 0.032 -7% | 0.037 -23% | 0.161 -437% | 0.035 -17% |
| Access Time Read * (ms) | 0.032 | 0.059 -84% | 0.1 -213% | 0.097 -203% | 0.054 -69% |
| 4K-64 Write (MB/s) | 1375 | 346 -75% | 171.6 -88% | 191.8 -86% | 706 -49% |
| 4K-64 Read (MB/s) | 1646 | 1109 -33% | 383.4 -77% | 140.7 -91% | 822 -50% |
| 4K Write (MB/s) | 129.6 | 117.3 -9% | 104 -20% | 65.5 -49% | 95.5 -26% |
| 4K Read (MB/s) | 44.83 | 46.35 3% | 37.2 -17% | 16.31 -64% | 39.13 -13% |
| Seq Write (MB/s) | 1989 | 1067 -46% | 288.2 -86% | 309.9 -84% | 943 -53% |
| Seq Read (MB/s) | 2541 | 1941 -24% | 510 -80% | 504 -80% | 2203 -13% |
* ... mindre är bättre

| 3DMark 11 Performance | 22125 poäng | |
| 3DMark Ice Storm Standard Score | 194644 poäng | |
| 3DMark Cloud Gate Standard Score | 41694 poäng | |
| 3DMark Fire Strike Score | 18551 poäng | |
| 3DMark Fire Strike Extreme Score | 9551 poäng | |
Hjälp | ||
| Rise of the Tomb Raider - 3840x2160 High Preset AA:FX AF:4x | |
| Eurocom Sky X9C | |
| Nvidia GeForce GTX 1080 Ti Founders Edition | |
| Nvidia GeForce GTX 1080 Ti Founders Edition | |
| Eurocom Sky X4C | |
| Nvidia GeForce GTX 1080 Founders Edition | |
| Nvidia GeForce GTX 1080 Founders Edition | |
| Nvidia GeForce GTX 1070 Ti Founders Edition | |
| Asus Zephyrus GX501 | |
| Eurocom Q5 | |
| Fallout 4 - 3840x2160 High Preset AA:T AF:16x | |
| Eurocom Sky X9C | |
| Nvidia GeForce GTX 1080 Ti Founders Edition | |
| Nvidia GeForce GTX 1080 Founders Edition | |
| Eurocom Sky X4C | |
| Eurocom Q5 | |
| låg | med. | hög | ultra | 4K | |
|---|---|---|---|---|---|
| BioShock Infinite (2013) | 181.2 | ||||
| Metro: Last Light (2013) | 141.1 | ||||
| Thief (2014) | 127.6 | ||||
| The Witcher 3 (2015) | 75.3 | 53.4 | |||
| Batman: Arkham Knight (2015) | 101 | 55 | |||
| Metal Gear Solid V (2015) | 60 | 60 | |||
| Fallout 4 (2015) | 123.4 | 53.4 | |||
| Rise of the Tomb Raider (2016) | 111.7 | 50.6 | |||
| Overwatch (2016) | 195.6 | 92.1 | |||
| Mafia 3 (2016) | 81.2 | 32.5 | |||
| Prey (2017) | 143 | 70.9 | |||
| Middle-earth: Shadow of War (2017) | 94 | 37 | |||
| Destiny 2 (2017) | 139.1 | 38.4 |
Ljudnivå
| Låg belastning |
| 28.6 / 28.6 / 31.1 dB(A) |
| Hårddisk |
| 0 dB(A) |
| Hög belastning |
| 42.2 / 50 dB(A) |
 | ||
30 dB tyst 40 dB(A) hörbar 50 dB(A) högt ljud |
||
min: | ||
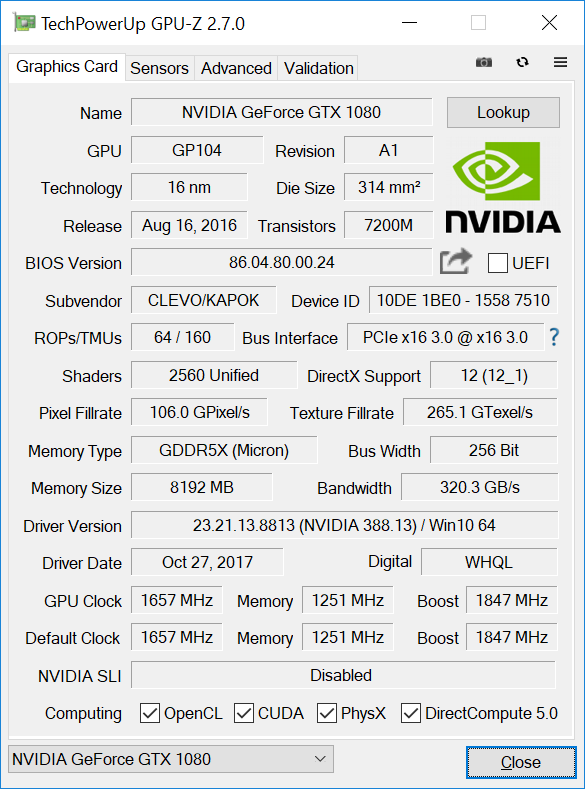
| Eurocom Sky X4C GeForce GTX 1080 Mobile, i7-8700K, Samsung SSD 960 Pro 1TB m.2 NVMe | Alienware 15 R3 Max-Q GeForce GTX 1080 Max-Q, i7-7820HK, LiteOn CX2-8B256 | MSI GT62VR 7RE-223 GeForce GTX 1070 Mobile, i7-7700HQ, Samsung SSD PM871a MZNLN256HMHQ | Asus Strix GL502VS-FY032T GeForce GTX 1070 Mobile, 6700HQ, SanDisk SD8SNAT256G1002 | EVGA SC15 GeForce GTX 1060 Mobile, i7-7700HQ, Toshiba NVMe THNSN5256GPU7 | Alienware 15 R3 GeForce GTX 1070 Mobile, i7-7700HQ | |
|---|---|---|---|---|---|---|
| Noise | -6% | -8% | -6% | 1% | -13% | |
| av / miljö * (dB) | 28.6 | 29 -1% | 30 -5% | 30 -5% | 28 2% | 30 -5% |
| Idle Minimum * (dB) | 28.6 | 32 -12% | 34 -19% | 32 -12% | 31.9 -12% | 31 -8% |
| Idle Average * (dB) | 28.6 | 33 -15% | 35 -22% | 33 -15% | 32 -12% | 32 -12% |
| Idle Maximum * (dB) | 31.1 | 35 -13% | 36 -16% | 34 -9% | 32 -3% | 42 -35% |
| Load Average * (dB) | 42.2 | 46 -9% | 40 5% | 39 8% | 36.5 14% | 49 -16% |
| Witcher 3 ultra * (dB) | 53.8 | 48 11% | 40.3 25% | |||
| Load Maximum * (dB) | 50 | 50 -0% | 46 8% | 51 -2% | 53.4 -7% | 50 -0% |
* ... mindre är bättre
(±) Den maximala temperaturen på ovansidan är 43.8 °C / 111 F, jämfört med genomsnittet av 40.4 °C / 105 F , allt från 21.2 till 68.8 °C för klassen Gaming.
(-) Botten värms upp till maximalt 49.6 °C / 121 F, jämfört med genomsnittet av 43.2 °C / 110 F
(+) Vid tomgångsbruk är medeltemperaturen för ovansidan 26.4 °C / 80 F, jämfört med enhetsgenomsnittet på 33.9 °C / ### class_avg_f### F.
(+) När du spelar The Witcher 3 är medeltemperaturen för ovansidan 30 °C / 86 F, jämfört med enhetsgenomsnittet på 33.9 °C / ## #class_avg_f### F.
(+) Handledsstöden och pekplattan är kallare än hudtemperaturen med maximalt 27.6 °C / 81.7 F och är därför svala att ta på.
(±) Medeltemperaturen för handledsstödsområdet på liknande enheter var 28.8 °C / 83.8 F (+1.2 °C / 2.1 F).
| Av/Standby | |
| Låg belastning | |
| Hög belastning |
|
Förklaring:
min: | |
| Eurocom Sky X4C i7-8700K, GeForce GTX 1080 Mobile, Samsung SSD 960 Pro 1TB m.2 NVMe, IPS, 3840x2160, 15.6" | Alienware 15 R3 Max-Q i7-7820HK, GeForce GTX 1080 Max-Q, LiteOn CX2-8B256, IPS, 1920x1080, 15.6" | MSI GT62VR 7RE-223 i7-7700HQ, GeForce GTX 1070 Mobile, Samsung SSD PM871a MZNLN256HMHQ, IPS, 1920x1080, 15.6" | EVGA SC15 i7-7700HQ, GeForce GTX 1060 Mobile, Toshiba NVMe THNSN5256GPU7, , 1920x1080, 15.6" | Alienware 15 R3 i7-7700HQ, GeForce GTX 1070 Mobile, , TN, 1920x1080, 15.6" | Eurocom Tornado F5 Killer Edition i5-7600K, GeForce GTX 1080 Mobile, Samsung SSD 960 Evo 250GB m.2 NVMe, IPS, 3840x2160, 15.6" | |
|---|---|---|---|---|---|---|
| Power Consumption | 18% | 27% | 27% | 28% | -8% | |
| Idle Minimum * (Watt) | 30.2 | 22 27% | 20 34% | 25.8 15% | 19 37% | 28.4 6% |
| Idle Average * (Watt) | 34.7 | 26 25% | 24 31% | 26.6 23% | 23 34% | 32 8% |
| Idle Maximum * (Watt) | 37.8 | 33 13% | 29 23% | 26.7 29% | 29 23% | 33.5 11% |
| Load Average * (Watt) | 130.3 | 86 34% | 82 37% | 80.3 38% | 85 35% | 190.9 -47% |
| Witcher 3 ultra * (Watt) | 172.2 | 159 8% | 121.2 30% | |||
| Load Maximum * (Watt) | 217.7 | 215 1% | 193 11% | 159.3 27% | 192 12% | 259.4 -19% |
* ... mindre är bättre
| Eurocom Sky X4C i7-8700K, GeForce GTX 1080 Mobile, 82 Wh | Alienware 15 R3 Max-Q i7-7820HK, GeForce GTX 1080 Max-Q, 99 Wh | MSI GT62VR 7RE-223 i7-7700HQ, GeForce GTX 1070 Mobile, 75 Wh | Asus Strix GL502VS-FY032T 6700HQ, GeForce GTX 1070 Mobile, 62 Wh | EVGA SC15 i7-7700HQ, GeForce GTX 1060 Mobile, 62 Wh | Acer Predator 15 G9-593-751X i7-7700HQ, GeForce GTX 1070 Mobile, 90 Wh | |
|---|---|---|---|---|---|---|
| Batteridrifttid | 94% | 61% | 12% | 10% | 112% | |
| Reader / Idle (h) | 3 | 7.1 137% | 6.3 110% | 4.1 37% | 3.7 23% | 8.4 180% |
| WiFi v1.3 (h) | 2.6 | 5.4 108% | 4.1 58% | 3.3 27% | 2.8 8% | 5.5 112% |
| Load (h) | 1.4 | 1.9 36% | 1.6 14% | 1 -29% | 1.4 0% | 2 43% |
För
Emot
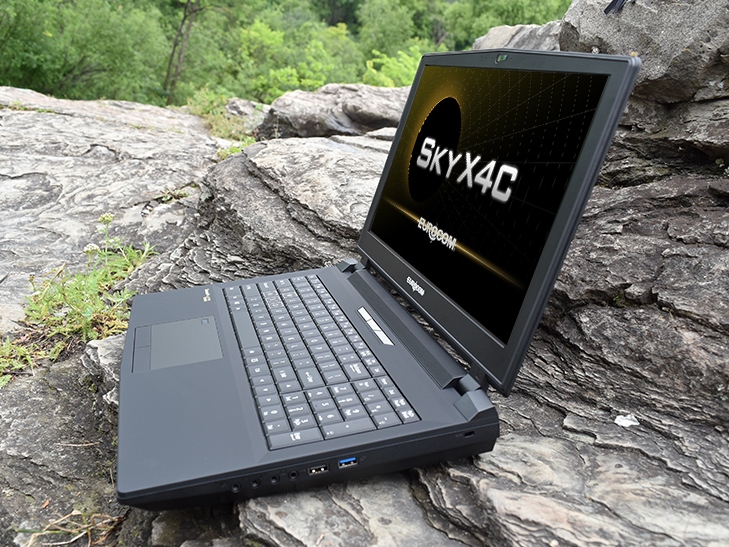
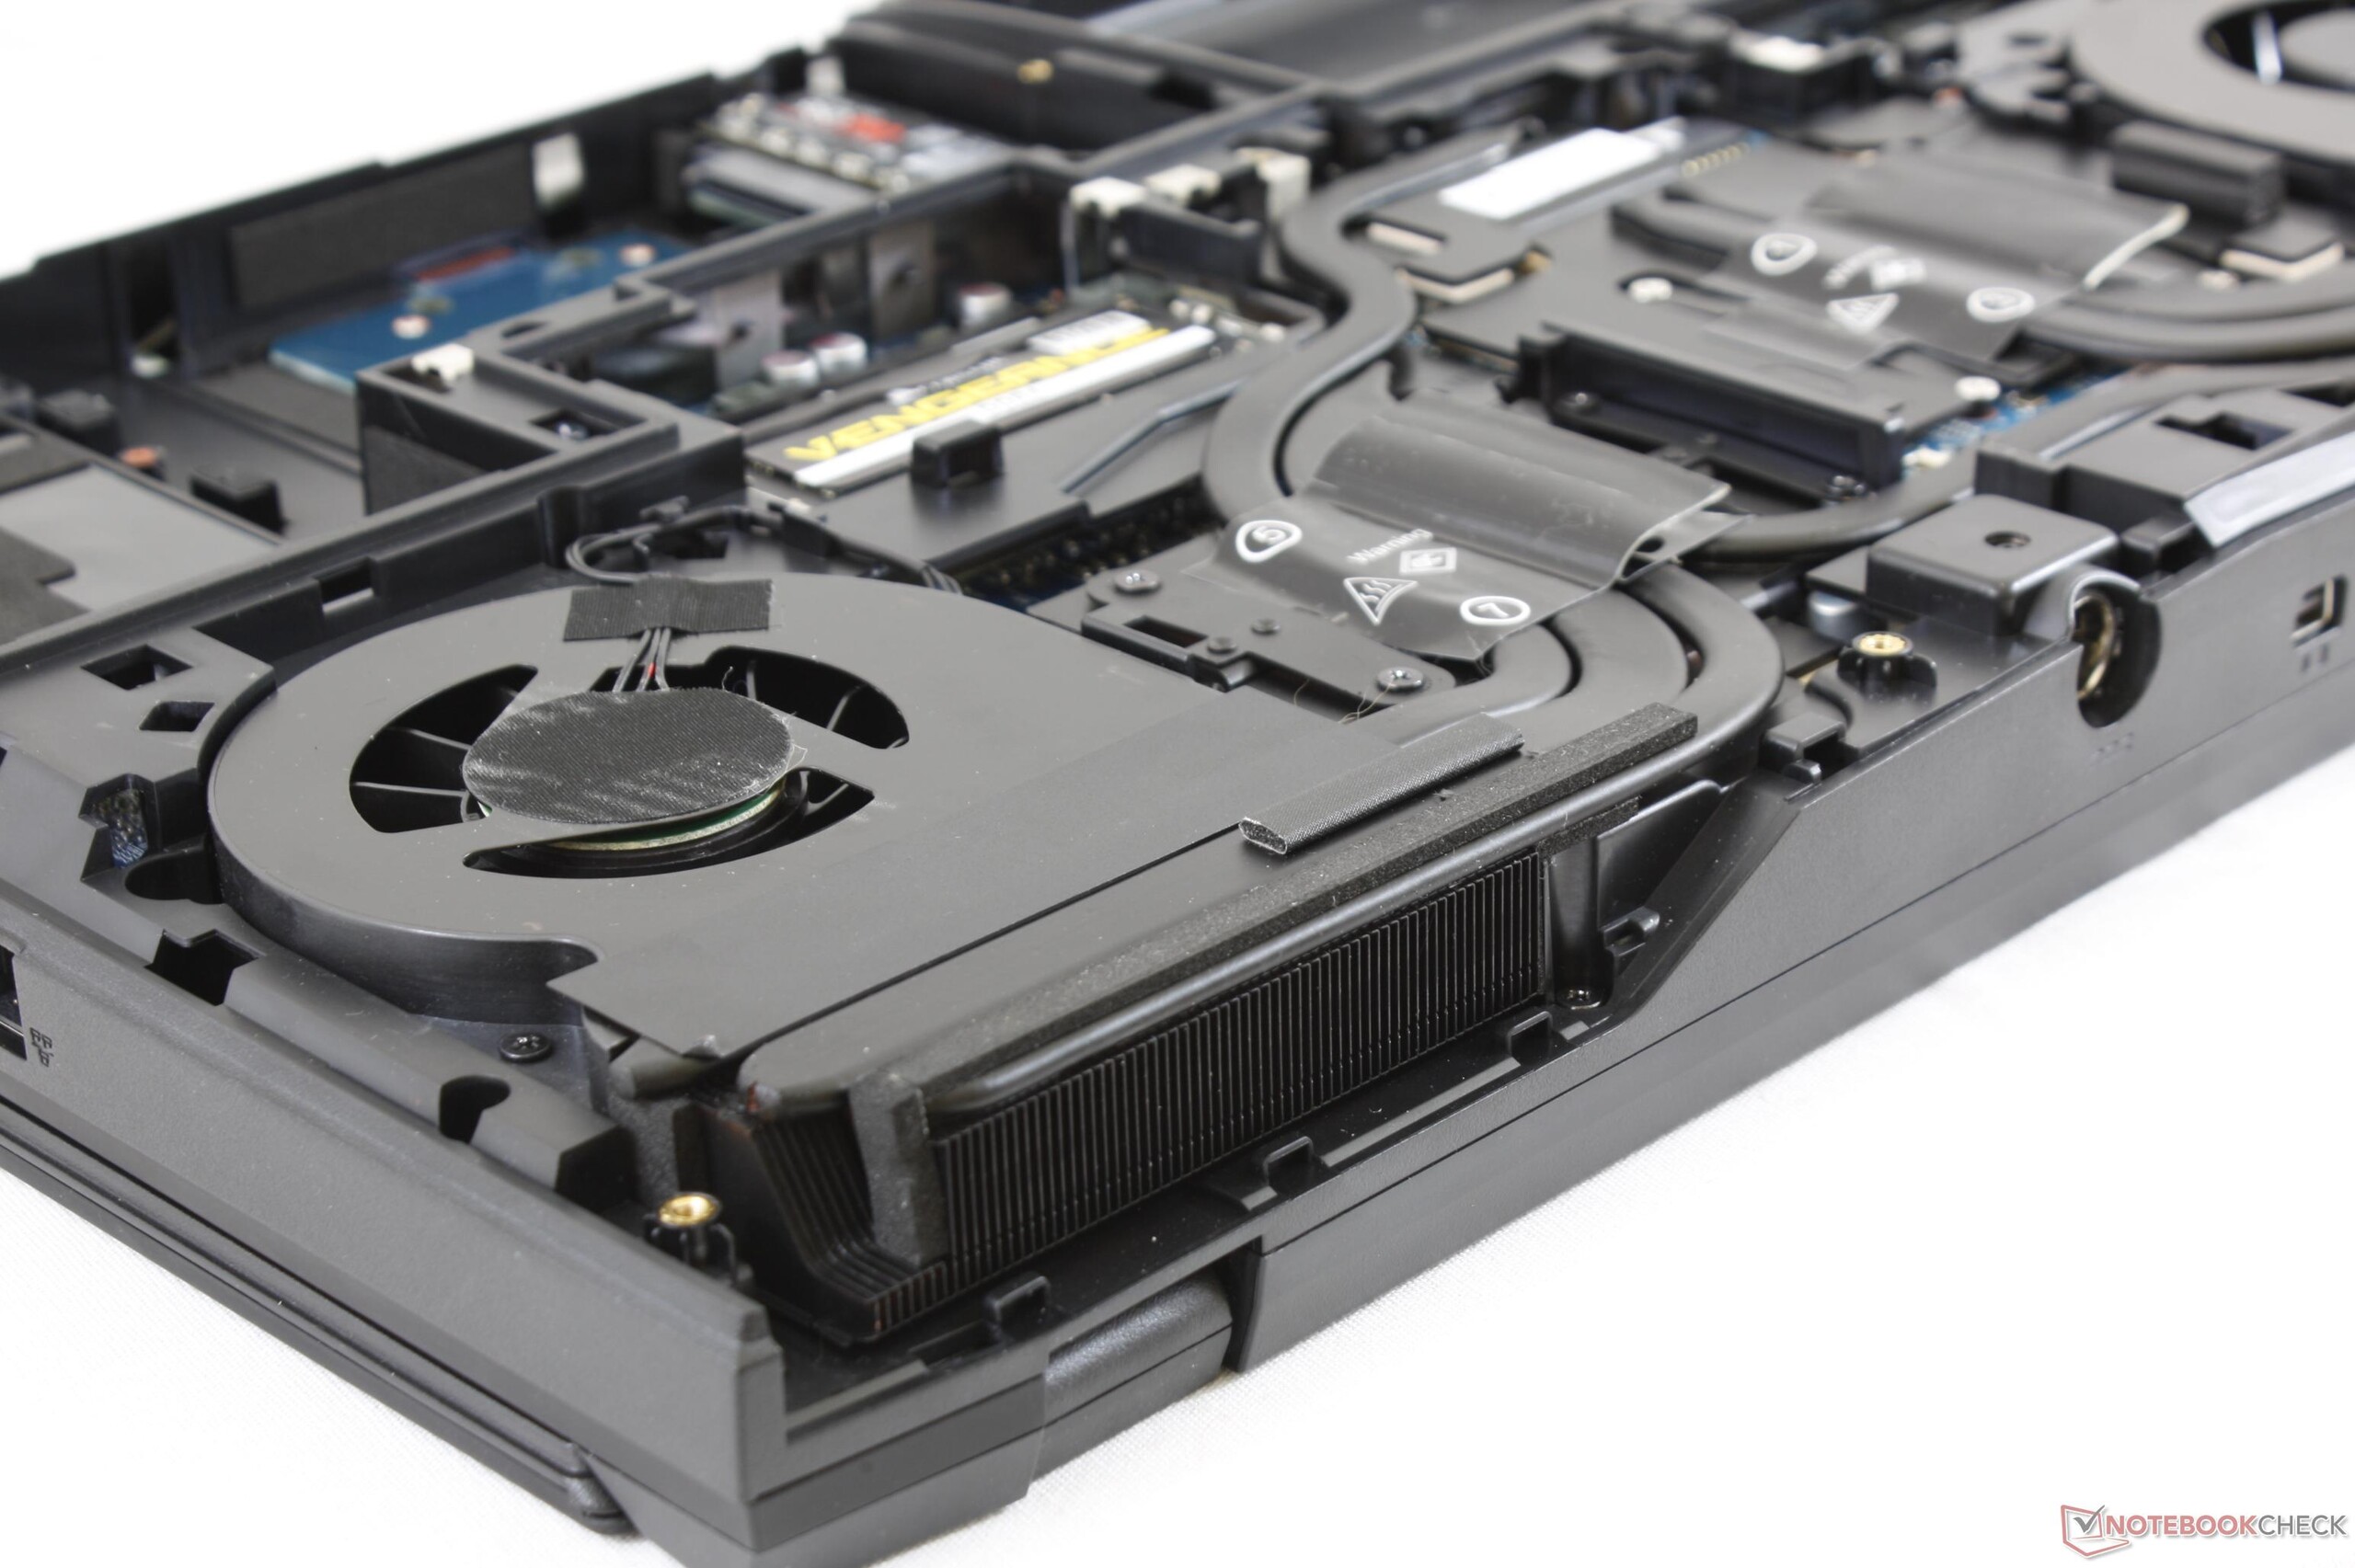
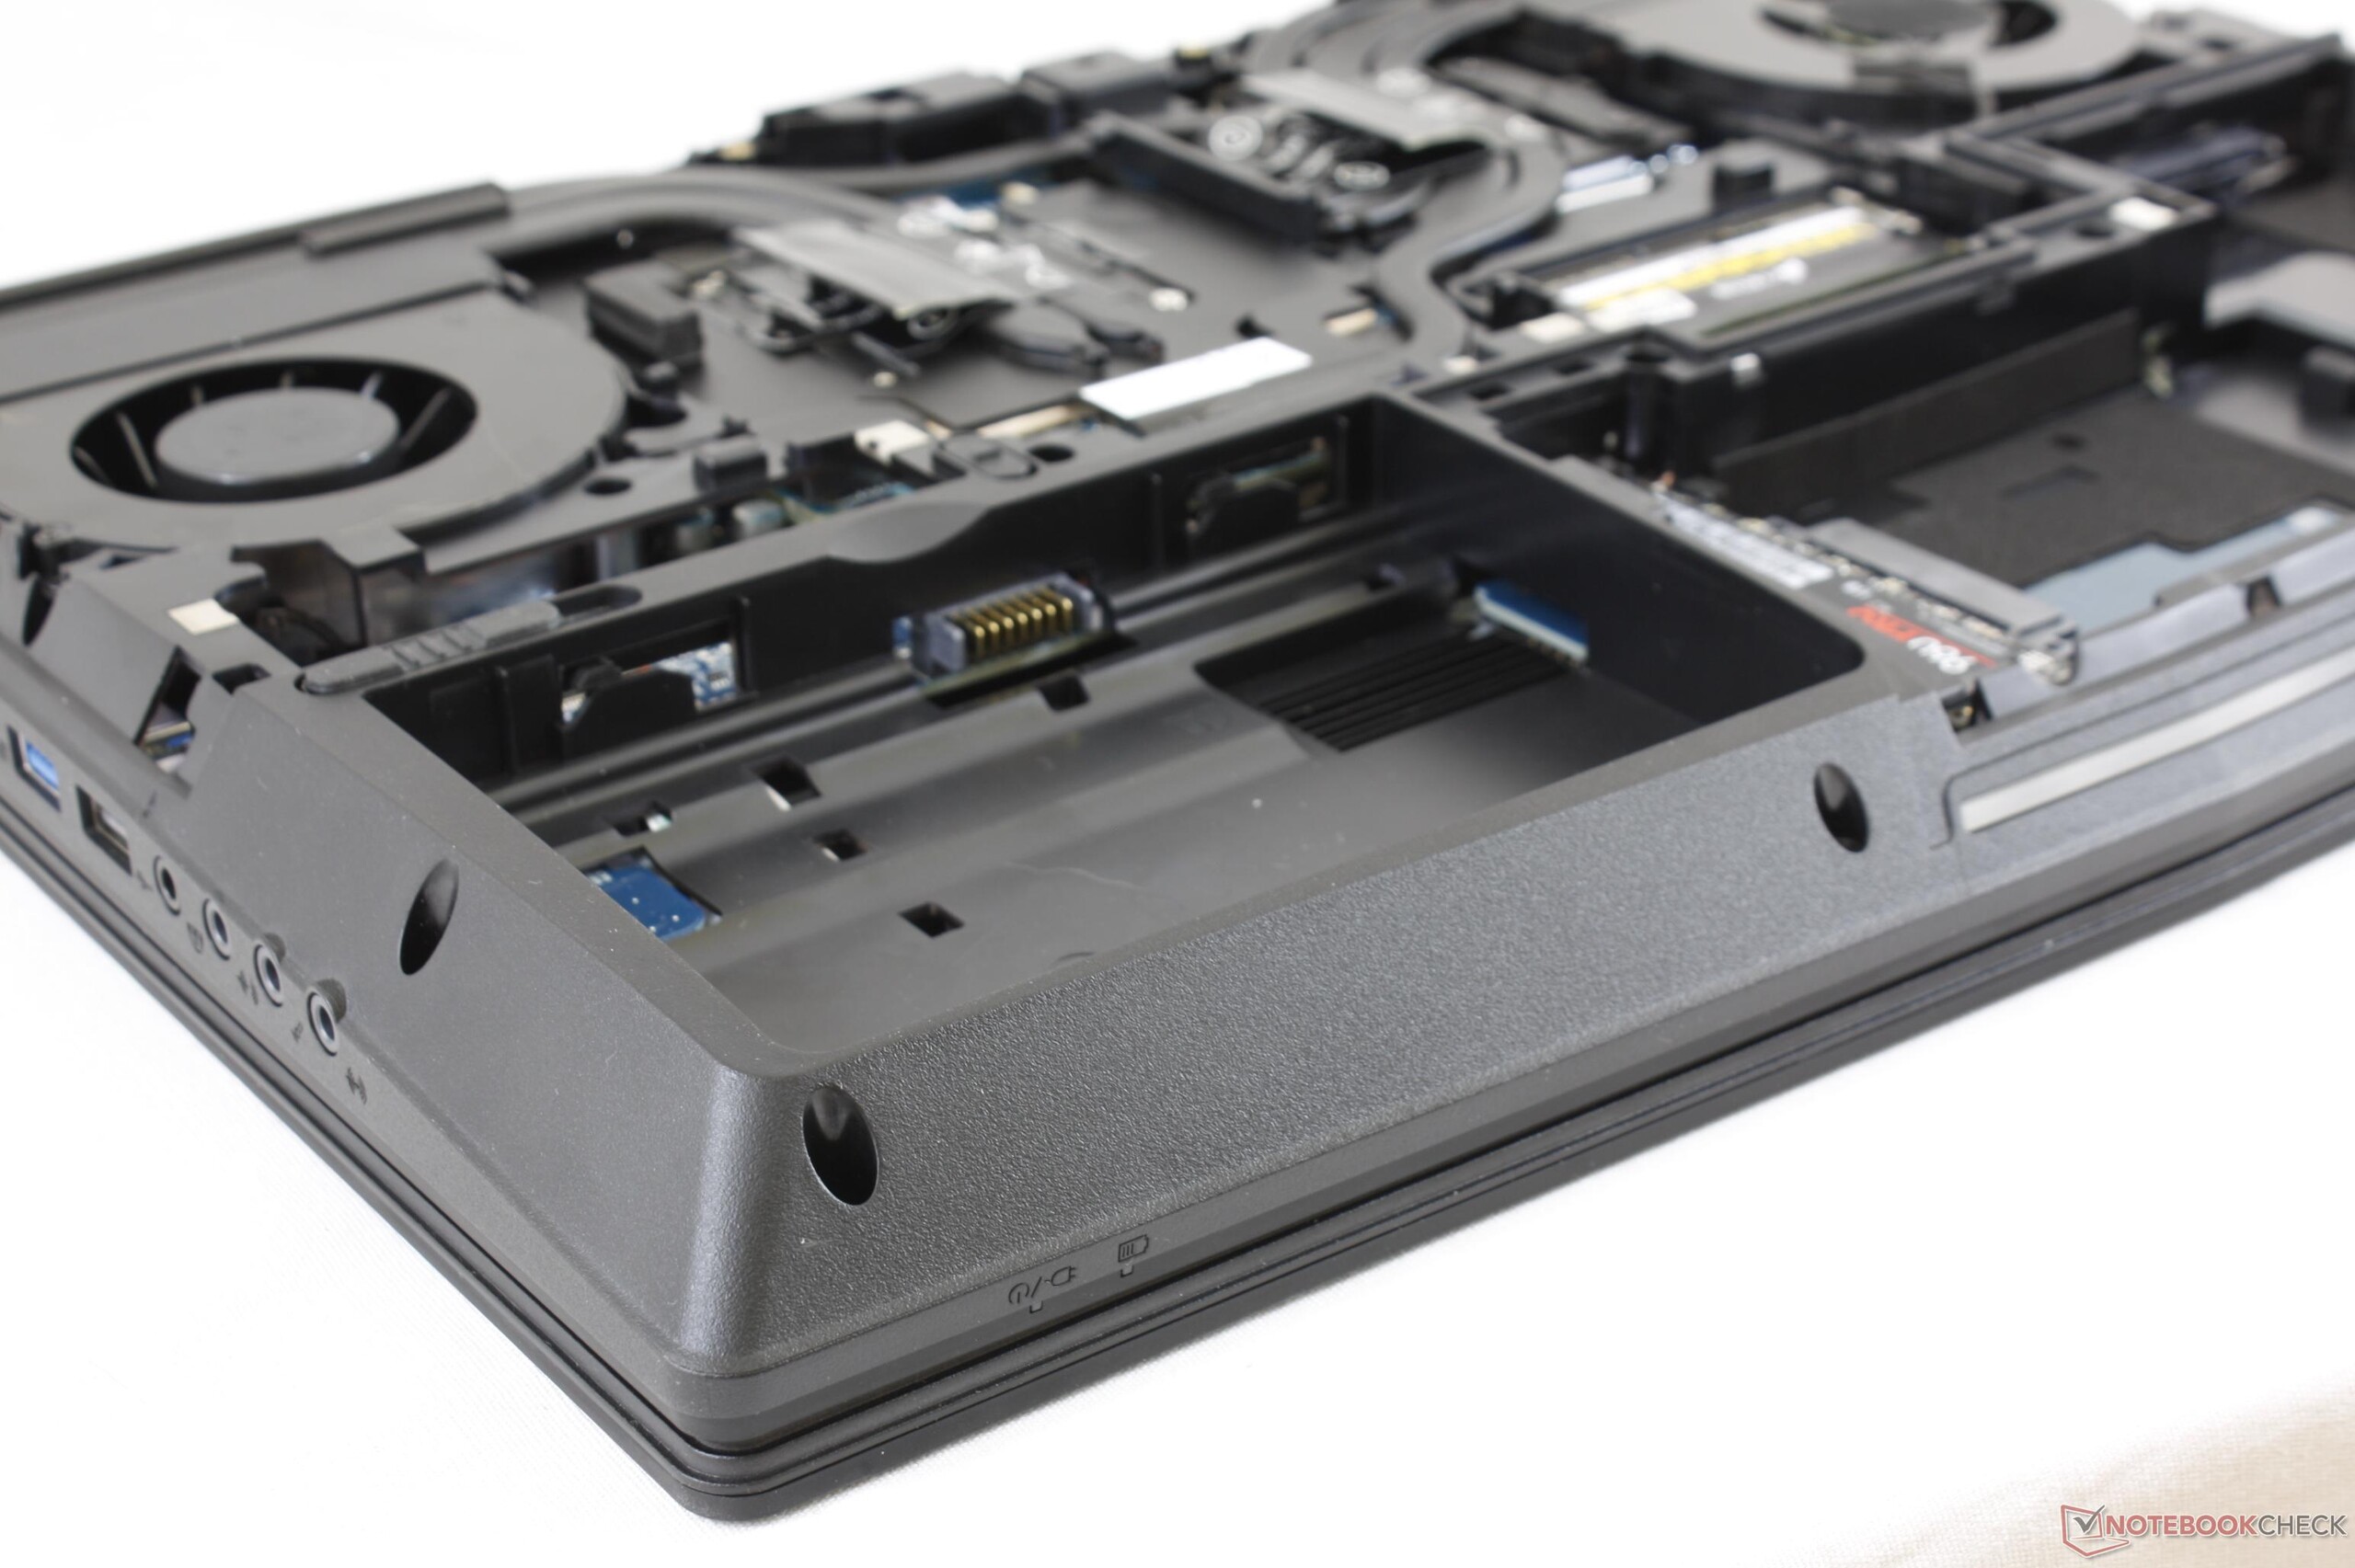
Sky X4C är den kraftfullaste och mest mångsidiga laptop på 15.6 tum som finns tillgänglig på grund av dess desktop-lika uppgraderbarhet. Dess mångsidighet för både gamers och användare av professionella arbetsstationer samt dess inbyggda SIM-alternativ gör den till en unik modell i havet av spellaptops. Det finns inte en chans att större tillverkare som Lenovo, HP eller Dell någonsin skulle ge slutanvändaren de nivåer av servicemöjligheter och anpassning som generellt uppmuntas av modeller från Eurocom eller Clevo. Detta är trots allt en laptop för entusiaster.
Hur kraftfull Eurocom än må vara så börjar Clevo-chassit att visa sin ålder i fråga om funktioner. G-Sync är begränsat till vissa GPU:er och det finns inga alternativ för 3 ms/155 Hz-skärmar, inga alternativ för tryckkänslighet, ingen 10 Gbps RJ-45 och ingen tangentspecifik RGB-belysning eller dedikerade snabbknappar. En del användare kan uppfatta dessa alternativ som överflödiga, men vi förväntar oss diskbänken och mer därtill med tanke på datorns pris.
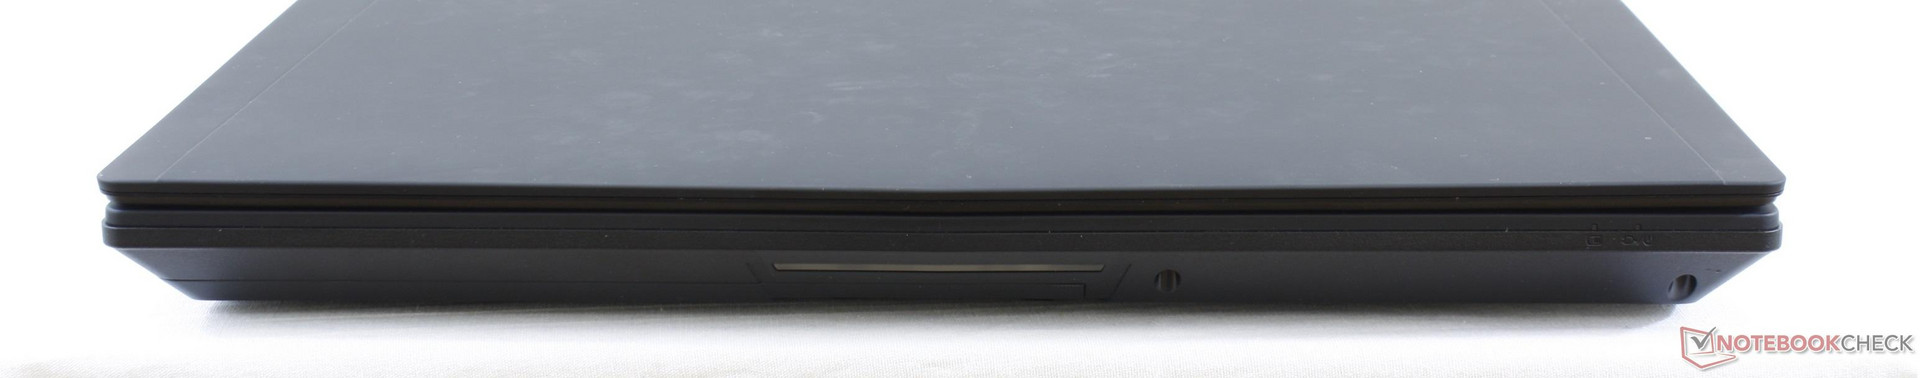
Själva hårdvaran har en del konstigheter som är värda att nämna. Det gummerade yttre locket är en blandad upplevelse då det drar åt sig fett och damm och den ojämna bleedingen hos bakgrundsbelysningen är oförlåtlig hos en entusiast-laptop. Den blanka-men-gryniga 4K UHD-skärmen tilltalar inte och förändringarna i energiförbrukning vid extrem processorbelastning gör oss en aning oroade över enhetens prestanda när den kör både CPU och GPU på 100 procent under längre perioder.
Det här är laptopen att se upp till från ett rent service- och prestanda-perspektiv. Men det finns fortfarande plats för förbättringar i fråga om funktioner och fläktljud.
Eurocom Sky X4C
- 02/11/2018 v6 (old)
Allen Ngo
Price comparison
