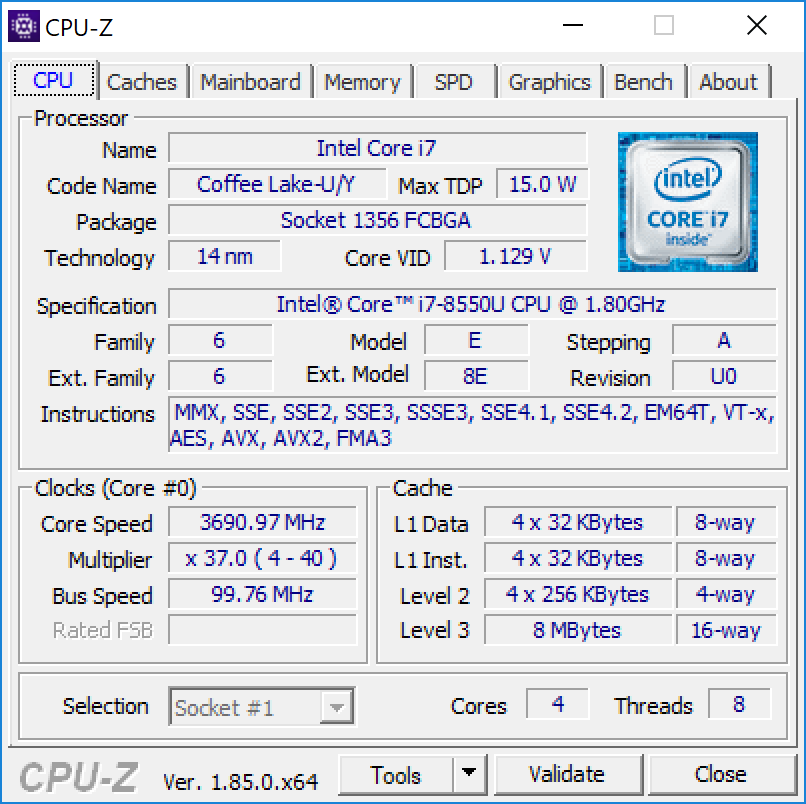
Test: HP Spectre x360 15 2018 (i7-8550U, GeForce MX150) Omvandlingsbar (Sammanfattning)
| SD Card Reader | |
| average JPG Copy Test (av. of 3 runs) | |
| HP Spectre x360 15-ch011nr (Toshiba Exceria Pro SDXC 64 GB UHS-II) | |
| HP Spectre x360 15t-bl100 (Toshiba Exceria Pro SDXC 64 GB UHS-II) | |
| Dell XPS 15 2018 i5 FHD 97Wh | |
| maximum AS SSD Seq Read Test (1GB) | |
| HP Spectre x360 15t-bl100 (Toshiba Exceria Pro SDXC 64 GB UHS-II) | |
| HP Spectre x360 15-ch011nr (Toshiba Exceria Pro SDXC 64 GB UHS-II) | |
| Dell XPS 15 2018 i5 FHD 97Wh | |
| Networking | |
| iperf3 transmit AX12 | |
| Dell XPS 15 2018 i5 FHD 97Wh | |
| HP Spectre x360 15-ch011nr | |
| Gigabyte Aero 15X v8 | |
| iperf3 receive AX12 | |
| Gigabyte Aero 15X v8 | |
| HP Spectre x360 15-ch011nr | |
| Dell XPS 15 2018 i5 FHD 97Wh | |
| |||||||||||||||||||||||||
Distribution av ljusstyrkan: 84 %
Mitt på batteriet: 329.3 cd/m²
Kontrast: 1062:1 (Svärta: 0.31 cd/m²)
ΔE ColorChecker Calman: 4.78 | ∀{0.5-29.43 Ø4.72}
calibrated: 3.51
ΔE Greyscale Calman: 7.9 | ∀{0.09-98 Ø4.97}
90.4% sRGB (Argyll 1.6.3 3D)
58.8% AdobeRGB 1998 (Argyll 1.6.3 3D)
66.3% AdobeRGB 1998 (Argyll 3D)
90.7% sRGB (Argyll 3D)
68.5% Display P3 (Argyll 3D)
Gamma: 2.24
CCT: 8323 K
| HP Spectre x360 15-ch011nr BOE0730, IPS, 15.6", 3840x2160 | HP Spectre x360 15t-bl100 BOE06C3, IPS, 15.6", 3840x2160 | Dell XPS 15 2018 i5 FHD 97Wh Sharp SHP149A LQ156M1, LED IGZO IPS InfinityEdge, 15.6", 1920x1080 | Dell XPS 15 9575 i7-8705G Sharp SHP148D, IPS, 15.6", 3840x2160 | Gigabyte Aero 15X v8 LGD05C0, IPS, 15.6", 1920x1080 | Asus ZenBook Pro 15 UX580GE AU Optronics B156ZAN03.1, IPS, 15.6", 3840x2160 | |
|---|---|---|---|---|---|---|
| Display | -4% | 1% | 14% | -2% | 28% | |
| Display P3 Coverage (%) | 68.5 | 66.6 -3% | 66 -4% | 78.7 15% | 63.6 -7% | 85.9 25% |
| sRGB Coverage (%) | 90.7 | 86.9 -4% | 96.5 6% | 97.9 8% | 93.8 3% | 100 10% |
| AdobeRGB 1998 Coverage (%) | 66.3 | 63.5 -4% | 66.7 1% | 79.2 19% | 64.9 -2% | 99.1 49% |
| Response Times | -8% | -19% | -27% | 58% | 1% | |
| Response Time Grey 50% / Grey 80% * (ms) | 38 ? | 41.2 ? -8% | 49 ? -29% | 48.4 ? -27% | 16.8 ? 56% | 44 ? -16% |
| Response Time Black / White * (ms) | 27.6 ? | 29.6 ? -7% | 30 ? -9% | 34.8 ? -26% | 11.2 ? 59% | 22.8 ? 17% |
| PWM Frequency (Hz) | 943 ? | 1000 | 961 ? | 1000 ? | ||
| Screen | 10% | 28% | 29% | 22% | 14% | |
| Brightness middle (cd/m²) | 329.3 | 338.7 3% | 413 25% | 488 48% | 313 -5% | 357.6 9% |
| Brightness (cd/m²) | 316 | 325 3% | 378 20% | 440 39% | 300 -5% | 350 11% |
| Brightness Distribution (%) | 84 | 91 8% | 86 2% | 81 -4% | 78 -7% | 85 1% |
| Black Level * (cd/m²) | 0.31 | 0.28 10% | 0.29 6% | 0.3 3% | 0.33 -6% | 0.35 -13% |
| Contrast (:1) | 1062 | 1210 14% | 1424 34% | 1627 53% | 948 -11% | 1022 -4% |
| Colorchecker dE 2000 * | 4.78 | 4.9 -3% | 2.44 49% | 3.16 34% | 1.29 73% | 4.12 14% |
| Colorchecker dE 2000 max. * | 11.75 | 8.7 26% | 4.46 62% | 8.8 25% | 2.04 83% | 9.91 16% |
| Colorchecker dE 2000 calibrated * | 3.51 | 2.48 29% | 4.23 -21% | |||
| Greyscale dE 2000 * | 7.9 | 5.5 30% | 2.48 69% | 3.3 58% | 0.69 91% | 1.8 77% |
| Gamma | 2.24 98% | 2.08 106% | 2.43 91% | 2.178 101% | 2.43 91% | 2.17 101% |
| CCT | 8323 78% | 7498 87% | 7006 93% | 6811 95% | 6550 99% | 6613 98% |
| Color Space (Percent of AdobeRGB 1998) (%) | 58.8 | 63.5 8% | 62 5% | 71.7 22% | 60 2% | 87.5 49% |
| Color Space (Percent of sRGB) (%) | 90.4 | 86.92 -4% | 96 6% | 97.9 8% | 94 4% | 100 11% |
| Totalt genomsnitt (program/inställningar) | -1% /
5% | 3% /
17% | 5% /
18% | 26% /
22% | 14% /
15% |
* ... mindre är bättre
Visa svarstider
| ↔ Svarstid svart till vitt | ||
|---|---|---|
| 27.6 ms ... stiga ↗ och falla ↘ kombinerat | ↗ 15.6 ms stiga | 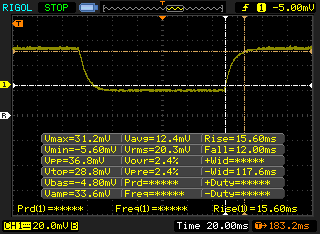 |
| ↘ 12 ms hösten | ||
| Skärmen visar relativt långsamma svarsfrekvenser i våra tester och kan vara för långsam för spelare. I jämförelse sträcker sig alla testade enheter från 0.1 (minst) till 240 (maximalt) ms. » 70 % av alla enheter är bättre. Detta innebär att den uppmätta svarstiden är sämre än genomsnittet av alla testade enheter (19.8 ms). | ||
| ↔ Svarstid 50 % grått till 80 % grått | ||
| 38 ms ... stiga ↗ och falla ↘ kombinerat | ↗ 20.4 ms stiga | 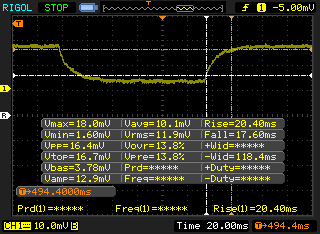 |
| ↘ 17.6 ms hösten | ||
| Skärmen visar långsamma svarsfrekvenser i våra tester och kommer att vara otillfredsställande för spelare. I jämförelse sträcker sig alla testade enheter från 0.165 (minst) till 636 (maximalt) ms. » 55 % av alla enheter är bättre. Detta innebär att den uppmätta svarstiden är sämre än genomsnittet av alla testade enheter (31 ms). | ||
Skärmflimmer / PWM (Puls-Width Modulation)
| Skärmflimmer / PWM upptäckt | 943 Hz | ≤ 99 % ljusstyrka inställning | 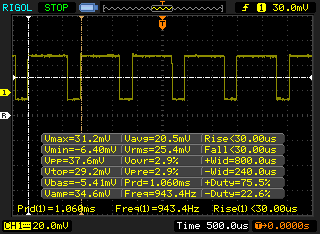 |
Displayens bakgrundsbelysning flimrar vid 943 Hz (i värsta fall, t.ex. med PWM) Flimrande upptäckt vid en ljusstyrkeinställning på 99 % och lägre. Det ska inte finnas något flimmer eller PWM över denna ljusstyrkeinställning. Frekvensen för 943 Hz är ganska hög, så de flesta användare som är känsliga för PWM bör inte märka något flimmer. Som jämförelse: 52 % av alla testade enheter använder inte PWM för att dämpa skärmen. Om PWM upptäcktes mättes ett medelvärde av 7778 (minst: 5 - maximum: 343500) Hz. | |||
| PCMark 8 Home Score Accelerated v2 | 3482 poäng | |
| PCMark 8 Work Score Accelerated v2 | 4323 poäng | |
| PCMark 10 Score | 3938 poäng | |
Hjälp | ||
| HP Spectre x360 15-ch011nr SK hynix PC401 NVMe 500 GB | HP Spectre x360 15t-bl100 Samsung PM961 NVMe MZVLW512HMJP | Dell XPS 15 9575 i7-8705G SK hynix PC401 NVMe 500 GB | Gigabyte Aero 15X v8 Toshiba NVMe THNSN5512GPU7 | Dell XPS 15 2018 i5 FHD 97Wh Lite-On CA3-8D256-Q11 | |
|---|---|---|---|---|---|
| AS SSD | 53% | 3% | 0% | -174% | |
| Copy Game MB/s (MB/s) | 1042 | 1134 9% | 944 -9% | 465.9 -55% | |
| Copy Program MB/s (MB/s) | 486.8 | 534 10% | 487.9 0% | 117.2 -76% | |
| Copy ISO MB/s (MB/s) | 1668 | 1936 16% | 1523 -9% | 632 -62% | |
| Score Total (Points) | 2037 | 3781 86% | 2132 5% | 2536 24% | 750 -63% |
| Score Write (Points) | 757 | 1556 106% | 807 7% | 939 24% | 58 -92% |
| Score Read (Points) | 859 | 1493 74% | 921 7% | 1092 27% | 492 -43% |
| Access Time Write * (ms) | 0.051 | 0.026 49% | 0.051 -0% | 0.046 10% | 0.889 -1643% |
| Access Time Read * (ms) | 0.054 | 0.04 26% | 0.044 19% | 0.119 -120% | 0.086 -59% |
| 4K-64 Write (MB/s) | 545 | 1262 132% | 637 17% | 742 36% | 19.19 -96% |
| 4K-64 Read (MB/s) | 646 | 1206 87% | 649 0% | 847 31% | 301.8 -53% |
| 4K Write (MB/s) | 93.2 | 141.1 51% | 94.3 1% | 80.4 -14% | 5.12 -95% |
| 4K Read (MB/s) | 38.76 | 51.9 34% | 41.38 7% | 23.36 -40% | 32.5 -16% |
| Seq Write (MB/s) | 1189 | 1530 29% | 752 -37% | 1163 -2% | 340.3 -71% |
| Seq Read (MB/s) | 1739 | 2342 35% | 2302 32% | 2213 27% | 1574 -9% |
* ... mindre är bättre

| 3DMark 11 | |
| 1280x720 Performance GPU | |
| MSI GV62 8RE-016US | |
| Dell XPS 15 9575 i7-8705G | |
| Dell XPS 15 9575 i5-8305G | |
| Asus ZenBook Pro 15 UX580GE | |
| Asus Zenbook UX510UW-CN044T | |
| HP Spectre x360 15-ch011nr | |
| HP Spectre x360 15t-bl100 | |
| Acer Aspire E5-575G-549D | |
| Genomsnitt NVIDIA GeForce MX150 (2796 - 4905, n=47) | |
| Acer Swift 3 SF315-41-R6J9 | |
| 1280x720 Performance Combined | |
| Asus ZenBook Pro 15 UX580GE | |
| Dell XPS 15 9575 i7-8705G | |
| MSI GV62 8RE-016US | |
| Dell XPS 15 9575 i5-8305G | |
| Asus Zenbook UX510UW-CN044T | |
| HP Spectre x360 15-ch011nr | |
| HP Spectre x360 15t-bl100 | |
| Acer Aspire E5-575G-549D | |
| Genomsnitt NVIDIA GeForce MX150 (2820 - 4421, n=46) | |
| Acer Swift 3 SF315-41-R6J9 | |
| 3DMark | |
| 1280x720 Cloud Gate Standard Graphics | |
| MSI GV62 8RE-016US | |
| Dell XPS 15 9575 i5-8305G | |
| Asus ZenBook Pro 15 UX580GE | |
| Dell XPS 15 9575 i7-8705G | |
| Asus Zenbook UX510UW-CN044T | |
| Acer Aspire E5-575G-549D | |
| HP Spectre x360 15t-bl100 | |
| HP Spectre x360 15-ch011nr | |
| Genomsnitt NVIDIA GeForce MX150 (16227 - 22183, n=43) | |
| Acer Swift 3 SF315-41-R6J9 | |
| 1920x1080 Fire Strike Graphics | |
| MSI GV62 8RE-016US | |
| Dell XPS 15 9575 i5-8305G | |
| Dell XPS 15 9575 i7-8705G | |
| Asus ZenBook Pro 15 UX580GE | |
| Asus Zenbook UX510UW-CN044T | |
| HP Spectre x360 15-ch011nr | |
| Acer Aspire E5-575G-549D | |
| HP Spectre x360 15t-bl100 | |
| Genomsnitt NVIDIA GeForce MX150 (2323 - 3739, n=44) | |
| Acer Swift 3 SF315-41-R6J9 | |
| 3DMark 11 Performance | 4969 poäng | |
| 3DMark Cloud Gate Standard Score | 12588 poäng | |
| 3DMark Fire Strike Score | 3267 poäng | |
Hjälp | ||
| låg | med. | hög | ultra | |
|---|---|---|---|---|
| BioShock Infinite (2013) | 197.4 | 114.2 | 96 | 35.2 |
| Batman: Arkham Knight (2015) | 60 | 51 | 20 | |
| Rise of the Tomb Raider (2016) | 67.4 | 43.1 | 23 | 18.5 |
Ljudnivå
| Låg belastning |
| 29.2 / 29.2 / 29.2 dB(A) |
| Hög belastning |
| 29.2 / 45.7 dB(A) |
 | ||
30 dB tyst 40 dB(A) hörbar 50 dB(A) högt ljud |
||
min: | ||
| HP Spectre x360 15-ch011nr GeForce MX150, i5-8550U, SK hynix PC401 NVMe 500 GB | HP Spectre x360 15t-bl100 GeForce MX150, i5-8550U, Samsung PM961 NVMe MZVLW512HMJP | Dell XPS 15 9575 i7-8705G Vega M GL / 870, i7-8705G, SK hynix PC401 NVMe 500 GB | Gigabyte Aero 15X v8 GeForce GTX 1070 Max-Q, i7-8750H, Toshiba NVMe THNSN5512GPU7 | Asus ZenBook Pro 15 UX580GE GeForce GTX 1050 Ti Mobile, i9-8950HK, Samsung SSD PM961 1TB M.2 PCIe 3.0 x4 NVMe (MZVLW1T0) | Dell XPS 15 2018 i5 FHD 97Wh GeForce GTX 1050 Mobile, i5-8300H, Lite-On CA3-8D256-Q11 | |
|---|---|---|---|---|---|---|
| Noise | -2% | -1% | -21% | -9% | -7% | |
| av / miljö * (dB) | 28.6 | 28.4 1% | 28.2 1% | 29 -1% | 28 2% | 30.3 -6% |
| Idle Minimum * (dB) | 29.2 | 28.4 3% | 28.2 3% | 30 -3% | 28.6 2% | 30.3 -4% |
| Idle Average * (dB) | 29.2 | 28.4 3% | 28.2 3% | 31 -6% | 29.9 -2% | 30.3 -4% |
| Idle Maximum * (dB) | 29.2 | 28.4 3% | 28.2 3% | 35 -20% | 30.5 -4% | 30.3 -4% |
| Load Average * (dB) | 29.2 | 41.6 -42% | 29 1% | 49 -68% | 42.5 -46% | 37.1 -27% |
| Witcher 3 ultra * (dB) | 38.4 | 36.1 6% | 44.7 -16% | 51 -33% | 44.8 -17% | 43.3 -13% |
| Load Maximum * (dB) | 45.7 | 41.6 9% | 47.4 -4% | 54 -18% | 44.8 2% | 43 6% |
* ... mindre är bättre
(-) Den maximala temperaturen på ovansidan är 46.4 °C / 116 F, jämfört med genomsnittet av 36.8 °C / 98 F , allt från 21 till 71 °C för klassen Multimedia.
(-) Botten värms upp till maximalt 49 °C / 120 F, jämfört med genomsnittet av 39.1 °C / 102 F
(+) Vid tomgångsbruk är medeltemperaturen för ovansidan 27.7 °C / 82 F, jämfört med enhetsgenomsnittet på 31.3 °C / ### class_avg_f### F.
(±) När du spelar The Witcher 3 är medeltemperaturen för ovansidan 36.3 °C / 97 F, jämfört med enhetsgenomsnittet på 31.3 °C / ## #class_avg_f### F.
(+) Handledsstöden och pekplattan når maximal hudtemperatur (33 °C / 91.4 F) och är därför inte varma.
(-) Medeltemperaturen för handledsstödsområdet på liknande enheter var 28.7 °C / 83.7 F (-4.3 °C / -7.7 F).
HP Spectre x360 15-ch011nr ljudanalys
(±) | högtalarljudstyrkan är genomsnittlig men bra (79.9 dB)
Bas 100 - 315 Hz
(-) | nästan ingen bas - i genomsnitt 22.3% lägre än medianen
(±) | linjäriteten för basen är genomsnittlig (11.5% delta till föregående frekvens)
Mellan 400 - 2000 Hz
(+) | balanserad mellan - endast 2.4% från medianen
(±) | linjäriteten för mids är genomsnittlig (7.5% delta till föregående frekvens)
Högsta 2 - 16 kHz
(+) | balanserade toppar - endast 4% från medianen
(+) | toppar är linjära (6.2% delta till föregående frekvens)
Totalt 100 - 16 000 Hz
(±) | linjäriteten för det totala ljudet är genomsnittlig (17.7% skillnad mot median)
Jämfört med samma klass
» 51% av alla testade enheter i den här klassen var bättre, 7% liknande, 42% sämre
» Den bästa hade ett delta på 5%, genomsnittet var 17%, sämst var 45%
Jämfört med alla testade enheter
» 35% av alla testade enheter var bättre, 8% liknande, 57% sämre
» Den bästa hade ett delta på 4%, genomsnittet var 24%, sämst var 134%
Apple MacBook 12 (Early 2016) 1.1 GHz ljudanalys
(+) | högtalare kan spela relativt högt (83.6 dB)
Bas 100 - 315 Hz
(±) | reducerad bas - i genomsnitt 11.3% lägre än medianen
(±) | linjäriteten för basen är genomsnittlig (14.2% delta till föregående frekvens)
Mellan 400 - 2000 Hz
(+) | balanserad mellan - endast 2.4% från medianen
(+) | mids är linjära (5.5% delta till föregående frekvens)
Högsta 2 - 16 kHz
(+) | balanserade toppar - endast 2% från medianen
(+) | toppar är linjära (4.5% delta till föregående frekvens)
Totalt 100 - 16 000 Hz
(+) | det totala ljudet är linjärt (10.2% skillnad mot median)
Jämfört med samma klass
» 7% av alla testade enheter i den här klassen var bättre, 2% liknande, 91% sämre
» Den bästa hade ett delta på 5%, genomsnittet var 18%, sämst var 53%
Jämfört med alla testade enheter
» 5% av alla testade enheter var bättre, 1% liknande, 94% sämre
» Den bästa hade ett delta på 4%, genomsnittet var 24%, sämst var 134%
| Av/Standby | |
| Låg belastning | |
| Hög belastning |
|
Förklaring:
min: | |
| HP Spectre x360 15-ch011nr i5-8550U, GeForce MX150, SK hynix PC401 NVMe 500 GB, IPS, 3840x2160, 15.6" | HP Spectre x360 15t-bl100 i5-8550U, GeForce MX150, Samsung PM961 NVMe MZVLW512HMJP, IPS, 3840x2160, 15.6" | Dell XPS 15 2018 i5 FHD 97Wh i5-8300H, GeForce GTX 1050 Mobile, Lite-On CA3-8D256-Q11, LED IGZO IPS InfinityEdge, 1920x1080, 15.6" | Dell XPS 15 9575 i7-8705G i7-8705G, Vega M GL / 870, SK hynix PC401 NVMe 500 GB, IPS, 3840x2160, 15.6" | Asus ZenBook Pro 15 UX580GE i9-8950HK, GeForce GTX 1050 Ti Mobile, Samsung SSD PM961 1TB M.2 PCIe 3.0 x4 NVMe (MZVLW1T0), IPS, 3840x2160, 15.6" | Acer Swift 3 SF315-41-R6J9 R7 2700U, Vega 10, Micron SSD 1100 SED 512GB, M.2 (MTFDDAV512TBN), IPS, 1920x1080, 15.6" | |
|---|---|---|---|---|---|---|
| Power Consumption | -25% | 10% | -18% | -69% | 30% | |
| Idle Minimum * (Watt) | 5.3 | 11.6 -119% | 2.9 45% | 6.2 -17% | 11.7 -121% | 5.9 -11% |
| Idle Average * (Watt) | 9.8 | 13.8 -41% | 5.8 41% | 12.9 -32% | 18.5 -89% | 8.6 12% |
| Idle Maximum * (Watt) | 12.6 | 14.2 -13% | 7.5 40% | 13.6 -8% | 22.8 -81% | 8.7 31% |
| Load Average * (Watt) | 73 | 67.9 7% | 77.5 -6% | 76.1 -4% | 97.5 -34% | 32.8 55% |
| Witcher 3 ultra * (Watt) | 67.6 | 59 13% | 84 -24% | 84.3 -25% | 102.9 -52% | 38.2 43% |
| Load Maximum * (Watt) | 80 | 76.9 4% | 107 -34% | 99.4 -24% | 111.1 -39% | 40.9 49% |
* ... mindre är bättre
| HP Spectre x360 15-ch011nr i5-8550U, GeForce MX150, 84 Wh | HP Spectre x360 15t-bl100 i5-8550U, GeForce MX150, 79.2 Wh | Dell XPS 15 2018 i5 FHD 97Wh i5-8300H, GeForce GTX 1050 Mobile, 97 Wh | Dell XPS 15 9575 i7-8705G i7-8705G, Vega M GL / 870, 75 Wh | Asus ZenBook Pro 15 UX580GE i9-8950HK, GeForce GTX 1050 Ti Mobile, 71 Wh | Acer Swift 3 SF315-41-R6J9 R7 2700U, Vega 10, 49 Wh | |
|---|---|---|---|---|---|---|
| Batteridrifttid | -6% | 17% | -38% | -31% | -35% | |
| Reader / Idle (h) | 15.5 | 15.6 1% | 11.2 -28% | 14 -10% | 13.3 -14% | |
| WiFi v1.3 (h) | 10.4 | 8.5 -18% | 15.7 51% | 7 -33% | 6.3 -39% | 5.3 -49% |
| Load (h) | 2.3 | 2.3 0% | 1.9 -17% | 1.1 -52% | 1.3 -43% | 1.3 -43% |
| Witcher 3 ultra (h) | 1 |
För
Emot
Läs den fullständiga versionen av den här recensionen på engelska här.
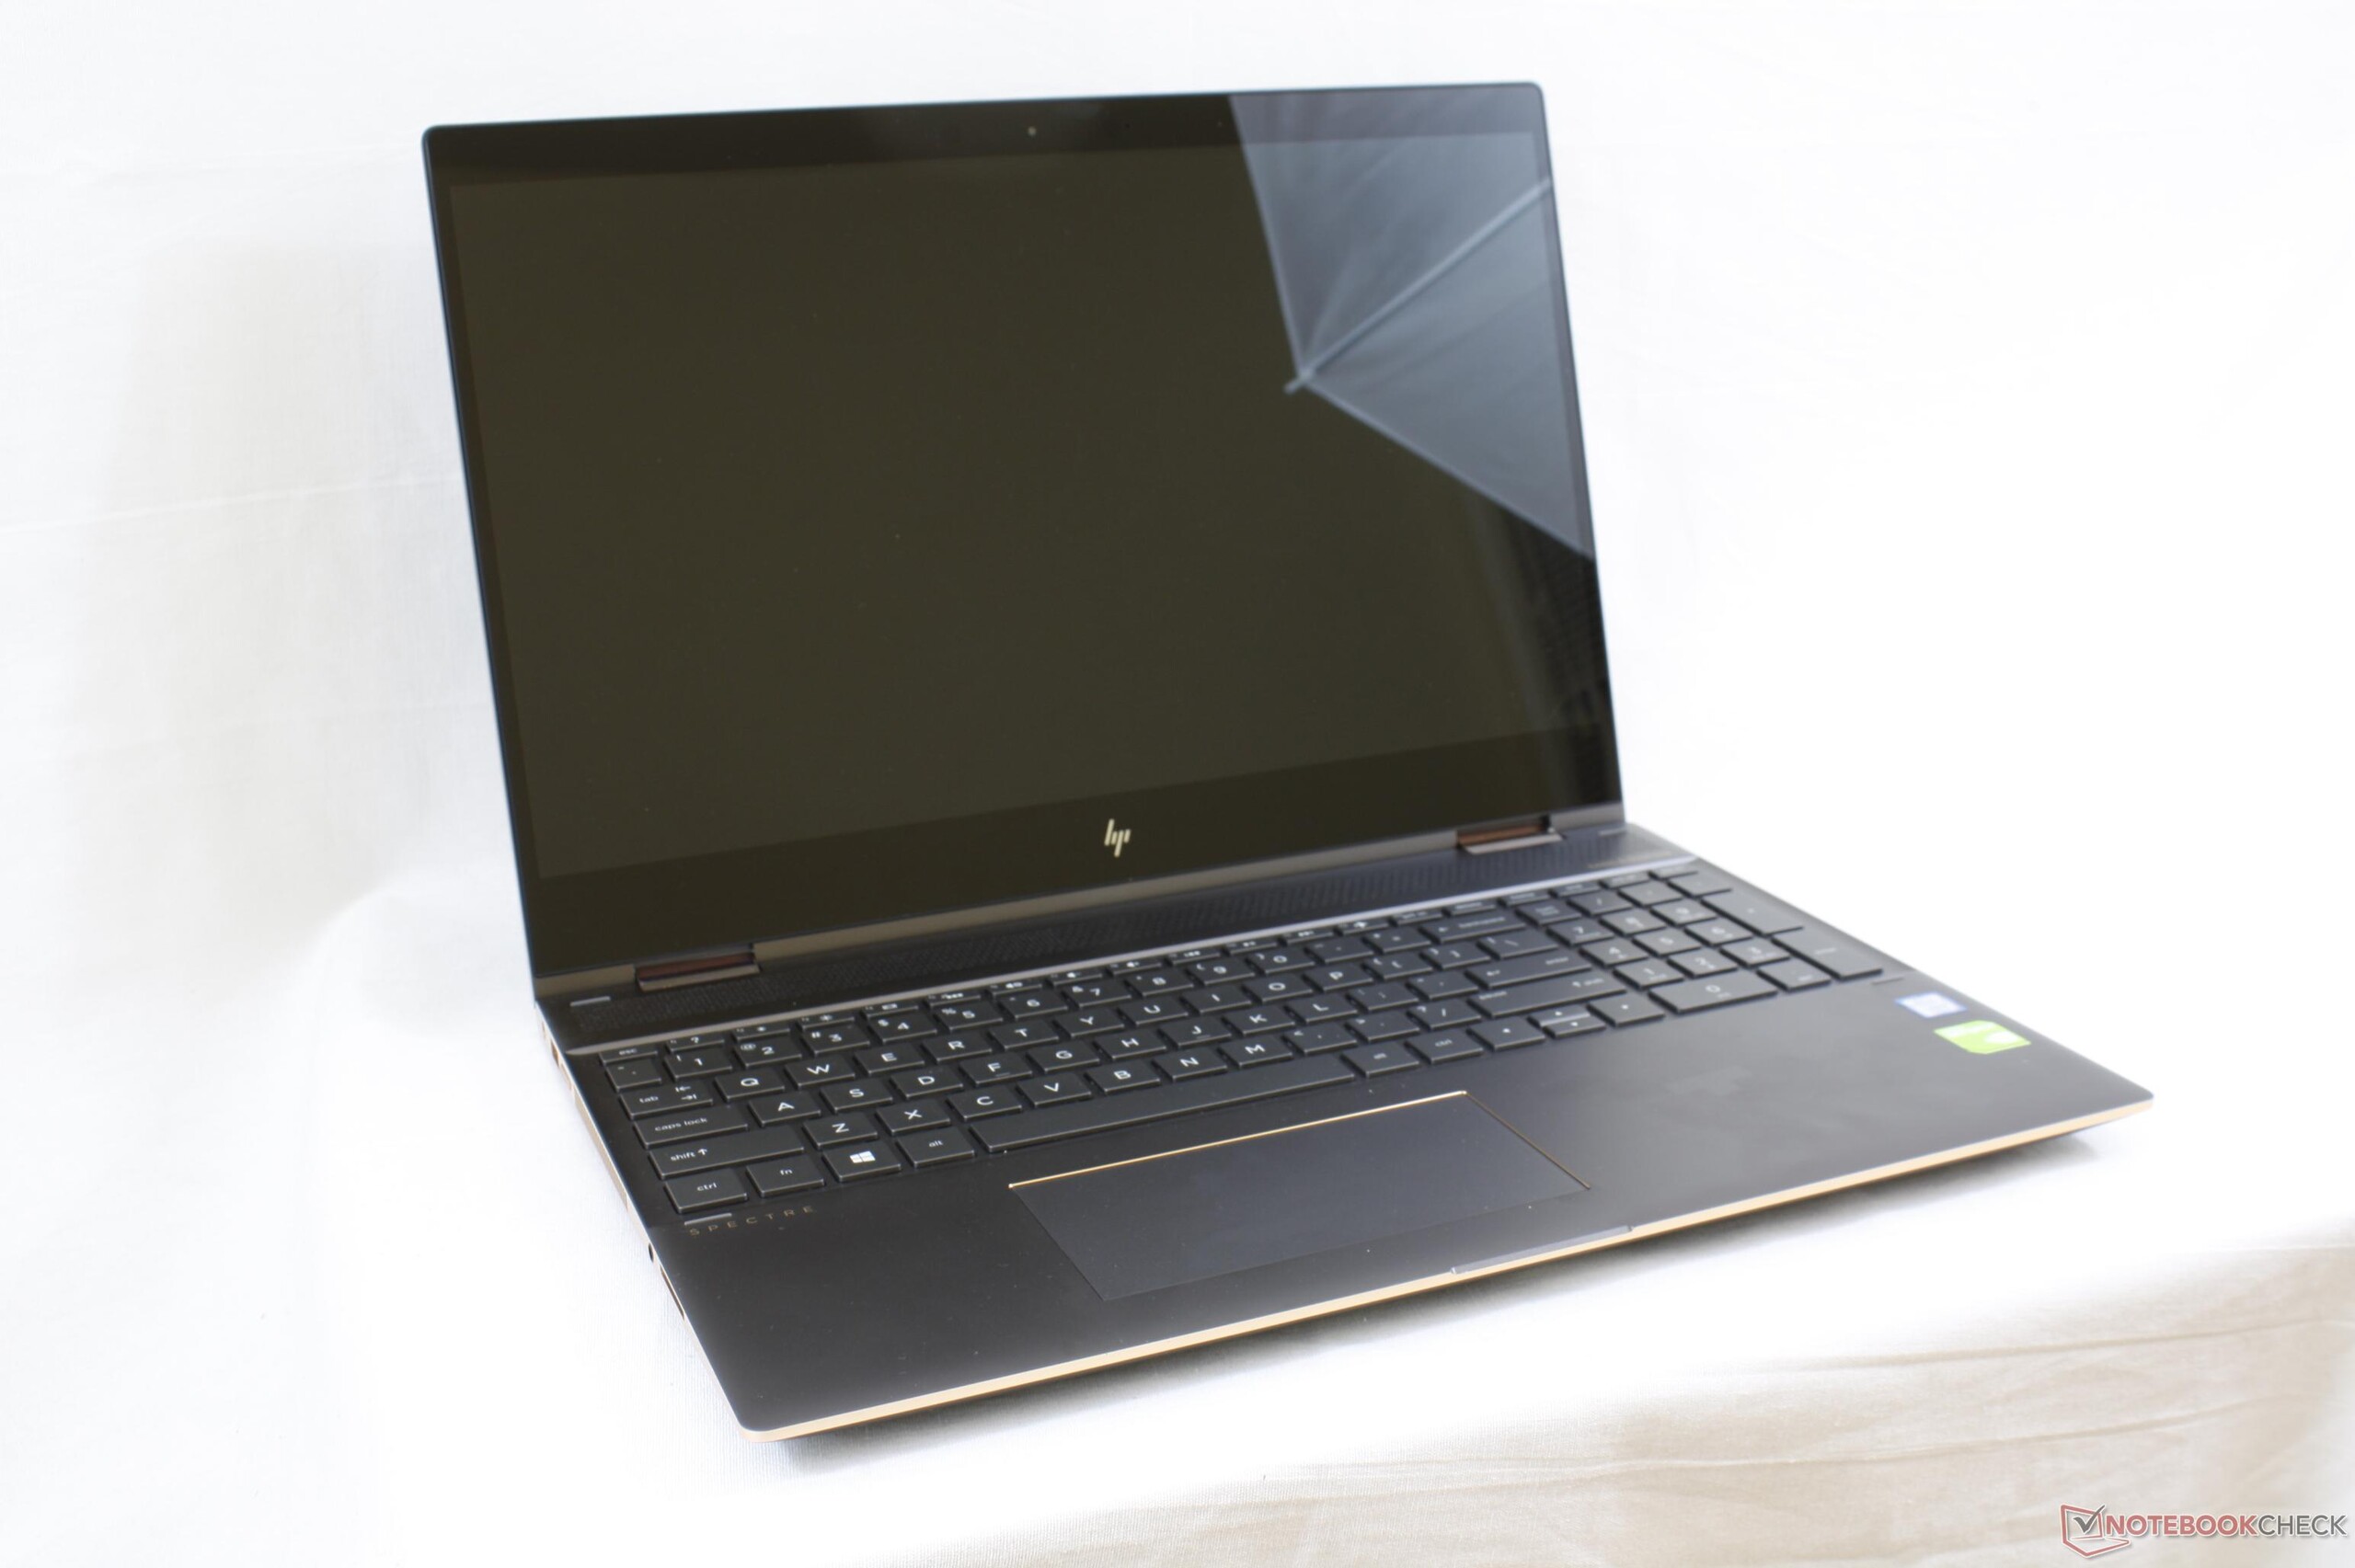
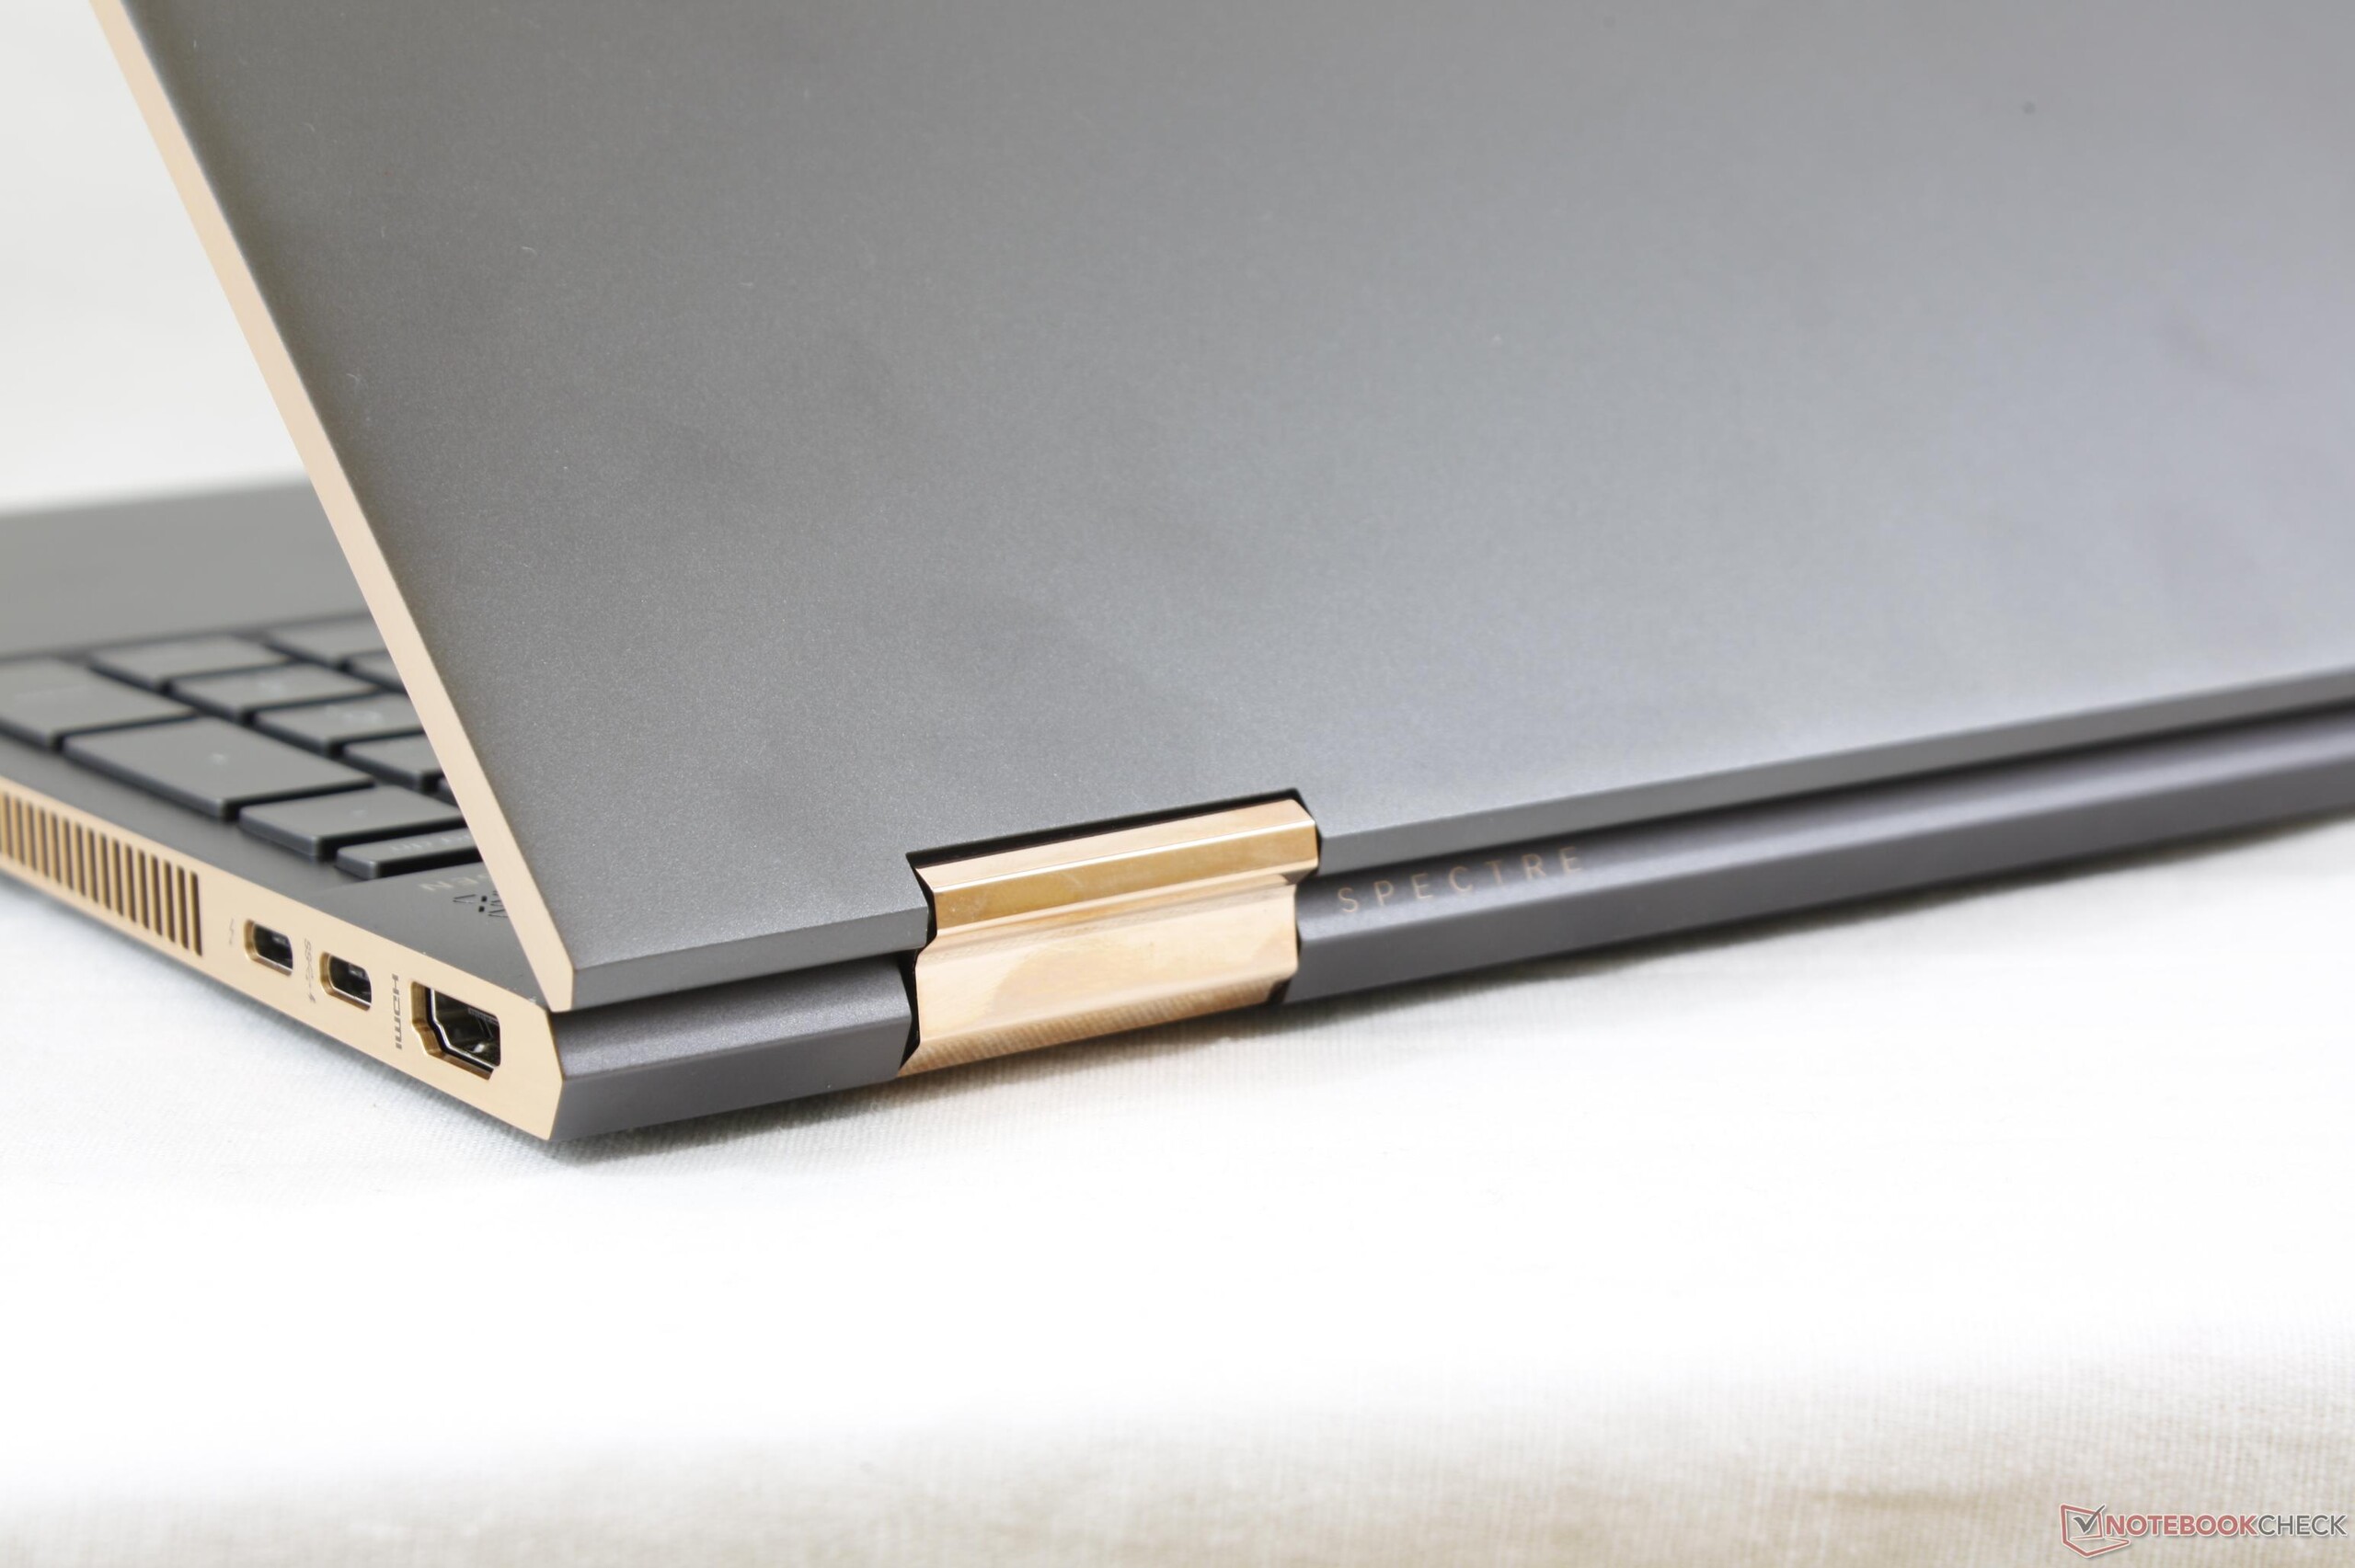
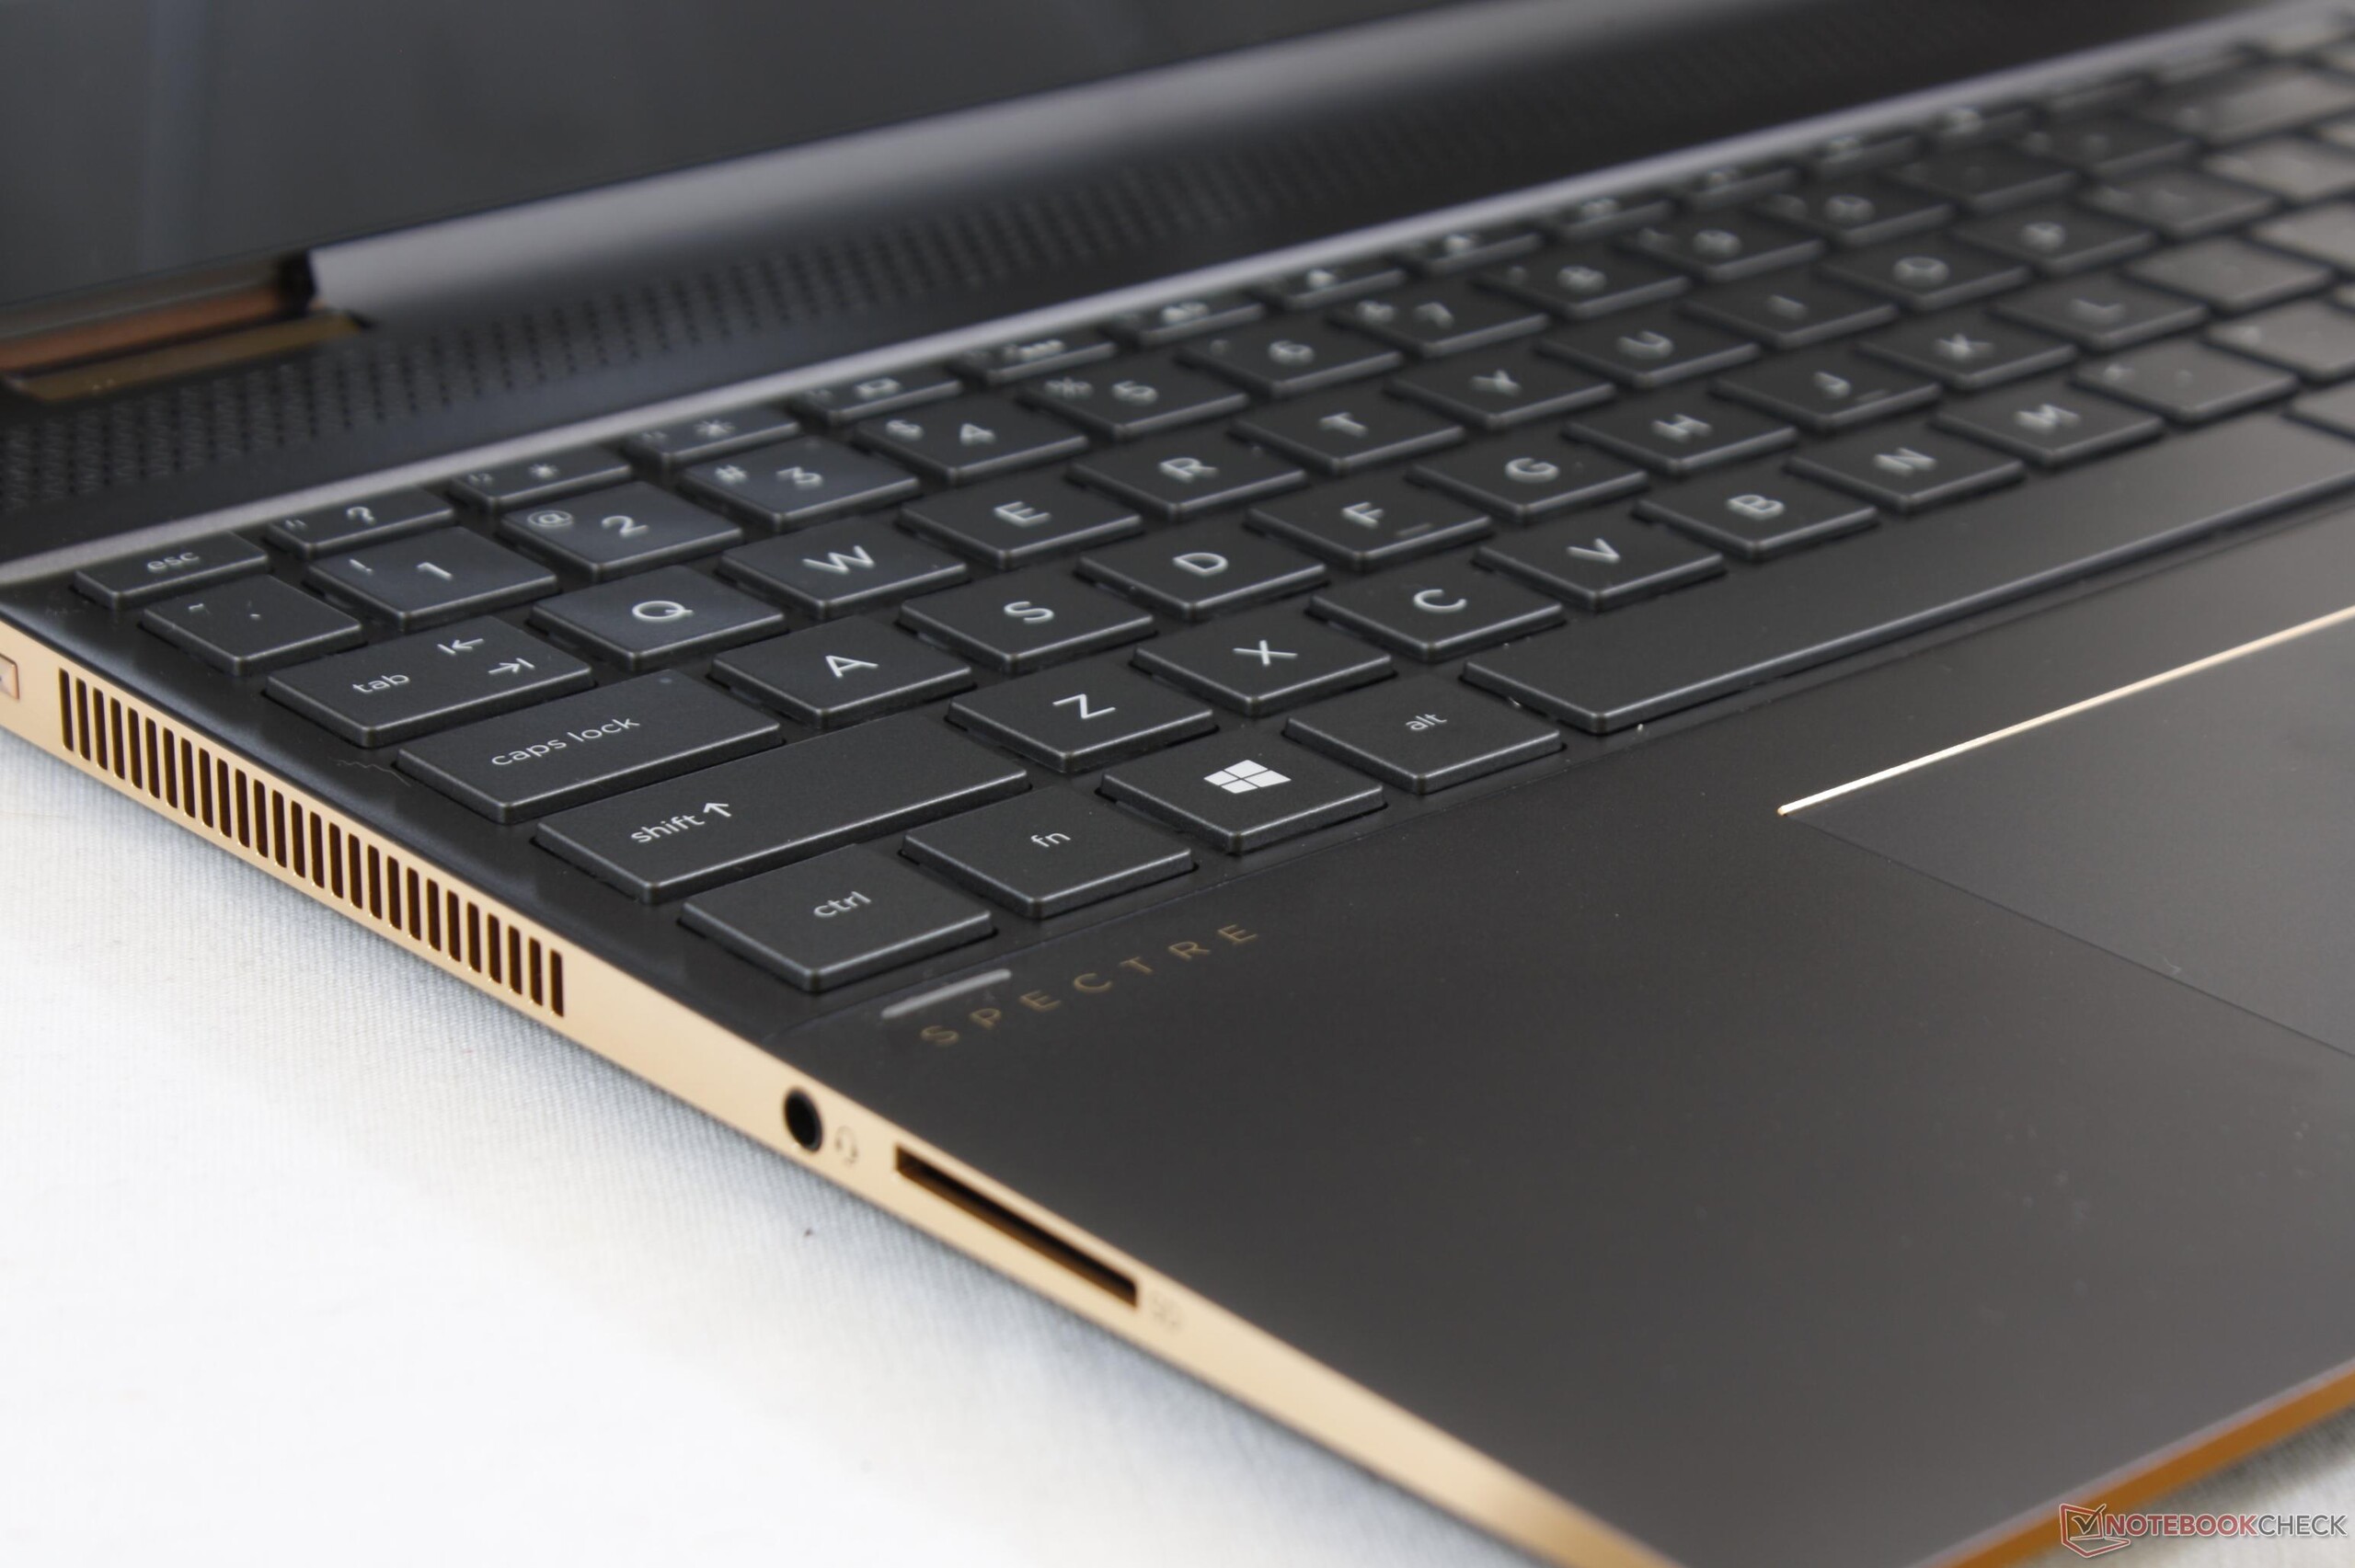
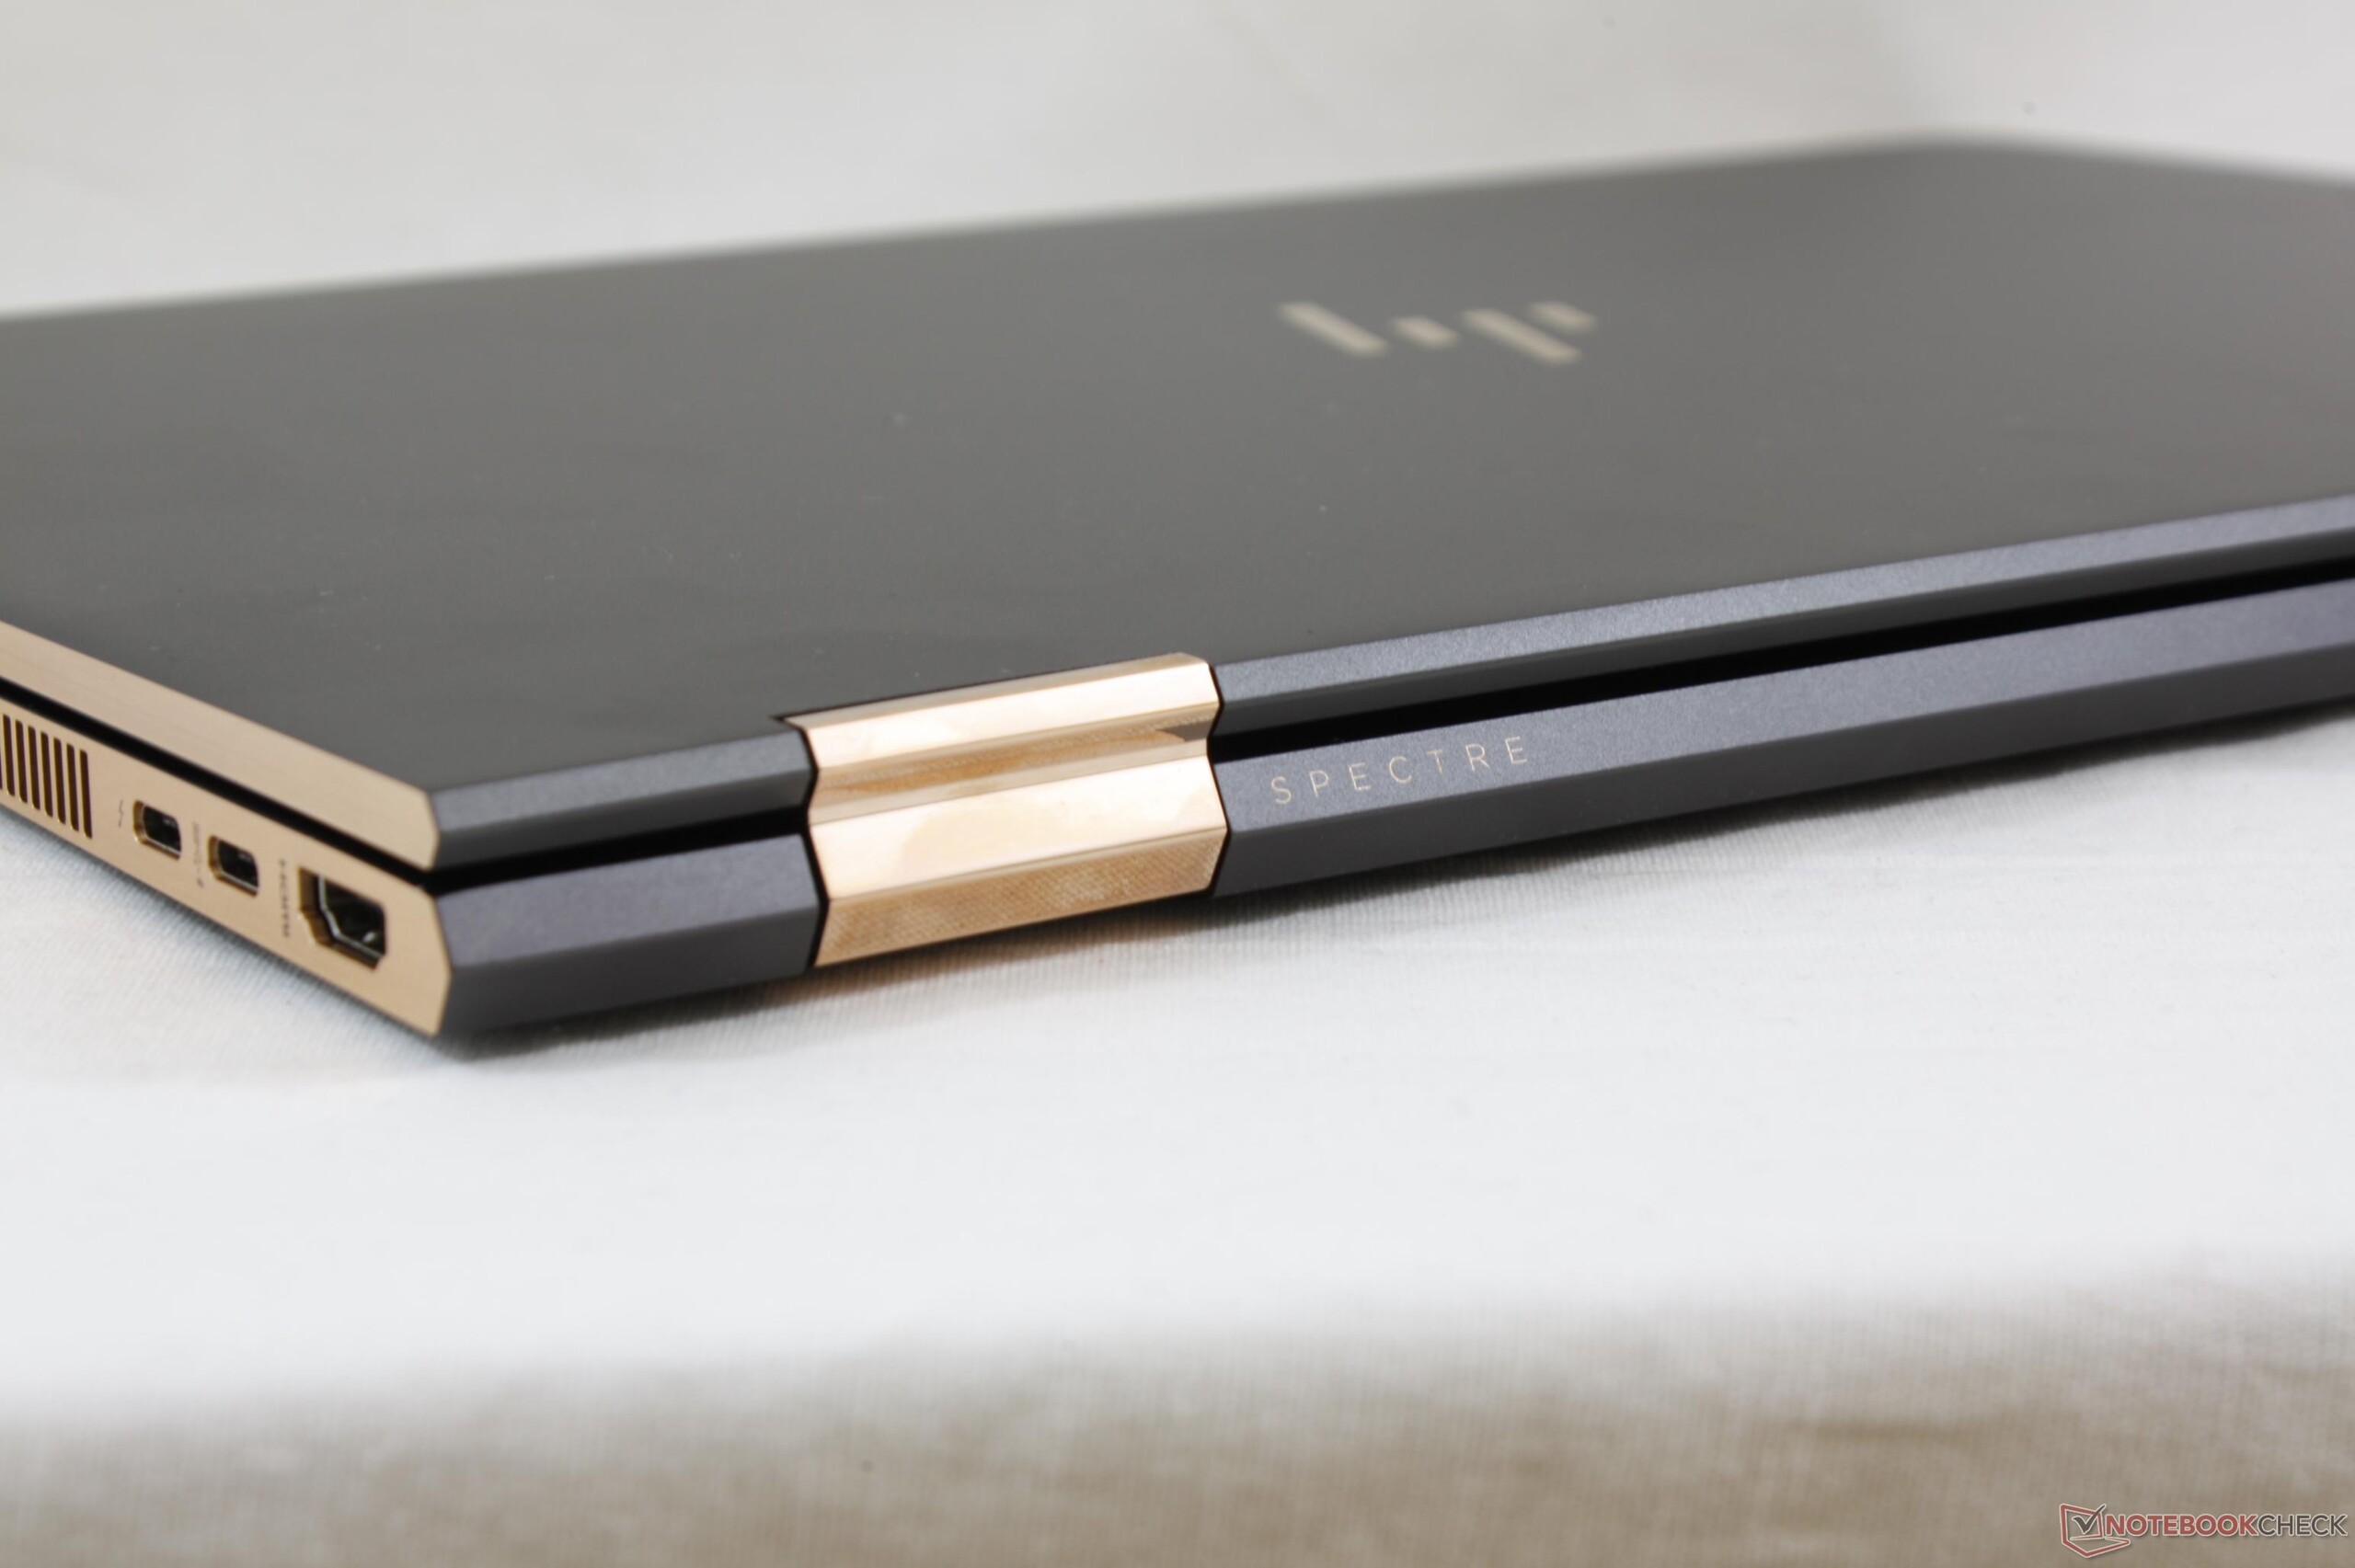
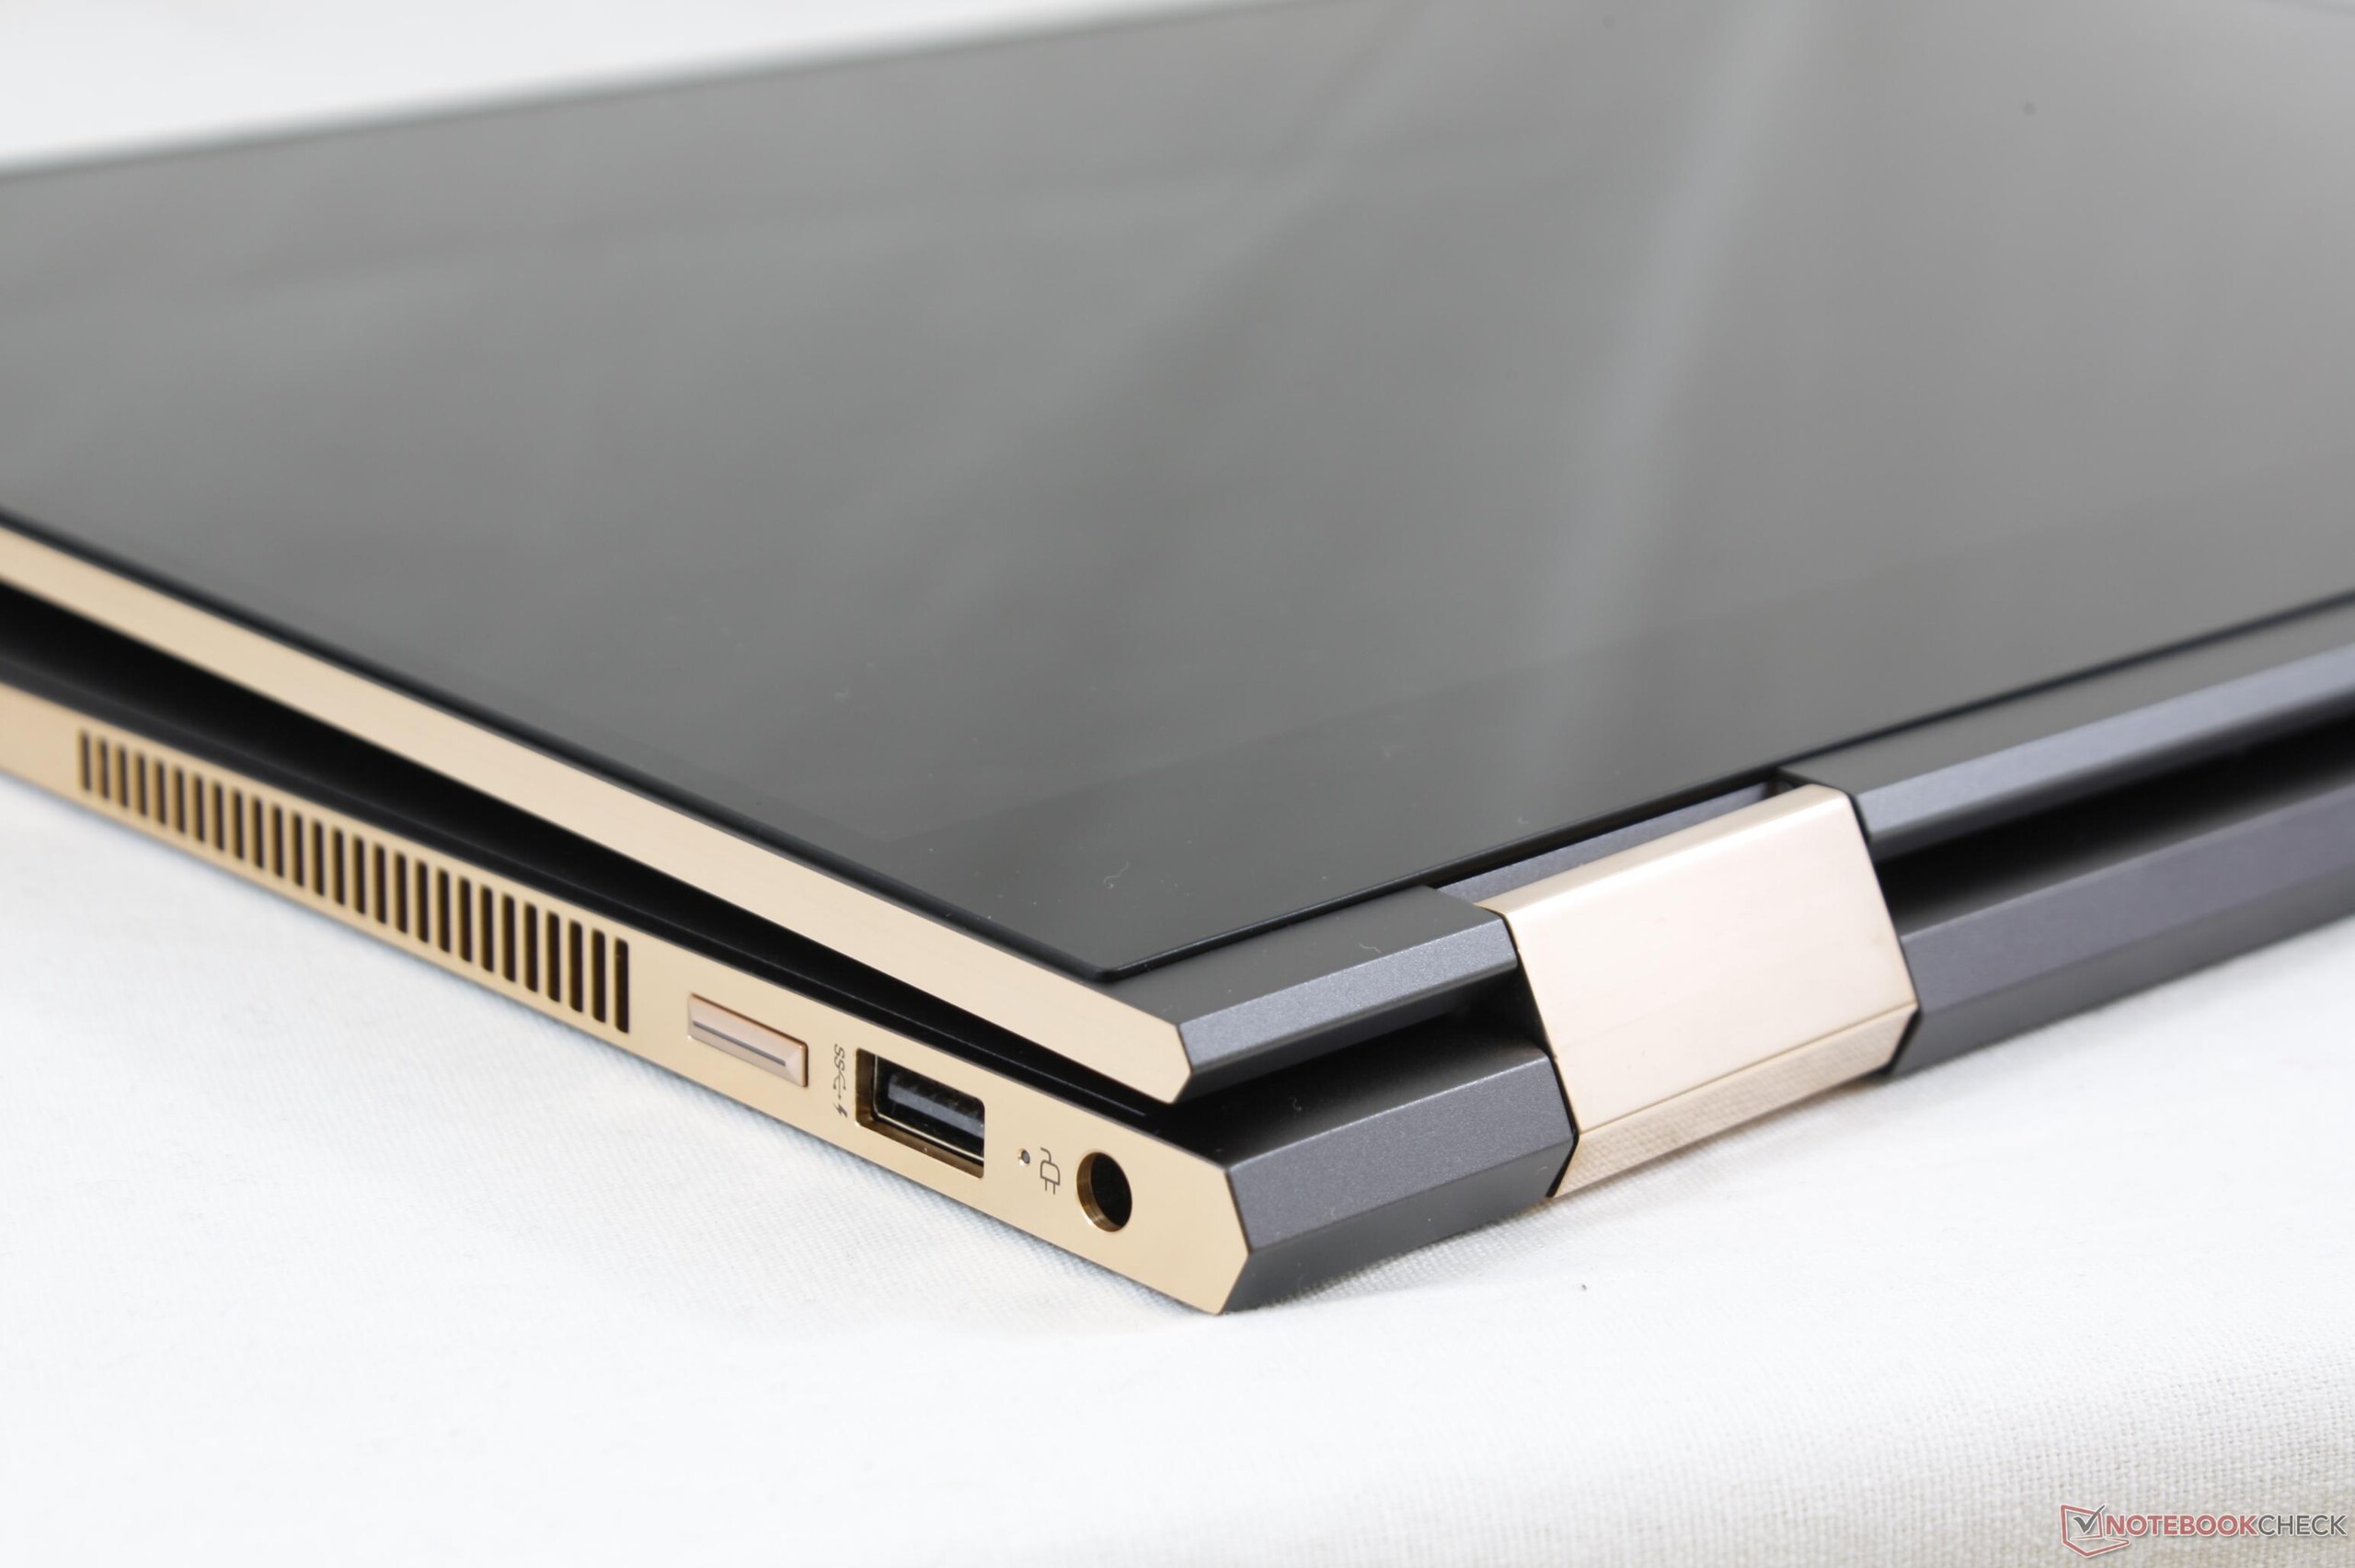
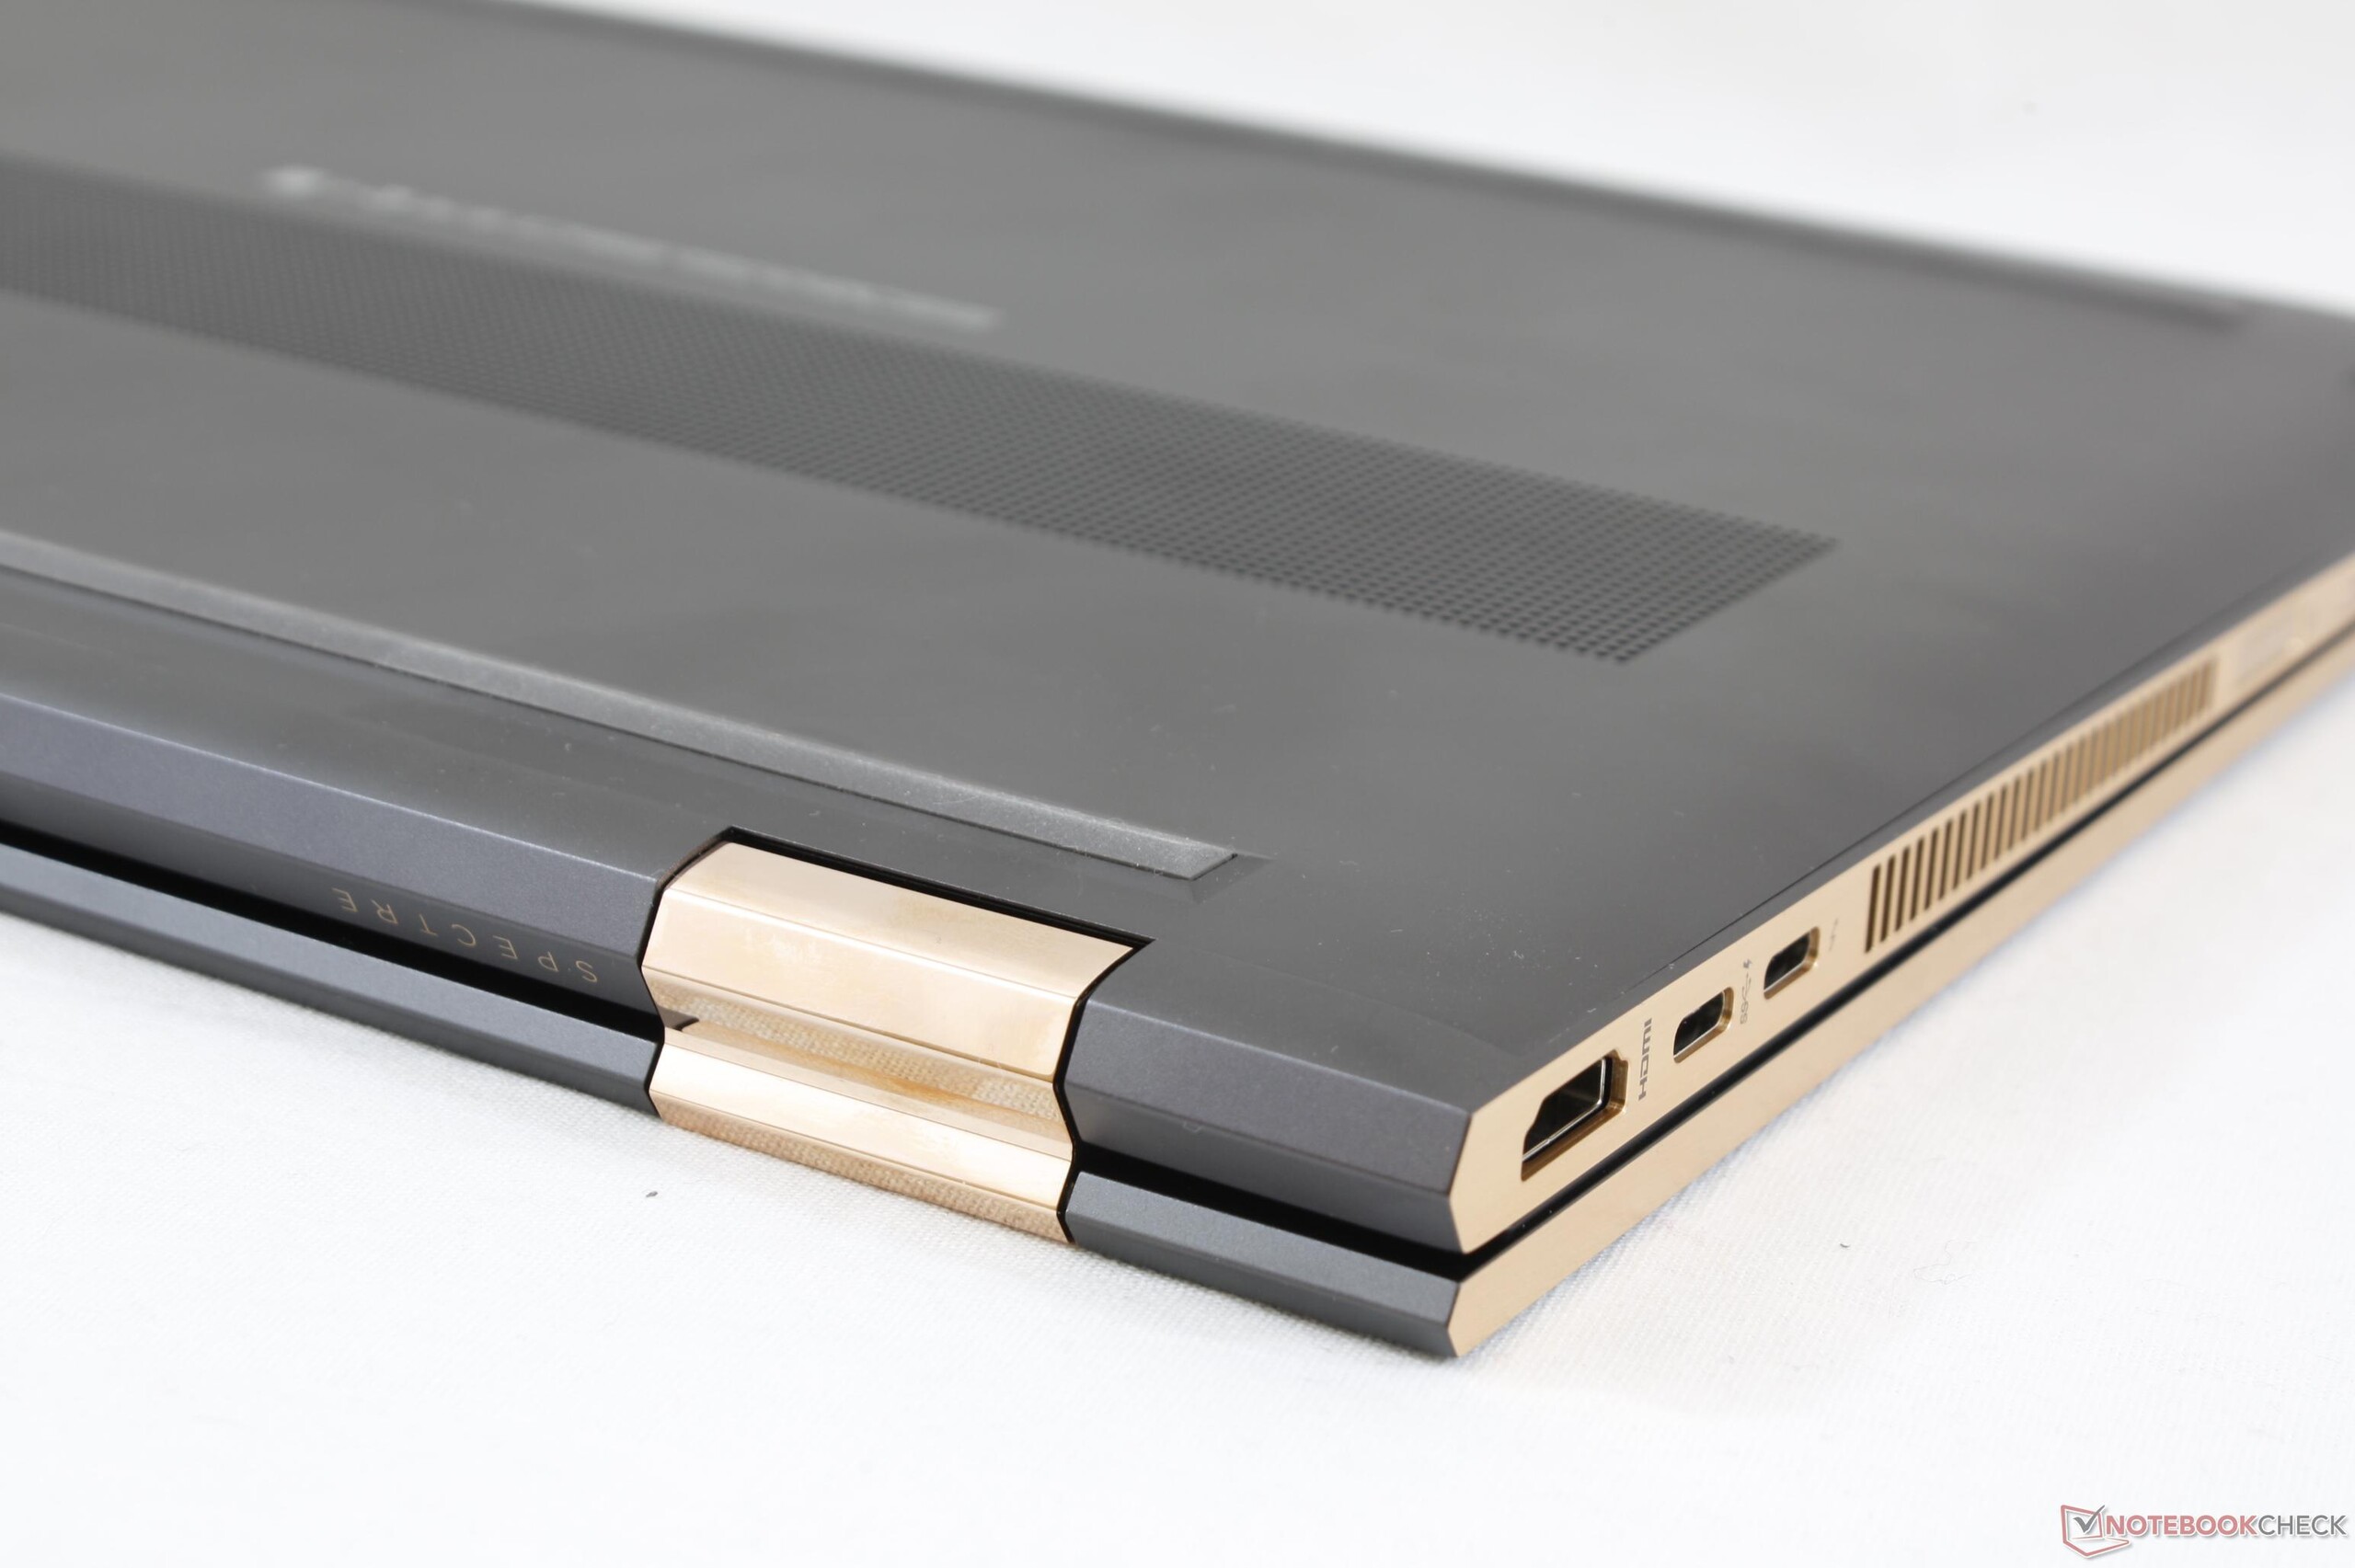
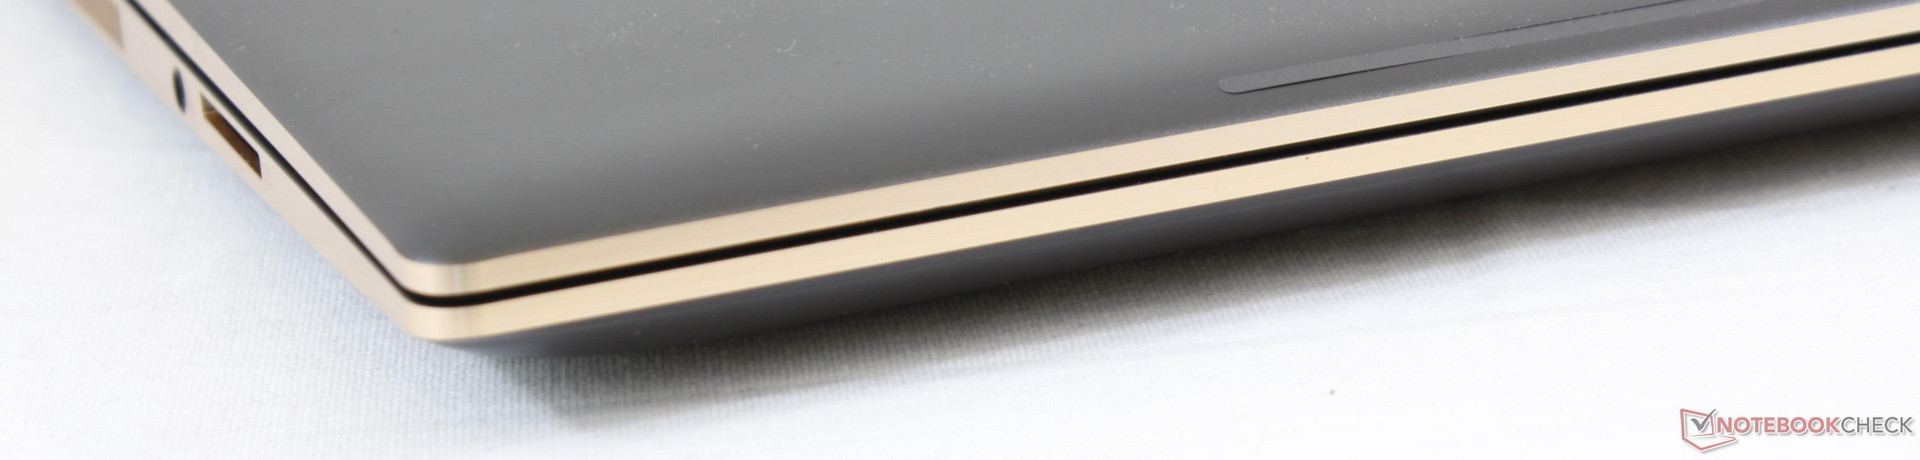
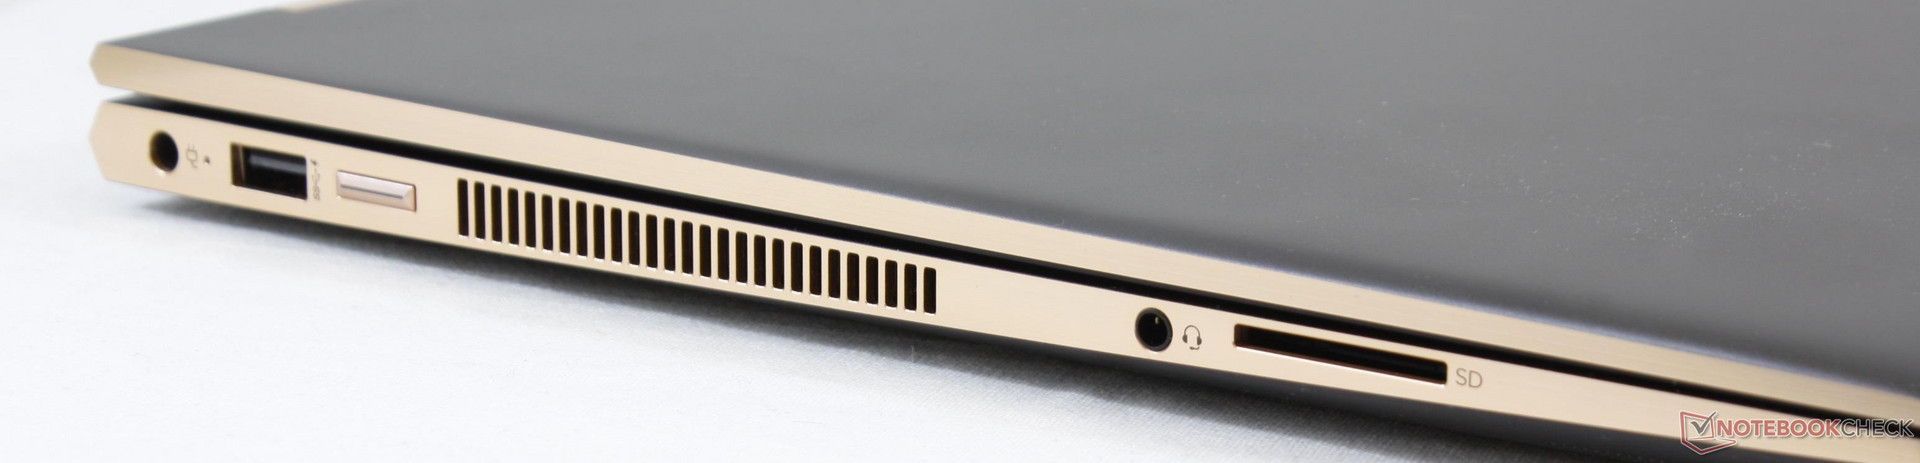
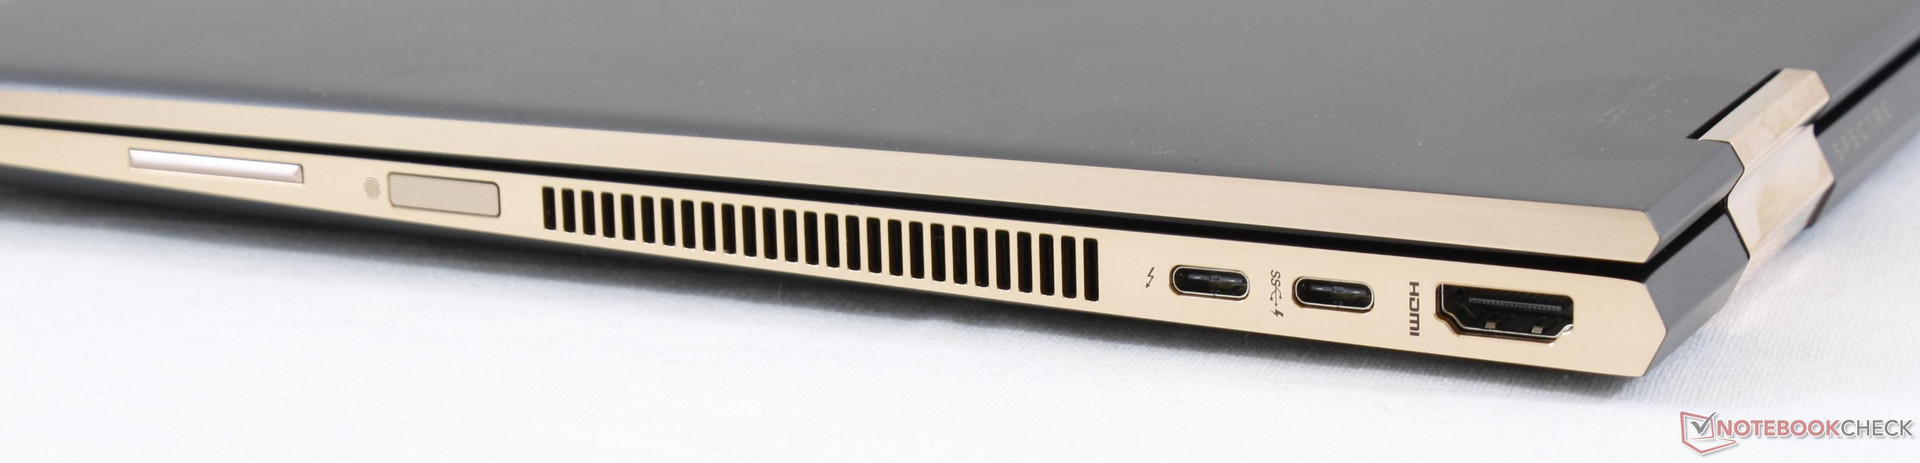
Även om dom flesta tillverkare tenderar att göra tunnare, mindre och lättare enheter varje ny generation så har HP haft modet att göra sin nya modell aningen tjockare, en chansning som betalat sig. Tredje generationens Spectre x360 15 är tystare och har svalare kärntemperaturer jämfört med förra årets modell samtidigt som den erbjuder fler funktioner för att motivera den ringa storleksökningen. Kanske bäst av allt, HP behövde inte flytta om webbkameran eller ge avkall på USB Typ A-portar, SD-kortläsare i fullstorlek eller ett traditionellt numeriskt tangentbord - alla viktiga egenskaper att ha för produktivitet. Vi kan tyvärr inte säga detsamma om konkurrerande modeller som den populära Dell XPS 15 9570 eller MacBook Pro 15.
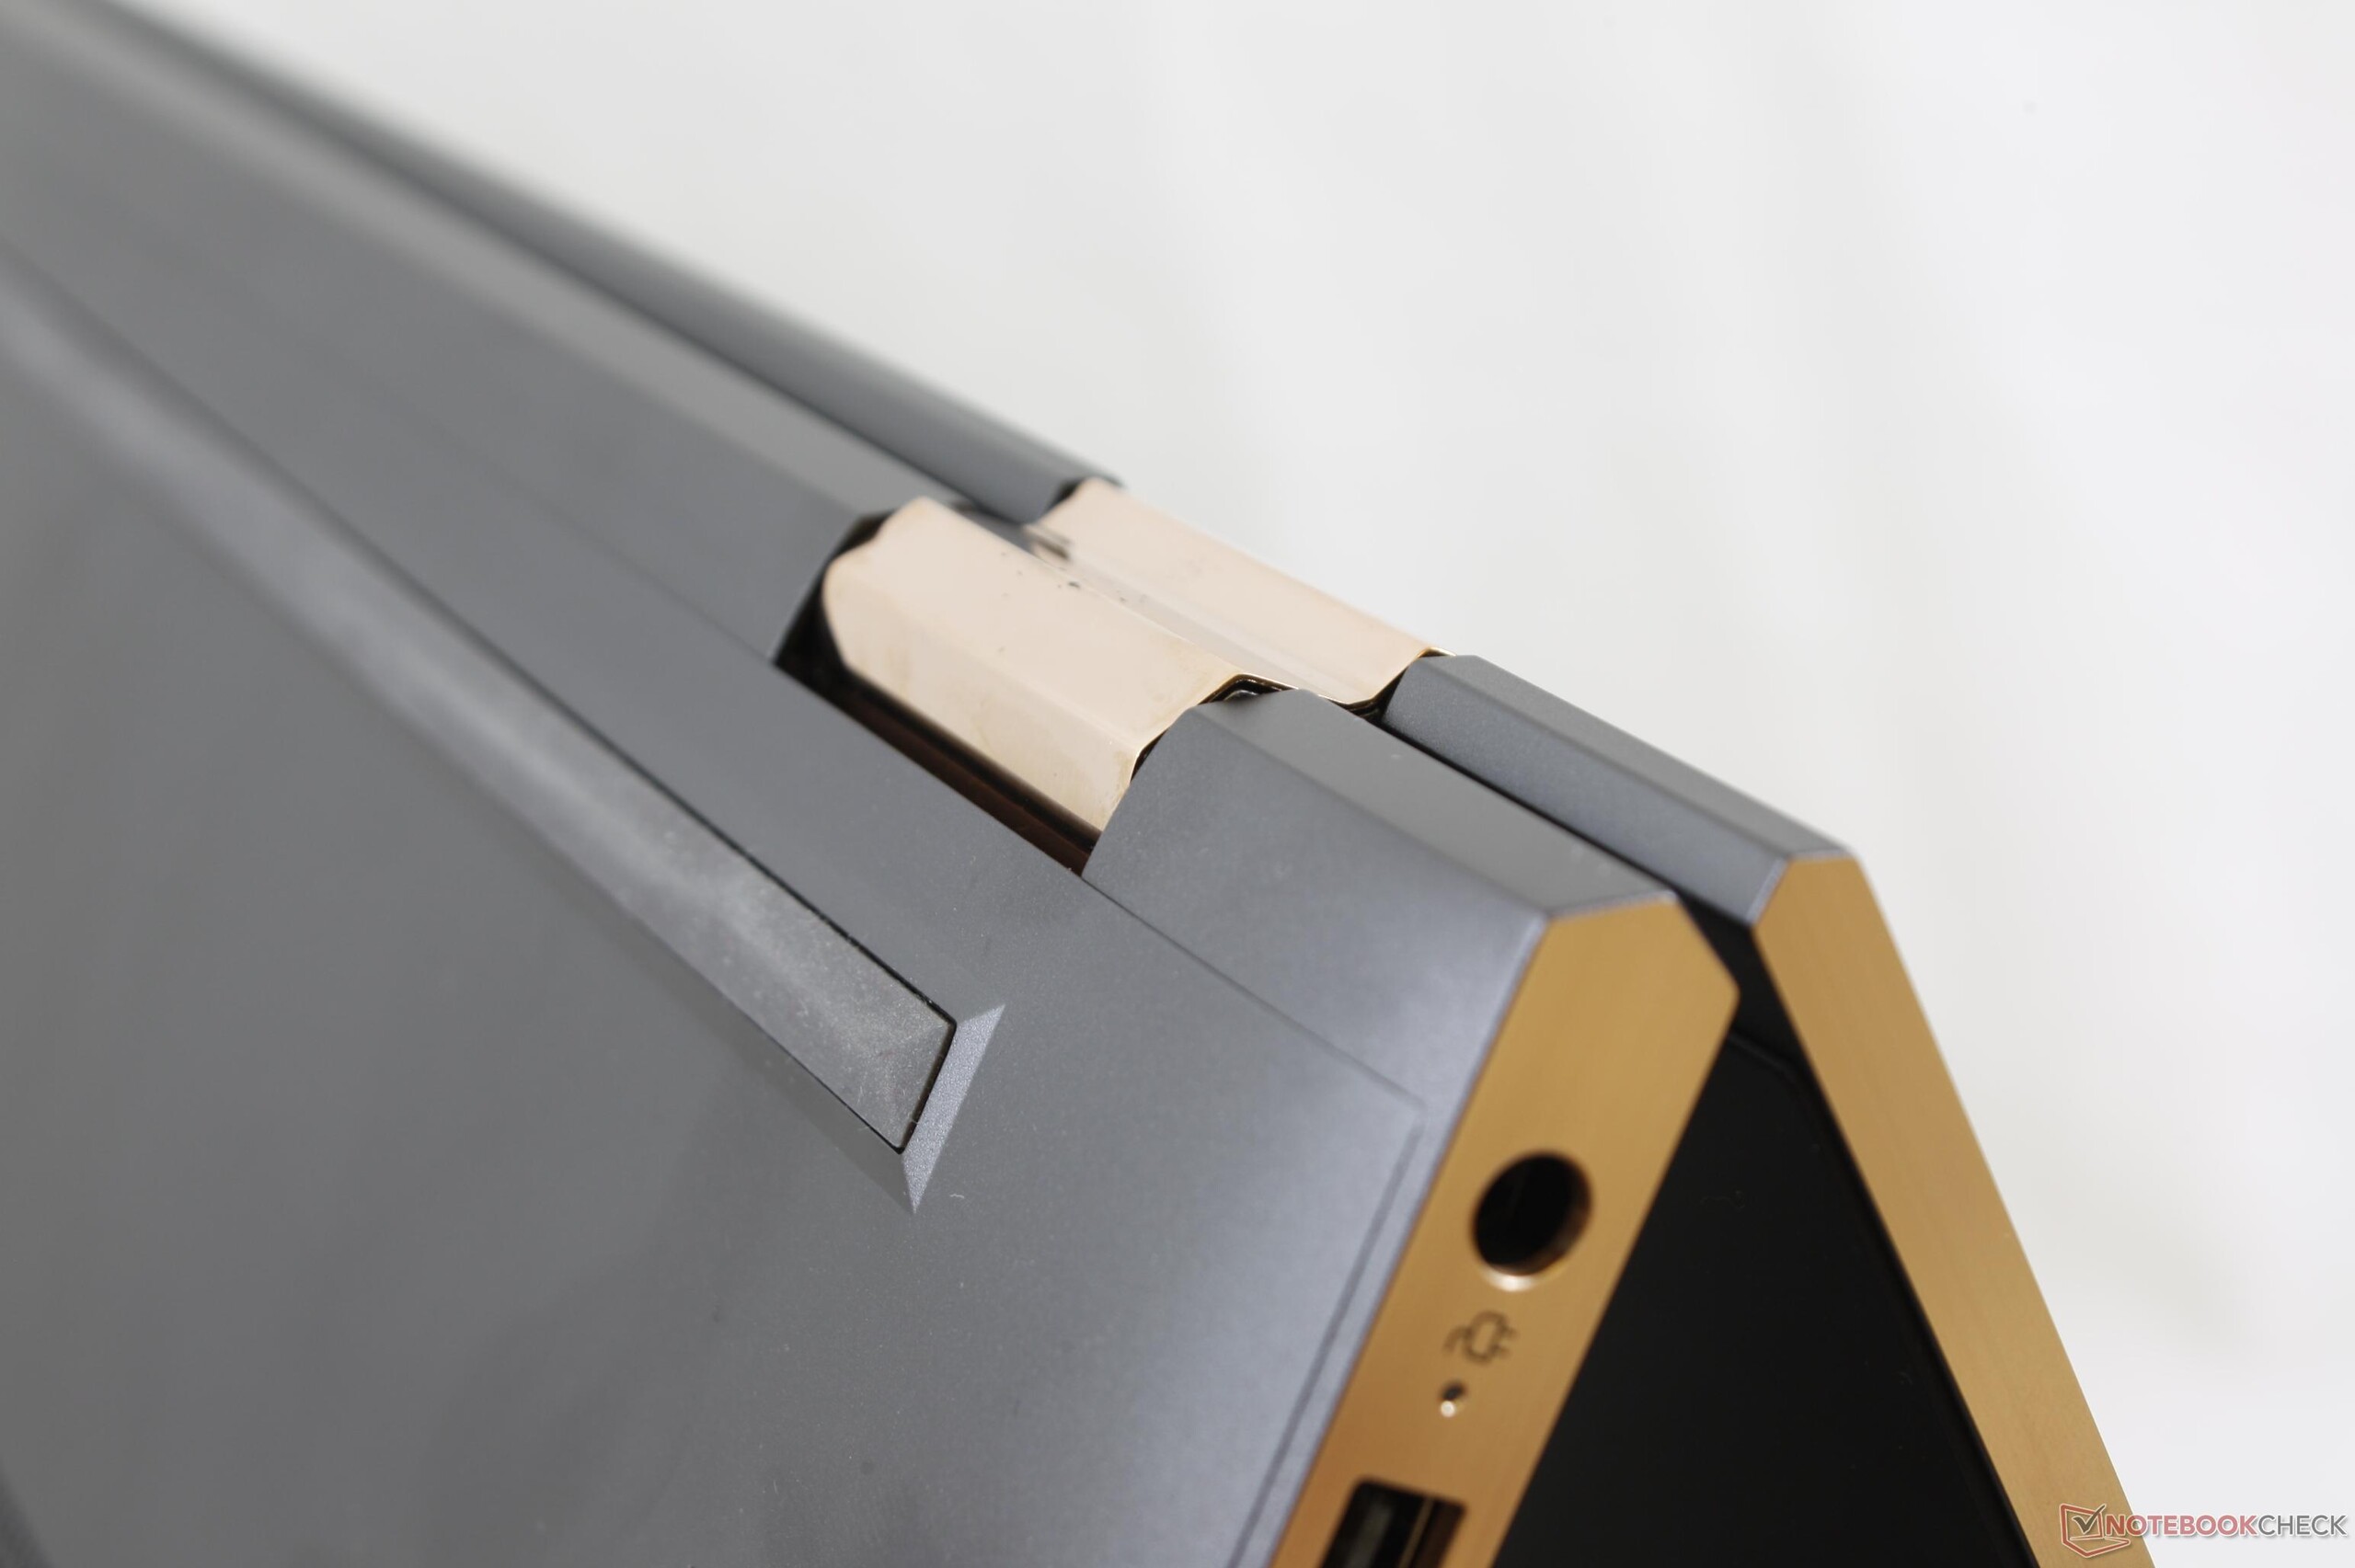
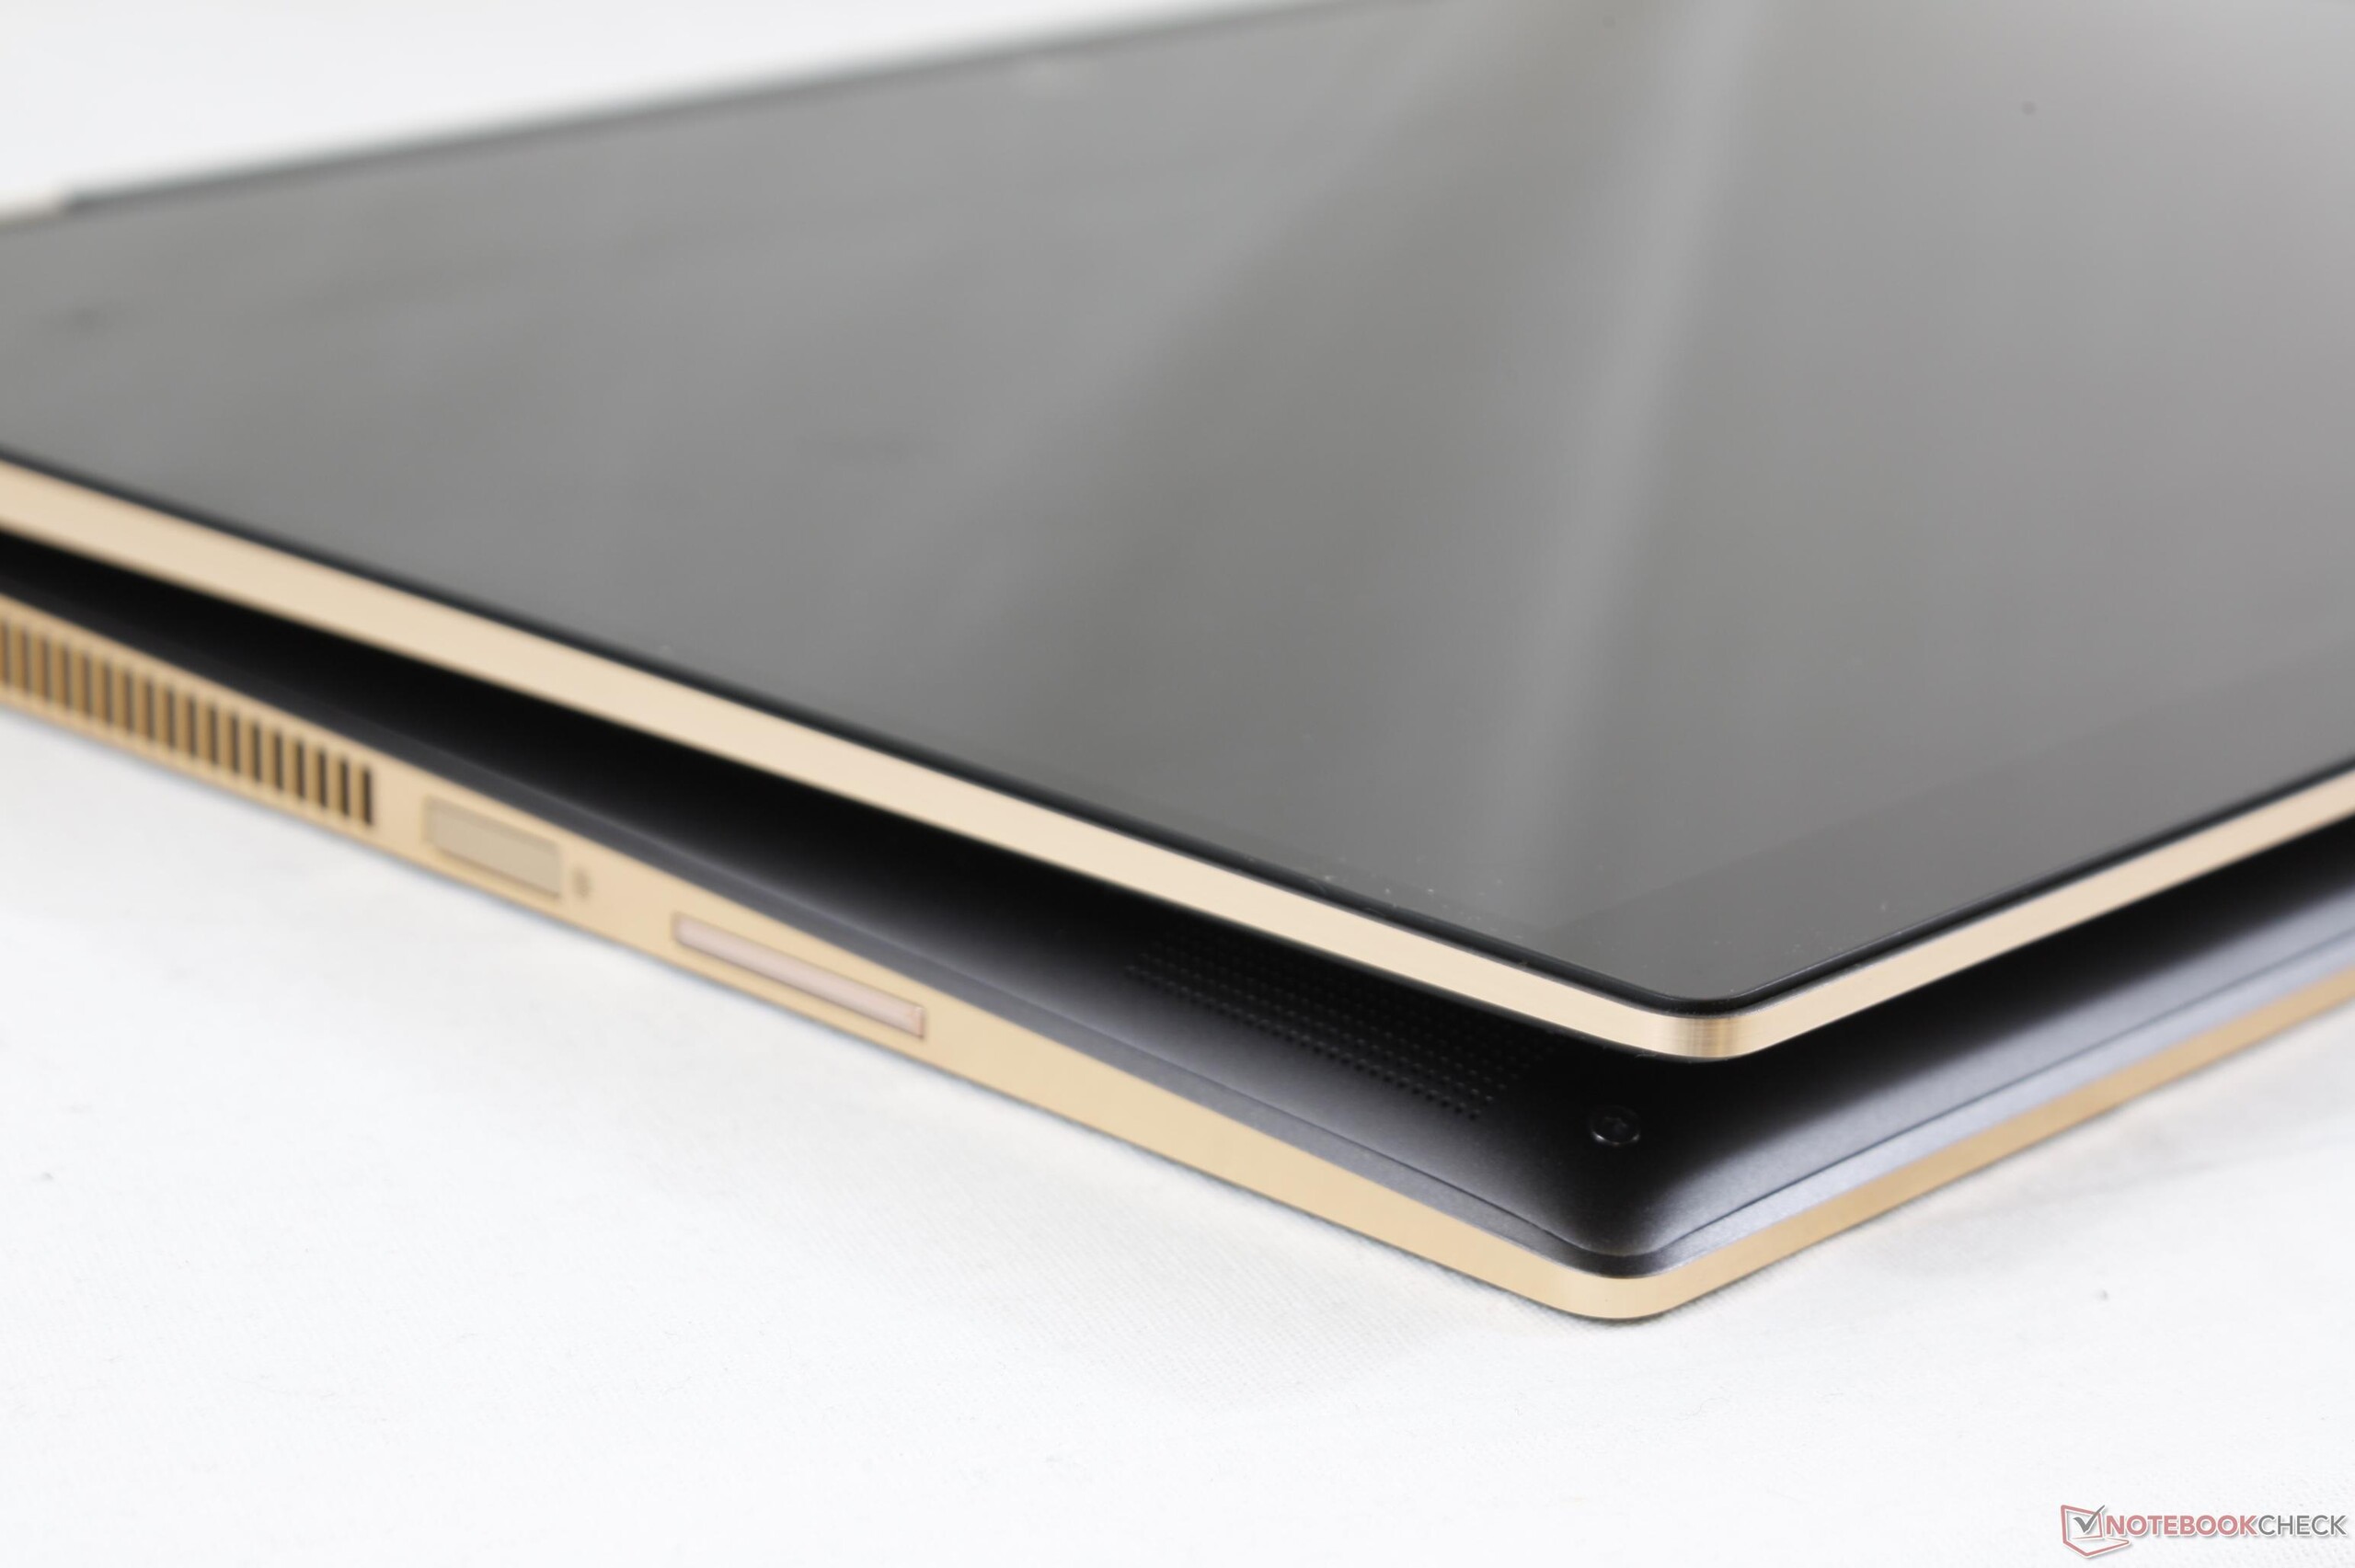
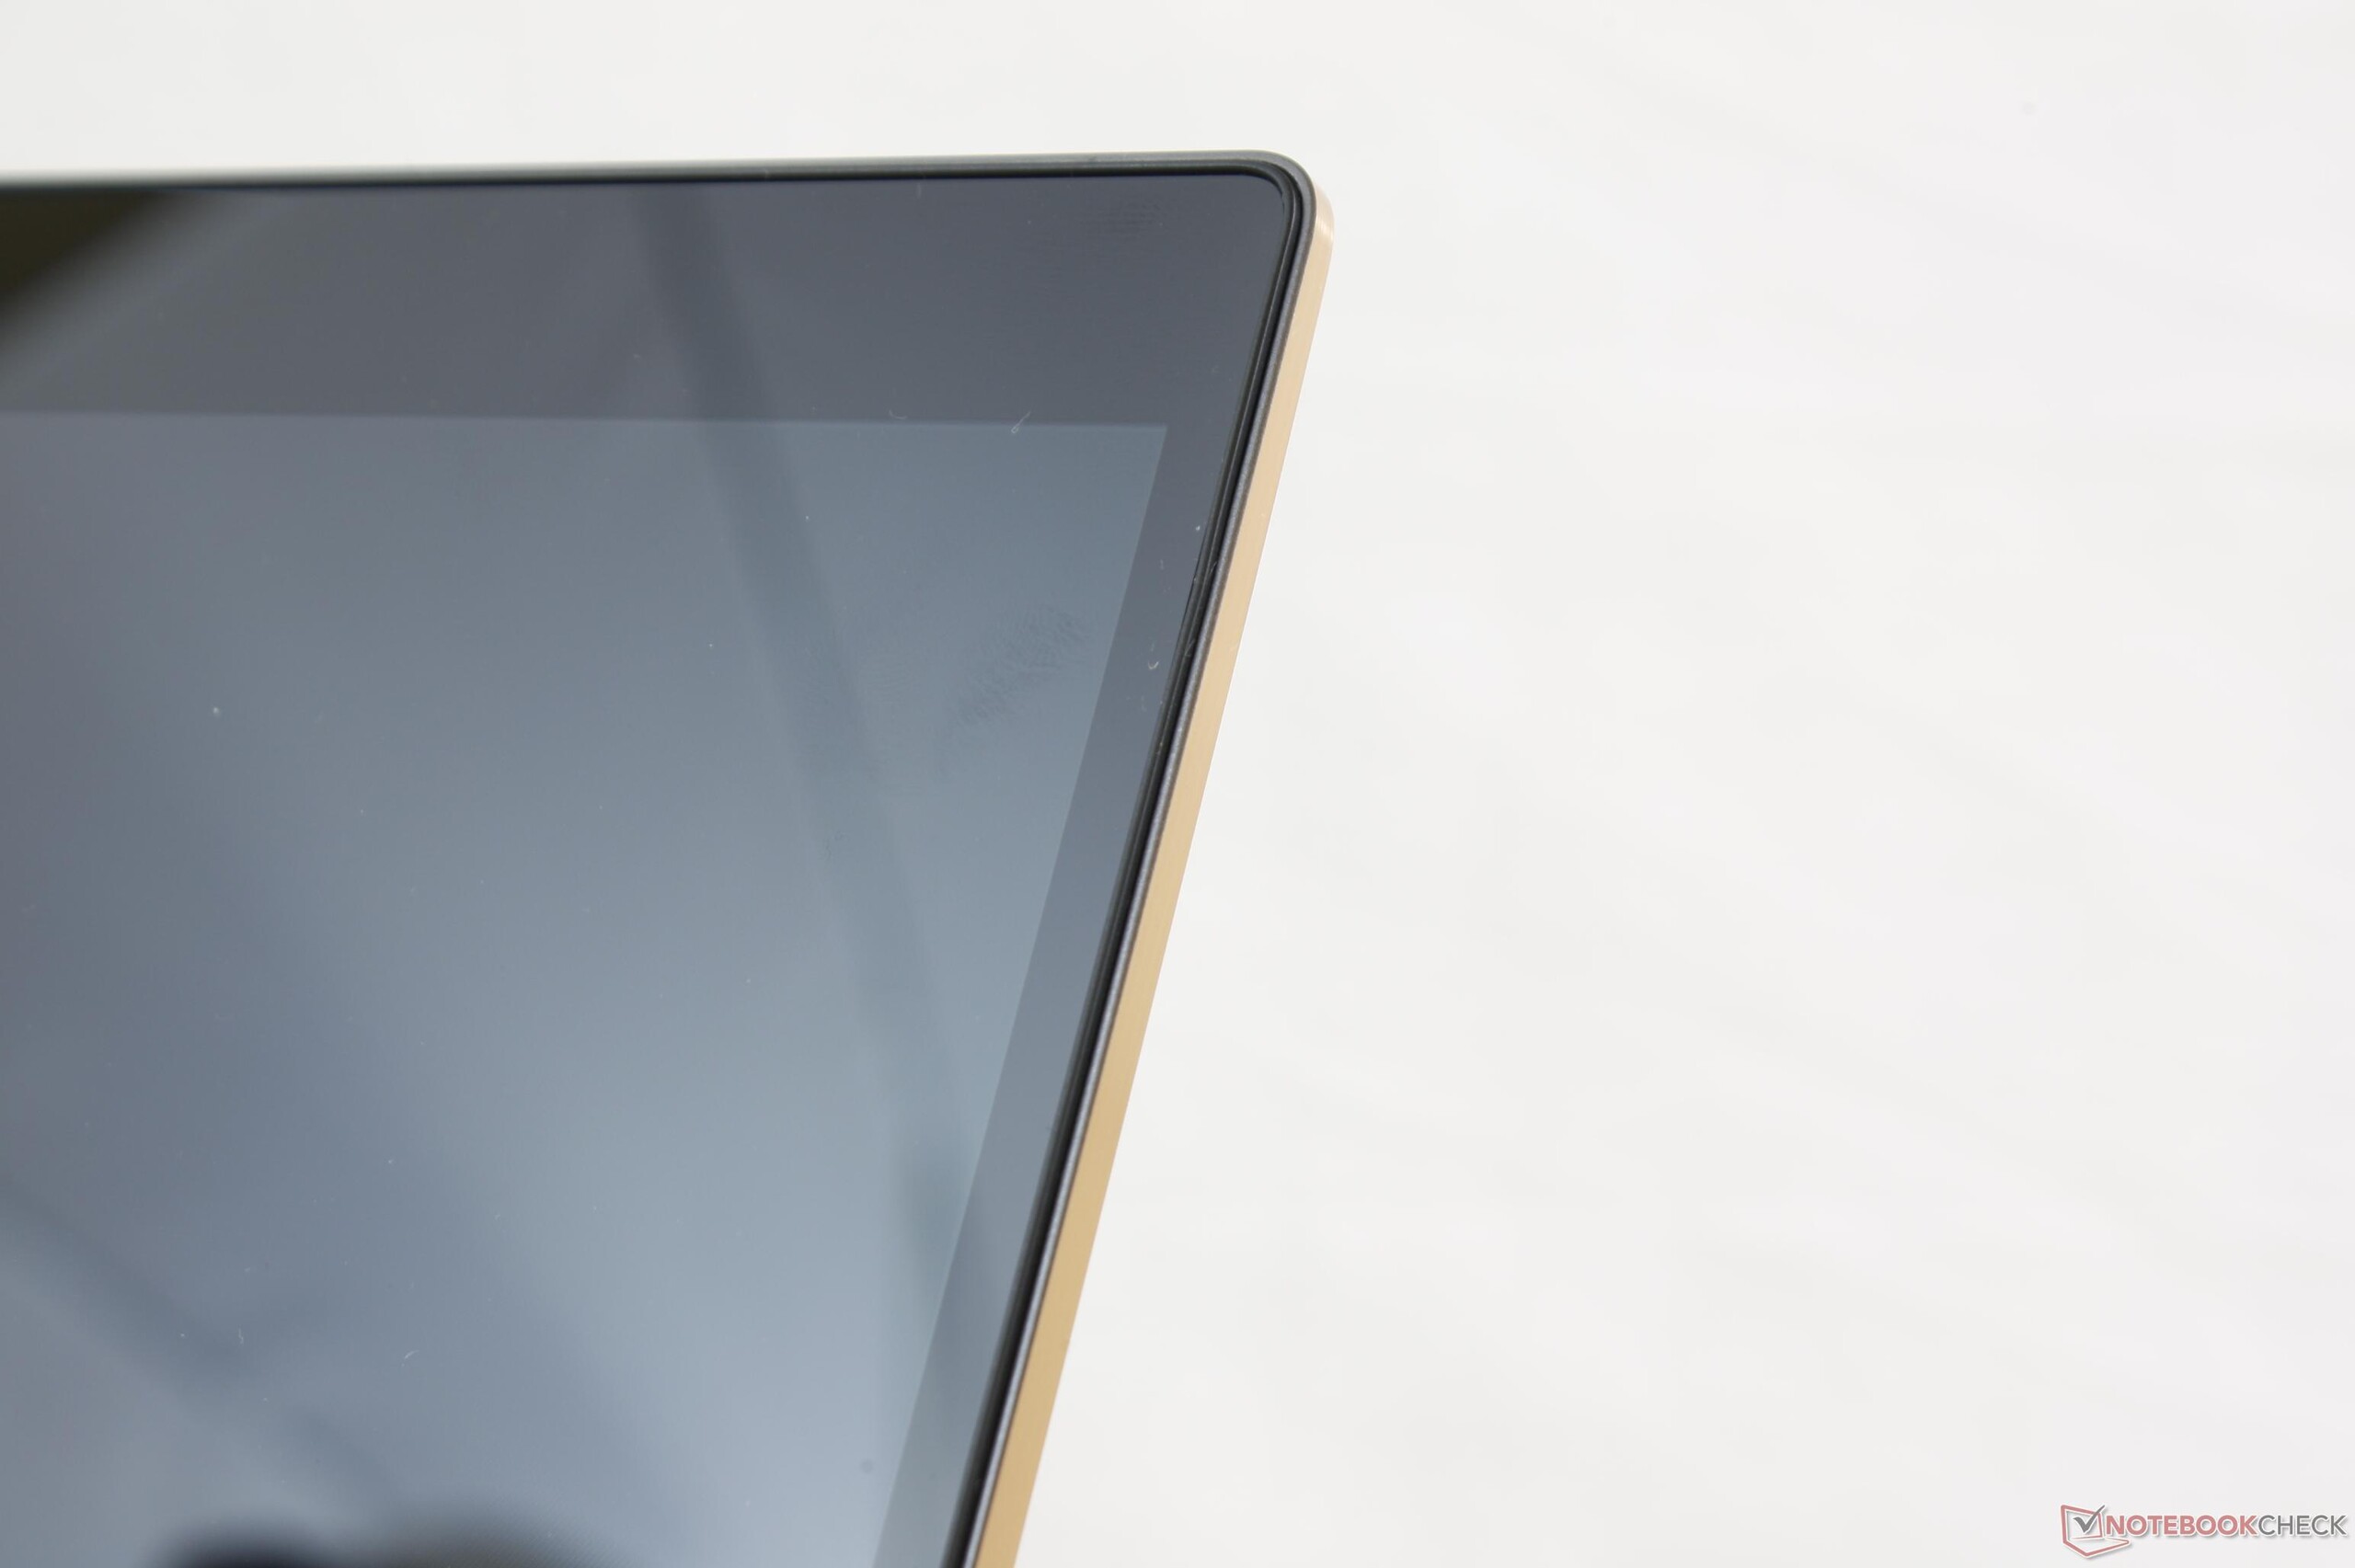
Att 2018 års modell är en aning större än 2017 års modell av Spectre x360 15 löser dock inte det största problemet som plågat Spectre x360-serien sedan 2016: Nämligen att den fortfarande är tung och nästan klumpig att använda i surfplatteläge. Övre kanten av infattningen är fortfarande tjock jämfört med konkurrenterna och vi hade önskat att HP ökade skärmens bakgrundsbelysning för bättre synlighet utomhus. Å andra sidan är detta ett rimligt pris att betala för en välbyggd och obeveklig maskin som är värdig att stå jämsides med både PS 15 9575 och 9570.
Dom svala temperaturerna och den tysta ljudnivån från Kaby Lake R-konfigurationen på 90 W har gjort oss ivriga att testa den kraftigare Kaby Lake G-konfigurationen på 150 W. I en framtida recension skulle det vara intressant att se hur samma chassi klarar av en mer krävande processor.
2017 års modell av Spectre x360 15 var en av dom bästa omvandlingsbara modellerna på 15 tum som fanns tillgänglig och det är inte annorlunda med 2018 års uppfräschning. Vår favorit 2-i-1 är nu tystare, svalare och mer funktionsrik än tidigare. Den som tidigare var ointresserad av Spectre x360 15 på grund av dess vikt och storlek kommer dock inte ändra sig nu.
HP Spectre x360 15-ch011nr
- 06/29/2018 v6 (old)
Allen Ngo
Price comparison
