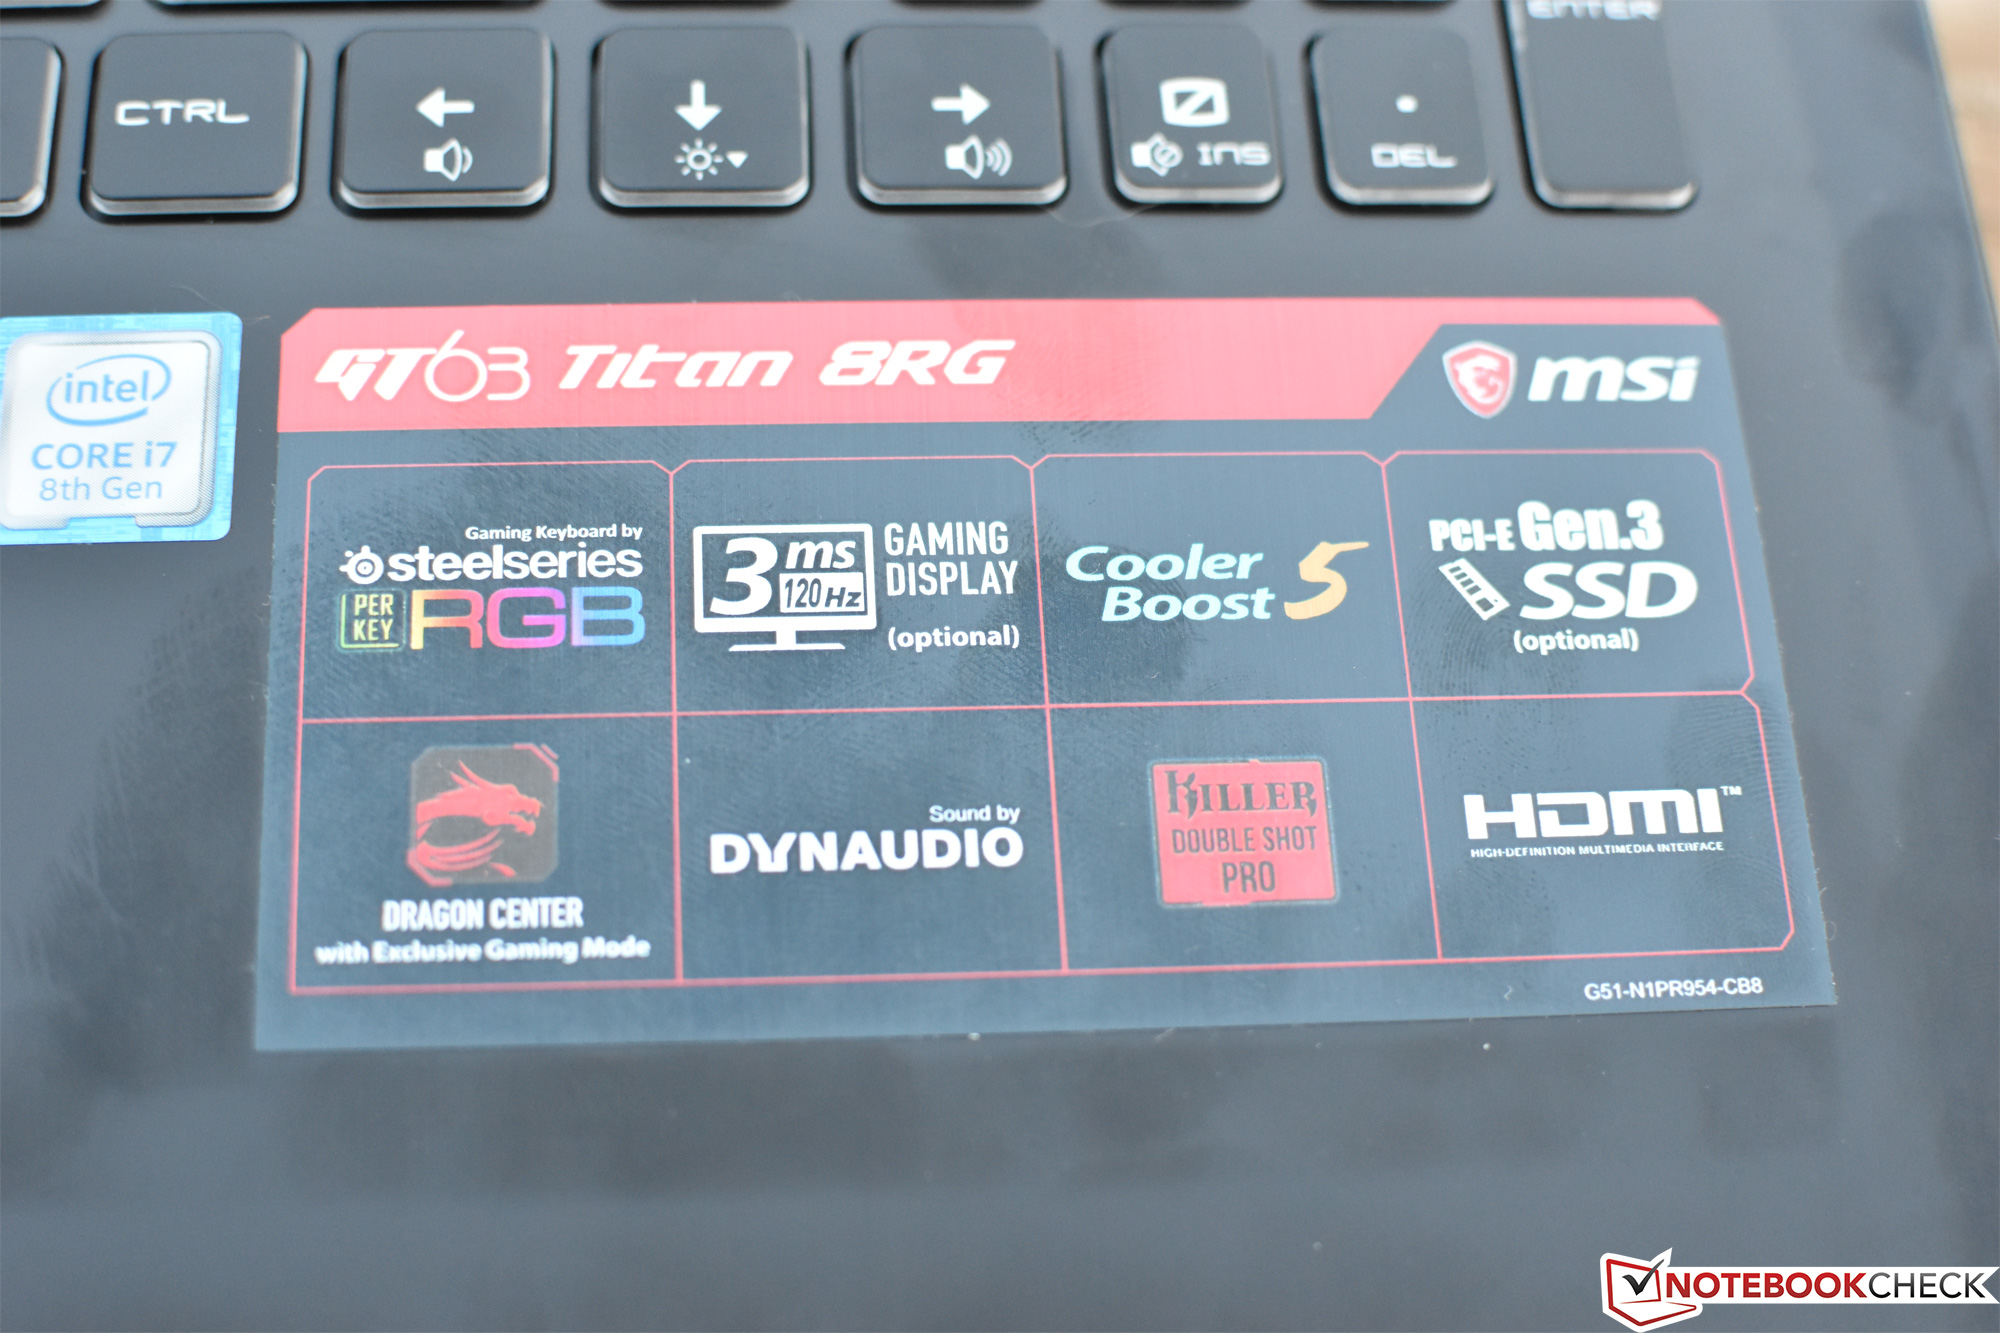
Test: MSI GT63 Titan 8RG-046 (i7-8750H, GTX 1080, FHD) Laptop (Sammanfattning)


| SD Card Reader | |
| average JPG Copy Test (av. of 3 runs) | |
| Asus Chimera G703GI (Toshiba Exceria Pro SDXC 64 GB UHS-II) | |
| Genomsnitt av klass Gaming (20.9 - 210, n=55, senaste 2 åren) | |
| Lenovo Legion Y520-15IKBA-80WY001VGE (Toshiba Exceria Pro SDXC 64 GB UHS-II) | |
| Dell G5 15 5587 (Toshiba Exceria Pro SDXC 64 GB UHS-II) | |
| MSI GT63 Titan 8RG-046 (Toshiba Exceria Pro SDXC 64 GB UHS-II) | |
| maximum AS SSD Seq Read Test (1GB) | |
| Asus Chimera G703GI (Toshiba Exceria Pro SDXC 64 GB UHS-II) | |
| Genomsnitt av klass Gaming (25.5 - 261, n=52, senaste 2 åren) | |
| Lenovo Legion Y520-15IKBA-80WY001VGE (Toshiba Exceria Pro SDXC 64 GB UHS-II) | |
| Dell G5 15 5587 (Toshiba Exceria Pro SDXC 64 GB UHS-II) | |
| MSI GT63 Titan 8RG-046 (Toshiba Exceria Pro SDXC 64 GB UHS-II) | |
| |||||||||||||||||||||||||
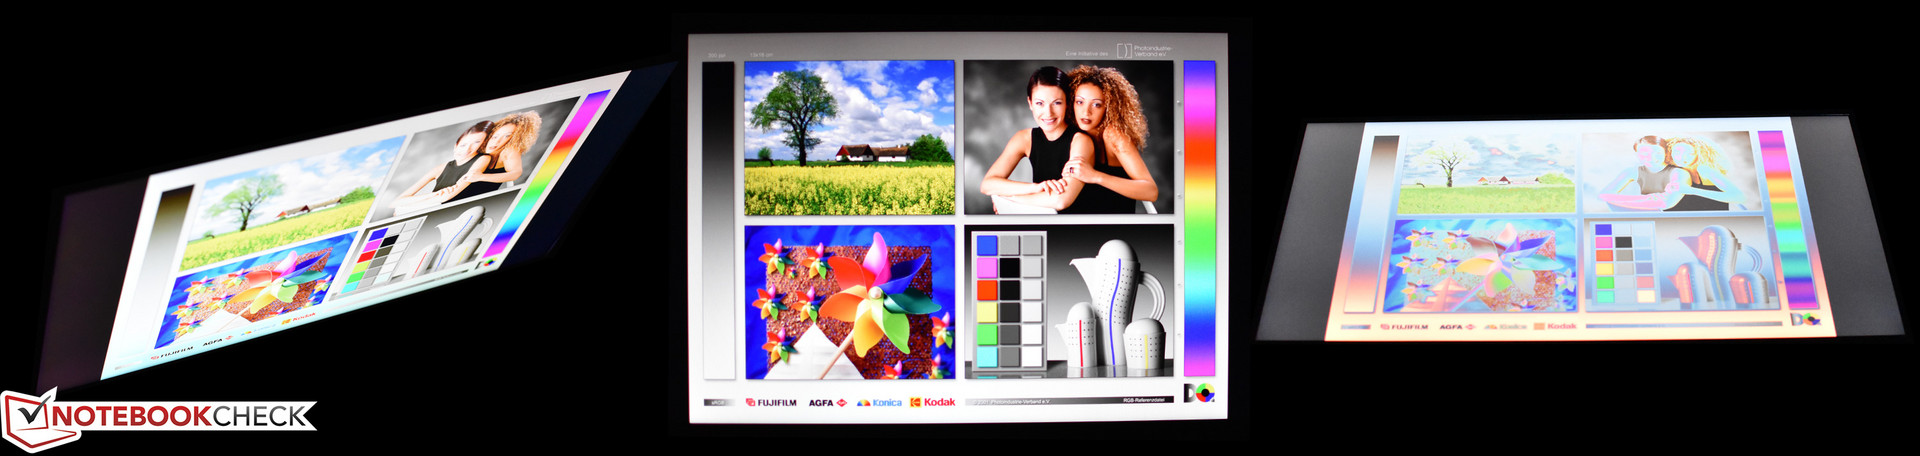
Distribution av ljusstyrkan: 80 %
Mitt på batteriet: 307.1 cd/m²
Kontrast: 830:1 (Svärta: 0.37 cd/m²)
ΔE ColorChecker Calman: 2.53 | ∀{0.5-29.43 Ø4.71}
calibrated: 2.82
ΔE Greyscale Calman: 1.7 | ∀{0.09-98 Ø4.96}
100% sRGB (Argyll 1.6.3 3D)
76% AdobeRGB 1998 (Argyll 1.6.3 3D)
85.7% AdobeRGB 1998 (Argyll 3D)
99.9% sRGB (Argyll 3D)
91.3% Display P3 (Argyll 3D)
Gamma: 2.194
CCT: 6893 K
| MSI GT63 Titan 8RG-046 N156HHE-GA1, TN, 15.6", 1920x1080 | Asus ROG GU501GM-BI7N8 AU Optronics AUO45ED, IPS, 15.6", 1920x1080 | Razer Blade 15 2018 LGD05C0, IPS, 15.6", 1920x1080 | Lenovo Legion Y520-15IKBA-80WY001VGE LG Philips LGD0533, IPS, 15.6", 1920x1080 | Alienware 15 R3 Max-Q LG Philips LP156WF6 (LGD049B), IPS, 15.6", 1920x1080 | Dell G5 15 5587 LGD053F, 156WF6, IPS, 15.6", 1920x1080 | Asus Chimera G703GI B173HAN03.2 (AUO329D), IPS, 17.3", 1920x1080 | Acer Predator Helios 500 PH517-51-79BY AUO_B173HAN03, IPS, 17.3", 1920x1080 | |
|---|---|---|---|---|---|---|---|---|
| Display | -22% | -20% | -50% | -25% | -52% | -19% | -20% | |
| Display P3 Coverage (%) | 91.3 | 63.4 -31% | 64.3 -30% | 39.53 -57% | 64.3 -30% | 38.13 -58% | 65.8 -28% | 64.4 -29% |
| sRGB Coverage (%) | 99.9 | 87.7 -12% | 93.7 -6% | 59.2 -41% | 82.9 -17% | 56.8 -43% | 92.6 -7% | 91.3 -9% |
| AdobeRGB 1998 Coverage (%) | 85.7 | 65.5 -24% | 40.86 -52% | 60.6 -29% | 39.47 -54% | 67 -22% | 65.6 -23% | |
| Response Times | -322% | -106% | -383% | -380% | -304% | -31% | -61% | |
| Response Time Grey 50% / Grey 80% * (ms) | 8.4 ? | 30.8 ? -267% | 17.2 ? -105% | 42 ? -400% | 40 ? -376% | 33 ? -293% | 6.4 ? 24% | 14 ? -67% |
| Response Time Black / White * (ms) | 5.8 ? | 27.6 ? -376% | 12 ? -107% | 27 ? -366% | 28 ? -383% | 24 ? -314% | 10.8 ? -86% | 9 ? -55% |
| PWM Frequency (Hz) | 25510 ? | 24900 ? | 21100 ? | |||||
| Screen | -21% | -3% | -68% | -38% | -69% | -2% | -47% | |
| Brightness middle (cd/m²) | 307.1 | 286.7 -7% | 290 -6% | 243 -21% | 306 0% | 229 -25% | 285 -7% | 335 9% |
| Brightness (cd/m²) | 276 | 281 2% | 281 2% | 231 -16% | 297 8% | 224 -19% | 275 0% | 300 9% |
| Brightness Distribution (%) | 80 | 92 15% | 82 2% | 87 9% | 89 11% | 87 9% | 82 2% | 82 2% |
| Black Level * (cd/m²) | 0.37 | 0.39 -5% | 0.3 19% | 0.24 35% | 0.28 24% | 0.28 24% | 0.22 41% | 0.7 -89% |
| Contrast (:1) | 830 | 735 -11% | 967 17% | 1013 22% | 1093 32% | 818 -1% | 1295 56% | 479 -42% |
| Colorchecker dE 2000 * | 2.53 | 4.17 -65% | 2.85 -13% | 6.36 -151% | 5.45 -115% | 6.1 -141% | 3.18 -26% | 4.99 -97% |
| Colorchecker dE 2000 max. * | 4.66 | 7.22 -55% | 6.27 -35% | 12.76 -174% | 9.45 -103% | 12.2 -162% | 5.99 -29% | 9.32 -100% |
| Colorchecker dE 2000 calibrated * | 2.82 | 1.39 51% | 6.51 -131% | 6.12 -117% | 1.73 39% | 1.93 32% | ||
| Greyscale dE 2000 * | 1.7 | 2.5 -47% | 2.4 -41% | 5.63 -231% | 4.9 -188% | 5.68 -234% | 2.93 -72% | 5.2 -206% |
| Gamma | 2.194 100% | 2.274 97% | 2.34 94% | 2.47 89% | 2.49 88% | 2.4 92% | 2.45 90% | 2.49 88% |
| CCT | 6893 94% | 6885 94% | 6718 97% | 7411 88% | 7062 92% | 6989 93% | 7165 91% | 7719 84% |
| Color Space (Percent of AdobeRGB 1998) (%) | 76 | 57 -25% | 60 -21% | 38 -50% | 54 -29% | 36 -53% | 60 -21% | 59 -22% |
| Color Space (Percent of sRGB) (%) | 100 | 87 -13% | 94 -6% | 59 -41% | 83 -17% | 57 -43% | 93 -7% | 91 -9% |
| Totalt genomsnitt (program/inställningar) | -122% /
-64% | -43% /
-19% | -167% /
-104% | -148% /
-81% | -142% /
-95% | -17% /
-9% | -43% /
-44% |
* ... mindre är bättre
Visa svarstider
| ↔ Svarstid svart till vitt | ||
|---|---|---|
| 5.8 ms ... stiga ↗ och falla ↘ kombinerat | ↗ 4.4 ms stiga | 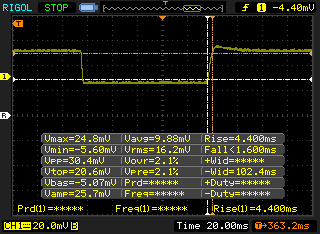 |
| ↘ 1.4 ms hösten | ||
| Skärmen visar väldigt snabba svarsfrekvenser i våra tester och borde vara mycket väl lämpad för fartfyllt spel. I jämförelse sträcker sig alla testade enheter från 0.1 (minst) till 240 (maximalt) ms. » 18 % av alla enheter är bättre. Det betyder att den uppmätta svarstiden är bättre än genomsnittet av alla testade enheter (19.8 ms). | ||
| ↔ Svarstid 50 % grått till 80 % grått | ||
| 8.4 ms ... stiga ↗ och falla ↘ kombinerat | ↗ 4.4 ms stiga | 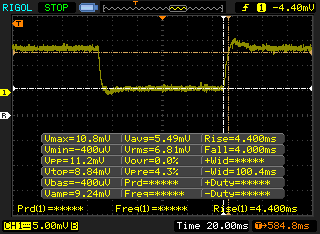 |
| ↘ 4 ms hösten | ||
| Skärmen visar snabba svarsfrekvenser i våra tester och bör passa för spel. I jämförelse sträcker sig alla testade enheter från 0.165 (minst) till 636 (maximalt) ms. » 22 % av alla enheter är bättre. Det betyder att den uppmätta svarstiden är bättre än genomsnittet av alla testade enheter (30.9 ms). | ||
Skärmflimmer / PWM (Puls-Width Modulation)
| Skärmflimmer / PWM upptäckt | 25510 Hz | ≤ 34 % ljusstyrka inställning | 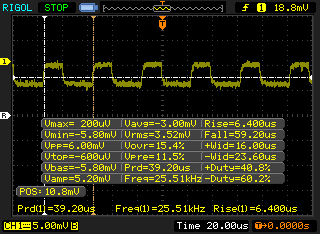 |
Displayens bakgrundsbelysning flimrar vid 25510 Hz (i värsta fall, t.ex. med PWM) Flimrande upptäckt vid en ljusstyrkeinställning på 34 % och lägre. Det ska inte finnas något flimmer eller PWM över denna ljusstyrkeinställning. Frekvensen för 25510 Hz är ganska hög, så de flesta användare som är känsliga för PWM bör inte märka något flimmer. Som jämförelse: 52 % av alla testade enheter använder inte PWM för att dämpa skärmen. Om PWM upptäcktes mättes ett medelvärde av 7748 (minst: 5 - maximum: 343500) Hz. | |||
| PCMark 8 Home Score Accelerated v2 | 5445 poäng | |
| PCMark 8 Work Score Accelerated v2 | 5574 poäng | |
| PCMark 10 Score | 5961 poäng | |
Hjälp | ||
| MSI GT63 Titan 8RG-046 CUK Cyclone 500GB M.2 NVMe | Asus ROG GU501GM-BI7N8 Kingston RBUSNS8154P3128GJ | Razer Blade 15 2018 Samsung PM961 NVMe MZVLW512HMJP | Alienware 15 R3 Max-Q LiteOn CX2-8B256 | Asus Chimera G703GI 2x Intel 760p 512 GB + 1x Samsung SM961 512 GB (RAID) | Acer Predator Helios 500 PH517-51-79BY SK hynix SSD Canvas SC300 HFS256GD9MNE-6200A | |
|---|---|---|---|---|---|---|
| AS SSD | -96% | 18% | -12% | 67% | -28% | |
| Copy Game MB/s (MB/s) | 419.3 | 572 | 590 | |||
| Copy Program MB/s (MB/s) | 269.2 | 332 | 337 | |||
| Copy ISO MB/s (MB/s) | 773 | 1266 | 868 | |||
| Score Total (Points) | 3040 | 900 -70% | 3806 25% | 2328 -23% | 4843 59% | |
| Score Write (Points) | 902 | 345 -62% | 1450 61% | 894 -1% | 1855 106% | 812 -10% |
| Score Read (Points) | 1433 | 377 -74% | 1584 11% | 989 -31% | 1999 39% | 859 -40% |
| Access Time Write * (ms) | 0.042 | 0.058 -38% | 0.038 10% | 0.032 24% | 0.026 38% | 0.054 -29% |
| Access Time Read * (ms) | 0.05 | 0.278 -456% | 0.051 -2% | 0.063 -26% | 0.03 40% | |
| 4K-64 Write (MB/s) | 648 | 237 -63% | 1204 86% | 710 10% | 1303 101% | 647 0% |
| 4K-64 Read (MB/s) | 1144 | 270.3 -76% | 1300 14% | 741 -35% | 1453 27% | 723 -37% |
| 4K Write (MB/s) | 87.7 | 67.1 -23% | 93.6 7% | 119.3 36% | 141.3 61% | 80.7 -8% |
| 4K Read (MB/s) | 49.17 | 22.62 -54% | 46.45 -6% | 42.73 -13% | 57.4 17% | 38.57 -22% |
| Seq Write (MB/s) | 1665 | 404.7 -76% | 1521 -9% | 645 -61% | 4110 147% | 838 -50% |
| Seq Read (MB/s) | 2399 | 841 -65% | 2376 -1% | 2058 -14% | 4886 104% | 972 -59% |
* ... mindre är bättre

| 3DMark 11 Performance | 19463 poäng | |
| 3DMark Cloud Gate Standard Score | 35776 poäng | |
| 3DMark Fire Strike Score | 17582 poäng | |
Hjälp | ||
| Metro: Last Light | |
| 1024x768 Low (DX10) AF:4x (sortera efter värde) | |
| MSI GT63 Titan 8RG-046 | |
| Genomsnitt NVIDIA GeForce GTX 1080 Mobile (n=1) | |
| 1366x768 Medium (DX10) AF:4x (sortera efter värde) | |
| MSI GT63 Titan 8RG-046 | |
| Genomsnitt NVIDIA GeForce GTX 1080 Mobile (n=1) | |
| 1366x768 High (DX11) AF:16x (sortera efter värde) | |
| MSI GT63 Titan 8RG-046 | |
| Genomsnitt NVIDIA GeForce GTX 1080 Mobile (n=1) | |
| 1920x1080 Very High (DX11) AF:16x (sortera efter värde) | |
| MSI GT63 Titan 8RG-046 | |
| Dell Inspiron 15 7000 7577 4K | |
| Genomsnitt NVIDIA GeForce GTX 1080 Mobile (110.2 - 141.1, n=7) | |
| låg | med. | hög | ultra | |
|---|---|---|---|---|
| BioShock Infinite (2013) | 309 | 270 | 259 | 169 |
| Metro: Last Light (2013) | 128 | 131 | 129 | 117 |
| The Witcher 3 (2015) | 72 | |||
| Rise of the Tomb Raider (2016) | 210 | 166 | 131 | 120 |
Ljudnivå
| Låg belastning |
| 31.4 / 31.4 / 32.2 dB(A) |
| Hög belastning |
| 35.5 / 50.8 dB(A) |
 | ||
30 dB tyst 40 dB(A) hörbar 50 dB(A) högt ljud |
||
min: | ||
| MSI GT63 Titan 8RG-046 GeForce GTX 1080 Mobile, i7-8750H, CUK Cyclone 500GB M.2 NVMe | Asus ROG GU501GM-BI7N8 GeForce GTX 1060 Mobile, i7-8750H, Kingston RBUSNS8154P3128GJ | Razer Blade 15 2018 GeForce GTX 1070 Max-Q, i7-8750H, Samsung PM961 NVMe MZVLW512HMJP | Alienware 15 R3 Max-Q GeForce GTX 1080 Max-Q, i7-7820HK, LiteOn CX2-8B256 | Dell G5 15 5587 GeForce GTX 1060 Max-Q, i5-8300H, SK hynix SC311 M.2 | Asus Chimera G703GI GeForce GTX 1080 Mobile, i9-8950HK, 2x Intel 760p 512 GB + 1x Samsung SM961 512 GB (RAID) | Acer Predator Helios 500 PH517-51-79BY GeForce GTX 1070 Mobile, i7-8750H, SK hynix SSD Canvas SC300 HFS256GD9MNE-6200A | |
|---|---|---|---|---|---|---|---|
| Noise | -5% | -5% | -7% | 2% | -14% | -4% | |
| av / miljö * (dB) | 28 | 28.6 -2% | 29 -4% | 29 -4% | 30.3 -8% | 29 -4% | 30.4 -9% |
| Idle Minimum * (dB) | 31.4 | 31.4 -0% | 29 8% | 32 -2% | 31.1 1% | 30 4% | 31.2 1% |
| Idle Average * (dB) | 31.4 | 31.4 -0% | 30 4% | 33 -5% | 31.1 1% | 34 -8% | 35.3 -12% |
| Idle Maximum * (dB) | 32.2 | 34.2 -6% | 38 -18% | 35 -9% | 34.2 -6% | 42 -30% | 35.3 -10% |
| Load Average * (dB) | 35.5 | 42.8 -21% | 46 -30% | 46 -30% | 34.9 2% | 53 -49% | 44.4 -25% |
| Witcher 3 ultra * (dB) | 47.6 | 50.9 -7% | 49 -3% | 48 -1% | 42.7 10% | 51 -7% | 41 14% |
| Load Maximum * (dB) | 50.8 | 50.9 -0% | 46 9% | 50 2% | 44 13% | 53 -4% | 45.2 11% |
* ... mindre är bättre
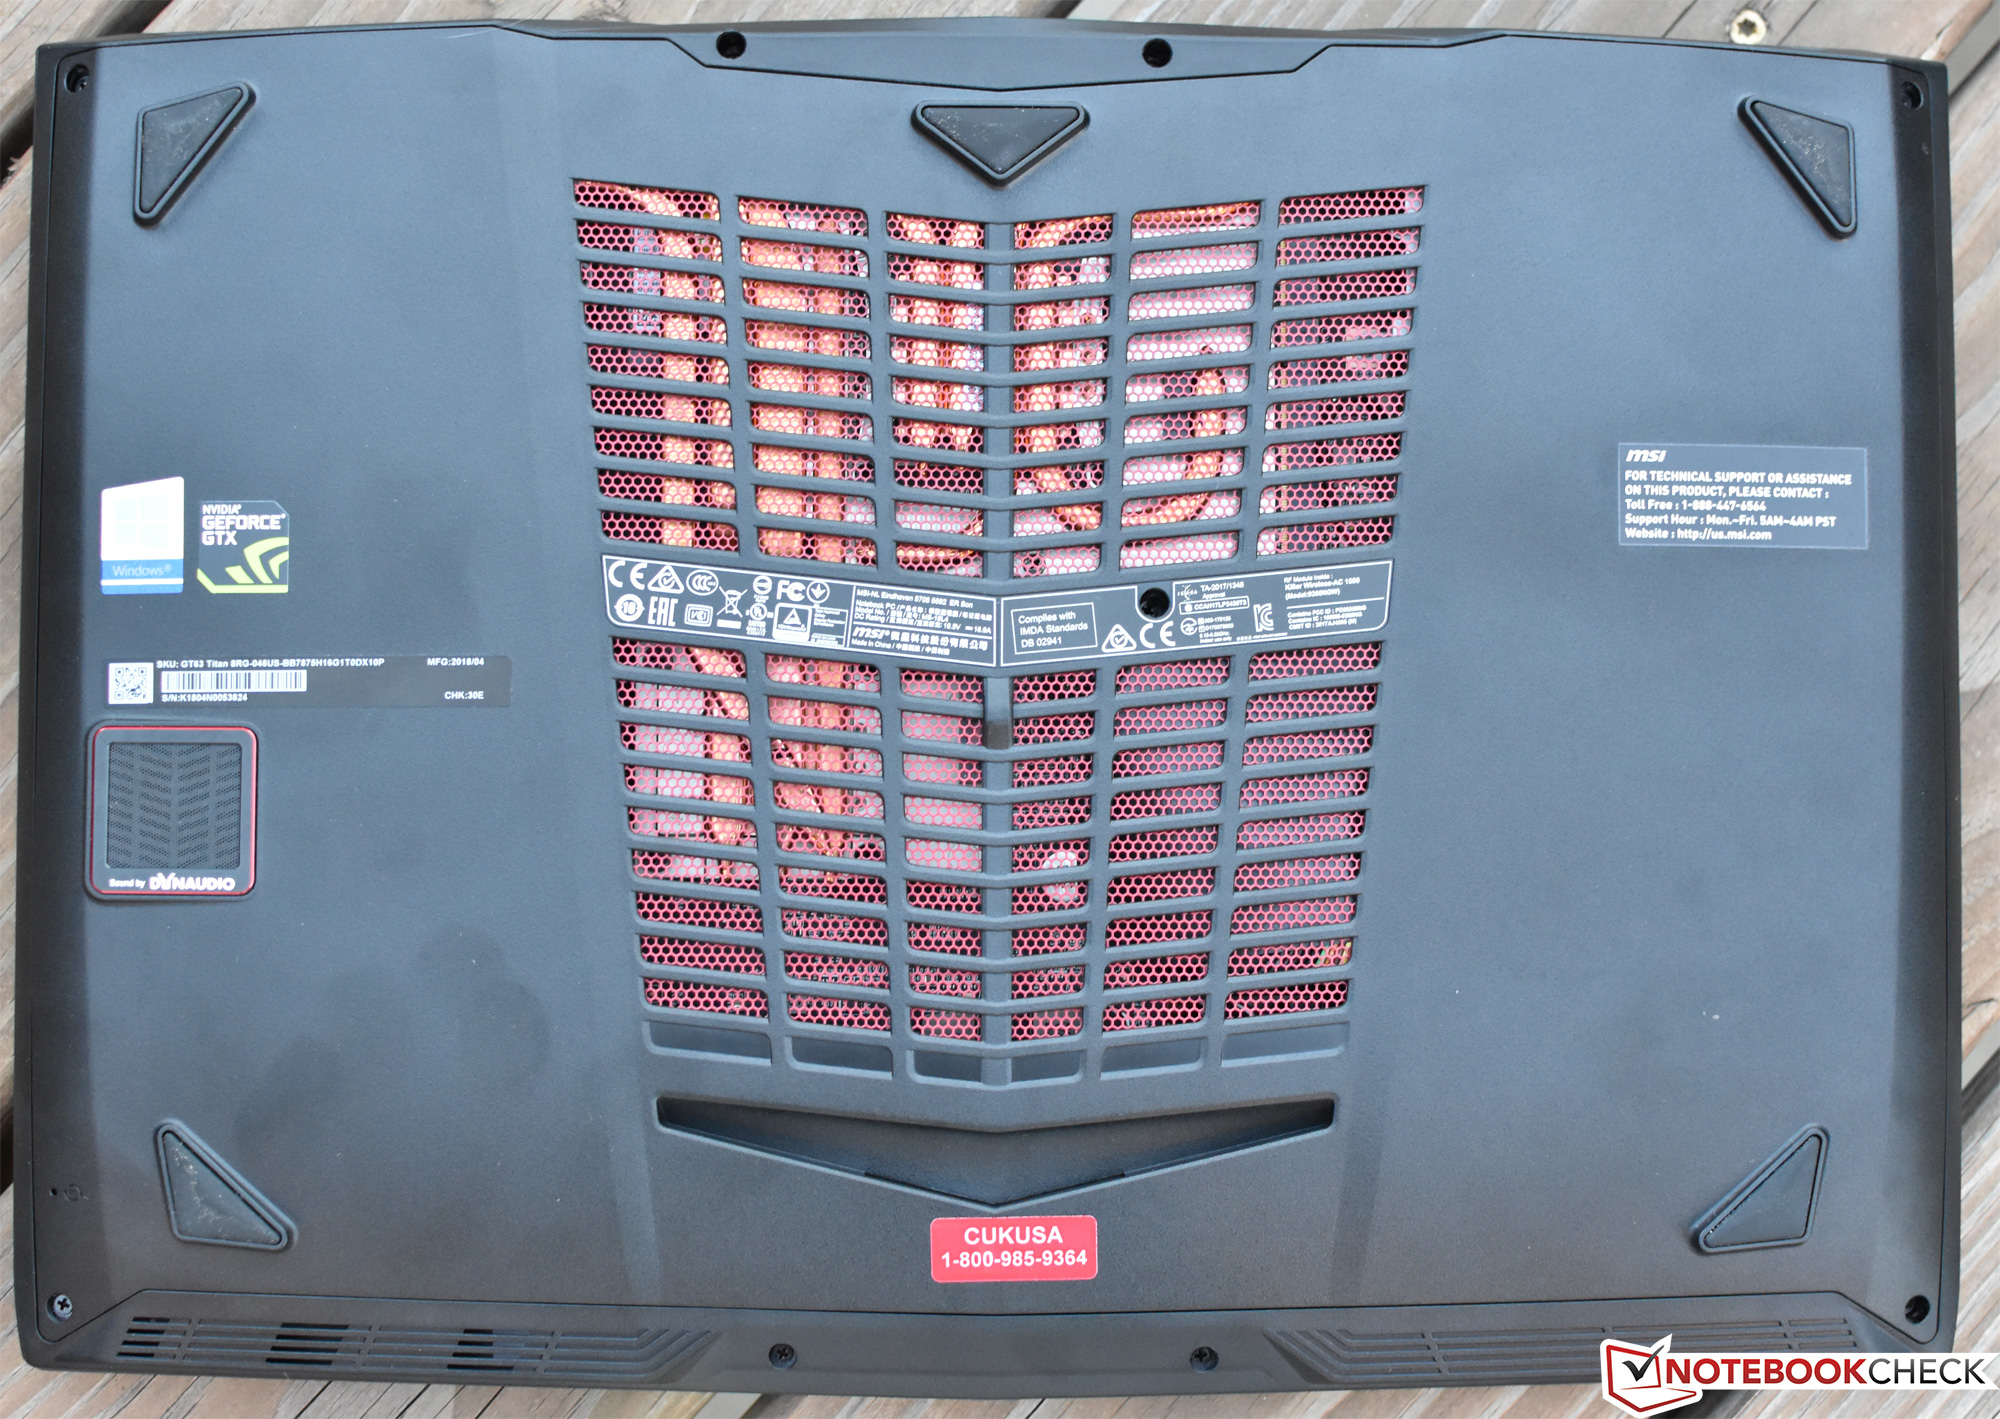
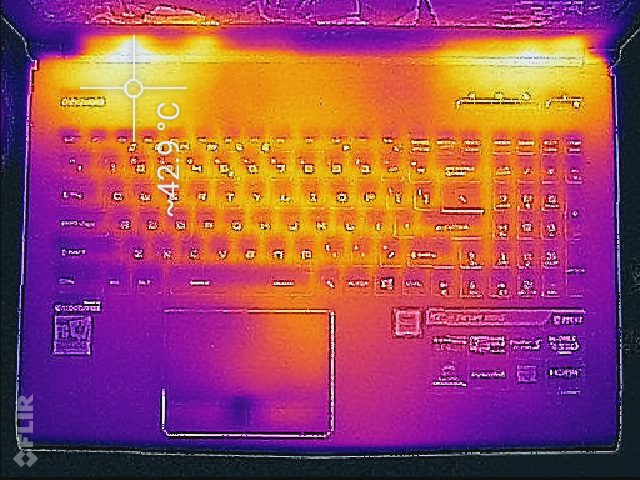
(±) Den maximala temperaturen på ovansidan är 41.6 °C / 107 F, jämfört med genomsnittet av 40.4 °C / 105 F , allt från 21.2 till 68.8 °C för klassen Gaming.
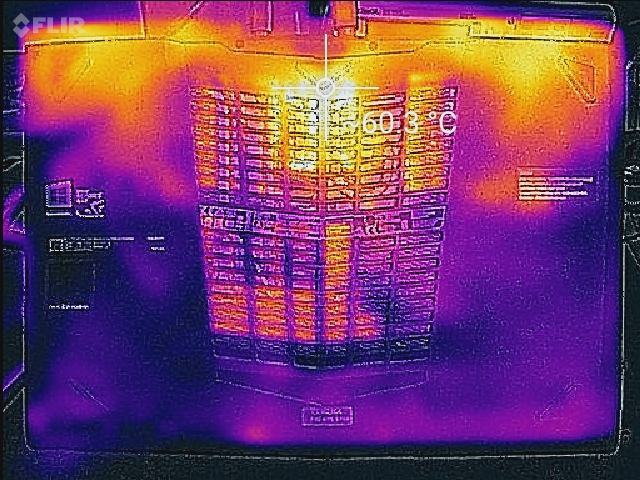
(-) Botten värms upp till maximalt 54.8 °C / 131 F, jämfört med genomsnittet av 43.2 °C / 110 F
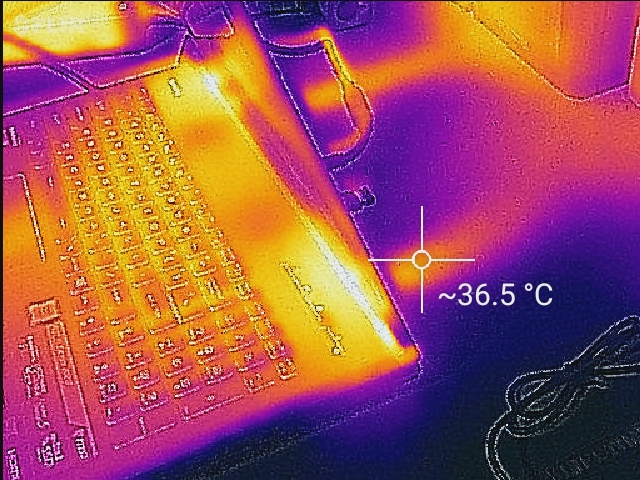
(±) Handledsstöden och pekplattan kan bli väldigt varma vid beröring med maximalt 37 °C / 98.6 F.
(-) Medeltemperaturen för handledsstödsområdet på liknande enheter var 28.8 °C / 83.8 F (-8.2 °C / -14.8 F).
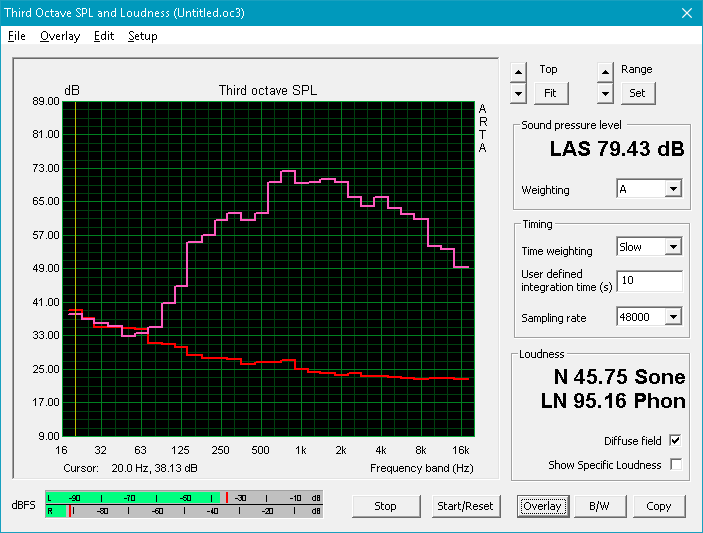
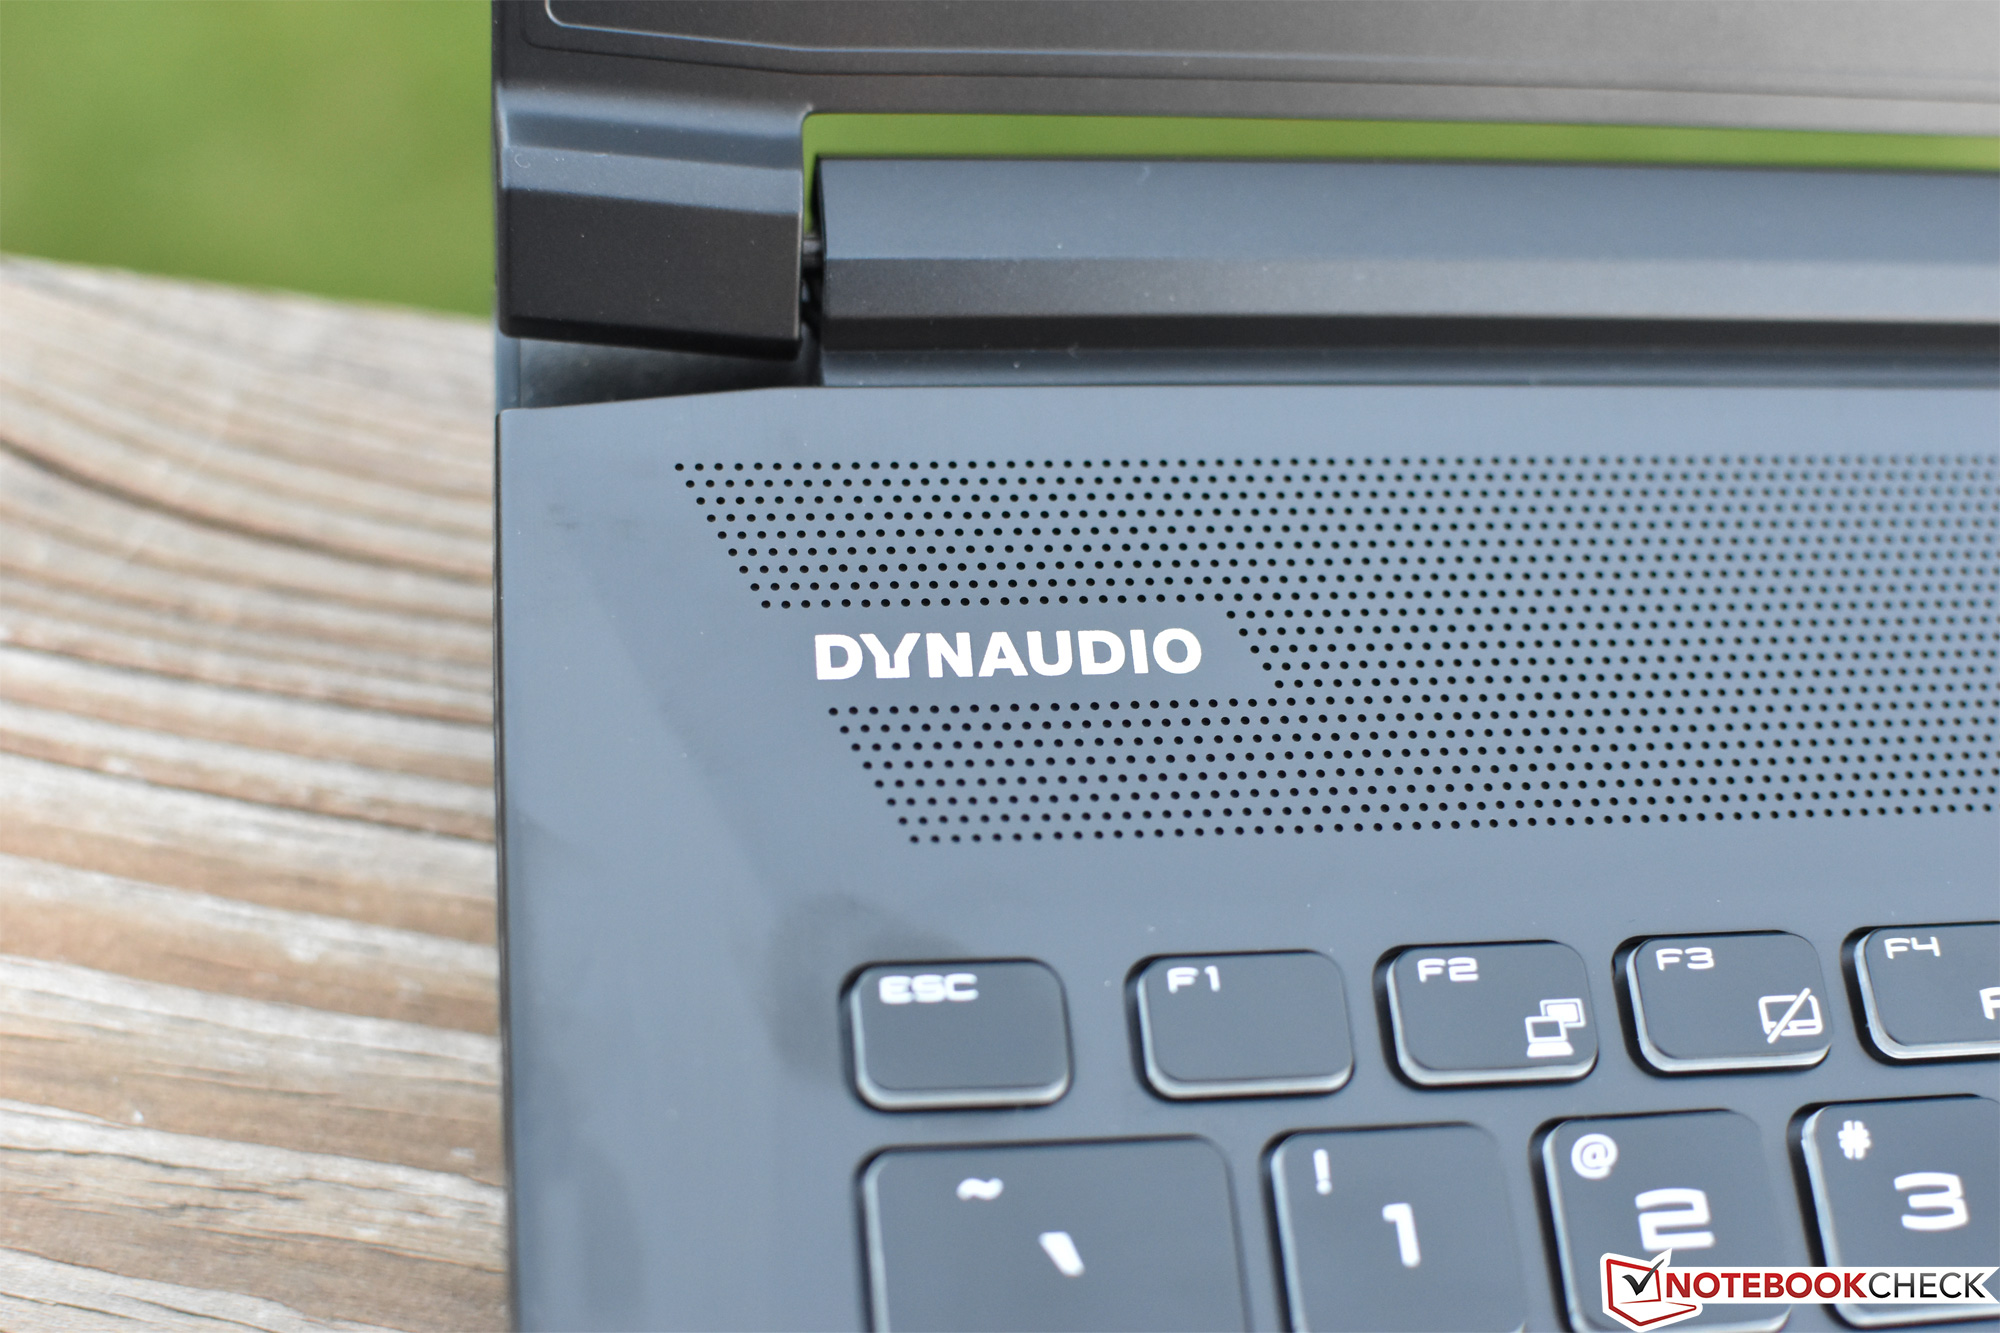
MSI GT63 Titan 8RG-046 ljudanalys
(±) | högtalarljudstyrkan är genomsnittlig men bra (79.4 dB)
Bas 100 - 315 Hz
(±) | reducerad bas - i genomsnitt 8.7% lägre än medianen
(±) | linjäriteten för basen är genomsnittlig (12.1% delta till föregående frekvens)
Mellan 400 - 2000 Hz
(±) | högre mellan - i genomsnitt 6.2% högre än median
(+) | mids är linjära (6% delta till föregående frekvens)
Högsta 2 - 16 kHz
(+) | balanserade toppar - endast 2.9% från medianen
(±) | linjäriteten för toppar är genomsnittlig (7.3% delta till föregående frekvens)
Totalt 100 - 16 000 Hz
(±) | linjäriteten för det totala ljudet är genomsnittlig (18.7% skillnad mot median)
Jämfört med samma klass
» 62% av alla testade enheter i den här klassen var bättre, 8% liknande, 30% sämre
» Den bästa hade ett delta på 6%, genomsnittet var 18%, sämst var 132%
Jämfört med alla testade enheter
» 43% av alla testade enheter var bättre, 8% liknande, 49% sämre
» Den bästa hade ett delta på 4%, genomsnittet var 23%, sämst var 134%
Asus Chimera G703GI ljudanalys
(+) | högtalare kan spela relativt högt (89 dB)
Bas 100 - 315 Hz
(±) | reducerad bas - i genomsnitt 8.9% lägre än medianen
(+) | basen är linjär (6.4% delta till föregående frekvens)
Mellan 400 - 2000 Hz
(+) | balanserad mellan - endast 3.1% från medianen
(+) | mids är linjära (2.4% delta till föregående frekvens)
Högsta 2 - 16 kHz
(+) | balanserade toppar - endast 4.4% från medianen
(+) | toppar är linjära (3.2% delta till föregående frekvens)
Totalt 100 - 16 000 Hz
(+) | det totala ljudet är linjärt (11.8% skillnad mot median)
Jämfört med samma klass
» 11% av alla testade enheter i den här klassen var bättre, 4% liknande, 85% sämre
» Den bästa hade ett delta på 6%, genomsnittet var 18%, sämst var 132%
Jämfört med alla testade enheter
» 9% av alla testade enheter var bättre, 3% liknande, 89% sämre
» Den bästa hade ett delta på 4%, genomsnittet var 23%, sämst var 134%
| Av/Standby | |
| Låg belastning | |
| Hög belastning |
|
Förklaring:
min: | |
| MSI GT63 Titan 8RG-046 i7-8750H, GeForce GTX 1080 Mobile, CUK Cyclone 500GB M.2 NVMe, TN, 1920x1080, 15.6" | Asus ROG GU501GM-BI7N8 i7-8750H, GeForce GTX 1060 Mobile, Kingston RBUSNS8154P3128GJ, IPS, 1920x1080, 15.6" | Razer Blade 15 2018 i7-8750H, GeForce GTX 1070 Max-Q, Samsung PM961 NVMe MZVLW512HMJP, IPS, 1920x1080, 15.6" | Alienware 15 R3 Max-Q i7-7820HK, GeForce GTX 1080 Max-Q, LiteOn CX2-8B256, IPS, 1920x1080, 15.6" | Dell G5 15 5587 i5-8300H, GeForce GTX 1060 Max-Q, SK hynix SC311 M.2, IPS, 1920x1080, 15.6" | Asus Chimera G703GI i9-8950HK, GeForce GTX 1080 Mobile, 2x Intel 760p 512 GB + 1x Samsung SM961 512 GB (RAID), IPS, 1920x1080, 17.3" | Acer Predator Helios 500 PH517-51-79BY i7-8750H, GeForce GTX 1070 Mobile, SK hynix SSD Canvas SC300 HFS256GD9MNE-6200A, IPS, 1920x1080, 17.3" | |
|---|---|---|---|---|---|---|---|
| Power Consumption | 31% | 30% | 12% | 53% | -33% | 0% | |
| Idle Minimum * (Watt) | 26.4 | 12.35 53% | 14 47% | 22 17% | 4.9 81% | 29 -10% | 20.4 23% |
| Idle Average * (Watt) | 30 | 19.98 33% | 17 43% | 26 13% | 8.5 72% | 37 -23% | 26.5 12% |
| Idle Maximum * (Watt) | 30.6 | 25.44 17% | 21 31% | 33 -8% | 9.1 70% | 46 -50% | 37 -21% |
| Load Average * (Watt) | 90.4 | 94.28 -4% | 95 -5% | 86 5% | 90.7 -0% | 156 -73% | 129 -43% |
| Witcher 3 ultra * (Watt) | 255.6 | 132.9 48% | 141 45% | 159 38% | 110 57% | 252 1% | 186 27% |
| Load Maximum * (Watt) | 224.4 | 140.63 37% | 179 20% | 215 4% | 144 36% | 314 -40% | 216 4% |
* ... mindre är bättre
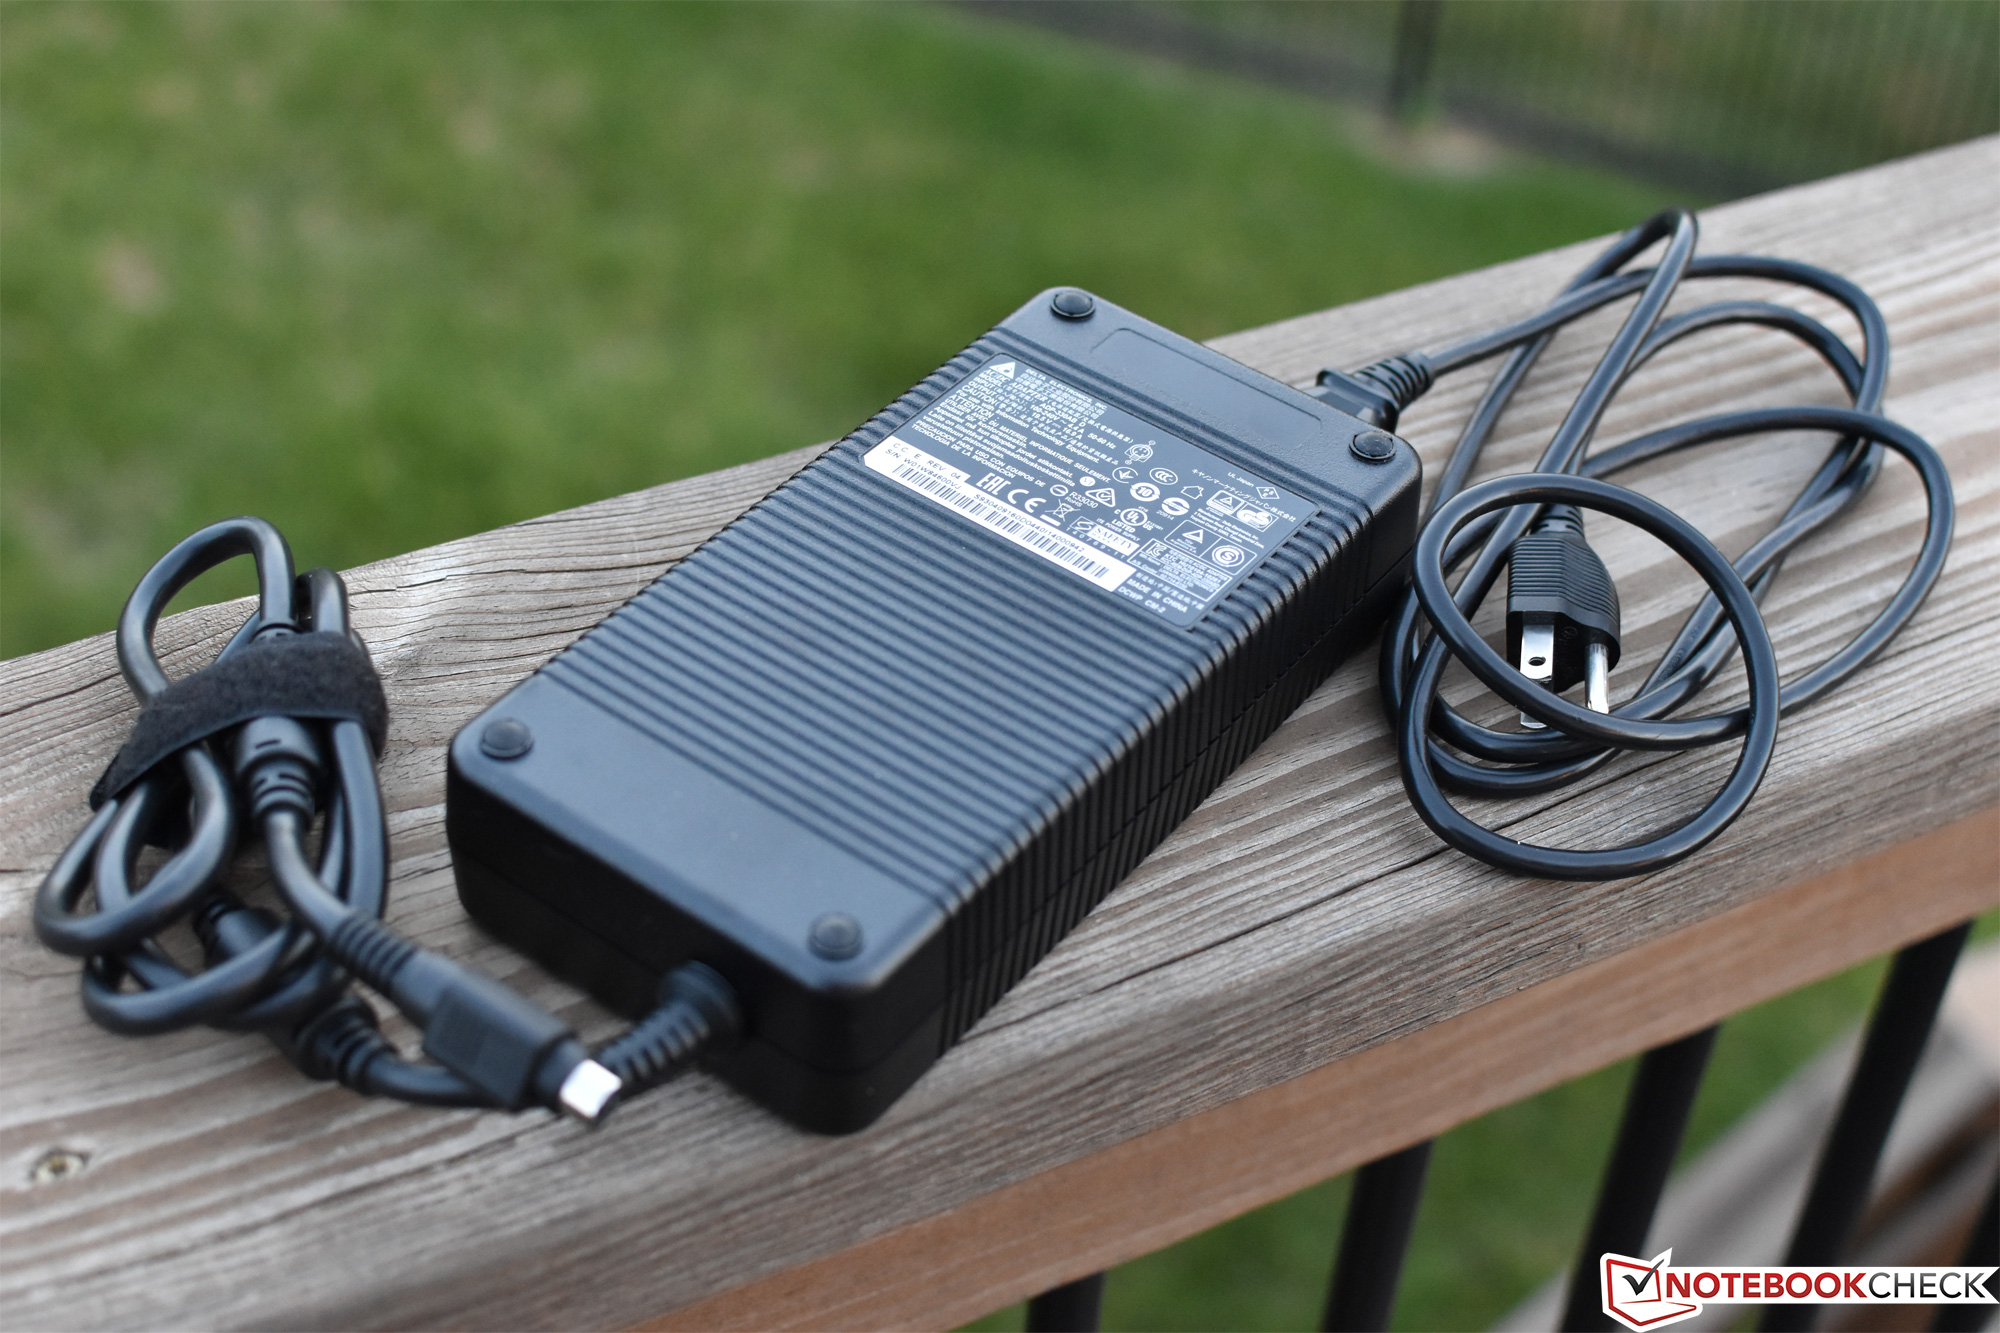
| MSI GT63 Titan 8RG-046 i7-8750H, GeForce GTX 1080 Mobile, 75.24 Wh | Asus ROG GU501GM-BI7N8 i7-8750H, GeForce GTX 1060 Mobile, 55 Wh | Razer Blade 15 2018 i7-8750H, GeForce GTX 1070 Max-Q, 80 Wh | Alienware 15 R3 Max-Q i7-7820HK, GeForce GTX 1080 Max-Q, 99 Wh | Dell G5 15 5587 i5-8300H, GeForce GTX 1060 Max-Q, 56 Wh | Asus Chimera G703GI i9-8950HK, GeForce GTX 1080 Mobile, 71 Wh | Acer Predator Helios 500 PH517-51-79BY i7-8750H, GeForce GTX 1070 Mobile, 72 Wh | |
|---|---|---|---|---|---|---|---|
| Batteridrifttid | 25% | 69% | 69% | 103% | -31% | -9% | |
| WiFi v1.3 (h) | 3.2 | 4 25% | 5.4 69% | 5.4 69% | 6.5 103% | 2.2 -31% | 2.9 -9% |
| Reader / Idle (h) | 4.5 | 6.4 | 7.1 | 11.8 | 2.8 | 4.2 | |
| Load (h) | 0.8 | 1.2 | 1.9 | 2.2 | 0.9 | 1.5 | |
| Witcher 3 ultra (h) | 1.1 |
För
Emot

Läs den fullständiga versionen av den här recensionen på engelska här.
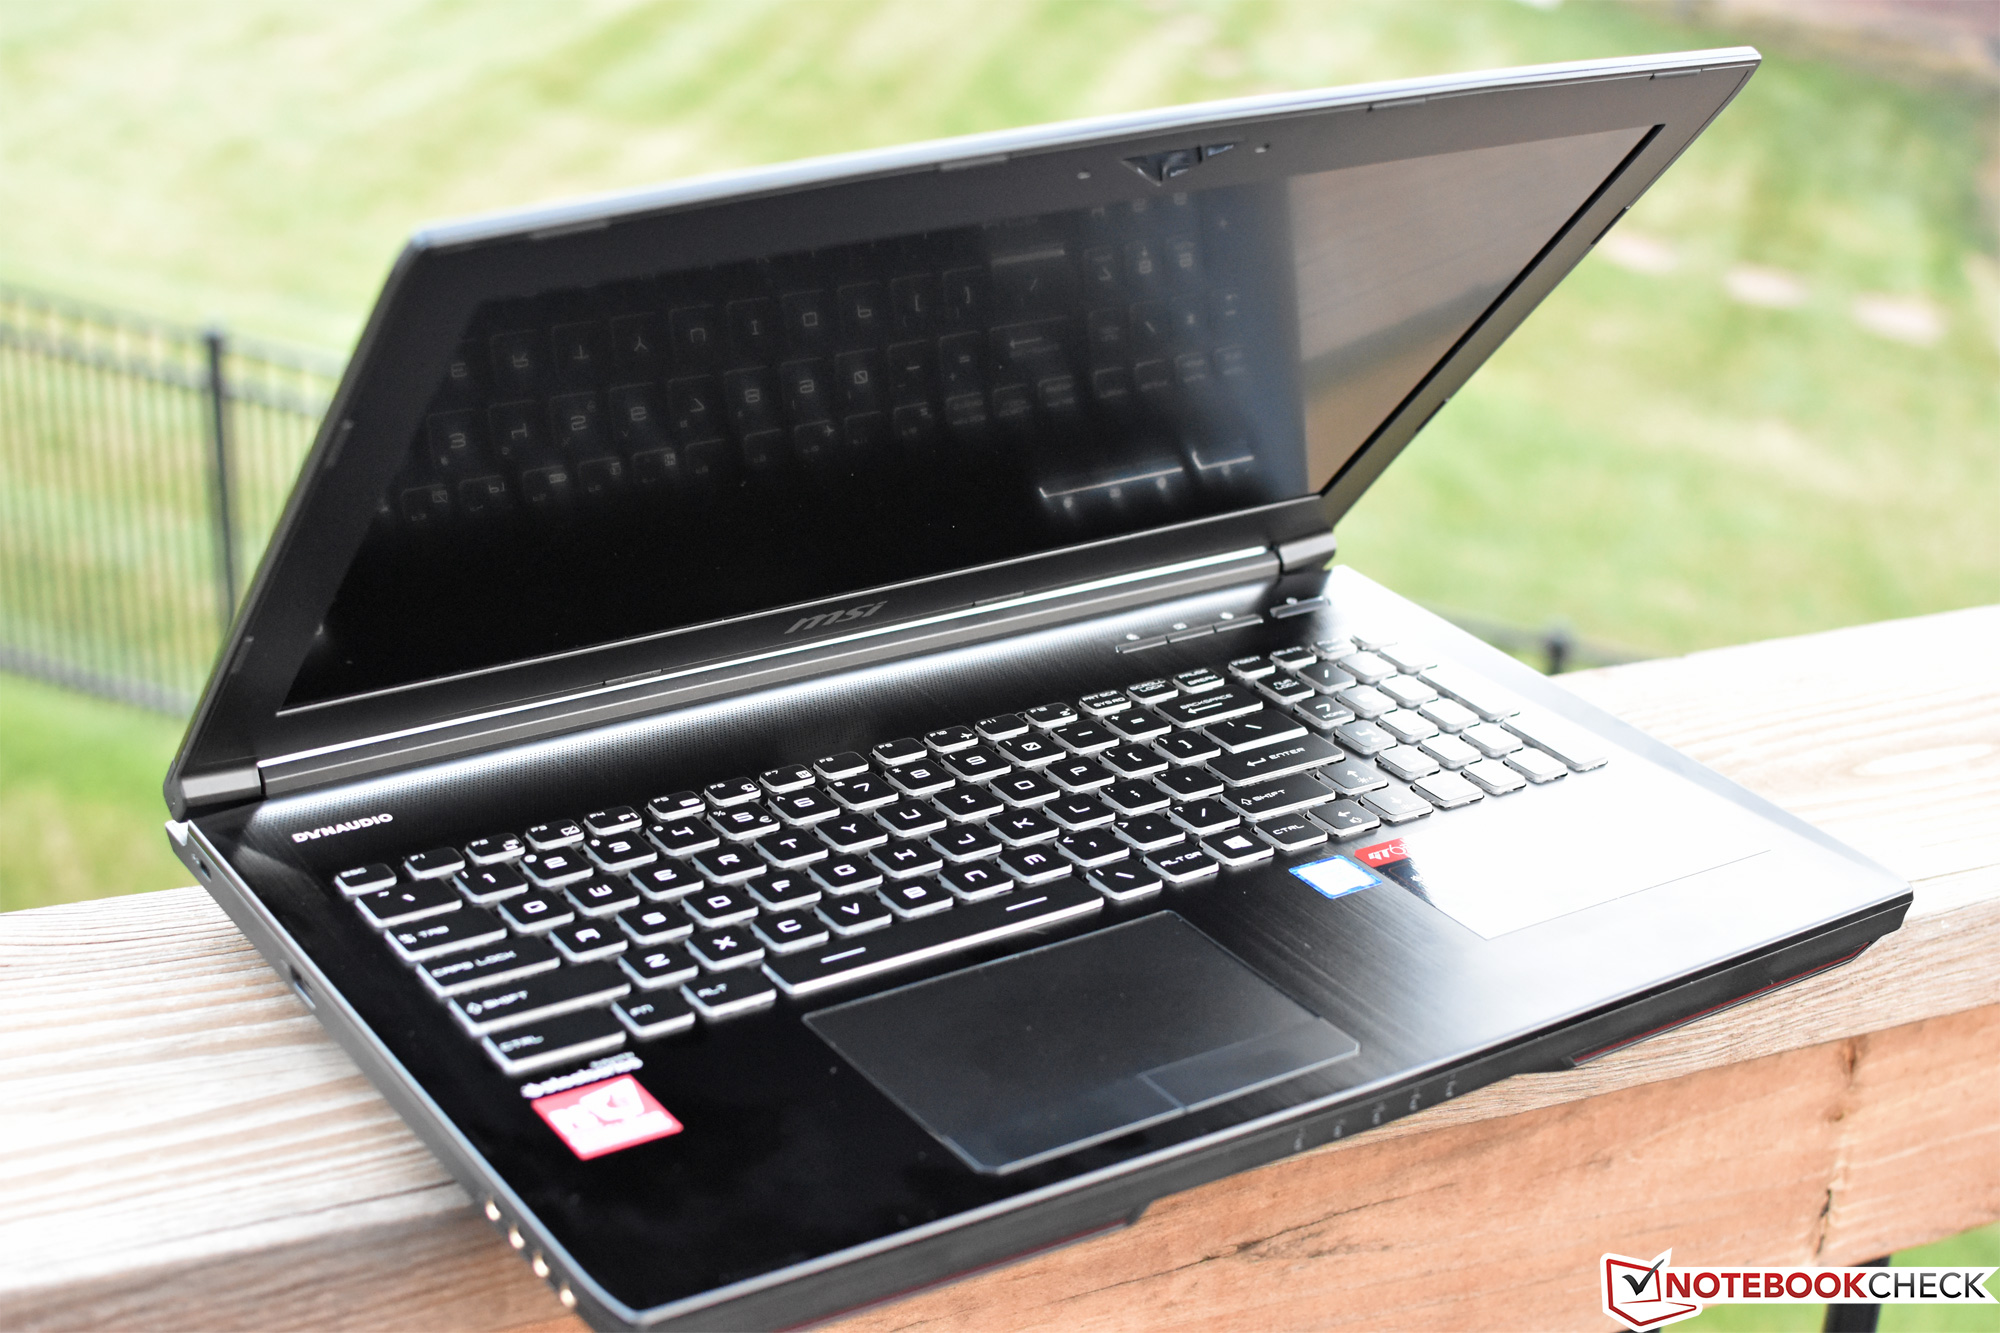
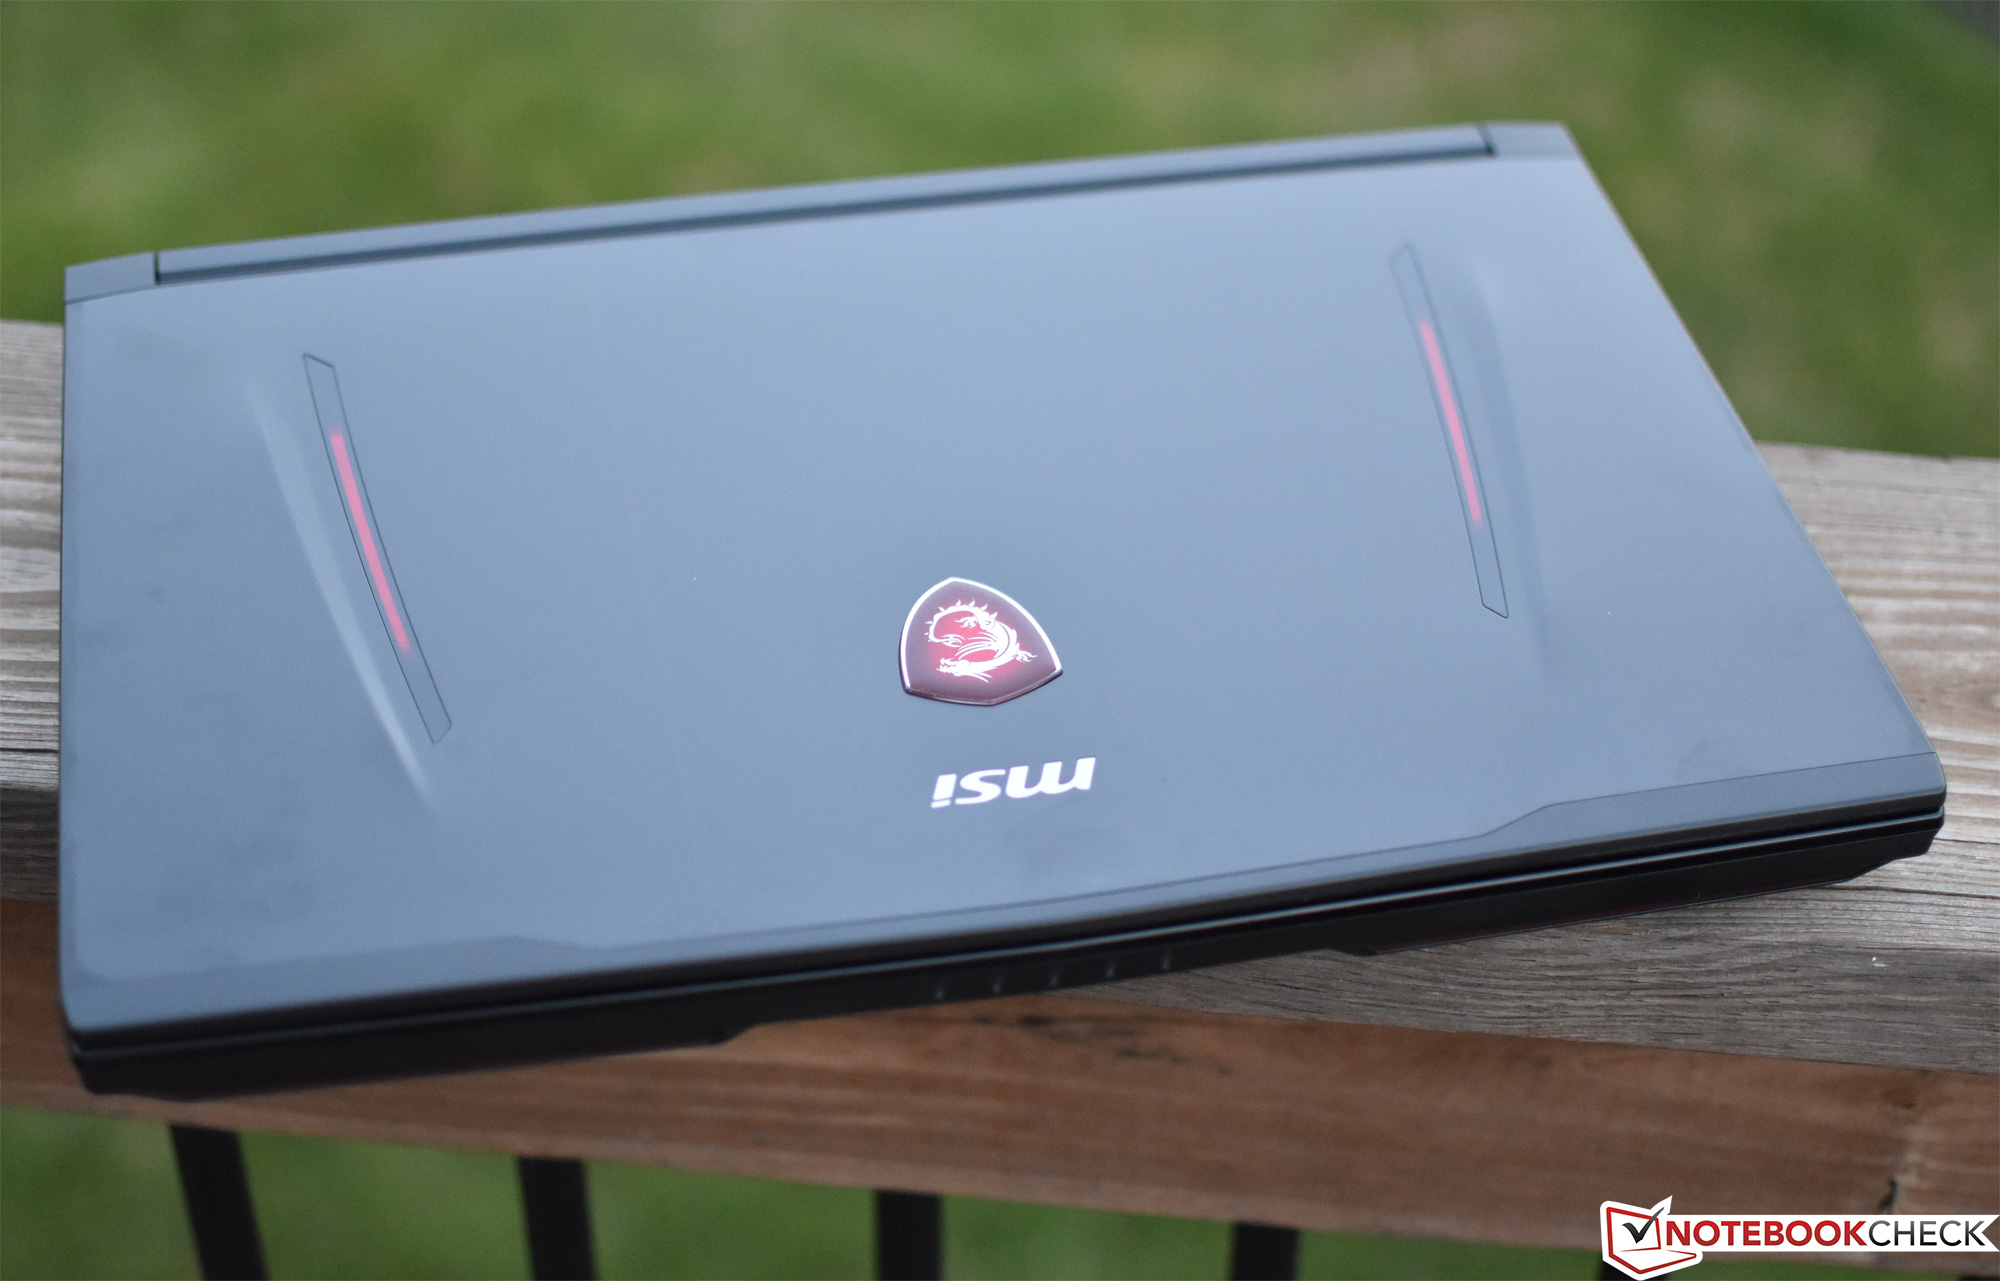
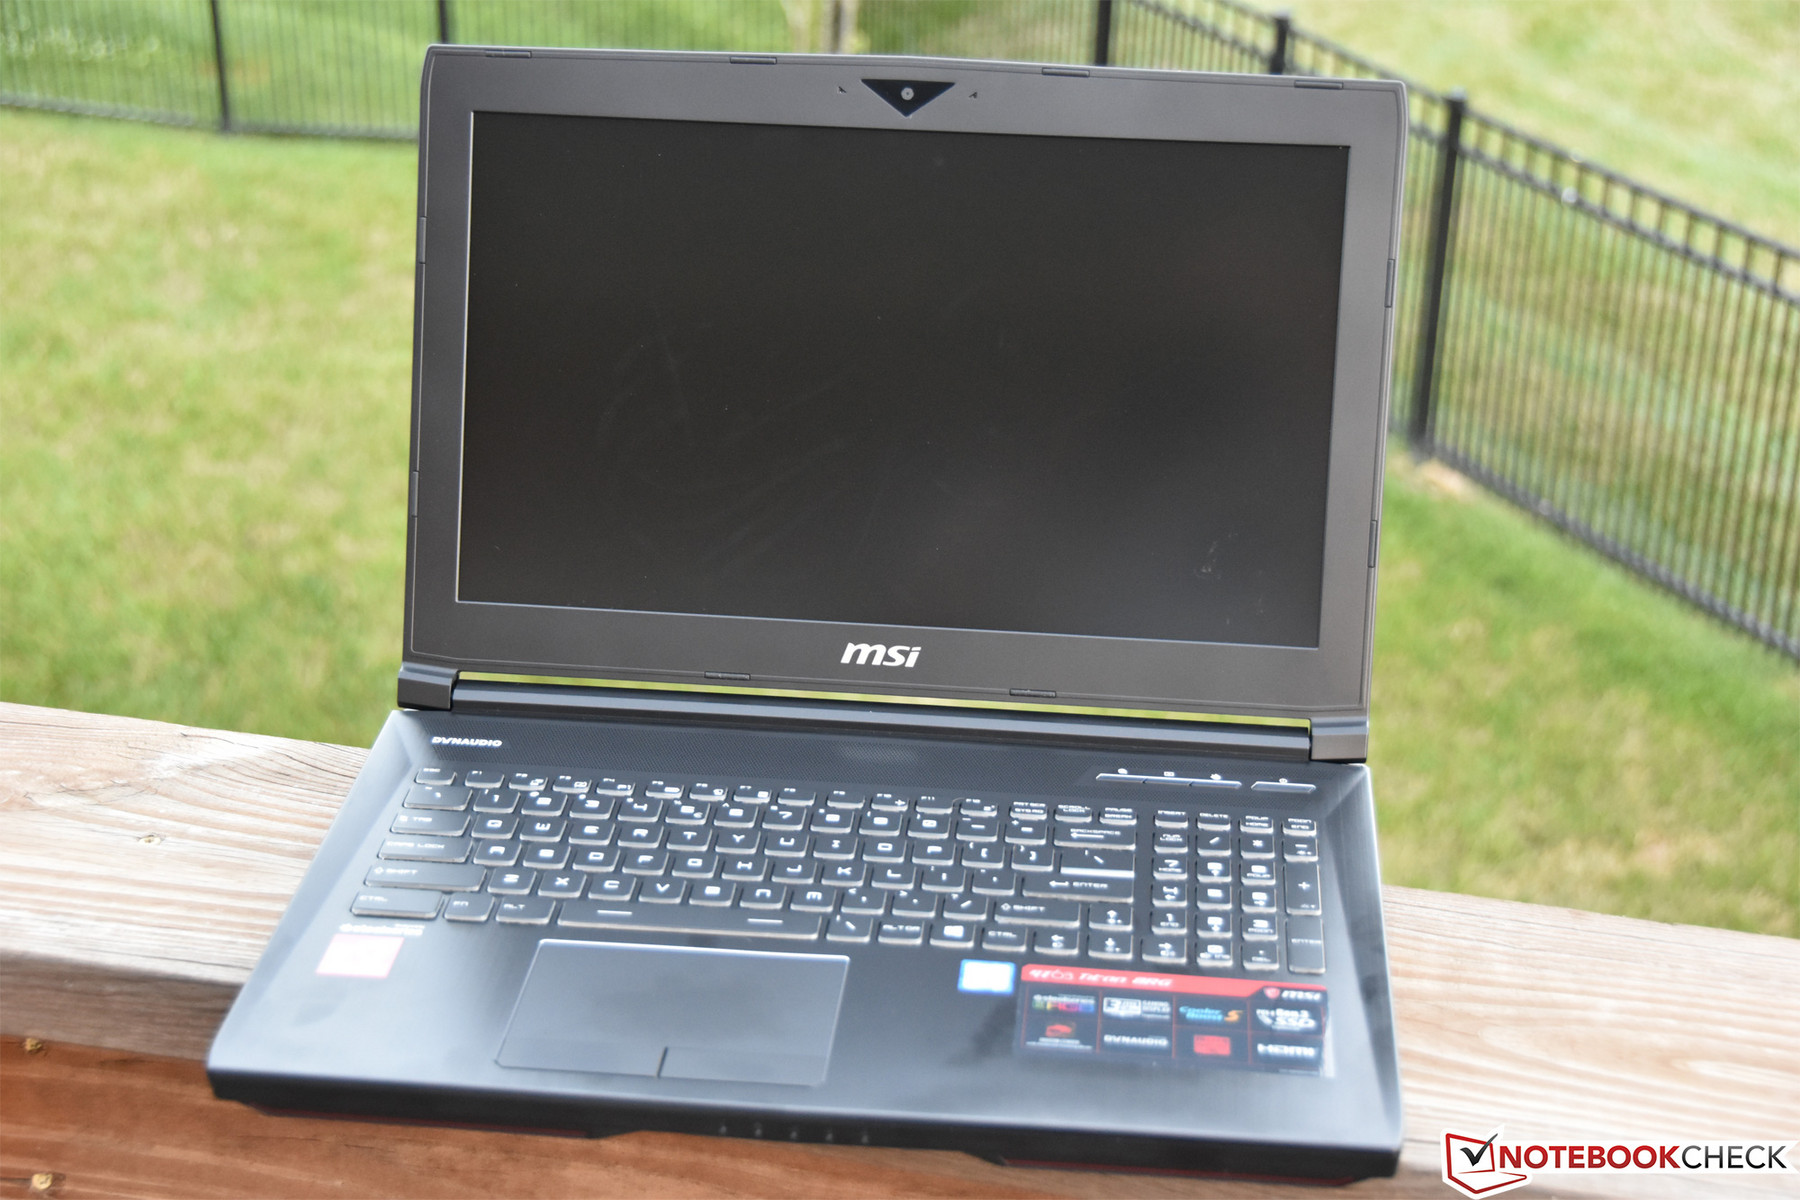
När det kommer till rå spelprestanda klarar MSI GT63 Titan 8RG sig bra. Designen må vara oförändrad men generellt sett har hastigheten bara ökat sen vi senast utvärderade GT62VR för ett par år sedan. Dess värmehantering är märkbart bättre än föregångarens och den grafiska prestandan levererar absolut. Ja, den är stor, den är tung och den är aningen högljudd — men den är en klassisk desktop-ersättning hela vägen igenom.
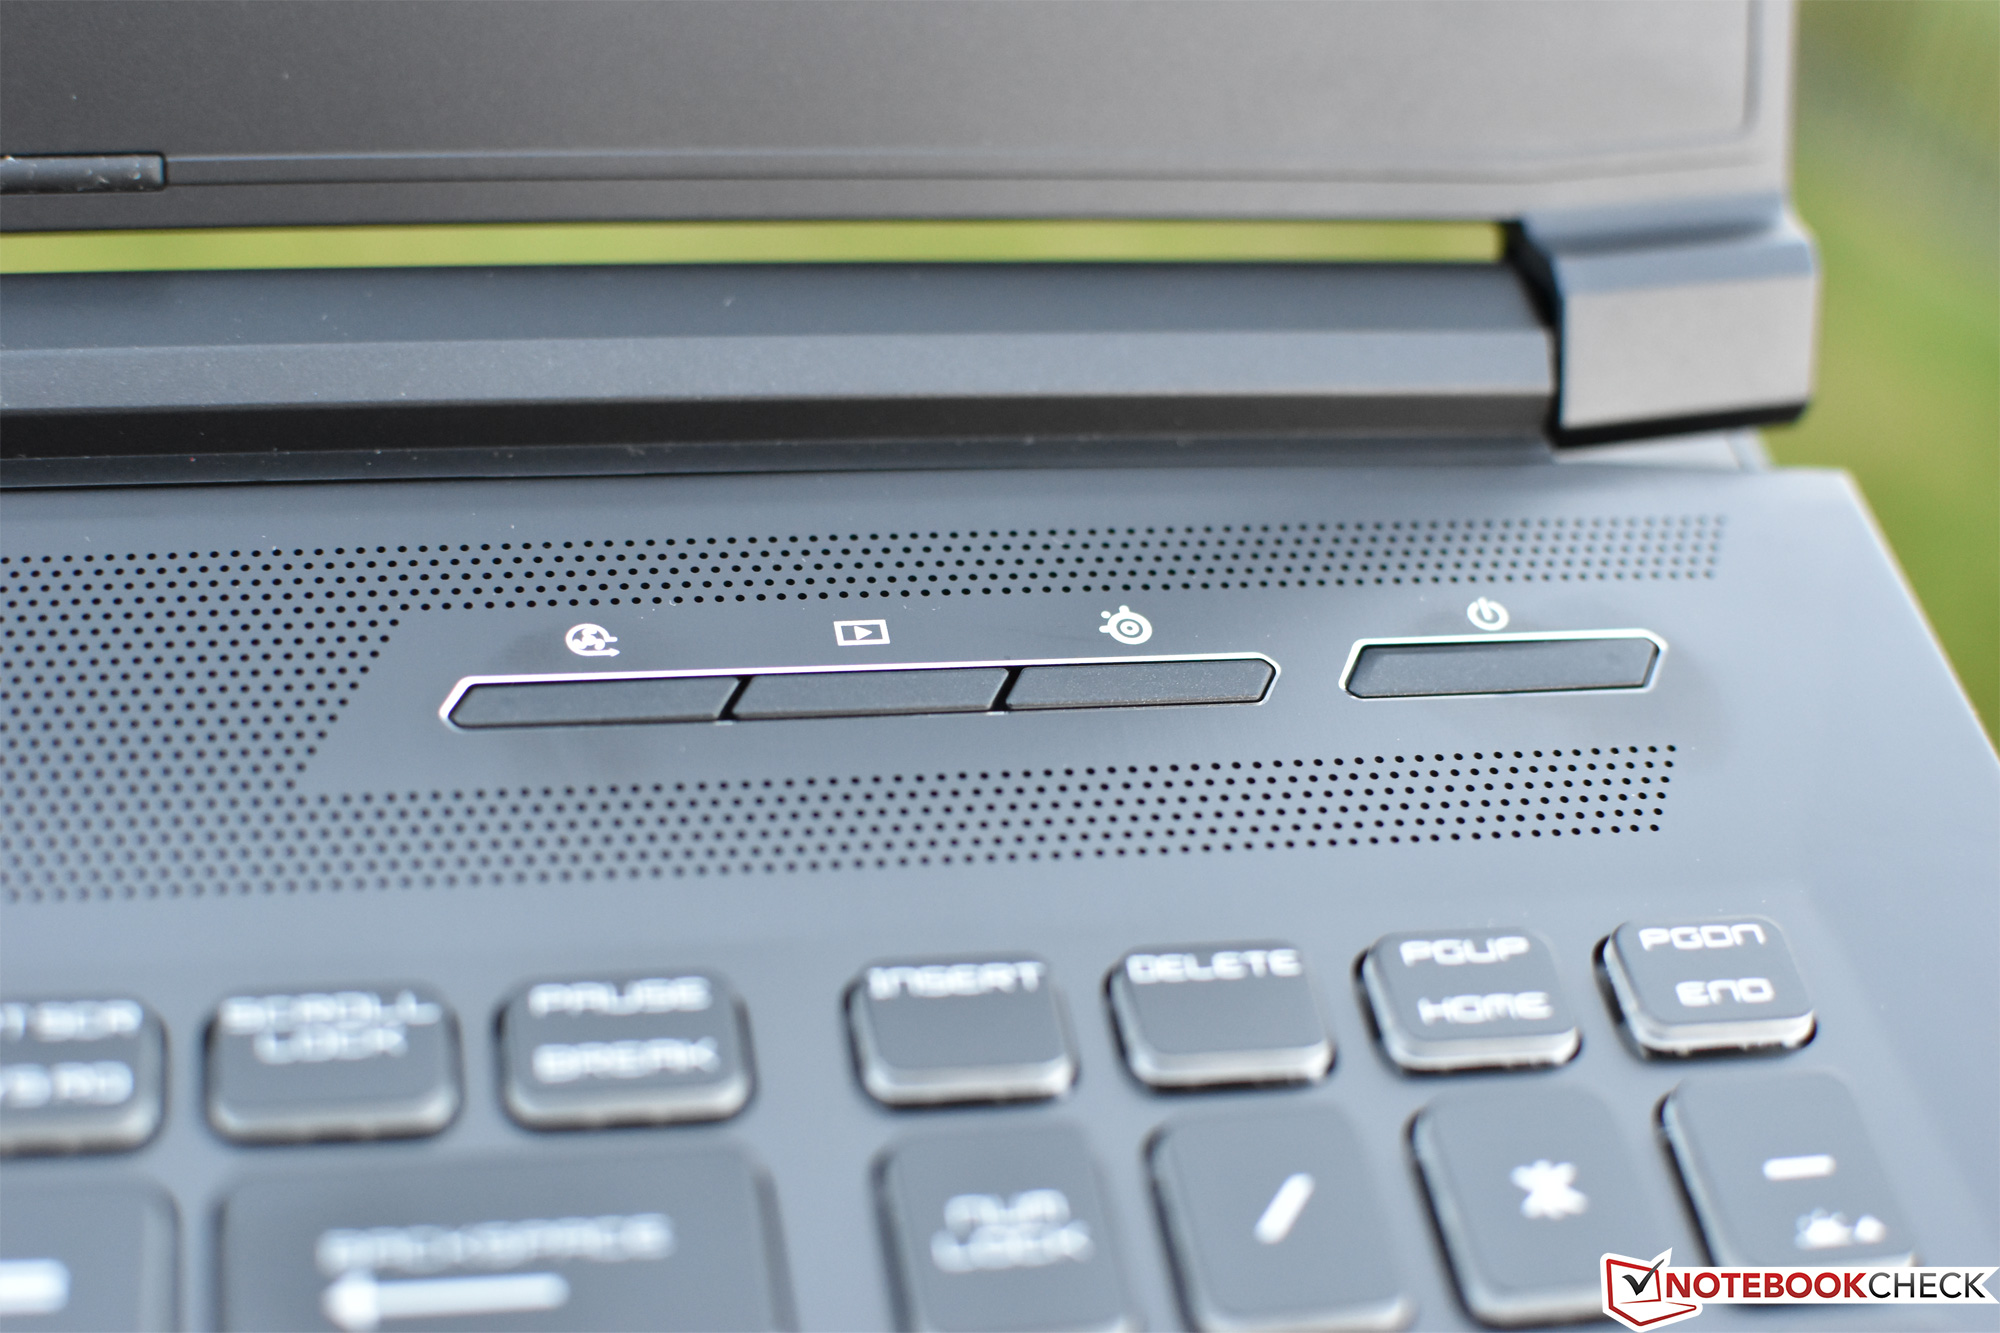
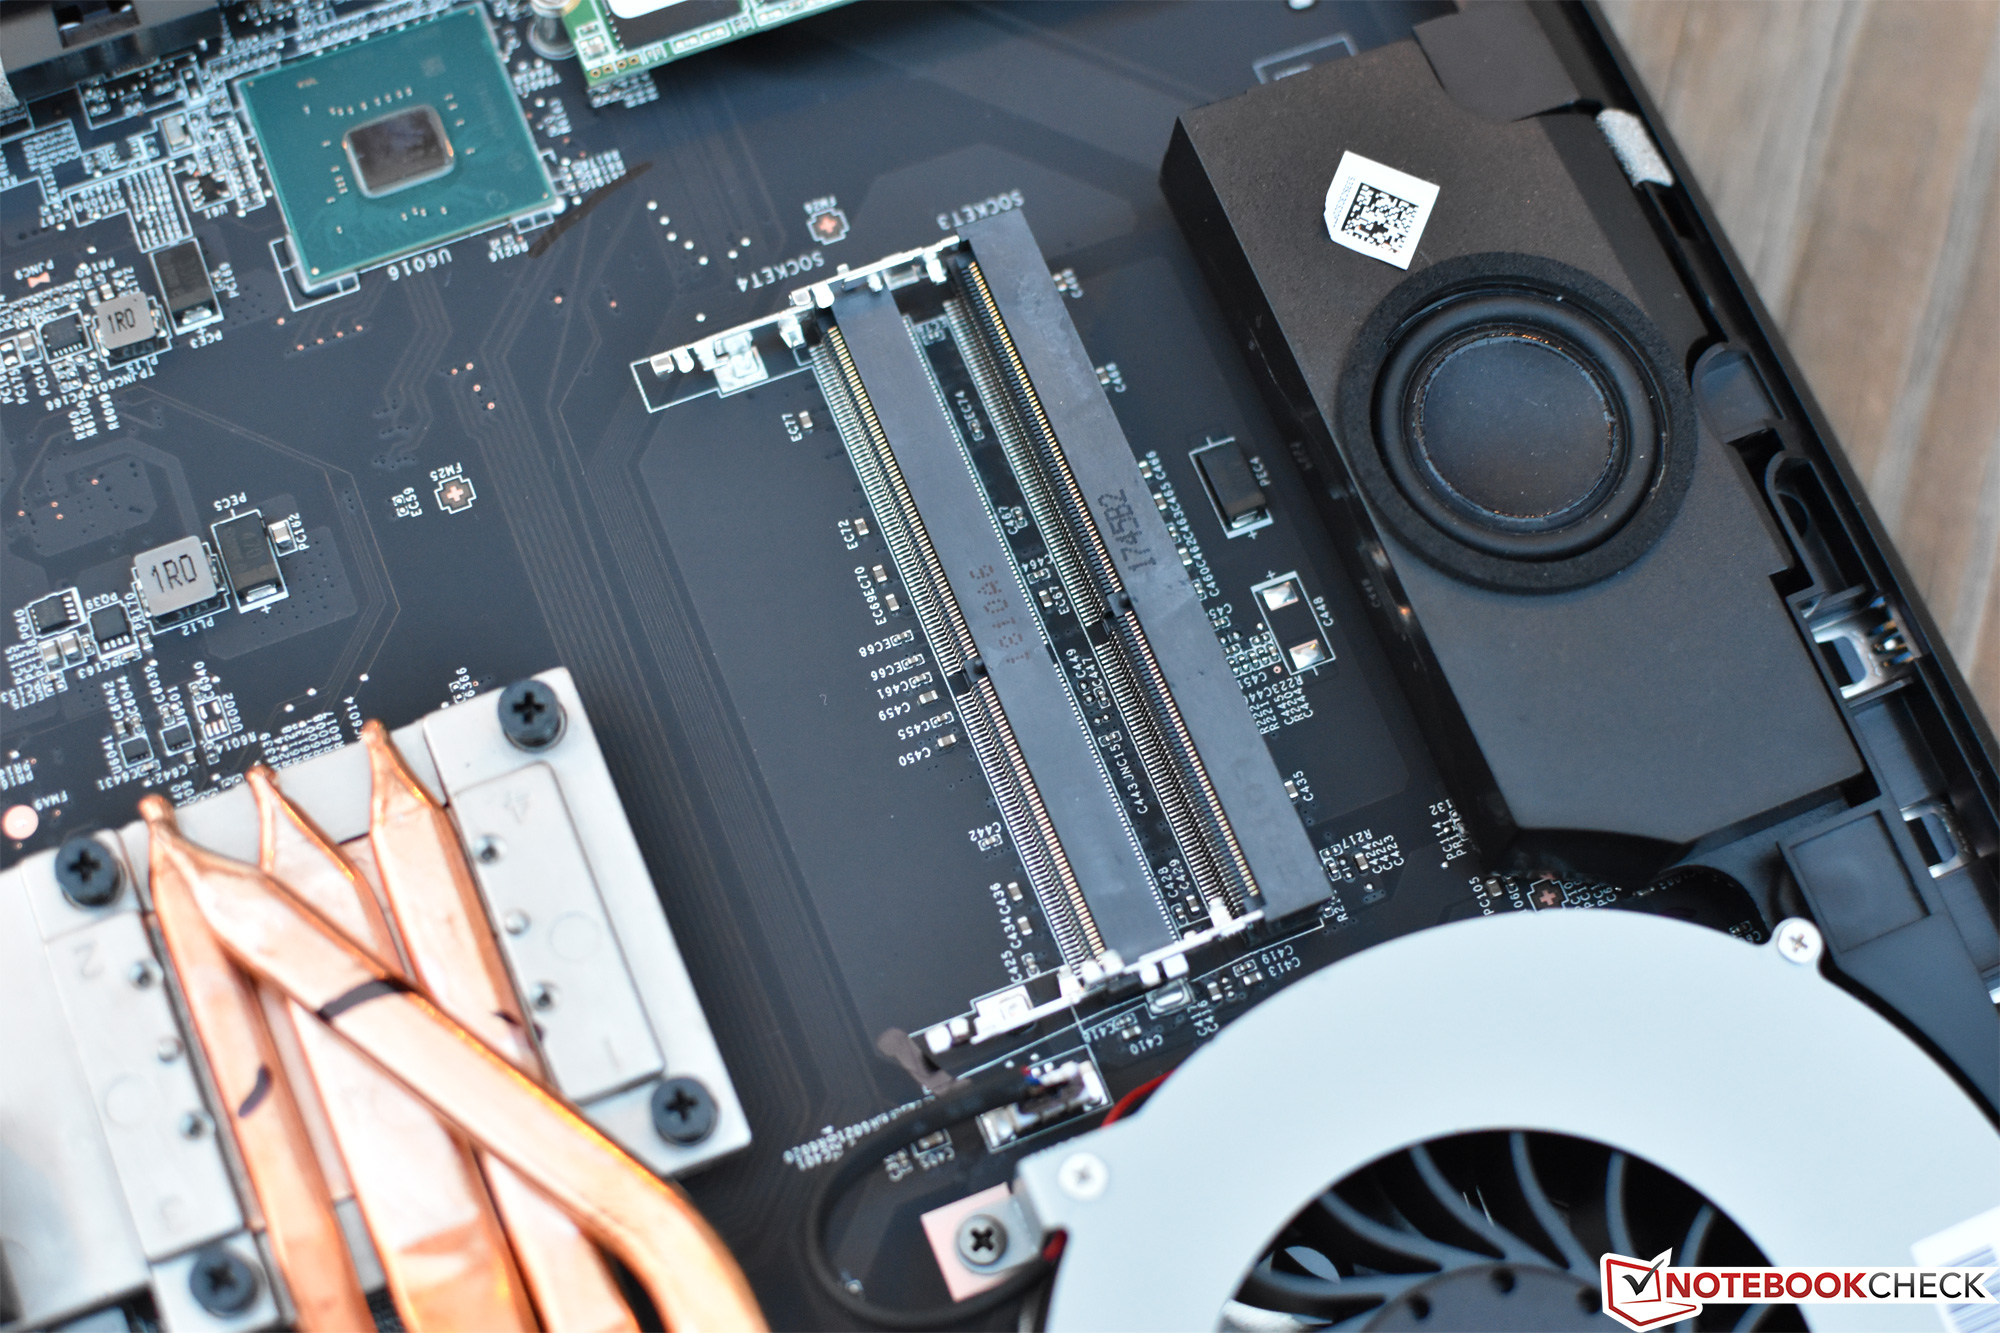
Bortsett från det har vi få övriga nämnvärda klagomål. Helst hade vi sett mer än en M.2-plats i en maskin av denna storlek och klass för att bana väg för RAID-alternativ eller helt enkelt tre separata lagringsenheter. Styrplatteknapparna är högljudda och irriterande (särskilt den vänstra knappen på vår testenhet). Och även om det är ett mindre klagomål så resulterar placeringen av en del viktiga portar på enhetens baksida i en del opraktiska akrobatiska övningar då och då.
Ja, den är stor, den är tung och den är aningen högljudd — men MSI GT63 Titan 8RG är en klassisk desktop-ersättning hela vägen igenom.
Men är det värt att plocka upp denna enhet på 26.390 kr framför dess många konkurrenter? Som jämförelse — även om vi inte har haft tid att utvärdera Alienware 15 R4 ännu — så erbjuder R3 inte bara en utan tre M.2 SSD-platser (varav två är fullstora 2280-platser), och även om dess yttemperaturer över tangentbordet är högre så är den totalt sett en väldigt välbalanserad maskin. Asus ROG Chimera och Acer Predator Helios 500 har också en andra M.2-plats samt utmärkt prestanda, men har svårt att matcha hur prisvärd GT63 är. För den som vill byta ut kraft mot mobilitet så erbjuder den trendiga kategorin för tunna-och-lätta modeller MSI GS65, ASUS ROG GU501GM och Razer Blade 15 som alla har sina egna uppsättningar för och nackdelar. Och tillslut, för den som behöver tänka på budgeten kan Dell Inspiron 15 7000 (och den nyare Dell G5 15) samt Lenovo Y500 vara en utmärkt start.
MSI GT63 Titan 8RG-046
- 07/02/2018 v6 (old)
Steve Schardein
Price comparison
