Test: Lenovo Y520-15IKBA (i5-7300HQ, RX 560) Laptop (Sammanfattning)


| SD Card Reader | |
| average JPG Copy Test (av. of 3 runs) | |
| Genomsnitt av klass Gaming (20.9 - 210, n=54, senaste 2 åren) | |
| Schenker XMG Apex 15 (Toshiba Exceria Pro SDXC 64 GB UHS-II) | |
| Lenovo Legion Y520-15IKBN-80WK001KUS (Toshiba Exceria Pro SDXC 64 GB UHS-II) | |
| Lenovo Legion Y520-15IKBA-80WY001VGE (Toshiba Exceria Pro SDXC 64 GB UHS-II) | |
| Asus ROG Strix GL702ZC-GC204T (Toshiba Exceria Pro SDXC 64 GB UHS-II) | |
| Dell Inspiron 15 7000 7577 4K (Toshiba Exceria Pro SDXC 64 GB UHS-II) | |
| maximum AS SSD Seq Read Test (1GB) | |
| Genomsnitt av klass Gaming (25.5 - 261, n=51, senaste 2 åren) | |
| Asus ROG Strix GL702ZC-GC204T (Toshiba Exceria Pro SDXC 64 GB UHS-II) | |
| Lenovo Legion Y520-15IKBN-80WK001KUS (Toshiba Exceria Pro SDXC 64 GB UHS-II) | |
| Schenker XMG Apex 15 (Toshiba Exceria Pro SDXC 64 GB UHS-II) | |
| Lenovo Legion Y520-15IKBA-80WY001VGE (Toshiba Exceria Pro SDXC 64 GB UHS-II) | |
| Dell Inspiron 15 7000 7577 4K (Toshiba Exceria Pro SDXC 64 GB UHS-II) | |
| |||||||||||||||||||||||||
Distribution av ljusstyrkan: 87 %
Mitt på batteriet: 244 cd/m²
Kontrast: 1013:1 (Svärta: 0.24 cd/m²)
ΔE ColorChecker Calman: 6.36 | ∀{0.5-29.43 Ø4.71}
calibrated: 6.51
ΔE Greyscale Calman: 5.63 | ∀{0.09-98 Ø4.96}
59% sRGB (Argyll 1.6.3 3D)
38% AdobeRGB 1998 (Argyll 1.6.3 3D)
40.86% AdobeRGB 1998 (Argyll 3D)
59.2% sRGB (Argyll 3D)
39.53% Display P3 (Argyll 3D)
Gamma: 2.47
CCT: 7411 K
| Lenovo Legion Y520-15IKBA-80WY001VGE LG Philips LGD0533, , 1920x1080, 15.6" | Alienware 13 R3 (i5-7300HQ, GTX 1050 Ti) Chi Mei CMN1371, , 1920x1080, 13.3" | Schenker XMG Apex 15 LG Philips LP156WF6 (LGD046F), , 1920x1080, 15.6" | Asus ROG Strix GL702ZC-GC204T LG Philips LP173WF4-SPF5, , 1920x1080, 17.3" | Dell Inspiron 15 7000 7577 4K Name: AU Optronics B156ZAN, , 3840x2160, 15.6" | Lenovo Legion Y520-15IKBN-80WK001KUS LP156WF6-SPK3, , 1920x1080, 15.6" | |
|---|---|---|---|---|---|---|
| Display | 61% | 48% | 51% | 69% | ||
| Display P3 Coverage (%) | 39.53 | 66.1 67% | 62 57% | 65.4 65% | 68.4 73% | |
| sRGB Coverage (%) | 59.2 | 90.9 54% | 82.7 40% | 82.6 40% | 97.1 64% | |
| AdobeRGB 1998 Coverage (%) | 40.86 | 66.2 62% | 60.4 48% | 60.4 48% | 69.6 70% | |
| Response Times | -9% | -10% | 15% | 6% | -37% | |
| Response Time Grey 50% / Grey 80% * (ms) | 42 ? | 41.6 ? 1% | 42.4 ? -1% | 36 ? 14% | 35.2 ? 16% | 58.8 ? -40% |
| Response Time Black / White * (ms) | 27 ? | 32 ? -19% | 32 ? -19% | 23 ? 15% | 28.4 ? -5% | 36 ? -33% |
| PWM Frequency (Hz) | 24900 ? | 25000 ? | 20490 ? | 21550 ? | ||
| Screen | 22% | 27% | 19% | 21% | -19% | |
| Brightness middle (cd/m²) | 243 | 363 49% | 269 11% | 415 71% | 322.9 33% | 239 -2% |
| Brightness (cd/m²) | 231 | 322 39% | 274 19% | 365 58% | 309 34% | 244 6% |
| Brightness Distribution (%) | 87 | 80 -8% | 91 5% | 82 -6% | 90 3% | 88 1% |
| Black Level * (cd/m²) | 0.24 | 0.31 -29% | 0.23 4% | 0.42 -75% | 0.36 -50% | 0.35 -46% |
| Contrast (:1) | 1013 | 1171 16% | 1170 15% | 988 -2% | 897 -11% | 683 -33% |
| Colorchecker dE 2000 * | 6.36 | 5.1 20% | 4.25 33% | 4.95 22% | 3.99 37% | 7.3 -15% |
| Colorchecker dE 2000 max. * | 12.76 | 8.9 30% | 10.39 19% | 9.34 27% | 8.97 30% | 24.7 -94% |
| Colorchecker dE 2000 calibrated * | 6.51 | 2.51 61% | ||||
| Greyscale dE 2000 * | 5.63 | 6.2 -10% | 3.11 45% | 4.69 17% | 5.3 6% | 4.9 13% |
| Gamma | 2.47 89% | 2.35 94% | 2.36 93% | 2.33 94% | 2.041 108% | 2.19 100% |
| CCT | 7411 88% | 6827 95% | 6851 95% | 6485 100% | 6941 94% | 7332 89% |
| Color Space (Percent of AdobeRGB 1998) (%) | 38 | 59.2 56% | 54 42% | 54 42% | 62.9 66% | 35 -8% |
| Color Space (Percent of sRGB) (%) | 59 | 90.7 54% | 83 41% | 82 39% | 96.8 64% | 55 -7% |
| Totalt genomsnitt (program/inställningar) | 25% /
25% | 22% /
26% | 28% /
25% | 32% /
29% | -28% /
-22% |
* ... mindre är bättre
Visa svarstider
| ↔ Svarstid svart till vitt | ||
|---|---|---|
| 27 ms ... stiga ↗ och falla ↘ kombinerat | ↗ 17 ms stiga | 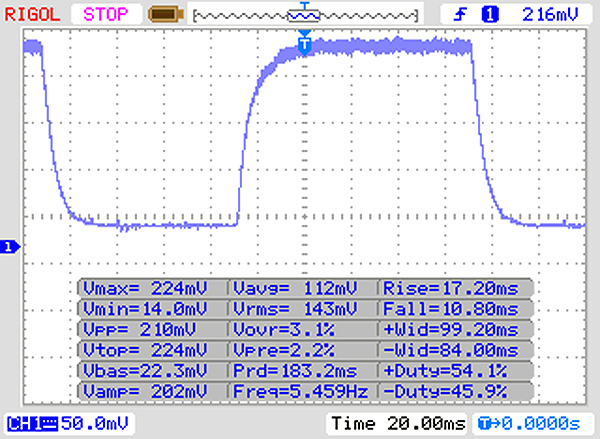 |
| ↘ 10 ms hösten | ||
| Skärmen visar relativt långsamma svarsfrekvenser i våra tester och kan vara för långsam för spelare. I jämförelse sträcker sig alla testade enheter från 0.1 (minst) till 240 (maximalt) ms. » 67 % av alla enheter är bättre. Detta innebär att den uppmätta svarstiden är sämre än genomsnittet av alla testade enheter (19.8 ms). | ||
| ↔ Svarstid 50 % grått till 80 % grått | ||
| 42 ms ... stiga ↗ och falla ↘ kombinerat | ↗ 22 ms stiga | 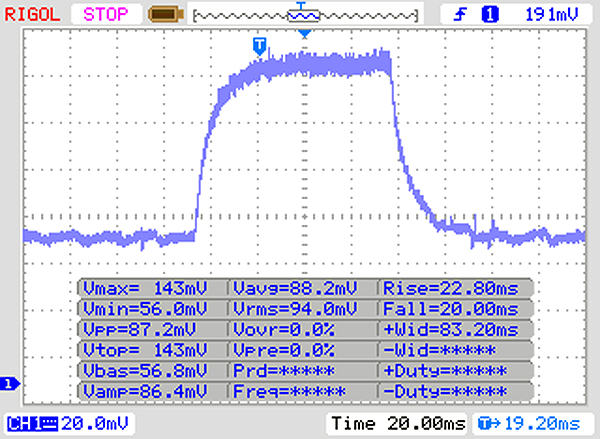 |
| ↘ 20 ms hösten | ||
| Skärmen visar långsamma svarsfrekvenser i våra tester och kommer att vara otillfredsställande för spelare. I jämförelse sträcker sig alla testade enheter från 0.165 (minst) till 636 (maximalt) ms. » 67 % av alla enheter är bättre. Detta innebär att den uppmätta svarstiden är sämre än genomsnittet av alla testade enheter (31 ms). | ||
Skärmflimmer / PWM (Puls-Width Modulation)
| Skärmflimmer / PWM upptäckt | 24900 Hz | ≤ 90 % ljusstyrka inställning | 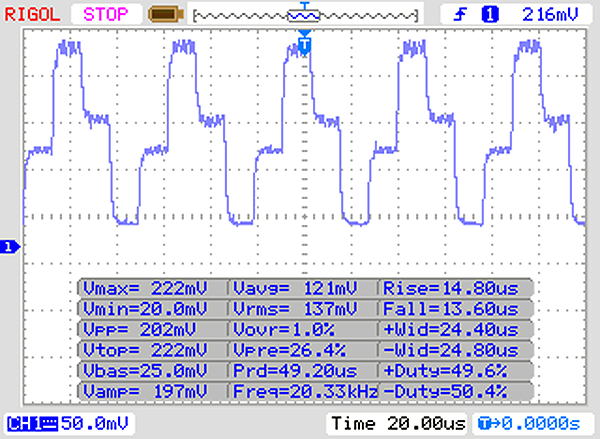 |
Displayens bakgrundsbelysning flimrar vid 24900 Hz (i värsta fall, t.ex. med PWM) Flimrande upptäckt vid en ljusstyrkeinställning på 90 % och lägre. Det ska inte finnas något flimmer eller PWM över denna ljusstyrkeinställning. Frekvensen för 24900 Hz är ganska hög, så de flesta användare som är känsliga för PWM bör inte märka något flimmer. Som jämförelse: 52 % av alla testade enheter använder inte PWM för att dämpa skärmen. Om PWM upptäcktes mättes ett medelvärde av 7754 (minst: 5 - maximum: 343500) Hz. | |||
| PCMark 8 Home Score Accelerated v2 | 4257 poäng | |
| PCMark 8 Work Score Accelerated v2 | 4700 poäng | |
| PCMark 10 Score | 3700 poäng | |
Hjälp | ||
| Lenovo Legion Y520-15IKBA-80WY001VGE Seagate Mobile HDD 1TB ST1000LM035 | Alienware 13 R3 (i5-7300HQ, GTX 1050 Ti) Samsung PM961 MZVLW256HEHP | Schenker XMG Apex 15 Samsung SSD 960 Evo 250GB m.2 NVMe | Asus ROG Strix GL702ZC-GC204T Seagate Mobile HDD 1TB ST1000LX015-1U7172 | Lenovo Legion Y520-15IKBN-80WK001KUS Samsung PM961 MZVLW256HEHP | Genomsnitt Seagate Mobile HDD 1TB ST1000LM035 | |
|---|---|---|---|---|---|---|
| CrystalDiskMark 3.0 | 27858% | 35895% | 14% | 26745% | 28% | |
| Read Seq (MB/s) | 81 | 2018 2391% | 1751 2062% | 92.5 14% | 2170 2579% | 90.9 ? 12% |
| Write Seq (MB/s) | 84.4 | 1210 1334% | 1375 1529% | 105.1 25% | 1202 1324% | 88.5 ? 5% |
| Read 512 (MB/s) | 28.29 | 1089 3749% | 792 2700% | 37.67 33% | 786 2678% | 31.5 ? 11% |
| Write 512 (MB/s) | 65.2 | 850 1204% | 1007 1444% | 101.8 56% | 822 1161% | 77.3 ? 19% |
| Read 4k (MB/s) | 0.394 | 58.7 14798% | 60 15128% | 0.484 23% | 58.9 14849% | 0.4174 ? 6% |
| Write 4k (MB/s) | 0.319 | 146.1 45699% | 164.1 51342% | 0.169 -47% | 146.4 45793% | 0.525 ? 65% |
| Read 4k QD32 (MB/s) | 0.838 | 492 58611% | 676 80568% | 1.294 54% | 457.7 54518% | 0.993 ? 18% |
| Write 4k QD32 (MB/s) | 0.431 | 410.2 95074% | 571 132383% | 0.221 -49% | 392.9 91060% | 0.803 ? 86% |

| 3DMark 11 Performance | 7567 poäng | |
| 3DMark Cloud Gate Standard Score | 14354 poäng | |
| 3DMark Fire Strike Score | 4899 poäng | |
Hjälp | ||
| Thief | |
| 1920x1080 Very High Preset AA:FXAA & High SS AF:8x | |
| Dell Inspiron 15 7000 7577 4K | |
| Alienware 13 R3 (i5-7300HQ, GTX 1050 Ti) | |
| Lenovo Legion Y520-15IKBA-80WY001VGE | |
| Genomsnitt AMD Radeon RX 560 (Laptop) (n=1) | |
| 1366x768 High Preset AA:FXAA & Low SS AF:4x | |
| Alienware 13 R3 (i5-7300HQ, GTX 1050 Ti) | |
| Lenovo Legion Y520-15IKBA-80WY001VGE | |
| Genomsnitt AMD Radeon RX 560 (Laptop) (n=1) | |
| 1366x768 Normal Preset AA:FX | |
| Alienware 13 R3 (i5-7300HQ, GTX 1050 Ti) | |
| Lenovo Legion Y520-15IKBA-80WY001VGE | |
| Genomsnitt AMD Radeon RX 560 (Laptop) (n=1) | |
| 1024x768 Very Low Preset | |
| Alienware 13 R3 (i5-7300HQ, GTX 1050 Ti) | |
| Lenovo Legion Y520-15IKBA-80WY001VGE | |
| Genomsnitt AMD Radeon RX 560 (Laptop) (n=1) | |
| Dragon Age: Inquisition | |
| 1920x1080 Ultra Graphics Quality AA:2x MS | |
| Asus ROG Strix GL702ZC-GC204T | |
| Alienware 13 R3 (i5-7300HQ, GTX 1050 Ti) | |
| Genomsnitt AMD Radeon RX 560 (Laptop) (23.9 - 26.4, n=2) | |
| Lenovo Legion Y520-15IKBA-80WY001VGE | |
| 1920x1080 High Graphics Quality | |
| Asus ROG Strix GL702ZC-GC204T | |
| Alienware 13 R3 (i5-7300HQ, GTX 1050 Ti) | |
| Genomsnitt AMD Radeon RX 560 (Laptop) (34.9 - 40.3, n=2) | |
| Lenovo Legion Y520-15IKBA-80WY001VGE | |
| låg | med. | hög | ultra | |
|---|---|---|---|---|
| BioShock Infinite (2013) | 88.6 | 75.3 | 70.1 | 40.05 |
| Thief (2014) | 38.3 | 35.4 | 34.5 | 30.6 |
| Dragon Age: Inquisition (2014) | 34.9 | 23.9 | ||
| The Witcher 3 (2015) | 35.2 | 20.7 | ||
| Rise of the Tomb Raider (2016) | 51.8 | 47.4 | 35.1 | 27.8 |
Ljudnivå
| Låg belastning |
| 31.3 / 31.3 / 31.3 dB(A) |
| Hårddisk |
| 31.3 dB(A) |
| Hög belastning |
| 32.8 / 39 dB(A) |
 | ||
30 dB tyst 40 dB(A) hörbar 50 dB(A) högt ljud |
||
min: | ||
(±) Den maximala temperaturen på ovansidan är 40.3 °C / 105 F, jämfört med genomsnittet av 40.4 °C / 105 F , allt från 21.2 till 68.8 °C för klassen Gaming.
(+) Botten värms upp till maximalt 39.6 °C / 103 F, jämfört med genomsnittet av 43.2 °C / 110 F
(+) Vid tomgångsbruk är medeltemperaturen för ovansidan 21.3 °C / 70 F, jämfört med enhetsgenomsnittet på 33.9 °C / ### class_avg_f### F.
(+) När du spelar The Witcher 3 är medeltemperaturen för ovansidan 28.9 °C / 84 F, jämfört med enhetsgenomsnittet på 33.9 °C / ## #class_avg_f### F.
(+) Handledsstöden och pekplattan är kallare än hudtemperaturen med maximalt 26.5 °C / 79.7 F och är därför svala att ta på.
(+) Medeltemperaturen för handledsstödsområdet på liknande enheter var 28.8 °C / 83.8 F (+2.3 °C / 4.1 F).
Lenovo Legion Y520-15IKBA-80WY001VGE ljudanalys
(-) | inte särskilt höga högtalare (67.9 dB)
Bas 100 - 315 Hz
(-) | nästan ingen bas - i genomsnitt 16.2% lägre än medianen
(±) | linjäriteten för basen är genomsnittlig (12.5% delta till föregående frekvens)
Mellan 400 - 2000 Hz
(±) | högre mellan - i genomsnitt 9.9% högre än median
(±) | linjäriteten för mids är genomsnittlig (8.8% delta till föregående frekvens)
Högsta 2 - 16 kHz
(+) | balanserade toppar - endast 4.1% från medianen
(±) | linjäriteten för toppar är genomsnittlig (11% delta till föregående frekvens)
Totalt 100 - 16 000 Hz
(-) | det totala ljudet är inte linjärt (32.4% skillnad mot median)
Jämfört med samma klass
» 98% av alla testade enheter i den här klassen var bättre, 1% liknande, 1% sämre
» Den bästa hade ett delta på 6%, genomsnittet var 18%, sämst var 132%
Jämfört med alla testade enheter
» 92% av alla testade enheter var bättre, 1% liknande, 7% sämre
» Den bästa hade ett delta på 4%, genomsnittet var 23%, sämst var 134%
Apple MacBook 12 (Early 2016) 1.1 GHz ljudanalys
(+) | högtalare kan spela relativt högt (83.6 dB)
Bas 100 - 315 Hz
(±) | reducerad bas - i genomsnitt 11.3% lägre än medianen
(±) | linjäriteten för basen är genomsnittlig (14.2% delta till föregående frekvens)
Mellan 400 - 2000 Hz
(+) | balanserad mellan - endast 2.4% från medianen
(+) | mids är linjära (5.5% delta till föregående frekvens)
Högsta 2 - 16 kHz
(+) | balanserade toppar - endast 2% från medianen
(+) | toppar är linjära (4.5% delta till föregående frekvens)
Totalt 100 - 16 000 Hz
(+) | det totala ljudet är linjärt (10.2% skillnad mot median)
Jämfört med samma klass
» 7% av alla testade enheter i den här klassen var bättre, 2% liknande, 90% sämre
» Den bästa hade ett delta på 5%, genomsnittet var 18%, sämst var 53%
Jämfört med alla testade enheter
» 5% av alla testade enheter var bättre, 1% liknande, 94% sämre
» Den bästa hade ett delta på 4%, genomsnittet var 23%, sämst var 134%
| Av/Standby | |
| Låg belastning | |
| Hög belastning |
|
Förklaring:
min: | |
| Lenovo Legion Y520-15IKBA-80WY001VGE i5-7300HQ, Radeon RX 560 (Laptop), Seagate Mobile HDD 1TB ST1000LM035, IPS, 1920x1080, 15.6" | Alienware 13 R3 (i5-7300HQ, GTX 1050 Ti) i5-7300HQ, GeForce GTX 1050 Ti Mobile, Samsung PM961 MZVLW256HEHP, IPS, 1920x1080, 13.3" | Schenker XMG Apex 15 i7-8700, GeForce GTX 1060 Mobile, Samsung SSD 960 Evo 250GB m.2 NVMe, IPS, 1920x1080, 15.6" | Dell Inspiron 15 7000 7577 4K i7-7700HQ, GeForce GTX 1060 Max-Q, SK hynix SC311 M.2, IPS, 3840x2160, 15.6" | Lenovo Legion Y520-15IKBN-80WK001KUS i7-7700HQ, GeForce GTX 1050 Ti Mobile, Samsung PM961 MZVLW256HEHP, IPS, 1920x1080, 15.6" | Genomsnitt AMD Radeon RX 560 (Laptop) | Genomsnitt av klass Gaming | |
|---|---|---|---|---|---|---|---|
| Power Consumption | -25% | -48% | -17% | -23% | -12% | -141% | |
| Idle Minimum * (Watt) | 4.7 | 6.6 -40% | 7 -49% | 5.5 -17% | 8.5 -81% | 7.3 ? -55% | 13 ? -177% |
| Idle Average * (Watt) | 7.8 | 9.5 -22% | 10 -28% | 10.5 -35% | 9.1 -17% | 8.65 ? -11% | 19 ? -144% |
| Idle Maximum * (Watt) | 8.4 | 12.7 -51% | 14 -67% | 10.9 -30% | 9.7 -15% | 9.55 ? -14% | 24.6 ? -193% |
| Load Average * (Watt) | 76.5 | 64 16% | 114 -49% | 72 6% | 79.9 -4% | 69.3 ? 9% | 110.7 ? -45% |
| Witcher 3 ultra * (Watt) | 93 | 105 -13% | 131 -41% | 97.4 -5% | 97.7 -5% | ||
| Load Maximum * (Watt) | 106 | 146.6 -38% | 164 -55% | 130.4 -23% | 121.5 -15% | 96.4 ? 9% | 259 ? -144% |
* ... mindre är bättre
| Lenovo Legion Y520-15IKBA-80WY001VGE i5-7300HQ, Radeon RX 560 (Laptop), 45 Wh | Alienware 13 R3 (i5-7300HQ, GTX 1050 Ti) i5-7300HQ, GeForce GTX 1050 Ti Mobile, 76 Wh | Schenker XMG Apex 15 i7-8700, GeForce GTX 1060 Mobile, 62 Wh | Dell Inspiron 15 7000 7577 4K i7-7700HQ, GeForce GTX 1060 Max-Q, 56 Wh | Lenovo Legion Y520-15IKBN-80WK001KUS i7-7700HQ, GeForce GTX 1050 Ti Mobile, 45 Wh | Genomsnitt av klass Gaming | |
|---|---|---|---|---|---|---|
| Batteridrifttid | ||||||
| WiFi v1.3 (h) | 5.6 | 7.7 38% | 5.6 0% | 5.4 -4% | 4 -29% | 7.11 ? 27% |
För
Emot
Läs den fullständiga versionen av den här recensionen på engelska här.
Lenovo Legion Y520-15IKBA är en gångbar spellaptop som även kan användas till annat än spel. För bara straxt över 7 000 kronor är denna enhet ett bra val för den som behöver tänka på budgeten.
Lenovo Legion Y520-15IKBA är en spellaptop som är konkurrensmässigt prissatt för den prestanda som erbjuds. Lenovo har dock kompromissat med en del komponenter för att kunna hålla priset på runt 7 000 kronor.
Lenovos kompromisser märks. Både WiFi och systemprestanda lider av dom billiga komponenterna. Detta gäller särskilt dess HDD, som märkbart saktar ner systemet jämfört med prestandan från en SSD-enhet. Y520-15IKBA är som tur är lätt att serva, så en SSD-enhet eller en bättre WiFi-modul kan lätt monteras i efterhand.
Lenovo Legion Y520-15IKBA-80WY001VGE
- 05/17/2018 v6 (old)
Mike Wobker
Price comparison
