Test: Asus ROG Chimera G703GI (i9 8950HK, GTX 1080, Full HD) Laptop (Sammanfattning)
| SD Card Reader | |
| average JPG Copy Test (av. of 3 runs) | |
| Aorus X9 DT (Toshiba Exceria Pro SDXC 64 GB UHS-II) | |
| Asus Chimera G703GI (Toshiba Exceria Pro SDXC 64 GB UHS-II) | |
| Schenker XMG Ultra 17 (Toshiba Exceria Pro SDXC 64 GB UHS-II) | |
| Asus G703 (Toshiba Exceria Pro SDXC 64 GB UHS-II) | |
| Genomsnitt av klass Gaming (20.9 - 210, n=54, senaste 2 åren) | |
| MSI GT75 8RG-090 Titan (Toshiba Exceria Pro SDXC 64 GB UHS-II) | |
| maximum AS SSD Seq Read Test (1GB) | |
| Asus Chimera G703GI (Toshiba Exceria Pro SDXC 64 GB UHS-II) | |
| Aorus X9 DT (Toshiba Exceria Pro SDXC 64 GB UHS-II) | |
| Asus G703 (Toshiba Exceria Pro SDXC 64 GB UHS-II) | |
| Schenker XMG Ultra 17 (Toshiba Exceria Pro SDXC 64 GB UHS-II) | |
| Genomsnitt av klass Gaming (25.5 - 261, n=51, senaste 2 åren) | |
| MSI GT75 8RG-090 Titan (Toshiba Exceria Pro SDXC 64 GB UHS-II) | |
| Networking | |
| iperf3 transmit AX12 | |
| Asus Chimera G703GI | |
| MSI GT75 8RG-090 Titan | |
| Aorus X9 DT | |
| Schenker XMG Ultra 17 | |
| Asus G703 | |
| iperf3 receive AX12 | |
| Schenker XMG Ultra 17 | |
| MSI GT75 8RG-090 Titan | |
| Asus G703 | |
| Asus Chimera G703GI | |
| Aorus X9 DT | |
| |||||||||||||||||||||||||
Distribution av ljusstyrkan: 82 %
Mitt på batteriet: 285 cd/m²
Kontrast: 1295:1 (Svärta: 0.22 cd/m²)
ΔE ColorChecker Calman: 3.18 | ∀{0.5-29.43 Ø4.73}
calibrated: 1.73
ΔE Greyscale Calman: 2.93 | ∀{0.09-98 Ø4.97}
93% sRGB (Argyll 1.6.3 3D)
60% AdobeRGB 1998 (Argyll 1.6.3 3D)
67% AdobeRGB 1998 (Argyll 3D)
92.6% sRGB (Argyll 3D)
65.8% Display P3 (Argyll 3D)
Gamma: 2.45
CCT: 7165 K
| Asus Chimera G703GI B173HAN03.2 (AUO329D), IPS, 1920x1080 | Asus G703 AUO B173HAN03.0 (AUO309D), IPS, 1920x1080 | MSI GT75 8RG-090 Titan CMN N173HHE-G32 (CMN1747), TN, 1920x1080 | Aorus X9 DT AUO B173HAN03.0 (AUO309D), IPS, 1920x1080 | Schenker XMG Ultra 17 AU Optronics B173ZAN01.0 (AUO109B), IPS, 3840x2160 | |
|---|---|---|---|---|---|
| Display | -0% | 25% | 0% | 29% | |
| Display P3 Coverage (%) | 65.8 | 65.5 0% | 90.9 38% | 66.8 2% | 86.4 31% |
| sRGB Coverage (%) | 92.6 | 92.4 0% | 100 8% | 92.1 -1% | 100 8% |
| AdobeRGB 1998 Coverage (%) | 67 | 66.6 -1% | 86.2 29% | 67.3 0% | 99.1 48% |
| Response Times | -90% | 12% | -99% | -359% | |
| Response Time Grey 50% / Grey 80% * (ms) | 6.4 ? | 17.6 ? -175% | 8 ? -25% | 18.4 ? -187% | 44 ? -588% |
| Response Time Black / White * (ms) | 10.8 ? | 11.2 ? -4% | 5.6 ? 48% | 12 ? -11% | 24.8 ? -130% |
| PWM Frequency (Hz) | 26000 ? | ||||
| Screen | -15% | 9% | 15% | -1% | |
| Brightness middle (cd/m²) | 285 | 274 -4% | 240 -16% | 280 -2% | 332 16% |
| Brightness (cd/m²) | 275 | 268 -3% | 248 -10% | 262 -5% | 313 14% |
| Brightness Distribution (%) | 82 | 80 -2% | 83 1% | 86 5% | 88 7% |
| Black Level * (cd/m²) | 0.22 | 0.29 -32% | 0.22 -0% | 0.22 -0% | 0.28 -27% |
| Contrast (:1) | 1295 | 945 -27% | 1091 -16% | 1273 -2% | 1186 -8% |
| Colorchecker dE 2000 * | 3.18 | 3.99 -25% | 2.14 33% | 1.78 44% | 3.86 -21% |
| Colorchecker dE 2000 max. * | 5.99 | 7.33 -22% | 5.04 16% | 3.91 35% | 5.88 2% |
| Colorchecker dE 2000 calibrated * | 1.73 | 1.79 -3% | 1.54 11% | ||
| Greyscale dE 2000 * | 2.93 | 4.14 -41% | 1.62 45% | 0.74 75% | 4.33 -48% |
| Gamma | 2.45 90% | 2.58 85% | 2.28 96% | 2.43 91% | 2.41 91% |
| CCT | 7165 91% | 7352 88% | 6846 95% | 6494 100% | 6595 99% |
| Color Space (Percent of AdobeRGB 1998) (%) | 60 | 60 0% | 77 28% | 60 0% | 88 47% |
| Color Space (Percent of sRGB) (%) | 93 | 92 -1% | 100 8% | 92 -1% | 100 8% |
| Totalt genomsnitt (program/inställningar) | -35% /
-21% | 15% /
12% | -28% /
-3% | -110% /
-43% |
* ... mindre är bättre
Visa svarstider
| ↔ Svarstid svart till vitt | ||
|---|---|---|
| 10.8 ms ... stiga ↗ och falla ↘ kombinerat | ↗ 6 ms stiga | 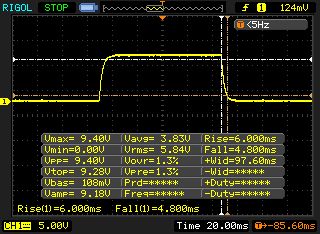 |
| ↘ 4.8 ms hösten | ||
| Skärmen visar bra svarsfrekvens i våra tester, men kan vara för långsam för konkurrenskraftiga spelare. I jämförelse sträcker sig alla testade enheter från 0.1 (minst) till 240 (maximalt) ms. » 29 % av alla enheter är bättre. Det betyder att den uppmätta svarstiden är bättre än genomsnittet av alla testade enheter (19.9 ms). | ||
| ↔ Svarstid 50 % grått till 80 % grått | ||
| 6.4 ms ... stiga ↗ och falla ↘ kombinerat | ↗ 3.4 ms stiga | 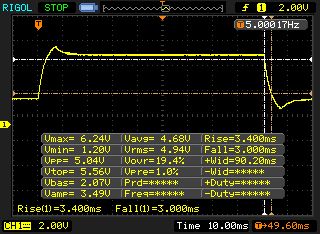 |
| ↘ 3 ms hösten | ||
| Skärmen visar väldigt snabba svarsfrekvenser i våra tester och borde vara mycket väl lämpad för fartfyllt spel. I jämförelse sträcker sig alla testade enheter från 0.165 (minst) till 636 (maximalt) ms. » 19 % av alla enheter är bättre. Det betyder att den uppmätta svarstiden är bättre än genomsnittet av alla testade enheter (31.1 ms). | ||
Skärmflimmer / PWM (Puls-Width Modulation)
| Skärmflimmer / PWM upptäcktes inte | 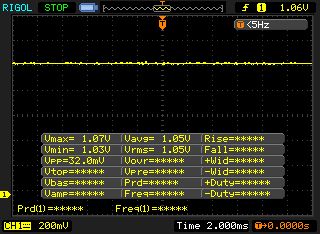 | ||
Som jämförelse: 52 % av alla testade enheter använder inte PWM för att dämpa skärmen. Om PWM upptäcktes mättes ett medelvärde av 7791 (minst: 5 - maximum: 343500) Hz. | |||
| PCMark 10 - Score | |
| Genomsnitt av klass Gaming (5828 - 11574, n=95, senaste 2 åren) | |
| Asus Chimera G703GI | |
| MSI GT75 8RG-090 Titan | |
| Aorus X9 DT | |
| Schenker XMG Ultra 17 | |
| Asus G703 | |
| PCMark 8 | |
| Home Score Accelerated v2 | |
| Asus Chimera G703GI | |
| Asus G703 | |
| Aorus X9 DT | |
| MSI GT75 8RG-090 Titan | |
| Genomsnitt av klass Gaming (n=1senaste 2 åren) | |
| Schenker XMG Ultra 17 | |
| Work Score Accelerated v2 | |
| Asus Chimera G703GI | |
| Aorus X9 DT | |
| Asus G703 | |
| MSI GT75 8RG-090 Titan | |
| Schenker XMG Ultra 17 | |
| Genomsnitt av klass Gaming (n=1senaste 2 åren) | |
| PCMark 8 Home Score Accelerated v2 | 6093 poäng | |
| PCMark 8 Work Score Accelerated v2 | 6281 poäng | |
| PCMark 10 Score | 6607 poäng | |
Hjälp | ||
| Asus Chimera G703GI 2x Intel 760p 512 GB + 1x Samsung SM961 512 GB (RAID) | Asus G703 2x Samsung SM961 MZVKW512HMJP NVMe (RAID 0) | MSI GT75 8RG-090 Titan 2x Samsung PM961 MZVLW256HEHP (RAID 0) | Aorus X9 DT Transcend TS1TMTE850 | Schenker XMG Ultra 17 Samsung SSD 960 Evo 500GB m.2 NVMe | |
|---|---|---|---|---|---|
| AS SSD | -20% | -28% | -57% | -24% | |
| Seq Read (MB/s) | 4886 | 3177 -35% | 3058 -37% | 1518 -69% | 2533 -48% |
| Seq Write (MB/s) | 4110 | 2556 -38% | 2196 -47% | 1019 -75% | 1771 -57% |
| 4K Read (MB/s) | 57.4 | 47.61 -17% | 38.37 -33% | 22.23 -61% | 43.65 -24% |
| 4K Write (MB/s) | 141.3 | 148.4 5% | 97.7 -31% | 98.9 -30% | 139.5 -1% |
| Score Read (Points) | 1999 | 1633 -18% | 1691 -15% | 828 -59% | 1716 -14% |
| Score Write (Points) | 1855 | 1519 -18% | 1553 -16% | 916 -51% | 1615 -13% |
| Score Total (Points) | 4843 | 3962 -18% | 4066 -16% | 2145 -56% | 4173 -14% |

| 3DMark - 1920x1080 Fire Strike Graphics | |
| Genomsnitt av klass Gaming (12242 - 62849, n=120, senaste 2 åren) | |
| Aorus X9 DT | |
| Asus G703 | |
| Asus Chimera G703GI | |
| MSI GT75 8RG-090 Titan | |
| Schenker XMG Ultra 17 | |
| 3DMark 11 - 1280x720 Performance GPU | |
| Genomsnitt av klass Gaming (21841 - 80022, n=108, senaste 2 åren) | |
| Asus Chimera G703GI | |
| Asus G703 | |
| MSI GT75 8RG-090 Titan | |
| Schenker XMG Ultra 17 | |
| Aorus X9 DT | |
| 3DMark 11 Performance | 23488 poäng | |
| 3DMark Ice Storm Standard Score | 214443 poäng | |
| 3DMark Cloud Gate Standard Score | 38913 poäng | |
| 3DMark Fire Strike Score | 18999 poäng | |
Hjälp | ||
| The Witcher 3 - 1920x1080 Ultra Graphics & Postprocessing (HBAO+) | |
| Genomsnitt av klass Gaming (95 - 240, n=8, senaste 2 åren) | |
| Asus G703 | |
| Aorus X9 DT | |
| MSI GT75 8RG-090 Titan | |
| Asus Chimera G703GI | |
| Schenker XMG Ultra 17 | |
| låg | med. | hög | ultra | |
|---|---|---|---|---|
| The Witcher 3 (2015) | 145 | 76.7 | ||
| Far Cry 5 (2018) | 113 | 103 |
Ljudnivå
| Låg belastning |
| 30 / 34 / 42 dB(A) |
| Hårddisk |
| 31 dB(A) |
| Hög belastning |
| 53 / 53 dB(A) |
 | ||
30 dB tyst 40 dB(A) hörbar 50 dB(A) högt ljud |
||
min: | ||
| Asus Chimera G703GI i9-8950HK, GeForce GTX 1080 Mobile | Asus G703 i7-7820HK, GeForce GTX 1080 Mobile | MSI GT75 8RG-090 Titan i9-8950HK, GeForce GTX 1080 Mobile | Aorus X9 DT i9-8950HK, GeForce GTX 1080 Mobile | Schenker XMG Ultra 17 i7-8700, GeForce GTX 1080 Mobile | Genomsnitt av klass Gaming | |
|---|---|---|---|---|---|---|
| Noise | 0% | -1% | -8% | -2% | 16% | |
| av / miljö * (dB) | 29 | 30 -3% | 30 -3% | 30 -3% | 30 -3% | 24.1 ? 17% |
| Idle Minimum * (dB) | 30 | 35 -17% | 32 -7% | 36 -20% | 34 -13% | 25.8 ? 14% |
| Idle Average * (dB) | 34 | 36 -6% | 34 -0% | 37 -9% | 35 -3% | 27.4 ? 19% |
| Idle Maximum * (dB) | 42 | 38 10% | 37 12% | 43 -2% | 40 5% | 30 ? 29% |
| Load Average * (dB) | 53 | 46 13% | 43 19% | 50 6% | 45 15% | 43 ? 19% |
| Witcher 3 ultra * (dB) | 51 | 48 6% | 57 -12% | 57 -12% | 52 -2% | |
| Load Maximum * (dB) | 53 | 54 -2% | 62 -17% | 61 -15% | 60 -13% | 54 ? -2% |
* ... mindre är bättre
(-) Den maximala temperaturen på ovansidan är 50 °C / 122 F, jämfört med genomsnittet av 40.4 °C / 105 F , allt från 21.2 till 68.8 °C för klassen Gaming.
(-) Botten värms upp till maximalt 50 °C / 122 F, jämfört med genomsnittet av 43.2 °C / 110 F
(+) Vid tomgångsbruk är medeltemperaturen för ovansidan 29.8 °C / 86 F, jämfört med enhetsgenomsnittet på 33.9 °C / ### class_avg_f### F.
(±) När du spelar The Witcher 3 är medeltemperaturen för ovansidan 37.4 °C / 99 F, jämfört med enhetsgenomsnittet på 33.9 °C / ## #class_avg_f### F.
(+) Handledsstöden och pekplattan är kallare än hudtemperaturen med maximalt 30 °C / 86 F och är därför svala att ta på.
(±) Medeltemperaturen för handledsstödsområdet på liknande enheter var 28.8 °C / 83.8 F (-1.2 °C / -2.2 F).
| Asus Chimera G703GI i9-8950HK, GeForce GTX 1080 Mobile | Asus G703 i7-7820HK, GeForce GTX 1080 Mobile | MSI GT75 8RG-090 Titan i9-8950HK, GeForce GTX 1080 Mobile | Aorus X9 DT i9-8950HK, GeForce GTX 1080 Mobile | Schenker XMG Ultra 17 i7-8700, GeForce GTX 1080 Mobile | Genomsnitt av klass Gaming | |
|---|---|---|---|---|---|---|
| Heat | -2% | 9% | 8% | 6% | 3% | |
| Maximum Upper Side * (°C) | 50 | 55 -10% | 47 6% | 43 14% | 41 18% | 45.2 ? 10% |
| Maximum Bottom * (°C) | 50 | 54 -8% | 53 -6% | 55 -10% | 48 4% | 48 ? 4% |
| Idle Upper Side * (°C) | 32 | 29 9% | 26 19% | 27 16% | 30 6% | 31.1 ? 3% |
| Idle Bottom * (°C) | 33 | 32 3% | 27 18% | 29 12% | 35 -6% | 34.2 ? -4% |
* ... mindre är bättre
Asus Chimera G703GI ljudanalys
(+) | högtalare kan spela relativt högt (89 dB)
Bas 100 - 315 Hz
(±) | reducerad bas - i genomsnitt 8.9% lägre än medianen
(+) | basen är linjär (6.4% delta till föregående frekvens)
Mellan 400 - 2000 Hz
(+) | balanserad mellan - endast 3.1% från medianen
(+) | mids är linjära (2.4% delta till föregående frekvens)
Högsta 2 - 16 kHz
(+) | balanserade toppar - endast 4.4% från medianen
(+) | toppar är linjära (3.2% delta till föregående frekvens)
Totalt 100 - 16 000 Hz
(+) | det totala ljudet är linjärt (11.8% skillnad mot median)
Jämfört med samma klass
» 11% av alla testade enheter i den här klassen var bättre, 4% liknande, 85% sämre
» Den bästa hade ett delta på 6%, genomsnittet var 18%, sämst var 132%
Jämfört med alla testade enheter
» 8% av alla testade enheter var bättre, 3% liknande, 89% sämre
» Den bästa hade ett delta på 4%, genomsnittet var 24%, sämst var 134%
MSI GT75 8RG-090 Titan ljudanalys
(+) | högtalare kan spela relativt högt (94 dB)
Bas 100 - 315 Hz
(±) | reducerad bas - i genomsnitt 9.4% lägre än medianen
(±) | linjäriteten för basen är genomsnittlig (8.7% delta till föregående frekvens)
Mellan 400 - 2000 Hz
(±) | högre mellan - i genomsnitt 6.8% högre än median
(±) | linjäriteten för mids är genomsnittlig (8.4% delta till föregående frekvens)
Högsta 2 - 16 kHz
(±) | högre toppar - i genomsnitt 5% högre än medianen
(±) | linjäriteten för toppar är genomsnittlig (7.8% delta till föregående frekvens)
Totalt 100 - 16 000 Hz
(+) | det totala ljudet är linjärt (14.4% skillnad mot median)
Jämfört med samma klass
» 27% av alla testade enheter i den här klassen var bättre, 7% liknande, 66% sämre
» Den bästa hade ett delta på 6%, genomsnittet var 18%, sämst var 132%
Jämfört med alla testade enheter
» 18% av alla testade enheter var bättre, 4% liknande, 78% sämre
» Den bästa hade ett delta på 4%, genomsnittet var 24%, sämst var 134%
| Av/Standby | |
| Låg belastning | |
| Hög belastning |
|
Förklaring:
min: | |
| Asus Chimera G703GI i9-8950HK, GeForce GTX 1080 Mobile | Asus G703 i7-7820HK, GeForce GTX 1080 Mobile | MSI GT75 8RG-090 Titan i9-8950HK, GeForce GTX 1080 Mobile | Aorus X9 DT i9-8950HK, GeForce GTX 1080 Mobile | Schenker XMG Ultra 17 i7-8700, GeForce GTX 1080 Mobile | Genomsnitt av klass Gaming | |
|---|---|---|---|---|---|---|
| Power Consumption | 10% | -1% | 5% | 5% | 40% | |
| Idle Minimum * (Watt) | 29 | 26 10% | 31 -7% | 28 3% | 32 -10% | 13.2 ? 54% |
| Idle Average * (Watt) | 37 | 30 19% | 35 5% | 37 -0% | 38 -3% | 18.9 ? 49% |
| Idle Maximum * (Watt) | 46 | 37 20% | 45 2% | 40 13% | 45 2% | 24.3 ? 47% |
| Load Average * (Watt) | 156 | 123 21% | 130 17% | 109 30% | 96 38% | 108 ? 31% |
| Witcher 3 ultra * (Watt) | 252 | 257 -2% | 268 -6% | 256 -2% | 237 6% | |
| Load Maximum * (Watt) | 314 | 341 -9% | 374 -19% | 353 -12% | 331 -5% | 254 ? 19% |
* ... mindre är bättre
| Asus Chimera G703GI i9-8950HK, GeForce GTX 1080 Mobile, 71 Wh | Asus G703 i7-7820HK, GeForce GTX 1080 Mobile, 71 Wh | MSI GT75 8RG-090 Titan i9-8950HK, GeForce GTX 1080 Mobile, 75 Wh | Aorus X9 DT i9-8950HK, GeForce GTX 1080 Mobile, 94.24 Wh | Schenker XMG Ultra 17 i7-8700, GeForce GTX 1080 Mobile, 82 Wh | Genomsnitt av klass Gaming | |
|---|---|---|---|---|---|---|
| Batteridrifttid | 11% | 29% | 46% | 13% | 164% | |
| Reader / Idle (h) | 2.8 | 3.3 18% | 3.8 36% | 4.2 50% | 2.7 -4% | 8.71 ? 211% |
| WiFi v1.3 (h) | 2.2 | 2.5 14% | 3.2 45% | 2.4 9% | 7.02 ? 219% | |
| Load (h) | 0.9 | 0.9 0% | 1.1 22% | 1.3 44% | 1.2 33% | 1.47 ? 63% |
| H.264 (h) | 2.4 | 2.9 | 2.5 | 8.26 ? |
För
Emot
Läs den fullständiga versionen av den här recensionen på engelska här.
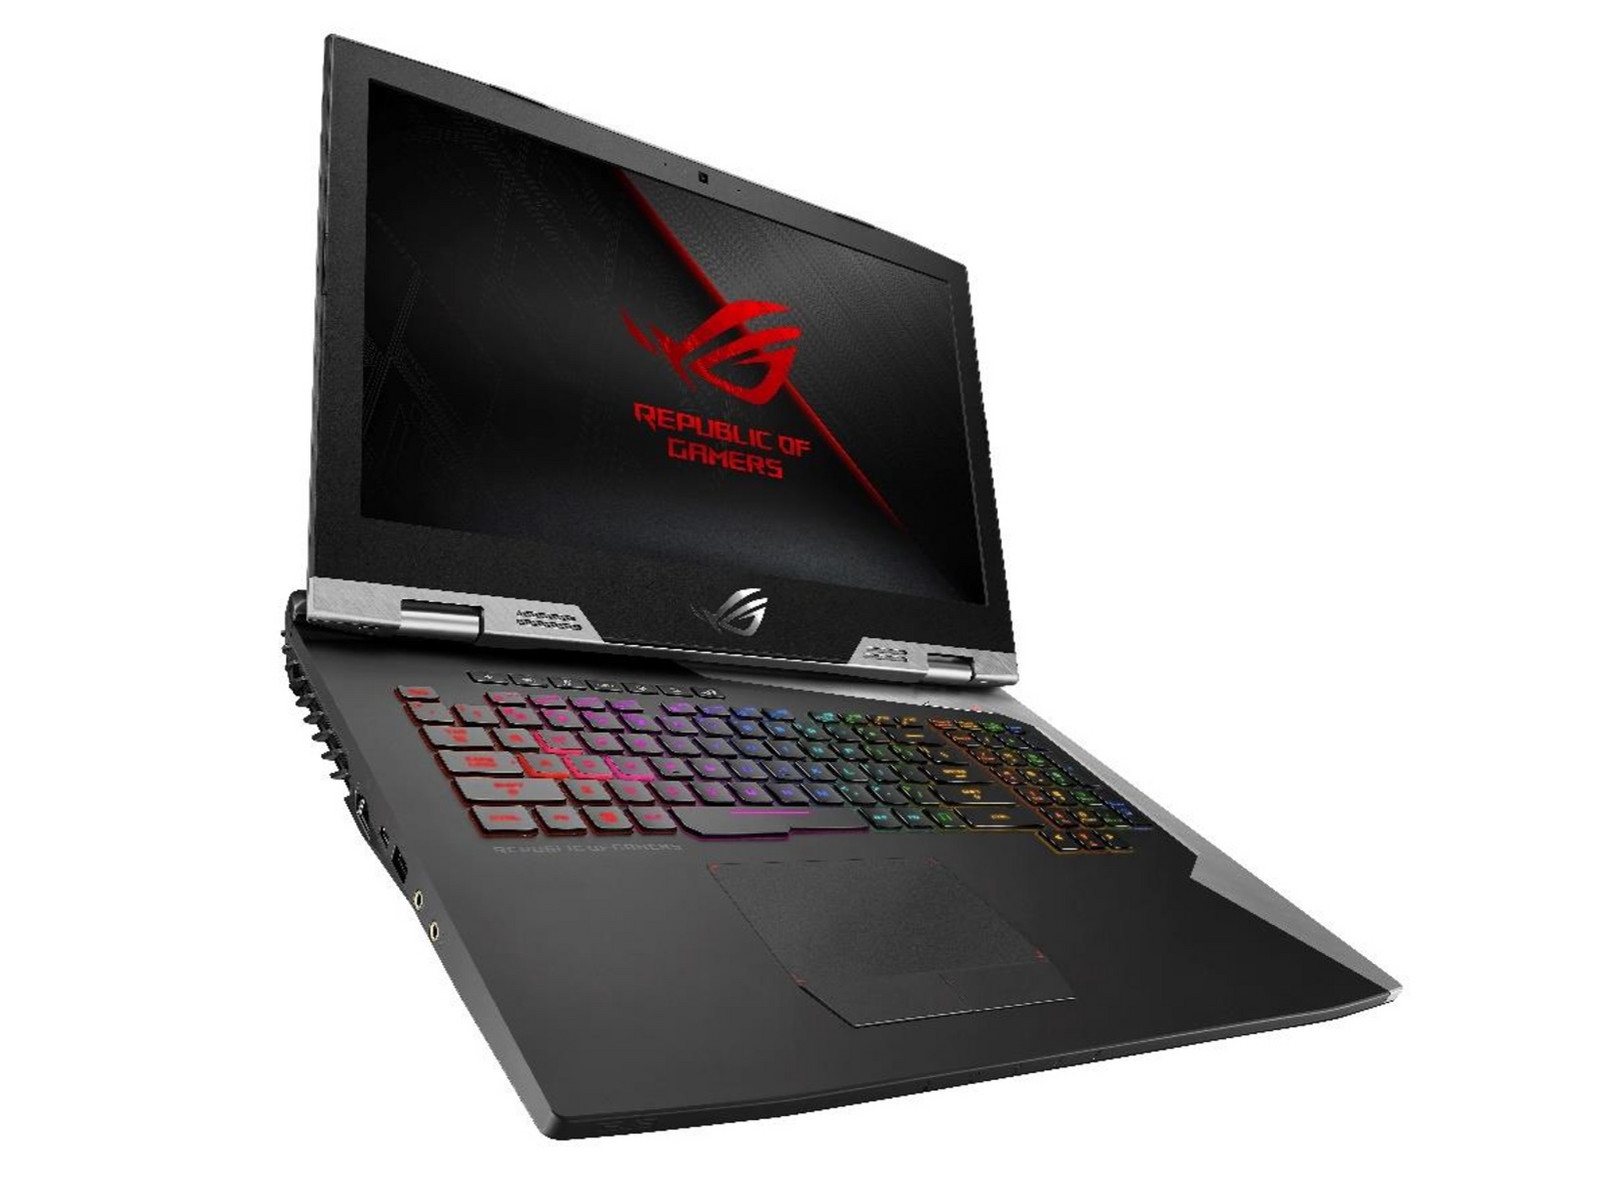
Likt sin föregångare så är Coffee Lake-versionen av Asus ROG Chimera G703 en av dom bästa toppskikts-modellerna för ivriga gamers.
Om vi bortser från dess höga vikt och tjocka konstruktion så har höljet många fördelar. Attraktionen i detta kraftpaket på 17 tum finns inte bara i dess snabba och kontrastrika 144 Hz-skärm med stabila betraktningsvinklar och stöd för G-Sync utan också hos dom moderna anslutningarna (Thunderbolt 3) och dom bra inmatningsenheterna.
I fråga om prestanda finns det helt enkelt inget att kritisera. I enhetens inbyggda upplösning kör dess sex-kärniga CPU och GeForce GTX 1080 alla spel på marknaden med smidig bilduppdatering. Datorn låter en hel del vid belastning, men andra konkurrenter såsom MSI GT75 8RG och Aorus X9 DT blir ännu mer högljudda i 3D-läge.
När alla aspekter har övervägts får datorn precis tillräckligt för betyget "Väldigt Bra". I vår Topp 10-lista över spellaptops tar den återigen första platsen.
Asus Chimera G703GI
- 06/07/2018 v6 (old)
Florian Glaser
Price comparison