Test: Dell Latitude 7490 (i5-8350U, FHD) Laptop (Sammanfattning)
| SD Card Reader | |
| average JPG Copy Test (av. of 3 runs) | |
| Lenovo ThinkPad X1 Carbon 2018-20KGS03900 (Toshiba Exceria Pro M501) | |
| Dell Latitude 7390 (Toshiba Exceria Pro M501 UHS-II) | |
| Dell Latitude 7490 (Toshiba Exceria Pro M501 UHS-II) | |
| Lenovo ThinkPad T480s-20L8S02D00 (Toshiba Exceria Pro SDXC 64 GB UHS-II) | |
| Genomsnitt av klass Office (19.8 - 198.5, n=22, senaste 2 åren) | |
| maximum AS SSD Seq Read Test (1GB) | |
| Lenovo ThinkPad X1 Carbon 2018-20KGS03900 (Toshiba Exceria Pro M501) | |
| Dell Latitude 7390 (Toshiba Exceria Pro M501 UHS-II) | |
| Dell Latitude 7490 (Toshiba Exceria Pro M501 UHS-II) | |
| Lenovo ThinkPad T480s-20L8S02D00 (Toshiba Exceria Pro SDXC 64 GB UHS-II) | |
| Genomsnitt av klass Office (27.4 - 249, n=21, senaste 2 åren) | |
| |||||||||||||||||||||||||
Distribution av ljusstyrkan: 89 %
Mitt på batteriet: 308.6 cd/m²
Kontrast: 1342:1 (Svärta: 0.23 cd/m²)
ΔE ColorChecker Calman: 6.07 | ∀{0.5-29.43 Ø4.71}
calibrated: 1.67
ΔE Greyscale Calman: 7.3 | ∀{0.09-98 Ø4.96}
97% sRGB (Argyll 1.6.3 3D)
62% AdobeRGB 1998 (Argyll 1.6.3 3D)
67.9% AdobeRGB 1998 (Argyll 3D)
96.8% sRGB (Argyll 3D)
66.6% Display P3 (Argyll 3D)
Gamma: 2.061
CCT: 7269 K
| Dell Latitude 7490 AUO503D (D04YD_B140HAN), IPS, 14", 1920x1080 | HP EliteBook 840 G5-3JX66EA AUO3B3D, IPS, 14", 1920x1080 | Dell Latitude 7390 LGD059B, IPS, 13.3", 1920x1080 | Lenovo ThinkPad T480s-20L8S02D00 LP140QH2-SPB1, IPS, 14", 2560x1440 | Lenovo ThinkPad X1 Carbon 2018-20KGS03900 B140QAN02.0, IPS, 14", 2560x1440 | Dell Latitude 7490 AU Optronics AU0223D, IPS, 14", 1920x1080 | |
|---|---|---|---|---|---|---|
| Display | -10% | 0% | 6% | 27% | -6% | |
| Display P3 Coverage (%) | 66.6 | 60.2 -10% | 67.8 2% | 72.8 9% | 87.7 32% | 63.6 -5% |
| sRGB Coverage (%) | 96.8 | 88.2 -9% | 95.1 -2% | 97.9 1% | 100 3% | 88.8 -8% |
| AdobeRGB 1998 Coverage (%) | 67.9 | 61.3 -10% | 67.8 0% | 74.1 9% | 99.9 47% | 64.8 -5% |
| Response Times | -1% | 9% | 10% | -25% | -9% | |
| Response Time Grey 50% / Grey 80% * (ms) | 41.6 ? | 42.4 ? -2% | 36.8 ? 12% | 38.4 ? 8% | 59.2 ? -42% | 48.4 ? -16% |
| Response Time Black / White * (ms) | 32 ? | 31.6 ? 1% | 30.4 ? 5% | 28.4 ? 11% | 34.4 ? -8% | 32.4 ? -1% |
| PWM Frequency (Hz) | ||||||
| Screen | 5% | 7% | 1% | 36% | -6% | |
| Brightness middle (cd/m²) | 308.6 | 414 34% | 303.8 -2% | 352 14% | 578 87% | 328.2 6% |
| Brightness (cd/m²) | 294 | 387 32% | 289 -2% | 343 17% | 533 81% | 305 4% |
| Brightness Distribution (%) | 89 | 87 -2% | 86 -3% | 91 2% | 84 -6% | 87 -2% |
| Black Level * (cd/m²) | 0.23 | 0.25 -9% | 0.31 -35% | 0.46 -100% | 0.38 -65% | 0.37 -61% |
| Contrast (:1) | 1342 | 1656 23% | 980 -27% | 765 -43% | 1521 13% | 887 -34% |
| Colorchecker dE 2000 * | 6.07 | 5.5 9% | 2.9 52% | 3.3 46% | 1.9 69% | 3.82 37% |
| Colorchecker dE 2000 max. * | 10.58 | 9.9 6% | 5.79 45% | 7.3 31% | 3.8 64% | 5.58 47% |
| Colorchecker dE 2000 calibrated * | 1.67 | 2.3 -38% | 1.72 -3% | 0.8 52% | 3.5 -110% | |
| Greyscale dE 2000 * | 7.3 | 6.4 12% | 3.7 49% | 5.3 27% | 3 59% | 3 59% |
| Gamma | 2.061 107% | 2.31 95% | 2.118 104% | 2.22 99% | 2.14 103% | 2.36 93% |
| CCT | 7269 89% | 7811 83% | 6323 103% | 6452 101% | 6377 102% | 6962 93% |
| Color Space (Percent of AdobeRGB 1998) (%) | 62 | 56.9 -8% | 63 2% | 68.4 10% | 88.8 43% | 58 -6% |
| Color Space (Percent of sRGB) (%) | 97 | 88.1 -9% | 95 -2% | 98 1% | 100 3% | 88 -9% |
| Totalt genomsnitt (program/inställningar) | -2% /
1% | 5% /
6% | 6% /
3% | 13% /
27% | -7% /
-7% |
* ... mindre är bättre
Visa svarstider
| ↔ Svarstid svart till vitt | ||
|---|---|---|
| 32 ms ... stiga ↗ och falla ↘ kombinerat | ↗ 16.4 ms stiga | 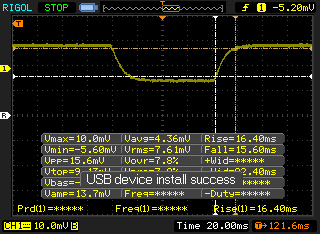 |
| ↘ 15.6 ms hösten | ||
| Skärmen visar långsamma svarsfrekvenser i våra tester och kommer att vara otillfredsställande för spelare. I jämförelse sträcker sig alla testade enheter från 0.1 (minst) till 240 (maximalt) ms. » 86 % av alla enheter är bättre. Detta innebär att den uppmätta svarstiden är sämre än genomsnittet av alla testade enheter (19.8 ms). | ||
| ↔ Svarstid 50 % grått till 80 % grått | ||
| 41.6 ms ... stiga ↗ och falla ↘ kombinerat | ↗ 22 ms stiga | 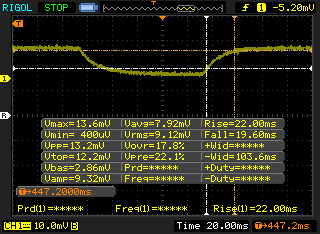 |
| ↘ 19.6 ms hösten | ||
| Skärmen visar långsamma svarsfrekvenser i våra tester och kommer att vara otillfredsställande för spelare. I jämförelse sträcker sig alla testade enheter från 0.165 (minst) till 636 (maximalt) ms. » 67 % av alla enheter är bättre. Detta innebär att den uppmätta svarstiden är sämre än genomsnittet av alla testade enheter (31 ms). | ||
Skärmflimmer / PWM (Puls-Width Modulation)
| Skärmflimmer / PWM upptäcktes inte | 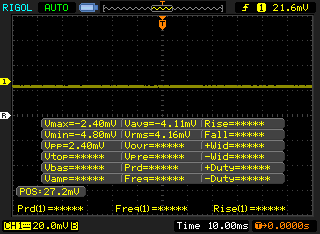 | ||
Som jämförelse: 52 % av alla testade enheter använder inte PWM för att dämpa skärmen. Om PWM upptäcktes mättes ett medelvärde av 7757 (minst: 5 - maximum: 343500) Hz. | |||
| PCMark 8 Home Score Accelerated v2 | 3723 poäng | |
| PCMark 8 Work Score Accelerated v2 | 4906 poäng | |
| PCMark 10 Score | 3564 poäng | |
Hjälp | ||
| Dell Latitude 7490 Toshiba KSG60ZMV256G | Dell Latitude 7490 Samsung PM961 MZVLW256HEHP | HP EliteBook 840 G5-3JX66EA Toshiba XG5 KXG50ZNV256G | Dell Latitude 7390 Samsung PM961 MZVLW256HEHP | Lenovo ThinkPad X1 Carbon 2018-20KGS03900 Samsung SSD PM981 MZVLB512HAJQ | Genomsnitt Toshiba KSG60ZMV256G | |
|---|---|---|---|---|---|---|
| AS SSD | 135% | 19% | 113% | 238% | 0% | |
| Copy Game MB/s (MB/s) | 382.3 | 309.3 | 352 | 1107 | ||
| Copy Program MB/s (MB/s) | 227.1 | 168.2 | 247.4 | 460.2 | ||
| Copy ISO MB/s (MB/s) | 872 | 319.2 | 818 | 1247 | ||
| Score Total (Points) | 947 | 2350 148% | 1232 30% | 2215 134% | 3529 273% | 947 ? 0% |
| Score Write (Points) | 357 | 536 50% | 376 5% | 501 40% | 1801 404% | 357 ? 0% |
| Score Read (Points) | 391 | 1242 218% | 603 54% | 1158 196% | 1168 199% | 391 ? 0% |
| Access Time Write * (ms) | 0.056 | 0.03 46% | 0.053 5% | 0.032 43% | 0.027 52% | 0.056 ? -0% |
| Access Time Read * (ms) | 0.112 | 0.04 64% | 0.321 -187% | 0.063 44% | 0.029 74% | 0.112 ? -0% |
| 4K-64 Write (MB/s) | 248.1 | 329.6 33% | 248.3 0% | 302.4 22% | 1529 516% | 248 ? 0% |
| 4K-64 Read (MB/s) | 316.1 | 955 202% | 413.3 31% | 932 195% | 876 177% | 316 ? 0% |
| 4K Write (MB/s) | 79.2 | 114.9 45% | 93.6 18% | 115.2 45% | 134.3 70% | 79.2 ? 0% |
| 4K Read (MB/s) | 26.66 | 48.13 81% | 29.01 9% | 49.43 85% | 52.4 97% | 26.7 ? 0% |
| Seq Write (MB/s) | 294.9 | 919 212% | 339 15% | 830 181% | 1376 367% | 295 ? 0% |
| Seq Read (MB/s) | 486.2 | 2385 391% | 1611 231% | 1761 262% | 2396 393% | 486 ? 0% |
* ... mindre är bättre

| 3DMark 11 Performance | 1797 poäng | |
| 3DMark Cloud Gate Standard Score | 7414 poäng | |
| 3DMark Fire Strike Score | 934 poäng | |
Hjälp | ||
| Metro: Last Light | |
| 1024x768 Low (DX10) AF:4x (sortera efter värde) | |
| Dell Latitude 7490 | |
| Genomsnitt Intel UHD Graphics 620 (23.3 - 41, n=5) | |
| 1366x768 Medium (DX10) AF:4x (sortera efter värde) | |
| Dell Latitude 7490 | |
| Genomsnitt Intel UHD Graphics 620 (16.4 - 28, n=4) | |
| 1366x768 High (DX11) AF:16x (sortera efter värde) | |
| Dell Latitude 7490 | |
| Genomsnitt Intel UHD Graphics 620 (13 - 16, n=3) | |
| 1920x1080 Very High (DX11) AF:16x (sortera efter värde) | |
| Dell Latitude 7490 | |
| Genomsnitt Intel UHD Graphics 620 (6 - 8, n=3) | |
| Rise of the Tomb Raider | |
| 1024x768 Lowest Preset (sortera efter värde) | |
| Dell Latitude 7490 | |
| HP EliteBook 840 G5-3JX66EA | |
| Lenovo ThinkPad X1 Carbon 2018-20KGS03900 | |
| Genomsnitt Intel UHD Graphics 620 (10.4 - 110.7, n=82) | |
| 1366x768 Medium Preset AF:2x (sortera efter värde) | |
| Dell Latitude 7490 | |
| HP EliteBook 840 G5-3JX66EA | |
| Lenovo ThinkPad X1 Carbon 2018-20KGS03900 | |
| Genomsnitt Intel UHD Graphics 620 (6.5 - 49.3, n=62) | |
| 1920x1080 High Preset AA:FX AF:4x (sortera efter värde) | |
| Dell Latitude 7490 | |
| HP EliteBook 840 G5-3JX66EA | |
| Lenovo ThinkPad X1 Carbon 2018-20KGS03900 | |
| Genomsnitt Intel UHD Graphics 620 (4.9 - 32, n=42) | |
| låg | med. | hög | ultra | |
|---|---|---|---|---|
| BioShock Infinite (2013) | 52 | 35 | 24 | 8 |
| Metro: Last Light (2013) | 31 | 23 | 15 | 6 |
| Rise of the Tomb Raider (2016) | 17 | 11 | 6 |
Ljudnivå
| Låg belastning |
| 28.2 / 28.2 / 28.7 dB(A) |
| Hög belastning |
| 29.9 / 40.2 dB(A) |
 | ||
30 dB tyst 40 dB(A) hörbar 50 dB(A) högt ljud |
||
min: | ||
| Dell Latitude 7490 UHD Graphics 620, i5-8350U, Toshiba KSG60ZMV256G | HP EliteBook 840 G5-3JX66EA UHD Graphics 620, i5-8250U, Toshiba XG5 KXG50ZNV256G | Dell Latitude 7390 UHD Graphics 620, i7-8650U, Samsung PM961 MZVLW256HEHP | Lenovo ThinkPad T480s-20L8S02D00 UHD Graphics 620, i5-8250U, Samsung SSD PM981 MZVLB512HAJQ | Lenovo ThinkPad X1 Carbon 2018-20KGS03900 UHD Graphics 620, i5-8550U, Samsung SSD PM981 MZVLB512HAJQ | Dell Latitude 7490 UHD Graphics 620, i7-8650U, Samsung PM961 MZVLW256HEHP | |
|---|---|---|---|---|---|---|
| Noise | -5% | -2% | -5% | -4% | -3% | |
| av / miljö * (dB) | 28.2 | 28.8 -2% | 28.2 -0% | 28.9 -2% | 28.9 -2% | 28.2 -0% |
| Idle Minimum * (dB) | 28.2 | 28.8 -2% | 28.2 -0% | 28.9 -2% | 28.9 -2% | 28.2 -0% |
| Idle Average * (dB) | 28.2 | 28.8 -2% | 28.2 -0% | 28.9 -2% | 28.9 -2% | 28.2 -0% |
| Idle Maximum * (dB) | 28.7 | 33.1 -15% | 28.2 2% | 28.9 -1% | 32.5 -13% | 31.4 -9% |
| Load Average * (dB) | 29.9 | 35.2 -18% | 31.5 -5% | 36.9 -23% | 35.1 -17% | 31.7 -6% |
| Load Maximum * (dB) | 40.2 | 35.2 12% | 42.7 -6% | 38.9 3% | 35.1 13% | 41.2 -2% |
* ... mindre är bättre
(-) Den maximala temperaturen på ovansidan är 45.2 °C / 113 F, jämfört med genomsnittet av 34.3 °C / 94 F , allt från 21.2 till 62.5 °C för klassen Office.
(-) Botten värms upp till maximalt 51.6 °C / 125 F, jämfört med genomsnittet av 36.8 °C / 98 F
(+) Vid tomgångsbruk är medeltemperaturen för ovansidan 28.7 °C / 84 F, jämfört med enhetsgenomsnittet på 29.5 °C / ### class_avg_f### F.
(+) Handledsstöden och pekplattan är kallare än hudtemperaturen med maximalt 30.4 °C / 86.7 F och är därför svala att ta på.
(-) Medeltemperaturen för handledsstödsområdet på liknande enheter var 27.5 °C / 81.5 F (-2.9 °C / -5.2 F).
Dell Latitude 7490 ljudanalys
(±) | högtalarljudstyrkan är genomsnittlig men bra (77.3 dB)
Bas 100 - 315 Hz
(±) | reducerad bas - i genomsnitt 13.6% lägre än medianen
(±) | linjäriteten för basen är genomsnittlig (10.5% delta till föregående frekvens)
Mellan 400 - 2000 Hz
(+) | balanserad mellan - endast 3.9% från medianen
(±) | linjäriteten för mids är genomsnittlig (7.3% delta till föregående frekvens)
Högsta 2 - 16 kHz
(+) | balanserade toppar - endast 3.4% från medianen
(±) | linjäriteten för toppar är genomsnittlig (8.8% delta till föregående frekvens)
Totalt 100 - 16 000 Hz
(±) | linjäriteten för det totala ljudet är genomsnittlig (18.8% skillnad mot median)
Jämfört med samma klass
» 35% av alla testade enheter i den här klassen var bättre, 7% liknande, 58% sämre
» Den bästa hade ett delta på 7%, genomsnittet var 21%, sämst var 53%
Jämfört med alla testade enheter
» 43% av alla testade enheter var bättre, 8% liknande, 49% sämre
» Den bästa hade ett delta på 4%, genomsnittet var 23%, sämst var 134%
Lenovo ThinkPad X1 Carbon 2018-20KGS03900 ljudanalys
(+) | högtalare kan spela relativt högt (83.6 dB)
Bas 100 - 315 Hz
(-) | nästan ingen bas - i genomsnitt 25.9% lägre än medianen
(±) | linjäriteten för basen är genomsnittlig (9.8% delta till föregående frekvens)
Mellan 400 - 2000 Hz
(+) | balanserad mellan - endast 3.8% från medianen
(±) | linjäriteten för mids är genomsnittlig (9% delta till föregående frekvens)
Högsta 2 - 16 kHz
(+) | balanserade toppar - endast 2.1% från medianen
(+) | toppar är linjära (4% delta till föregående frekvens)
Totalt 100 - 16 000 Hz
(±) | linjäriteten för det totala ljudet är genomsnittlig (18.7% skillnad mot median)
Jämfört med samma klass
» 35% av alla testade enheter i den här klassen var bättre, 6% liknande, 59% sämre
» Den bästa hade ett delta på 7%, genomsnittet var 21%, sämst var 53%
Jämfört med alla testade enheter
» 43% av alla testade enheter var bättre, 8% liknande, 49% sämre
» Den bästa hade ett delta på 4%, genomsnittet var 23%, sämst var 134%
| Av/Standby | |
| Låg belastning | |
| Hög belastning |
|
Förklaring:
min: | |
| Dell Latitude 7490 i5-8350U, UHD Graphics 620, Toshiba KSG60ZMV256G, IPS, 1920x1080, 14" | HP EliteBook 840 G5-3JX66EA i5-8250U, UHD Graphics 620, Toshiba XG5 KXG50ZNV256G, IPS, 1920x1080, 14" | Dell Latitude 7390 i7-8650U, UHD Graphics 620, Samsung PM961 MZVLW256HEHP, IPS, 1920x1080, 13.3" | Lenovo ThinkPad T480s-20L8S02D00 i5-8250U, UHD Graphics 620, Samsung SSD PM981 MZVLB512HAJQ, IPS, 2560x1440, 14" | Lenovo ThinkPad X1 Carbon 2018-20KGS03900 i5-8550U, UHD Graphics 620, Samsung SSD PM981 MZVLB512HAJQ, IPS, 2560x1440, 14" | Dell Latitude 7490 i7-8650U, UHD Graphics 620, Samsung PM961 MZVLW256HEHP, IPS, 1920x1080, 14" | |
|---|---|---|---|---|---|---|
| Power Consumption | -46% | -26% | -55% | -69% | -30% | |
| Idle Minimum * (Watt) | 2 | 3.2 -60% | 3.3 -65% | 3.1 -55% | 3.8 -90% | 3.1 -55% |
| Idle Average * (Watt) | 4.7 | 6.6 -40% | 5.9 -26% | 6.8 -45% | 8.9 -89% | 6.5 -38% |
| Idle Maximum * (Watt) | 5.7 | 9.5 -67% | 6.2 -9% | 10.1 -77% | 11.9 -109% | 7.6 -33% |
| Load Average * (Watt) | 38.4 | 36.2 6% | 43.2 -13% | 48.4 -26% | 47.5 -24% | 43 -12% |
| Load Maximum * (Watt) | 38.9 | 65.6 -69% | 45.2 -16% | 67.1 -72% | 52.5 -35% | 43.8 -13% |
* ... mindre är bättre
| Dell Latitude 7490 i5-8350U, UHD Graphics 620, 60 Wh | HP EliteBook 840 G5-3JX66EA i5-8250U, UHD Graphics 620, 50 Wh | Dell Latitude 7390 i7-8650U, UHD Graphics 620, 60 Wh | Lenovo ThinkPad T480s-20L8S02D00 i5-8250U, UHD Graphics 620, 57 Wh | Lenovo ThinkPad X1 Carbon 2018-20KGS03900 i5-8550U, UHD Graphics 620, 57 Wh | Dell Latitude 7490 i7-8650U, UHD Graphics 620, 60 Wh | |
|---|---|---|---|---|---|---|
| Batteridrifttid | ||||||
| WiFi v1.3 (h) | 9.1 | 7.5 -18% | 11.1 22% | 9 -1% | 8.7 -4% | 9.4 3% |
För
Emot
Läs den fullständiga versionen av den här recensionen på engelska här.
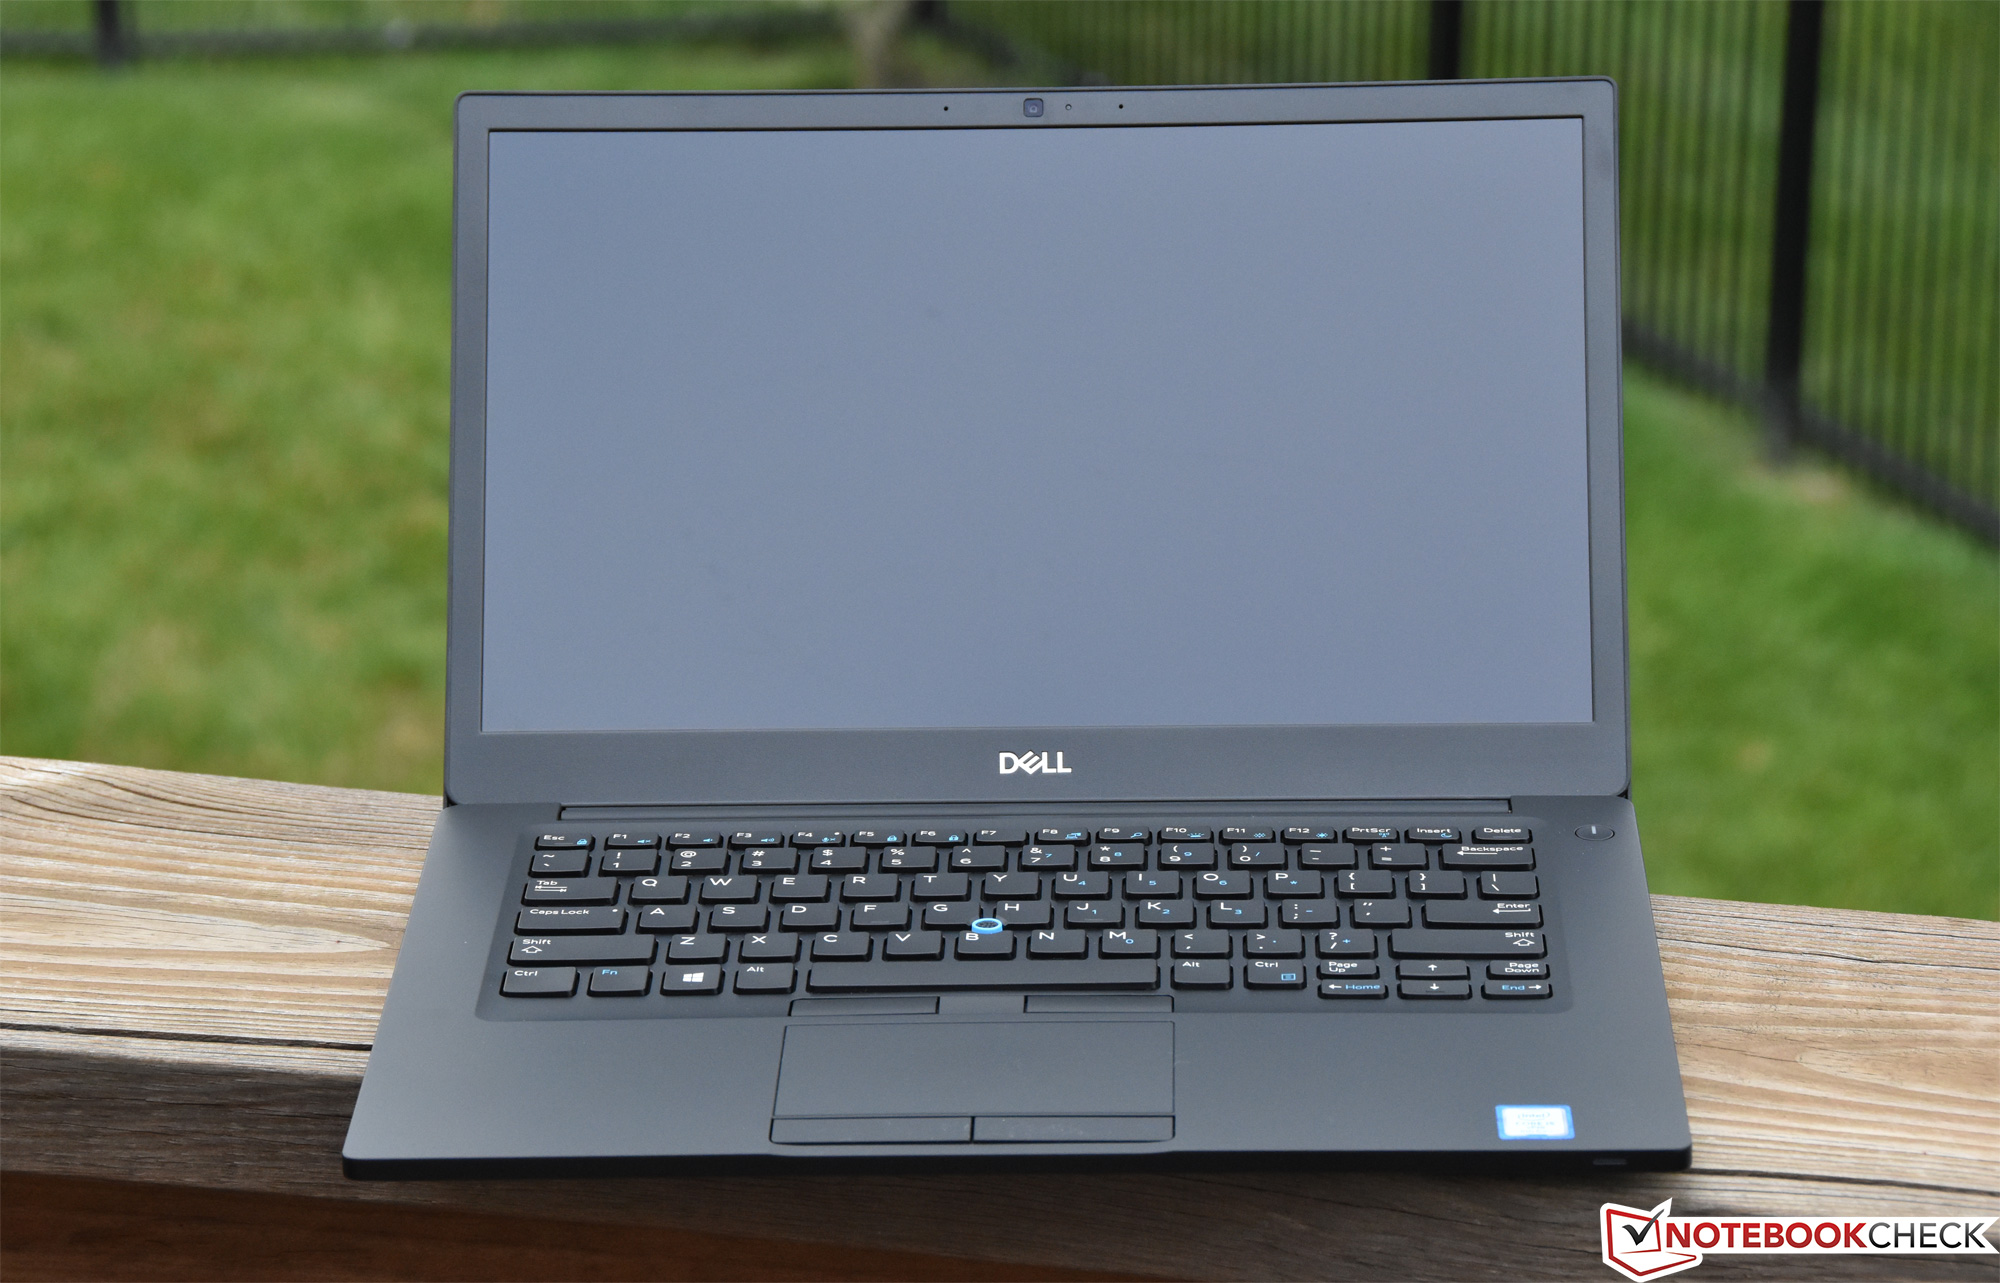
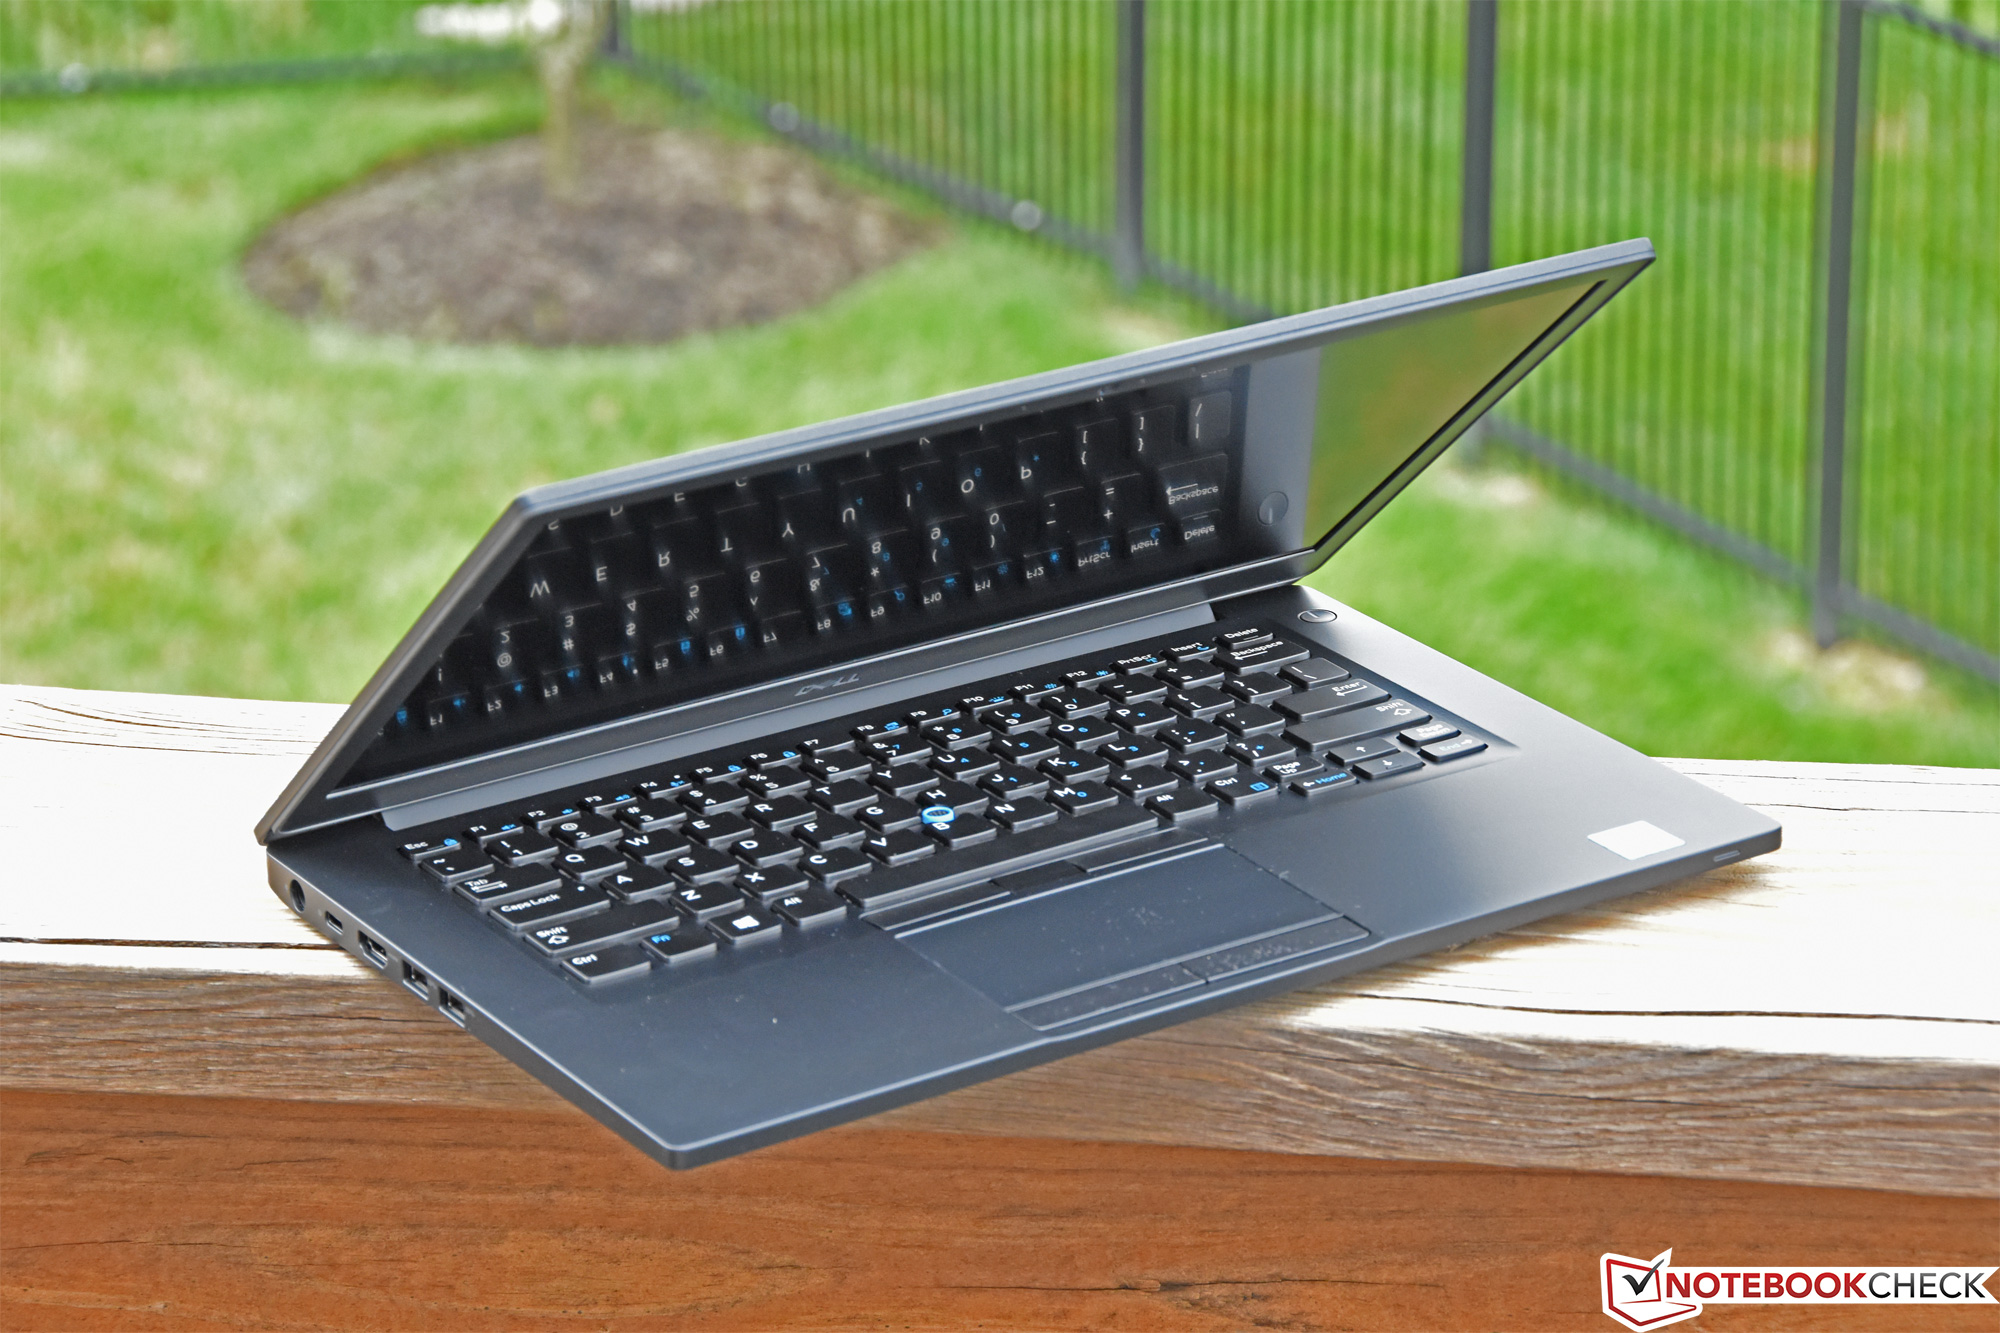
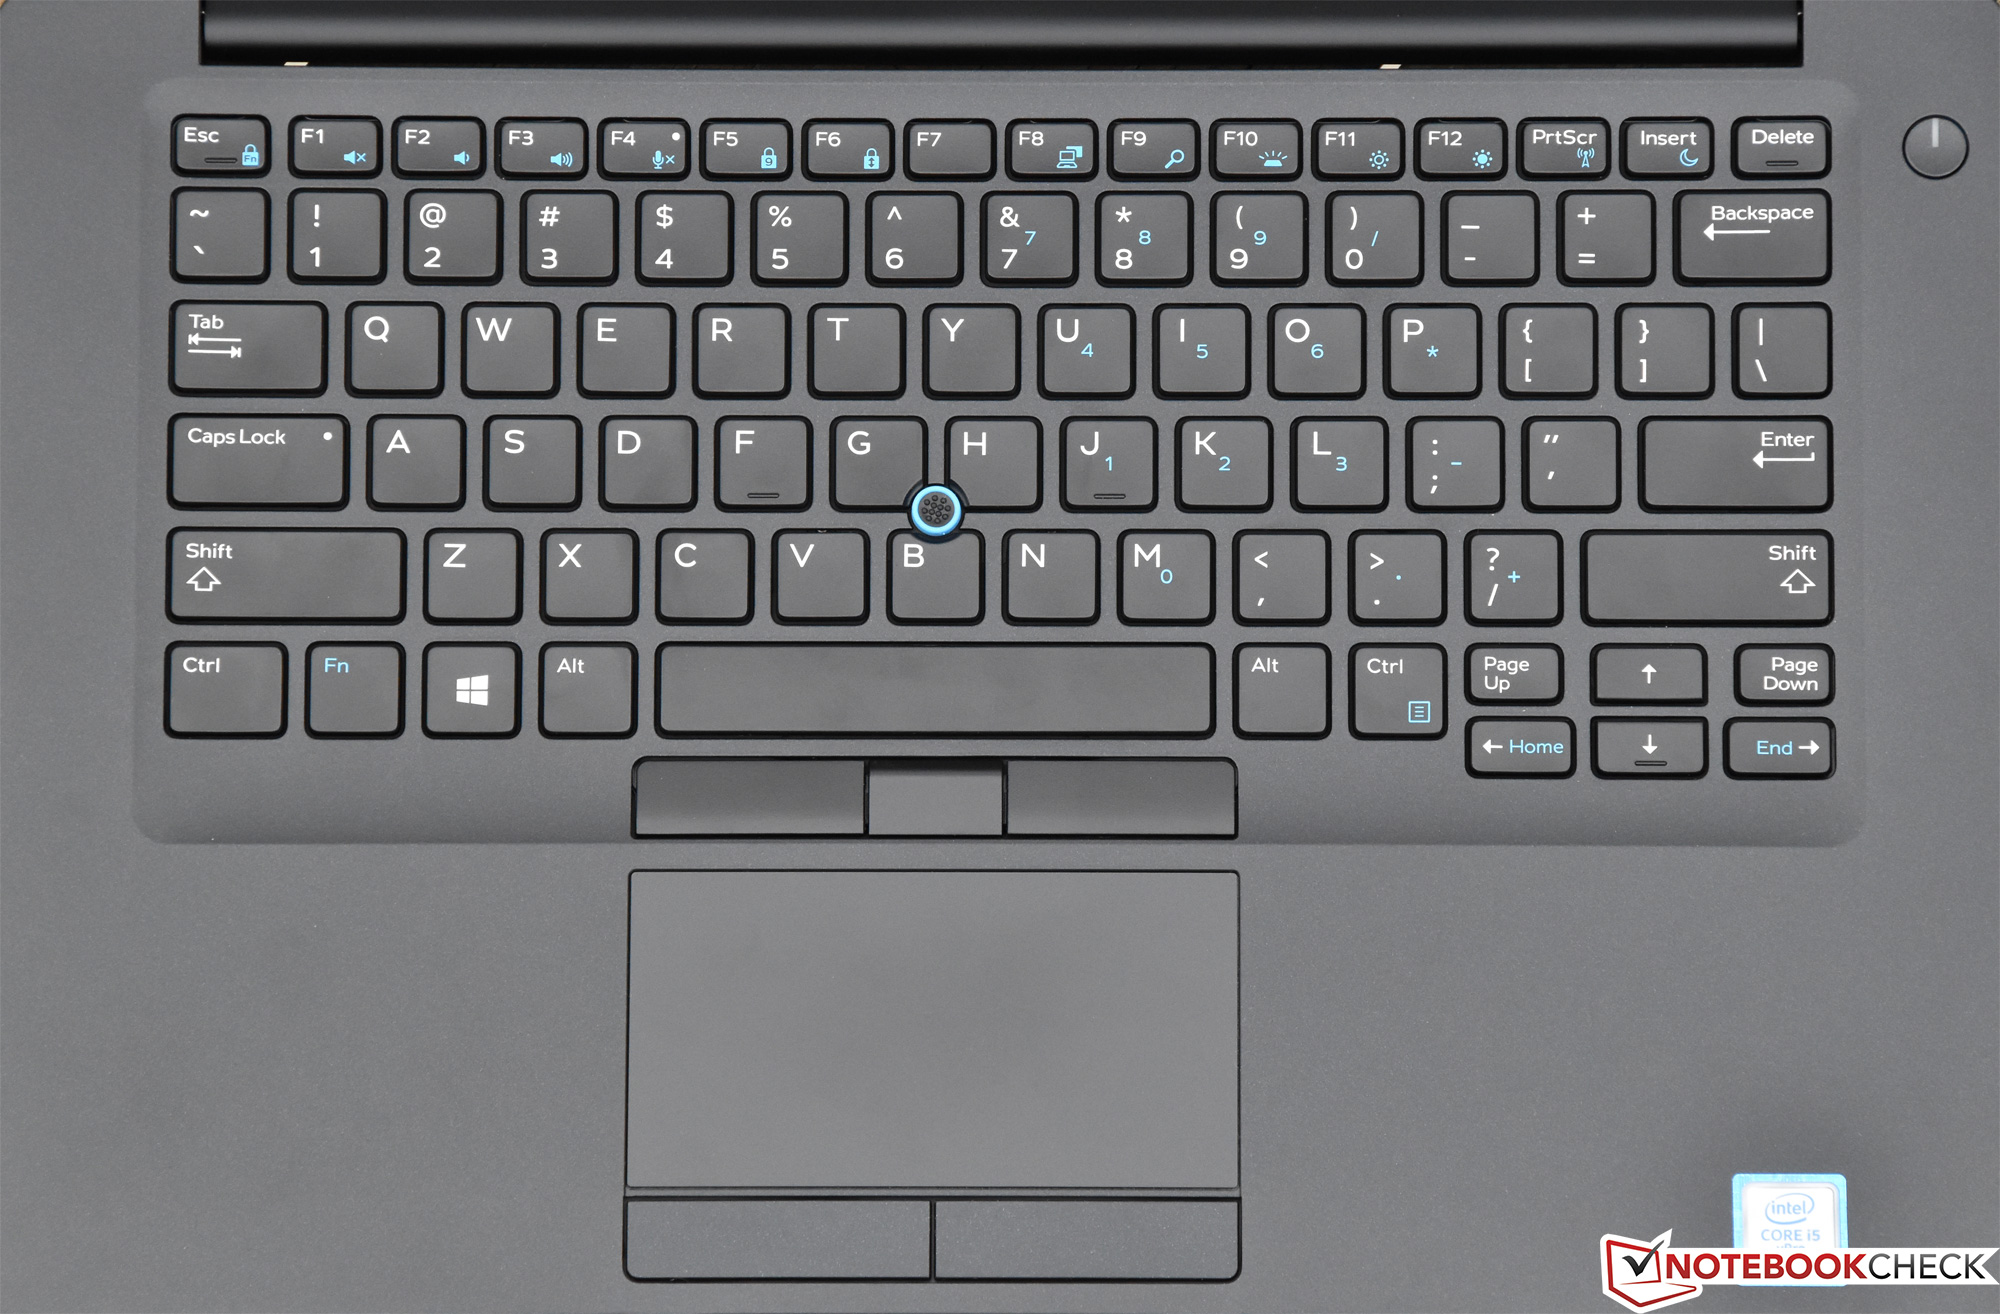
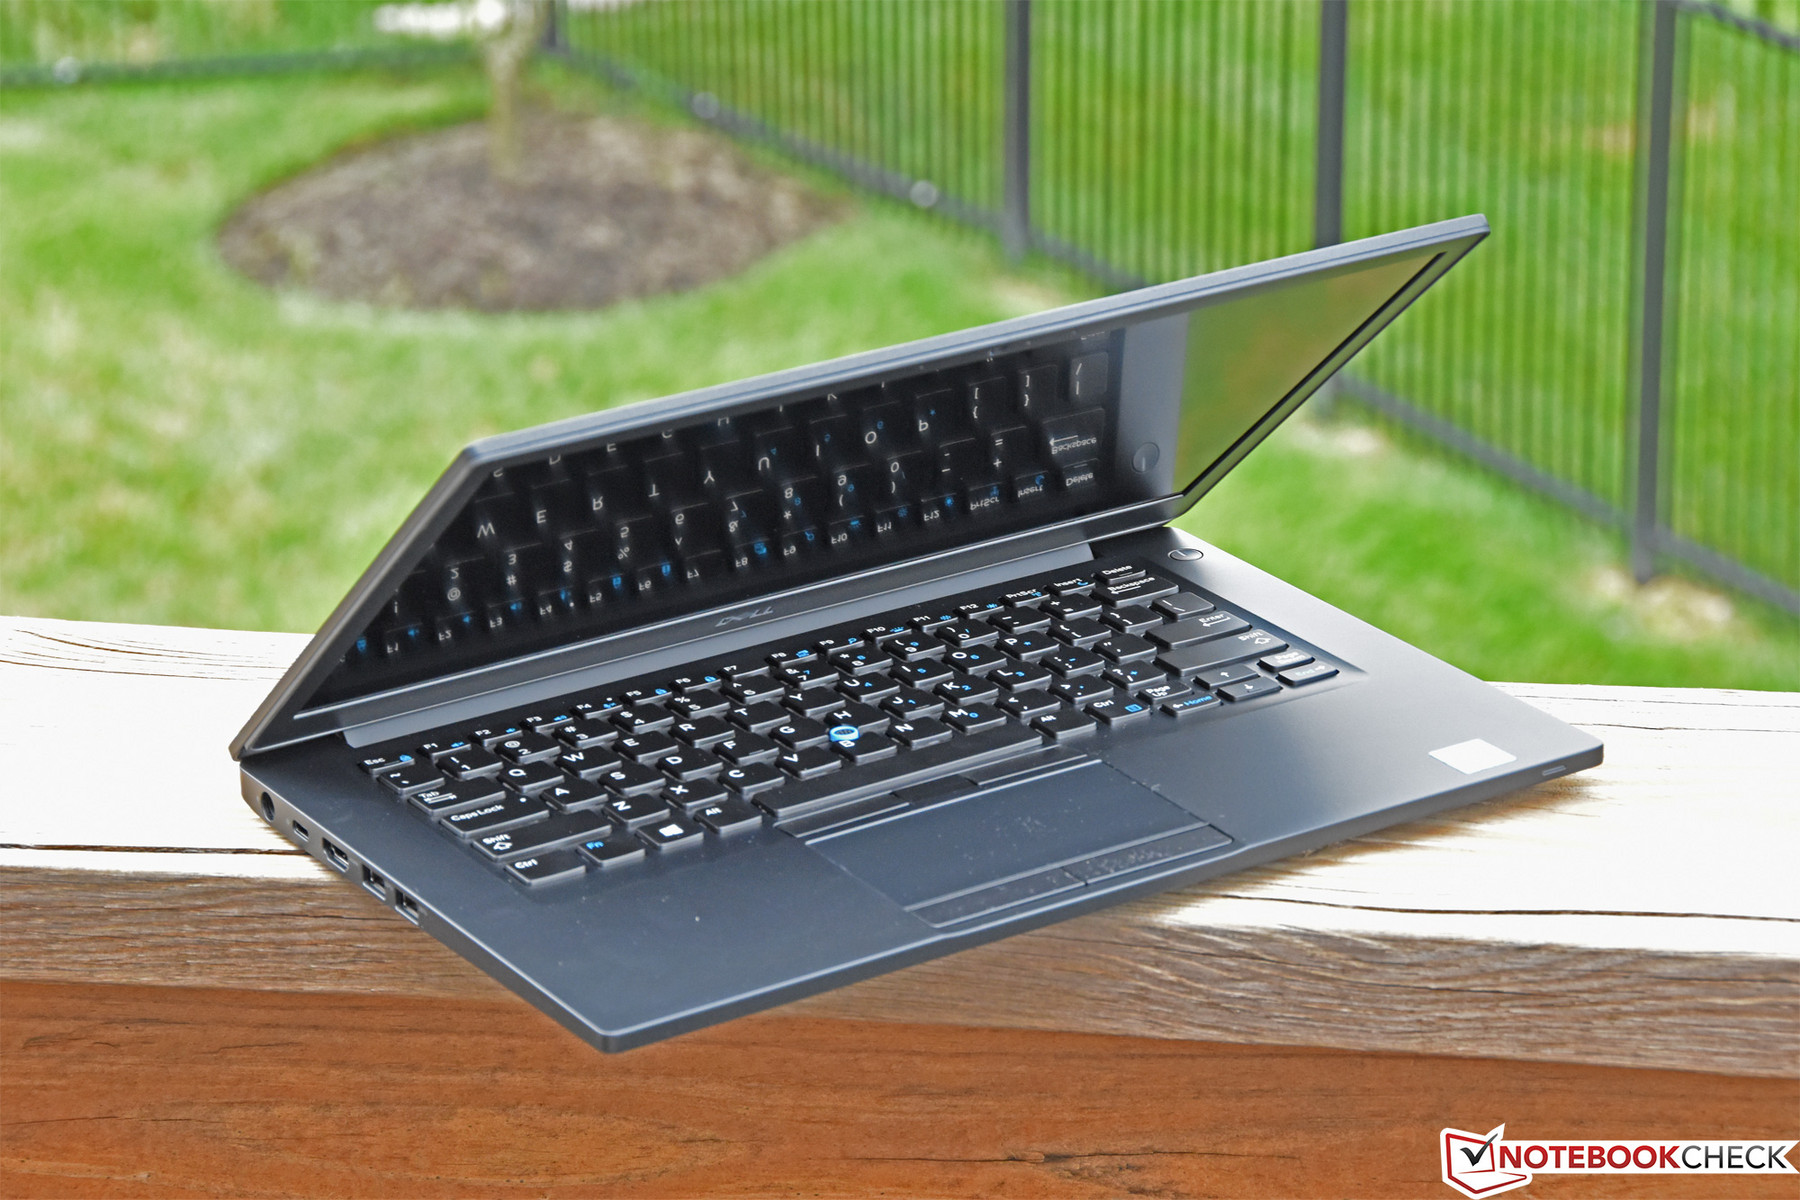
Återigen har vi blivit ordentligt imponerade av en maskin från Dells Latitude 7000-serie. Tillsammans med Lenovos ThinkPad-modeller och HP:s EliteBook-modeller står Latitude-modellerna långt över resten av konkurrensen i företagskategorin. Dom har en genomtänkt design, är smart uppdaterade och har setts över noggrant. Även om 7490 på alla sätt främst är en iterativ uppdatering till 7480 så lämnar den väldigt lite att önska. Höljet är robust, nedtonat och attraktivt, vikten är hanterbar, inmatningsenheterna är i toppklass, prestandan är riktigt bra, batteriet håller länge och den är en tyst kollega. Dom få områden där vi önskar en förbättring rör skärmalternativ som matchar konkurrenterna, förbättrad värmehantering och bättre högtalare.
Återigen har vi blivit ordentligt imponerade av en maskin från Dells Latitude 7000-serie. Dagens Latitude 7490 för 17.000 kronor förtjänar att övervägas av alla som letar efter en högkvalitativ företagslaptop.
Dagens billigare konfiguration saknar Core i7, NVMe-lagring, tryckkänslig skärm och en del av dom biometriska och säkerhetsmässiga funktioner som recensionsenheten från April hade - men den kostar också bara 17.000 kronor (jämfört med över 20.000 kronor för den tidigare modellen). Behöver man inte dualkanalsminne eller någon av dom tidigare nämnda sakerna så finns det väldigt lite att klaga på hos det här upplägget. CPU-prestandan ligger runt 10 och 15 procent under den i7-utrustade enheten och GPU-prestandan är runt 15 - 22 procent lägre (även om detta också beror på dualkanals-minnet vår i7-konfiguration hade). Således rekommenderar vi bara att uppgradera till en sådan SKU om CPU- och GPU-prestanda i toppklass är av yttersta vikt. Bredvid X1 Carbon, T480s, EliteBook 840 G5, och Latitude 7390, förtjänar 7490 definitivt att övervägas av alla som letar efter en högkvalitativ företagslaptop.
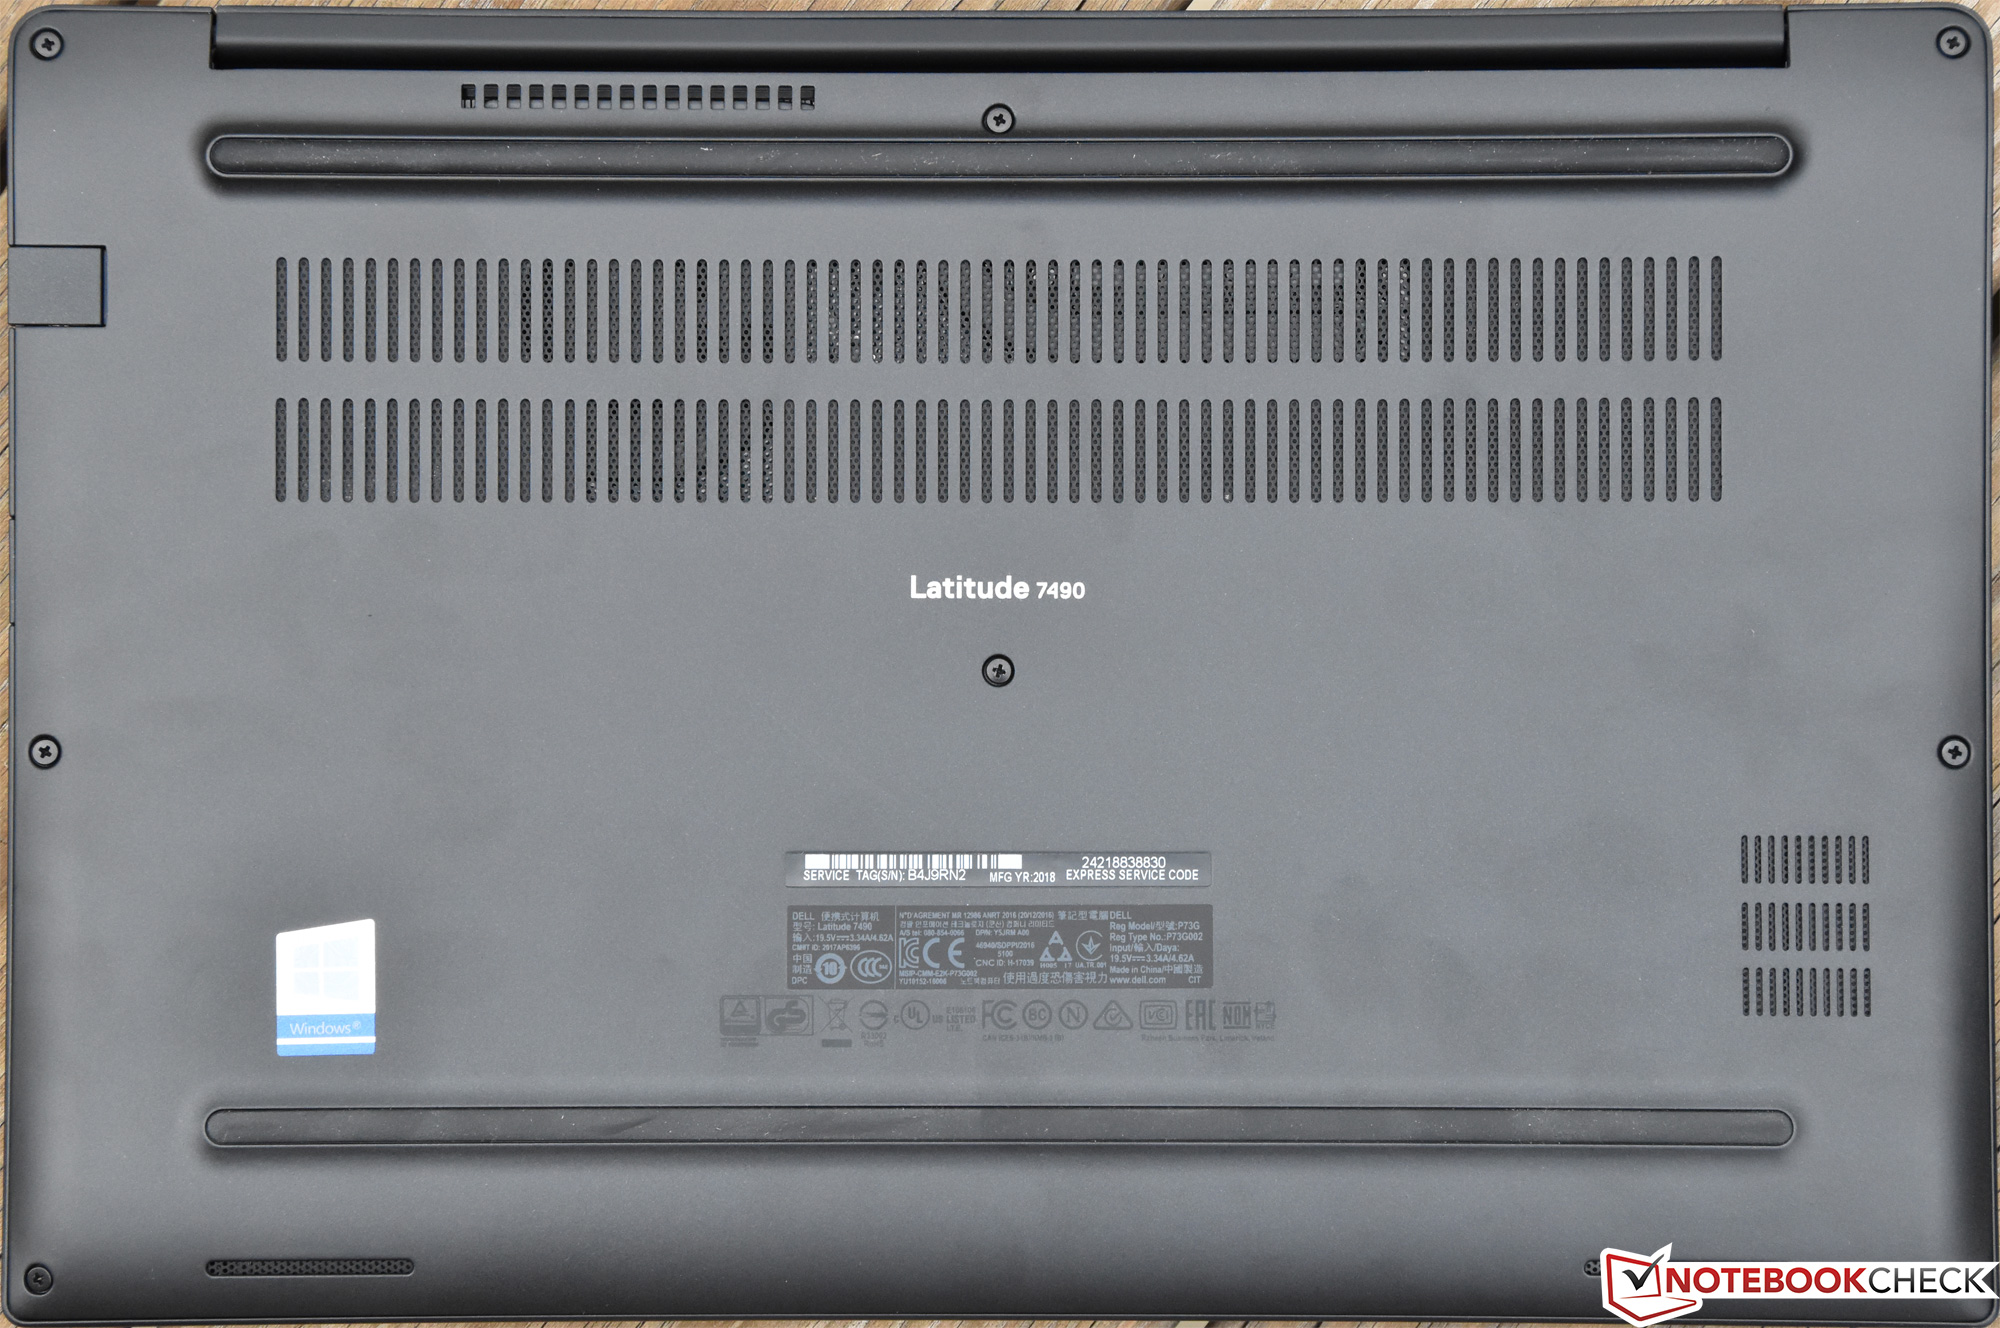
Dell Latitude 7490
- 06/21/2018 v6 (old)
Steve Schardein
Price comparison
