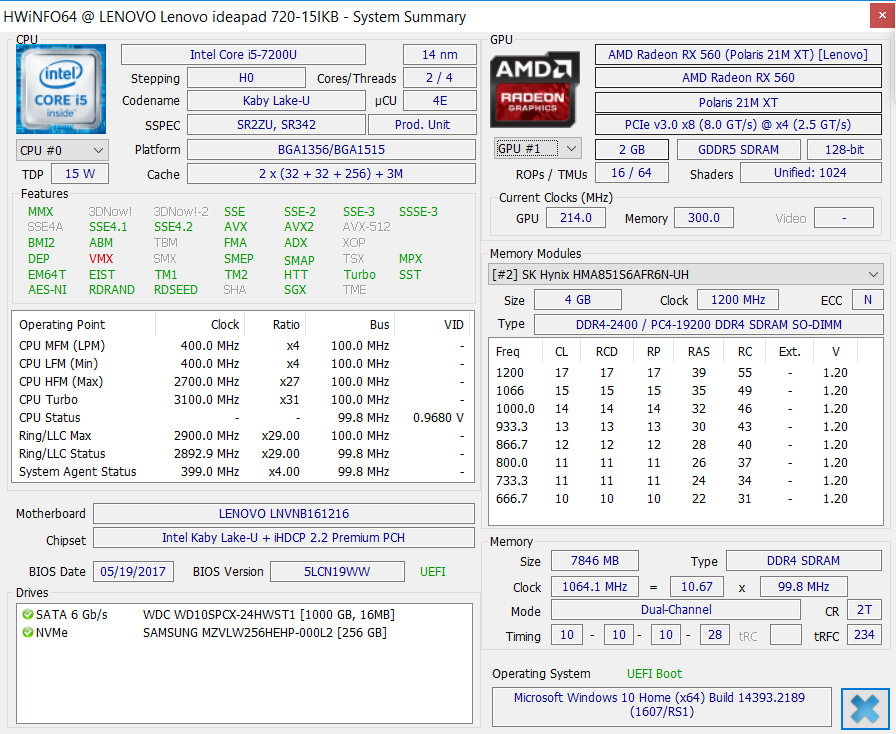
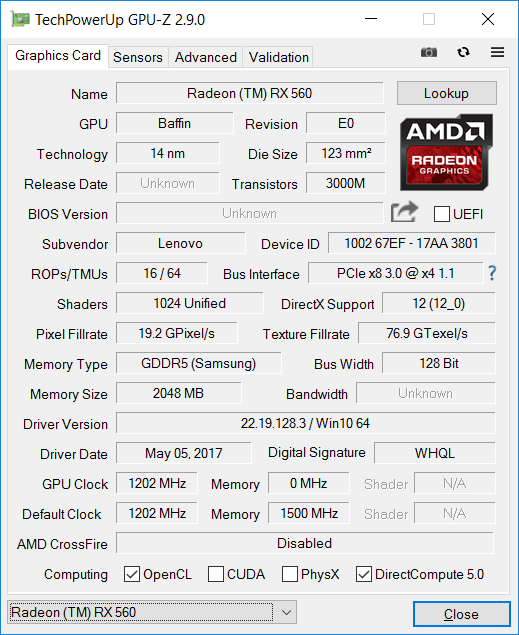
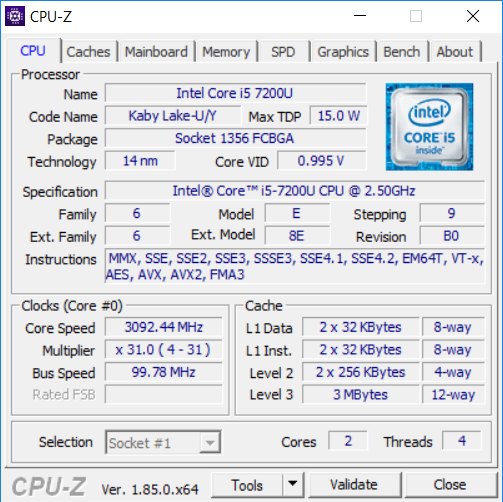
Test: Lenovo IdeaPad 720 (i5-7200U, RX 560) Laptop (Sammanfattning)

| SD Card Reader | |
| average JPG Copy Test (av. of 3 runs) | |
| Genomsnitt av klass Multimedia (23 - 531, n=37, senaste 2 åren) | |
| Lenovo IdeaPad 720-15IKB (Toshiba Exceria Pro SDXC 64 GB UHS-II) | |
| Acer Aspire 7 A715-71G-53TU (Toshiba Exceria Pro SDXC 64 GB UHS-II) | |
| HP Pavilion Power 15t-cb2000 (Toshiba Exceria Pro SDXC 64 GB UHS-II) | |
| Asus Zenbook UX430UN (Toshiba Exceria Pro SDXC 64 GB UHS-II) | |
| Acer Extensa 2540-580K (Toshiba Exceria Pro SDXC 64 GB UHS-II) | |
| Dell Vostro 15 3568 (Toshiba Exceria Pro SDXC 64 GB UHS-II) | |
| Xiaomi Mi Notebook Pro i5 | |
| maximum AS SSD Seq Read Test (1GB) | |
| Genomsnitt av klass Multimedia (37.3 - 1455, n=36, senaste 2 åren) | |
| HP Pavilion Power 15t-cb2000 (Toshiba Exceria Pro SDXC 64 GB UHS-II) | |
| Lenovo IdeaPad 720-15IKB (Toshiba Exceria Pro SDXC 64 GB UHS-II) | |
| Acer Aspire 7 A715-71G-53TU (Toshiba Exceria Pro SDXC 64 GB UHS-II) | |
| Asus Zenbook UX430UN (Toshiba Exceria Pro SDXC 64 GB UHS-II) | |
| Acer Extensa 2540-580K (Toshiba Exceria Pro SDXC 64 GB UHS-II) | |
| Dell Vostro 15 3568 (Toshiba Exceria Pro SDXC 64 GB UHS-II) | |
| Xiaomi Mi Notebook Pro i5 | |
| Networking | |
| iperf3 transmit AX12 | |
| Asus Zenbook UX3430UN-GV174T | |
| Acer Aspire 7 A715-71G-53TU | |
| Asus Zenbook UX430UN | |
| Xiaomi Mi Notebook Pro i5 | |
| HP Pavilion 15 Power 1GK62AV | |
| HP Pavilion Power 15t-cb2000 | |
| Lenovo IdeaPad 720-15IKB | |
| iperf3 receive AX12 | |
| Asus Zenbook UX430UN | |
| HP Pavilion 15 Power 1GK62AV | |
| Acer Aspire 7 A715-71G-53TU | |
| HP Pavilion Power 15t-cb2000 | |
| Xiaomi Mi Notebook Pro i5 | |
| Asus Zenbook UX3430UN-GV174T | |
| Lenovo IdeaPad 720-15IKB | |
| |||||||||||||||||||||||||
Distribution av ljusstyrkan: 87 %
Mitt på batteriet: 270 cd/m²
Kontrast: 1080:1 (Svärta: 0.25 cd/m²)
ΔE ColorChecker Calman: 4.79 | ∀{0.5-29.43 Ø4.71}
ΔE Greyscale Calman: 5.66 | ∀{0.09-98 Ø4.96}
59% sRGB (Argyll 1.6.3 3D)
37% AdobeRGB 1998 (Argyll 1.6.3 3D)
39.91% AdobeRGB 1998 (Argyll 3D)
58.1% sRGB (Argyll 3D)
38.62% Display P3 (Argyll 3D)
Gamma: 2.64
CCT: 7179 K
| Lenovo IdeaPad 720-15IKB LG Philips LGD0573 LP156WF9-SPK2, , 1920x1080, 15.6" | Xiaomi Mi Notebook Pro i5 BOE0747 NV156FHM-N61, , 1920x1080, 15.6" | Asus Zenbook UX3430UN-GV174T Chi Mei CMN14D2 / N140HCE-EN1, , 1920x1080, 14" | HP Pavilion 15 Power 1GK62AV ID: AU Optronics AUO41ED, , 1920x1080, 15.6" | Acer Aspire 7 A715-71G-53TU BOE NV156FHM-N42 , , 1920x1080, 15.6" | |
|---|---|---|---|---|---|
| Display | 60% | 69% | 0% | 4% | |
| Display P3 Coverage (%) | 38.62 | 66.5 72% | 65.6 70% | 38.81 0% | 40.53 5% |
| sRGB Coverage (%) | 58.1 | 86.9 50% | 97.4 68% | 57.9 0% | 59.9 3% |
| AdobeRGB 1998 Coverage (%) | 39.91 | 63.5 59% | 67.8 70% | 40.03 0% | 41.87 5% |
| Response Times | -22% | 17% | 0% | -28% | |
| Response Time Grey 50% / Grey 80% * (ms) | 42 ? | 47.9 ? -14% | 30 ? 29% | 38.8 ? 8% | 49 ? -17% |
| Response Time Black / White * (ms) | 26 ? | 33.7 ? -30% | 25 ? 4% | 28 ? -8% | 36 ? -38% |
| PWM Frequency (Hz) | 21800 ? | 20000 ? | |||
| Screen | 14% | 18% | -5% | 2% | |
| Brightness middle (cd/m²) | 270 | 296 10% | 377 40% | 256.6 -5% | 267 -1% |
| Brightness (cd/m²) | 250 | 288 15% | 339 36% | 243 -3% | 250 0% |
| Brightness Distribution (%) | 87 | 89 2% | 76 -13% | 81 -7% | 82 -6% |
| Black Level * (cd/m²) | 0.25 | 0.32 -28% | 0.4 -60% | 0.19 24% | 0.31 -24% |
| Contrast (:1) | 1080 | 925 -14% | 943 -13% | 1351 25% | 861 -20% |
| Colorchecker dE 2000 * | 4.79 | 4.3 10% | 3.33 30% | 5 -4% | 4.65 3% |
| Colorchecker dE 2000 max. * | 8.83 | 8.7 1% | 8.02 9% | 20.1 -128% | 8.2 7% |
| Greyscale dE 2000 * | 5.66 | 3 47% | 4.89 14% | 2.7 52% | 2.65 53% |
| Gamma | 2.64 83% | 2.1 105% | 2.37 93% | 2.32 95% | 2.44 90% |
| CCT | 7179 91% | 7100 92% | 7620 85% | 6599 98% | 6820 95% |
| Color Space (Percent of AdobeRGB 1998) (%) | 37 | 56.83 54% | 62 68% | 36.7 -1% | 38 3% |
| Color Space (Percent of sRGB) (%) | 59 | 86.86 47% | 98 66% | 57.7 -2% | 59 0% |
| Colorchecker dE 2000 calibrated * | 3.5 | ||||
| Totalt genomsnitt (program/inställningar) | 17% /
19% | 35% /
28% | -2% /
-3% | -7% /
-2% |
* ... mindre är bättre
Visa svarstider
| ↔ Svarstid svart till vitt | ||
|---|---|---|
| 26 ms ... stiga ↗ och falla ↘ kombinerat | ↗ 15 ms stiga | 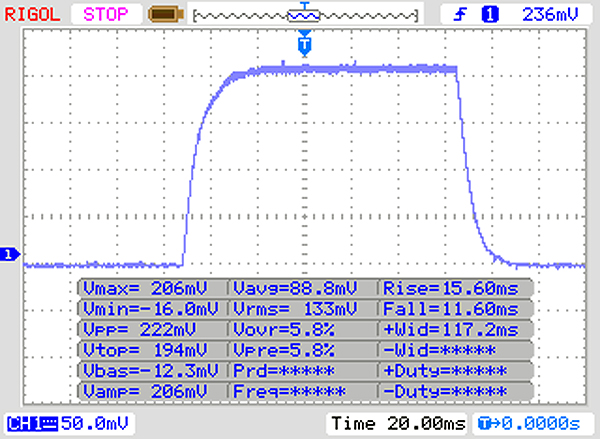 |
| ↘ 11 ms hösten | ||
| Skärmen visar relativt långsamma svarsfrekvenser i våra tester och kan vara för långsam för spelare. I jämförelse sträcker sig alla testade enheter från 0.1 (minst) till 240 (maximalt) ms. » 63 % av alla enheter är bättre. Detta innebär att den uppmätta svarstiden är sämre än genomsnittet av alla testade enheter (19.8 ms). | ||
| ↔ Svarstid 50 % grått till 80 % grått | ||
| 42 ms ... stiga ↗ och falla ↘ kombinerat | ↗ 22 ms stiga | 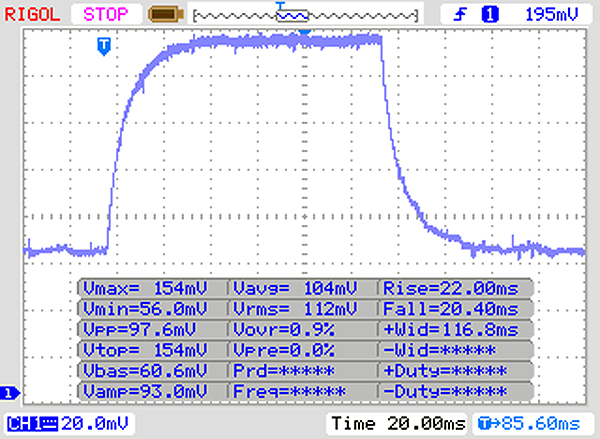 |
| ↘ 20 ms hösten | ||
| Skärmen visar långsamma svarsfrekvenser i våra tester och kommer att vara otillfredsställande för spelare. I jämförelse sträcker sig alla testade enheter från 0.165 (minst) till 636 (maximalt) ms. » 67 % av alla enheter är bättre. Detta innebär att den uppmätta svarstiden är sämre än genomsnittet av alla testade enheter (31 ms). | ||
Skärmflimmer / PWM (Puls-Width Modulation)
| Skärmflimmer / PWM upptäcktes inte | 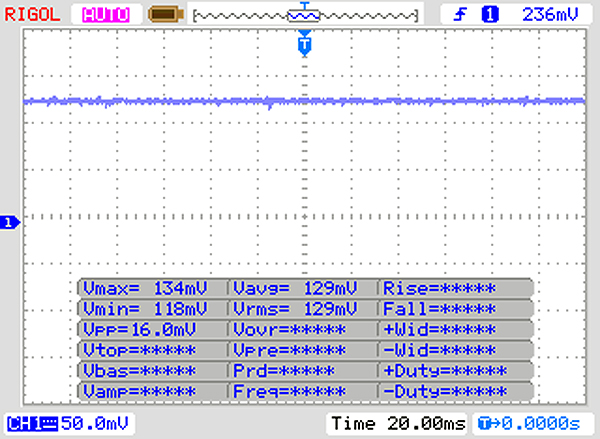 | ||
Som jämförelse: 52 % av alla testade enheter använder inte PWM för att dämpa skärmen. Om PWM upptäcktes mättes ett medelvärde av 7754 (minst: 5 - maximum: 343500) Hz. | |||
| PCMark 8 | |
| Home Score Accelerated v2 | |
| Genomsnitt av klass Multimedia (n=1senaste 2 åren) | |
| Lenovo IdeaPad 720-15IKB | |
| Genomsnitt Intel Core i5-7200U, AMD Radeon RX 560 (Laptop) (n=1) | |
| Acer Aspire 7 A715-71G-53TU | |
| HP Pavilion 15 Power 1GK62AV | |
| Xiaomi Mi Notebook Pro i5 | |
| Asus Zenbook UX3430UN-GV174T | |
| Work Score Accelerated v2 | |
| HP Pavilion 15 Power 1GK62AV | |
| Acer Aspire 7 A715-71G-53TU | |
| Lenovo IdeaPad 720-15IKB | |
| Genomsnitt Intel Core i5-7200U, AMD Radeon RX 560 (Laptop) (n=1) | |
| Xiaomi Mi Notebook Pro i5 | |
| Asus Zenbook UX3430UN-GV174T | |
| PCMark 8 Home Score Accelerated v2 | 4464 poäng | |
| PCMark 8 Creative Score Accelerated v2 | 5657 poäng | |
| PCMark 8 Work Score Accelerated v2 | 4882 poäng | |
Hjälp | ||
| Lenovo IdeaPad 720-15IKB Samsung PM961 MZVLW256HEHP | Asus Zenbook UX3430UN-GV174T SK Hynix HFS256G39TND-N210A | Xiaomi Mi Notebook Pro i5 Samsung PM961 MZVLW256HEHP | HP Pavilion 15 Power 1GK62AV SK Hynix HFS256G39TND-N210A | Genomsnitt Samsung PM961 MZVLW256HEHP | |
|---|---|---|---|---|---|
| CrystalDiskMark 3.0 | -51% | 17% | -60% | 5% | |
| Read Seq (MB/s) | 1713 | 480.3 -72% | 1260 -26% | 491.6 -71% | 1627 ? -5% |
| Write Seq (MB/s) | 1129 | 263.9 -77% | 1241 10% | 141.7 -87% | 1136 ? 1% |
| Read 512 (MB/s) | 926 | 266.9 -71% | 1039 12% | 345.6 -63% | 887 ? -4% |
| Write 512 (MB/s) | 721 | 263.2 -63% | 827 15% | 142.6 -80% | 781 ? 8% |
| Read 4k (MB/s) | 55.5 | 29.58 -47% | 60 8% | 18.83 -66% | 53 ? -5% |
| Write 4k (MB/s) | 124.5 | 68.4 -45% | 154 24% | 76.3 -39% | 126.7 ? 2% |
| Read 4k QD32 (MB/s) | 374.2 | 322.2 -14% | 526 41% | 348.5 -7% | 419 ? 12% |
| Write 4k QD32 (MB/s) | 290.4 | 243.3 -16% | 435 50% | 104.8 -64% | 384 ? 32% |

| 3DMark 11 - 1280x720 Performance GPU | |
| Genomsnitt av klass Multimedia (3749 - 60002, n=55, senaste 2 åren) | |
| Lenovo IdeaPad 720-15IKB | |
| Genomsnitt AMD Radeon RX 560 (Laptop) (8296 - 8345, n=3) | |
| Acer Aspire 7 A715-71G-53TU | |
| HP Pavilion 15 Power 1GK62AV | |
| HP Pavilion Power 15t-cb2000 | |
| Xiaomi Mi Notebook Pro i5 | |
| Asus Zenbook UX3430UN-GV174T | |
| Asus Zenbook UX430UN | |
| 3DMark | |
| 1280x720 Cloud Gate Standard Graphics | |
| Genomsnitt av klass Multimedia (16765 - 143501, n=32, senaste 2 åren) | |
| HP Pavilion 15 Power 1GK62AV | |
| Acer Aspire 7 A715-71G-53TU | |
| Lenovo IdeaPad 720-15IKB | |
| Genomsnitt AMD Radeon RX 560 (Laptop) (36424 - 36552, n=3) | |
| HP Pavilion Power 15t-cb2000 | |
| Asus Zenbook UX3430UN-GV174T | |
| Xiaomi Mi Notebook Pro i5 | |
| Asus Zenbook UX430UN | |
| 1920x1080 Fire Strike Graphics | |
| Genomsnitt av klass Multimedia (2328 - 48907, n=58, senaste 2 åren) | |
| Acer Aspire 7 A715-71G-53TU | |
| HP Pavilion 15 Power 1GK62AV | |
| Genomsnitt AMD Radeon RX 560 (Laptop) (5705 - 6258, n=3) | |
| Lenovo IdeaPad 720-15IKB | |
| HP Pavilion Power 15t-cb2000 | |
| Asus Zenbook UX3430UN-GV174T | |
| Xiaomi Mi Notebook Pro i5 | |
| Asus Zenbook UX430UN | |
| 3DMark 11 Performance | 6828 poäng | |
| 3DMark Cloud Gate Standard Score | 11994 poäng | |
| 3DMark Fire Strike Score | 4699 poäng | |
Hjälp | ||
| BioShock Infinite - 1920x1080 Ultra Preset, DX11 (DDOF) | |
| Dell XPS 15 2018 i5 FHD 97Wh | |
| HP Pavilion Power 15t-cb2000 | |
| Asus GL503VD-DB74 | |
| Acer Aspire 7 A715-71G-53TU | |
| HP Pavilion 15 Power 1GK62AV | |
| Asus FX504GD | |
| Lenovo IdeaPad 720-15IKB | |
| Genomsnitt AMD Radeon RX 560 (Laptop) (40.1 - 44.2, n=2) | |
| HP Envy 17-ae143ng | |
| MSI PL62 MX150 7300HQ | |
| Xiaomi Mi Notebook Air 13.3 2018 | |
| Asus Zenbook UX430UN | |
| Lenovo ThinkPad T480s-20L8S02E00 | |
| Dragon Age: Inquisition - 1920x1080 High Graphics Quality | |
| Lenovo IdeaPad 720-15IKB | |
| Genomsnitt AMD Radeon RX 560 (Laptop) (34.9 - 40.3, n=2) | |
| HP Envy 17-ae143ng | |
| The Witcher 3 - 1920x1080 High Graphics & Postprocessing (Nvidia HairWorks Off) | |
| Genomsnitt av klass Multimedia (22 - 224, n=7, senaste 2 åren) | |
| Gigabyte Aero 14-K8 | |
| Acer Predator Helios 300 PH317-52-51M6 | |
| Asus FX504GD | |
| HP Pavilion 15 Power 1GK62AV | |
| Dell XPS 15 2018 i5 FHD 97Wh | |
| Genomsnitt AMD Radeon RX 560 (Laptop) (34.1 - 35.2, n=2) | |
| Lenovo IdeaPad 720-15IKB | |
| Xiaomi Mi Notebook Pro i5 | |
| Lenovo ThinkPad T480s-20L8S02E00 | |
| Doom - 1366x768 Medium Preset | |
| HP Pavilion 15 Power 1GK62AV | |
| Lenovo IdeaPad 720-15IKB | |
| Genomsnitt AMD Radeon RX 560 (Laptop) (n=1) | |
| Lenovo ThinkPad T480s-20L8S02E00 | |
| HP Pavilion Power 15t-cb2000 | |
| Battlefield 1 - 1920x1080 High Preset AA:T | |
| Lenovo IdeaPad 720-15IKB | |
| Genomsnitt AMD Radeon RX 560 (Laptop) (n=1) | |
| Dirt 4 - 1920x1080 High Preset AA:2xMS AF:8x | |
| Dell XPS 15 2018 i5 FHD 97Wh | |
| Lenovo IdeaPad 720-15IKB | |
| Genomsnitt AMD Radeon RX 560 (Laptop) (n=1) | |
| Playerunknown's Battlegrounds (PUBG) - 1920x1080 High Preset | |
| Acer Predator Helios 300 PH317-52-51M6 | |
| Lenovo IdeaPad 720-15IKB | |
| Genomsnitt AMD Radeon RX 560 (Laptop) (n=1) | |
| Xiaomi Mi Notebook Pro i5 | |
| F1 2017 | |
| 1920x1080 High Preset AA:T AF:8x | |
| Dell XPS 15 2018 i5 FHD 97Wh | |
| Lenovo IdeaPad 720-15IKB | |
| Genomsnitt AMD Radeon RX 560 (Laptop) (n=1) | |
| 1920x1080 Ultra High Preset AA:T AF:16x | |
| Dell XPS 15 2018 i5 FHD 97Wh | |
| Lenovo IdeaPad 720-15IKB | |
| Genomsnitt AMD Radeon RX 560 (Laptop) (n=1) | |
| Destiny 2 - 1920x1080 Highest Preset AA:SM AF:16x | |
| Lenovo IdeaPad 720-15IKB | |
| Genomsnitt AMD Radeon RX 560 (Laptop) (n=1) | |
| Assassin´s Creed Origins - 1920x1080 Medium Preset | |
| Lenovo IdeaPad 720-15IKB | |
| Genomsnitt AMD Radeon RX 560 (Laptop) (n=1) | |
| Xiaomi Mi Notebook Air 13.3 2018 | |
| Need for Speed Payback - 1920x1080 Ultra Preset | |
| Gigabyte Aero 14-K8 | |
| Lenovo IdeaPad 720-15IKB | |
| Genomsnitt AMD Radeon RX 560 (Laptop) (n=1) | |
| Star Wars Battlefront 2 - 1920x1080 High Preset | |
| Gigabyte Aero 14-K8 | |
| Lenovo IdeaPad 720-15IKB | |
| Genomsnitt AMD Radeon RX 560 (Laptop) (n=1) | |
| Lenovo ThinkPad T480s-20L8S02E00 | |
| Final Fantasy XV Benchmark - 1920x1080 Standard Quality | |
| Genomsnitt av klass Multimedia (11.4 - 181.1, n=57, senaste 2 åren) | |
| Gigabyte Aero 14-K8 | |
| Dell XPS 15 2018 i5 FHD 97Wh | |
| Lenovo IdeaPad 720-15IKB | |
| Genomsnitt AMD Radeon RX 560 (Laptop) (n=1) | |
| Asus Zenbook UX430UN | |
| Kingdom Come: Deliverance - 1920x1080 Medium Preset | |
| Lenovo IdeaPad 720-15IKB | |
| Genomsnitt AMD Radeon RX 560 (Laptop) (n=1) | |
| Xiaomi Mi Notebook Air 13.3 2018 | |
| Far Cry 5 - 1920x1080 Medium Preset AA:T | |
| Genomsnitt av klass Multimedia (21 - 161, n=16, senaste 2 åren) | |
| Lenovo IdeaPad 720-15IKB | |
| Genomsnitt AMD Radeon RX 560 (Laptop) (n=1) | |
| Asus Zenbook UX3430UN-GV174T | |
| låg | med. | hög | ultra | 4K | |
|---|---|---|---|---|---|
| BioShock Infinite (2013) | 151.4 | 141 | 129.6 | 44.2 | |
| Dragon Age: Inquisition (2014) | 83.1 | 70 | 40.3 | 26.4 | |
| The Witcher 3 (2015) | 99.5 | 64.4 | 34.1 | 19.6 | |
| Rise of the Tomb Raider (2016) | 71.9 | 51.6 | 30.6 | 24.1 | |
| Doom (2016) | 38.7 | 60.9 | 22.2 | 15.4 | |
| Overwatch (2016) | 224.2 | 176.1 | 95.4 | 47.9 | |
| Battlefield 1 (2016) | 79 | 63.2 | 36.7 | 29.3 | |
| Rocket League (2017) | 196.3 | 96.8 | 69 | ||
| Dirt 4 (2017) | 176.5 | 83.6 | 49.8 | 28.6 | |
| Playerunknown's Battlegrounds (PUBG) (2017) | 108.2 | 49.4 | 45.4 | 12.5 | |
| F1 2017 (2017) | 100 | 66 | 47 | 24 | |
| FIFA 18 (2017) | 154.3 | 144.1 | 125.1 | 124.3 | |
| Destiny 2 (2017) | 106 små grafiska problem (no fullscreen-mode) | 47 små grafiska problem (no fullscreen-mode) | 44.1 | 36.2 | |
| Assassin´s Creed Origins (2017) | 36 | 23 | 19 | 9 | |
| Call of Duty WWII (2017) | 56 () | 39 () | 21 () | ||
| Need for Speed Payback (2017) | 59 | 49.7 | 41.4 | 36.3 | |
| Star Wars Battlefront 2 (2017) | 70.1 | 47 | 43 | 17 | |
| Fortnite (2018) | 151.3 | 87.4 | 63 | 50.2 | 35.9 |
| Final Fantasy XV Benchmark (2018) | 54.4 | 26.1 | 6.5 | ||
| Kingdom Come: Deliverance (2018) | 53.3 | 32.5 | 28.3 | 21.4 | |
| Far Cry 5 (2018) | 63 | 35 | 30 | 27 |
Ljudnivå
| Låg belastning |
| 30.3 / 30.3 / 30.3 dB(A) |
| Hög belastning |
| 39.2 / 39.2 dB(A) |
 | ||
30 dB tyst 40 dB(A) hörbar 50 dB(A) högt ljud |
||
min: | ||
(±) Den maximala temperaturen på ovansidan är 41.2 °C / 106 F, jämfört med genomsnittet av 36.8 °C / 98 F , allt från 21 till 71 °C för klassen Multimedia.
(+) Botten värms upp till maximalt 36.4 °C / 98 F, jämfört med genomsnittet av 39.1 °C / 102 F
(+) Vid tomgångsbruk är medeltemperaturen för ovansidan 21.5 °C / 71 F, jämfört med enhetsgenomsnittet på 31.3 °C / ### class_avg_f### F.
(±) När du spelar The Witcher 3 är medeltemperaturen för ovansidan 33 °C / 91 F, jämfört med enhetsgenomsnittet på 31.3 °C / ## #class_avg_f### F.
(+) Handledsstöden och pekplattan är kallare än hudtemperaturen med maximalt 27.3 °C / 81.1 F och är därför svala att ta på.
(±) Medeltemperaturen för handledsstödsområdet på liknande enheter var 28.7 °C / 83.7 F (+1.4 °C / 2.6 F).
Lenovo IdeaPad 720-15IKB ljudanalys
(-) | inte särskilt höga högtalare (68.7 dB)
Bas 100 - 315 Hz
(-) | nästan ingen bas - i genomsnitt 23% lägre än medianen
(±) | linjäriteten för basen är genomsnittlig (14.6% delta till föregående frekvens)
Mellan 400 - 2000 Hz
(+) | balanserad mellan - endast 4% från medianen
(+) | mids är linjära (6% delta till föregående frekvens)
Högsta 2 - 16 kHz
(+) | balanserade toppar - endast 3.9% från medianen
(±) | linjäriteten för toppar är genomsnittlig (8.5% delta till föregående frekvens)
Totalt 100 - 16 000 Hz
(±) | linjäriteten för det totala ljudet är genomsnittlig (23.3% skillnad mot median)
Jämfört med samma klass
» 83% av alla testade enheter i den här klassen var bättre, 5% liknande, 13% sämre
» Den bästa hade ett delta på 5%, genomsnittet var 17%, sämst var 45%
Jämfört med alla testade enheter
» 70% av alla testade enheter var bättre, 5% liknande, 25% sämre
» Den bästa hade ett delta på 4%, genomsnittet var 23%, sämst var 134%
Acer Aspire 7 A715-71G-53TU ljudanalys
(-) | inte särskilt höga högtalare (67.8 dB)
Bas 100 - 315 Hz
(-) | nästan ingen bas - i genomsnitt 15.4% lägre än medianen
(±) | linjäriteten för basen är genomsnittlig (12.6% delta till föregående frekvens)
Mellan 400 - 2000 Hz
(+) | balanserad mellan - endast 3.6% från medianen
(±) | linjäriteten för mids är genomsnittlig (8.5% delta till föregående frekvens)
Högsta 2 - 16 kHz
(+) | balanserade toppar - endast 3.9% från medianen
(±) | linjäriteten för toppar är genomsnittlig (7.9% delta till föregående frekvens)
Totalt 100 - 16 000 Hz
(±) | linjäriteten för det totala ljudet är genomsnittlig (19.7% skillnad mot median)
Jämfört med samma klass
» 65% av alla testade enheter i den här klassen var bättre, 6% liknande, 29% sämre
» Den bästa hade ett delta på 5%, genomsnittet var 17%, sämst var 45%
Jämfört med alla testade enheter
» 50% av alla testade enheter var bättre, 7% liknande, 43% sämre
» Den bästa hade ett delta på 4%, genomsnittet var 23%, sämst var 134%
HP Pavilion 15 Power 1GK62AV ljudanalys
(-) | inte särskilt höga högtalare (68.5 dB)
Bas 100 - 315 Hz
(-) | nästan ingen bas - i genomsnitt 17.7% lägre än medianen
(±) | linjäriteten för basen är genomsnittlig (13.4% delta till föregående frekvens)
Mellan 400 - 2000 Hz
(+) | balanserad mellan - endast 4.2% från medianen
(±) | linjäriteten för mids är genomsnittlig (8.8% delta till föregående frekvens)
Högsta 2 - 16 kHz
(+) | balanserade toppar - endast 3.5% från medianen
(±) | linjäriteten för toppar är genomsnittlig (11.6% delta till föregående frekvens)
Totalt 100 - 16 000 Hz
(±) | linjäriteten för det totala ljudet är genomsnittlig (26.8% skillnad mot median)
Jämfört med samma klass
» 92% av alla testade enheter i den här klassen var bättre, 2% liknande, 6% sämre
» Den bästa hade ett delta på 5%, genomsnittet var 17%, sämst var 45%
Jämfört med alla testade enheter
» 82% av alla testade enheter var bättre, 4% liknande, 14% sämre
» Den bästa hade ett delta på 4%, genomsnittet var 23%, sämst var 134%
| Av/Standby | |
| Låg belastning | |
| Hög belastning |
|
Förklaring:
min: | |
| Lenovo IdeaPad 720-15IKB i5-7200U, Radeon RX 560 (Laptop), Samsung PM961 MZVLW256HEHP, IPS, 1920x1080, 15.6" | Xiaomi Mi Notebook Pro i5 i5-8250U, GeForce MX150, Samsung PM961 MZVLW256HEHP, IPS LED, 1920x1080, 15.6" | Asus Zenbook UX3430UN-GV174T i5-8250U, GeForce MX150, SK Hynix HFS256G39TND-N210A, IPS, 1920x1080, 14" | HP Pavilion 15 Power 1GK62AV i7-7700HQ, GeForce GTX 1050 Mobile, SK Hynix HFS256G39TND-N210A, IPS, 1920x1080, 15.6" | Acer Aspire 7 A715-71G-53TU i5-7300HQ, GeForce GTX 1050 Mobile, Kingston RBUSNS8180DS3128GH, a-Si TFT-LCD, IPS, 1920x1080, 15.6" | HP Pavilion Power 15t-cb2000 i7-7700HQ, Radeon RX 550 (Laptop), HGST Travelstar 7K1000 HTS721010A9E630, IPS, 1920x1080, 15.6" | Asus Zenbook UX430UN i5-8550U, GeForce MX150, SanDisk SD8SN8U512G1002, IPS, 1920x1080, 14" | MSI PL62 MX150 7300HQ i5-7300HQ, GeForce MX150, , TN LED, 1920x1080, 15.6" | HP Envy 17-ae143ng i5-8250U, GeForce MX150, Liteonit CV3-8D128, IPS, 1920x1080, 17.3" | Genomsnitt AMD Radeon RX 560 (Laptop) | Genomsnitt av klass Multimedia | |
|---|---|---|---|---|---|---|---|---|---|---|---|
| Power Consumption | 34% | 29% | -17% | 8% | -47% | 41% | -16% | 14% | 5% | -3% | |
| Idle Minimum * (Watt) | 9.9 | 3.7 63% | 4.5 55% | 9.4 5% | 4 60% | 18.7 -89% | 3 70% | 9.2 7% | 4.8 52% | 7.3 ? 26% | 5.66 ? 43% |
| Idle Average * (Watt) | 9.5 | 7.5 21% | 7.8 18% | 9.7 -2% | 6.9 27% | 19.6 -106% | 5.8 39% | 13.6 -43% | 8.3 13% | 8.65 ? 9% | 10.2 ? -7% |
| Idle Maximum * (Watt) | 10.7 | 8 25% | 8.1 24% | 16.8 -57% | 9.4 12% | 21.7 -103% | 6.2 42% | 14.7 -37% | 10.3 4% | 9.55 ? 11% | 12.5 ? -17% |
| Load Average * (Watt) | 62 | 49 21% | 52 16% | 76.5 -23% | 72.6 -17% | 60.1 3% | 54.1 13% | 64 -3% | 61 2% | 69.3 ? -12% | 65.2 ? -5% |
| Witcher 3 ultra * (Watt) | 84 | 50.6 40% | 86.5 -3% | 80.5 4% | 45.9 45% | ||||||
| Load Maximum * (Watt) | 86.7 | 55.2 36% | 59 32% | 105.6 -22% | 122 -41% | 80.6 7% | 56.4 35% | 89.2 -3% | 86 1% | 96.4 ? -11% | 113.5 ? -31% |
* ... mindre är bättre
| Lenovo IdeaPad 720-15IKB i5-7200U, Radeon RX 560 (Laptop), 40 Wh | Asus Zenbook UX3430UN-GV174T i5-8250U, GeForce MX150, 48 Wh | Xiaomi Mi Notebook Pro i5 i5-8250U, GeForce MX150, 60 Wh | HP Pavilion 15 Power 1GK62AV i7-7700HQ, GeForce GTX 1050 Mobile, 70 Wh | Acer Aspire 7 A715-71G-53TU i5-7300HQ, GeForce GTX 1050 Mobile, 48 Wh | Genomsnitt av klass Multimedia | |
|---|---|---|---|---|---|---|
| Batteridrifttid | 43% | 68% | 46% | -1% | 80% | |
| Reader / Idle (h) | 16.1 | 22.8 42% | 16.2 1% | 9.9 -39% | 24.9 ? 55% | |
| H.264 (h) | 9.2 | 8.4 -9% | 10.5 14% | 5.1 -45% | 17.1 ? 86% | |
| WiFi v1.3 (h) | 7.1 | 8.1 14% | 10 41% | 8 13% | 5.6 -21% | 12.2 ? 72% |
| Load (h) | 0.8 | 1.8 125% | 2 150% | 1.8 125% | 1.6 100% | 1.664 ? 108% |
| Witcher 3 ultra (h) | 1.4 |
För
Emot
Läs den fullständiga versionen av den här recensionen på engelska här.
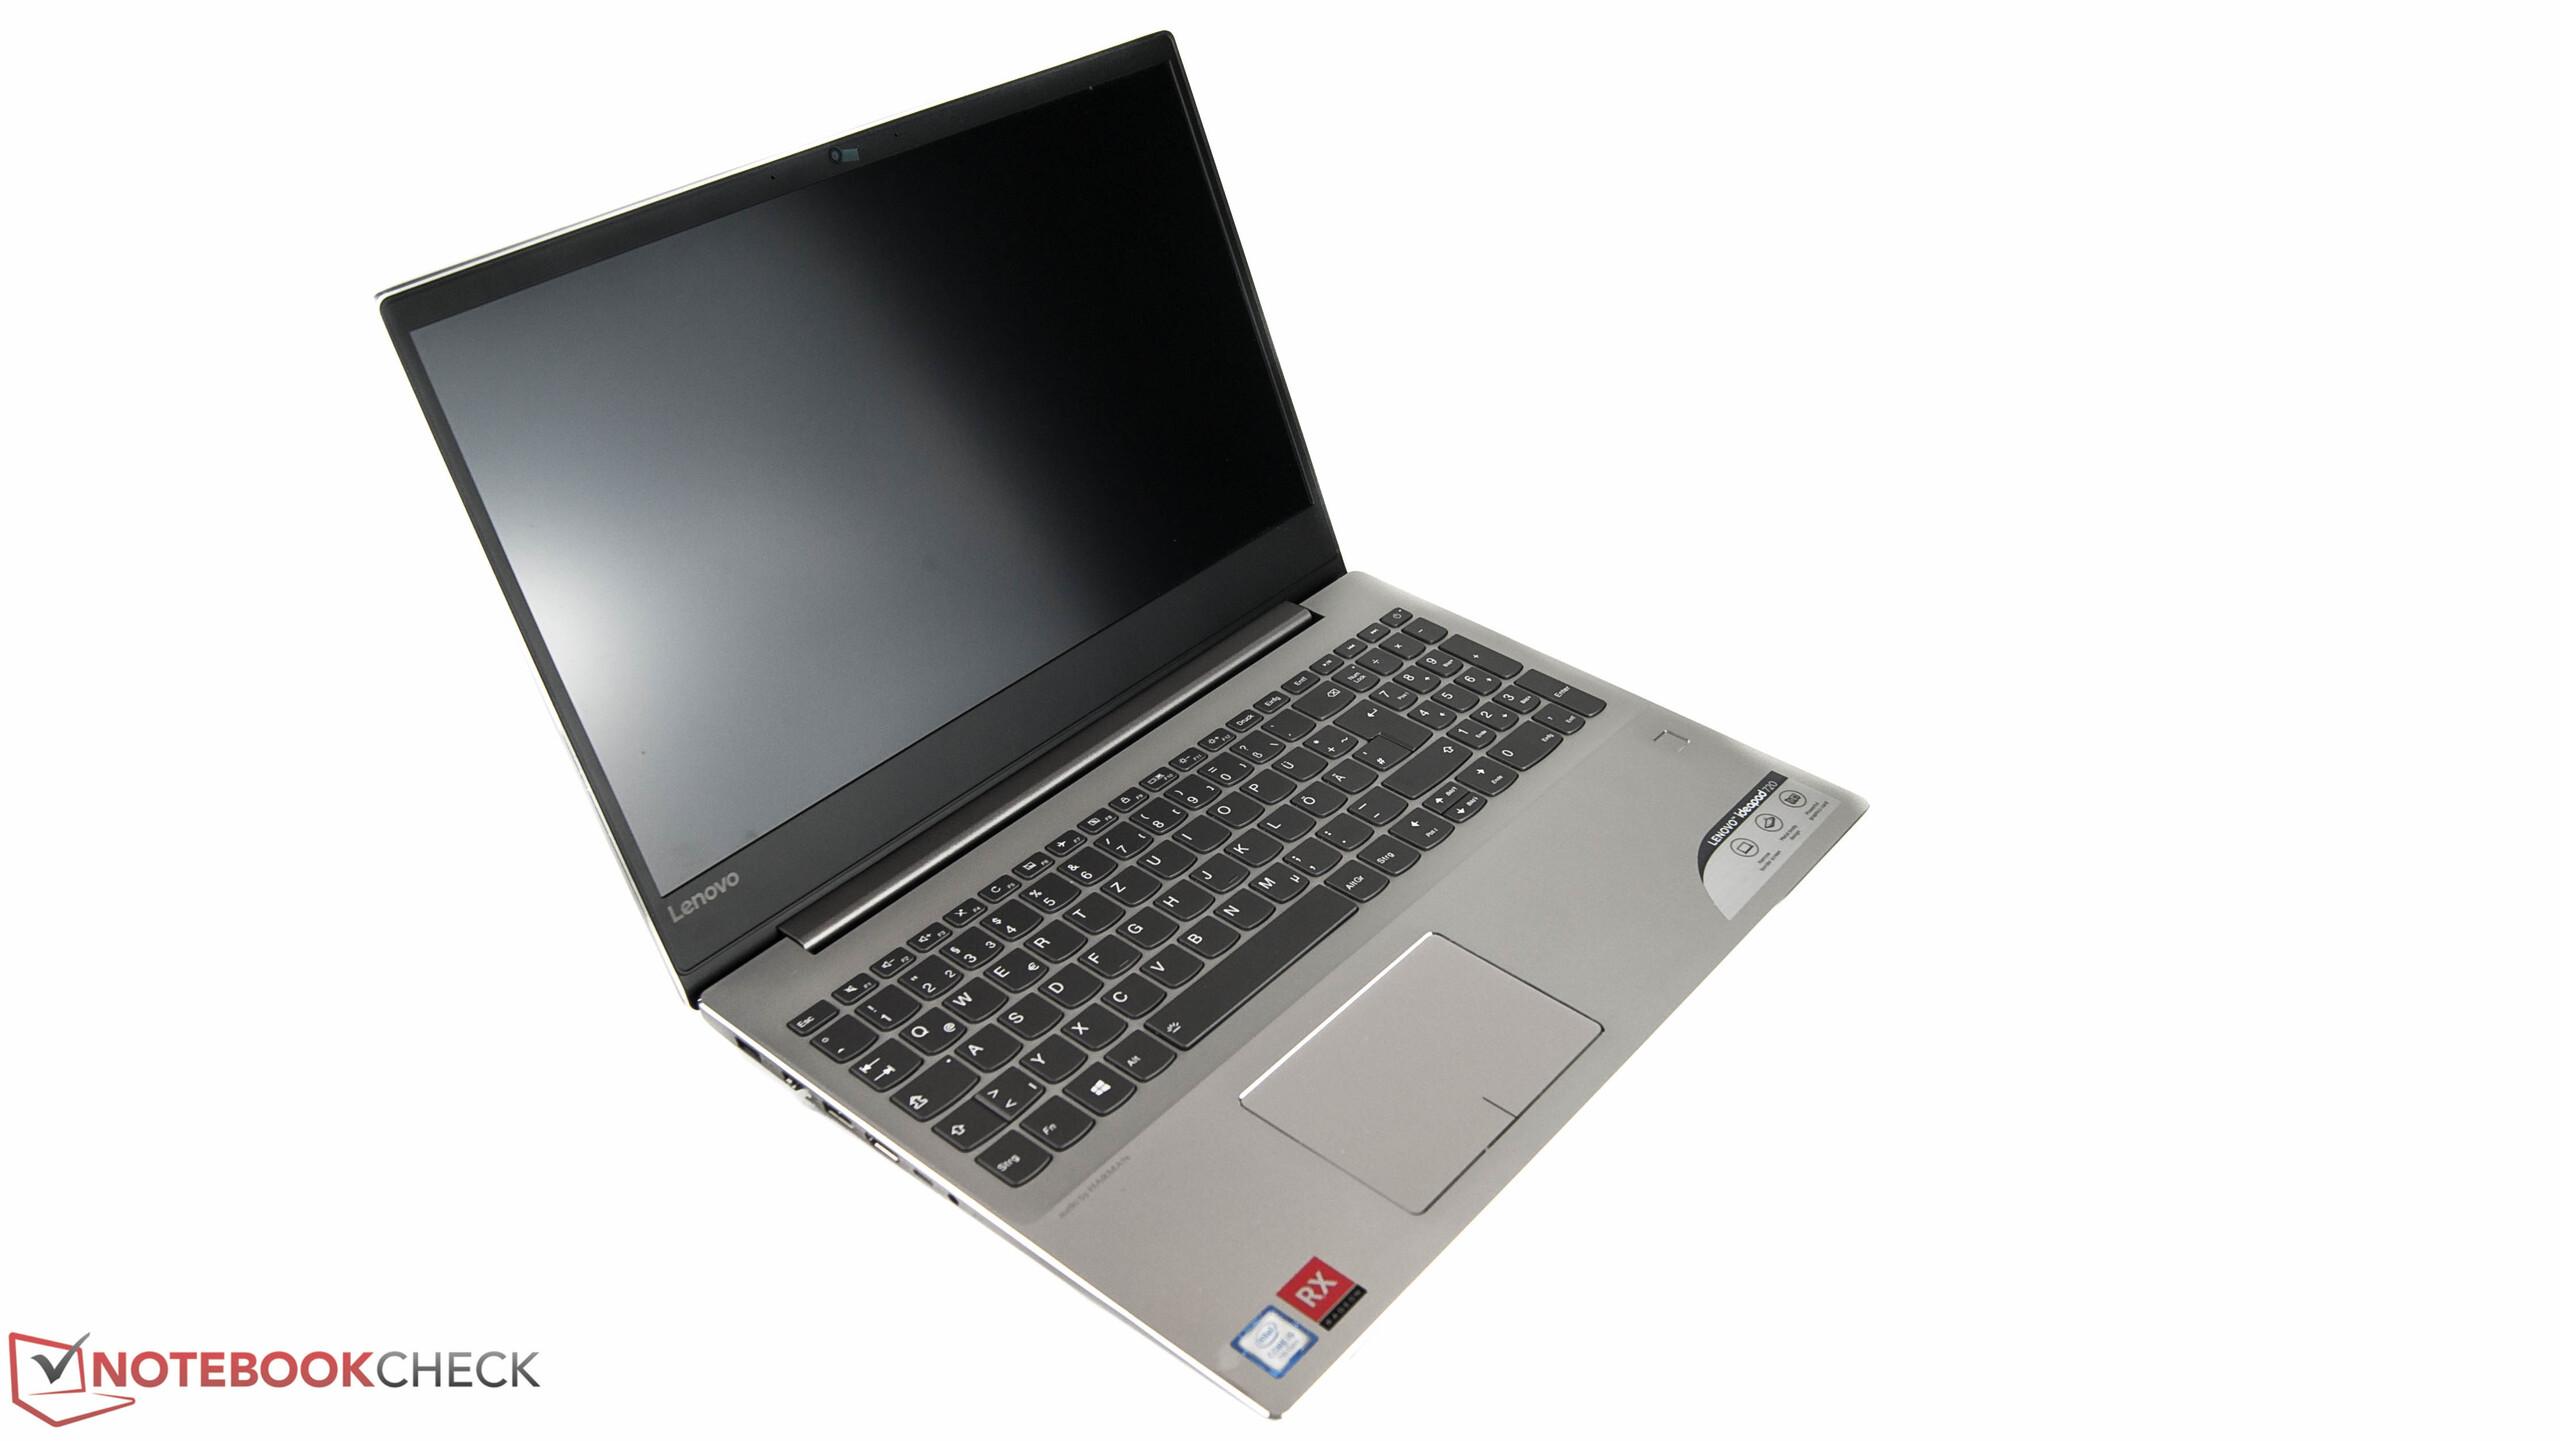
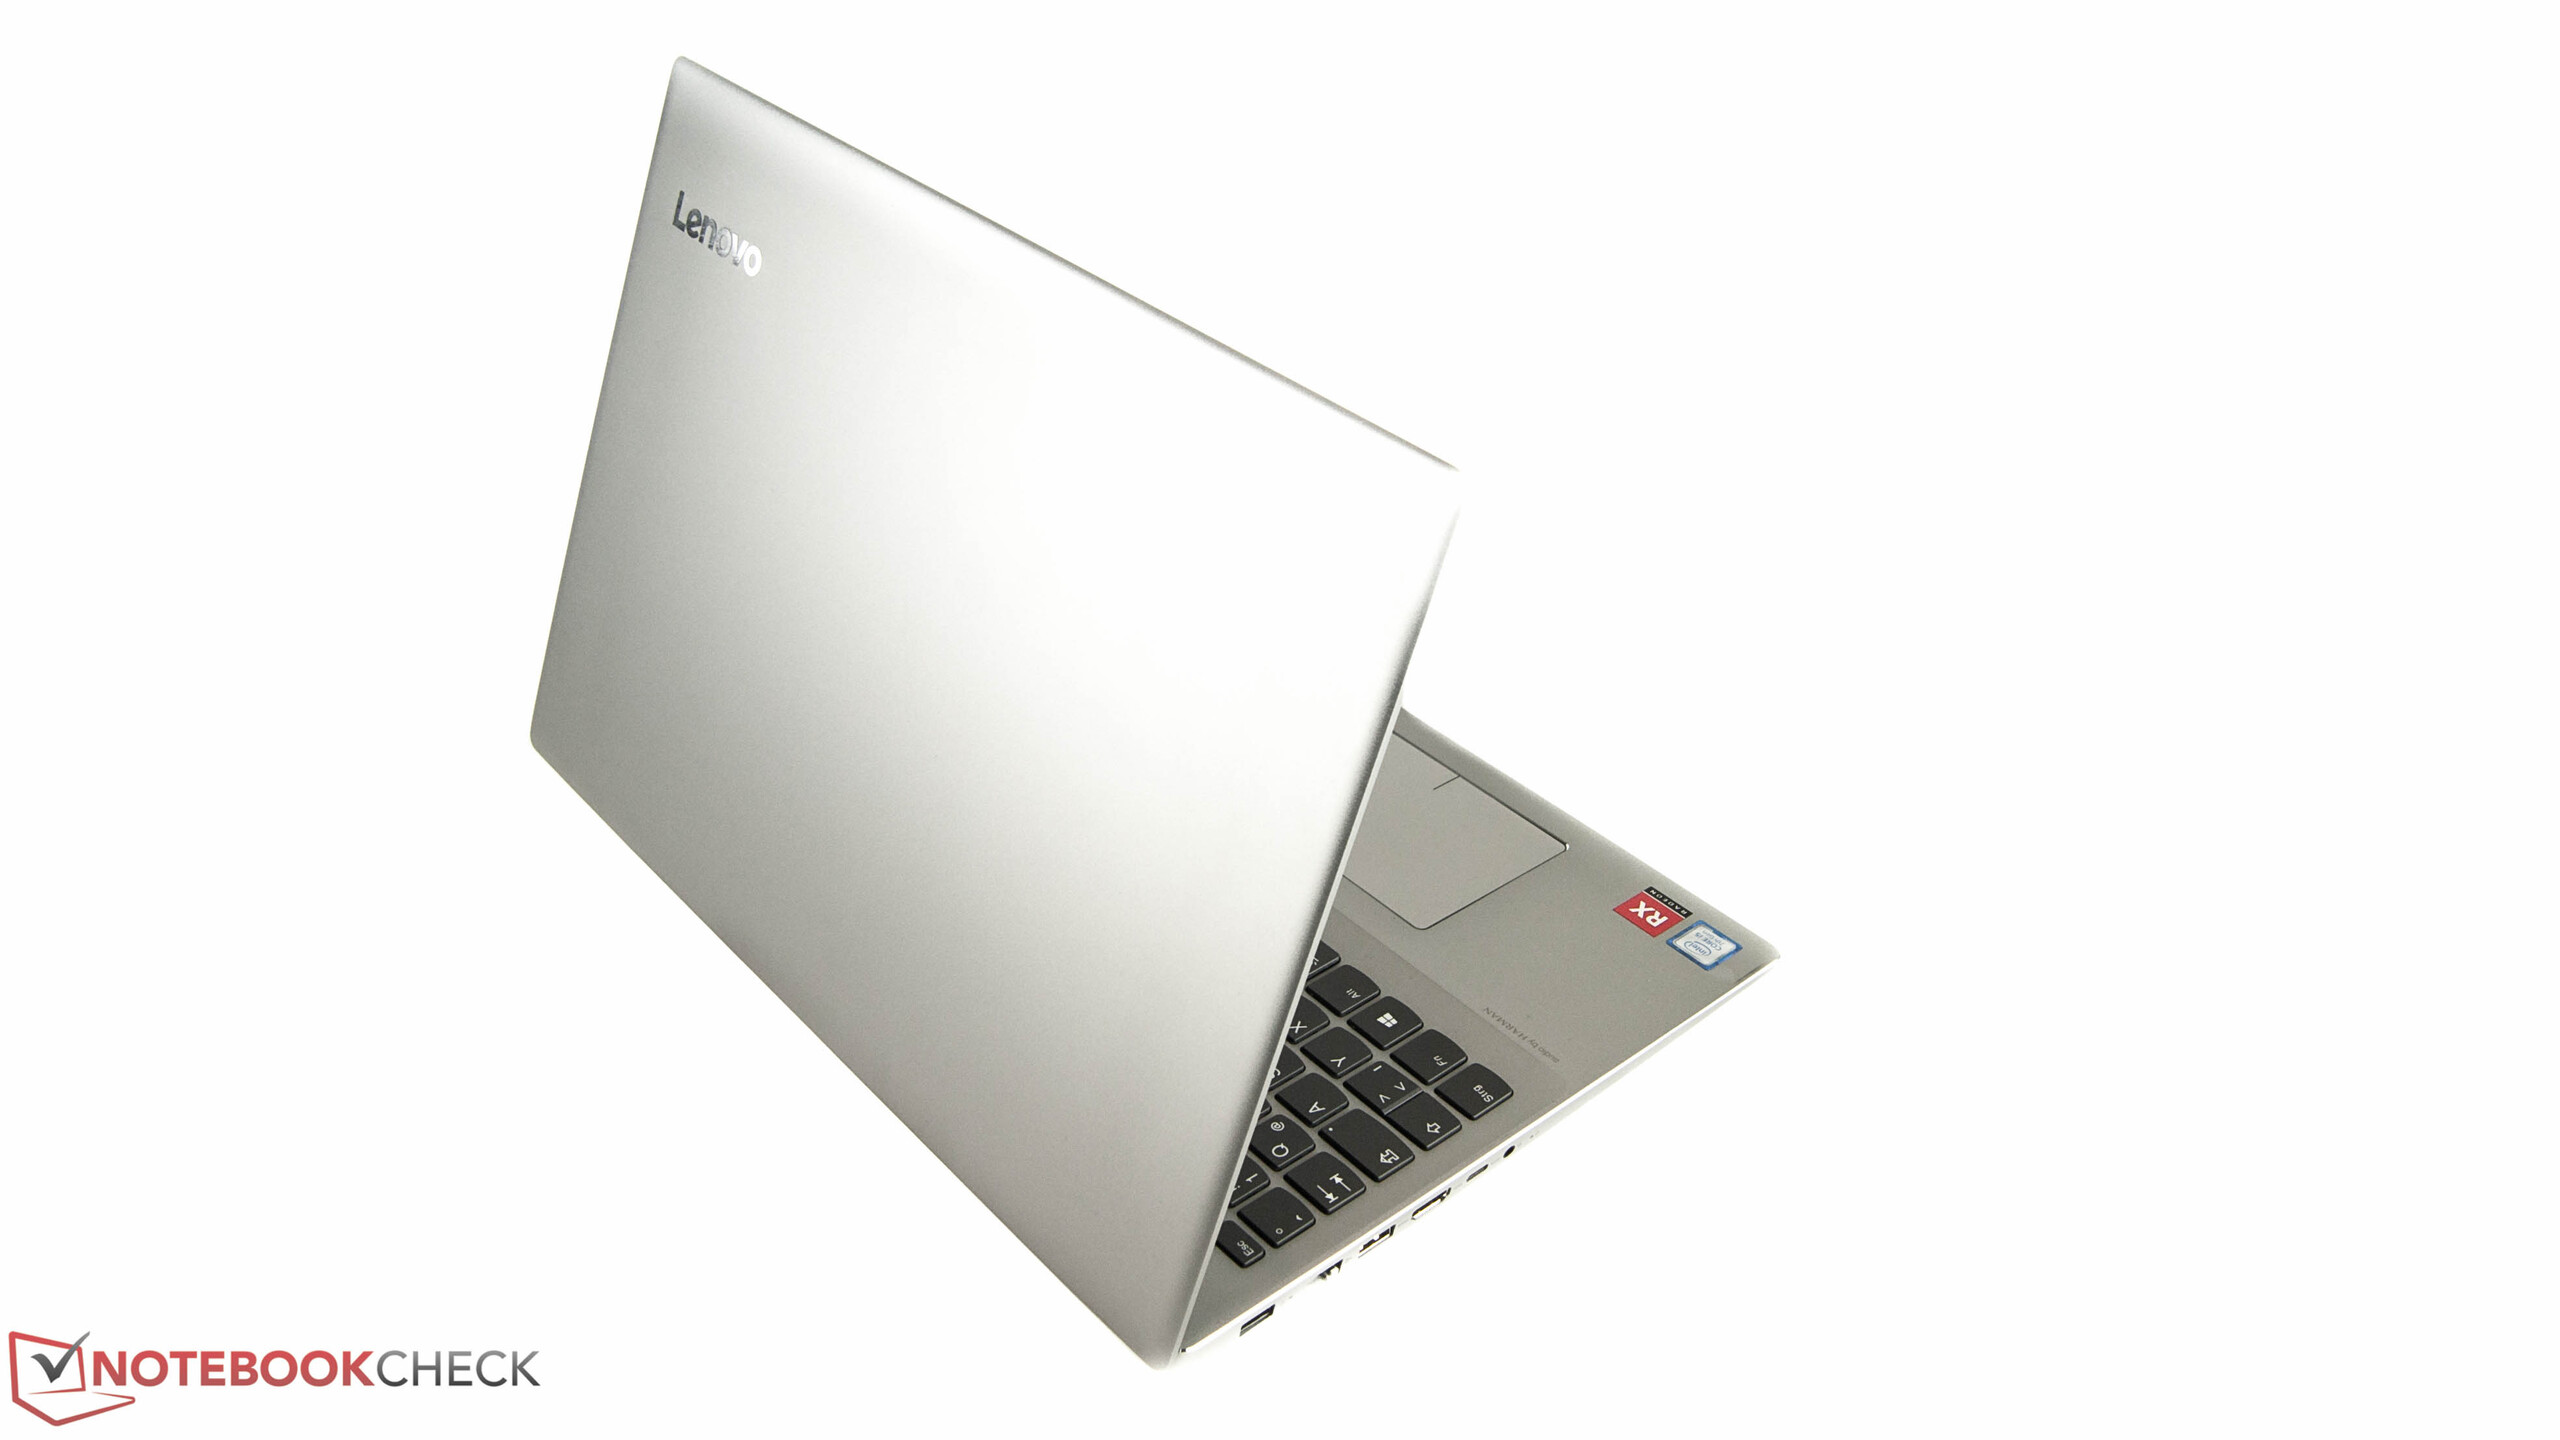
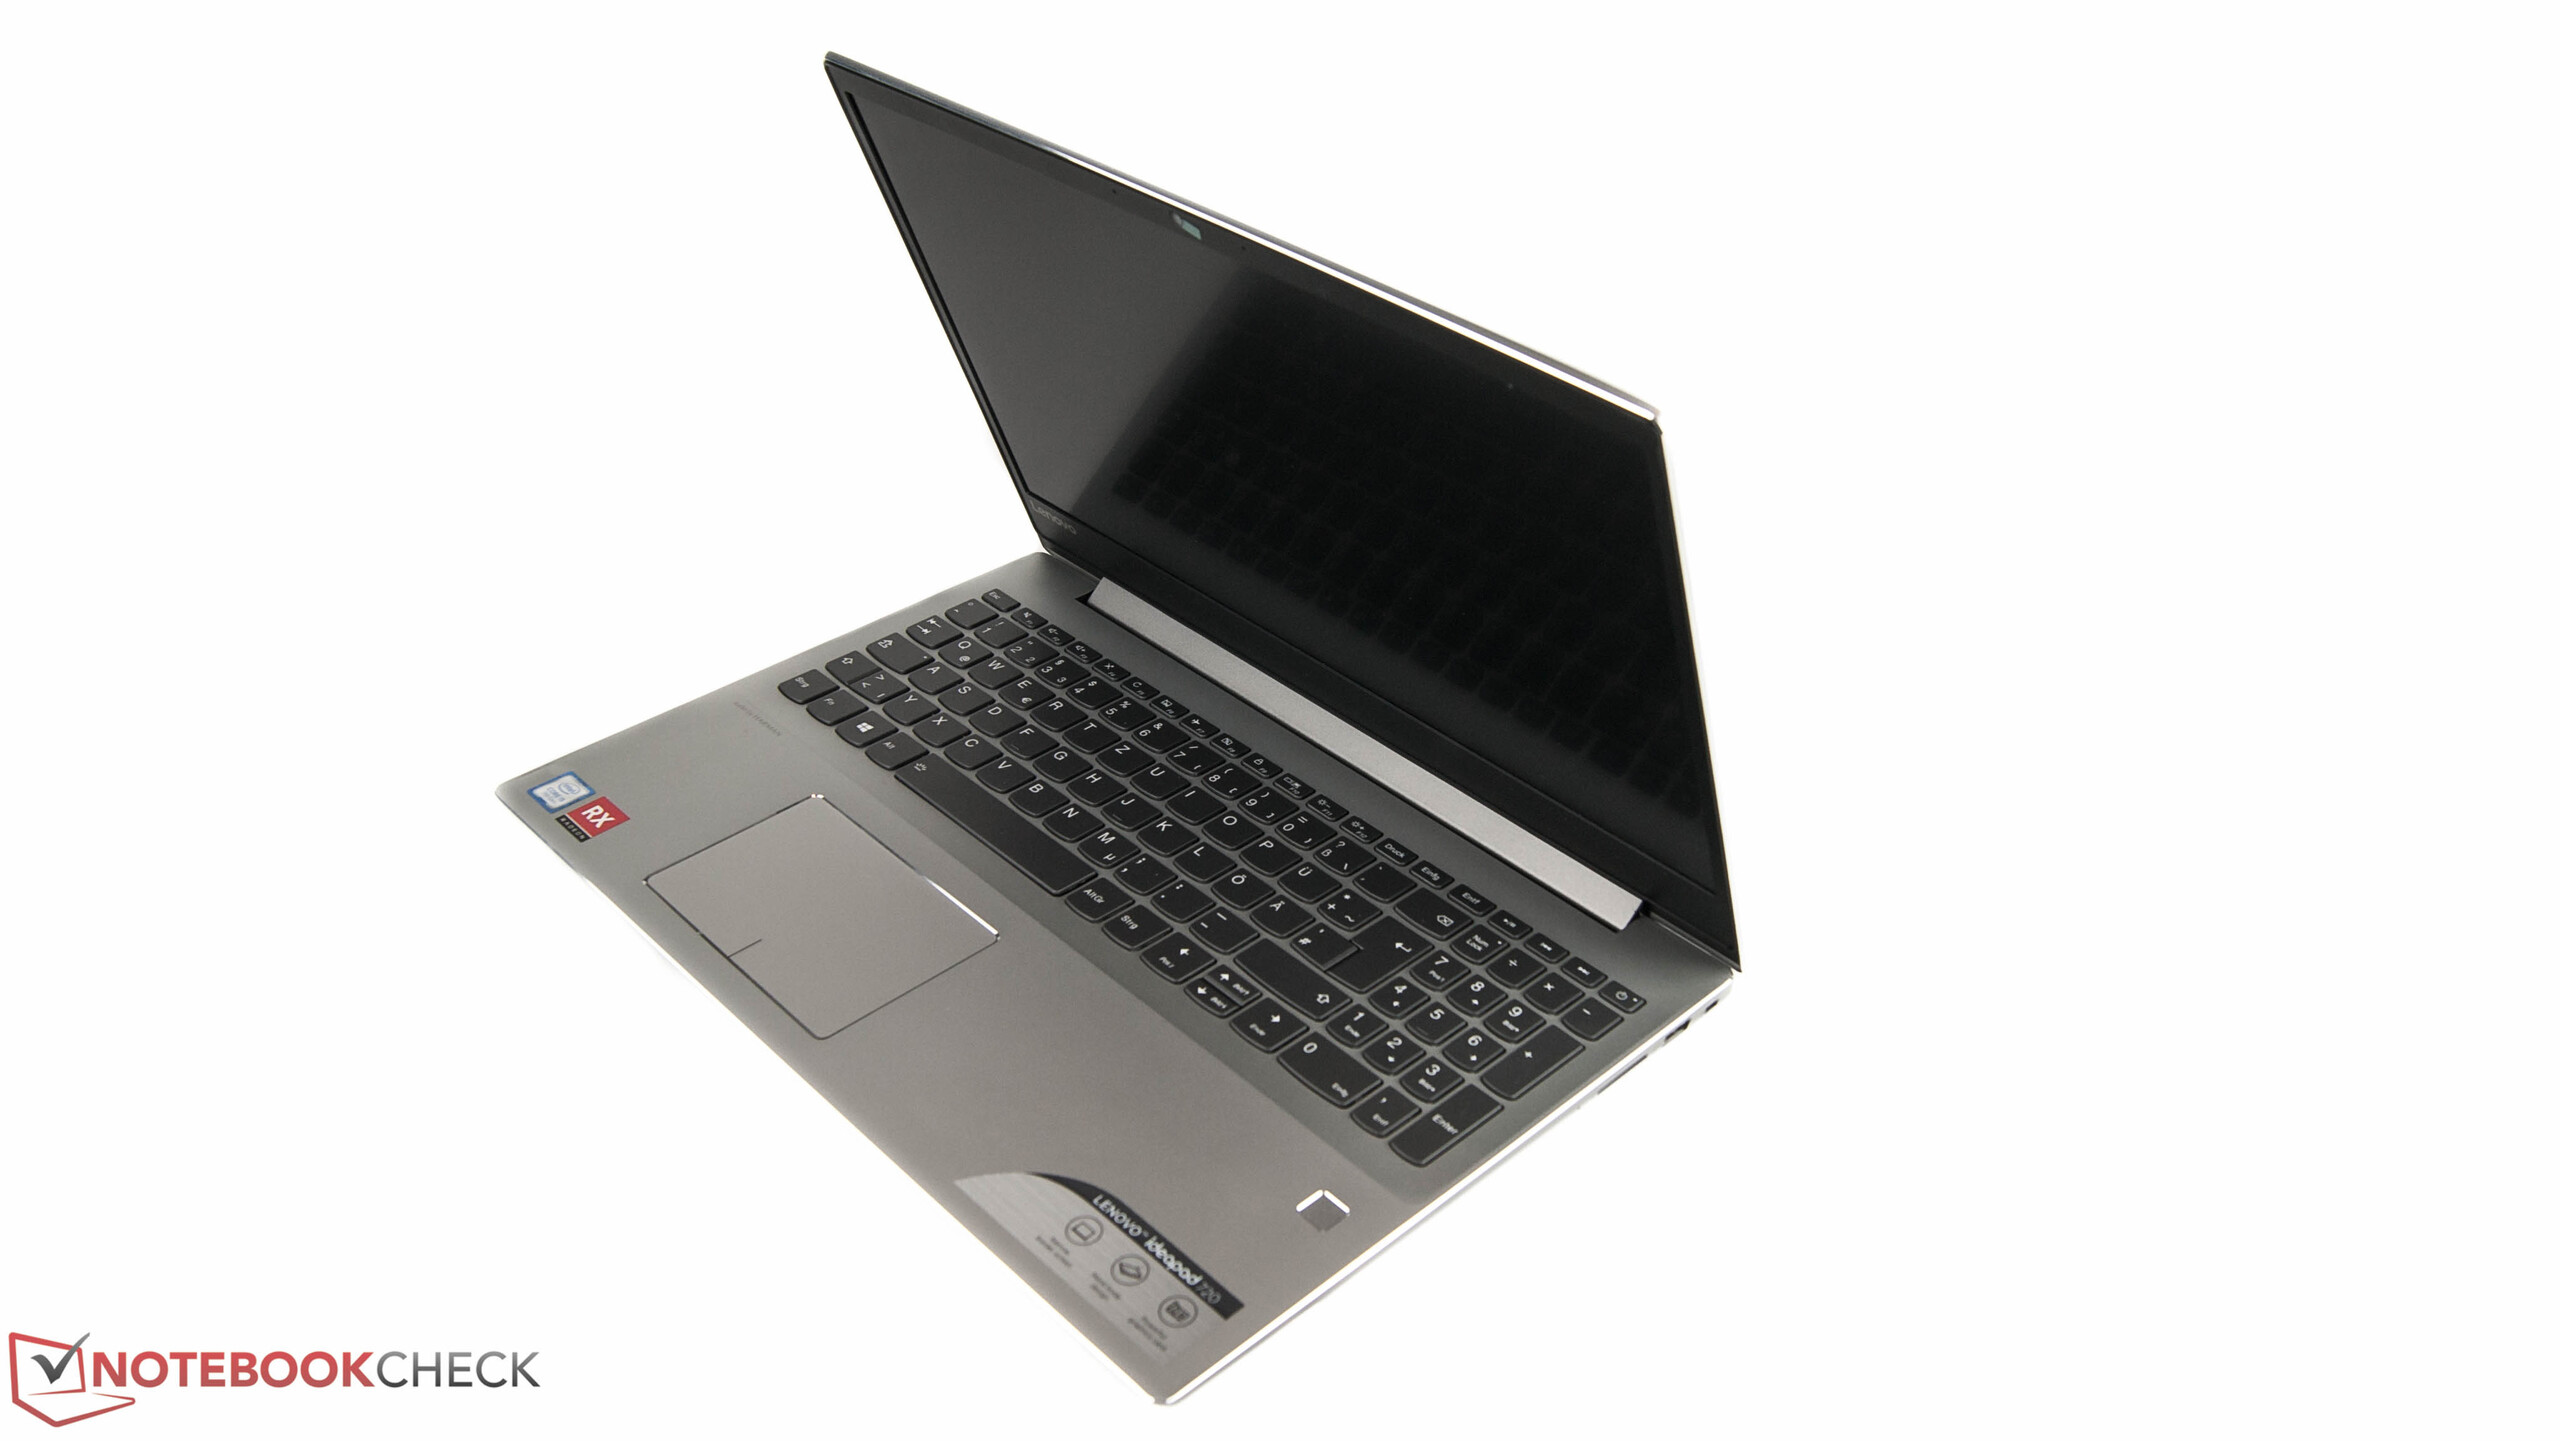
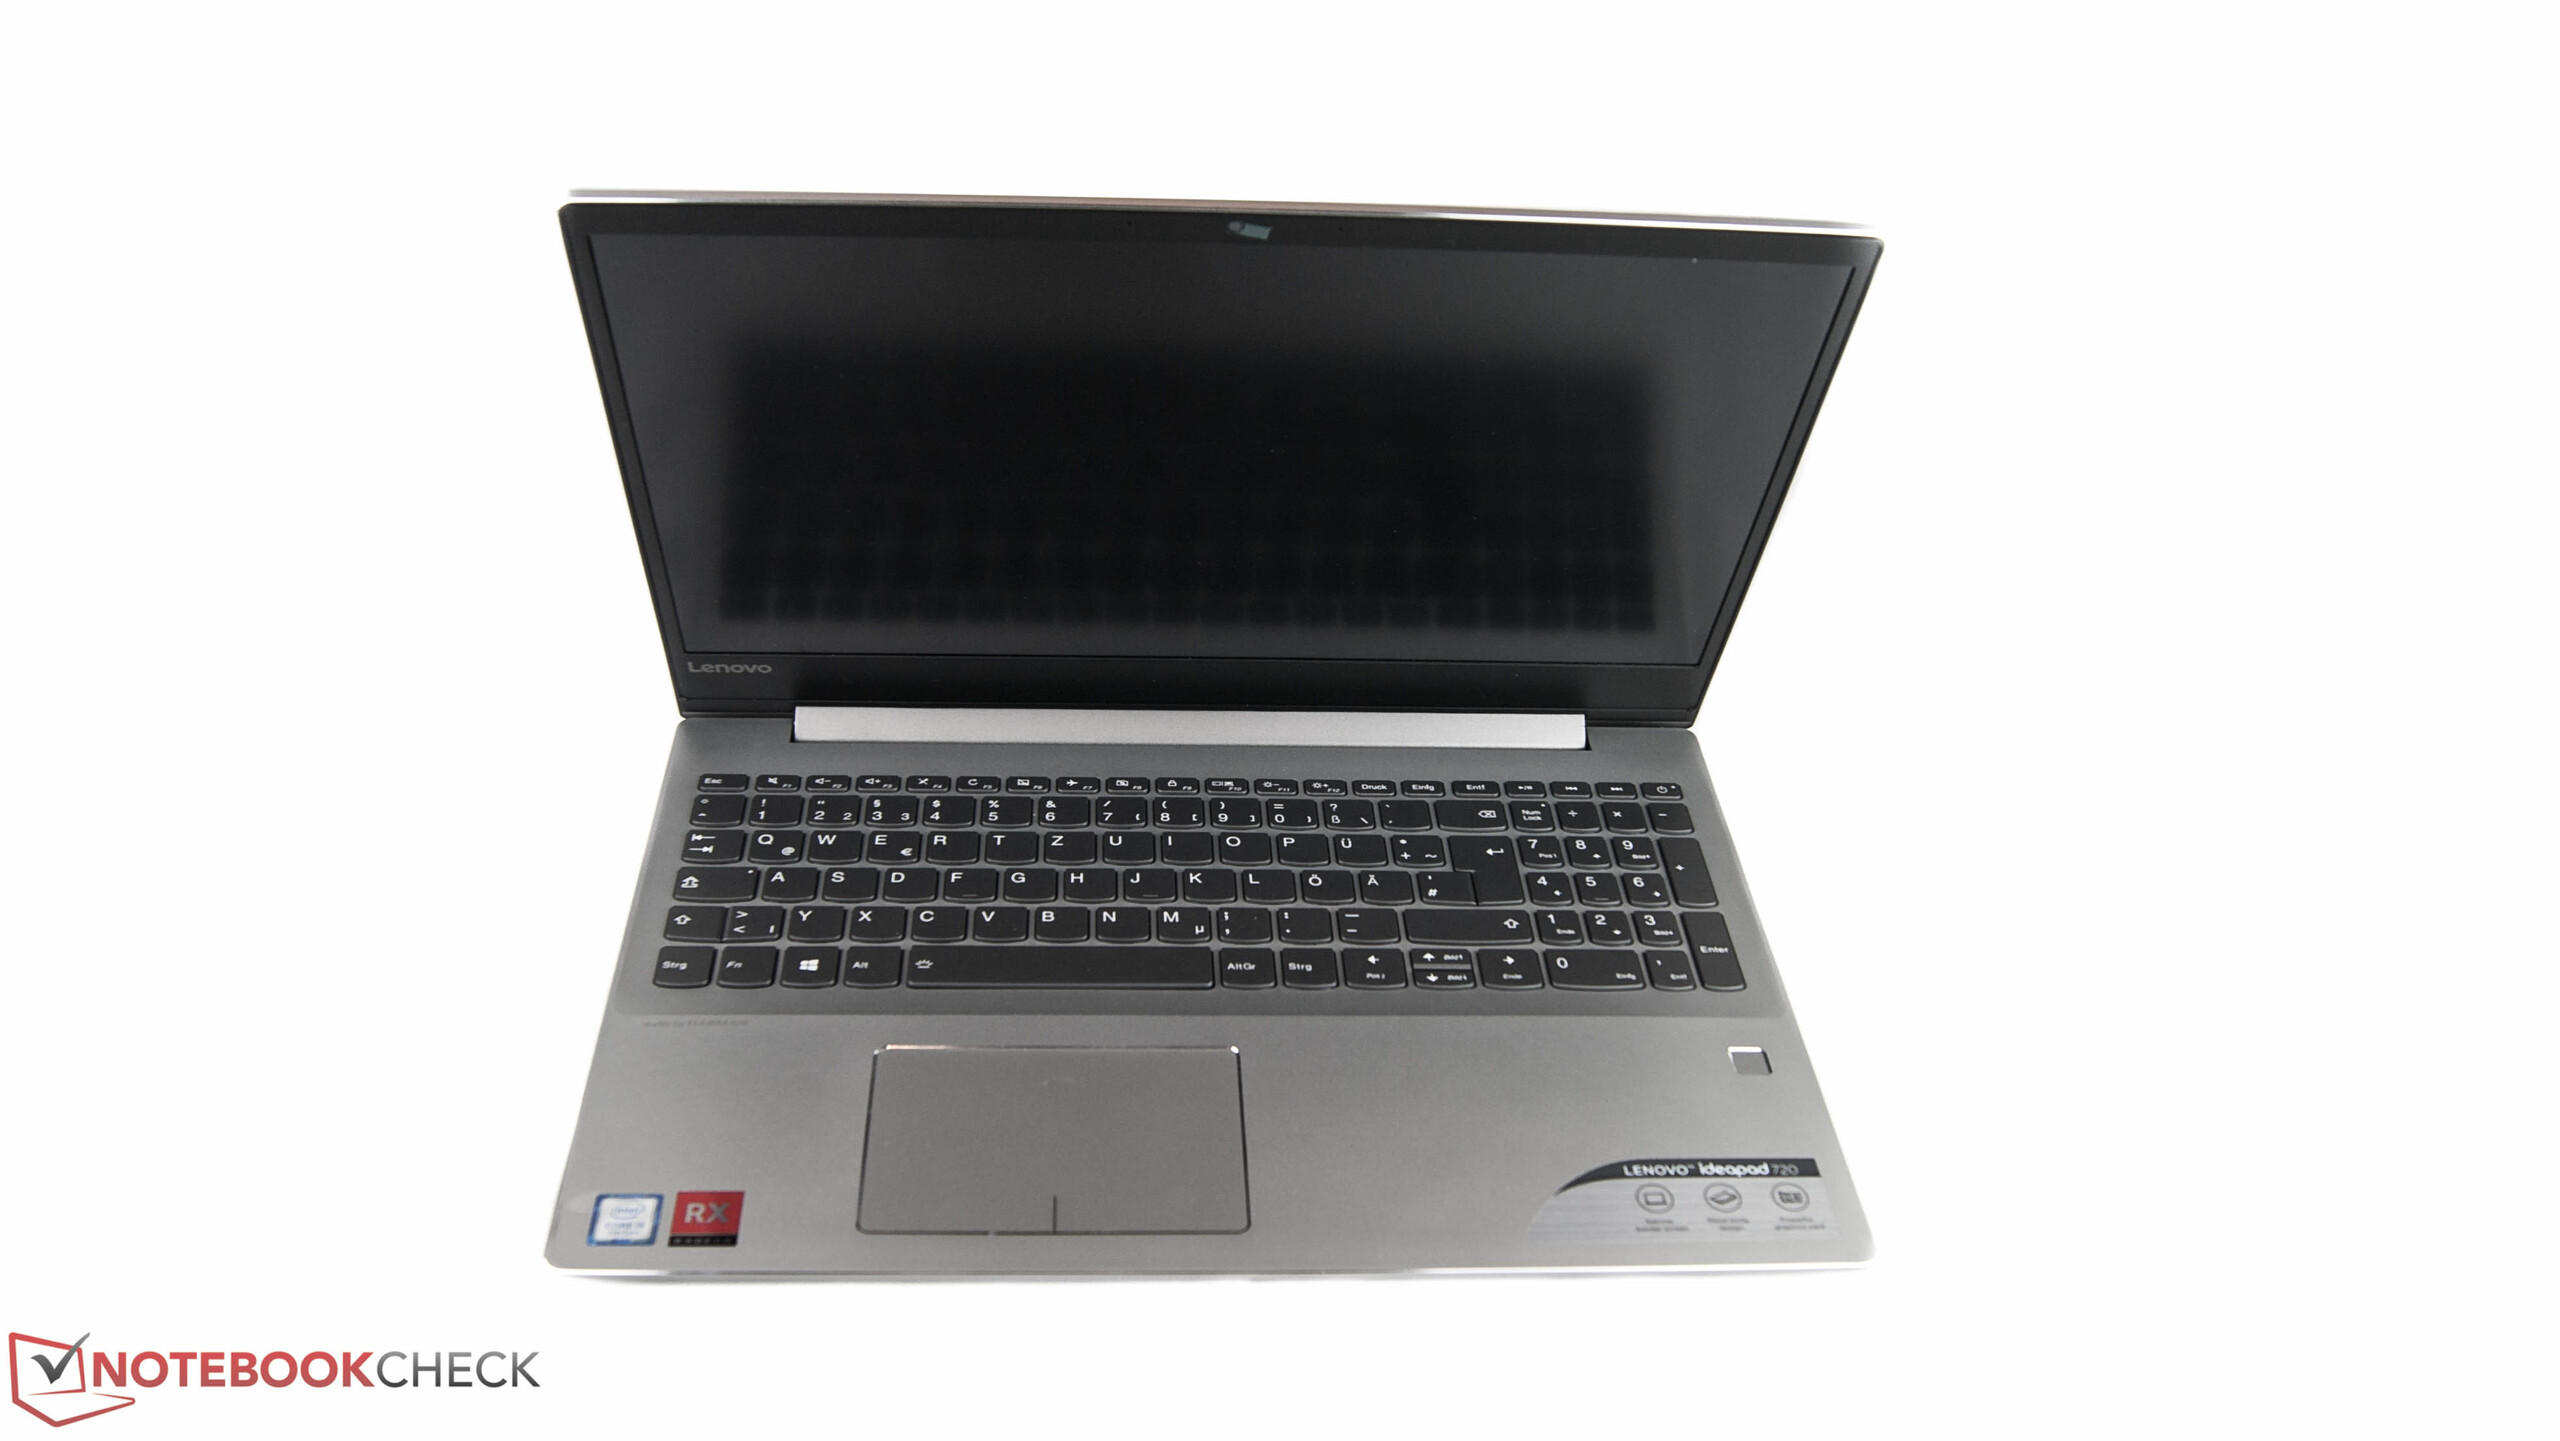
Lenovo IdeaPad 720-15IKB tar plats i leden av andra multimedialaptops på 15 tum. Lenovo har försökt skapa intresse för enheten genom till största del använda ett aluminiumhölje för att ge IdeaPad 720 ett gediget intryck. Alla våra jämförelseenheter har plasthöljen bortsett från Mi Notebook Pro i5.
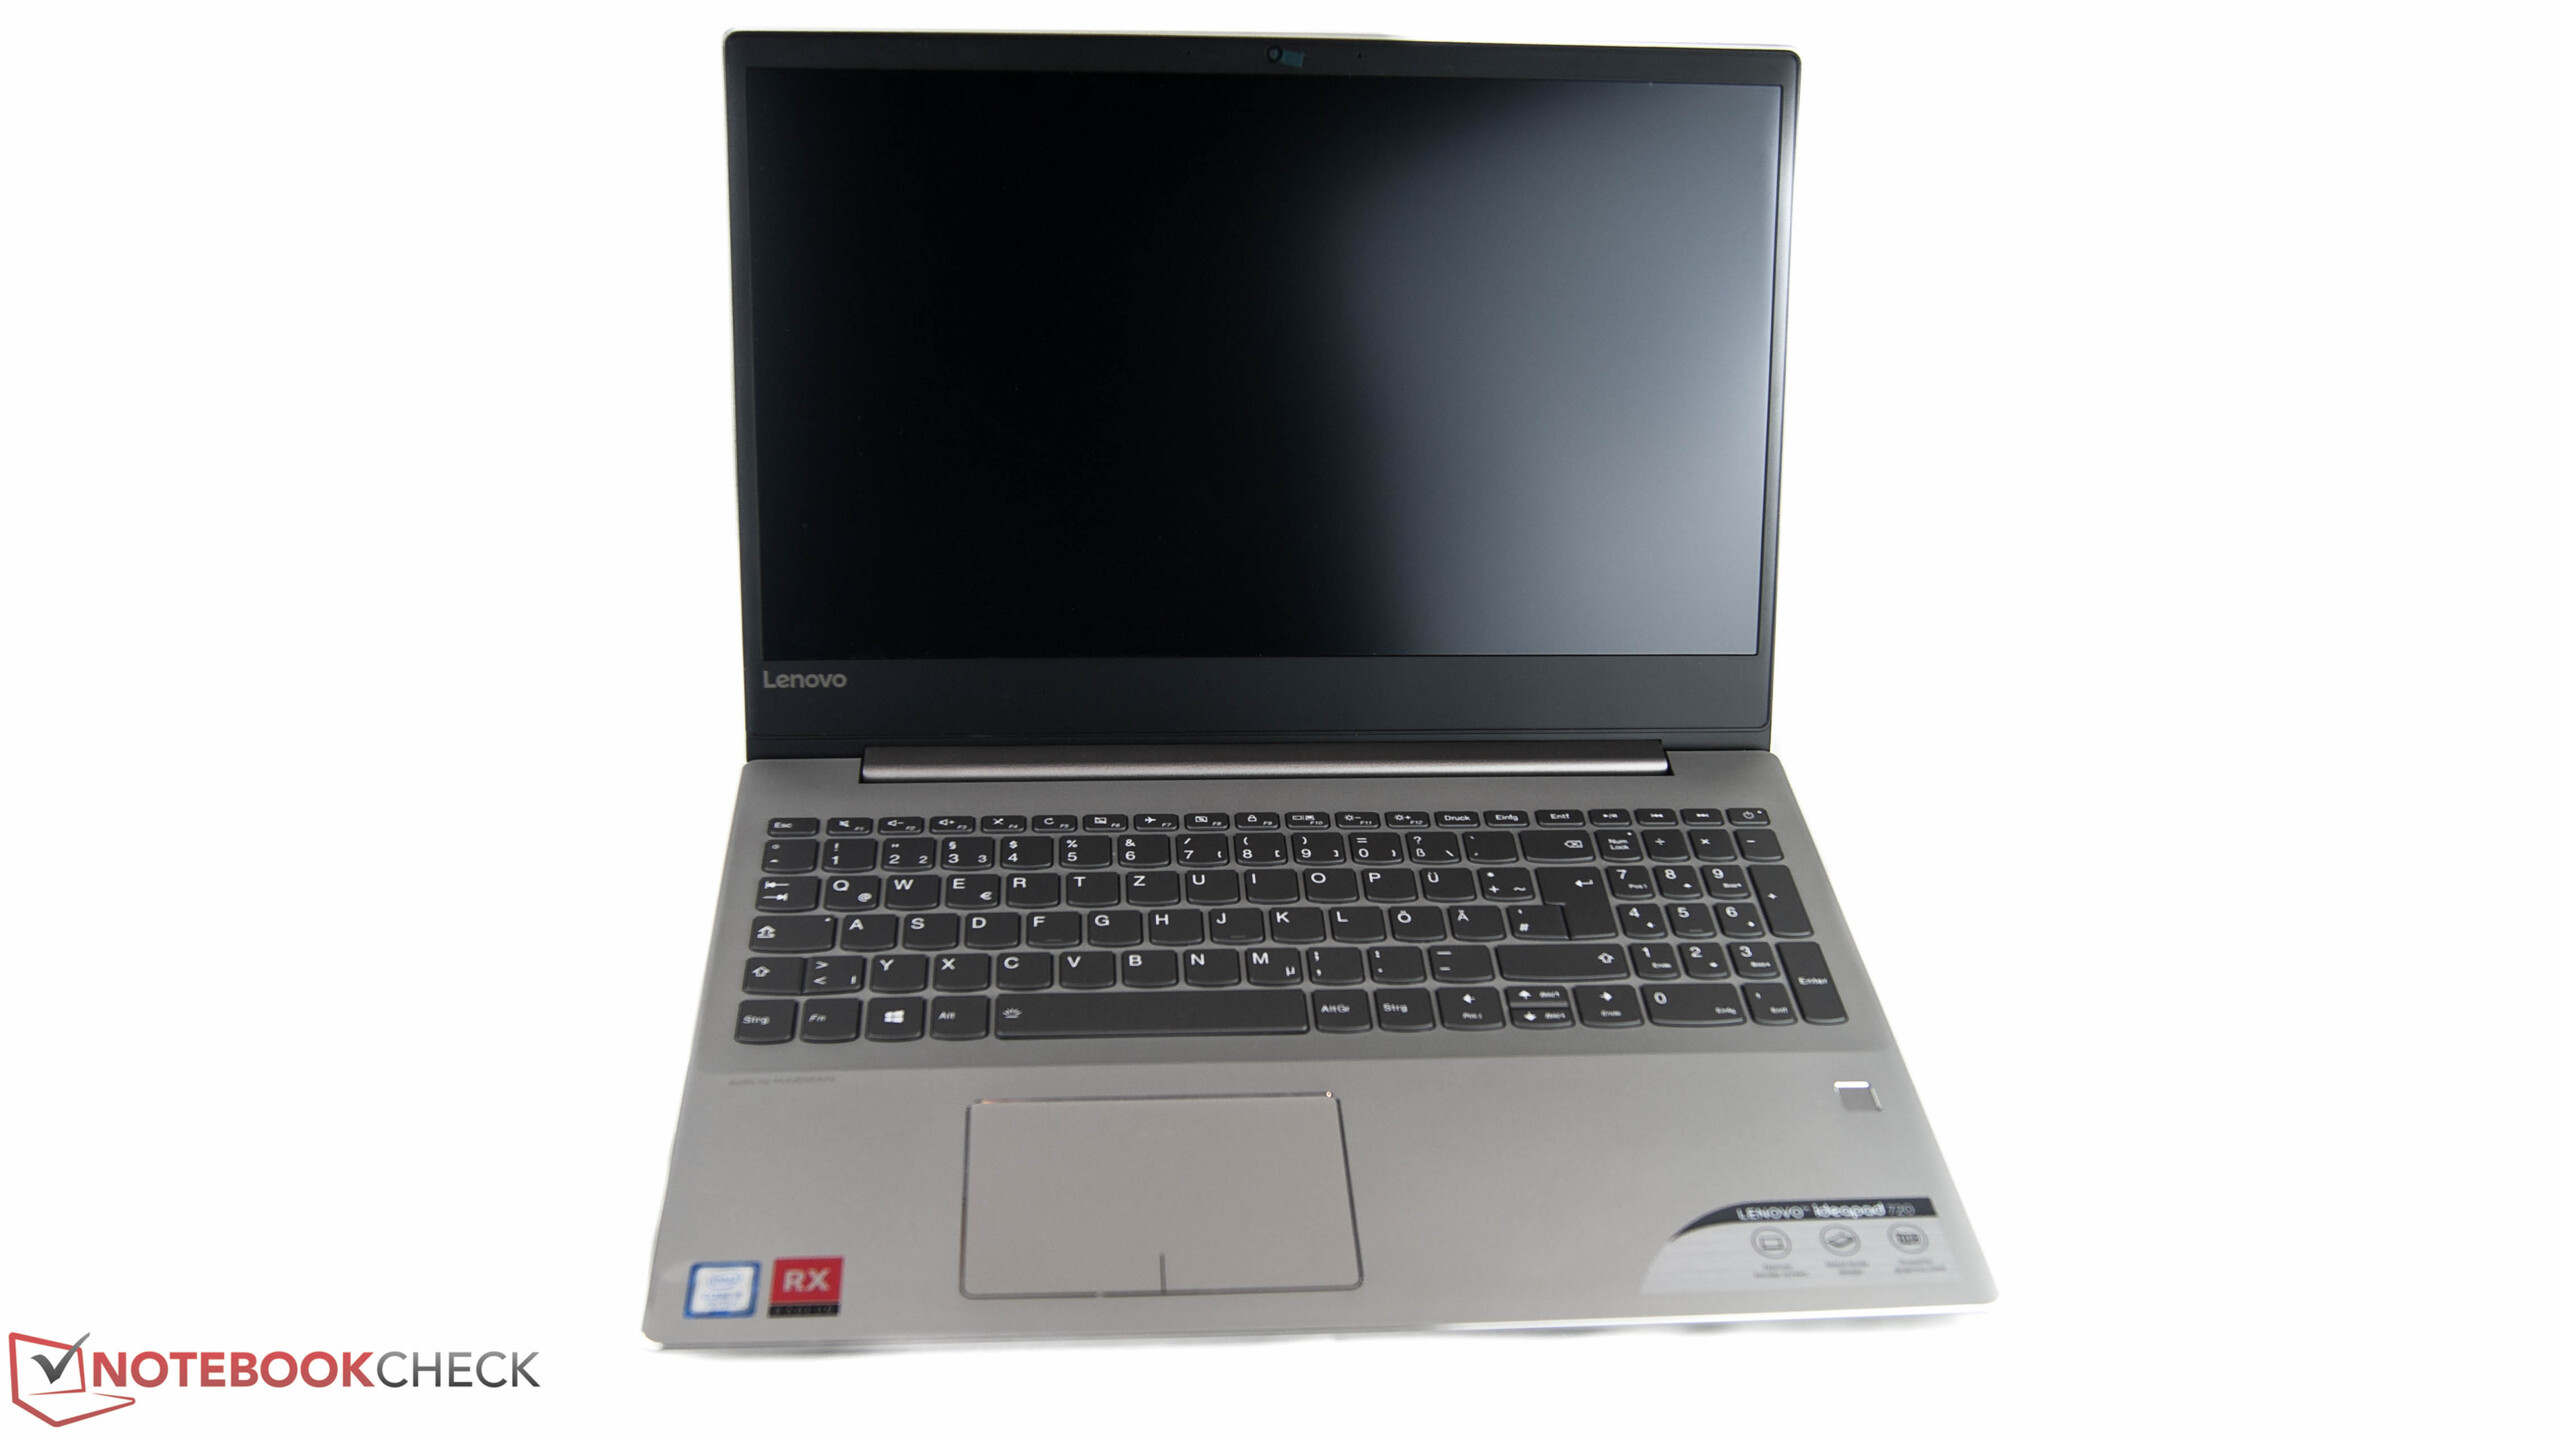
Lenovo har också ansträngt sig lite extra med inmatningsenheterna på IdeaPad 720. Tangentbordet har definierade och skarpa tryckpunkter och den har en skaplig styrplatta. IdeaPad 720 borde vara lämpad för kontorsarbete med tanke på inmatningsenheterna.
Vi hade föredragit en mer ljusstark skärm, den Lenovo har utrustat IdeaPad 720 med är bara genomsnittlig för sin klass.
Vår testenhets prestanda lämnade oss dock aningen splittrade. Även om Intel Core i5-7200U processorn inte kan tävla med nyare CPU-modeller så gör kombinationen av en dedikerad GPU och snabb PCIe-lagring att IdeaPad 720 har utmärkt systemprestanda.
På samma sätt finns det både positivt och negativt att säga om ljud och värmenivåer. Även om fläktljudet är minimalt så kan vissa sporadiska höga frekvenser vara irriterande. Yttemperaturerna är för det mesta ganska svala men det finns en del varma områden.
Det finns inte mycket att säga om batteritiden. IdeaPad 720 klarade runt sju timmar i vårt WiFi-batteritest, vilket placerar enheten i mittfältet bland alla multimedialaptops på 15 tum som vi har recenserat under dom 12 senaste månaderna.
Lenovo IdeaPad 720-15IKB är en enhet som är mer än summan av sina delar. Den saknar en funktion som står ut men Lenovo har gjort ett bra jobb. I slutändan är IdeaPad 720 en multimedia-enhet som är lämplig för att användas dagligen.
Vi rekommenderar att du tar en titt på HP Pavilion Power 15 om du letar efter mer kraft och en bättre spelupplevelse. På samma sätt har Xiaomi Mi Notebook Pro i5 bättre batteritid och en bättre skärm. Kort sagt, Lenovo IdeaPad 720-15IKB gör inte något för att stå ut från sina konkurrenter.
Lenovo IdeaPad 720-15IKB
- 06/13/2018 v6 (old)
Nino Ricchizzi
Price comparison
