Test: Lenovo ThinkBook 15 - En billig kontorsenhet med Comet Lake-processor (Sammanfattning)
Gradering | Datum | Modell | Vikt | Höjd | Storlek | Upplösning | Pris |
|---|---|---|---|---|---|---|---|
| 81.8 % v7 (old) | 02/2020 | Lenovo ThinkBook 15 i5-10210U, UHD Graphics 620 | 1.9 kg | 18.9 mm | 15.60" | 1920x1080 | |
| 88.4 % v6 (old) | 10/2024 | Lenovo ThinkPad E595-20NF0000GE R7 3700U, Vega 10 | 1.9 kg | 19.9 mm | 15.60" | 1920x1080 | |
| 83.2 % v7 (old) | 11/2019 | Lenovo ThinkPad L590-20Q70019GE i5-8265U, UHD Graphics 620 | 2 kg | 23 mm | 15.60" | 1920x1080 | |
| 82.1 % v7 (old) | Schenker Slim 15 L19 i5-10210U, UHD Graphics 620 | 1.6 kg | 19.9 mm | 15.60" | 1920x1080 | ||
| 84.6 % v6 (old) | 03/2019 | HP ProBook 450 G6-5TJ93EA i7-8565U, GeForce MX130 | 2 kg | 20 mm | 15.60" | 1920x1080 | |
| 79.6 % v6 (old) | 07/2019 | Dell Latitude 15 3590 i5-8250U, UHD Graphics 620 | 2.1 kg | 22 mm | 15.60" | 1920x1080 |

| SD Card Reader | |
| average JPG Copy Test (av. of 3 runs) | |
| Lenovo ThinkBook 15 (Toshiba Exceria Pro SDXC 64 GB UHS-II) | |
| Lenovo ThinkPad E595-20NF0000GE (Toshiba Exceria Pro M501 64 GB UHS-II) | |
| HP ProBook 450 G6-5TJ93EA (Toshiba Exceria Pro SDXC 64 GB UHS-II) | |
| Lenovo ThinkPad L590-20Q70019GE (Toshiba Exceria Pro M501 64 GB UHS-II) | |
| Schenker Slim 15 L19 (Toshiba Exceria Pro SDXC 64 GB UHS-II) | |
| Genomsnitt av klass Office (19.8 - 198.5, n=22, senaste 2 åren) | |
| Dell Latitude 15 3590 (Toshiba Exceria Pro SDXC 64 GB UHS-II) | |
| maximum AS SSD Seq Read Test (1GB) | |
| Lenovo ThinkPad E595-20NF0000GE (Toshiba Exceria Pro M501 64 GB UHS-II) | |
| Lenovo ThinkBook 15 (Toshiba Exceria Pro SDXC 64 GB UHS-II) | |
| Lenovo ThinkPad L590-20Q70019GE (Toshiba Exceria Pro M501 64 GB UHS-II) | |
| Schenker Slim 15 L19 (Toshiba Exceria Pro SDXC 64 GB UHS-II) | |
| HP ProBook 450 G6-5TJ93EA (Toshiba Exceria Pro SDXC 64 GB UHS-II) | |
| Genomsnitt av klass Office (27.4 - 249, n=21, senaste 2 åren) | |
| Dell Latitude 15 3590 (Toshiba Exceria Pro SDXC 64 GB UHS-II) | |
| Networking | |
| iperf3 transmit AX12 | |
| Schenker Slim 15 L19 | |
| Lenovo ThinkBook 15 | |
| HP ProBook 450 G6-5TJ93EA | |
| Lenovo ThinkPad L590-20Q70019GE | |
| Lenovo ThinkPad E595-20NF0000GE | |
| Dell Latitude 15 3590 | |
| iperf3 receive AX12 | |
| Schenker Slim 15 L19 | |
| Lenovo ThinkBook 15 | |
| Lenovo ThinkPad E595-20NF0000GE | |
| HP ProBook 450 G6-5TJ93EA | |
| Lenovo ThinkPad L590-20Q70019GE | |
| Dell Latitude 15 3590 | |
| |||||||||||||||||||||||||
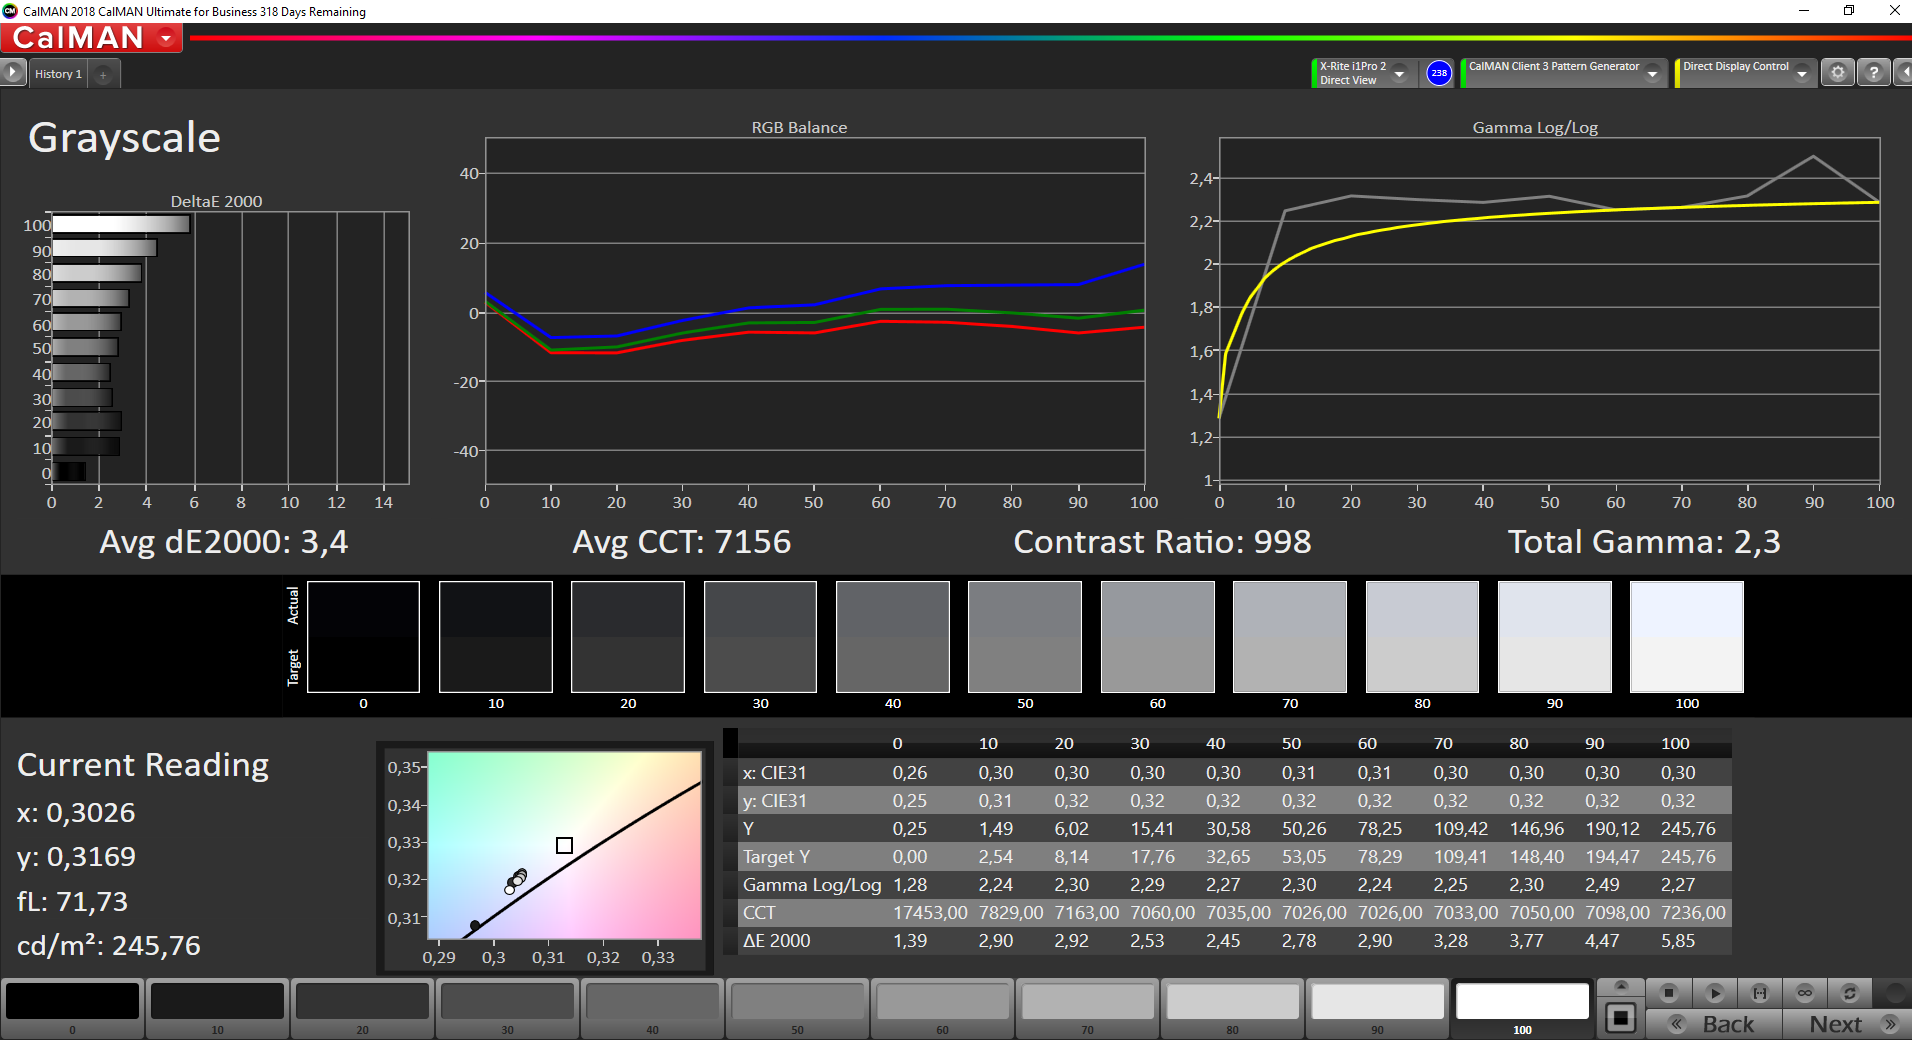
Distribution av ljusstyrkan: 82 %
Mitt på batteriet: 245 cd/m²
Kontrast: 980:1 (Svärta: 0.25 cd/m²)
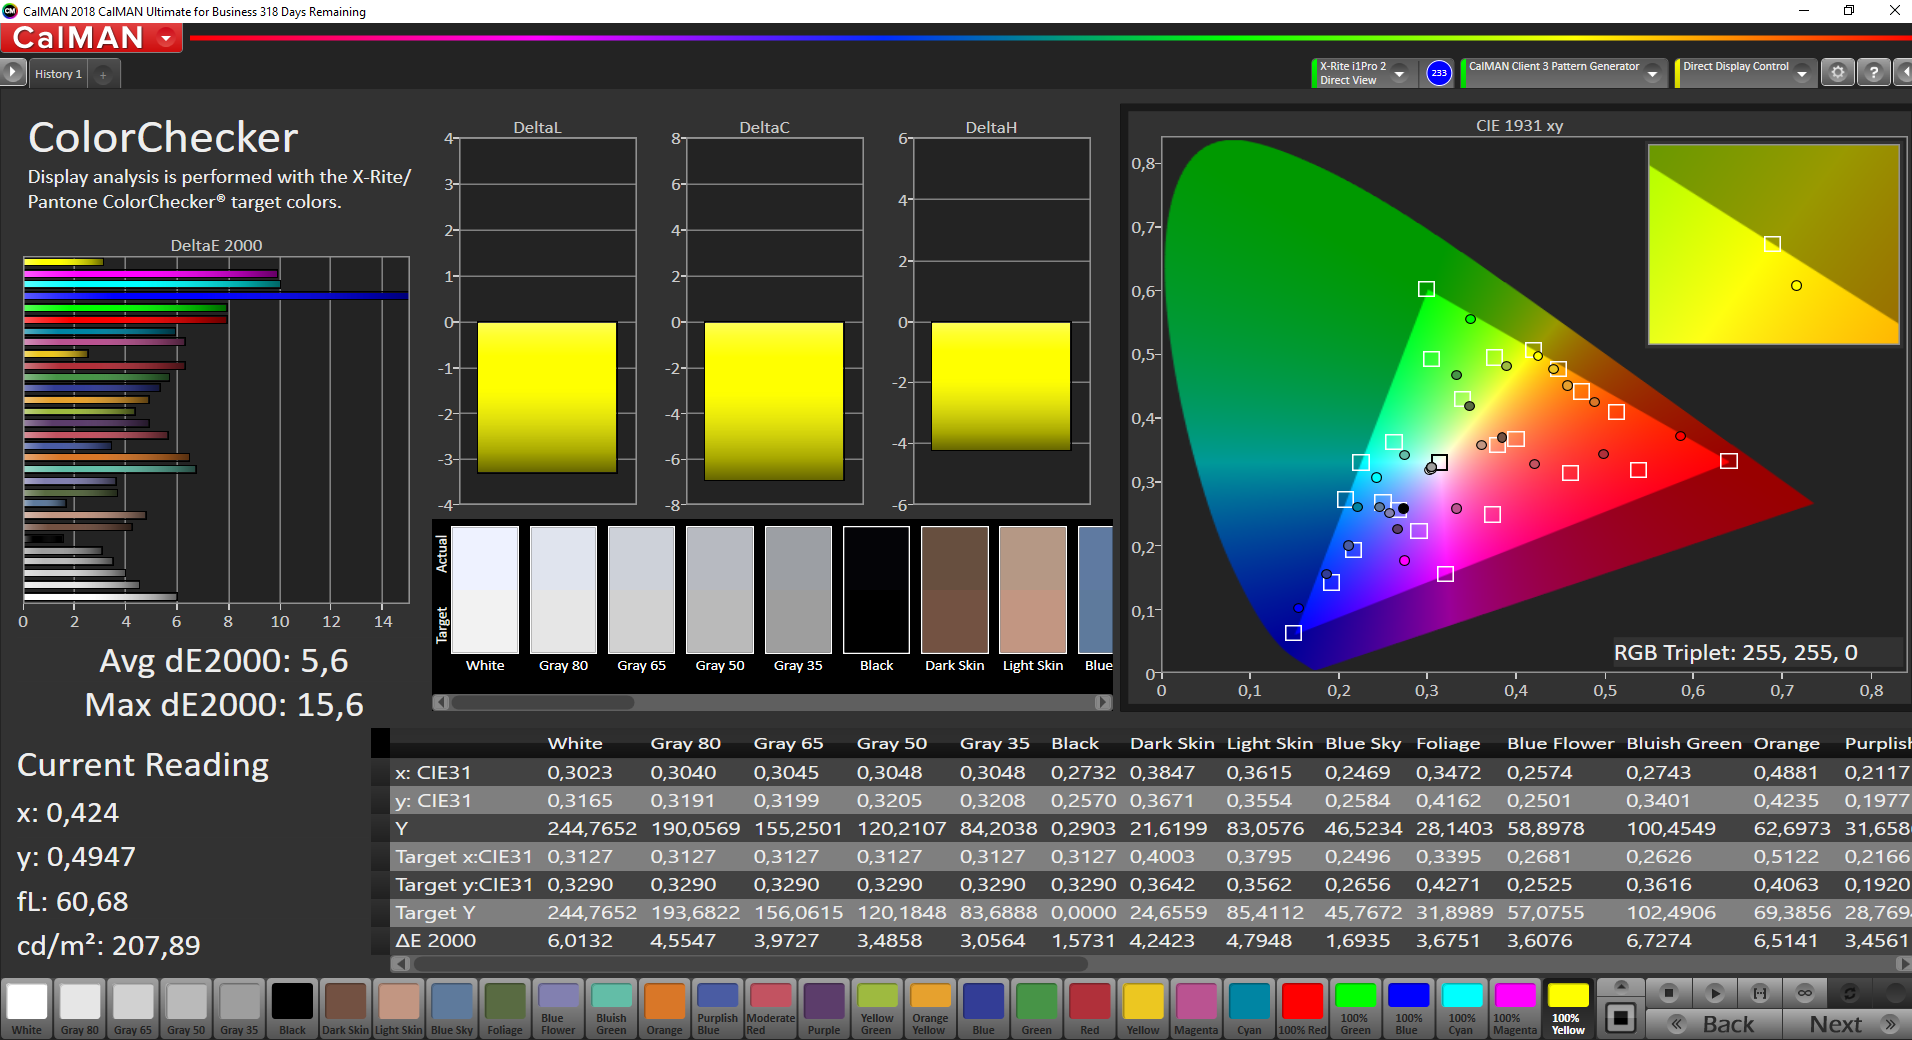
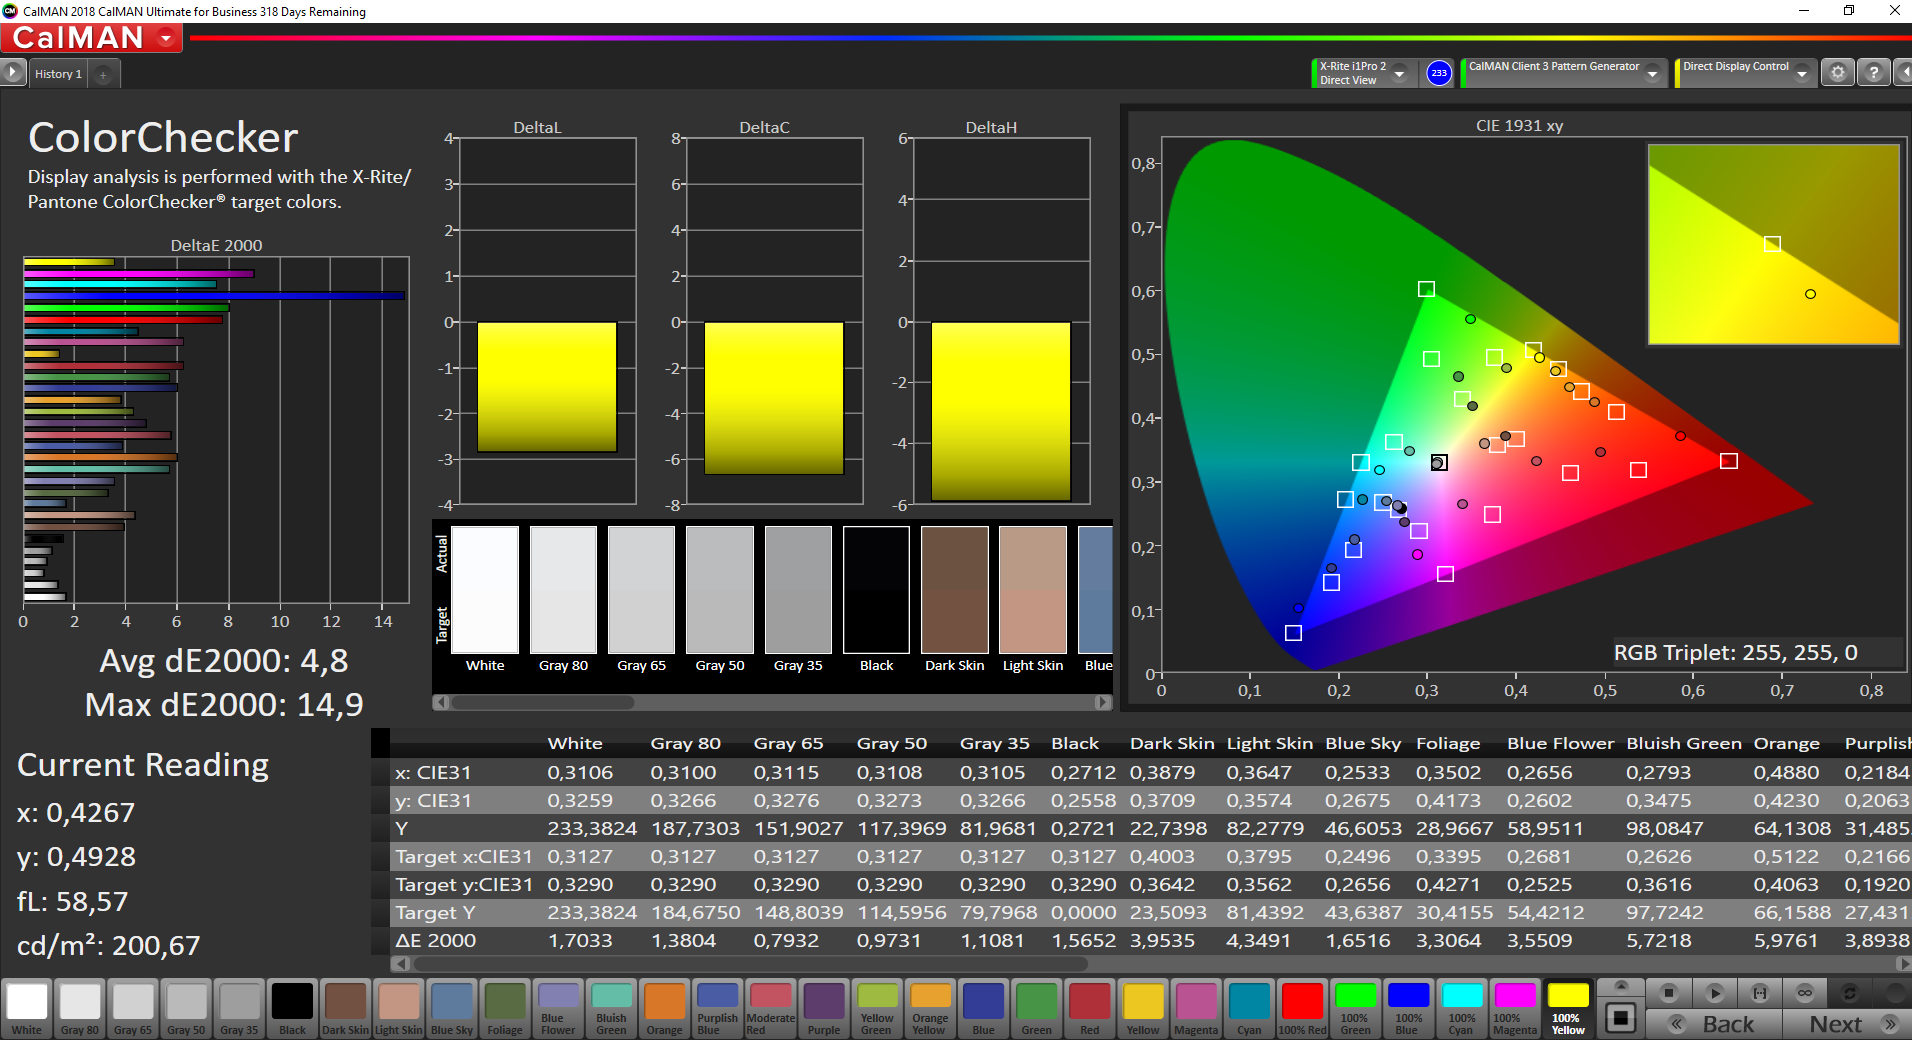
ΔE ColorChecker Calman: 5.6 | ∀{0.5-29.43 Ø4.72}
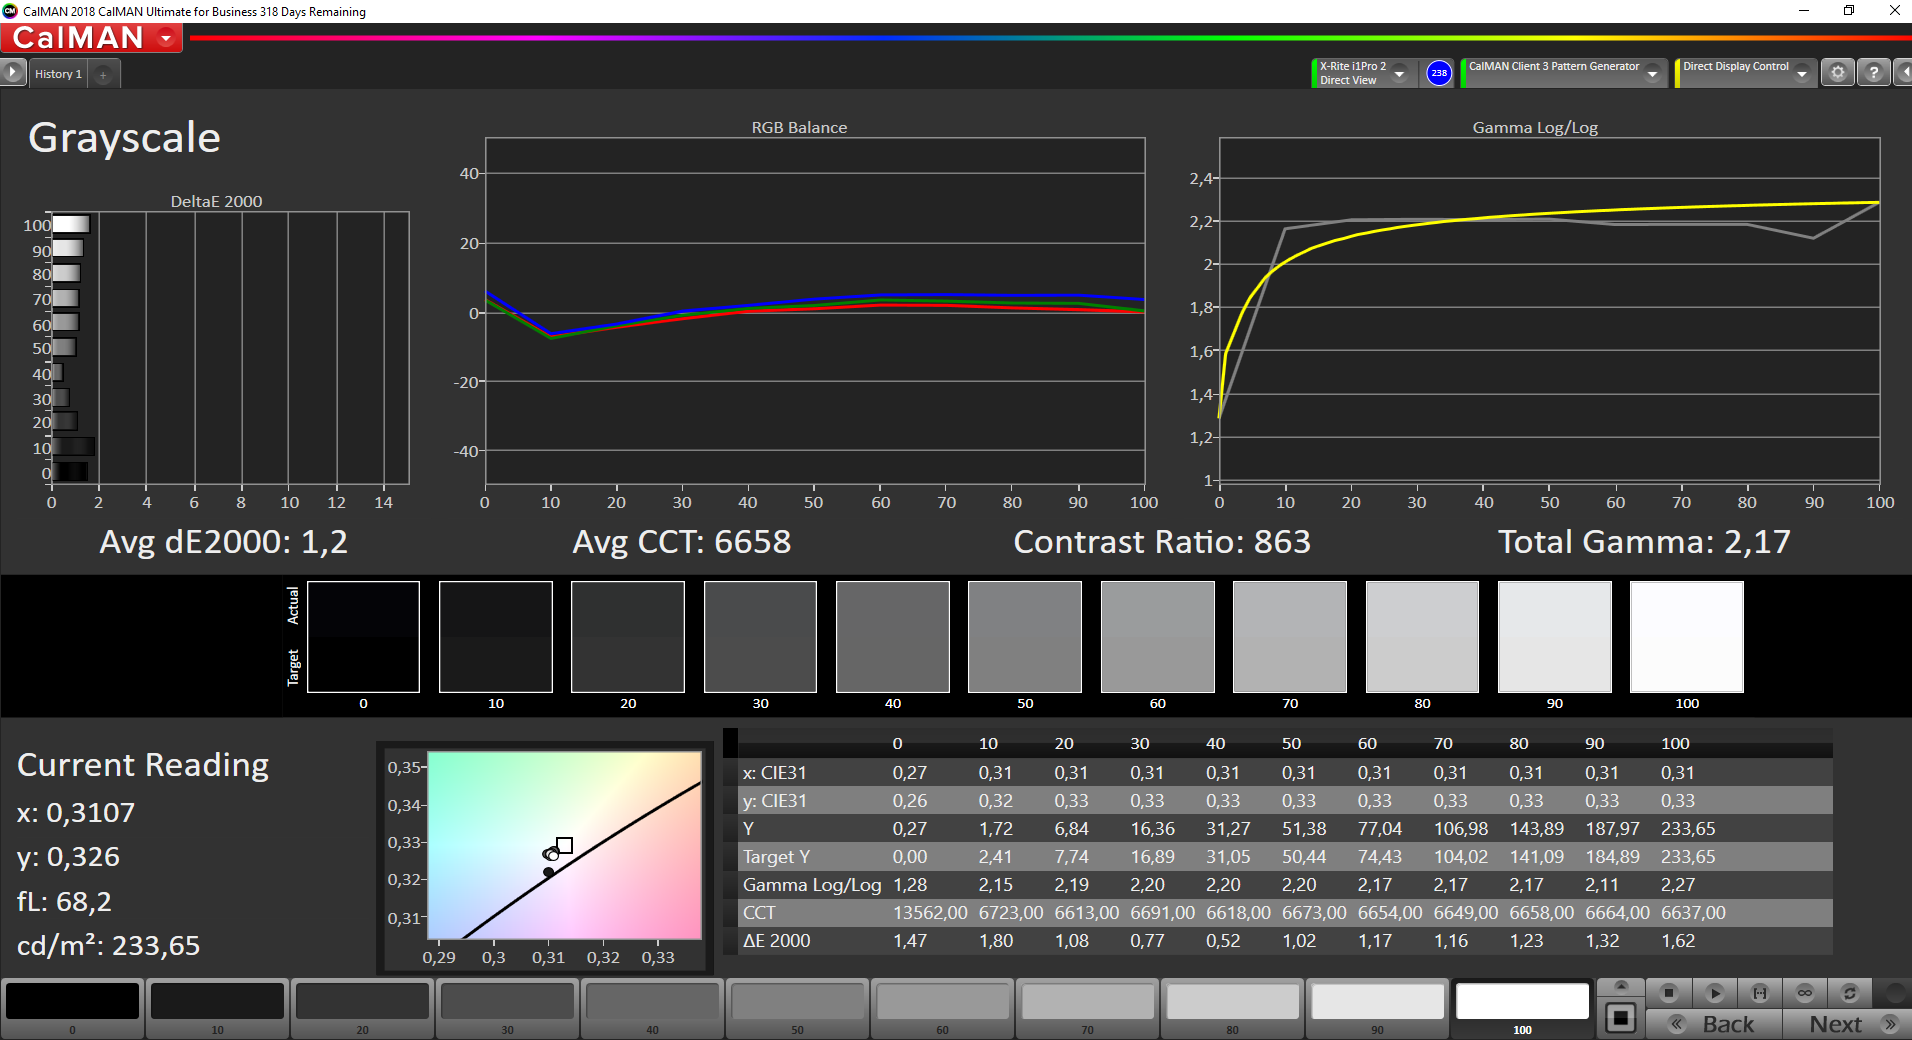
calibrated: 4.8
ΔE Greyscale Calman: 3.4 | ∀{0.09-98 Ø4.97}
57.5% sRGB (Argyll 1.6.3 3D)
36.5% AdobeRGB 1998 (Argyll 1.6.3 3D)
39.67% AdobeRGB 1998 (Argyll 3D)
57.7% sRGB (Argyll 3D)
38.38% Display P3 (Argyll 3D)
Gamma: 2.3
CCT: 7156 K
| Lenovo ThinkBook 15 LP156WFC-SPD1, IPS, 1920x1080, 15.6" | Lenovo ThinkPad E595-20NF0000GE NV156FHM-N49, IPS, 1920x1080, 15.6" | Lenovo ThinkPad L590-20Q70019GE N156HCE-EAA, IPS, 1920x1080, 15.6" | Schenker Slim 15 L19 BOE CQ NV156FHM-N61, , 1920x1080, 15.6" | HP ProBook 450 G6-5TJ93EA Chi Mei CMN15FE, IPS, 1920x1080, 15.6" | Dell Latitude 15 3590 BOE0802 / NT15N41 / Dell: M9P74, TN LED, 1920x1080, 15.6" | |
|---|---|---|---|---|---|---|
| Display | 3% | 13% | 62% | 12% | 3% | |
| Display P3 Coverage (%) | 38.38 | 39.88 4% | 43.3 13% | 66.8 74% | 42.83 12% | 39.67 3% |
| sRGB Coverage (%) | 57.7 | 58.6 2% | 64.4 12% | 87.1 51% | 64.2 11% | 59.7 3% |
| AdobeRGB 1998 Coverage (%) | 39.67 | 41.2 4% | 44.81 13% | 63.7 61% | 44.29 12% | 40.99 3% |
| Response Times | -14% | -12% | -16% | 11% | 24% | |
| Response Time Grey 50% / Grey 80% * (ms) | 37.6 ? | 41.2 ? -10% | 42.8 ? -14% | 45 ? -20% | 34.4 ? 9% | 41 ? -9% |
| Response Time Black / White * (ms) | 28 ? | 32.8 ? -17% | 30.8 ? -10% | 31 ? -11% | 24.4 ? 13% | 12 ? 57% |
| PWM Frequency (Hz) | 1220 ? | 24510 ? | 250 ? | 26040 ? | 250 ? | |
| Screen | 18% | -1% | 13% | 8% | -40% | |
| Brightness middle (cd/m²) | 245 | 318 30% | 247 1% | 315 29% | 242 -1% | 215 -12% |
| Brightness (cd/m²) | 239 | 297 24% | 228 -5% | 294 23% | 226 -5% | 214 -10% |
| Brightness Distribution (%) | 82 | 89 9% | 81 -1% | 83 1% | 88 7% | 91 11% |
| Black Level * (cd/m²) | 0.25 | 0.17 32% | 0.18 28% | 0.29 -16% | 0.21 16% | 0.385 -54% |
| Contrast (:1) | 980 | 1871 91% | 1372 40% | 1086 11% | 1152 18% | 558 -43% |
| Colorchecker dE 2000 * | 5.6 | 5.5 2% | 5.9 -5% | 6 -7% | 4.7 16% | 10.31 -84% |
| Colorchecker dE 2000 max. * | 15.6 | 21 -35% | 22.9 -47% | 10.2 35% | 18.5 -19% | 20.44 -31% |
| Colorchecker dE 2000 calibrated * | 4.8 | 5.1 -6% | 4.7 2% | 3.1 35% | 4 17% | 3.88 19% |
| Greyscale dE 2000 * | 3.4 | 1.8 47% | 5.1 -50% | 6 -76% | 2.7 21% | 11.84 -248% |
| Gamma | 2.3 96% | 2.12 104% | 2.21 100% | 2.16 102% | 2.26 97% | 2.67 82% |
| CCT | 7156 91% | 6257 104% | 6398 102% | 8038 81% | 6442 101% | 13398 49% |
| Color Space (Percent of AdobeRGB 1998) (%) | 36.5 | 37.6 3% | 41.2 13% | 57 56% | 40.8 12% | 39 7% |
| Color Space (Percent of sRGB) (%) | 57.5 | 58.2 1% | 64.1 11% | 87 51% | 64 11% | 61 6% |
| Totalt genomsnitt (program/inställningar) | 2% /
11% | 0% /
0% | 20% /
19% | 10% /
9% | -4% /
-24% |
* ... mindre är bättre

Visa svarstider
| ↔ Svarstid svart till vitt | ||
|---|---|---|
| 28 ms ... stiga ↗ och falla ↘ kombinerat | ↗ 16.4 ms stiga | 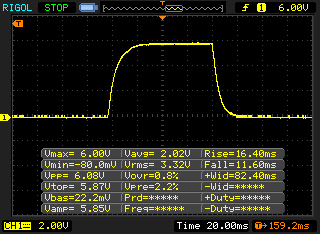 |
| ↘ 11.6 ms hösten | ||
| Skärmen visar relativt långsamma svarsfrekvenser i våra tester och kan vara för långsam för spelare. I jämförelse sträcker sig alla testade enheter från 0.1 (minst) till 240 (maximalt) ms. » 71 % av alla enheter är bättre. Detta innebär att den uppmätta svarstiden är sämre än genomsnittet av alla testade enheter (19.8 ms). | ||
| ↔ Svarstid 50 % grått till 80 % grått | ||
| 37.6 ms ... stiga ↗ och falla ↘ kombinerat | ↗ 19.6 ms stiga | 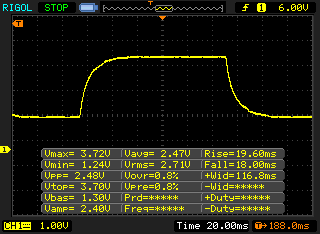 |
| ↘ 18 ms hösten | ||
| Skärmen visar långsamma svarsfrekvenser i våra tester och kommer att vara otillfredsställande för spelare. I jämförelse sträcker sig alla testade enheter från 0.165 (minst) till 636 (maximalt) ms. » 55 % av alla enheter är bättre. Detta innebär att den uppmätta svarstiden är sämre än genomsnittet av alla testade enheter (31 ms). | ||
Skärmflimmer / PWM (Puls-Width Modulation)
| Skärmflimmer / PWM upptäcktes inte | 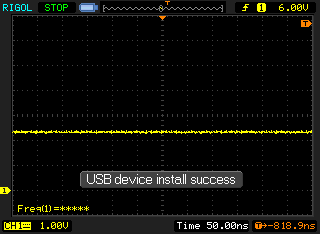 | ||
Som jämförelse: 52 % av alla testade enheter använder inte PWM för att dämpa skärmen. Om PWM upptäcktes mättes ett medelvärde av 7778 (minst: 5 - maximum: 343500) Hz. | |||
* ... mindre är bättre
| PCMark 8 Home Score Accelerated v2 | 4227 poäng | |
| PCMark 8 Creative Score Accelerated v2 | 5312 poäng | |
| PCMark 8 Work Score Accelerated v2 | 5102 poäng | |
| PCMark 10 Score | 4248 poäng | |
Hjälp | ||
| Lenovo ThinkBook 15 Samsung SSD PM981 MZVLB512HAJQ | Lenovo ThinkPad E595-20NF0000GE SK Hynix BC501 HFM512GDJTNG | Lenovo ThinkPad L590-20Q70019GE Toshiba XG6 KXG6AZNV512G | Schenker Slim 15 L19 Samsung SSD 970 EVO Plus 500GB | HP ProBook 450 G6-5TJ93EA Samsung SSD PM981 MZVLB512HAJQ | Dell Latitude 15 3590 Samsung SSD PM871b MZ7LN256HAJQ | Genomsnitt Samsung SSD PM981 MZVLB512HAJQ | |
|---|---|---|---|---|---|---|---|
| CrystalDiskMark 5.2 / 6 | -38% | -27% | 1% | -12% | -60% | -12% | |
| Write 4K (MB/s) | 176.3 | 129.5 -27% | 115.3 -35% | 188.7 7% | 126.1 -28% | 79.5 -55% | 126.7 ? -28% |
| Read 4K (MB/s) | 48.98 | 41.23 -16% | 43.34 -12% | 51.9 6% | 43.92 -10% | 32.72 -33% | 44 ? -10% |
| Write Seq (MB/s) | 1789 | 811 -55% | 1014 -43% | 1566 -12% | 1669 -7% | 472.5 -74% | 1617 ? -10% |
| Read Seq (MB/s) | 1671 | 1145 -31% | 1481 -11% | 1452 -13% | 2224 33% | 504 -70% | 1716 ? 3% |
| Write 4K Q32T1 (MB/s) | 433.5 | 314.1 -28% | 495.4 14% | 444 2% | 410.4 -5% | 322.6 -26% | 413 ? -5% |
| Read 4K Q32T1 (MB/s) | 526 | 356.2 -32% | 332.6 -37% | 566 8% | 338.1 -36% | 249.9 -52% | 420 ? -20% |
| Write Seq Q32T1 (MB/s) | 2983 | 839 -72% | 1654 -45% | 3279 10% | 1979 -34% | 531 -82% | 2076 ? -30% |
| Read Seq Q32T1 (MB/s) | 3555 | 2042 -43% | 1746 -51% | 3558 0% | 3368 -5% | 544 -85% | 3130 ? -12% |
| Write 4K Q8T8 (MB/s) | 1688 | 1033 -39% | 1264 ? -25% | ||||
| Read 4K Q8T8 (MB/s) | 1036 | 892 -14% | 1193 ? 15% | ||||
| AS SSD | -43% | -33% | -66% | -71% | -31% | ||
| Seq Read (MB/s) | 2564 | 1698 -34% | 1383 -46% | 2063 -20% | 498.7 -81% | 1976 ? -23% | |
| Seq Write (MB/s) | 2268 | 740 -67% | 852 -62% | 1163 -49% | 361.7 -84% | 1637 ? -28% | |
| 4K Read (MB/s) | 57 | 39.18 -31% | 45.72 -20% | 50.6 -11% | 34.65 -39% | 50.5 ? -11% | |
| 4K Write (MB/s) | 141.4 | 87.7 -38% | 120.2 -15% | 125.4 -11% | 79.8 -44% | 112 ? -21% | |
| 4K-64 Read (MB/s) | 1175 | 764 -35% | 1344 14% | 1352 15% | 372.5 -68% | 1203 ? 2% | |
| 4K-64 Write (MB/s) | 1665 | 669 -60% | 926 -44% | 1023 -39% | 247.7 -85% | 1504 ? -10% | |
| Access Time Read * (ms) | 0.032 | 0.04 -25% | 0.063 -97% | 0.044 -38% | 0.06 -88% | 0.05092 ? -59% | |
| Access Time Write * (ms) | 0.025 | 0.036 -44% | 0.036 -44% | 0.182 -628% | 0.042 -68% | 0.08337 ? -233% | |
| Score Read (Points) | 1488 | 973 -35% | 1528 3% | 1608 8% | 457 -69% | 1451 ? -2% | |
| Score Write (Points) | 2033 | 831 -59% | 1132 -44% | 1265 -38% | 364 -82% | 1780 ? -12% | |
| Score Total (Points) | 4279 | 2261 -47% | 3420 -20% | 3658 -15% | 1060 -75% | 3966 ? -7% | |
| Copy ISO MB/s (MB/s) | 2118 | 1147 -46% | 1382 -35% | 1755 ? -17% | |||
| Copy Program MB/s (MB/s) | 495.6 | 419.8 -15% | 414.3 -16% | 454 ? -8% | |||
| Copy Game MB/s (MB/s) | 1174 | 928 -21% | 660 -44% | 1057 ? -10% | |||
| Totalt genomsnitt (program/inställningar) | -41% /
-41% | -30% /
-30% | 1% /
1% | -39% /
-46% | -66% /
-66% | -22% /
-23% |
* ... mindre är bättre

| 3DMark 11 - 1280x720 Performance GPU | |
| Genomsnitt av klass Office (2551 - 18313, n=69, senaste 2 åren) | |
| Lenovo ThinkPad E595-20NF0000GE | |
| HP ProBook 450 G6-5TJ93EA | |
| Lenovo ThinkBook 15 | |
| Schenker Slim 15 L19 | |
| Genomsnitt Intel UHD Graphics 620 (1144 - 3432, n=244) | |
| Lenovo ThinkPad L590-20Q70019GE | |
| Dell Latitude 15 3590 | |
| 3DMark | |
| 1280x720 Cloud Gate Standard Graphics | |
| Genomsnitt av klass Office (11640 - 118515, n=37, senaste 2 åren) | |
| Lenovo ThinkPad E595-20NF0000GE | |
| HP ProBook 450 G6-5TJ93EA | |
| Lenovo ThinkBook 15 | |
| Schenker Slim 15 L19 | |
| Genomsnitt Intel UHD Graphics 620 (6205 - 16400, n=225) | |
| Lenovo ThinkPad L590-20Q70019GE | |
| Dell Latitude 15 3590 | |
| 1920x1080 Fire Strike Graphics | |
| Genomsnitt av klass Office (736 - 21871, n=73, senaste 2 åren) | |
| HP ProBook 450 G6-5TJ93EA | |
| Lenovo ThinkPad E595-20NF0000GE | |
| Lenovo ThinkBook 15 | |
| Schenker Slim 15 L19 | |
| Genomsnitt Intel UHD Graphics 620 (557 - 2608, n=213) | |
| Lenovo ThinkPad L590-20Q70019GE | |
| Dell Latitude 15 3590 | |
| 2560x1440 Time Spy Graphics | |
| Genomsnitt av klass Office (493 - 6679, n=68, senaste 2 åren) | |
| Lenovo ThinkBook 15 | |
| Schenker Slim 15 L19 | |
| Genomsnitt Intel UHD Graphics 620 (299 - 797, n=88) | |
| Lenovo ThinkPad L590-20Q70019GE | |
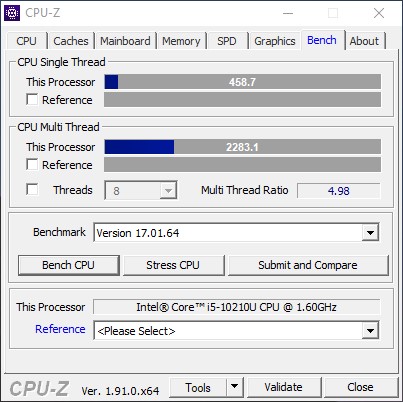
| 3DMark 11 Performance | 2165 poäng | |
| 3DMark Ice Storm Standard Score | 68444 poäng | |
| 3DMark Cloud Gate Standard Score | 8887 poäng | |
| 3DMark Fire Strike Score | 1182 poäng | |
| 3DMark Fire Strike Extreme Score | 528 poäng | |
| 3DMark Time Spy Score | 484 poäng | |
Hjälp | ||
| låg | med. | hög | ultra | |
|---|---|---|---|---|
| BioShock Infinite (2013) | 81.9 | 40.3 | 33.2 | 10.8 |
| Dota 2 Reborn (2015) | 84.6 | 53.7 | 21.9 | 19.6 |
| Rise of the Tomb Raider (2016) | 23.6 | 15.6 | 8.03 | |
| X-Plane 11.11 (2018) | 11.5 | 13.4 | 12.4 |
Ljudnivå
| Låg belastning |
| 29.2 / 29.2 / 29.9 dB(A) |
| Hög belastning |
| 30.6 / 33.8 dB(A) |
 | ||
30 dB tyst 40 dB(A) hörbar 50 dB(A) högt ljud |
||
min: | ||
| Lenovo ThinkBook 15 UHD Graphics 620, i5-10210U, Samsung SSD PM981 MZVLB512HAJQ | Lenovo ThinkPad E595-20NF0000GE Vega 10, R7 3700U, SK Hynix BC501 HFM512GDJTNG | Lenovo ThinkPad L590-20Q70019GE UHD Graphics 620, i5-8265U, Toshiba XG6 KXG6AZNV512G | Schenker Slim 15 L19 UHD Graphics 620, i5-10210U, Samsung SSD 970 EVO Plus 500GB | HP ProBook 450 G6-5TJ93EA GeForce MX130, i7-8565U, Samsung SSD PM981 MZVLB512HAJQ | Dell Latitude 15 3590 UHD Graphics 620, i5-8250U, Samsung SSD PM871b MZ7LN256HAJQ | |
|---|---|---|---|---|---|---|
| Noise | -1% | 2% | -13% | -3% | -12% | |
| av / miljö * (dB) | 29.2 | 29.3 -0% | 29 1% | 30.6 -5% | 29 1% | 30.6 -5% |
| Idle Minimum * (dB) | 29.2 | 29.3 -0% | 29 1% | 30.6 -5% | 29 1% | 30.6 -5% |
| Idle Average * (dB) | 29.2 | 29.3 -0% | 29 1% | 30.6 -5% | 29 1% | 31.9 -9% |
| Idle Maximum * (dB) | 29.9 | 30.1 -1% | 29 3% | 30.6 -2% | 29 3% | 31.9 -7% |
| Load Average * (dB) | 30.6 | 30.9 -1% | 29 5% | 40.5 -32% | 34.2 -12% | 39 -27% |
| Load Maximum * (dB) | 33.8 | 35.2 -4% | 33.8 -0% | 42.7 -26% | 38.4 -14% | 39.1 -16% |
| Witcher 3 ultra * (dB) | 34.2 |
* ... mindre är bättre
(+) Den maximala temperaturen på ovansidan är 38 °C / 100 F, jämfört med genomsnittet av 34.3 °C / 94 F , allt från 21.2 till 62.5 °C för klassen Office.
(±) Botten värms upp till maximalt 43.9 °C / 111 F, jämfört med genomsnittet av 36.8 °C / 98 F
(+) Vid tomgångsbruk är medeltemperaturen för ovansidan 23.5 °C / 74 F, jämfört med enhetsgenomsnittet på 29.5 °C / ### class_avg_f### F.
(+) Handledsstöden och pekplattan är kallare än hudtemperaturen med maximalt 27.8 °C / 82 F och är därför svala att ta på.
(±) Medeltemperaturen för handledsstödsområdet på liknande enheter var 27.5 °C / 81.5 F (-0.3 °C / -0.5 F).
| Lenovo ThinkBook 15 UHD Graphics 620, i5-10210U, Samsung SSD PM981 MZVLB512HAJQ | Lenovo ThinkPad E595-20NF0000GE Vega 10, R7 3700U, SK Hynix BC501 HFM512GDJTNG | Lenovo ThinkPad L590-20Q70019GE UHD Graphics 620, i5-8265U, Toshiba XG6 KXG6AZNV512G | Schenker Slim 15 L19 UHD Graphics 620, i5-10210U, Samsung SSD 970 EVO Plus 500GB | HP ProBook 450 G6-5TJ93EA GeForce MX130, i7-8565U, Samsung SSD PM981 MZVLB512HAJQ | Dell Latitude 15 3590 UHD Graphics 620, i5-8250U, Samsung SSD PM871b MZ7LN256HAJQ | |
|---|---|---|---|---|---|---|
| Heat | -20% | -11% | 1% | -2% | 1% | |
| Maximum Upper Side * (°C) | 38 | 48.8 -28% | 42.7 -12% | 37 3% | 39.4 -4% | 40.6 -7% |
| Maximum Bottom * (°C) | 43.9 | 48.4 -10% | 51 -16% | 43.1 2% | 50.2 -14% | 37.5 15% |
| Idle Upper Side * (°C) | 24.5 | 29.1 -19% | 25.9 -6% | 25.1 -2% | 22.9 7% | 26.3 -7% |
| Idle Bottom * (°C) | 25.4 | 31 -22% | 28.3 -11% | 25.1 1% | 24.1 5% | 25.2 1% |
* ... mindre är bättre
Lenovo ThinkBook 15 ljudanalys
(-) | inte särskilt höga högtalare (68.9 dB)
Bas 100 - 315 Hz
(-) | nästan ingen bas - i genomsnitt 18.4% lägre än medianen
(±) | linjäriteten för basen är genomsnittlig (7.3% delta till föregående frekvens)
Mellan 400 - 2000 Hz
(±) | högre mellan - i genomsnitt 8.1% högre än median
(±) | linjäriteten för mids är genomsnittlig (12.5% delta till föregående frekvens)
Högsta 2 - 16 kHz
(±) | högre toppar - i genomsnitt 6.1% högre än medianen
(±) | linjäriteten för toppar är genomsnittlig (13.1% delta till föregående frekvens)
Totalt 100 - 16 000 Hz
(-) | det totala ljudet är inte linjärt (38.1% skillnad mot median)
Jämfört med samma klass
» 98% av alla testade enheter i den här klassen var bättre, 1% liknande, 1% sämre
» Den bästa hade ett delta på 7%, genomsnittet var 21%, sämst var 53%
Jämfört med alla testade enheter
» 95% av alla testade enheter var bättre, 1% liknande, 5% sämre
» Den bästa hade ett delta på 4%, genomsnittet var 24%, sämst var 134%
Schenker Slim 15 L19 ljudanalys
(-) | inte särskilt höga högtalare (70.7 dB)
Bas 100 - 315 Hz
(-) | nästan ingen bas - i genomsnitt 30.1% lägre än medianen
(+) | basen är linjär (6.4% delta till föregående frekvens)
Mellan 400 - 2000 Hz
(±) | högre mellan - i genomsnitt 8.7% högre än median
(±) | linjäriteten för mids är genomsnittlig (11.6% delta till föregående frekvens)
Högsta 2 - 16 kHz
(+) | balanserade toppar - endast 4.6% från medianen
(+) | toppar är linjära (6.5% delta till föregående frekvens)
Totalt 100 - 16 000 Hz
(-) | det totala ljudet är inte linjärt (32.4% skillnad mot median)
Jämfört med samma klass
» 95% av alla testade enheter i den här klassen var bättre, 1% liknande, 4% sämre
» Den bästa hade ett delta på 7%, genomsnittet var 21%, sämst var 53%
Jämfört med alla testade enheter
» 91% av alla testade enheter var bättre, 1% liknande, 7% sämre
» Den bästa hade ett delta på 4%, genomsnittet var 24%, sämst var 134%
| Av/Standby | |
| Låg belastning | |
| Hög belastning |
|
Förklaring:
min: | |
| Lenovo ThinkBook 15 i5-10210U, UHD Graphics 620, Samsung SSD PM981 MZVLB512HAJQ, IPS, 1920x1080, 15.6" | Lenovo ThinkPad E595-20NF0000GE R7 3700U, Vega 10, SK Hynix BC501 HFM512GDJTNG, IPS, 1920x1080, 15.6" | Lenovo ThinkPad L590-20Q70019GE i5-8265U, UHD Graphics 620, Toshiba XG6 KXG6AZNV512G, IPS, 1920x1080, 15.6" | Schenker Slim 15 L19 i5-10210U, UHD Graphics 620, Samsung SSD 970 EVO Plus 500GB, , 1920x1080, 15.6" | HP ProBook 450 G6-5TJ93EA i7-8565U, GeForce MX130, Samsung SSD PM981 MZVLB512HAJQ, IPS, 1920x1080, 15.6" | Dell Latitude 15 3590 i5-8250U, UHD Graphics 620, Samsung SSD PM871b MZ7LN256HAJQ, TN LED, 1920x1080, 15.6" | Genomsnitt Intel UHD Graphics 620 | Genomsnitt av klass Office | |
|---|---|---|---|---|---|---|---|---|
| Power Consumption | 5% | 3% | -23% | -11% | 3% | 4% | -10% | |
| Idle Minimum * (Watt) | 3.5 | 4.2 -20% | 3.96 -13% | 5.5 -57% | 3.12 11% | 4.3 -23% | 3.81 ? -9% | 4.41 ? -26% |
| Idle Average * (Watt) | 7.1 | 7.92 -12% | 6.9 3% | 8.9 -25% | 6.3 11% | 7.2 -1% | 6.94 ? 2% | 7.37 ? -4% |
| Idle Maximum * (Watt) | 7.8 | 8.16 -5% | 9.8 -26% | 9.1 -17% | 9.78 -25% | 9.8 -26% | 8.75 ? -12% | 8.58 ? -10% |
| Load Average * (Watt) | 38.9 | 29 25% | 31.4 19% | 47 -21% | 57.6 -48% | 38 2% | 35 ? 10% | 43 ? -11% |
| Load Maximum * (Watt) | 65.4 | 42.2 35% | 45.4 31% | 61.2 6% | 67.3 -3% | 24 63% | 47.5 ? 27% | 64.6 ? 1% |
| Witcher 3 ultra * (Watt) | 42 |
* ... mindre är bättre


| Lenovo ThinkBook 15 i5-10210U, UHD Graphics 620, 45 Wh | Lenovo ThinkPad E595-20NF0000GE R7 3700U, Vega 10, 45 Wh | Lenovo ThinkPad L590-20Q70019GE i5-8265U, UHD Graphics 620, 45 Wh | Schenker Slim 15 L19 i5-10210U, UHD Graphics 620, Wh | HP ProBook 450 G6-5TJ93EA i7-8565U, GeForce MX130, 45 Wh | Dell Latitude 15 3590 i5-8250U, UHD Graphics 620, 56 Wh | Genomsnitt av klass Office | |
|---|---|---|---|---|---|---|---|
| Batteridrifttid | 6% | 30% | -9% | 21% | 35% | 64% | |
| Reader / Idle (h) | 17.9 | 15.7 -12% | 17.4 -3% | 14.6 -18% | 20.2 13% | 23.7 ? 32% | |
| H.264 (h) | 7 | 8.6 23% | 9 29% | 7.7 10% | 10.3 47% | 15 ? 114% | |
| WiFi v1.3 (h) | 6.8 | 7.7 13% | 7.2 6% | 6.2 -9% | 9.7 43% | 9.1 34% | 12.9 ? 90% |
| Load (h) | 1.5 | 1.5 0% | 2.8 87% | 2.2 47% | 2.2 47% | 1.794 ? 20% |
För
Emot
Omdöme - Ett gediget arbetsverktyg i modern klädsel

Läs den fullständiga versionen av den här recensionen på engelska här.
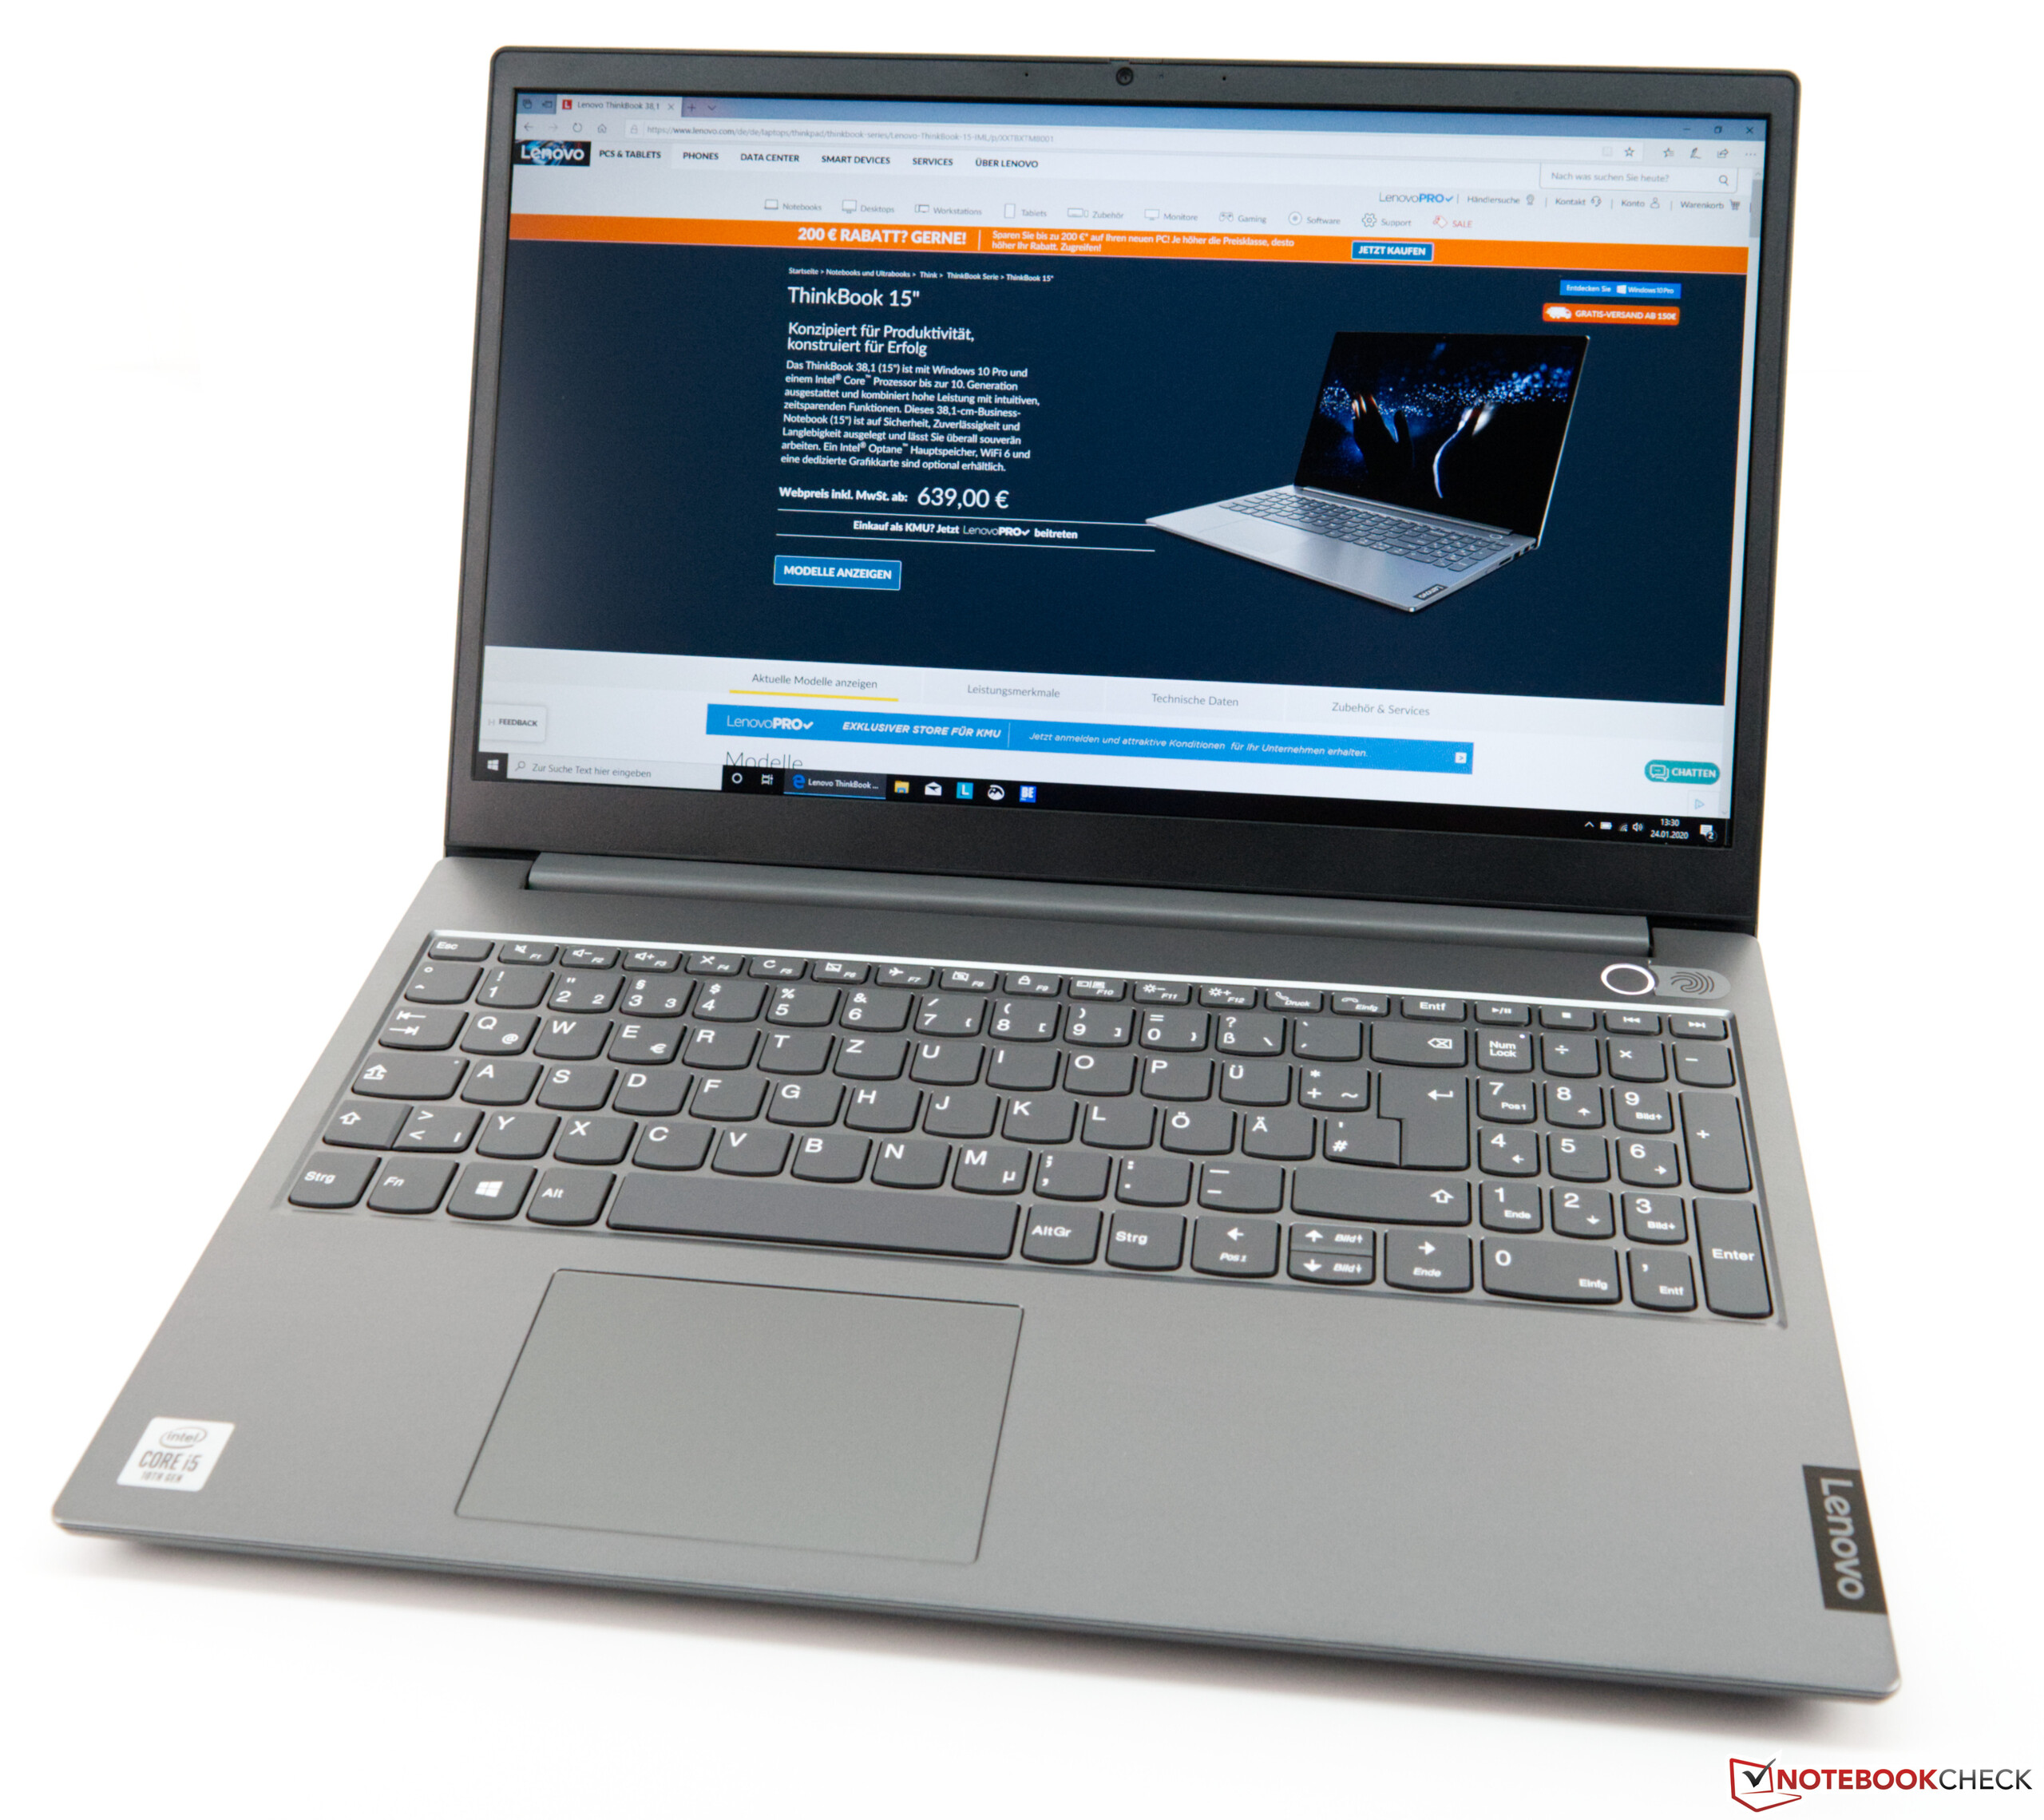
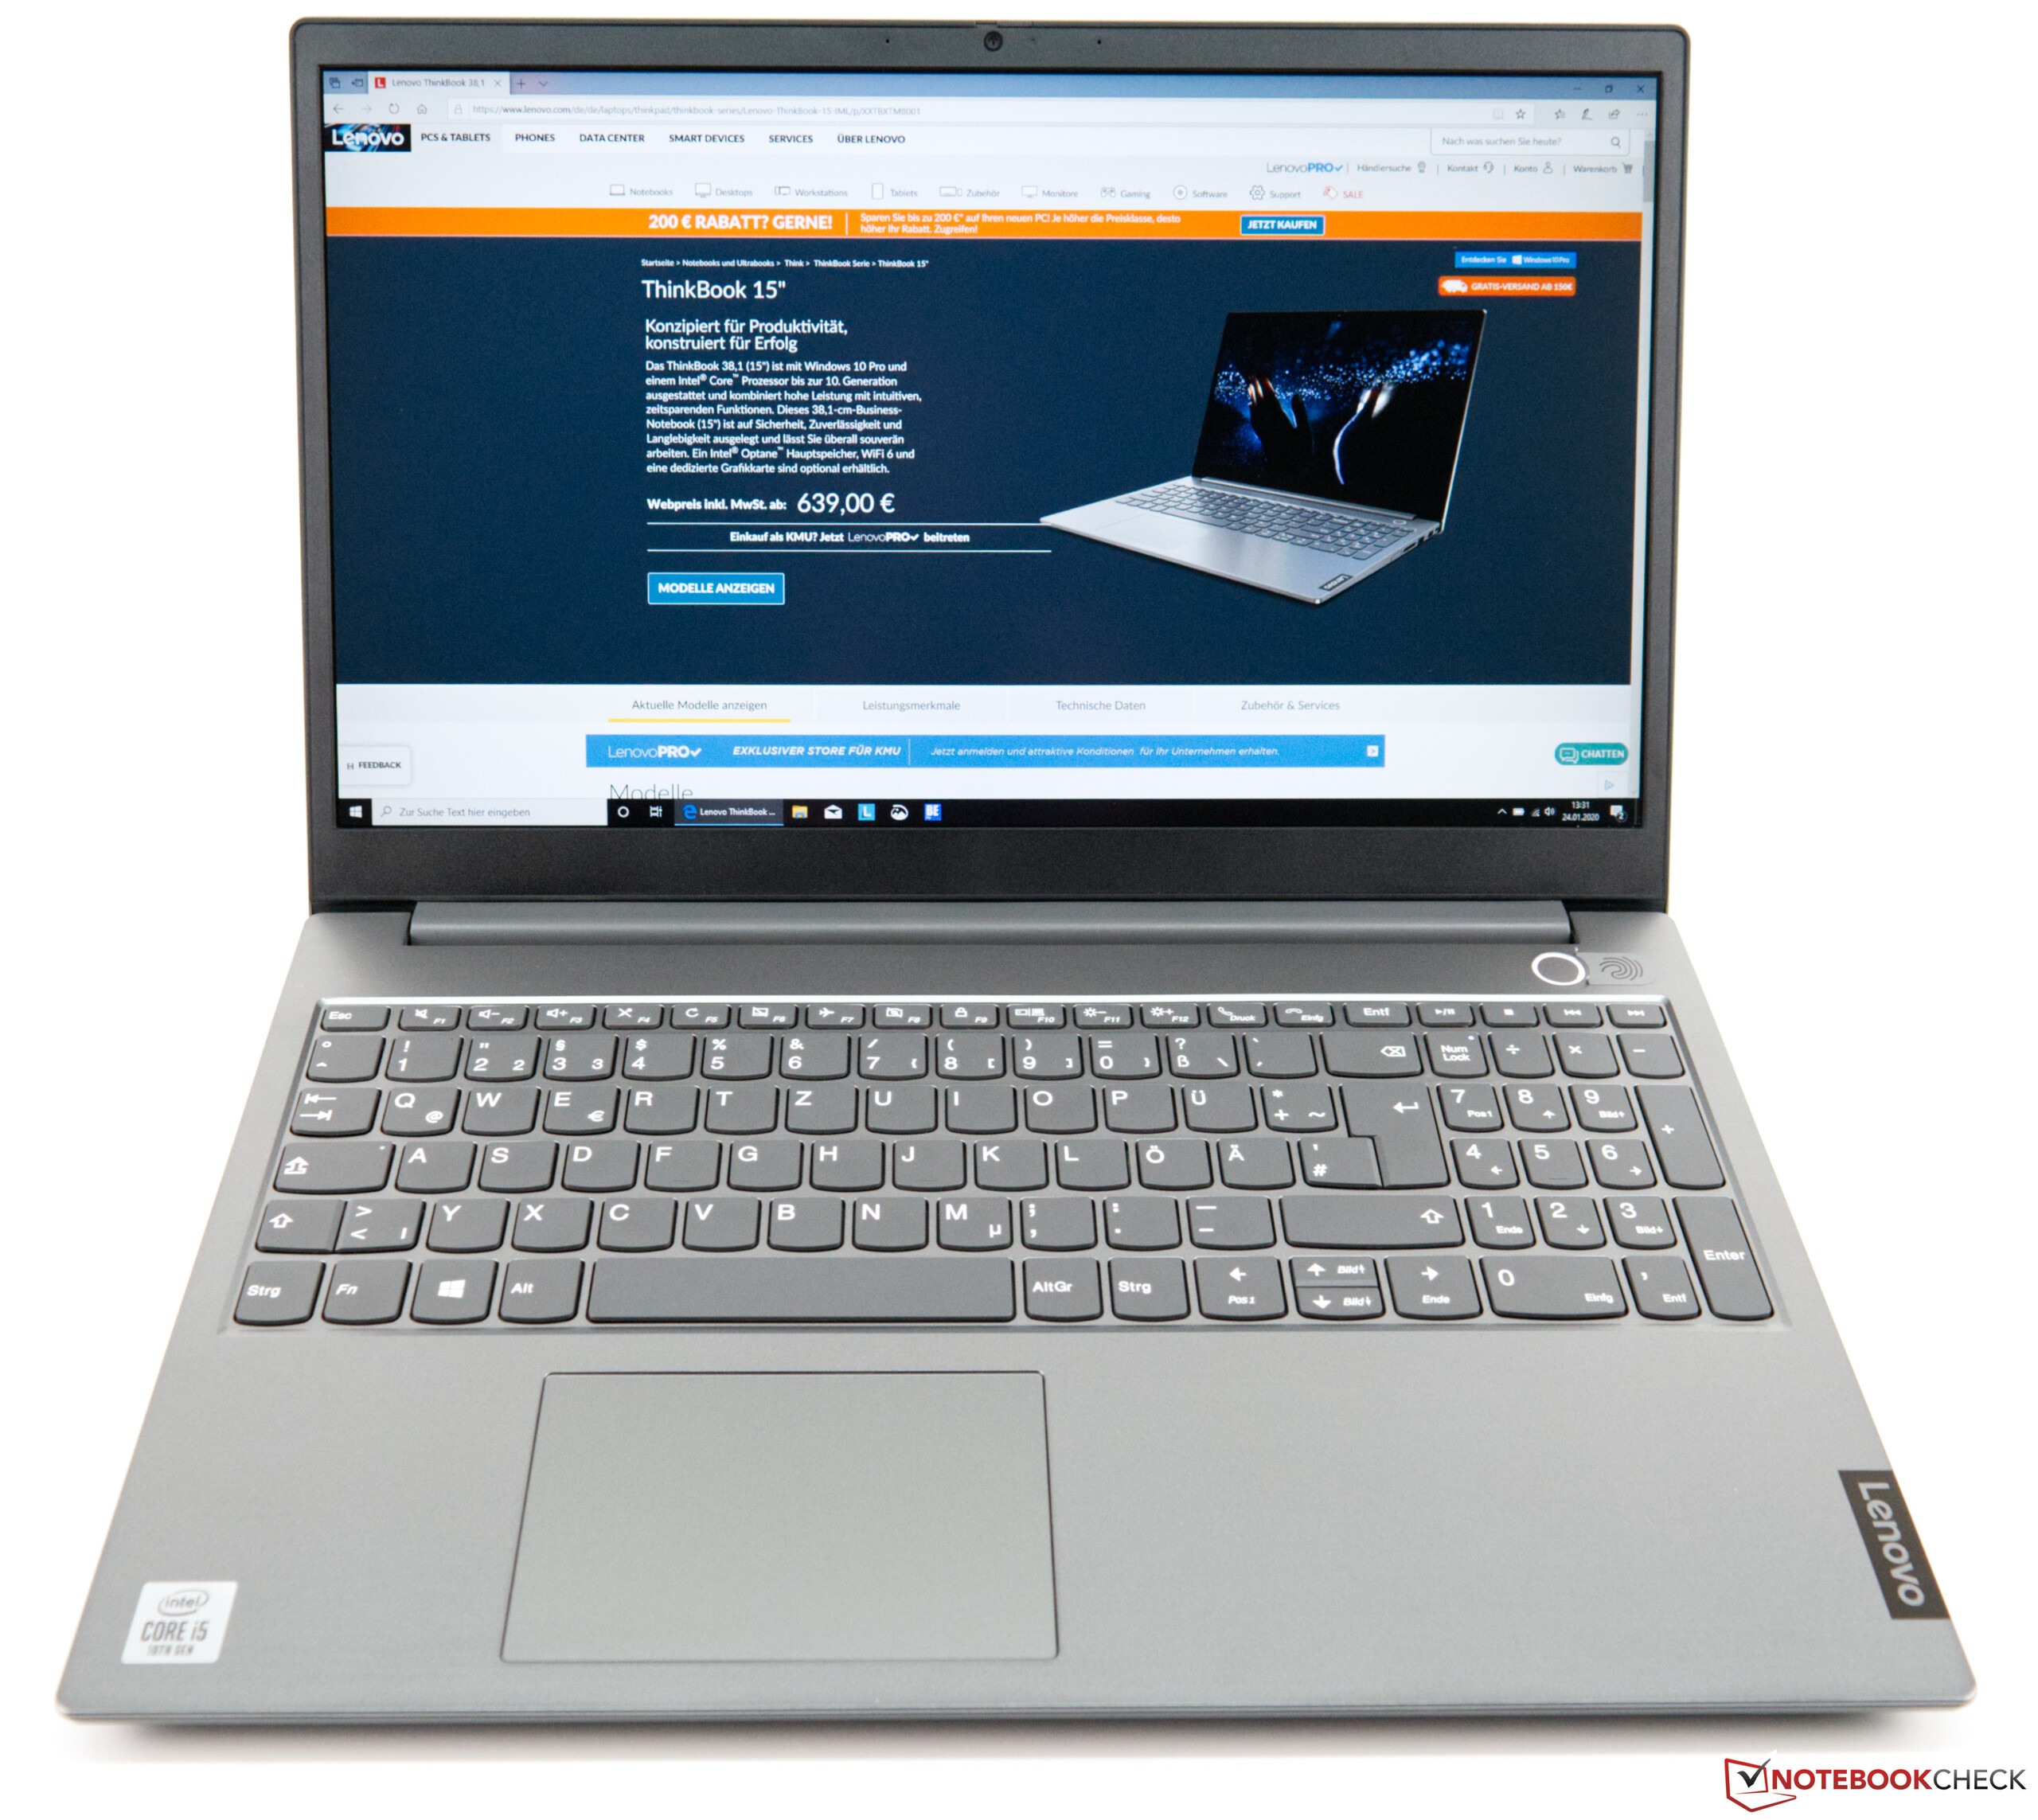
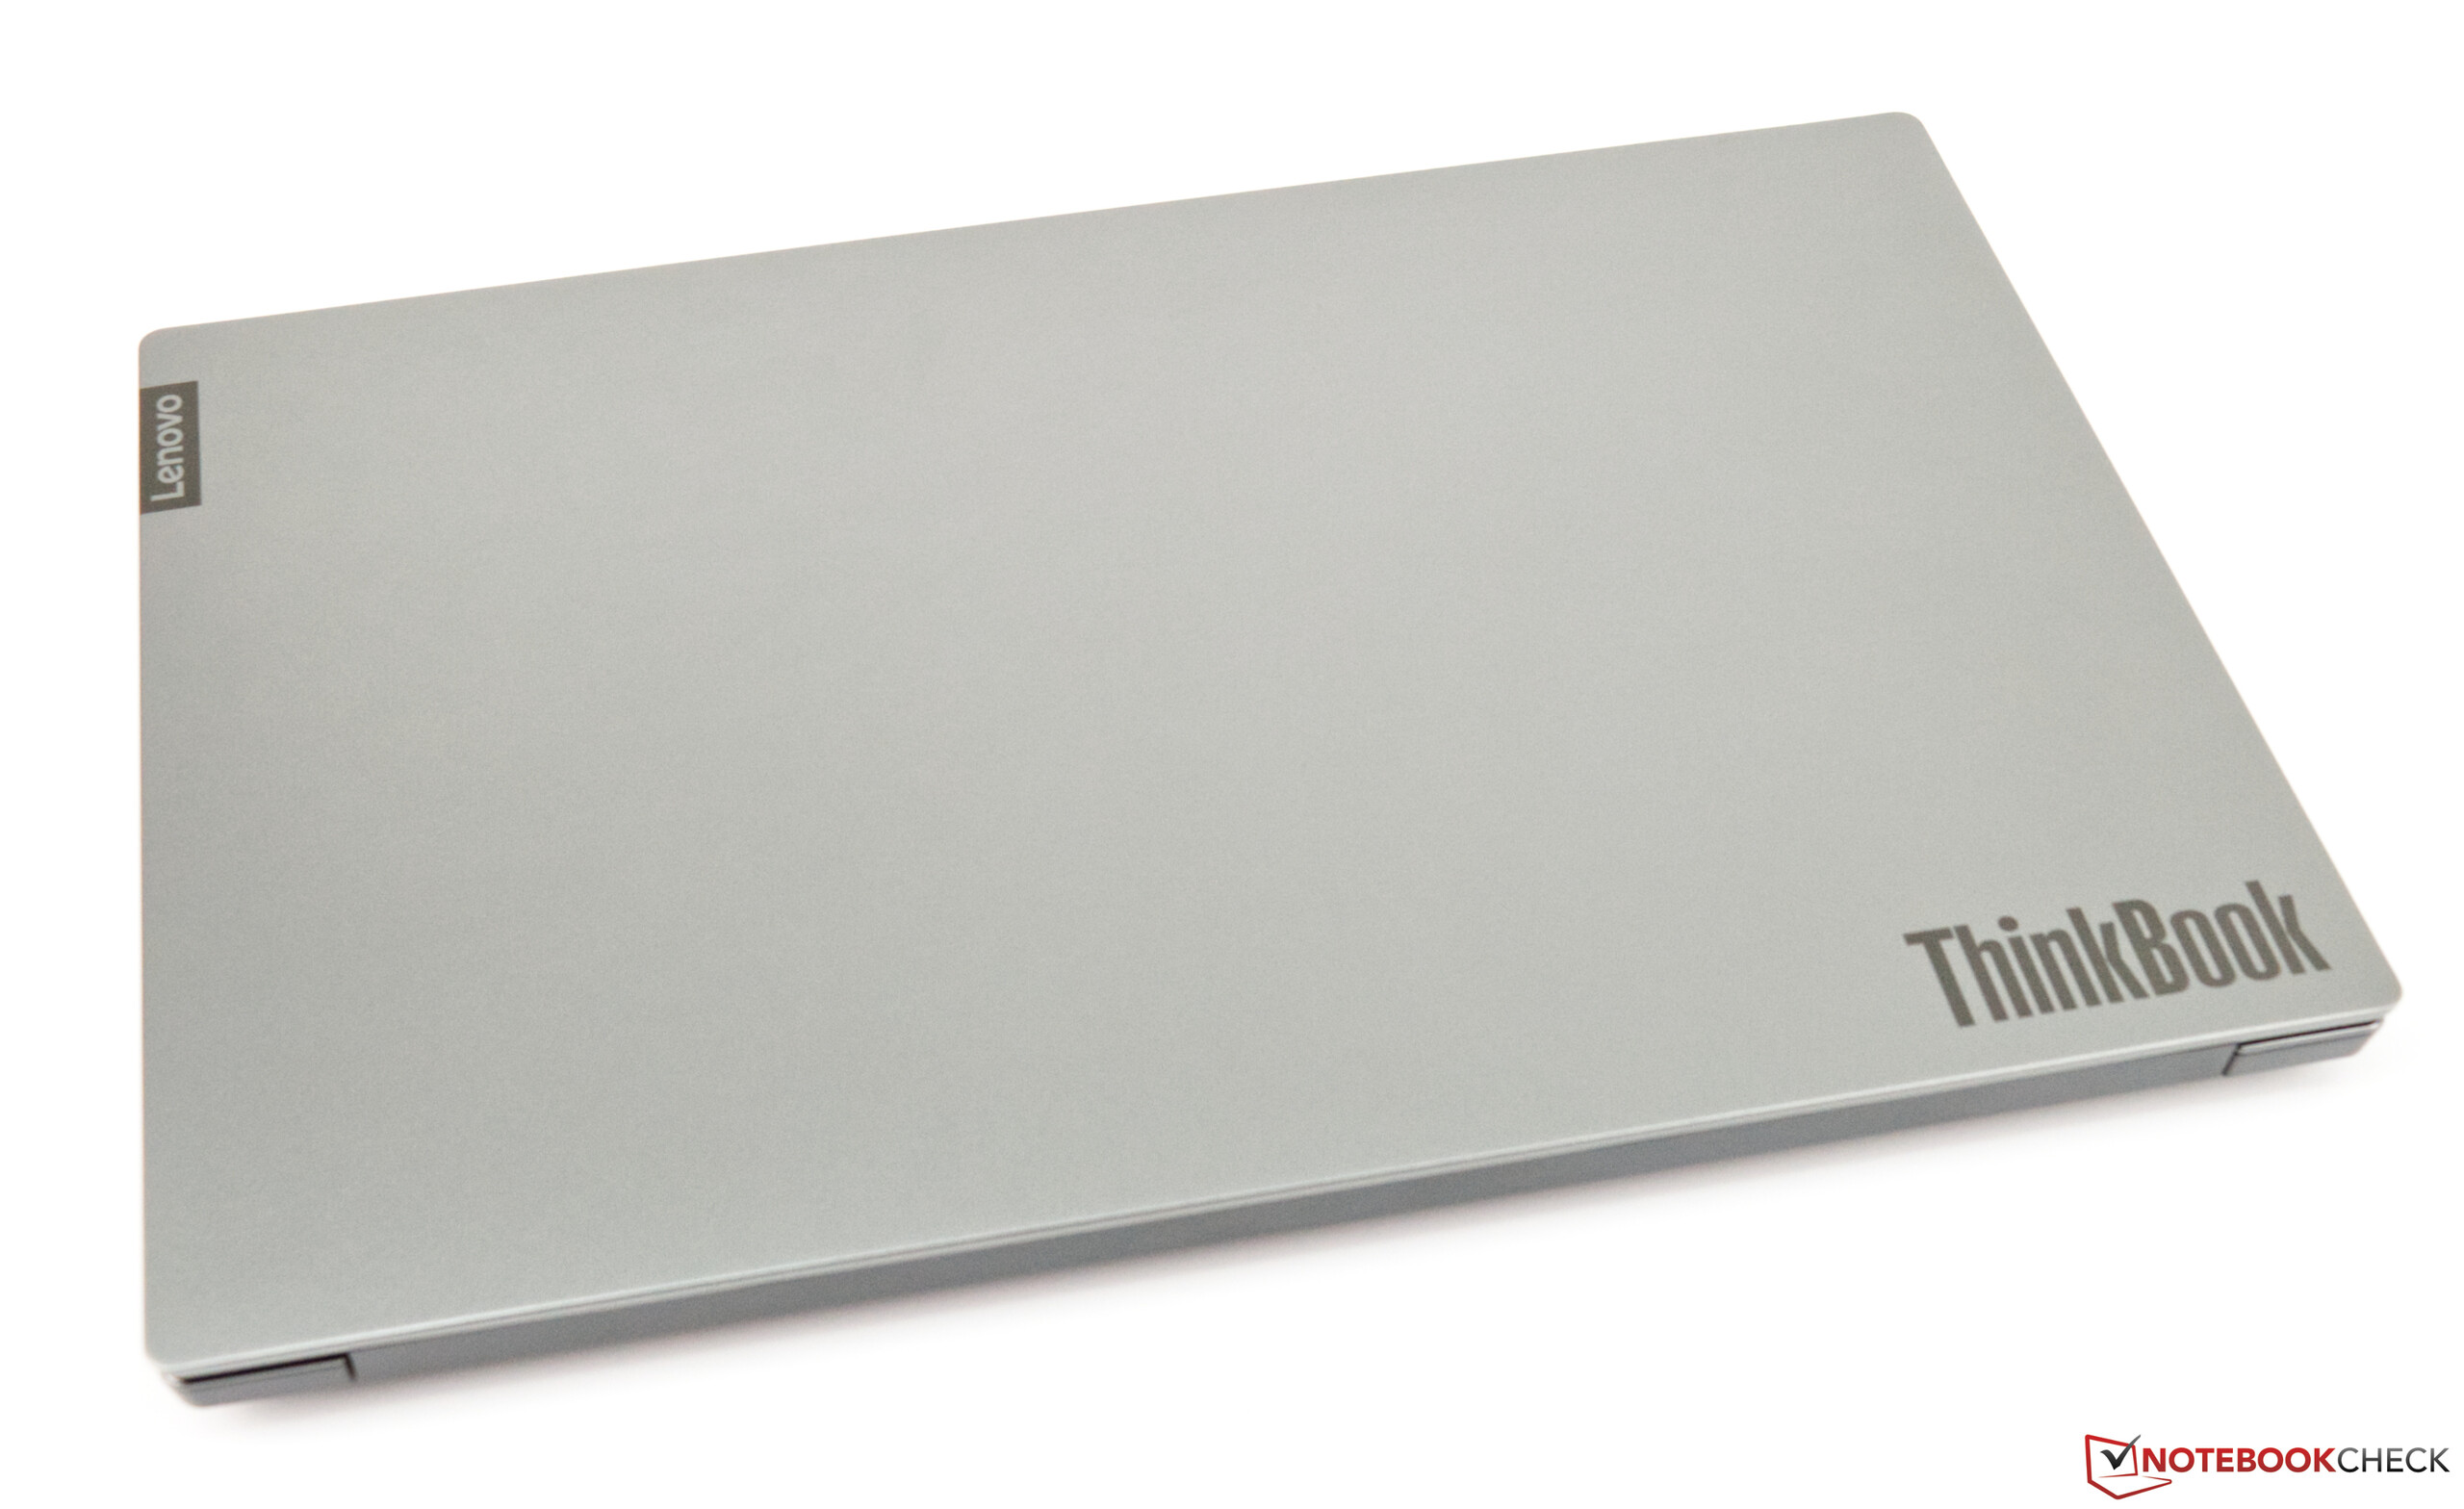
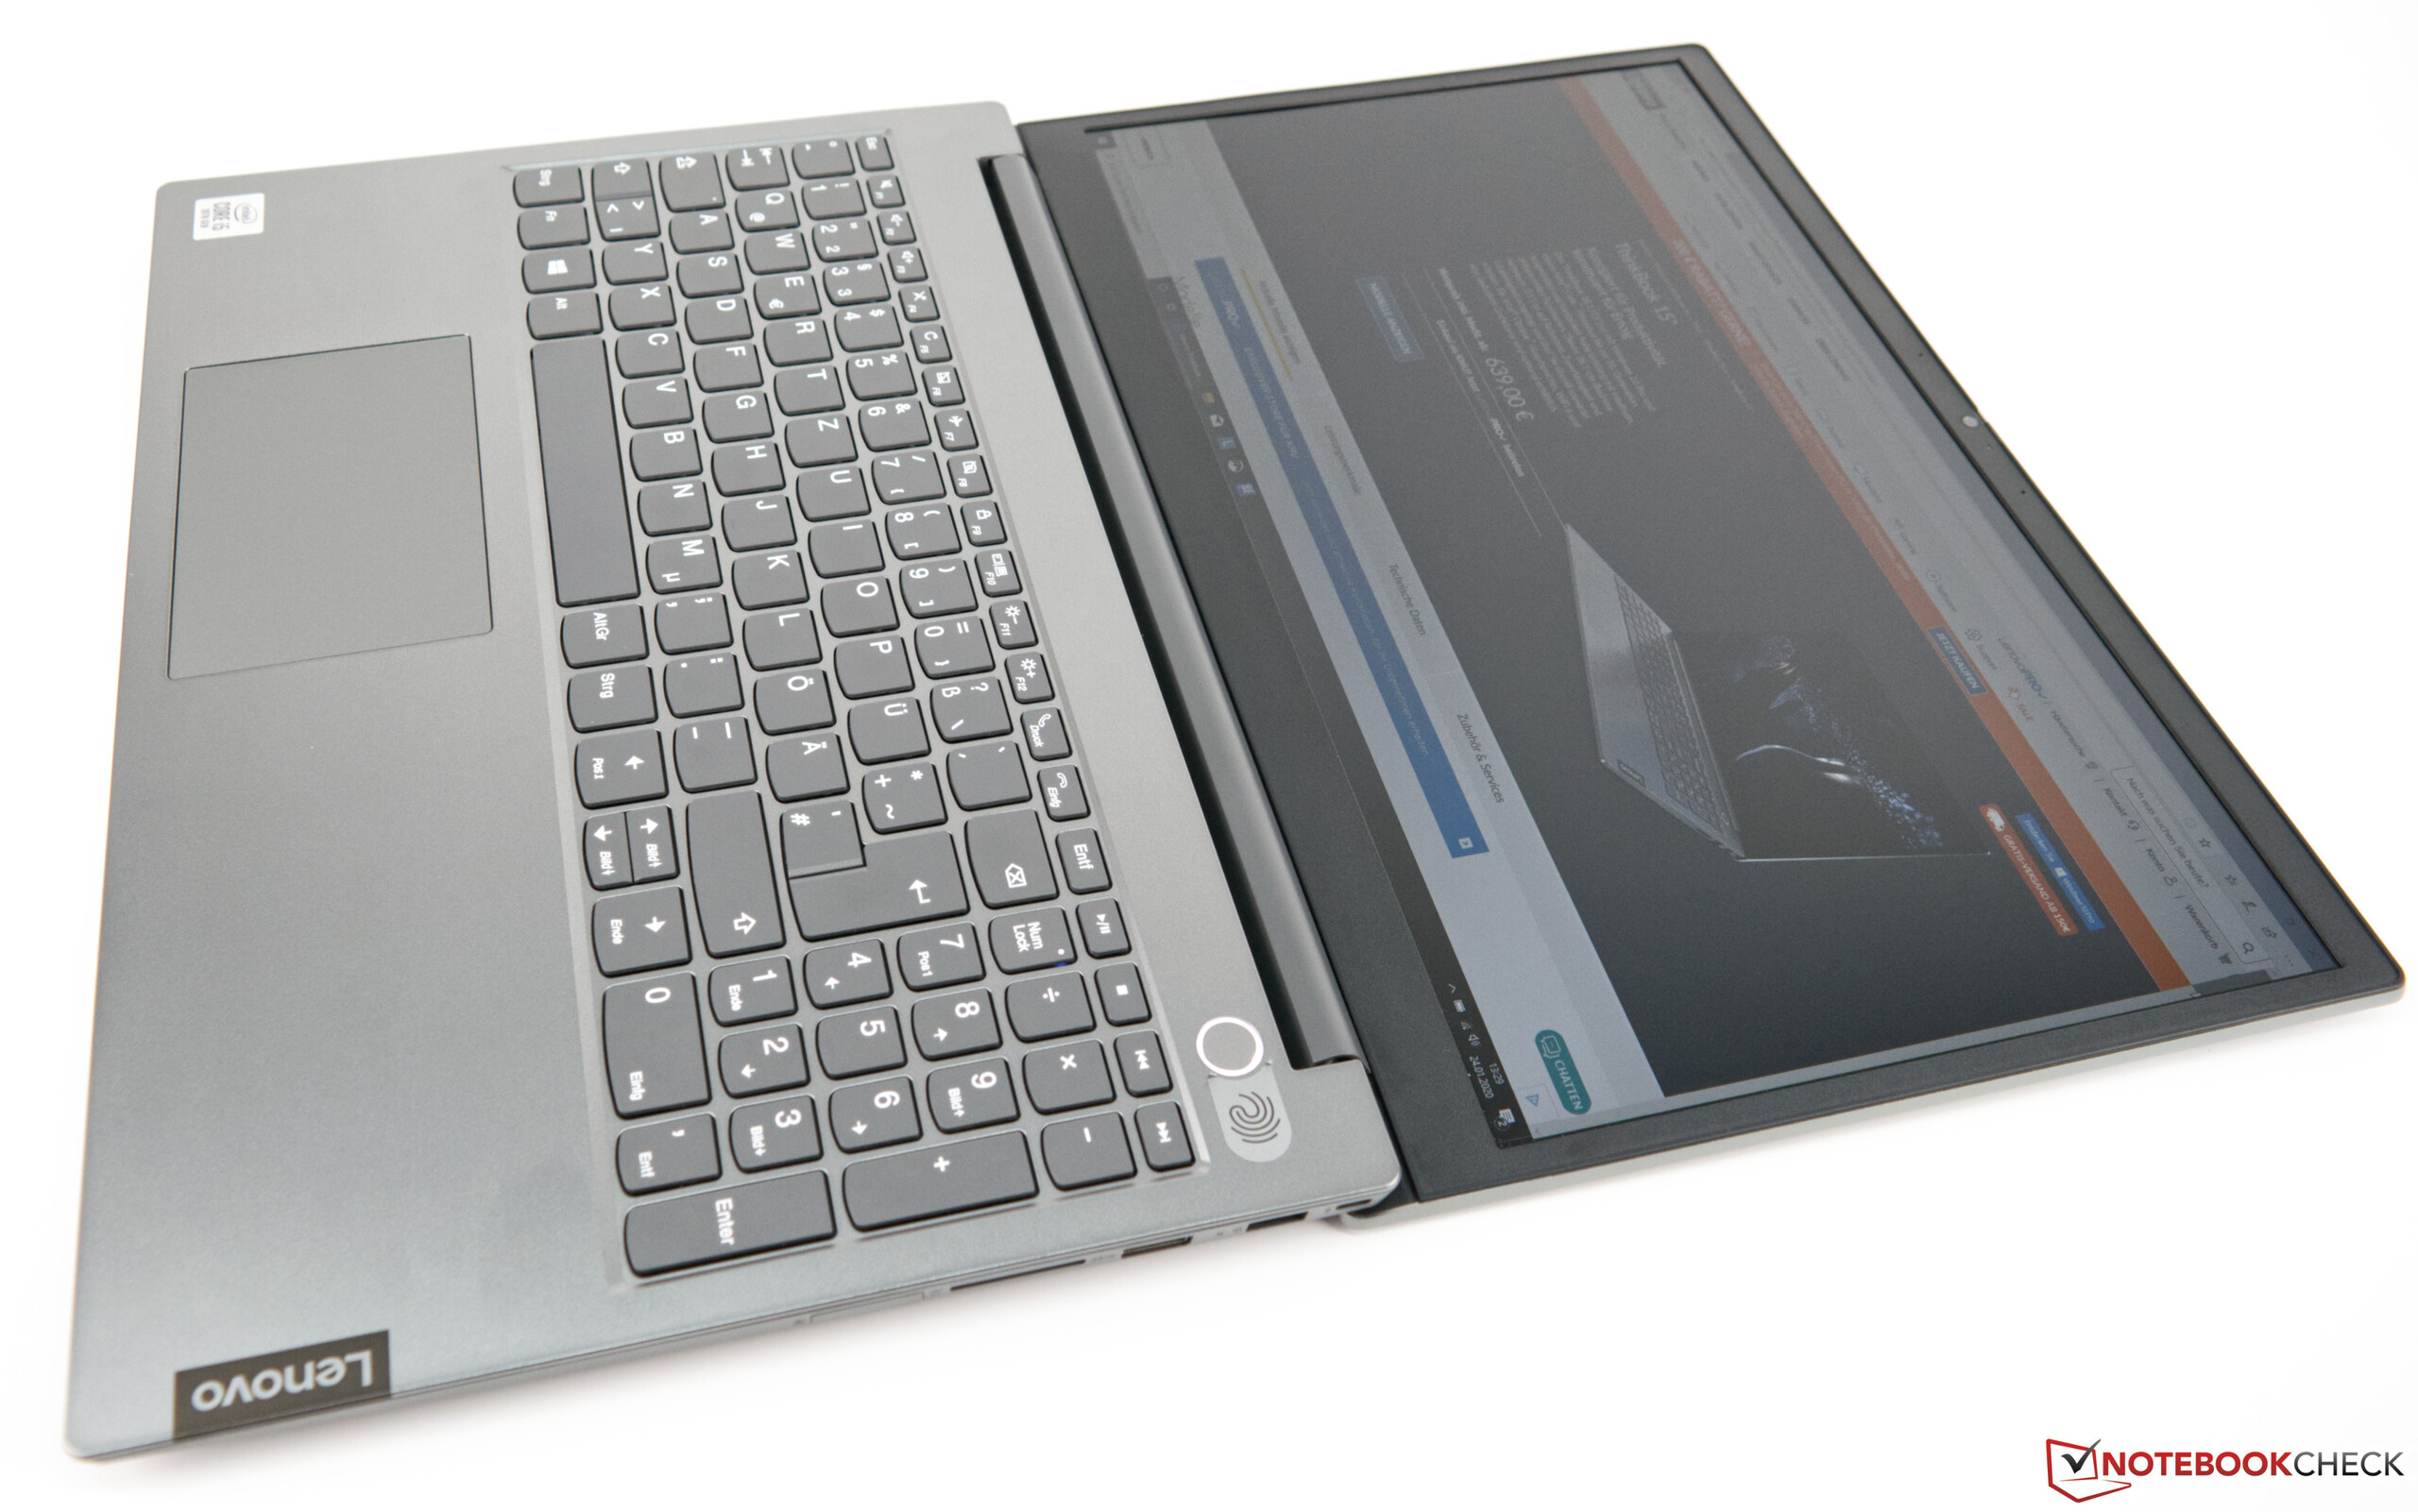
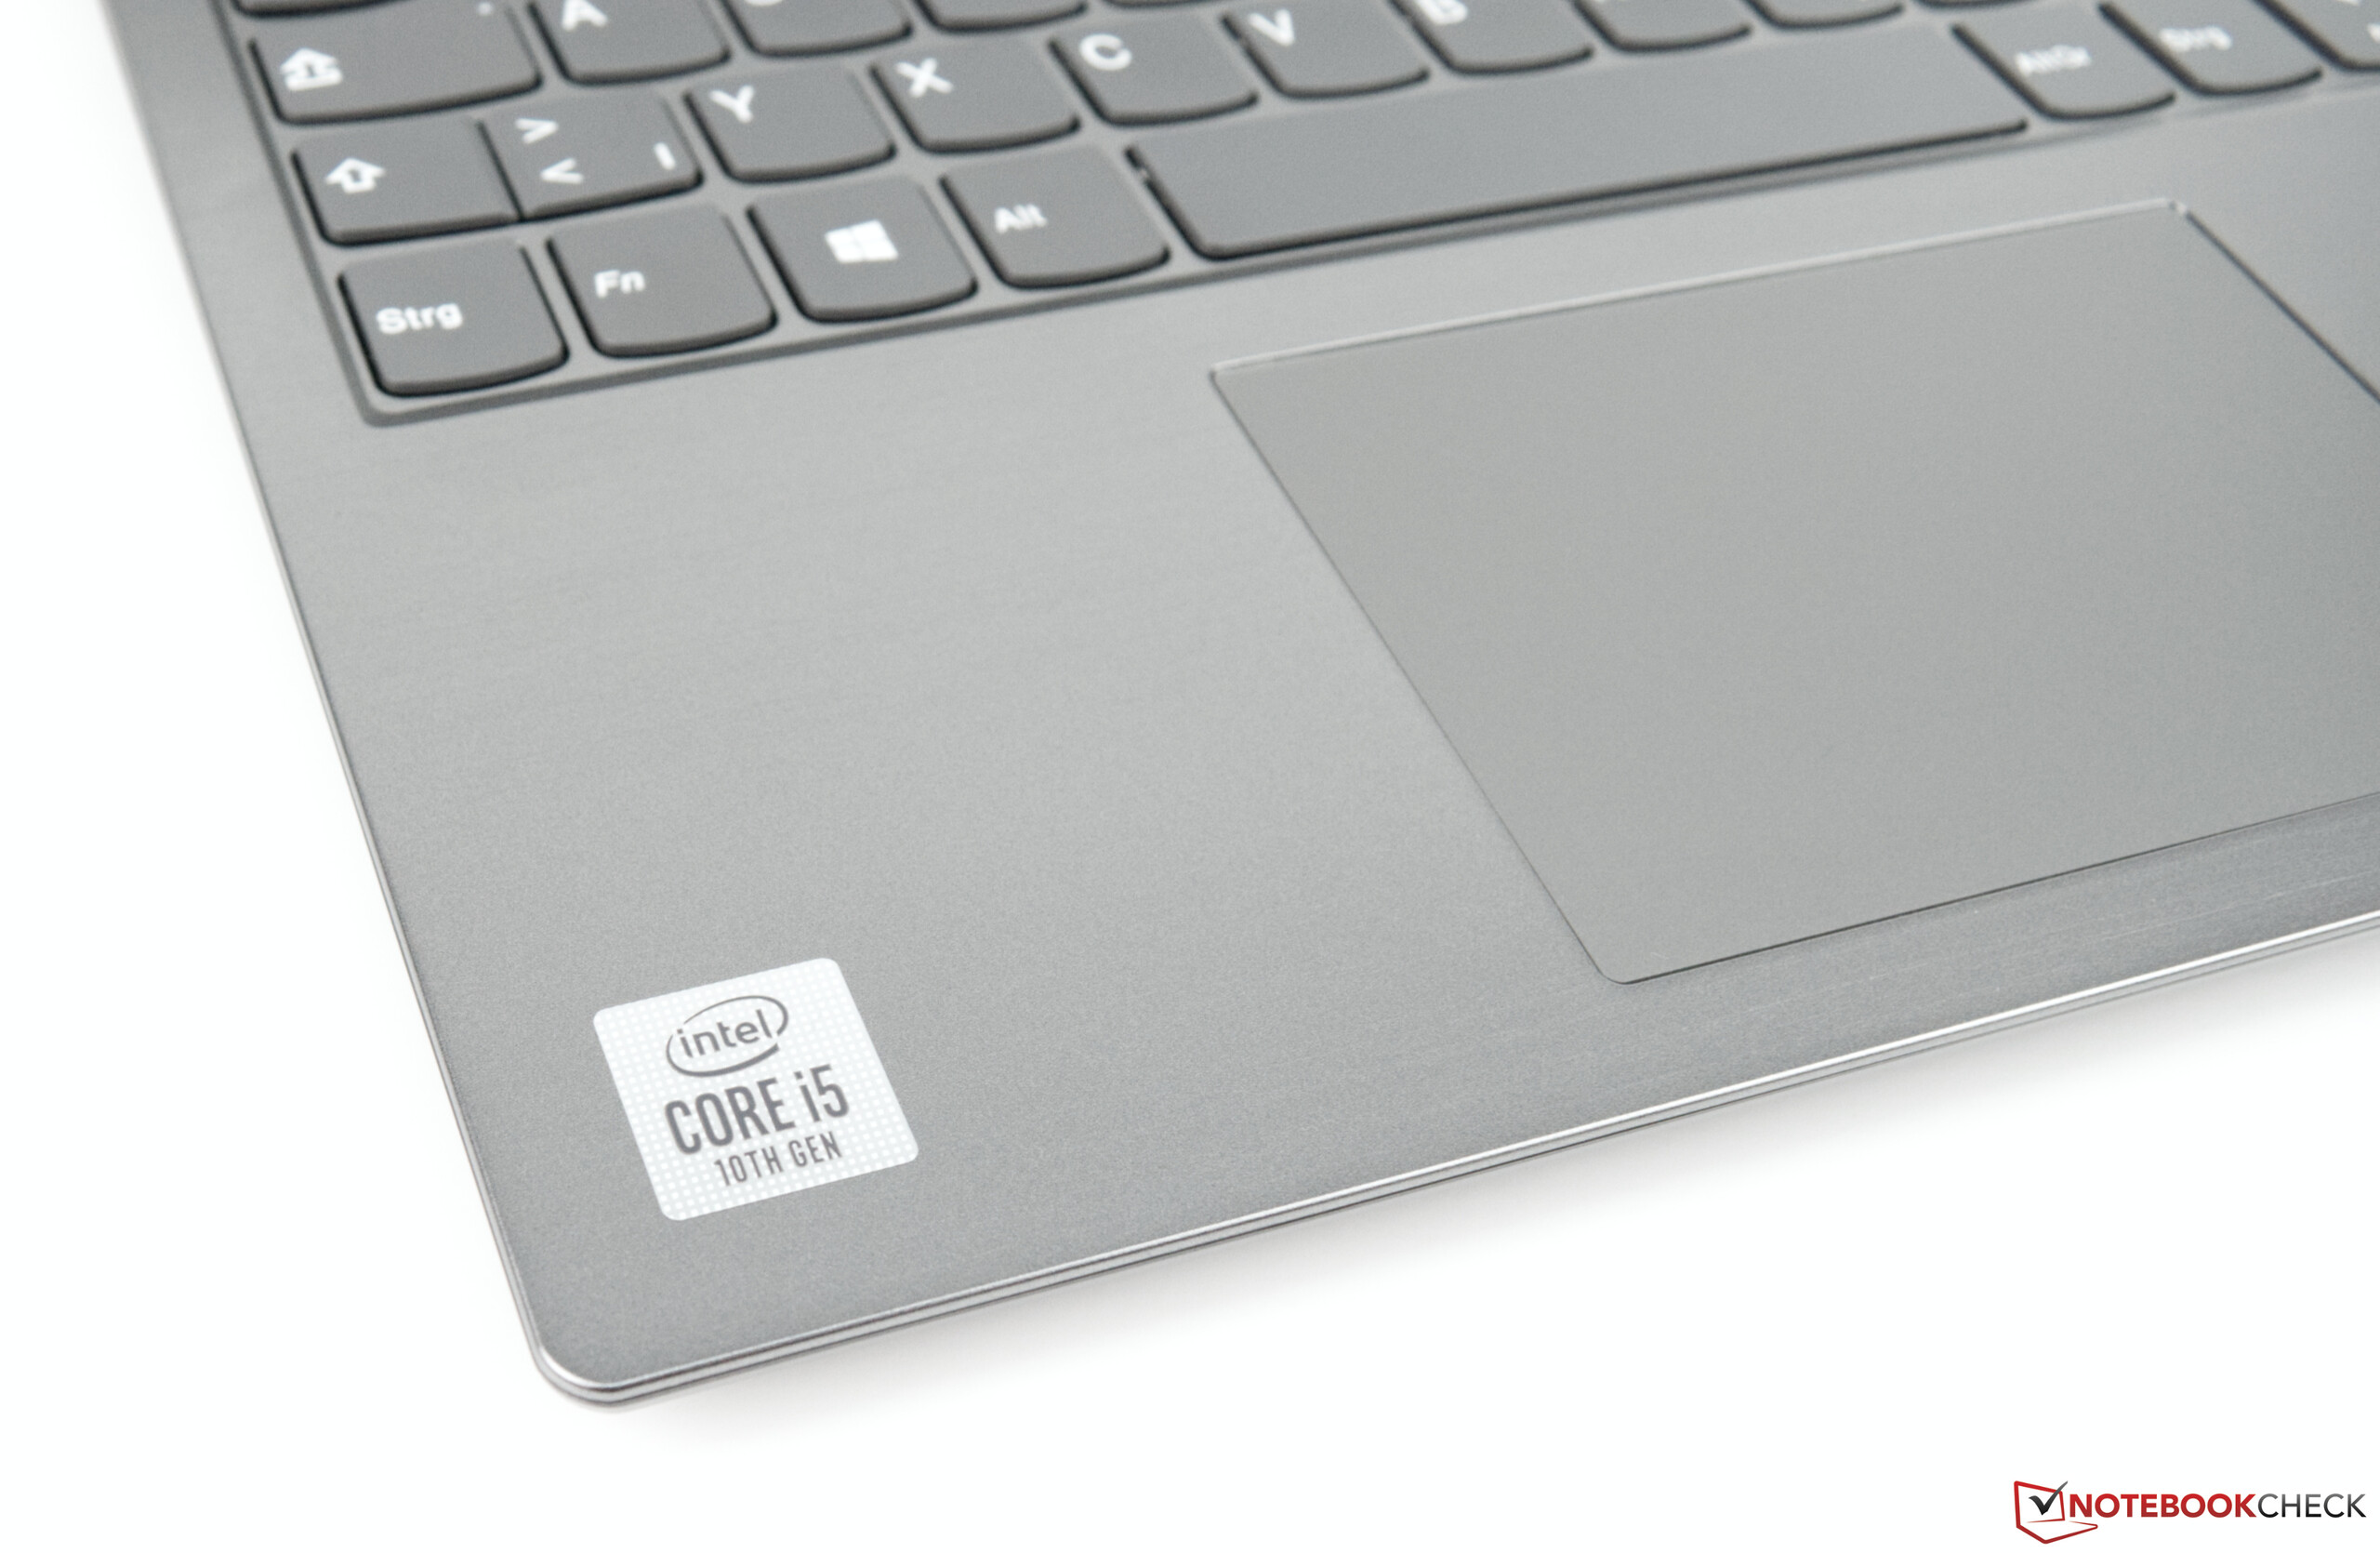
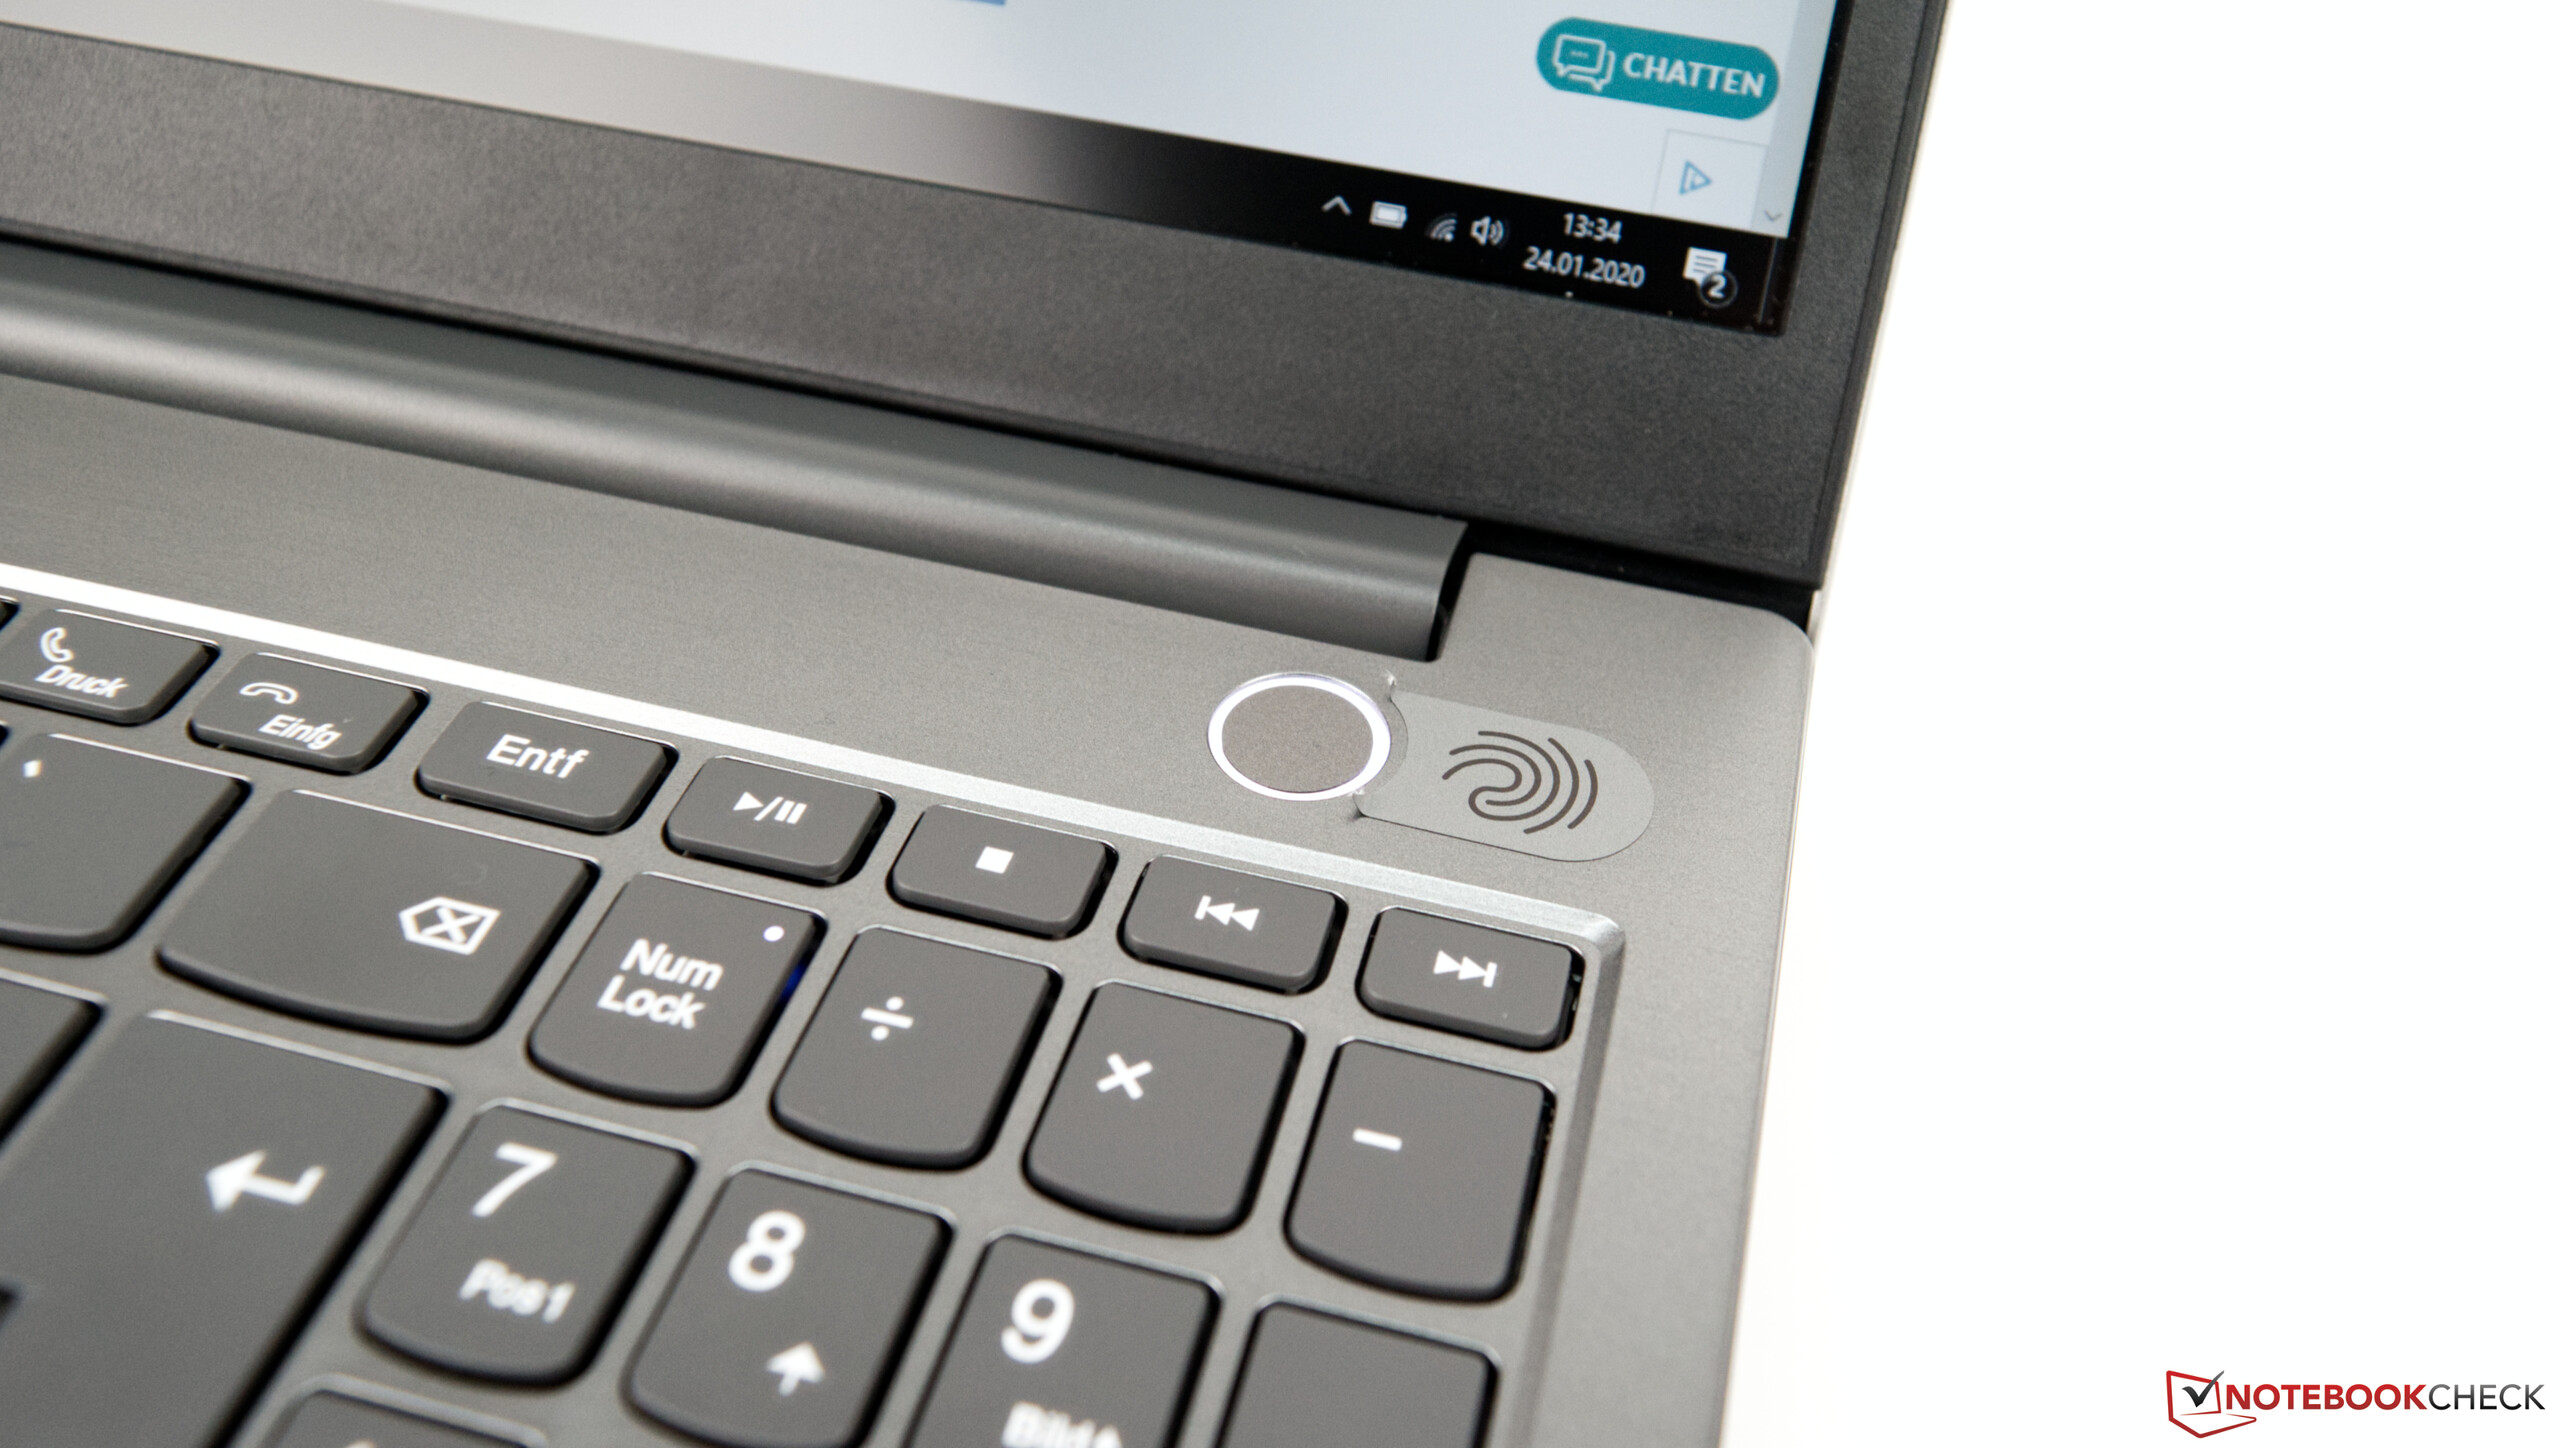
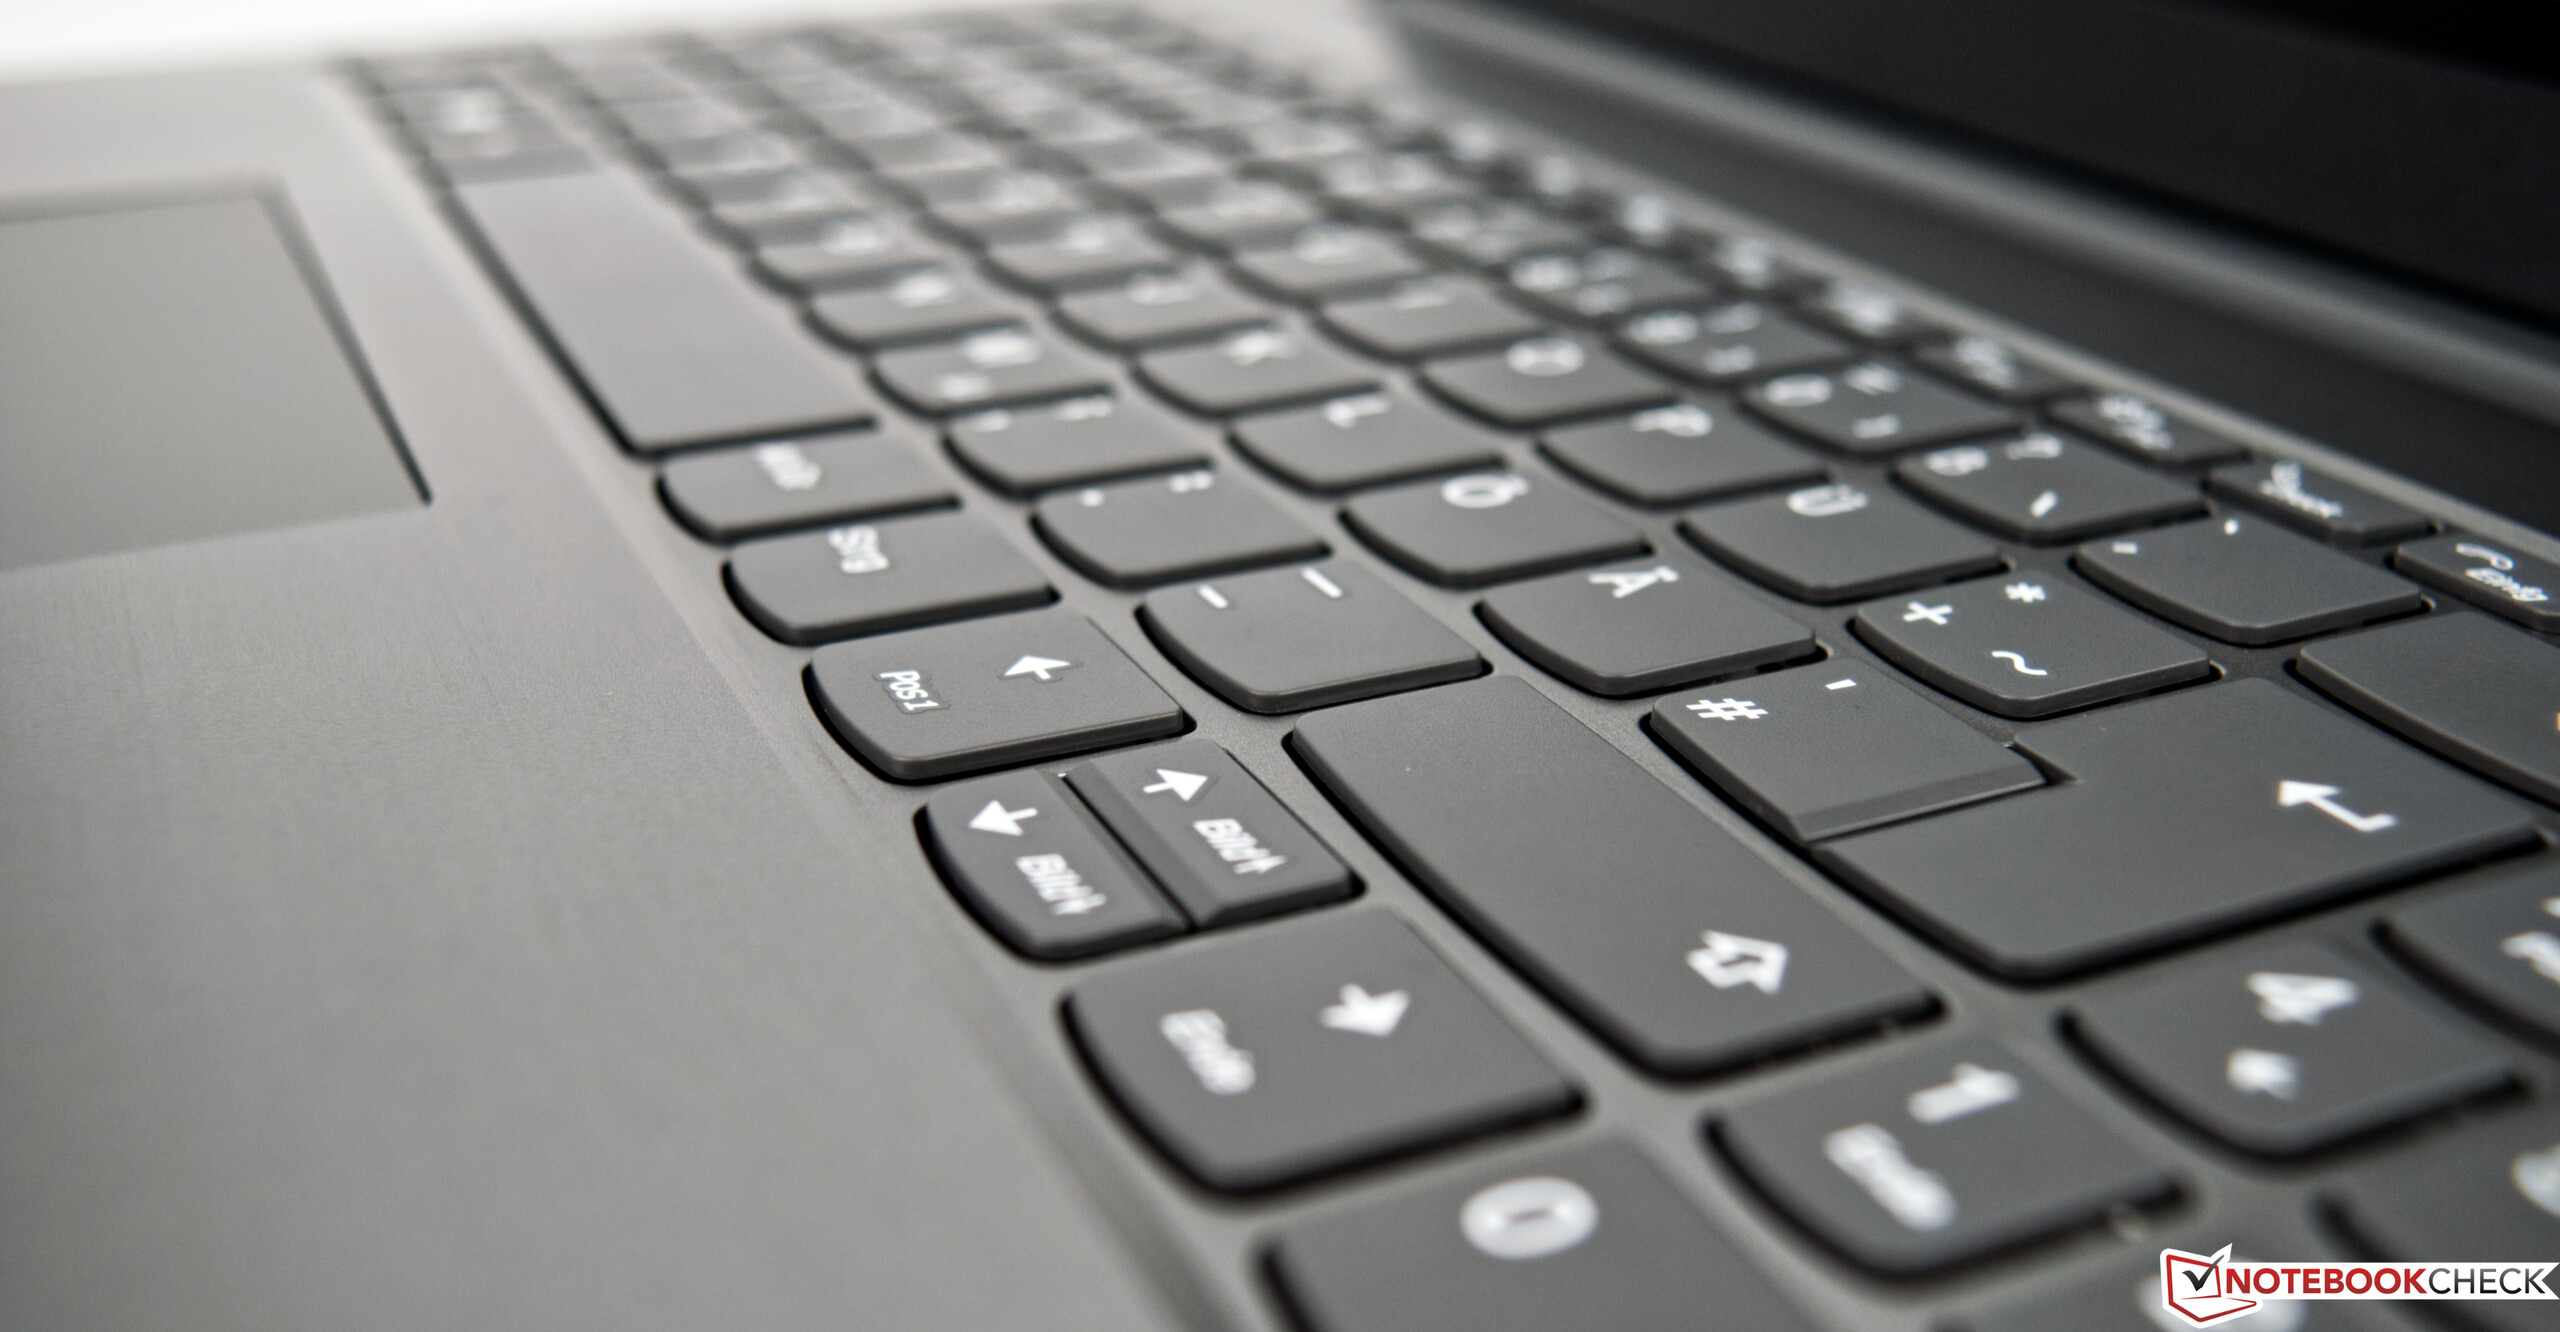
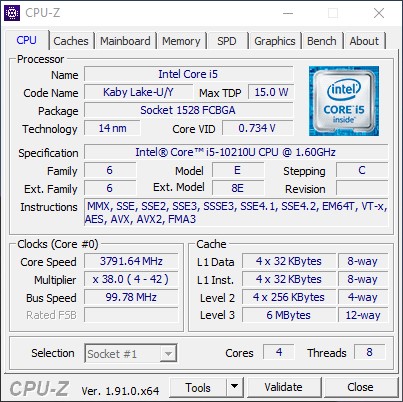
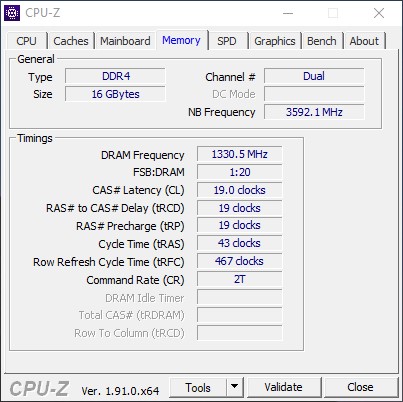
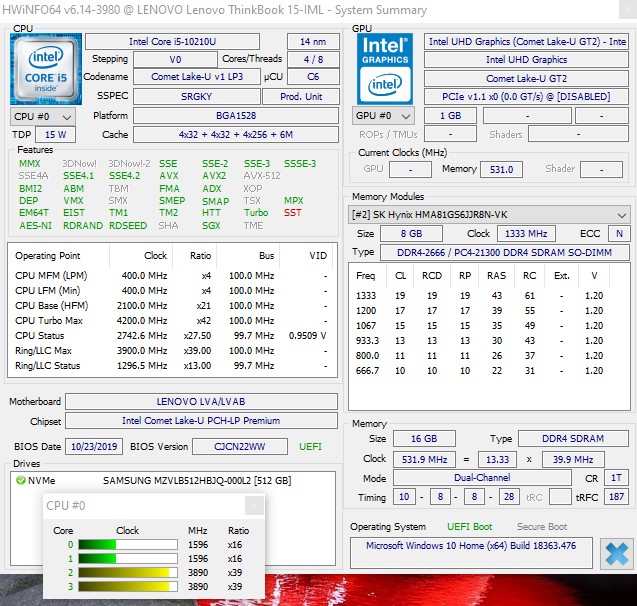
ThinkBook 15 är en enkel kontorslaptop som får poäng för en modern design och bra inmatningsenheter. Comet Lake-processorn innebär dessutom en mindre prestandaökning jämfört med föregångarna Kaby Lake och Whiskey Lake. Vår recensionsenhets Core i5-10210U var alltid redo att ta sig genom vanliga uppgifter. I korthet gör processorn att ThinkBook 15, som exempel, passar bra som en laptop till hemmakontoret. Hela 16 GB RAM och en snabb NVMe SSD på 512 GB hjälper också till.
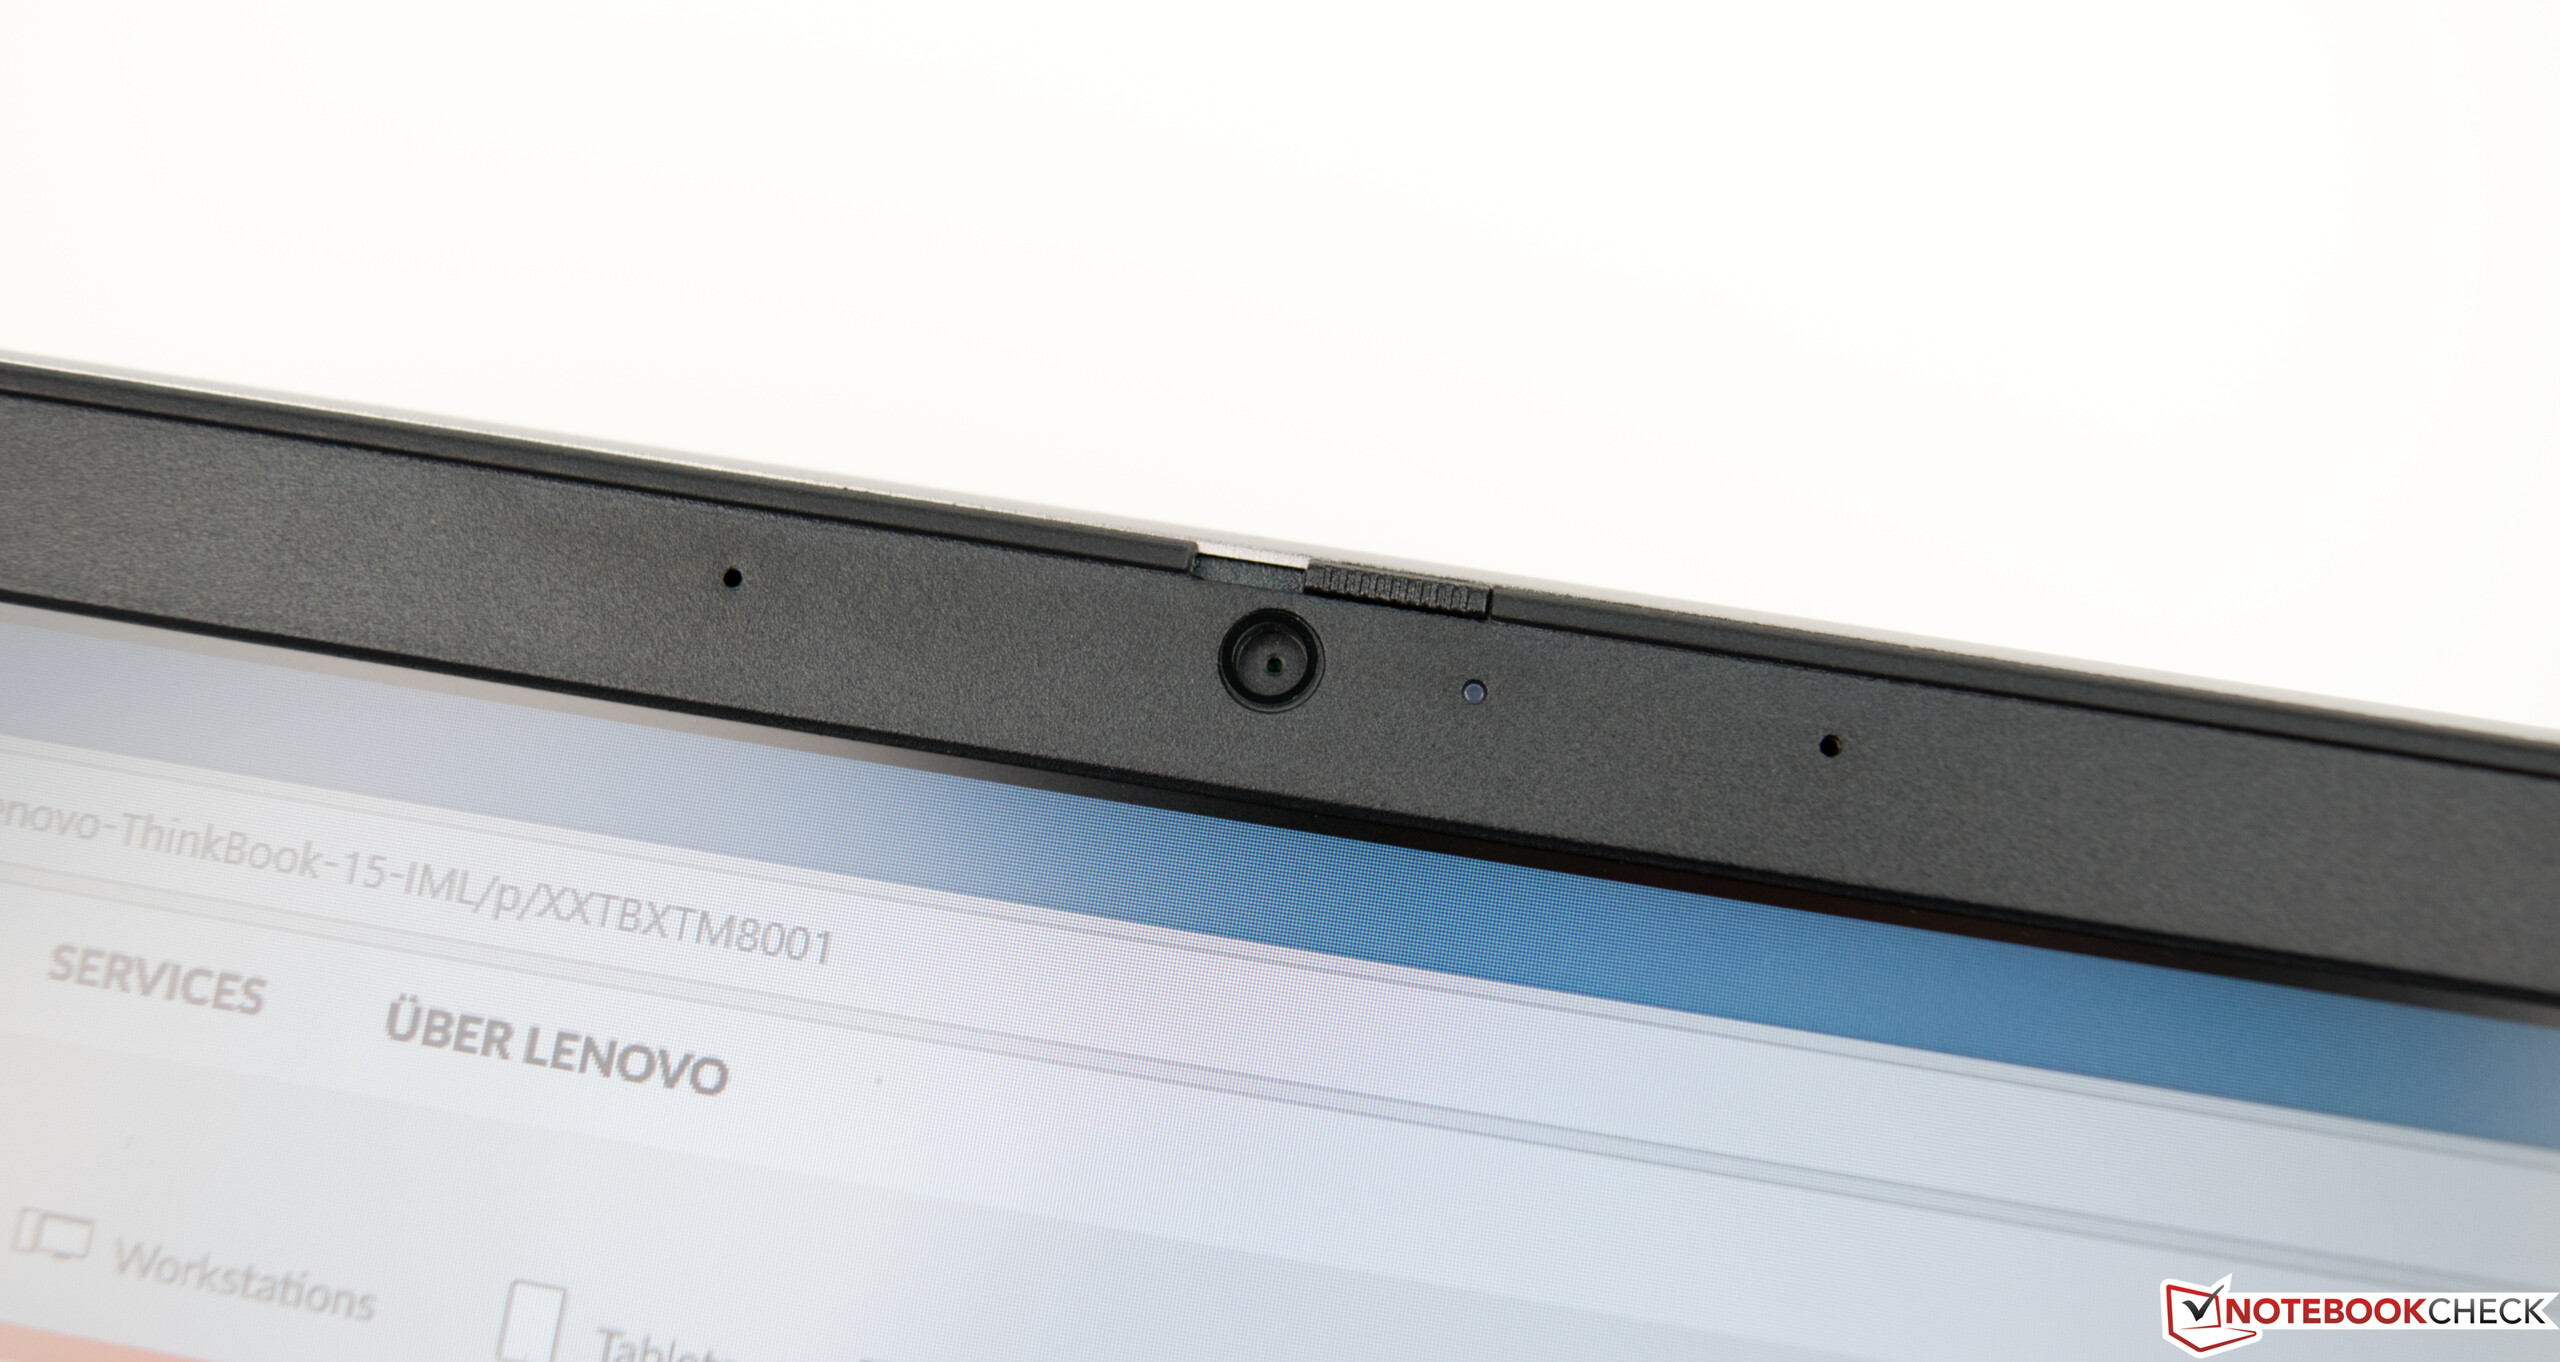
När det kommer till skärmen lär dock åsikterna gå isär. Även om vi gav den poäng för en matt yta och bra betraktningsvinklar gör den låga färgrymdstäckningen att ThinkBook 15 inte känns lämplig för foto- eller videoredigering.
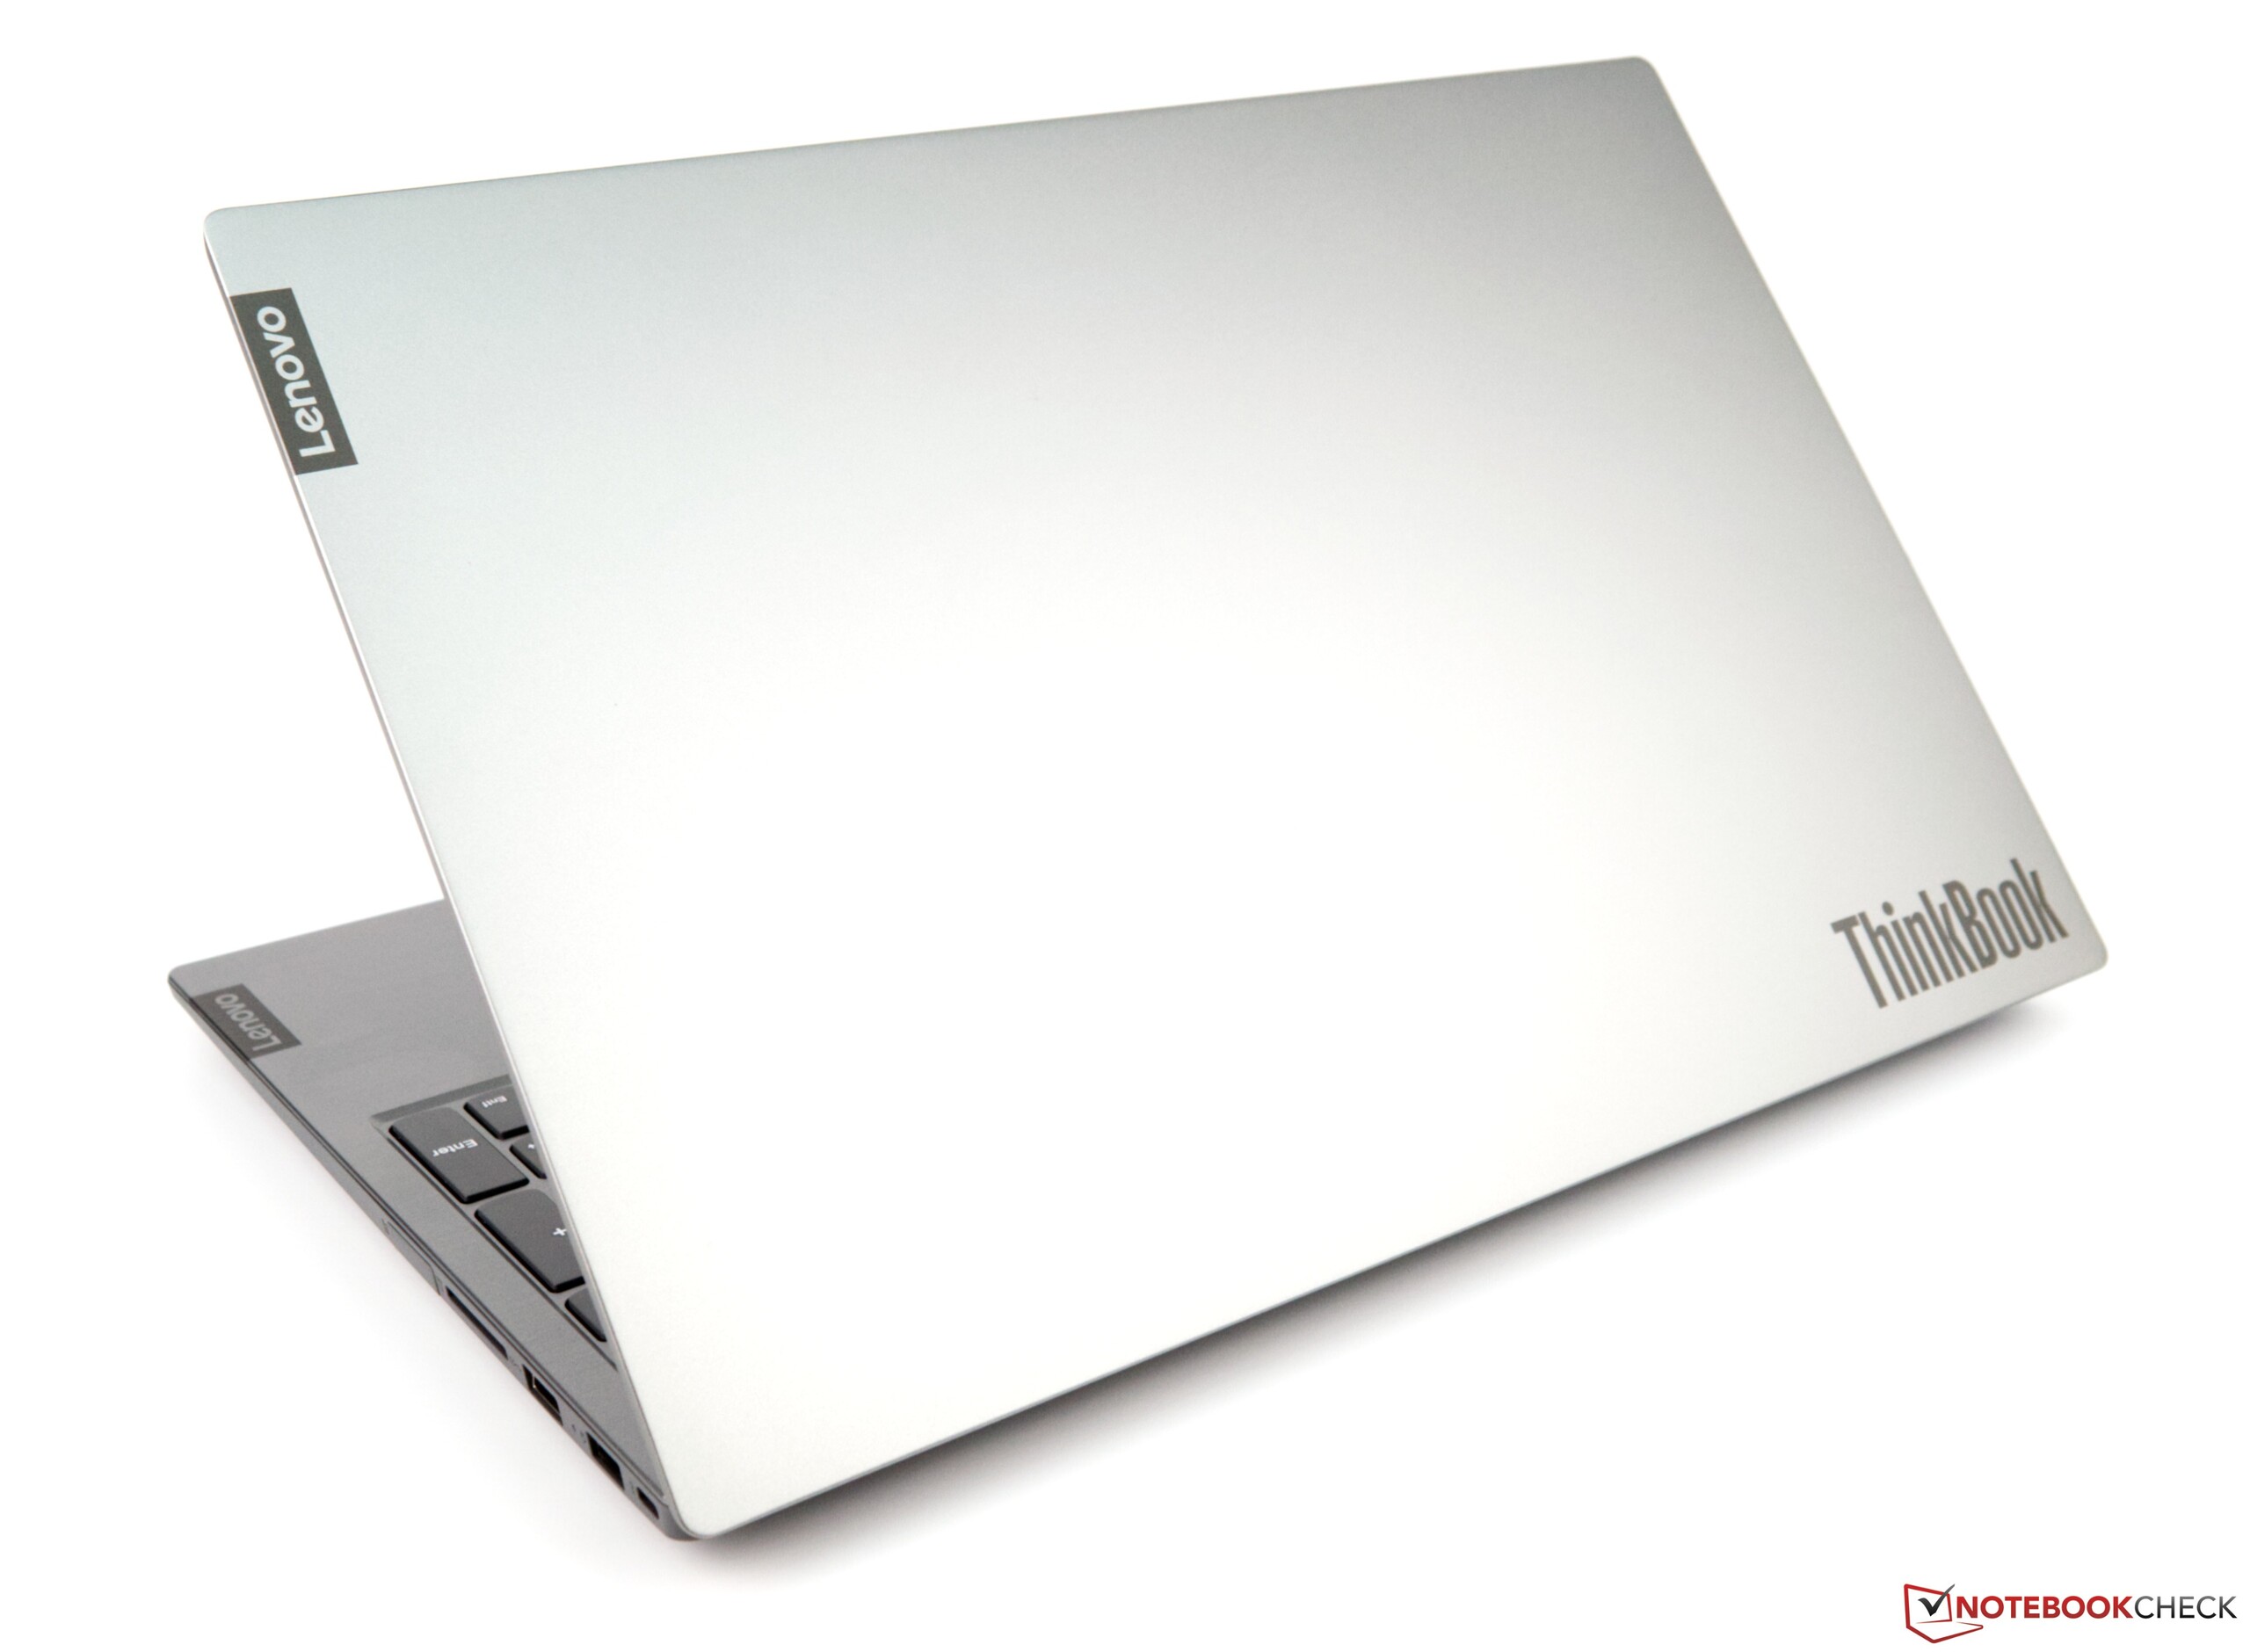
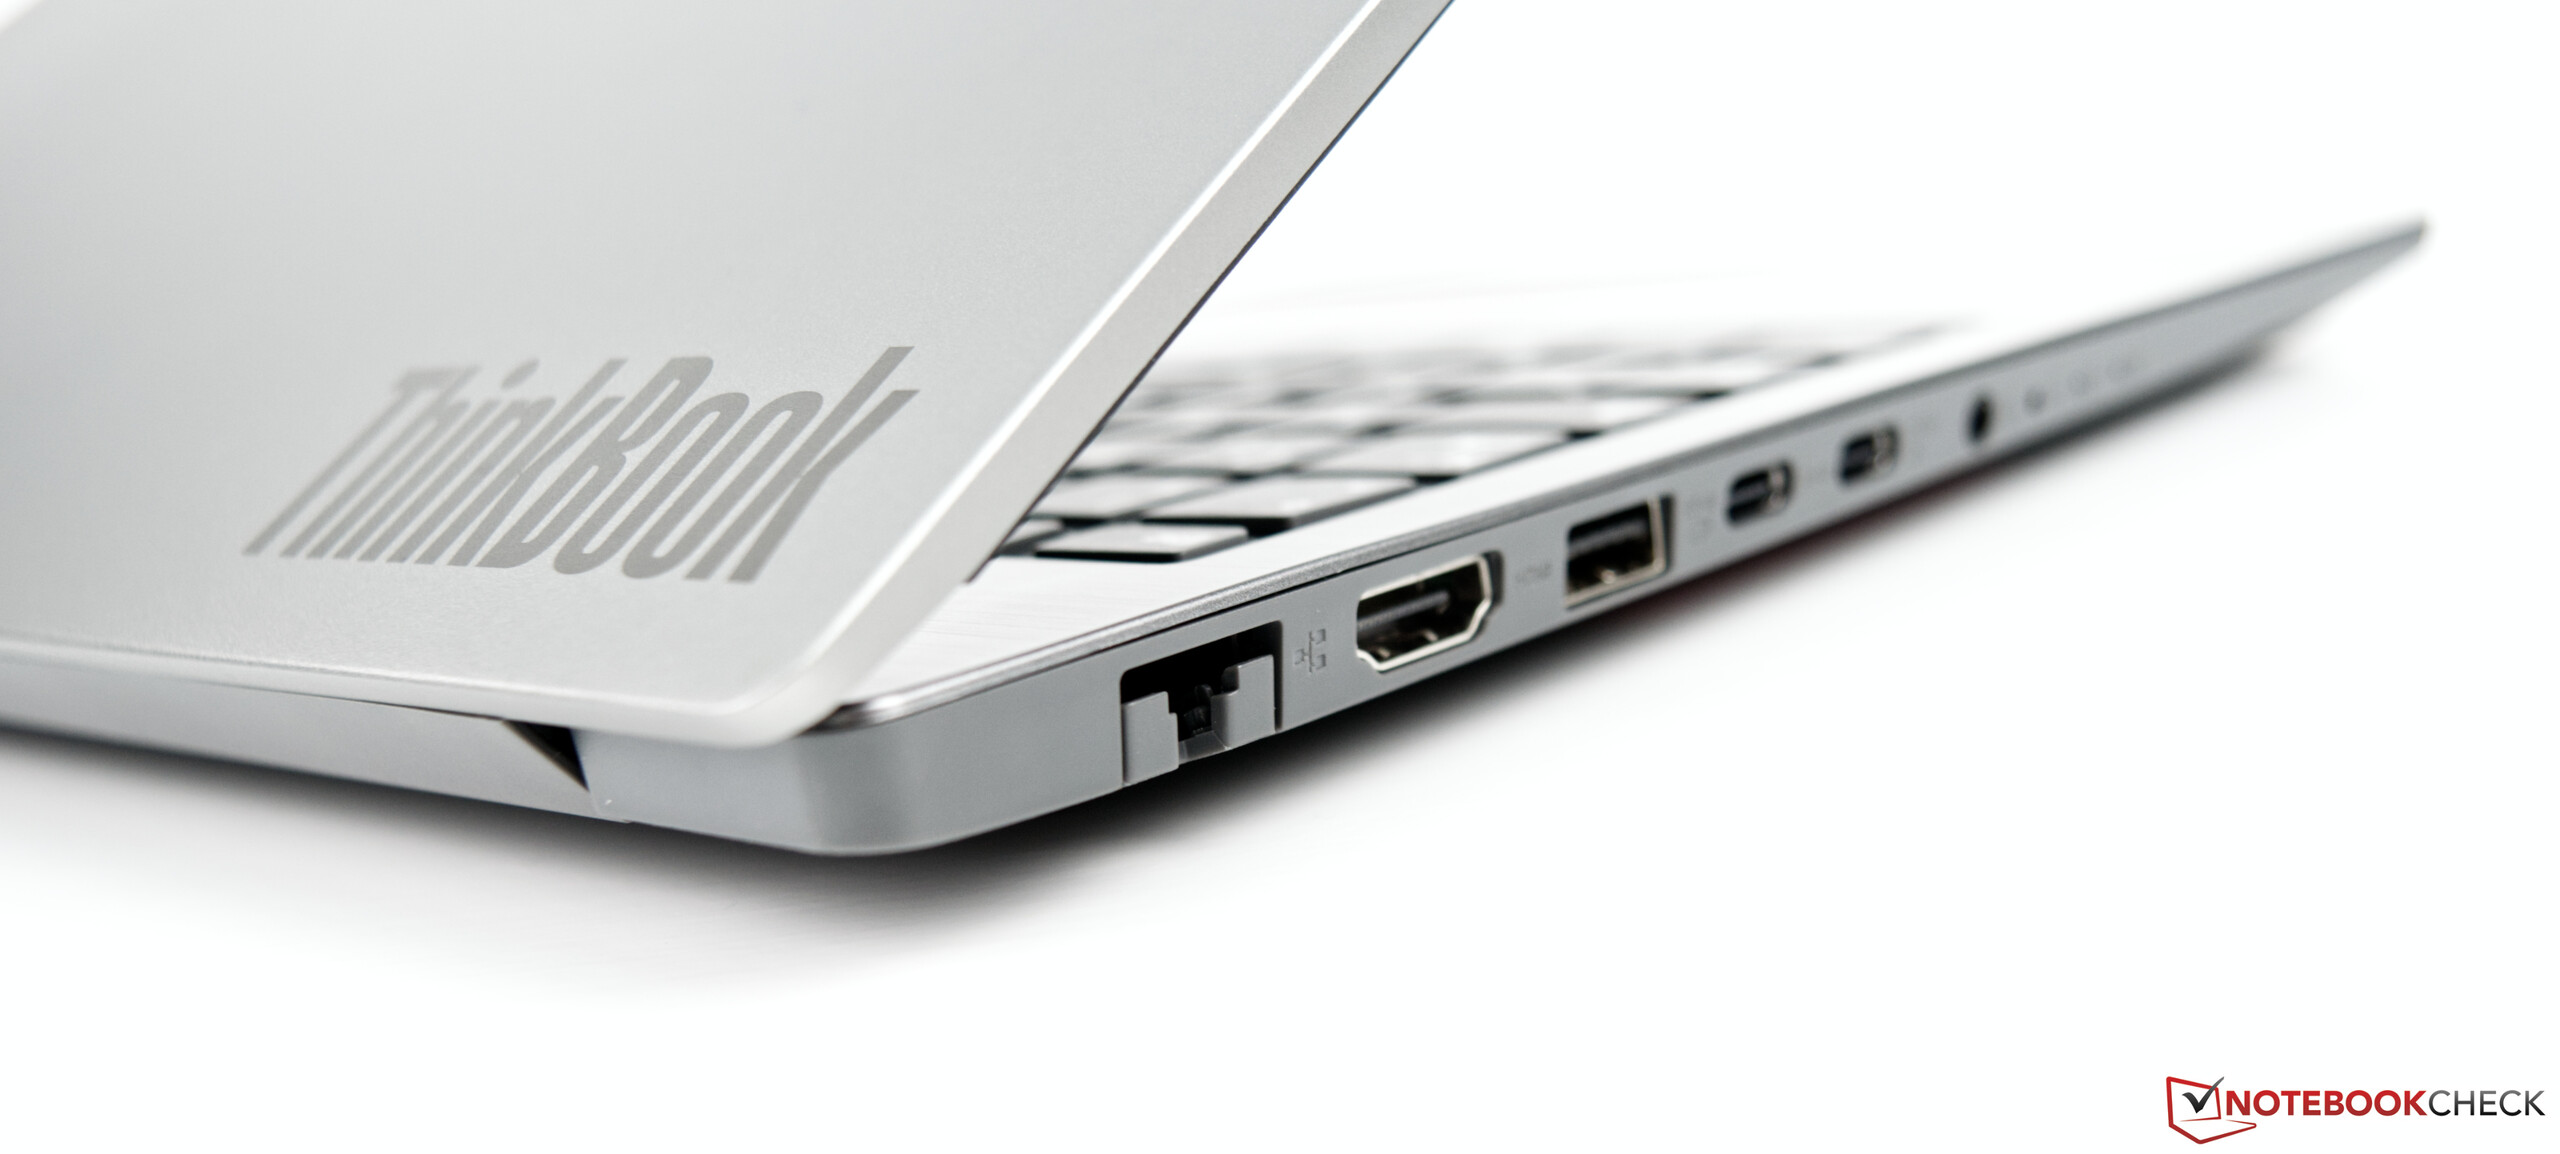
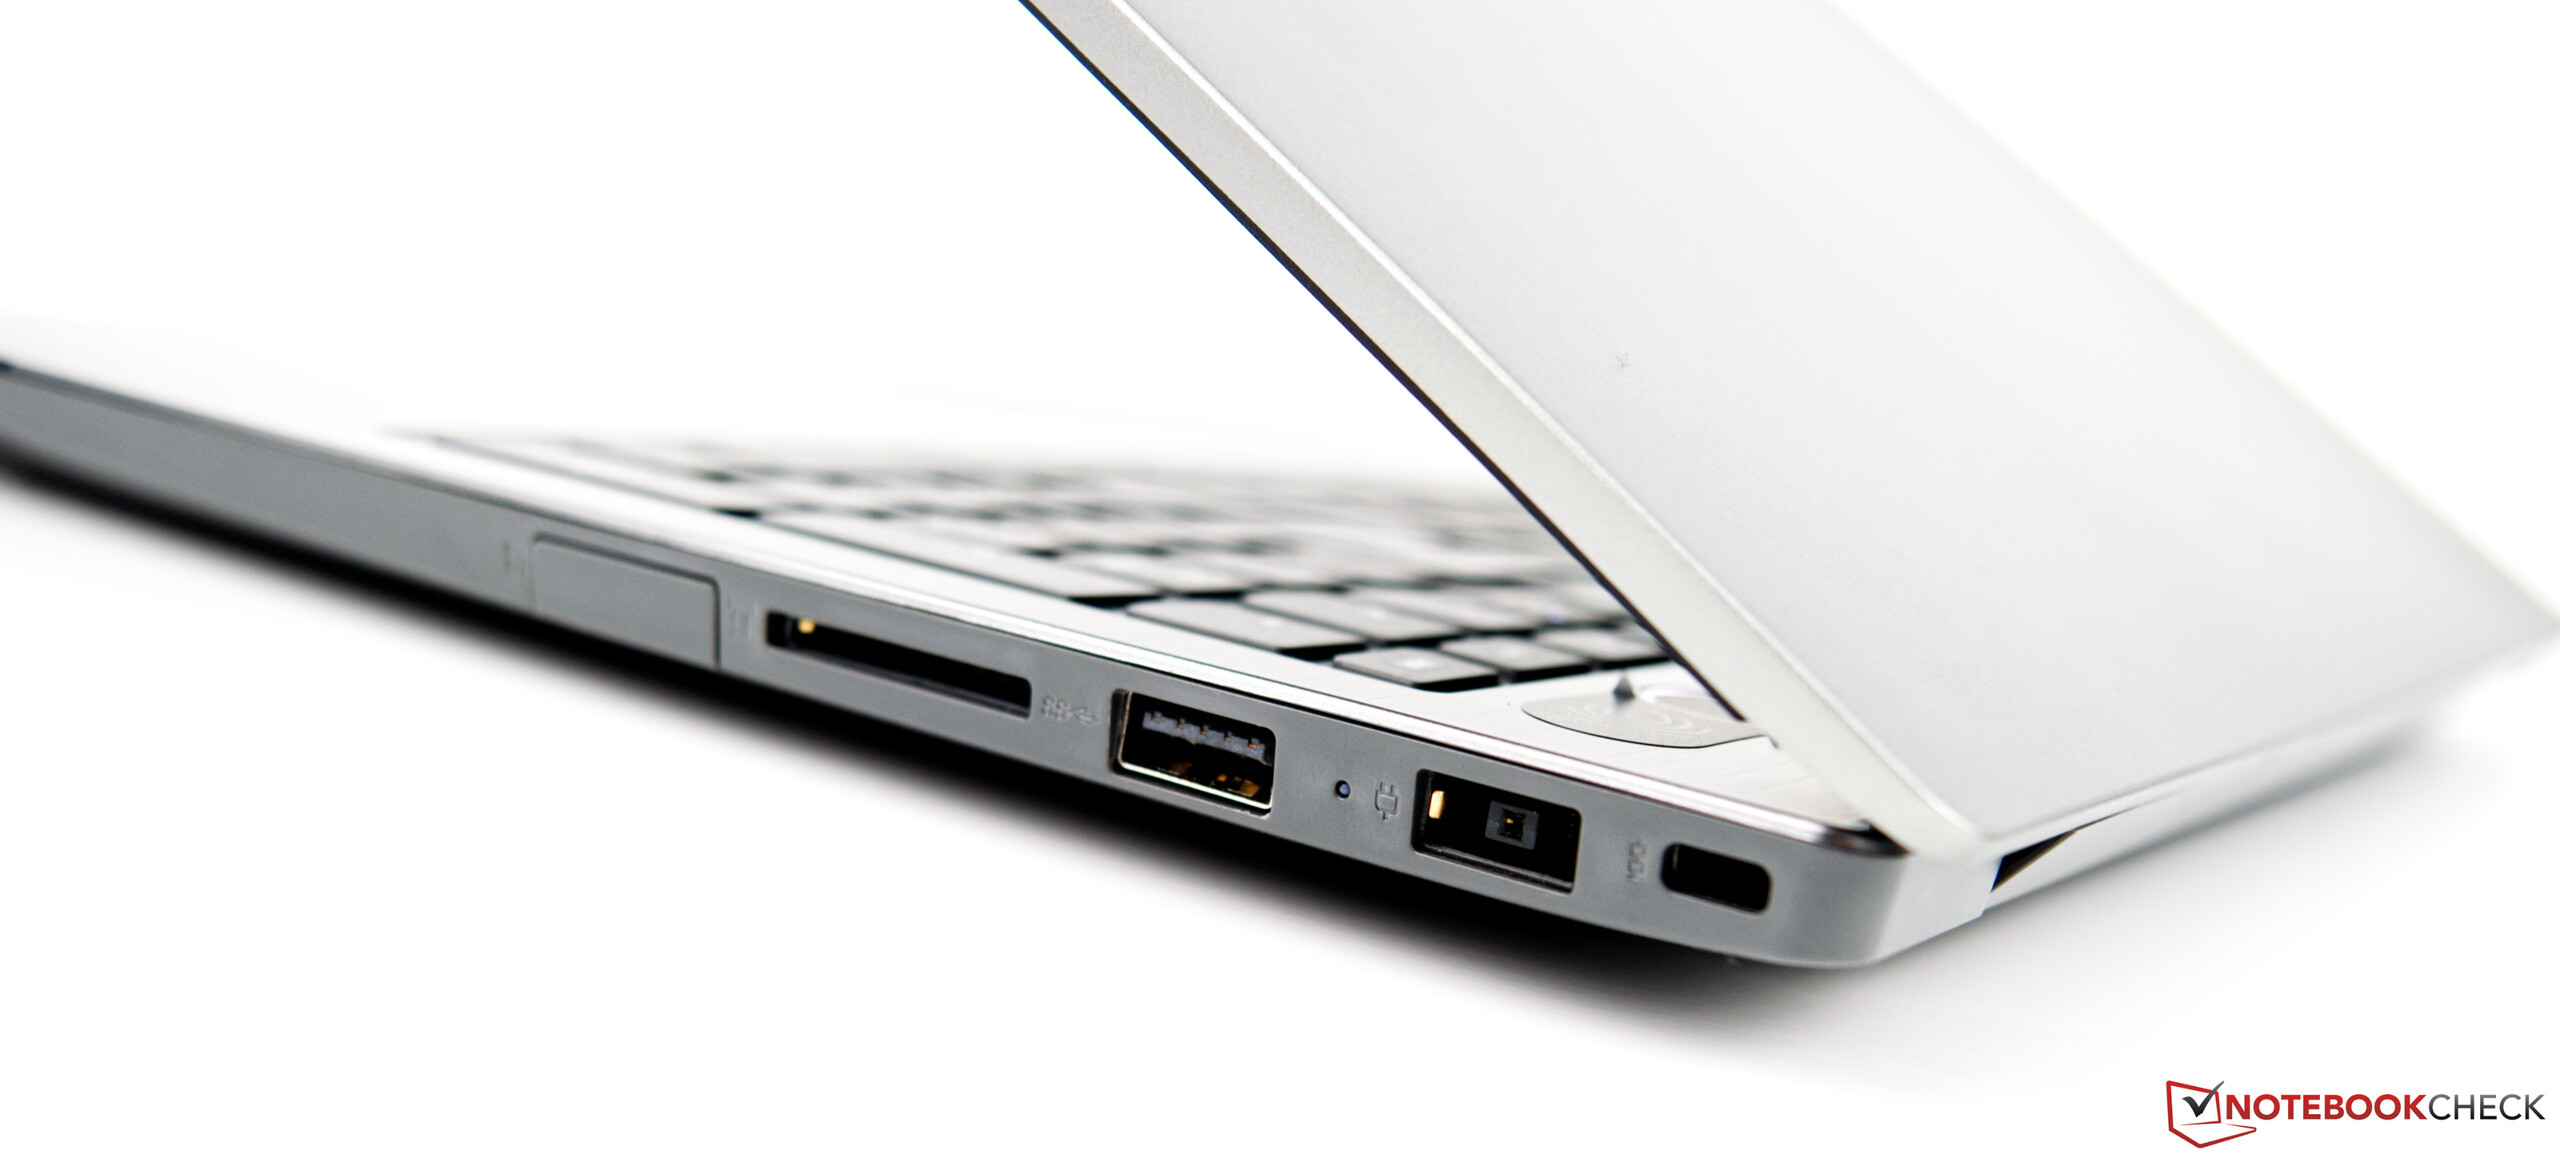
Lenovo ThinkBook 15 är en billig kontorslaptop utan några större brister.
Totalt sett känns 8.100 kronor som ett bra pris för ThinkBook 15. Men batteriet på 45 Wh kommer inte räcka en hel arbetsdag. Vi hade förväntat oss minst åtta timmar eller mer.
Lenovo ThinkBook 15
- 02/06/2020 v7 (old)
Sebastian Bade
Price comparison
