Test: Dell Alienware m17 R3 GeForce RTX 2080 Super - Farväl, Max-Q (Sammanfattning)
Gradering | Datum | Modell | Vikt | Höjd | Storlek | Upplösning | Pris |
|---|---|---|---|---|---|---|---|
| 85.3 % v7 (old) | 09/2020 | Alienware m17 R3 P45E i9-10980HK, GeForce RTX 2080 Super Mobile | 3 kg | 20.7 mm | 17.30" | 1920x1080 | |
| 84.3 % v7 (old) | Eluktronics RP-17 R7 4800H, GeForce RTX 2060 Mobile | 2.6 kg | 30 mm | 17.30" | 1920x1080 | ||
| 83.7 % v7 (old) | MSI GS75 10SF-609US i7-10875H, GeForce RTX 2070 Max-Q | 2.3 kg | 18.9 mm | 17.30" | 1920x1080 | ||
| 82.7 % v7 (old) | 09/2020 | Asus Strix Scar 17 G732LXS i9-10980HK, GeForce RTX 2080 Super Mobile | 2.9 kg | 26.5 mm | 17.30" | 1920x1080 | |
| 85.1 % v7 (old) | MSI GE75 Raider 10SE-008US i7-10750H, GeForce RTX 2060 Mobile | 2.6 kg | 27.5 mm | 17.30" | 1920x1080 | ||
| 87.4 % v7 (old) | 06/2020 | Razer Blade Pro 17 RTX 2070 Max-Q 300 Hz i7-10875H, GeForce RTX 2070 Max-Q | 2.7 kg | 19.9 mm | 17.30" | 1920x1080 |
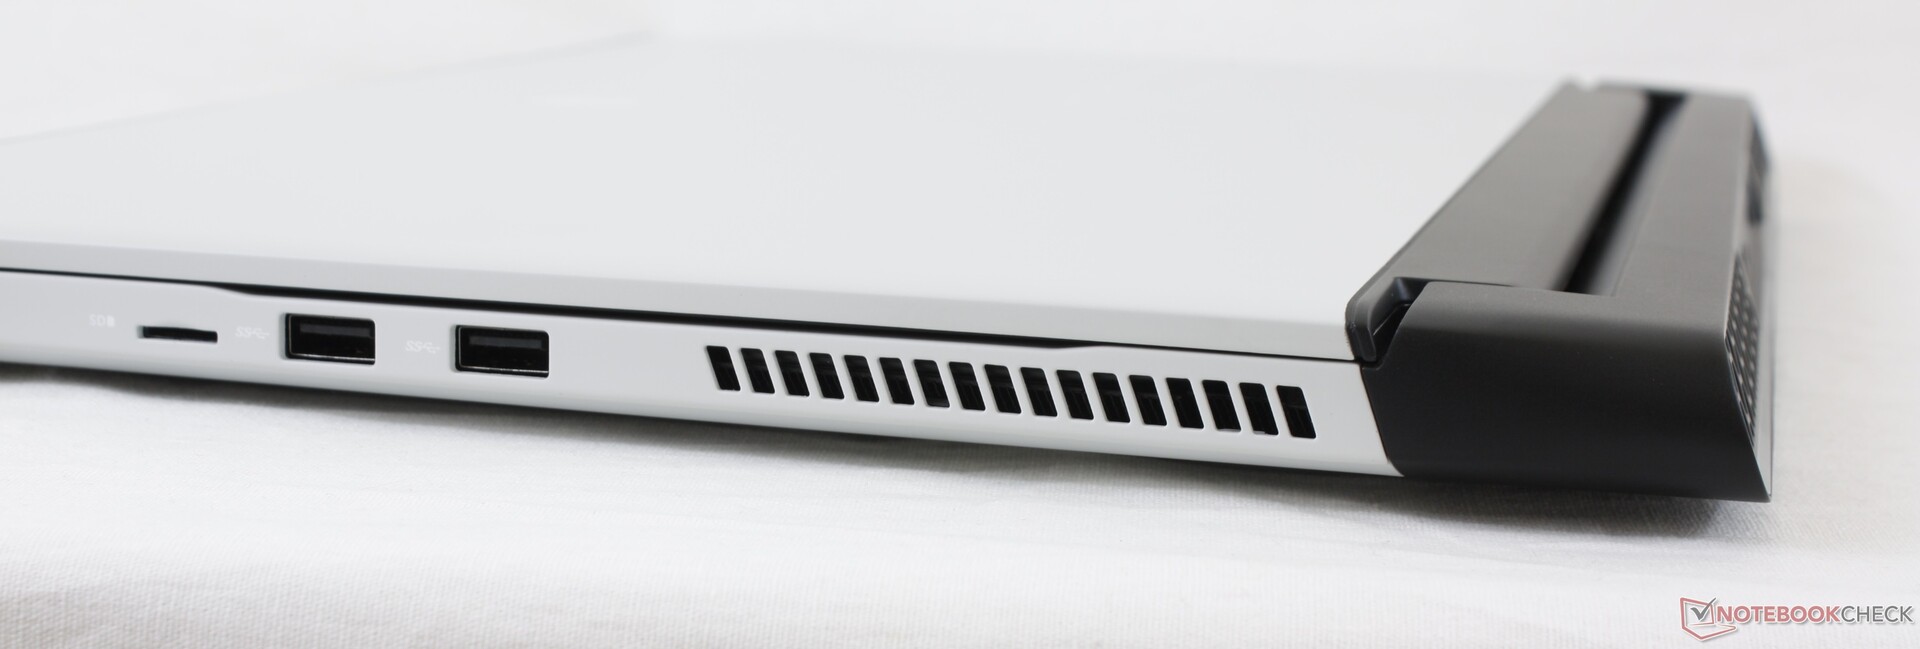
| SD Card Reader | |
| average JPG Copy Test (av. of 3 runs) | |
| Alienware m17 R3 P45E (Toshiba Exceria Pro M501 UHS-II) | |
| Razer Blade Pro 17 RTX 2070 Max-Q 300 Hz (Toshiba Exceria Pro SDXC 64 GB UHS-II) | |
| MSI GS75 10SF-609US (Toshiba Exceria Pro M501 UHS-II) | |
| Eluktronics RP-17 (Toshiba Exceria Pro SDXC 64 GB UHS-II) | |
| MSI GE75 Raider 10SE-008US (Toshiba Exceria Pro SDXC 64 GB UHS-II) | |
| maximum AS SSD Seq Read Test (1GB) | |
| Alienware m17 R3 P45E (Toshiba Exceria Pro M501 UHS-II) | |
| MSI GS75 10SF-609US (Toshiba Exceria Pro M501 UHS-II) | |
| Razer Blade Pro 17 RTX 2070 Max-Q 300 Hz (Toshiba Exceria Pro SDXC 64 GB UHS-II) | |
| Eluktronics RP-17 (Toshiba Exceria Pro SDXC 64 GB UHS-II) | |
| MSI GE75 Raider 10SE-008US (Toshiba Exceria Pro SDXC 64 GB UHS-II) | |
| Networking | |
| iperf3 transmit AX12 | |
| MSI GE75 Raider 10SE-008US | |
| Razer Blade Pro 17 RTX 2070 Max-Q 300 Hz | |
| MSI GS75 10SF-609US | |
| Eluktronics RP-17 | |
| Alienware m17 R3 P45E | |
| Asus Strix Scar 17 G732LXS | |
| iperf3 receive AX12 | |
| Eluktronics RP-17 | |
| Alienware m17 R3 P45E | |
| MSI GE75 Raider 10SE-008US | |
| Asus Strix Scar 17 G732LXS | |
| Razer Blade Pro 17 RTX 2070 Max-Q 300 Hz | |
| MSI GS75 10SF-609US | |

")
")
| |||||||||||||||||||||||||
Distribution av ljusstyrkan: 91 %
Mitt på batteriet: 338.3 cd/m²
Kontrast: 1253:1 (Svärta: 0.27 cd/m²)
ΔE ColorChecker Calman: 1.88 | ∀{0.5-29.43 Ø4.71}
calibrated: 1.32
ΔE Greyscale Calman: 2.4 | ∀{0.09-98 Ø4.96}
97.8% sRGB (Argyll 1.6.3 3D)
64.7% AdobeRGB 1998 (Argyll 1.6.3 3D)
71.4% AdobeRGB 1998 (Argyll 3D)
97.9% sRGB (Argyll 3D)
69.2% Display P3 (Argyll 3D)
Gamma: 2.39
CCT: 6572 K
| Alienware m17 R3 P45E AU Optronics B173HAN, IPS, 17.3", 1920x1080 | Eluktronics RP-17 BOE NV173FHM-N44, IPS, 17.3", 1920x1080 | MSI GS75 10SF-609US Sharp LQ173M1JW05, IPS, 17.3", 1920x1080 | Asus Strix Scar 17 G732LXS LQ173M1JW03 (SHP14DC), IPS, 17.3", 1920x1080 | MSI GE75 Raider 10SE-008US Chi Mei N173HCE-G33, IPS, 17.3", 1920x1080 | Razer Blade Pro 17 RTX 2070 Max-Q 300 Hz Sharp LQ173M1JW02, IPS, 17.3", 1920x1080 | |
|---|---|---|---|---|---|---|
| Display | -7% | 5% | 1% | -3% | 2% | |
| Display P3 Coverage (%) | 69.2 | 64.7 -7% | 75.6 9% | 71 3% | 65.6 -5% | 72.2 4% |
| sRGB Coverage (%) | 97.9 | 92 -6% | 99.8 2% | 99 1% | 98.1 0% | 98.5 1% |
| AdobeRGB 1998 Coverage (%) | 71.4 | 65.8 -8% | 75.1 5% | 71.6 0% | 67.8 -5% | 73 2% |
| Response Times | -10% | 62% | 53% | 49% | 49% | |
| Response Time Grey 50% / Grey 80% * (ms) | 16.8 ? | 22.4 ? -33% | 5 ? 70% | 5.8 ? 65% | 6.8 ? 60% | 5.6 ? 67% |
| Response Time Black / White * (ms) | 14 ? | 12 ? 14% | 6.6 ? 53% | 8.4 ? 40% | 8.8 ? 37% | 9.6 ? 31% |
| PWM Frequency (Hz) | 943 | 25000 ? | ||||
| Screen | -43% | -10% | -33% | -5% | -59% | |
| Brightness middle (cd/m²) | 338.3 | 311.5 -8% | 299.4 -11% | 310 -8% | 337.9 0% | 328 -3% |
| Brightness (cd/m²) | 325 | 301 -7% | 299 -8% | 311 -4% | 305 -6% | 329 1% |
| Brightness Distribution (%) | 91 | 91 0% | 84 -8% | 82 -10% | 81 -11% | 78 -14% |
| Black Level * (cd/m²) | 0.27 | 0.31 -15% | 0.31 -15% | 0.41 -52% | 0.29 -7% | 0.35 -30% |
| Contrast (:1) | 1253 | 1005 -20% | 966 -23% | 756 -40% | 1165 -7% | 937 -25% |
| Colorchecker dE 2000 * | 1.88 | 4.13 -120% | 1.82 3% | 2.41 -28% | 2.18 -16% | 4.74 -152% |
| Colorchecker dE 2000 max. * | 3.23 | 7.32 -127% | 3.91 -21% | 8.59 -166% | 3.9 -21% | 8.99 -178% |
| Colorchecker dE 2000 calibrated * | 1.32 | 2.93 -122% | 1.59 -20% | 1.13 14% | 0.69 48% | 2.12 -61% |
| Greyscale dE 2000 * | 2.4 | 3.3 -38% | 2.7 -13% | 4.3 -79% | 3.1 -29% | 6.8 -183% |
| Gamma | 2.39 92% | 2.17 101% | 2.18 101% | 2.149 102% | 2.07 106% | 2.2 100% |
| CCT | 6572 99% | 7157 91% | 6837 95% | 7059 92% | 6882 94% | 6446 101% |
| Color Space (Percent of AdobeRGB 1998) (%) | 64.7 | 59.5 -8% | 67.1 4% | 72 11% | 62 -4% | 64.8 0% |
| Color Space (Percent of sRGB) (%) | 97.8 | 91.6 -6% | 99.8 2% | 94 -4% | 98.2 0% | 98.6 1% |
| Totalt genomsnitt (program/inställningar) | -20% /
-32% | 19% /
2% | 7% /
-16% | 14% /
2% | -3% /
-34% |
* ... mindre är bättre
Visa svarstider
| ↔ Svarstid svart till vitt | ||
|---|---|---|
| 14 ms ... stiga ↗ och falla ↘ kombinerat | ↗ 7.6 ms stiga | 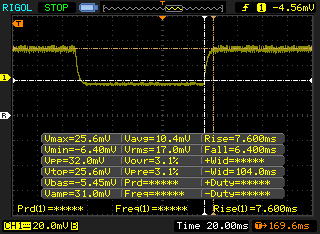 |
| ↘ 6.4 ms hösten | ||
| Skärmen visar bra svarsfrekvens i våra tester, men kan vara för långsam för konkurrenskraftiga spelare. I jämförelse sträcker sig alla testade enheter från 0.1 (minst) till 240 (maximalt) ms. » 34 % av alla enheter är bättre. Det betyder att den uppmätta svarstiden är bättre än genomsnittet av alla testade enheter (19.8 ms). | ||
| ↔ Svarstid 50 % grått till 80 % grått | ||
| 16.8 ms ... stiga ↗ och falla ↘ kombinerat | ↗ 11.6 ms stiga | 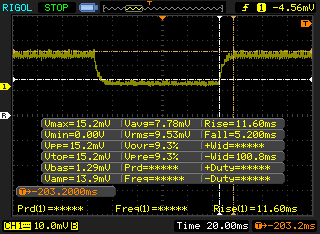 |
| ↘ 5.2 ms hösten | ||
| Skärmen visar bra svarsfrekvens i våra tester, men kan vara för långsam för konkurrenskraftiga spelare. I jämförelse sträcker sig alla testade enheter från 0.165 (minst) till 636 (maximalt) ms. » 31 % av alla enheter är bättre. Det betyder att den uppmätta svarstiden är bättre än genomsnittet av alla testade enheter (30.9 ms). | ||
Skärmflimmer / PWM (Puls-Width Modulation)
| Skärmflimmer / PWM upptäcktes inte |  | ||
Som jämförelse: 52 % av alla testade enheter använder inte PWM för att dämpa skärmen. Om PWM upptäcktes mättes ett medelvärde av 7744 (minst: 5 - maximum: 343500) Hz. | |||
Cinebench R15: CPU Multi 64Bit | CPU Single 64Bit
Blender: v2.79 BMW27 CPU
7-Zip 18.03: 7z b 4 -mmt1 | 7z b 4
Geekbench 5.5: Single-Core | Multi-Core
HWBOT x265 Benchmark v2.2: 4k Preset
LibreOffice : 20 Documents To PDF
R Benchmark 2.5: Overall mean
| Cinebench R20 / CPU (Multi Core) | |
| Intel Core i9-10900K | |
| MSI GT76 Titan DT 9SG | |
| Eluktronics RP-17 | |
| Alienware m17 R3 P45E | |
| Asus Zephyrus G14 GA401IV | |
| Alienware m17 R2 P41E | |
| Genomsnitt Intel Core i9-10980HK (3526 - 4487, n=13) | |
| MSI GS75 10SF-609US | |
| MSI GE75 9SG | |
| MSI GE75 Raider 10SE-008US | |
| Medion Erazer X15805 | |
| Schenker XMG Pro 17 PB71RD-G | |
| Cinebench R20 / CPU (Single Core) | |
| Intel Core i9-10900K | |
| MSI GT76 Titan DT 9SG | |
| Medion Erazer X15805 | |
| Asus Zephyrus G14 GA401IV | |
| Genomsnitt Intel Core i9-10980HK (465 - 507, n=13) | |
| Eluktronics RP-17 | |
| Alienware m17 R2 P41E | |
| MSI GS75 10SF-609US | |
| Alienware m17 R3 P45E | |
| MSI GE75 Raider 10SE-008US | |
| MSI GE75 9SG | |
| Schenker XMG Pro 17 PB71RD-G | |
| Cinebench R15 / CPU Multi 64Bit | |
| Intel Core i9-10900K | |
| MSI GT76 Titan DT 9SG | |
| Eluktronics RP-17 | |
| Asus Zephyrus G14 GA401IV | |
| Alienware m17 R3 P45E | |
| Alienware m17 R2 P41E | |
| Genomsnitt Intel Core i9-10980HK (1606 - 1862, n=15) | |
| MSI GE75 9SG | |
| MSI GS75 10SF-609US | |
| MSI GE75 Raider 10SE-008US | |
| Medion Erazer X15805 | |
| Schenker XMG Pro 17 PB71RD-G | |
| Cinebench R15 / CPU Single 64Bit | |
| Intel Core i9-10900K | |
| MSI GT76 Titan DT 9SG | |
| Alienware m17 R3 P45E | |
| Genomsnitt Intel Core i9-10980HK (198 - 219, n=15) | |
| Medion Erazer X15805 | |
| MSI GS75 10SF-609US | |
| Alienware m17 R2 P41E | |
| Asus Zephyrus G14 GA401IV | |
| MSI GE75 9SG | |
| MSI GE75 Raider 10SE-008US | |
| Eluktronics RP-17 | |
| Schenker XMG Pro 17 PB71RD-G | |
| Blender / v2.79 BMW27 CPU | |
| Schenker XMG Pro 17 PB71RD-G | |
| MSI GE75 Raider 10SE-008US | |
| Asus Zephyrus G14 GA401IV | |
| MSI GE75 9SG | |
| MSI GS75 10SF-609US | |
| Genomsnitt Intel Core i9-10980HK (239 - 299, n=13) | |
| Eluktronics RP-17 | |
| Alienware m17 R3 P45E | |
| Intel Core i9-10900K | |
| 7-Zip 18.03 / 7z b 4 -mmt1 | |
| Intel Core i9-10900K | |
| Alienware m17 R3 P45E | |
| Genomsnitt Intel Core i9-10980HK (5081 - 5542, n=13) | |
| MSI GS75 10SF-609US | |
| MSI GE75 Raider 10SE-008US | |
| MSI GE75 9SG | |
| Asus Zephyrus G14 GA401IV | |
| Eluktronics RP-17 | |
| Schenker XMG Pro 17 PB71RD-G | |
| 7-Zip 18.03 / 7z b 4 | |
| Intel Core i9-10900K | |
| Eluktronics RP-17 | |
| Asus Zephyrus G14 GA401IV | |
| MSI GS75 10SF-609US | |
| Genomsnitt Intel Core i9-10980HK (43786 - 49275, n=13) | |
| Alienware m17 R3 P45E | |
| MSI GE75 9SG | |
| MSI GE75 Raider 10SE-008US | |
| Schenker XMG Pro 17 PB71RD-G | |
| Geekbench 5.5 / Single-Core | |
| Intel Core i9-10900K | |
| Alienware m17 R3 P45E | |
| Genomsnitt Intel Core i9-10980HK (1283 - 1401, n=12) | |
| MSI GT76 Titan DT 9SG | |
| MSI GS75 10SF-609US | |
| MSI GE75 Raider 10SE-008US | |
| Asus Zephyrus G14 GA401IV | |
| Eluktronics RP-17 | |
| Schenker XMG Pro 17 PB71RD-G | |
| Geekbench 5.5 / Multi-Core | |
| Intel Core i9-10900K | |
| MSI GT76 Titan DT 9SG | |
| MSI GS75 10SF-609US | |
| Genomsnitt Intel Core i9-10980HK (7634 - 8666, n=12) | |
| Alienware m17 R3 P45E | |
| Eluktronics RP-17 | |
| Asus Zephyrus G14 GA401IV | |
| MSI GE75 Raider 10SE-008US | |
| Schenker XMG Pro 17 PB71RD-G | |
| HWBOT x265 Benchmark v2.2 / 4k Preset | |
| Intel Core i9-10900K | |
| Alienware m17 R3 P45E | |
| Eluktronics RP-17 | |
| Genomsnitt Intel Core i9-10980HK (12 - 14.6, n=13) | |
| MSI GS75 10SF-609US | |
| Asus Zephyrus G14 GA401IV | |
| MSI GE75 9SG | |
| MSI GE75 Raider 10SE-008US | |
| Schenker XMG Pro 17 PB71RD-G | |
| LibreOffice / 20 Documents To PDF | |
| Intel Core i9-10900K | |
| Eluktronics RP-17 | |
| MSI GE75 Raider 10SE-008US | |
| Genomsnitt Intel Core i9-10980HK (44 - 89, n=13) | |
| MSI GS75 10SF-609US | |
| Alienware m17 R3 P45E | |
| R Benchmark 2.5 / Overall mean | |
| Schenker XMG Pro 17 PB71RD-G | |
| MSI GE75 Raider 10SE-008US | |
| MSI GS75 10SF-609US | |
| Eluktronics RP-17 | |
| Genomsnitt Intel Core i9-10980HK (0.561 - 0.596, n=13) | |
| Alienware m17 R3 P45E | |
| Intel Core i9-10900K | |
* ... mindre är bättre
| PCMark 8 | |
| Home Score Accelerated v2 | |
| Alienware m17 R3 P45E | |
| Genomsnitt Intel Core i9-10980HK, NVIDIA GeForce RTX 2080 Super Mobile (n=1) | |
| Razer Blade Pro 17 RTX 2070 Max-Q 300 Hz | |
| Eluktronics RP-17 | |
| MSI GS75 10SF-609US | |
| MSI GE75 Raider 10SE-008US | |
| Work Score Accelerated v2 | |
| Alienware m17 R3 P45E | |
| Genomsnitt Intel Core i9-10980HK, NVIDIA GeForce RTX 2080 Super Mobile (n=1) | |
| Razer Blade Pro 17 RTX 2070 Max-Q 300 Hz | |
| MSI GS75 10SF-609US | |
| MSI GE75 Raider 10SE-008US | |
| Eluktronics RP-17 | |
| PCMark 8 Home Score Accelerated v2 | 5881 poäng | |
| PCMark 8 Work Score Accelerated v2 | 6589 poäng | |
| PCMark 10 Score | 6594 poäng | |
Hjälp | ||
| DPC Latencies / LatencyMon - interrupt to process latency (max), Web, Youtube, Prime95 | |
| Asus Strix Scar 17 G732LXS | |
| MSI GE75 Raider 10SE-008US | |
| Eluktronics RP-17 | |
| Razer Blade Pro 17 RTX 2070 Max-Q 300 Hz | |
| Alienware m17 R3 P45E | |
| MSI GS75 10SF-609US | |
* ... mindre är bättre
| Alienware m17 R3 P45E 2x Micron 2200S 512 GB (RAID 0) | Eluktronics RP-17 Phison PS5013 PRO-X-1TB-G2R NVMe SSD | MSI GS75 10SF-609US WDC PC SN730 SDBPNTY-512G | Asus Strix Scar 17 G732LXS 2x Intel SSD 660p 1TB SSDPEKNW010T8 (RAID 0) | MSI GE75 Raider 10SE-008US Samsung SSD PM981 MZVLB512HAJQ | Razer Blade Pro 17 RTX 2070 Max-Q 300 Hz Lite-On CA5-8D512 | |
|---|---|---|---|---|---|---|
| AS SSD | 23% | 17% | -2% | 21% | -10% | |
| Seq Read (MB/s) | 2060 | 1689 -18% | 2327 13% | 2450 19% | 2036 -1% | 2019 -2% |
| Seq Write (MB/s) | 2297 | 1695 -26% | 2479 8% | 1436 -37% | 1835 -20% | 1314 -43% |
| 4K Read (MB/s) | 35.39 | 50 41% | 45.46 28% | 49.48 40% | 60.6 71% | 46.61 32% |
| 4K Write (MB/s) | 63.1 | 182.9 190% | 157.4 149% | 119.4 89% | 127.2 102% | 90.2 43% |
| 4K-64 Read (MB/s) | 1337 | 1043 -22% | 1050 -21% | 1032 -23% | 1601 20% | 665 -50% |
| 4K-64 Write (MB/s) | 1307 | 1841 41% | 938 -28% | 1229 -6% | 1734 33% | 813 -38% |
| Access Time Read * (ms) | 0.057 | 0.04 30% | 0.076 -33% | 0.145 -154% | 0.049 14% | 0.058 -2% |
| Access Time Write * (ms) | 0.411 | 0.102 75% | 0.071 83% | 0.036 91% | 0.09 78% | 0.167 59% |
| Score Read (Points) | 1578 | 1262 -20% | 1328 -16% | 1327 -16% | 1865 18% | 913 -42% |
| Score Write (Points) | 1600 | 2194 37% | 1343 -16% | 1492 -7% | 2045 28% | 1034 -35% |
| Score Total (Points) | 3997 | 4112 3% | 3366 -16% | 3456 -14% | 4863 22% | 2392 -40% |
| Copy ISO MB/s (MB/s) | 1728 | 2124 23% | 3092 79% | 1900 10% | 1715 -1% | |
| Copy Program MB/s (MB/s) | 727 | 579 -20% | 733 1% | 205.5 -72% | 622 -14% | |
| Copy Game MB/s (MB/s) | 1585 | 1304 -18% | 1683 6% | 1419 -10% | 1506 -5% | |
| CrystalDiskMark 5.2 / 6 | 21% | 25% | 8% | 12% | 11% | |
| Write 4K (MB/s) | 68 | 226.1 233% | 177.9 162% | 125.8 85% | 139.2 105% | 119 75% |
| Read 4K (MB/s) | 42.04 | 54.7 30% | 47.42 13% | 52.9 26% | 53 26% | 51.9 23% |
| Write Seq (MB/s) | 2221 | 1868 -16% | 2707 22% | 1795 -19% | 1950 -12% | 2258 2% |
| Read Seq (MB/s) | 2202 | 1648 -25% | 2369 8% | 2315 5% | 2328 6% | 2283 4% |
| Write 4K Q32T1 (MB/s) | 494.5 | 429.9 -13% | 427.8 -13% | 407.1 -18% | 408.9 -17% | 491 -1% |
| Read 4K Q32T1 (MB/s) | 540 | 521 -4% | 543 1% | 411.9 -24% | 551 2% | 540 0% |
| Write Seq Q32T1 (MB/s) | 2623 | 2248 -14% | 2703 3% | 2844 8% | 1938 -26% | 2253 -14% |
| Read Seq Q32T1 (MB/s) | 3159 | 2484 -21% | 3387 7% | 3130 -1% | 3467 10% | 3172 0% |
| Totalt genomsnitt (program/inställningar) | 22% /
22% | 21% /
20% | 3% /
2% | 17% /
18% | 1% /
-2% |
* ... mindre är bättre

Kontinuerlig inläsning: DiskSpd Read Loop, Queue Depth 8
| 3DMark 11 Performance | 27300 poäng | |
| 3DMark Cloud Gate Standard Score | 54828 poäng | |
| 3DMark Fire Strike Score | 21102 poäng | |
| 3DMark Time Spy Score | 9921 poäng | |
Hjälp | ||
| Final Fantasy XV Benchmark - 1920x1080 High Quality | |
| Intel Core i9-10900K | |
| Alienware m17 R3 P45E | |
| Genomsnitt NVIDIA GeForce RTX 2080 Super Mobile (95.7 - 107, n=3) | |
| MSI RTX 2080 Gaming X Trio | |
| Asus Strix Scar 17 G732LXS | |
| Razer Blade 15 RTX 2070 Super Max-Q | |
| MSI RTX 2070 Gaming Z 8G | |
| MSI GS75 Stealth 9SG | |
| MSI RTX 2060 Gaming Z 6G | |
| Asus Zephyrus S17 GX701LXS | |
| Eluktronics RP-17 | |
| Asus Zephyrus G14 GA401IV | |
| The Witcher 3 - 1920x1080 Ultra Graphics & Postprocessing (HBAO+) | |
| Intel Core i9-10900K | |
| MSI RTX 2080 Gaming X Trio | |
| Genomsnitt NVIDIA GeForce RTX 2080 Super Mobile (93.4 - 113.2, n=4) | |
| MSI GT76 Titan DT 9SG | |
| Asus ROG Mothership GZ700GX | |
| Alienware m17 R3 P45E | |
| MSI GE75 9SG | |
| Asus Strix Scar 17 G732LXS | |
| MSI RTX 2070 Gaming Z 8G | |
| Asus ROG Strix Scar 15 G532LWS | |
| Asus Zephyrus S17 GX701LXS | |
| Razer Blade Pro 17 RTX 2070 Max-Q 300 Hz | |
| Alienware m17 R2 P41E | |
| MSI GS75 Stealth 9SG | |
| Razer Blade 15 RTX 2070 Super Max-Q | |
| MSI RTX 2060 Gaming Z 6G | |
| MSI GS75 10SF-609US | |
| MSI GE75 Raider 10SE-008US | |
| Medion Erazer X15805 | |
| Eluktronics RP-17 | |
| Schenker XMG Ultra 17 Coffee Lake Refresh | |
| Schenker XMG Pro 17 PB71RD-G | |
| Asus Zephyrus G14 GA401IV | |
| Asus TUF A17 FA706IU-AS76 | |
| MSI Bravo 17 A4DDR | |
| Asus ROG Strix G15 G512LI | |
| låg | med. | hög | ultra | |
|---|---|---|---|---|
| The Witcher 3 (2015) | 389.7 | 274.2 | 186.2 | 97.7 |
| Dota 2 Reborn (2015) | 150 | 140 | 134 | 127 |
| Final Fantasy XV Benchmark (2018) | 193 | 134 | 103 | |
| X-Plane 11.11 (2018) | 128 | 114 | 93.8 |
| Alienware m17 R3 P45E GeForce RTX 2080 Super Mobile, i9-10980HK, 2x Micron 2200S 512 GB (RAID 0) | Eluktronics RP-17 GeForce RTX 2060 Mobile, R7 4800H, Phison PS5013 PRO-X-1TB-G2R NVMe SSD | MSI GS75 10SF-609US GeForce RTX 2070 Max-Q, i7-10875H, WDC PC SN730 SDBPNTY-512G | Asus Strix Scar 17 G732LXS GeForce RTX 2080 Super Mobile, i9-10980HK, 2x Intel SSD 660p 1TB SSDPEKNW010T8 (RAID 0) | MSI GE75 Raider 10SE-008US GeForce RTX 2060 Mobile, i7-10750H, Samsung SSD PM981 MZVLB512HAJQ | Razer Blade Pro 17 RTX 2070 Max-Q 300 Hz GeForce RTX 2070 Max-Q, i7-10875H, Lite-On CA5-8D512 | |
|---|---|---|---|---|---|---|
| Noise | 7% | -6% | -15% | -0% | 1% | |
| av / miljö * (dB) | 26.5 | 26.2 1% | 26.2 1% | 25 6% | 28.4 -7% | 28.2 -6% |
| Idle Minimum * (dB) | 27.8 | 26.2 6% | 31.2 -12% | 33 -19% | 30.2 -9% | 28.2 -1% |
| Idle Average * (dB) | 27.8 | 26.2 6% | 31.4 -13% | 38 -37% | 30.2 -9% | 28.2 -1% |
| Idle Maximum * (dB) | 27.8 | 30 -8% | 34 -22% | 45 -62% | 32 -15% | 30.5 -10% |
| Load Average * (dB) | 52.1 | 38.5 26% | 49.5 5% | 54 -4% | 33.2 36% | 42.2 19% |
| Witcher 3 ultra * (dB) | 51.8 | 47.2 9% | 50.6 2% | 50 3% | 55 -6% | 53 -2% |
| Load Maximum * (dB) | 59.1 | 54.6 8% | 60.7 -3% | 55 7% | 55 7% | 55.5 6% |
* ... mindre är bättre
Ljudnivå
| Låg belastning |
| 27.8 / 27.8 / 27.8 dB(A) |
| Hög belastning |
| 52.1 / 59.1 dB(A) |
 | ||
30 dB tyst 40 dB(A) hörbar 50 dB(A) högt ljud |
||
min: | ||
(-) Den maximala temperaturen på ovansidan är 54 °C / 129 F, jämfört med genomsnittet av 40.4 °C / 105 F , allt från 21.2 till 68.8 °C för klassen Gaming.
(-) Botten värms upp till maximalt 58.4 °C / 137 F, jämfört med genomsnittet av 43.2 °C / 110 F
(±) Vid tomgångsbruk är medeltemperaturen för ovansidan 33.2 °C / 92 F, jämfört med enhetsgenomsnittet på 33.9 °C / ### class_avg_f### F.
(-) När du spelar The Witcher 3 är medeltemperaturen för ovansidan 39.1 °C / 102 F, jämfört med enhetsgenomsnittet på 33.9 °C / ## #class_avg_f### F.
(+) Handledsstöden och pekplattan är kallare än hudtemperaturen med maximalt 31.2 °C / 88.2 F och är därför svala att ta på.
(-) Medeltemperaturen för handledsstödsområdet på liknande enheter var 28.8 °C / 83.8 F (-2.4 °C / -4.4 F).
Alienware m17 R3 P45E ljudanalys
(+) | högtalare kan spela relativt högt (87.5 dB)
Bas 100 - 315 Hz
(-) | nästan ingen bas - i genomsnitt 17.9% lägre än medianen
(±) | linjäriteten för basen är genomsnittlig (9.6% delta till föregående frekvens)
Mellan 400 - 2000 Hz
(±) | högre mellan - i genomsnitt 5.6% högre än median
(+) | mids är linjära (4.5% delta till föregående frekvens)
Högsta 2 - 16 kHz
(±) | högre toppar - i genomsnitt 5% högre än medianen
(+) | toppar är linjära (4.7% delta till föregående frekvens)
Totalt 100 - 16 000 Hz
(±) | linjäriteten för det totala ljudet är genomsnittlig (16.2% skillnad mot median)
Jämfört med samma klass
» 40% av alla testade enheter i den här klassen var bättre, 7% liknande, 53% sämre
» Den bästa hade ett delta på 6%, genomsnittet var 18%, sämst var 132%
Jämfört med alla testade enheter
» 26% av alla testade enheter var bättre, 6% liknande, 68% sämre
» Den bästa hade ett delta på 4%, genomsnittet var 23%, sämst var 134%
Apple MacBook 12 (Early 2016) 1.1 GHz ljudanalys
(+) | högtalare kan spela relativt högt (83.6 dB)
Bas 100 - 315 Hz
(±) | reducerad bas - i genomsnitt 11.3% lägre än medianen
(±) | linjäriteten för basen är genomsnittlig (14.2% delta till föregående frekvens)
Mellan 400 - 2000 Hz
(+) | balanserad mellan - endast 2.4% från medianen
(+) | mids är linjära (5.5% delta till föregående frekvens)
Högsta 2 - 16 kHz
(+) | balanserade toppar - endast 2% från medianen
(+) | toppar är linjära (4.5% delta till föregående frekvens)
Totalt 100 - 16 000 Hz
(+) | det totala ljudet är linjärt (10.2% skillnad mot median)
Jämfört med samma klass
» 7% av alla testade enheter i den här klassen var bättre, 2% liknande, 90% sämre
» Den bästa hade ett delta på 5%, genomsnittet var 18%, sämst var 53%
Jämfört med alla testade enheter
» 5% av alla testade enheter var bättre, 1% liknande, 94% sämre
» Den bästa hade ett delta på 4%, genomsnittet var 23%, sämst var 134%
| Av/Standby | |
| Låg belastning | |
| Hög belastning |
|
Förklaring:
min: | |
| Alienware m17 R3 P45E i9-10980HK, GeForce RTX 2080 Super Mobile, 2x Micron 2200S 512 GB (RAID 0), IPS, 1920x1080, 17.3" | Eluktronics RP-17 R7 4800H, GeForce RTX 2060 Mobile, Phison PS5013 PRO-X-1TB-G2R NVMe SSD, IPS, 1920x1080, 17.3" | MSI GS75 10SF-609US i7-10875H, GeForce RTX 2070 Max-Q, WDC PC SN730 SDBPNTY-512G, IPS, 1920x1080, 17.3" | Asus Strix Scar 17 G732LXS i9-10980HK, GeForce RTX 2080 Super Mobile, 2x Intel SSD 660p 1TB SSDPEKNW010T8 (RAID 0), IPS, 1920x1080, 17.3" | MSI GE75 Raider 10SE-008US i7-10750H, GeForce RTX 2060 Mobile, Samsung SSD PM981 MZVLB512HAJQ, IPS, 1920x1080, 17.3" | Razer Blade Pro 17 RTX 2070 Max-Q 300 Hz i7-10875H, GeForce RTX 2070 Max-Q, Lite-On CA5-8D512, IPS, 1920x1080, 17.3" | |
|---|---|---|---|---|---|---|
| Power Consumption | 36% | 35% | 21% | 41% | 35% | |
| Idle Minimum * (Watt) | 33.6 | 20.2 40% | 19.2 43% | 16 52% | 14.7 56% | 19.6 42% |
| Idle Average * (Watt) | 43.9 | 24.5 44% | 22.4 49% | 25 43% | 20.4 54% | 21.7 51% |
| Idle Maximum * (Watt) | 59 | 28.7 51% | 34.7 41% | 35 41% | 26.9 54% | 36.1 39% |
| Load Average * (Watt) | 134.9 | 110.4 18% | 106.7 21% | 177 -31% | 93.2 31% | 115.6 14% |
| Witcher 3 ultra * (Watt) | 242 | 166.3 31% | 160.5 34% | 227 6% | 185.4 23% | 157 35% |
| Load Maximum * (Watt) | 320 | 217.4 32% | 248.7 22% | 280 12% | 237.8 26% | 219.9 31% |
* ... mindre är bättre
| Alienware m17 R3 P45E i9-10980HK, GeForce RTX 2080 Super Mobile, 86 Wh | Eluktronics RP-17 R7 4800H, GeForce RTX 2060 Mobile, 62 Wh | MSI GS75 10SF-609US i7-10875H, GeForce RTX 2070 Max-Q, 80.25 Wh | Asus Strix Scar 17 G732LXS i9-10980HK, GeForce RTX 2080 Super Mobile, 66 Wh | MSI GE75 Raider 10SE-008US i7-10750H, GeForce RTX 2060 Mobile, 65 Wh | Razer Blade Pro 17 RTX 2070 Max-Q 300 Hz i7-10875H, GeForce RTX 2070 Max-Q, 70 Wh | |
|---|---|---|---|---|---|---|
| Batteridrifttid | 48% | 224% | 123% | 16% | 53% | |
| Reader / Idle (h) | 3.7 | 8.6 132% | 10 170% | |||
| WiFi v1.3 (h) | 3.2 | 4.4 38% | 4.9 53% | 5.9 84% | 3.7 16% | 4.9 53% |
| Load (h) | 0.7 | 1.1 57% | 4.1 486% | 1.5 114% |
För
Emot
Läs den fullständiga versionen av den här recensionen på engelska här.
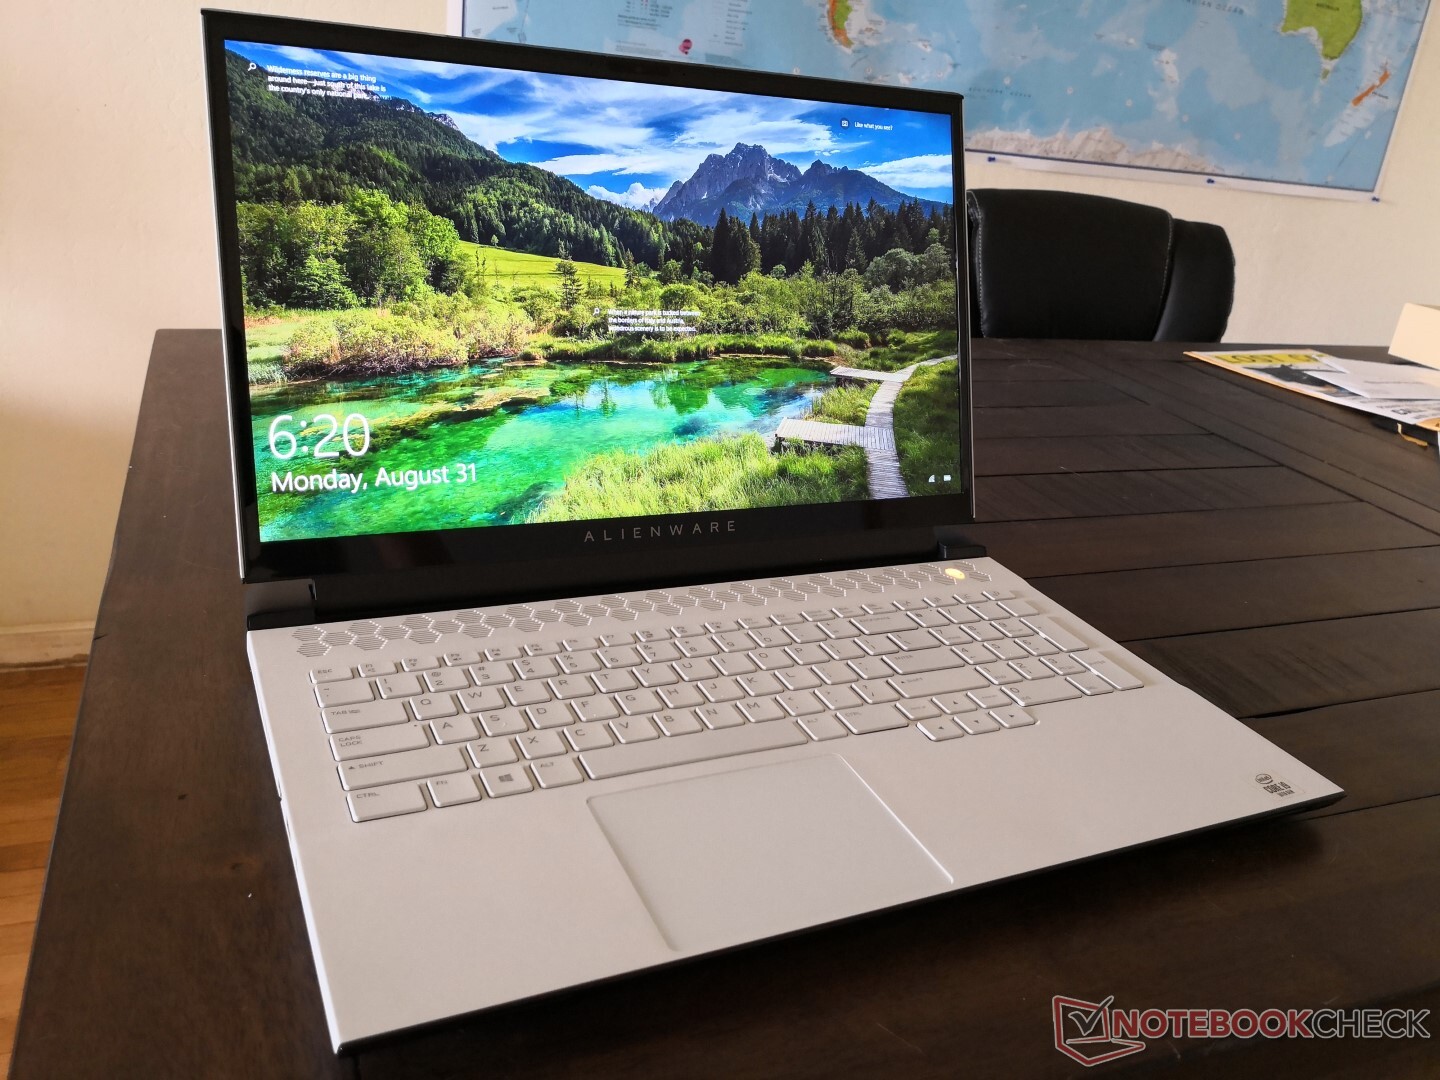
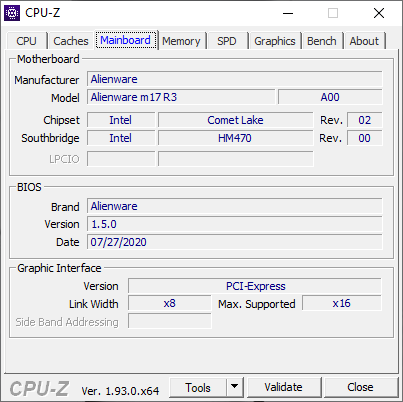
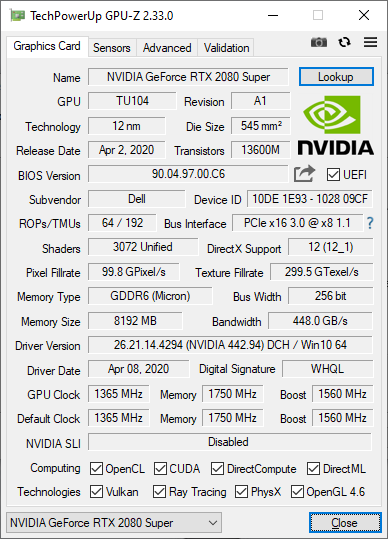
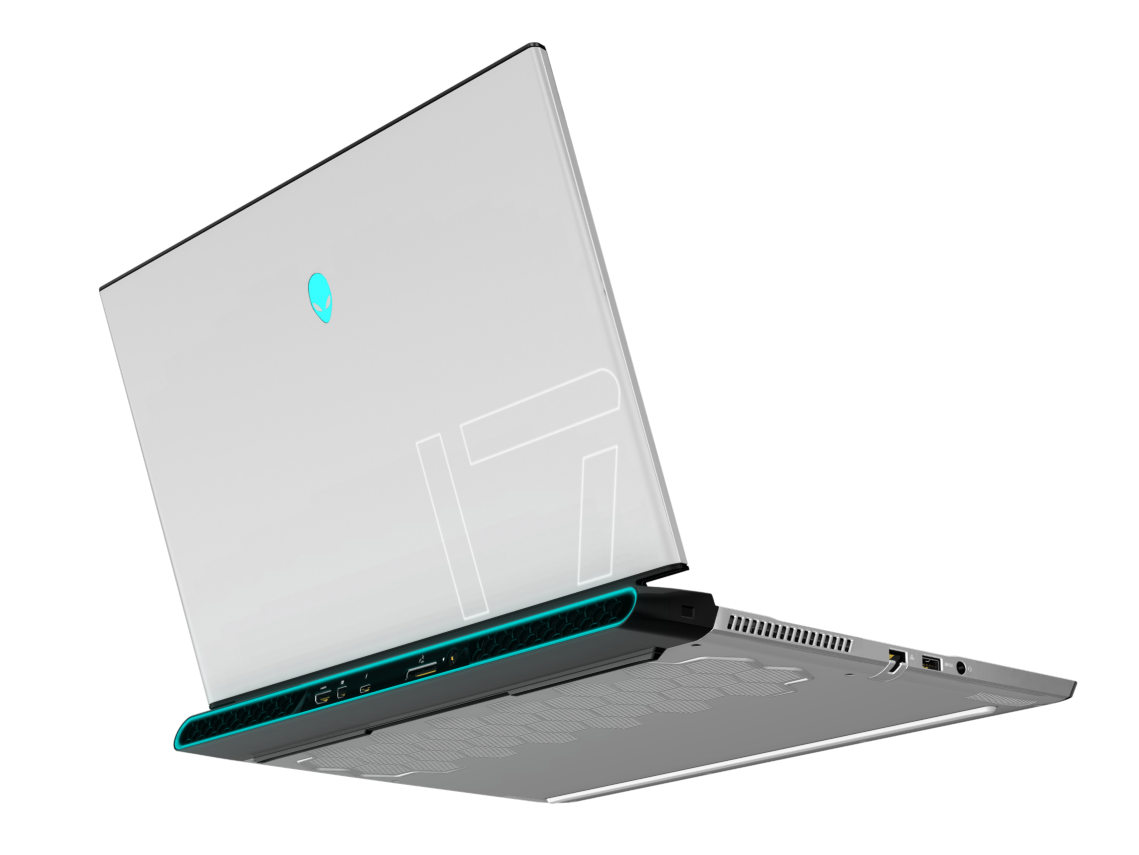
Till skillnad från MSI GS75 eller Razer Blade Pro, som förlitar sig på grafikkort med Max-Q, lyckas Alienware m17 R3 inrymma ett fullständigt mobilt GeForce RTX 2080 Super, vilket ger märkbart bättre prestanda i spel. Entusiaster som vill spela spel i 1080p med 60+ FPS eller 4K60 kommer uppskatta de extra hästkrafterna som Alienware kan leverera jämfört med de flesta andra ultra-tunna bärbara speldatorerna. Turbo Boost-klockfrekvenserna håller sig ockå konsekventa över tid, vilket är imponerande för ett såpass tunt chassi som innehåller både en olåst Core i9 CPU och en GeForce Super GPU.
De större bristerna inkluderar hög vikt och fläktar som låter mycket, till och med för en spellaptop på 17.3 tum. m17 R3 är varken tystare, svalare, mer uthållig eller lättare än m17 R2 trots ett identiskt chassi. Den är definitivt snabbare, men alla existerande brister förstärks som ett resultat av detta. För en del hardcore-gamers kan den dock mycket väl vara värd det priset.
Alienware m17 R3 är den snabbaste bärbara speldatorn på 17.3 tum som du kan få tag på med den här tjockleken, eftersom de flesta andra modellerna i den här kategorin endast kommer med långsammare Max-Q alternativ. Utgångspunkten är "prestanda till varje pris", vilket fungerar så länge du är medveten om den höga vikten och de högljudda fläktarna.
Alienware m17 R3 P45E
- 09/04/2020 v7 (old)
Allen Ngo
Price comparison
