Test: ASUS ROG Strix Scar II GL704GW (Core i7-8750H, RTX 2070) Laptop (Sammanfattning)
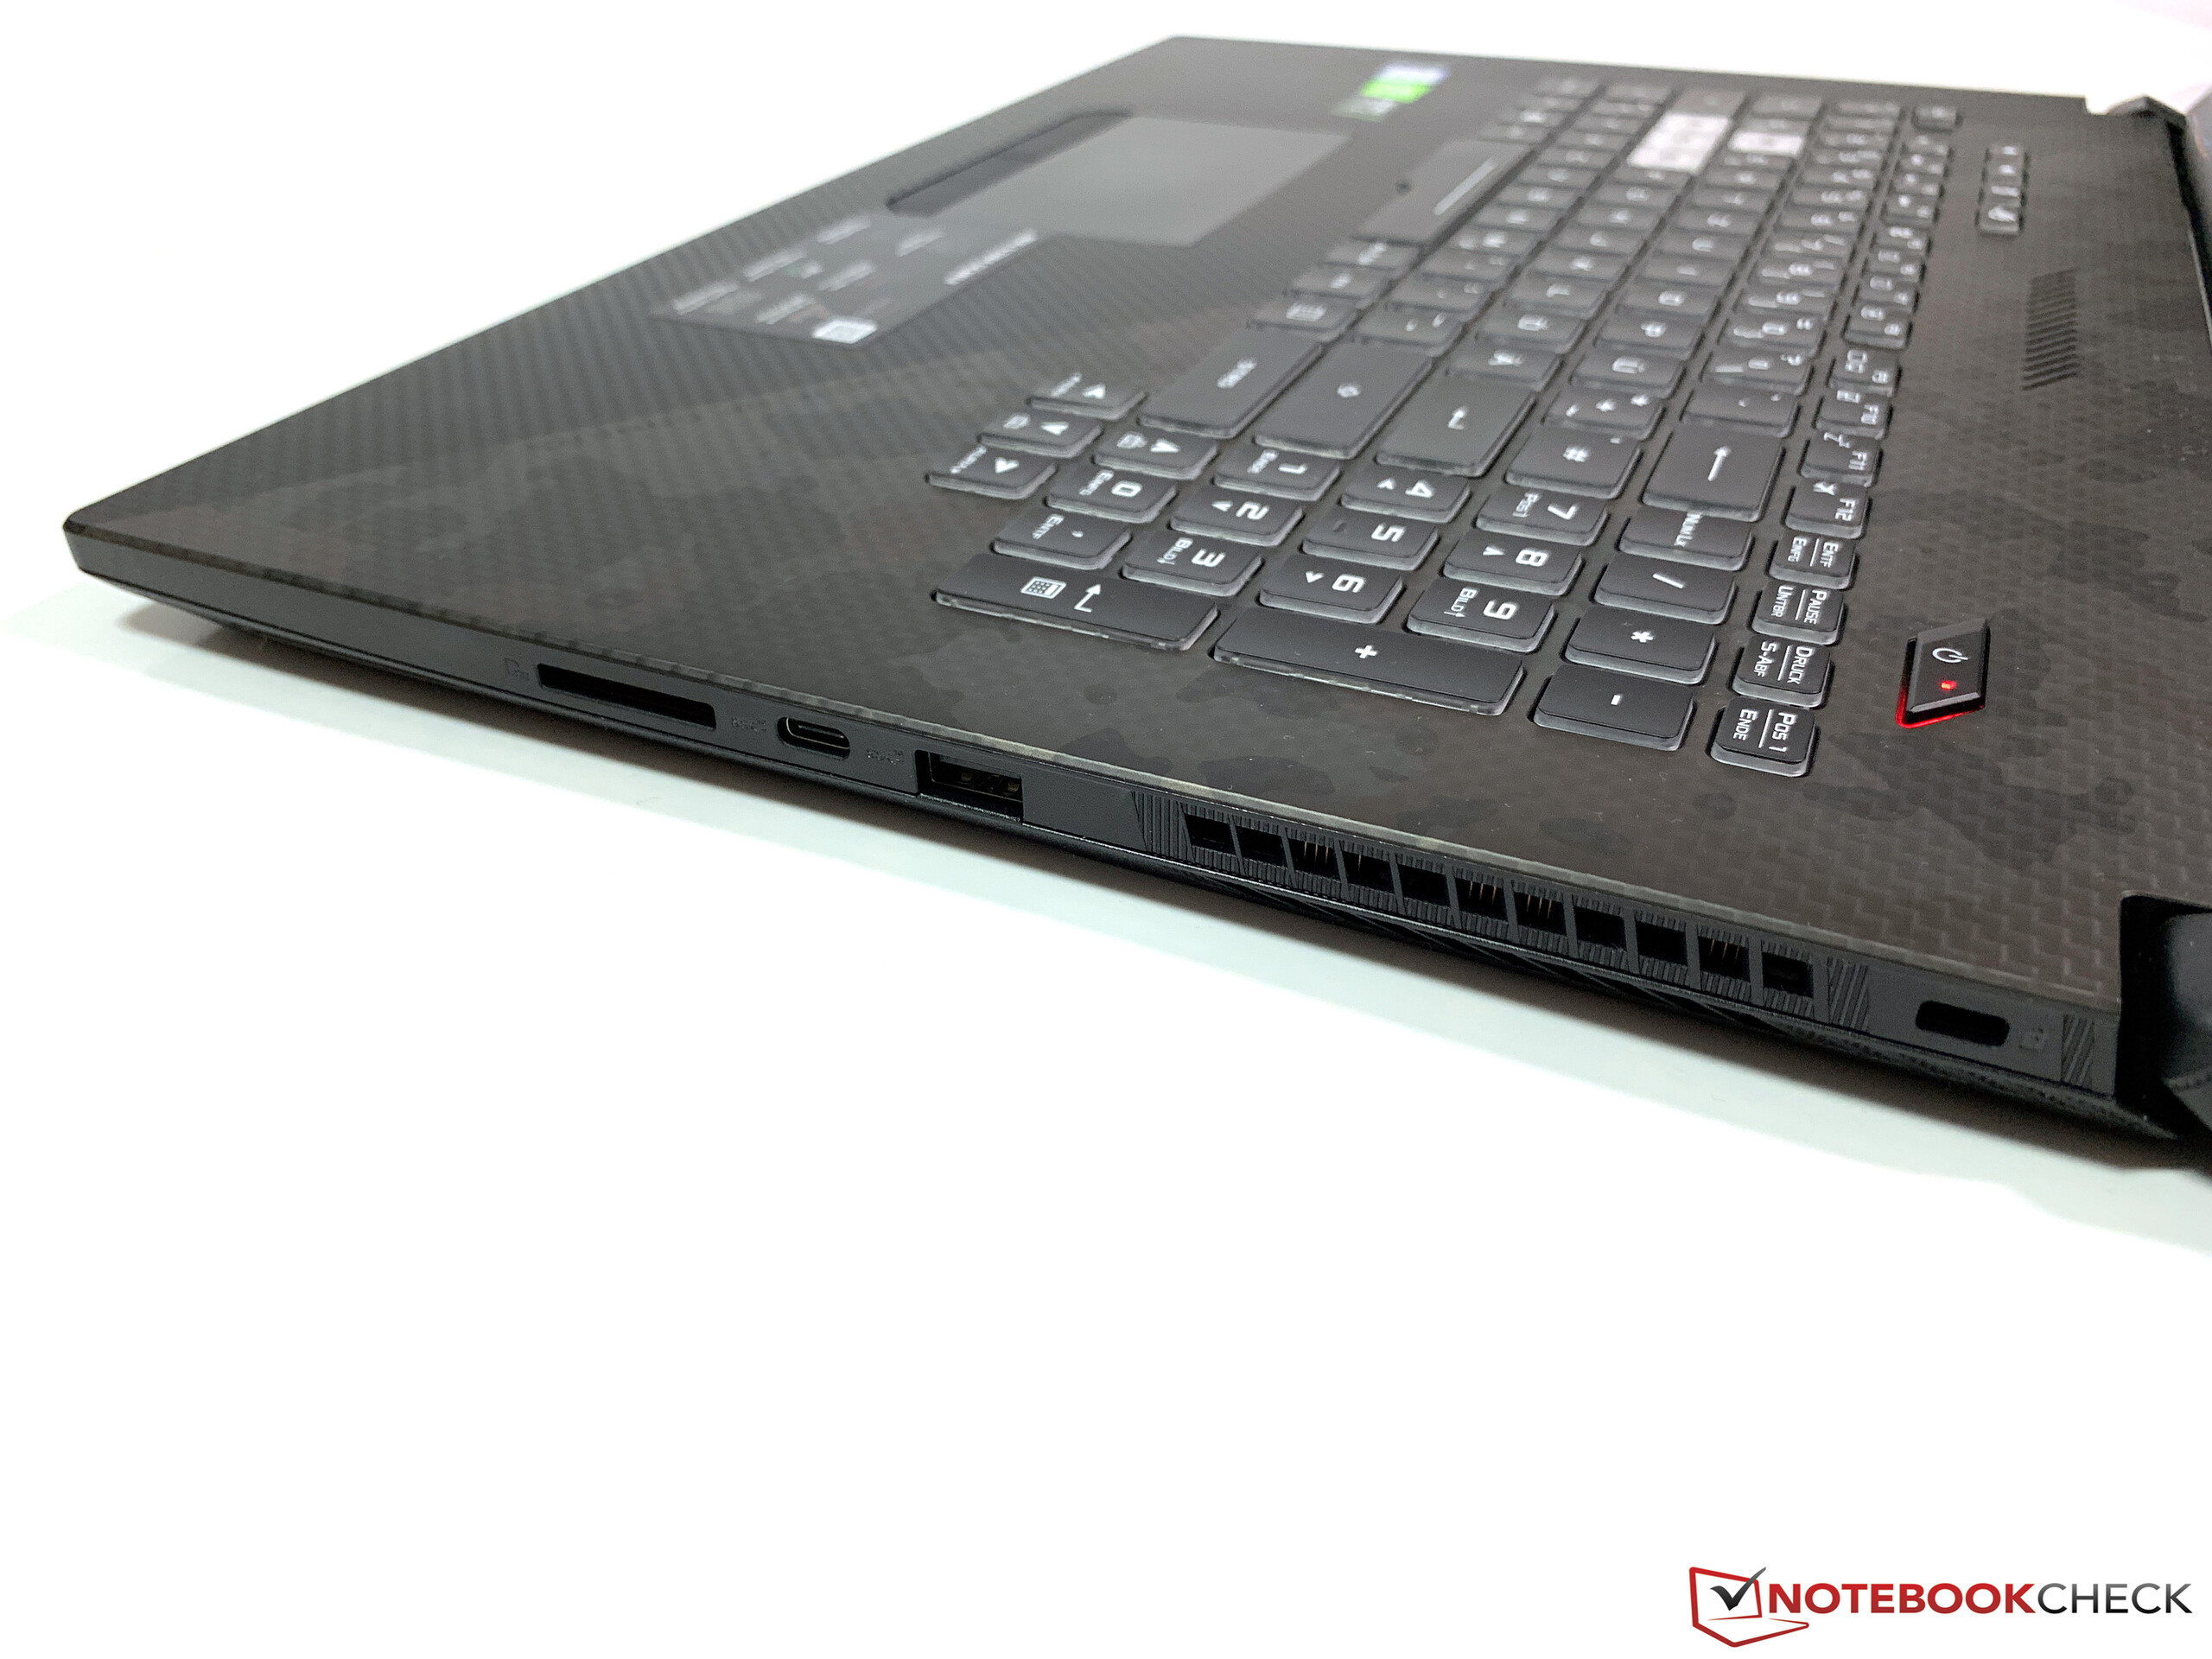
| SD Card Reader | |
| average JPG Copy Test (av. of 3 runs) | |
| MSI GS73VR 7RG (Toshiba Exceria Pro SDXC 64 GB UHS-II) | |
| Genomsnitt av klass Gaming (20.9 - 210, n=54, senaste 2 åren) | |
| HP Omen 17t-3AW55AV_1 (Toshiba Exceria Pro SDXC 64 GB UHS-II) | |
| Asus ROG Strix Scar II GL704GW (Toshiba Exceria Pro SDXC 64 GB UHS-II) | |
| Asus GL704GM-DH74 (Toshiba Exceria Pro SDXC 64 GB UHS-II) | |
| Gigabyte Sabre 17-W8 (Toshiba Exceria Pro SDXC 64 GB UHS-II) | |
| MSI GL73 8SE-010US (Toshiba Exceria Pro SDXC 64 GB UHS-II) | |
| maximum AS SSD Seq Read Test (1GB) | |
| MSI GS73VR 7RG (Toshiba Exceria Pro SDXC 64 GB UHS-II) | |
| Genomsnitt av klass Gaming (25.5 - 261, n=51, senaste 2 åren) | |
| HP Omen 17t-3AW55AV_1 (Toshiba Exceria Pro SDXC 64 GB UHS-II) | |
| Asus ROG Strix Scar II GL704GW (Toshiba Exceria Pro SDXC 64 GB UHS-II) | |
| Gigabyte Sabre 17-W8 (Toshiba Exceria Pro SDXC 64 GB UHS-II) | |
| Asus GL704GM-DH74 (Toshiba Exceria Pro SDXC 64 GB UHS-II) | |
| MSI GL73 8SE-010US (Toshiba Exceria Pro SDXC 64 GB UHS-II) | |
| Networking | |
| iperf3 transmit AX12 | |
| Asus GL704GM-DH74 | |
| HP Omen 17t-3AW55AV_1 | |
| MSI GL73 8SE-010US | |
| MSI GS73VR 7RG | |
| Asus ROG Strix Scar II GL704GW | |
| Gigabyte Sabre 17-W8 | |
| iperf3 receive AX12 | |
| Asus GL704GM-DH74 | |
| MSI GL73 8SE-010US | |
| HP Omen 17t-3AW55AV_1 | |
| MSI GS73VR 7RG | |
| Asus ROG Strix Scar II GL704GW | |
| Gigabyte Sabre 17-W8 | |
| |||||||||||||||||||||||||
Distribution av ljusstyrkan: 96 %
Kontrast: 1229:1 (Svärta: 0.24 cd/m²)
ΔE ColorChecker Calman: 3.2 | ∀{0.5-29.43 Ø4.71}
calibrated: 2.52
ΔE Greyscale Calman: 2.16 | ∀{0.09-98 Ø4.96}
87% sRGB (Argyll 1.6.3 3D)
57% AdobeRGB 1998 (Argyll 1.6.3 3D)
63.7% AdobeRGB 1998 (Argyll 3D)
87.1% sRGB (Argyll 3D)
62.9% Display P3 (Argyll 3D)
Gamma: 2.46
CCT: 6872 K
| Asus ROG Strix Scar II GL704GW B173HAN04.0 (AUO409D), AHVA, 1920x1080 | Asus GL704GM-DH74 AU Optronics B173HAN04.0, IPS, 1920x1080 | MSI GS73VR 7RG ID: CMN1747, Name: Chi Mei N173HHE-G32, TN LED, 1920x1080 | Gigabyte Sabre 17-W8 Chi Mei CMN1747, TN, 1920x1080 | HP Omen 17t-3AW55AV_1 AU Optronics AUO309D, IPS, 1920x1080 | MSI GL73 8SE-010US CMN1747, TN LED, 1920x1080 | |
|---|---|---|---|---|---|---|
| Display | 0% | 31% | 31% | 3% | 31% | |
| Display P3 Coverage (%) | 62.9 | 62 -1% | 89.6 42% | 89.9 43% | 65.4 4% | 91.1 45% |
| sRGB Coverage (%) | 87.1 | 89.2 2% | 100 15% | 100 15% | 90 3% | 100 15% |
| AdobeRGB 1998 Coverage (%) | 63.7 | 63.3 -1% | 86.9 36% | 85.1 34% | 65.8 3% | 85.4 34% |
| Response Times | 31% | -5% | 39% | 6% | 27% | |
| Response Time Grey 50% / Grey 80% * (ms) | 17.6 ? | 6.8 ? 61% | 23.6 ? -34% | 9 ? 49% | 17.6 ? -0% | 12.8 ? 27% |
| Response Time Black / White * (ms) | 11.2 ? | 11.2 ? -0% | 8.4 ? 25% | 8 ? 29% | 10 ? 11% | 8.2 ? 27% |
| PWM Frequency (Hz) | 26040 ? | 25000 ? | 25770 ? | |||
| Screen | -18% | -67% | -62% | -13% | -57% | |
| Brightness middle (cd/m²) | 295 | 324.4 10% | 350.9 19% | 326 11% | 343.6 16% | 326.4 11% |
| Brightness (cd/m²) | 291 | 314 8% | 311 7% | 309 6% | 320 10% | 317 9% |
| Brightness Distribution (%) | 96 | 92 -4% | 79 -18% | 82 -15% | 87 -9% | 90 -6% |
| Black Level * (cd/m²) | 0.24 | 0.35 -46% | 0.33 -38% | 0.27 -13% | 0.34 -42% | 0.28 -17% |
| Contrast (:1) | 1229 | 927 -25% | 1063 -14% | 1207 -2% | 1011 -18% | 1166 -5% |
| Colorchecker dE 2000 * | 3.2 | 3.82 -19% | 7.7 -141% | 9.11 -185% | 3.74 -17% | 7.83 -145% |
| Colorchecker dE 2000 max. * | 6.64 | 6.4 4% | 14.4 -117% | 14.14 -113% | 5.33 20% | 13.36 -101% |
| Colorchecker dE 2000 calibrated * | 2.52 | 3.32 -32% | 2.62 -4% | 3.49 -38% | 2.83 -12% | |
| Greyscale dE 2000 * | 2.16 | 4.3 -99% | 11.1 -414% | 11.17 -417% | 3.7 -71% | 10.9 -405% |
| Gamma | 2.46 89% | 2.2 100% | 2.11 104% | 2.28 96% | 2.36 93% | 1.97 112% |
| CCT | 6872 95% | 7366 88% | 11813 55% | 12475 52% | 6388 102% | 11056 59% |
| Color Space (Percent of AdobeRGB 1998) (%) | 57 | 57.5 1% | 77.74 36% | 76 33% | 58 2% | 75.8 33% |
| Color Space (Percent of sRGB) (%) | 87 | 88.8 2% | 100 15% | 100 15% | 90 3% | 100 15% |
| Totalt genomsnitt (program/inställningar) | 4% /
-9% | -14% /
-39% | 3% /
-32% | -1% /
-8% | 0% /
-30% |
* ... mindre är bättre
Visa svarstider
| ↔ Svarstid svart till vitt | ||
|---|---|---|
| 11.2 ms ... stiga ↗ och falla ↘ kombinerat | ↗ 6.8 ms stiga | 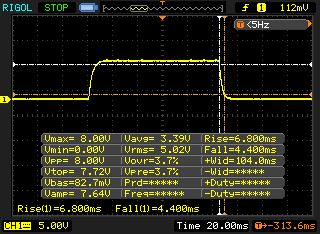 |
| ↘ 4.4 ms hösten | ||
| Skärmen visar bra svarsfrekvens i våra tester, men kan vara för långsam för konkurrenskraftiga spelare. I jämförelse sträcker sig alla testade enheter från 0.1 (minst) till 240 (maximalt) ms. » 30 % av alla enheter är bättre. Det betyder att den uppmätta svarstiden är bättre än genomsnittet av alla testade enheter (19.8 ms). | ||
| ↔ Svarstid 50 % grått till 80 % grått | ||
| 17.6 ms ... stiga ↗ och falla ↘ kombinerat | ↗ 8.4 ms stiga | 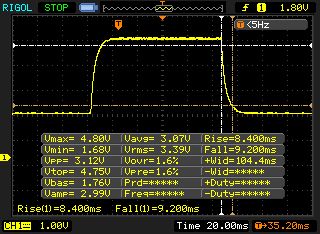 |
| ↘ 9.2 ms hösten | ||
| Skärmen visar bra svarsfrekvens i våra tester, men kan vara för långsam för konkurrenskraftiga spelare. I jämförelse sträcker sig alla testade enheter från 0.165 (minst) till 636 (maximalt) ms. » 32 % av alla enheter är bättre. Det betyder att den uppmätta svarstiden är bättre än genomsnittet av alla testade enheter (31 ms). | ||
Skärmflimmer / PWM (Puls-Width Modulation)
| Skärmflimmer / PWM upptäcktes inte |  | ||
Som jämförelse: 52 % av alla testade enheter använder inte PWM för att dämpa skärmen. Om PWM upptäcktes mättes ett medelvärde av 7754 (minst: 5 - maximum: 343500) Hz. | |||

| Cinebench R15 | |
| CPU Single 64Bit | |
| Genomsnitt av klass Gaming (188.8 - 350, n=106, senaste 2 åren) | |
| Asus GL704GM-DH74 | |
| Asus ROG Strix Scar II GL704GW | |
| Gigabyte Sabre 17-W8 | |
| MSI GL73 8SE-010US | |
| HP Omen 17t-3AW55AV_1 | |
| MSI GS73VR 7RG | |
| CPU Multi 64Bit | |
| Genomsnitt av klass Gaming (1578 - 6330, n=105, senaste 2 åren) | |
| Asus ROG Strix Scar II GL704GW | |
| Gigabyte Sabre 17-W8 | |
| Asus GL704GM-DH74 | |
| HP Omen 17t-3AW55AV_1 | |
| MSI GL73 8SE-010US | |
| MSI GS73VR 7RG | |
| PCMark 10 - Score | |
| Genomsnitt av klass Gaming (5828 - 12414, n=93, senaste 2 åren) | |
| HP Omen 17t-3AW55AV_1 | |
| Asus ROG Strix Scar II GL704GW | |
| MSI GL73 8SE-010US | |
| Asus GL704GM-DH74 | |
| Gigabyte Sabre 17-W8 | |
| MSI GS73VR 7RG | |
| PCMark 8 | |
| Home Score Accelerated v2 | |
| Genomsnitt av klass Gaming (n=1senaste 2 åren) | |
| HP Omen 17t-3AW55AV_1 | |
| Asus ROG Strix Scar II GL704GW | |
| MSI GS73VR 7RG | |
| Asus GL704GM-DH74 | |
| Gigabyte Sabre 17-W8 | |
| MSI GL73 8SE-010US | |
| Work Score Accelerated v2 | |
| HP Omen 17t-3AW55AV_1 | |
| Asus GL704GM-DH74 | |
| Asus ROG Strix Scar II GL704GW | |
| MSI GL73 8SE-010US | |
| Gigabyte Sabre 17-W8 | |
| MSI GS73VR 7RG | |
| Genomsnitt av klass Gaming (n=1senaste 2 åren) | |
| PCMark 8 Home Score Accelerated v2 | 4861 poäng | |
| PCMark 8 Creative Score Accelerated v2 | 7941 poäng | |
| PCMark 8 Work Score Accelerated v2 | 5663 poäng | |
| PCMark 10 Score | 5555 poäng | |
Hjälp | ||
| Asus ROG Strix Scar II GL704GW Intel SSD 660p SSDPEKNW512G8 | Asus GL704GM-DH74 WDC PC SN520 SDAPNUW-256G | MSI GS73VR 7RG Samsung SSD PM871 MZNLN512HMJP | Gigabyte Sabre 17-W8 Toshiba NVMe THNSN5256GPU7 | HP Omen 17t-3AW55AV_1 Samsung SSD PM981 MZVLB512HAJQ | MSI GL73 8SE-010US Kingston RBUSNS8154P3128GJ | |
|---|---|---|---|---|---|---|
| CrystalDiskMark 5.2 / 6 | -1% | -19% | 1% | 29% | -43% | |
| Write 4K (MB/s) | 99.6 | 96.8 -3% | 141.3 42% | 104.7 5% | 110.7 11% | 71.2 -29% |
| Read 4K (MB/s) | 48.99 | 39.82 -19% | 41.02 -16% | 37.39 -24% | 35.49 -28% | 32.7 -33% |
| Write Seq (MB/s) | 972 | 1197 23% | 507 -48% | 866 -11% | 1665 71% | 404.5 -58% |
| Read Seq (MB/s) | 1515 | 1166 -23% | 539 -64% | 944 -38% | 1284 -15% | 8.3 -99% |
| Write 4K Q32T1 (MB/s) | 280.6 | 247.3 -12% | 362.8 29% | 293.3 5% | 340.2 21% | 204 -27% |
| Read 4K Q32T1 (MB/s) | 327.8 | 314.3 -4% | 402.8 23% | 374.3 14% | 407.5 24% | 303.2 -8% |
| Write Seq Q32T1 (MB/s) | 970 | 1302 34% | 524 -46% | 1064 10% | 2038 110% | 386.5 -60% |
| Read Seq Q32T1 (MB/s) | 1757 | 1688 -4% | 553 -69% | 2616 49% | 2367 35% | 1214 -31% |
| AS SSD | 6% | -23% | 14% | 83% | -53% | |
| Seq Read (MB/s) | 1315 | 1102 -16% | 497.9 -62% | 2120 61% | 1473 12% | 794 -40% |
| Seq Write (MB/s) | 927 | 1204 30% | 465.1 -50% | 871 -6% | 1962 112% | 427.6 -54% |
| 4K Read (MB/s) | 52.4 | 28.76 -45% | 33.69 -36% | 20.59 -61% | 31.66 -40% | 21.91 -58% |
| 4K Write (MB/s) | 122.8 | 92.9 -24% | 96.8 -21% | 88.4 -28% | 84.4 -31% | 56.6 -54% |
| 4K-64 Read (MB/s) | 326.5 | 649 99% | 337.7 3% | 848 160% | 1125 245% | 354.3 9% |
| 4K-64 Write (MB/s) | 727 | 593 -18% | 273.6 -62% | 591 -19% | 1866 157% | 285.7 -61% |
| Access Time Read * (ms) | 0.11 | 0.141 -28% | 0.051 54% | 0.191 -74% | 0.071 35% | 0.237 -115% |
| Access Time Write * (ms) | 0.045 | 0.04 11% | 0.032 29% | 0.047 -4% | 0.047 -4% | 0.09 -100% |
| Score Read (Points) | 510 | 788 55% | 421 -17% | 1080 112% | 1304 156% | 456 -11% |
| Score Write (Points) | 942 | 806 -14% | 417 -56% | 767 -19% | 2147 128% | 385 -59% |
| Score Total (Points) | 1715 | 2008 17% | 1064 -38% | 2335 36% | 4142 142% | 1061 -38% |
| Totalt genomsnitt (program/inställningar) | 3% /
3% | -21% /
-21% | 8% /
9% | 56% /
60% | -48% /
-49% |
* ... mindre är bättre

| 3DMark 11 - 1280x720 Performance GPU | |
| Genomsnitt av klass Gaming (21841 - 80022, n=104, senaste 2 åren) | |
| Asus ROG Strix Scar II GL704GW (Turbo Mode) | |
| Asus ROG Strix Scar II GL704GW | |
| Razer Blade 15 RTX 2070 Max-Q | |
| HP Omen 17t-3AW55AV_1 | |
| MSI GL73 8SE-010US | |
| MSI GS73VR 7RG | |
| Asus GL704GM-DH74 | |
| Gigabyte Sabre 17-W8 | |
| 3DMark | |
| 3840x2160 Fire Strike Ultra Graphics | |
| Genomsnitt av klass Gaming (7980 - 16509, n=6, senaste 2 åren) | |
| Asus ROG Strix Scar II GL704GW | |
| Razer Blade 15 RTX 2070 Max-Q | |
| MSI GL73 8SE-010US | |
| MSI GS73VR 7RG | |
| 1920x1080 Fire Strike Graphics | |
| Genomsnitt av klass Gaming (12242 - 62849, n=115, senaste 2 åren) | |
| Asus ROG Strix Scar II GL704GW | |
| Razer Blade 15 RTX 2070 Max-Q | |
| HP Omen 17t-3AW55AV_1 | |
| MSI GL73 8SE-010US | |
| MSI GS73VR 7RG | |
| Asus GL704GM-DH74 | |
| Gigabyte Sabre 17-W8 | |
| 2560x1440 Time Spy Graphics | |
| Genomsnitt av klass Gaming (5012 - 26212, n=115, senaste 2 åren) | |
| Asus ROG Strix Scar II GL704GW | |
| Razer Blade 15 RTX 2070 Max-Q | |
| MSI GL73 8SE-010US | |
| 3DMark 11 Performance | 19085 poäng | |
| 3DMark Fire Strike Score | 16810 poäng | |
| 3DMark Fire Strike Extreme Score | 8788 poäng | |
| 3DMark Time Spy Score | 7182 poäng | |
Hjälp | ||
| The Witcher 3 | |
| 1920x1080 High Graphics & Postprocessing (Nvidia HairWorks Off) | |
| Genomsnitt av klass Gaming (341 - 404, n=2, senaste 2 åren) | |
| Asus ROG G703GX | |
| Asus ROG Strix Scar II GL704GW | |
| MSI GL73 8SE-010US | |
| MSI GS73VR 7RG | |
| HP Omen 17t-3AW55AV_1 | |
| Asus GL704GM-DH74 | |
| Gigabyte Sabre 17-W8 | |
| 1920x1080 Ultra Graphics & Postprocessing (HBAO+) | |
| Genomsnitt av klass Gaming (104.7 - 240, n=7, senaste 2 åren) | |
| Asus ROG G703GX | |
| MSI GS75 8SG Stealth | |
| Asus ROG Strix Scar II GL704GW | |
| Schenker XMG Ultra 17 Coffee Lake Refresh | |
| HP Omen 17t-3AW55AV_1 | |
| MSI GL73 8SE-010US | |
| MSI GS73VR 7RG | |
| Asus GL704GM-DH74 | |
| Gigabyte Sabre 17-W8 | |
| Shadow of the Tomb Raider | |
| 1920x1080 Highest Preset AA:T | |
| Asus ROG G703GX | |
| Genomsnitt av klass Gaming (96 - 116, n=2, senaste 2 åren) | |
| Asus ROG Strix Scar II GL704GW | |
| Schenker XMG Ultra 17 Coffee Lake Refresh | |
| MSI GS75 8SG Stealth | |
| MSI GL73 8SE-010US | |
| 1920x1080 High Preset AA:SM | |
| Genomsnitt av klass Gaming (107 - 127, n=2, senaste 2 åren) | |
| Asus ROG G703GX | |
| Asus ROG Strix Scar II GL704GW | |
| MSI GL73 8SE-010US | |
| Rise of the Tomb Raider | |
| 1920x1080 High Preset AA:FX AF:4x | |
| Asus ROG Strix Scar II GL704GW | |
| HP Omen 17t-3AW55AV_1 | |
| MSI GS73VR 7RG | |
| Asus GL704GM-DH74 | |
| Gigabyte Sabre 17-W8 | |
| 1920x1080 Very High Preset AA:FX AF:16x | |
| Asus ROG Strix Scar II GL704GW | |
| HP Omen 17t-3AW55AV_1 | |
| MSI GS73VR 7RG | |
| Asus GL704GM-DH74 | |
| Gigabyte Sabre 17-W8 | |
| Battlefield V | |
| 1920x1080 Ultra Preset | |
| Asus ROG G703GX | |
| MSI GS75 8SG Stealth | |
| Asus ROG Strix Scar II GL704GW | |
| 1920x1080 High Preset | |
| Asus ROG G703GX | |
| Asus ROG Strix Scar II GL704GW | |
| Darksiders III | |
| 1920x1080 Epic | |
| Asus ROG G703GX | |
| Asus ROG Strix Scar II GL704GW | |
| 1920x1080 High | |
| Asus ROG G703GX | |
| Asus ROG Strix Scar II GL704GW | |
| låg | med. | hög | ultra | |
|---|---|---|---|---|
| GTA V (2015) | 163.4 | 155.7 | 126.6 | 71.4 |
| Dirt Rally (2015) | 254.5 | 160.6 | 199.7 | 113.6 |
| The Witcher 3 (2015) | 255.3 | 204.1 | 133.6 | 71.8 |
| Dota 2 Reborn (2015) | 129.7 | 120.7 | 115 | 109.2 |
| Rise of the Tomb Raider (2016) | 210.5 | 158.6 | 130.7 | 109 |
| Battlefield 1 (2016) | 165.4 | 141.5 | 120.6 | 113.3 |
| Assassin´s Creed Origins (2017) | 84 | 72 | 71 | 64 |
| Shadow of the Tomb Raider (2018) | 119 | 95 | 92 | 91 |
| Forza Horizon 4 (2018) | 137 | 113 | 112 | 94 |
| Battlefield V (2018) | 111.6 | 86 | 77.7 | 73 |
| Darksiders III (2018) | 169.2 | 102.4 | 98.5 | 94.7 |
| Just Cause 4 (2018) | 169.5 | 129.3 | 96.1 | 91.3 |
Ljudnivå
| Låg belastning |
| 29 / 32 / 40 dB(A) |
| Hårddisk |
| 32 dB(A) |
| Hög belastning |
| 46 / 52 dB(A) |
 | ||
30 dB tyst 40 dB(A) hörbar 50 dB(A) högt ljud |
||
min: | ||
| Asus ROG Strix Scar II GL704GW GeForce RTX 2070 Mobile, i7-8750H | Asus GL704GM-DH74 GeForce GTX 1060 Mobile, i7-8750H | MSI GS73VR 7RG GeForce GTX 1070 Max-Q, i7-7700HQ | Gigabyte Sabre 17-W8 GeForce GTX 1060 Mobile, i7-8750H | HP Omen 17t-3AW55AV_1 GeForce GTX 1070 Mobile, i7-8750H | MSI GL73 8SE-010US GeForce RTX 2060 Mobile, i7-8750H | |
|---|---|---|---|---|---|---|
| Noise | -3% | 7% | 3% | 6% | 3% | |
| av / miljö * (dB) | 29 | 28.2 3% | 28 3% | 30.5 -5% | 27.8 4% | 28.6 1% |
| Idle Minimum * (dB) | 29 | 30 -3% | 29.4 -1% | 32.1 -11% | 31.1 -7% | 33.8 -17% |
| Idle Average * (dB) | 32 | 31.8 1% | 30.7 4% | 32.1 -0% | 31.1 3% | 34 -6% |
| Idle Maximum * (dB) | 40 | 34.6 13% | 34 15% | 32.3 19% | 35 12% | 34.1 15% |
| Load Average * (dB) | 46 | 56 -22% | 42 9% | 42.9 7% | 42 9% | 36.5 21% |
| Witcher 3 ultra * (dB) | 51 | 54.2 -6% | 45.8 10% | 44.5 13% | 47.8 6% | |
| Load Maximum * (dB) | 52 | 56.7 -9% | 45.8 12% | 48.8 6% | 46.5 11% | 52.2 -0% |
* ... mindre är bättre
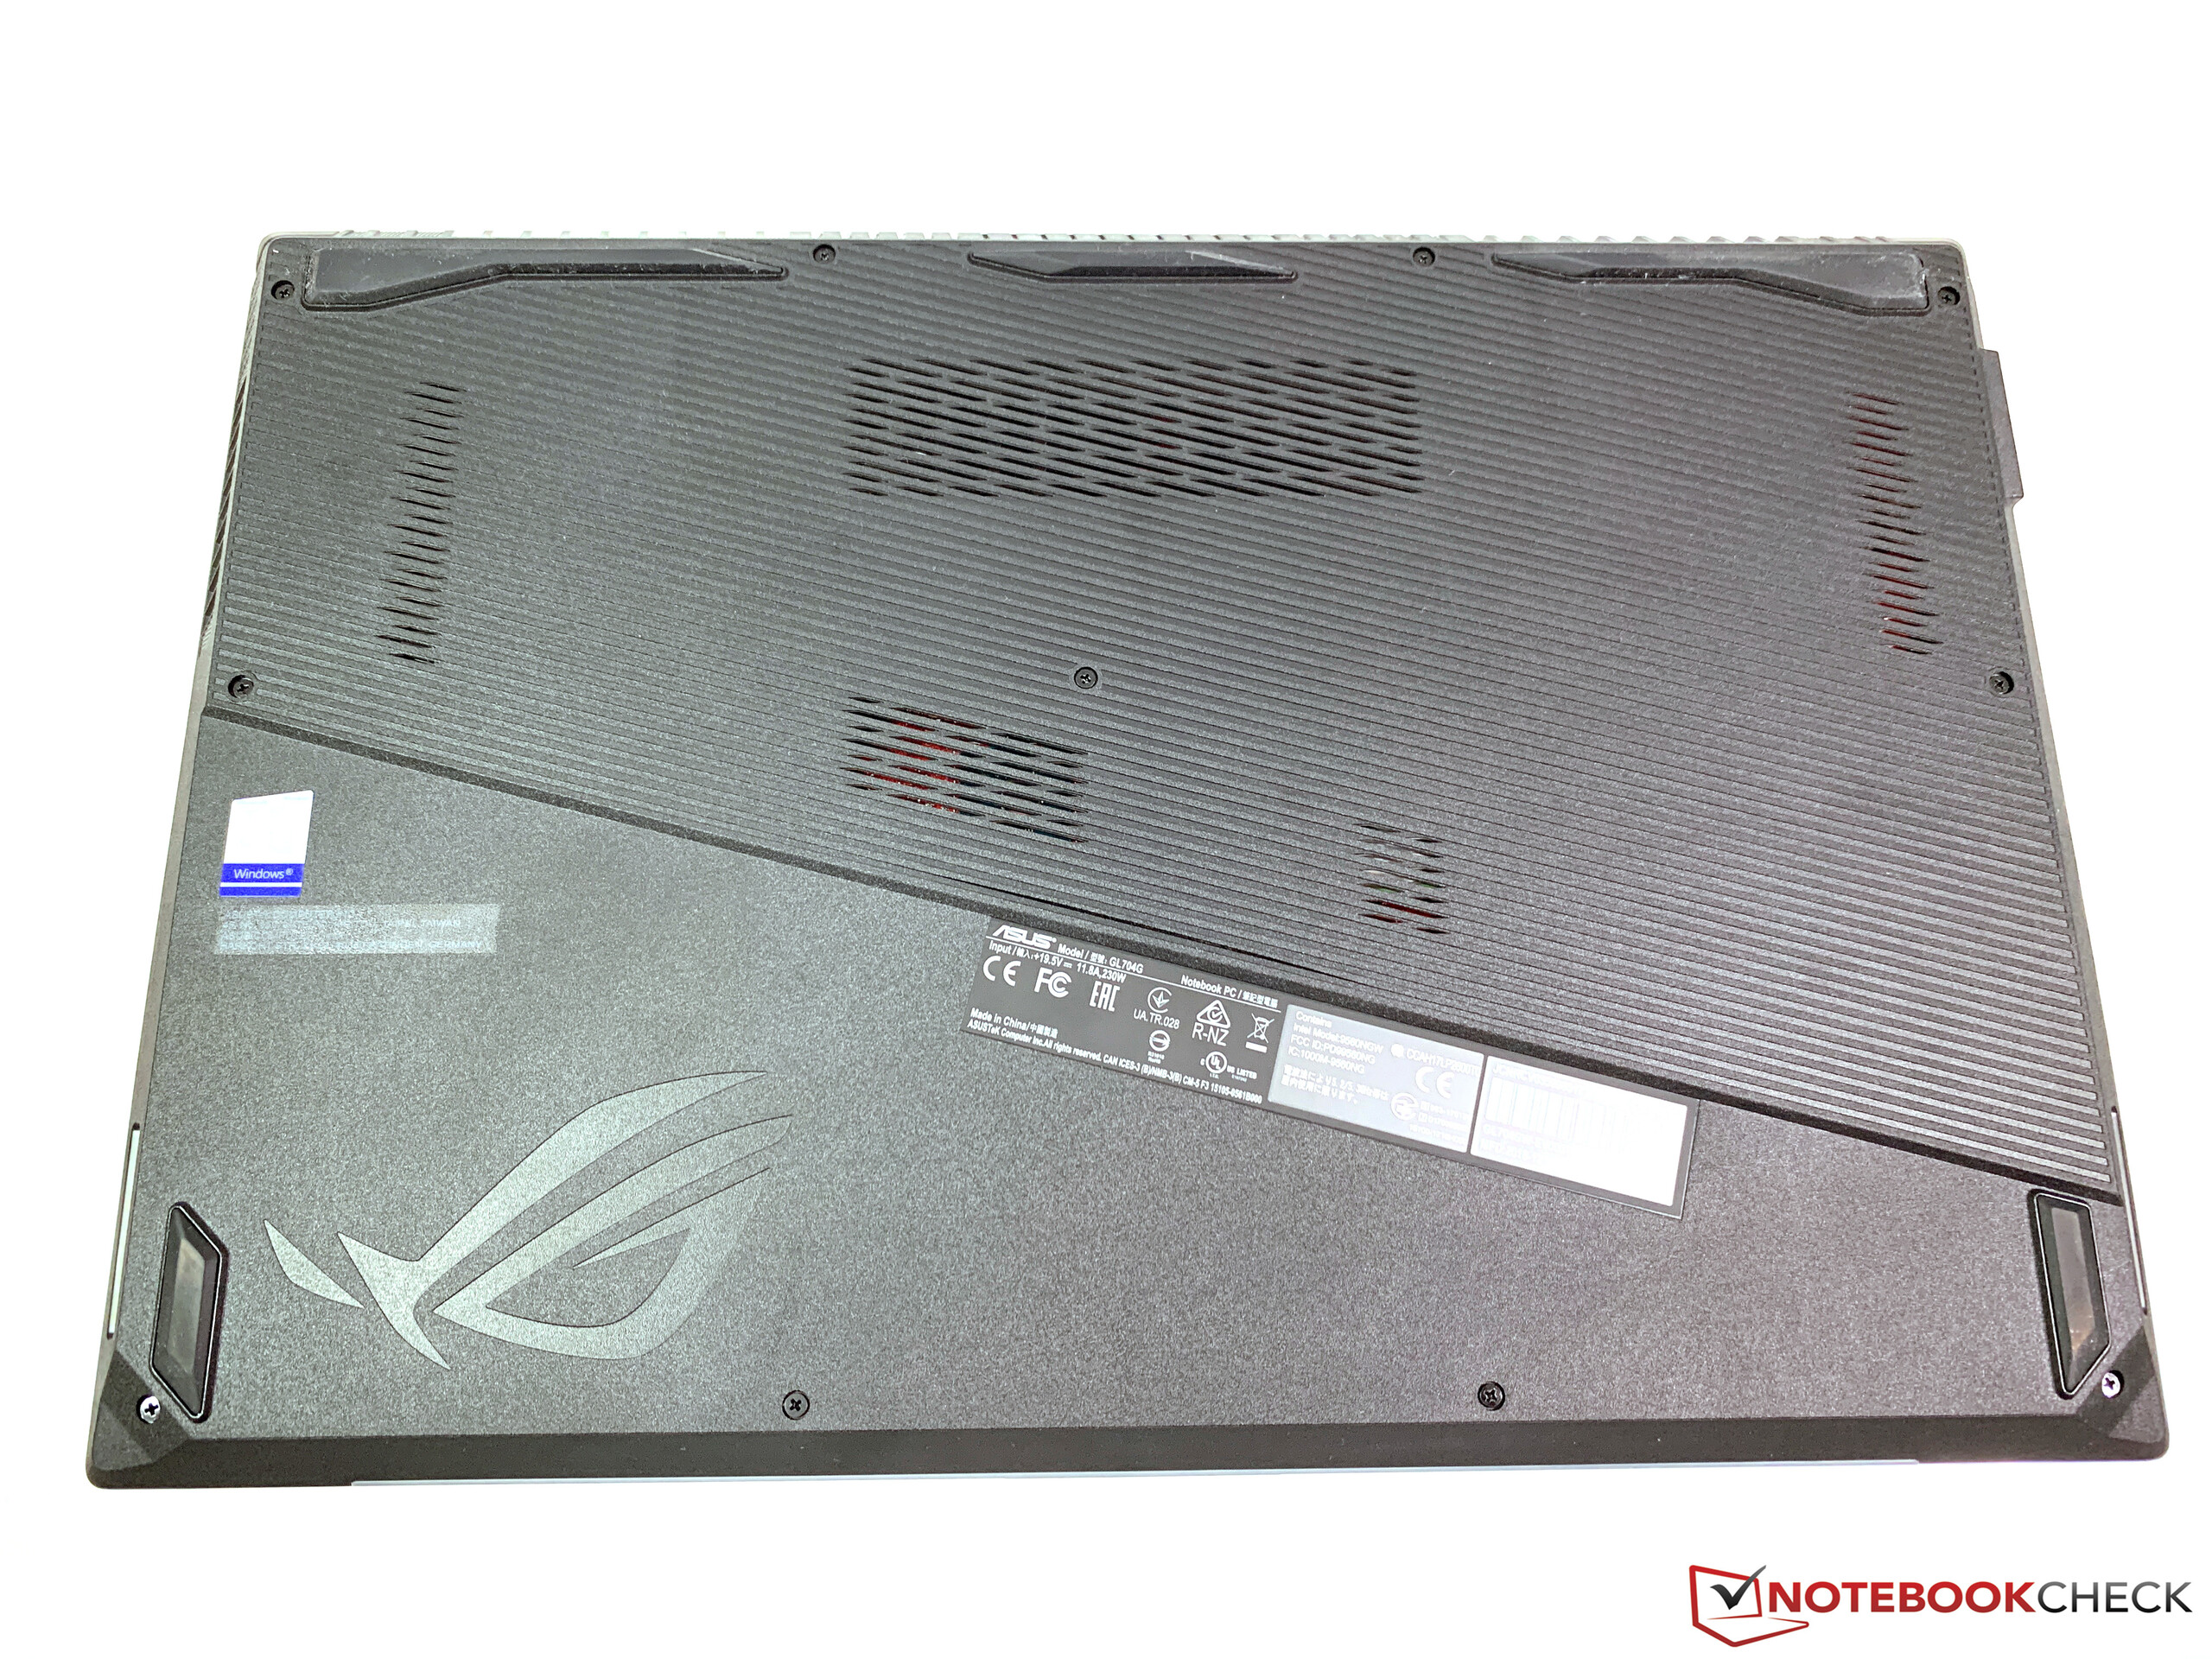
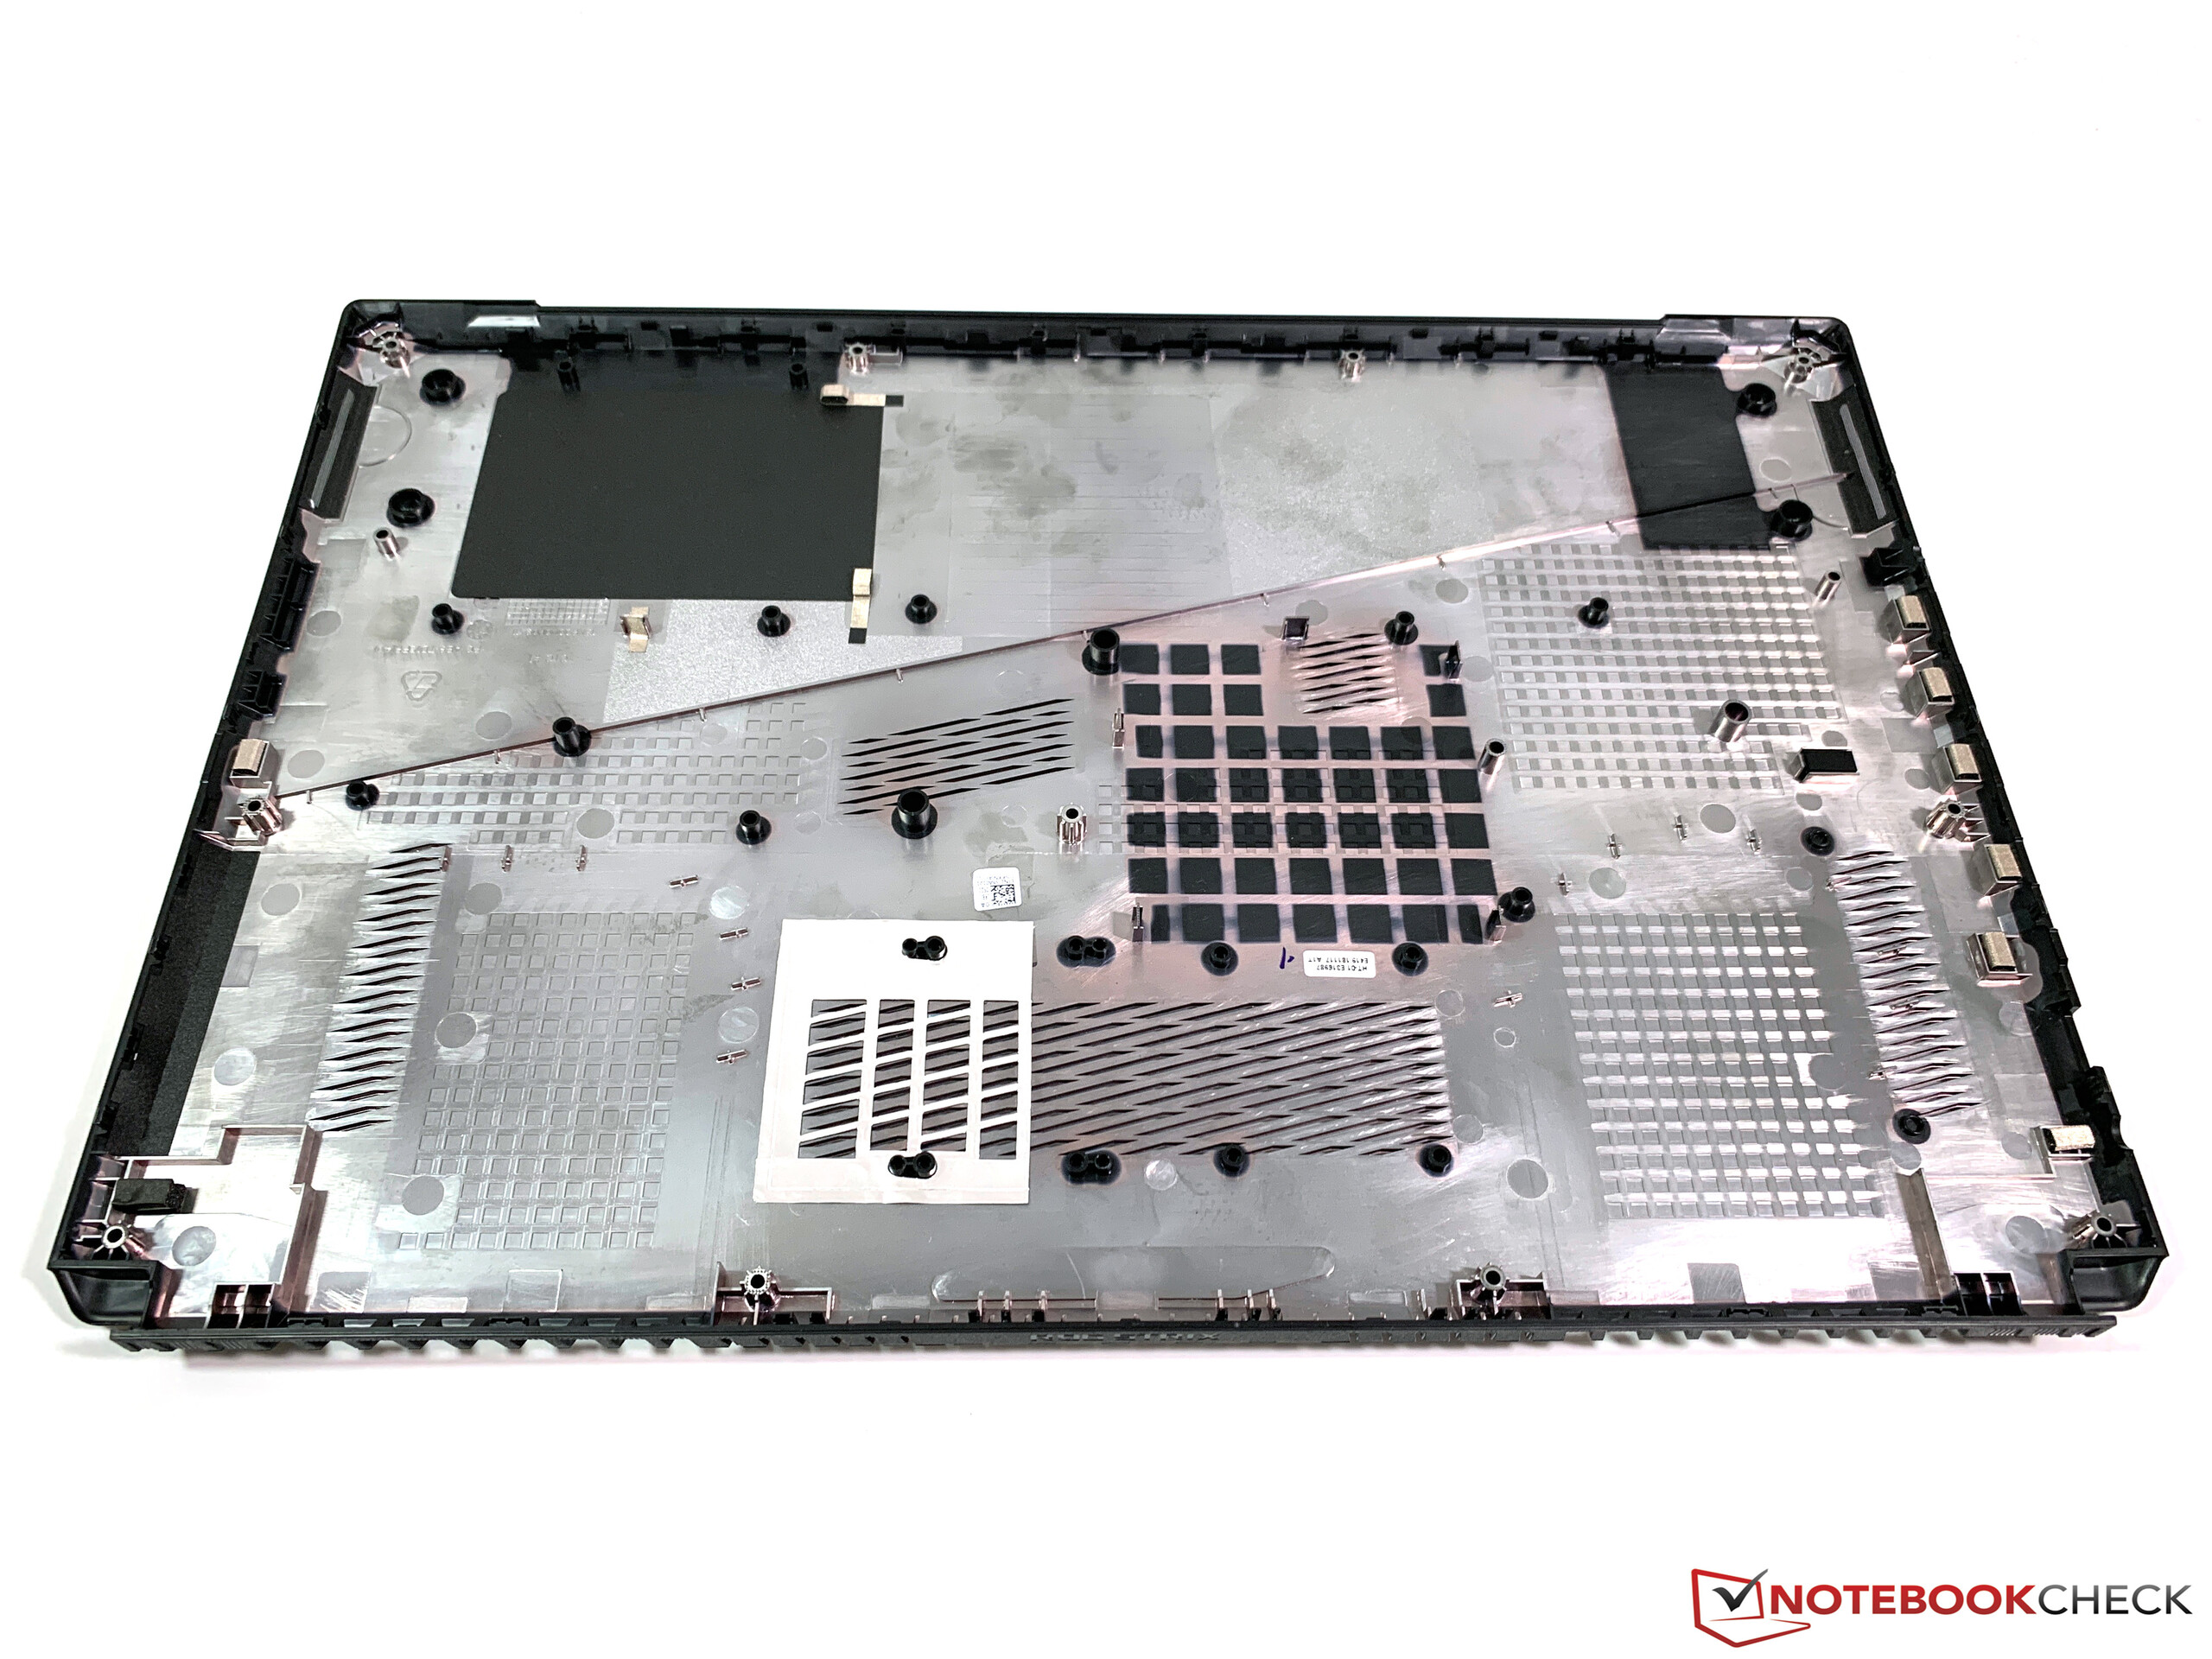
(-) Den maximala temperaturen på ovansidan är 59 °C / 138 F, jämfört med genomsnittet av 40.4 °C / 105 F , allt från 21.2 till 68.8 °C för klassen Gaming.
(-) Botten värms upp till maximalt 54 °C / 129 F, jämfört med genomsnittet av 43.2 °C / 110 F
(+) Vid tomgångsbruk är medeltemperaturen för ovansidan 30.7 °C / 87 F, jämfört med enhetsgenomsnittet på 33.9 °C / ### class_avg_f### F.
(-) När du spelar The Witcher 3 är medeltemperaturen för ovansidan 40.4 °C / 105 F, jämfört med enhetsgenomsnittet på 33.9 °C / ## #class_avg_f### F.
(+) Handledsstöden och pekplattan är kallare än hudtemperaturen med maximalt 29 °C / 84.2 F och är därför svala att ta på.
(±) Medeltemperaturen för handledsstödsområdet på liknande enheter var 28.8 °C / 83.8 F (-0.2 °C / -0.4 F).
Asus ROG Strix Scar II GL704GW ljudanalys
(±) | högtalarljudstyrkan är genomsnittlig men bra (77 dB)
Bas 100 - 315 Hz
(±) | reducerad bas - i genomsnitt 6.1% lägre än medianen
(±) | linjäriteten för basen är genomsnittlig (10.4% delta till föregående frekvens)
Mellan 400 - 2000 Hz
(+) | balanserad mellan - endast 2.2% från medianen
(+) | mids är linjära (2.4% delta till föregående frekvens)
Högsta 2 - 16 kHz
(+) | balanserade toppar - endast 3.1% från medianen
(+) | toppar är linjära (4% delta till föregående frekvens)
Totalt 100 - 16 000 Hz
(+) | det totala ljudet är linjärt (12.3% skillnad mot median)
Jämfört med samma klass
» 13% av alla testade enheter i den här klassen var bättre, 5% liknande, 82% sämre
» Den bästa hade ett delta på 6%, genomsnittet var 18%, sämst var 132%
Jämfört med alla testade enheter
» 10% av alla testade enheter var bättre, 3% liknande, 87% sämre
» Den bästa hade ett delta på 4%, genomsnittet var 23%, sämst var 134%
Asus GL704GM-DH74 ljudanalys
(-) | inte särskilt höga högtalare (67.9 dB)
Bas 100 - 315 Hz
(±) | reducerad bas - i genomsnitt 7.7% lägre än medianen
(±) | linjäriteten för basen är genomsnittlig (14.4% delta till föregående frekvens)
Mellan 400 - 2000 Hz
(+) | balanserad mellan - endast 3% från medianen
(+) | mids är linjära (5.7% delta till föregående frekvens)
Högsta 2 - 16 kHz
(+) | balanserade toppar - endast 2.9% från medianen
(±) | linjäriteten för toppar är genomsnittlig (9% delta till föregående frekvens)
Totalt 100 - 16 000 Hz
(±) | linjäriteten för det totala ljudet är genomsnittlig (17% skillnad mot median)
Jämfört med samma klass
» 45% av alla testade enheter i den här klassen var bättre, 12% liknande, 43% sämre
» Den bästa hade ett delta på 6%, genomsnittet var 18%, sämst var 132%
Jämfört med alla testade enheter
» 31% av alla testade enheter var bättre, 8% liknande, 61% sämre
» Den bästa hade ett delta på 4%, genomsnittet var 23%, sämst var 134%
| Av/Standby | |
| Låg belastning | |
| Hög belastning |
|
Förklaring:
min: | |
| Asus ROG Strix Scar II GL704GW GeForce RTX 2070 Mobile, i7-8750H | Asus GL704GM-DH74 GeForce GTX 1060 Mobile, i7-8750H | MSI GL73 8SE-010US GeForce RTX 2060 Mobile, i7-8750H | MSI GS73VR 7RG GeForce GTX 1070 Max-Q, i7-7700HQ | Gigabyte Sabre 17-W8 GeForce GTX 1060 Mobile, i7-8750H | HP Omen 17t-3AW55AV_1 GeForce GTX 1070 Mobile, i7-8750H | Genomsnitt av klass Gaming | |
|---|---|---|---|---|---|---|---|
| Power Consumption | 14% | 29% | 28% | 33% | 3% | 8% | |
| Idle Minimum * (Watt) | 19 | 15.2 20% | 8.8 54% | 10.1 47% | 9.3 51% | 17.8 6% | 13 ? 32% |
| Idle Average * (Watt) | 22 | 20.4 7% | 16.2 26% | 18.3 17% | 14.8 33% | 24.7 -12% | 19 ? 14% |
| Idle Maximum * (Watt) | 29 | 27.3 6% | 18.3 37% | 19.6 32% | 22 24% | 29.6 -2% | 24.6 ? 15% |
| Load Average * (Watt) | 102 | 92.9 9% | 86.1 16% | 87.6 14% | 63 38% | 110 -8% | 110.7 ? -9% |
| Witcher 3 ultra * (Watt) | 190 | 143 25% | 146.7 23% | 136.3 28% | 167.8 12% | ||
| Load Maximum * (Watt) | 231 | 190.6 17% | 186.4 19% | 160.7 30% | 187 19% | 178.6 23% | 259 ? -12% |
* ... mindre är bättre
| Asus ROG Strix Scar II GL704GW GeForce RTX 2070 Mobile, i7-8750H, 66 Wh | Asus GL704GM-DH74 GeForce GTX 1060 Mobile, i7-8750H, 66 Wh | MSI GS73VR 7RG GeForce GTX 1070 Max-Q, i7-7700HQ, 51 Wh | Gigabyte Sabre 17-W8 GeForce GTX 1060 Mobile, i7-8750H, 62 Wh | HP Omen 17t-3AW55AV_1 GeForce GTX 1070 Mobile, i7-8750H, 86 Wh | MSI GL73 8SE-010US GeForce RTX 2060 Mobile, i7-8750H, 41 Wh | Genomsnitt av klass Gaming | |
|---|---|---|---|---|---|---|---|
| Batteridrifttid | 8% | -11% | 25% | 9% | -23% | 51% | |
| Reader / Idle (h) | 6.2 | 7.1 15% | 5.8 -6% | 6.9 11% | 4.5 -27% | 6.5 5% | 8.27 ? 33% |
| WiFi v1.3 (h) | 3.9 | 4.3 10% | 3.2 -18% | 5.4 38% | 4.2 8% | 2.8 -28% | 7.11 ? 82% |
| Witcher 3 ultra (h) | 0.9 | ||||||
| Load (h) | 1.1 | 1.1 0% | 1 -9% | 1.4 27% | 1.6 45% | 0.6 -45% | 1.502 ? 37% |
| H.264 (h) | 5.3 | 8.32 ? |
För
Emot
Läs den fullständiga versionen av den här recensionen på engelska här.
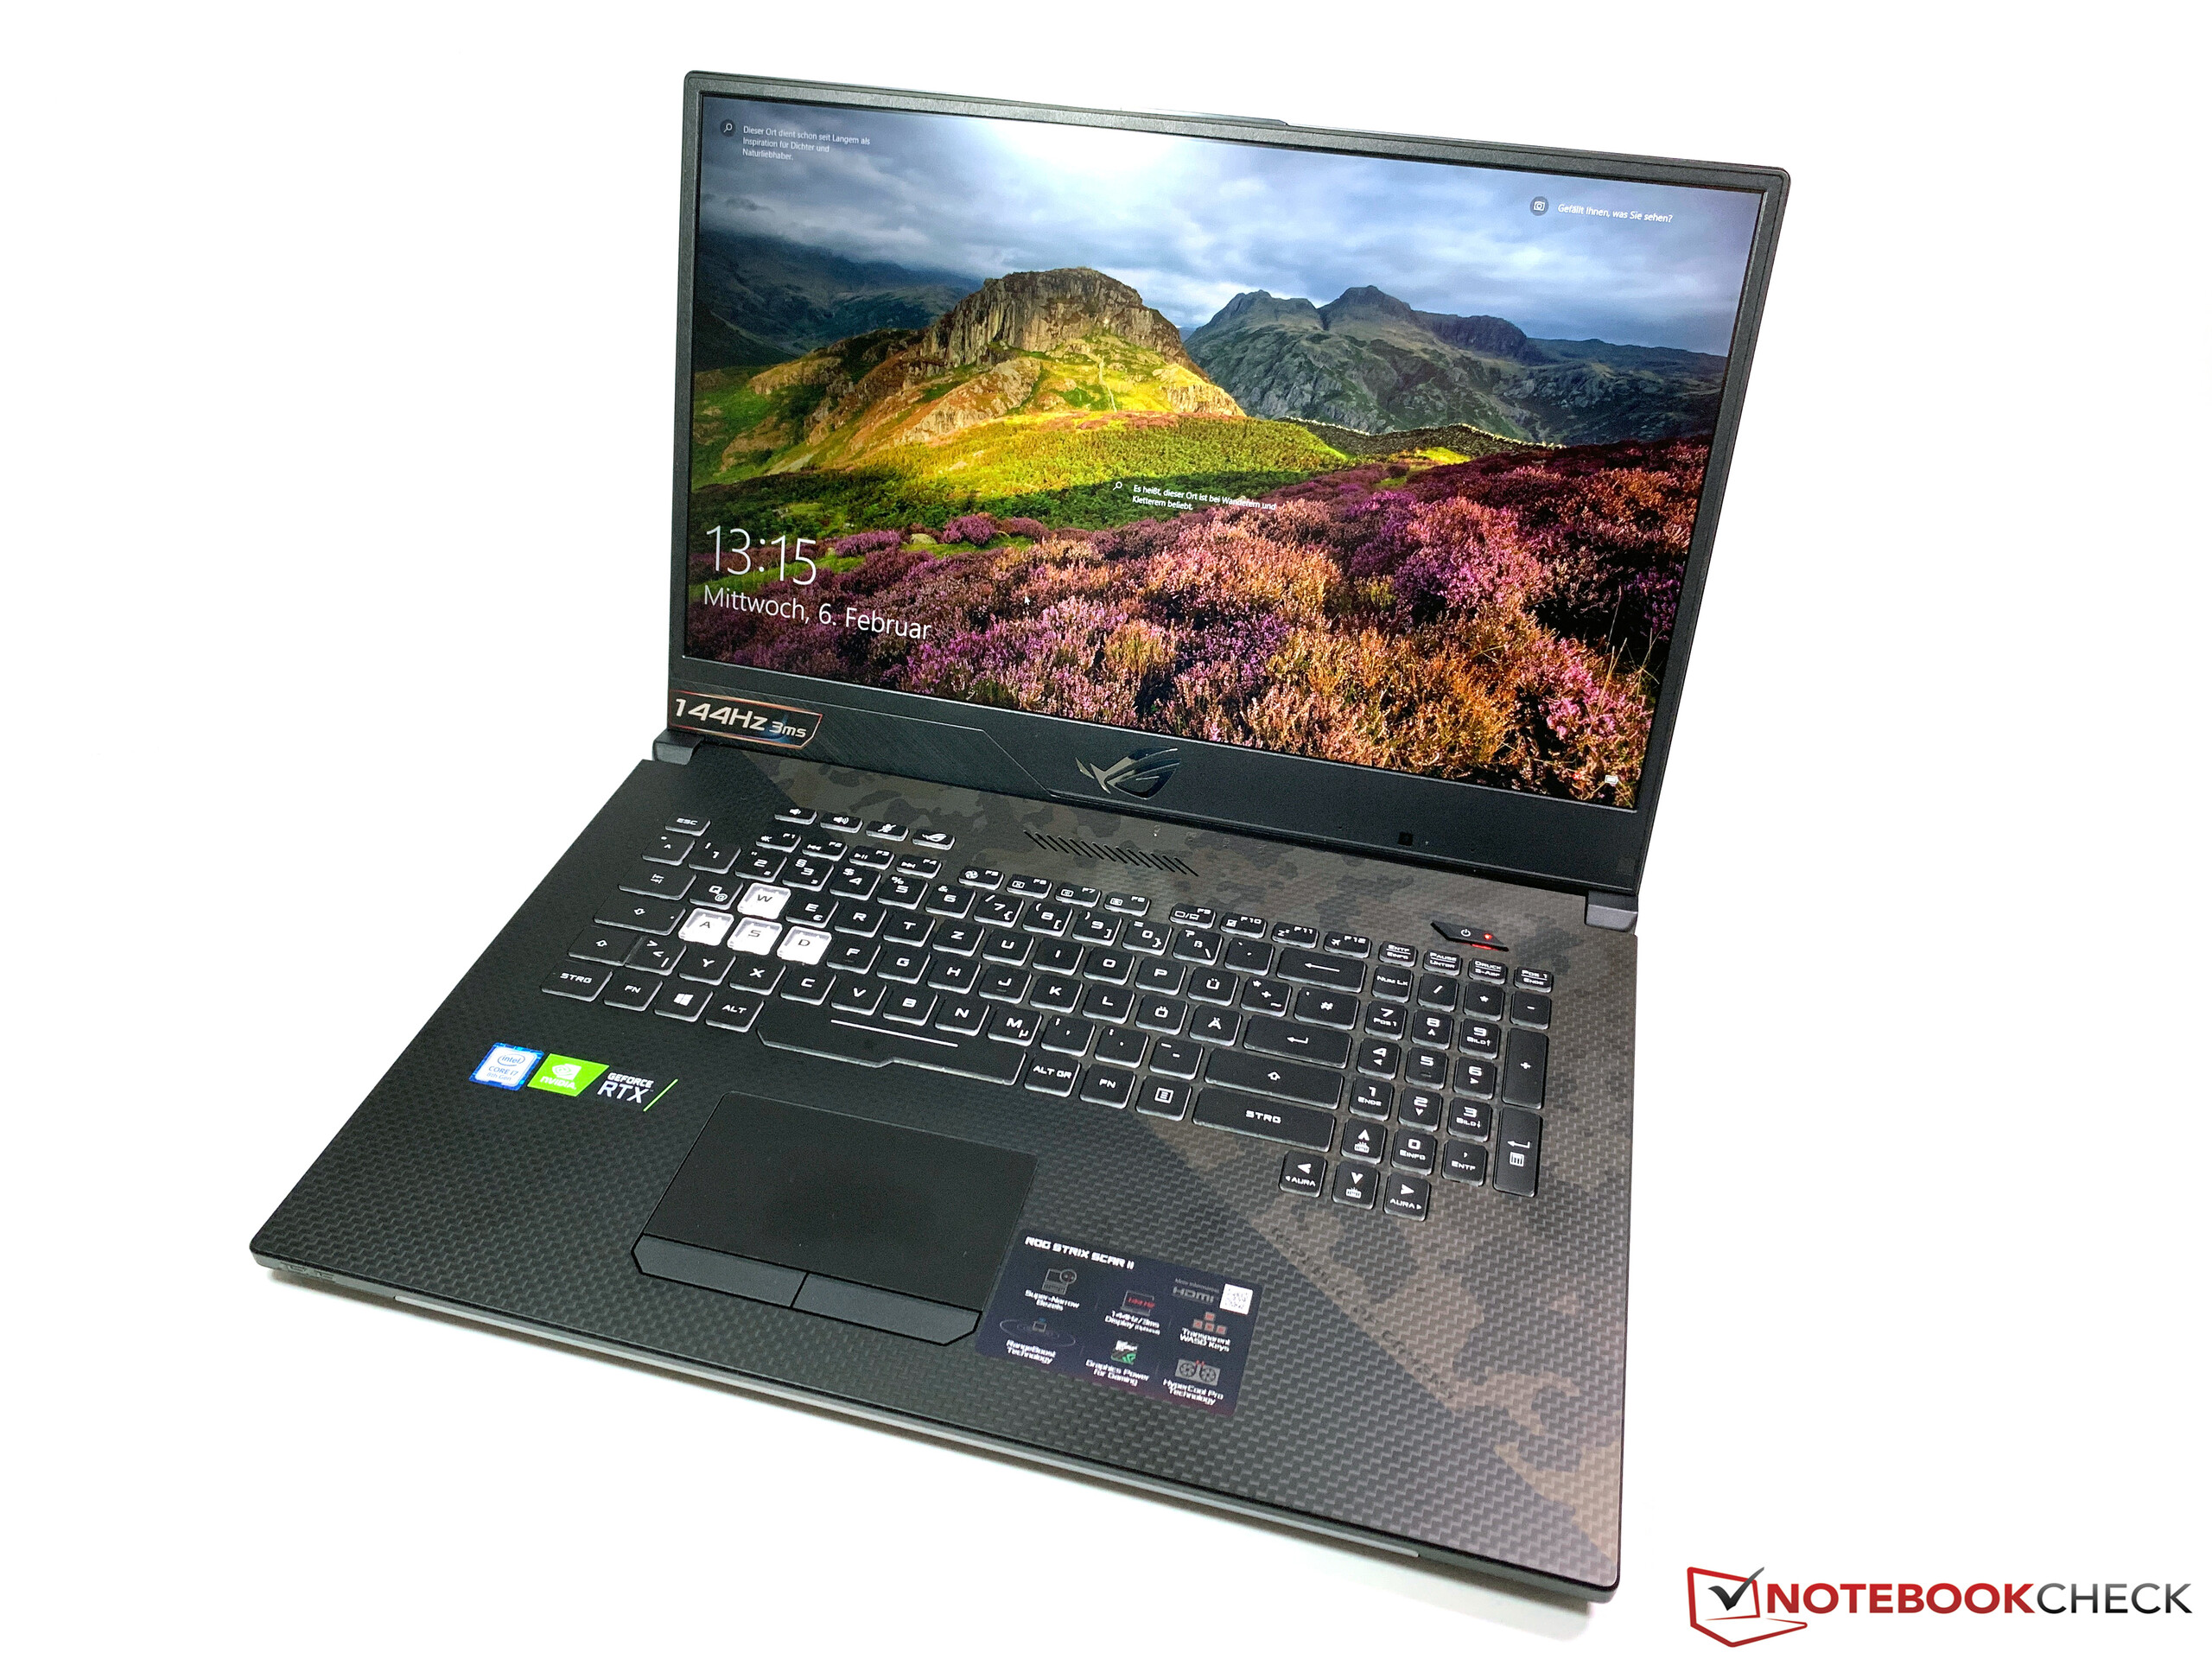
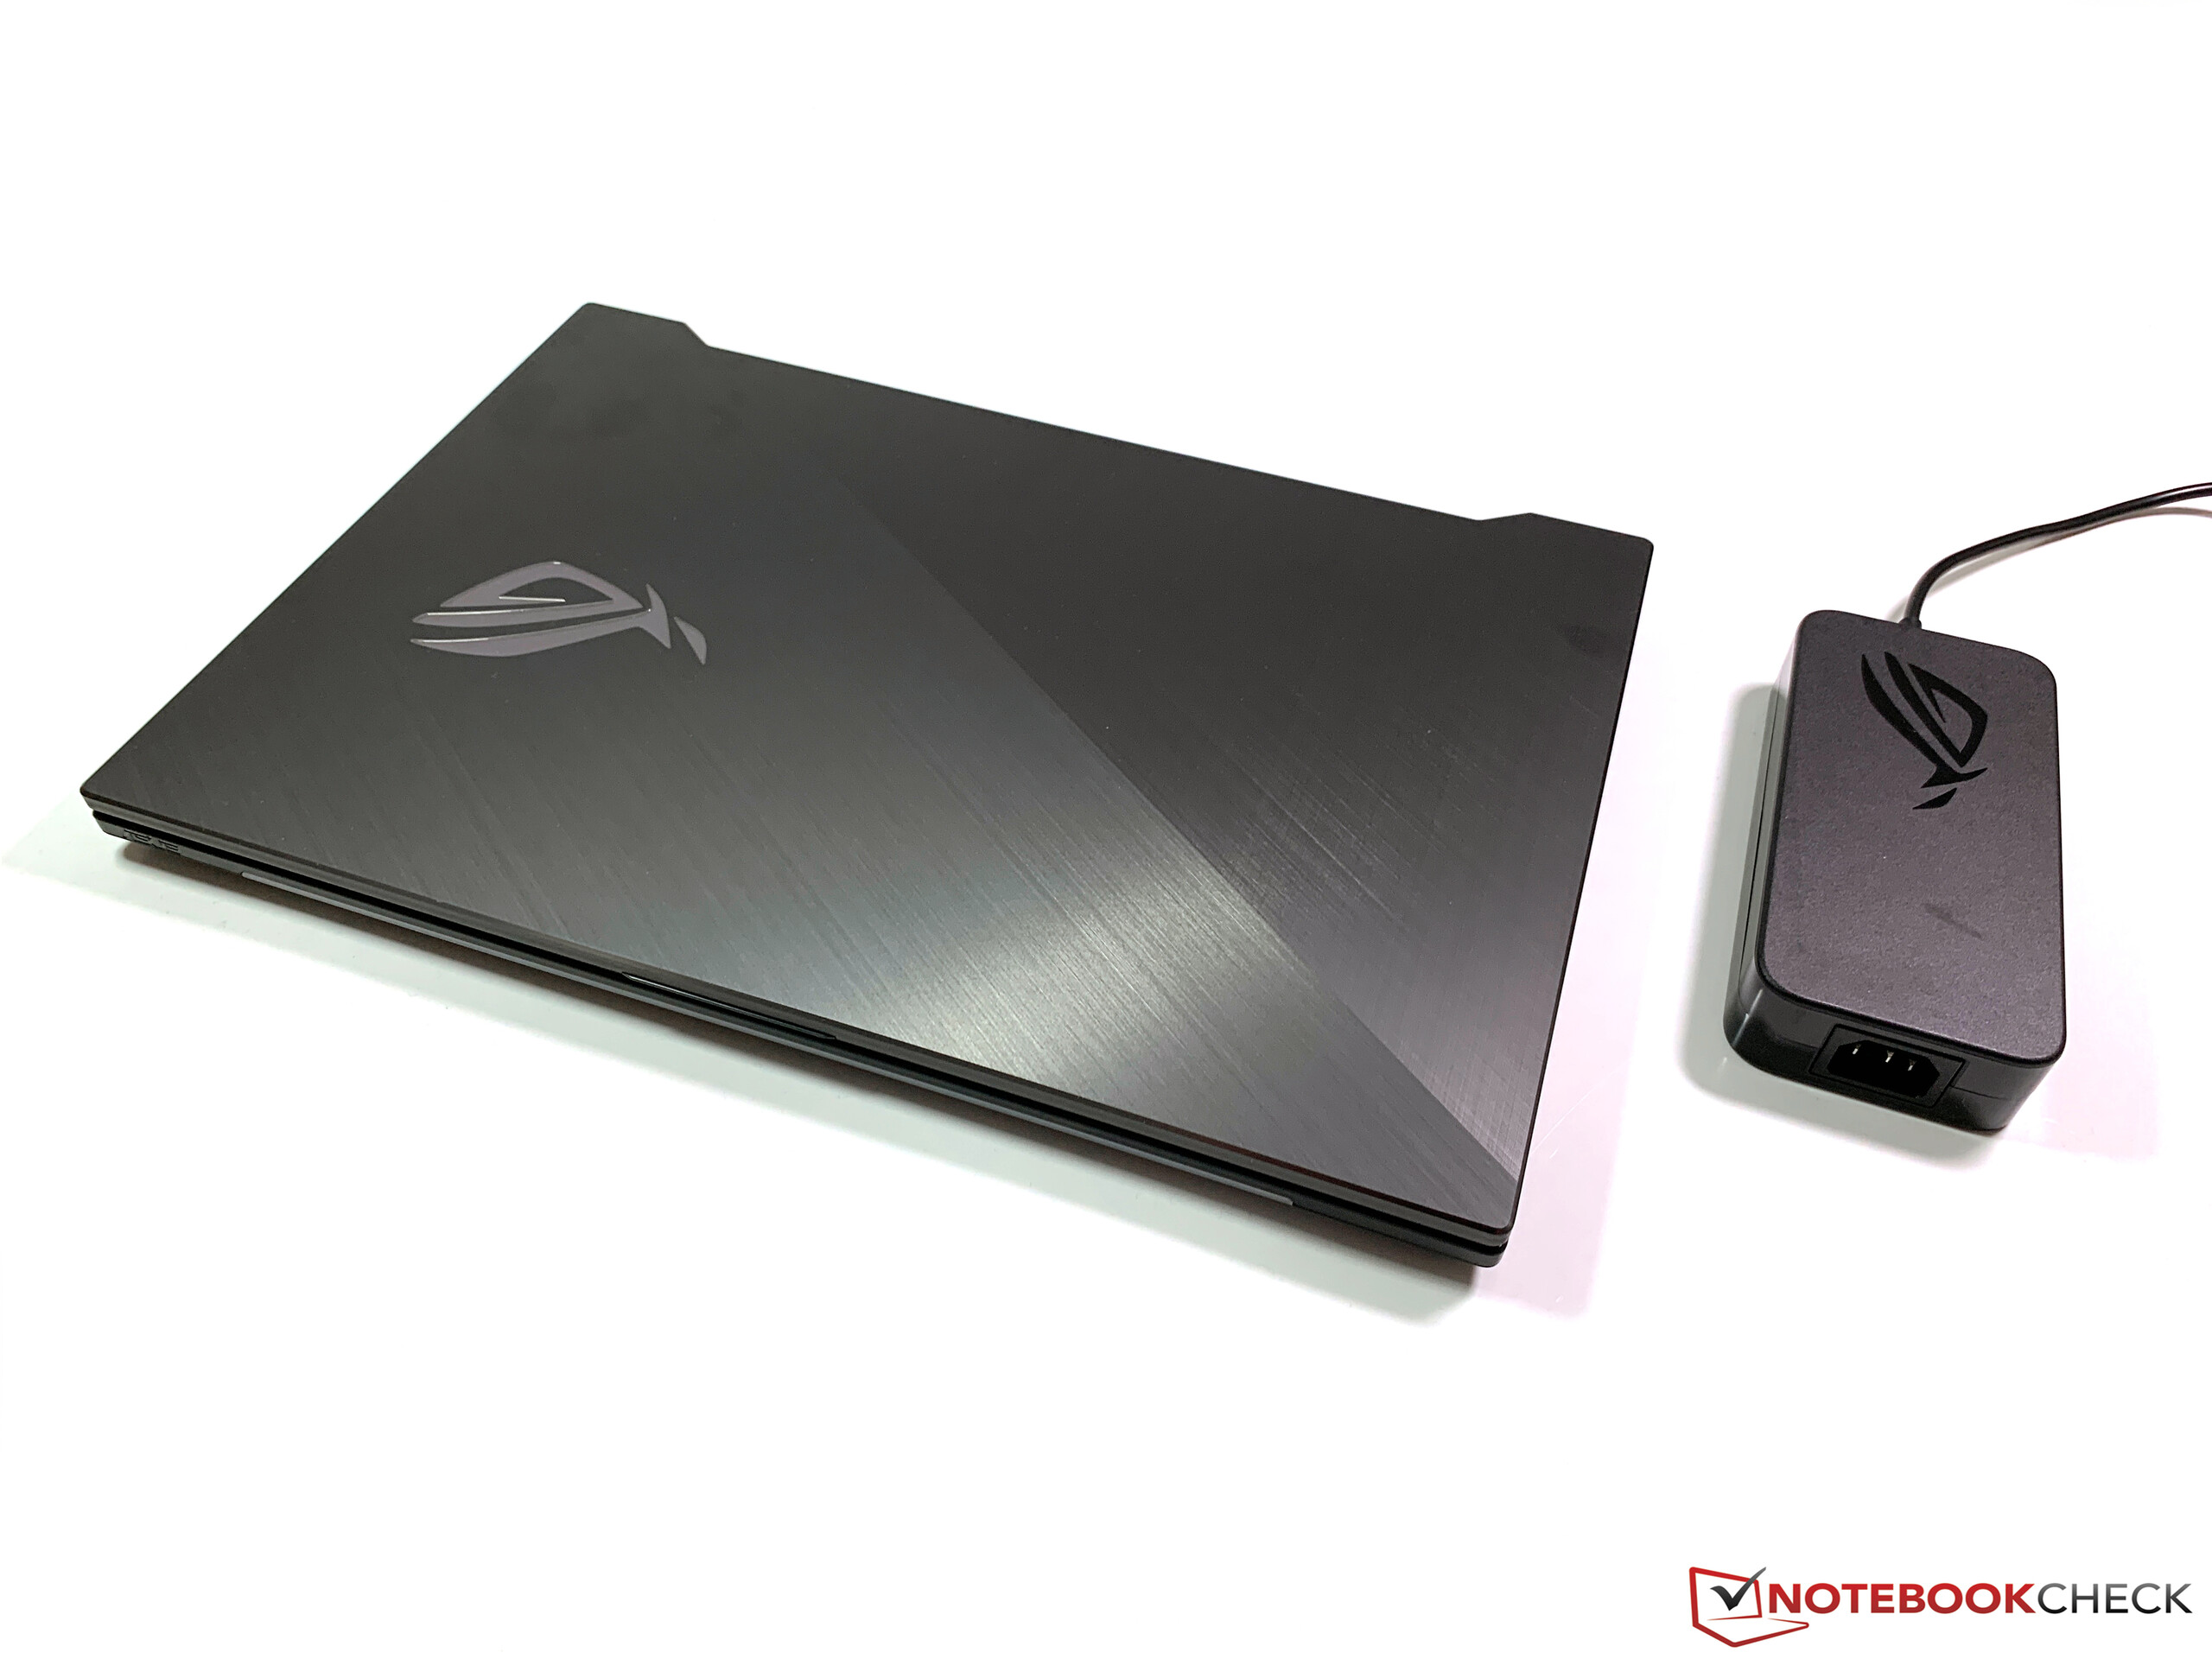
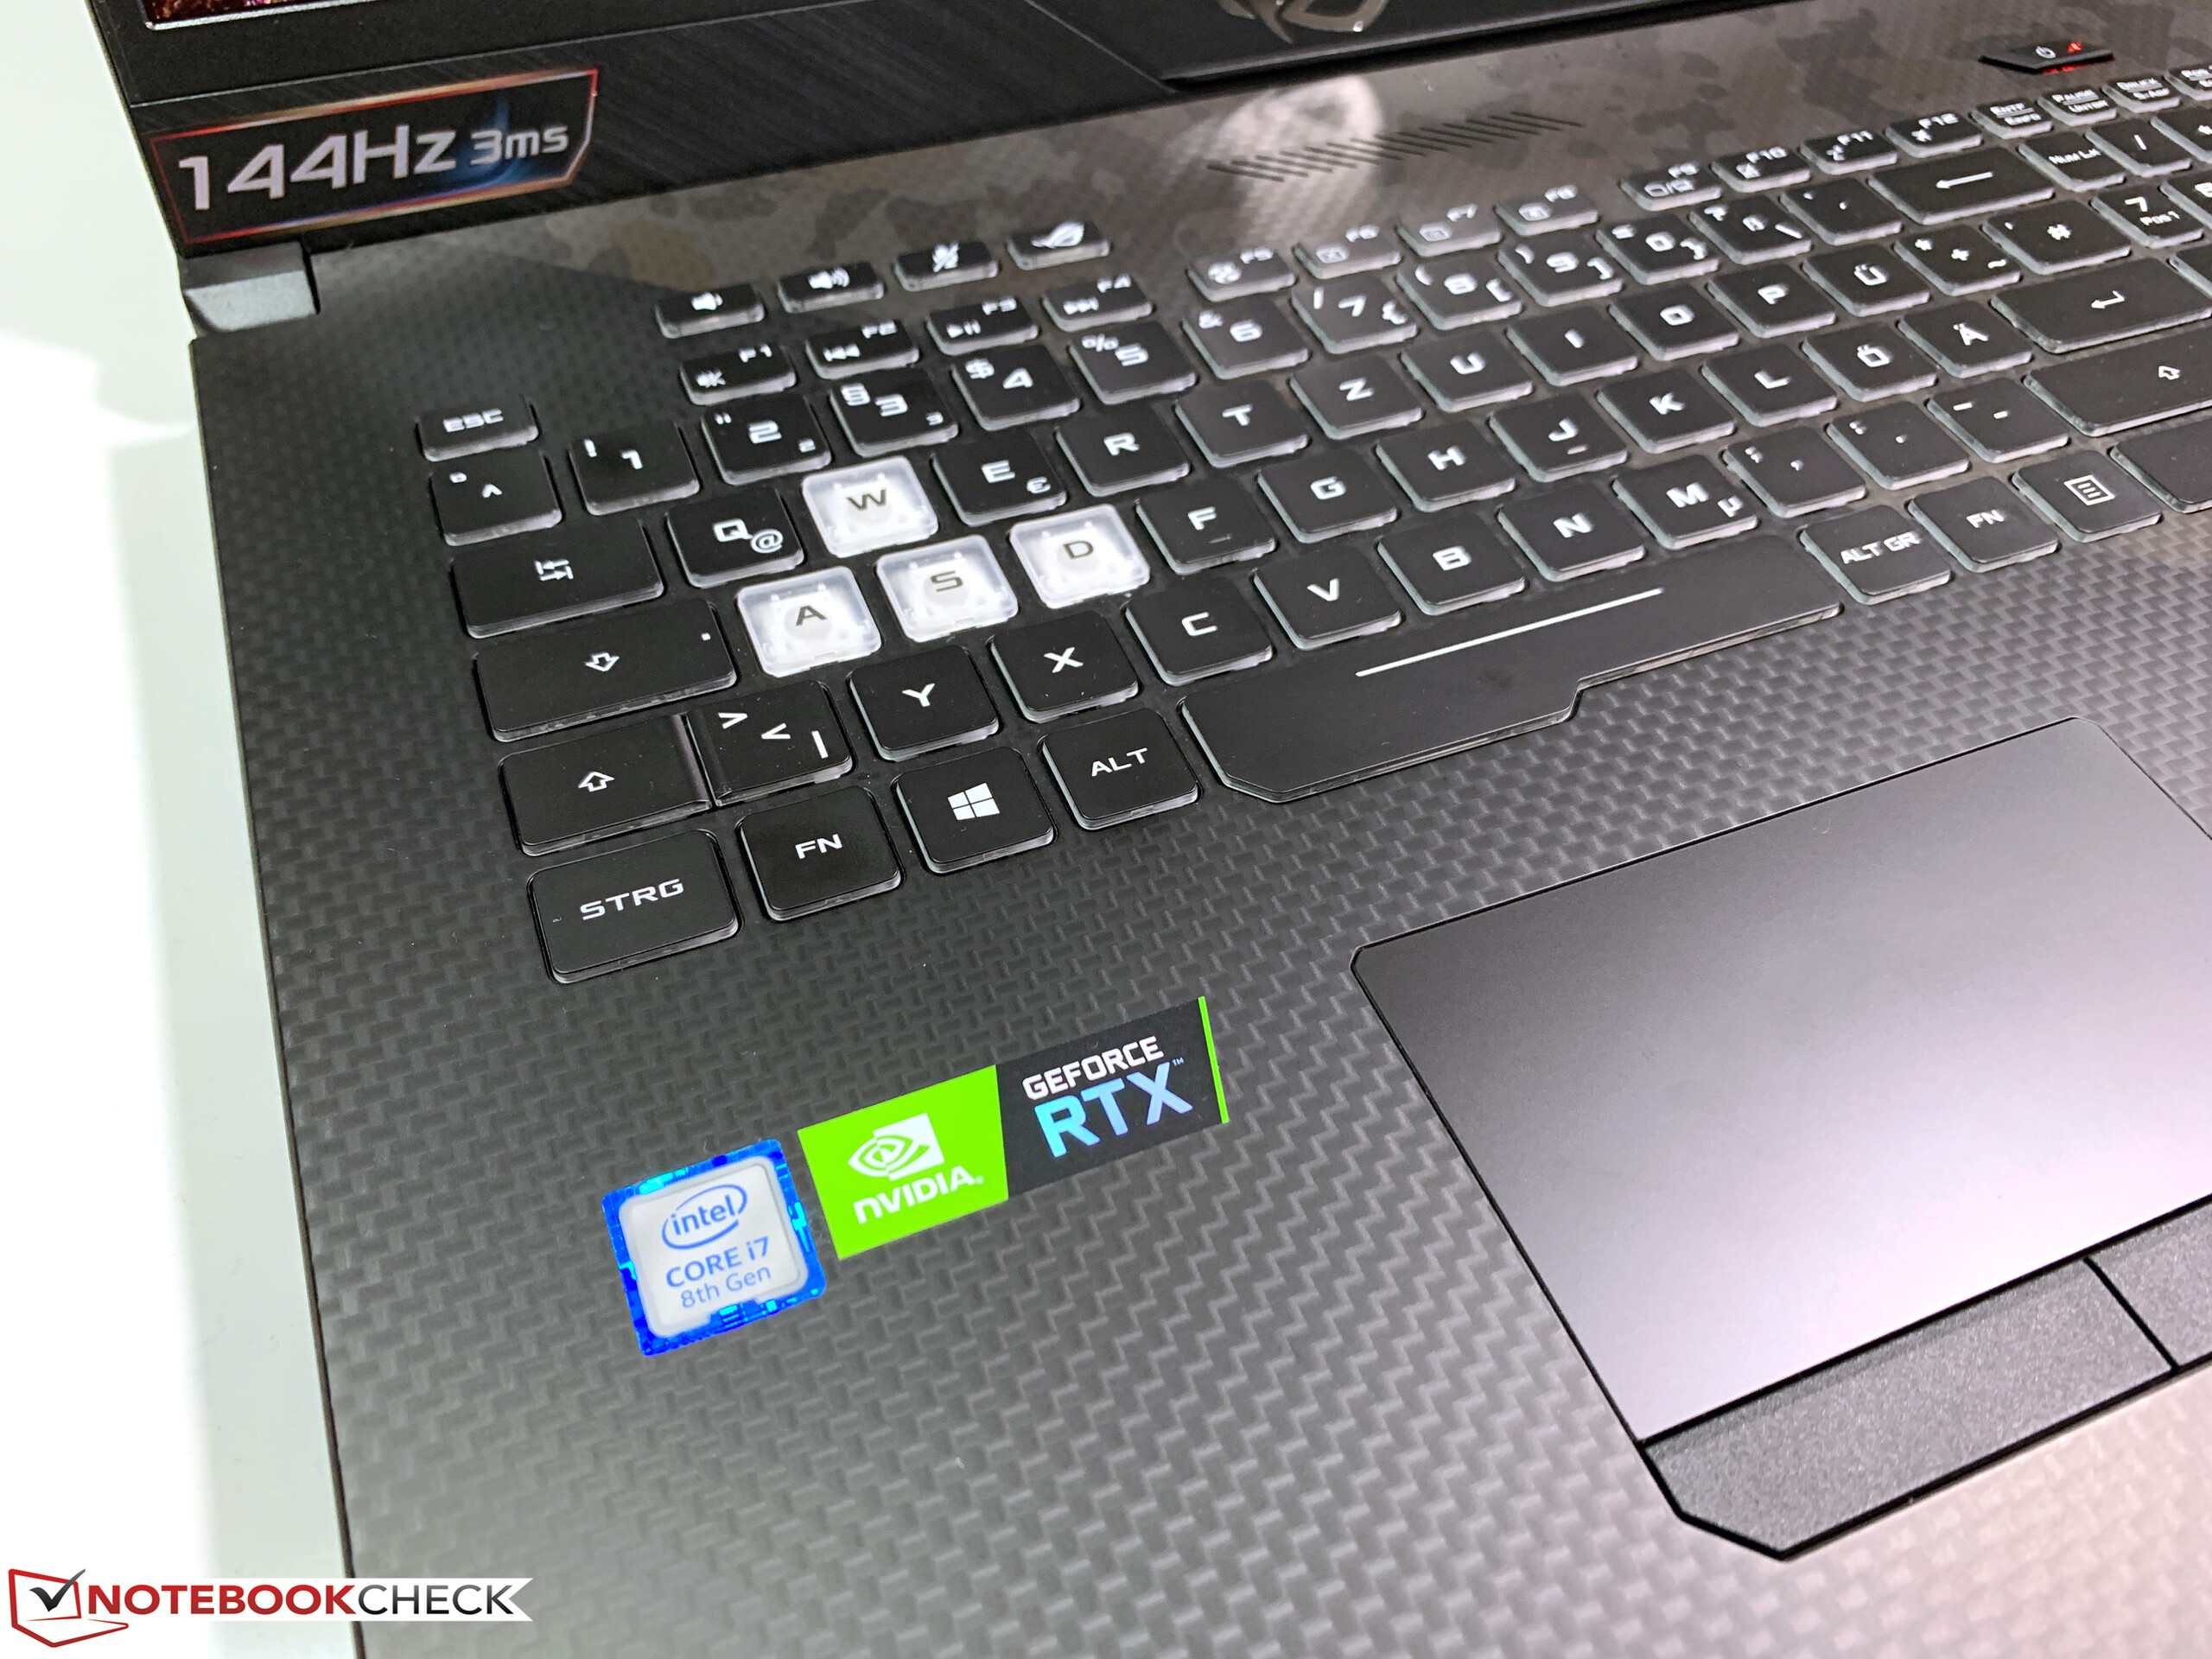
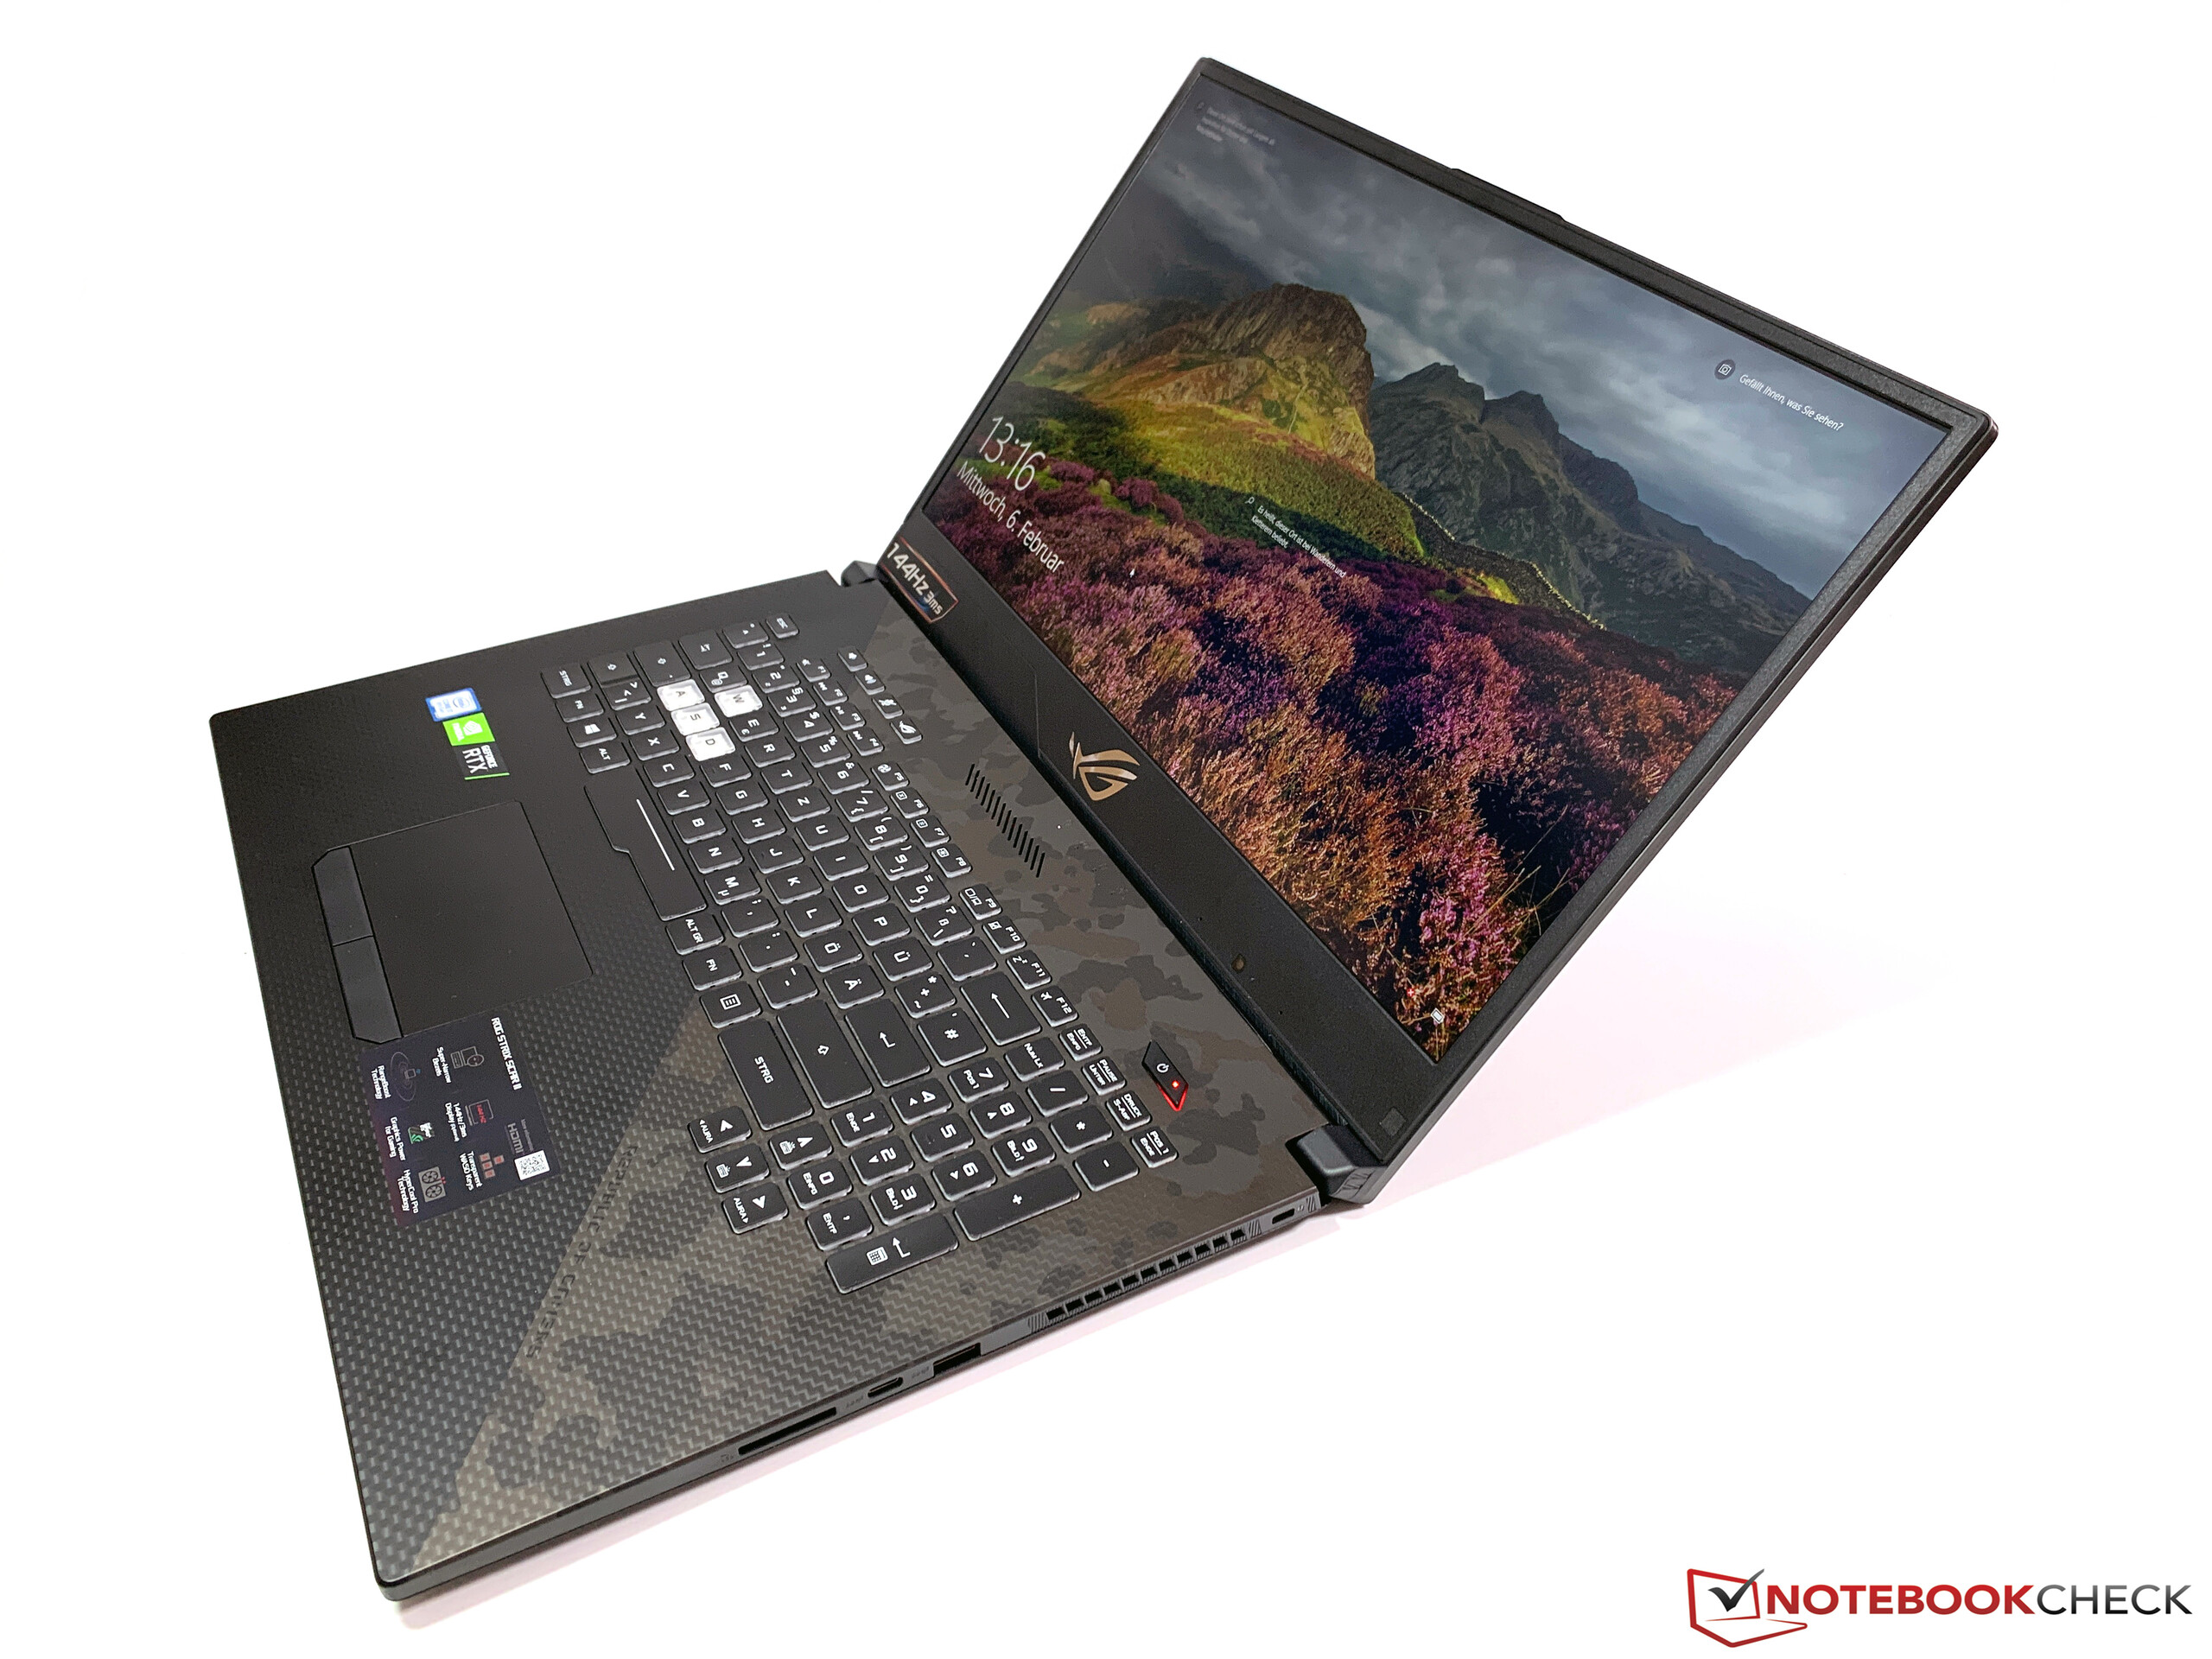
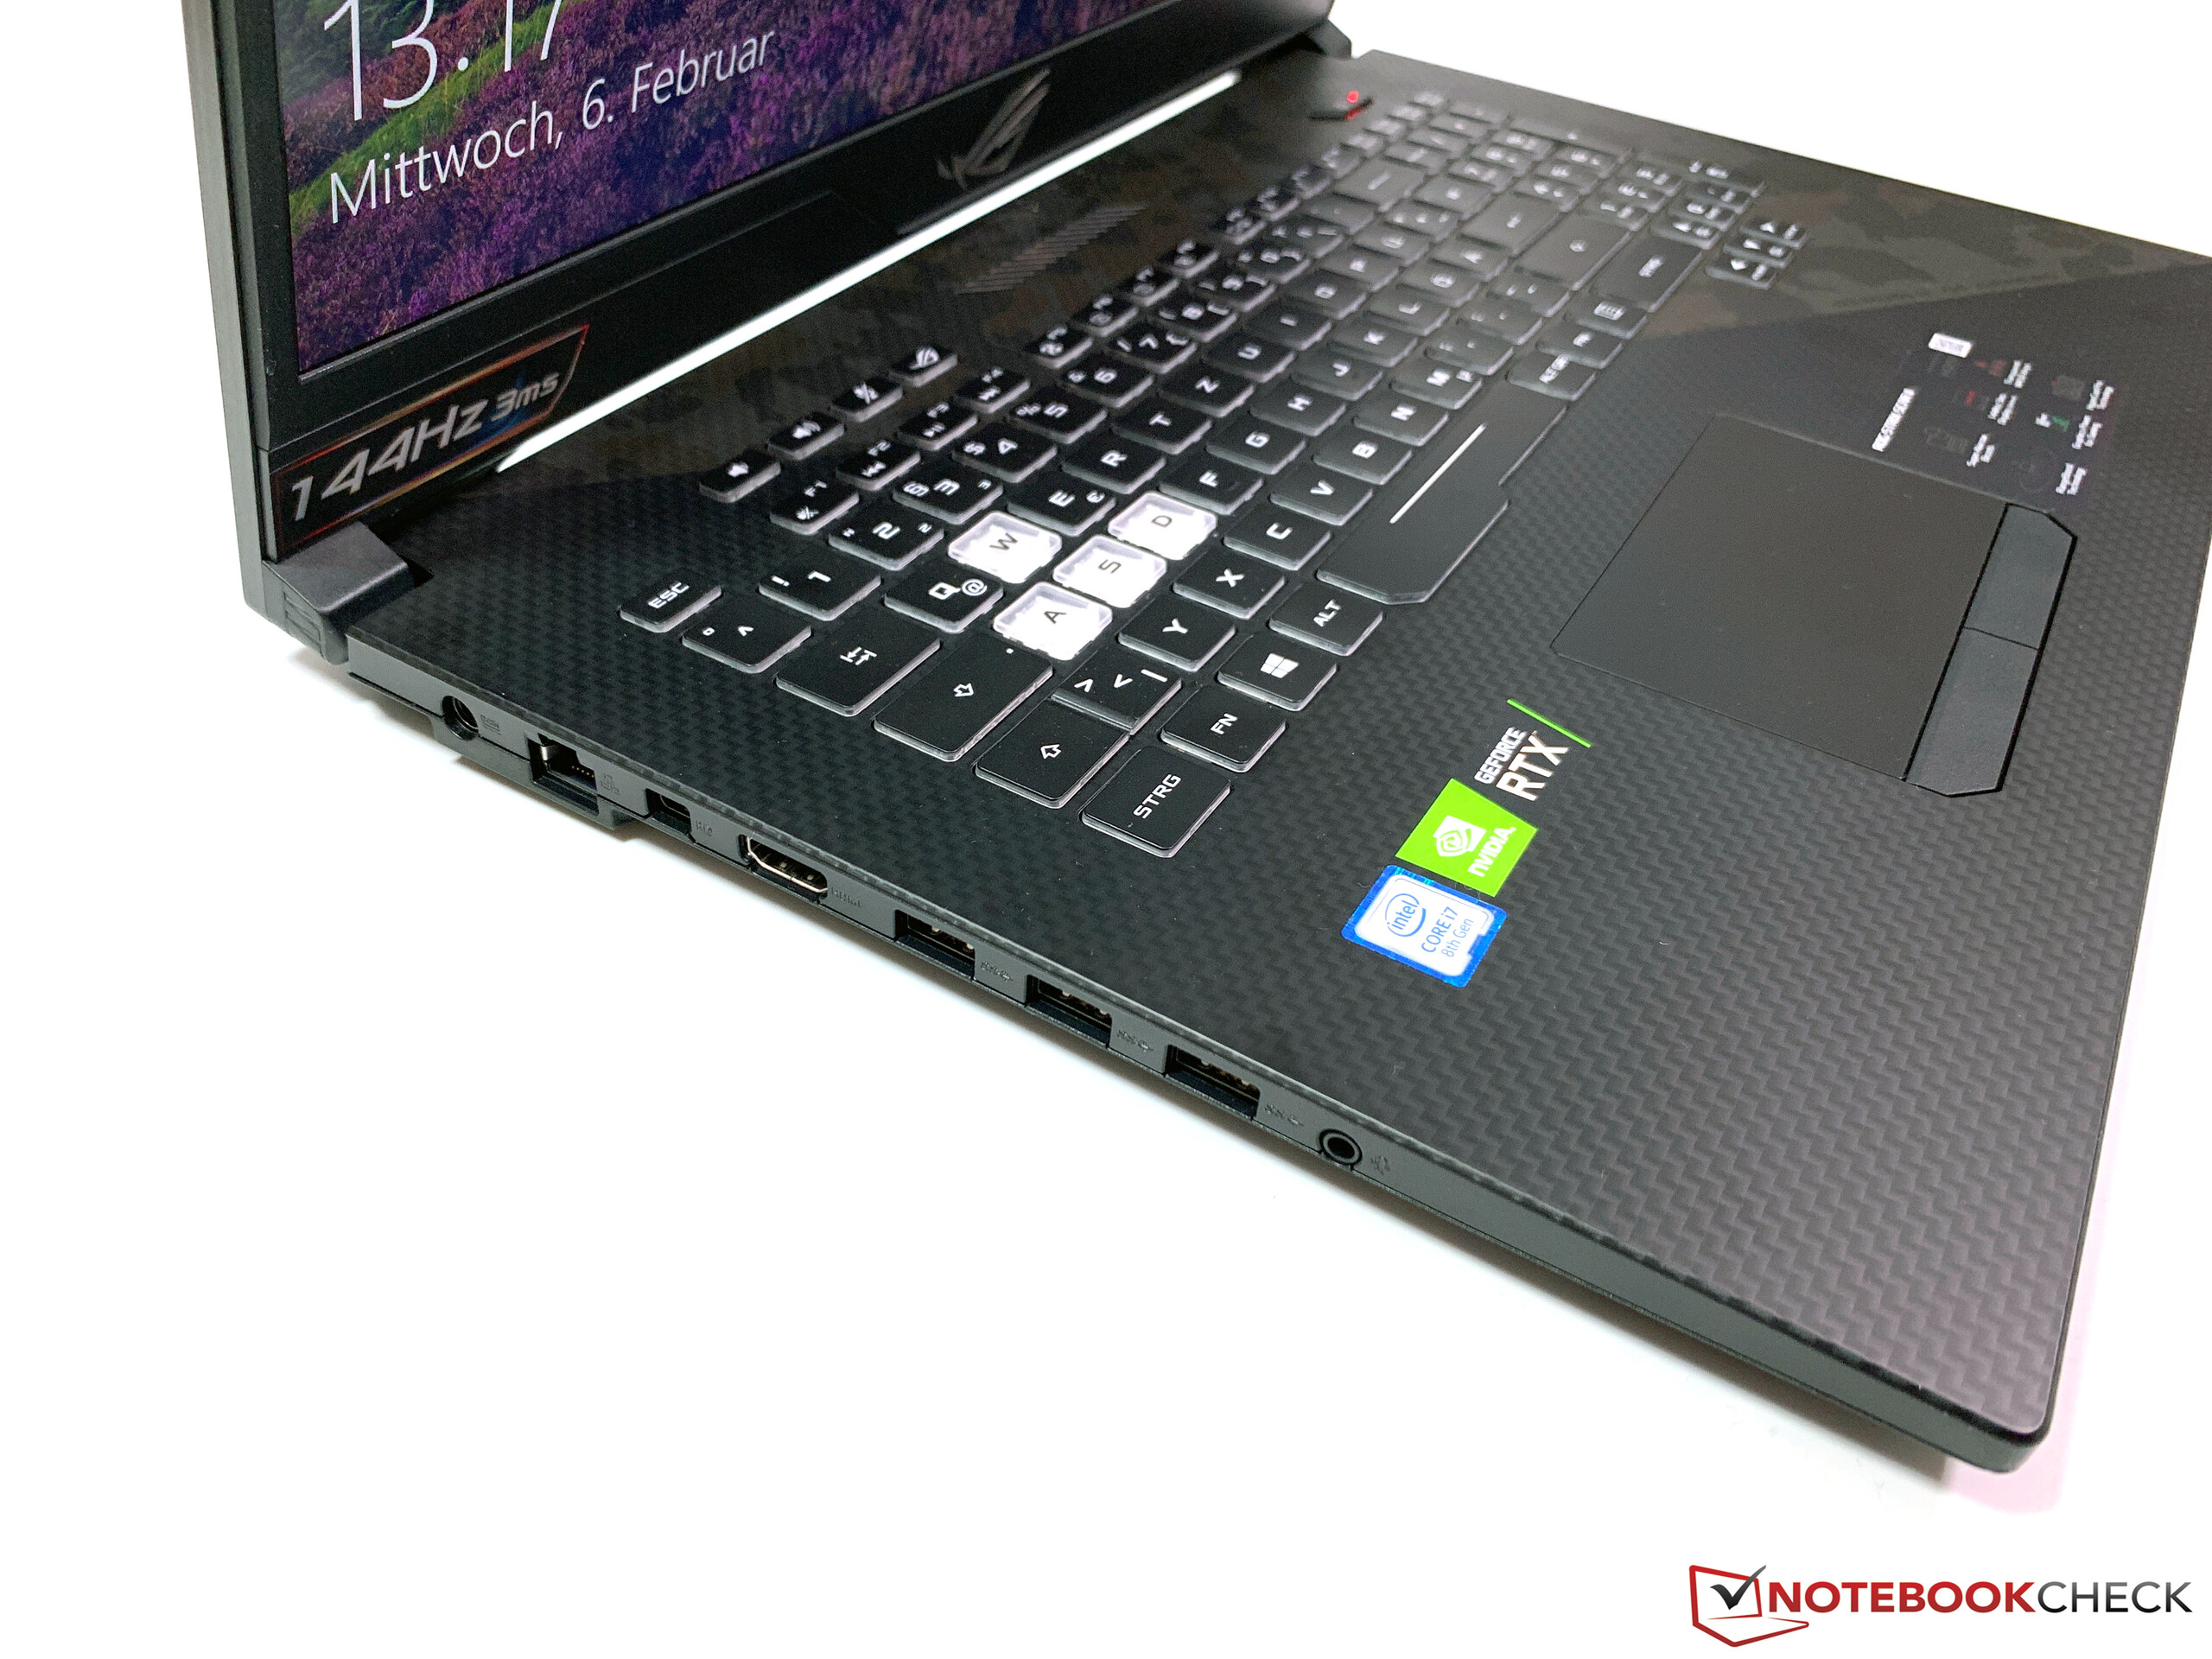
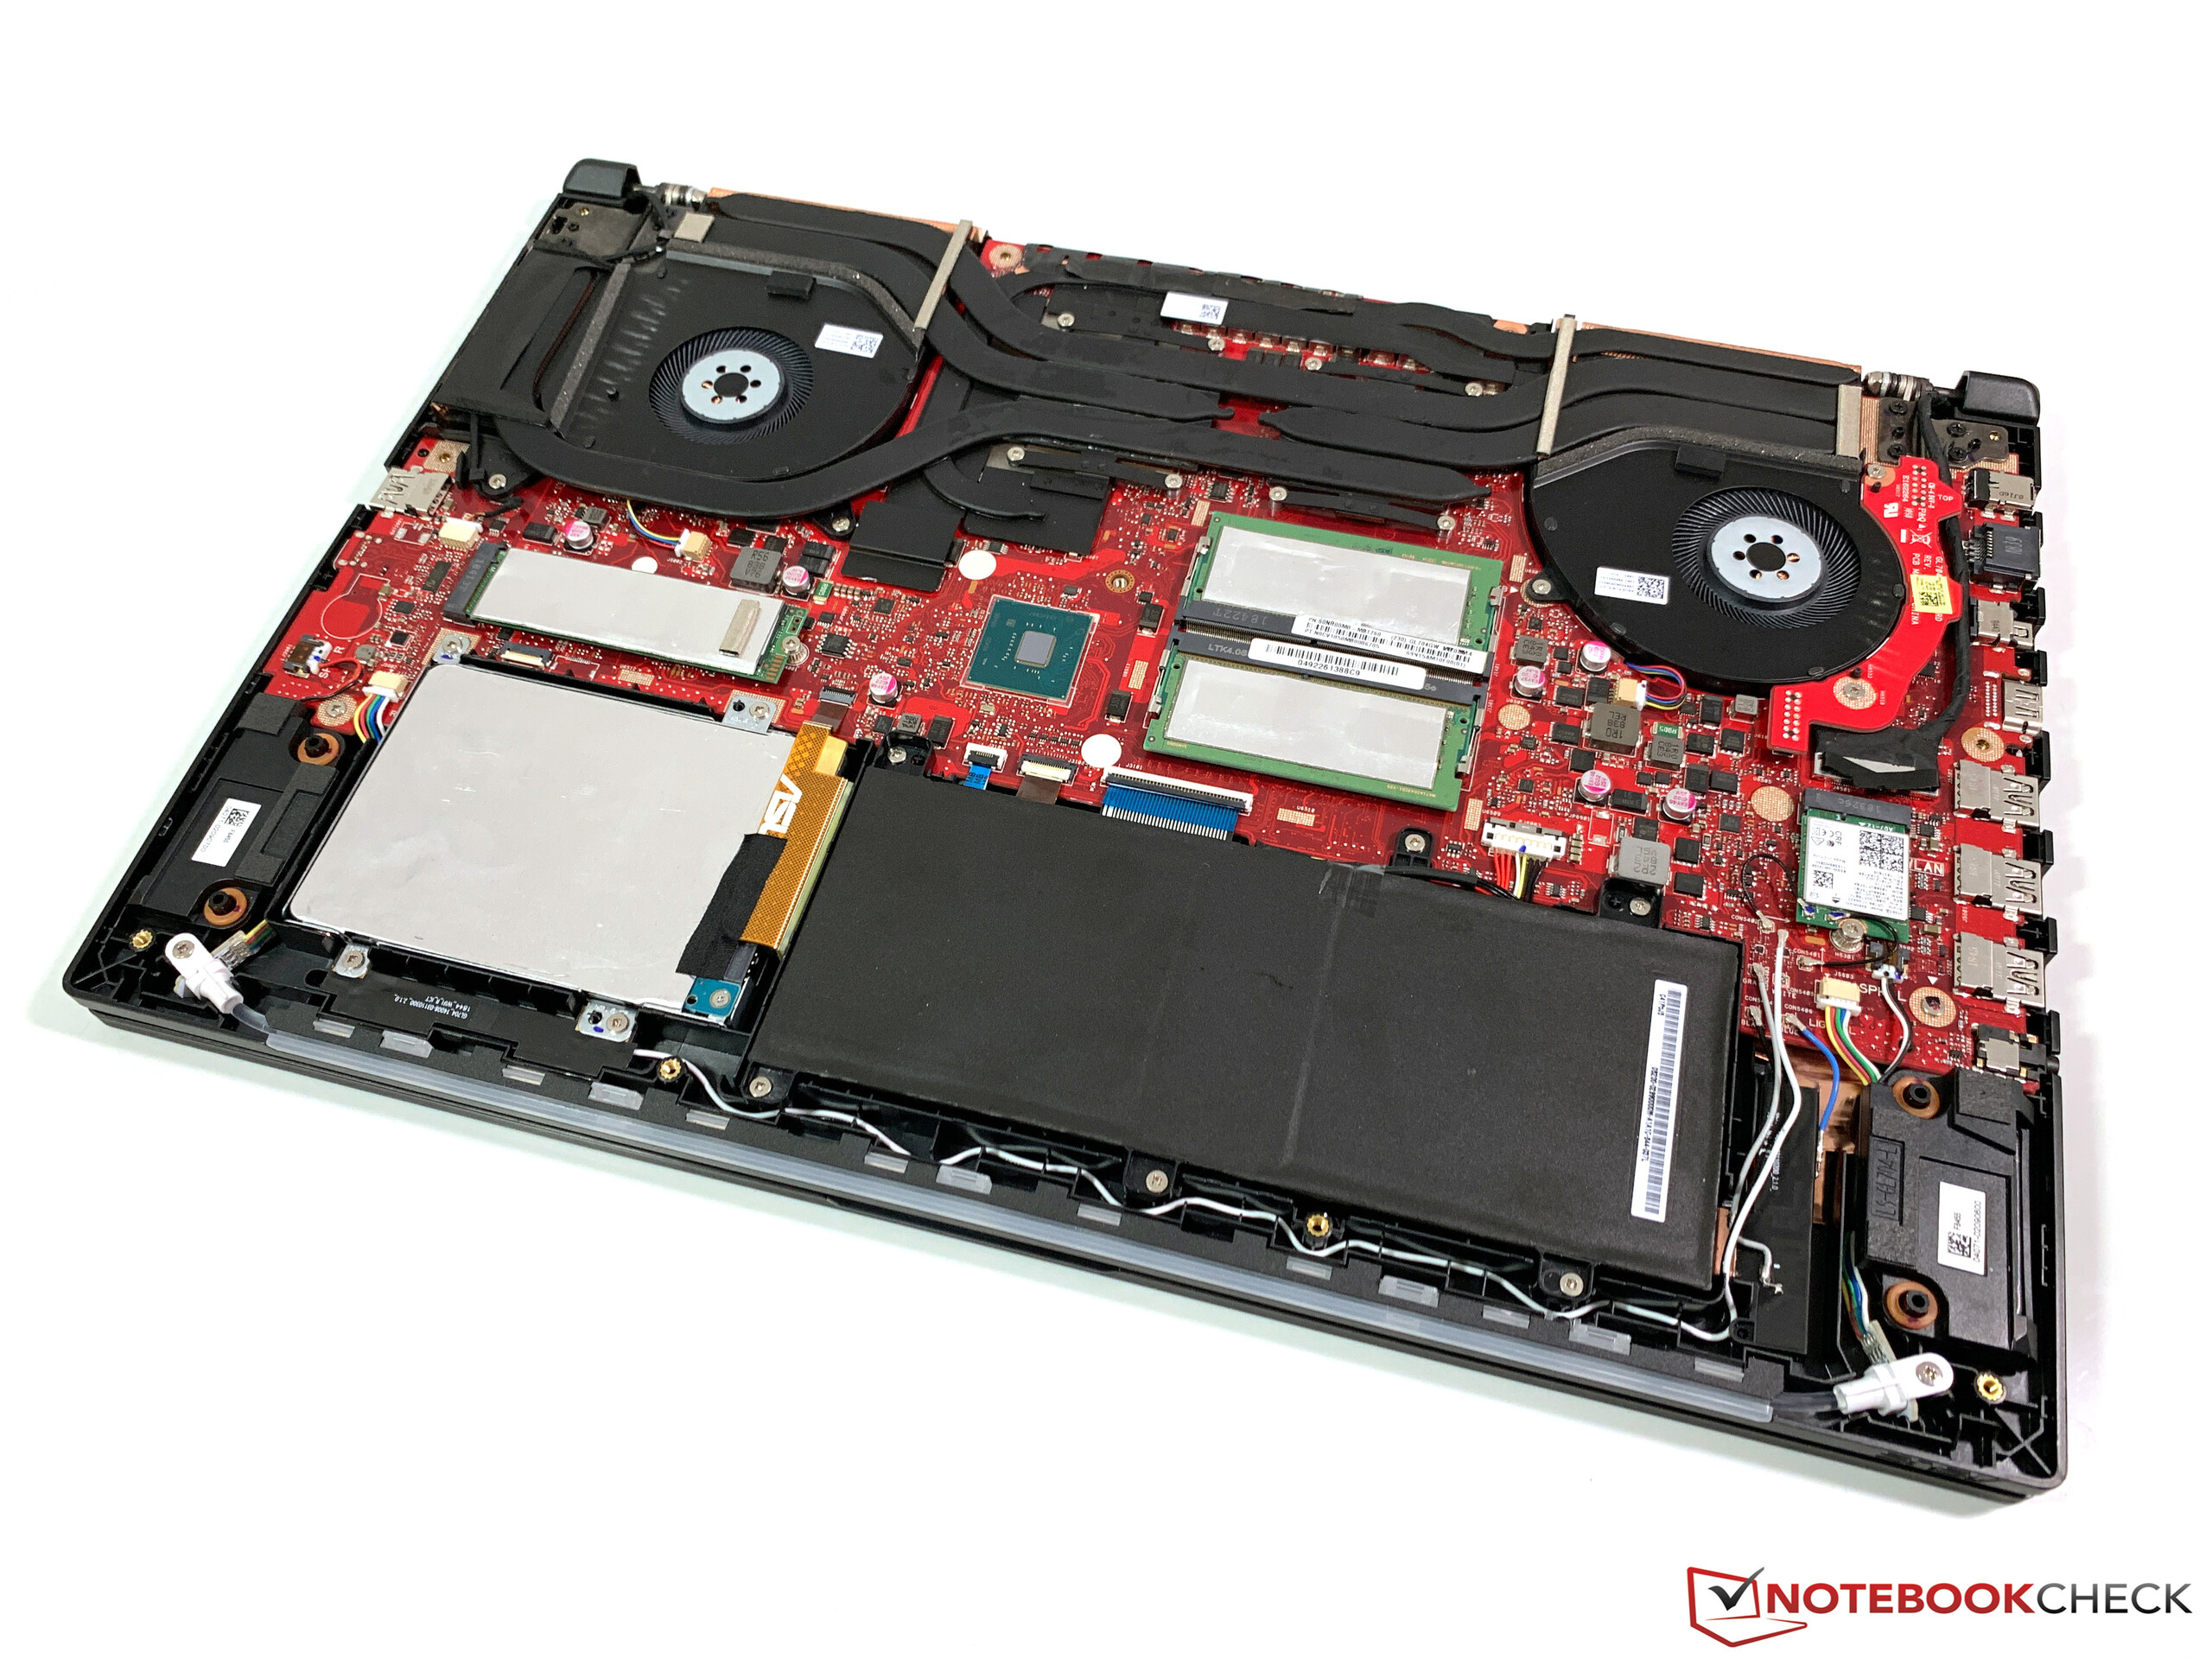
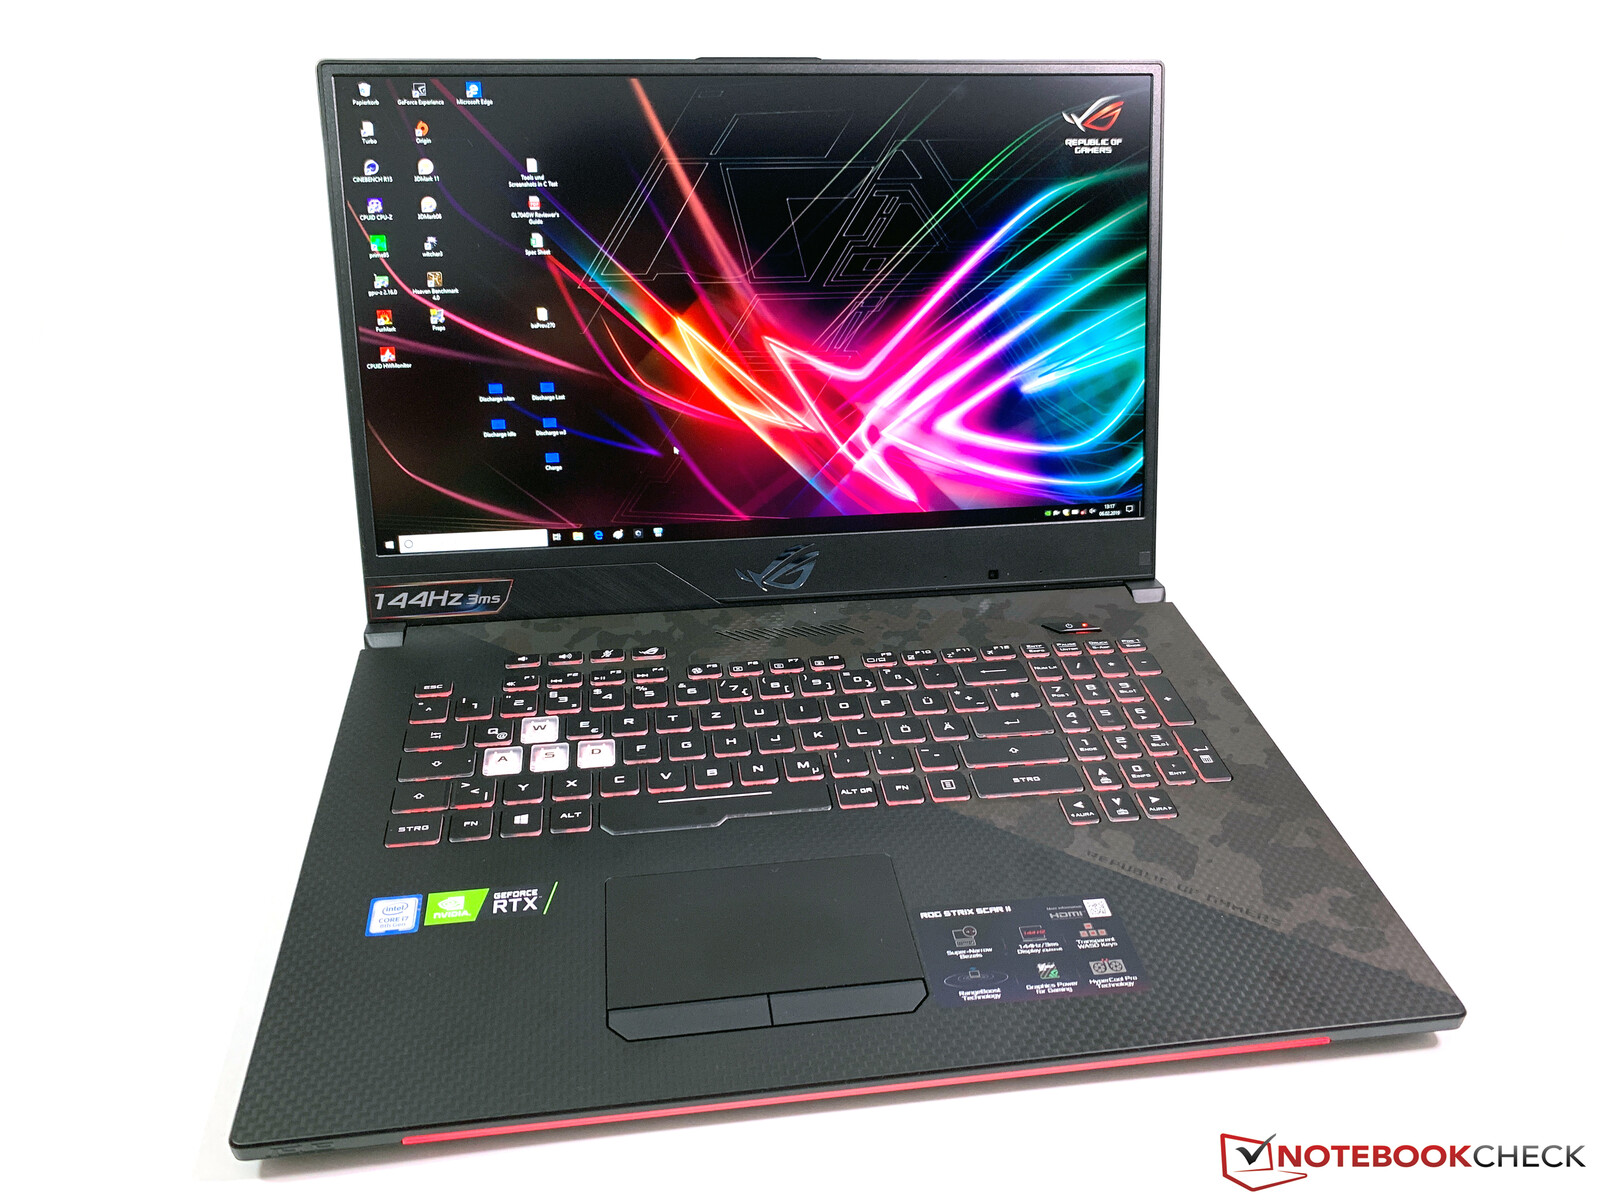
ASUS ROG Strix Scar II GL704GW är en påfallande kompakt och kraftfull laptop. Den har ett fotavtryck som bara är en aning större än de flesta bärbara speldatorer på 15.6 tum och den är märkbart mindre än alla våra jämförelseenheter förutom MSI GS73VR 7RG. Än mer imponerande är att ASUS har lyckats pressa in en GeForce RTX 2070 GPU med, och det är inte Max-Q versionen.
Vår recensionsenhet fick utmärkta resultat i våra tester och kan köra alla moderna AAA-spel smidigt i 1080p med maximala grafikinställningar. De enda nackdelarna är att enheten blir varm och högljudd i så stor grad att fläktarna överröstar högtalarna när man spelar. GL704GW stryps också kraftigt vid batteridrift, men det är ett mindre problem då batteriet ändå bara håller runt en timme vid ihållande belastning. Det är synd att fläktarna låter så mycket då ASUS har utrustat GL704GW med skapliga högtalare.
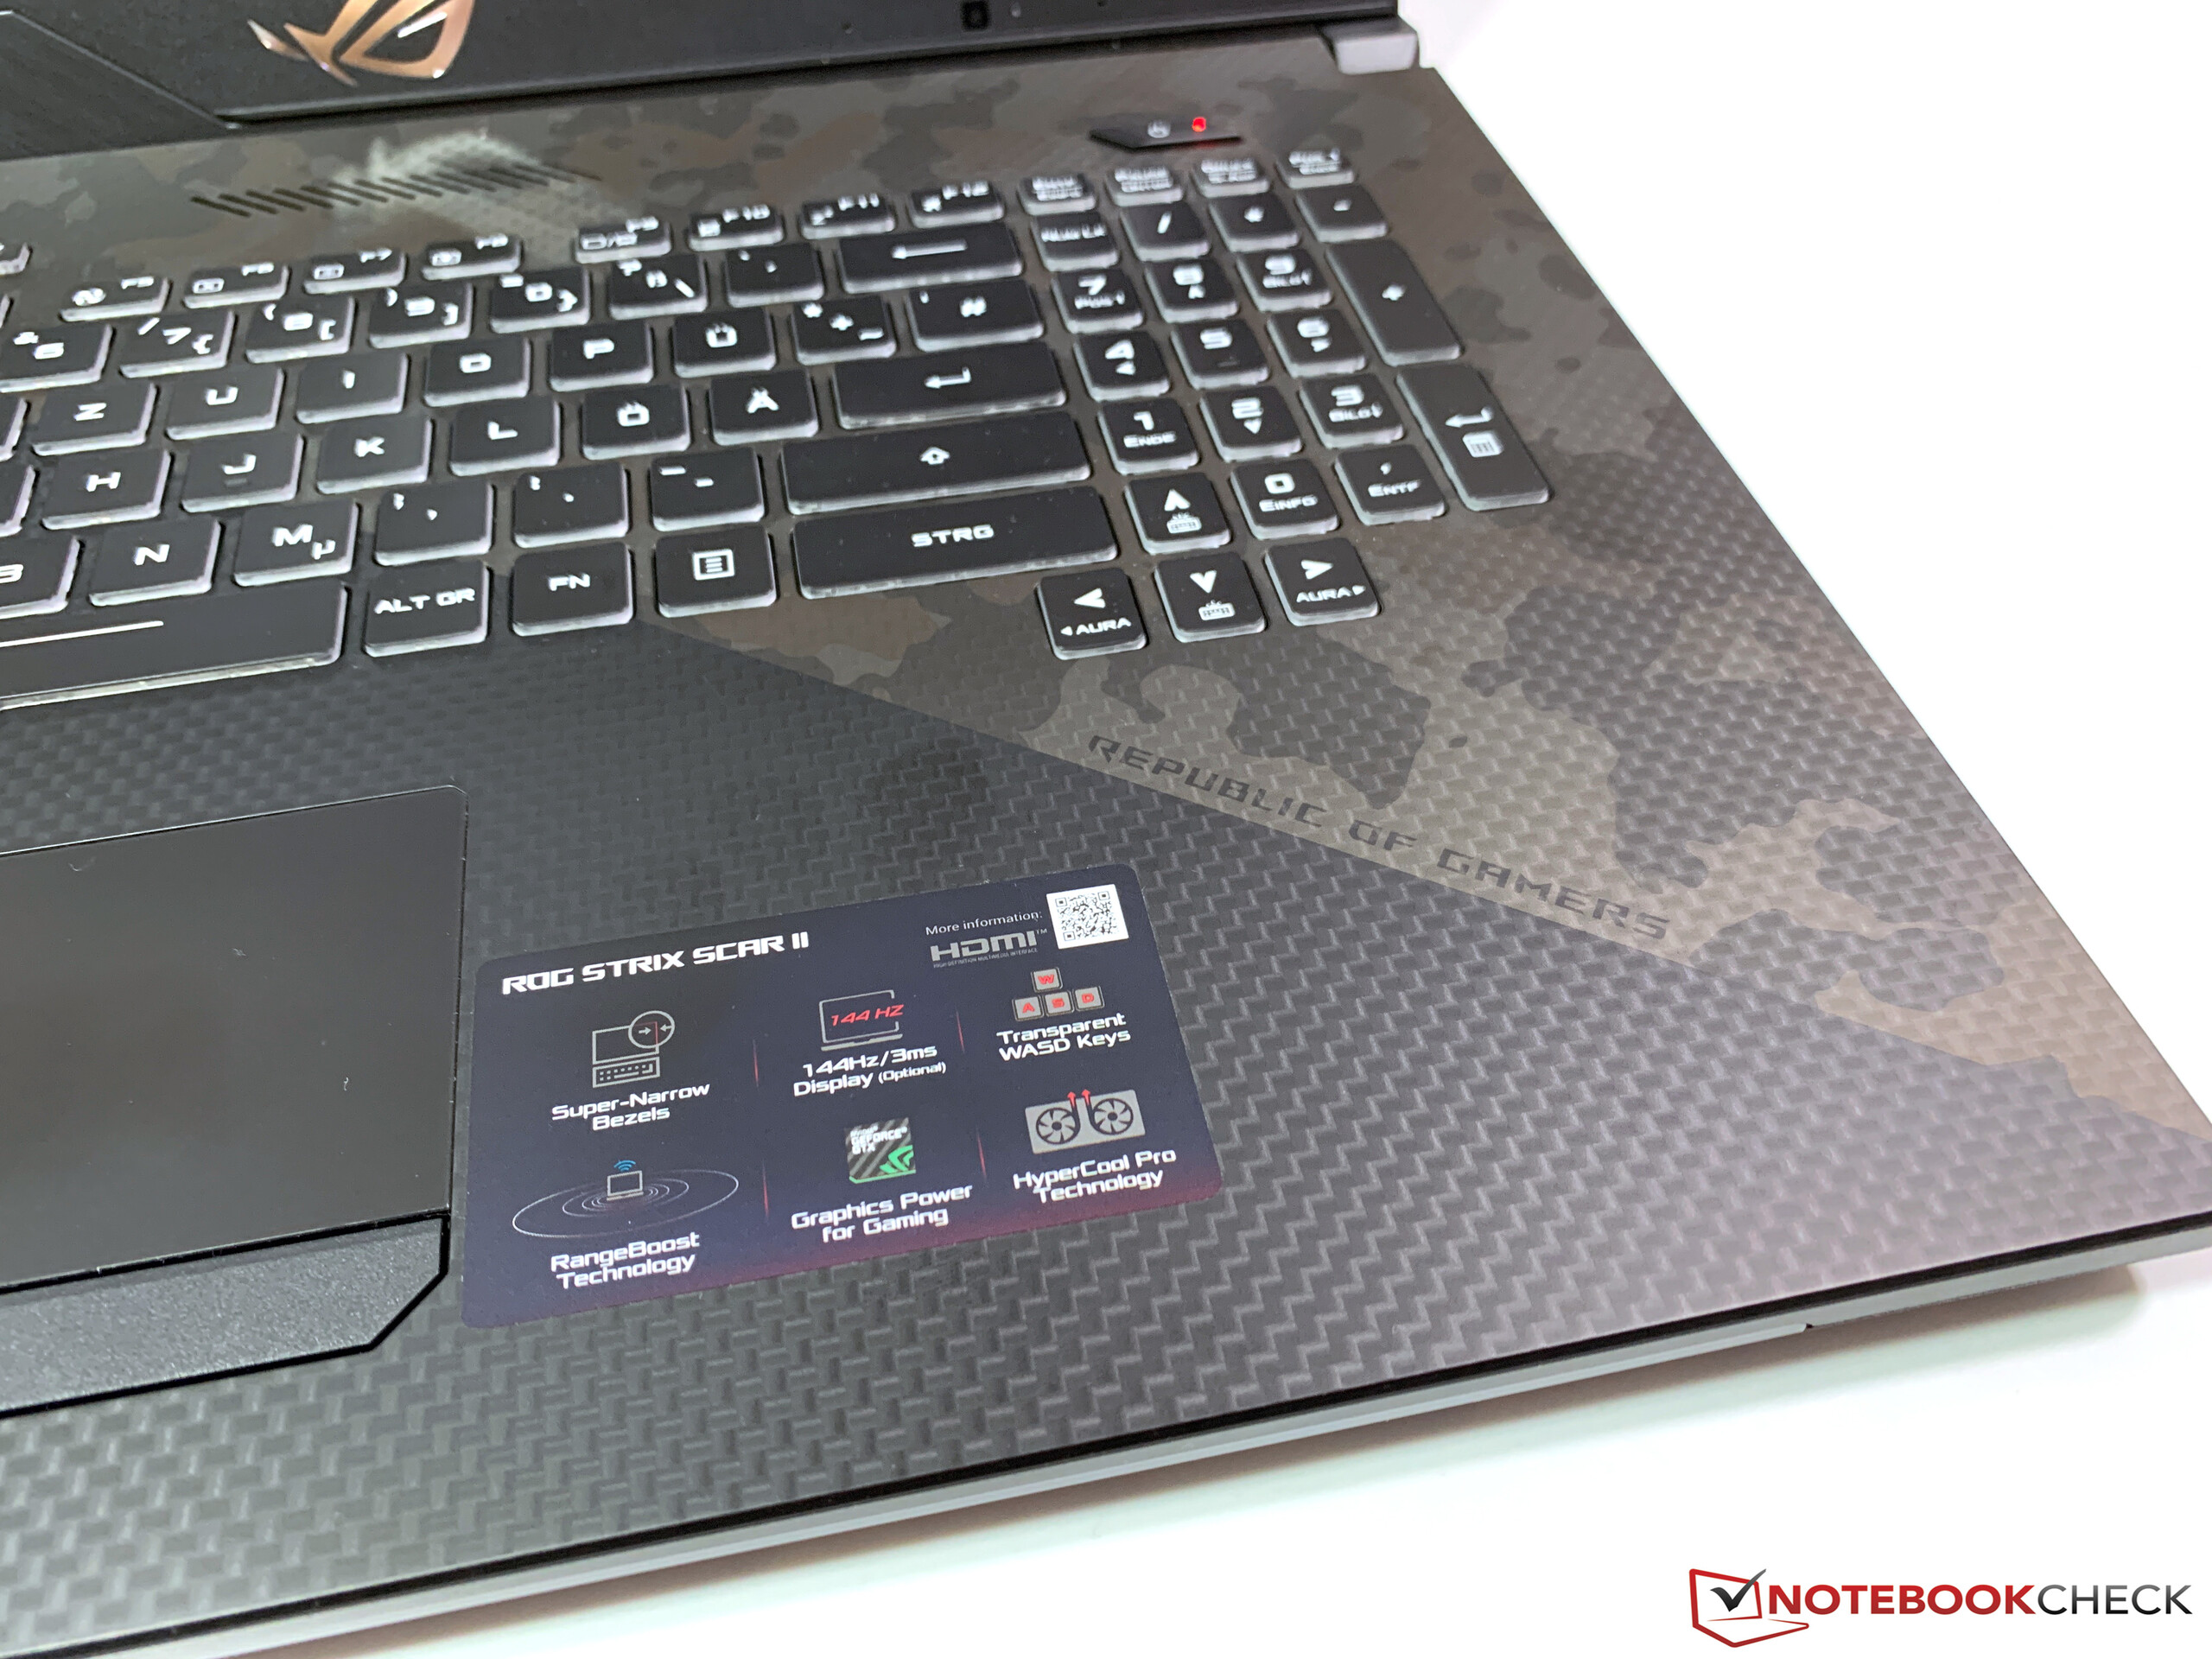
Ibland är mindre mer. ASUS ROG Strix Scar II GL704GW är en imponerande spellaptop på 17.3 tum, men RTX 2070-versionen blir så varm och högljudd att det kan vara bättre att välja modellen med RTX 2060.
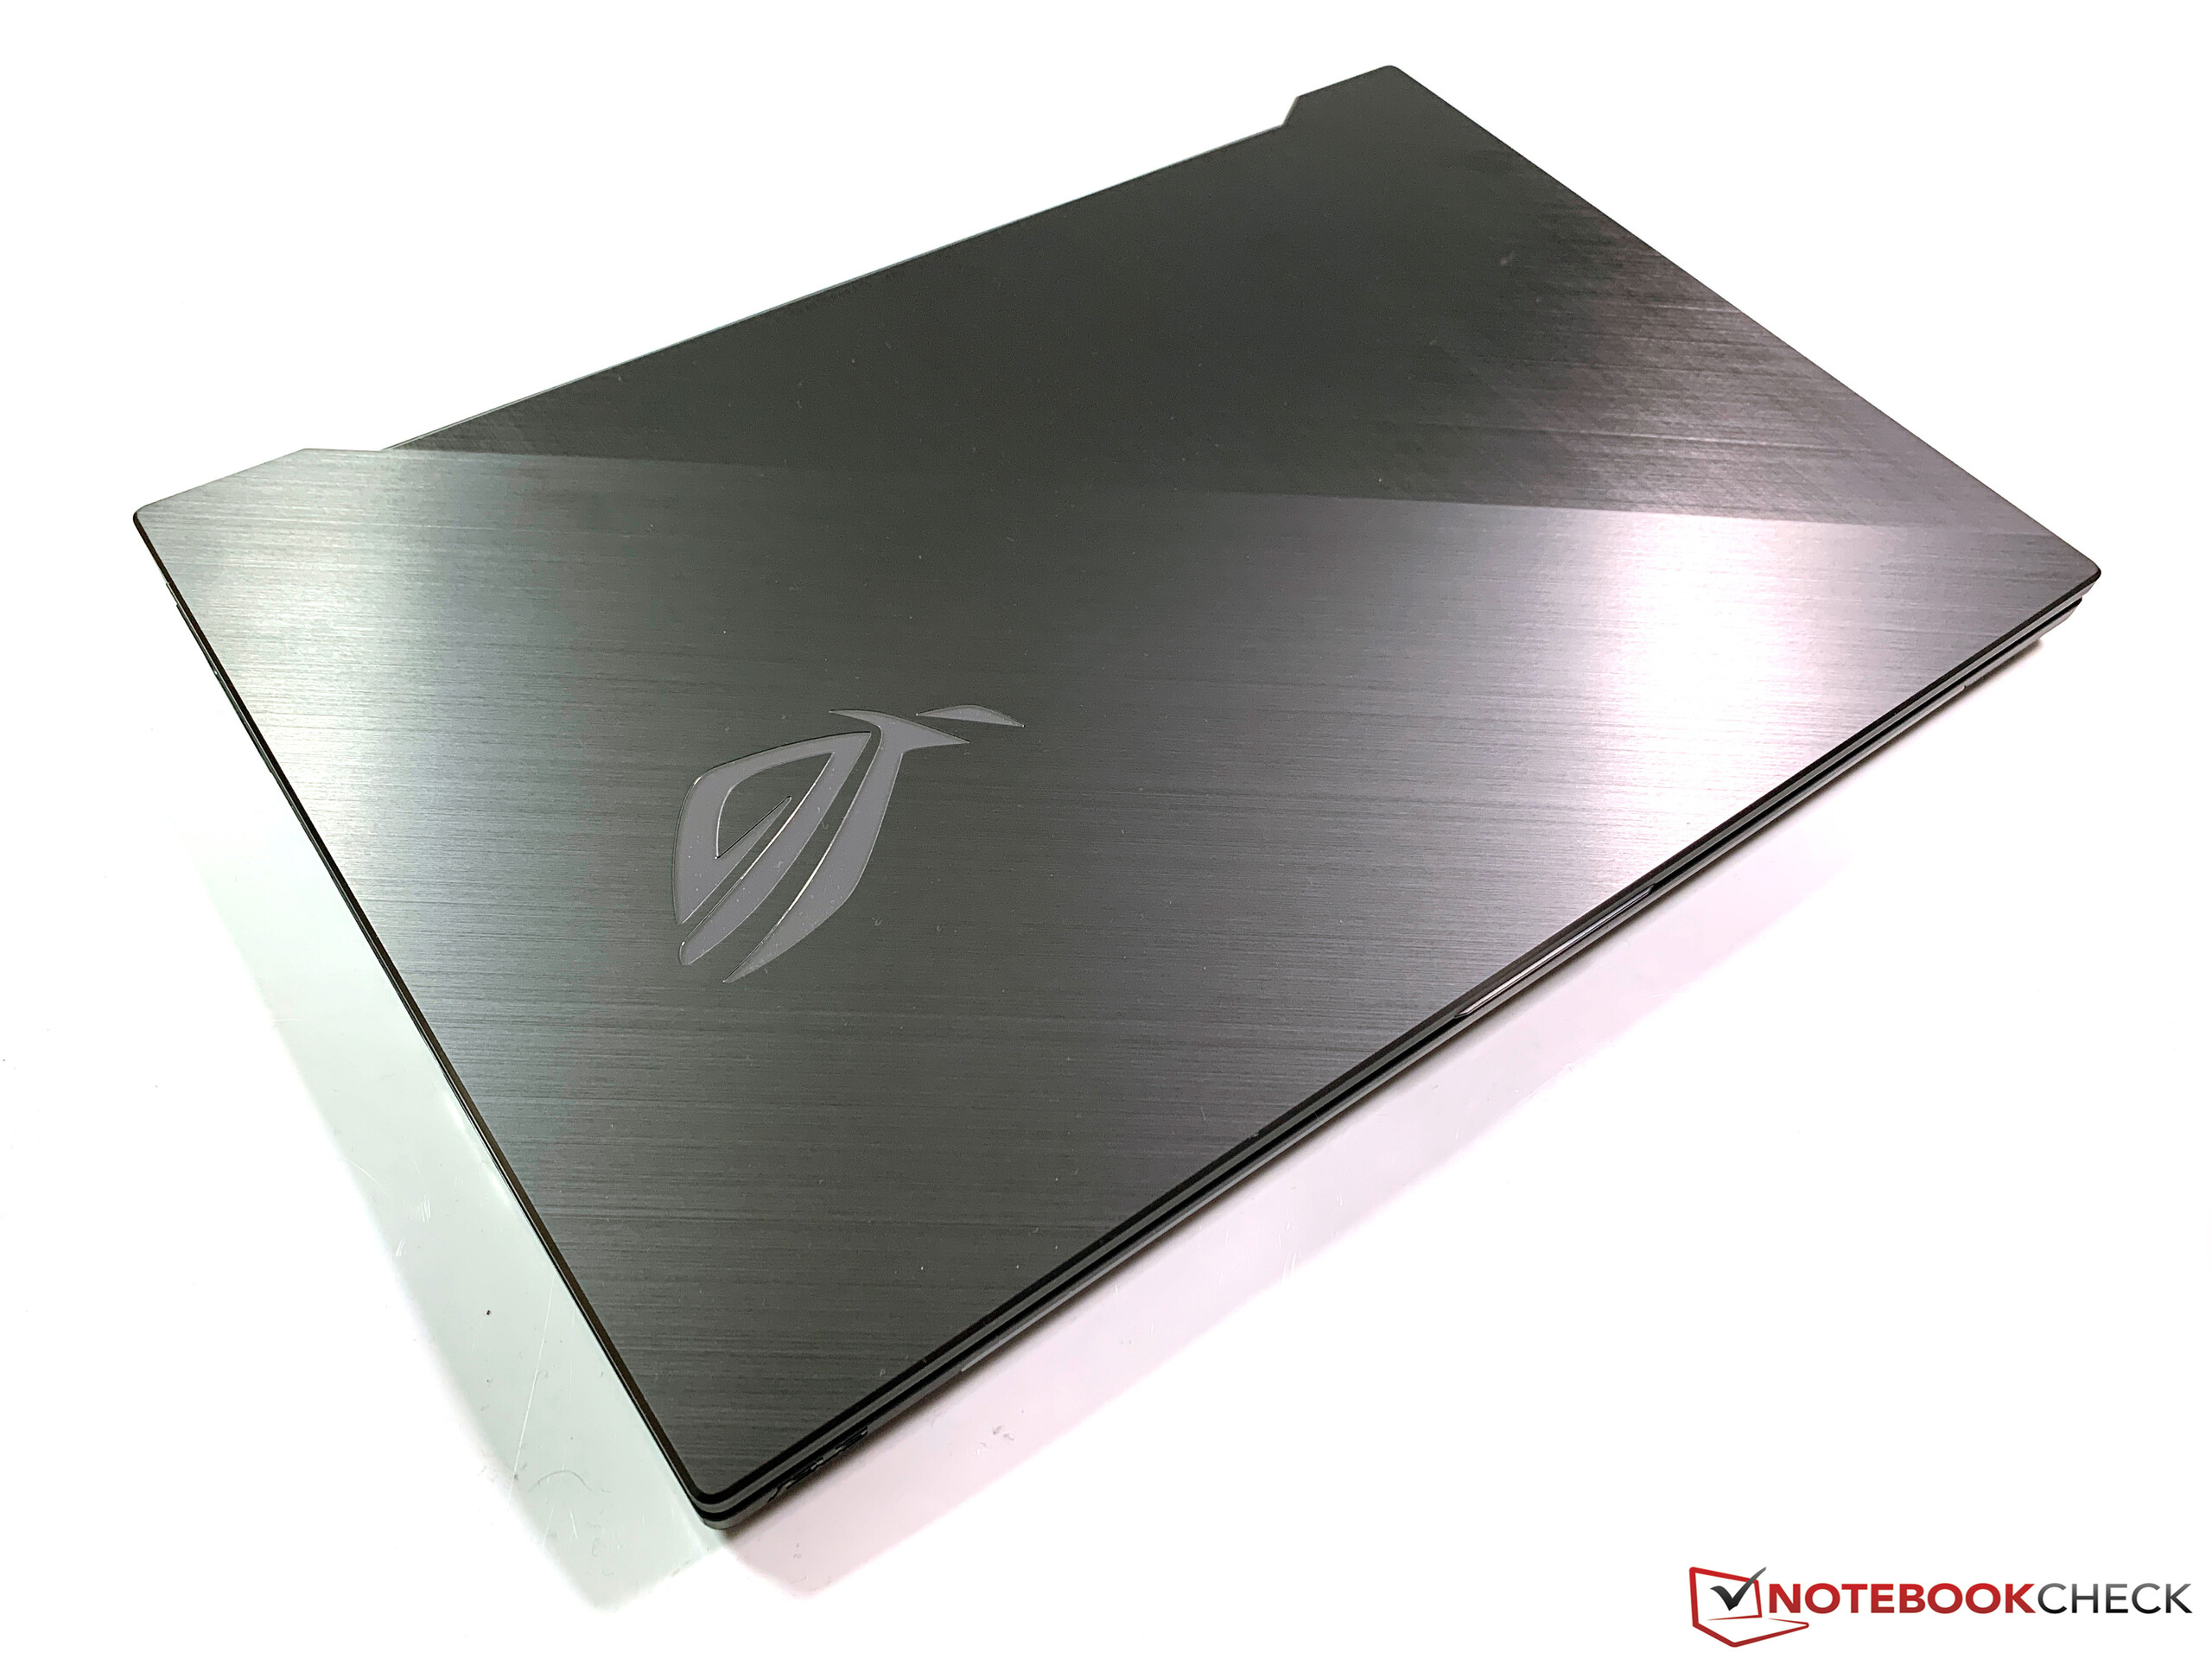
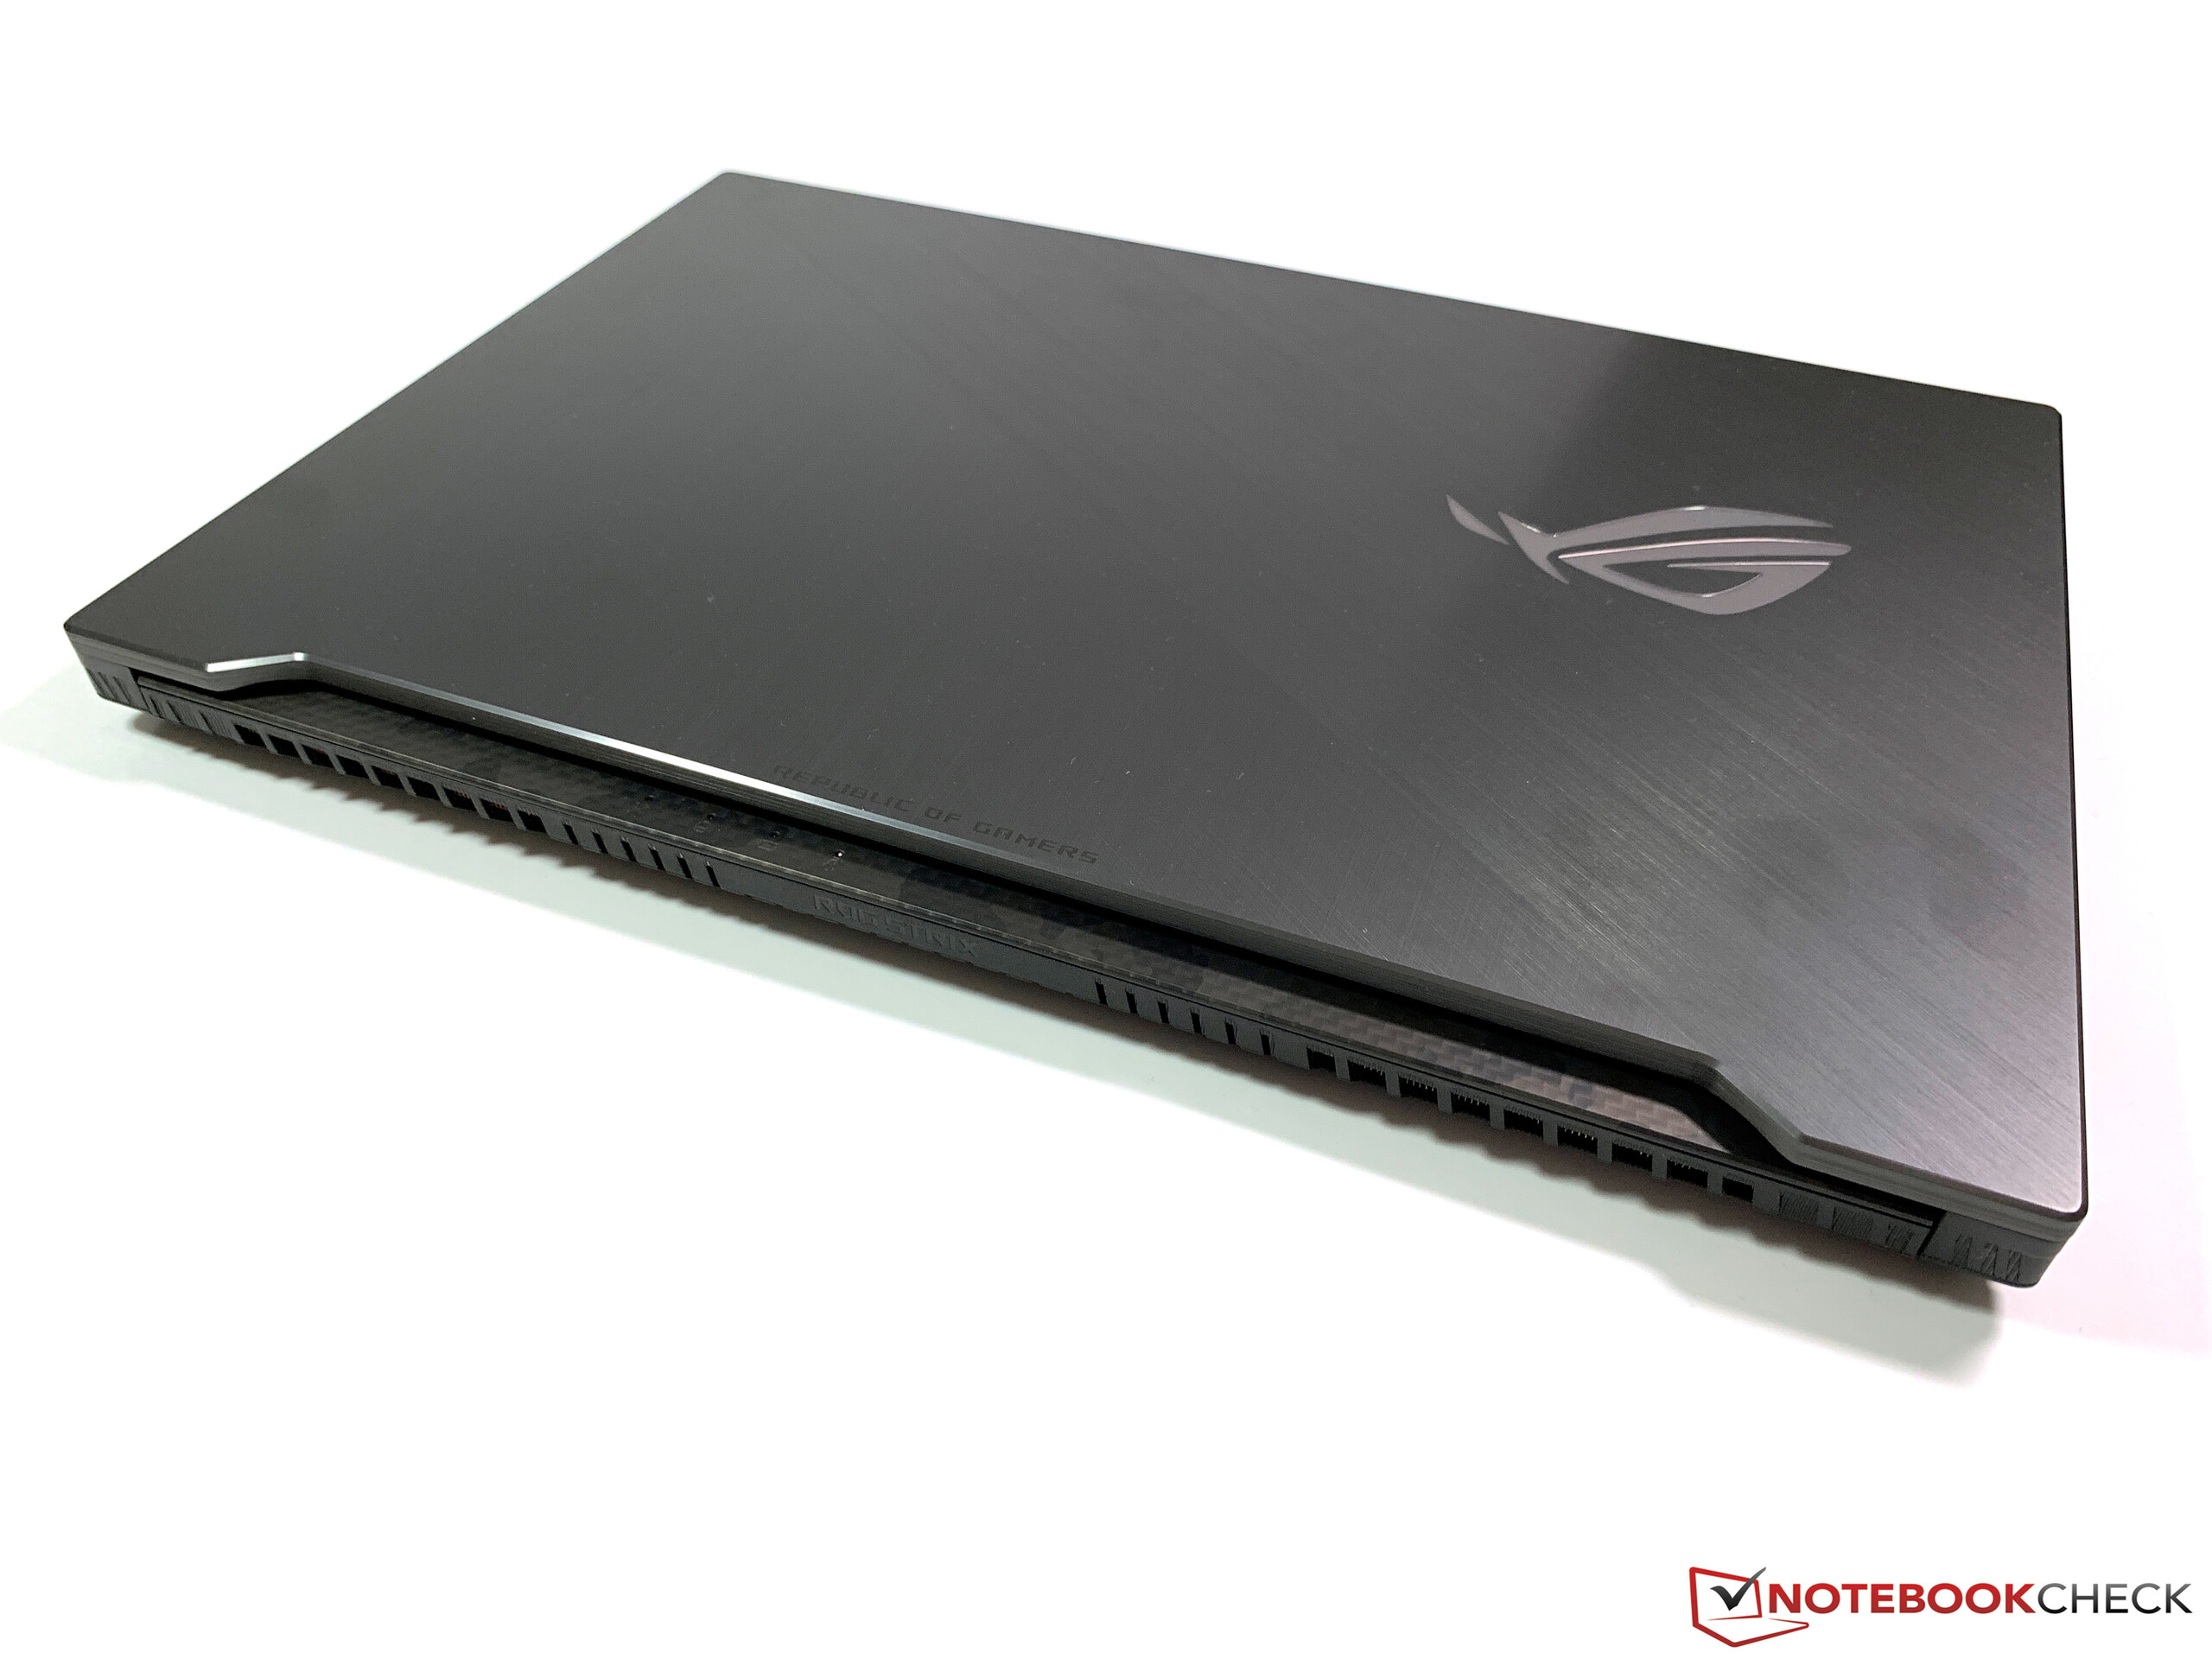
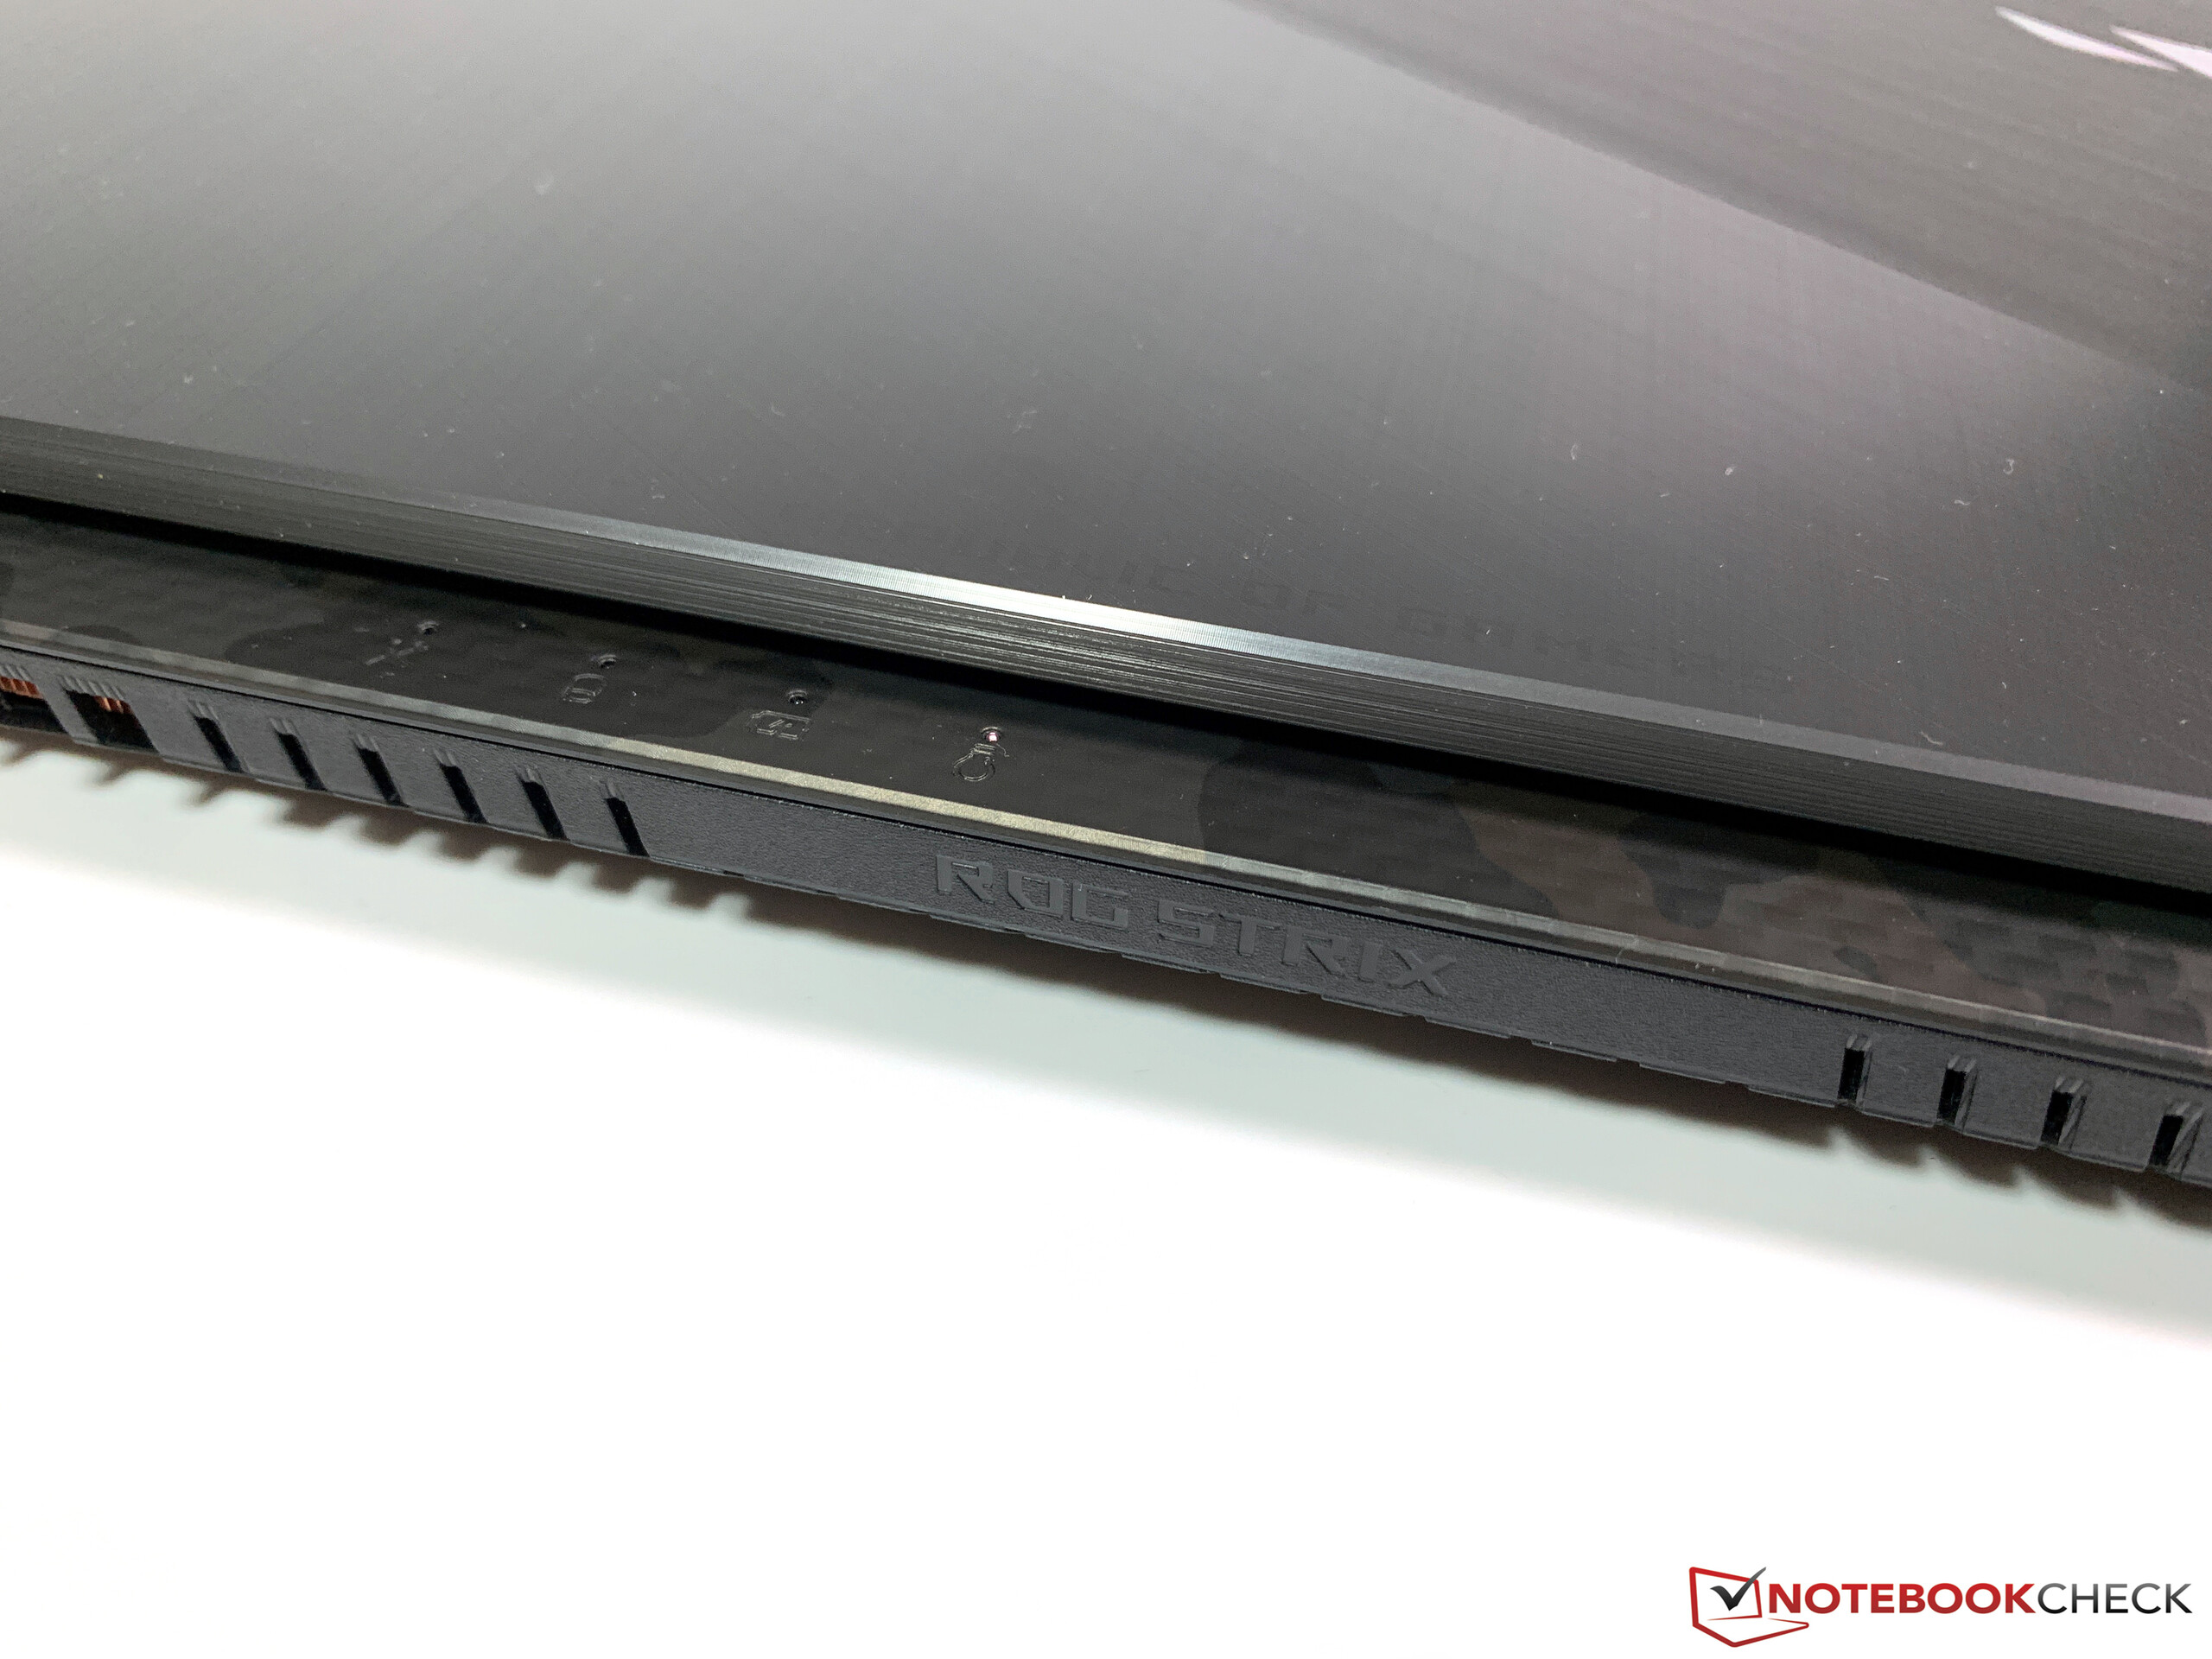
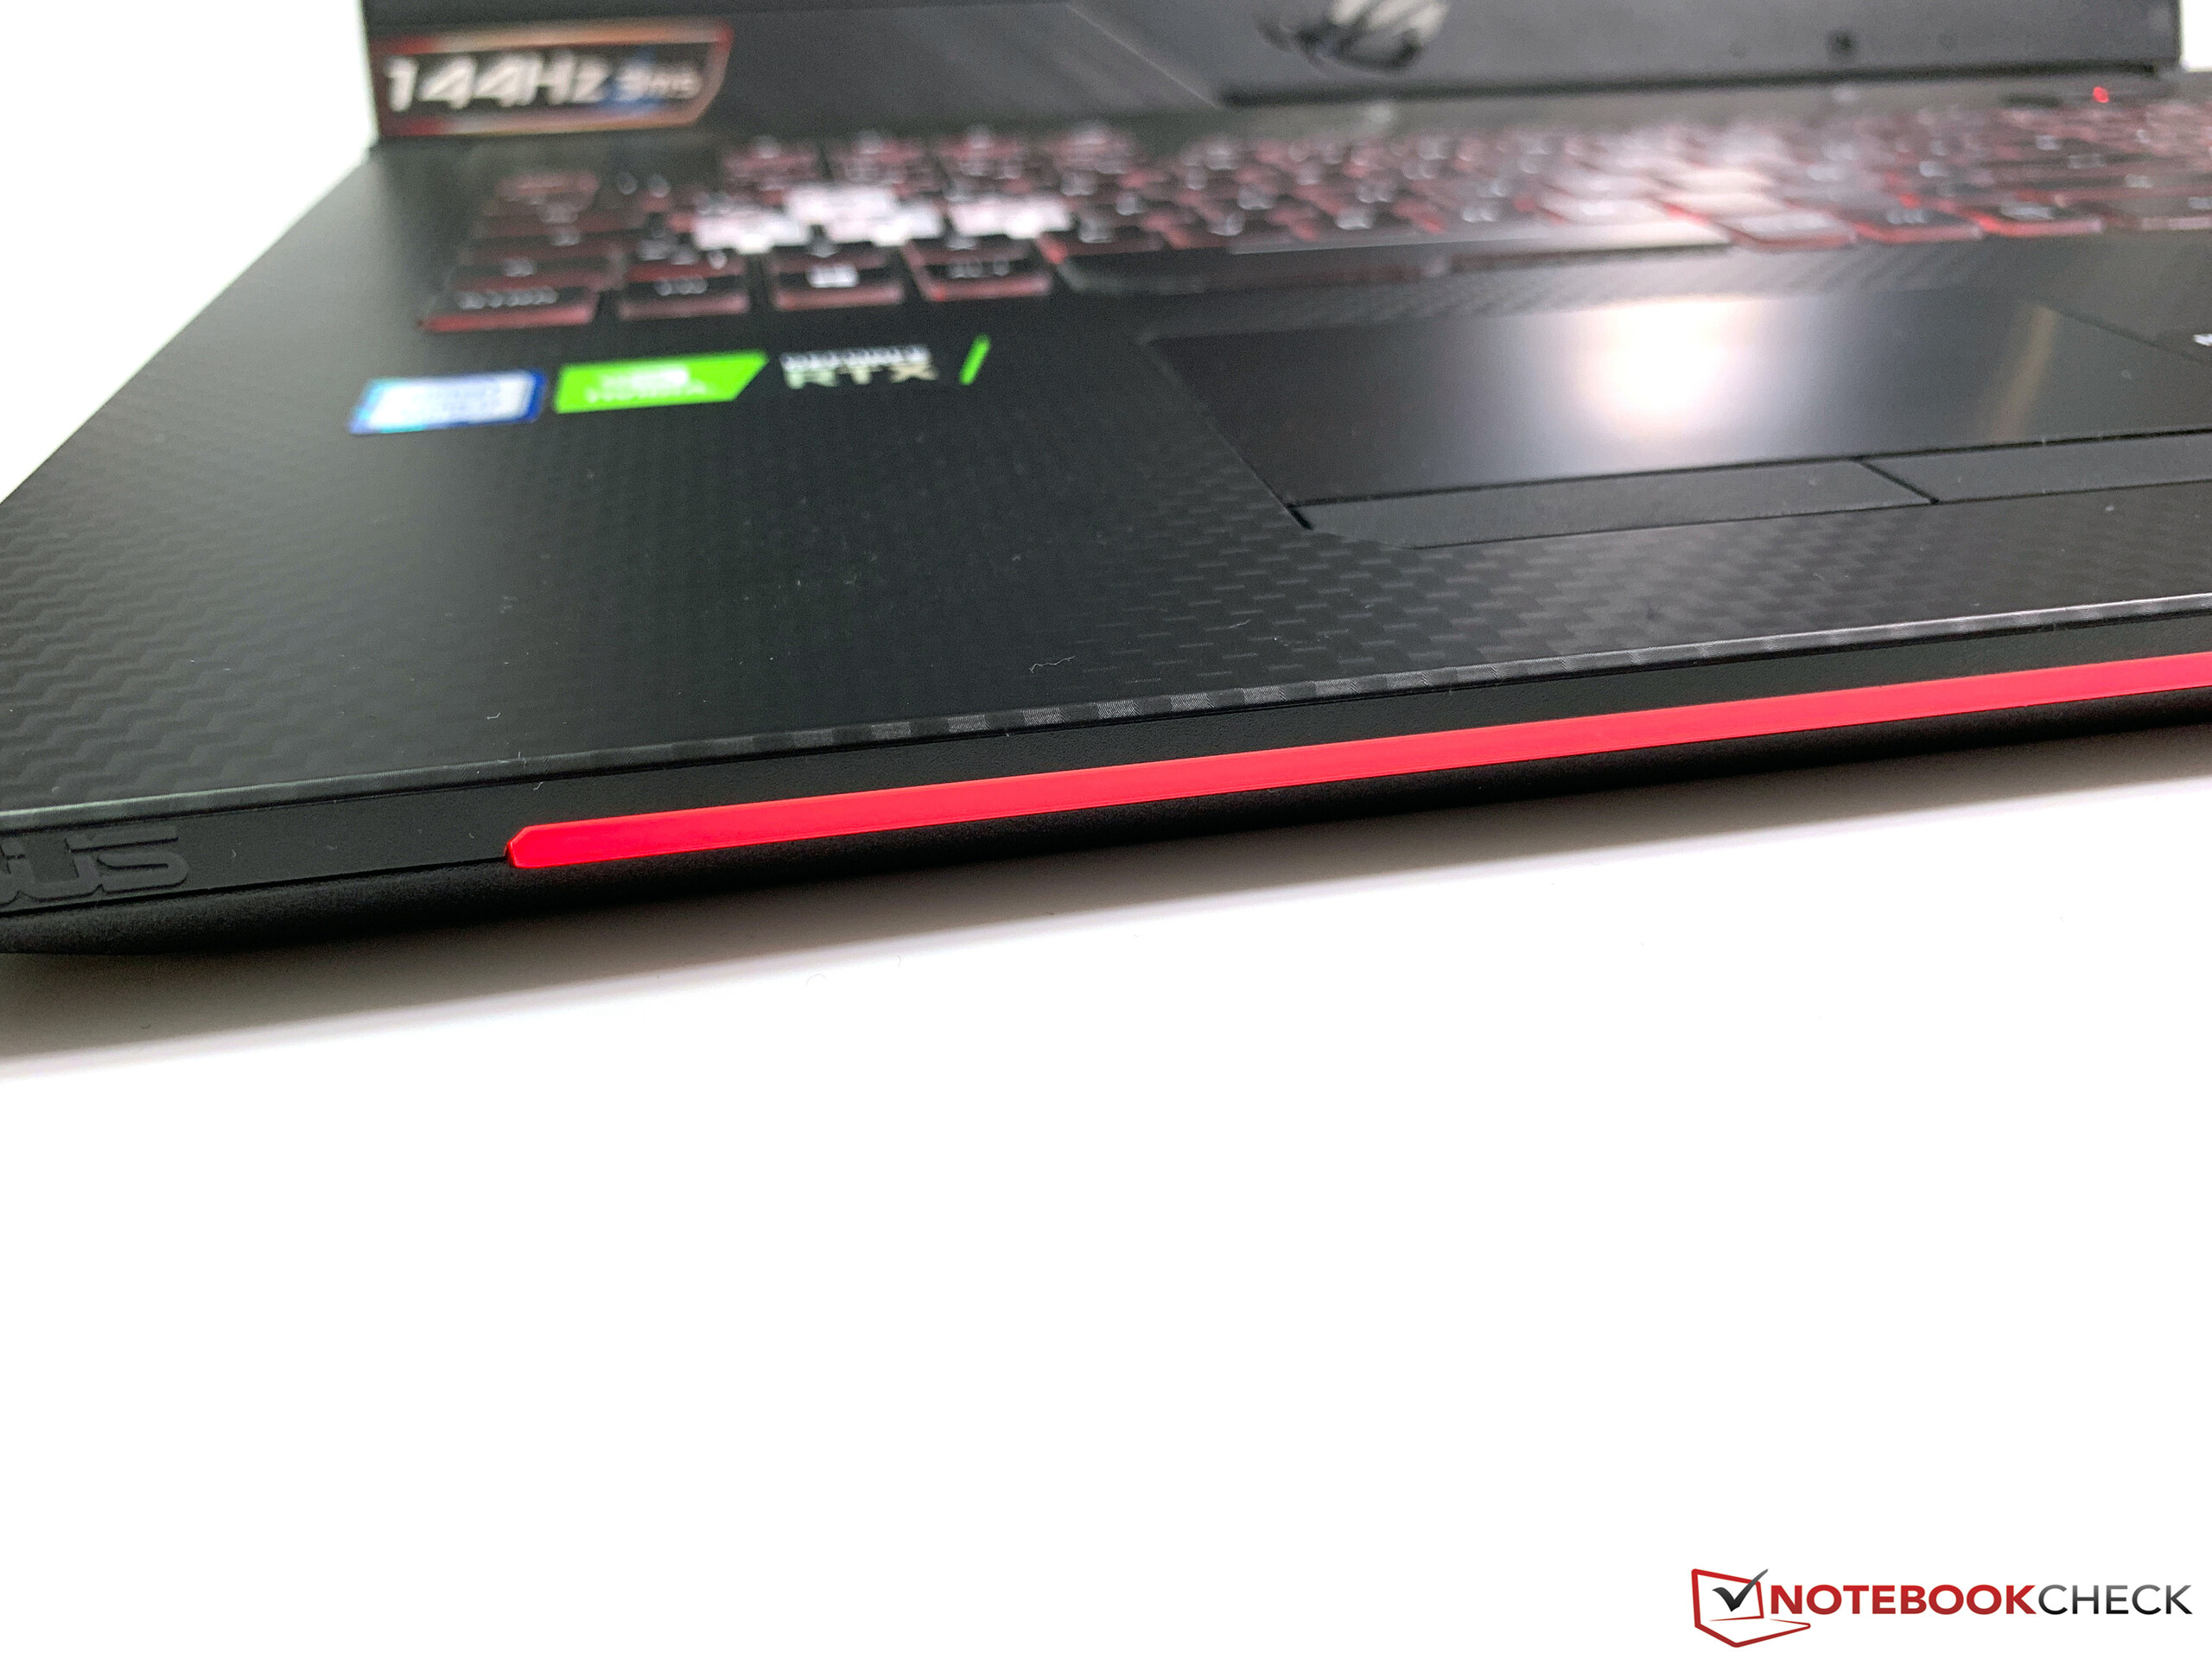
ASUS har utrustat GL704GW med samma 144 Hz-skärm som de använde till GL704GM och som fortfarande imponerar på oss med korta responstider och utmärkt färgprecision. Höljets aggressiva och industriella design är inte för alla, men du kommer få svårt att hitta en mer kompakt spellaptop som levererar samma prestanda som GL704GW gör. I korthet är ASUS ROG Strix Scar II GL704GW en utmärkt spellaptop med få brister utöver sina högljudda fläktar och höga temperaturer.
Asus ROG Strix Scar II GL704GW
- 02/18/2019 v6 (old)
Andreas Osthoff