XMG SECTOR högklassig stationär dator med Intel Core i9-13900K och Nvidia GeForce RTX 4090 recenserad

Många förknippar Schenker med kraftfulla bärbara datorer. Den extra märkningen "XMG" visar att det rör sig om avancerade spelutrustning, som under tiden även omfattar stationära datorer. I den här recensionen kommer vi att fokusera på den Intel-baserade XMG SECTOR. Baskonfigurationen kostar 1 239 euro (1 306 dollar) och levereras med en Intel Core i5-12400F, 16 GB RAM och en Nvidia GeForce RTX 3060. Vår recensionsenhet är en högklassig modell med en Core i9-13900K och en GeForce RTX 4090, men den har också ett mycket högt pris på cirka 4 700 euro (4 956 dollar). Men tack vare de många alternativ som erbjuds av XMG shopkan du utrusta datorn med olika hårdvarukomponenter och sätta ihop ett system som är skräddarsytt specifikt för dina behov.
En detaljerad titt på XMG SECTOR Intel
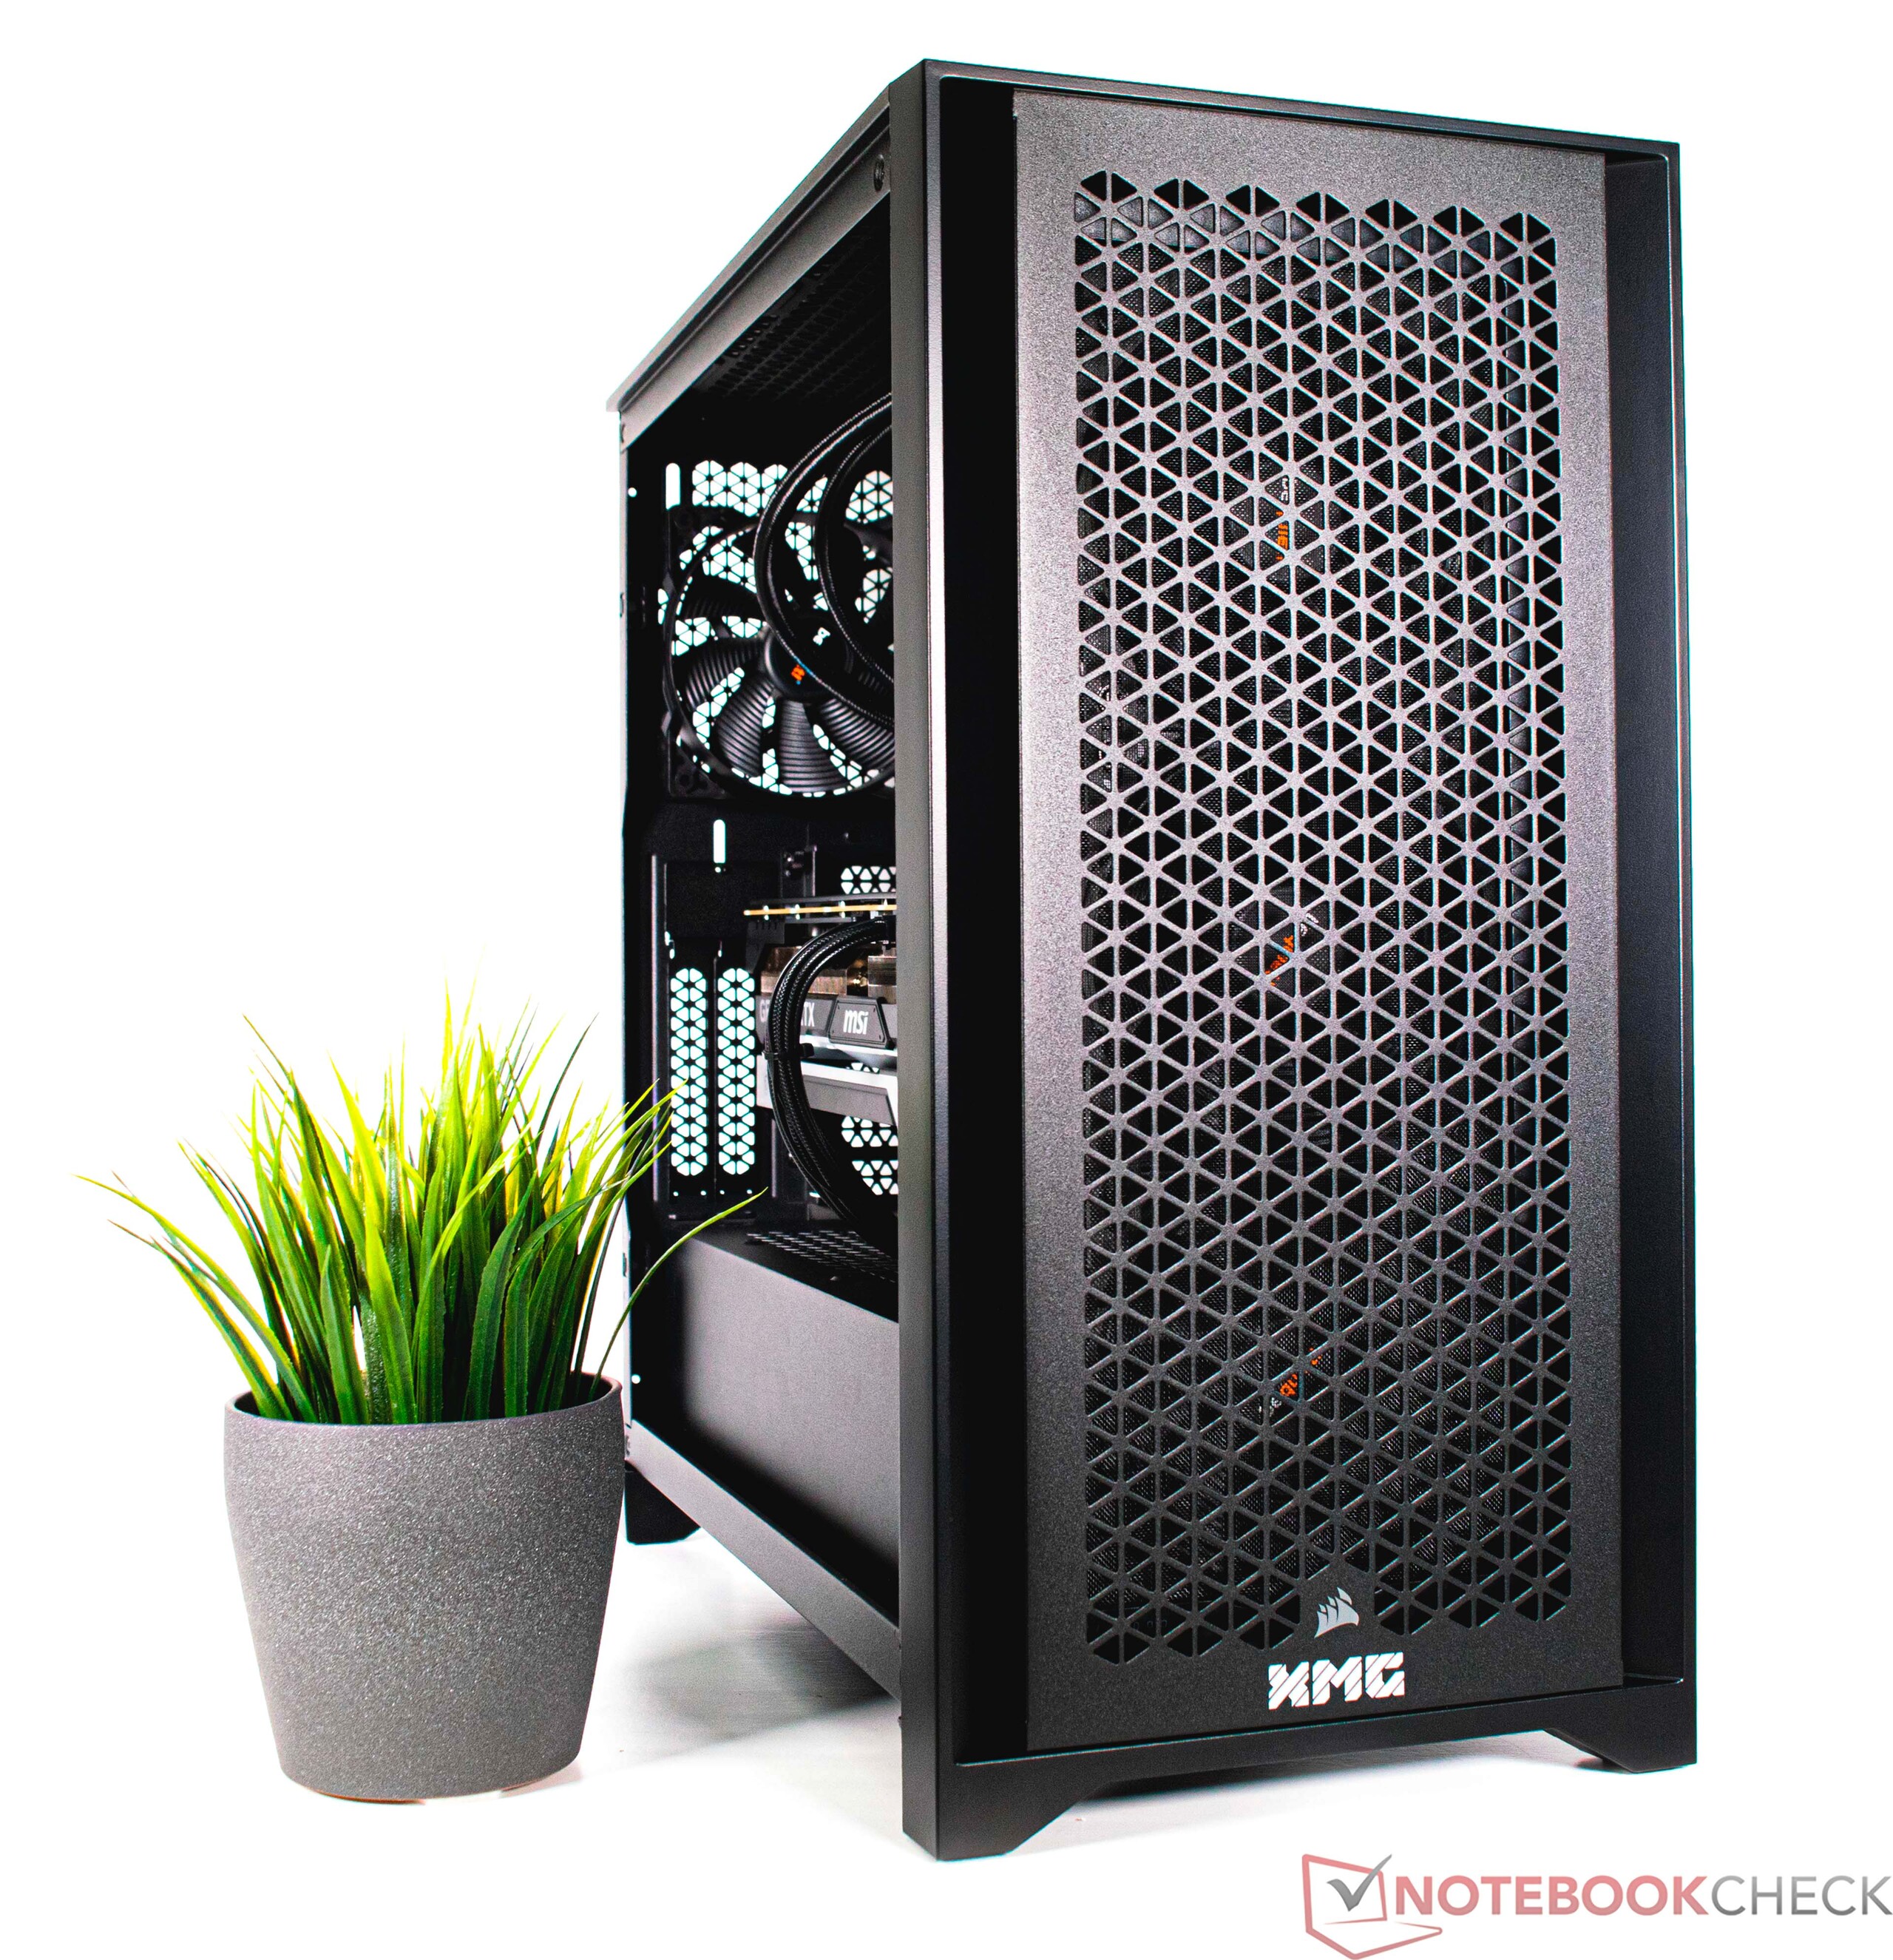
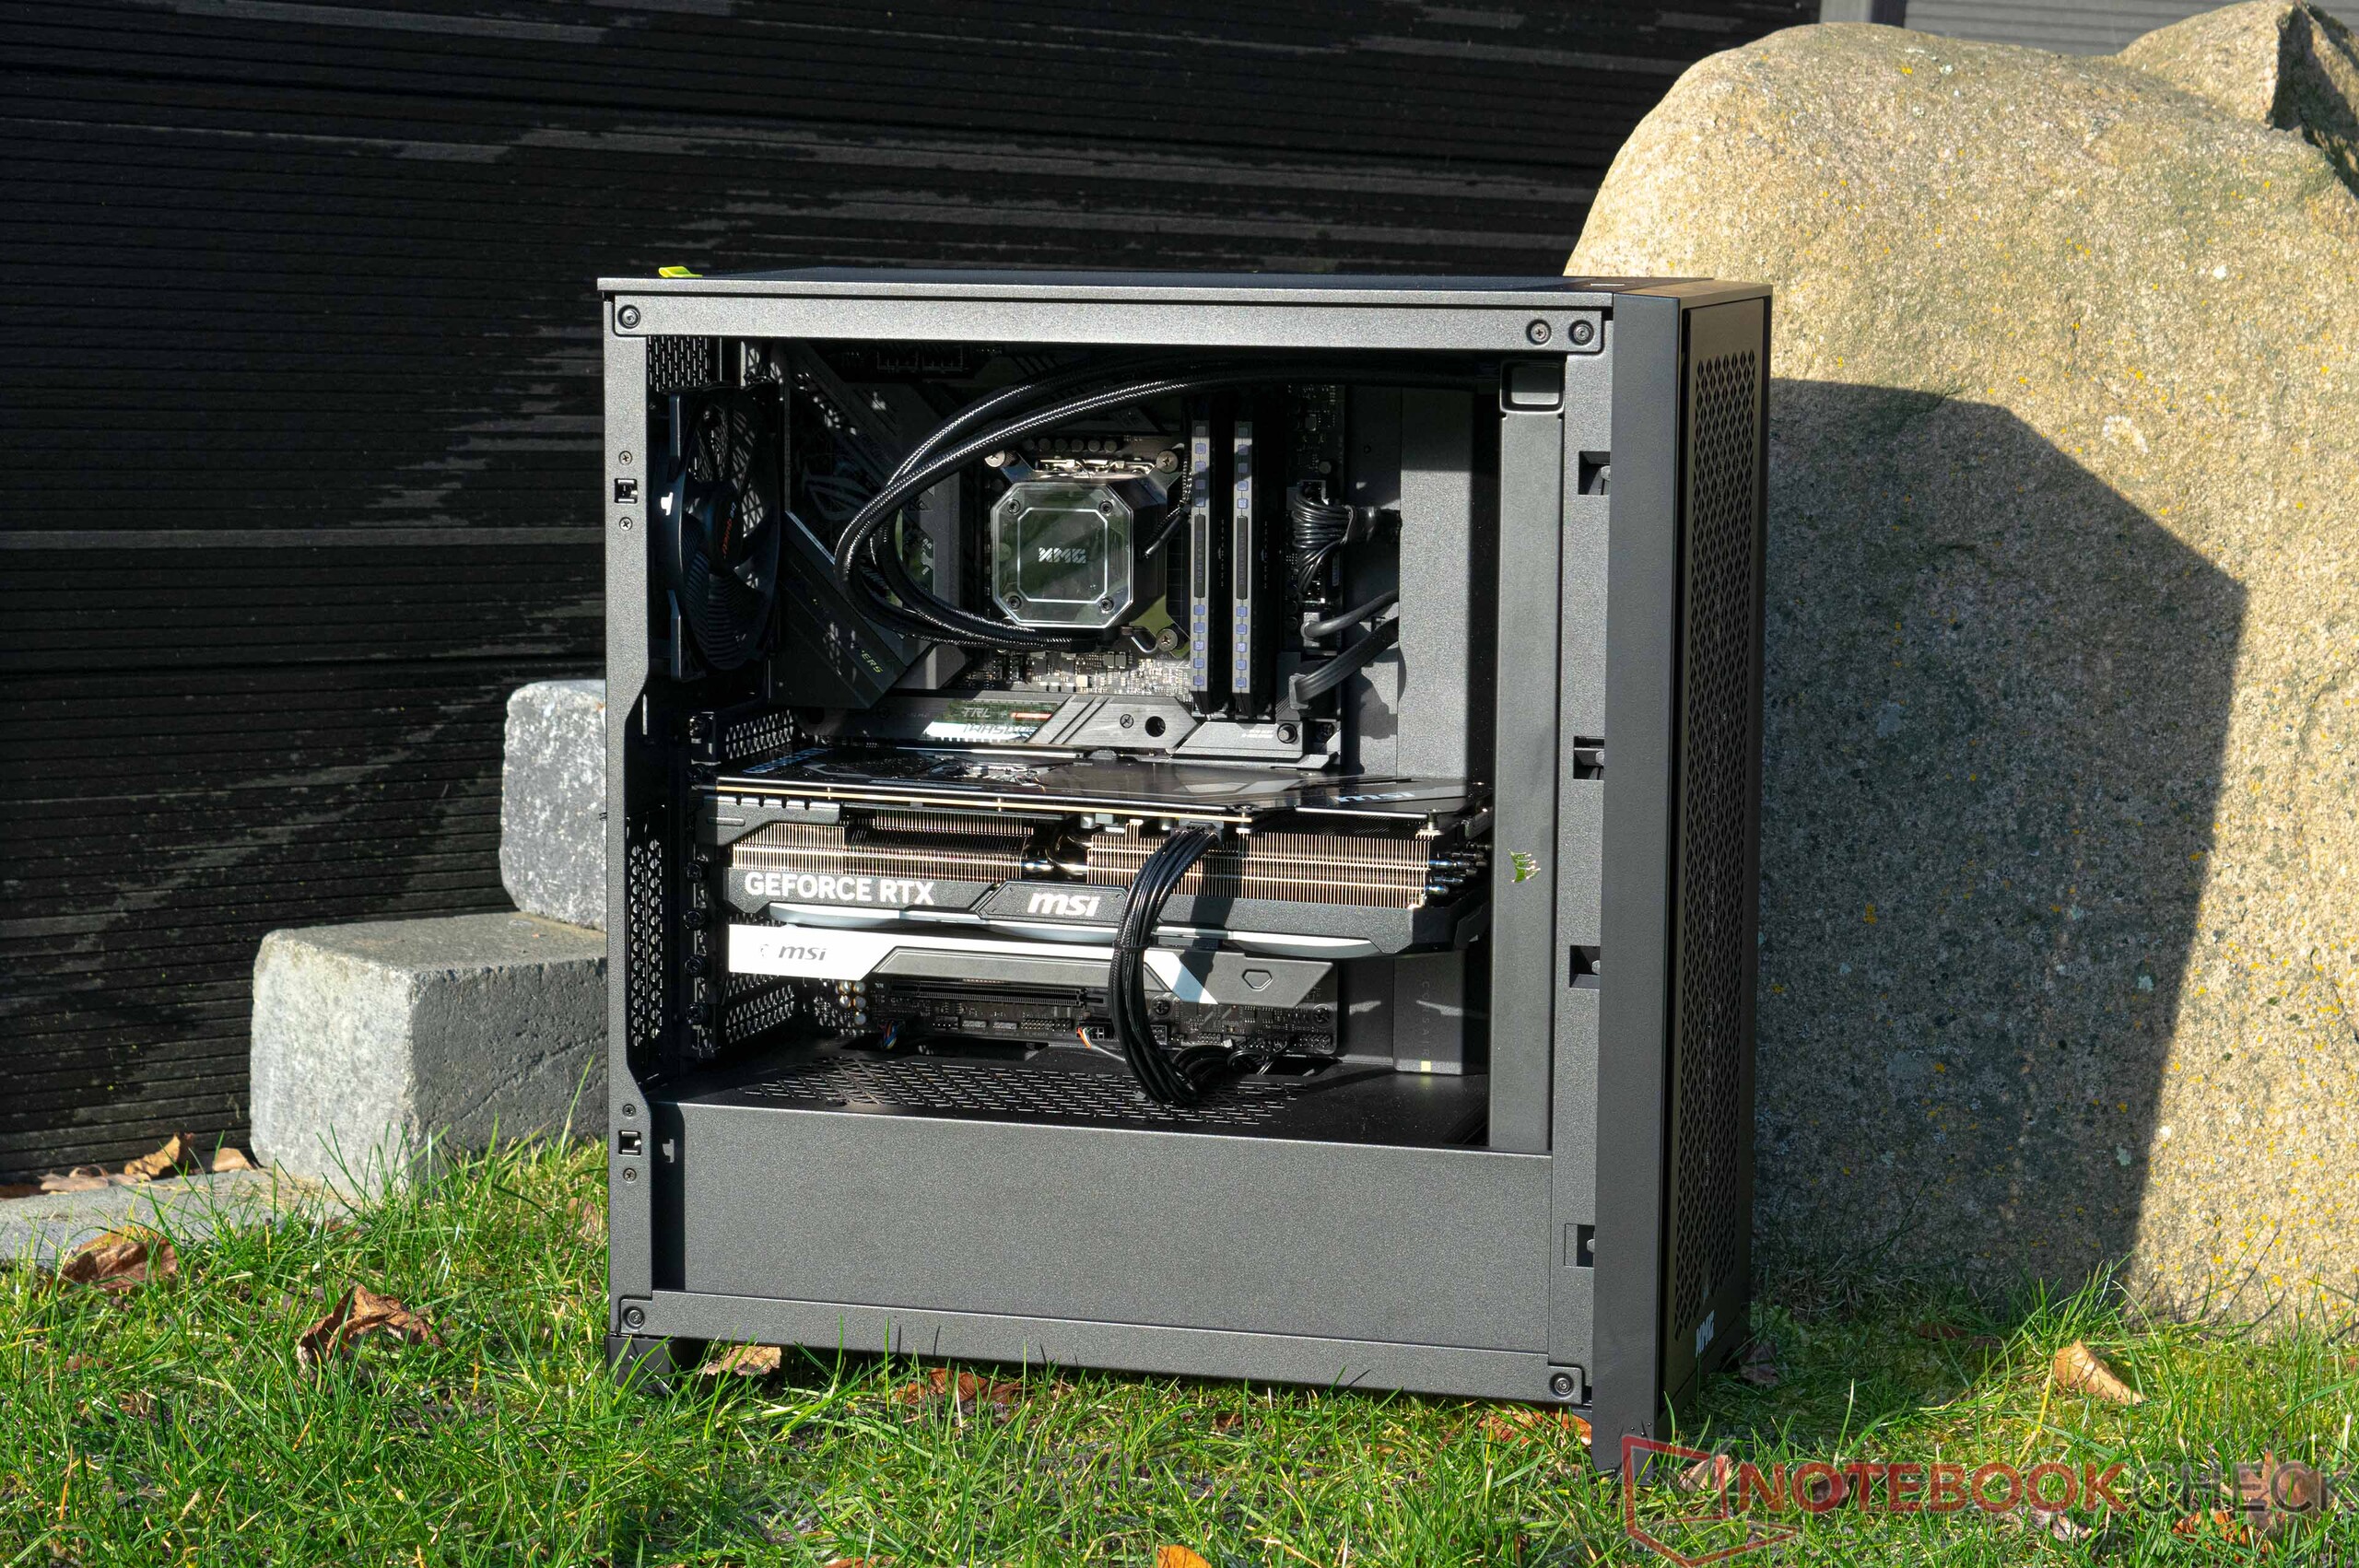
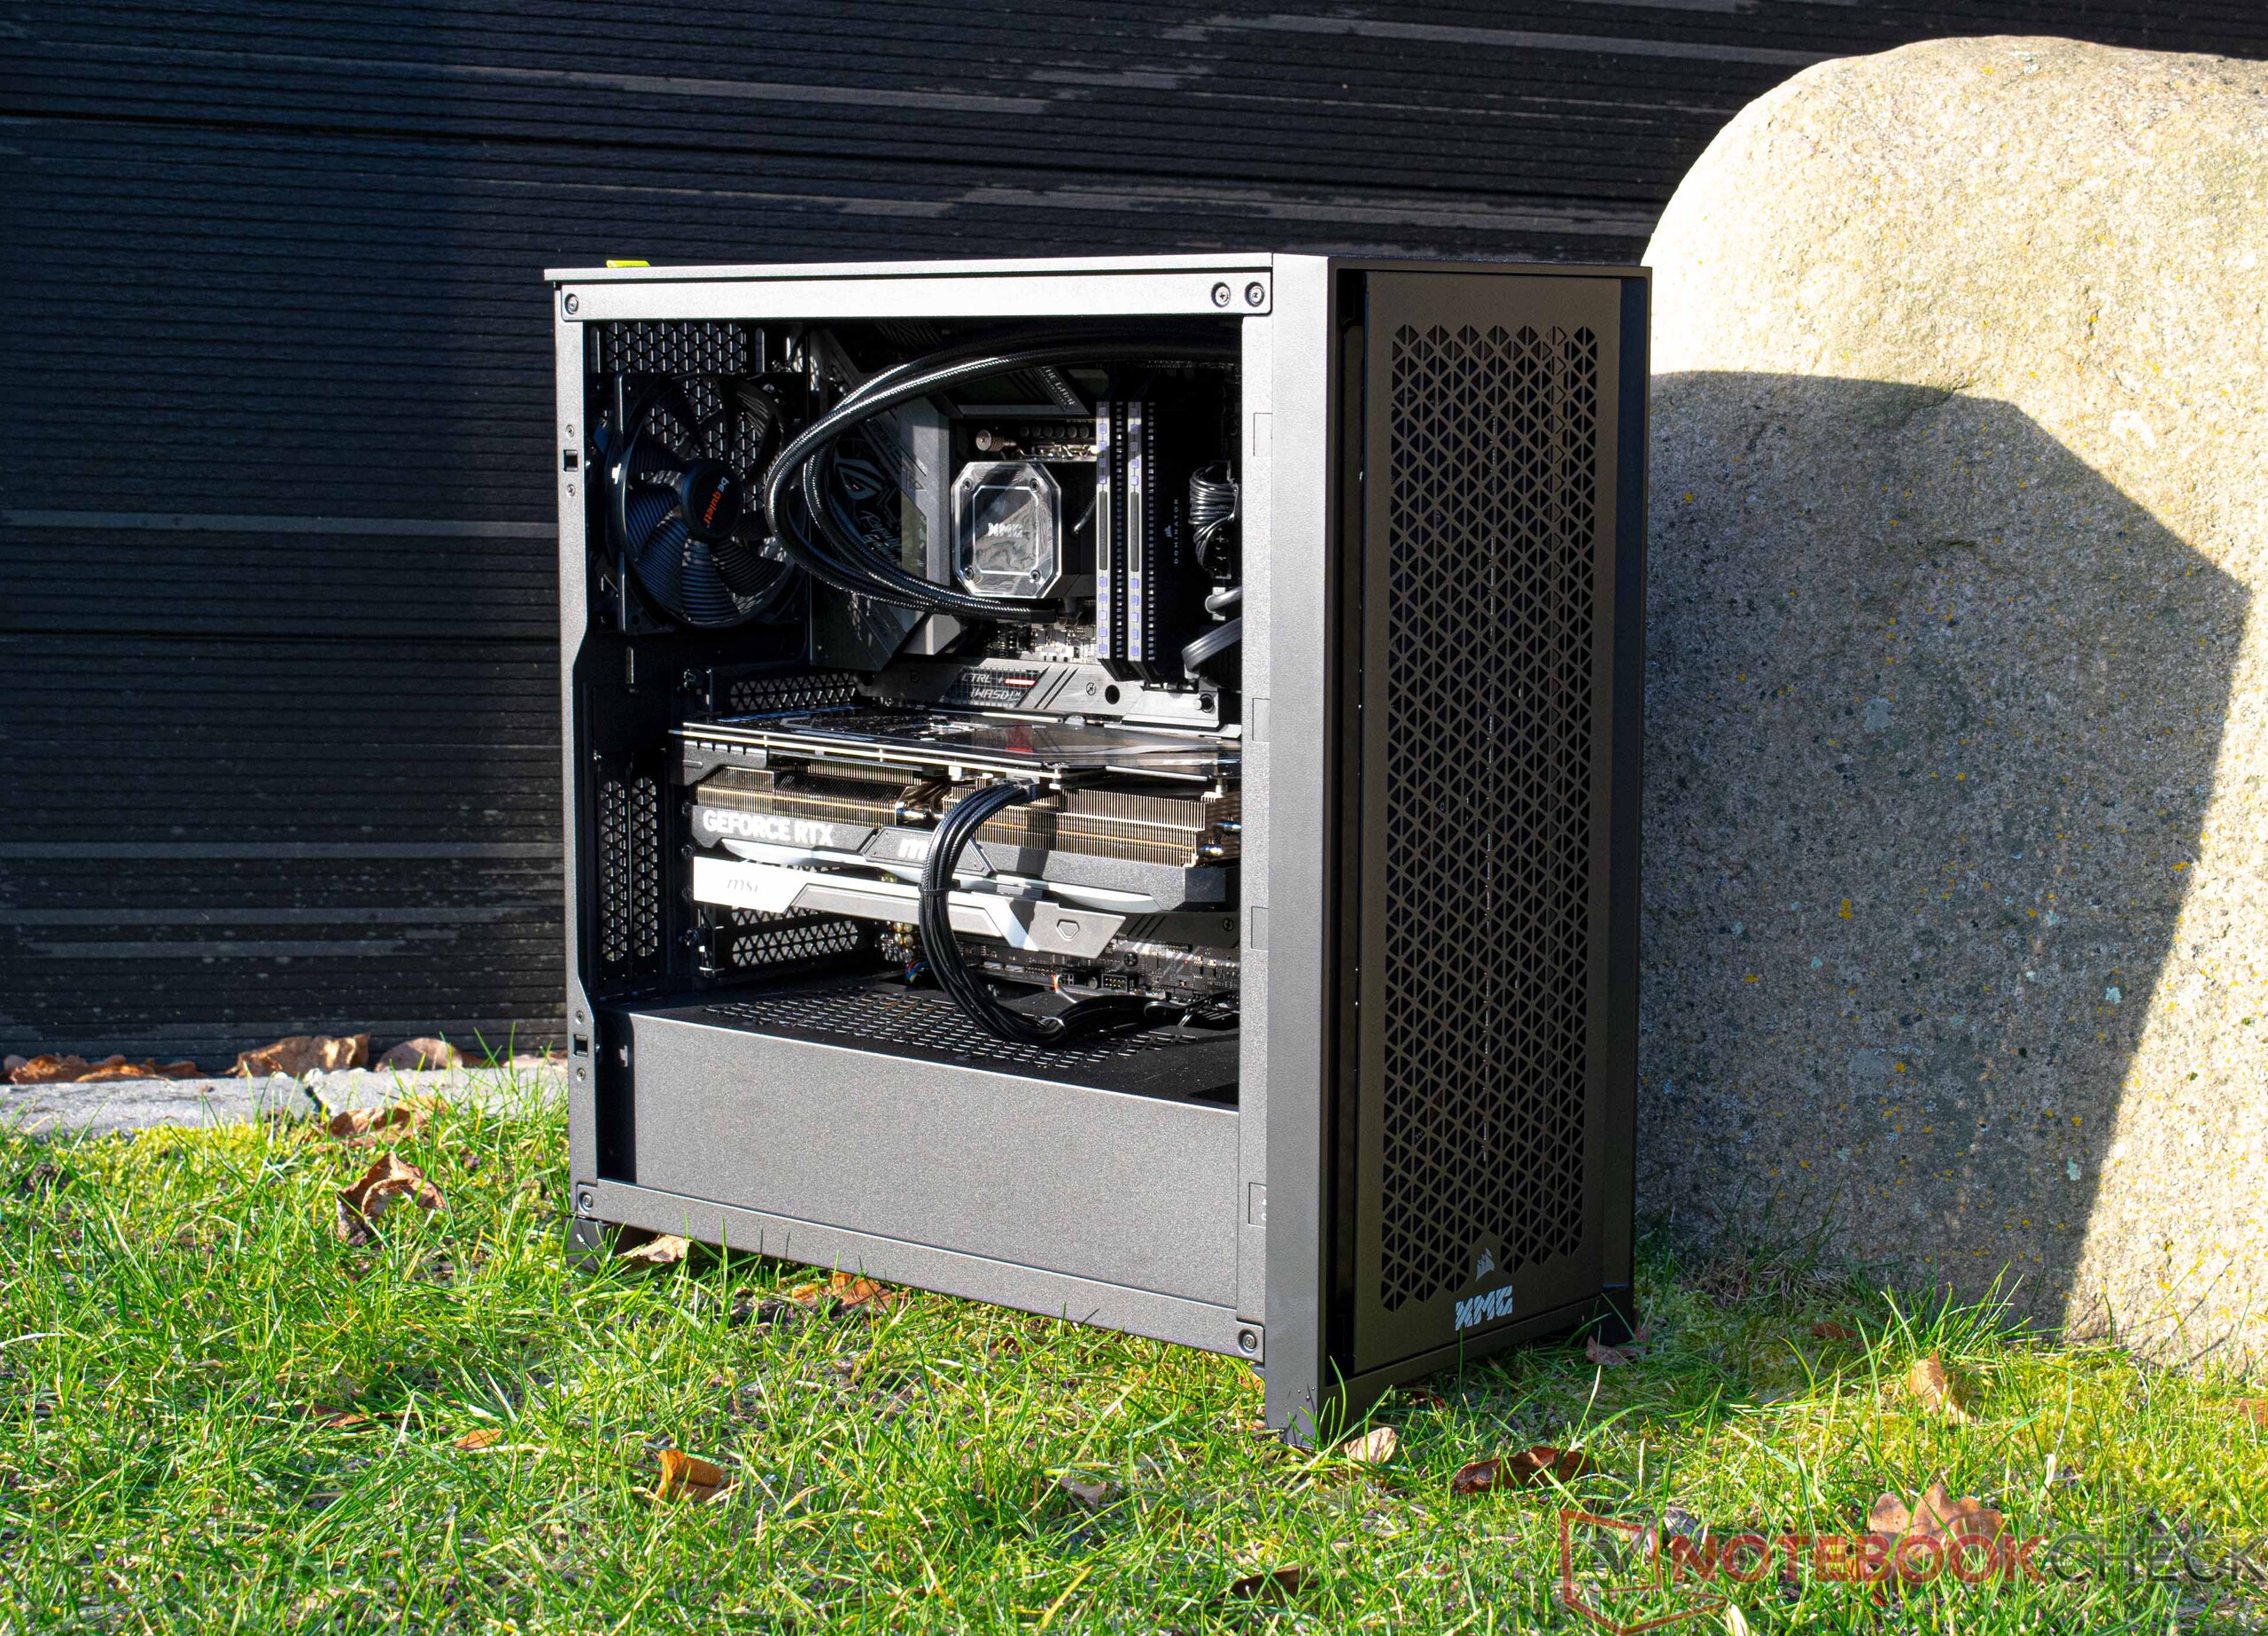
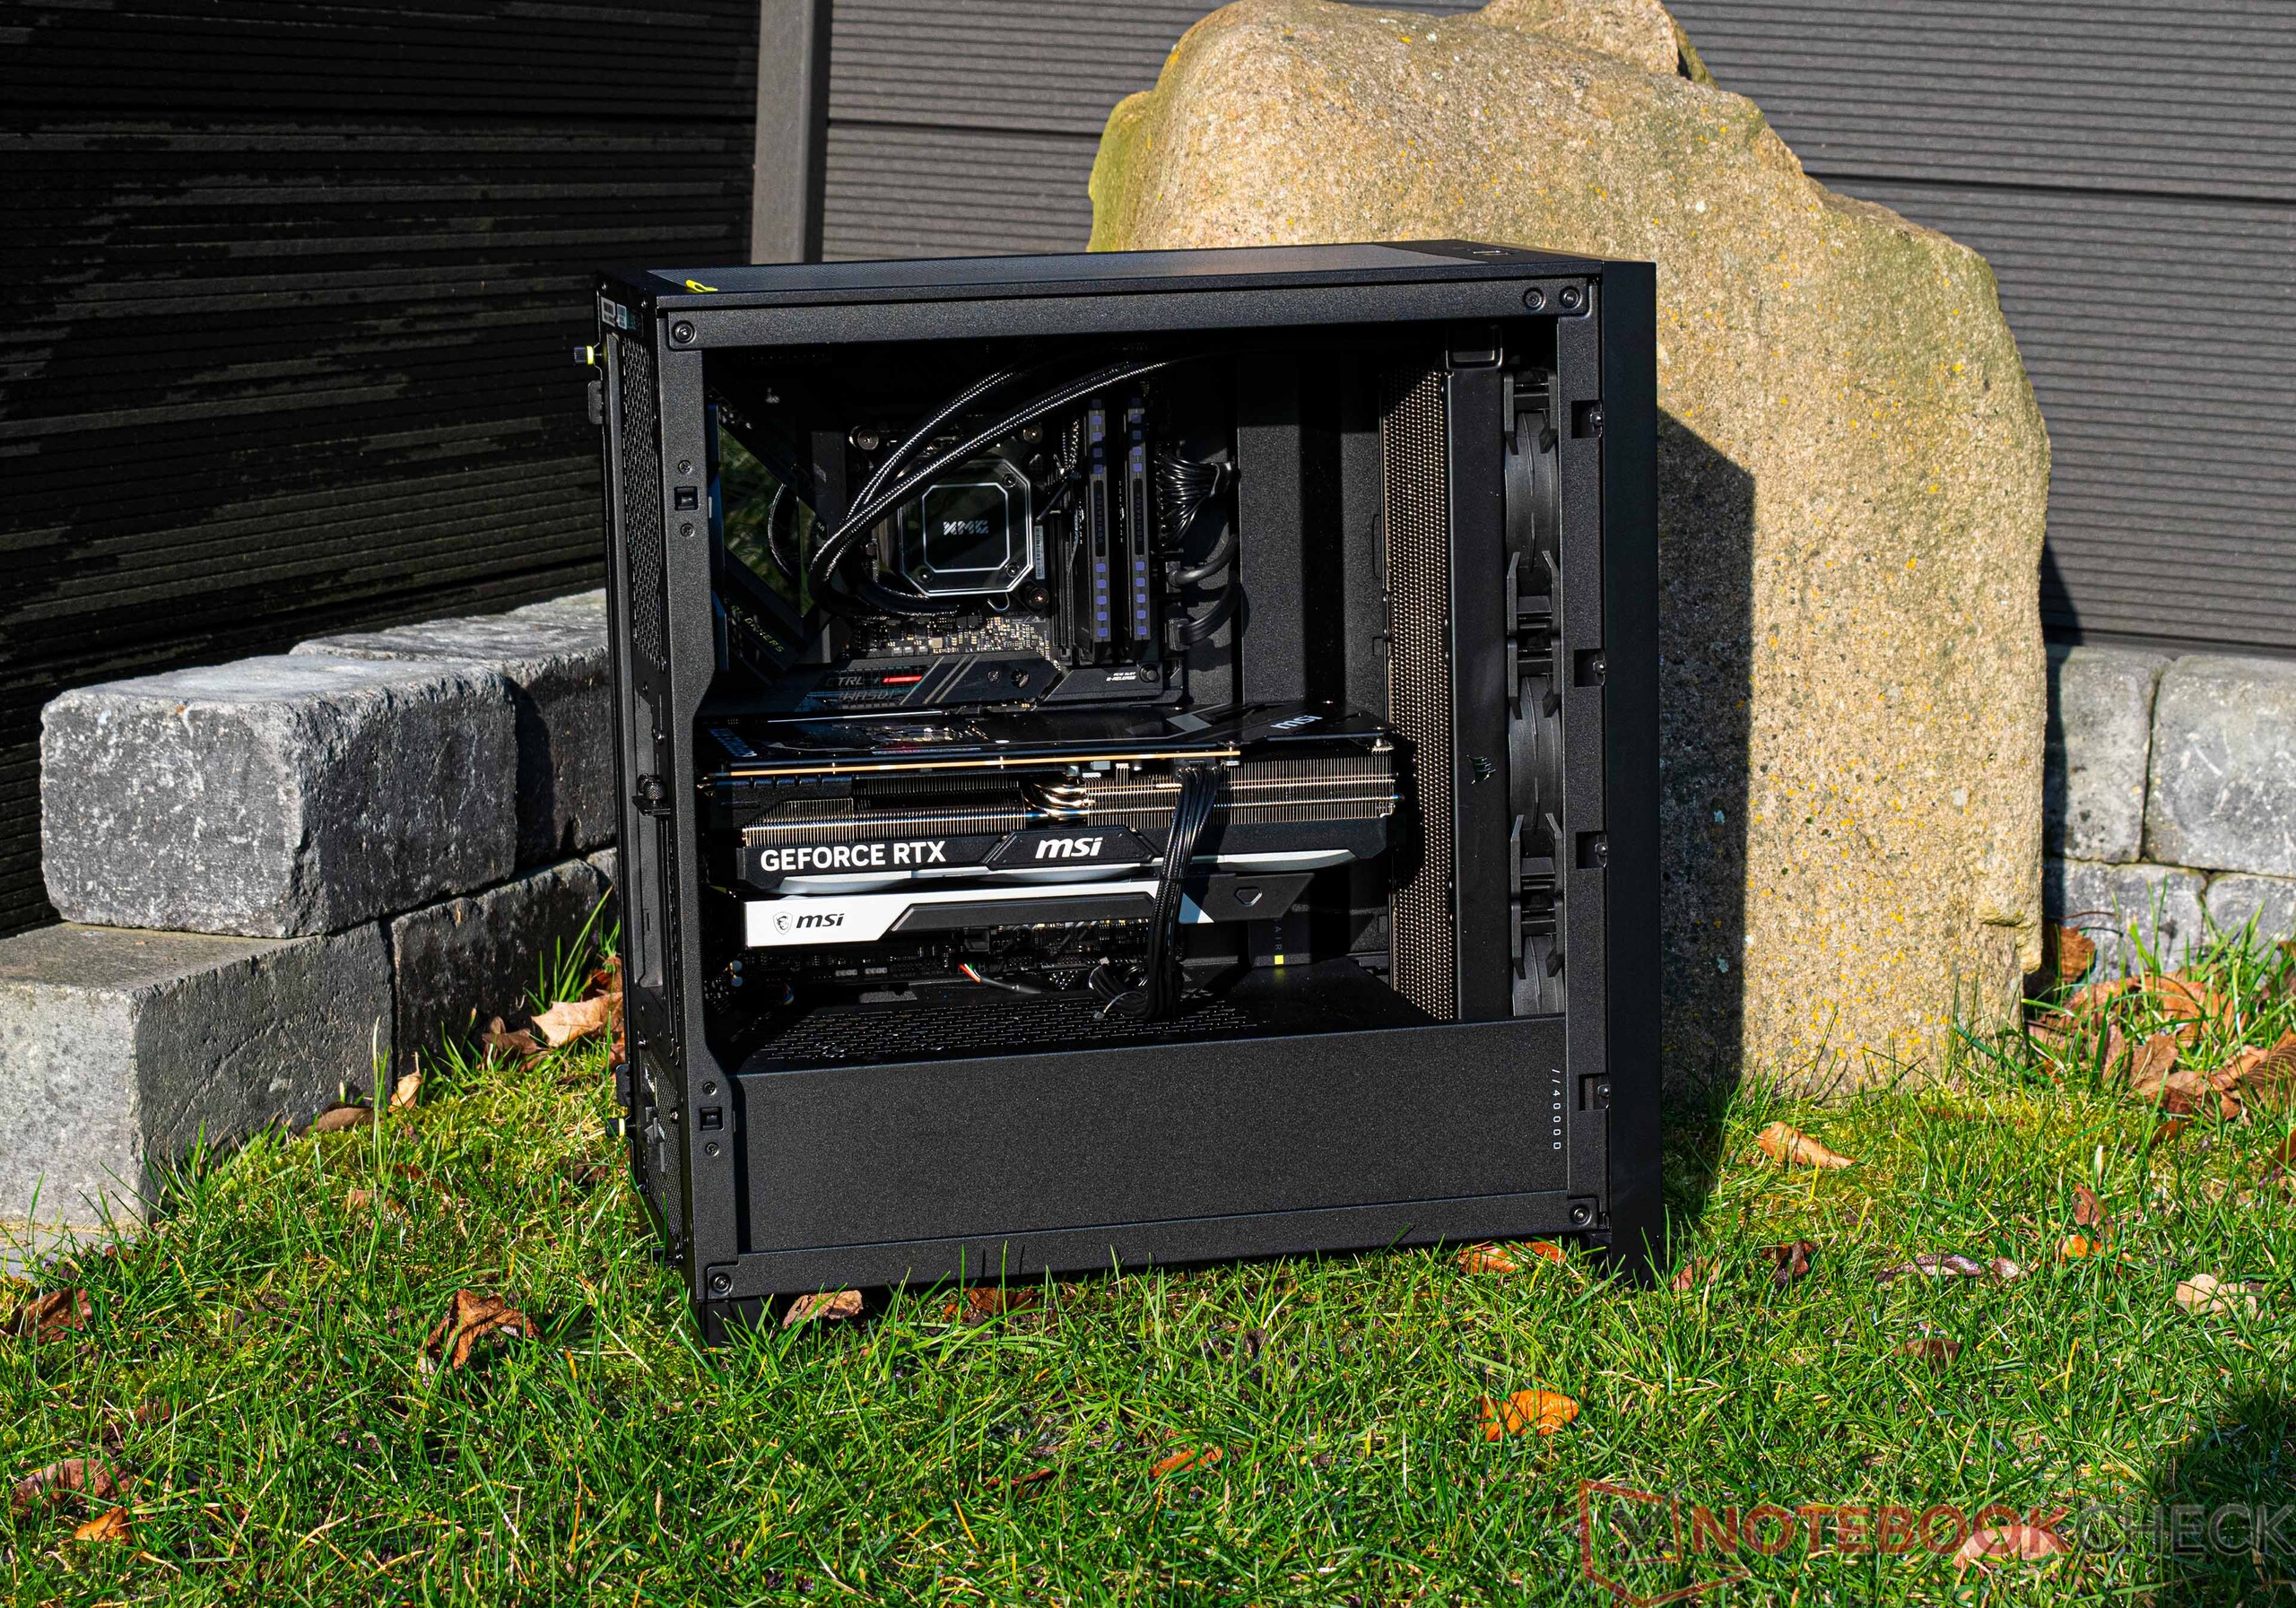
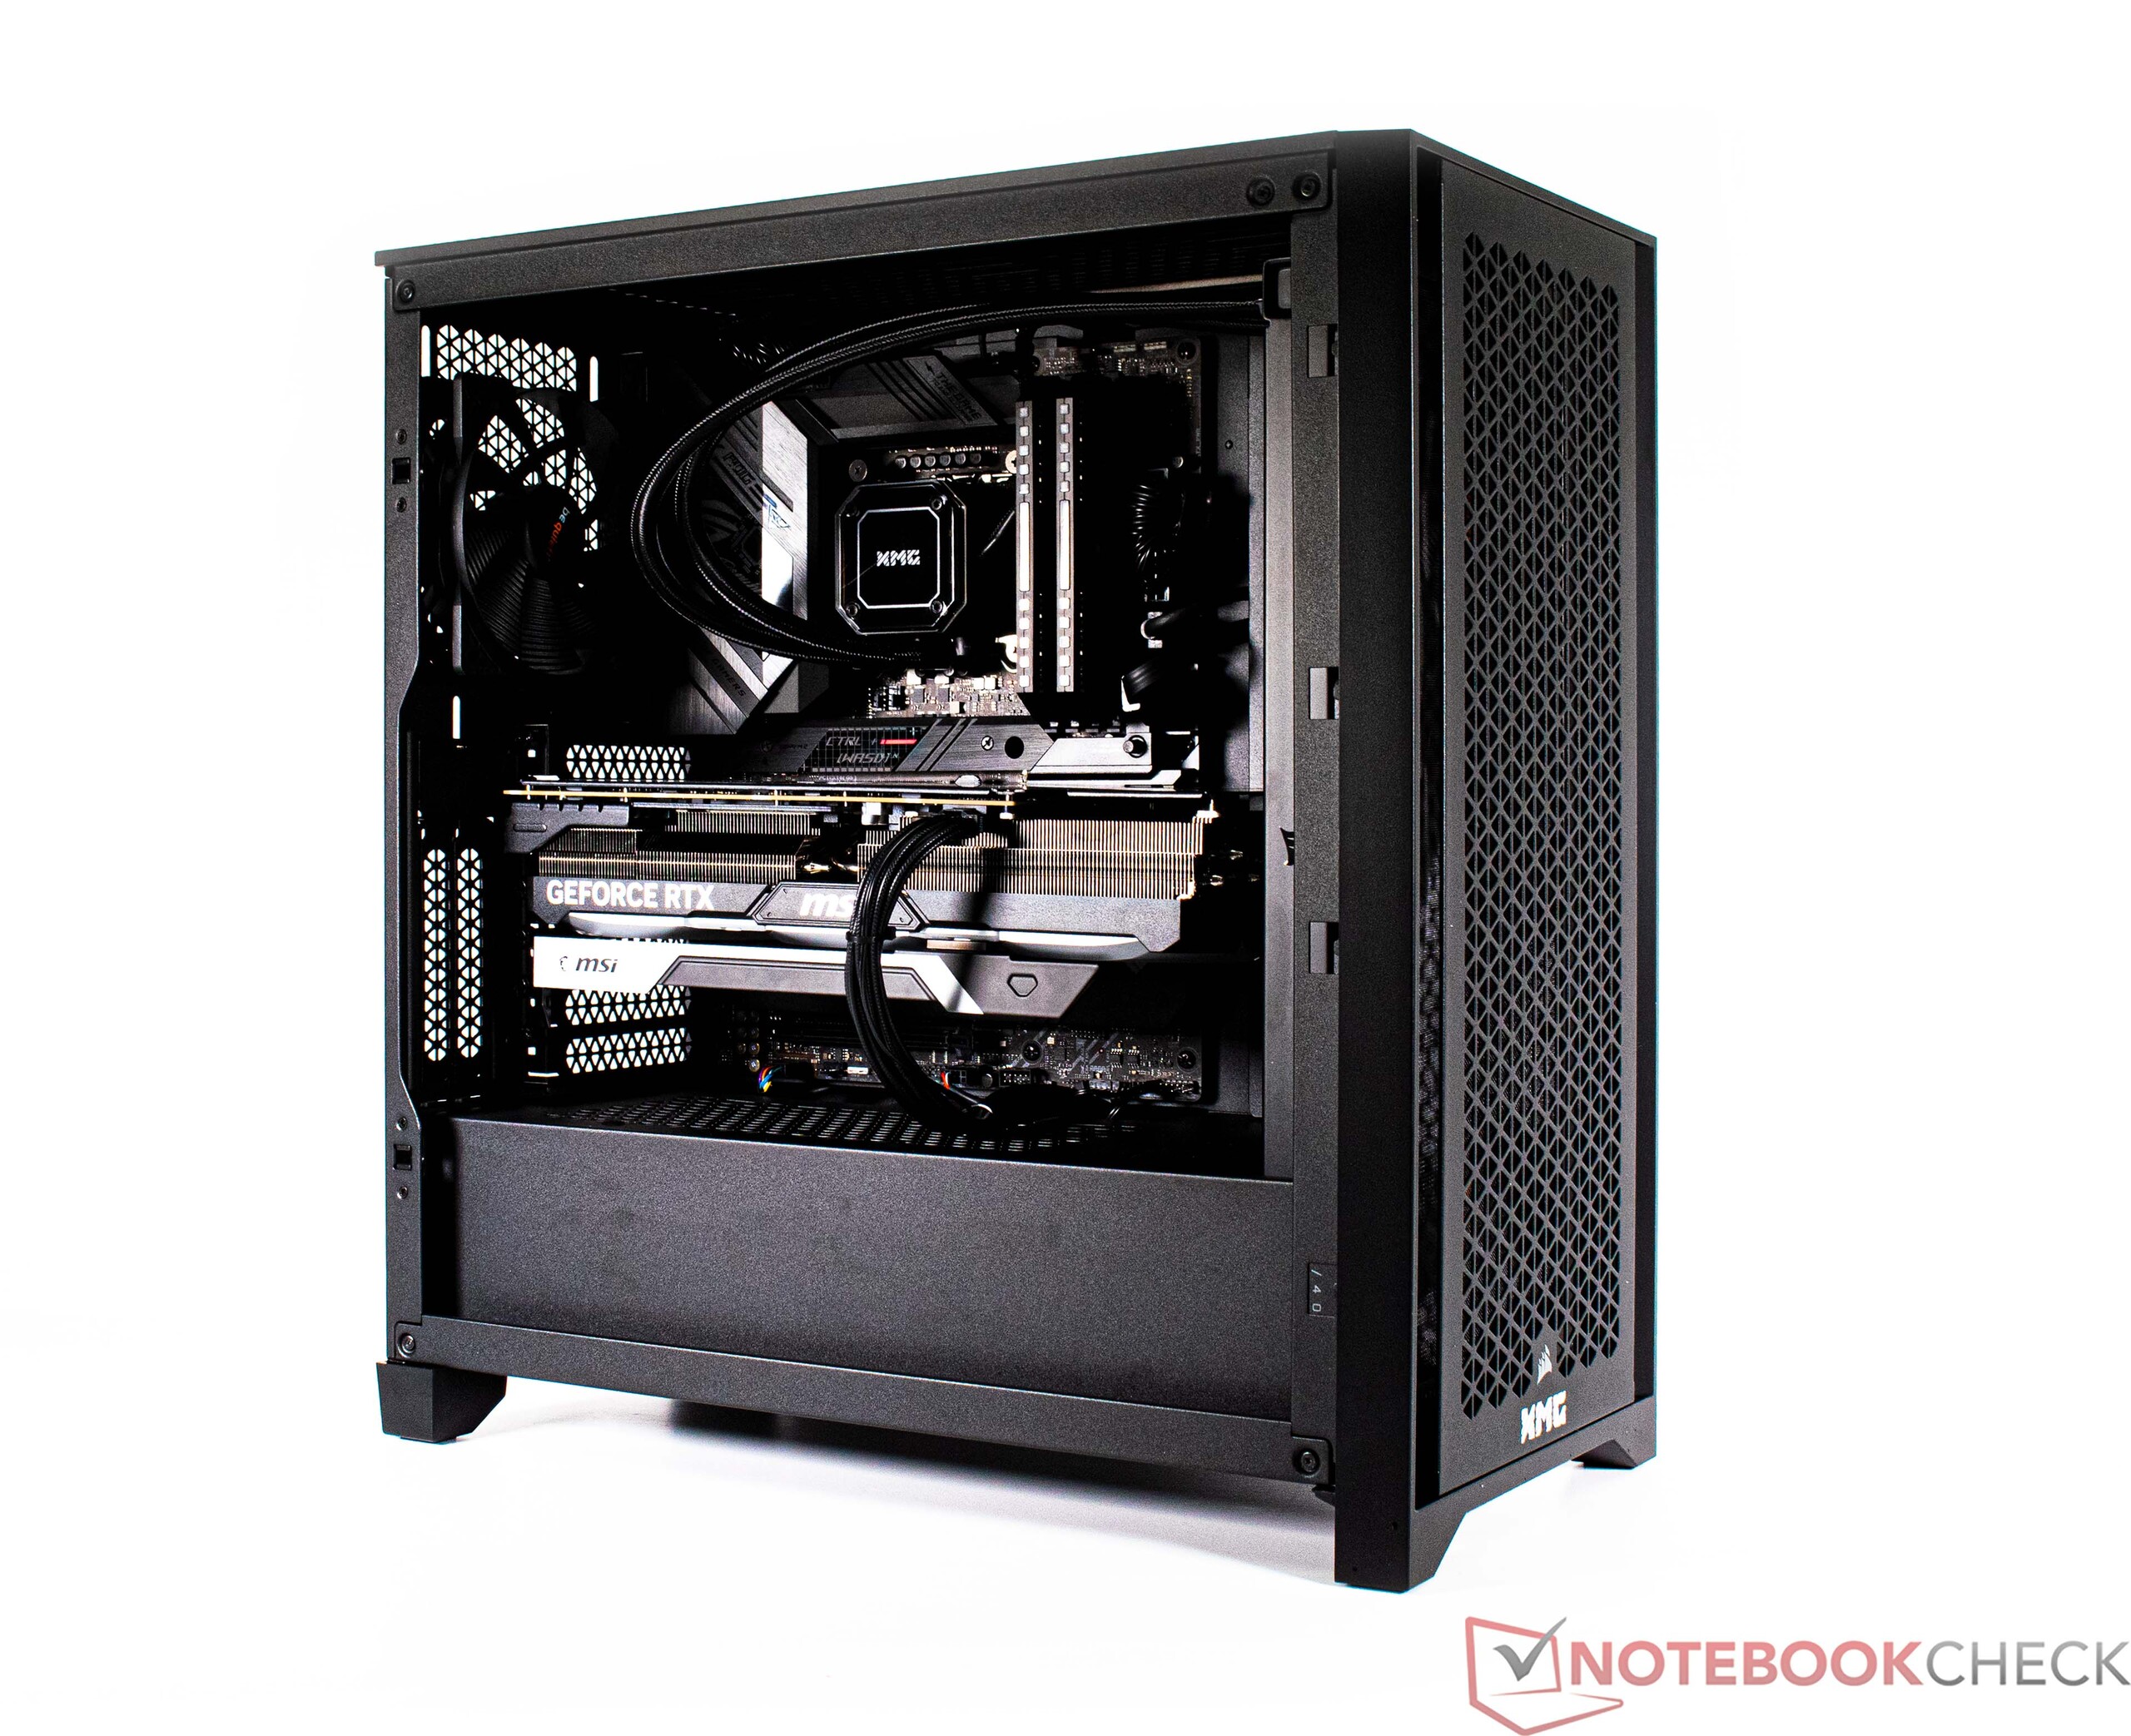
Väska - Corsair 4000D Airflow
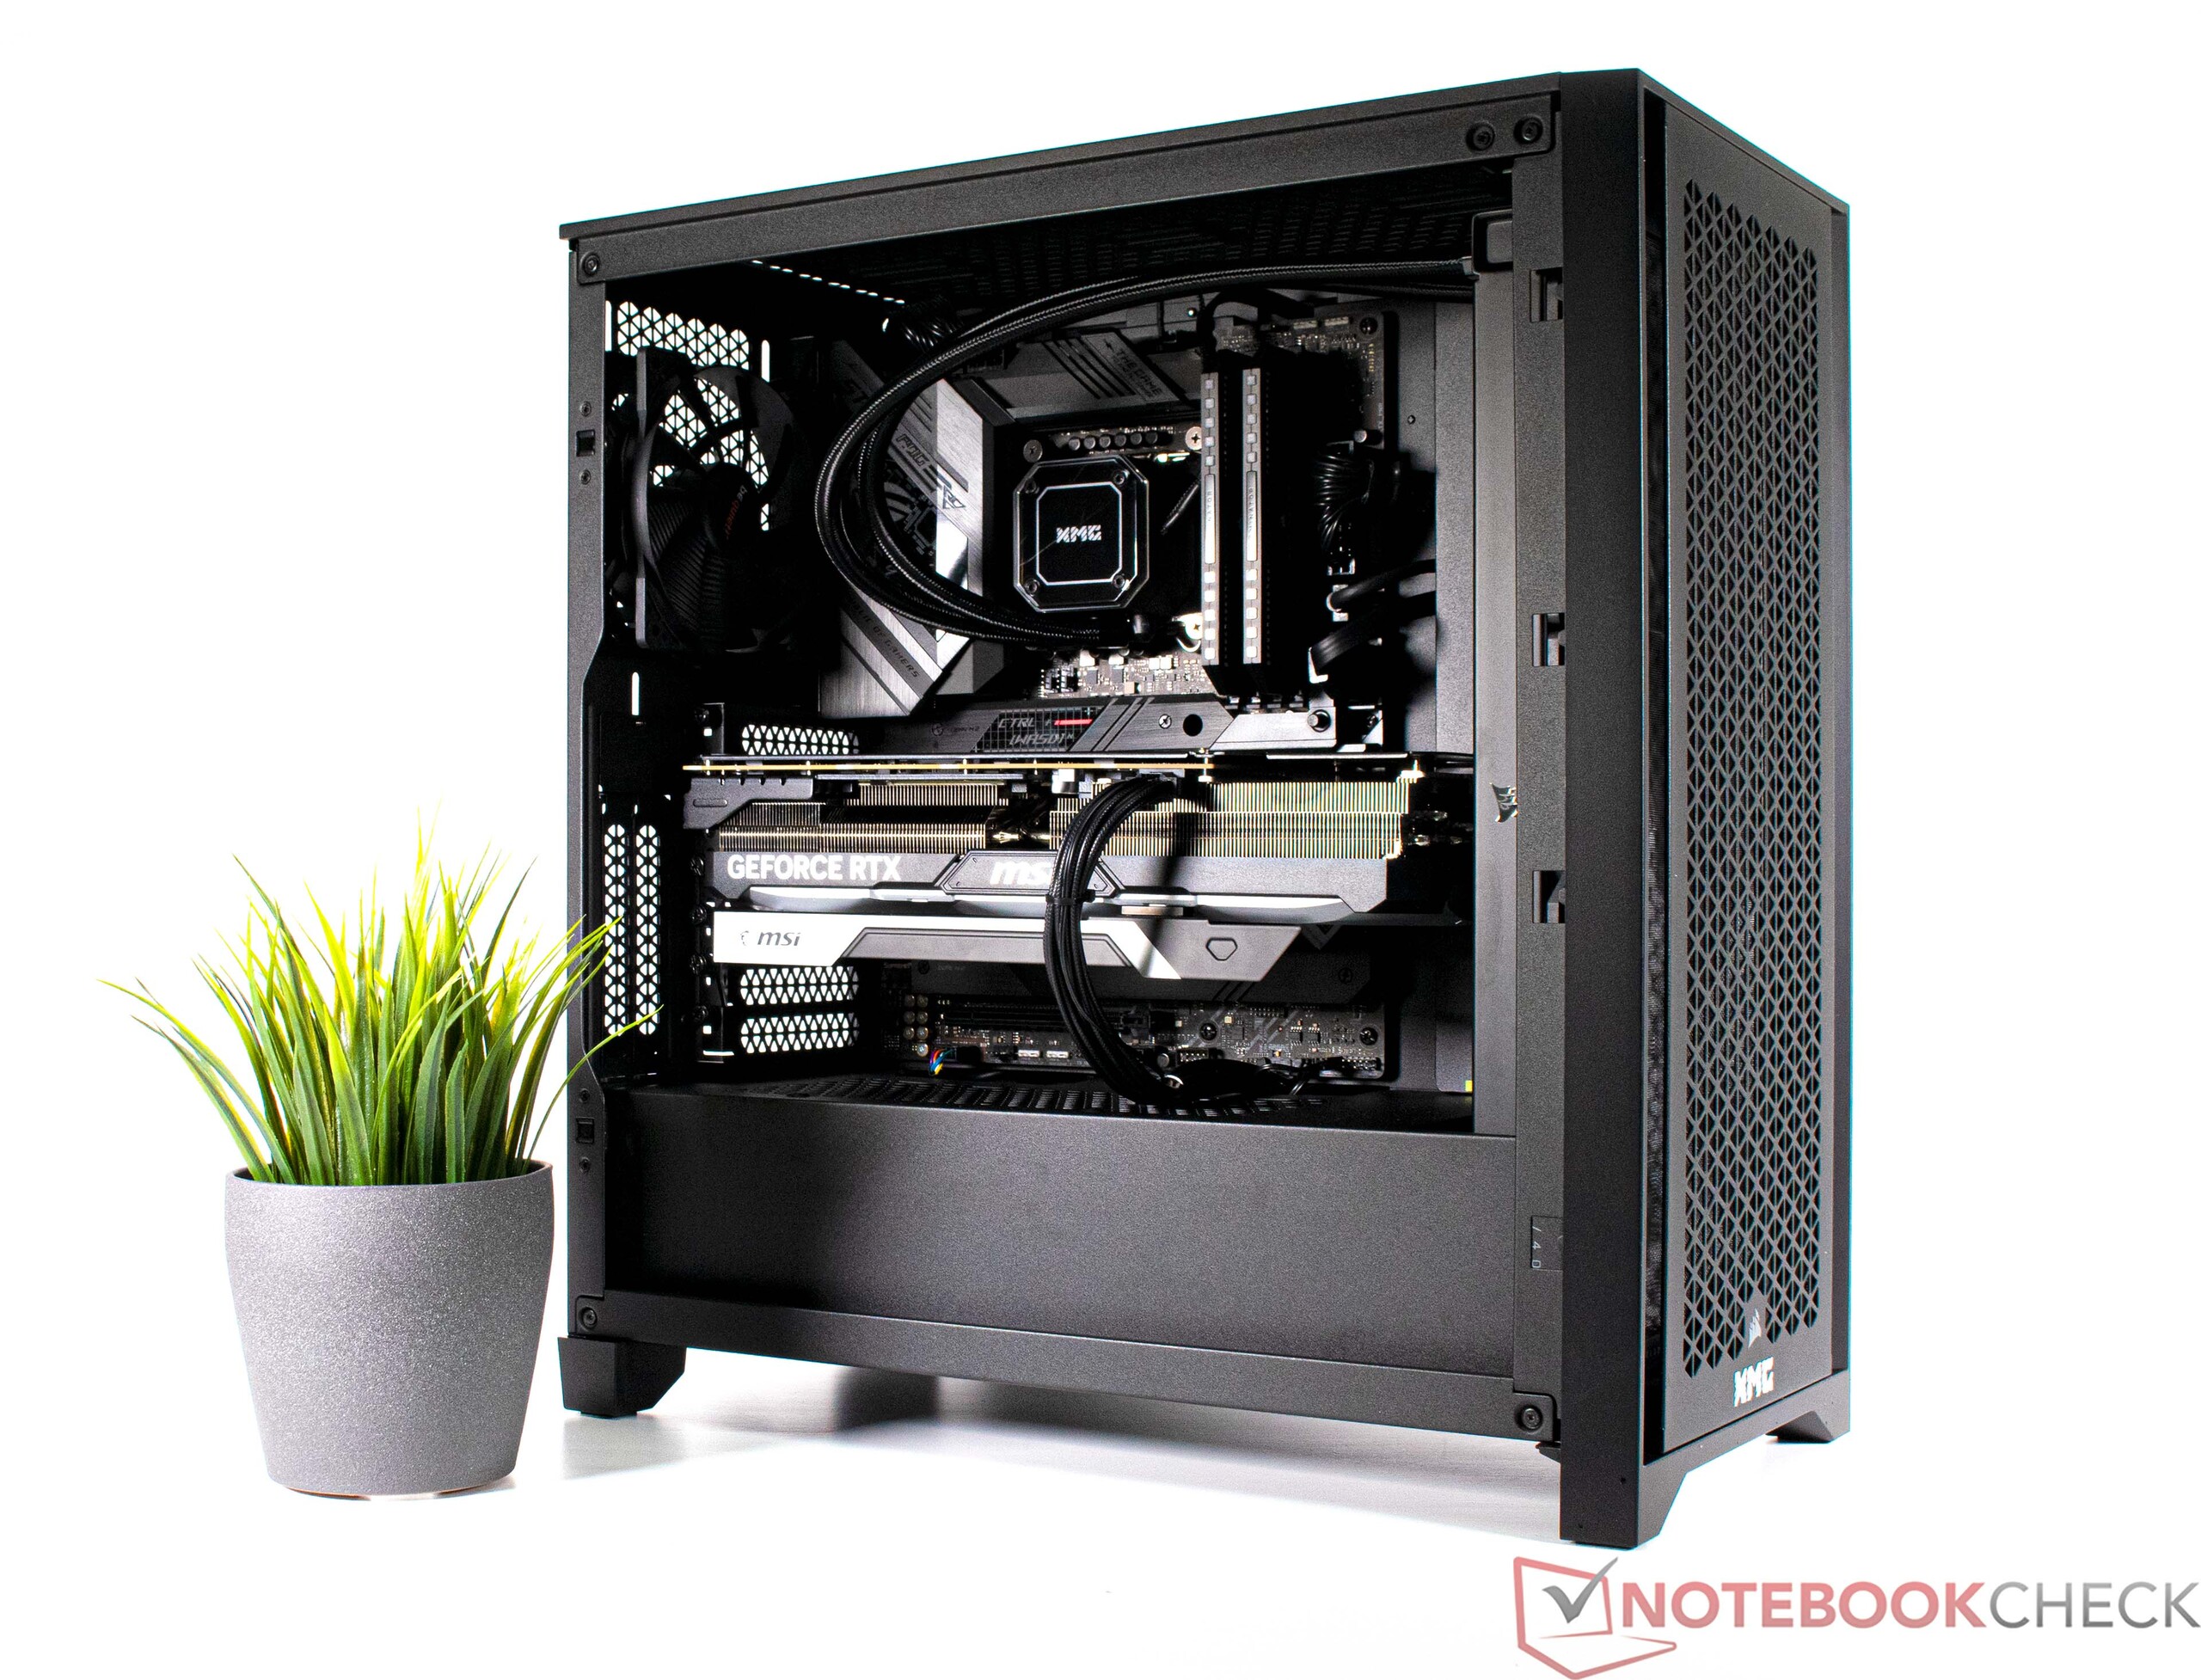
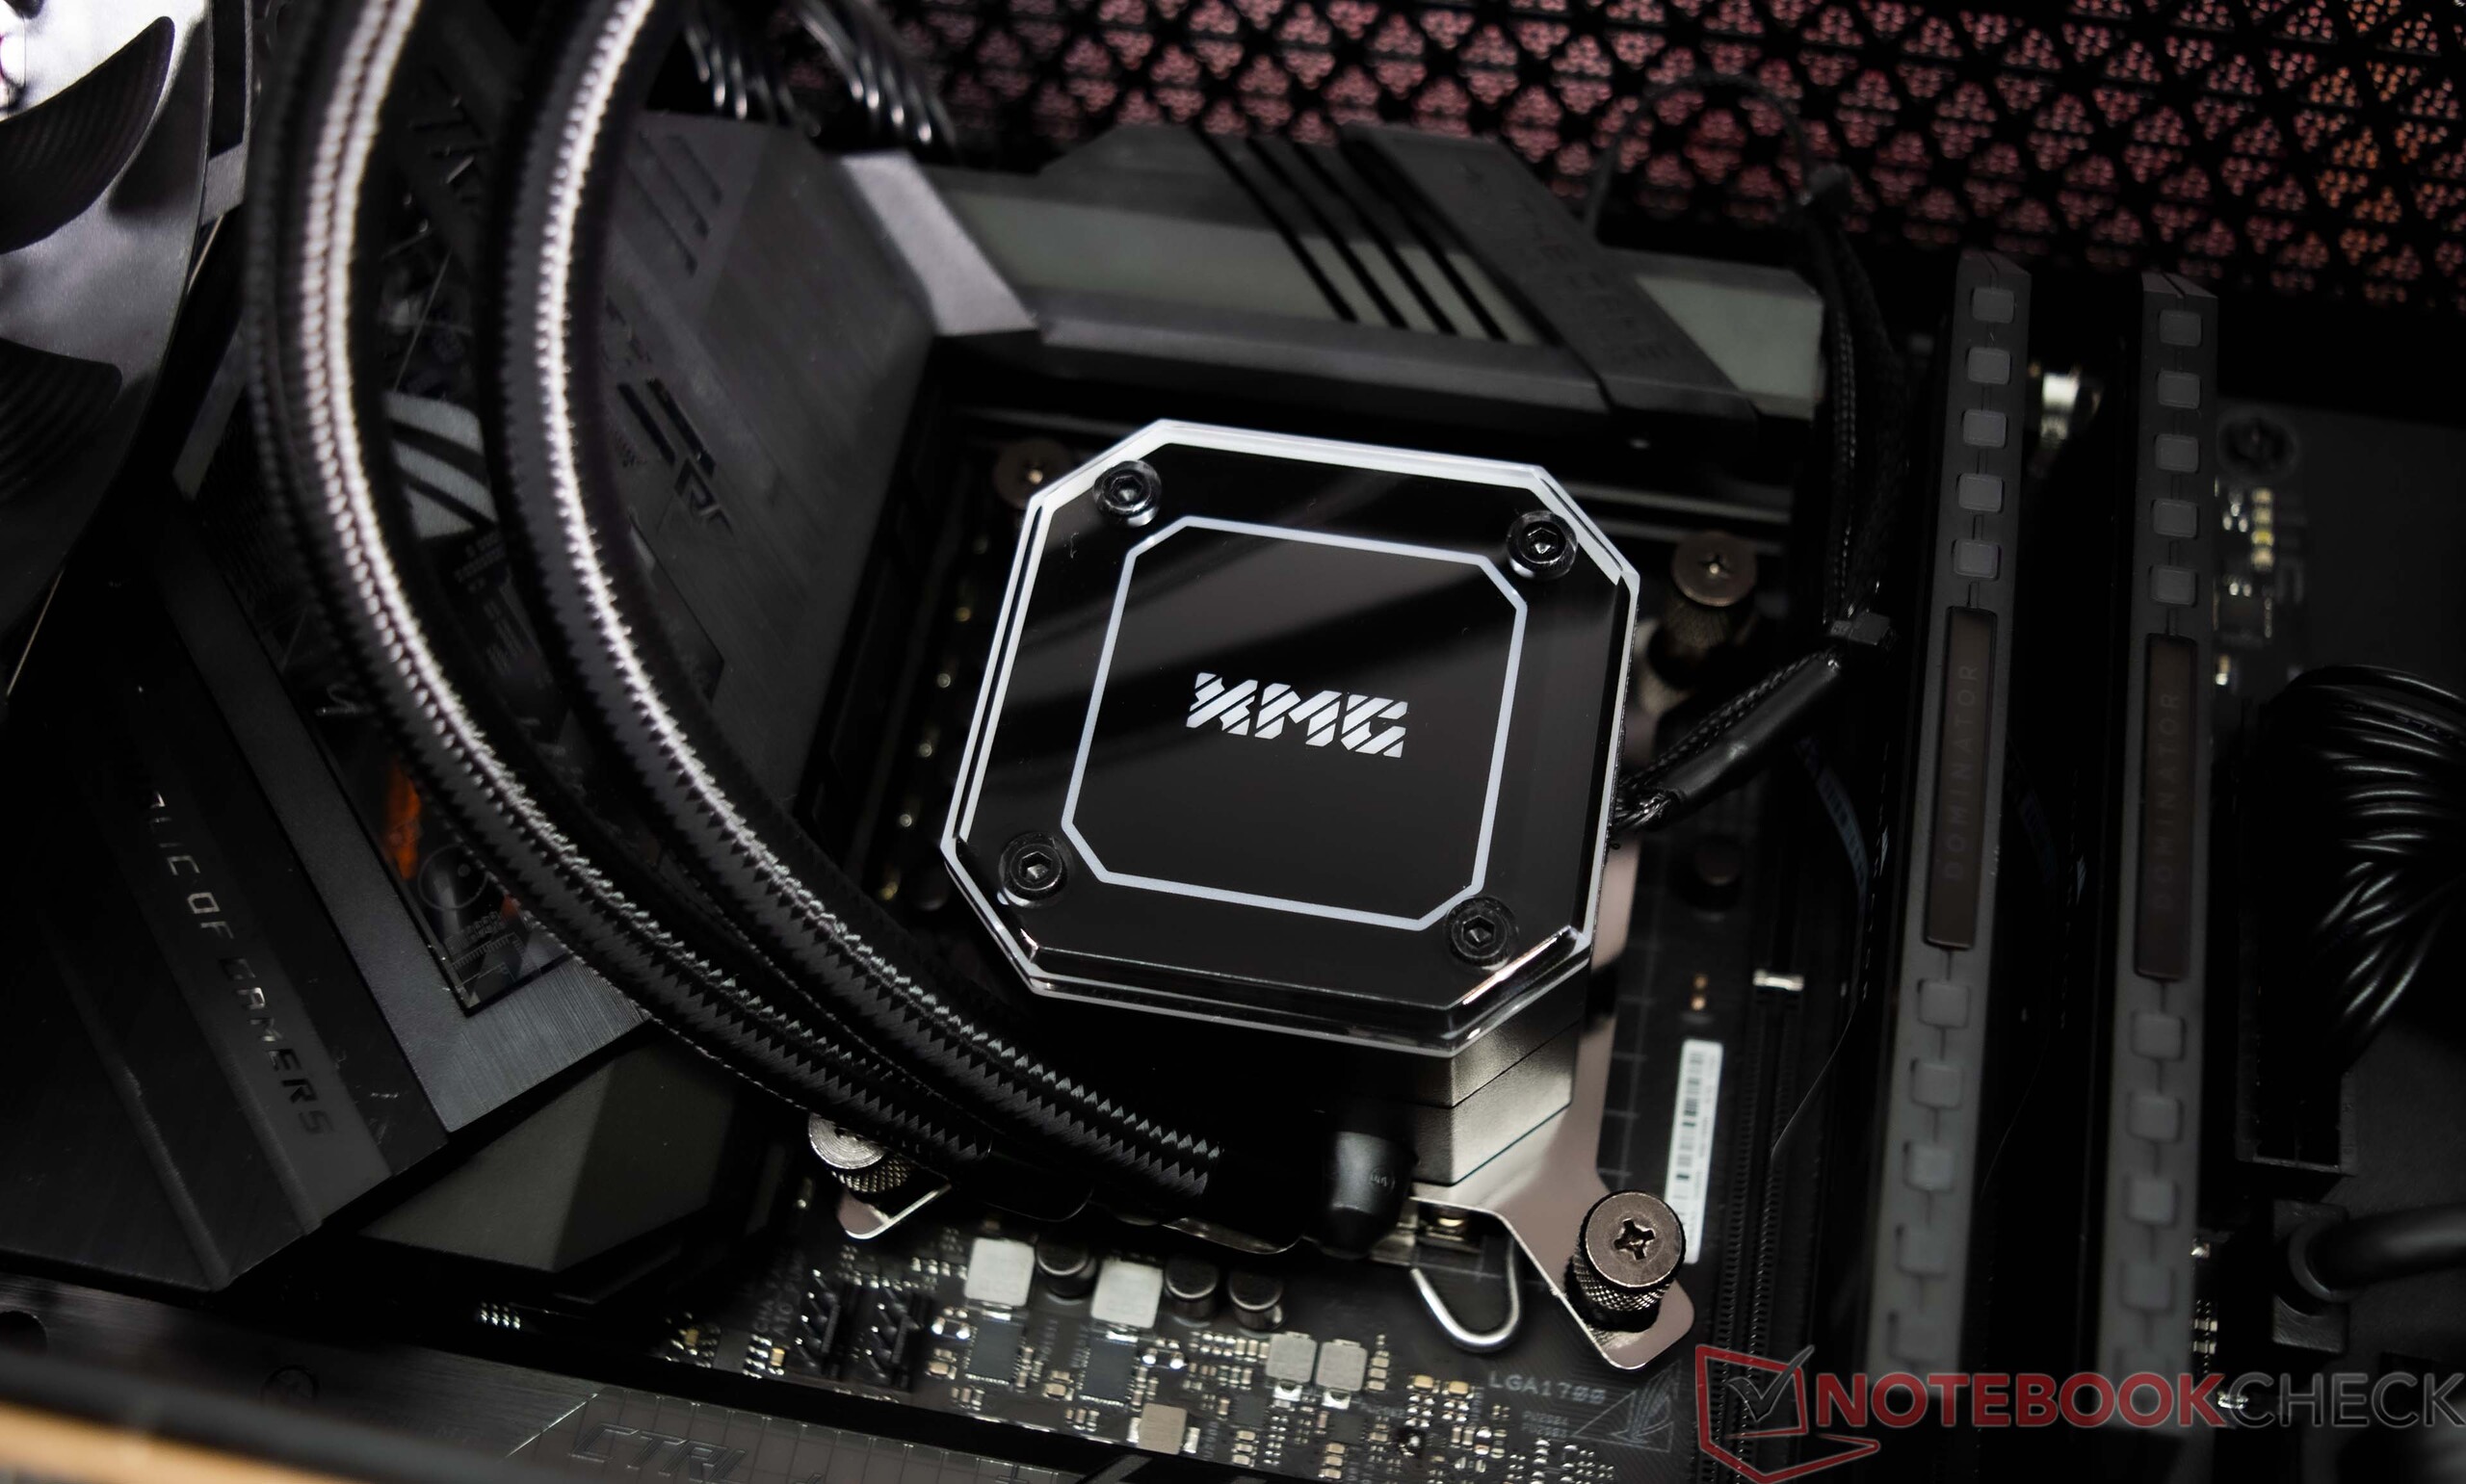
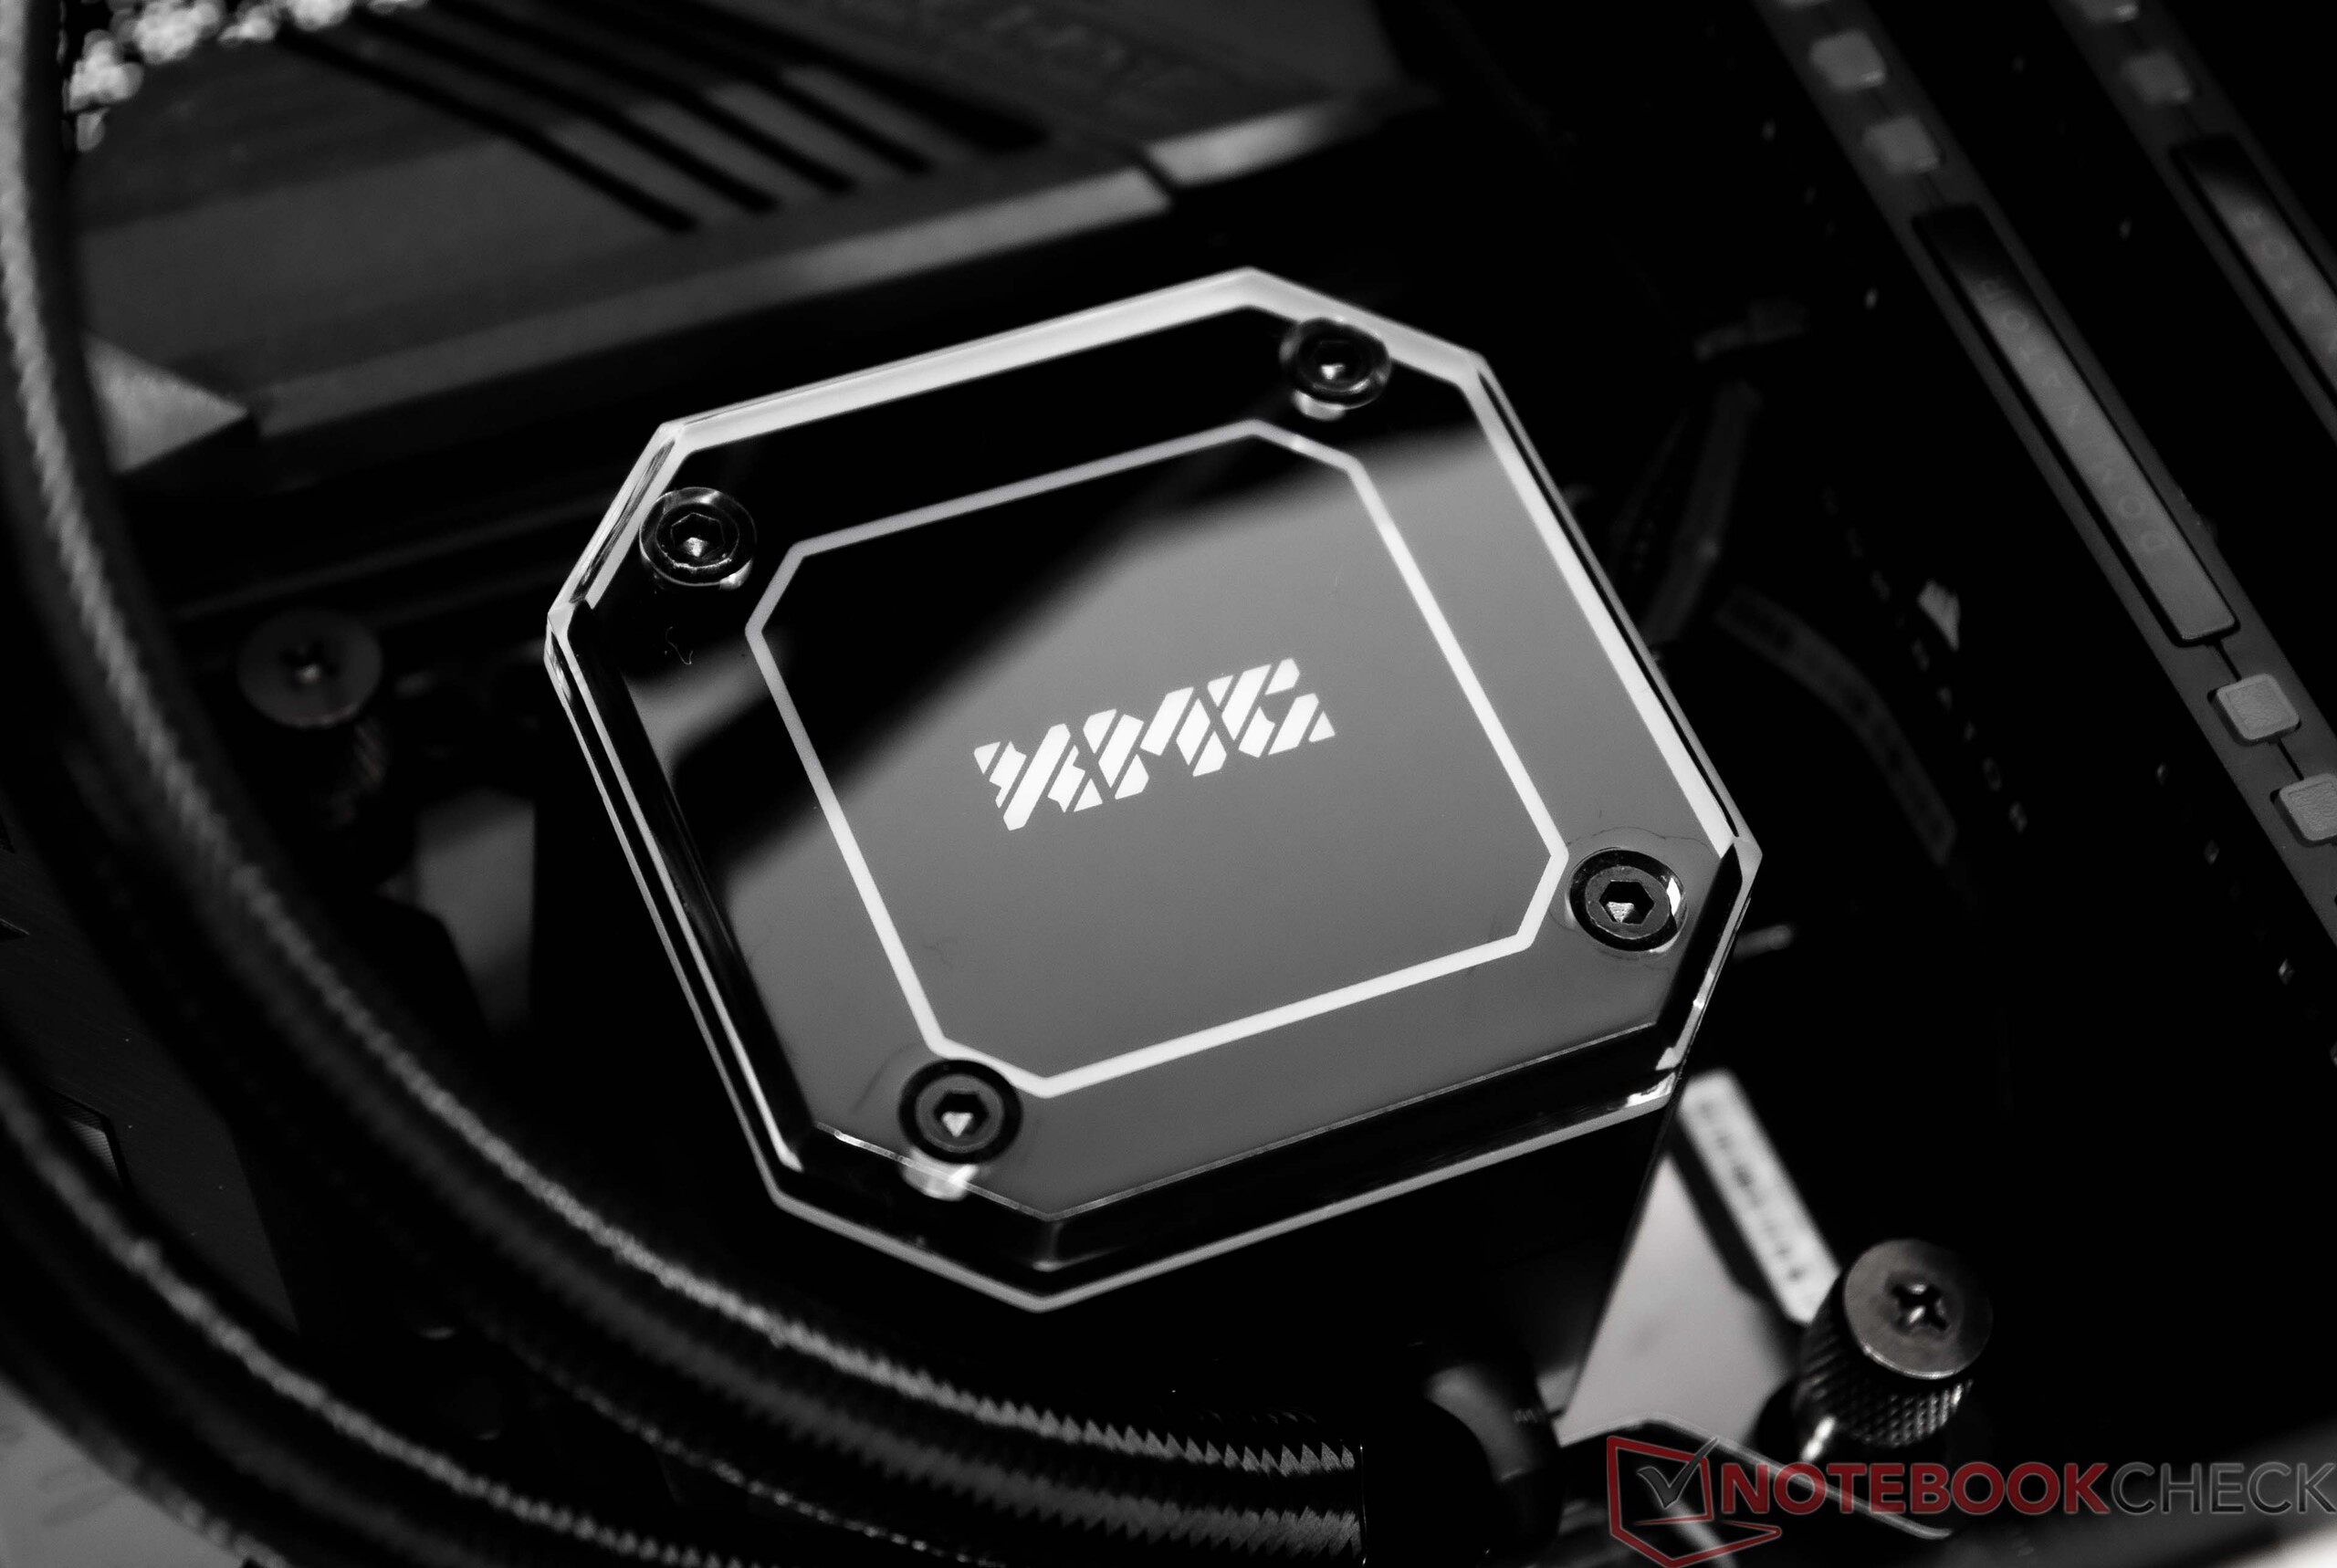
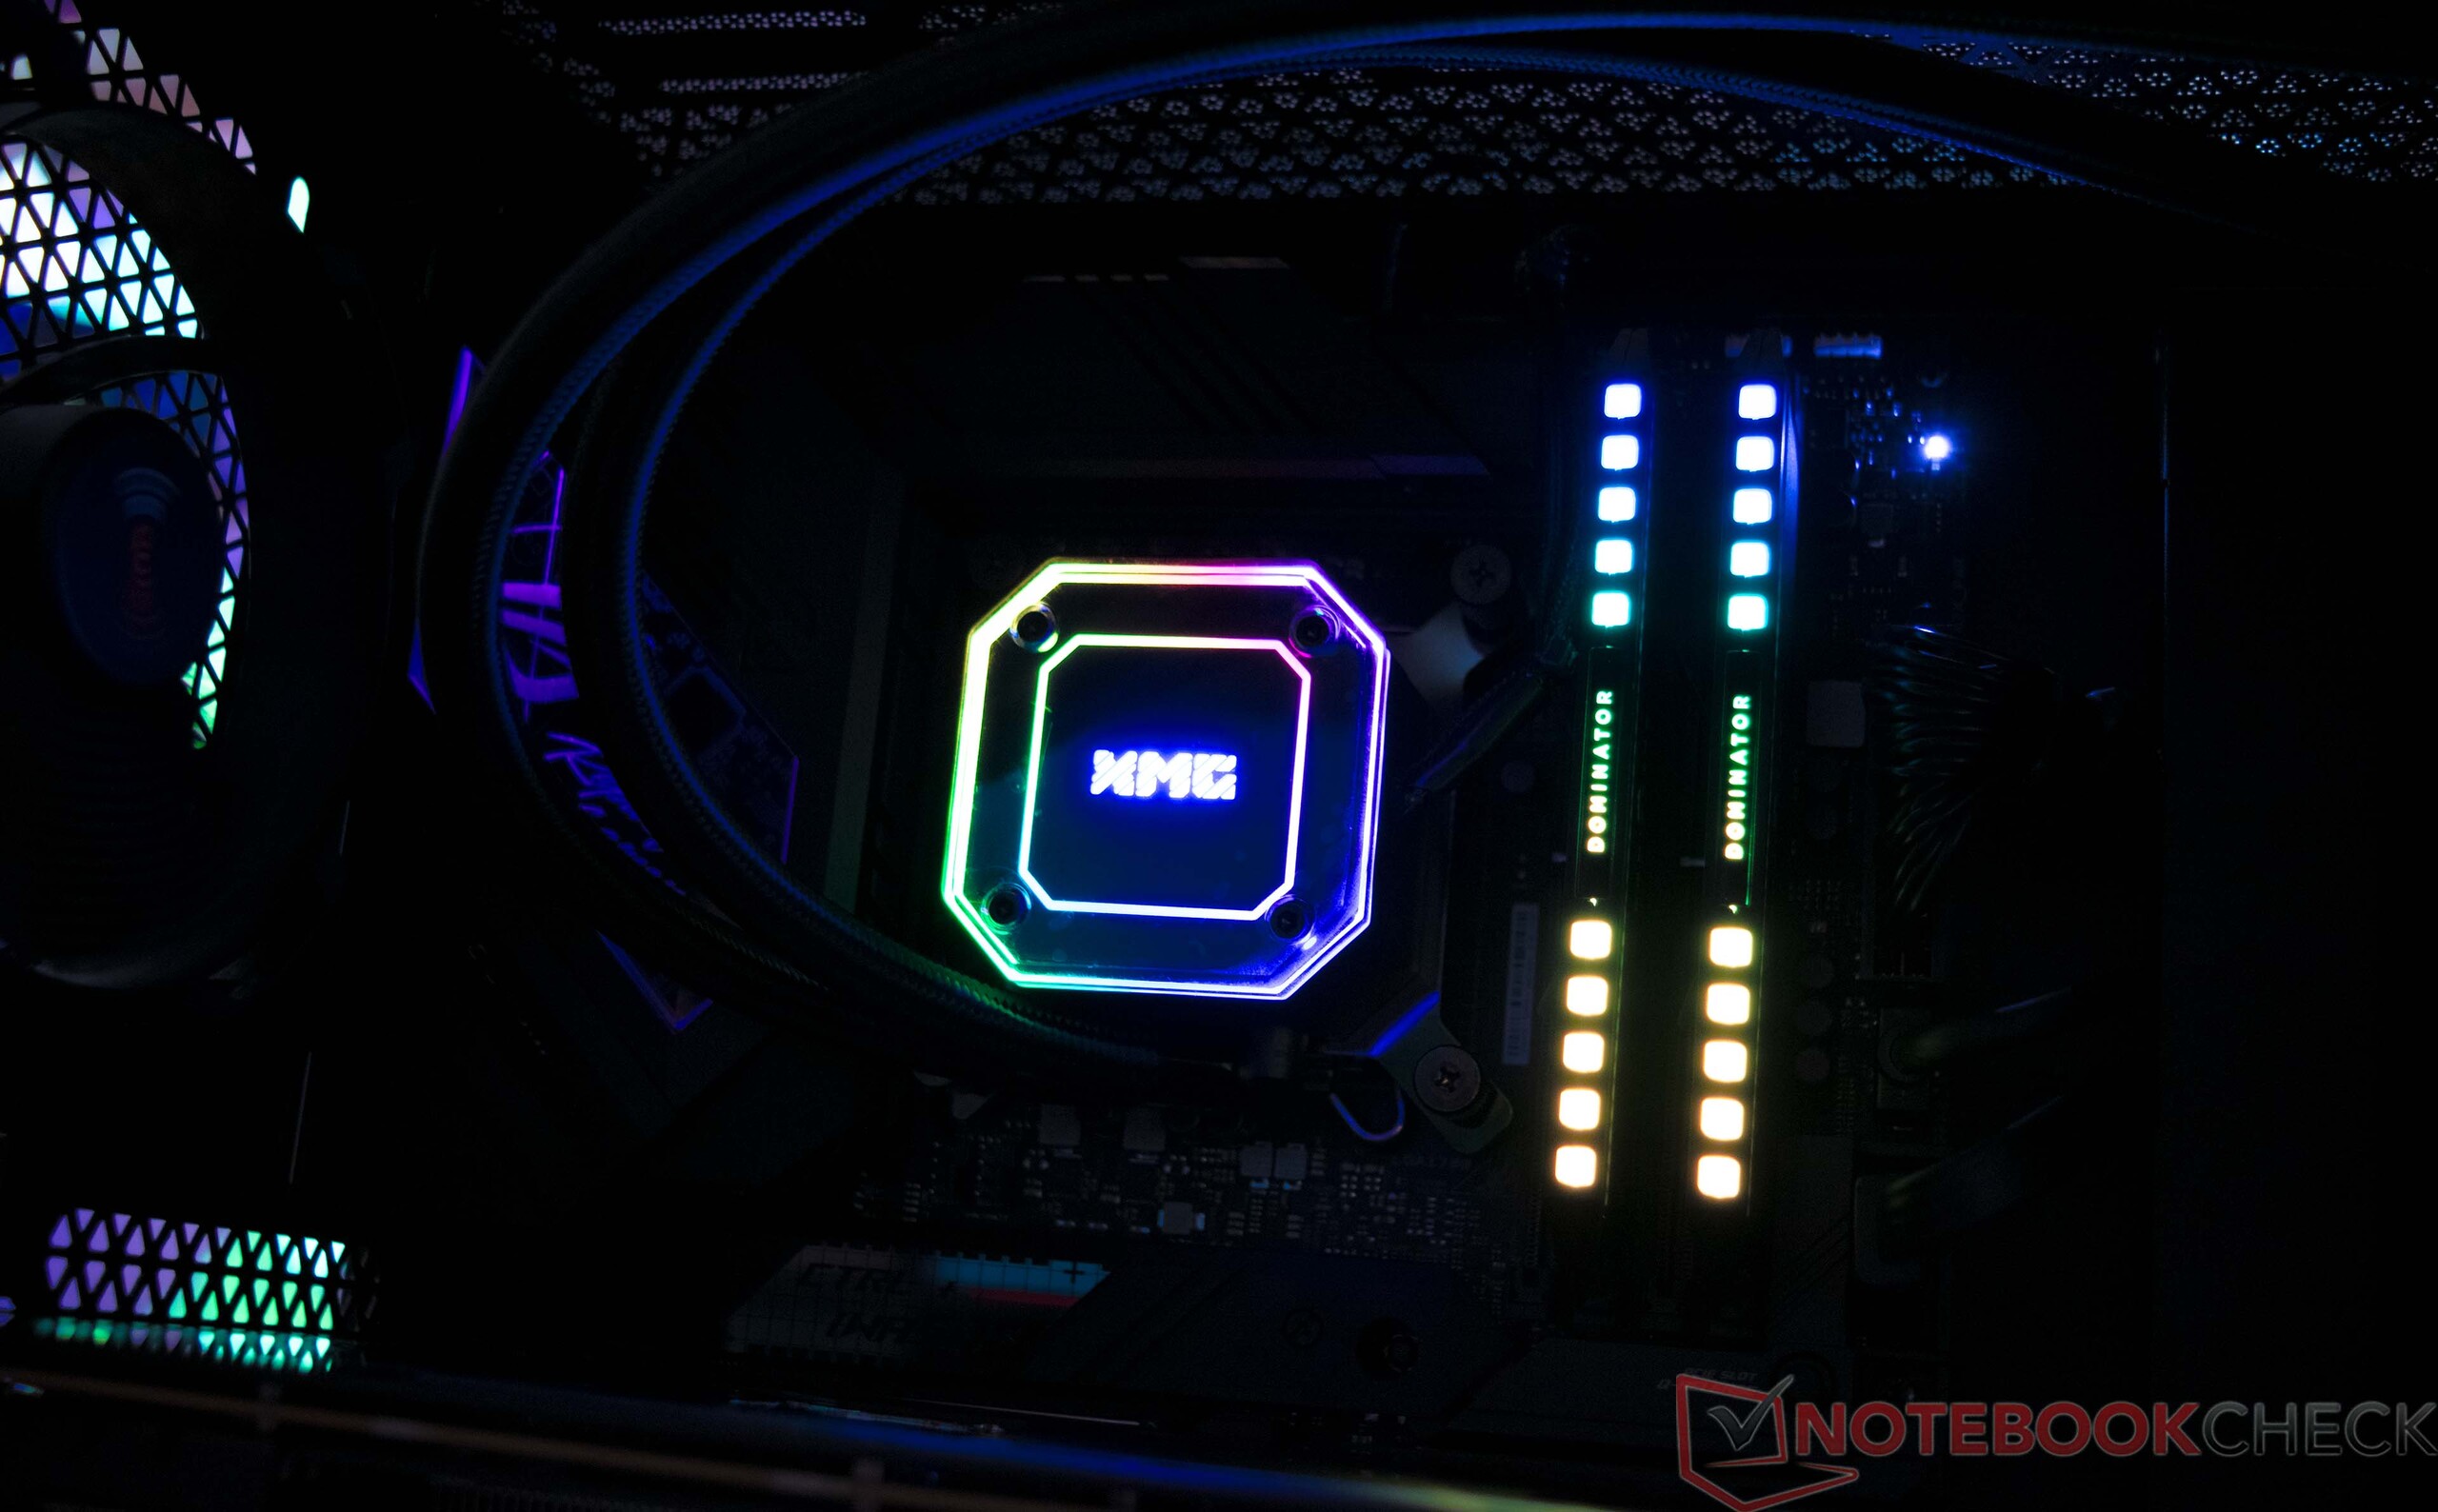
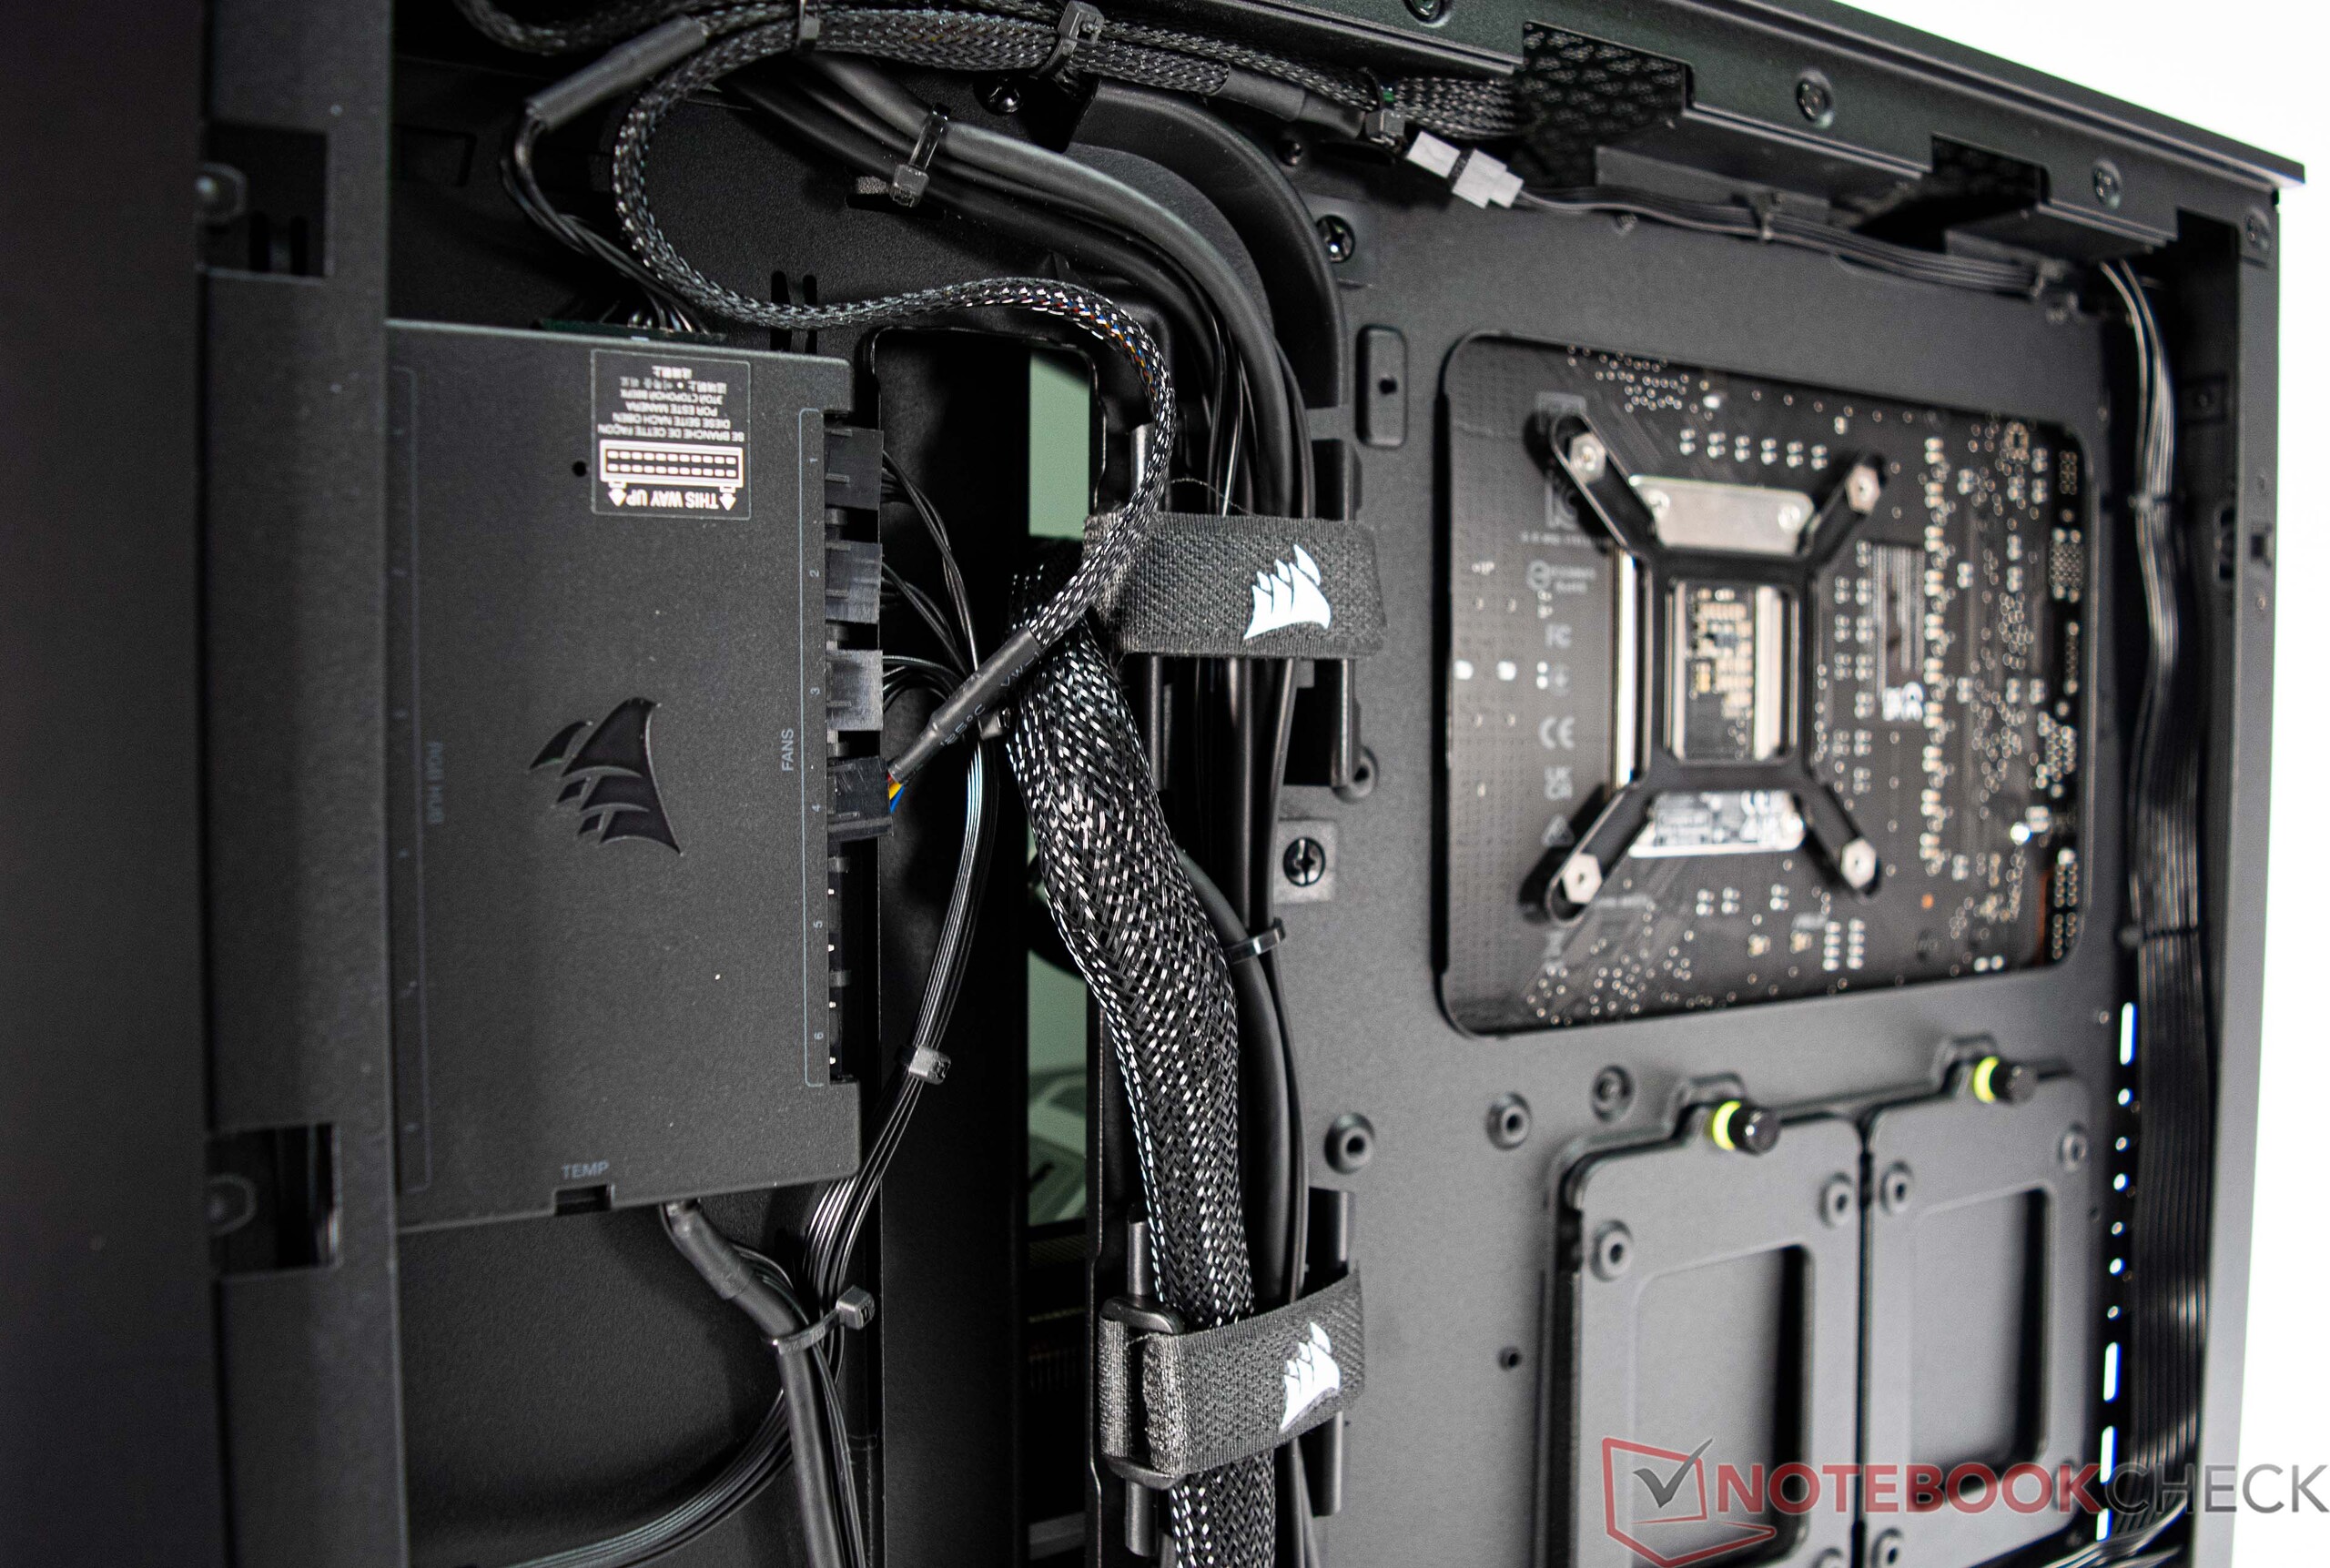
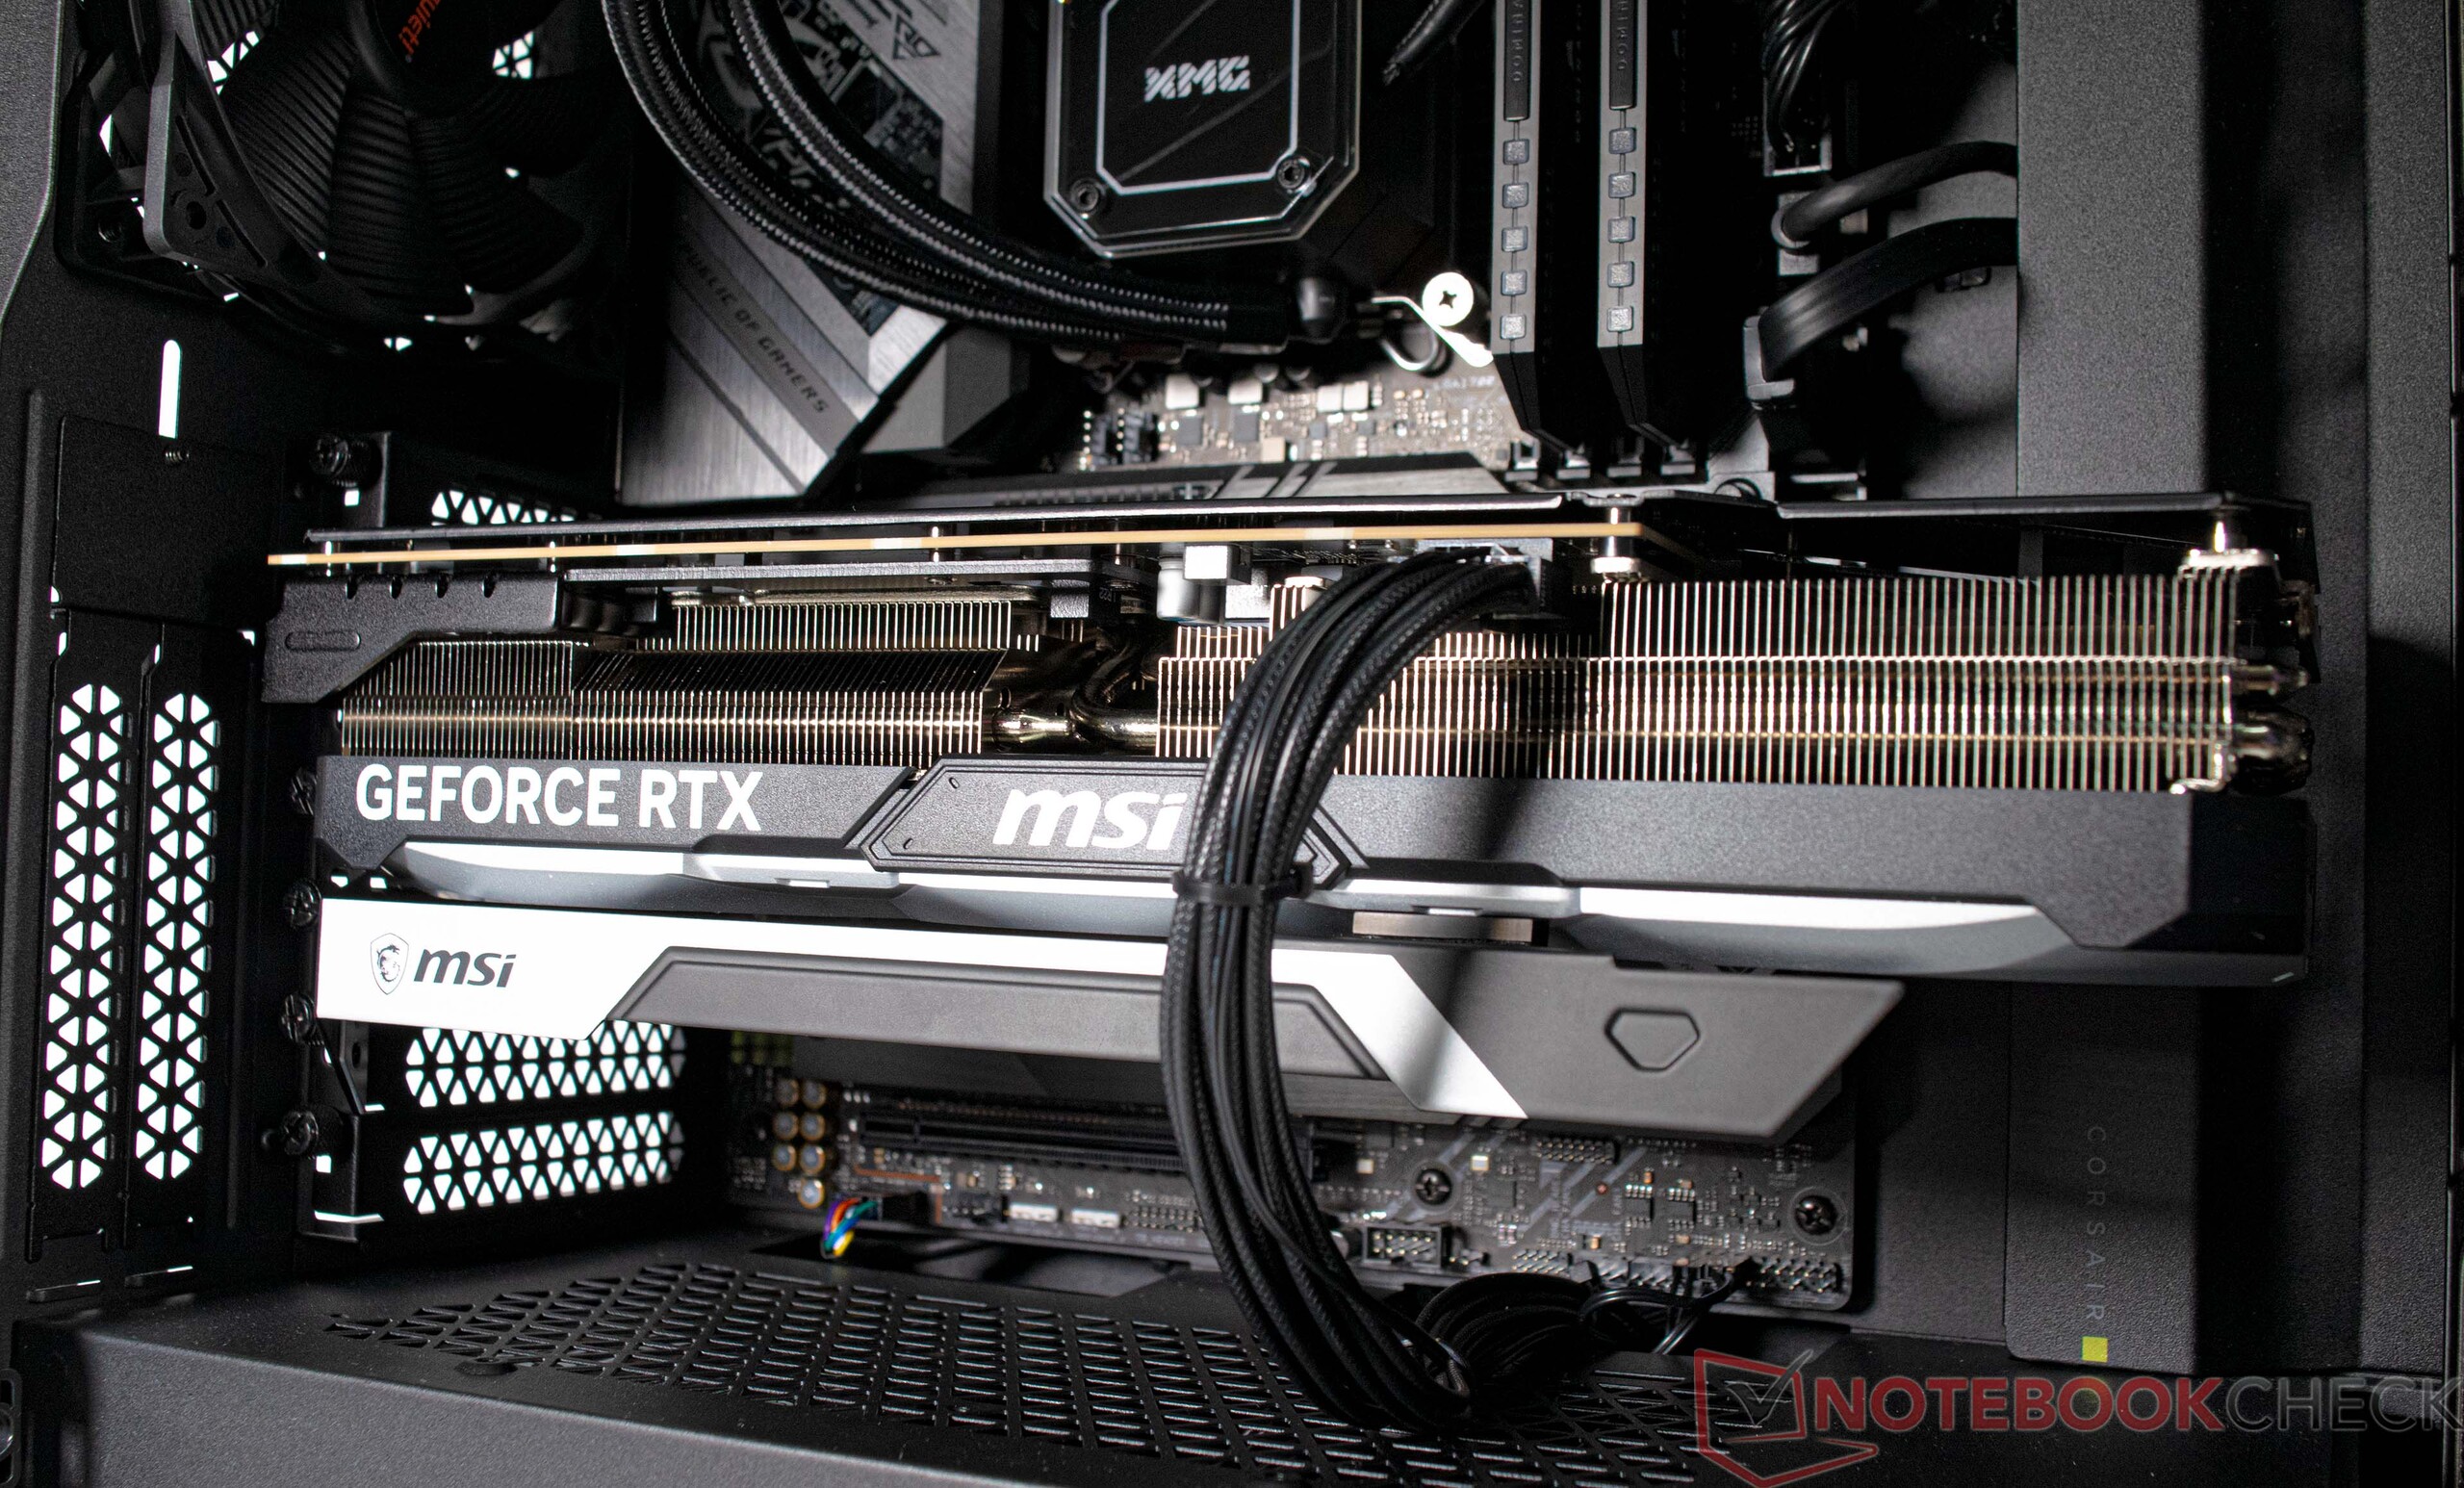
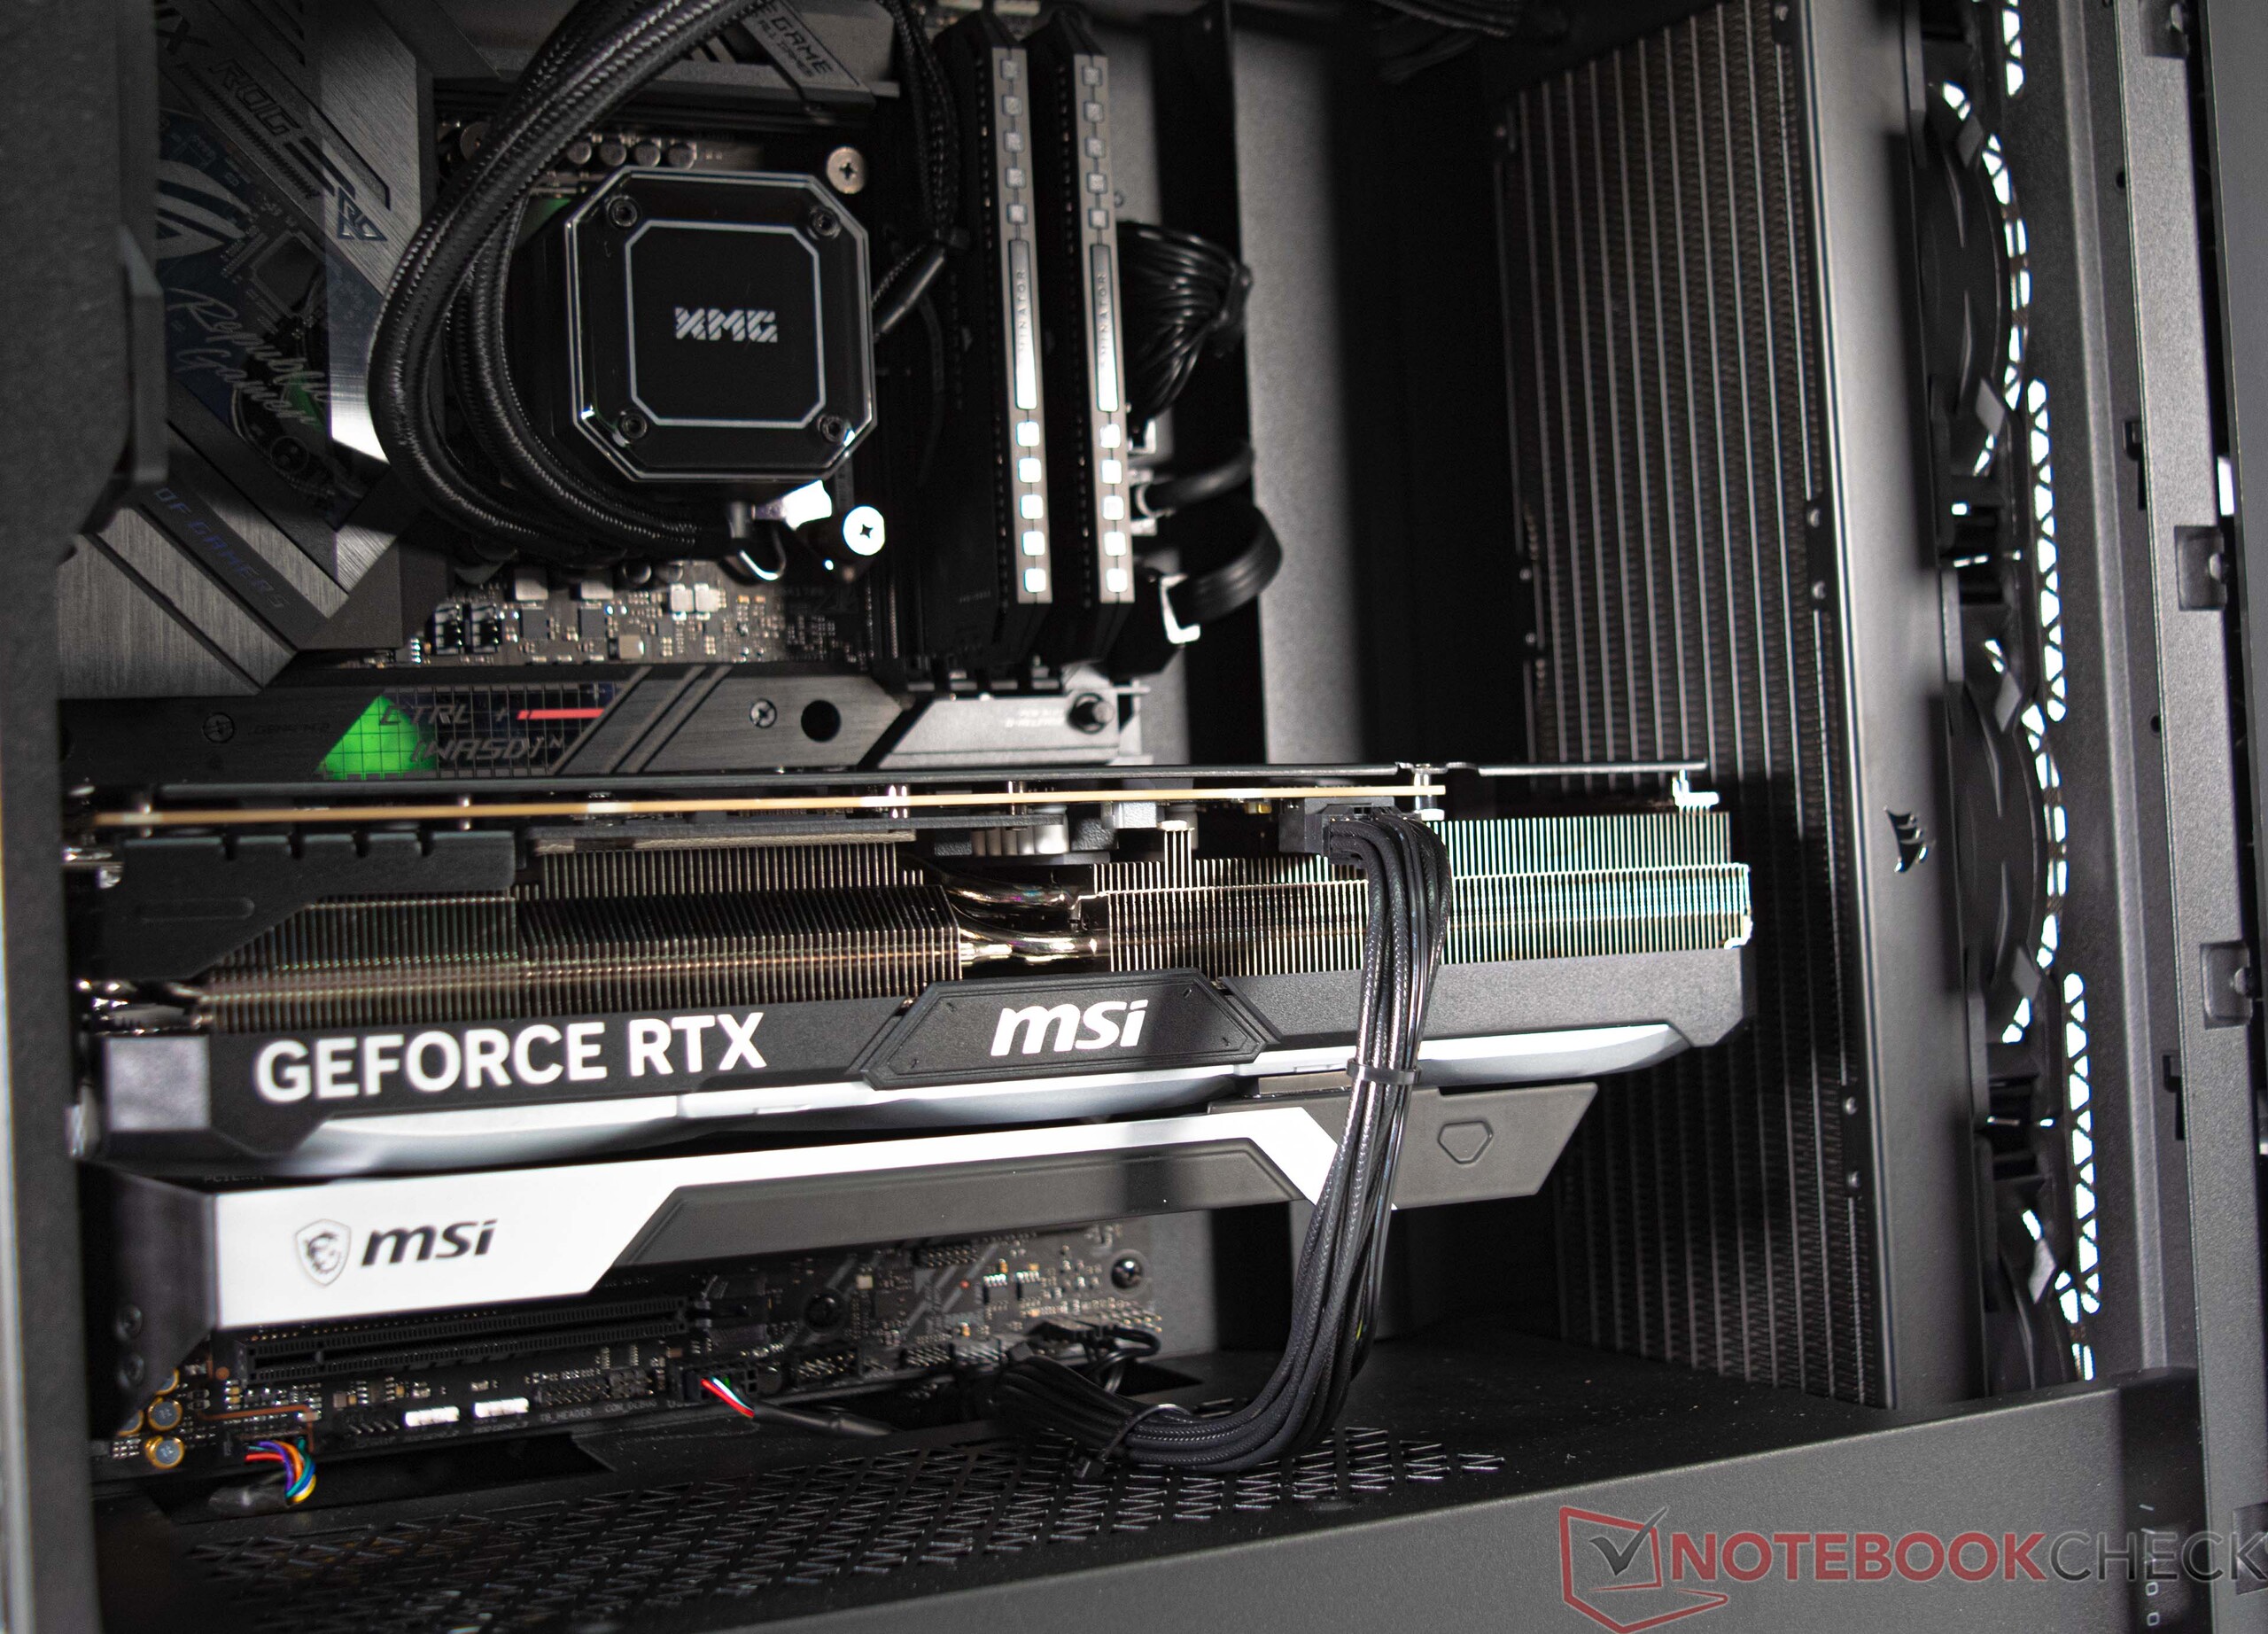
Schenker har installerat XMG SECTOR Intel-hårdvaran i en svart Corsair 4000D Airflow. Fallet har ett fönster av mörkt glas för att visa upp komponenterna inuti med ljuseffekter. Den medföljande AIO-kylaren och Corsair Dominator RGB-minnesmoduler är dock de enda källorna till belysning i vår granskningskonfiguration.
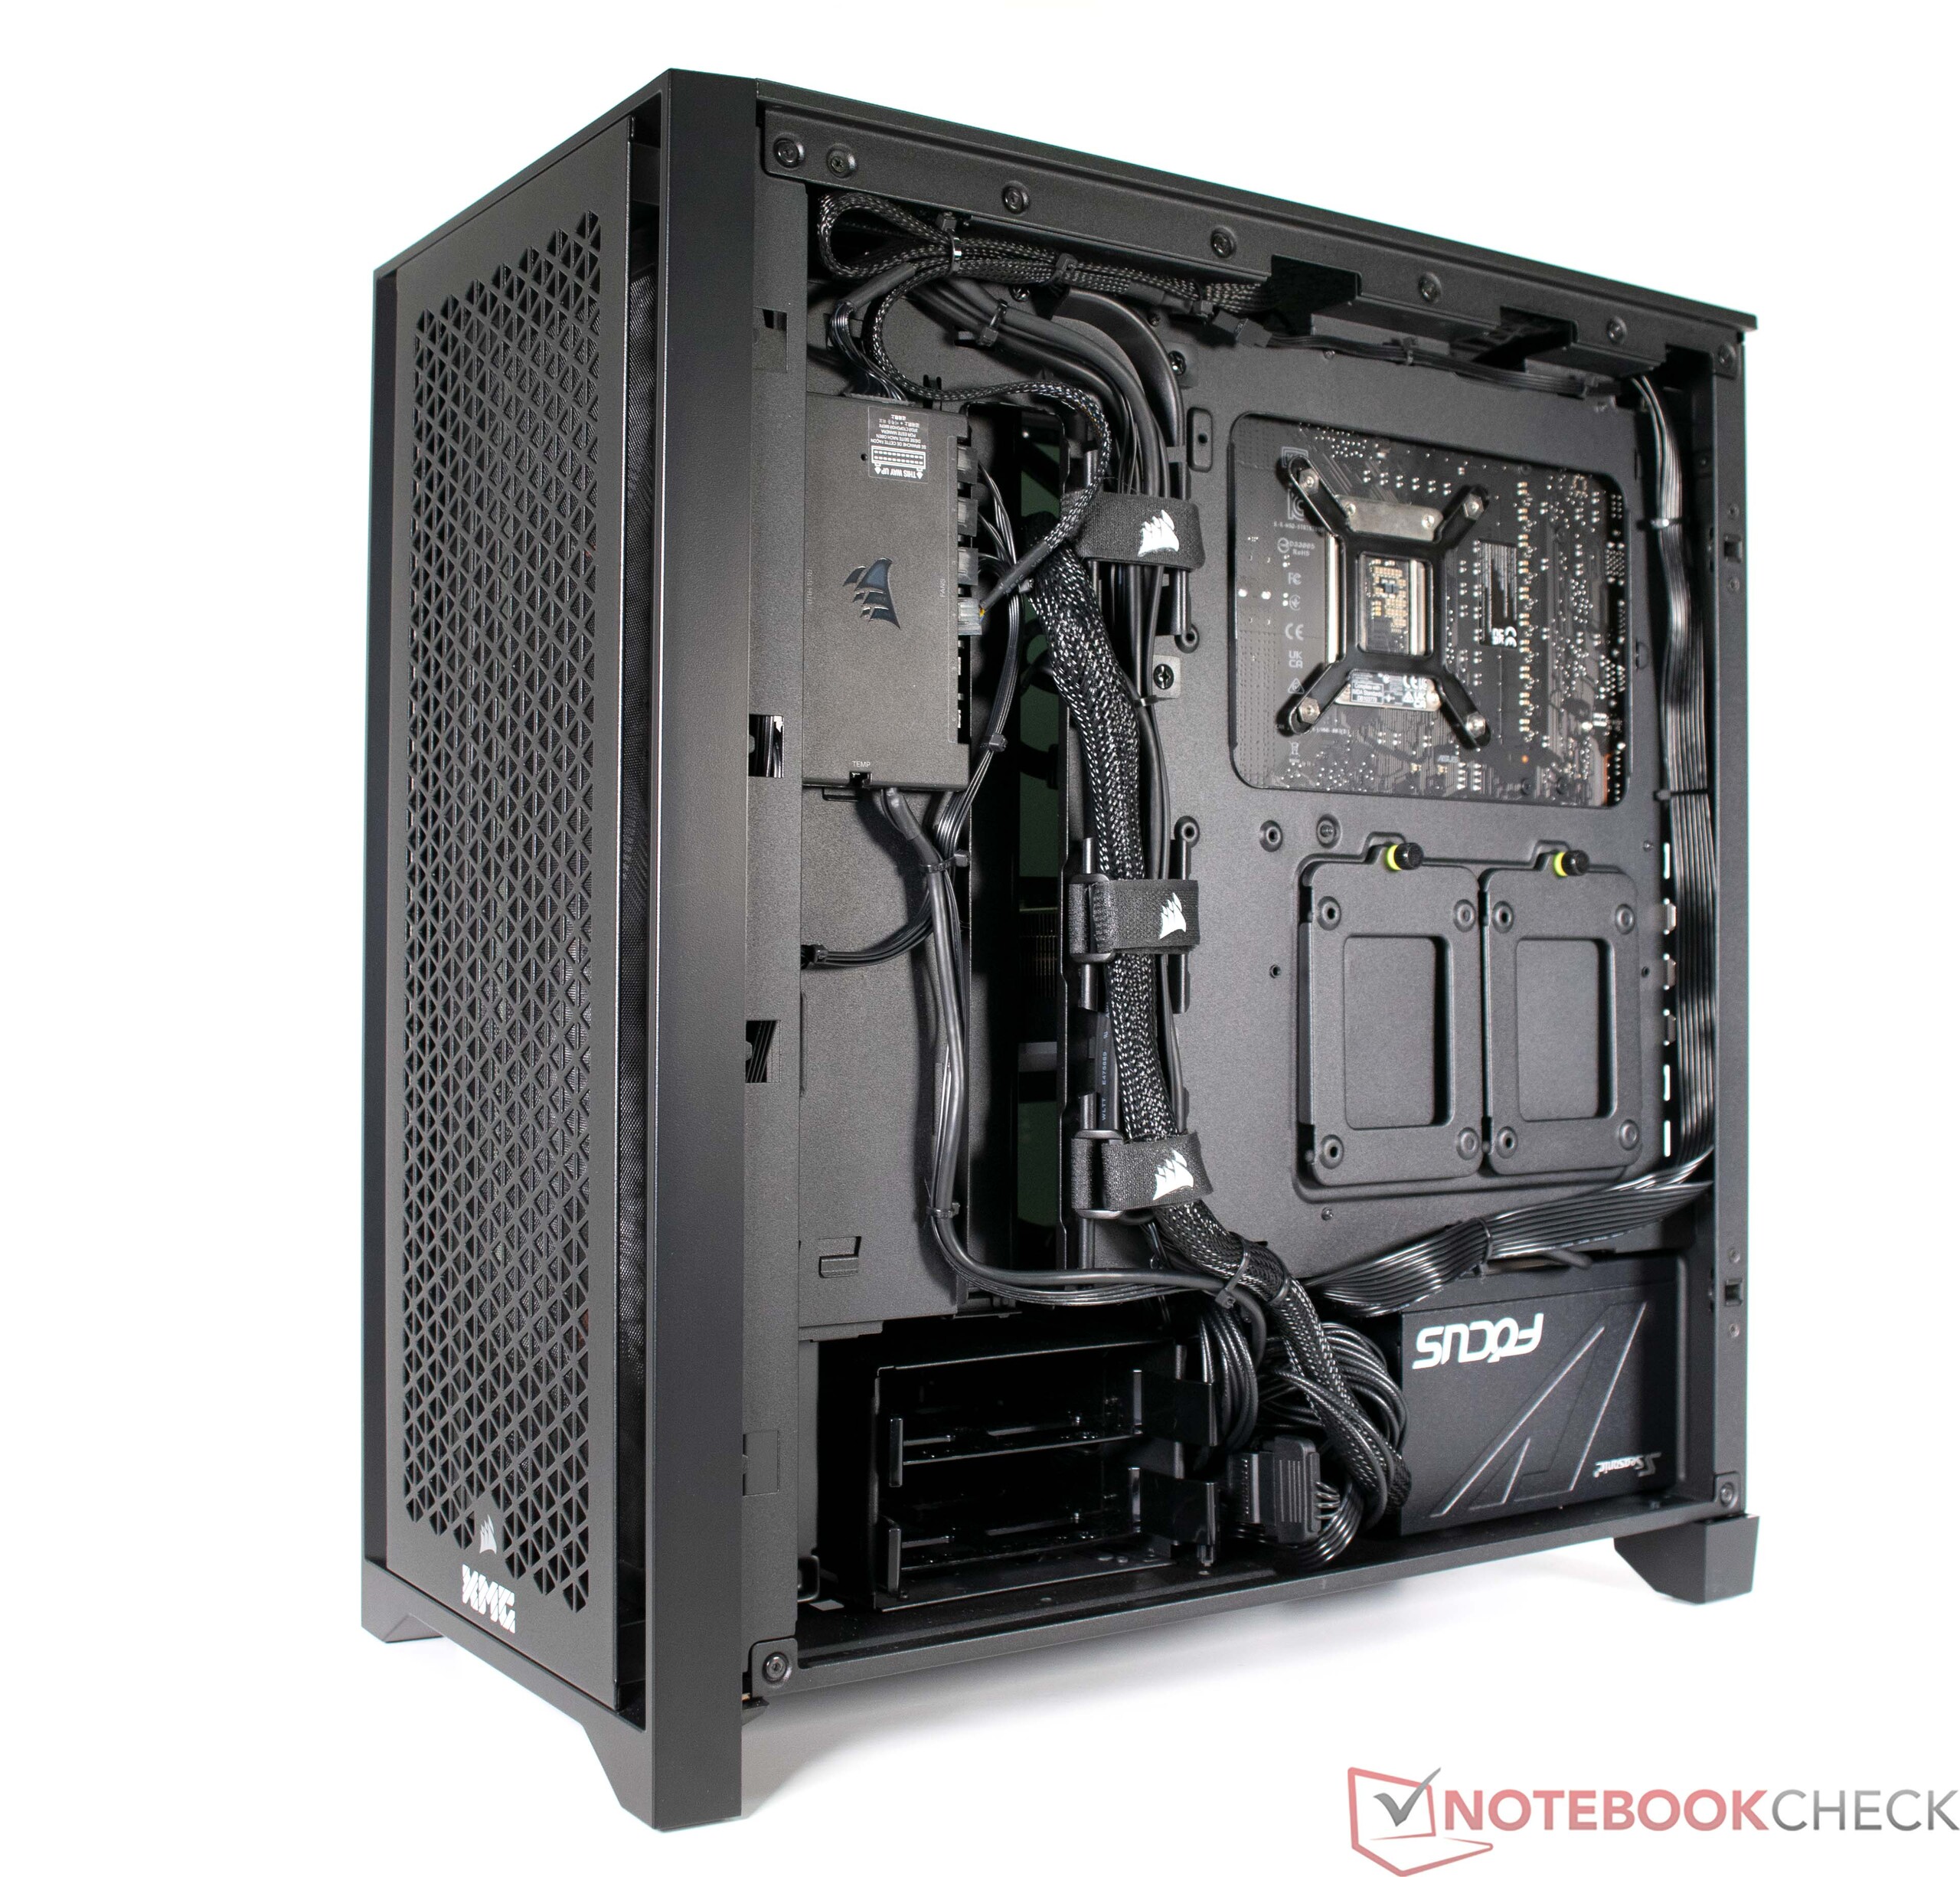
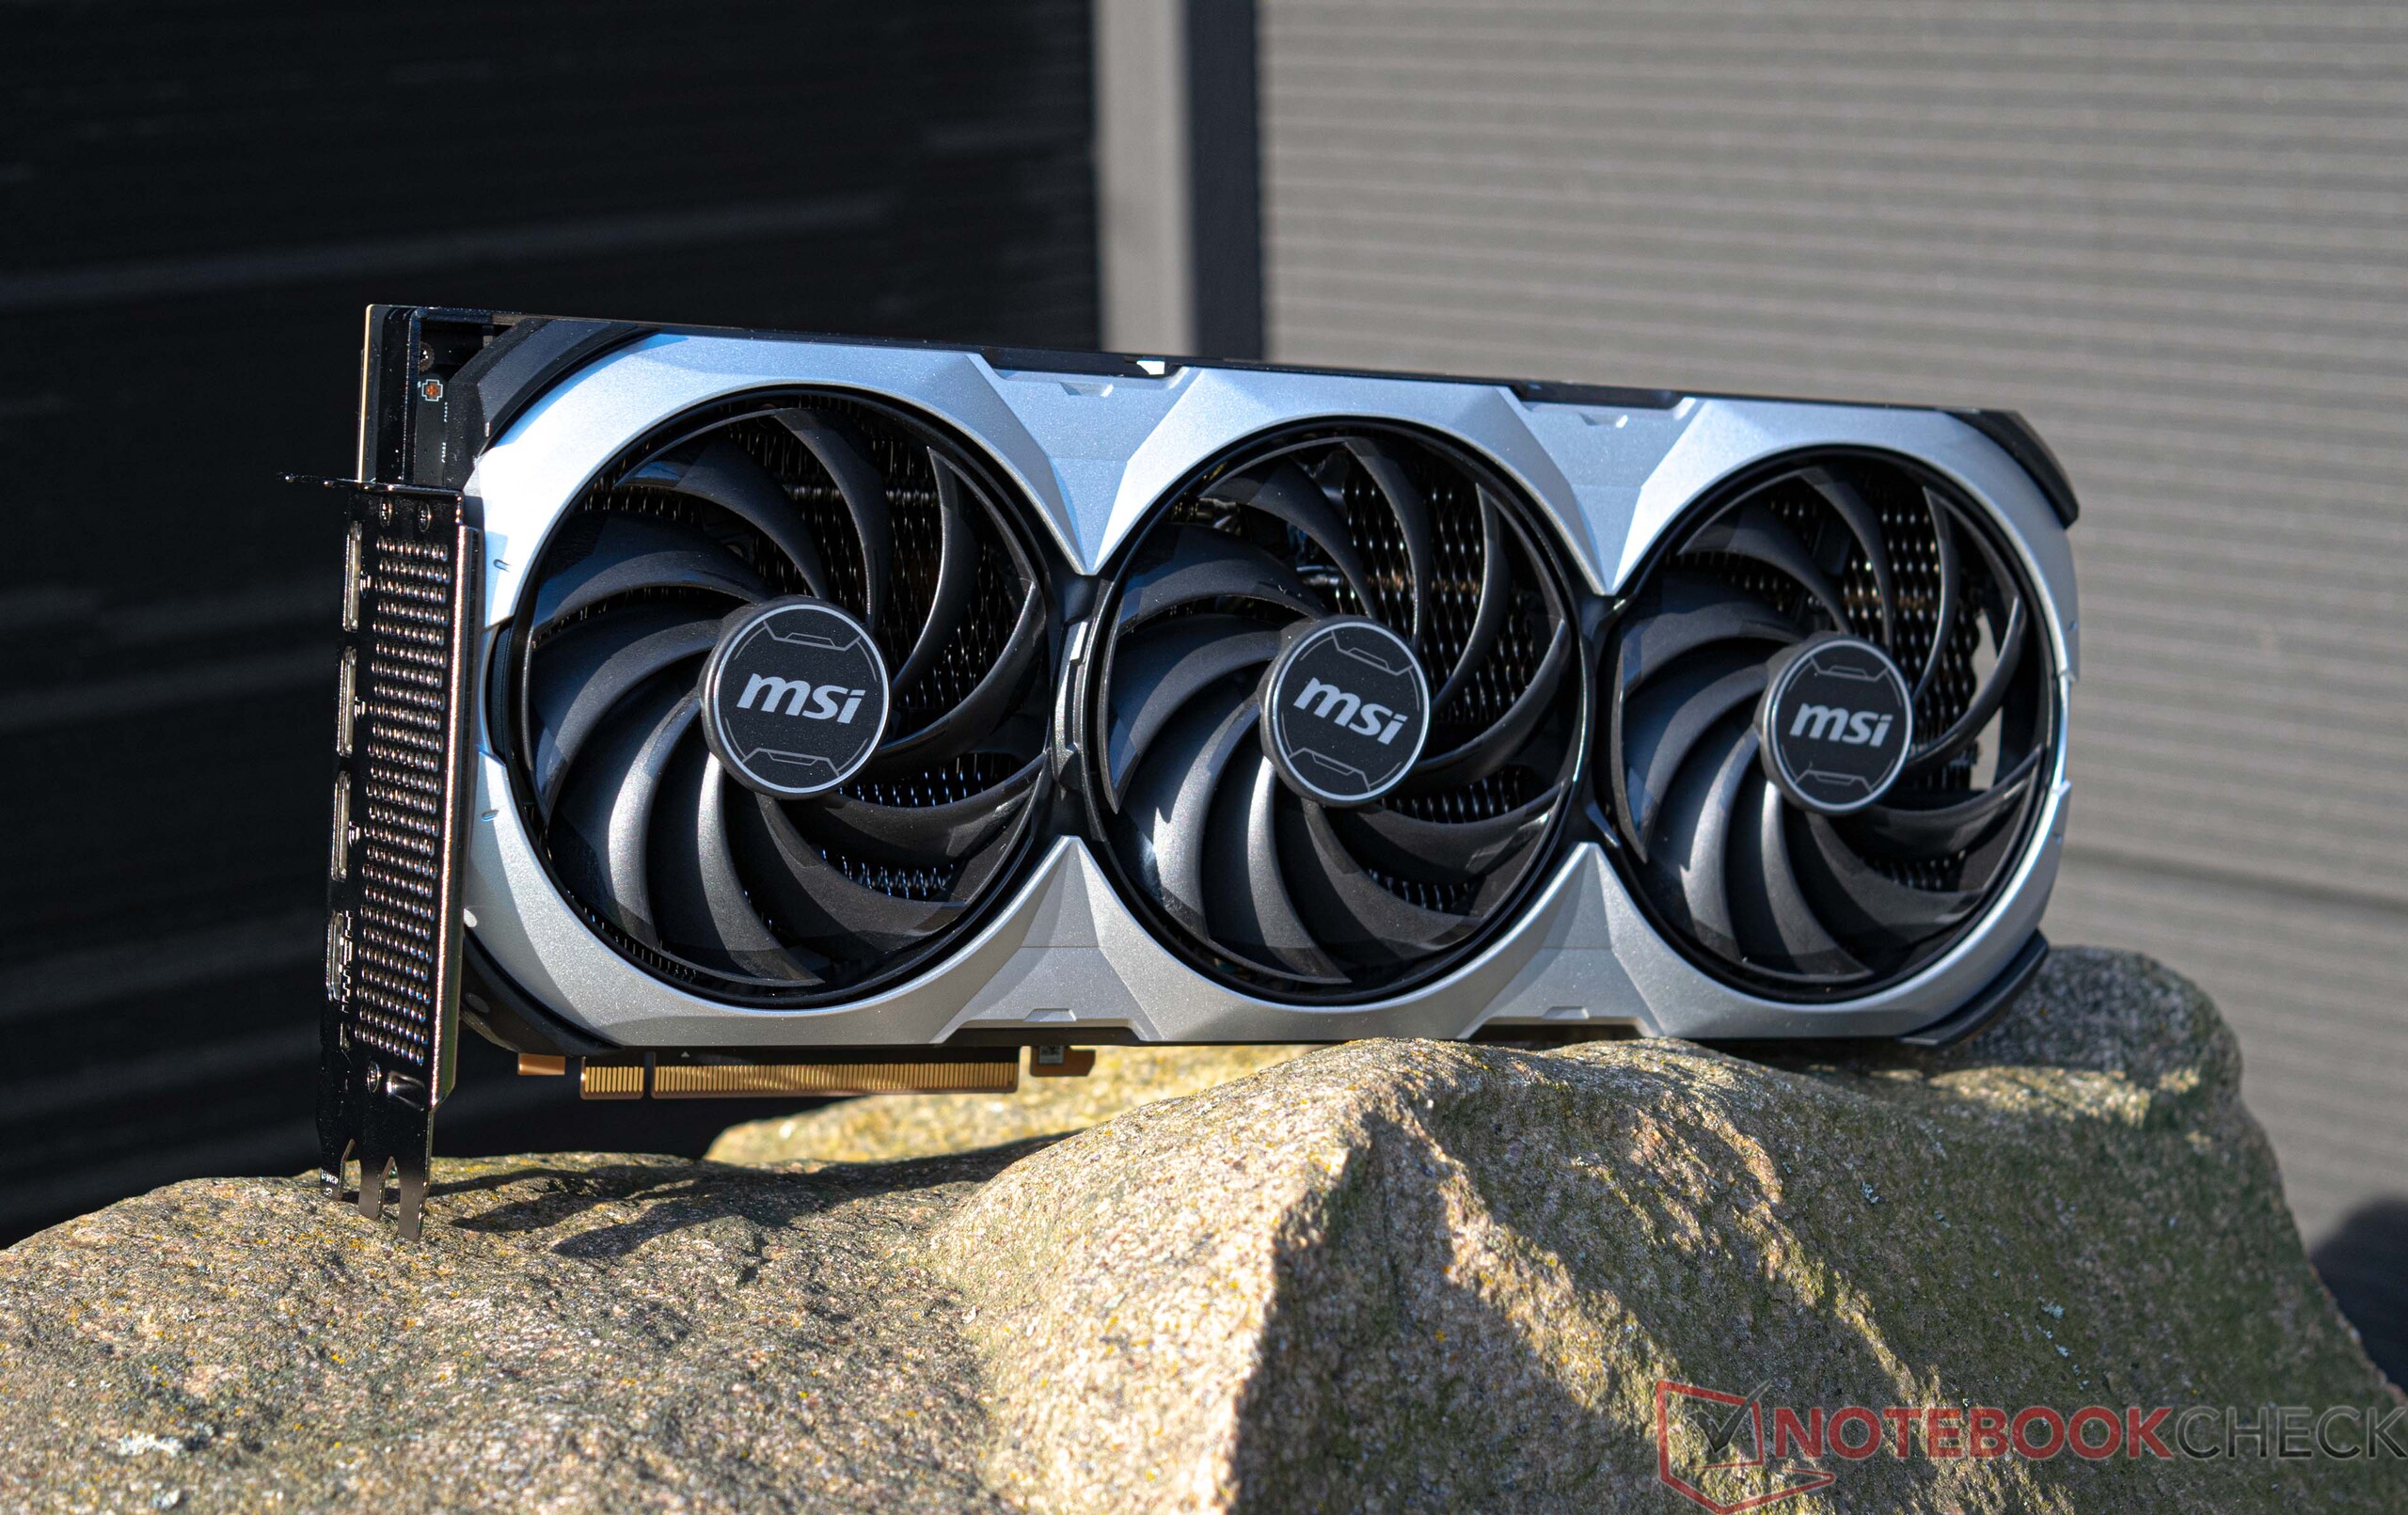
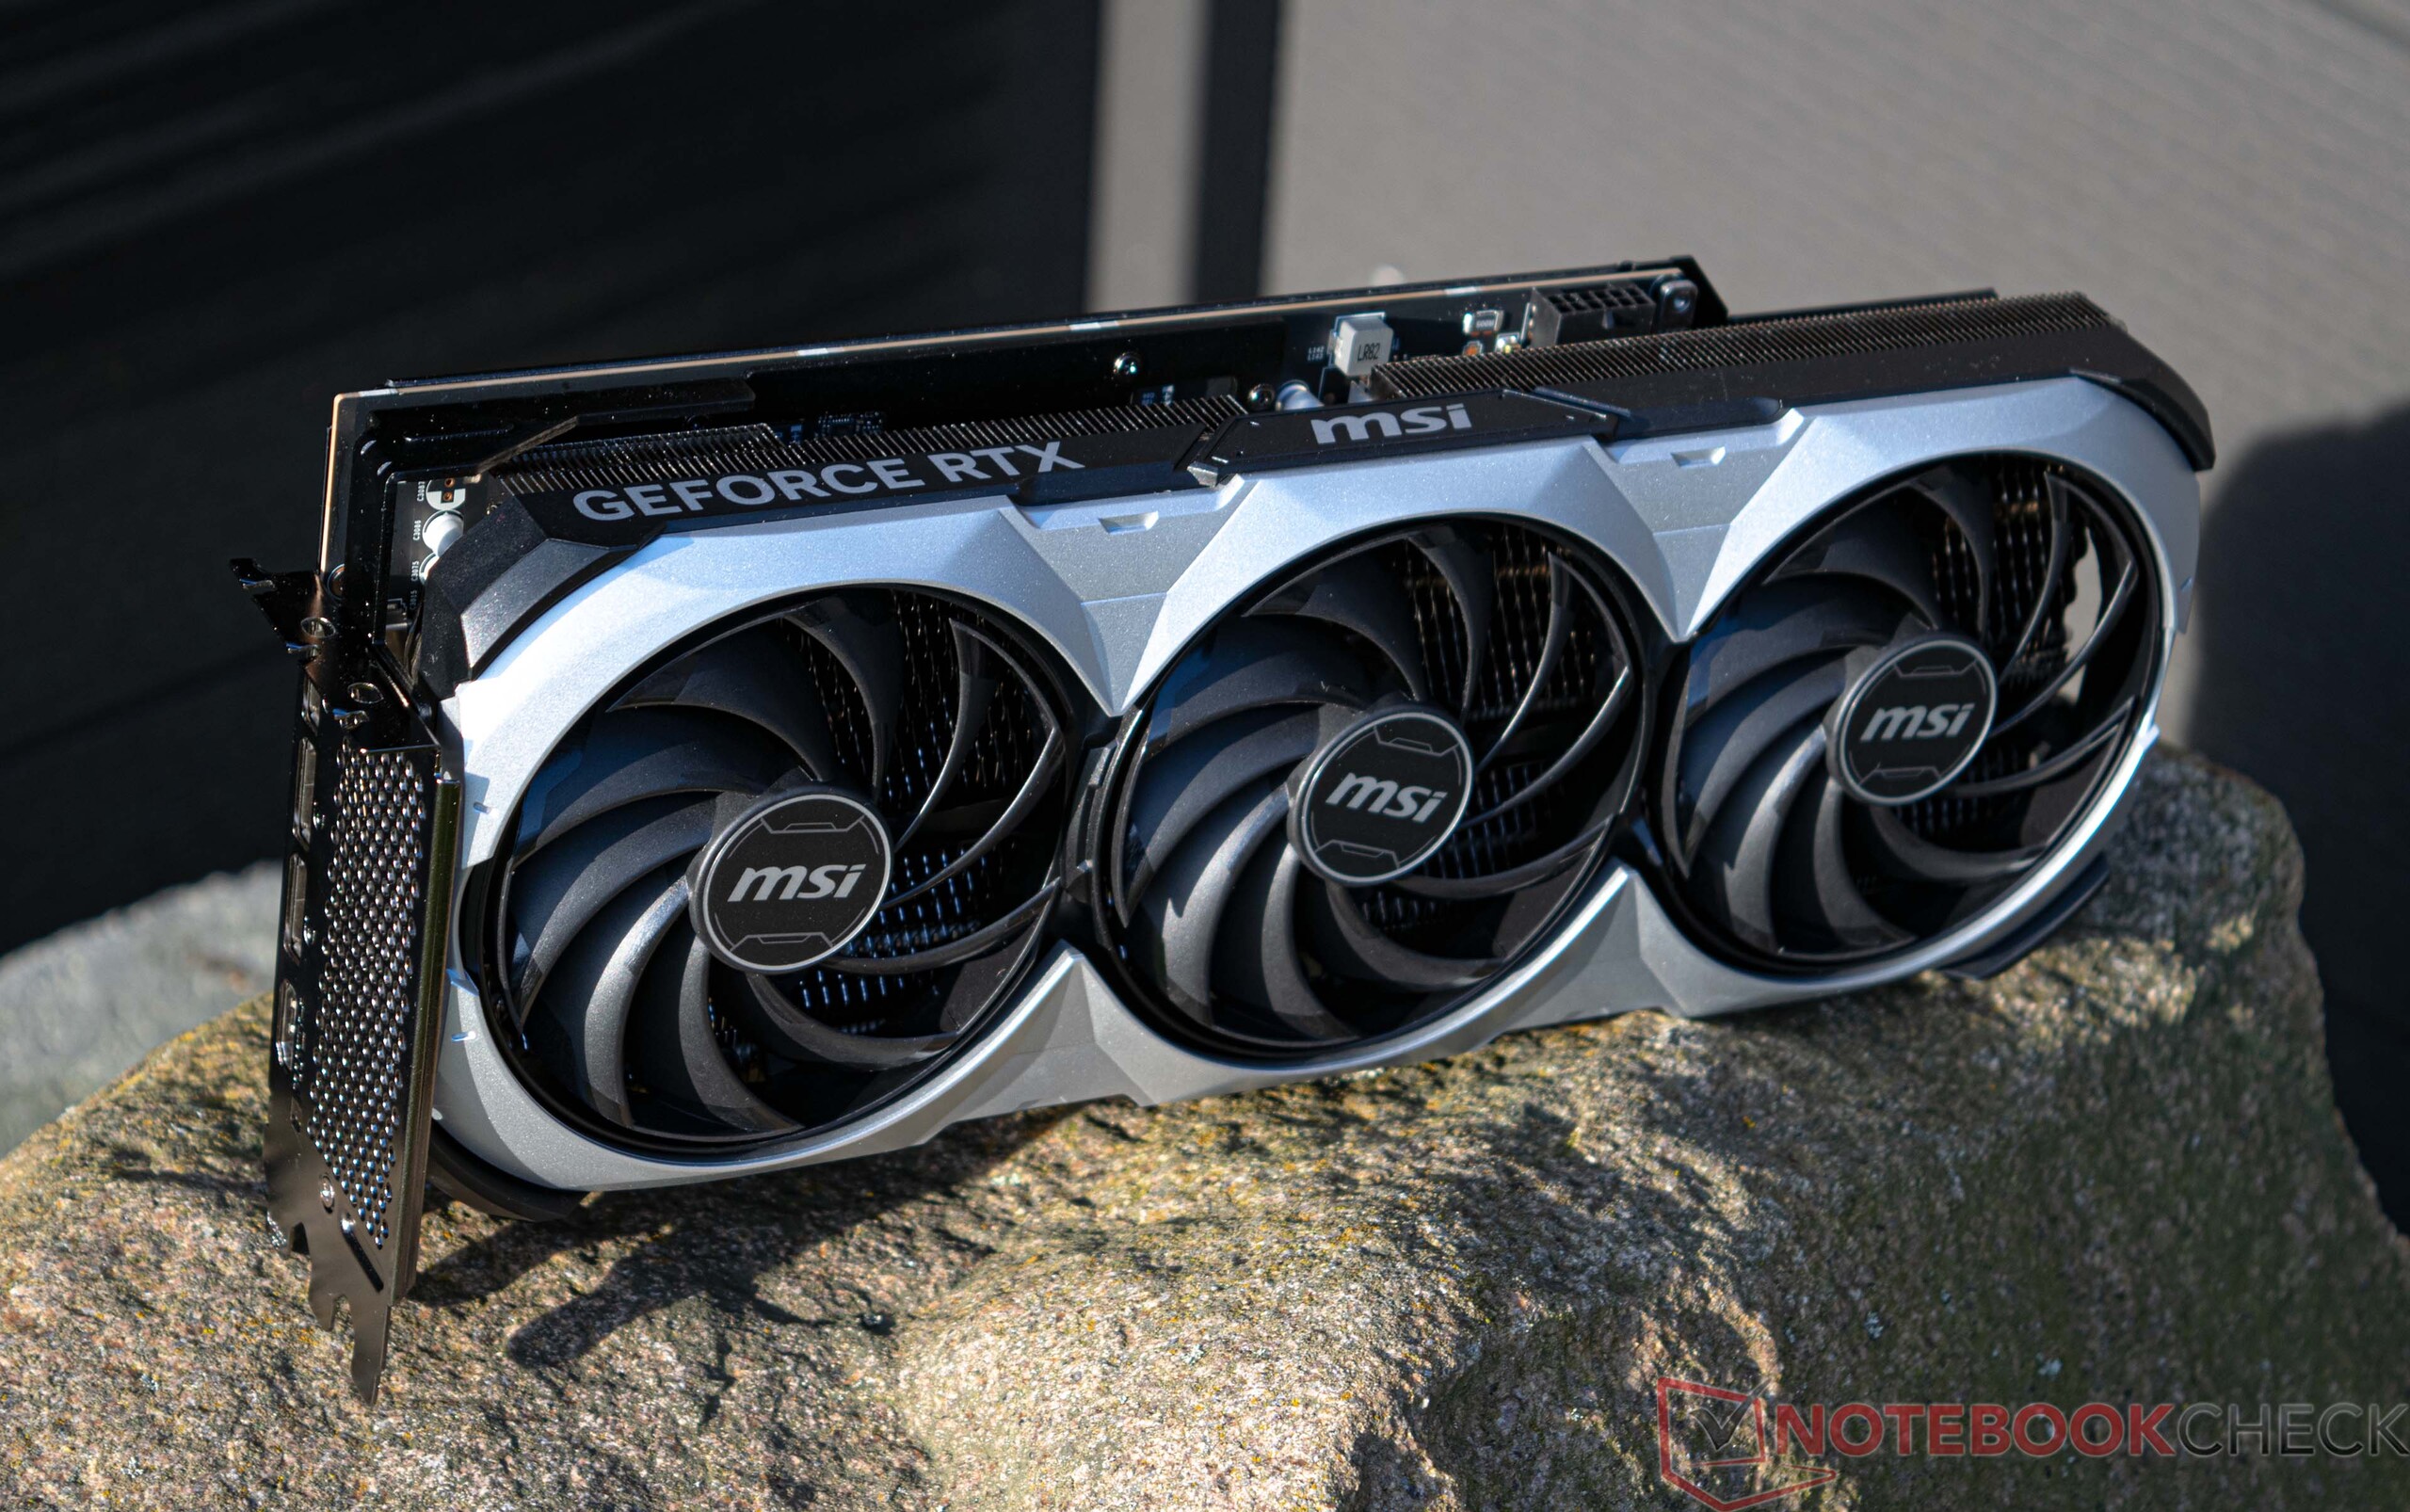
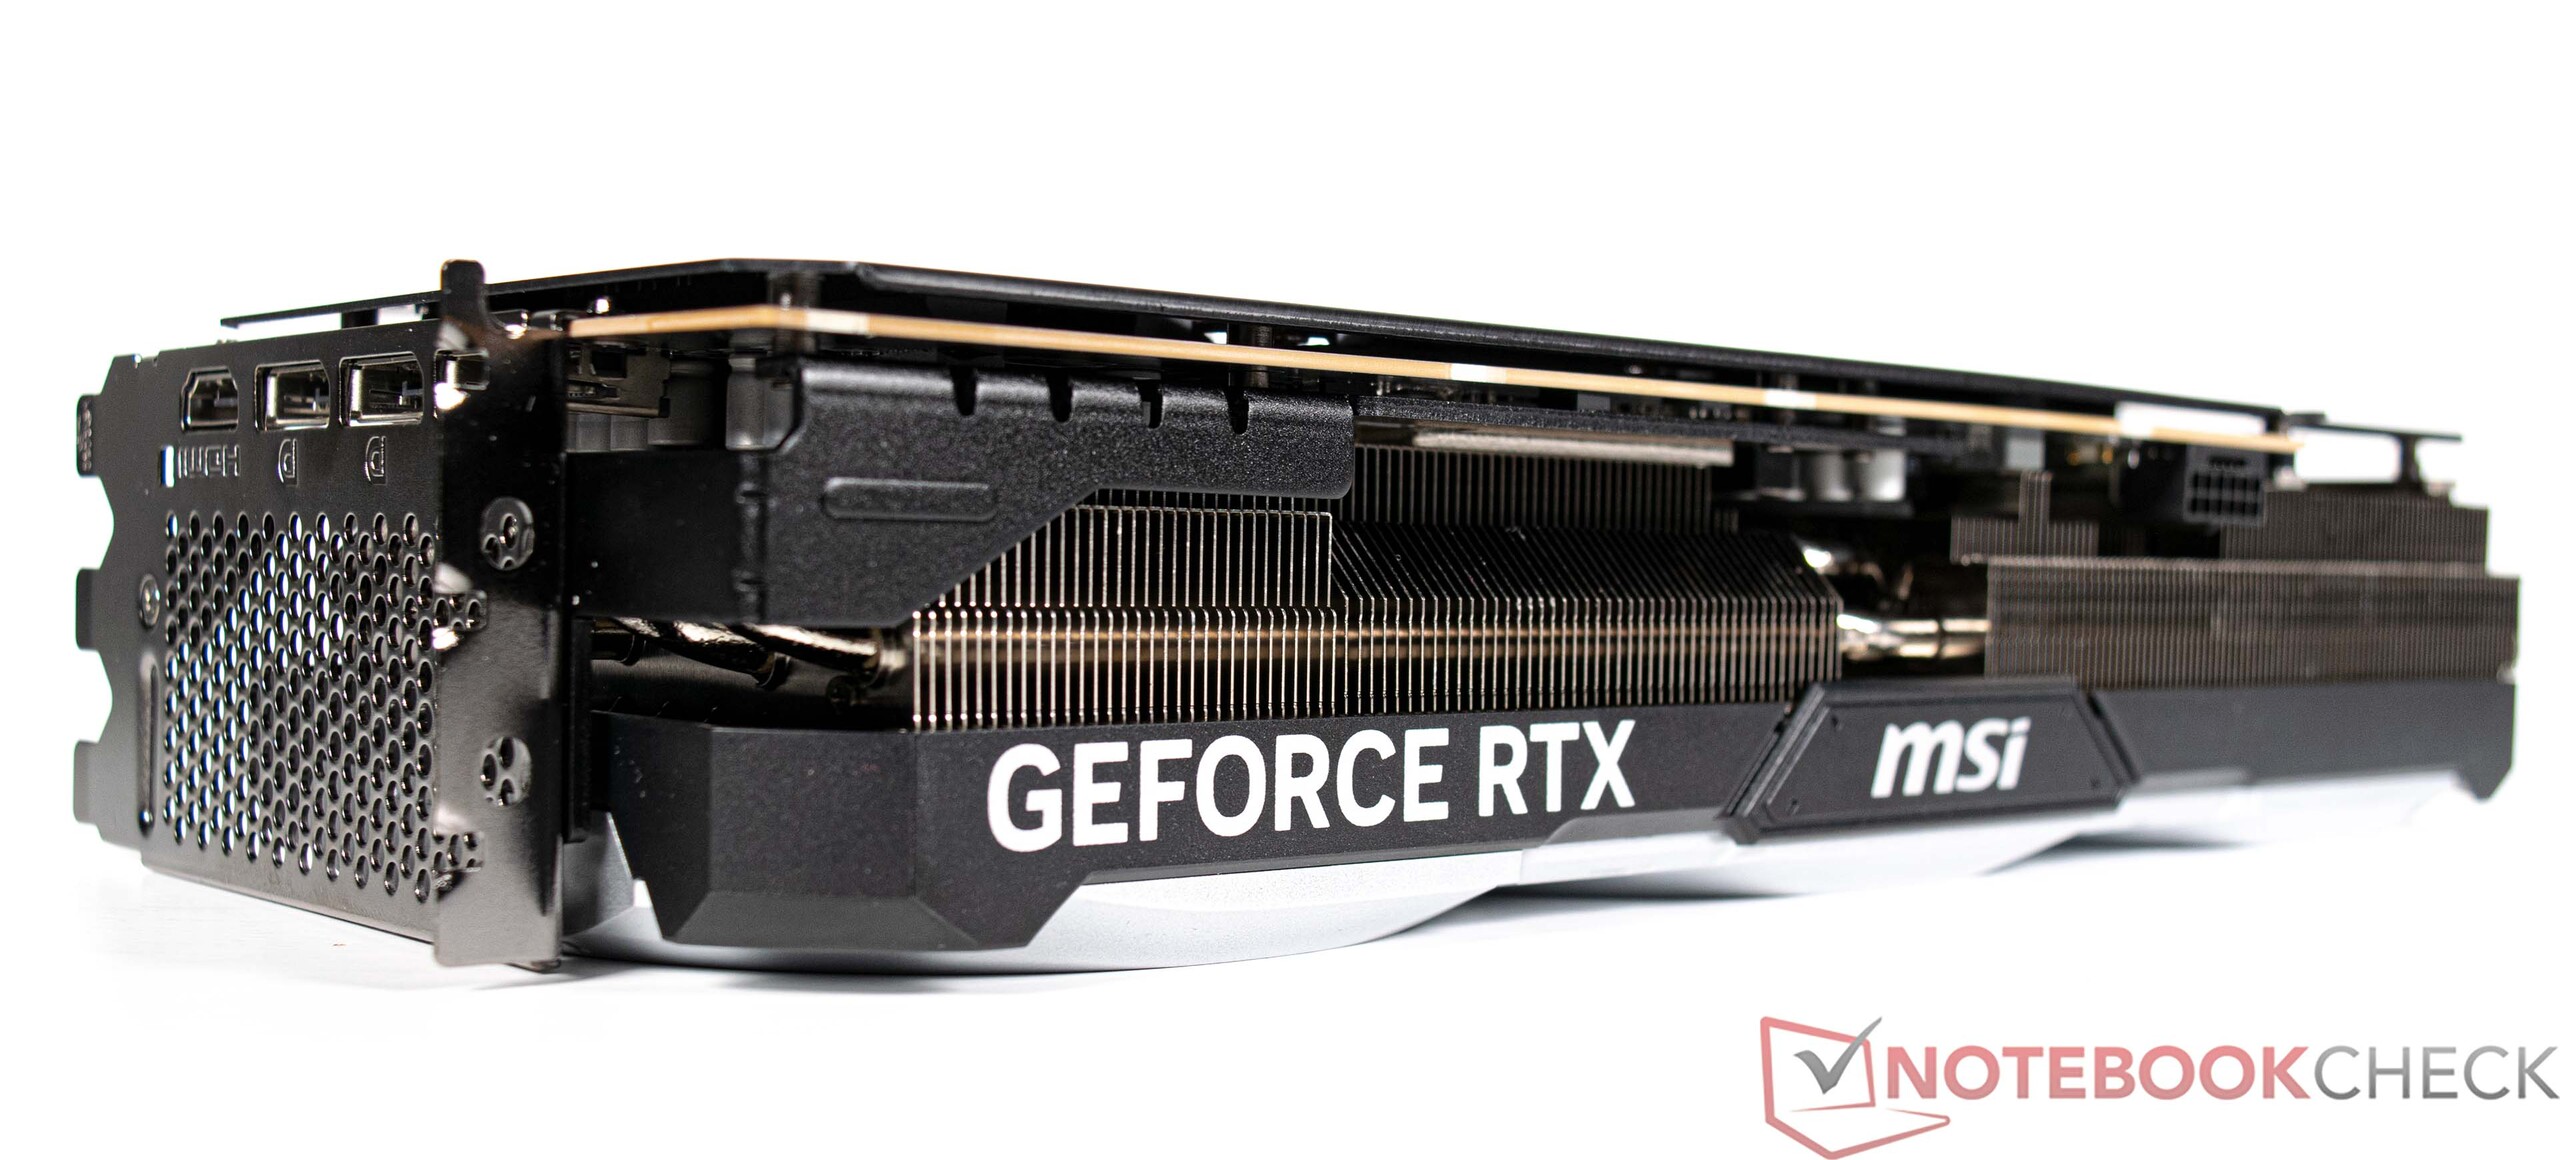
Corsair 4000D Airflow är i grunden ett mycket förstklassigt hölje med tillräckligt med utrymme för att rymma många komponenter. Till och med det massiva MSI GeForce RTX 4090 VENTUS 3X får lätt plats i fodralet.
Specifikationer
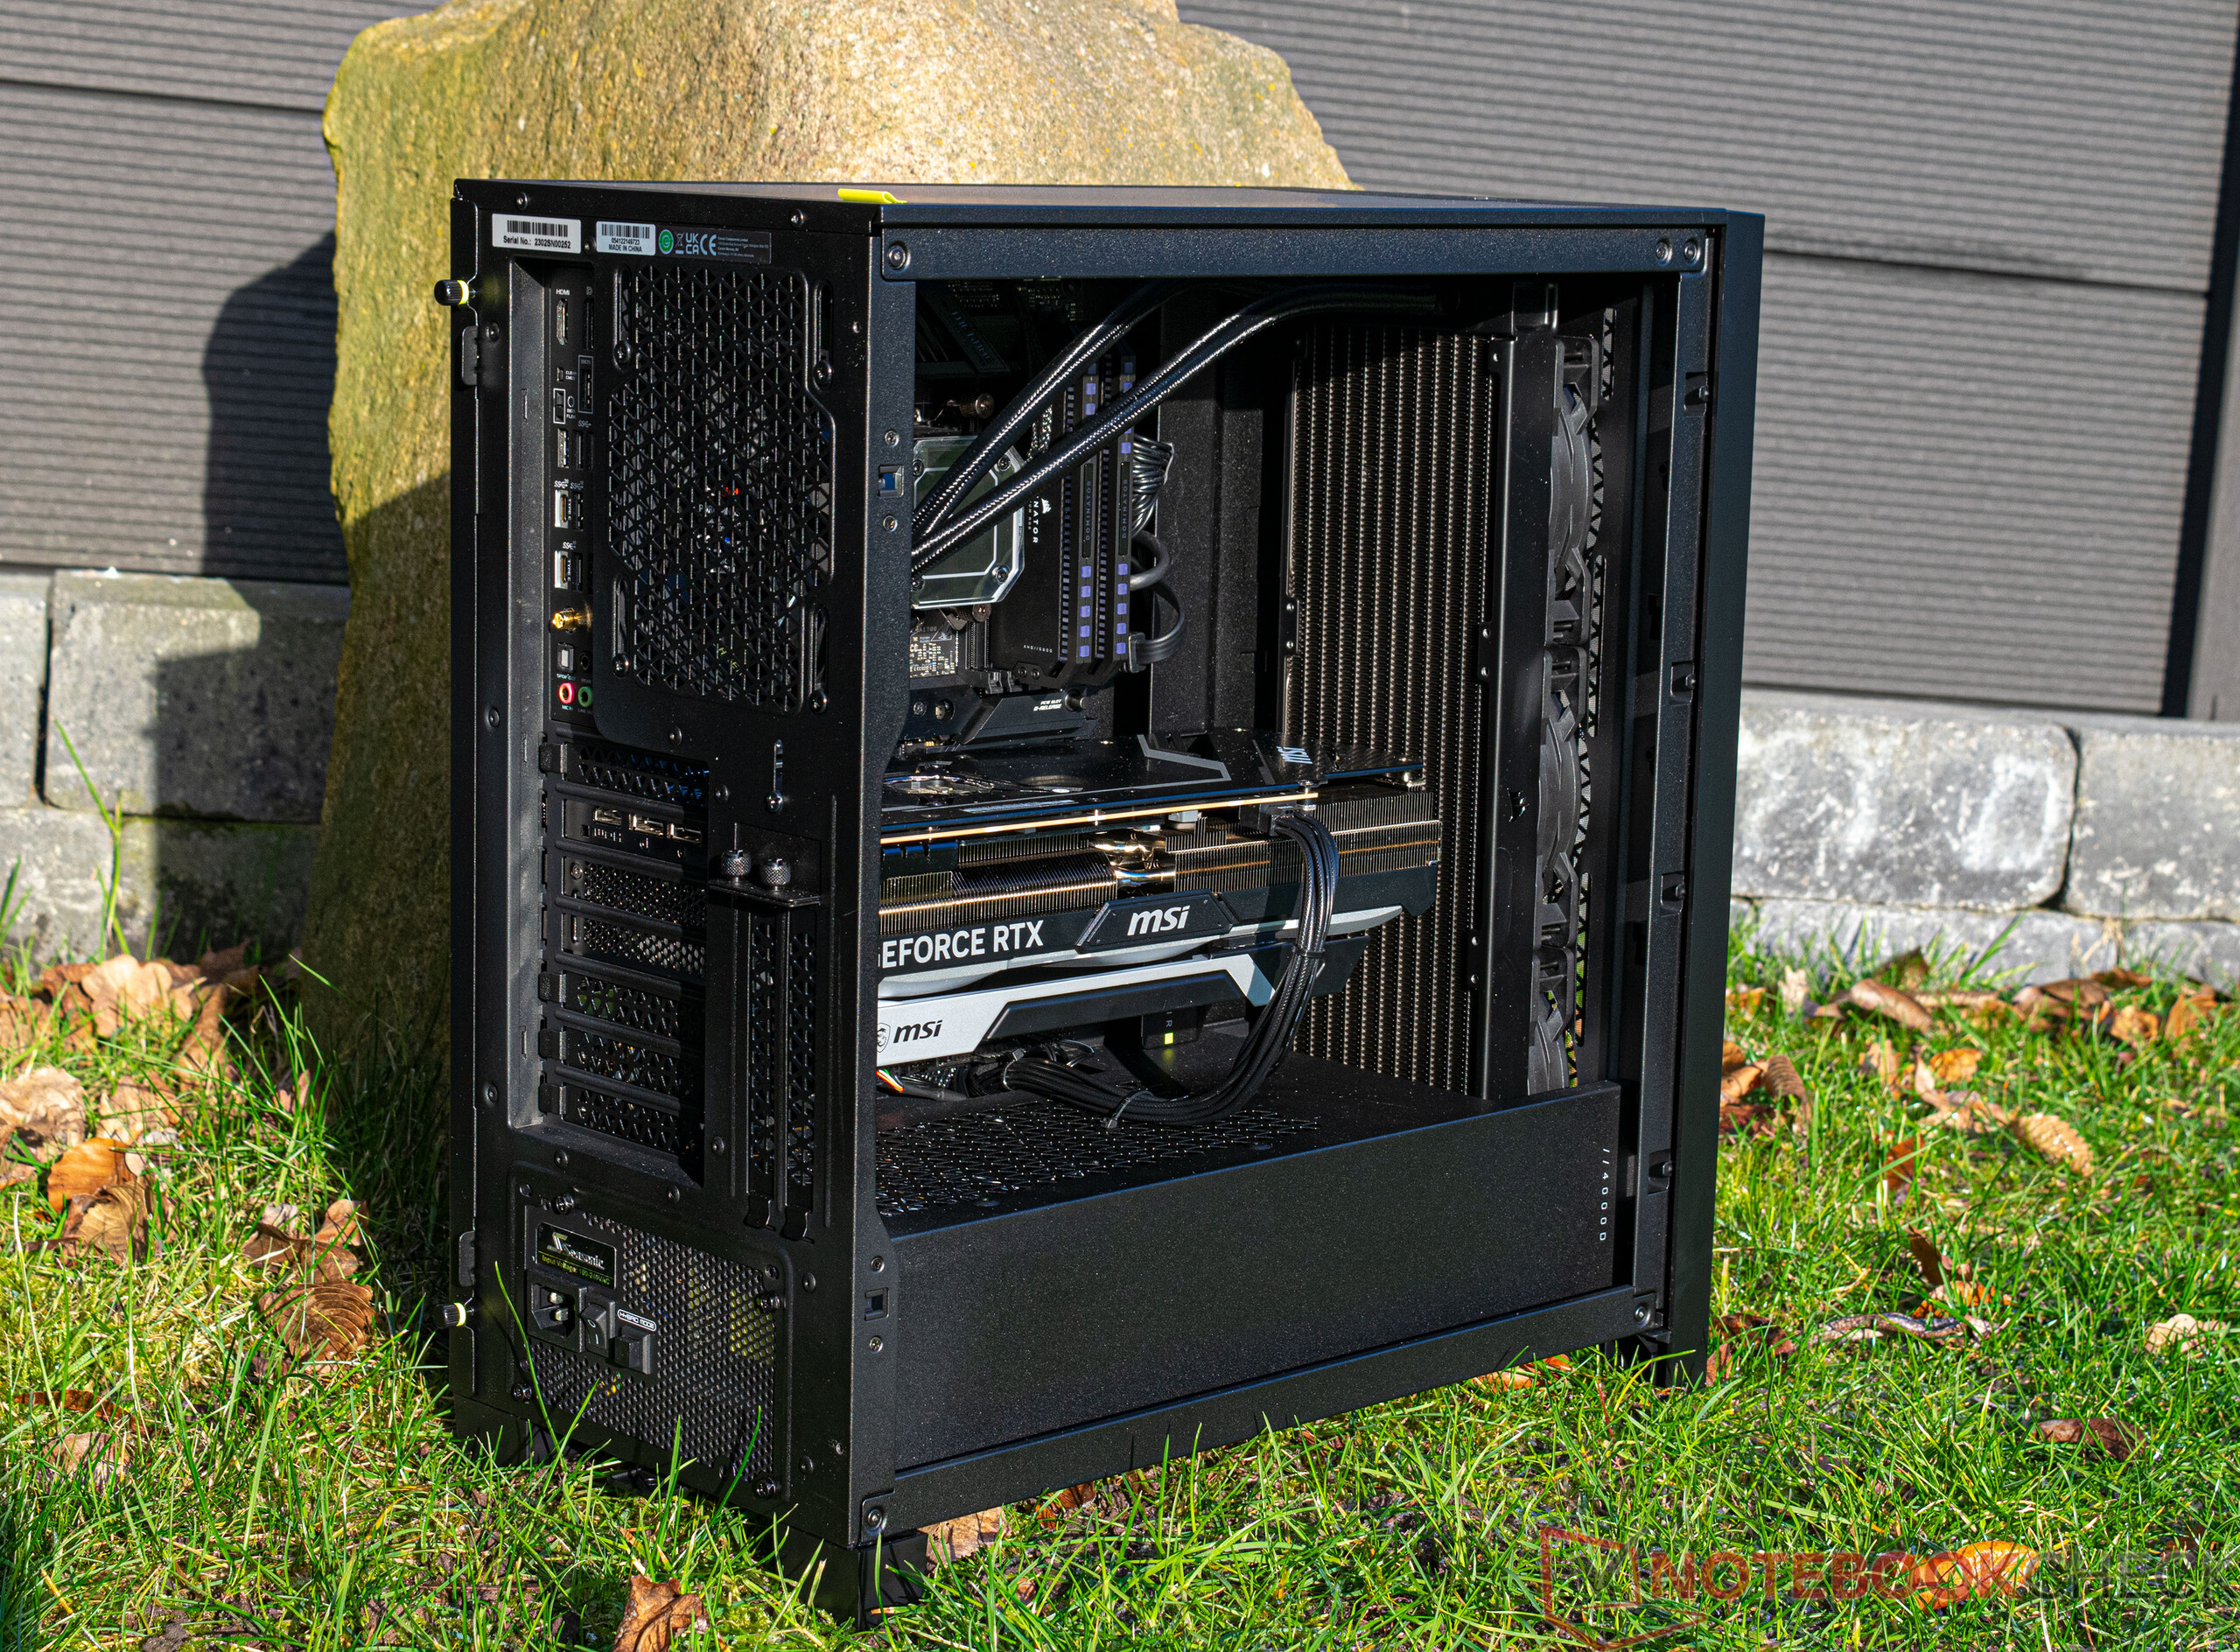
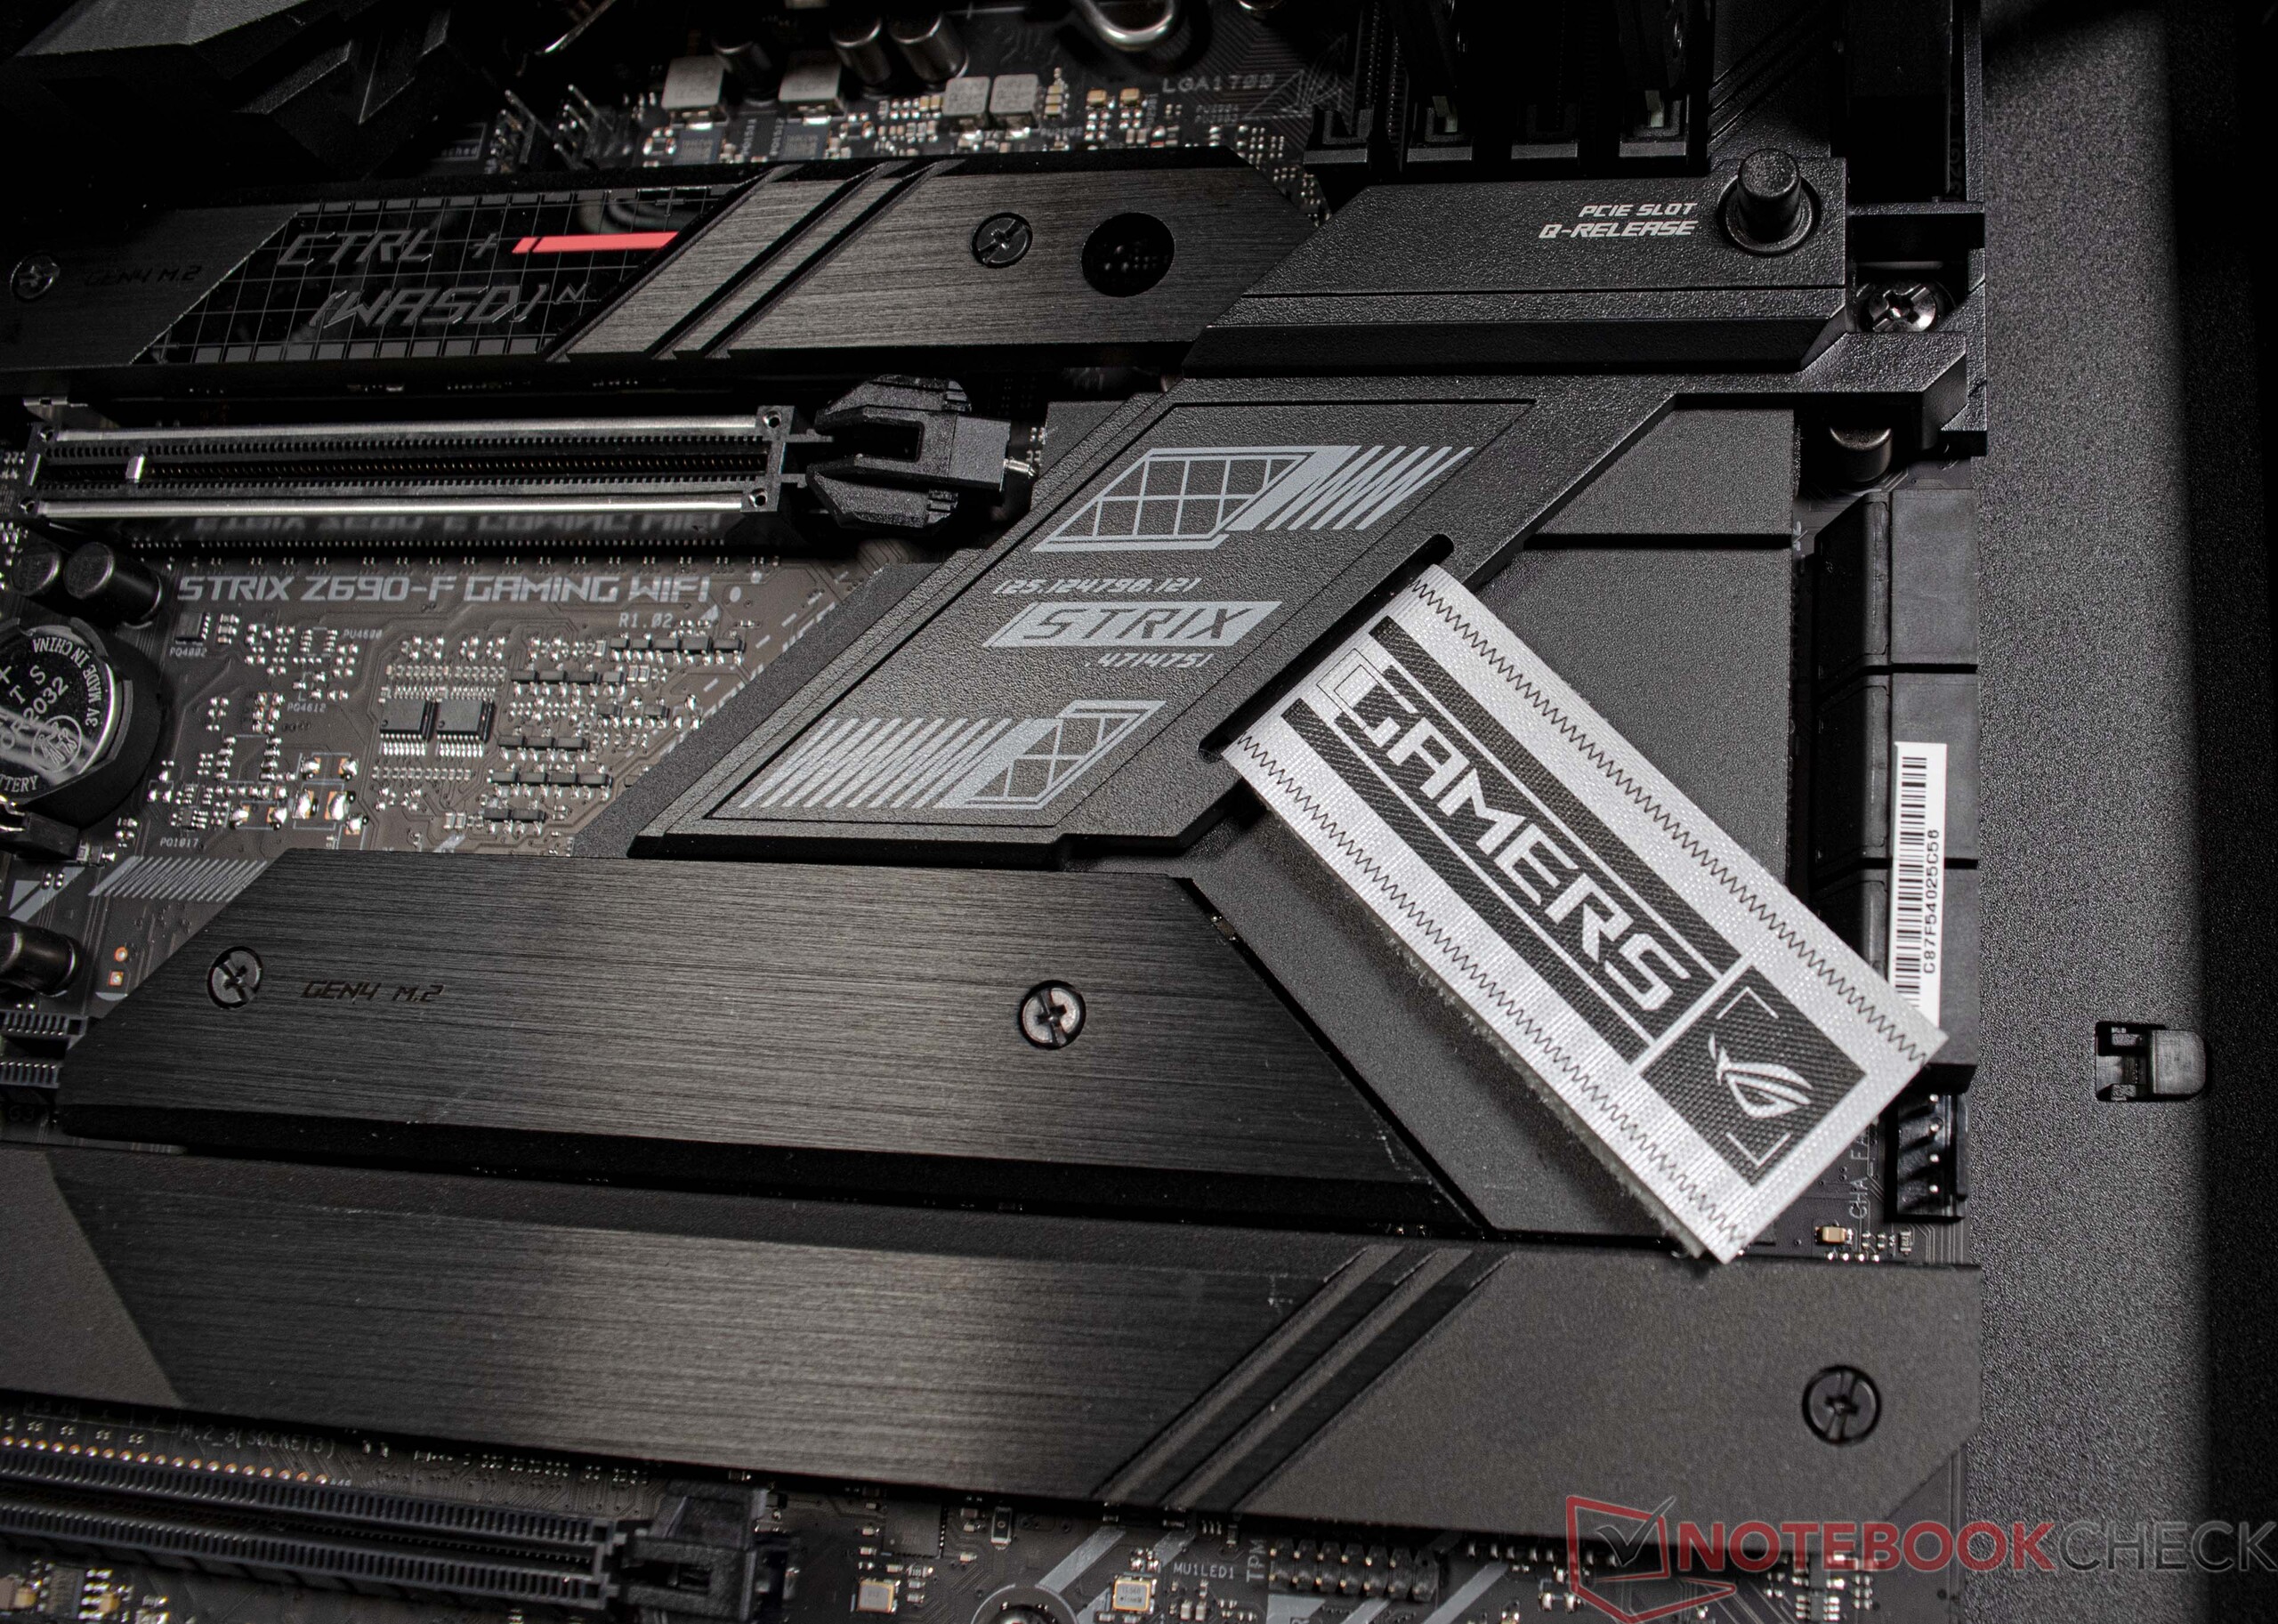
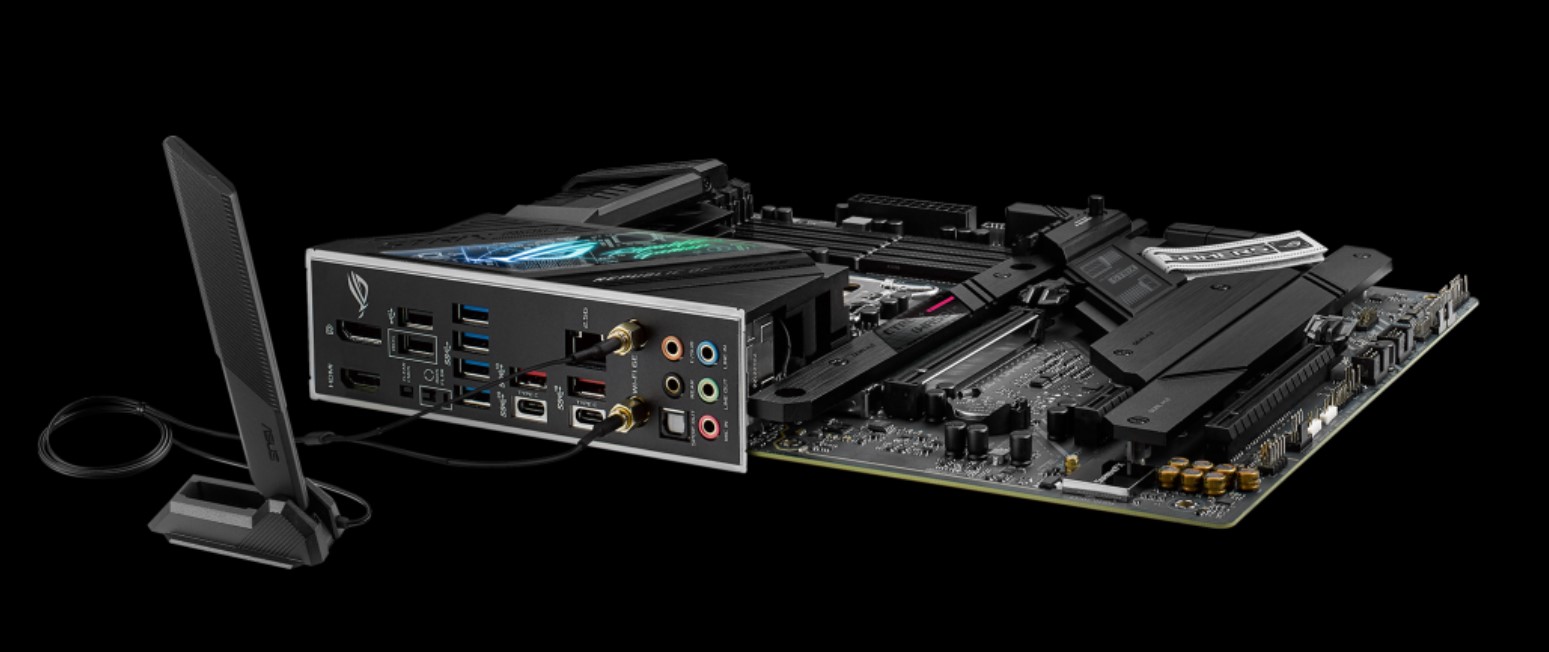
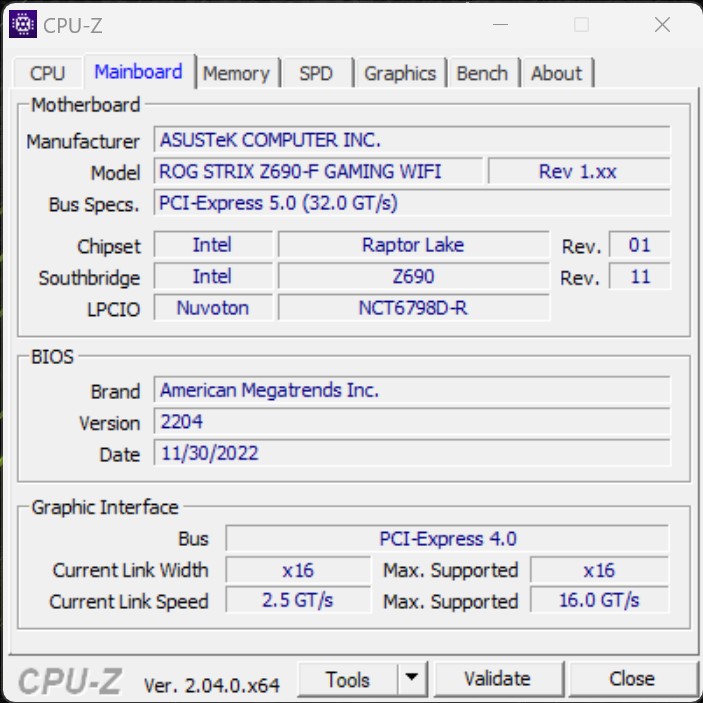
Praktiskt taget inga kompromisser har gjorts när det gäller I/O-portar. Det medföljande moderkortet (Asus ROG Strix Z690-F Gaming) erbjuder till exempel en mängd USB-gränssnitt och moderna portar för nätverk. Dessutom kan det rymma upp till fyra M.2 SSD-diskar och 128 GB DDR5 RAM och har 6x SATA 6Gb/s-kontakter. Användare har direkt tillgång till en USB-A-port och en USB-C-port på frontpanelen på Corsair 4000D Airflow. De tillgängliga skärmutgångarna beror på grafikkortet i systemet. Vår recensionsenhet har tre DisplayPorts och en HDMI-utgång. Om ditt system inte är utrustat med en non-F CPU kan du använda processorns integrerade GPU för videoutgång som ett alternativ till det dedikerade grafikkortet. Det finns också olika sätt att driva skärmar från moderkortet.
Anslutningsmöjligheter
En trådlös Intel Wi-Fi 6E AX211-modul är installerad på Asus ROG Strix Z690-F Gaming. Vi var inte helt imponerade av modulens prestanda när vi testade den med vår referensrouter, Asus ROG Rapture GT-AXE11000. De registrerade överföringshastigheterna låg under våra förväntningar när systemet var anslutet till 5G-nätverket. Efter att ha bytt till en 6G-anslutning förbättrades överföringshastigheterna avsevärt. Som ett alternativ har moderkortet i vår recensionsenhet också ett RJ45-gränssnitt som stöder hastigheter på upp till 2,5 Gbit/s.
Tillbehör
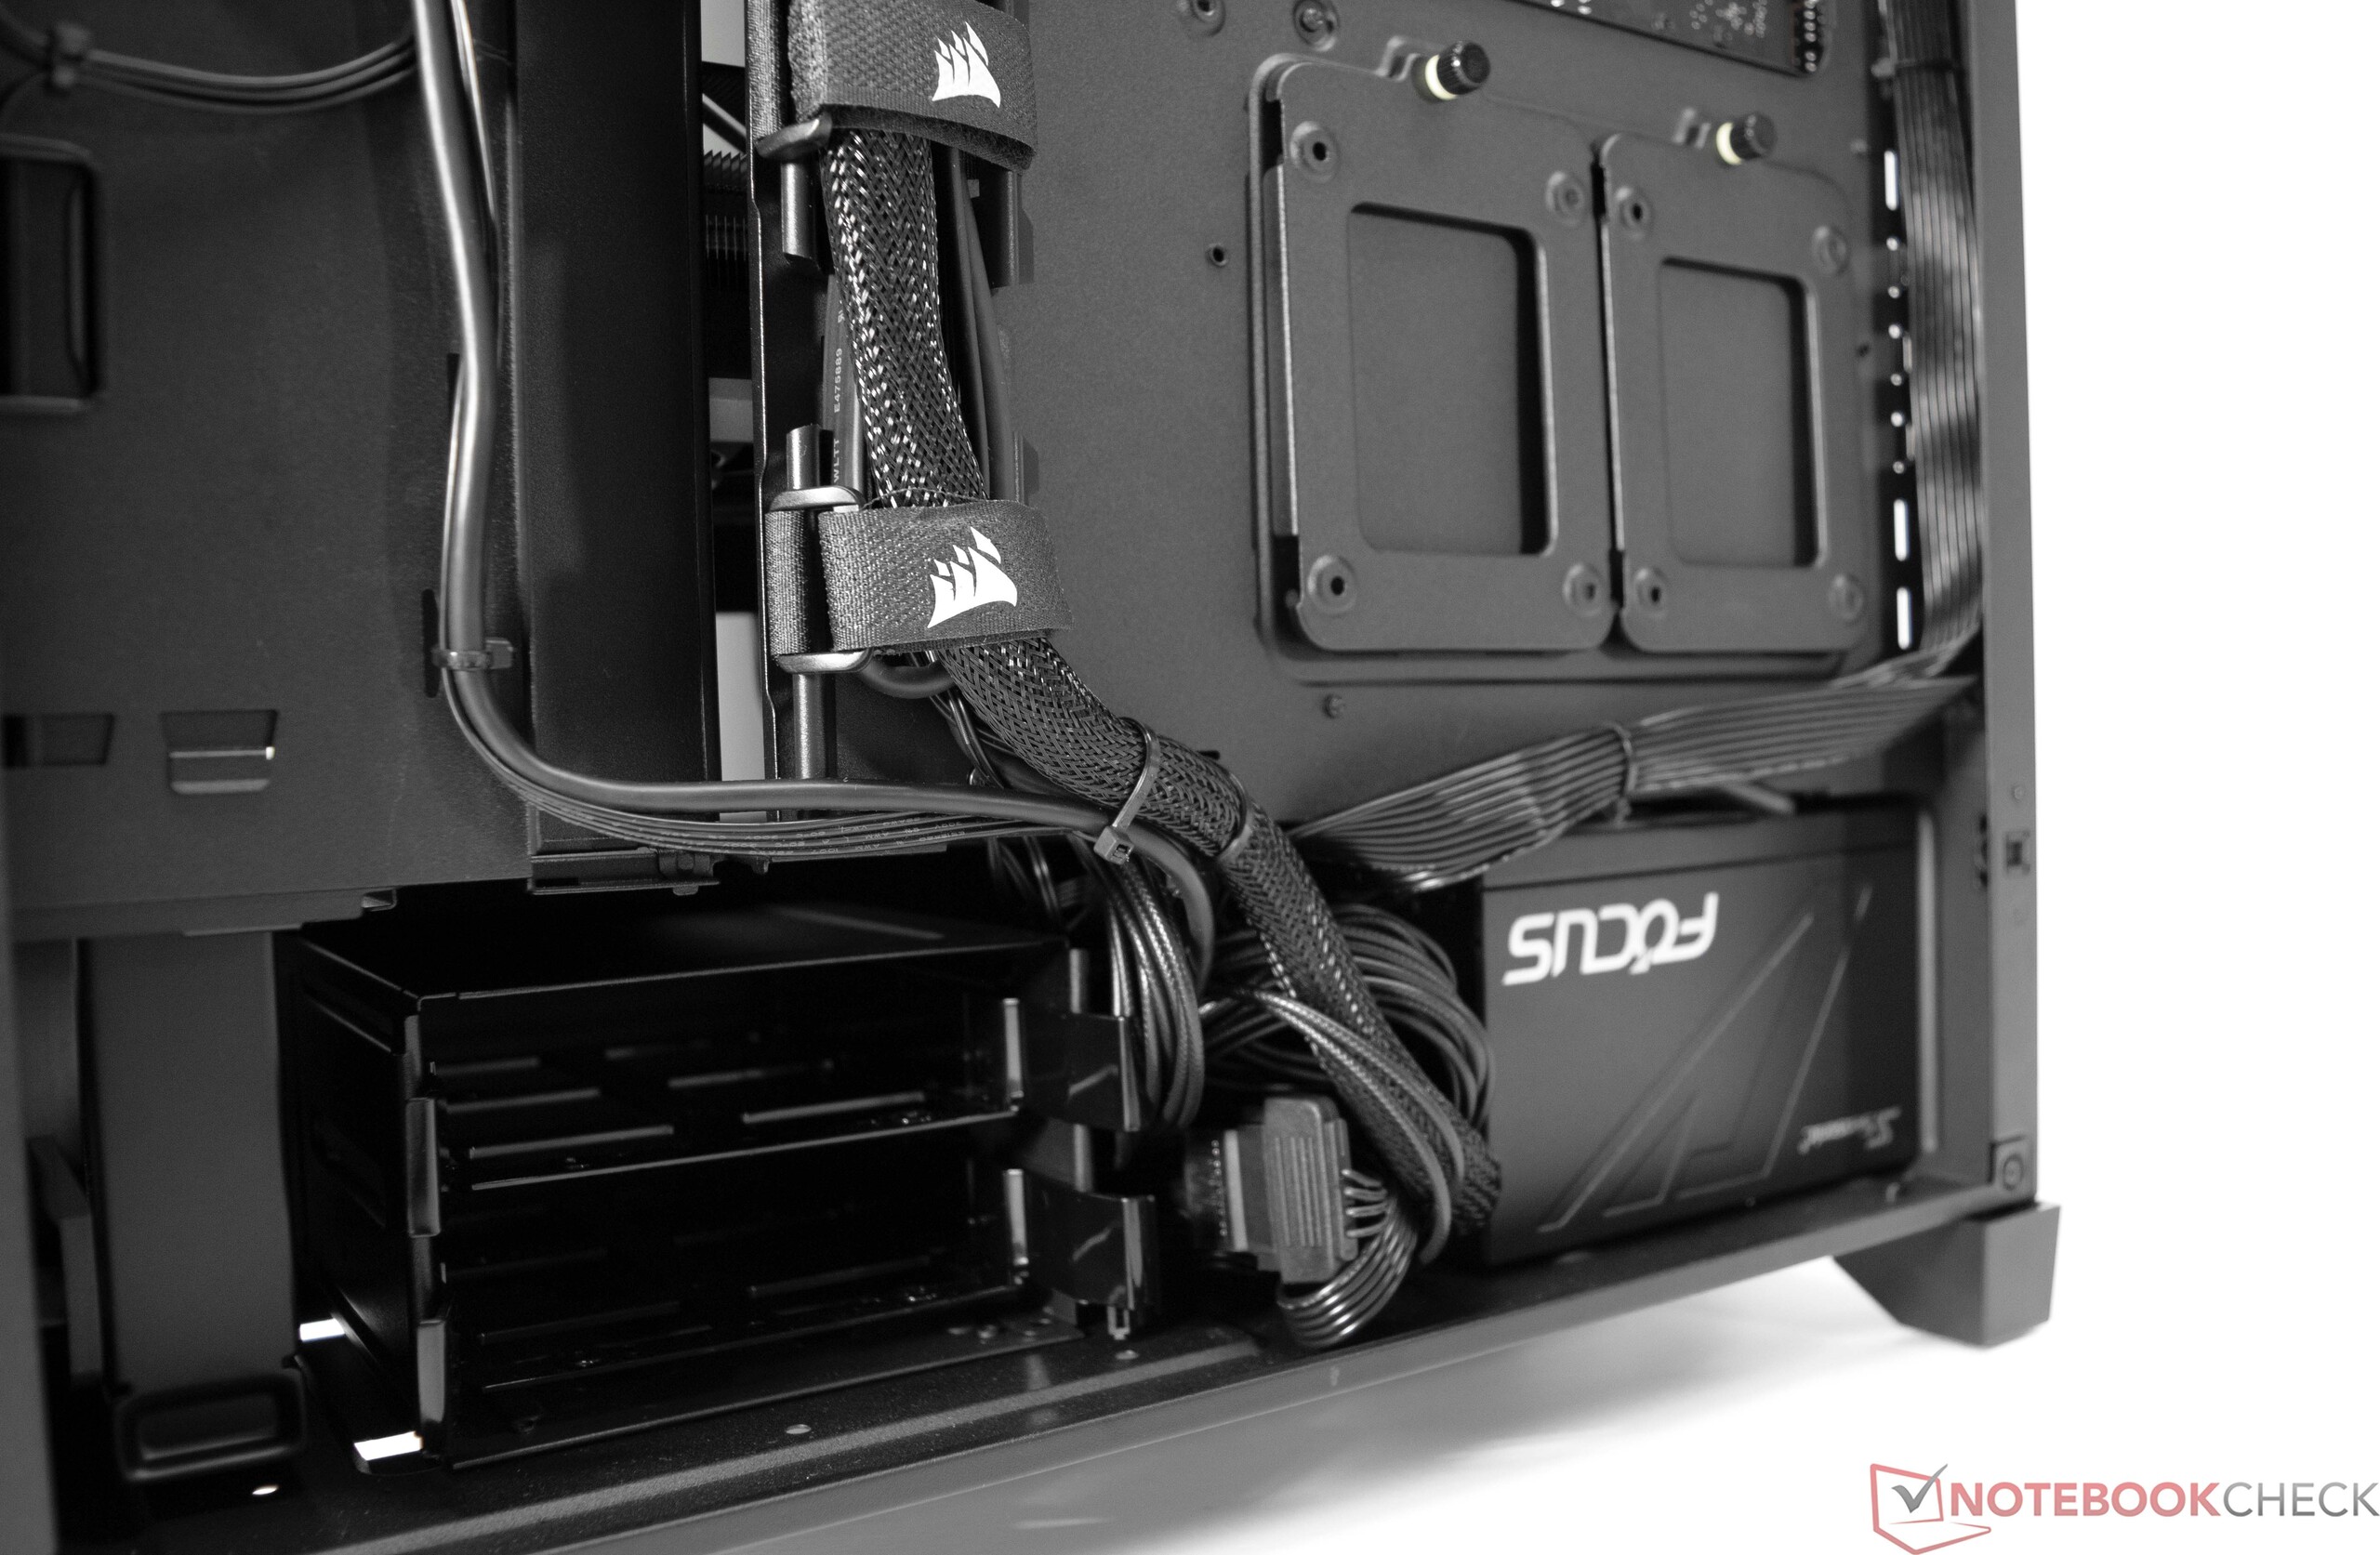
I lådan hittar du förutom själva datorn även olika moderkortstillbehör som kablar och Wi-Fi-antenner samt oanvända kablar som hör till nätaggregatet, som är helt modulärt.
Underhåll
Det är enkelt att underhålla XMG SECTOR Intel. Sidopanelerna på Corsair 4000D Airflow kan enkelt tas bort så att du snabbt och smidigt kan rengöra damm på fläktarna. Den medföljande Corsair iCUE H150i Elite Capellix är en högpresterande AIO-kyllösning som inte kräver särskilt mycket underhåll.
Garanti
Schenker erbjuder 36 månaders grundgaranti med hämtning och återlämning på alla XMG SECTOR Intel. Det finns dock ingen möjlighet att förlänga garantiperioden under beställningsprocessen.
Prestanda - den näst snabbaste Intel CPU:n möter den snabbaste GPU:n
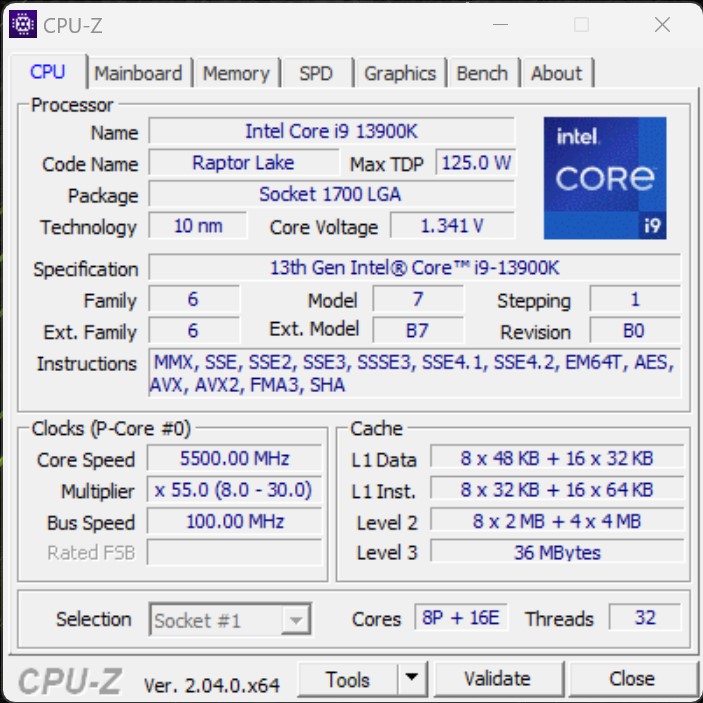
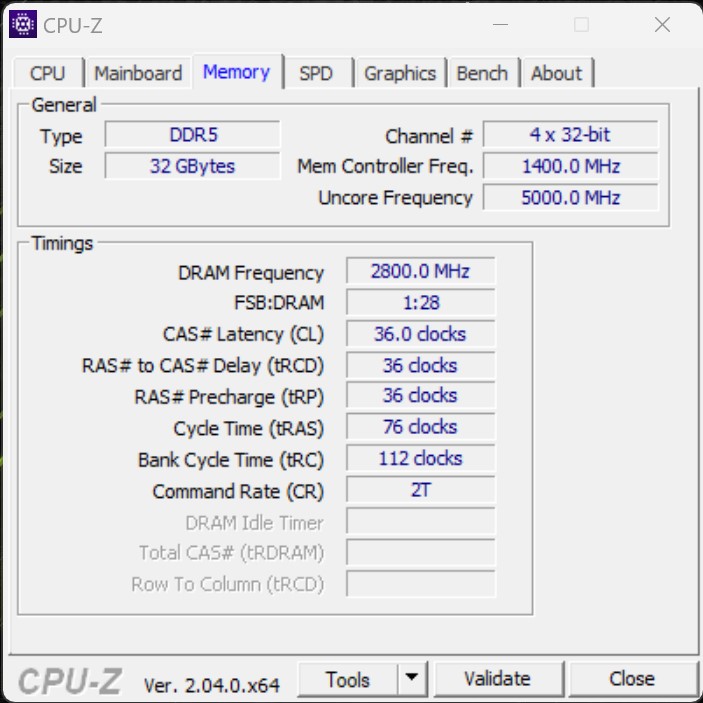
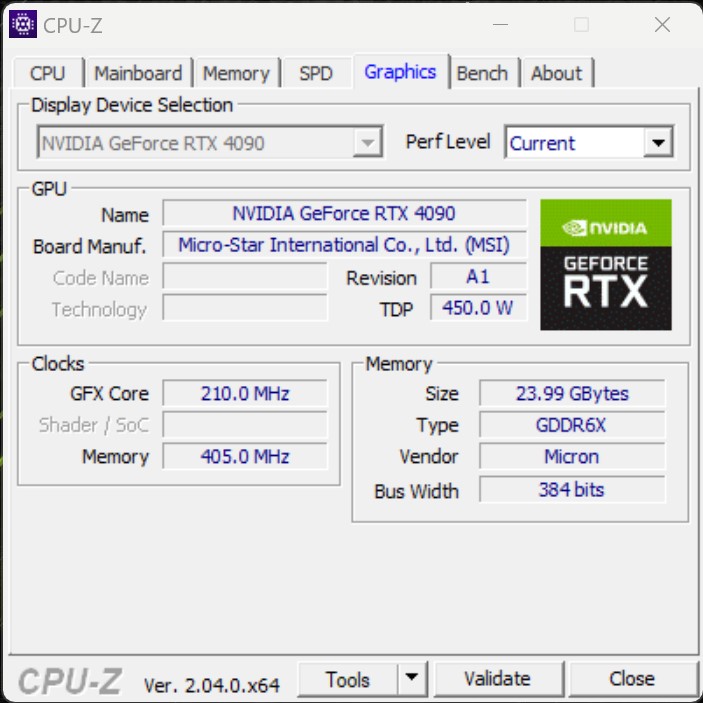
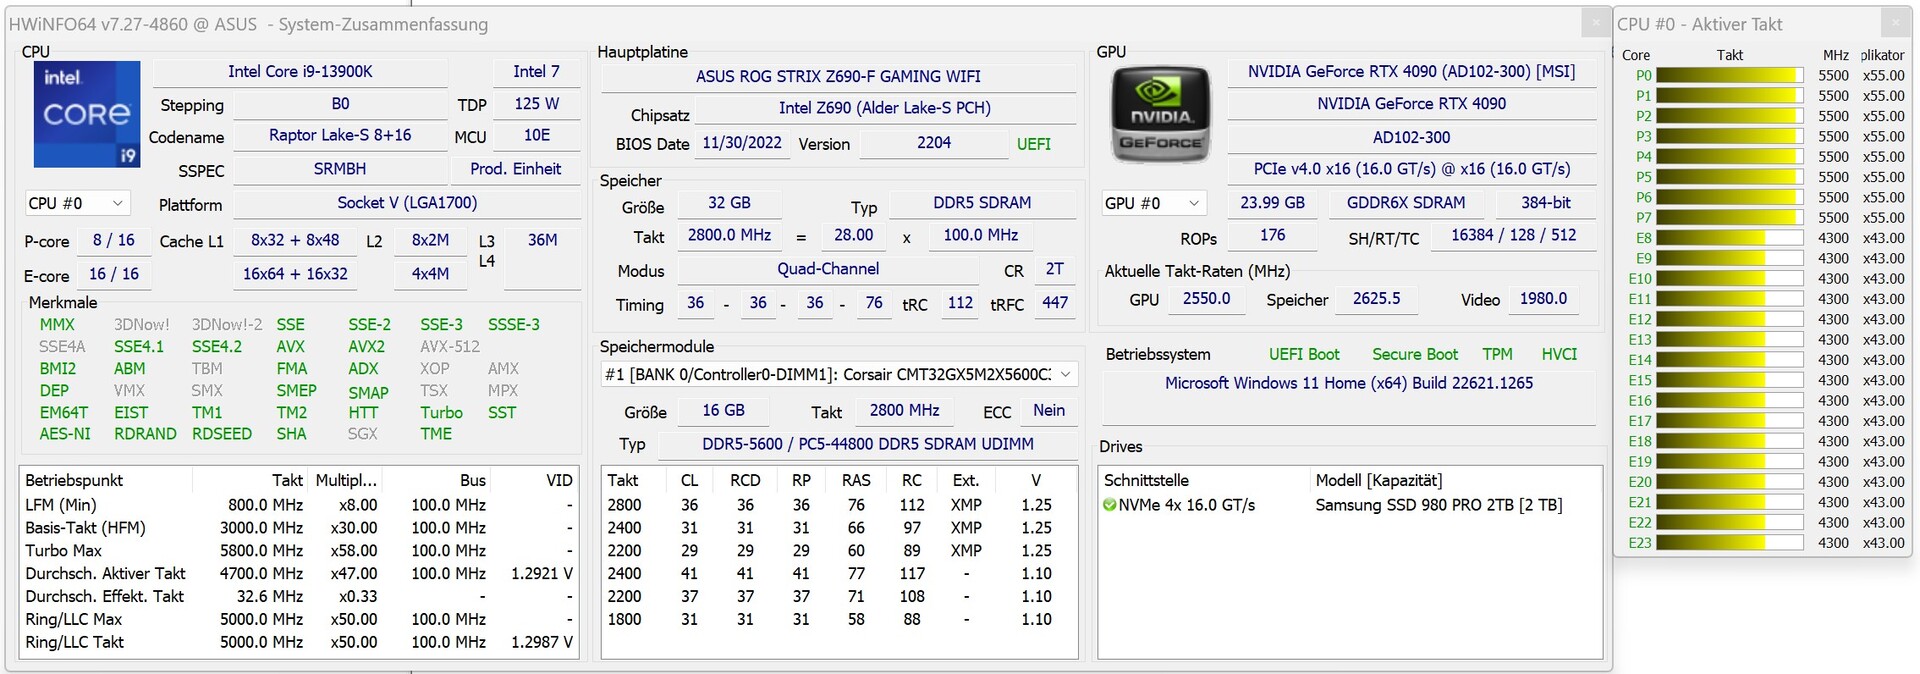
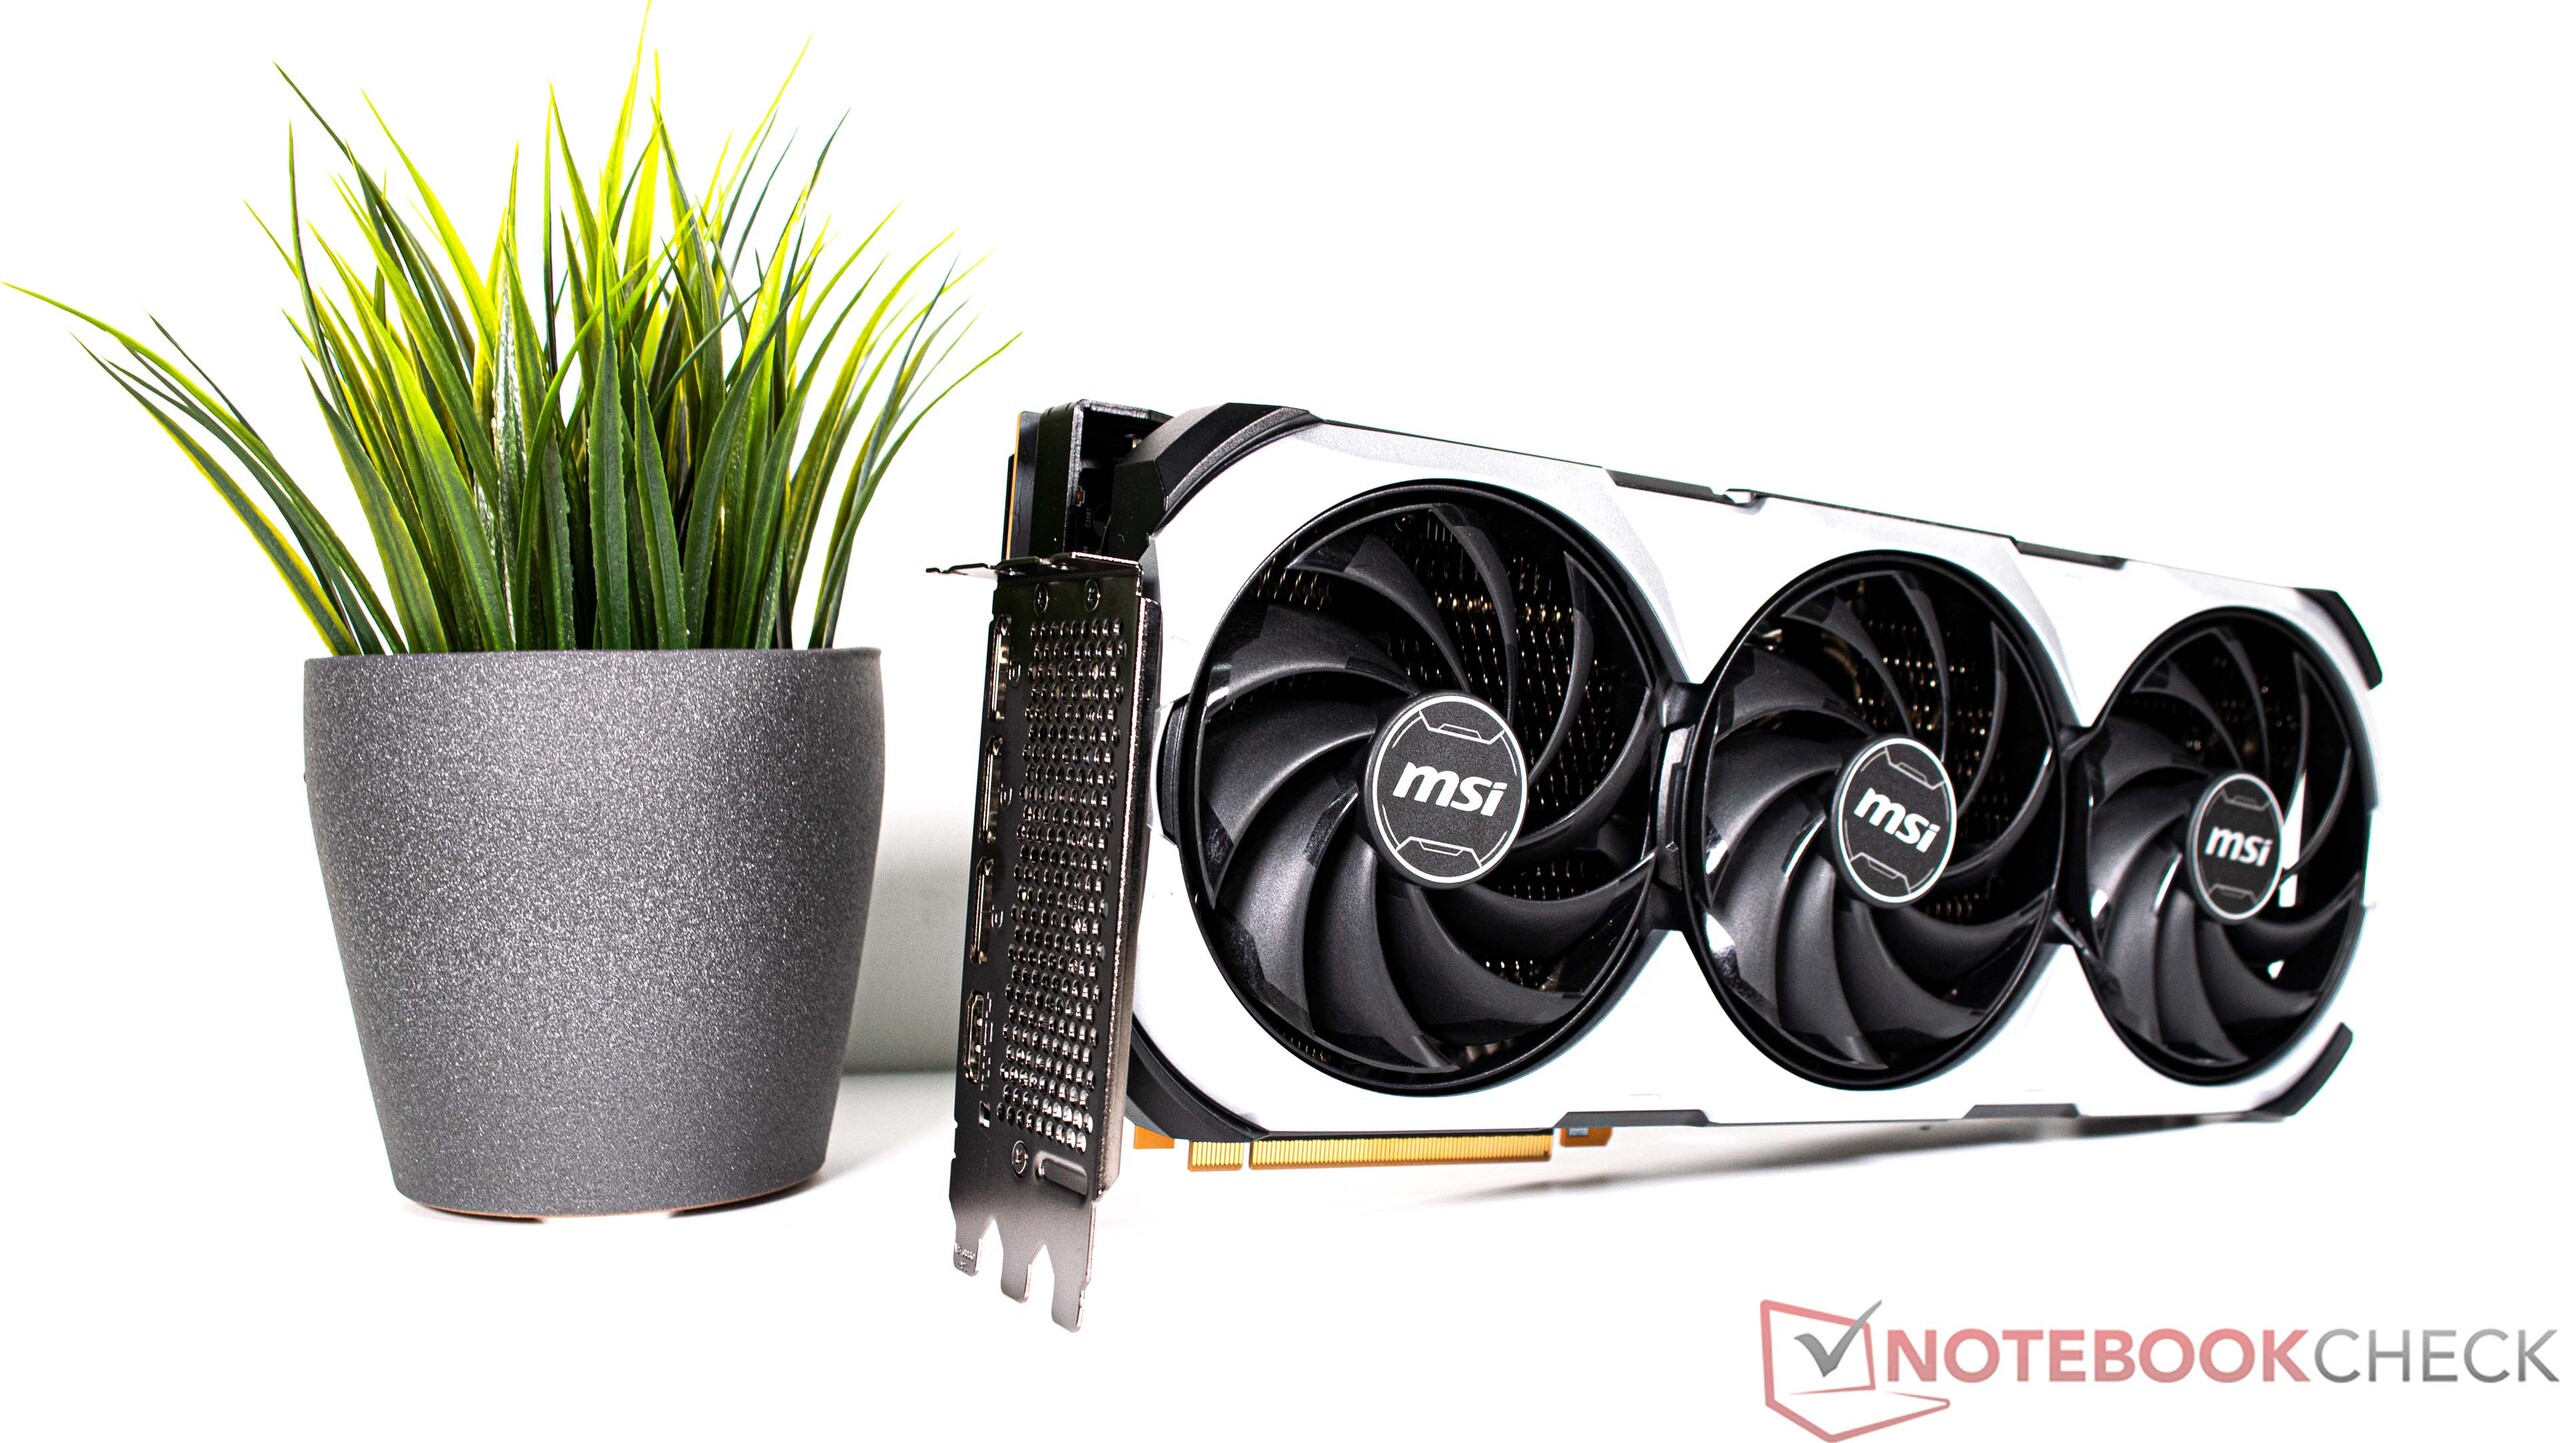
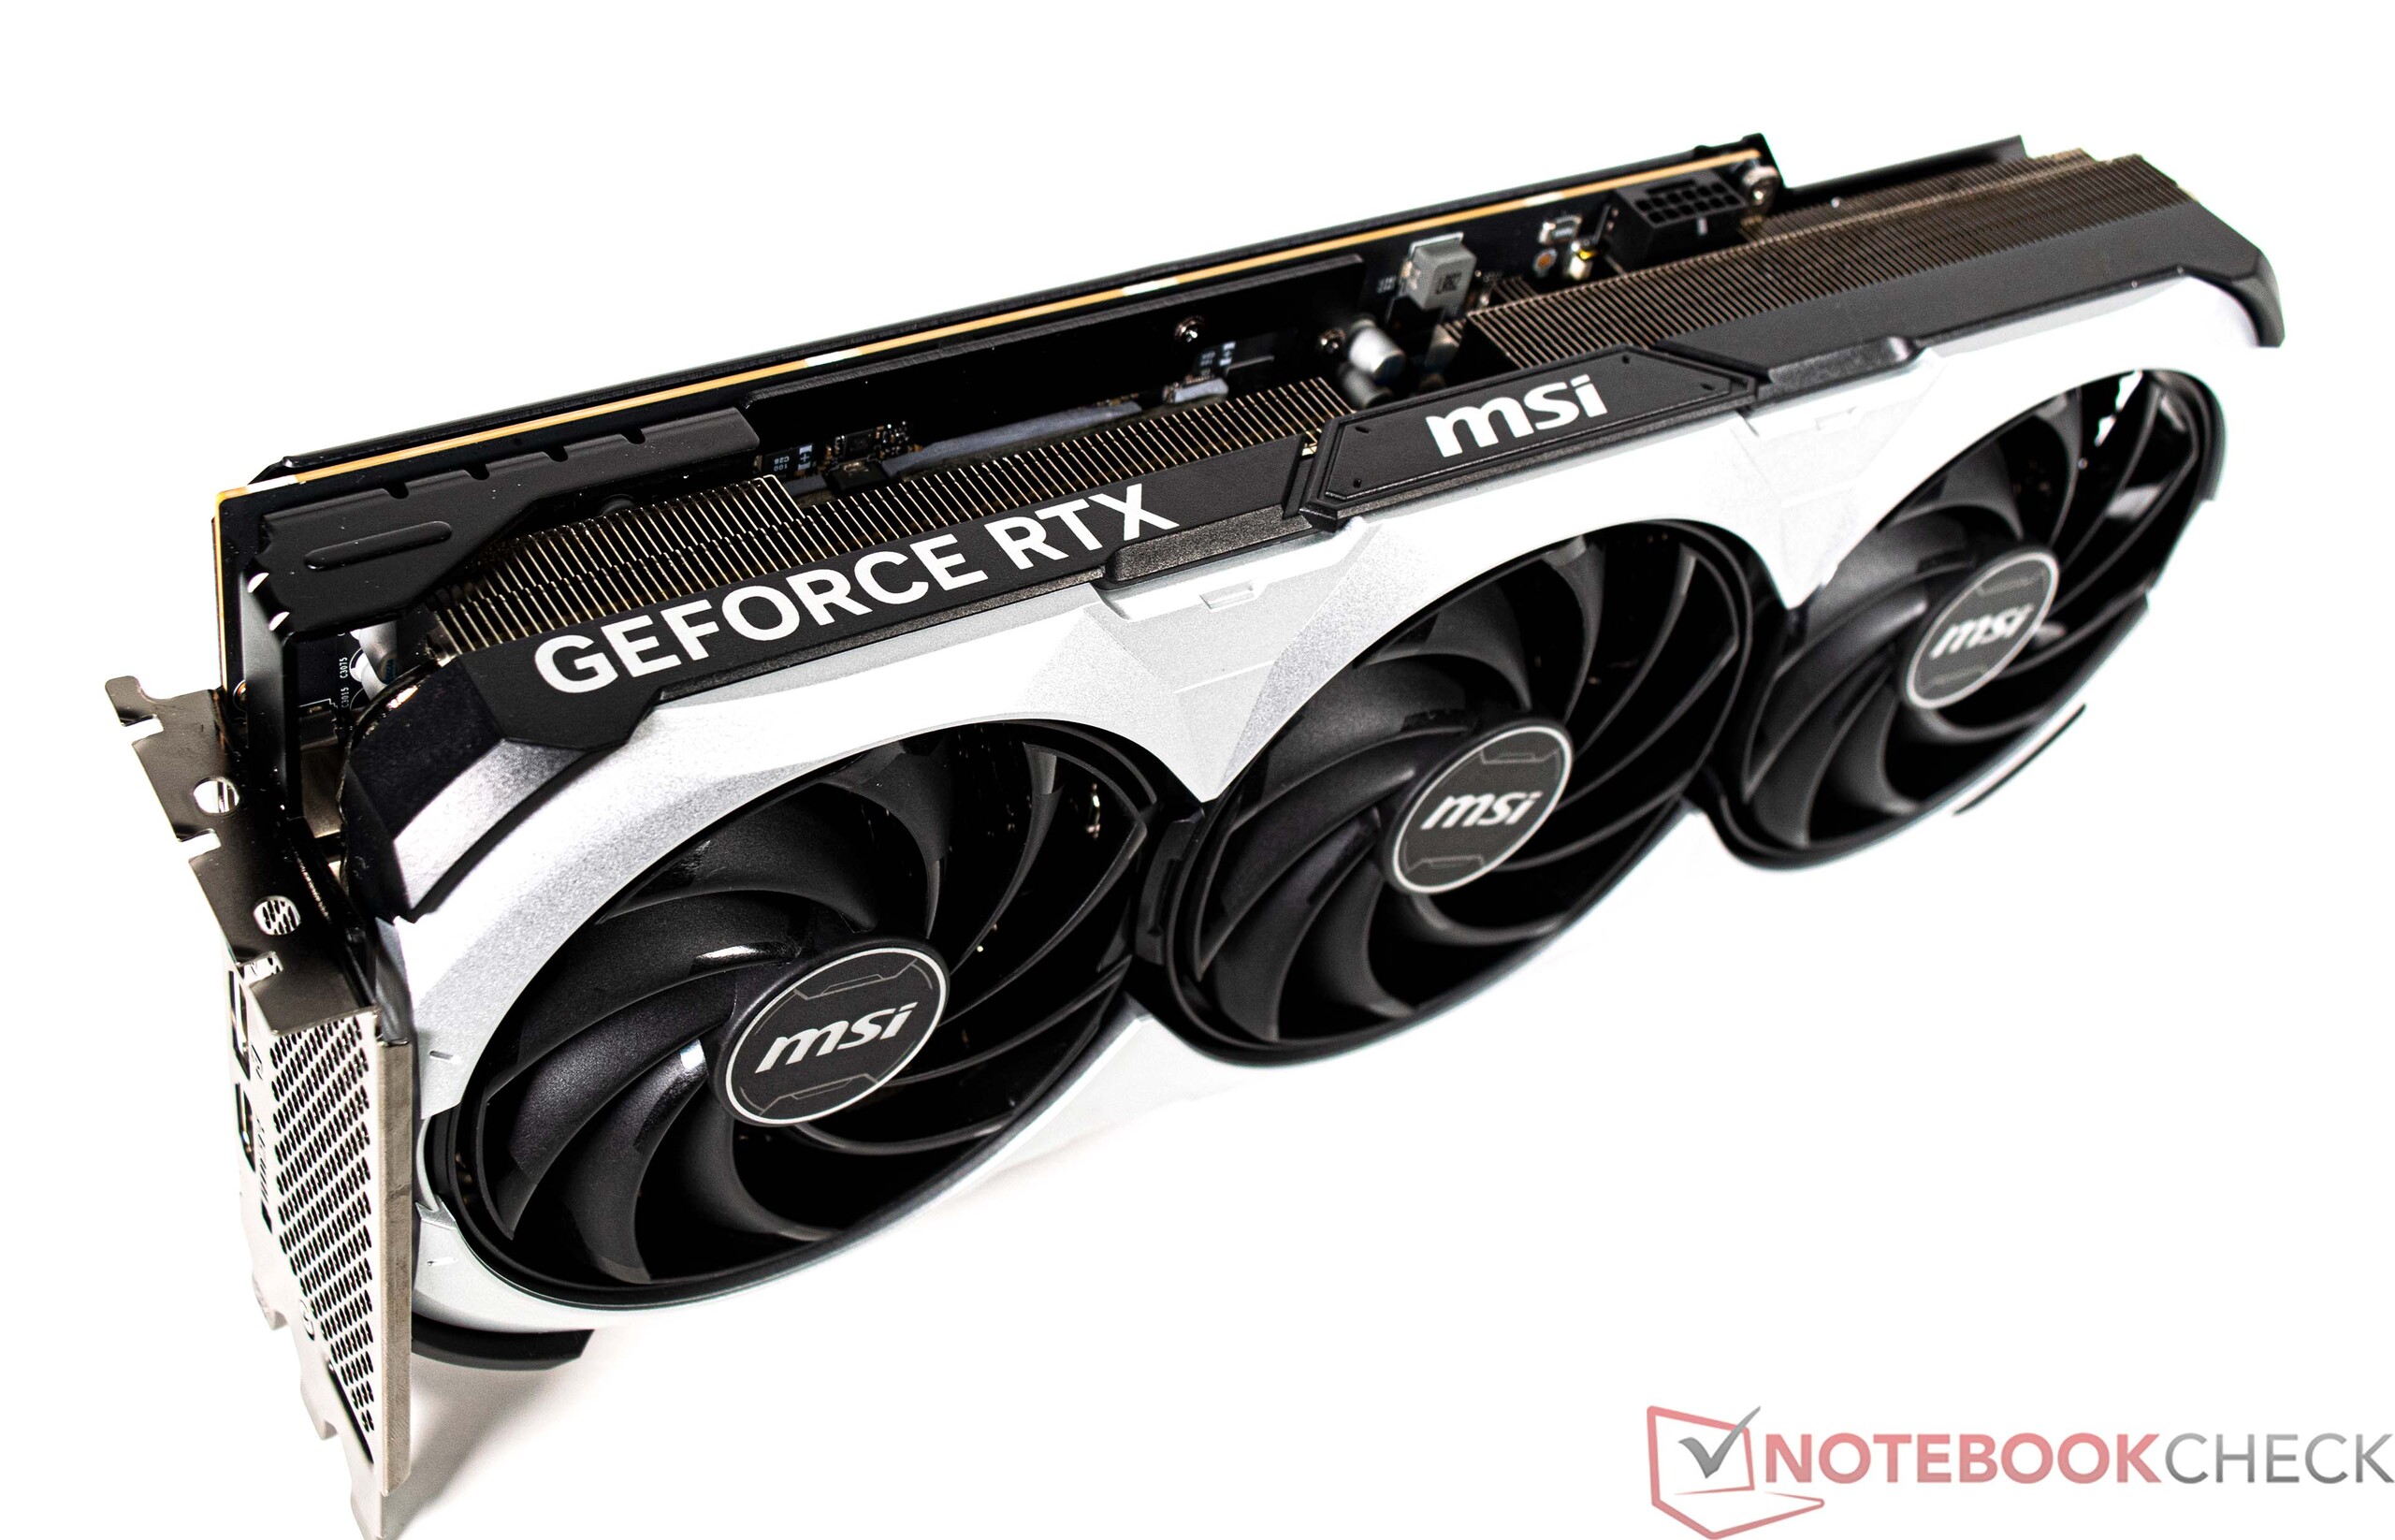
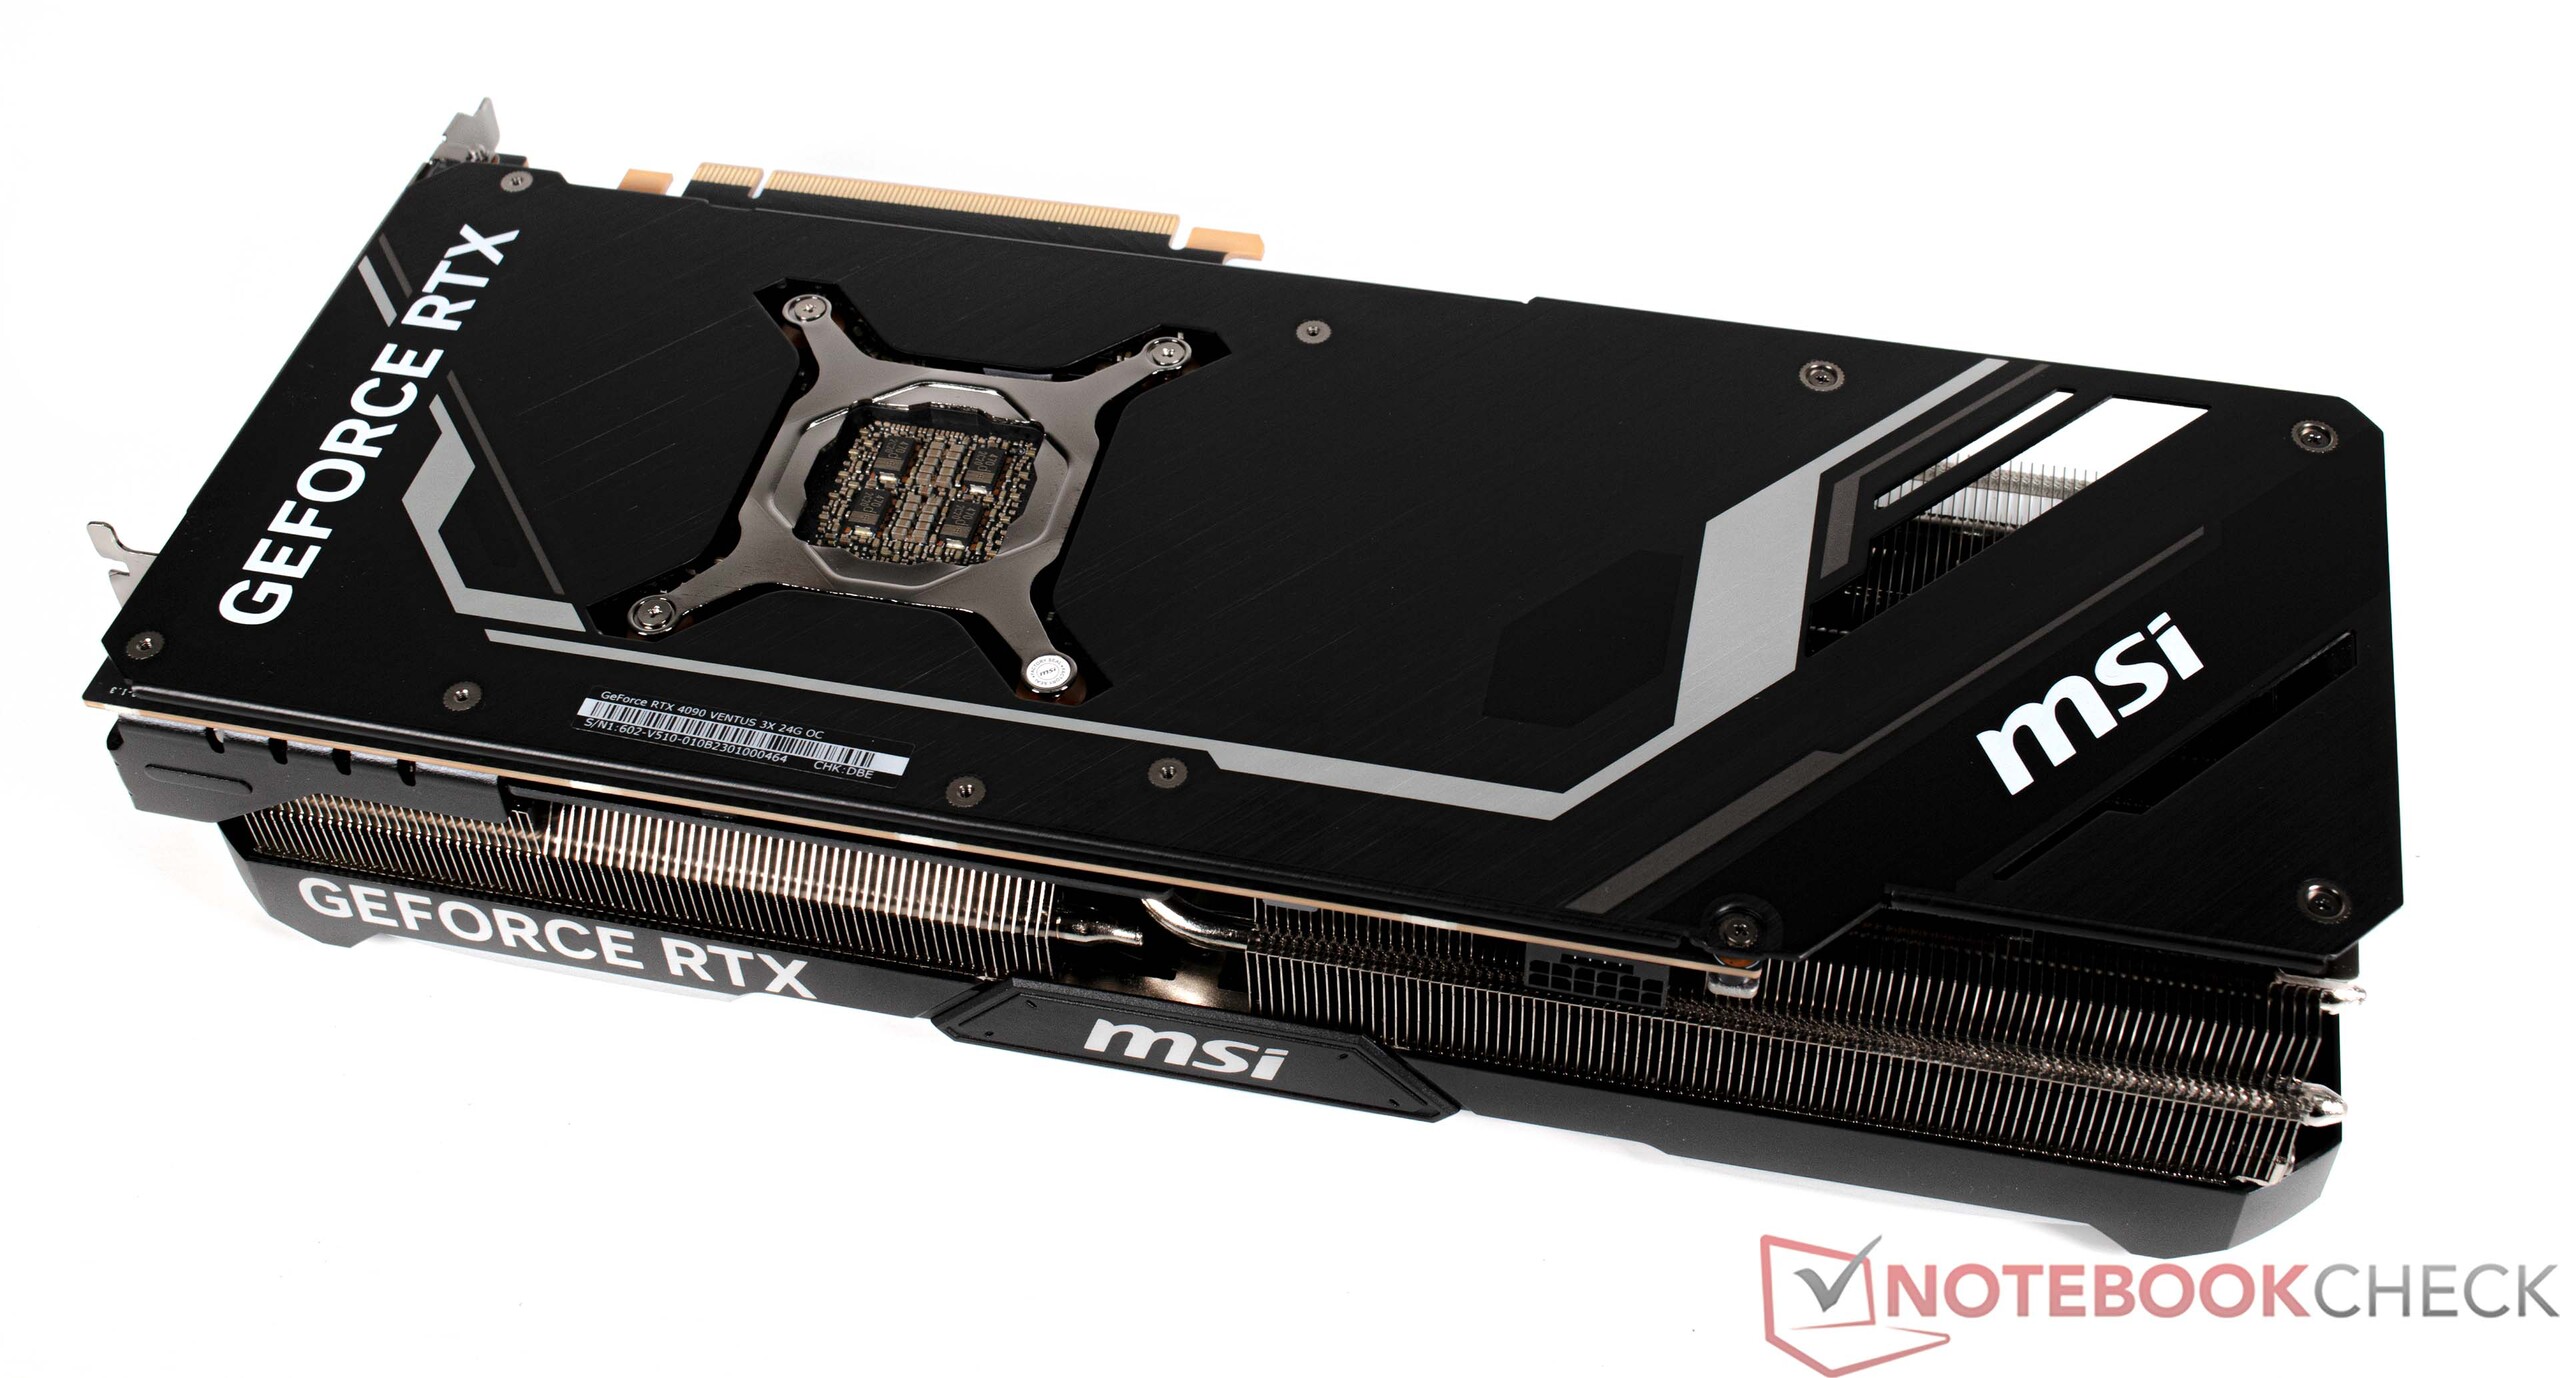
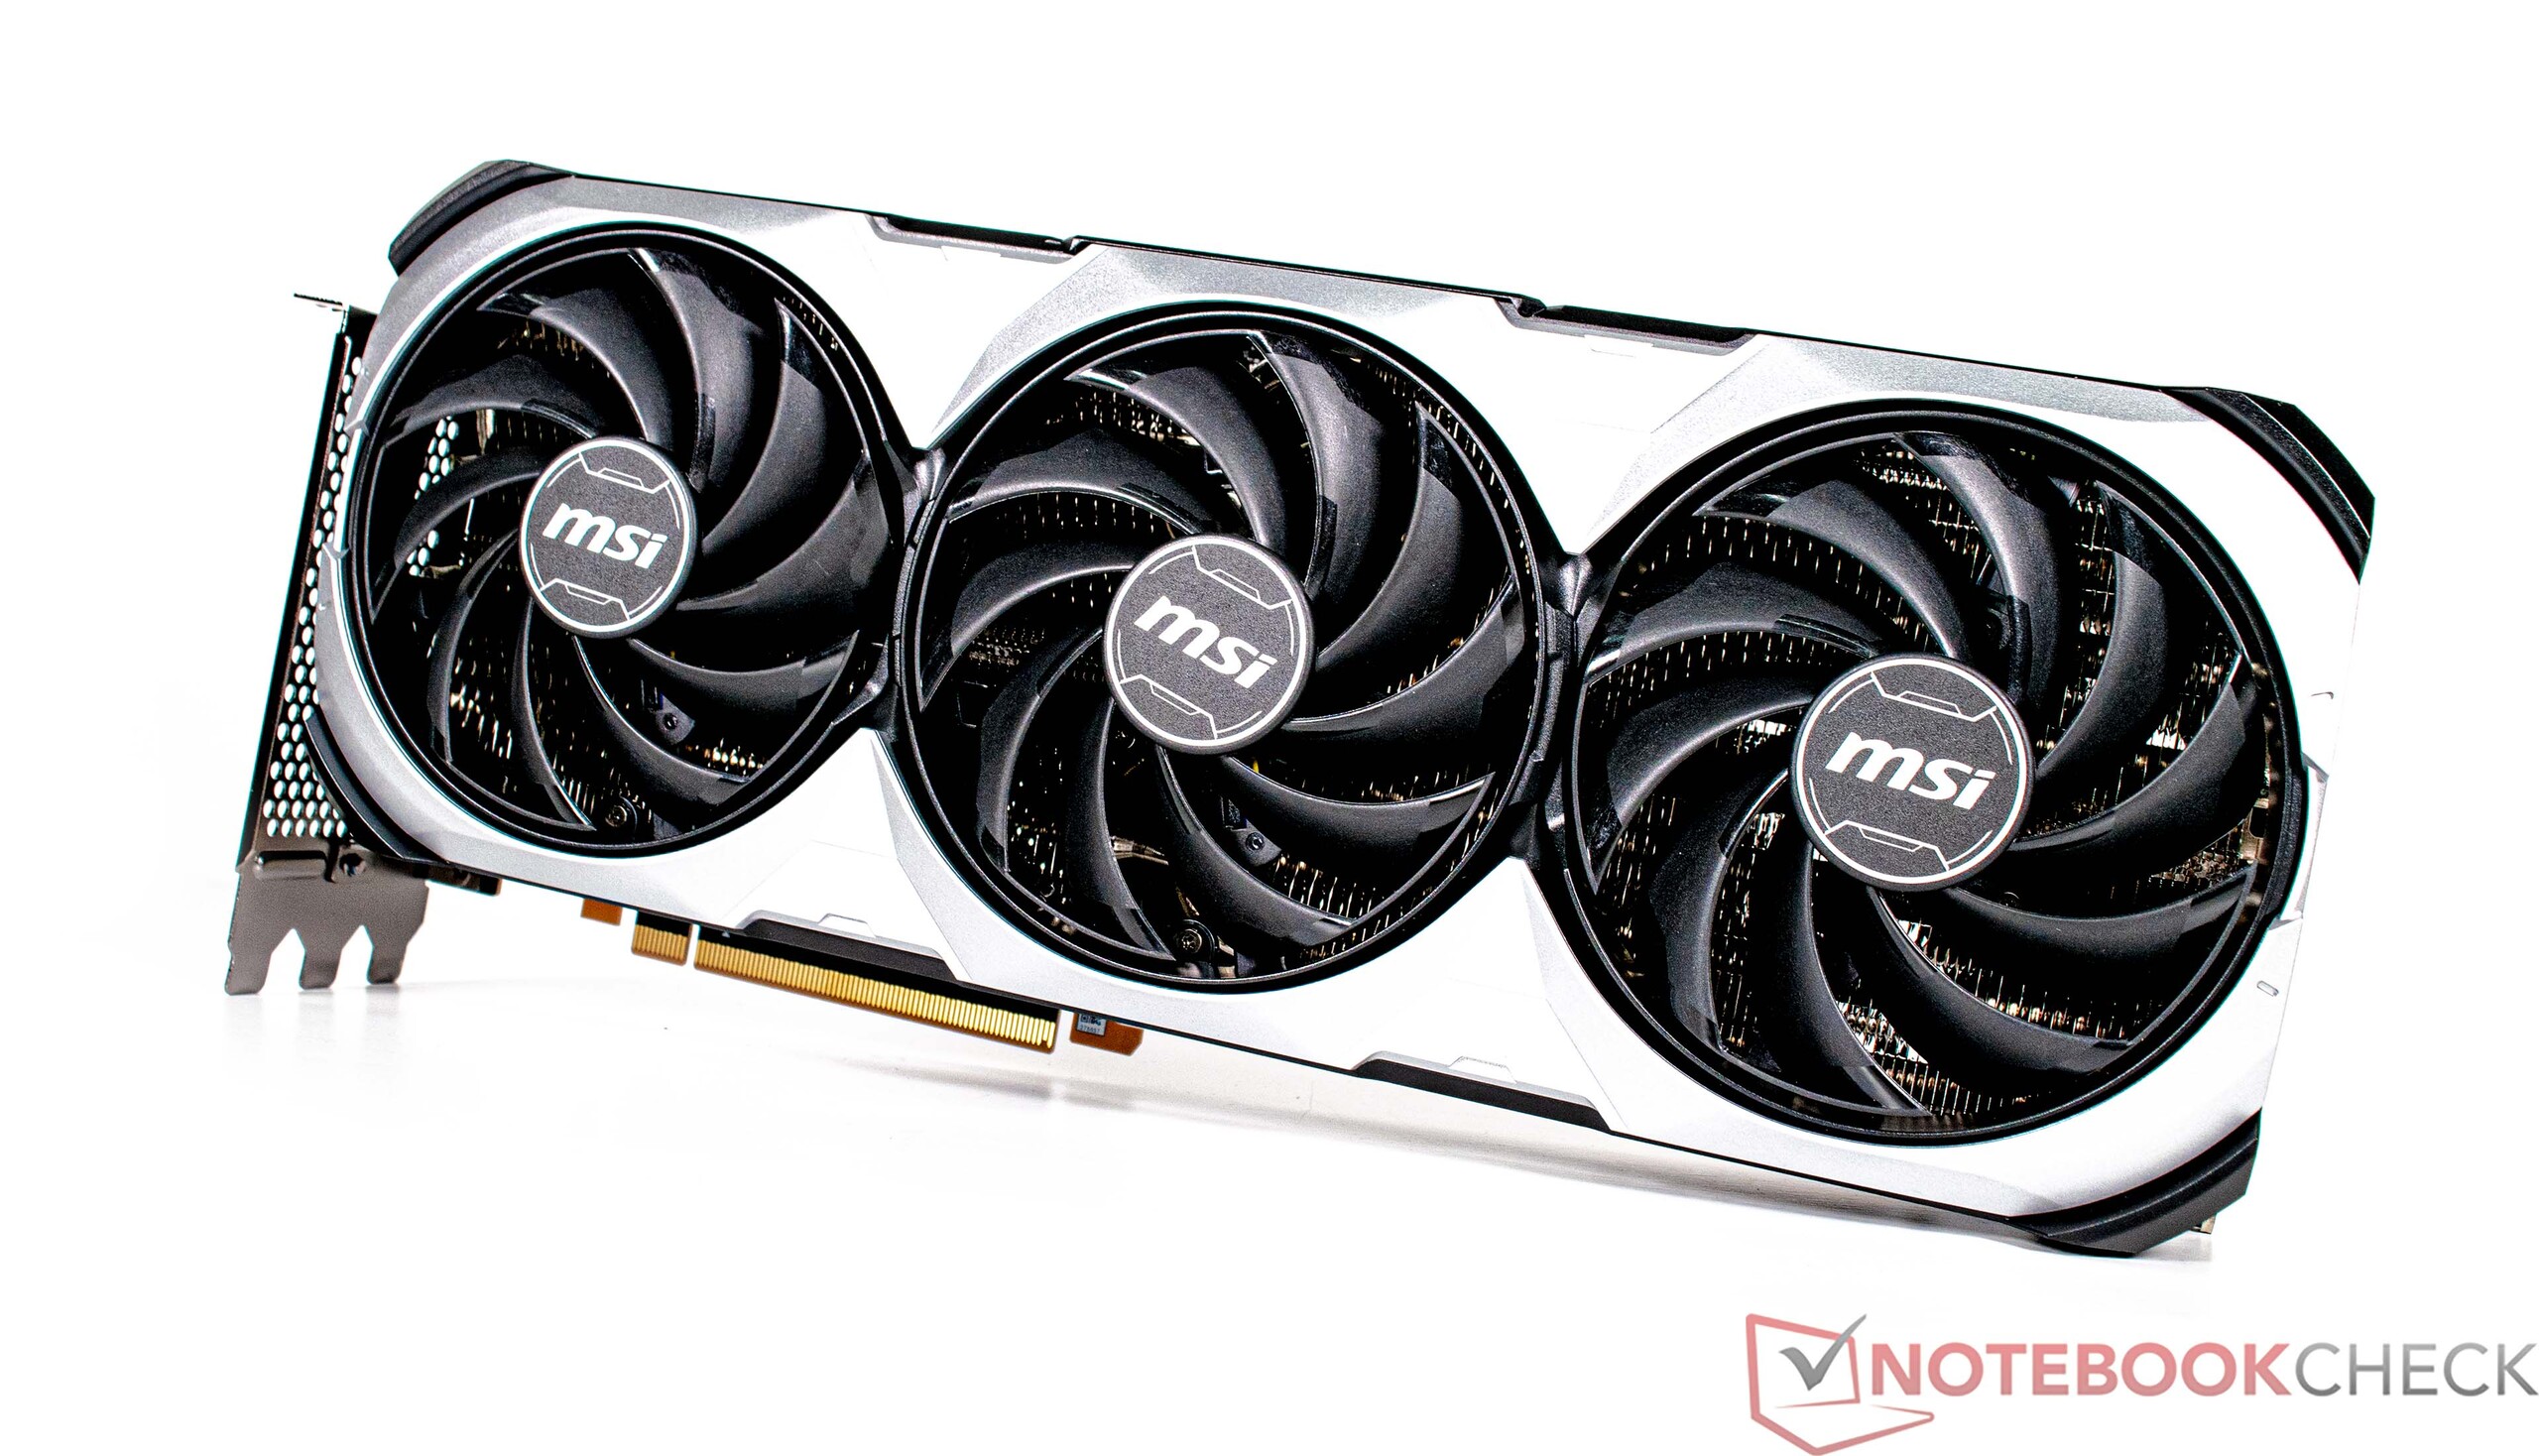
XMG SECTOR Intel i den här recensionen är utrustad med den näst snabbaste Intel-spelprocessorn - Core i9-13900K. Processorn flankeras av 32 GB minne och en SSD med hela 2 TB kapacitet, vilket innebär att systemet har tillräckligt med lagringsutrymme för att rymma PC-spel med stor installationsstorlek. Det medföljande grafikkortet är ett MSI GeForce RTX 4090 VENTUS 3X, vilket är den snabbaste GPU:n för konsumentmarknaden just nu.
Provningsvillkor
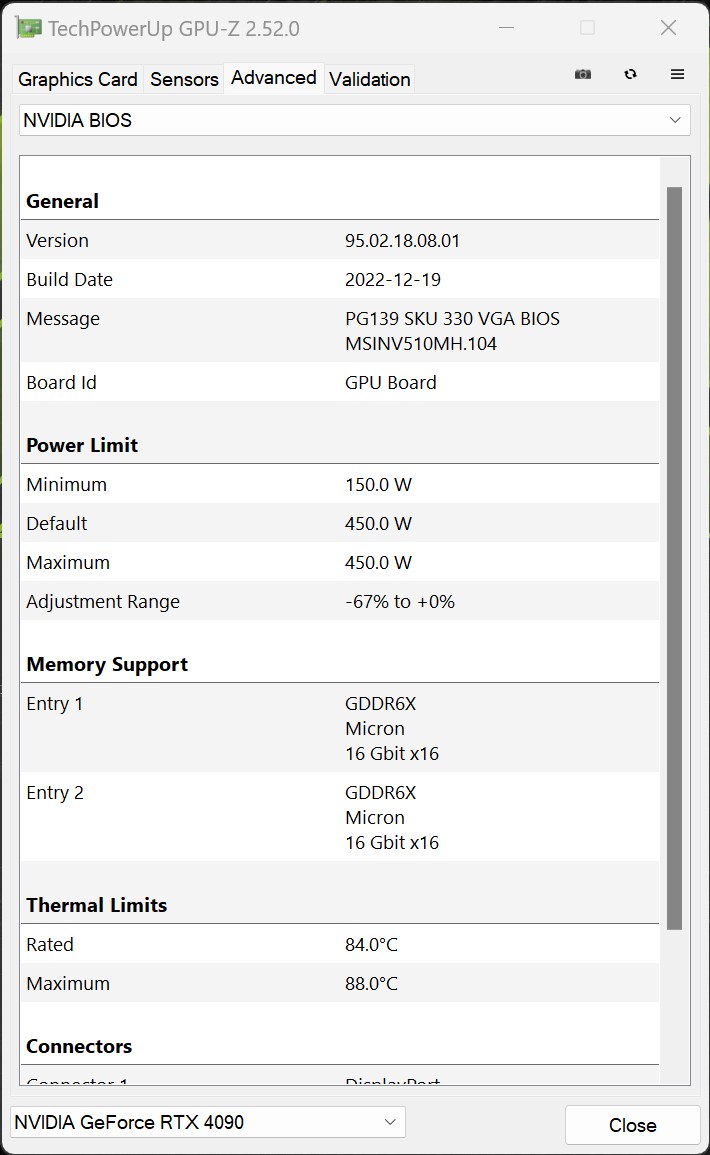
Alla prestandarelaterade tester utfördes med strömprofilen inställd på "Hög prestanda" för att vi ska få bästa möjliga resultat. Dessutom har tillverkaren redan inaktiverat alla begränsningar av CPU-strömförbrukningen i BIOS. Som ett resultat av detta har Core i9-13900K inte begränsad till ett maximalt effektuttag på 253 watt (CPU:ns PL2). Vi bytte endast till en annan strömplan när vi mätte strömförbrukningen och bullernivåerna. Se den här sidan för att få veta mer om våra testkriterier.
Processor
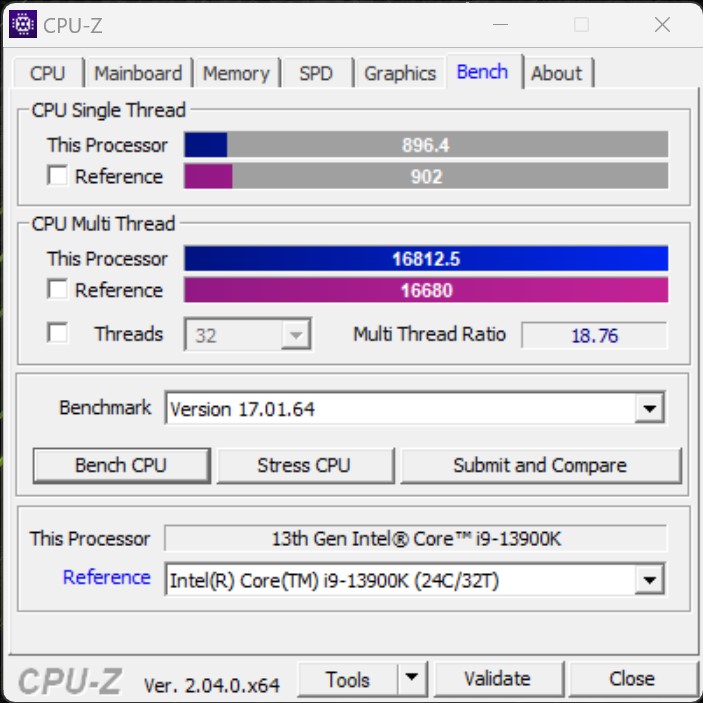
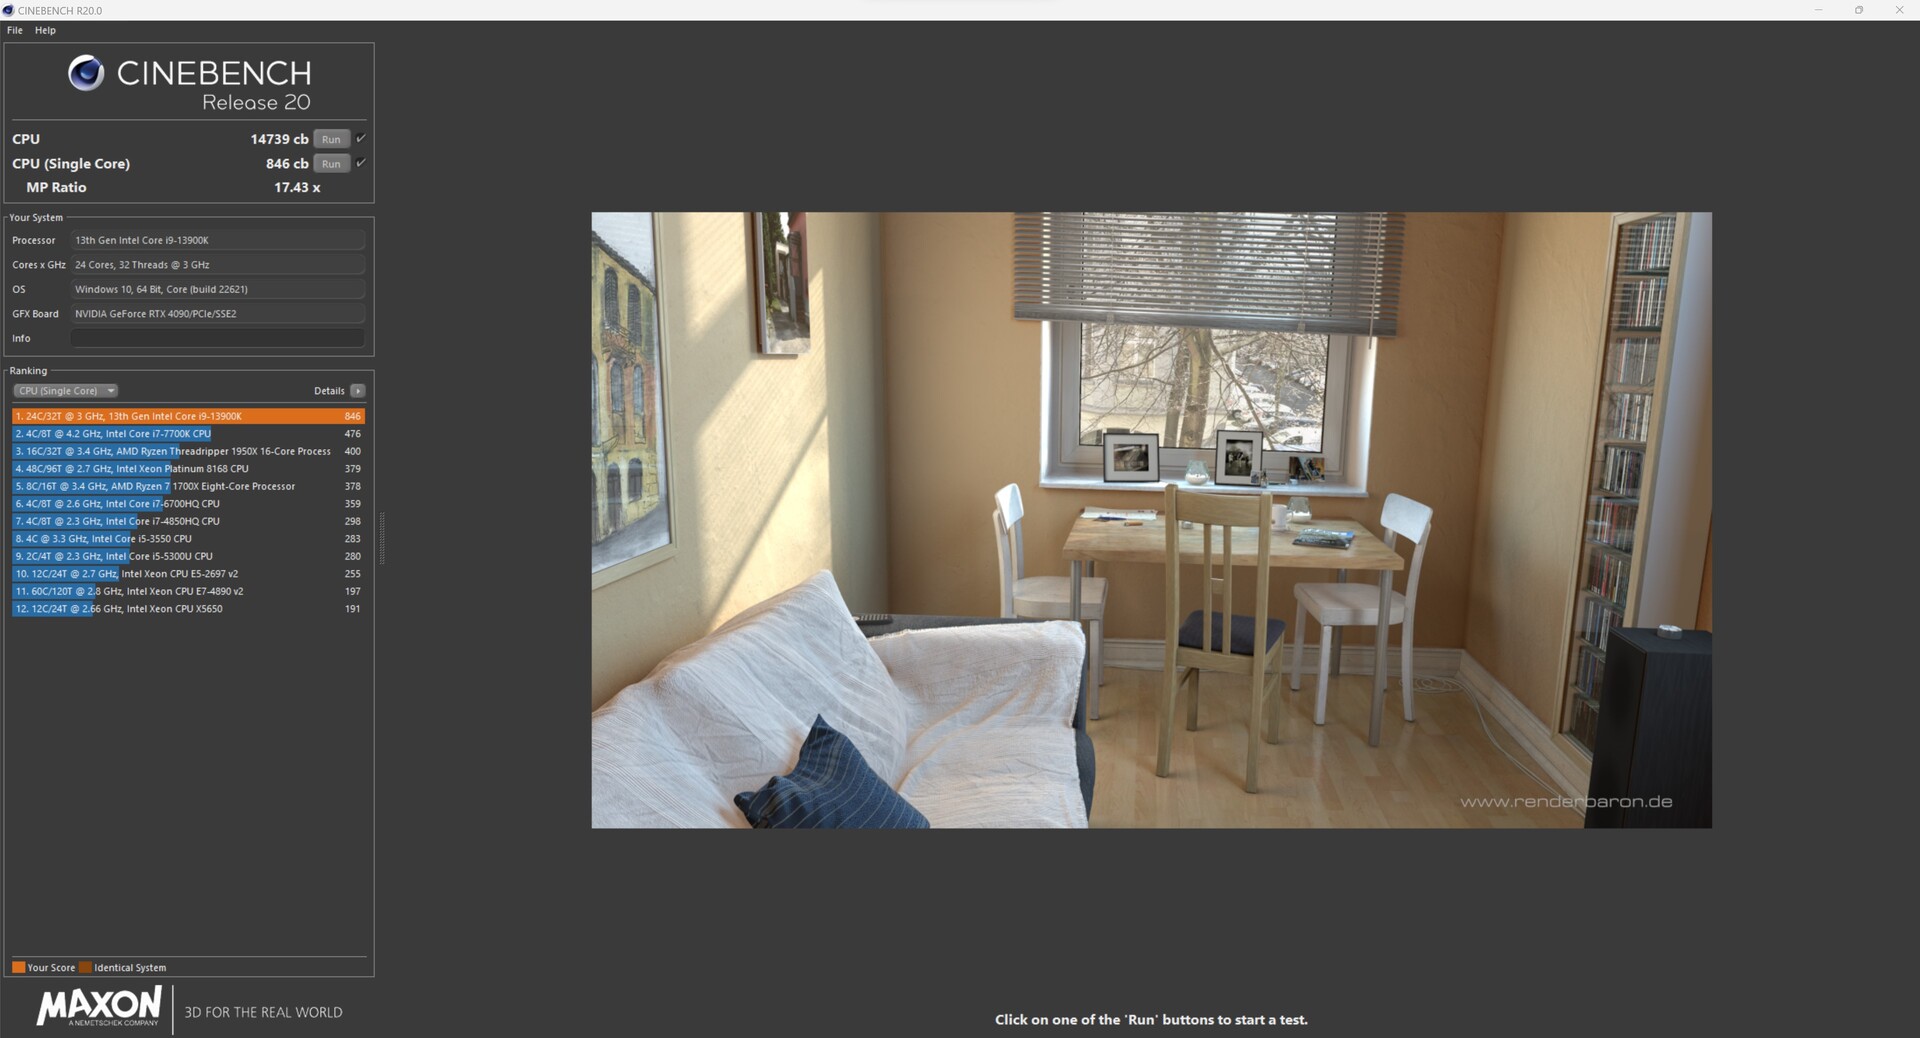
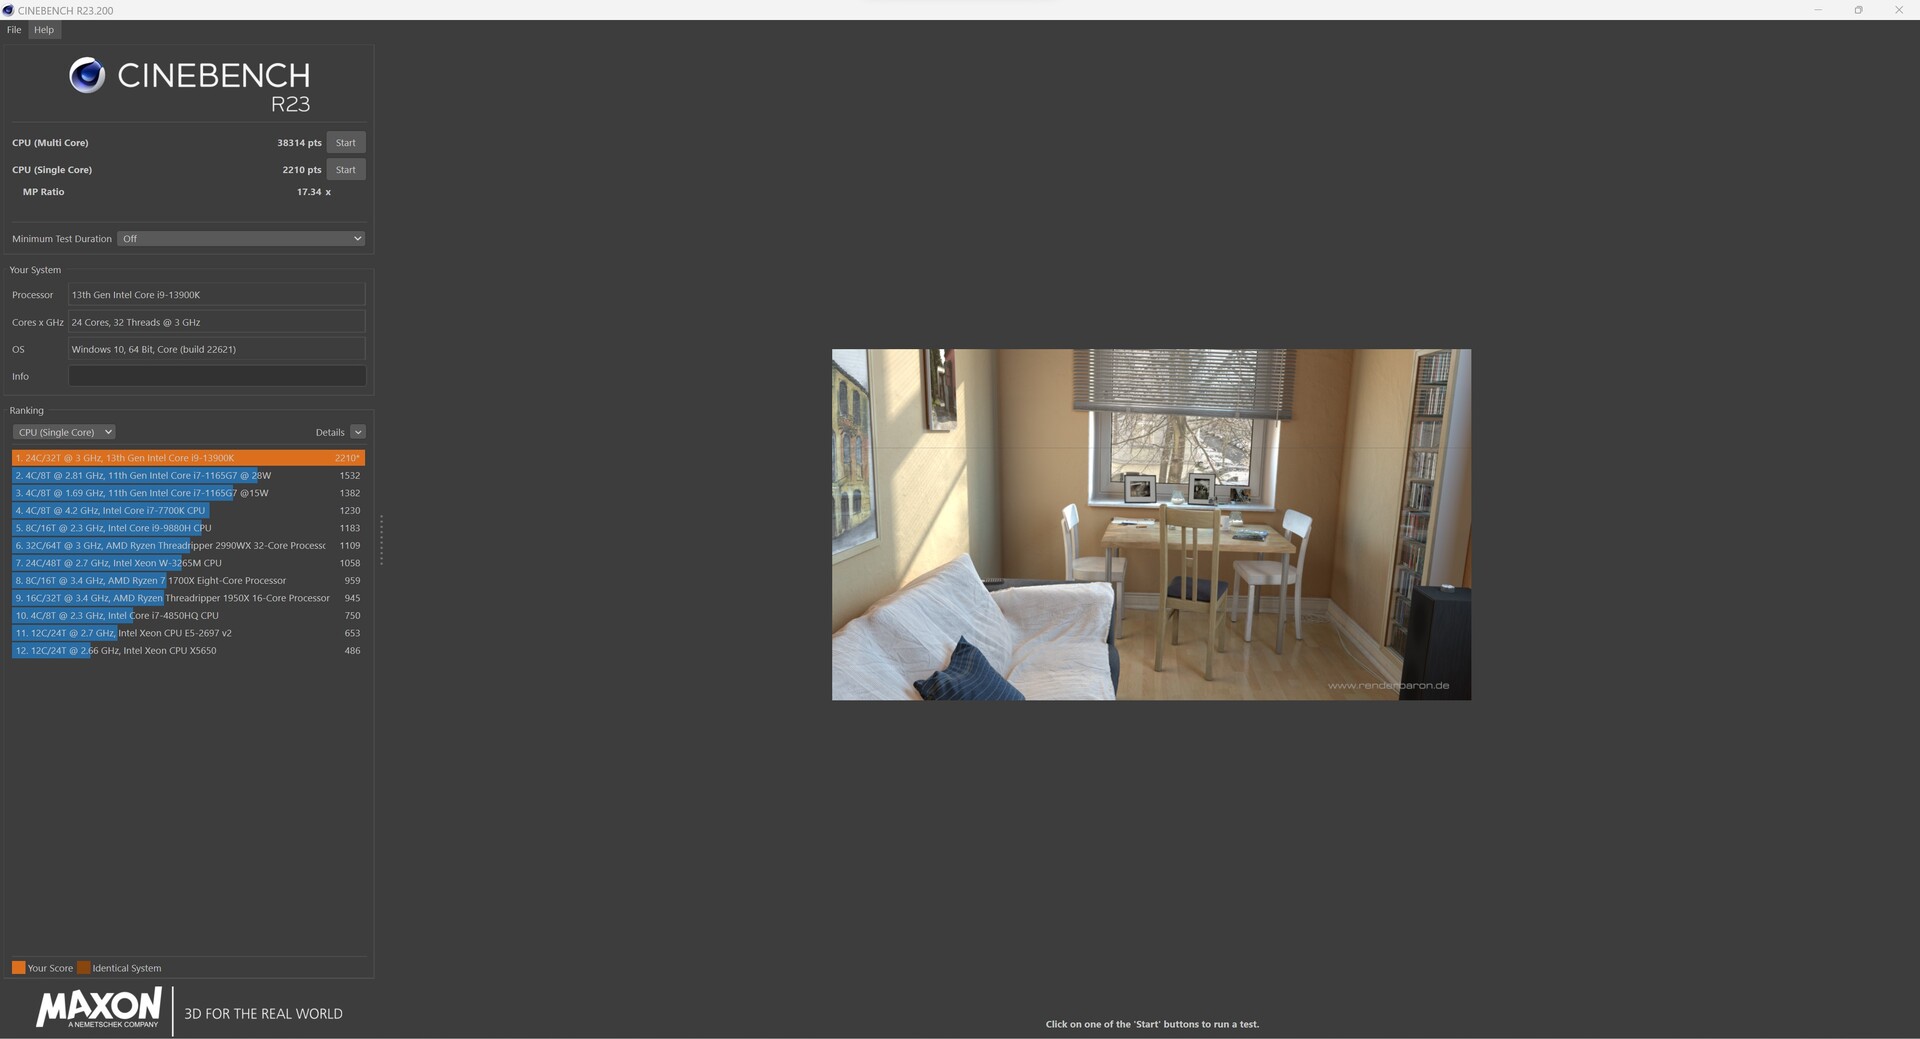
Vår XMG SECTOR Intel drivs av en Core i9-13900Ksom är Intels näst snabbaste spelprocessor för tillfället. De resultat som produceras av recensionsenheten är så bra som man kan förvänta sig. Den ligger hals och hals med de andra enheterna i vår jämförelse. När det gäller prestandaklassificering är skillnaden mellan XMG SECTOR och testsystemet med liknande specifikationer extremt liten, bara 2 %, och kan nästan tillskrivas mätningstoleranser.
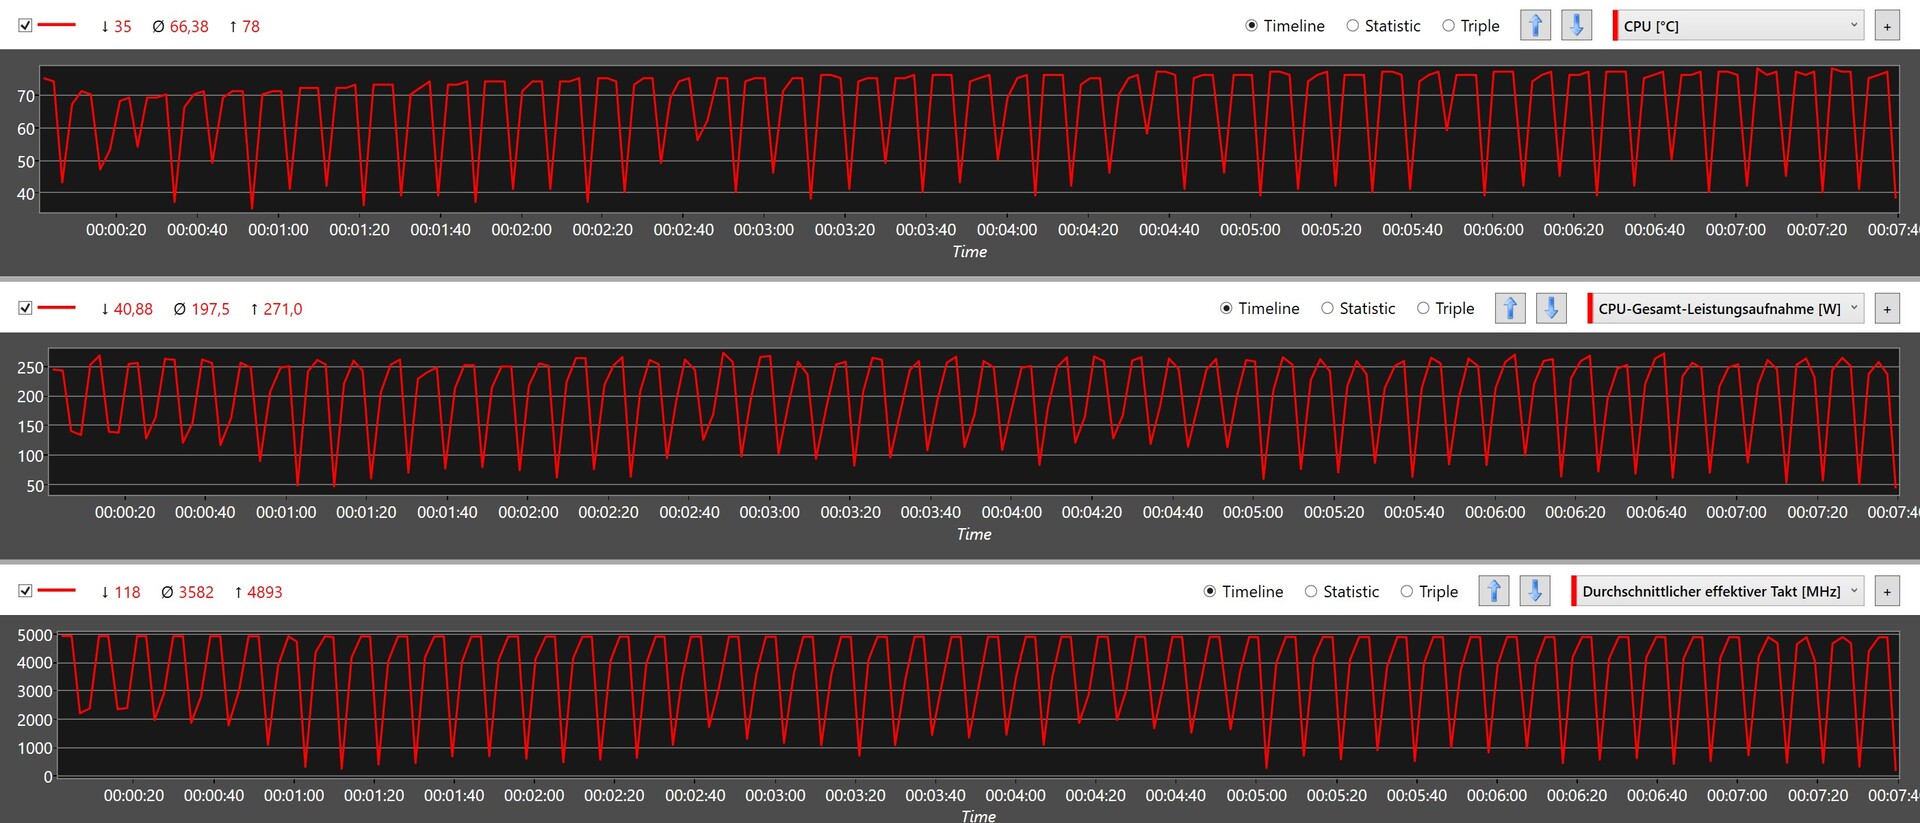
Processorn är inte bunden av några effektgränser eftersom alla restriktioner har upphävts. Följaktligen begränsas processorns prestanda av temperaturen, vilket går hand i hand med den installerade AIO-kylaren.
Du kan hitta fler processorbenchmarks på den här sidan.

* ... mindre är bättre
XMG SECTOR Intel i Cinebench R15 Multi loop
Genom att köra Cinebench R15 i en slinga fick vi en första titt på hur effektiv kylningslösningen är i datorn. Det fanns ingen märkbar nedgång i prestanda efter de första körningarna. XMG SECTOR Intel presterade mycket bra och fick en genomsnittlig poäng på 5 917.
Systemprestanda
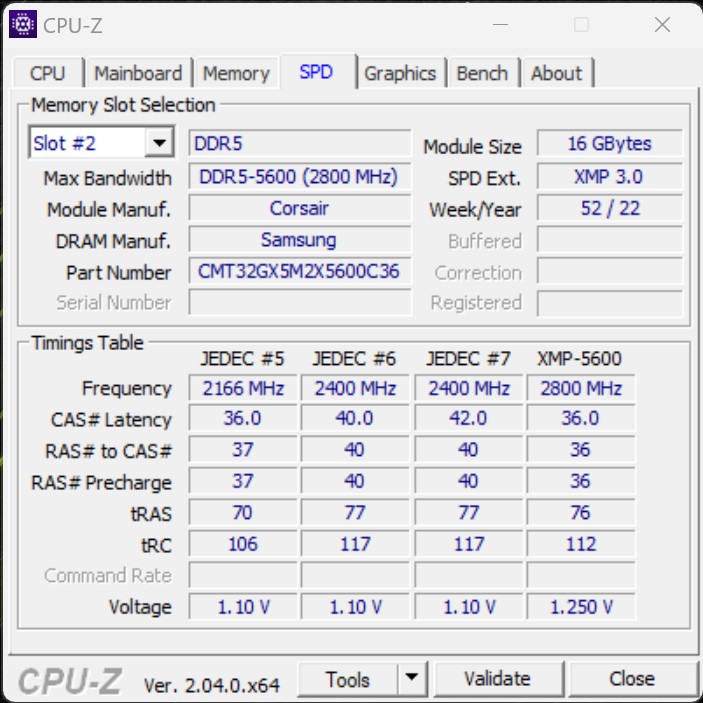
XMG SECTOR Intel var extremt snabb i syntetiska riktmärken, vilket gör att den ligger på samma nivå som konkurrenterna. Dessutom levererade vår recensionsenhet enastående prestanda i AIDA64-minnestesterna och lyckades säkra förstaplatsen tack vare det snabba minnet (DDR5-5600) och låga latenser. Under vår tid med XMG SECTOR Intel körde den konsekvent mycket snabbt utan någon betydande latens.
| Performance rating - Percent | |
| AMD Ryzen 9 7900X | |
| NVIDIA GeForce RTX 3090 Founders Edition | |
| Intel Core i9-13900K | |
| Schenker XMG SECTOR, i9 13900K, RTX 4090 | |
| Intel Core i5-13600K | |
| Intel NUC13 Raptor Canyon | |
| Corsair One i300 | |
| Intel Core i9-12900K | |
| Intel Dragon Canyon NUC - RTX 3060 | |
| Minisforum Neptune Series NAD9 | |
| AIDA64 / Memory Copy | |
| Schenker XMG SECTOR, i9 13900K, RTX 4090 | |
| Intel Core i9-13900K | |
| Genomsnitt Intel Core i9-13900K (68722 - 80203, n=4) | |
| Corsair One i300 | |
| Intel Core i9-12900K | |
| NVIDIA GeForce RTX 3090 Founders Edition | |
| Intel Core i5-13600K | |
| Genomsnitt av klass Desktop (54743 - 98416, n=21, senaste 2 åren) | |
| AMD Ryzen 9 7900X | |
| Intel NUC13 Raptor Canyon | |
| Minisforum Neptune Series NAD9 | |
| Intel Dragon Canyon NUC - RTX 3060 | |
| AIDA64 / Memory Read | |
| Schenker XMG SECTOR, i9 13900K, RTX 4090 | |
| Intel Core i9-13900K | |
| Genomsnitt Intel Core i9-13900K (73392 - 88780, n=4) | |
| Intel Core i9-12900K | |
| NVIDIA GeForce RTX 3090 Founders Edition | |
| Intel Core i5-13600K | |
| Genomsnitt av klass Desktop (58375 - 110448, n=21, senaste 2 åren) | |
| AMD Ryzen 9 7900X | |
| Corsair One i300 | |
| Intel NUC13 Raptor Canyon | |
| Intel Dragon Canyon NUC - RTX 3060 | |
| Minisforum Neptune Series NAD9 | |
| AIDA64 / Memory Write | |
| NVIDIA GeForce RTX 3090 Founders Edition | |
| Genomsnitt av klass Desktop (60635 - 93889, n=21, senaste 2 åren) | |
| Schenker XMG SECTOR, i9 13900K, RTX 4090 | |
| AMD Ryzen 9 7900X | |
| Intel Core i9-13900K | |
| Genomsnitt Intel Core i9-13900K (68948 - 78678, n=4) | |
| Intel Core i9-12900K | |
| Intel Core i5-13600K | |
| Corsair One i300 | |
| Intel NUC13 Raptor Canyon | |
| Minisforum Neptune Series NAD9 | |
| Intel Dragon Canyon NUC - RTX 3060 | |
| AIDA64 / Memory Latency | |
| Minisforum Neptune Series NAD9 | |
| Intel NUC13 Raptor Canyon | |
| Genomsnitt av klass Desktop (68.5 - 168, n=21, senaste 2 åren) | |
| Intel Dragon Canyon NUC - RTX 3060 | |
| Corsair One i300 | |
| Intel Core i5-13600K | |
| Genomsnitt Intel Core i9-13900K (72.6 - 93.4, n=4) | |
| Intel Core i9-13900K | |
| Schenker XMG SECTOR, i9 13900K, RTX 4090 | |
| AMD Ryzen 9 7900X | |
| NVIDIA GeForce RTX 3090 Founders Edition | |
* ... mindre är bättre
Masslagring
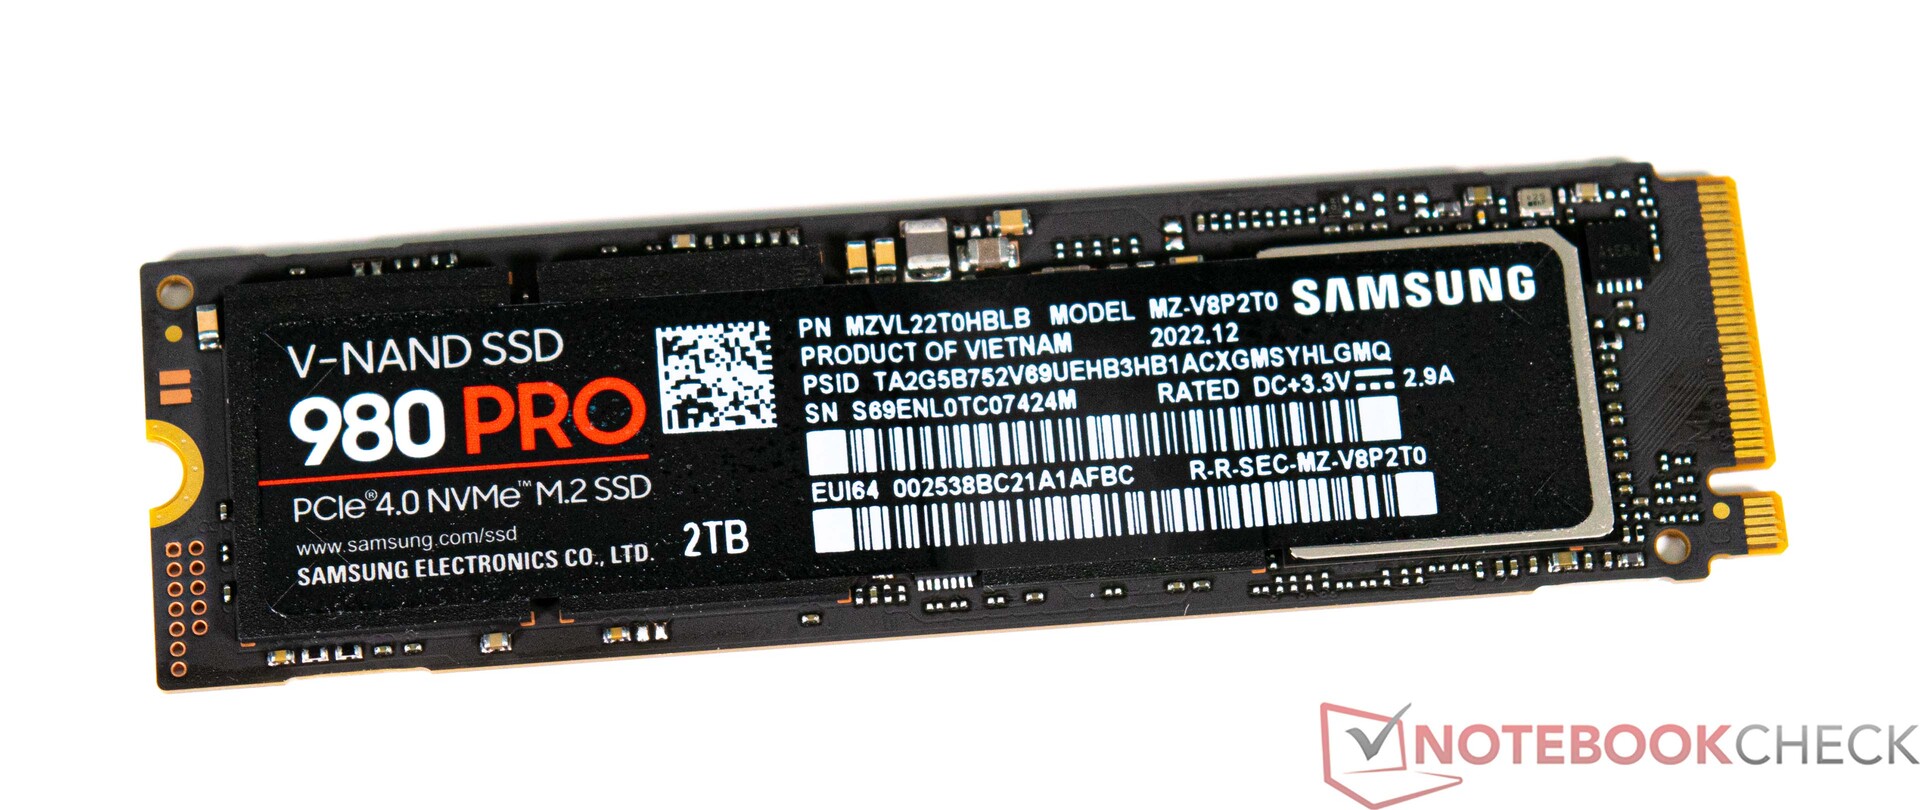
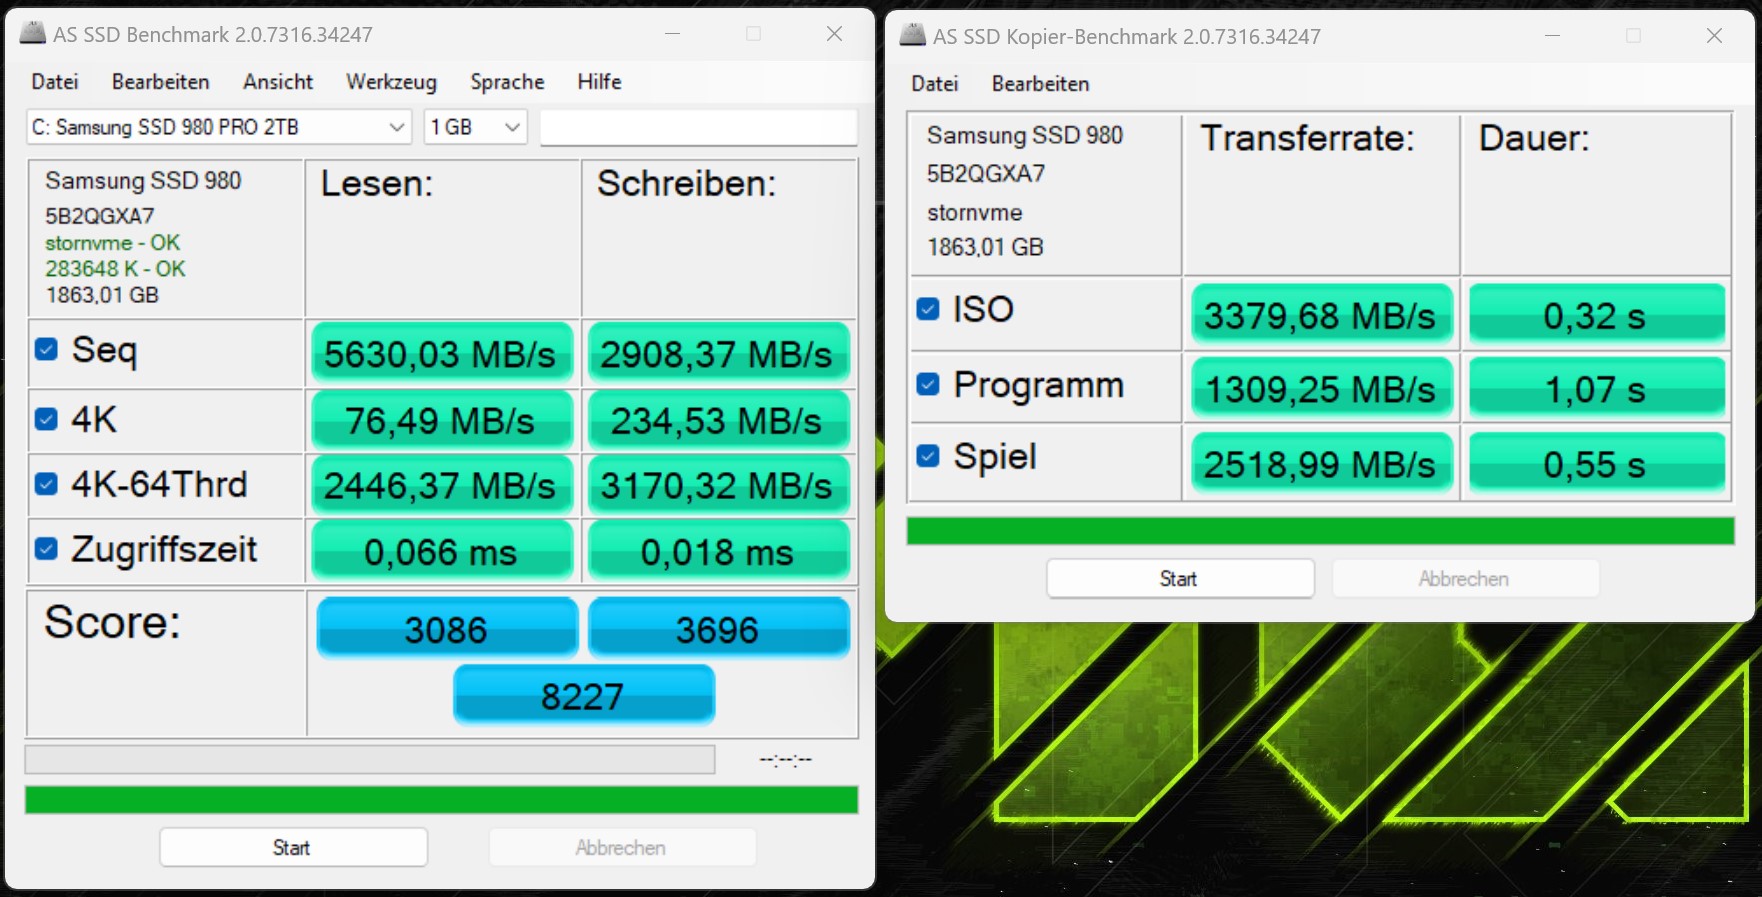
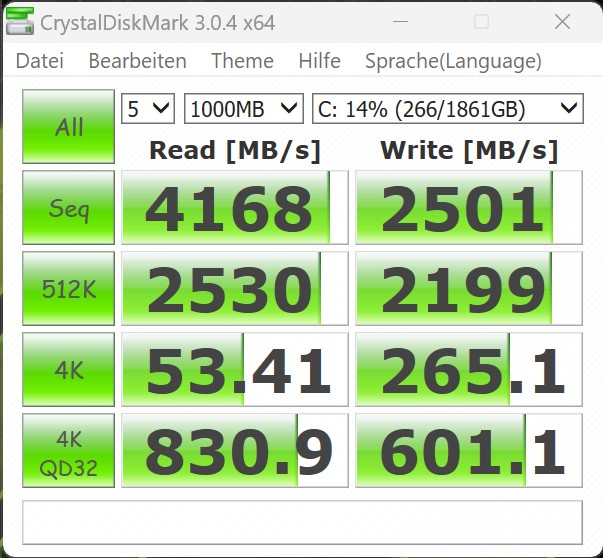
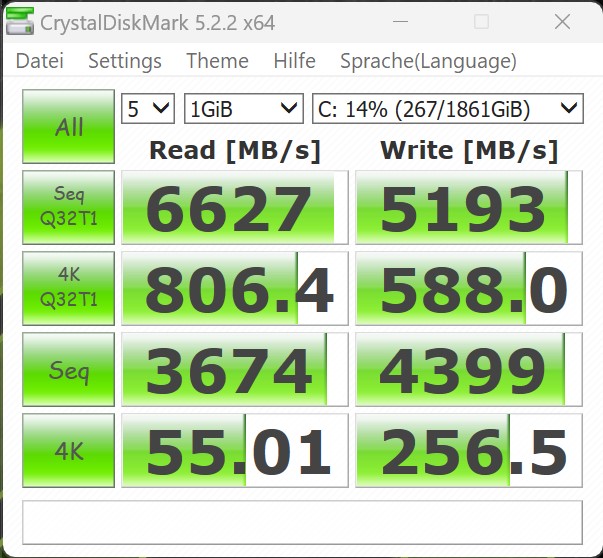
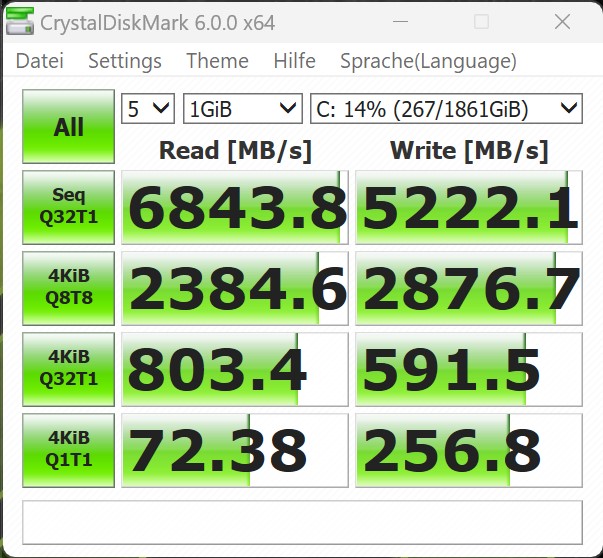
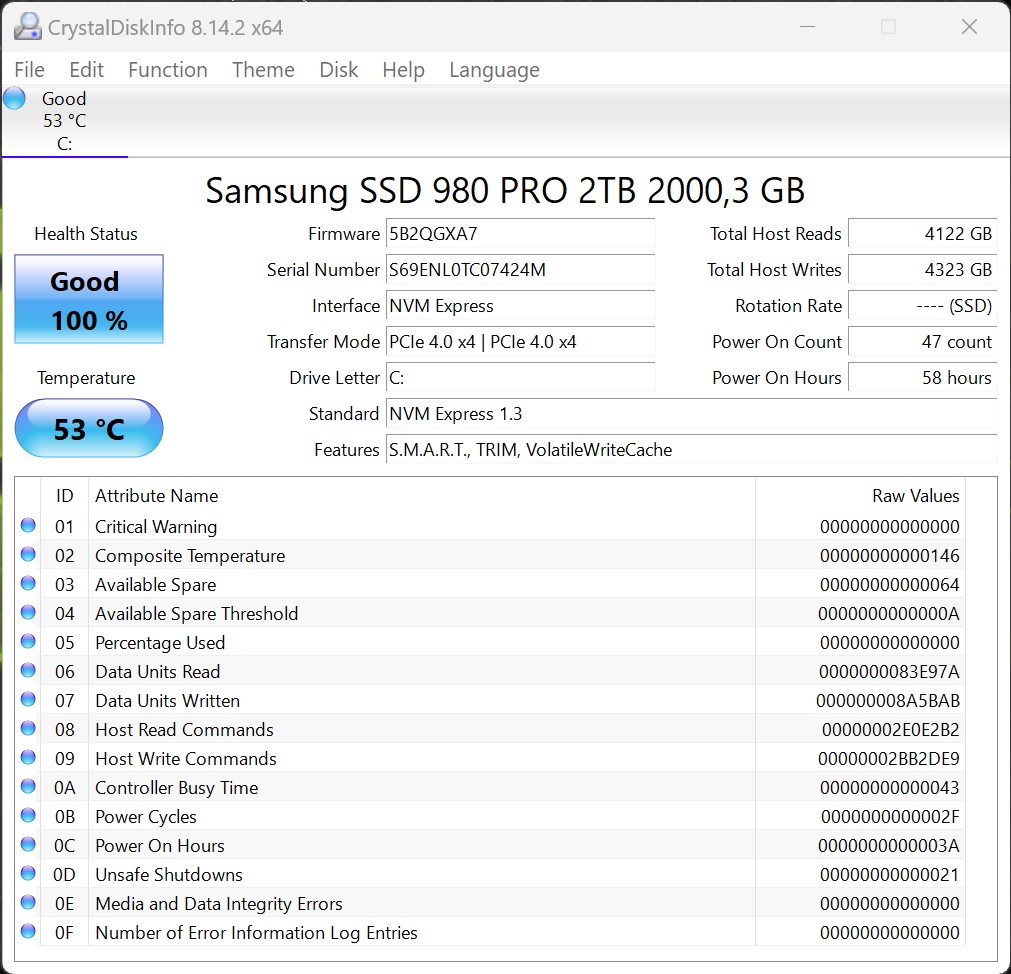
Vår recensionsenhet är utrustad med en supersnabb Samsung NVMe SSD. Samsung 980 Pro är en av de snabbaste SSD-enheterna i konsumentklassen. Detta är något som vi också kan se i benchmarks: enheten presterade nästan konsekvent bättre än lagringslösningarna i konkurrerande enheter. Endast Kingston Fury Renegade i Intel NUC13 Raptor Canyon kunde överträffa prestandan hos Samsung 980 Pro i AS-SSD Benchmark. Detta är dock tillräckligt för att Samsung SSD ska komma på första plats i det totala betyget. Även under stresstestet lyckades enheten upprätthålla en hög läshastighet under en längre tid, vilket tyder på att SSD-kylningen är mycket effektiv.
Du kan installera upp till tre ytterligare M.2 SSD-enheter på Asus ROG Strix Z690-F Gaming. Det finns även möjlighet att ansluta ännu fler lagringsenheter via SATA.
Se vår jämförelsetabell för lagringsenheter på https://www.notebookcheck.net/Laptop-harddisks-HDD-SSD-benchmarks.22089.0.html för mer information och riktmärken.

| Drive Performance rating - Percent | |
| Genomsnitt av klass Desktop | |
| Schenker XMG SECTOR, i9 13900K, RTX 4090 | |
| Corsair One i300 | |
| NVIDIA GeForce RTX 3090 Founders Edition | |
| Intel NUC13 Raptor Canyon | |
| Intel Core i5-13600K | |
| Intel Core i9-13900K | |
| Minisforum Neptune Series NAD9 | |
| Intel Core i9-12900K -11! | |
| Intel Dragon Canyon NUC - RTX 3060 -11! | |
* ... mindre är bättre
Sustained Read: DiskSpd Read Loop, Queue Depth 8
Grafikkort - Inga kompromisser med GeForce RTX 4090
Syntetiska riktmärken
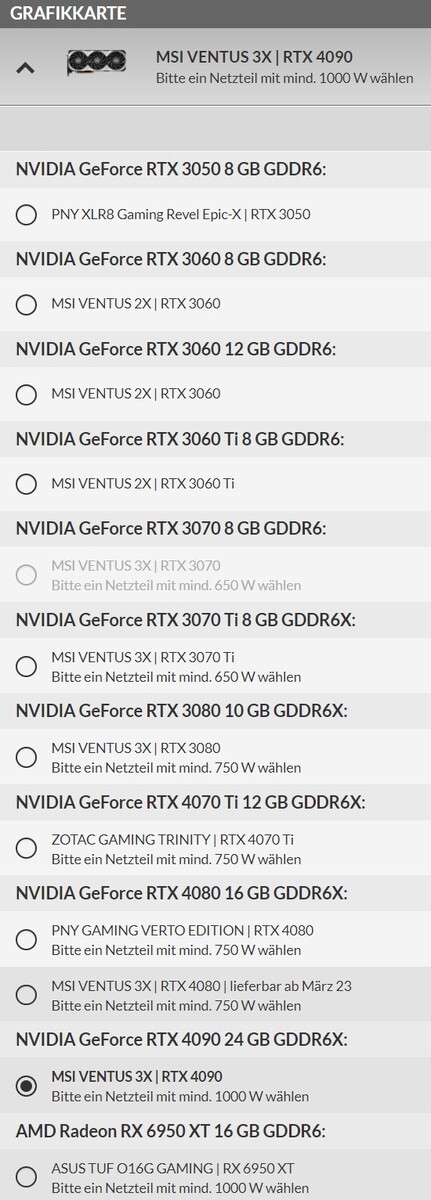
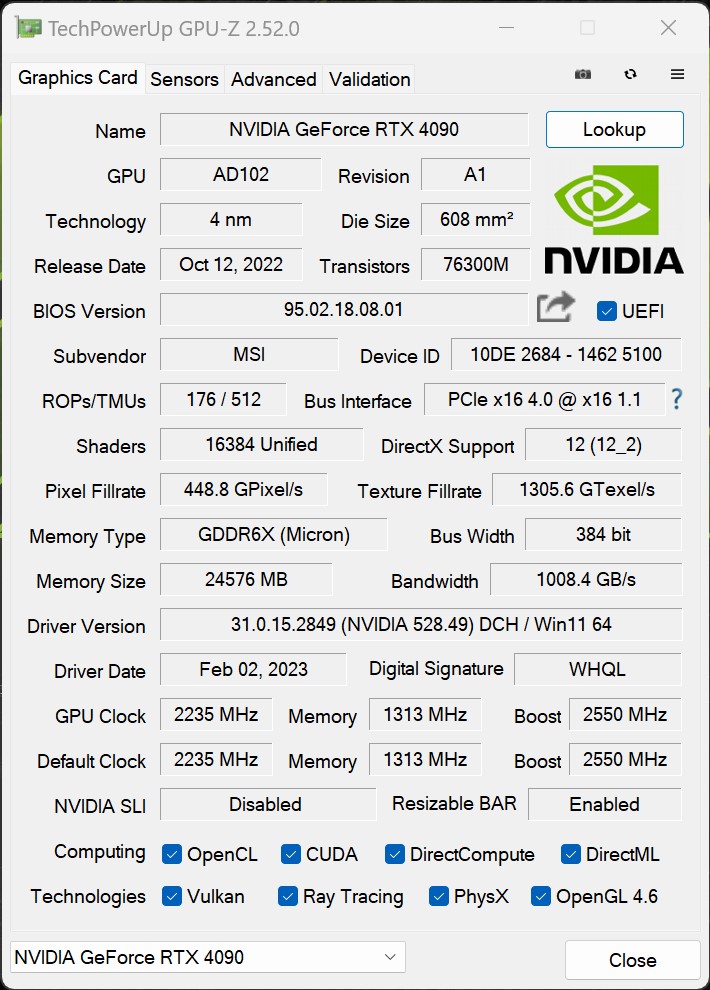
Vårt prov är utrustat med det snabbaste grafikkortet för konsumentbrukare just nu, nämligen Nvidia GeForce RTX 4090. GPU:n levererade enormt hög prestanda i alla våra syntetiska tester, vilket är helt i linje med våra förväntningar. I samband med Core i9-13900K, landade recensionsenheten på andra plats i 3DMark-klassningen. Första platsen togs i anspråk av en annanGeForce RTX 4090, den här gången en modell från KFA2. Trots detta kan MSI GeForce RTX 4090 VENTUS 3X hävda sig mycket väl mot kortet från KFA2. MSI-modellen tar upp en stor del av utrymmet i XMG SECTOR Intel. MSI har dock beslutat att inte ge kortet några tjusiga ljuseffekter. Flaggskeppet Nvidias grafikprocessor har ett betydande försprång gentemot avancerade grafikkort från AMD. I konfiguratorn kan du välja mellan ett stort antal grafikkort i Nvidias 30- och 40-serie. Om du absolut vill ha ett AMD-kort i ditt system är ditt enda alternativ här ett Radeon RX 6950 XT. AMD:s kort i 7000-serien är för närvarande inte tillgängliga för val.
Gå över till den här sidan för mer teknisk information om Nvidia GeForce RTX 4090.
Besök vår jämförelsetabell för GPU:er https://www.notebookcheck.net/Mobile-Graphics-Cards-Benchmark-List.844.0.html för mer information och resultat från benchmarking.
Compute benchmarks and professional applications
| 3DMark 05 Standard | 68661 poäng | |
| 3DMark 06 Standard Score | 70557 poäng | |
| 3DMark Vantage P Result | 133759 poäng | |
| 3DMark 11 Performance | 62922 poäng | |
| 3DMark Ice Storm Standard Score | 257615 poäng | |
| 3DMark Cloud Gate Standard Score | 85474 poäng | |
| 3DMark Fire Strike Score | 45450 poäng | |
| 3DMark Fire Strike Extreme Score | 37831 poäng | |
| 3DMark Time Spy Score | 32024 poäng | |
Hjälp | ||
Spelprestanda
De fantastiska resultaten i de syntetiska benchmarks förstärks av XMG SECTOR Intels utmärkta spelprestanda. Självfallet spelar GeForce RTX 4090 en avgörande roll i detta. Men du behöver också en extremt snabb CPU för att effektivt kunna utnyttja kraften i den snabbaste Nvidia GPU:n. På samma sätt rekommenderar vi att du spelar spel mestadels i 2160p och maxinställningar så att du kan dra nytta av grafikkortets prestanda i första hand. De som bara spelar i 1080p kan bara välja ett RTX 4070 Ti och spara en hel del pengar.
Särskilda RTX-funktioner som DLSS 3.0 och Frame Generation (FG) är för närvarande exklusiva för kort i RTX 40-serien. Det betyder att om du vill njuta av dessa nya funktioner har du inget annat val än att skaffa en GPU i RTX 40-serien. XMG SECTOR Intel klarar av att köra alla testade spel smidigt i 2160p och maxinställningar. Dessutom kan de som vill aktivera ray tracing mestadels använda funktionen utan några begränsningar. Men vissa spel, till exempel Cyberpunk 2077, kan tvinga även en high-end rigg som XMG SECTOR på knä. Genom att aktivera DLSS kan datorn köra dessa spel smidigt igen vid 2160p. AMD å sin sida erbjuder en liknande funktion i form av FSR. I slutändan är det upp till spelutvecklarna att implementera dessa funktioner. Du kan besöka den här sidan för att hitta en lista över spel som antingen redan har stöd för DLSS 3.0 eller kommer att göra det i framtiden.
| Metro Exodus - 1920x1080 Ultra Quality DXR AF:16x | |
| NVIDIA GeForce RTX 4090 | |
| AMD Radeon RX 7900 XTX | |
| NVIDIA GeForce RTX 4080 | |
| NVIDIA GeForce RTX 4090 | |
| AMD Radeon RX 7900 XT | |
| NVIDIA GeForce RTX 3080 Ti | |
| NVIDIA GeForce RTX 3090 | |
| Far Cry 6 - 1920x1080 Ultra Graphics Quality + HD Textures + DXR AA:T | |
| NVIDIA GeForce RTX 4080 | |
| AMD Radeon RX 7900 XTX | |
| AMD Radeon RX 7900 XT | |
| NVIDIA GeForce RTX 4090 | |
| NVIDIA GeForce RTX 4090 | |
| NVIDIA GeForce RTX 3080 Ti | |
| NVIDIA GeForce RTX 3090 | |
| AMD Radeon RX 6800 | |
| AMD Radeon RX 6950 XT | |
| Cyberpunk 2077 1.6 | |
| 3840x2160 Ray Tracing Ultra Preset (DLSS off) | |
| NVIDIA GeForce RTX 4090 | |
| NVIDIA GeForce RTX 4090 (1.6) | |
| NVIDIA GeForce RTX 4080 (1.6) | |
| NVIDIA GeForce RTX 3090 (1.6) | |
| AMD Radeon RX 7900 XTX (1.61) | |
| NVIDIA GeForce RTX 3080 Ti (1.61) | |
| AMD Radeon RX 7900 XT (1.61) | |
| AMD Radeon RX 6800 (1.61) | |
| 1920x1080 Ray Tracing Ultra Preset (DLSS off) | |
| NVIDIA GeForce RTX 4090 | |
| NVIDIA GeForce RTX 4090 (1.6) | |
| NVIDIA GeForce RTX 4080 (1.6) | |
| NVIDIA GeForce RTX 3080 Ti (1.61) | |
| NVIDIA GeForce RTX 3090 (1.6) | |
| AMD Radeon RX 7900 XTX (1.61) | |
| AMD Radeon RX 7900 XT (1.61) | |
| AMD Radeon RX 6800 (1.61) | |
| Control - 1920x1080 High Quality Preset & High Ray Tracing Preset (DX12) | |
| NVIDIA GeForce RTX 4090 | |
| NVIDIA GeForce RTX 4080 | |
| NVIDIA GeForce RTX 4090 | |
| AMD Radeon RX 7900 XTX | |
| NVIDIA GeForce RTX 3080 Ti | |
| AMD Radeon RX 7900 XT | |
| AMD Radeon RX 6950 XT | |
| Ghostwire Tokyo - 1920x1080 Highest Settings + Maximum Ray Tracing | |
| NVIDIA GeForce RTX 4090 | |
| NVIDIA GeForce RTX 4090 | |
| NVIDIA GeForce RTX 4080 | |
| AMD Radeon RX 7900 XTX | |
| NVIDIA GeForce RTX 3080 Ti | |
| AMD Radeon RX 7900 XT | |
| Guardians of the Galaxy - 1920x1080 Ultra Preset + Ultra Ray-Tracing | |
| NVIDIA GeForce RTX 4090 | |
| AMD Radeon RX 7900 XTX | |
| AMD Radeon RX 7900 XT | |
| The Callisto Protocol - 1920x1080 Ultra Preset (without FSR Upscaling) + Full Ray-Tracing | |
| AMD Radeon RX 7900 XTX | |
| NVIDIA GeForce RTX 4090 | |
| NVIDIA GeForce RTX 4090 | |
| AMD Radeon RX 7900 XT | |
| NVIDIA GeForce RTX 3080 Ti | |
| AMD Radeon RX 6800 | |
| låg | med. | hög | ultra | QHD | 4K DLSS | 4K | |
|---|---|---|---|---|---|---|---|
| GTA V (2015) | 187.6 | 187.6 | 187 | 165.9 | 166.3 | 187.5 | |
| The Witcher 3 (2015) | 731.4 | 664.6 | 613.4 | 314.1 | 282 | ||
| Dota 2 Reborn (2015) | 287.9 | 258.5 | 256.3 | 219.7 | 226.8 | ||
| Final Fantasy XV Benchmark (2018) | 234 | 232 | 227 | 224 | 155.7 | ||
| X-Plane 11.11 (2018) | 237 | 209 | 160.6 | 139.3 | |||
| Far Cry 5 (2018) | 240 | 208 | 201 | 187 | 187 | 173 | |
| Strange Brigade (2018) | 627 | 506 | 506 | 506 | 488 | 281 | |
| Shadow of the Tomb Raider (2018) | 300 | 288 | 285 | 282 | 269 | 186 | |
| Far Cry New Dawn (2019) | 206 | 188 | 180 | 161 | 164 | 152 | |
| Metro Exodus (2019) | 260 | 235 | 191.9 | 177.3 | 165 | 136.3 | |
| Control (2019) | 233 | 233 | 233 | 232 | 114.4 | ||
| Borderlands 3 (2019) | 243 | 213 | 197.3 | 182.9 | 182.5 | 132.9 | |
| F1 2020 (2020) | 521 | 445 | 431 | 395 | 386 | 282 | |
| F1 2021 (2021) | 632 | 585 | 501 | 277 | 267 | 196.6 | |
| Far Cry 6 (2021) | 213 | 187.4 | 168.7 | 166.8 | 163.8 | 133.4 | |
| Guardians of the Galaxy (2021) | 220 | 220 | 219 | 216 | 215 | 214 | |
| Forza Horizon 5 (2021) | 285 | 245 | 244 | 187 | 178 | 148 | |
| God of War (2022) | 263 | 263 | 255 | 203 | 173.4 | 125.1 | |
| GRID Legends (2022) | 311 | 286 | 258 | 248 | 242 | 191.4 | |
| Cyberpunk 2077 1.6 (2022) | 195 | 185 | 182 | 181 | 167 | 80 | |
| Ghostwire Tokyo (2022) | 278 | 275 | 273 | 272 | 266 | 174.7 | |
| Tiny Tina's Wonderlands (2022) | 413 | 355 | 309 | 280 | 224 | 128.4 | |
| F1 22 (2022) | 415 | 377 | 364 | 195.4 | 149.7 | 81.1 | |
| A Plague Tale Requiem (2022) | 188.6 | 175.4 | 158.5 | 147.8 | 104.6 | 193.6 | 74.7 |
| Uncharted Legacy of Thieves Collection (2022) | 139.5 | 138.1 | 137.1 | 136.6 | 134.9 | 99.1 | |
| Call of Duty Modern Warfare 2 2022 (2022) | 248 | 247 | 232 | 230 | 187 | 215 | 128 |
| Spider-Man Miles Morales (2022) | 169.9 | 163.3 | 150.9 | 149.3 | 127.4 | 126.8 | |
| The Callisto Protocol (2022) | 234.8 | 224 | 204.9 | 203.8 | 184.8 | 124.9 | |
| The Witcher 3 v4 (2023) | 304 | 271 | 218 | 198.8 | 154.1 | 199.7 |
Utsläpp
Bullerutsläpp
Enligt våra mätningar är systemet relativt tyst vid tomgång och producerar endast 32 dB(A) buller. Vid en genomsnittlig belastning är datorn hörbar men ändå tyst eftersom grafikkortet fortfarande kan kylas passivt. Höljefläktarna och de tre GPU-fläktarna snurrar bara upp när systemet är hårt belastat. Vår ljudnivåmätare uppmätte en toppljudnivå på 40,6 dB(A) under stresstestet.
Ljudnivå
| Låg belastning |
| 32 / 32.1 / 32.3 dB(A) |
| Hög belastning |
| 32.4 / 40.6 dB(A) |
 | ||
30 dB tyst 40 dB(A) hörbar 50 dB(A) högt ljud |
||
min: | ||
Temperatur
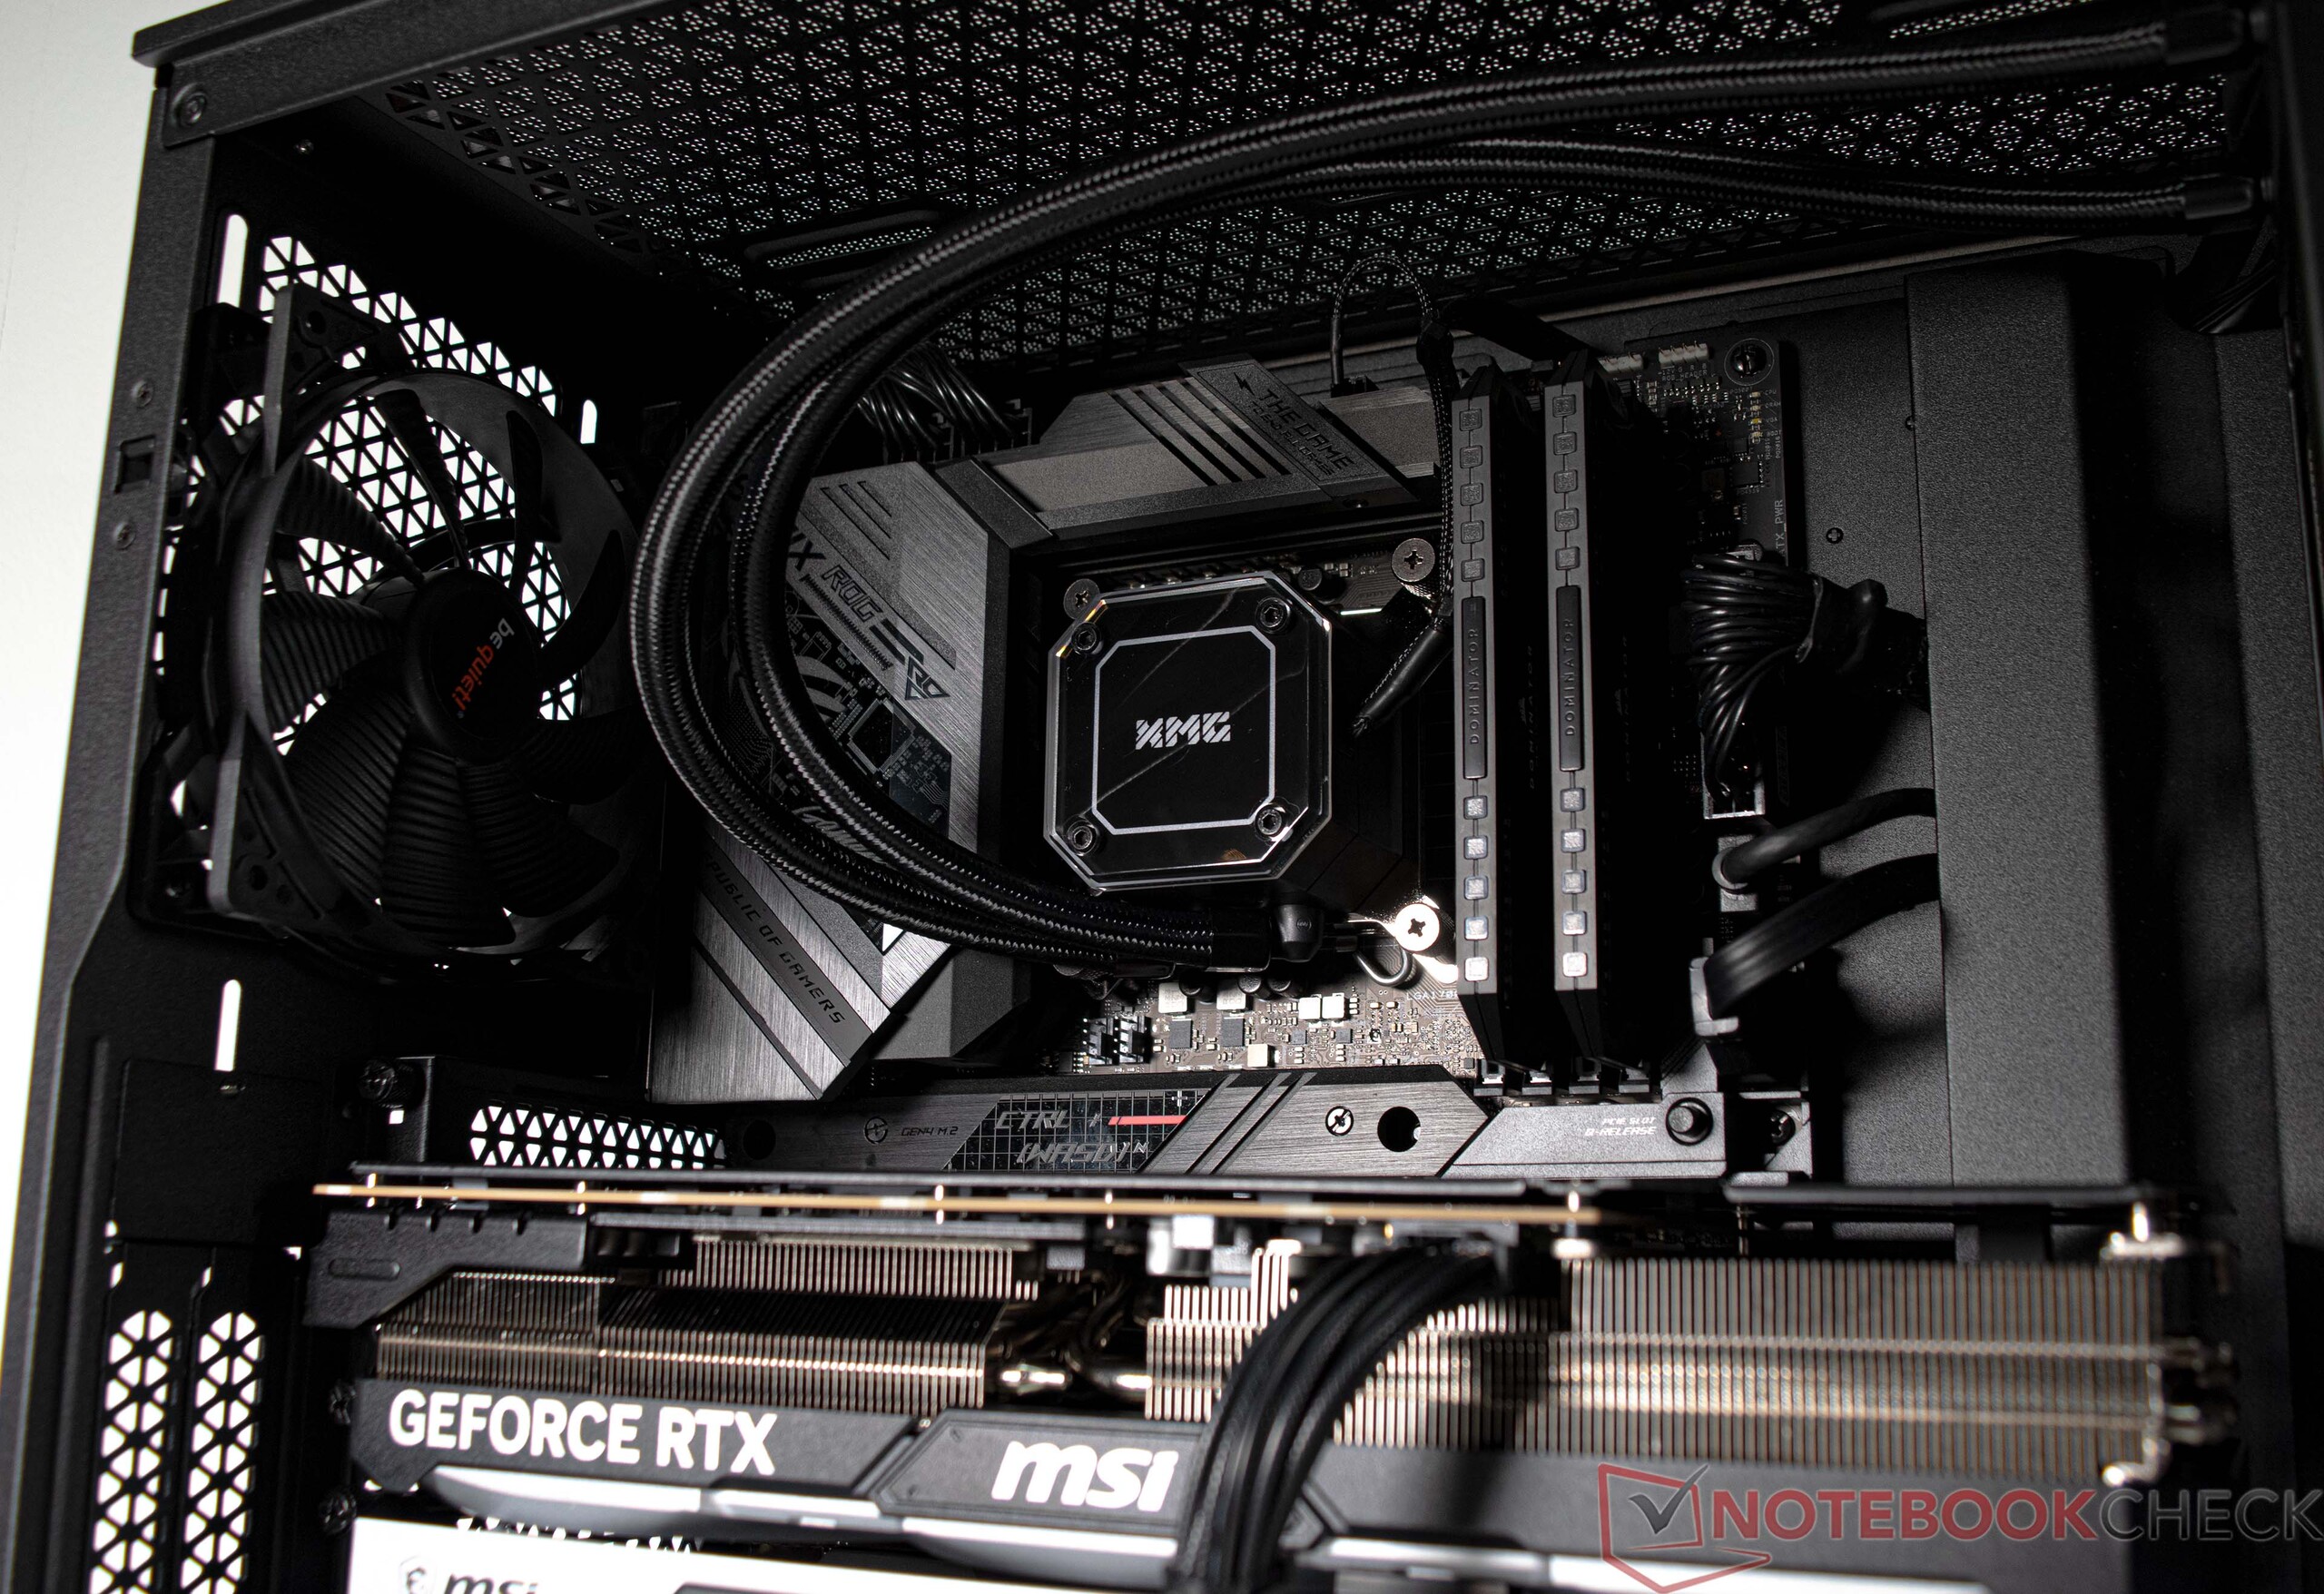
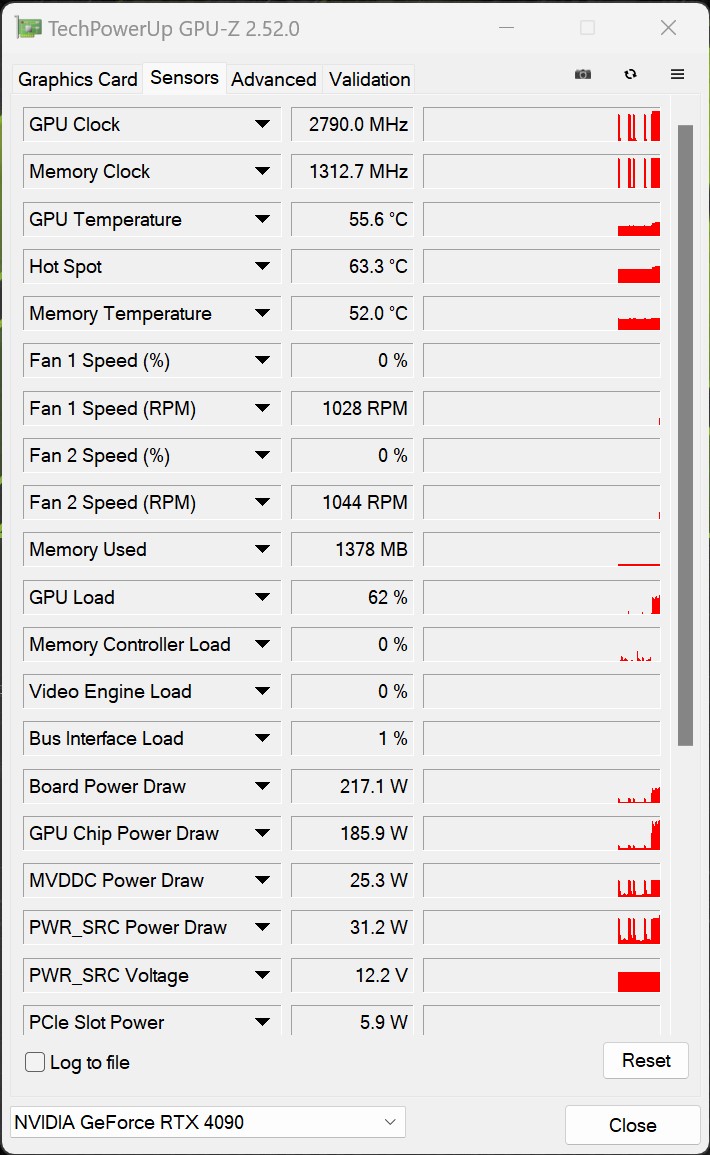
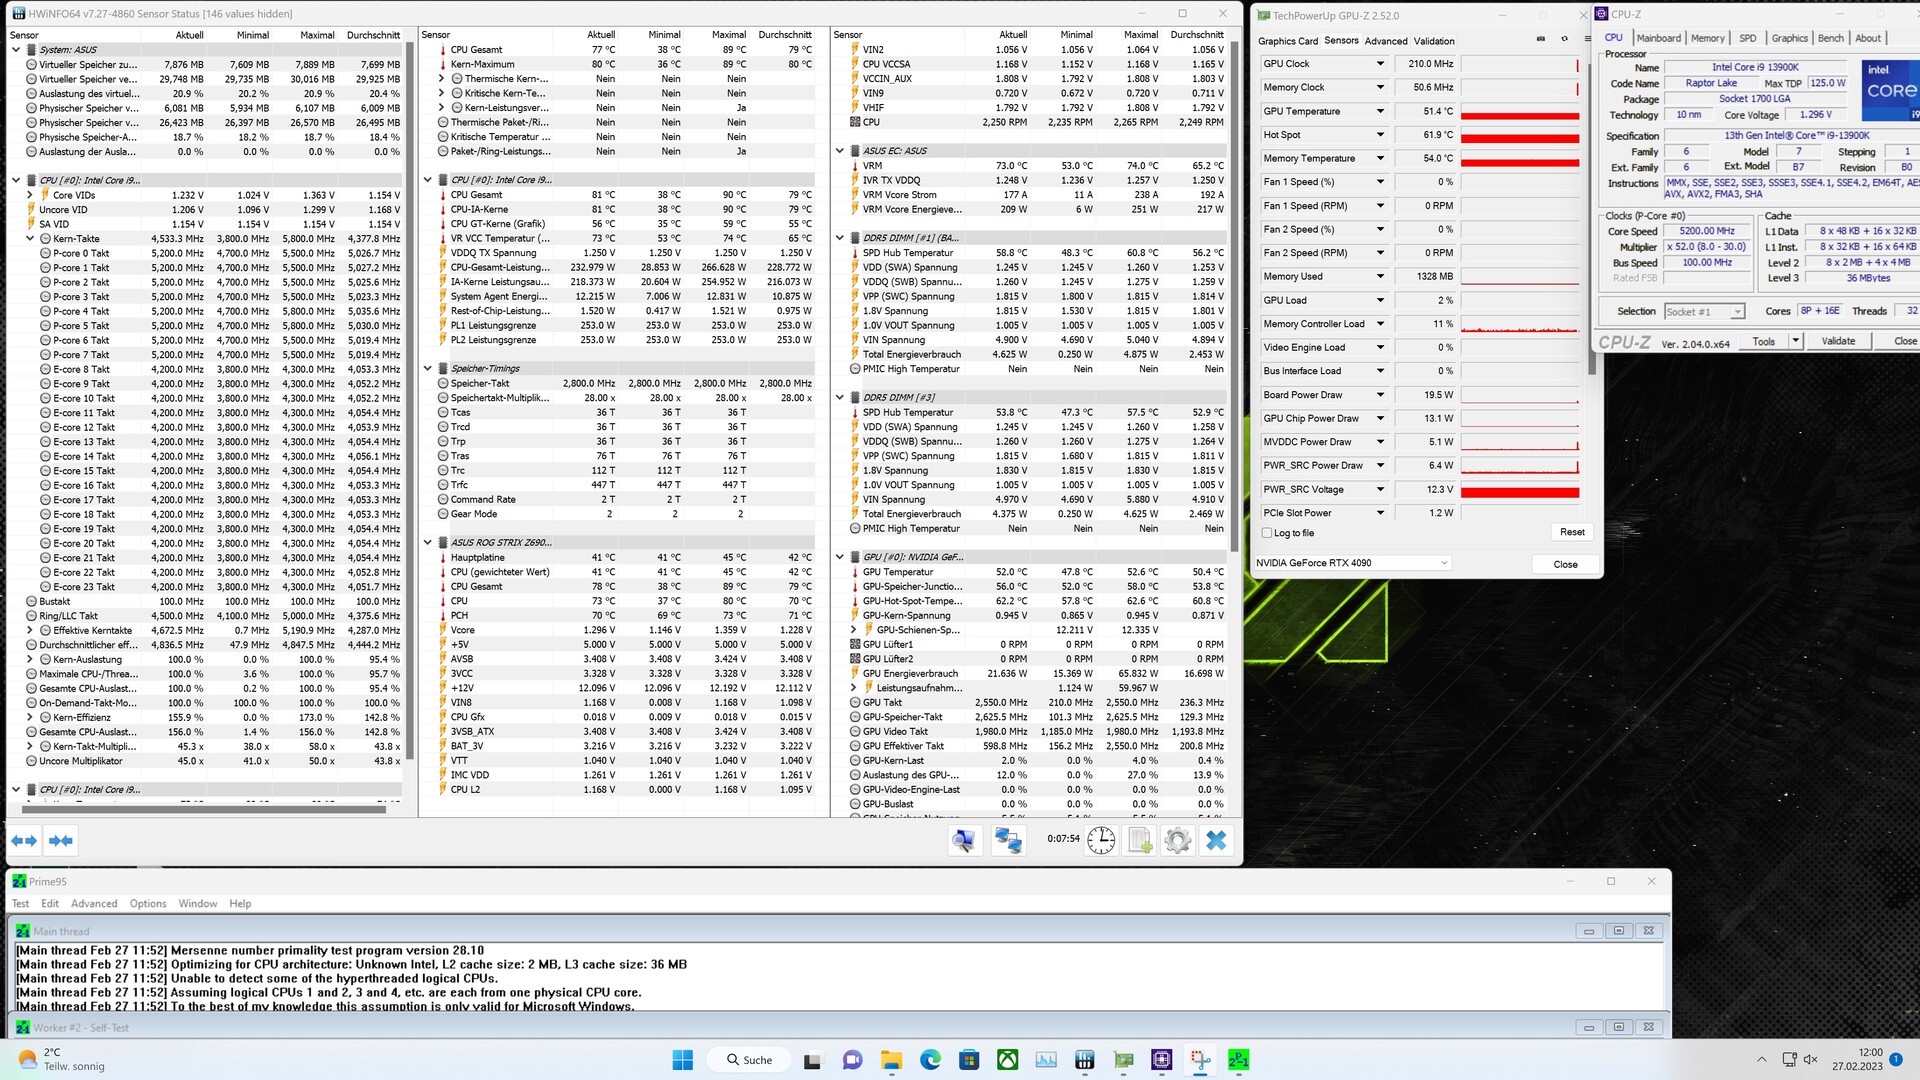
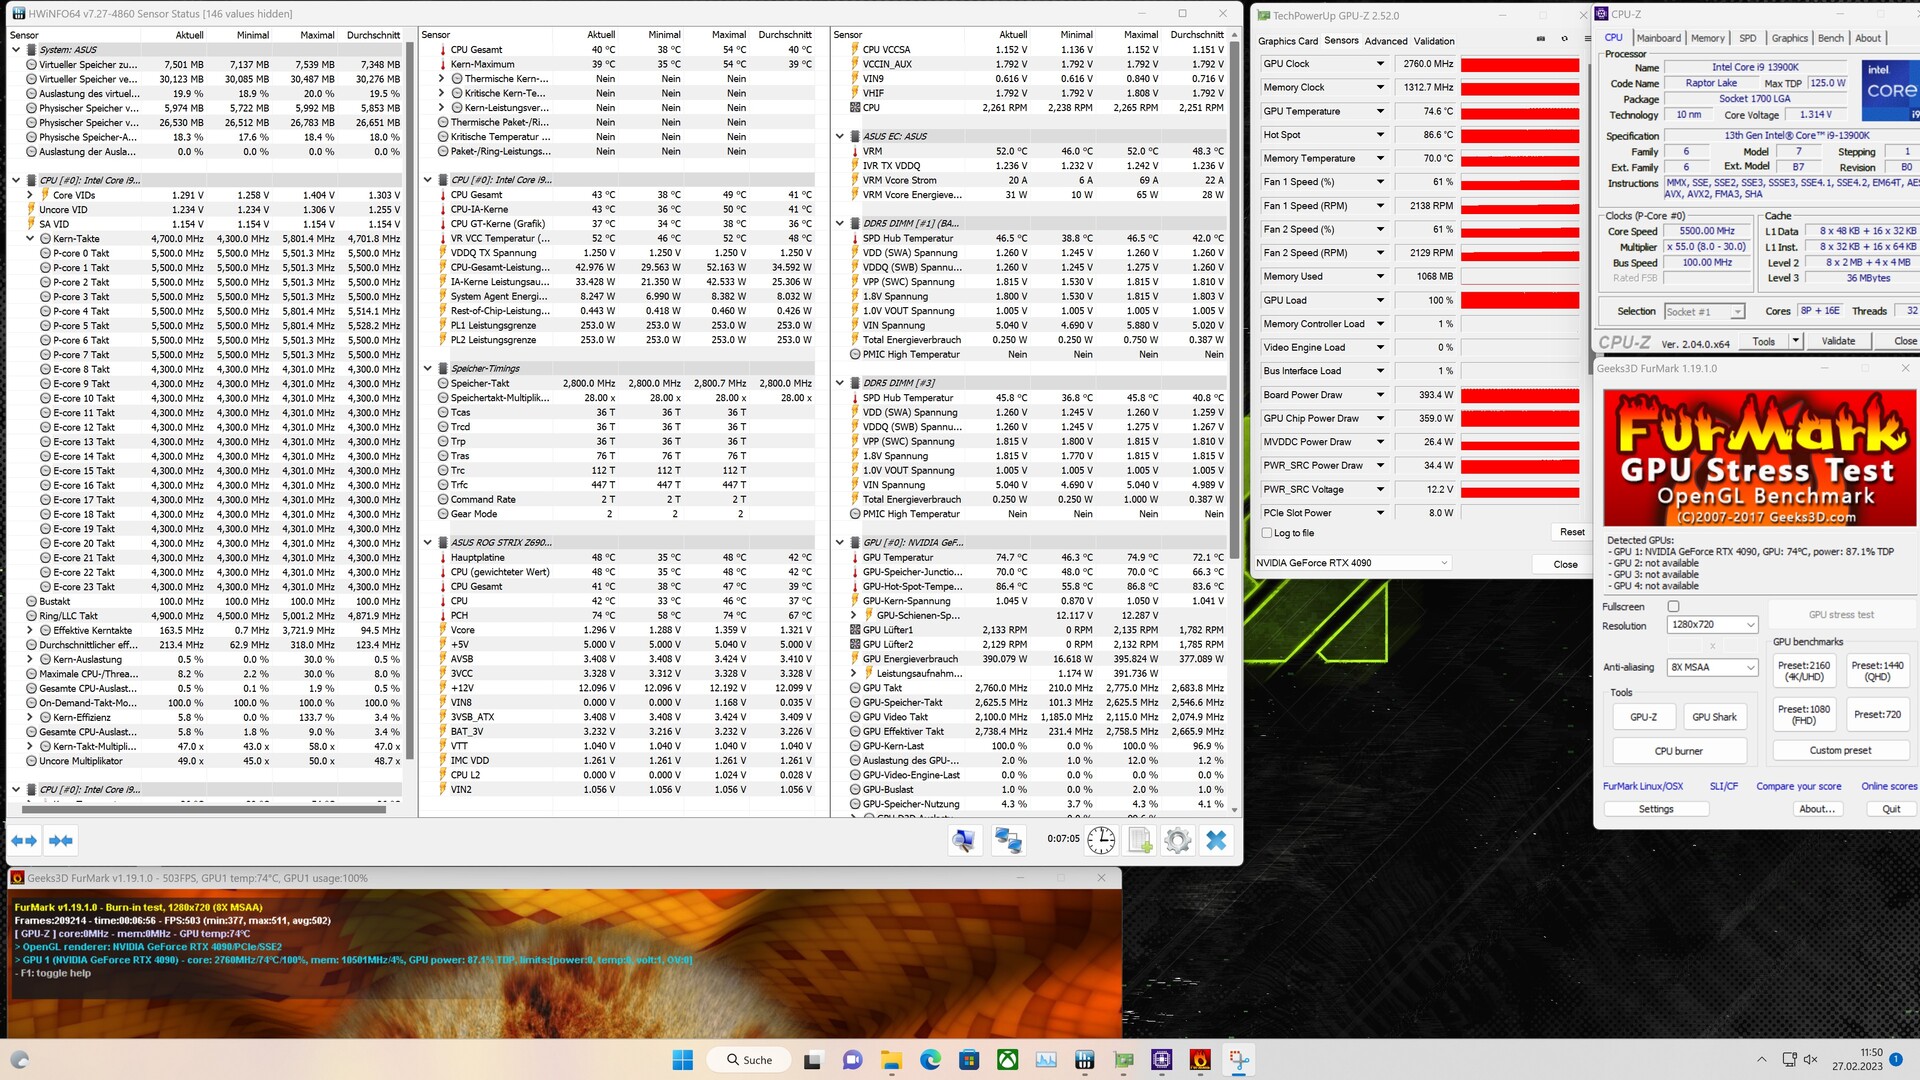
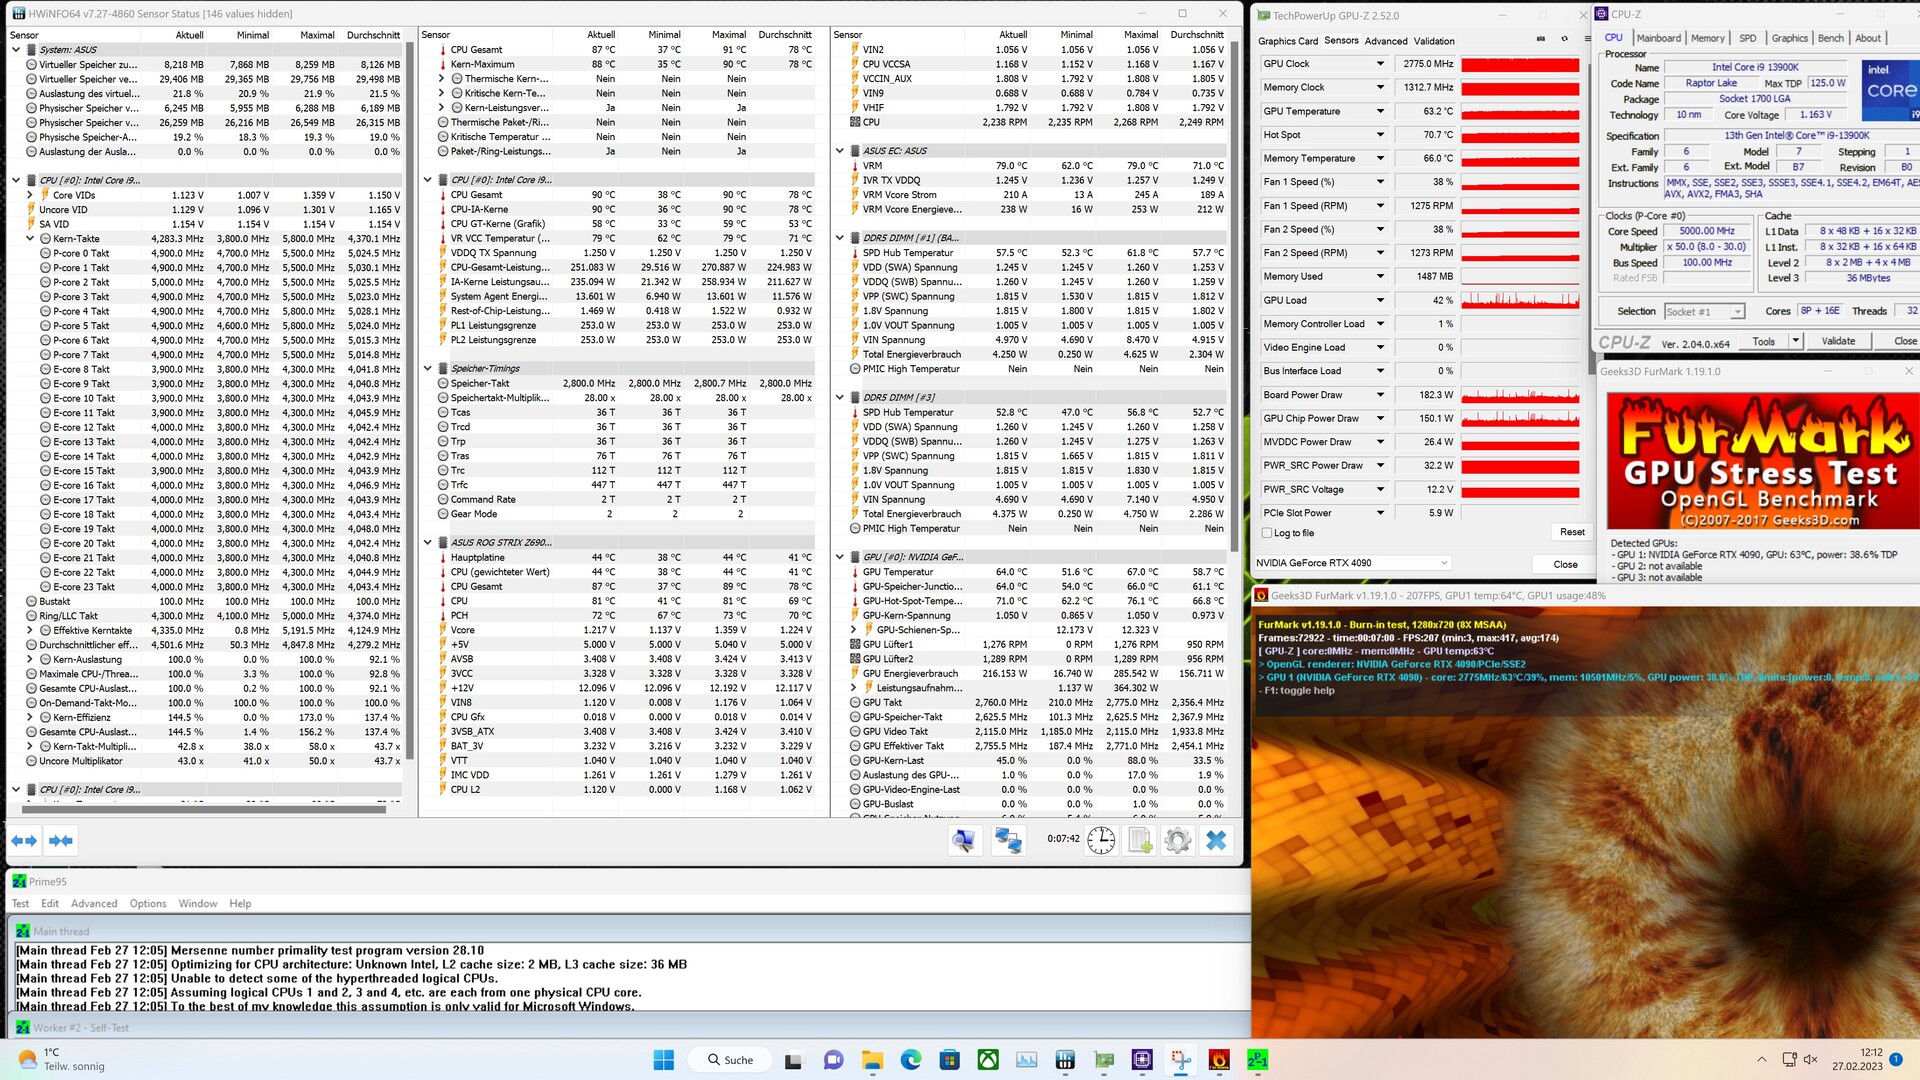
XMG SECTOR Intel är utformad för att dra in kall luft framifrån och leda ut varm luft ur höljet uppifrån och bakåt. Men systemet använder bara en fläkt för att föra bort varm luft från höljet. Det finns inga fläktar installerade i toppen. Corsair 4000D Airflow använder sig dock av tre intagsfläktar för att skapa ett övertryck så att varm luft kan tryckas ut ur höljet. AIO-kylarens 360 mm radiator är monterad precis bakom frontpanelen för att säkerställa optimal kylning av processorn. I stresstestet såg vi CPU:n nå så högt som 90 °C (195 °F) med ett genomsnittligt effektuttag på 228 watt, medan GPU-temperaturerna nådde nästan 75 °C (167 °F), vilket är helt ofarligt.
Effektförbrukning
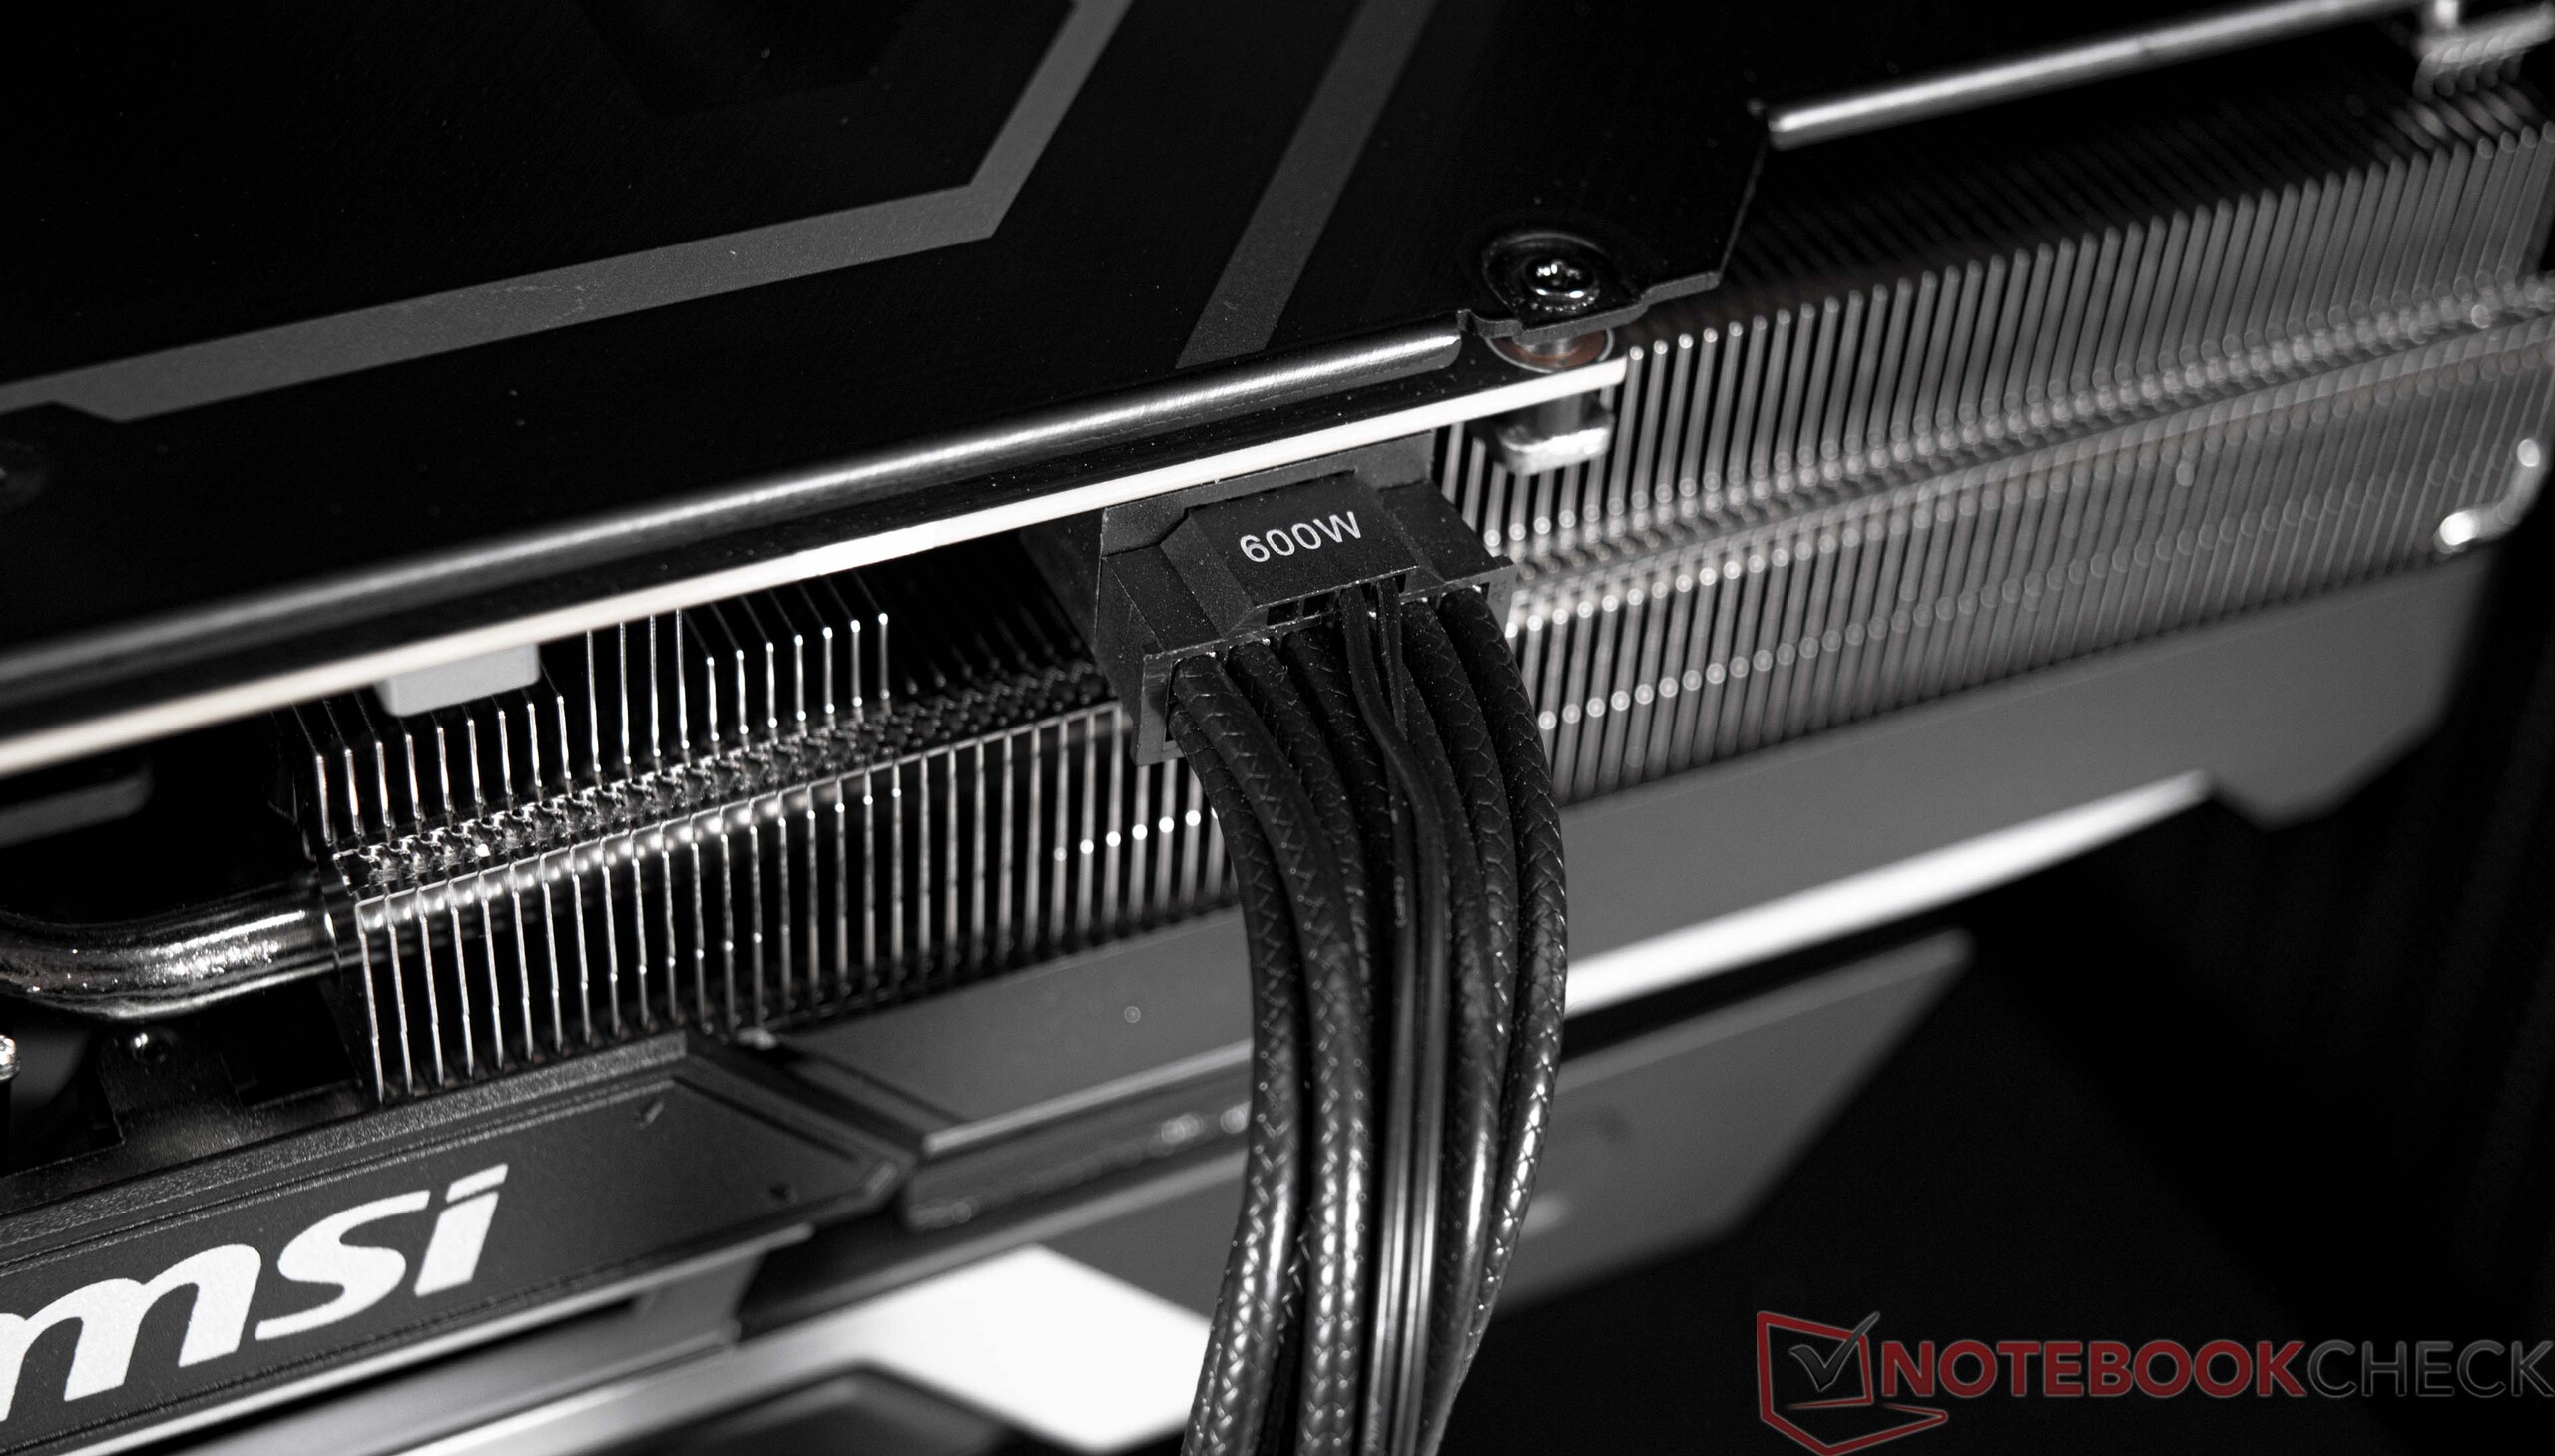
Hela systemet drivs av ett Seasonic nätaggregat på 1000 watt. Under våra tester hade nätaggregatet inga problem med att förse komponenterna med tillräckligt med energi även vid full belastning. Med tanke på alla avancerade komponenter inuti är det uppenbart att systemet inte kommer att vara lätt på strömförbrukningen. Strömförbrukningen låg runt 78 till 96 watt vid tomgång, vilket fortfarande är acceptabelt. Däremot var det 1000-watts nätaggregatet tvunget att leverera i genomsnitt 511 watt under spelandet. Vi märkte några enstaka större toppar i strömförbrukningen, men inte ens användningstopparna på upp till 778 watt pressade nätaggregatet till sina gränser. I jämförelsen ligger recensionsenheten bara något efter vårt GPU-testsystem med ett liknande grafikkort.
| Power Consumption / The Witcher 3 ultra (external Monitor) | |
| AMD Radeon RX 6950 XT | |
| NVIDIA GeForce RTX 3090 Ti (Idle: 102 W) | |
| NVIDIA GeForce RTX 3090 | |
| NVIDIA GeForce RTX 4090 | |
| NVIDIA GeForce RTX 3080 12 GB | |
| NVIDIA GeForce RTX 4090 | |
| AMD Radeon RX 6900 XT (Idle: 99.15 W) | |
| Power Consumption / FurMark 1.19 GPU Stress Test (external Monitor) | |
| NVIDIA GeForce RTX 4090 | |
| AMD Radeon RX 6950 XT | |
| NVIDIA GeForce RTX 3090 | |
| NVIDIA GeForce RTX 3080 12 GB | |
| AMD Radeon RX 6900 XT (Idle: 99.15 W) | |
| NVIDIA GeForce RTX 4090 | |
* ... mindre är bättre
| Av/Standby | |
| Låg belastning | |
| Hög belastning |
|
Förklaring:
min: | |
Power consumption with external monitor
För
Emot
Bedömning - En otroligt snabb speldator

Med en Intel Core i9-13900K och en Nvidia GeForce RTX 4090är vår testkonfiguration av XMG SECTOR Intel en av de snabbaste speldatorer du kan sätta ihop just nu. Systemet sitter också på en ganska modern grund, även om dess moderkort "bara" har Z690-chipsetet. Trots detta använder sig systemet av DDR5-minne. Dessutom levererar dess lagringsenhet solida prestanda och med en kapacitet på 2 TB erbjuder den till och med tillräckligt med utrymme för många spel.
Baserat på en Intel Core i9-13900K erbjuder XMG SECTOR Intel utmärkt prestanda för en mängd olika användningsområden. Tillsammans med GeForce RTX 4090 är systemet för närvarande en av de snabbaste speldatorerna på marknaden.
Vår recensionsenhet har så oerhört hög prestanda till sitt förfogande att den kan köra alla moderna spel smidigt i 2160p. Systemet är verkligen ingen stöld för cirka 4 600 euro (4 851 dollar). Ändå är konfigurationen vettig om du vill spela de senaste spelen utan några kompromisser. Ett AMD-system med liknande specifikationer och en Ryzen 9 7950X (även tillgänglig i butiken som XMG SECTOR AMD) kostar ungefär 300 euro (316 US-dollar) mer
.Pris och tillgänglighet
XMG SECTOR Intel är tillgänglig från Schenkers onlinebutik bestware.com och kostar ungefär 4 600 euro (4 851 USD). Du kan också välja komponenter utifrån dina specifika behov med hjälp av den omfattande konfiguratorn.
Schenker XMG SECTOR, i9 13900K, RTX 4090
- 03/04/2023 v7 (old)
Sebastian Bade
Genomskinlighet
Valet av enheter som ska granskas görs av vår redaktion. Testprovet gavs till författaren som ett lån av tillverkaren eller återförsäljaren för denna recension. Långivaren hade inget inflytande på denna recension och inte heller fick tillverkaren en kopia av denna recension innan publiceringen. Det fanns ingen skyldighet att publicera denna recension. Som ett oberoende medieföretag är Notebookcheck inte föremål för auktoritet från tillverkare, återförsäljare eller förlag.
This is how Notebookcheck is testingEvery year, Notebookcheck independently reviews hundreds of laptops and smartphones using standardized procedures to ensure that all results are comparable. We have continuously developed our test methods for around 20 years and set industry standards in the process. In our test labs, high-quality measuring equipment is utilized by experienced technicians and editors. These tests involve a multi-stage validation process. Our complex rating system is based on hundreds of well-founded measurements and benchmarks, which maintains objectivity.

