Test: HP ZBook Studio 15 G8 - Fler alternativ än någonsin (Sammanfattning)
Testgrupp
Gradering | Datum | Modell | Vikt | Höjd | Storlek | Upplösning | Pris |
|---|---|---|---|---|---|---|---|
| 87.8 % v7 (old) | 09/2021 | HP ZBook Studio 15 G8 i9-11950H, GeForce RTX 3070 Laptop GPU | 1.9 kg | 18 mm | 15.60" | 3840x2160 | |
| 83.8 % v7 (old) | HP ZBook Firefly 15 G8 2C9R7EA i7-1165G7, T500 Laptop GPU | 1.8 kg | 19.2 mm | 15.60" | 1920x1080 | ||
| 90.6 % v7 (old) | 02/2021 | HP ZBook Studio G7 i9-10885H, Quadro RTX 3000 Max-Q | 2 kg | 18 mm | 15.60" | 3840x2160 | |
| 87.8 % v7 (old) | 12/2020 | Dell Precision 7550 W-10885M, Quadro RTX 5000 Max-Q | 2.8 kg | 27.36 mm | 15.60" | 3840x2160 | |
| 85.3 % v7 (old) | Lenovo ThinkPad P15s Gen2-20W6000GGE i7-1165G7, T500 Laptop GPU | 1.9 kg | 19.1 mm | 15.60" | 3840x2160 | ||
| 83.1 % v7 (old) | Asus ProArt StudioBook Pro 15 W500G5T i7-9750H, Quadro RTX 5000 Max-Q | 2 kg | 18.9 mm | 15.60" | 3840x2160 |
| SD Card Reader | |
| average JPG Copy Test (av. of 3 runs) | |
| Dell Precision 7550 (Toshiba Exceria Pro SDXC 64 GB UHS-II) | |
| HP ZBook Studio G7 (AV Pro V60) | |
| HP ZBook Studio 15 G8 (AV Pro V60) | |
| Lenovo ThinkPad P15s Gen2-20W6000GGE (AV Pro V60) | |
| maximum AS SSD Seq Read Test (1GB) | |
| Dell Precision 7550 (Toshiba Exceria Pro SDXC 64 GB UHS-II) | |
| HP ZBook Studio G7 (AV Pro V60) | |
| Lenovo ThinkPad P15s Gen2-20W6000GGE (AV Pro V60) | |
| HP ZBook Studio 15 G8 (AV Pro V60) | |
| Networking | |
| iperf3 transmit AX12 | |
| HP ZBook Studio 15 G8 | |
| Asus ProArt StudioBook Pro 15 W500G5T | |
| Lenovo ThinkPad P15s Gen2-20W6000GGE | |
| HP ZBook Firefly 15 G8 2C9R7EA | |
| HP ZBook Studio G7 | |
| Dell Precision 7550 | |
| iperf3 receive AX12 | |
| HP ZBook Studio G7 | |
| Lenovo ThinkPad P15s Gen2-20W6000GGE | |
| HP ZBook Firefly 15 G8 2C9R7EA | |
| HP ZBook Studio 15 G8 | |
| Asus ProArt StudioBook Pro 15 W500G5T | |
| Dell Precision 7550 | |


| |||||||||||||||||||||||||
Distribution av ljusstyrkan: 95 %
Mitt på batteriet: 379.6 cd/m²
Kontrast: ∞:1 (Svärta: 0 cd/m²)
ΔE ColorChecker Calman: 5.15 | ∀{0.5-29.43 Ø4.72}
calibrated: 3.1
ΔE Greyscale Calman: 2.6 | ∀{0.09-98 Ø4.97}
95.3% AdobeRGB 1998 (Argyll 3D)
100% sRGB (Argyll 3D)
99.9% Display P3 (Argyll 3D)
Gamma: 1.99
CCT: 6166 K
| HP ZBook Studio 15 G8 SDC4145, OLED, 15.6", 3840x2160 | HP ZBook Firefly 15 G8 2C9R7EA LGD069B, IPS, 15.6", 1920x1080 | HP ZBook Studio G7 LGD0661, IPS, 15.6", 3840x2160 | Dell Precision 7550 AU Optronics B156ZAN, IPS, 15.6", 3840x2160 | Lenovo ThinkPad P15s Gen2-20W6000GGE MNF601EA1-1, IPS LED, 15.6", 3840x2160 | |
|---|---|---|---|---|---|
| Display | -20% | -4% | -5% | -4% | |
| Display P3 Coverage (%) | 99.9 | 68.6 -31% | 98.2 -2% | 82.1 -18% | 84.5 -15% |
| sRGB Coverage (%) | 100 | 98.5 -1% | 99.9 0% | 99.6 0% | 98.7 -1% |
| AdobeRGB 1998 Coverage (%) | 95.3 | 70 -27% | 86.5 -9% | 96.8 2% | 97.8 3% |
| Response Times | -1733% | -1859% | -1675% | -1217% | |
| Response Time Grey 50% / Grey 80% * (ms) | 2.4 ? | 56 ? -2233% | 56.4 ? -2250% | 51.2 ? -2033% | 40 ? -1567% |
| Response Time Black / White * (ms) | 2.4 ? | 32 ? -1233% | 37.6 ? -1467% | 34 ? -1317% | 23.2 ? -867% |
| PWM Frequency (Hz) | 240.4 ? | ||||
| Screen | -30% | 59% | -11% | 57% | |
| Brightness middle (cd/m²) | 379.6 | 397 5% | 723 90% | 473.5 25% | 604 59% |
| Brightness (cd/m²) | 380 | 402 6% | 707 86% | 461 21% | 609 60% |
| Brightness Distribution (%) | 95 | 84 -12% | 92 -3% | 90 -5% | 91 -4% |
| Black Level * (cd/m²) | 0.13 | 0.35 | 0.55 | 0.34 | |
| Colorchecker dE 2000 * | 5.15 | 5.9 -15% | 1.4 73% | 4.8 7% | 0.9 83% |
| Colorchecker dE 2000 max. * | 7.79 | 9.4 -21% | 2.9 63% | 8.73 -12% | 2.6 67% |
| Colorchecker dE 2000 calibrated * | 3.1 | 1.1 65% | 0.5 84% | 3.08 1% | 0.8 74% |
| Greyscale dE 2000 * | 2.6 | 8.8 -238% | 2 23% | 5.6 -115% | 1.1 58% |
| Gamma | 1.99 111% | 2.47 89% | 2.14 103% | 2.34 94% | 2.15 102% |
| CCT | 6166 105% | 6416 101% | 6484 100% | 7549 86% | 6656 98% |
| Contrast (:1) | 3054 | 2066 | 861 | 1776 | |
| Color Space (Percent of AdobeRGB 1998) (%) | 63.7 | 77.3 | 86.4 | 84.5 | |
| Color Space (Percent of sRGB) (%) | 98.5 | 99.9 | 99.7 | 98.6 | |
| Totalt genomsnitt (program/inställningar) | -594% /
-311% | -601% /
-276% | -564% /
-287% | -388% /
-171% |
* ... mindre är bättre
Visa svarstider
| ↔ Svarstid svart till vitt | ||
|---|---|---|
| 2.4 ms ... stiga ↗ och falla ↘ kombinerat | ↗ 1.1 ms stiga | 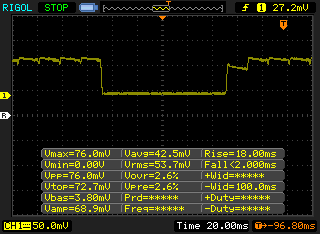 |
| ↘ 1.3 ms hösten | ||
| Skärmen visar väldigt snabba svarsfrekvenser i våra tester och borde vara mycket väl lämpad för fartfyllt spel. I jämförelse sträcker sig alla testade enheter från 0.1 (minst) till 240 (maximalt) ms. » 12 % av alla enheter är bättre. Det betyder att den uppmätta svarstiden är bättre än genomsnittet av alla testade enheter (19.8 ms). | ||
| ↔ Svarstid 50 % grått till 80 % grått | ||
| 2.4 ms ... stiga ↗ och falla ↘ kombinerat | ↗ 1 ms stiga | 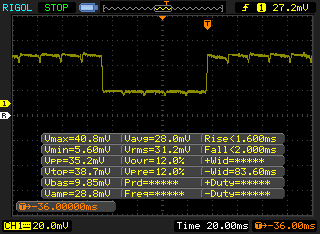 |
| ↘ 1.4 ms hösten | ||
| Skärmen visar väldigt snabba svarsfrekvenser i våra tester och borde vara mycket väl lämpad för fartfyllt spel. I jämförelse sträcker sig alla testade enheter från 0.165 (minst) till 636 (maximalt) ms. » 11 % av alla enheter är bättre. Det betyder att den uppmätta svarstiden är bättre än genomsnittet av alla testade enheter (31 ms). | ||
Skärmflimmer / PWM (Puls-Width Modulation)
| Skärmflimmer / PWM upptäckt | 240.4 Hz | ≤ 52 % ljusstyrka inställning | 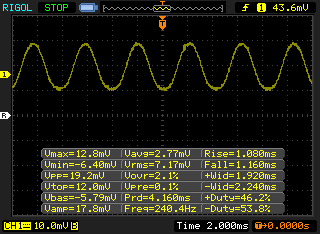 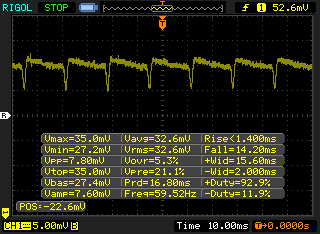 |
Displayens bakgrundsbelysning flimrar vid 240.4 Hz (i värsta fall, t.ex. med PWM) Flimrande upptäckt vid en ljusstyrkeinställning på 52 % och lägre. Det ska inte finnas något flimmer eller PWM över denna ljusstyrkeinställning. Frekvensen för 240.4 Hz är relativt låg, så känsliga användare kommer sannolikt att märka flimmer och uppleva ansträngda ögon vid den angivna ljusstyrkeinställningen och nedan. Som jämförelse: 52 % av alla testade enheter använder inte PWM för att dämpa skärmen. Om PWM upptäcktes mättes ett medelvärde av 7781 (minst: 5 - maximum: 343500) Hz. | |||
Cinebench R15 Multi Loop
Cinebench R23: Multi Core | Single Core
Cinebench R15: CPU Multi 64Bit | CPU Single 64Bit
Blender: v2.79 BMW27 CPU
7-Zip 18.03: 7z b 4 -mmt1 | 7z b 4
Geekbench 5.5: Single-Core | Multi-Core
HWBOT x265 Benchmark v2.2: 4k Preset
LibreOffice : 20 Documents To PDF
R Benchmark 2.5: Overall mean
| Cinebench R20 / CPU (Multi Core) | |
| Asus ROG Strix Scar 15 G533QS | |
| Asus ROG Zephyrus S17 GX703HSD | |
| Genomsnitt Intel Core i9-11950H (4471 - 5000, n=4) | |
| HP ZBook Studio 15 G8 | |
| Asus TUF Gaming A15 FA506QR-AZ061T | |
| Schenker XMG Core 15 Ampere | |
| MSI WS66 10TMT-207US | |
| Dell XPS 15 9510 11800H RTX 3050 Ti OLED | |
| HP ZBook Studio G7 | |
| MSI GE65 Raider 9SF-049US | |
| Dell Precision 5550 P91F | |
| Apple MacBook Pro 15 2019 i9 Vega 20 | |
| Cinebench R20 / CPU (Single Core) | |
| Genomsnitt Intel Core i9-11950H (610 - 632, n=4) | |
| HP ZBook Studio 15 G8 | |
| Asus ROG Zephyrus S17 GX703HSD | |
| Dell XPS 15 9510 11800H RTX 3050 Ti OLED | |
| Asus ROG Strix Scar 15 G533QS | |
| Asus TUF Gaming A15 FA506QR-AZ061T | |
| HP ZBook Studio G7 | |
| MSI WS66 10TMT-207US | |
| Dell Precision 5550 P91F | |
| Schenker XMG Core 15 Ampere | |
| Apple MacBook Pro 15 2019 i9 Vega 20 | |
| MSI GE65 Raider 9SF-049US | |
| Cinebench R23 / Multi Core | |
| Asus ROG Strix Scar 15 G533QS | |
| Asus ROG Zephyrus S17 GX703HSD | |
| Genomsnitt Intel Core i9-11950H (12048 - 13113, n=4) | |
| HP ZBook Studio 15 G8 | |
| Schenker XMG Core 15 Ampere | |
| Dell XPS 15 9510 11800H RTX 3050 Ti OLED | |
| HP ZBook Studio G7 | |
| Cinebench R23 / Single Core | |
| Genomsnitt Intel Core i9-11950H (1569 - 1633, n=4) | |
| Asus ROG Zephyrus S17 GX703HSD | |
| HP ZBook Studio 15 G8 | |
| Dell XPS 15 9510 11800H RTX 3050 Ti OLED | |
| Asus ROG Strix Scar 15 G533QS | |
| HP ZBook Studio G7 | |
| Schenker XMG Core 15 Ampere | |
| Cinebench R15 / CPU Multi 64Bit | |
| Asus ROG Strix Scar 15 G533QS | |
| Asus ROG Zephyrus S17 GX703HSD | |
| Dell XPS 15 9510 11800H RTX 3050 Ti OLED | |
| Dell XPS 15 9510 11800H RTX 3050 Ti OLED | |
| Asus TUF Gaming A15 FA506QR-AZ061T | |
| Genomsnitt Intel Core i9-11950H (1827 - 2130, n=5) | |
| Schenker XMG Core 15 Ampere | |
| HP ZBook Studio 15 G8 | |
| HP ZBook Studio G7 | |
| MSI WS66 10TMT-207US | |
| MSI GE65 Raider 9SF-049US | |
| Dell Precision 5550 P91F | |
| Apple MacBook Pro 15 2019 i9 Vega 20 | |
| Cinebench R15 / CPU Single 64Bit | |
| Genomsnitt Intel Core i9-11950H (236 - 249, n=4) | |
| Asus ROG Zephyrus S17 GX703HSD | |
| HP ZBook Studio 15 G8 | |
| Asus ROG Strix Scar 15 G533QS | |
| Asus TUF Gaming A15 FA506QR-AZ061T | |
| Dell XPS 15 9510 11800H RTX 3050 Ti OLED | |
| HP ZBook Studio G7 | |
| MSI WS66 10TMT-207US | |
| Dell Precision 5550 P91F | |
| MSI GE65 Raider 9SF-049US | |
| Schenker XMG Core 15 Ampere | |
| Apple MacBook Pro 15 2019 i9 Vega 20 | |
| Blender / v2.79 BMW27 CPU | |
| Dell Precision 5550 P91F | |
| Dell XPS 15 9510 11800H RTX 3050 Ti OLED | |
| HP ZBook Studio G7 | |
| MSI WS66 10TMT-207US | |
| Asus TUF Gaming A15 FA506QR-AZ061T | |
| HP ZBook Studio 15 G8 | |
| Genomsnitt Intel Core i9-11950H (244 - 261, n=3) | |
| Schenker XMG Core 15 Ampere | |
| Asus ROG Strix Scar 15 G533QS | |
| Asus ROG Zephyrus S17 GX703HSD | |
| 7-Zip 18.03 / 7z b 4 -mmt1 | |
| Genomsnitt Intel Core i9-11950H (5755 - 5919, n=3) | |
| Asus ROG Zephyrus S17 GX703HSD | |
| HP ZBook Studio 15 G8 | |
| HP ZBook Studio G7 | |
| Asus ROG Strix Scar 15 G533QS | |
| Asus TUF Gaming A15 FA506QR-AZ061T | |
| Dell XPS 15 9510 11800H RTX 3050 Ti OLED | |
| Dell Precision 5550 P91F | |
| MSI WS66 10TMT-207US | |
| Schenker XMG Core 15 Ampere | |
| 7-Zip 18.03 / 7z b 4 | |
| Asus ROG Strix Scar 15 G533QS | |
| Asus ROG Zephyrus S17 GX703HSD | |
| Asus TUF Gaming A15 FA506QR-AZ061T | |
| Schenker XMG Core 15 Ampere | |
| Genomsnitt Intel Core i9-11950H (50050 - 51402, n=3) | |
| HP ZBook Studio 15 G8 | |
| MSI WS66 10TMT-207US | |
| HP ZBook Studio G7 | |
| Dell XPS 15 9510 11800H RTX 3050 Ti OLED | |
| Dell Precision 5550 P91F | |
| Geekbench 5.5 / Single-Core | |
| HP ZBook Studio 15 G8 | |
| Genomsnitt Intel Core i9-11950H (1623 - 1702, n=3) | |
| Asus ROG Zephyrus S17 GX703HSD | |
| Dell XPS 15 9510 11800H RTX 3050 Ti OLED | |
| Asus TUF Gaming A15 FA506QR-AZ061T | |
| HP ZBook Studio G7 | |
| MSI WS66 10TMT-207US | |
| Dell Precision 5550 P91F | |
| Schenker XMG Core 15 Ampere | |
| Geekbench 5.5 / Multi-Core | |
| Asus ROG Zephyrus S17 GX703HSD | |
| Dell Precision 5550 P91F | |
| MSI WS66 10TMT-207US | |
| Dell XPS 15 9510 11800H RTX 3050 Ti OLED | |
| Schenker XMG Core 15 Ampere | |
| Genomsnitt Intel Core i9-11950H (7286 - 8152, n=3) | |
| HP ZBook Studio G7 | |
| Asus TUF Gaming A15 FA506QR-AZ061T | |
| HP ZBook Studio 15 G8 | |
| HWBOT x265 Benchmark v2.2 / 4k Preset | |
| Asus ROG Zephyrus S17 GX703HSD | |
| Asus ROG Strix Scar 15 G533QS | |
| HP ZBook Studio 15 G8 | |
| Genomsnitt Intel Core i9-11950H (13.8 - 14.5, n=4) | |
| Schenker XMG Core 15 Ampere | |
| Asus TUF Gaming A15 FA506QR-AZ061T | |
| MSI WS66 10TMT-207US | |
| HP ZBook Studio G7 | |
| Dell XPS 15 9510 11800H RTX 3050 Ti OLED | |
| Dell Precision 5550 P91F | |
| LibreOffice / 20 Documents To PDF | |
| HP ZBook Studio G7 | |
| Schenker XMG Core 15 Ampere | |
| Asus ROG Strix Scar 15 G533QS | |
| Asus TUF Gaming A15 FA506QR-AZ061T | |
| HP ZBook Studio 15 G8 | |
| Genomsnitt Intel Core i9-11950H (38.6 - 53.2, n=4) | |
| Dell XPS 15 9510 11800H RTX 3050 Ti OLED | |
| Asus ROG Zephyrus S17 GX703HSD | |
| MSI WS66 10TMT-207US | |
| Dell Precision 5550 P91F | |
| R Benchmark 2.5 / Overall mean | |
| Dell Precision 5550 P91F | |
| MSI WS66 10TMT-207US | |
| Schenker XMG Core 15 Ampere | |
| Dell XPS 15 9510 11800H RTX 3050 Ti OLED | |
| HP ZBook Studio G7 | |
| HP ZBook Studio 15 G8 | |
| Genomsnitt Intel Core i9-11950H (0.521 - 0.551, n=4) | |
| Asus ROG Zephyrus S17 GX703HSD | |
| Asus TUF Gaming A15 FA506QR-AZ061T | |
| Asus ROG Strix Scar 15 G533QS | |
* ... mindre är bättre
| PCMark 10 / Score | |
| HP ZBook Studio 15 G8 | |
| Dell Precision 7550 | |
| HP ZBook Firefly 15 G8 2C9R7EA | |
| HP ZBook Studio G7 | |
| Lenovo ThinkPad P15s Gen2-20W6000GGE | |
| Asus ProArt StudioBook Pro 15 W500G5T | |
| PCMark 10 / Essentials | |
| HP ZBook Studio 15 G8 | |
| Dell Precision 7550 | |
| Lenovo ThinkPad P15s Gen2-20W6000GGE | |
| HP ZBook Firefly 15 G8 2C9R7EA | |
| Asus ProArt StudioBook Pro 15 W500G5T | |
| HP ZBook Studio G7 | |
| PCMark 10 / Productivity | |
| Lenovo ThinkPad P15s Gen2-20W6000GGE | |
| HP ZBook Firefly 15 G8 2C9R7EA | |
| HP ZBook Studio 15 G8 | |
| Dell Precision 7550 | |
| Asus ProArt StudioBook Pro 15 W500G5T | |
| HP ZBook Studio G7 | |
| PCMark 10 / Digital Content Creation | |
| HP ZBook Studio 15 G8 | |
| Dell Precision 7550 | |
| HP ZBook Studio G7 | |
| HP ZBook Firefly 15 G8 2C9R7EA | |
| Asus ProArt StudioBook Pro 15 W500G5T | |
| Lenovo ThinkPad P15s Gen2-20W6000GGE | |
| PCMark 10 Score | 6751 poäng | |
Hjälp | ||
| DPC Latencies / LatencyMon - interrupt to process latency (max), Web, Youtube, Prime95 | |
| Dell Precision 7550 | |
| HP ZBook Studio G7 | |
| Lenovo ThinkPad P15s Gen2-20W6000GGE | |
| Asus ProArt StudioBook Pro 15 W500G5T | |
| HP ZBook Studio 15 G8 | |
| HP ZBook Firefly 15 G8 2C9R7EA | |
* ... mindre är bättre
| HP ZBook Studio 15 G8 Samsung PM981a MZVLB2T0HALB | HP ZBook Firefly 15 G8 2C9R7EA Toshiba XG6 KXG60ZNV1T02 | HP ZBook Studio G7 Micron 2300 1TB MTFDHBA1T0TDV | Dell Precision 7550 SK Hynix PC601A NVMe 1TB | Lenovo ThinkPad P15s Gen2-20W6000GGE WDC PC SN720 SDAQNTW-1T00 | Asus ProArt StudioBook Pro 15 W500G5T Samsung SSD PM981 MZVLB1T0HALR | |
|---|---|---|---|---|---|---|
| AS SSD | -1% | -16% | -20% | 11% | 4% | |
| Seq Read (MB/s) | 2953 | 2599 -12% | 2548 -14% | 2028 -31% | 2796 -5% | 2702 -8% |
| Seq Write (MB/s) | 1691 | 1305 -23% | 1312 -22% | 1193 -29% | 2525 49% | 2348 39% |
| 4K Read (MB/s) | 43.98 | 49.65 13% | 45.38 3% | 42.31 -4% | 50.9 16% | 37.59 -15% |
| 4K Write (MB/s) | 105.4 | 128.1 22% | 83 -21% | 105.5 0% | 211.9 101% | 107.1 2% |
| 4K-64 Read (MB/s) | 1065 | 1157 9% | 935 -12% | 1128 6% | 1505 41% | 1491 40% |
| 4K-64 Write (MB/s) | 1957 | 1475 -25% | 2314 18% | 1537 -21% | 949 -52% | 1794 -8% |
| Access Time Read * (ms) | 0.04 | 0.057 -43% | 0.057 -43% | 0.069 -73% | 0.081 -103% | 0.046 -15% |
| Access Time Write * (ms) | 0.105 | 0.03 71% | 0.098 7% | 0.106 -1% | 0.019 82% | 0.034 68% |
| Score Read (Points) | 1404 | 1467 4% | 1235 -12% | 1373 -2% | 1835 31% | 1798 28% |
| Score Write (Points) | 2232 | 1734 -22% | 2528 13% | 1762 -21% | 1413 -37% | 2136 -4% |
| Score Total (Points) | 4297 | 3894 -9% | 4342 1% | 3801 -12% | 4177 -3% | 4835 13% |
| Copy ISO MB/s (MB/s) | 2474 | 3142 27% | 1768 -29% | 2302 -7% | ||
| Copy Program MB/s (MB/s) | 1074 | 126.1 -88% | 627 -42% | 564 -47% | ||
| Copy Game MB/s (MB/s) | 1929 | 477.4 -75% | 1477 -23% | 1336 -31% | ||
| CrystalDiskMark 5.2 / 6 | 1% | -9% | -8% | 22% | 106% | |
| Write 4K (MB/s) | 110.5 | 140.6 27% | 95.5 -14% | 121 10% | 237.6 115% | 1107 902% |
| Read 4K (MB/s) | 51.8 | 52.8 2% | 48.99 -5% | 42.16 -19% | 54.7 6% | 43.38 -16% |
| Write Seq (MB/s) | 2071 | 1844 -11% | 2001 -3% | 2150 4% | 2603 26% | 2387 15% |
| Read Seq (MB/s) | 2505 | 2108 -16% | 1600 -36% | 1755 -30% | 1889 -25% | 2431 -3% |
| Write 4K Q32T1 (MB/s) | 429.8 | 418 -3% | 410.2 -5% | 395.3 -8% | 505 17% | 340.7 -21% |
| Read 4K Q32T1 (MB/s) | 418.3 | 476.8 14% | 394.7 -6% | 381.8 -9% | 606 45% | 397.8 -5% |
| Write Seq Q32T1 (MB/s) | 3060 | 3064 0% | 3148 3% | 2730 -11% | 2795 -9% | 2390 -22% |
| Read Seq Q32T1 (MB/s) | 3539 | 3289 -7% | 3227 -9% | 3468 -2% | 3448 -3% | 3502 -1% |
| Totalt genomsnitt (program/inställningar) | 0% /
-0% | -13% /
-13% | -14% /
-16% | 17% /
15% | 55% /
41% |
* ... mindre är bättre

DiskSpd Read Loop, Queue Depth 8
| 3DMark 11 | |
| 1280x720 Performance GPU | |
| Asus ROG Strix Scar 15 G533QS | |
| Genomsnitt NVIDIA GeForce RTX 3070 Laptop GPU (12535 - 38275, n=54) | |
| HP ZBook Studio 15 G8 | |
| Schenker XMG Core 15 Ampere | |
| MSI WS66 10TMT-207US | |
| Dell Precision 7550 | |
| MSI GE65 Raider 9SF-049US | |
| HP ZBook Studio G7 | |
| Dell Inspiron 16 Plus 7610 | |
| Dell XPS 15 9510 11800H RTX 3050 Ti OLED | |
| Apple MacBook Pro 15 2019 i9 Vega 20 | |
| Dell Precision 5550 P91F | |
| HP ZBook Firefly 15 G8 2C9R7EA | |
| 1280x720 Performance Combined | |
| Asus ROG Strix Scar 15 G533QS | |
| MSI WS66 10TMT-207US | |
| MSI GE65 Raider 9SF-049US | |
| Genomsnitt NVIDIA GeForce RTX 3070 Laptop GPU (3715 - 22517, n=53) | |
| HP ZBook Studio G7 | |
| Schenker XMG Core 15 Ampere | |
| Dell Inspiron 16 Plus 7610 | |
| Dell XPS 15 9510 11800H RTX 3050 Ti OLED | |
| Dell Precision 5550 P91F | |
| Dell Precision 7550 | |
| HP ZBook Studio 15 G8 | |
| Apple MacBook Pro 15 2019 i9 Vega 20 | |
| HP ZBook Firefly 15 G8 2C9R7EA | |
| 3DMark 11 Performance | 22946 poäng | |
| 3DMark Cloud Gate Standard Score | 32051 poäng | |
| 3DMark Fire Strike Score | 19167 poäng | |
| 3DMark Time Spy Score | 8050 poäng | |
Hjälp | ||
Witcher 3 FPS-tabell
| låg | med. | hög | ultra | QHD | 4K | |
|---|---|---|---|---|---|---|
| The Witcher 3 (2015) | 365.9 | 252.2 | 154.2 | 81.5 | 40.3 | |
| Dota 2 Reborn (2015) | 162.5 | 144.1 | 135.8 | 116.3 | 93.1 | |
| Final Fantasy XV Benchmark (2018) | 144 | 104 | 78.5 | 61.3 | 36.2 | |
| X-Plane 11.11 (2018) | 120 | 104 | 83.5 | 54.4 | ||
| Far Cry 5 (2018) | 125 | 100 | 93 | 89 | 81 | 44 |
| HP ZBook Studio 15 G8 GeForce RTX 3070 Laptop GPU, i9-11950H, Samsung PM981a MZVLB2T0HALB | HP ZBook Firefly 15 G8 2C9R7EA T500 Laptop GPU, i7-1165G7, Toshiba XG6 KXG60ZNV1T02 | HP ZBook Studio G7 Quadro RTX 3000 Max-Q, i9-10885H, Micron 2300 1TB MTFDHBA1T0TDV | Dell Precision 7550 Quadro RTX 5000 Max-Q, W-10885M, SK Hynix PC601A NVMe 1TB | Lenovo ThinkPad P15s Gen2-20W6000GGE T500 Laptop GPU, i7-1165G7, WDC PC SN720 SDAQNTW-1T00 | Asus ProArt StudioBook Pro 15 W500G5T Quadro RTX 5000 Max-Q, i7-9750H, Samsung SSD PM981 MZVLB1T0HALR | |
|---|---|---|---|---|---|---|
| Noise | 11% | 2% | -7% | 6% | -8% | |
| av / miljö * (dB) | 23.5 | 24.1 -3% | 24.4 -4% | 25.8 -10% | 24.3 -3% | 25.2 -7% |
| Idle Minimum * (dB) | 25.3 | 24.1 5% | 24.4 4% | 25.8 -2% | 25.5 -1% | 27.9 -10% |
| Idle Average * (dB) | 25.3 | 24.1 5% | 24.4 4% | 25.8 -2% | 25.5 -1% | 27.9 -10% |
| Idle Maximum * (dB) | 25.3 | 27.1 -7% | 27.9 -10% | 25.9 -2% | 25.5 -1% | 27.9 -10% |
| Load Average * (dB) | 41.2 | 32.8 20% | 38.8 6% | 51.2 -24% | 35.65 13% | 47 -14% |
| Witcher 3 ultra * (dB) | 49.4 | 36.1 27% | 46.3 6% | 51.9 -5% | ||
| Load Maximum * (dB) | 49.4 | 36.1 27% | 46.3 6% | 51.9 -5% | 35.65 28% | 46.9 5% |
* ... mindre är bättre
Ljudnivå
| Låg belastning |
| 25.3 / 25.3 / 25.3 dB(A) |
| Hög belastning |
| 41.2 / 49.4 dB(A) |
 | ||
30 dB tyst 40 dB(A) hörbar 50 dB(A) högt ljud |
||
min: | ||
(-) Den maximala temperaturen på ovansidan är 49 °C / 120 F, jämfört med genomsnittet av 38.2 °C / 101 F , allt från 22.2 till 69.8 °C för klassen Workstation.
(-) Botten värms upp till maximalt 54.2 °C / 130 F, jämfört med genomsnittet av 41.1 °C / 106 F
(+) Vid tomgångsbruk är medeltemperaturen för ovansidan 25.4 °C / 78 F, jämfört med enhetsgenomsnittet på 32 °C / ### class_avg_f### F.
(-) När du spelar The Witcher 3 är medeltemperaturen för ovansidan 43.2 °C / 110 F, jämfört med enhetsgenomsnittet på 32 °C / ## #class_avg_f### F.
(±) Handledsstöden och pekplattan kan bli väldigt varma vid beröring med maximalt 38.4 °C / 101.1 F.
(-) Medeltemperaturen för handledsstödsområdet på liknande enheter var 27.8 °C / 82 F (-10.6 °C / -19.1 F).
HP ZBook Studio 15 G8 ljudanalys
(+) | högtalare kan spela relativt högt (85.1 dB)
Bas 100 - 315 Hz
(±) | reducerad bas - i genomsnitt 6% lägre än medianen
(±) | linjäriteten för basen är genomsnittlig (8.2% delta till föregående frekvens)
Mellan 400 - 2000 Hz
(+) | balanserad mellan - endast 3.8% från medianen
(+) | mids är linjära (3.9% delta till föregående frekvens)
Högsta 2 - 16 kHz
(+) | balanserade toppar - endast 3.4% från medianen
(+) | toppar är linjära (6.5% delta till föregående frekvens)
Totalt 100 - 16 000 Hz
(+) | det totala ljudet är linjärt (8% skillnad mot median)
Jämfört med samma klass
» 1% av alla testade enheter i den här klassen var bättre, 1% liknande, 99% sämre
» Den bästa hade ett delta på 7%, genomsnittet var 17%, sämst var 35%
Jämfört med alla testade enheter
» 2% av alla testade enheter var bättre, 1% liknande, 98% sämre
» Den bästa hade ett delta på 4%, genomsnittet var 24%, sämst var 134%
Apple MacBook 12 (Early 2016) 1.1 GHz ljudanalys
(+) | högtalare kan spela relativt högt (83.6 dB)
Bas 100 - 315 Hz
(±) | reducerad bas - i genomsnitt 11.3% lägre än medianen
(±) | linjäriteten för basen är genomsnittlig (14.2% delta till föregående frekvens)
Mellan 400 - 2000 Hz
(+) | balanserad mellan - endast 2.4% från medianen
(+) | mids är linjära (5.5% delta till föregående frekvens)
Högsta 2 - 16 kHz
(+) | balanserade toppar - endast 2% från medianen
(+) | toppar är linjära (4.5% delta till föregående frekvens)
Totalt 100 - 16 000 Hz
(+) | det totala ljudet är linjärt (10.2% skillnad mot median)
Jämfört med samma klass
» 7% av alla testade enheter i den här klassen var bättre, 2% liknande, 91% sämre
» Den bästa hade ett delta på 5%, genomsnittet var 18%, sämst var 53%
Jämfört med alla testade enheter
» 5% av alla testade enheter var bättre, 1% liknande, 94% sämre
» Den bästa hade ett delta på 4%, genomsnittet var 24%, sämst var 134%
| Av/Standby | |
| Låg belastning | |
| Hög belastning |
|
Förklaring:
min: | |
| HP ZBook Studio 15 G8 i9-11950H, GeForce RTX 3070 Laptop GPU, Samsung PM981a MZVLB2T0HALB, OLED, 3840x2160, 15.6" | HP ZBook Firefly 15 G8 2C9R7EA i7-1165G7, T500 Laptop GPU, Toshiba XG6 KXG60ZNV1T02, IPS, 1920x1080, 15.6" | HP ZBook Studio G7 i9-10885H, Quadro RTX 3000 Max-Q, Micron 2300 1TB MTFDHBA1T0TDV, IPS, 3840x2160, 15.6" | Dell Precision 7550 W-10885M, Quadro RTX 5000 Max-Q, SK Hynix PC601A NVMe 1TB, IPS, 3840x2160, 15.6" | Lenovo ThinkPad P15s Gen2-20W6000GGE i7-1165G7, T500 Laptop GPU, WDC PC SN720 SDAQNTW-1T00, IPS LED, 3840x2160, 15.6" | Asus ProArt StudioBook Pro 15 W500G5T i7-9750H, Quadro RTX 5000 Max-Q, Samsung SSD PM981 MZVLB1T0HALR, IPS, 3840x2160, 15.6" | |
|---|---|---|---|---|---|---|
| Power Consumption | 63% | 19% | 2% | 54% | 6% | |
| Idle Minimum * (Watt) | 11 | 3.3 70% | 5.5 50% | 8.2 25% | 5.8 47% | 11.6 -5% |
| Idle Average * (Watt) | 18.8 | 5.6 70% | 13.7 27% | 16.8 11% | 13.3 29% | 19 -1% |
| Idle Maximum * (Watt) | 31.7 | 8.7 73% | 16.6 48% | 24.4 23% | 15.6 51% | 20.6 35% |
| Load Average * (Watt) | 105.2 | 64.4 39% | 118.4 -13% | 131 -25% | 43.2 59% | 102 3% |
| Witcher 3 ultra * (Watt) | 148 | 53 64% | 120 19% | 156.6 -6% | 37.1 75% | |
| Load Maximum * (Watt) | 171.8 | 69 60% | 203.3 -18% | 201.8 -17% | 67.3 61% | 178 -4% |
* ... mindre är bättre
Energiförbrukning: Witcher 3 / Stress-test
| HP ZBook Studio 15 G8 i9-11950H, GeForce RTX 3070 Laptop GPU, 83 Wh | HP ZBook Firefly 15 G8 2C9R7EA i7-1165G7, T500 Laptop GPU, 56 Wh | HP ZBook Studio G7 i9-10885H, Quadro RTX 3000 Max-Q, 83 Wh | Dell Precision 7550 W-10885M, Quadro RTX 5000 Max-Q, 95 Wh | Lenovo ThinkPad P15s Gen2-20W6000GGE i7-1165G7, T500 Laptop GPU, 57 Wh | Asus ProArt StudioBook Pro 15 W500G5T i7-9750H, Quadro RTX 5000 Max-Q, 76 Wh | |
|---|---|---|---|---|---|---|
| Batteridrifttid | 49% | 8% | -5% | 15% | -24% | |
| Reader / Idle (h) | 12.9 | 11.1 -14% | ||||
| WiFi v1.3 (h) | 6.2 | 10.5 69% | 7.8 26% | 8.9 44% | 7.7 24% | 4.7 -24% |
| Load (h) | 1.8 | 2.3 28% | 1.6 -11% | 1 -44% | 1.9 6% |
För
Emot
Omdöme – Bra vinster på CPU-sidan, oinspirerade vinster på GPU-sidan
Läs den fullständiga versionen av den här recensionen på engelska här.
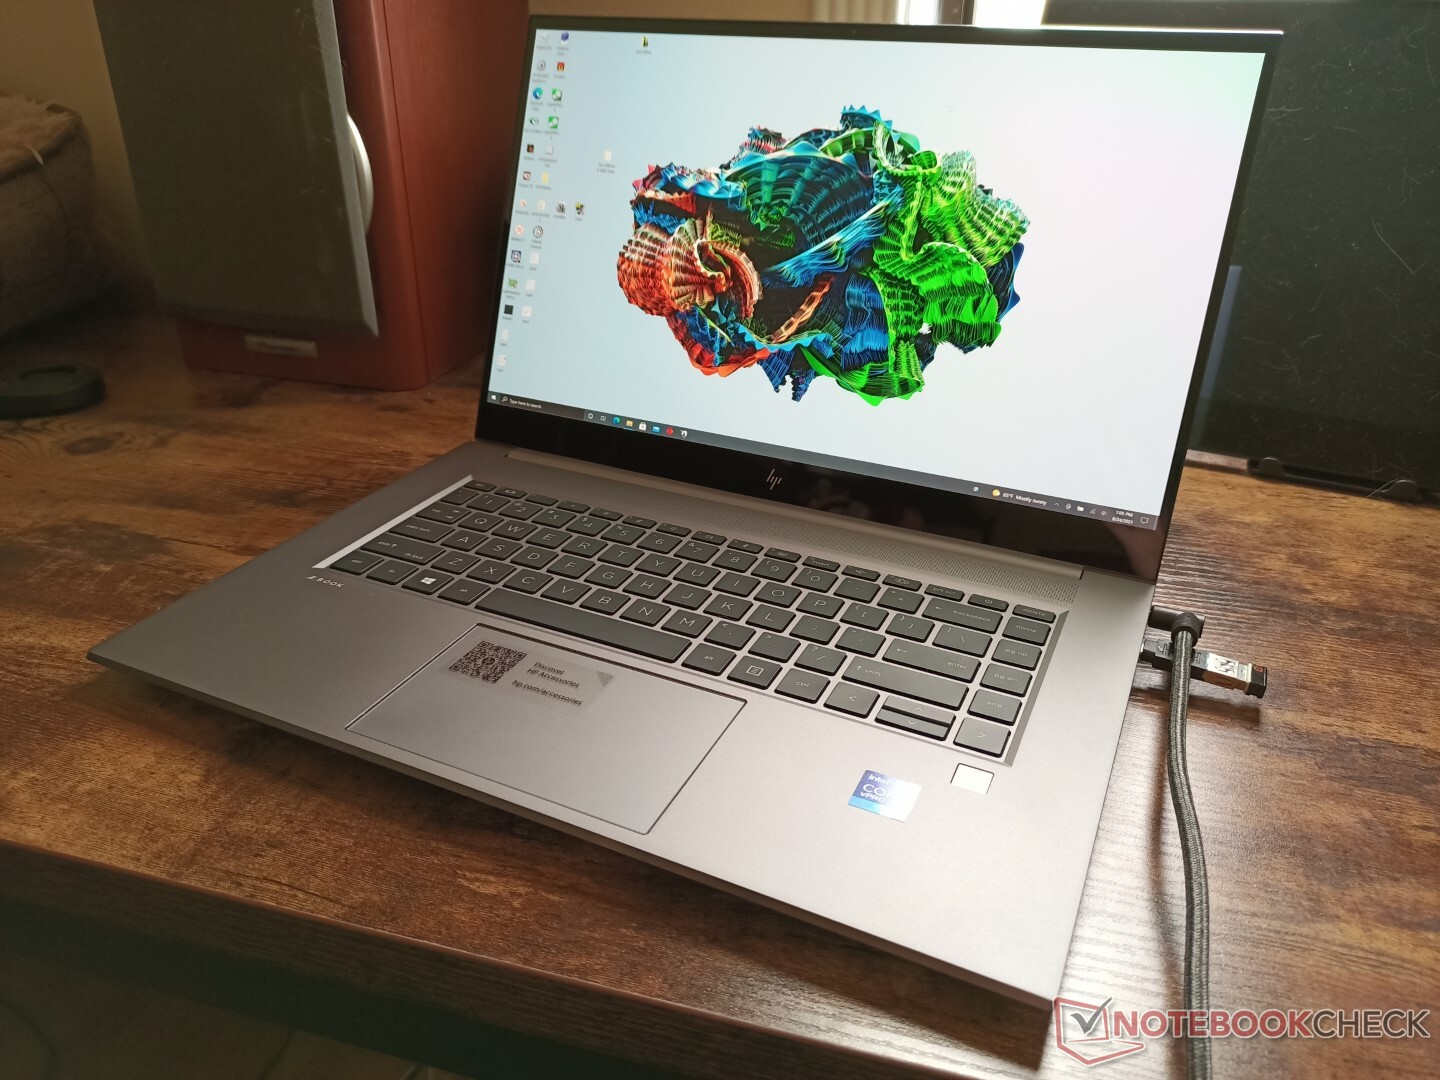
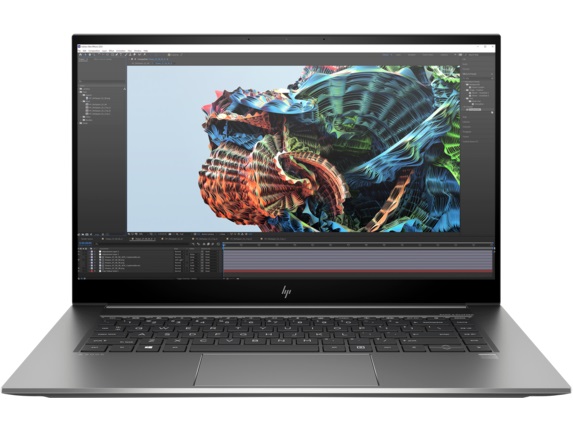
HP har för tillfället tre modeller av ZBook G8 att välja på: ZBook Studio G8, ZBook Fury G8 och ZBook Firefly G8. Tjocka Fury G8 tar upp det traditionella arbetsstationsutrymmet medans tunna och lätta Firefly G8 använder ULV och är mer portabel. ZBook Studio G8 är en bra medelväg för den som vill ha prestandan från Core H-serien utan Furys klumpighet.
Denna medelvägslösning innebär dock att man går miste om vissa funktioner som finns på Fury. Den lätt avlägsnade bottenplattan, det numeriska tangentbordet, musknapparna, TrackPoint-enheten, Xeon-processorerna, uppgraderingsbart ECC RAM, skyddsöverdrag för webbkameran, mm saknas på ZBook Studio G8. Önskar man dessa funktioner är det bättre att överväga den tjockare Fury-modellen.
Pålitliga ZBook Studio G8 fungerar bra och ser ännu bättre ut trots en ett år gammal design. Men GeForce RTX 3070 GPU:n når inte upp till sin potential och OLED-panelen har några nämnvärda brister jämfört med de billigare IPS-alternativen.
Jämfört med mer direkta konkurrenter som MSI WS66 och Razer Blade 15 Studio har MSI:s dator Xeon som alternativ och båda kan hålla två M.2 SSD-enheter istället för bara en. CPU-temperaturerna vid hög belastning kan också hålla sig svalare än på HP:s modell. ZBook Studio G8 har däremot högre kvalitet på konstruktionen än MSI:s dator och ett bättre tangentbord än båda alternativen.
HP ZBook Studio 15 G8
- 08/31/2022 v7 (old)
Allen Ngo
Price comparison
