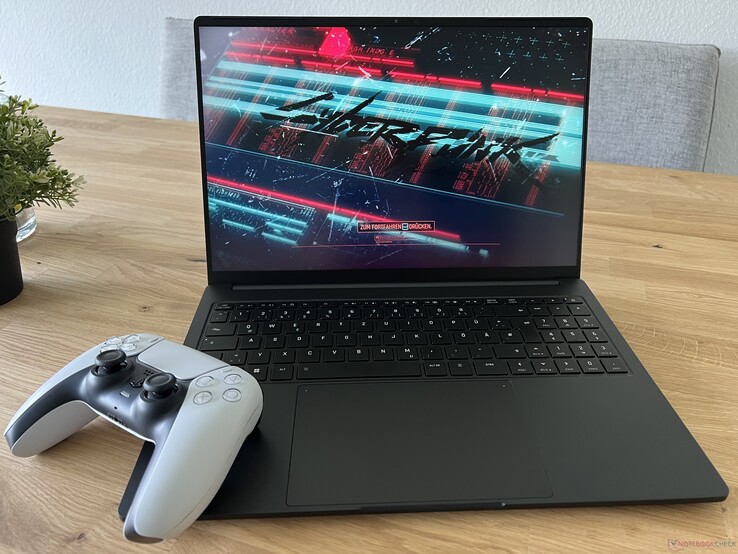
Schenker Vision 16 Pro 2023 recension: 1.6 kg lätt och kraftfullt paket med RTX 4070 Laptop
Schenker har uppdaterat Vision 16 Pro för 2023 och erbjuder återigen en extremt lätt 16-tums laptop med mycket hög prestanda. Processorn har uppgraderats till Intels nuvarande Core i7-13700H Raptor Lake-chip, och som grafikkort kan du antingen välja det nya GeForce RTX 4060 bärbar dator eller denRTX 4070 bärbar datorvar och en med en maximal TGP på 95 watt. Utöver dessa två uppdateringar har även kylsystemet förbättrats (nya fläktar), och förutom processorn använder nu även GPU:n kylning med flytande metall för optimal värmeöverföring.
Priset för den nya modellen med Core i7-13700H, GeForce RTX 4060 Laptop, 16 GB RAM och en 500 GB SSD börjar från 2 099 euro (~2361 USD). Vår testkonfiguration med den snabbare RTX 4070 Laptop, 32 GB RAM och en 1 TB SSD samt Windows 11 förinstallerat kostar cirka 2 600 euro (~2 924 USD), vilket också motsvarar priset för föregångaren.
Potentiella konkurrenter i jämförelse
Gradering | Datum | Modell | Vikt | Höjd | Storlek | Upplösning | Pris |
|---|---|---|---|---|---|---|---|
| 88.6 % v7 (old) | 07/2023 | Schenker VISION 16 Pro (M23) i7-13700H, GeForce RTX 4070 Laptop GPU | 1.6 kg | 17.1 mm | 16.00" | 2560x1600 | |
| 88.8 % v7 (old) | 05/2023 | Samsung Galaxy Book3 Ultra 16, i9-13900H RTX 4070 i9-13900H, GeForce RTX 4070 Laptop GPU | 1.8 kg | 16.8 mm | 16.00" | 2880x1800 | |
| 88.8 % v7 (old) | 07/2023 | MSI Stealth 16 Studio A13VG i7-13700H, GeForce RTX 4070 Laptop GPU | 2 kg | 19.95 mm | 16.00" | 2560x1600 | |
| 90.3 % v7 (old) | 04/2023 | Dell XPS 15 9530 RTX 4070 i7-13700H, GeForce RTX 4070 Laptop GPU | 1.9 kg | 18 mm | 15.60" | 3456x2160 | |
| 86.1 % v7 (old) | 06/2023 | Asus ProArt Studiobook 16 OLED H7604 i9-13980HX, GeForce RTX 4070 Laptop GPU | 2.4 kg | 23.9 mm | 16.00" | 3200x2000 | |
| 93.7 % v7 (old) | 03/2023 | Apple MacBook Pro 16 2023 M2 Max M2 Max, M2 Max 38-Core GPU | 2.2 kg | 16.8 mm | 16.20" | 3456x2234 |
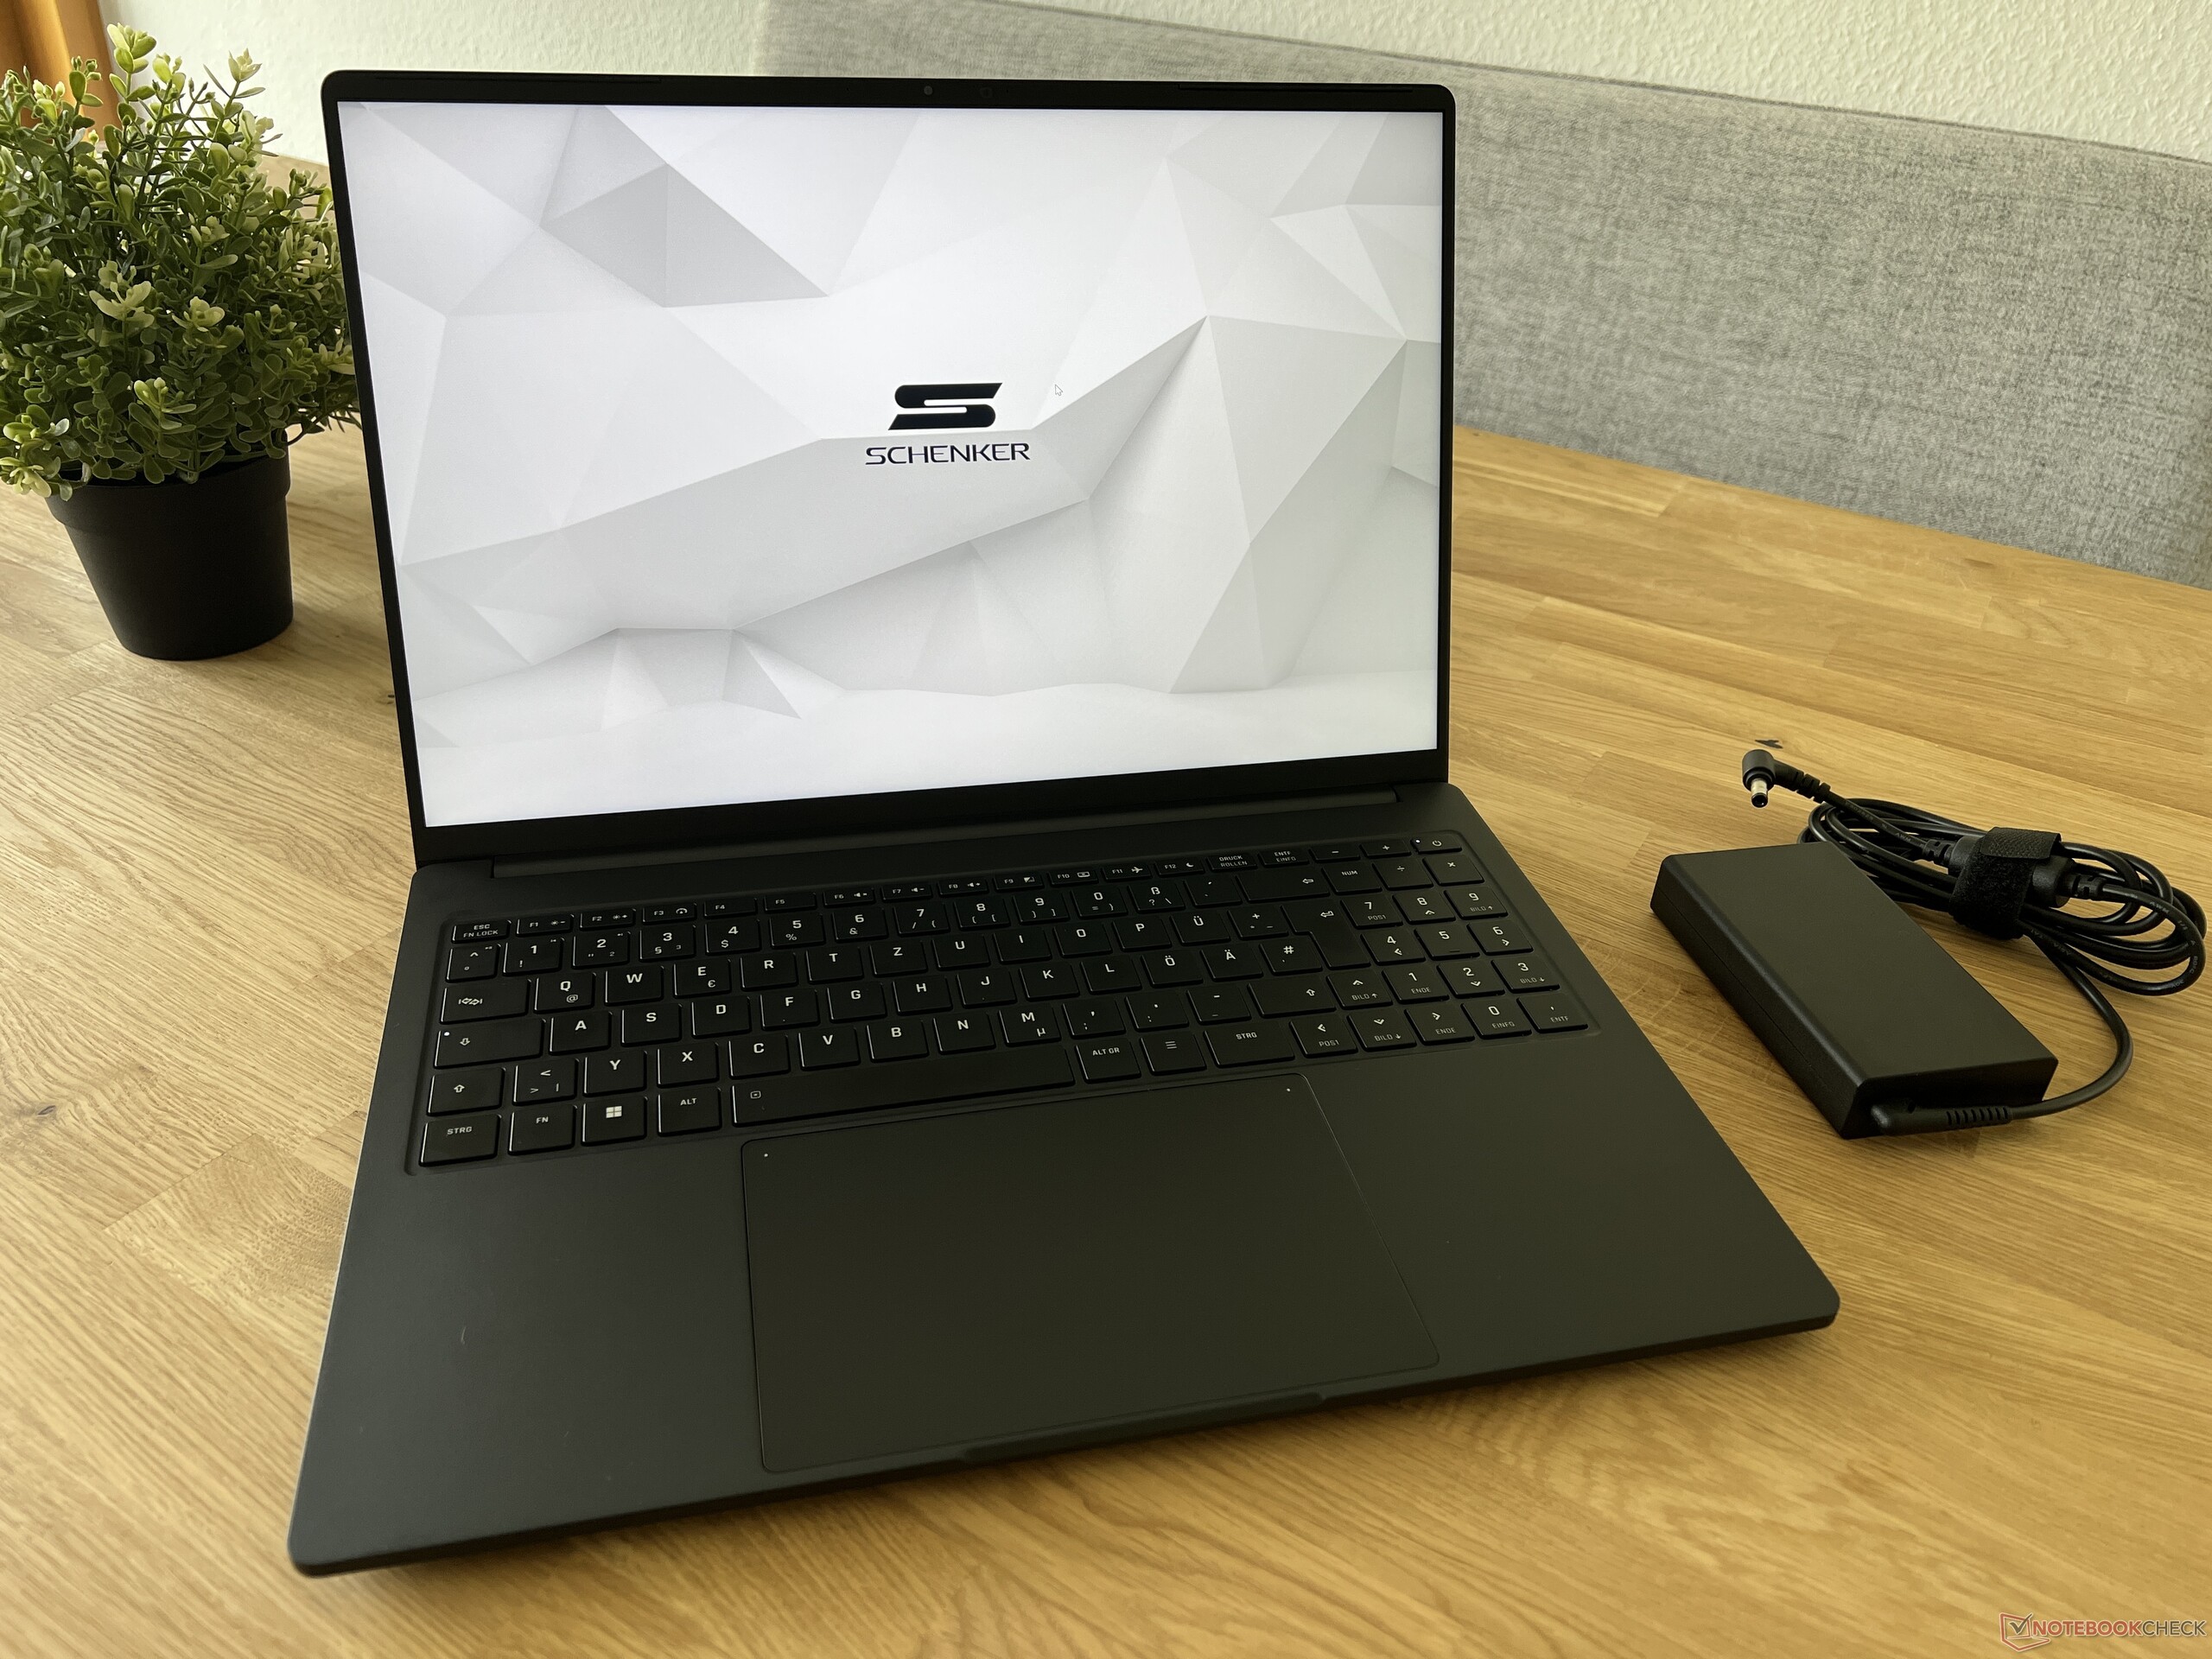
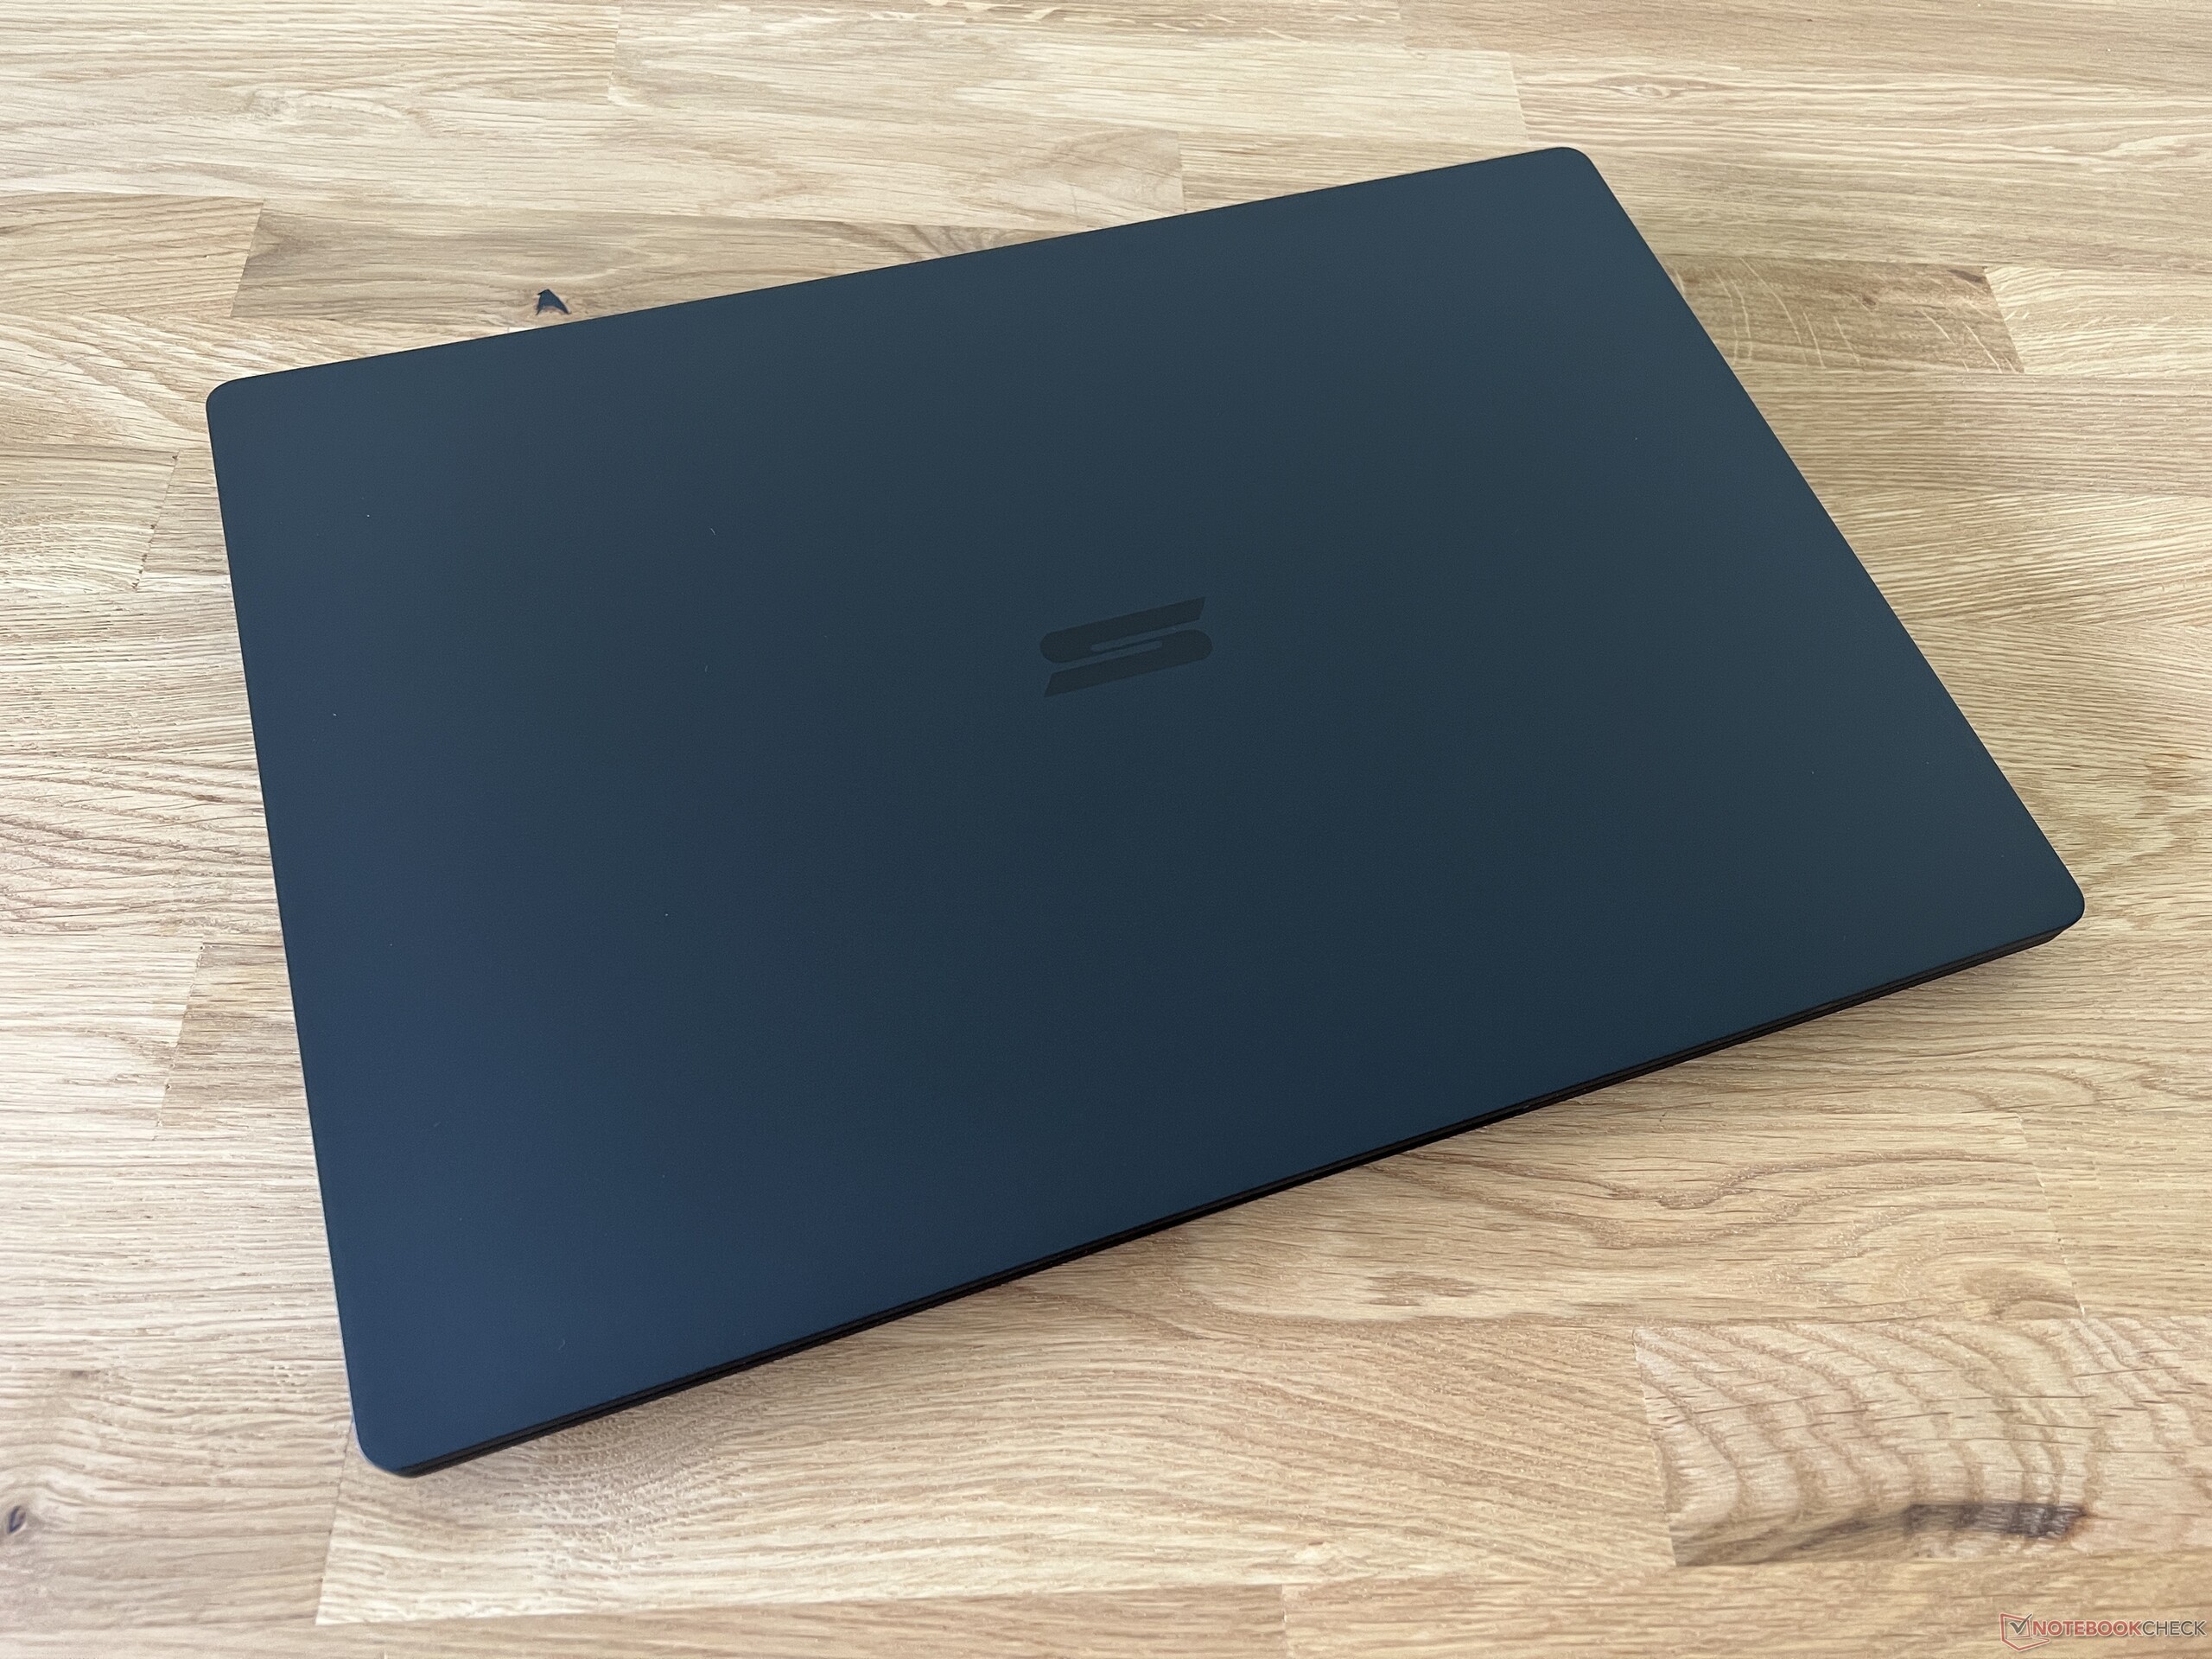
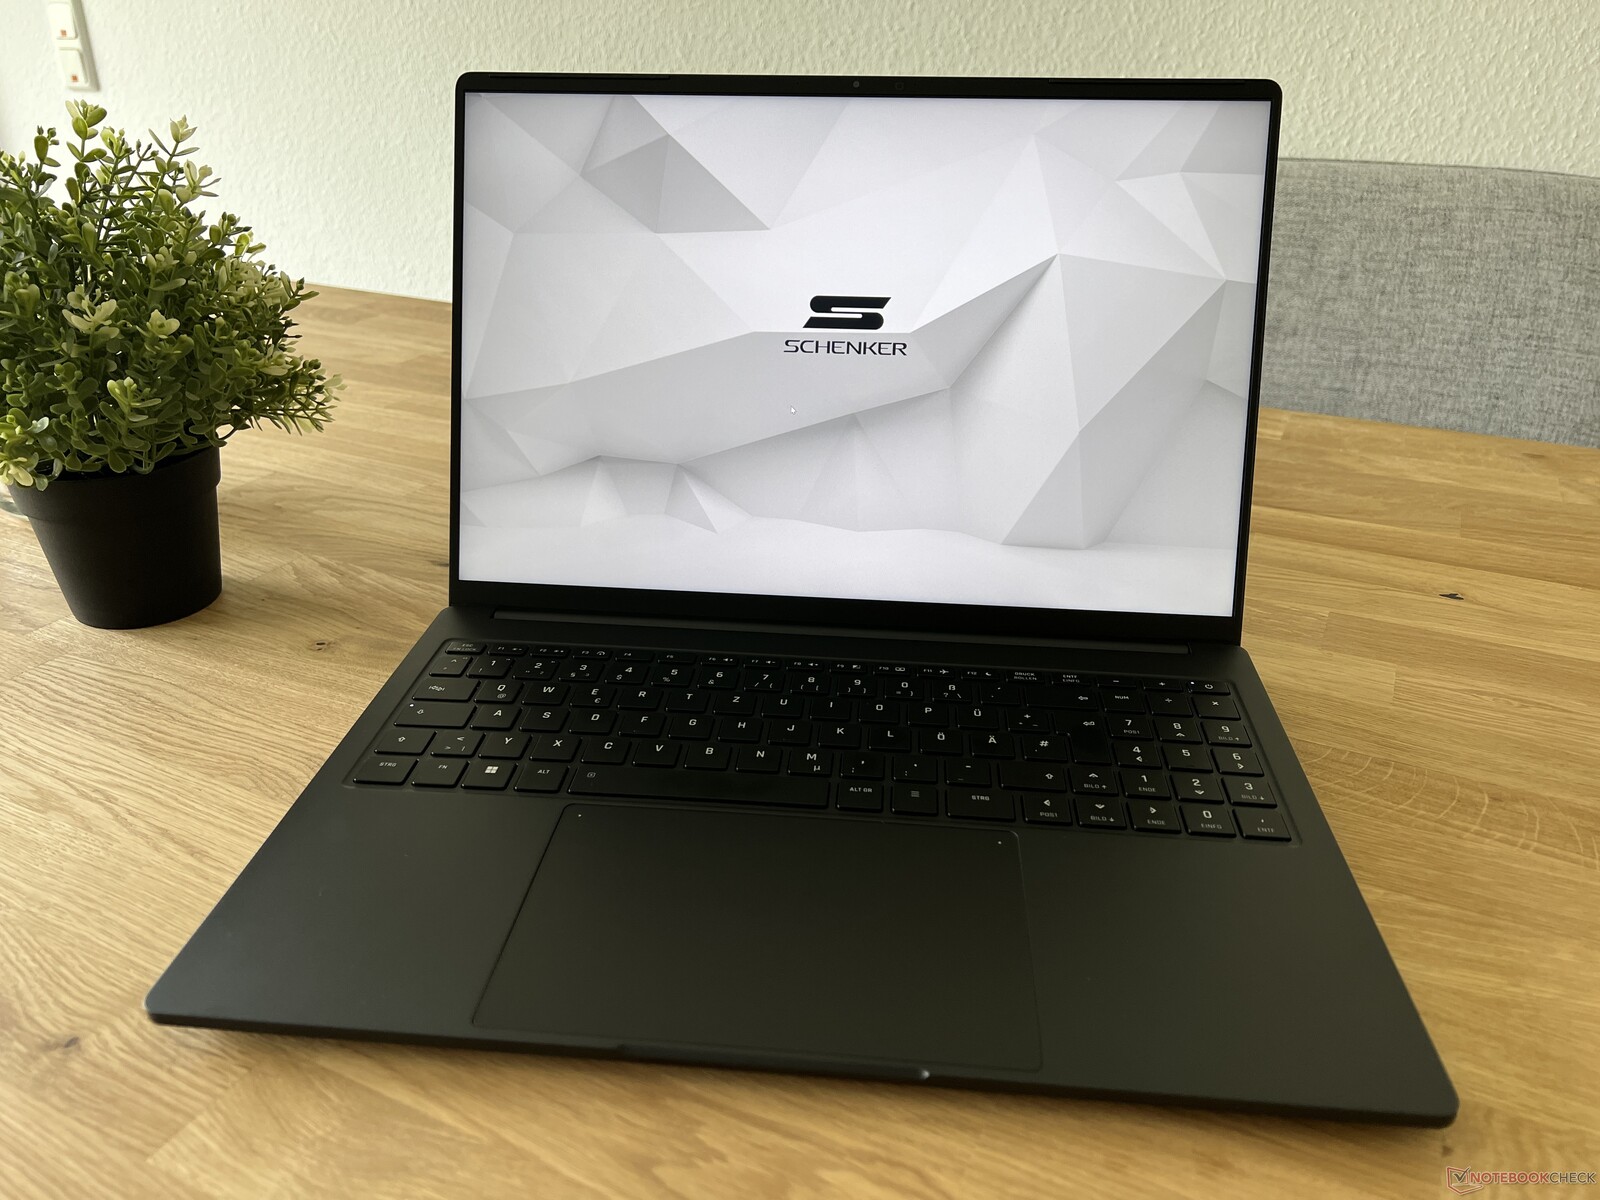
Hölje - Lätt magnesiumhölje på 1,6 kg (~3,5 lb)
Sedan förra året har Schenker inte ändrat någonting i lådan, och den här gången har vi den svarta versionen i vårt test. Den saknar alla kontraster och ser mycket mer diskret ut än silverversionen. Med endast 1,6 kg (~3,5 lb) fortsätter magnesiumhöljet (basenhet och skärmlock) att vara extremt lätt för en snabb 16-tums bärbar dator. Basenheten är mycket robust och endast tangentbordets mitt kan tryckas ned minimalt, utan att detta orsakar några problem i den dagliga användningen. Det tunna skärmlocket är något mer flexibelt, och gångjärnen fortsätter att tillåta viss synlig vobbling.
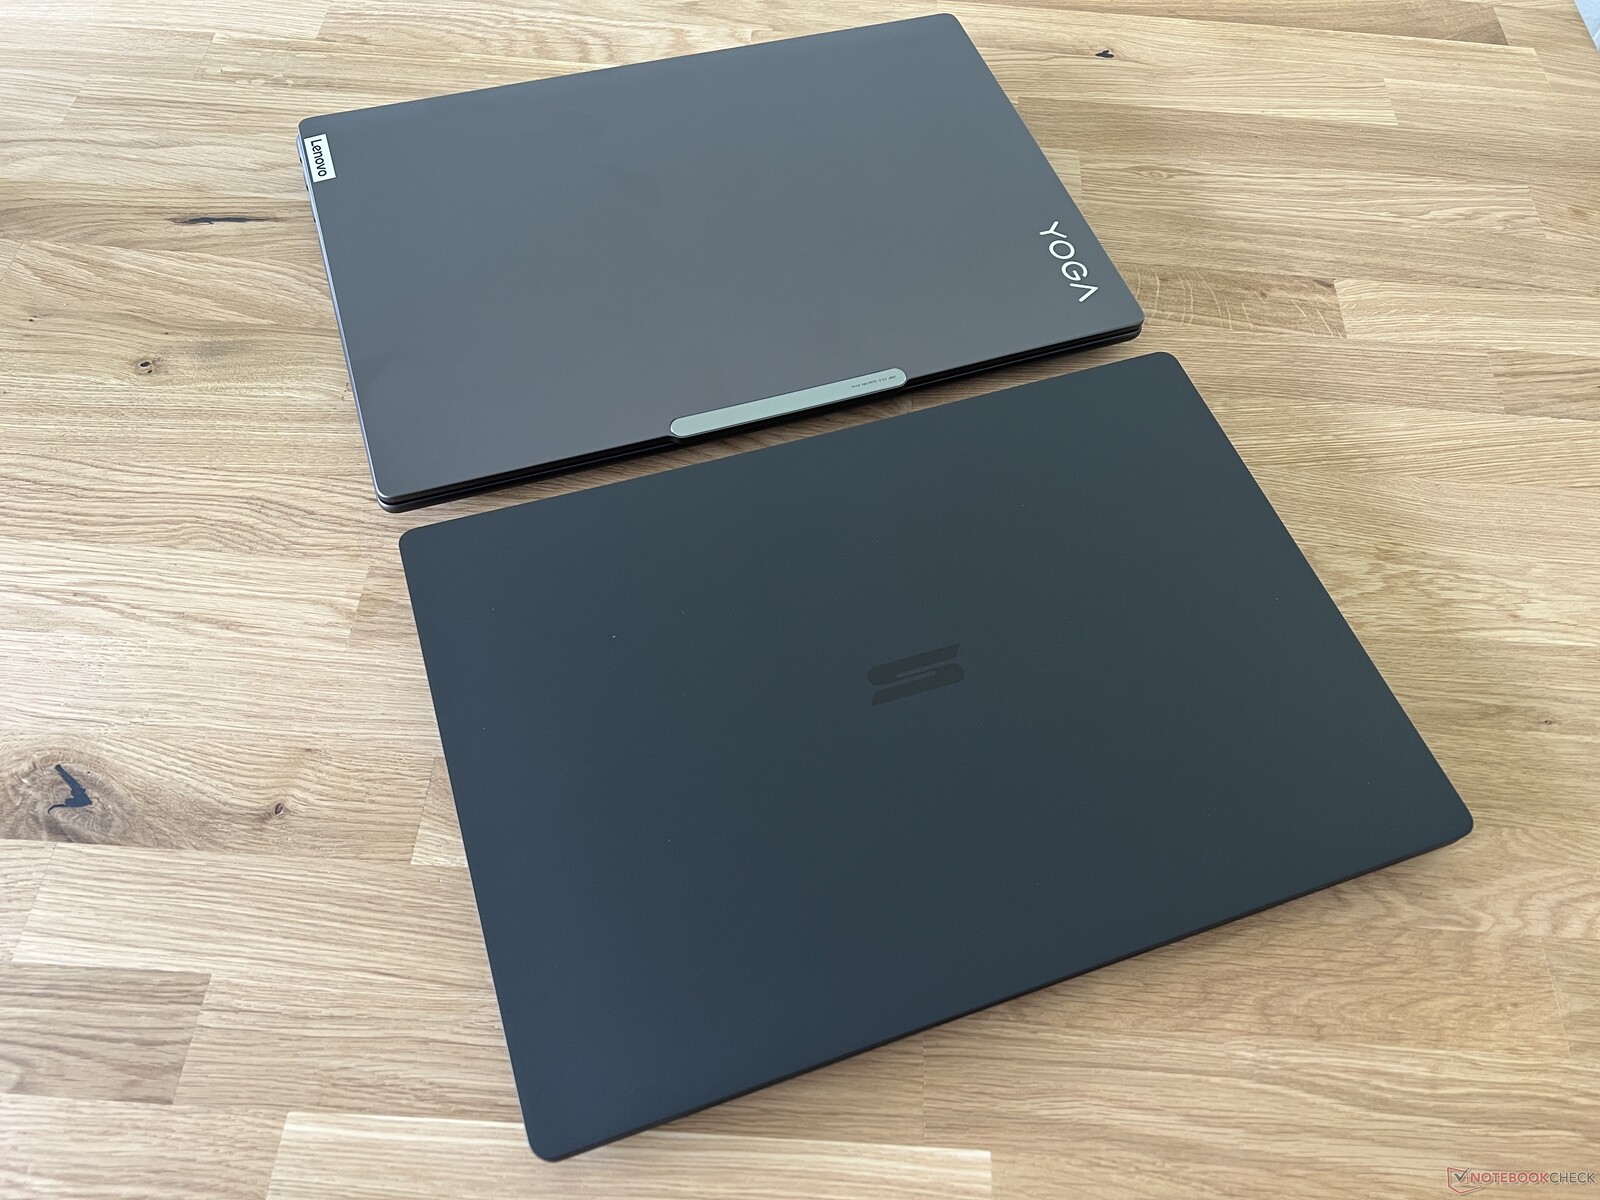
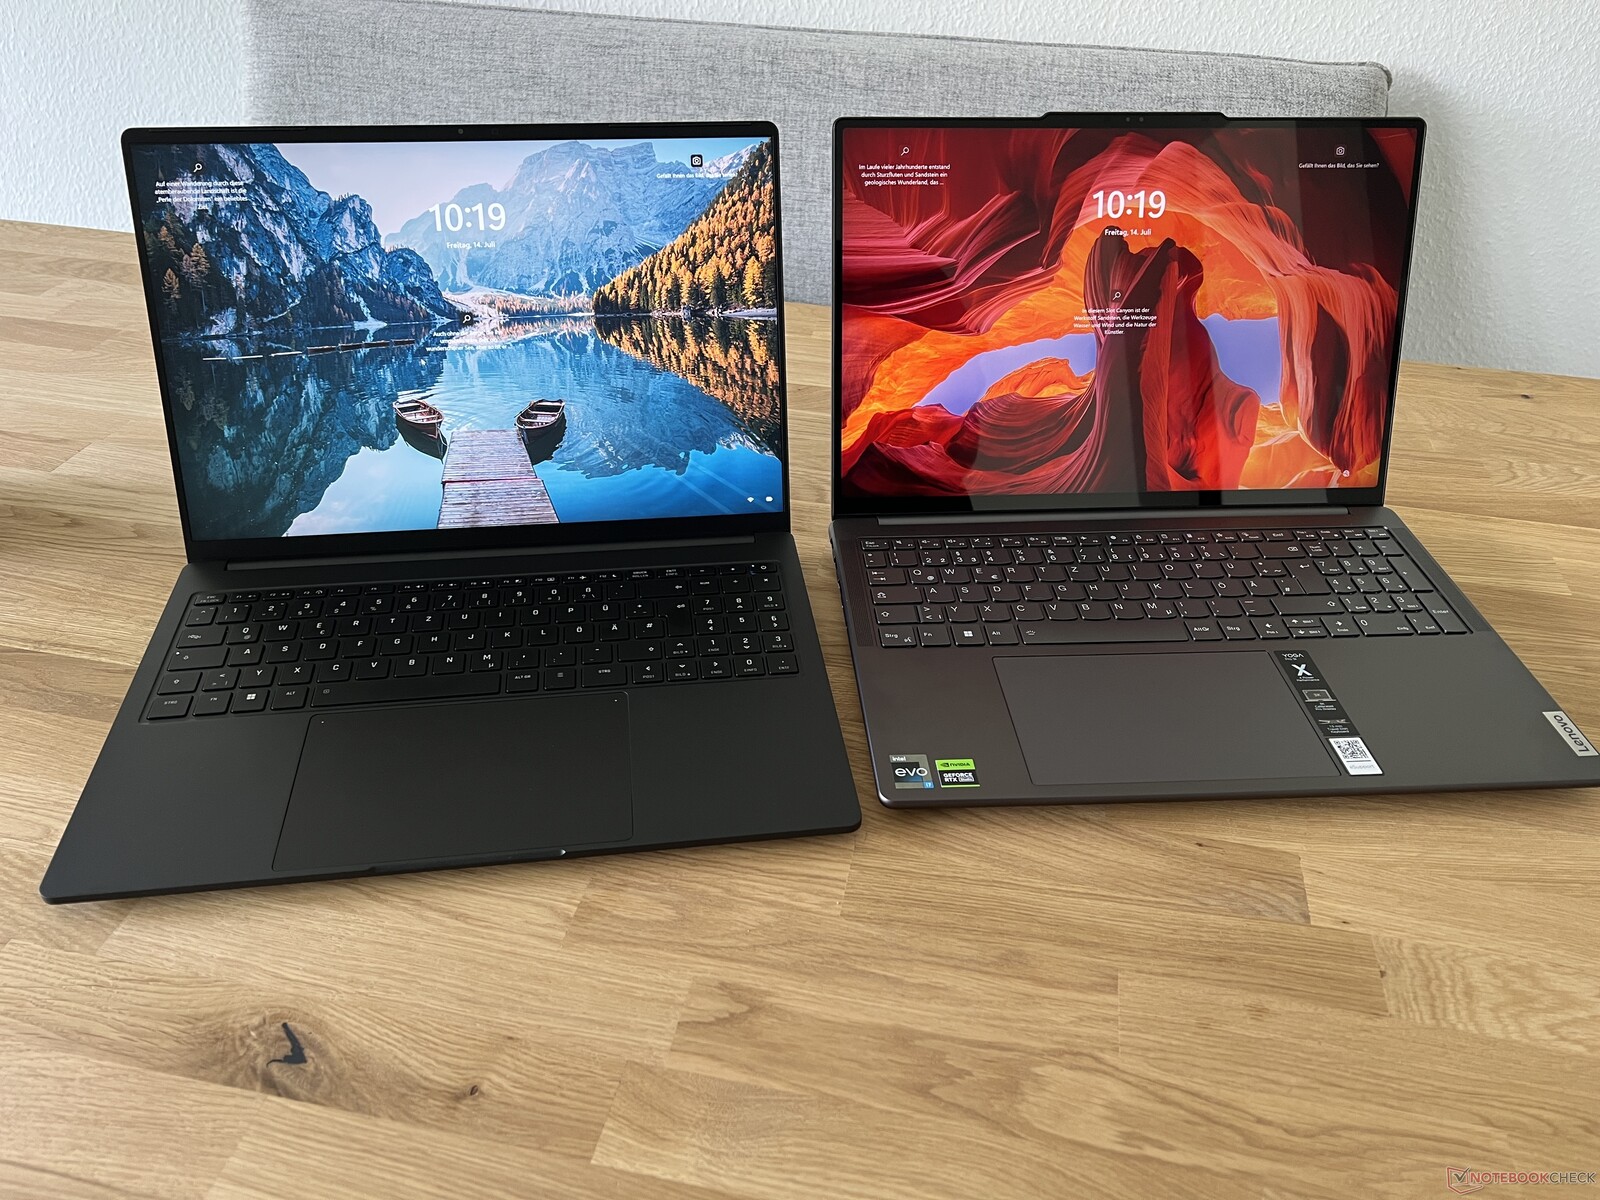
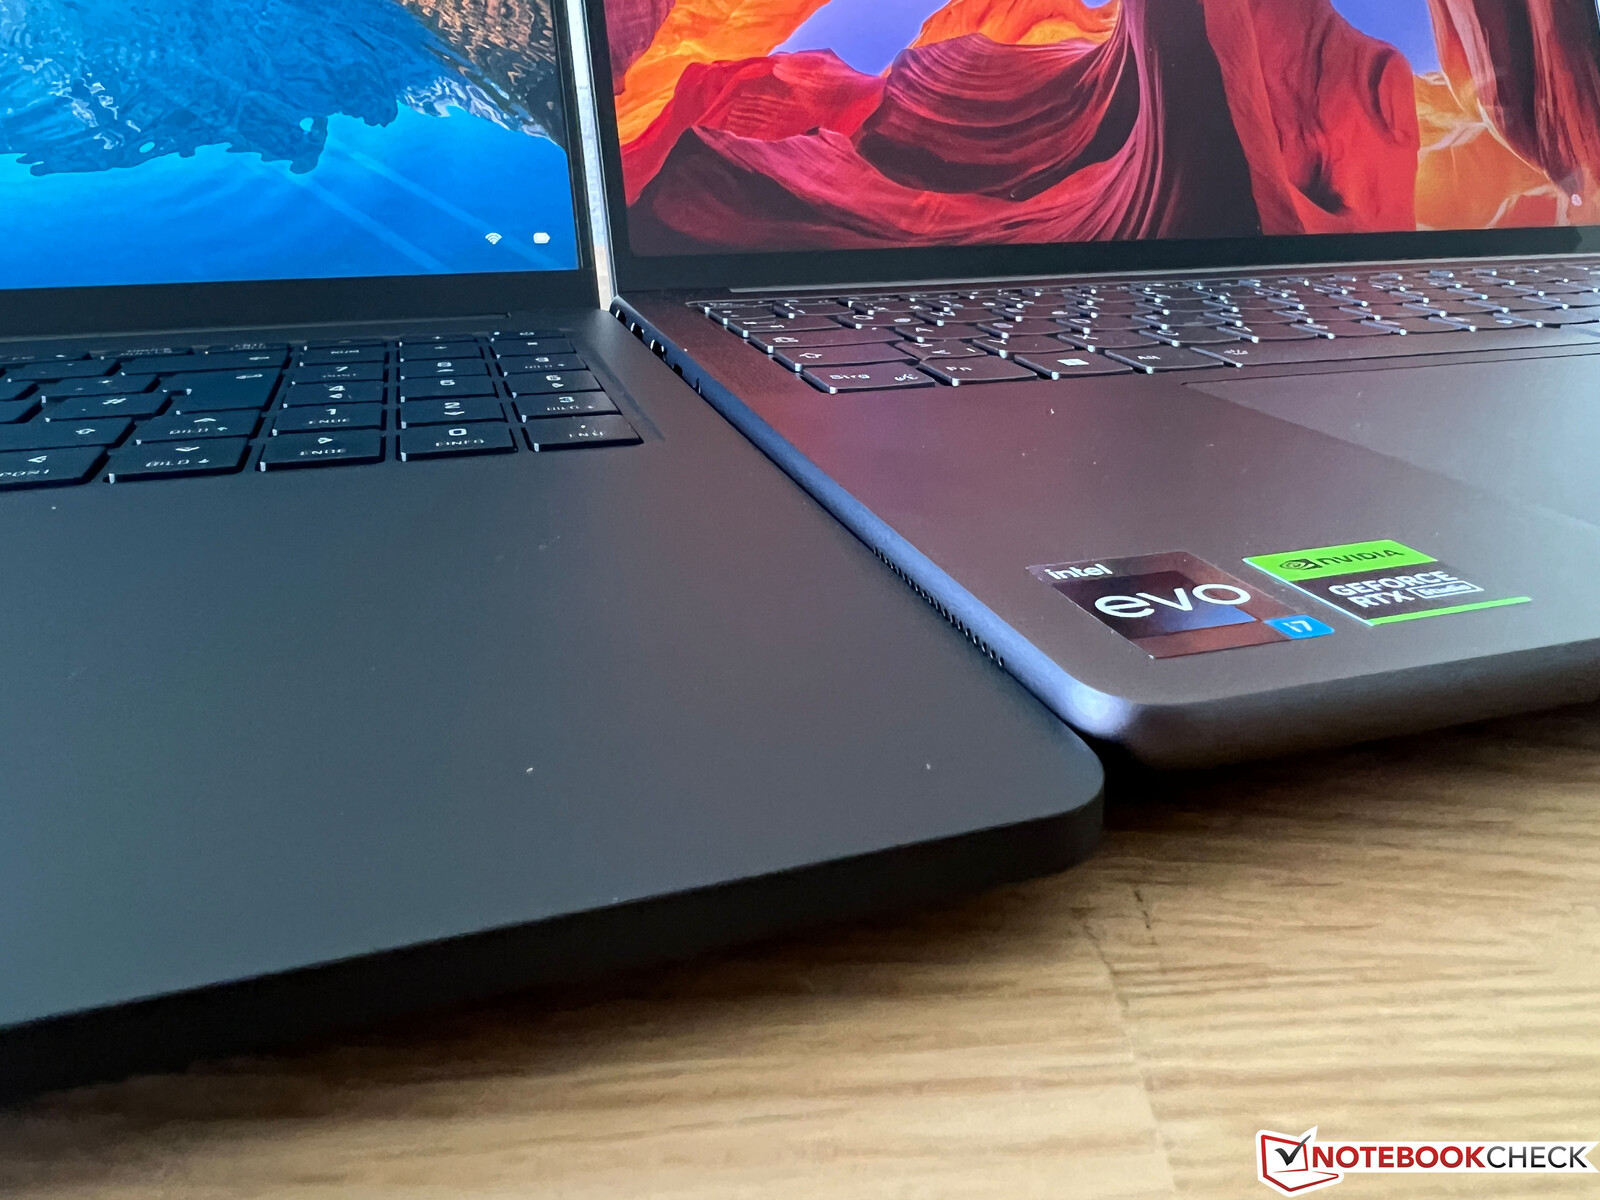
I storleksjämförelsen är Vision 16 Pro också den mest kompakta och samtidigt överlägset lättaste bärbara datorn. Vi tog också några jämförelsebilder med den nya Lenovo Yoga Pro 9 16, som vi också testar för närvarande. Deras fotavtryck är praktiskt taget identiska, men du kan se skillnaden i höjd, särskilt på basenheten.
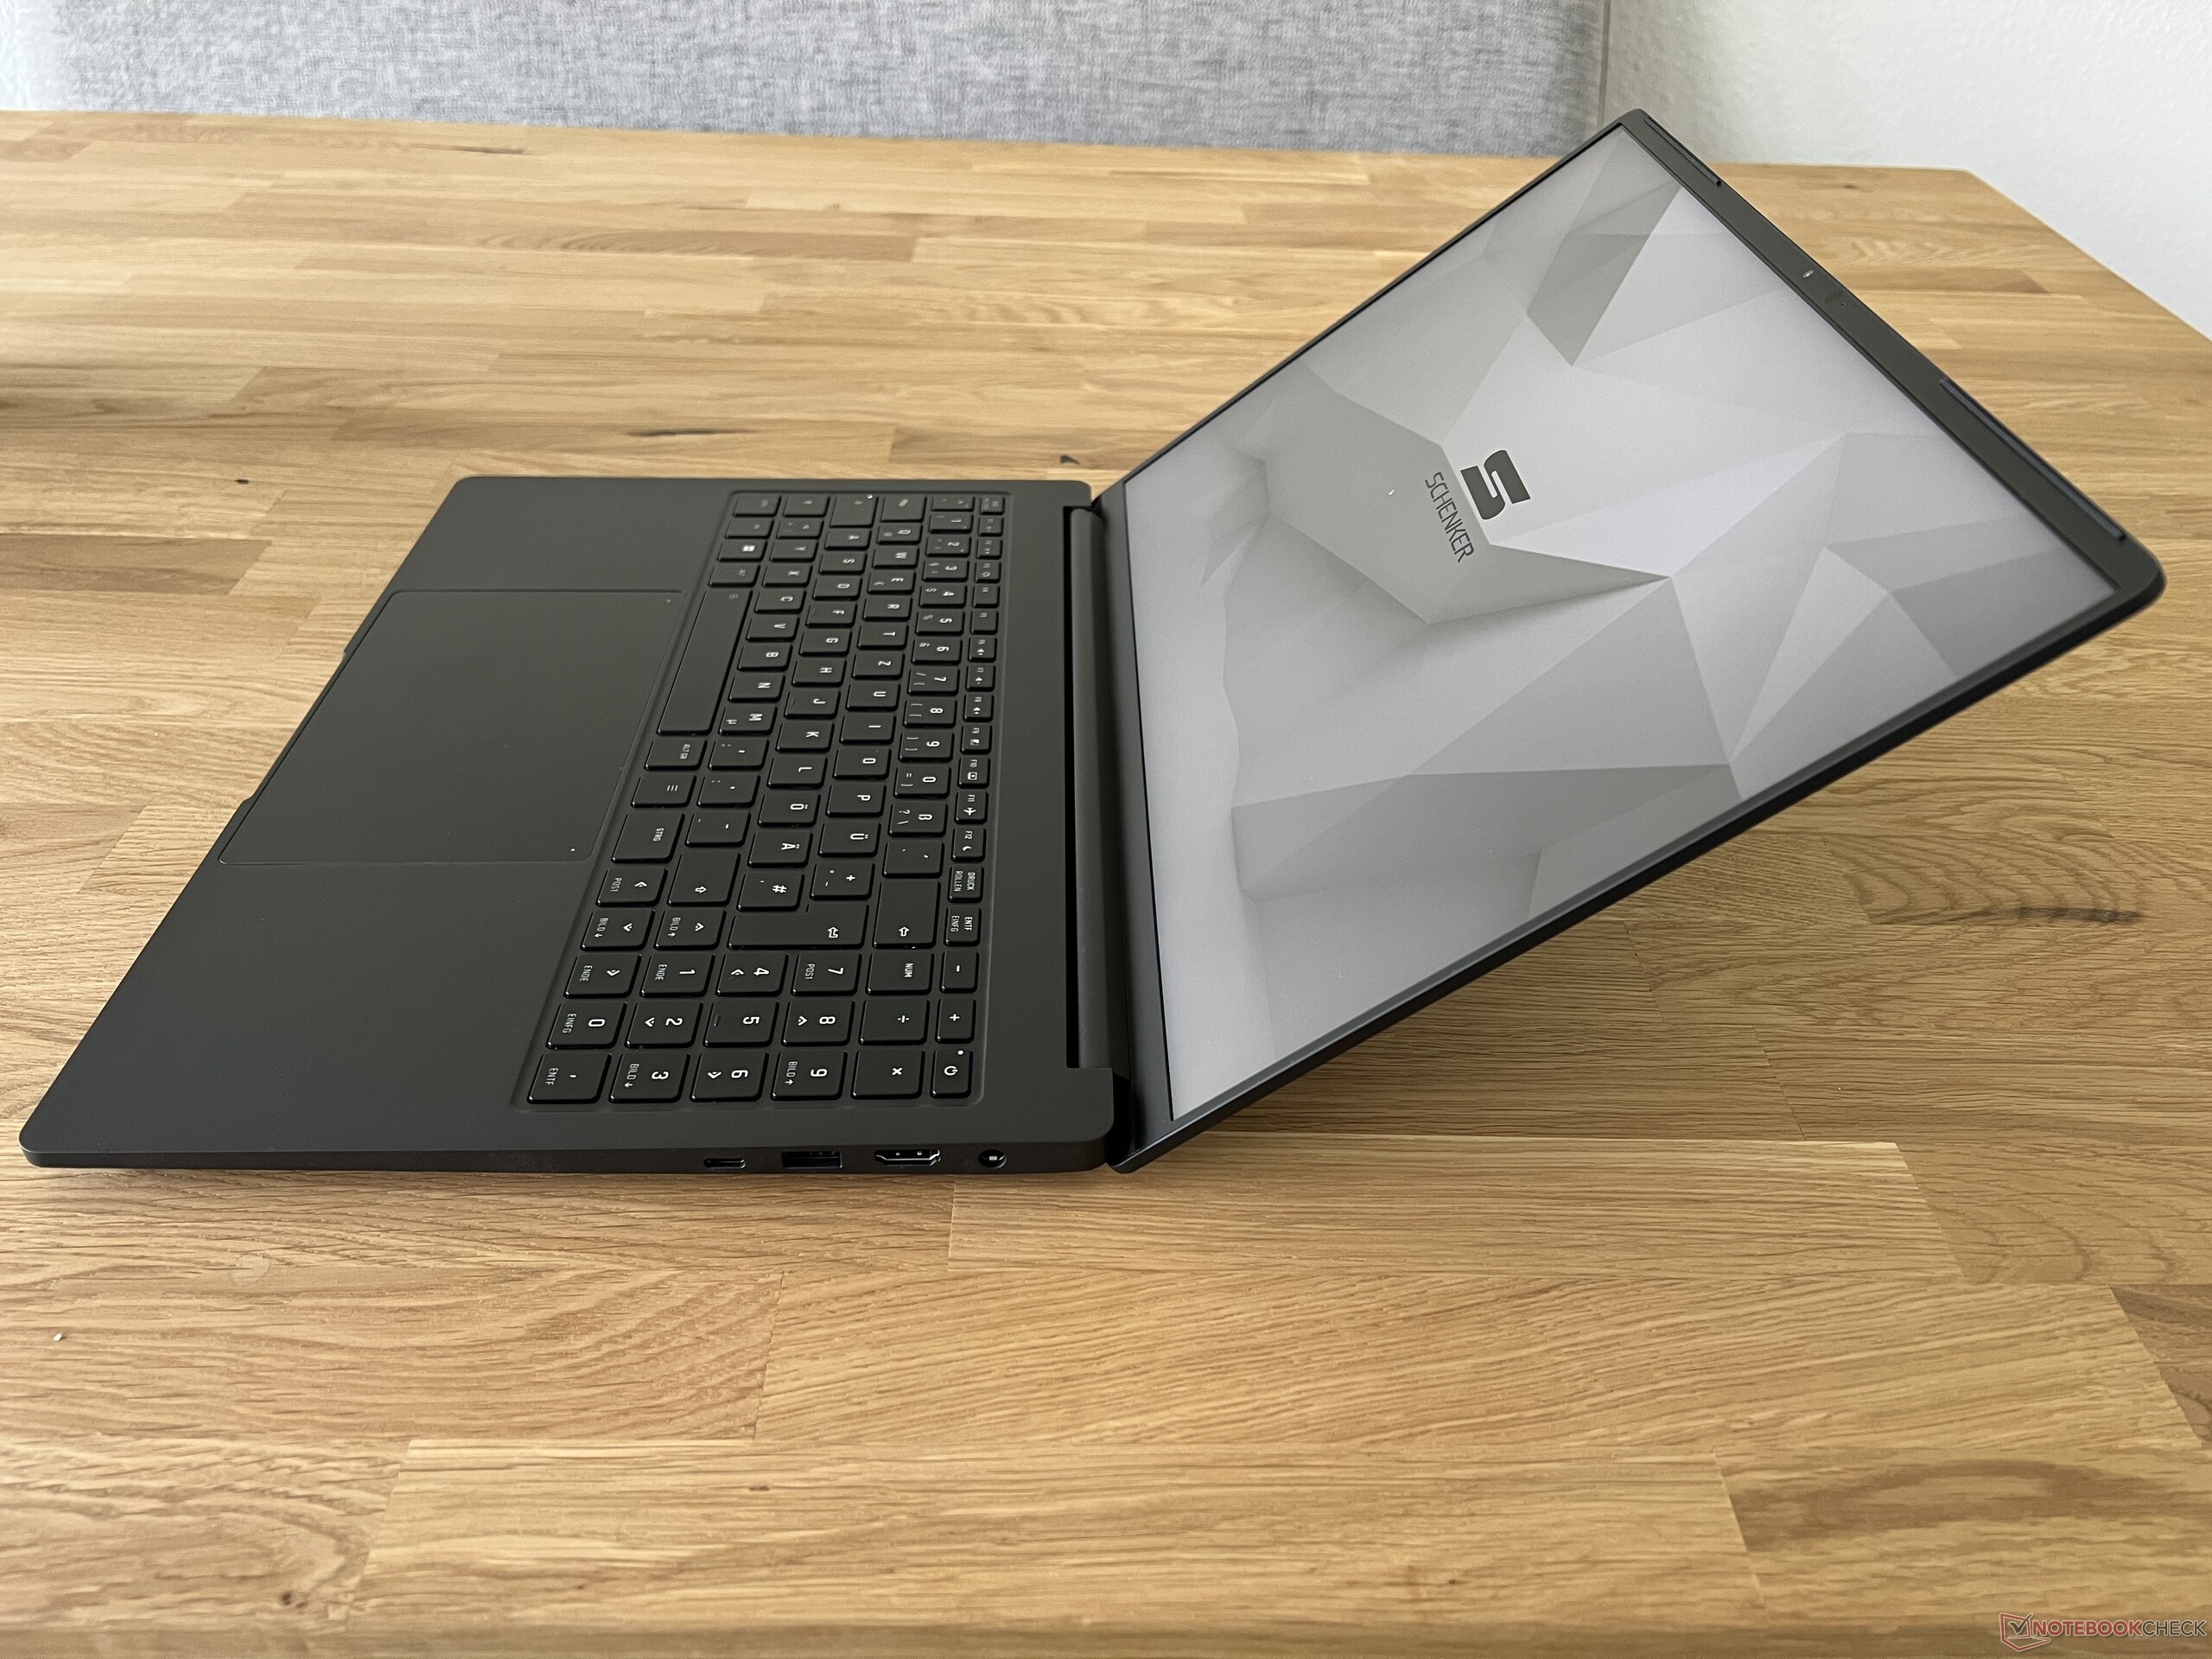
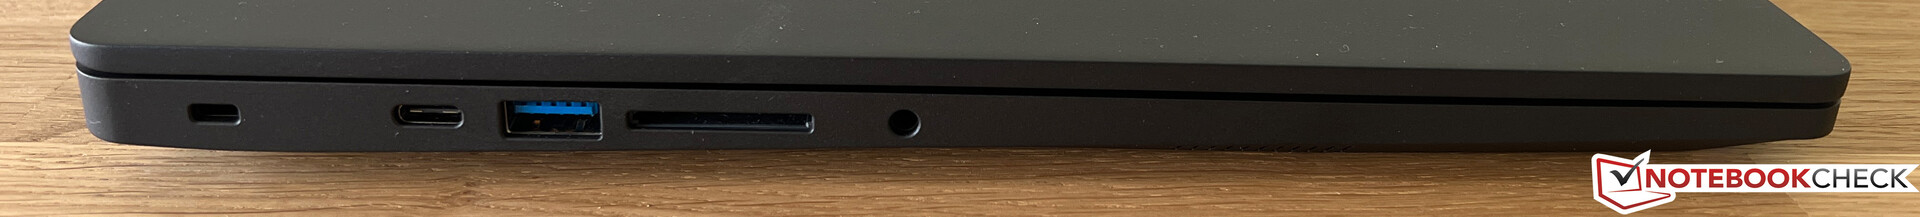
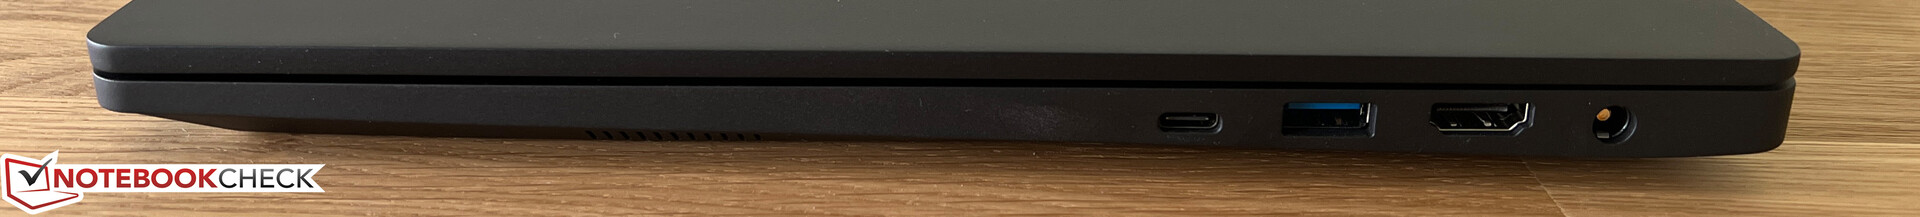
Utrustning - Thunderbolt och kortläsare
Trots det tunna höljet har Vision 16 Pro alla viktiga anslutningar, inklusive Thunderbolt 4 och 2x USB-A, vilket gör adaptrar onödiga i praktiken. Anslutningarna är fördelade över båda sidorna och är placerade i det bakre området. På resande fot kan du också ladda den bärbara datorn via USB-C (min. 65 watt, max. 100 watt). Jämfört med förra årets modell har kortläsaren blivit betydligt långsammare, vilket vi testade med två SD-kort. Du måste också acceptera några små kompromisser i WLAN-modulen, eftersom antennkonfigurationen på Vision 16 Pro inte stöder 6-GHz-nätverk (Wi-Fi 6E). AX201-modulen från Intel fortsätter att användas (Wi-Fi 6), och överföringshastigheterna är mycket bra. 1080p-webbkameran skapar anständiga inspelningar under rimliga ljusförhållanden. Dessutom finns det också en IR-modul för ansiktsigenkänning via Windows Hello.
| SD Card Reader | |
| average JPG Copy Test (av. of 3 runs) | |
| Apple MacBook Pro 16 2023 M2 Max (Angelbird AV Pro V60) | |
| MSI Stealth 16 Studio A13VG | |
| Dell XPS 15 9530 RTX 4070 (Toshiba Exceria Pro SDXC 64 GB UHS-II) | |
| Genomsnitt av klass Multimedia (23 - 531, n=36, senaste 2 åren) | |
| Schenker Vision 16 Pro RTX 3070 Ti (AV Pro V60) | |
| Samsung Galaxy Book3 Ultra 16, i9-13900H RTX 4070 (AV Pro SD microSD 128 GB V60) | |
| Asus ProArt Studiobook 16 OLED H7604 (Angelibird AV Pro V60) | |
| Schenker VISION 16 Pro (M23) (Angelbird AV Pro V60) | |
| maximum AS SSD Seq Read Test (1GB) | |
| Apple MacBook Pro 16 2023 M2 Max (Angelbird AV Pro V60) | |
| Genomsnitt av klass Multimedia (37.3 - 1455, n=35, senaste 2 åren) | |
| Dell XPS 15 9530 RTX 4070 (Toshiba Exceria Pro SDXC 64 GB UHS-II) | |
| MSI Stealth 16 Studio A13VG | |
| Samsung Galaxy Book3 Ultra 16, i9-13900H RTX 4070 (AV Pro SD microSD 128 GB V60) | |
| Asus ProArt Studiobook 16 OLED H7604 (Angelibird AV Pro V60) | |
| Schenker Vision 16 Pro RTX 3070 Ti (AV Pro V60) | |
| Schenker VISION 16 Pro (M23) (Angelbird AV Pro V60) | |
| Networking | |
| Schenker VISION 16 Pro (M23) | |
| iperf3 transmit AXE11000 | |
| iperf3 receive AXE11000 | |
| Samsung Galaxy Book3 Ultra 16, i9-13900H RTX 4070 | |
| iperf3 transmit AXE11000 | |
| iperf3 receive AXE11000 | |
| iperf3 transmit AXE11000 6GHz | |
| iperf3 receive AXE11000 6GHz | |
| MSI Stealth 16 Studio A13VG | |
| iperf3 transmit AXE11000 | |
| iperf3 receive AXE11000 | |
| iperf3 transmit AXE11000 6GHz | |
| iperf3 receive AXE11000 6GHz | |
| Dell XPS 15 9530 RTX 4070 | |
| iperf3 transmit AXE11000 | |
| iperf3 receive AXE11000 | |
| Asus ProArt Studiobook 16 OLED H7604 | |
| iperf3 transmit AXE11000 | |
| iperf3 receive AXE11000 | |
| Apple MacBook Pro 16 2023 M2 Max | |
| iperf3 transmit AXE11000 6GHz | |
| iperf3 receive AXE11000 6GHz | |
| Schenker Vision 16 Pro RTX 3070 Ti | |
| iperf3 transmit AXE11000 | |
| iperf3 receive AXE11000 | |

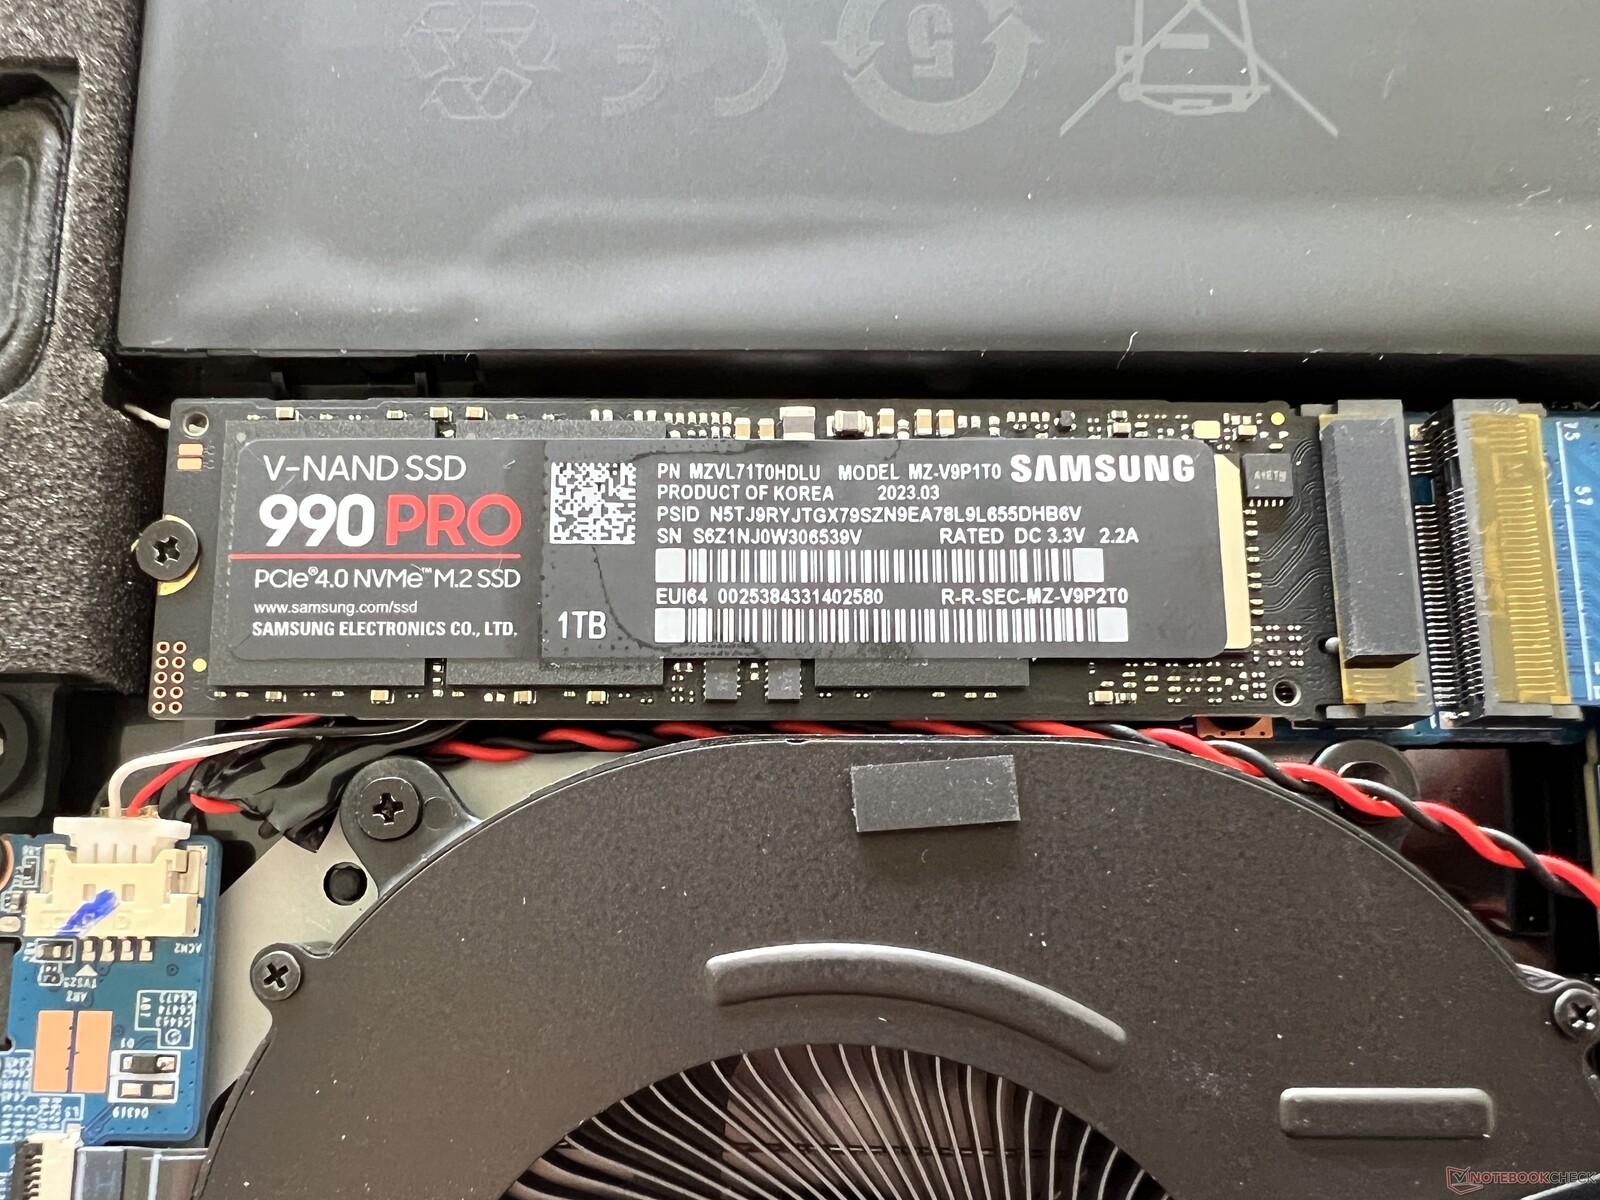
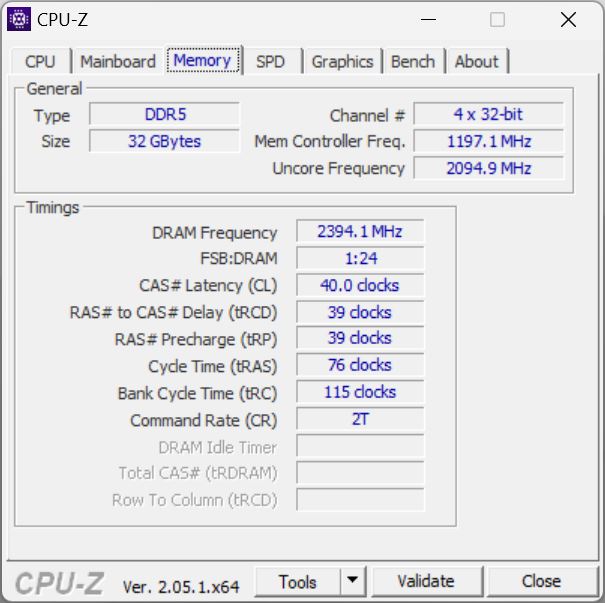
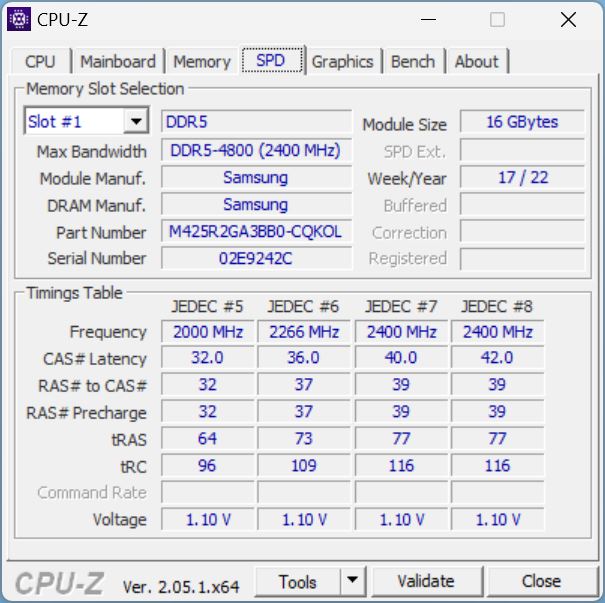
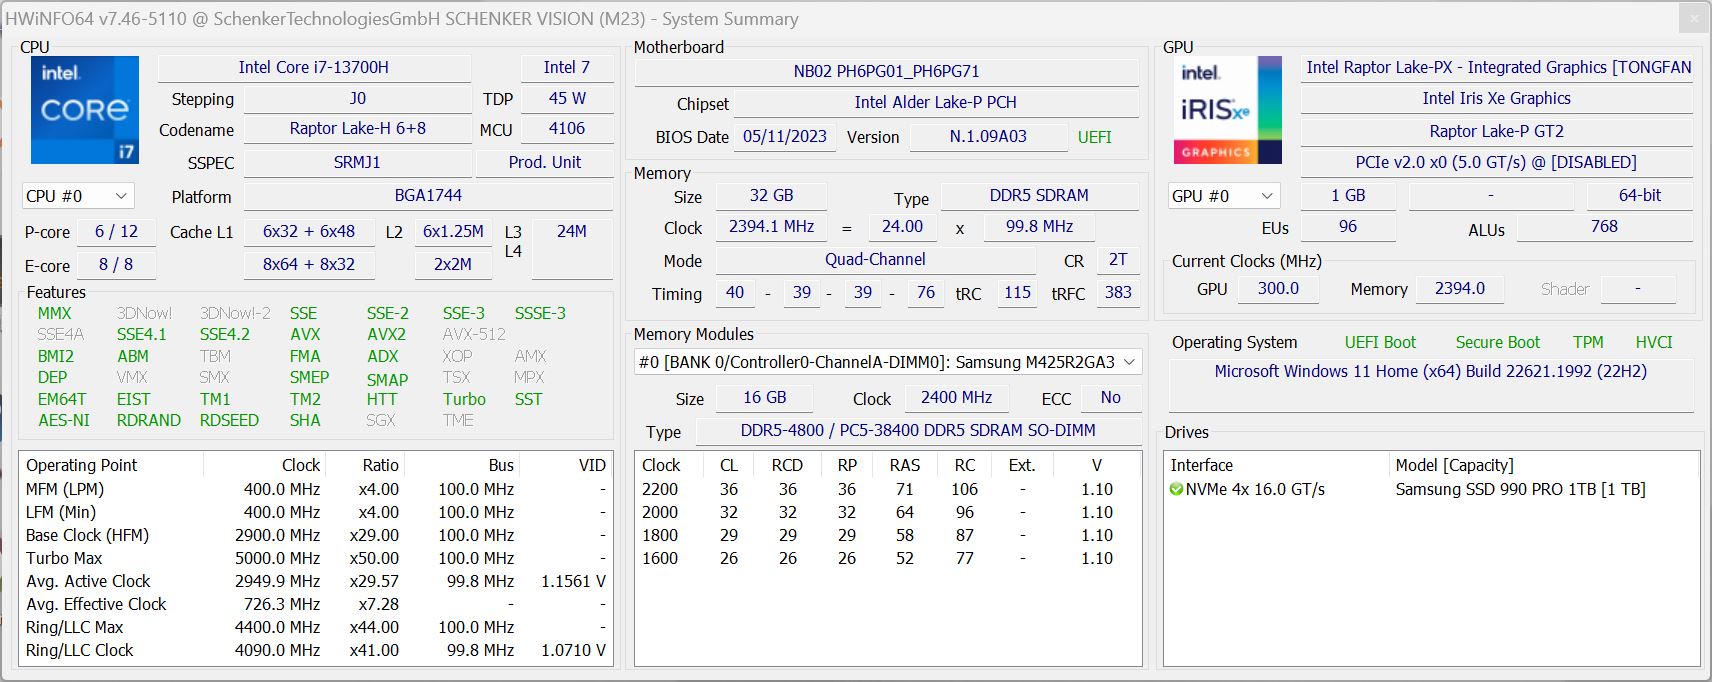
 GeForce RTX 4070 Laptop GPU, i7-13700H, Samsung 990 Pro 1 TB")
 GeForce RTX 4070 Laptop GPU, i7-13700H, Samsung 990 Pro 1 TB")
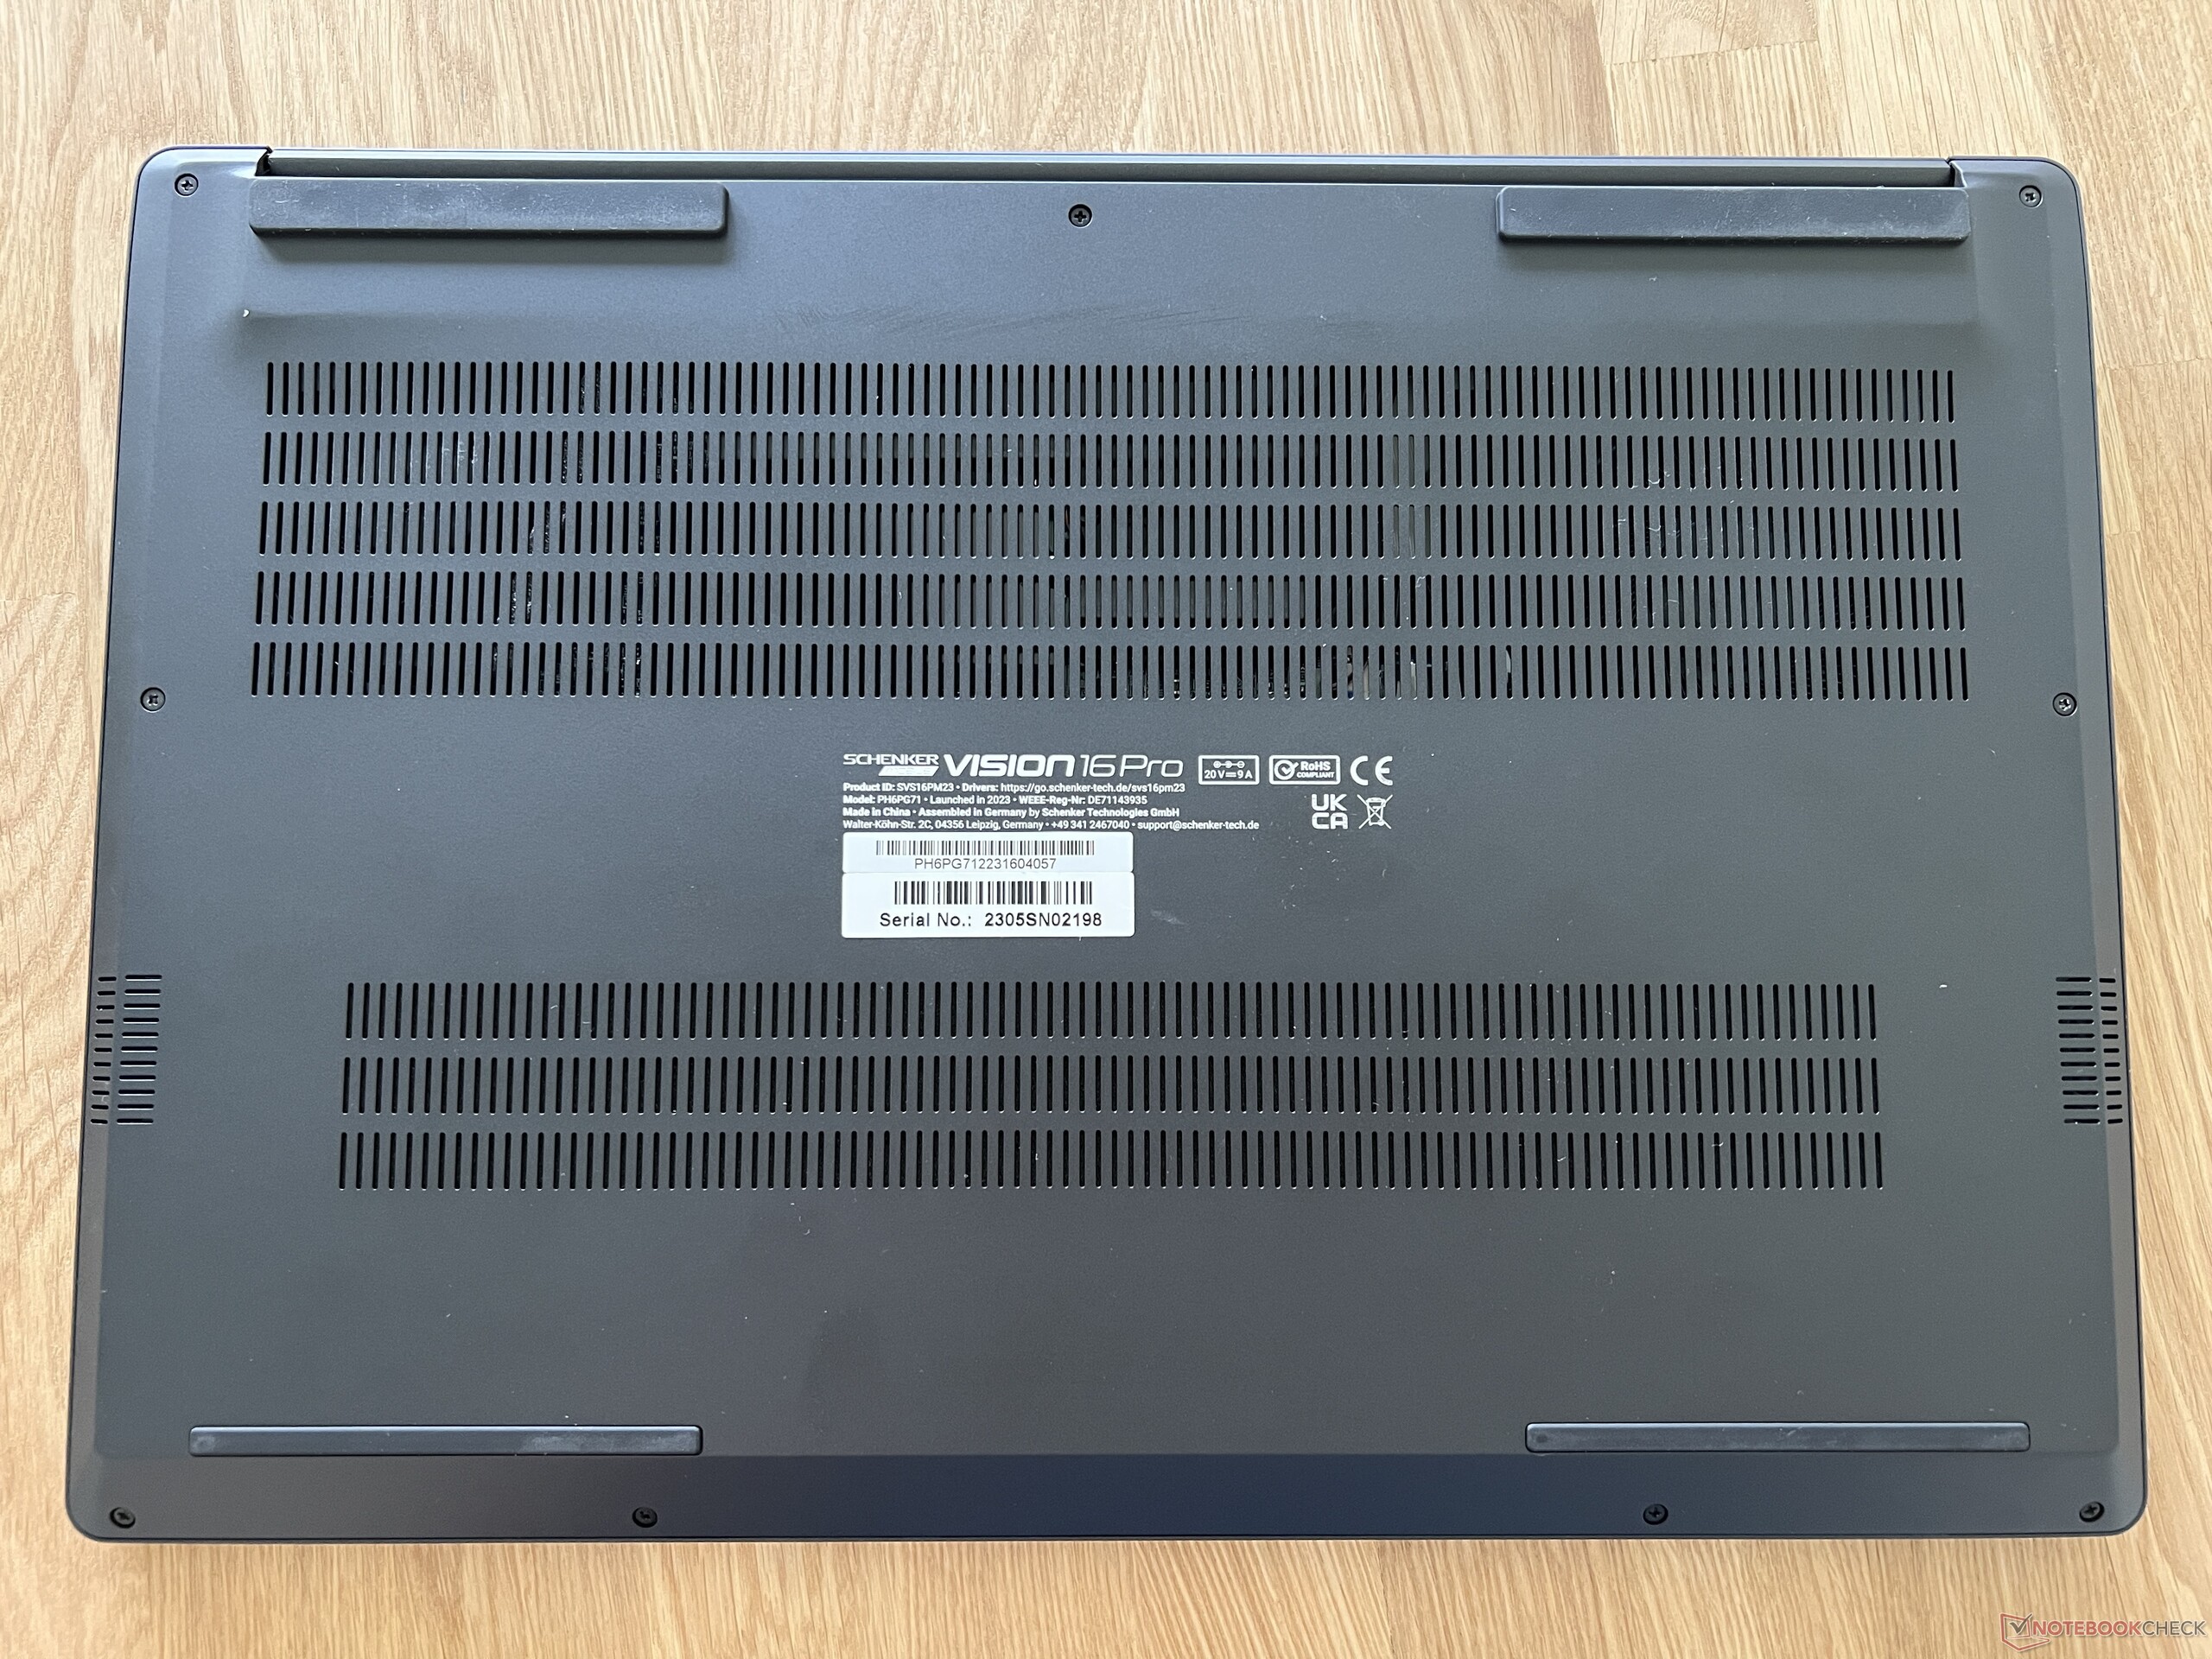
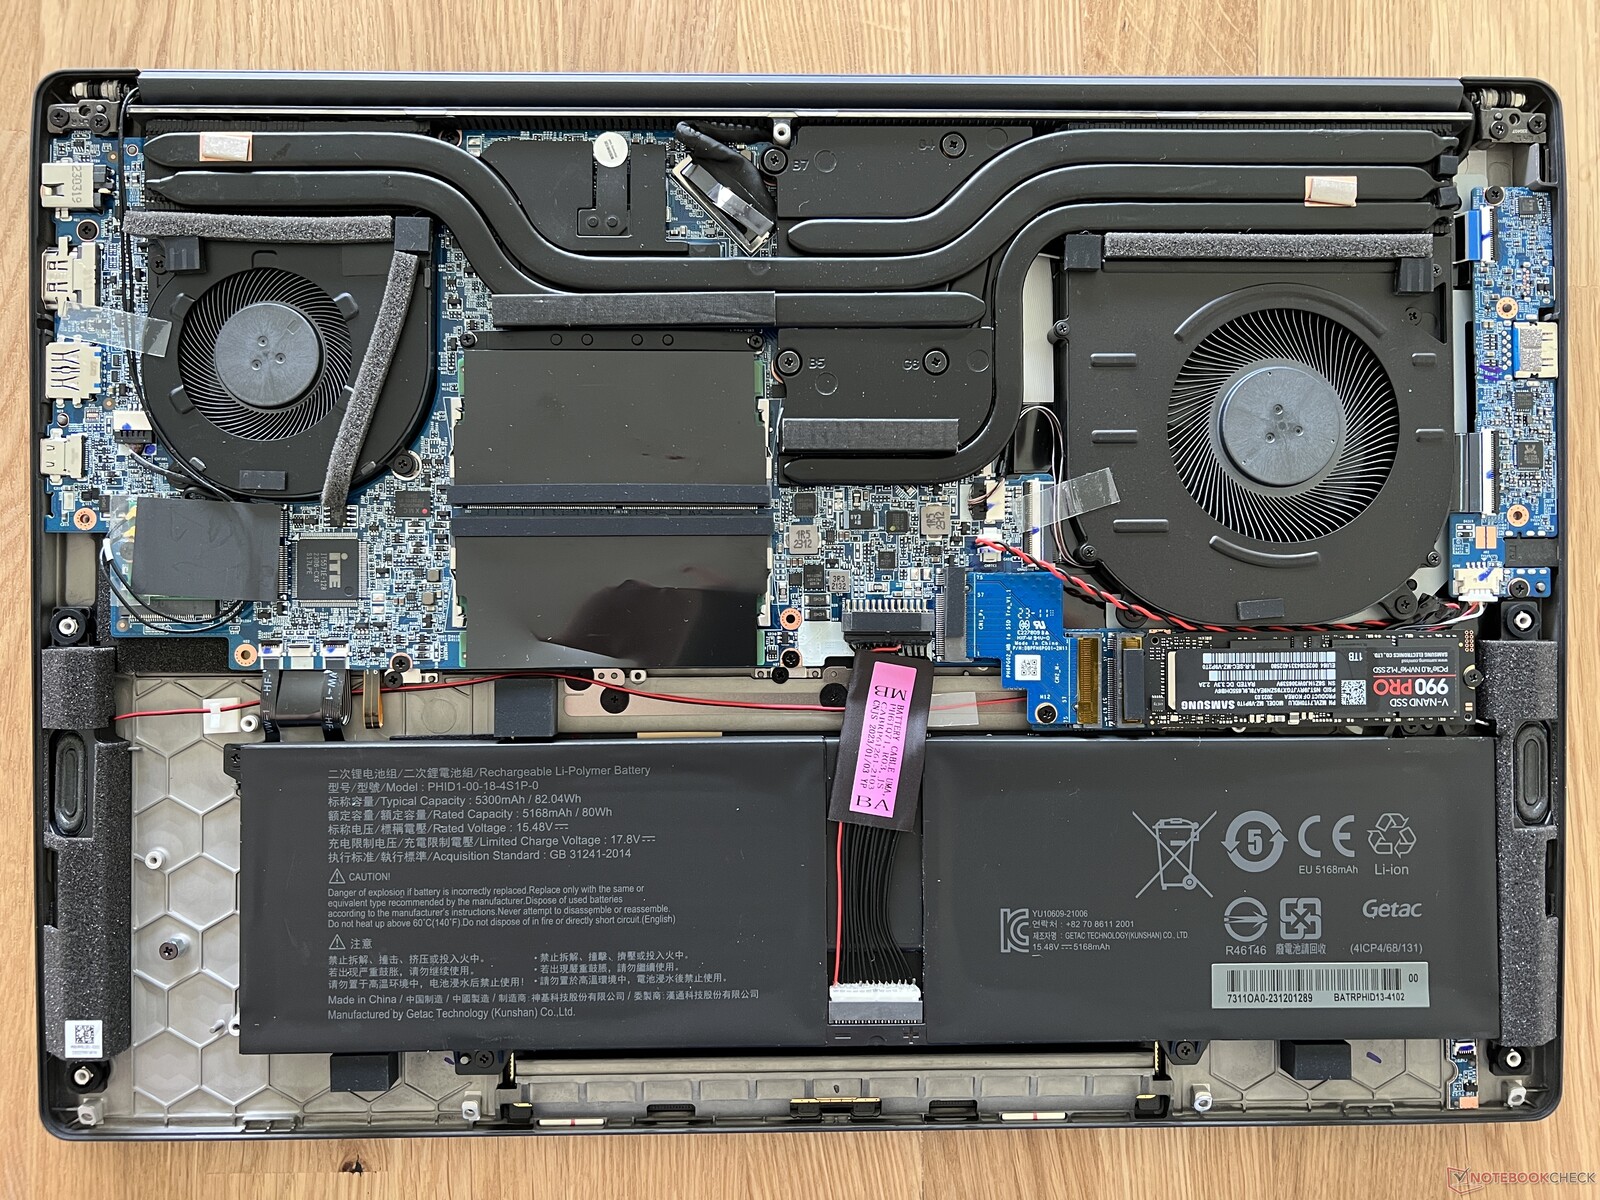
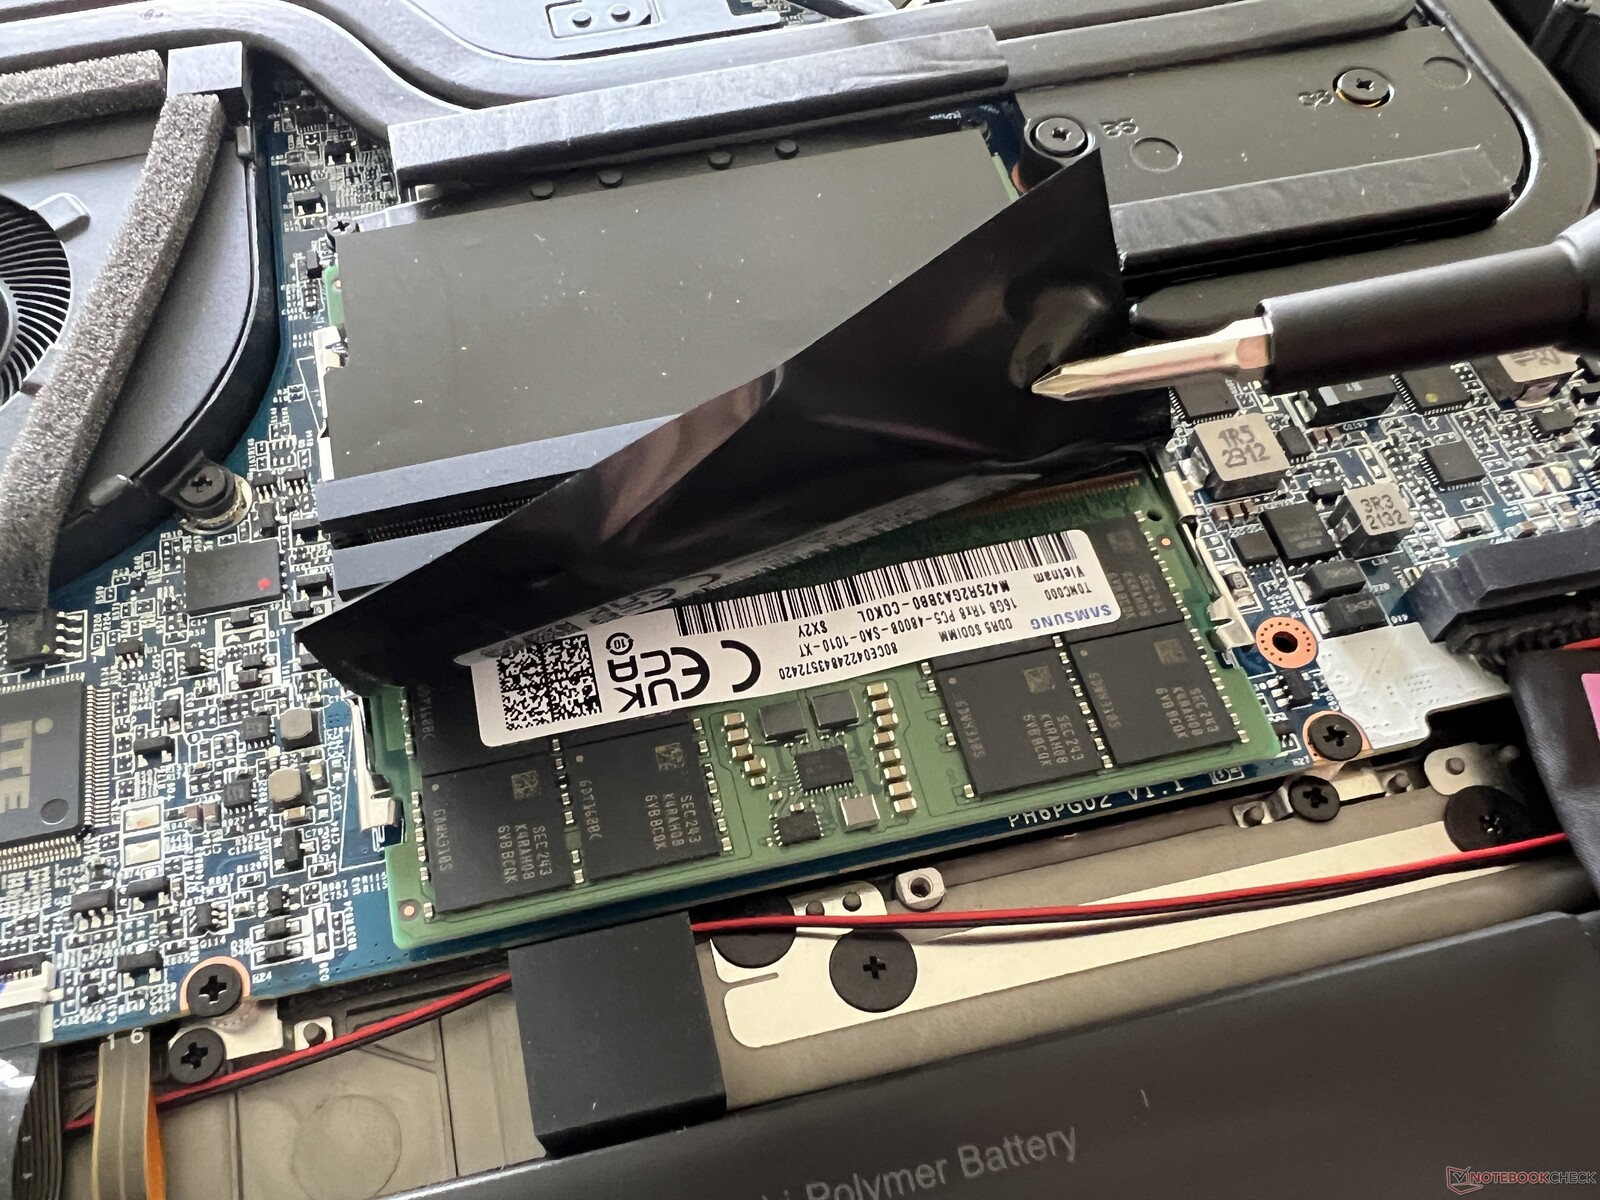
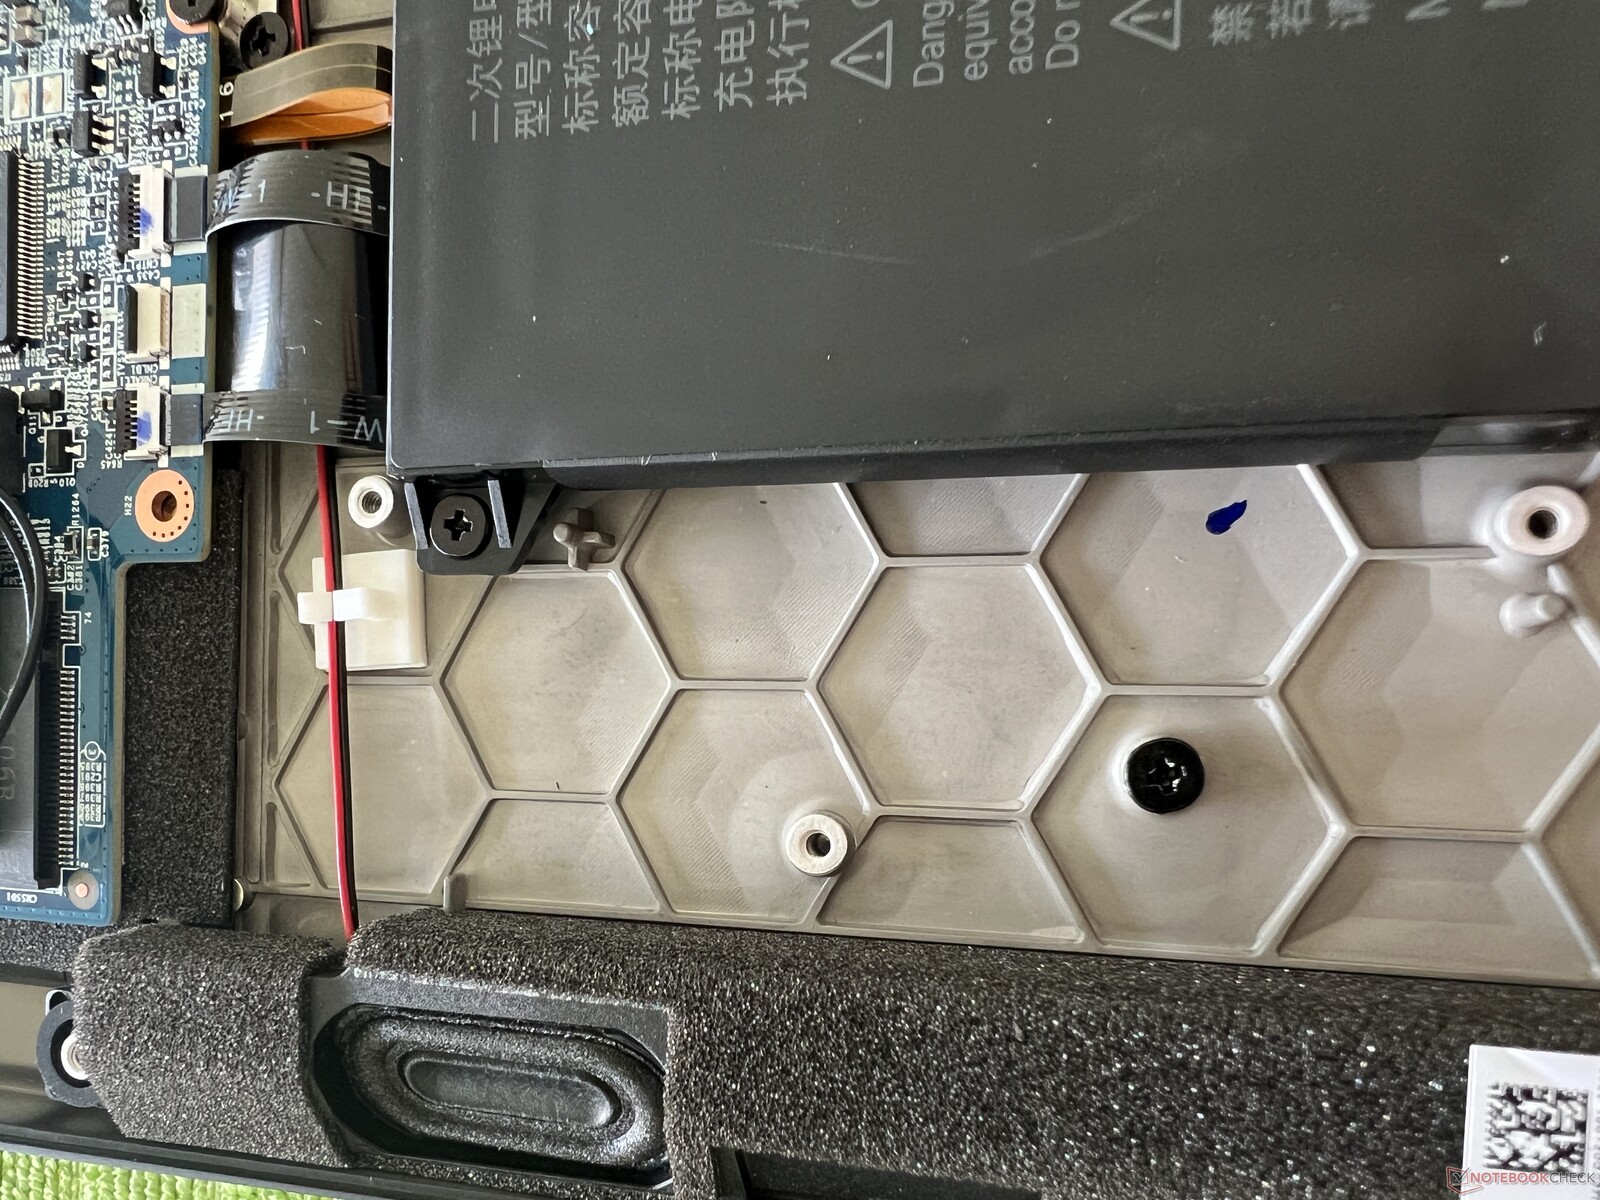
Underhåll
Höljets botten är fastsatt med några vanliga Phillips-skruvar och kan enkelt tas bort. På insidan kan du se att konfigurationen är i princip identisk, förutom en liten förändring i placeringen av värmerören. Användarna har tillgång till de två fläktarna, SO-DIMM-platserna och de två platserna för M.2 2280 SSD-enheter, med endast en enkelsidig andra SSD-enhet som stöds.
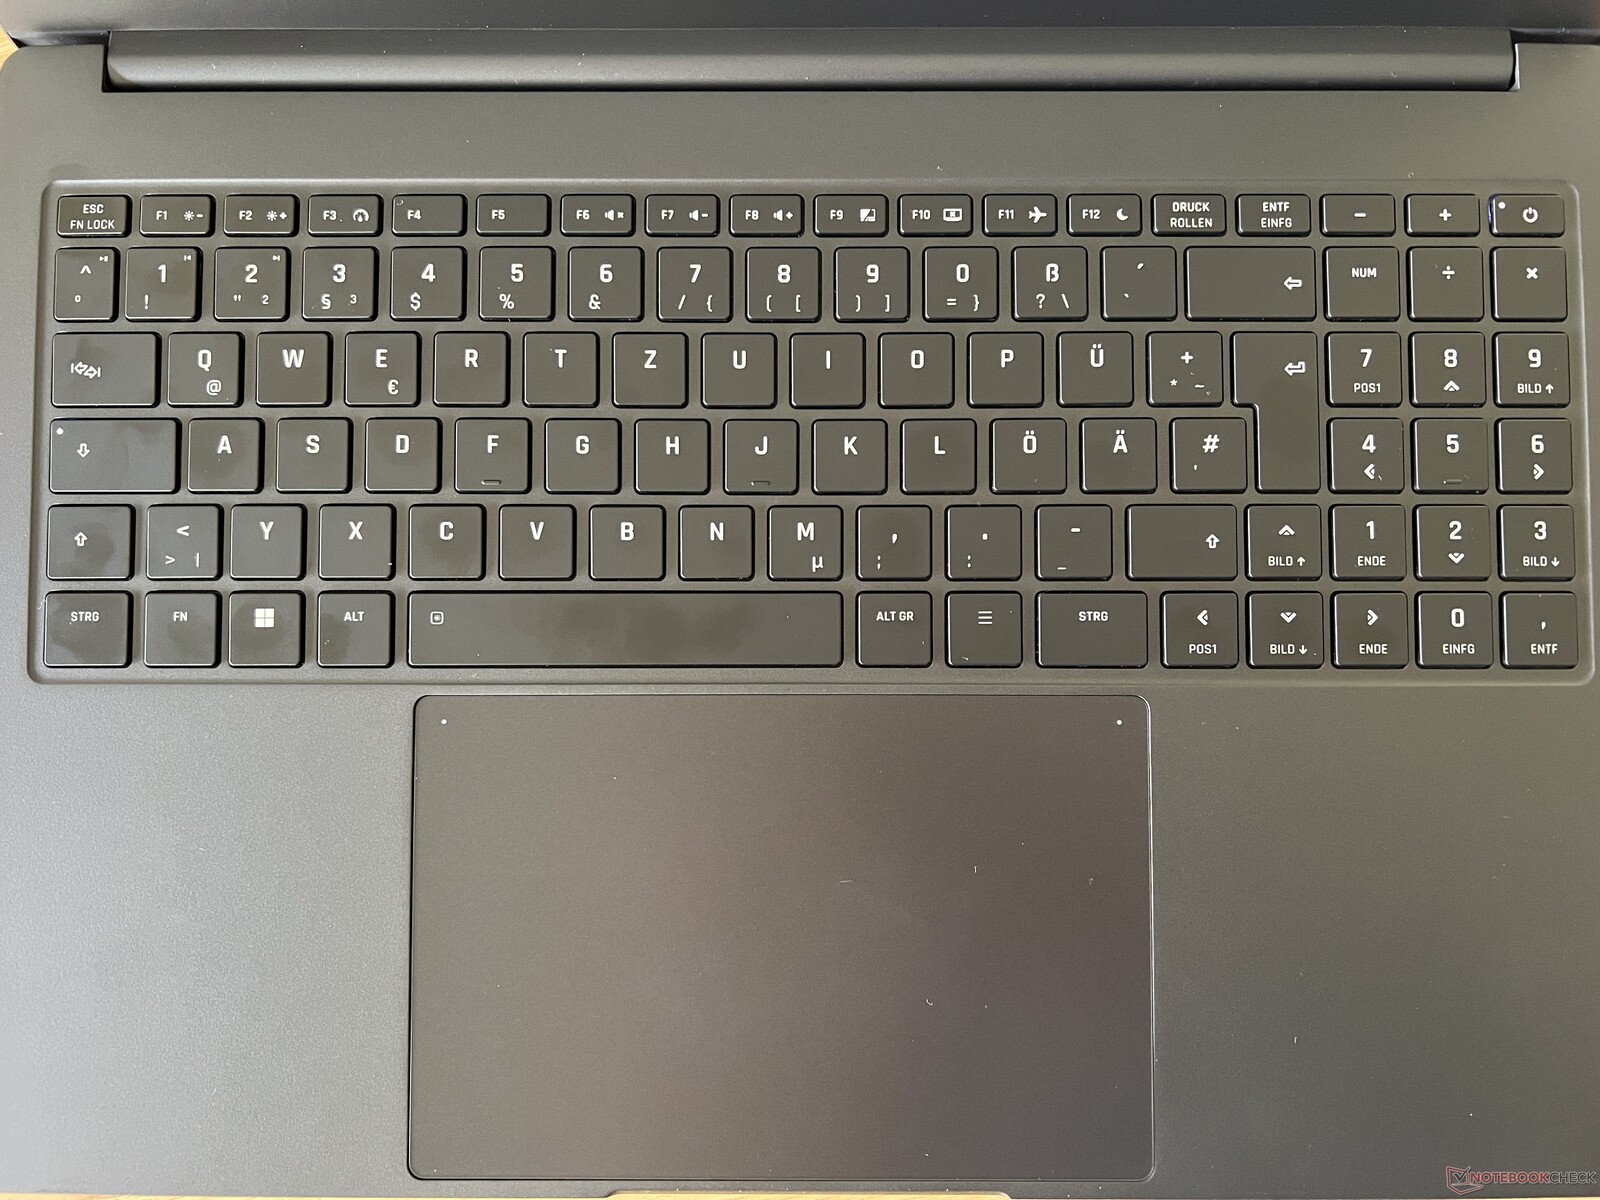
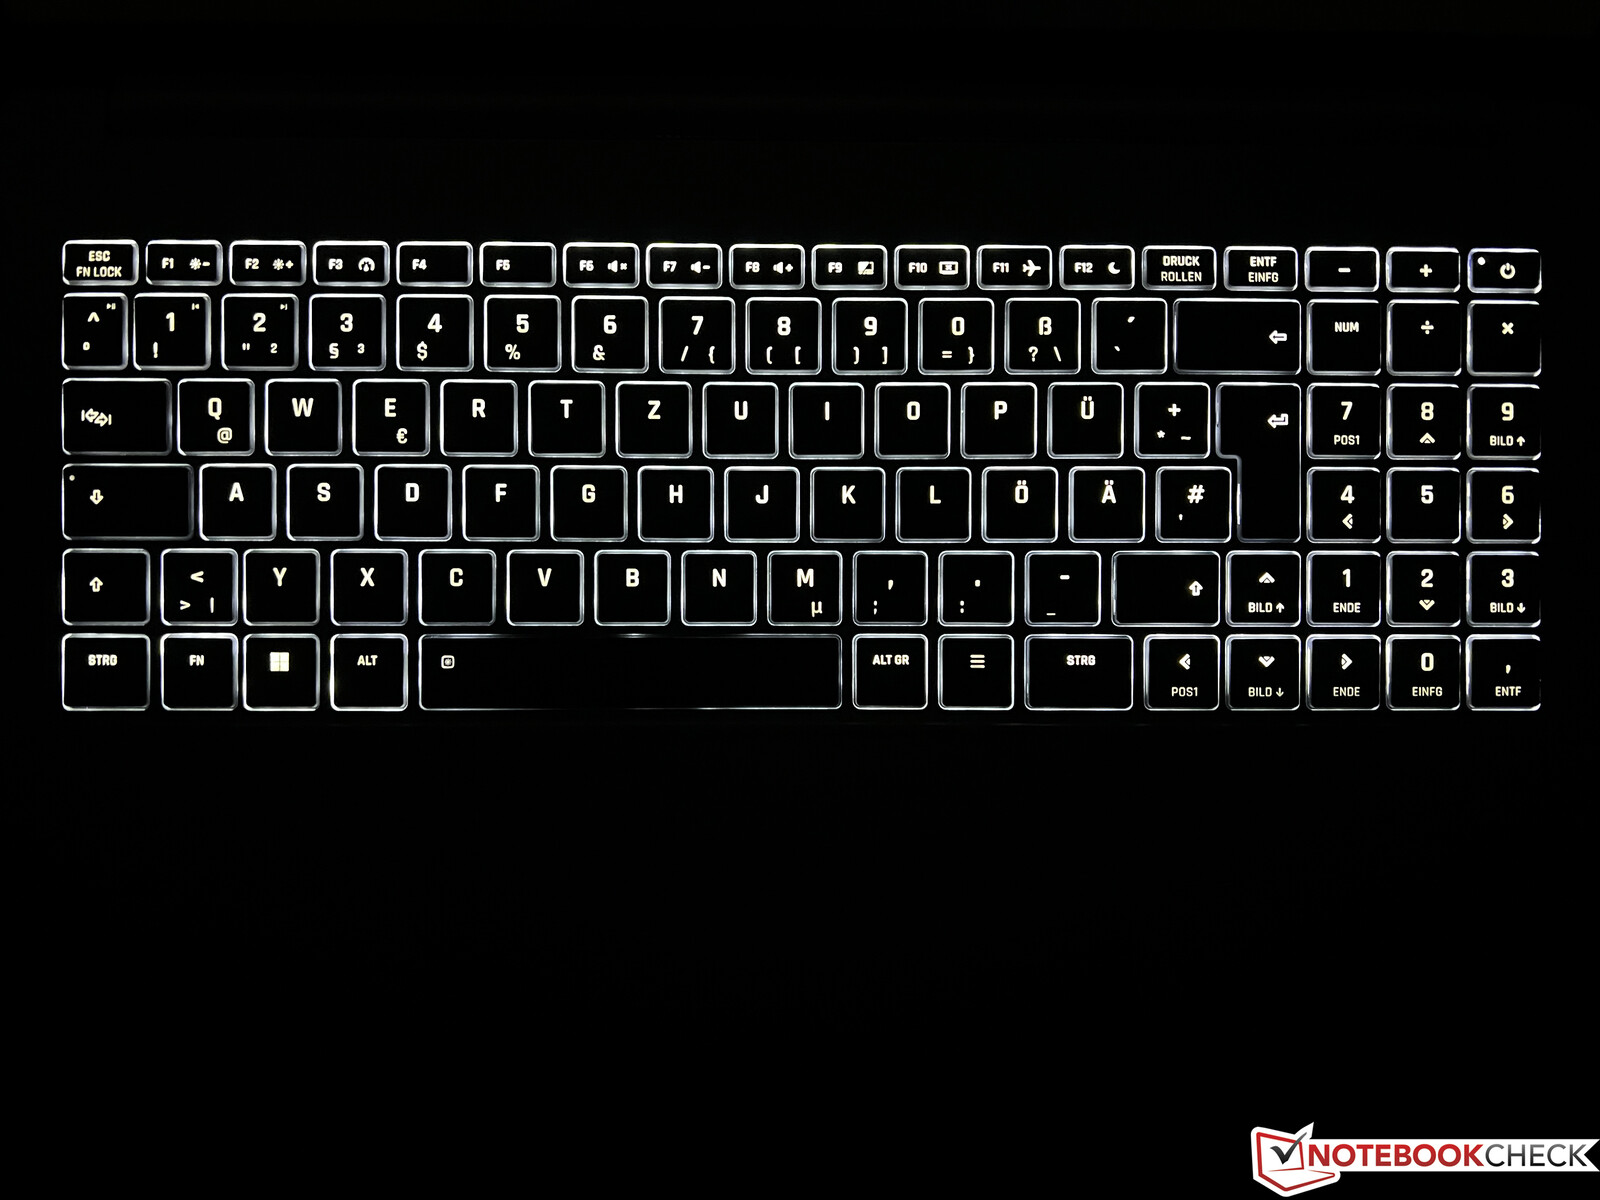
Inmatningsenheter - Stor ClickPad och sifferblock
Det fullstora tangentbordet har ett dedikerat nummerblock med stora piltangenter, men det innebär också att det inte finns någon extra Enter-tangent och att Shift-tangenten har minskat i storlek. Överlag är tangentbordet mycket exakt och bekvämt och tangentnedslagen är också behagligt tysta, med endast Space- och Enter-tangenterna som är något mer högljudda. I mörkare miljöer är den vita tangentbordsbelysningen i två steg till stor hjälp. Den stora ClickPad i glas (15,4 x 10 cm, ~6 x 4 in) är lätt att använda och erbjuder mycket utrymme för gester och markörrörelser. Endast klickljuden är lite för höga.
Display - WQHD-panel med 240 Hz
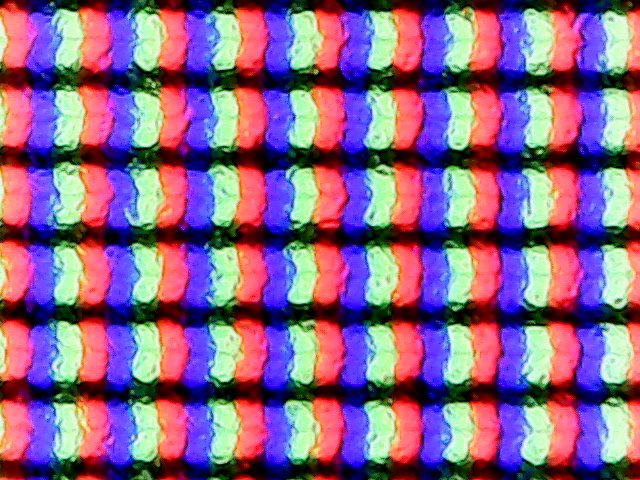
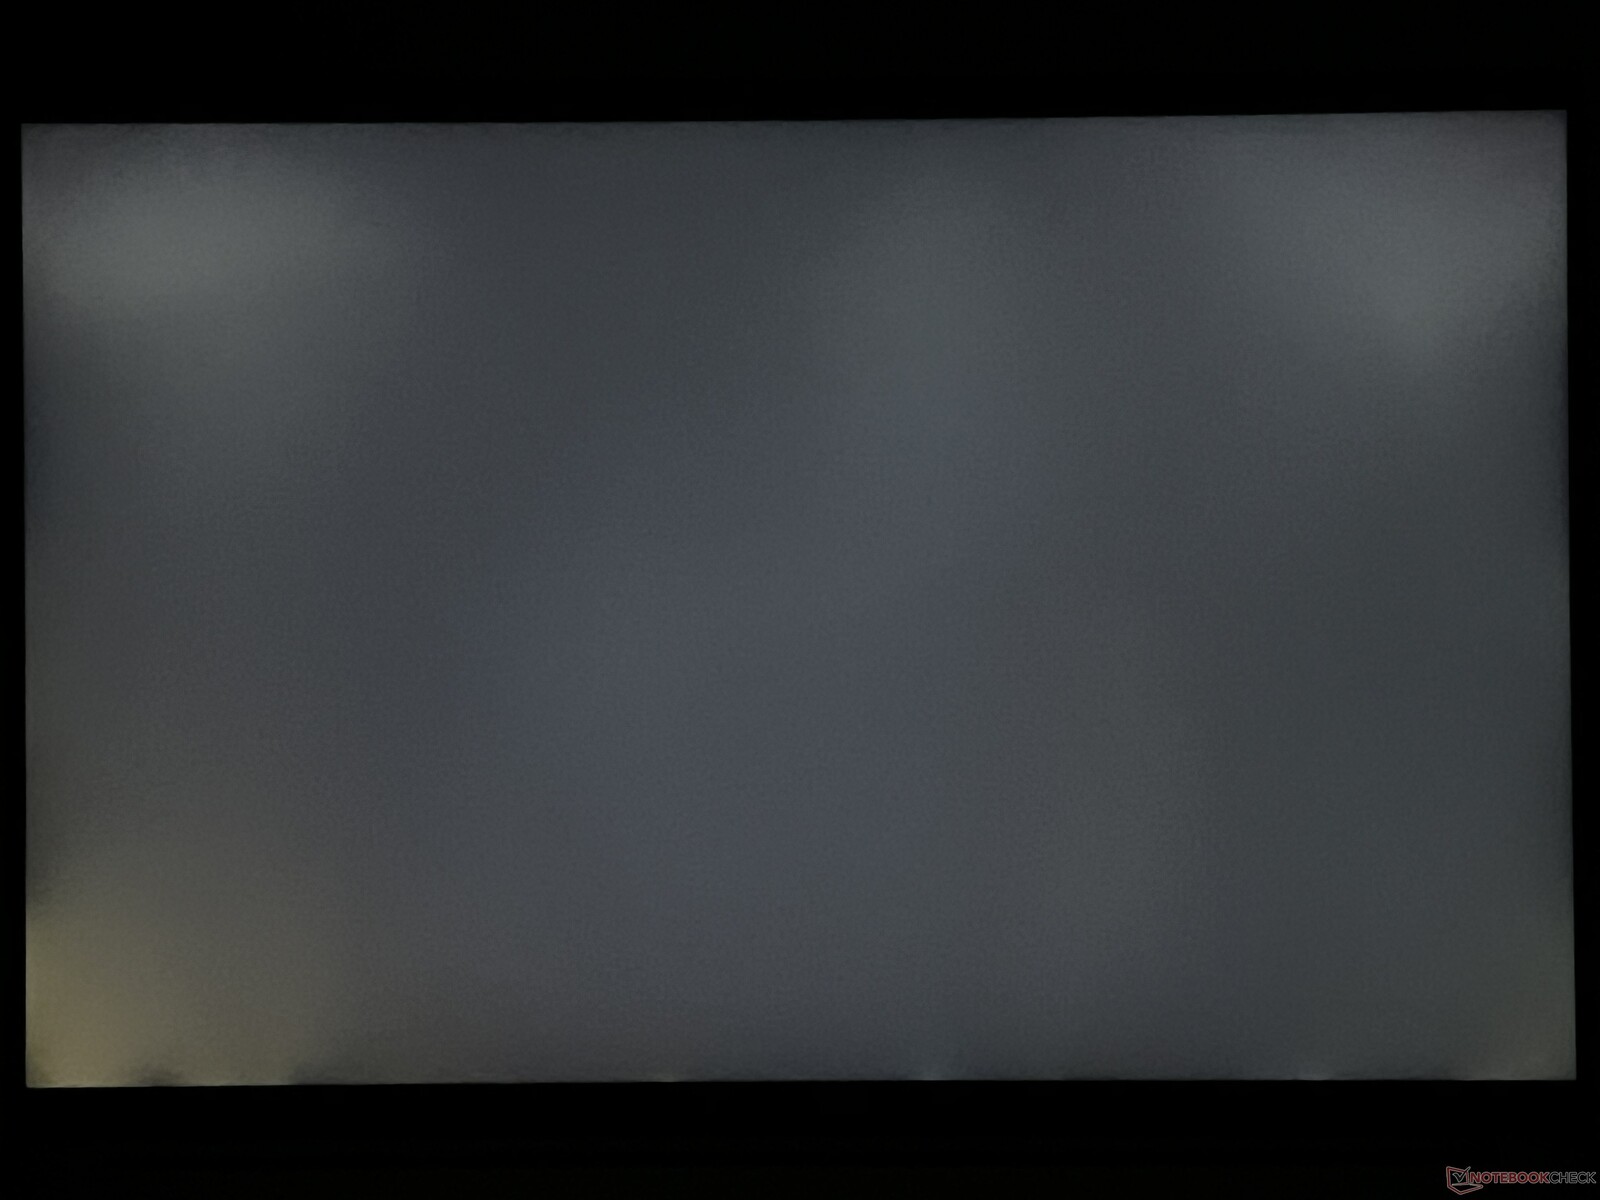
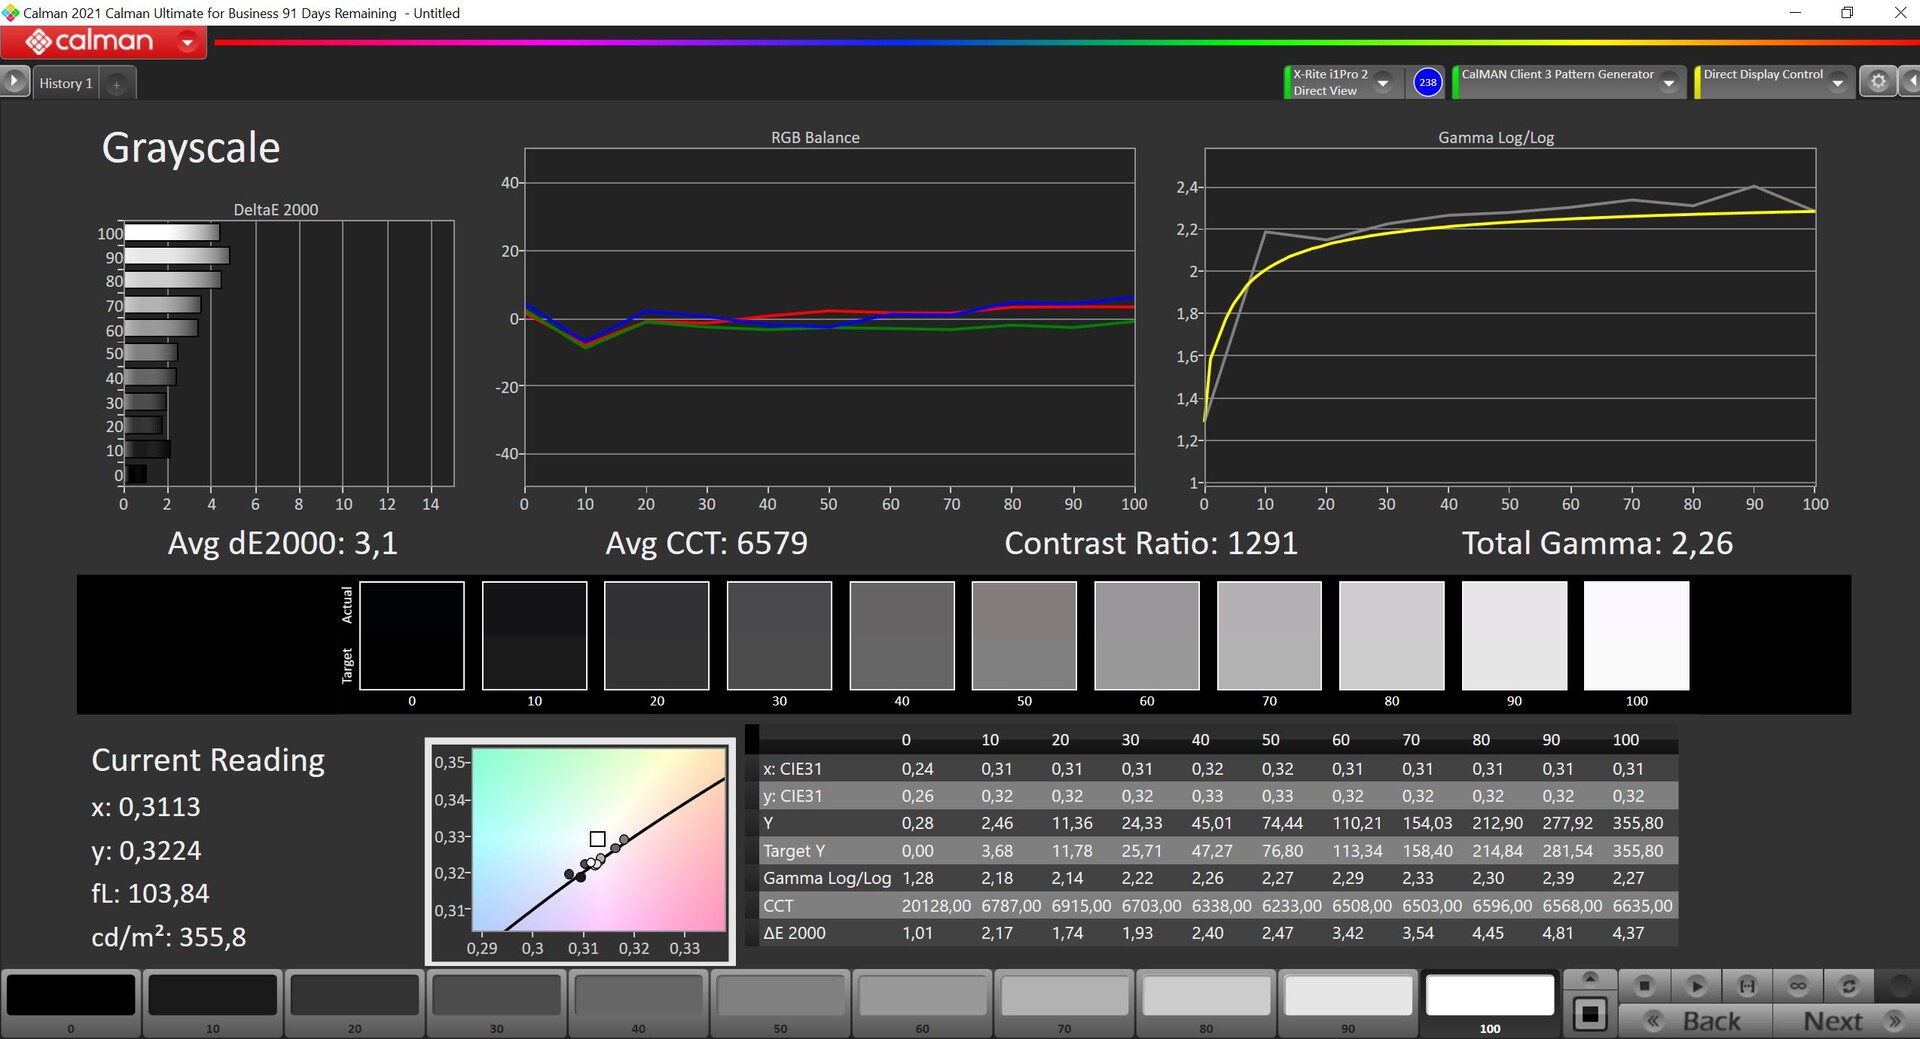
Skärmen har förblivit oförändrad och är fortfarande en matt WQHD-panel med en upplösning på 2 560 x 1 600 pixlar och en uppdateringsfrekvens på 240 Hz. Det subjektiva bildintrycket är mycket bra, eftersom även ljusa områden visas utan kornighet. Ljusstyrkan hos panelen (NE160QDM-NZ1) anges till 350 cd/m², och vår panel överträffar till och med detta något med ett genomsnitt på 370 cd/m². Svartvärdet är anständiga 0,3 cd/m², vilket leder till ett bra kontrastförhållande på mer än 1 200:1.
Uppdateringsfrekvensen på 240 Hz ger ett mycket mjukt intryck vid rörelser, och svarstiderna är också snabba. Ljushalos syns endast i mörka bilder vid full ljusstyrka, men detta kommer inte att vara ett problem i praktisk drift. PWM används inte.
| |||||||||||||||||||||||||
Distribution av ljusstyrkan: 88 %
Mitt på batteriet: 384 cd/m²
Kontrast: 1280:1 (Svärta: 0.3 cd/m²)
ΔE ColorChecker Calman: 3.4 | ∀{0.5-29.43 Ø4.71}
calibrated: 1.3
ΔE Greyscale Calman: 3.4 | ∀{0.09-98 Ø4.96}
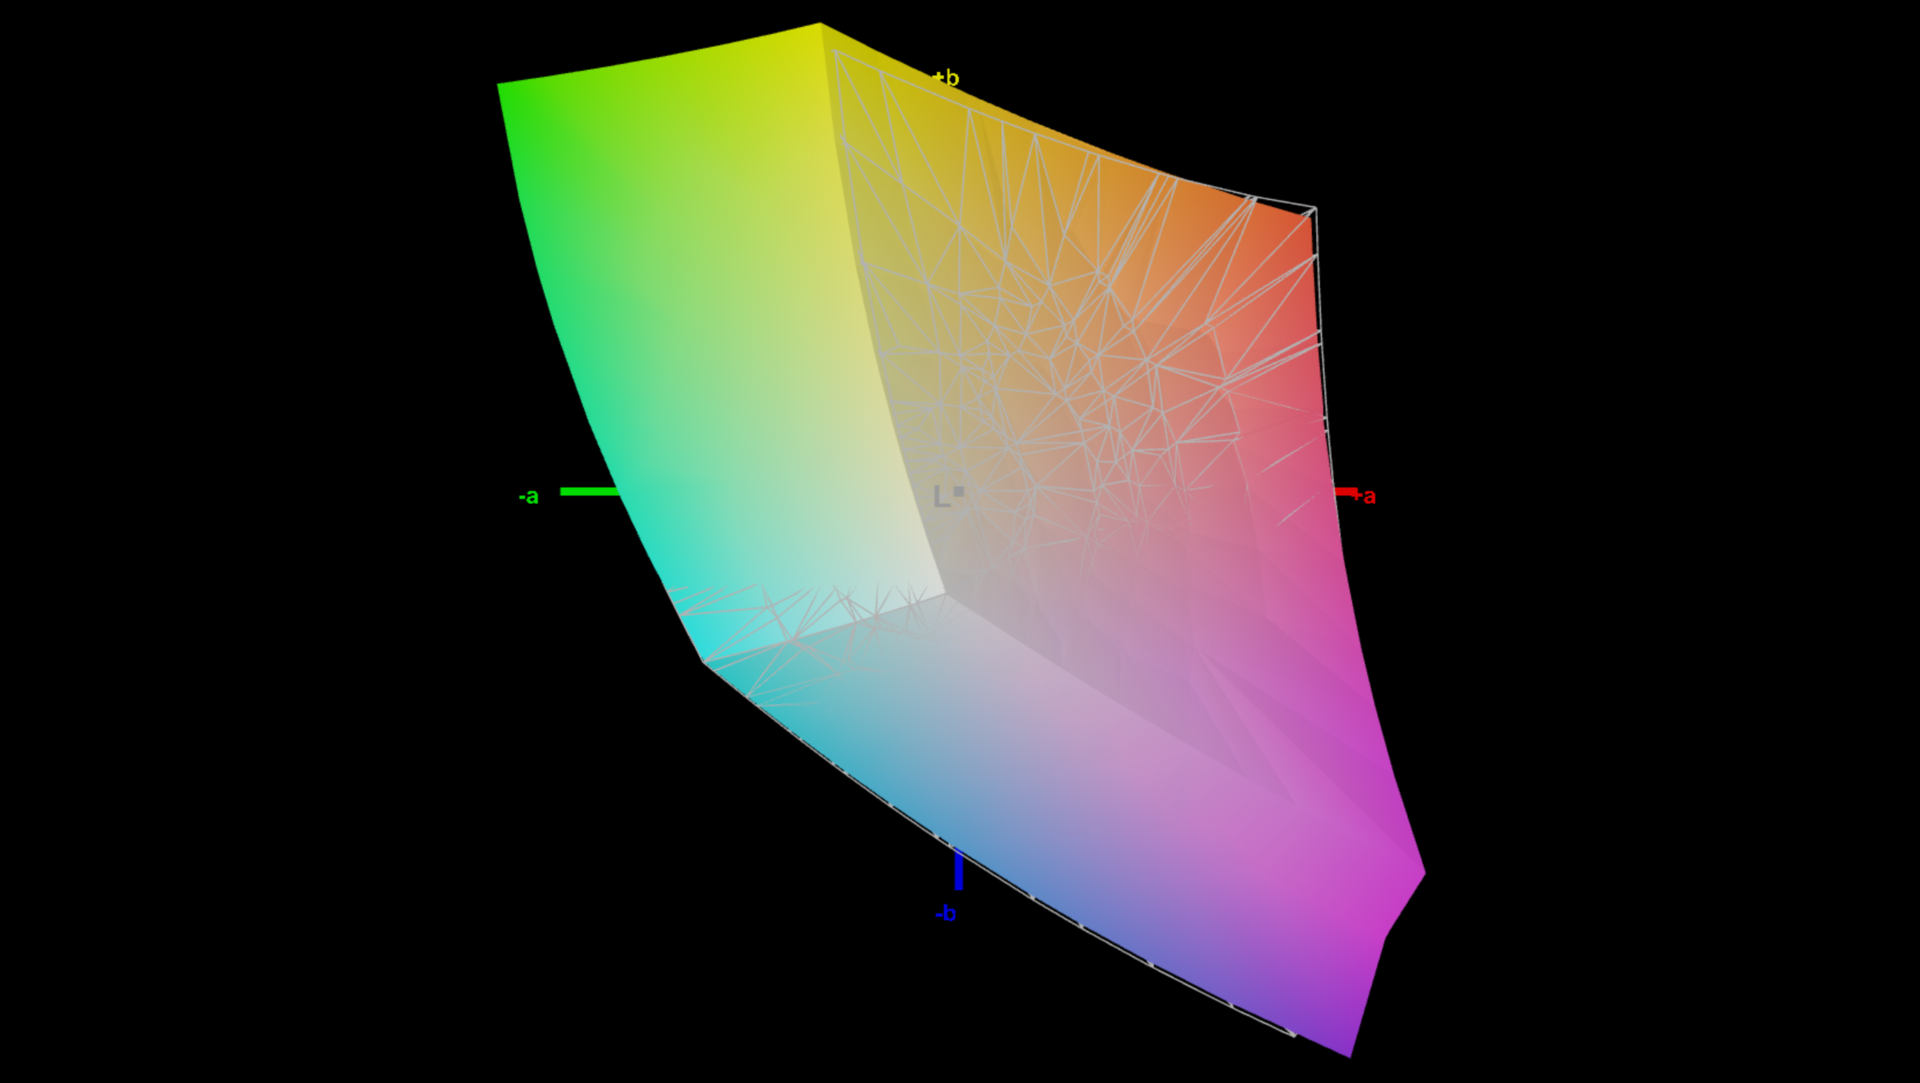
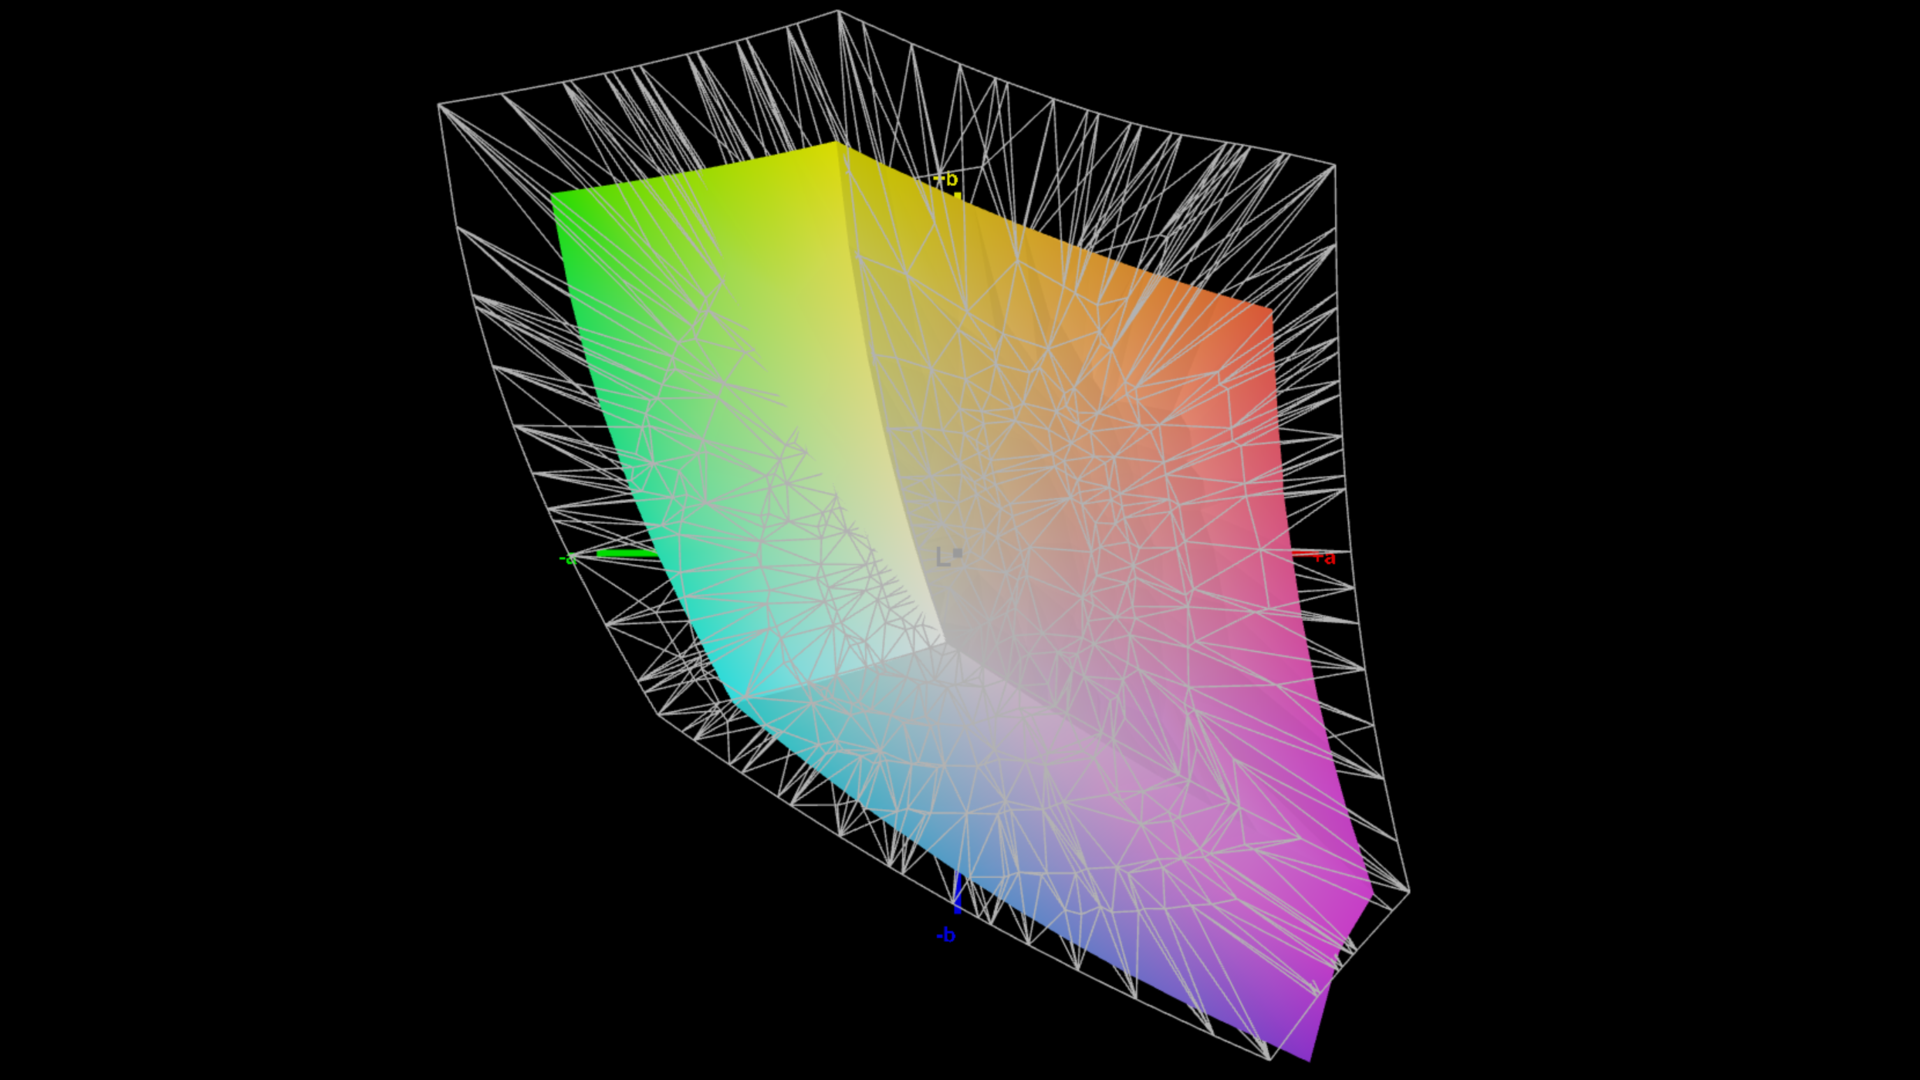
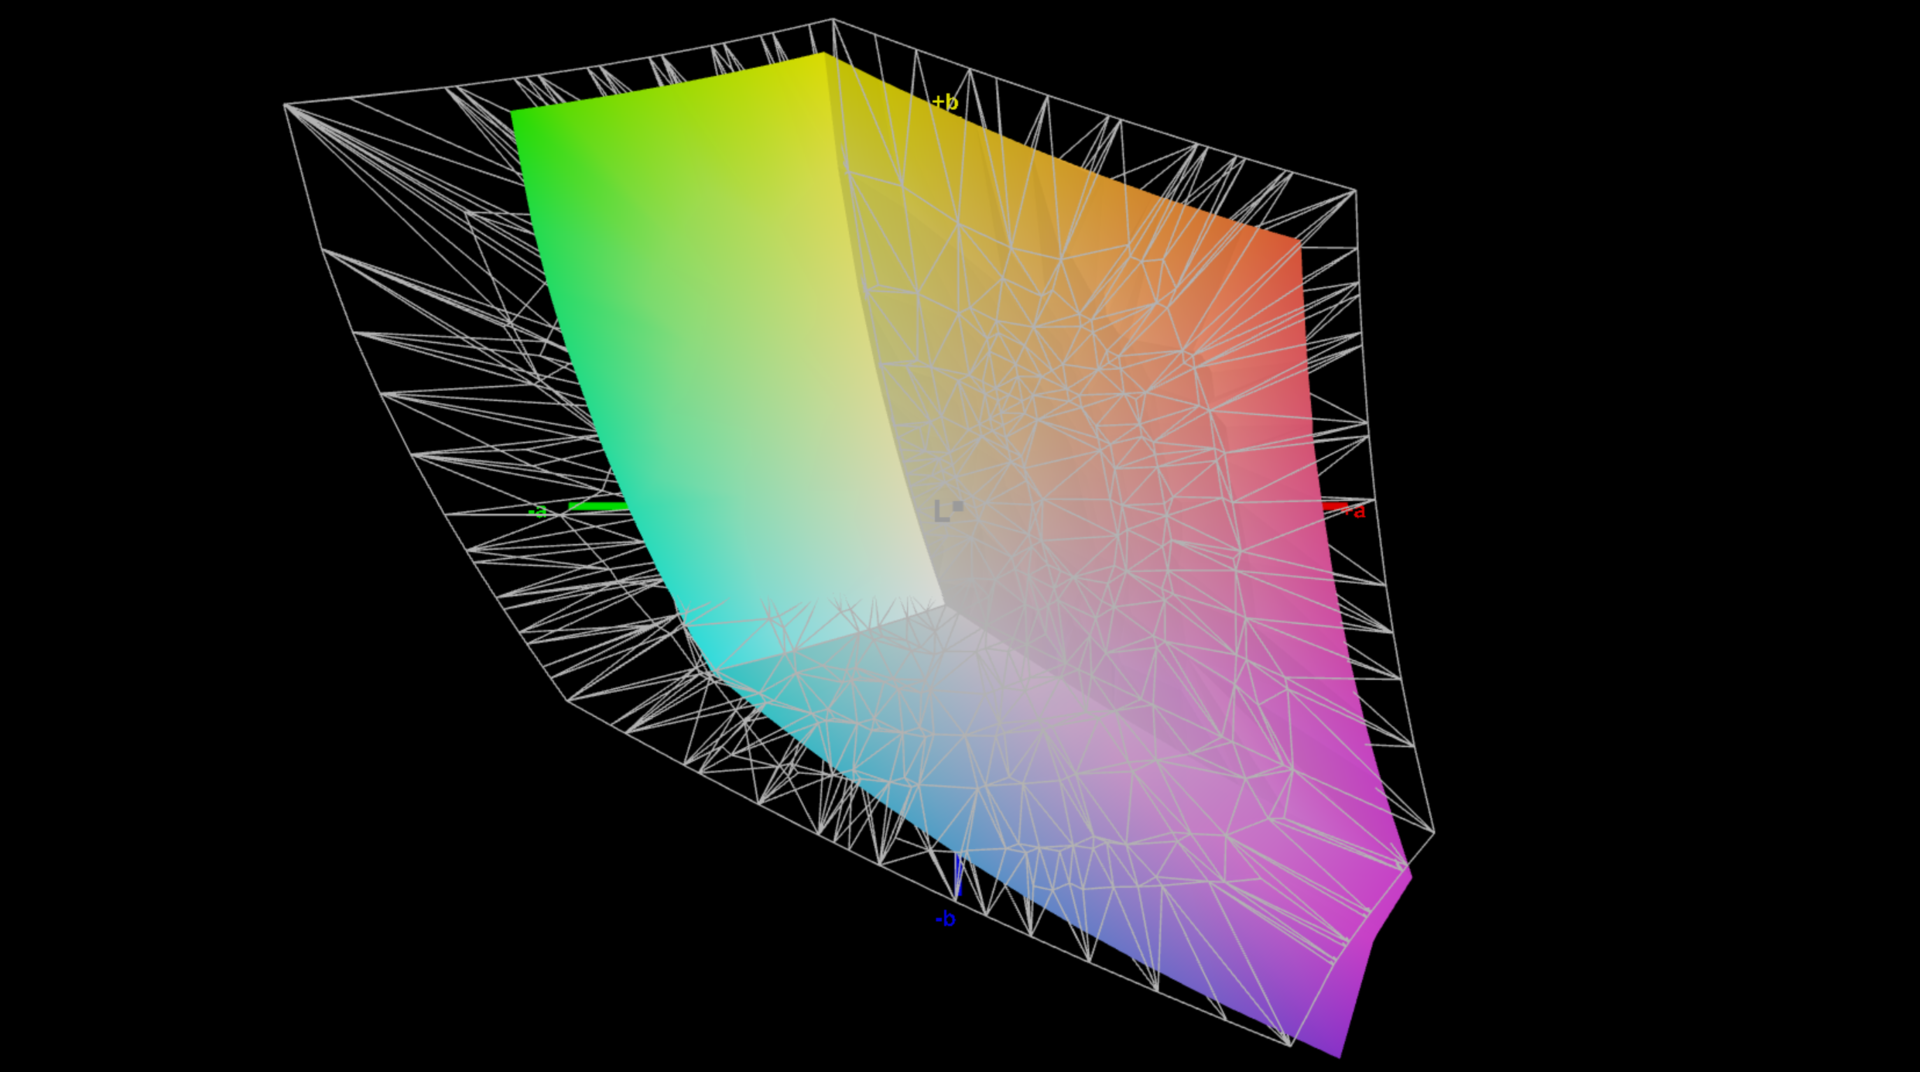
70% AdobeRGB 1998 (Argyll 3D)
98.8% sRGB (Argyll 3D)
68.8% Display P3 (Argyll 3D)
Gamma: 2.16
CCT: 7462 K
| Schenker VISION 16 Pro (M23) NE160QDM-NZ1, IPS, 2560x1600, 16" | Samsung Galaxy Book3 Ultra 16, i9-13900H RTX 4070 Samsung SDC4185 ATNA60CL03-0, OLED / AMOLED, 2880x1800, 16" | MSI Stealth 16 Studio A13VG AUO26A9, IPS, 2560x1600, 16" | Dell XPS 15 9530 RTX 4070 Samsung 156XG01, OLED, 3456x2160, 15.6" | Asus ProArt Studiobook 16 OLED H7604 ATNA60BX01-1, OLED, 3200x2000, 16" | Apple MacBook Pro 16 2023 M2 Max Mini-LED, 3456x2234, 16.2" | Schenker Vision 16 Pro RTX 3070 Ti N160QDM-NZ1, IPS, 2560x1600, 16" | |
|---|---|---|---|---|---|---|---|
| Display | 26% | 21% | 29% | 25% | 24% | -1% | |
| Display P3 Coverage (%) | 68.8 | 95.3 39% | 96.4 40% | 99.8 45% | 99.6 45% | 99 44% | 68.7 0% |
| sRGB Coverage (%) | 98.8 | 99.1 0% | 99.7 1% | 100 1% | 100 1% | 100 1% | 96.7 -2% |
| AdobeRGB 1998 Coverage (%) | 70 | 97.4 39% | 84.8 21% | 98.4 41% | 89.4 28% | 88.5 26% | 70 0% |
| Response Times | 80% | 50% | 82% | 93% | -486% | -5% | |
| Response Time Grey 50% / Grey 80% * (ms) | 13.7 ? | 2 ? 85% | 4.4 ? 68% | 1.68 ? 88% | 0.59 ? 96% | 80.5 ? -488% | 14.3 ? -4% |
| Response Time Black / White * (ms) | 8.1 ? | 2 ? 75% | 5.6 ? 31% | 1.94 ? 76% | 0.79 ? 90% | 47.2 ? -483% | 8.6 ? -6% |
| PWM Frequency (Hz) | 250 ? | 239 | 240 ? | 14880 ? | |||
| Screen | 21% | -16% | 0% | 159% | 4950% | -14% | |
| Brightness middle (cd/m²) | 384 | 403 5% | 424 10% | 389.5 1% | 349 -9% | 504 31% | 364 -5% |
| Brightness (cd/m²) | 371 | 408 10% | 411 11% | 392 6% | 350 -6% | 487 31% | 347 -6% |
| Brightness Distribution (%) | 88 | 98 11% | 88 0% | 98 11% | 95 8% | 94 7% | 89 1% |
| Black Level * (cd/m²) | 0.3 | 0.37 -23% | 0.02 93% | 0.001 100% | 0.3 -0% | ||
| Contrast (:1) | 1280 | 1146 -10% | 17450 1263% | 504000 39275% | 1213 -5% | ||
| Colorchecker dE 2000 * | 3.4 | 2.63 23% | 3.04 11% | 4.95 -46% | 2.1 38% | 1.5 56% | 3.3 3% |
| Colorchecker dE 2000 max. * | 9.2 | 4.07 56% | 7.5 18% | 8.65 6% | 5.5 40% | 3.3 64% | 6.6 28% |
| Colorchecker dE 2000 calibrated * | 1.3 | 3.04 -134% | 1.53 -18% | 2.1 -62% | 2.5 -92% | ||
| Greyscale dE 2000 * | 3.4 | 2.69 21% | 4.34 -28% | 2 41% | 1.2 65% | 2.1 38% | 5.2 -53% |
| Gamma | 2.16 102% | 2.48 89% | 2.32 95% | 2.27 97% | 2.19 100% | 2.25 98% | 2.14 103% |
| CCT | 7462 87% | 6907 94% | 6952 93% | 6265 104% | 6545 99% | 6882 94% | 6331 103% |
| Totalt genomsnitt (program/inställningar) | 42% /
33% | 18% /
1% | 37% /
21% | 92% /
121% | 1496% /
2977% | -7% /
-10% |
* ... mindre är bättre
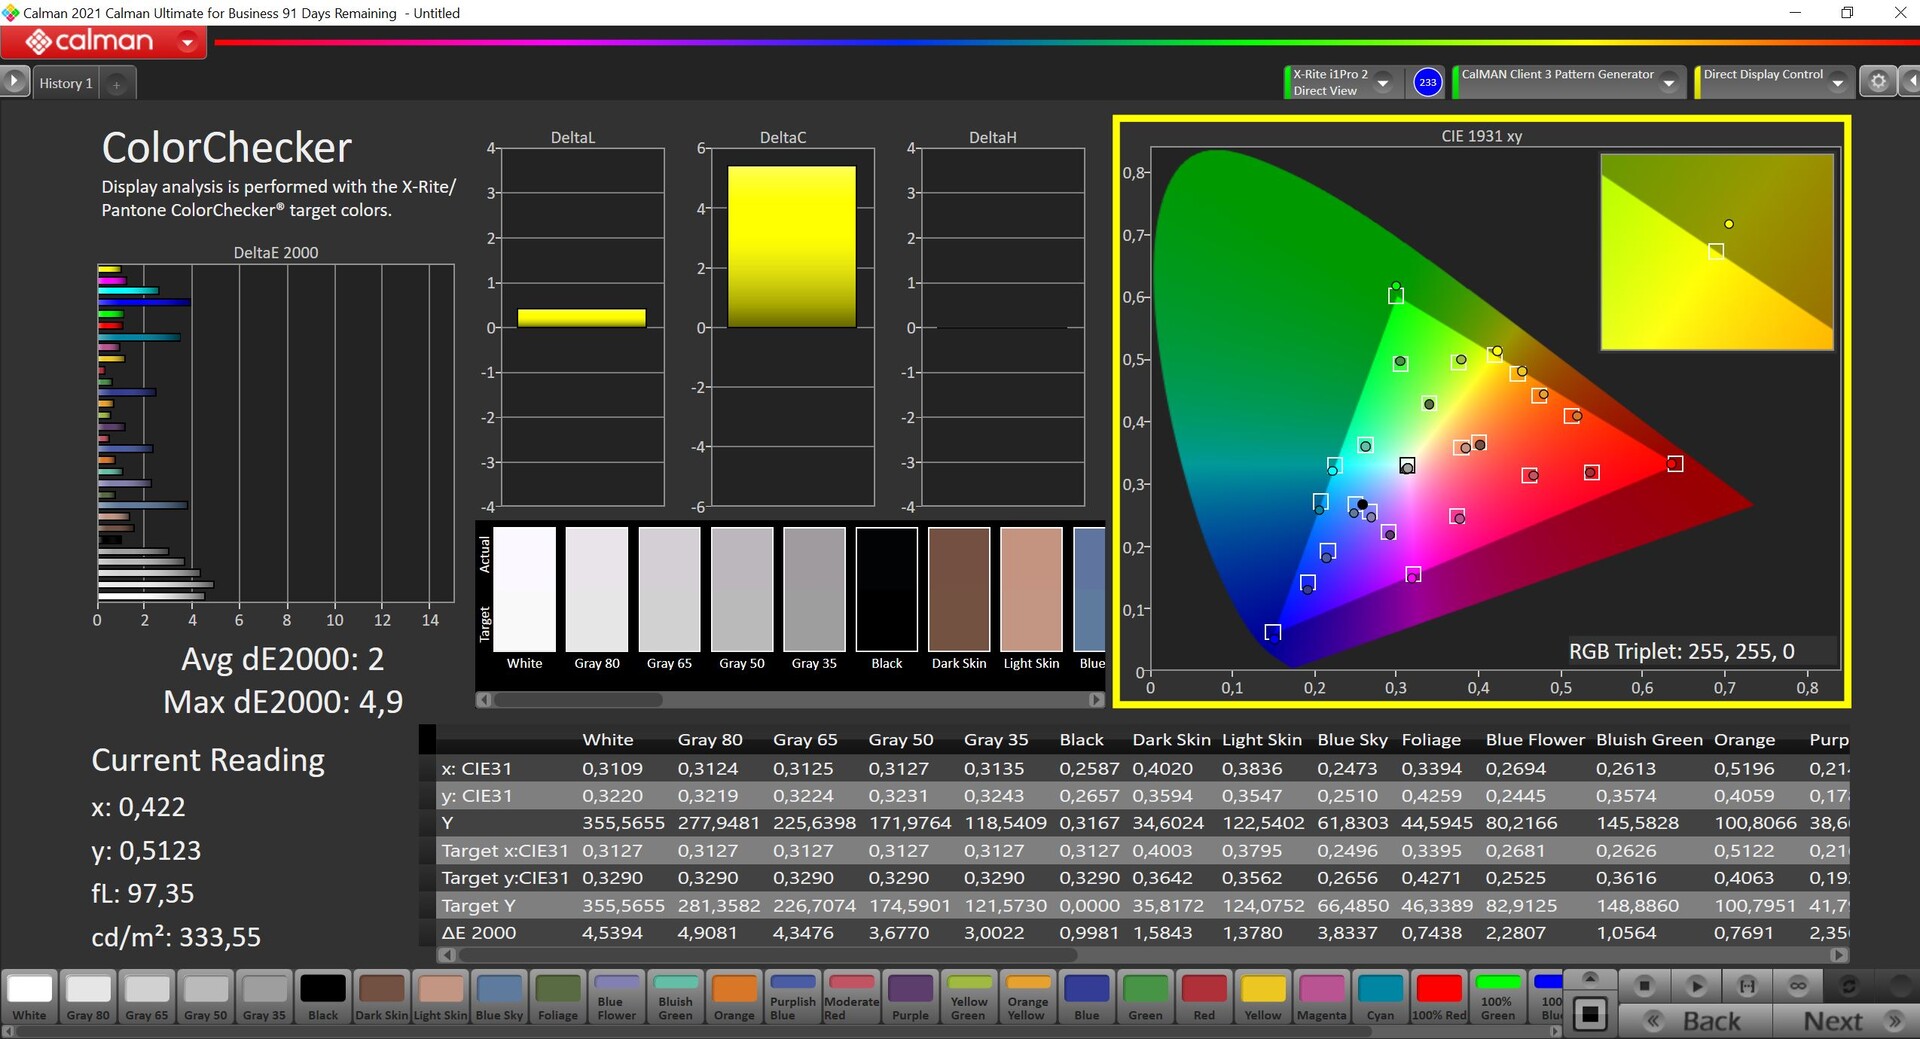
Vi mäter panelen i leveransskick med den professionella programvaran CalMAN. Den har en tydlig blå nyans och färgtemperaturen är också för kall. Schenker erbjuder nedladdning av en kalibrerad profil i Control Center, och den laddas sedan ned automatiskt med hjälp av serienumret. Även om detta förbättrar situationen och även eliminerar färgtonen, minskar det också den maximala ljusstyrkan något med cirka 30 cd/m². Detta är inte en perfekt lösning, vilket vi kommer att se inom kort, men de som inte kan kalibrera sin panel (eller ladda ner vår kalibrerade profil från länken ovan) kommer fortfarande att få en märkbar förbättring här.
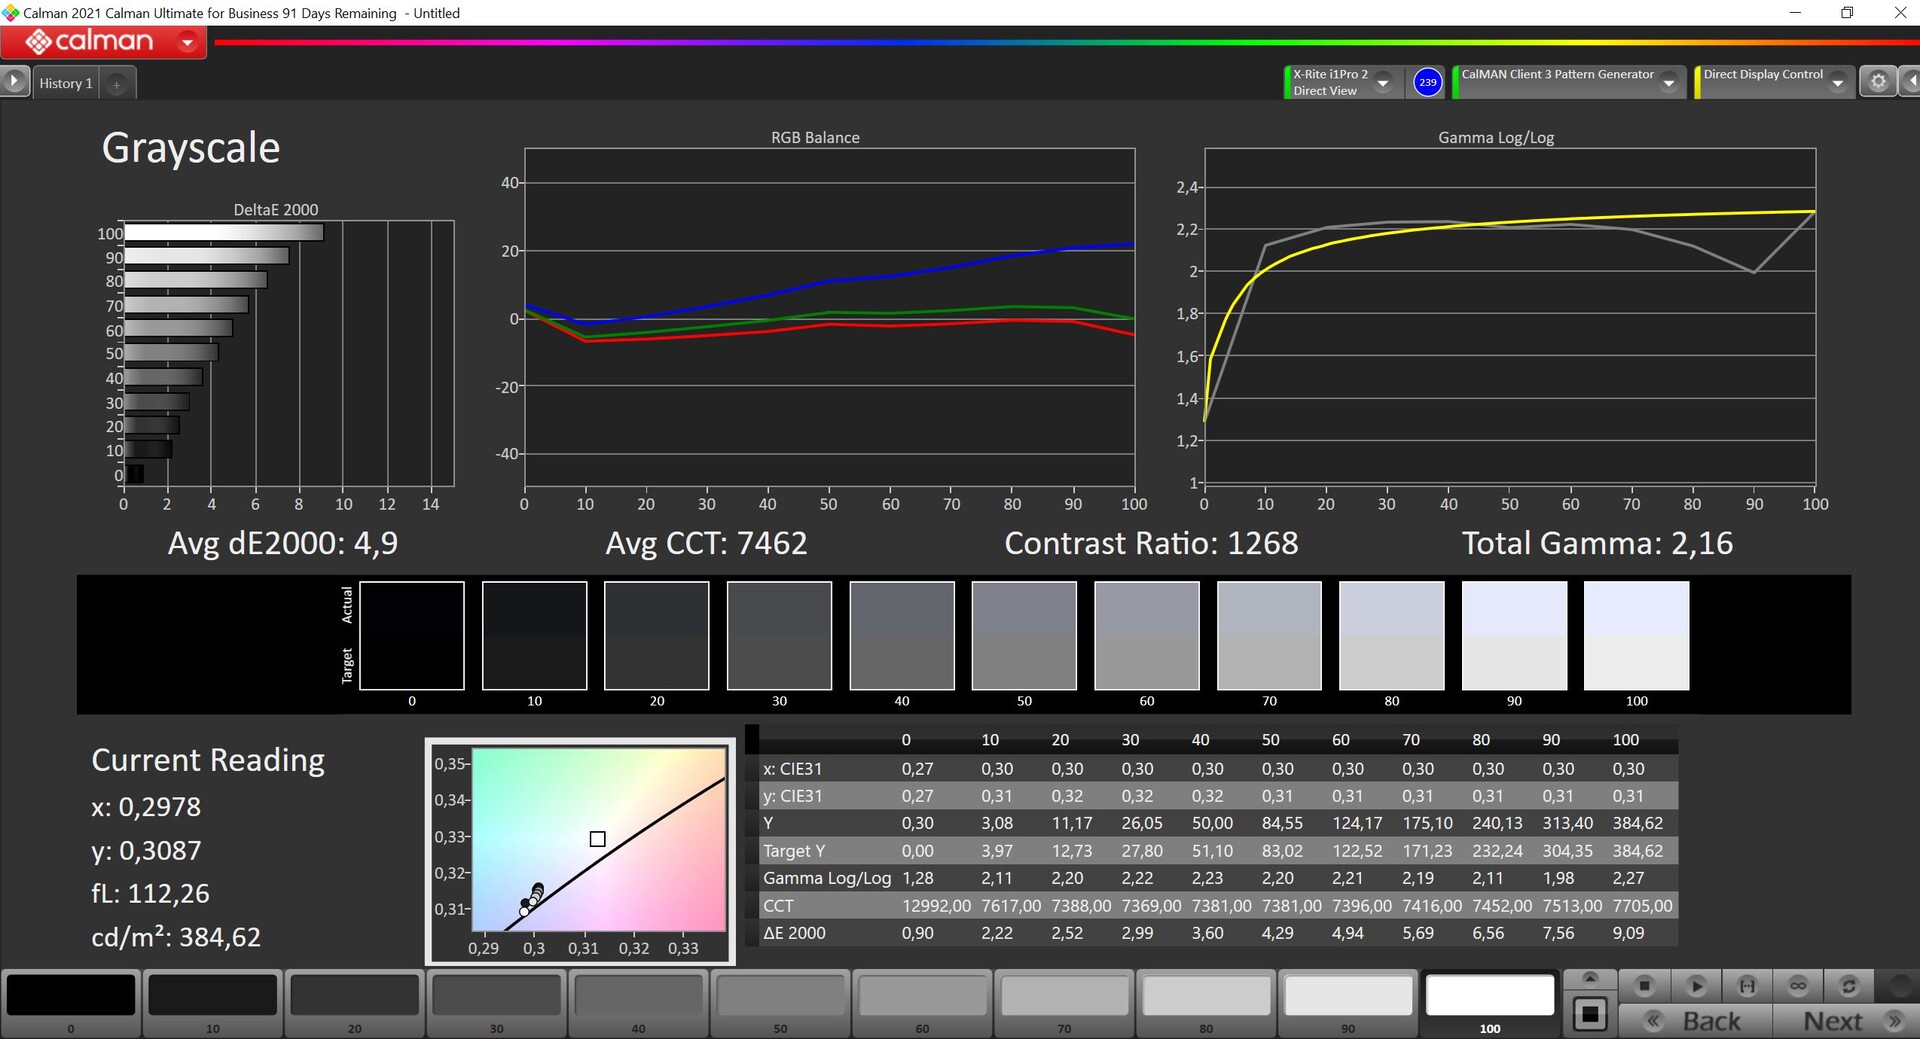
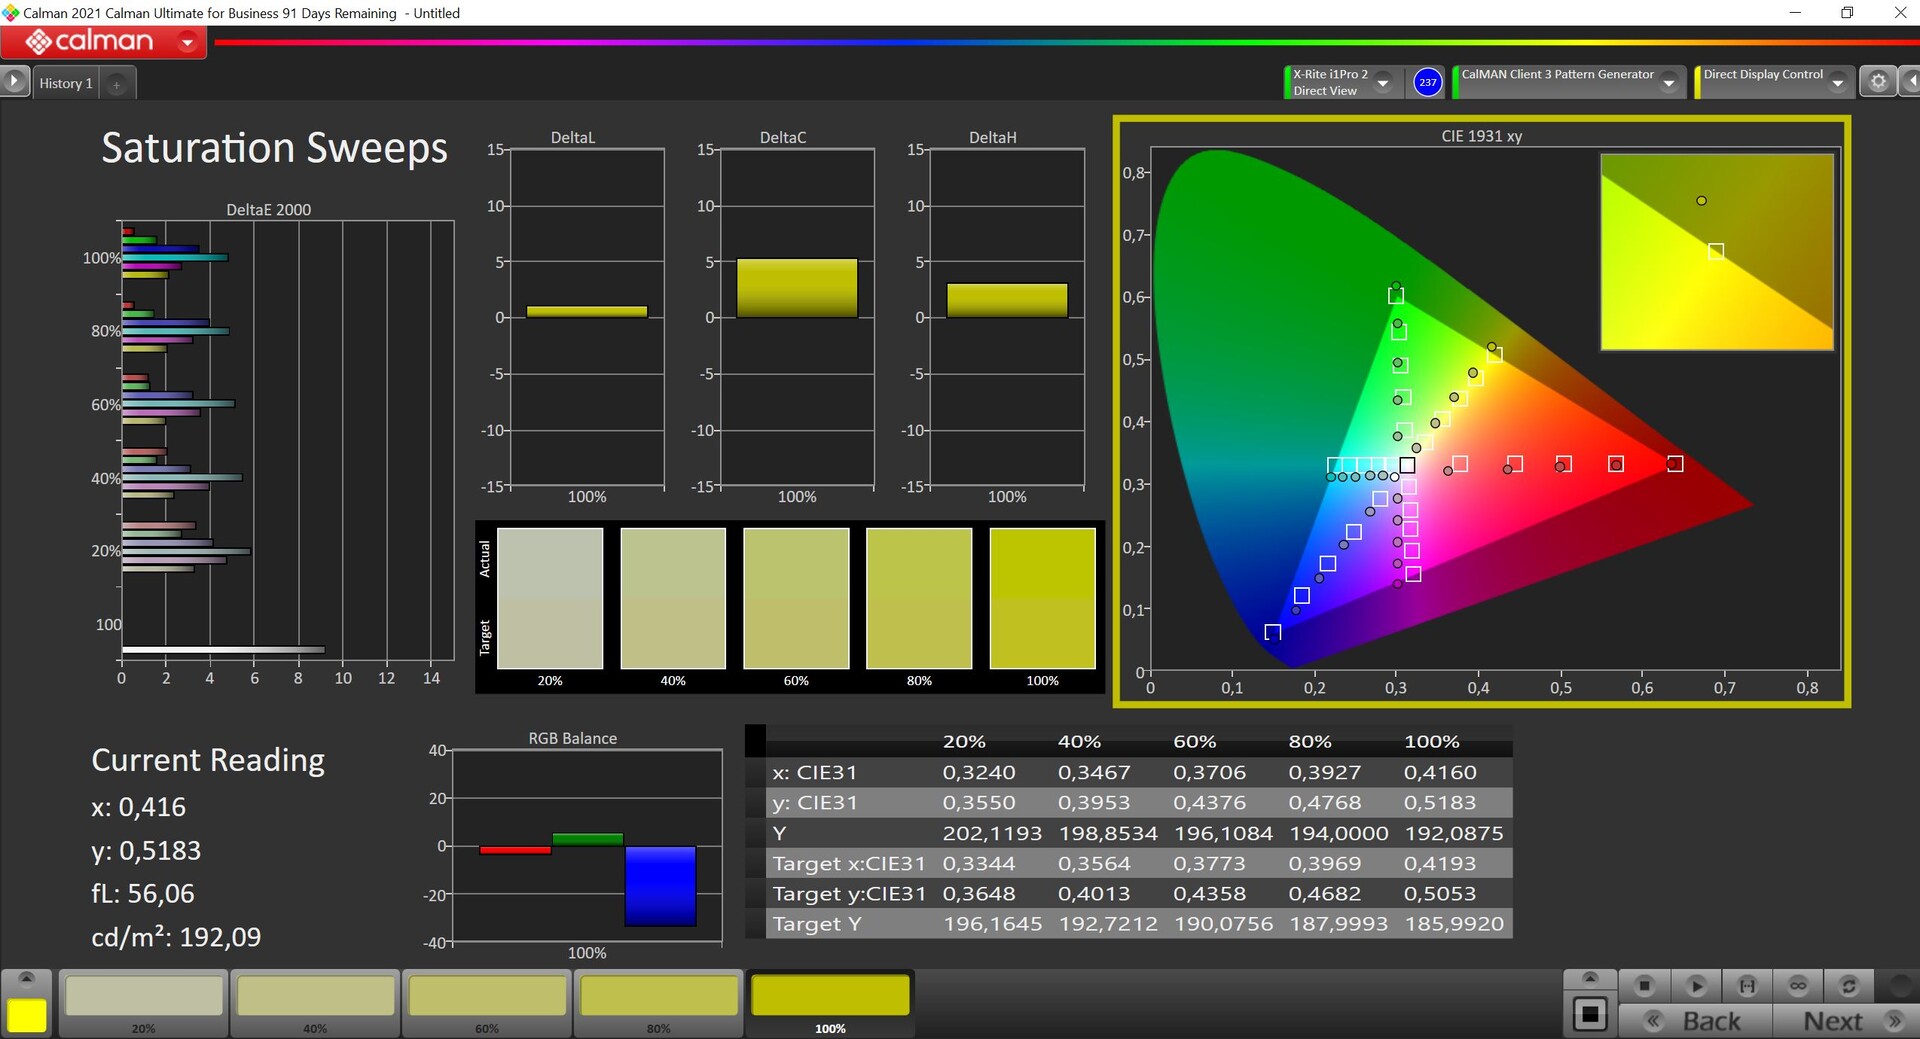
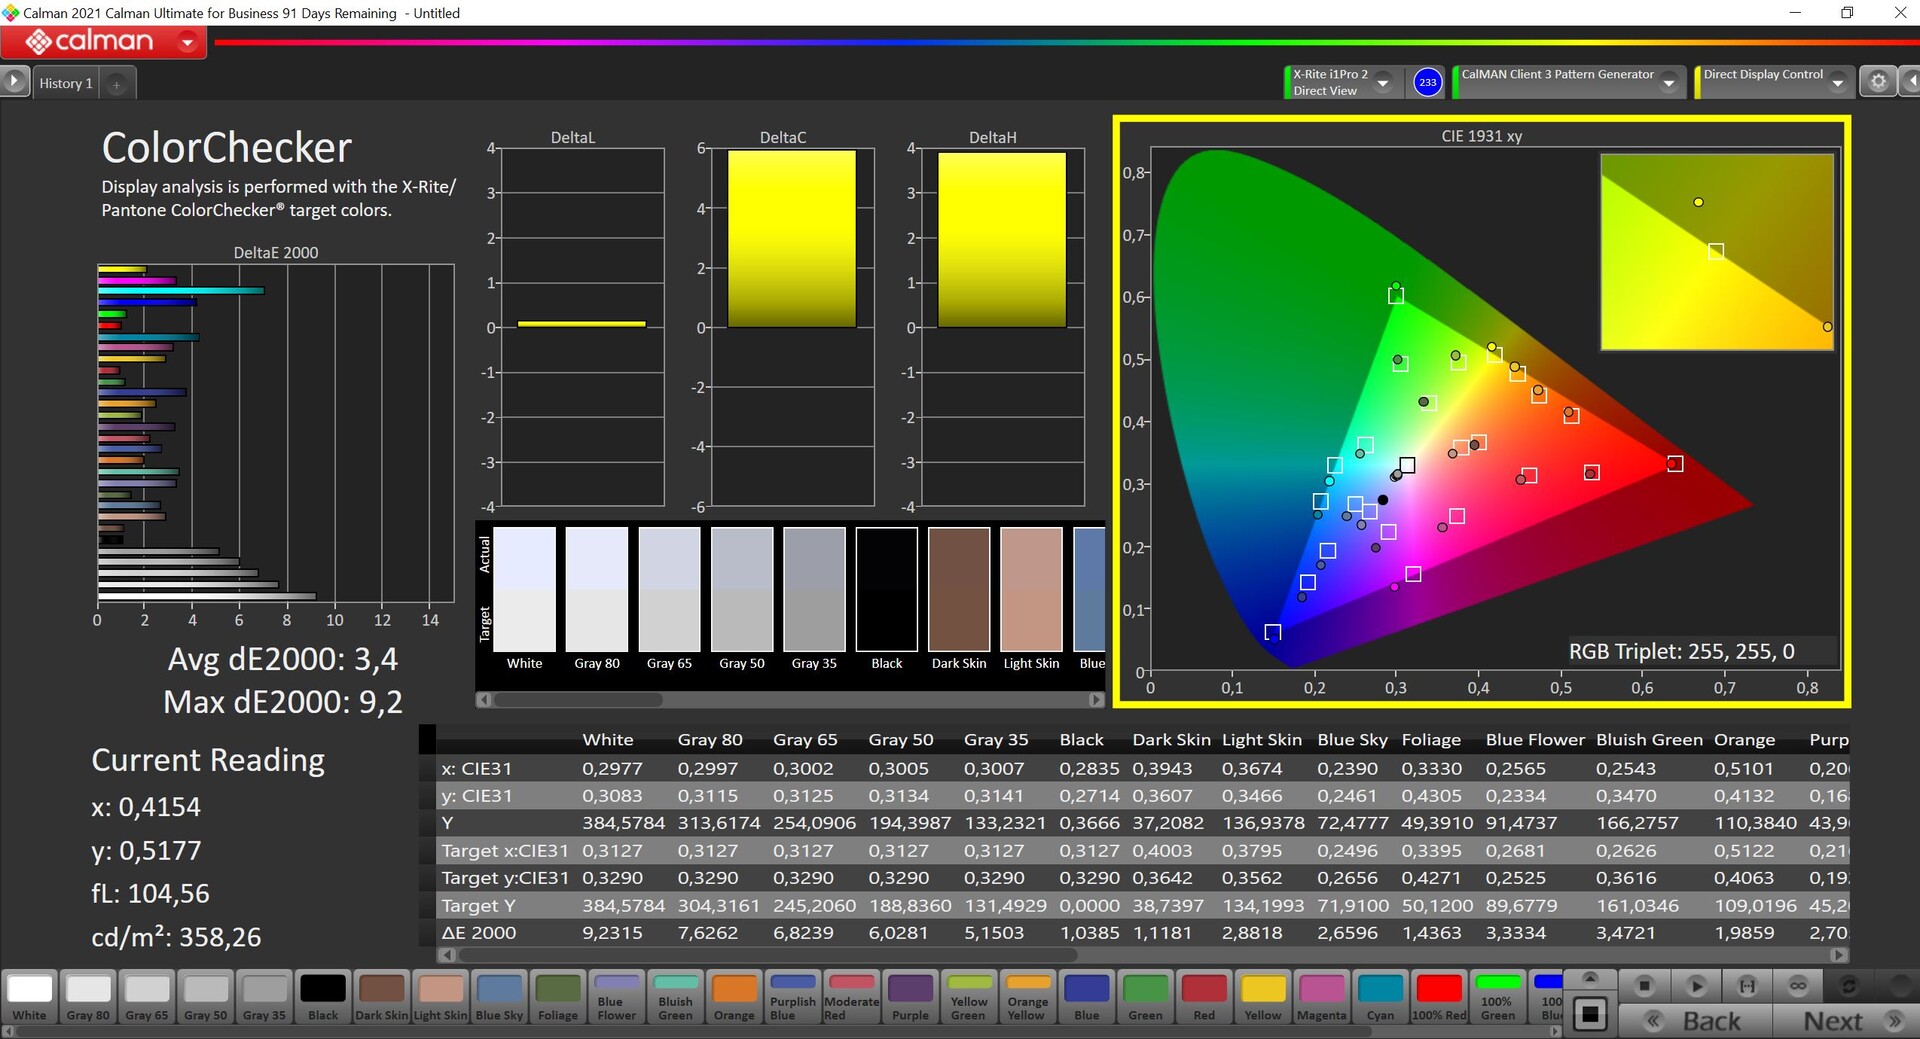

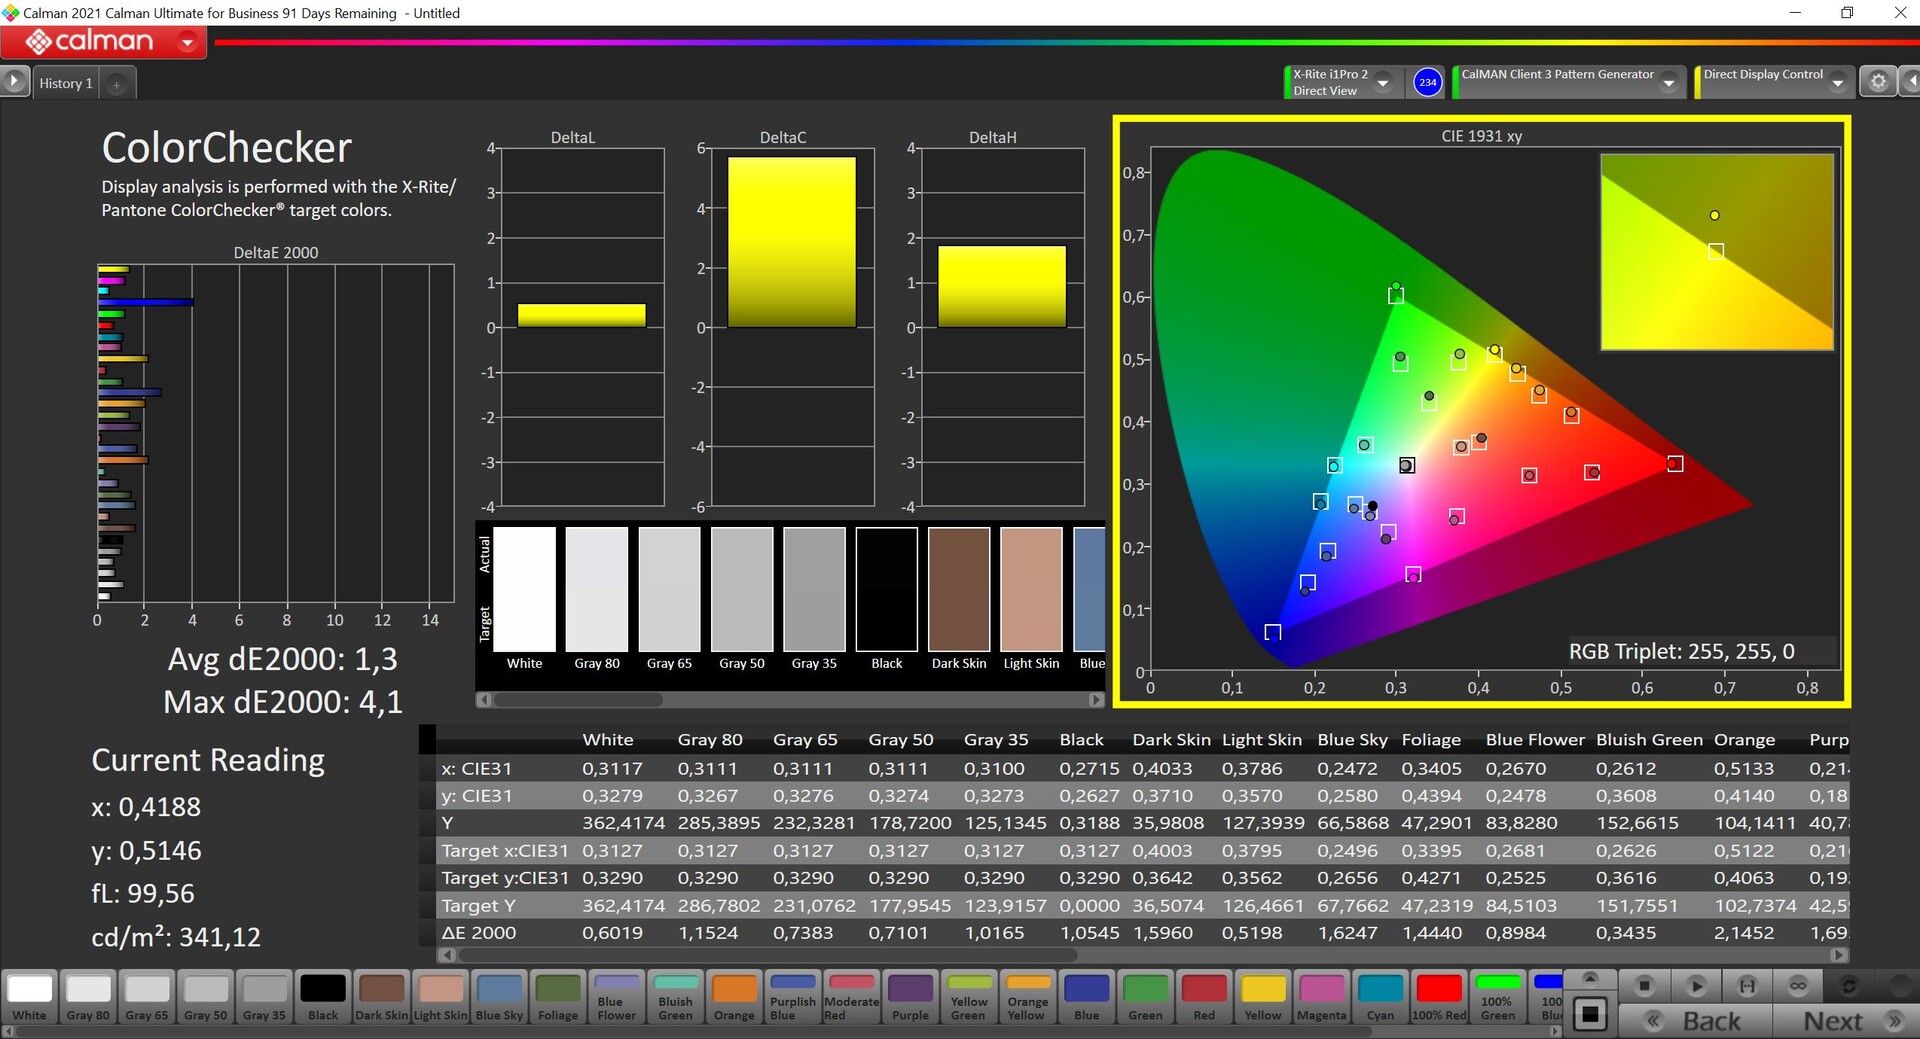
Med hjälp av vår egen kalibrering kan vi förbättra skärmen ytterligare, där gråskalan nu ligger på referensnivå och särskilt färgavvikelserna är ännu lägre. Det finns dock fortfarande några avvikelser i de blå färgtonerna där avvikelserna ligger minimalt över den viktiga målgränsen på 3. Men totalt sett är panelen fortfarande mycket lämplig för bildbehandling i den lilla sRGB-färgrymden som praktiskt taget täcks helt och hållet.


Visa svarstider
| ↔ Svarstid svart till vitt | ||
|---|---|---|
| 8.1 ms ... stiga ↗ och falla ↘ kombinerat | ↗ 3.8 ms stiga | 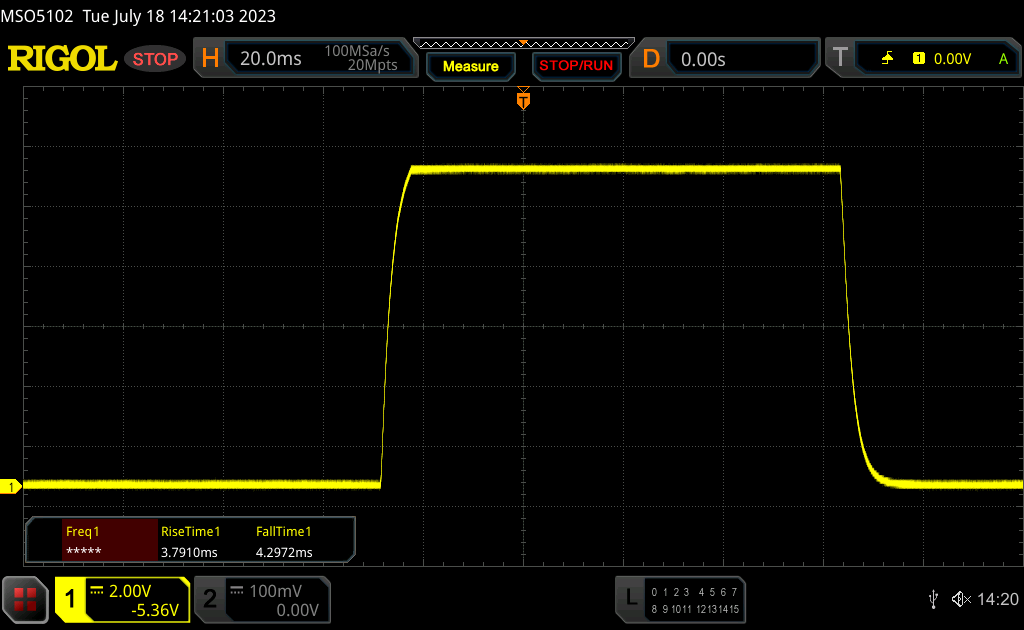 |
| ↘ 4.3 ms hösten | ||
| Skärmen visar snabba svarsfrekvenser i våra tester och bör passa för spel. I jämförelse sträcker sig alla testade enheter från 0.1 (minst) till 240 (maximalt) ms. » 24 % av alla enheter är bättre. Det betyder att den uppmätta svarstiden är bättre än genomsnittet av alla testade enheter (19.8 ms). | ||
| ↔ Svarstid 50 % grått till 80 % grått | ||
| 13.7 ms ... stiga ↗ och falla ↘ kombinerat | ↗ 6.7 ms stiga | 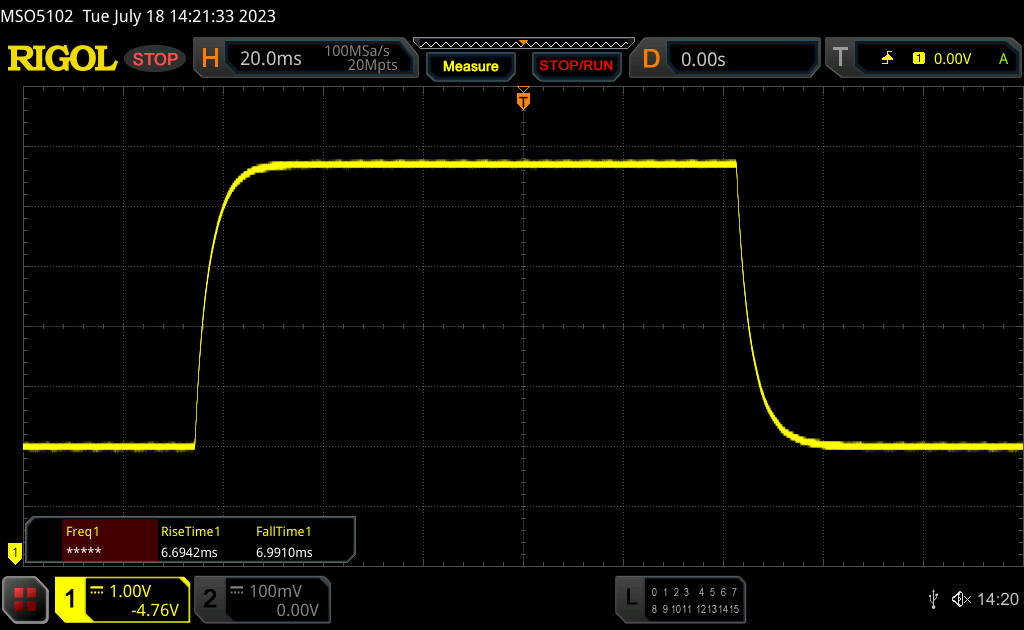 |
| ↘ 7 ms hösten | ||
| Skärmen visar bra svarsfrekvens i våra tester, men kan vara för långsam för konkurrenskraftiga spelare. I jämförelse sträcker sig alla testade enheter från 0.165 (minst) till 636 (maximalt) ms. » 28 % av alla enheter är bättre. Det betyder att den uppmätta svarstiden är bättre än genomsnittet av alla testade enheter (30.9 ms). | ||
Skärmflimmer / PWM (Puls-Width Modulation)
| Skärmflimmer / PWM upptäcktes inte | 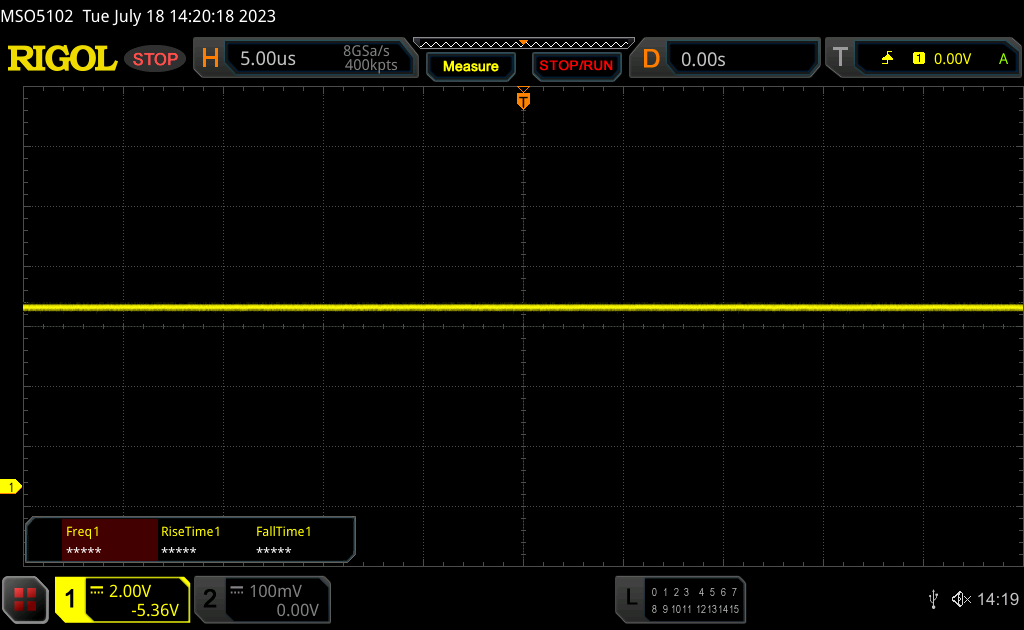 | ||
Som jämförelse: 52 % av alla testade enheter använder inte PWM för att dämpa skärmen. Om PWM upptäcktes mättes ett medelvärde av 7748 (minst: 5 - maximum: 343500) Hz. | |||

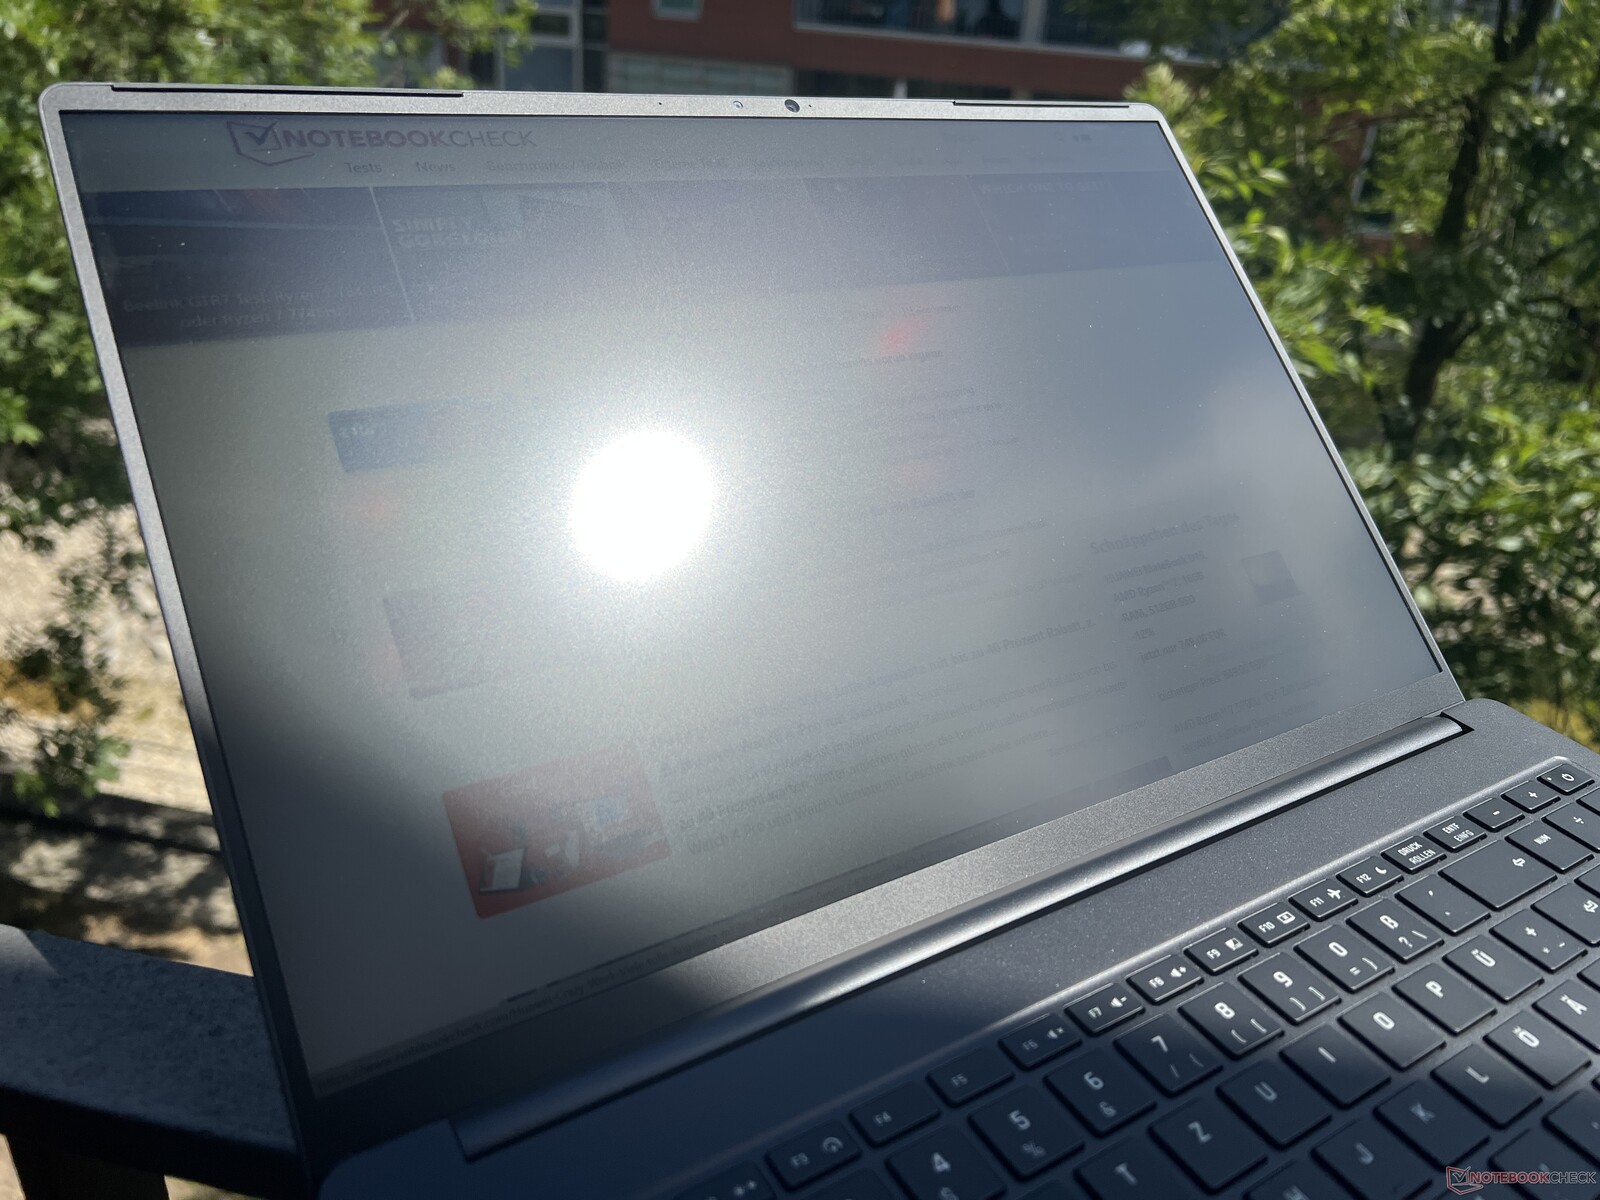
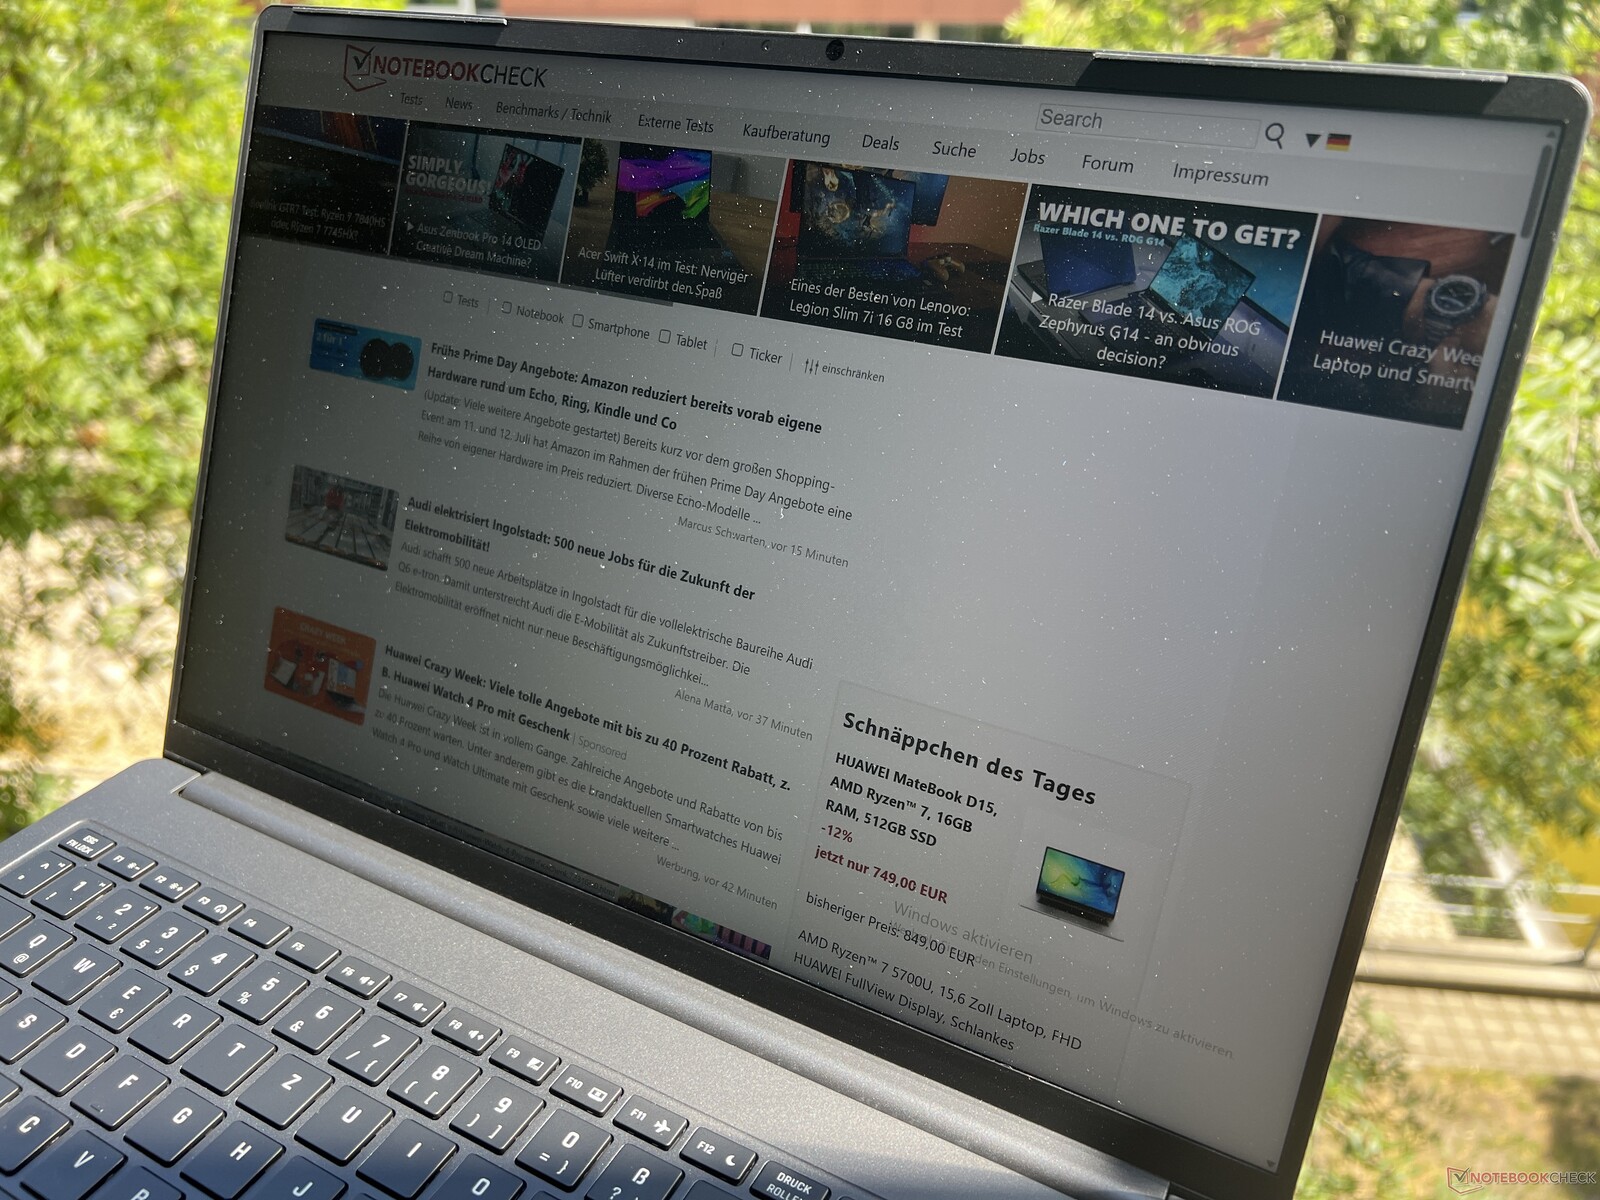
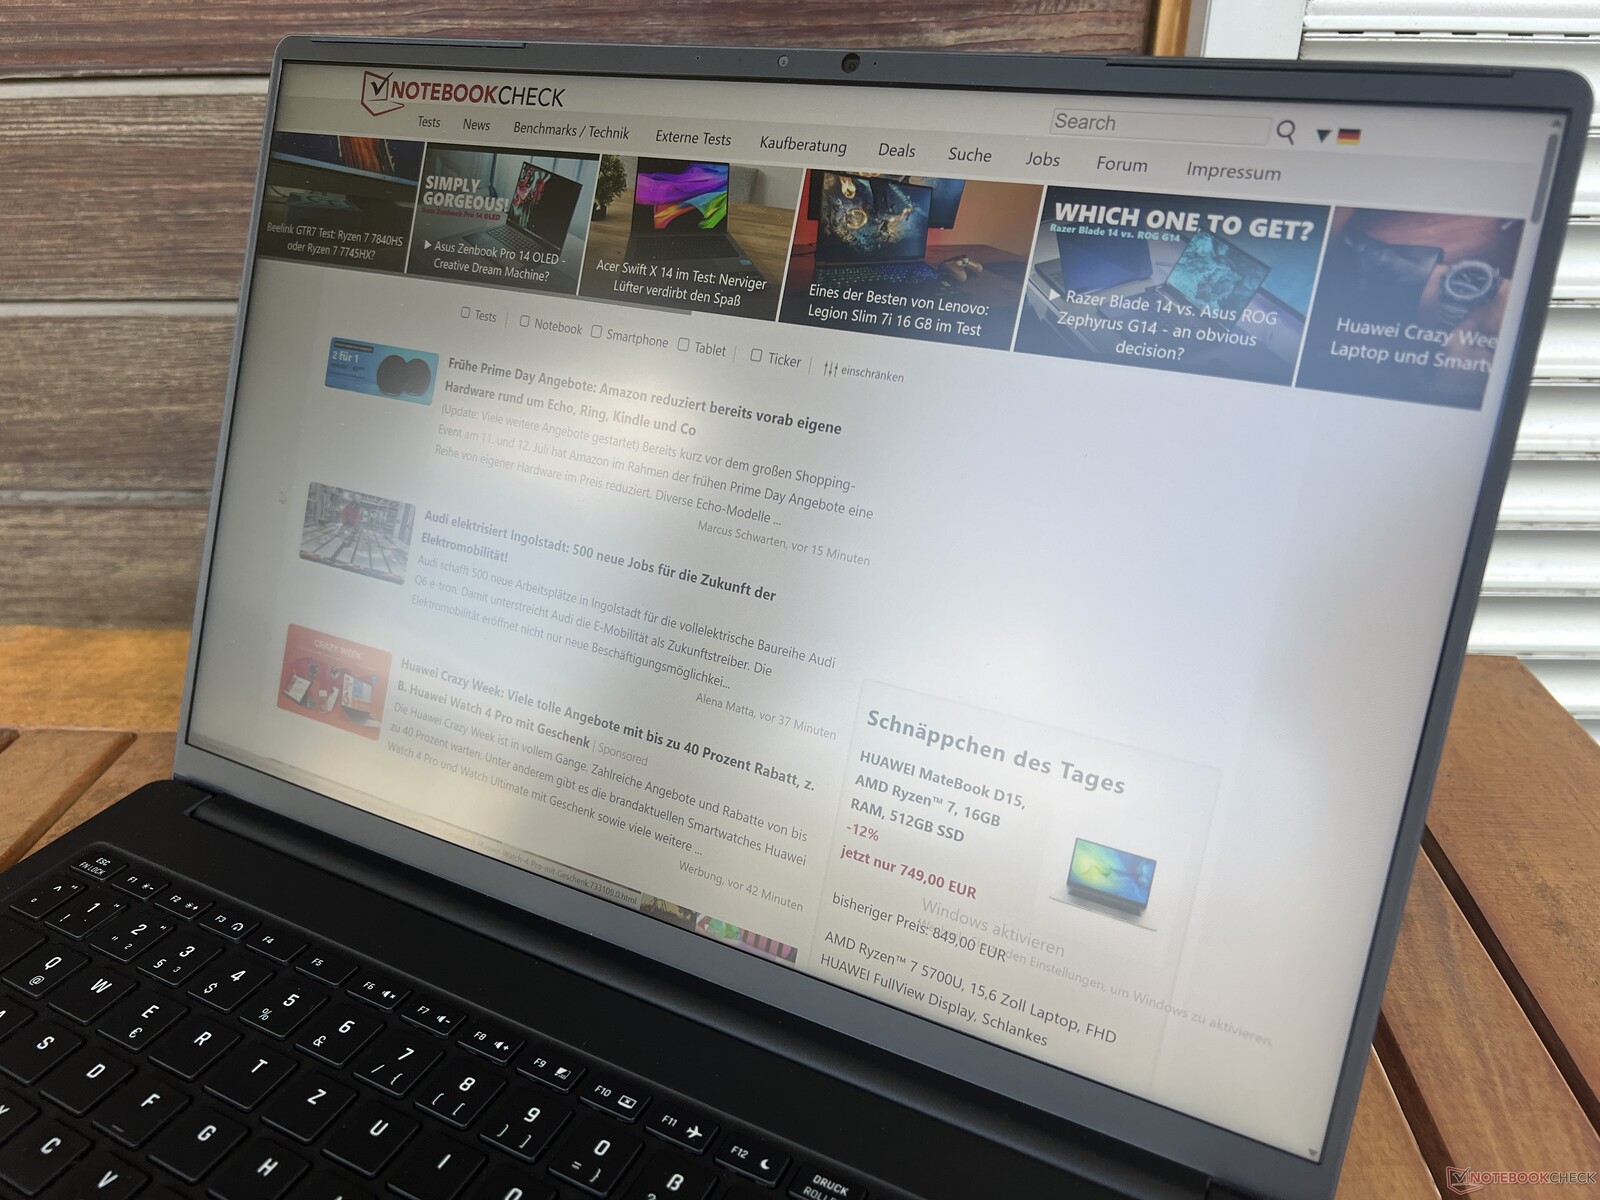

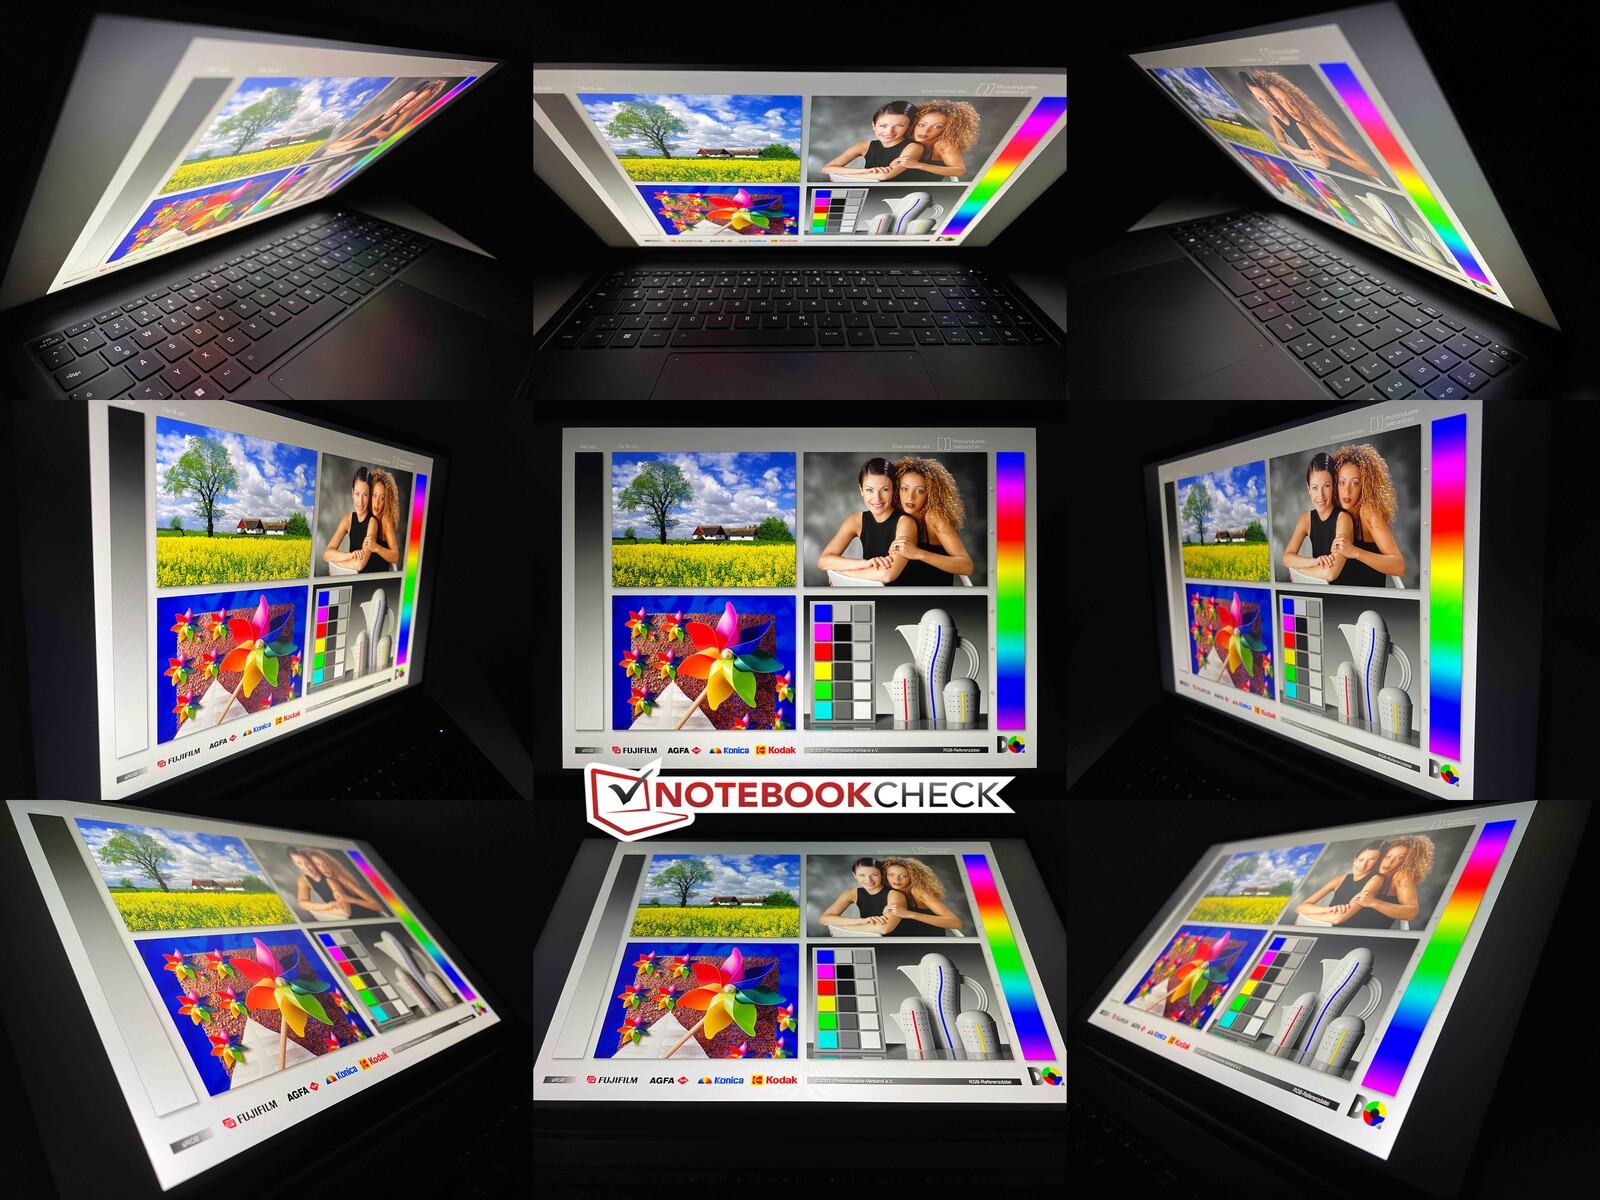
Så länge du undviker reflektioner från direkta ljuskällor kan Vision 16 Pro utan problem användas även i ljusa miljöer. Betraktningsvinkelstabiliteten är överlag god, men vid betraktning från en vinkel ovanifrån syns en tydlig ljusförstärkning och minskad kontrast.
Prestanda - RTX 4070 Laptop med 95 watt
Testförhållanden
Schenker erbjuder olika energiprofiler i Control Center, men till skillnad från föregångaren finns det ingen manuell profil längre, vilket skulle göra att du kan konfigurera TDP-gränserna för processorn. Vi körde återigen riktmärkena och mätningarna i Enthusiast Performance-läget, vilket ställer in TDP-värdena för processorn till 60/45 watt (eller 55/35 watt när dGPU är aktiverad). GPU:n kan förbruka 95 watt (70W TGP + 25W Dynamic Boost) här, och i läget Enthusiast Balanced är den 85 watt (60 + 25W).
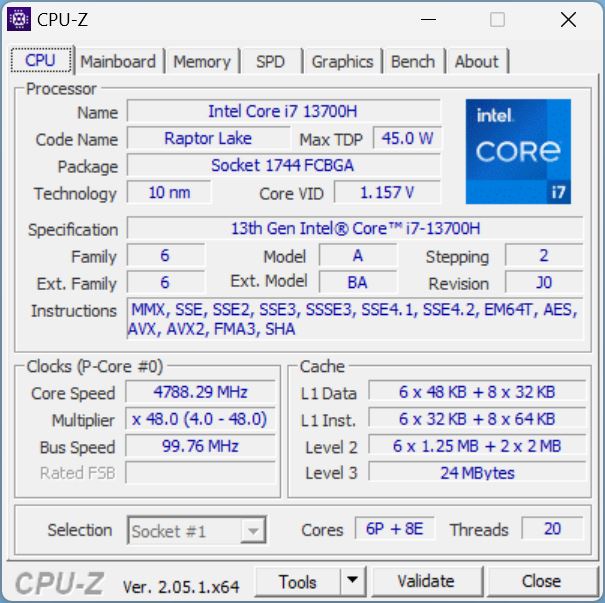
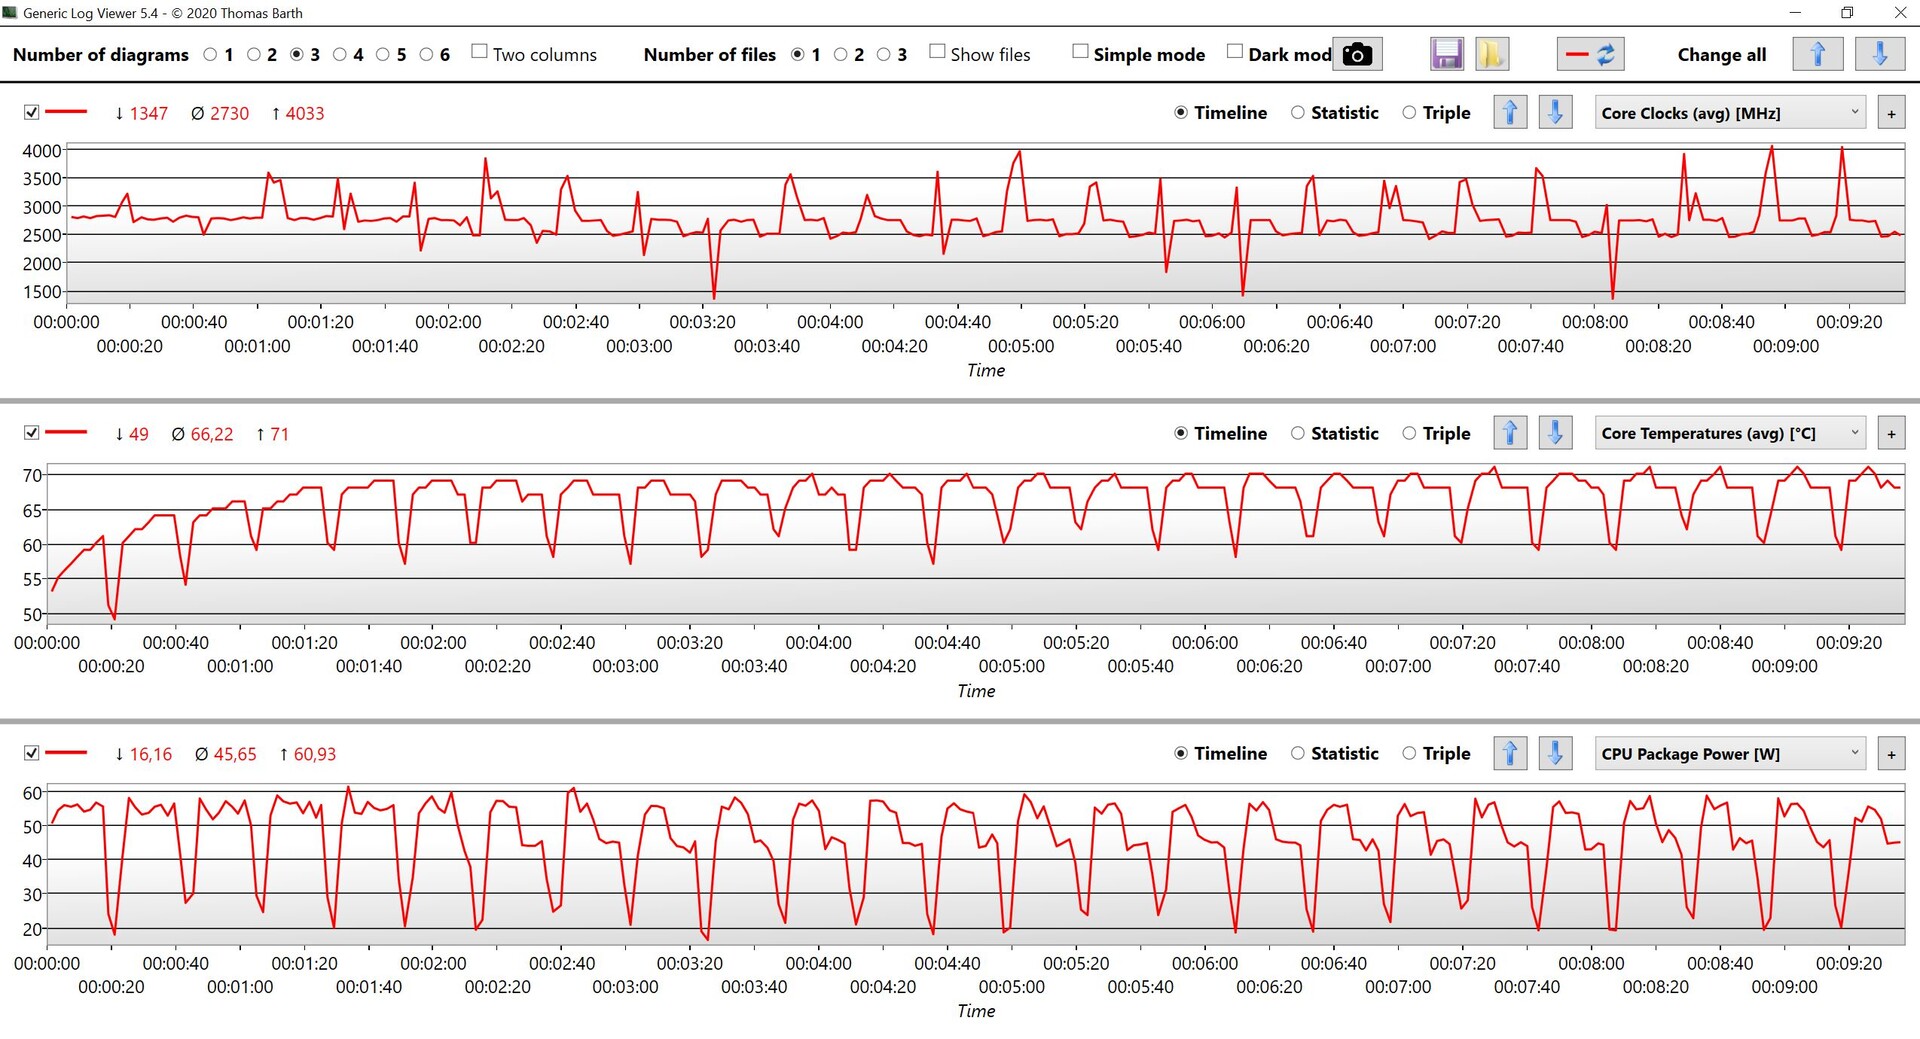
Processor - Core i7-13700H
Core i7-13700H från Intels nuvarande Raptor Lake-generation är den direkta efterföljaren till Core i7-12700H, och det finns inga förändringar förutom några små ökningar av de maximala klockhastigheterna. Vision 16 Pro är en av få enheter utan extremt höga effektgränser på mer än 100 watt. Detta har vissa fördelar i den dagliga driften, eftersom temperaturerna inte skjuter upp så högt så snabbt, och det finns inte heller en så brant prestandafall under konstant belastning. Å andra sidan är flerkärnighetsprestandan under kort belastning också lägre än konkurrenternas och bara något högre än i den äldre modellen. I Turbo-läge var den gamla modellen till och med betydligt snabbare. Vid batteridrift är strömförbrukningen begränsad till 36 watt, vilket gör att prestandan för flera kärnor sjunker med 20% utan laddare. Du kan hitta ytterligare CPU-riktmärken i vårt tekniska avsnitt.
Cinebench R15 Multi Constant Load Test
Cinebench R23: Multi Core | Single Core
Cinebench R20: CPU (Multi Core) | CPU (Single Core)
Cinebench R15: CPU Multi 64Bit | CPU Single 64Bit
Blender: v2.79 BMW27 CPU
7-Zip 18.03: 7z b 4 | 7z b 4 -mmt1
Geekbench 5.5: Multi-Core | Single-Core
HWBOT x265 Benchmark v2.2: 4k Preset
LibreOffice : 20 Documents To PDF
R Benchmark 2.5: Overall mean
| CPU Performance rating | |
| Asus ProArt Studiobook 16 OLED H7604 | |
| MSI Stealth 16 Studio A13VG | |
| Apple MacBook Pro 16 2023 M2 Max -6! | |
| Dell XPS 15 9530 RTX 4070 | |
| Genomsnitt av klass Multimedia | |
| Schenker VISION 16 Pro (M23) | |
| Genomsnitt Intel Core i7-13700H | |
| Schenker Vision 16 Pro RTX 3070 Ti | |
| Samsung Galaxy Book3 Ultra 16, i9-13900H RTX 4070 | |
| Cinebench R23 / Multi Core | |
| Asus ProArt Studiobook 16 OLED H7604 | |
| MSI Stealth 16 Studio A13VG | |
| Genomsnitt av klass Multimedia (4861 - 33362, n=65, senaste 2 åren) | |
| Dell XPS 15 9530 RTX 4070 | |
| Genomsnitt Intel Core i7-13700H (5890 - 20034, n=29) | |
| Apple MacBook Pro 16 2023 M2 Max | |
| Schenker VISION 16 Pro (M23) | |
| Samsung Galaxy Book3 Ultra 16, i9-13900H RTX 4070 | |
| Schenker Vision 16 Pro RTX 3070 Ti | |
| Cinebench R23 / Single Core | |
| Asus ProArt Studiobook 16 OLED H7604 | |
| Genomsnitt av klass Multimedia (1128 - 2459, n=64, senaste 2 åren) | |
| Schenker VISION 16 Pro (M23) | |
| MSI Stealth 16 Studio A13VG | |
| Dell XPS 15 9530 RTX 4070 | |
| Schenker Vision 16 Pro RTX 3070 Ti | |
| Genomsnitt Intel Core i7-13700H (1323 - 1914, n=29) | |
| Apple MacBook Pro 16 2023 M2 Max | |
| Samsung Galaxy Book3 Ultra 16, i9-13900H RTX 4070 | |
| Cinebench R20 / CPU (Multi Core) | |
| Asus ProArt Studiobook 16 OLED H7604 | |
| MSI Stealth 16 Studio A13VG | |
| Genomsnitt av klass Multimedia (1887 - 12912, n=56, senaste 2 åren) | |
| Dell XPS 15 9530 RTX 4070 | |
| Genomsnitt Intel Core i7-13700H (2322 - 7674, n=29) | |
| Schenker VISION 16 Pro (M23) | |
| Schenker Vision 16 Pro RTX 3070 Ti | |
| Samsung Galaxy Book3 Ultra 16, i9-13900H RTX 4070 | |
| Apple MacBook Pro 16 2023 M2 Max | |
| Cinebench R20 / CPU (Single Core) | |
| Asus ProArt Studiobook 16 OLED H7604 | |
| Schenker VISION 16 Pro (M23) | |
| Genomsnitt av klass Multimedia (425 - 853, n=56, senaste 2 åren) | |
| MSI Stealth 16 Studio A13VG | |
| Schenker Vision 16 Pro RTX 3070 Ti | |
| Dell XPS 15 9530 RTX 4070 | |
| Genomsnitt Intel Core i7-13700H (508 - 741, n=29) | |
| Apple MacBook Pro 16 2023 M2 Max | |
| Samsung Galaxy Book3 Ultra 16, i9-13900H RTX 4070 | |
| Cinebench R15 / CPU Multi 64Bit | |
| Asus ProArt Studiobook 16 OLED H7604 | |
| MSI Stealth 16 Studio A13VG | |
| Schenker Vision 16 Pro RTX 3070 Ti | |
| Schenker Vision 16 Pro RTX 3070 Ti | |
| Dell XPS 15 9530 RTX 4070 | |
| Genomsnitt av klass Multimedia (856 - 5224, n=60, senaste 2 åren) | |
| Genomsnitt Intel Core i7-13700H (905 - 2982, n=29) | |
| Schenker VISION 16 Pro (M23) | |
| Samsung Galaxy Book3 Ultra 16, i9-13900H RTX 4070 | |
| Apple MacBook Pro 16 2023 M2 Max | |
| Cinebench R15 / CPU Single 64Bit | |
| Asus ProArt Studiobook 16 OLED H7604 | |
| Genomsnitt av klass Multimedia (184.8 - 326, n=58, senaste 2 åren) | |
| Schenker VISION 16 Pro (M23) | |
| MSI Stealth 16 Studio A13VG | |
| Dell XPS 15 9530 RTX 4070 | |
| Schenker Vision 16 Pro RTX 3070 Ti | |
| Genomsnitt Intel Core i7-13700H (213 - 278, n=29) | |
| Apple MacBook Pro 16 2023 M2 Max | |
| Samsung Galaxy Book3 Ultra 16, i9-13900H RTX 4070 | |
| Blender / v2.79 BMW27 CPU | |
| Schenker Vision 16 Pro RTX 3070 Ti | |
| Genomsnitt av klass Multimedia (100 - 557, n=57, senaste 2 åren) | |
| Samsung Galaxy Book3 Ultra 16, i9-13900H RTX 4070 | |
| Genomsnitt Intel Core i7-13700H (169 - 555, n=29) | |
| Schenker VISION 16 Pro (M23) | |
| Dell XPS 15 9530 RTX 4070 | |
| MSI Stealth 16 Studio A13VG | |
| Asus ProArt Studiobook 16 OLED H7604 | |
| 7-Zip 18.03 / 7z b 4 | |
| Asus ProArt Studiobook 16 OLED H7604 | |
| MSI Stealth 16 Studio A13VG | |
| Schenker VISION 16 Pro (M23) | |
| Genomsnitt Intel Core i7-13700H (27322 - 76344, n=29) | |
| Dell XPS 15 9530 RTX 4070 | |
| Genomsnitt av klass Multimedia (26062 - 130368, n=54, senaste 2 åren) | |
| Schenker Vision 16 Pro RTX 3070 Ti | |
| Samsung Galaxy Book3 Ultra 16, i9-13900H RTX 4070 | |
| 7-Zip 18.03 / 7z b 4 -mmt1 | |
| Asus ProArt Studiobook 16 OLED H7604 | |
| Schenker VISION 16 Pro (M23) | |
| MSI Stealth 16 Studio A13VG | |
| Dell XPS 15 9530 RTX 4070 | |
| Genomsnitt av klass Multimedia (3666 - 7545, n=55, senaste 2 åren) | |
| Genomsnitt Intel Core i7-13700H (4825 - 6238, n=29) | |
| Schenker Vision 16 Pro RTX 3070 Ti | |
| Samsung Galaxy Book3 Ultra 16, i9-13900H RTX 4070 | |
| Geekbench 5.5 / Multi-Core | |
| Asus ProArt Studiobook 16 OLED H7604 | |
| Apple MacBook Pro 16 2023 M2 Max | |
| Dell XPS 15 9530 RTX 4070 | |
| MSI Stealth 16 Studio A13VG | |
| Genomsnitt av klass Multimedia (4652 - 20422, n=55, senaste 2 åren) | |
| Schenker VISION 16 Pro (M23) | |
| Genomsnitt Intel Core i7-13700H (6165 - 14215, n=29) | |
| Schenker Vision 16 Pro RTX 3070 Ti | |
| Samsung Galaxy Book3 Ultra 16, i9-13900H RTX 4070 | |
| Geekbench 5.5 / Single-Core | |
| Asus ProArt Studiobook 16 OLED H7604 | |
| Apple MacBook Pro 16 2023 M2 Max | |
| Genomsnitt av klass Multimedia (805 - 2974, n=55, senaste 2 åren) | |
| Dell XPS 15 9530 RTX 4070 | |
| Schenker VISION 16 Pro (M23) | |
| MSI Stealth 16 Studio A13VG | |
| Schenker Vision 16 Pro RTX 3070 Ti | |
| Genomsnitt Intel Core i7-13700H (1362 - 1919, n=29) | |
| Samsung Galaxy Book3 Ultra 16, i9-13900H RTX 4070 | |
| HWBOT x265 Benchmark v2.2 / 4k Preset | |
| Asus ProArt Studiobook 16 OLED H7604 | |
| MSI Stealth 16 Studio A13VG | |
| Genomsnitt av klass Multimedia (5.26 - 36.1, n=55, senaste 2 åren) | |
| Dell XPS 15 9530 RTX 4070 | |
| Schenker VISION 16 Pro (M23) | |
| Genomsnitt Intel Core i7-13700H (6.72 - 21.2, n=29) | |
| Samsung Galaxy Book3 Ultra 16, i9-13900H RTX 4070 | |
| Schenker Vision 16 Pro RTX 3070 Ti | |
| LibreOffice / 20 Documents To PDF | |
| Samsung Galaxy Book3 Ultra 16, i9-13900H RTX 4070 | |
| MSI Stealth 16 Studio A13VG | |
| Genomsnitt av klass Multimedia (23.9 - 146.7, n=56, senaste 2 åren) | |
| Genomsnitt Intel Core i7-13700H (31.3 - 62.4, n=29) | |
| Schenker VISION 16 Pro (M23) | |
| Asus ProArt Studiobook 16 OLED H7604 | |
| Dell XPS 15 9530 RTX 4070 | |
| Schenker Vision 16 Pro RTX 3070 Ti | |
| R Benchmark 2.5 / Overall mean | |
| Samsung Galaxy Book3 Ultra 16, i9-13900H RTX 4070 | |
| Genomsnitt Intel Core i7-13700H (0.4308 - 0.607, n=29) | |
| Genomsnitt av klass Multimedia (0.3604 - 0.947, n=55, senaste 2 åren) | |
| Schenker Vision 16 Pro RTX 3070 Ti | |
| MSI Stealth 16 Studio A13VG | |
| Dell XPS 15 9530 RTX 4070 | |
| Schenker VISION 16 Pro (M23) | |
| Asus ProArt Studiobook 16 OLED H7604 | |
* ... mindre är bättre
AIDA64: FP32 Ray-Trace | FPU Julia | CPU SHA3 | CPU Queen | FPU SinJulia | FPU Mandel | CPU AES | CPU ZLib | FP64 Ray-Trace | CPU PhotoWorxx
| Performance rating | |
| Asus ProArt Studiobook 16 OLED H7604 | |
| MSI Stealth 16 Studio A13VG | |
| Genomsnitt av klass Multimedia | |
| Schenker VISION 16 Pro (M23) | |
| Dell XPS 15 9530 RTX 4070 | |
| Genomsnitt Intel Core i7-13700H | |
| Samsung Galaxy Book3 Ultra 16, i9-13900H RTX 4070 | |
| Schenker Vision 16 Pro RTX 3070 Ti | |
| AIDA64 / FP32 Ray-Trace | |
| Asus ProArt Studiobook 16 OLED H7604 | |
| MSI Stealth 16 Studio A13VG | |
| Genomsnitt av klass Multimedia (2214 - 50388, n=53, senaste 2 åren) | |
| Samsung Galaxy Book3 Ultra 16, i9-13900H RTX 4070 | |
| Dell XPS 15 9530 RTX 4070 | |
| Genomsnitt Intel Core i7-13700H (4986 - 18908, n=29) | |
| Schenker VISION 16 Pro (M23) | |
| Schenker Vision 16 Pro RTX 3070 Ti | |
| AIDA64 / FPU Julia | |
| Asus ProArt Studiobook 16 OLED H7604 | |
| MSI Stealth 16 Studio A13VG | |
| Genomsnitt av klass Multimedia (12867 - 201874, n=53, senaste 2 åren) | |
| Schenker VISION 16 Pro (M23) | |
| Genomsnitt Intel Core i7-13700H (25360 - 92359, n=29) | |
| Dell XPS 15 9530 RTX 4070 | |
| Schenker Vision 16 Pro RTX 3070 Ti | |
| Samsung Galaxy Book3 Ultra 16, i9-13900H RTX 4070 | |
| AIDA64 / CPU SHA3 | |
| Asus ProArt Studiobook 16 OLED H7604 | |
| MSI Stealth 16 Studio A13VG | |
| Genomsnitt av klass Multimedia (626 - 8623, n=53, senaste 2 åren) | |
| Samsung Galaxy Book3 Ultra 16, i9-13900H RTX 4070 | |
| Genomsnitt Intel Core i7-13700H (1339 - 4224, n=29) | |
| Schenker VISION 16 Pro (M23) | |
| Dell XPS 15 9530 RTX 4070 | |
| Schenker Vision 16 Pro RTX 3070 Ti | |
| AIDA64 / CPU Queen | |
| Asus ProArt Studiobook 16 OLED H7604 | |
| MSI Stealth 16 Studio A13VG | |
| Dell XPS 15 9530 RTX 4070 | |
| Schenker VISION 16 Pro (M23) | |
| Genomsnitt Intel Core i7-13700H (59324 - 107159, n=29) | |
| Schenker Vision 16 Pro RTX 3070 Ti | |
| Samsung Galaxy Book3 Ultra 16, i9-13900H RTX 4070 | |
| Genomsnitt av klass Multimedia (13483 - 181505, n=40, senaste 2 åren) | |
| AIDA64 / FPU SinJulia | |
| Asus ProArt Studiobook 16 OLED H7604 | |
| MSI Stealth 16 Studio A13VG | |
| Schenker VISION 16 Pro (M23) | |
| Genomsnitt Intel Core i7-13700H (4800 - 11050, n=29) | |
| Dell XPS 15 9530 RTX 4070 | |
| Genomsnitt av klass Multimedia (886 - 28794, n=53, senaste 2 åren) | |
| Schenker Vision 16 Pro RTX 3070 Ti | |
| Samsung Galaxy Book3 Ultra 16, i9-13900H RTX 4070 | |
| AIDA64 / FPU Mandel | |
| Asus ProArt Studiobook 16 OLED H7604 | |
| MSI Stealth 16 Studio A13VG | |
| Genomsnitt av klass Multimedia (6395 - 105740, n=53, senaste 2 åren) | |
| Samsung Galaxy Book3 Ultra 16, i9-13900H RTX 4070 | |
| Genomsnitt Intel Core i7-13700H (12321 - 45118, n=29) | |
| Dell XPS 15 9530 RTX 4070 | |
| Schenker VISION 16 Pro (M23) | |
| Schenker Vision 16 Pro RTX 3070 Ti | |
| AIDA64 / CPU AES | |
| Asus ProArt Studiobook 16 OLED H7604 | |
| MSI Stealth 16 Studio A13VG | |
| Genomsnitt Intel Core i7-13700H (28769 - 151254, n=29) | |
| Schenker VISION 16 Pro (M23) | |
| Genomsnitt av klass Multimedia (8171 - 126790, n=53, senaste 2 åren) | |
| Dell XPS 15 9530 RTX 4070 | |
| Schenker Vision 16 Pro RTX 3070 Ti | |
| Samsung Galaxy Book3 Ultra 16, i9-13900H RTX 4070 | |
| AIDA64 / CPU ZLib | |
| Asus ProArt Studiobook 16 OLED H7604 | |
| MSI Stealth 16 Studio A13VG | |
| Samsung Galaxy Book3 Ultra 16, i9-13900H RTX 4070 | |
| Genomsnitt av klass Multimedia (143.8 - 2022, n=53, senaste 2 åren) | |
| Schenker VISION 16 Pro (M23) | |
| Genomsnitt Intel Core i7-13700H (389 - 1215, n=29) | |
| Dell XPS 15 9530 RTX 4070 | |
| Schenker Vision 16 Pro RTX 3070 Ti | |
| AIDA64 / FP64 Ray-Trace | |
| Asus ProArt Studiobook 16 OLED H7604 | |
| MSI Stealth 16 Studio A13VG | |
| Genomsnitt av klass Multimedia (1014 - 26875, n=53, senaste 2 åren) | |
| Dell XPS 15 9530 RTX 4070 | |
| Genomsnitt Intel Core i7-13700H (2540 - 10135, n=29) | |
| Schenker VISION 16 Pro (M23) | |
| Schenker Vision 16 Pro RTX 3070 Ti | |
| Samsung Galaxy Book3 Ultra 16, i9-13900H RTX 4070 | |
| AIDA64 / CPU PhotoWorxx | |
| Genomsnitt av klass Multimedia (8187 - 88154, n=53, senaste 2 åren) | |
| Asus ProArt Studiobook 16 OLED H7604 | |
| Samsung Galaxy Book3 Ultra 16, i9-13900H RTX 4070 | |
| MSI Stealth 16 Studio A13VG | |
| Schenker VISION 16 Pro (M23) | |
| Dell XPS 15 9530 RTX 4070 | |
| Schenker Vision 16 Pro RTX 3070 Ti | |
| Genomsnitt Intel Core i7-13700H (12872 - 52727, n=29) | |
Systemets prestanda
Testresultaten i de syntetiska riktmärkena är mycket bra, men jämförelseenheterna ligger mycket nära varandra och det kommer inte att finnas några märkbara skillnader i den dagliga driften. Det är helt enkelt väldigt responsiva datorer med moderna komponenter. Vi stötte inte på några stabilitetsproblem under våra tester.
CrossMark: Overall | Productivity | Creativity | Responsiveness
| PCMark 10 / Score | |
| Genomsnitt av klass Multimedia (4325 - 10386, n=51, senaste 2 åren) | |
| Asus ProArt Studiobook 16 OLED H7604 | |
| Genomsnitt Intel Core i7-13700H, NVIDIA GeForce RTX 4070 Laptop GPU (7158 - 7956, n=8) | |
| Schenker VISION 16 Pro (M23) | |
| MSI Stealth 16 Studio A13VG | |
| Dell XPS 15 9530 RTX 4070 | |
| Samsung Galaxy Book3 Ultra 16, i9-13900H RTX 4070 | |
| PCMark 10 / Essentials | |
| Dell XPS 15 9530 RTX 4070 | |
| Asus ProArt Studiobook 16 OLED H7604 | |
| Schenker VISION 16 Pro (M23) | |
| Genomsnitt Intel Core i7-13700H, NVIDIA GeForce RTX 4070 Laptop GPU (10252 - 11449, n=8) | |
| Genomsnitt av klass Multimedia (8025 - 11664, n=50, senaste 2 åren) | |
| MSI Stealth 16 Studio A13VG | |
| Samsung Galaxy Book3 Ultra 16, i9-13900H RTX 4070 | |
| PCMark 10 / Productivity | |
| Genomsnitt av klass Multimedia (7323 - 18233, n=50, senaste 2 åren) | |
| Asus ProArt Studiobook 16 OLED H7604 | |
| Schenker VISION 16 Pro (M23) | |
| Genomsnitt Intel Core i7-13700H, NVIDIA GeForce RTX 4070 Laptop GPU (8501 - 10769, n=8) | |
| MSI Stealth 16 Studio A13VG | |
| Dell XPS 15 9530 RTX 4070 | |
| Samsung Galaxy Book3 Ultra 16, i9-13900H RTX 4070 | |
| PCMark 10 / Digital Content Creation | |
| Genomsnitt Intel Core i7-13700H, NVIDIA GeForce RTX 4070 Laptop GPU (10358 - 12908, n=8) | |
| MSI Stealth 16 Studio A13VG | |
| Schenker VISION 16 Pro (M23) | |
| Dell XPS 15 9530 RTX 4070 | |
| Asus ProArt Studiobook 16 OLED H7604 | |
| Genomsnitt av klass Multimedia (3651 - 16240, n=50, senaste 2 åren) | |
| Samsung Galaxy Book3 Ultra 16, i9-13900H RTX 4070 | |
| CrossMark / Overall | |
| Asus ProArt Studiobook 16 OLED H7604 | |
| Apple MacBook Pro 16 2023 M2 Max | |
| Schenker VISION 16 Pro (M23) | |
| Dell XPS 15 9530 RTX 4070 | |
| Genomsnitt Intel Core i7-13700H, NVIDIA GeForce RTX 4070 Laptop GPU (1768 - 2073, n=6) | |
| Genomsnitt av klass Multimedia (866 - 2728, n=59, senaste 2 åren) | |
| MSI Stealth 16 Studio A13VG | |
| Schenker Vision 16 Pro RTX 3070 Ti | |
| Samsung Galaxy Book3 Ultra 16, i9-13900H RTX 4070 | |
| CrossMark / Productivity | |
| Asus ProArt Studiobook 16 OLED H7604 | |
| Schenker VISION 16 Pro (M23) | |
| Genomsnitt Intel Core i7-13700H, NVIDIA GeForce RTX 4070 Laptop GPU (1645 - 2006, n=6) | |
| Genomsnitt av klass Multimedia (931 - 2489, n=59, senaste 2 åren) | |
| Dell XPS 15 9530 RTX 4070 | |
| MSI Stealth 16 Studio A13VG | |
| Apple MacBook Pro 16 2023 M2 Max | |
| Schenker Vision 16 Pro RTX 3070 Ti | |
| Samsung Galaxy Book3 Ultra 16, i9-13900H RTX 4070 | |
| CrossMark / Creativity | |
| Apple MacBook Pro 16 2023 M2 Max | |
| Asus ProArt Studiobook 16 OLED H7604 | |
| Genomsnitt av klass Multimedia (907 - 3465, n=59, senaste 2 åren) | |
| Dell XPS 15 9530 RTX 4070 | |
| Genomsnitt Intel Core i7-13700H, NVIDIA GeForce RTX 4070 Laptop GPU (1936 - 2137, n=6) | |
| Schenker VISION 16 Pro (M23) | |
| MSI Stealth 16 Studio A13VG | |
| Schenker Vision 16 Pro RTX 3070 Ti | |
| Samsung Galaxy Book3 Ultra 16, i9-13900H RTX 4070 | |
| CrossMark / Responsiveness | |
| Asus ProArt Studiobook 16 OLED H7604 | |
| Schenker VISION 16 Pro (M23) | |
| Genomsnitt Intel Core i7-13700H, NVIDIA GeForce RTX 4070 Laptop GPU (1451 - 2202, n=6) | |
| MSI Stealth 16 Studio A13VG | |
| Dell XPS 15 9530 RTX 4070 | |
| Genomsnitt av klass Multimedia (605 - 2024, n=59, senaste 2 åren) | |
| Apple MacBook Pro 16 2023 M2 Max | |
| Schenker Vision 16 Pro RTX 3070 Ti | |
| Samsung Galaxy Book3 Ultra 16, i9-13900H RTX 4070 | |
| PCMark 10 Score | 7368 poäng | |
Hjälp | ||
| AIDA64 / Memory Copy | |
| Genomsnitt av klass Multimedia (11299 - 132135, n=53, senaste 2 åren) | |
| Asus ProArt Studiobook 16 OLED H7604 | |
| Samsung Galaxy Book3 Ultra 16, i9-13900H RTX 4070 | |
| MSI Stealth 16 Studio A13VG | |
| Dell XPS 15 9530 RTX 4070 | |
| Schenker VISION 16 Pro (M23) | |
| Schenker Vision 16 Pro RTX 3070 Ti | |
| Genomsnitt Intel Core i7-13700H (24334 - 78081, n=29) | |
| AIDA64 / Memory Read | |
| Genomsnitt av klass Multimedia (11624 - 174586, n=53, senaste 2 åren) | |
| Asus ProArt Studiobook 16 OLED H7604 | |
| MSI Stealth 16 Studio A13VG | |
| Schenker VISION 16 Pro (M23) | |
| Samsung Galaxy Book3 Ultra 16, i9-13900H RTX 4070 | |
| Dell XPS 15 9530 RTX 4070 | |
| Schenker Vision 16 Pro RTX 3070 Ti | |
| Genomsnitt Intel Core i7-13700H (23681 - 79656, n=29) | |
| AIDA64 / Memory Write | |
| Samsung Galaxy Book3 Ultra 16, i9-13900H RTX 4070 | |
| Genomsnitt av klass Multimedia (11755 - 134998, n=53, senaste 2 åren) | |
| Asus ProArt Studiobook 16 OLED H7604 | |
| MSI Stealth 16 Studio A13VG | |
| Genomsnitt Intel Core i7-13700H (22986 - 99898, n=29) | |
| Dell XPS 15 9530 RTX 4070 | |
| Schenker VISION 16 Pro (M23) | |
| Schenker Vision 16 Pro RTX 3070 Ti | |
| AIDA64 / Memory Latency | |
| Genomsnitt av klass Multimedia (7 - 535, n=52, senaste 2 åren) | |
| Samsung Galaxy Book3 Ultra 16, i9-13900H RTX 4070 | |
| Genomsnitt Intel Core i7-13700H (82.4 - 136.8, n=29) | |
| Schenker Vision 16 Pro RTX 3070 Ti | |
| MSI Stealth 16 Studio A13VG | |
| Dell XPS 15 9530 RTX 4070 | |
| Asus ProArt Studiobook 16 OLED H7604 | |
| Schenker VISION 16 Pro (M23) | |
* ... mindre är bättre
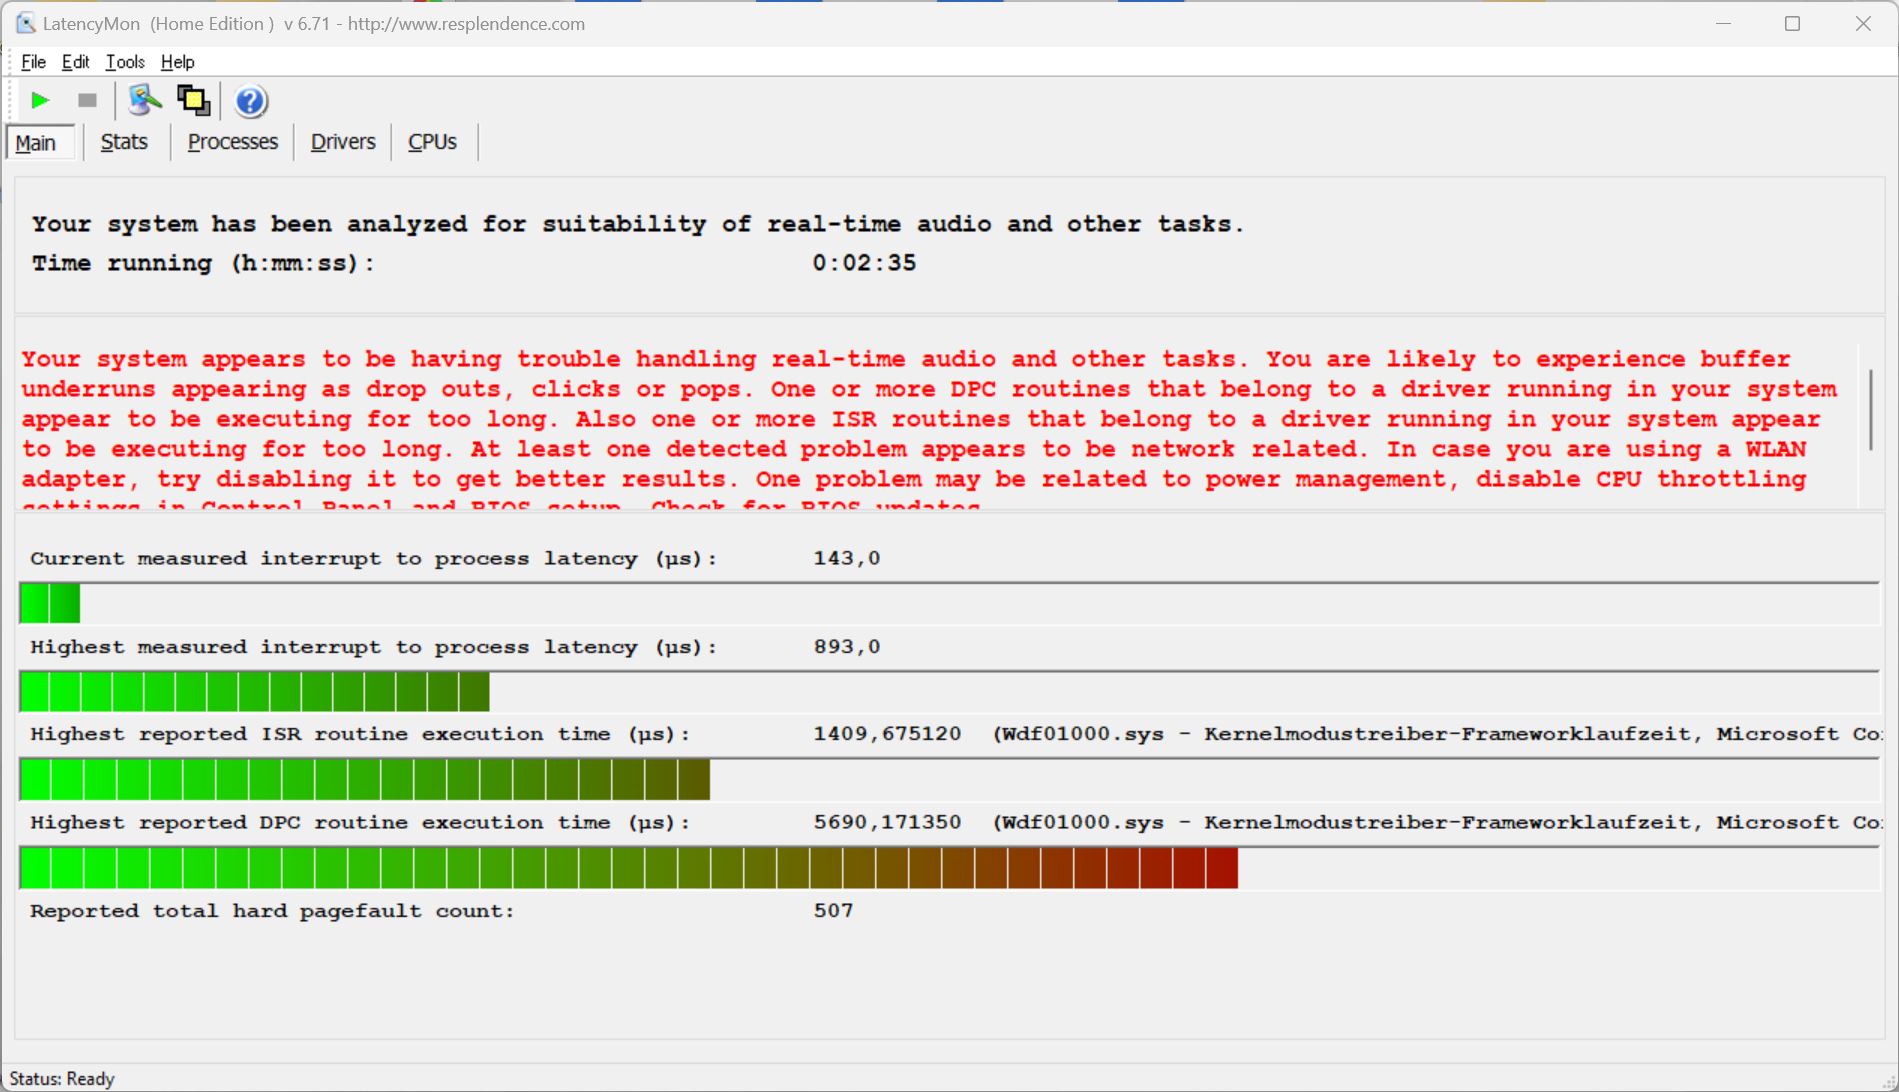
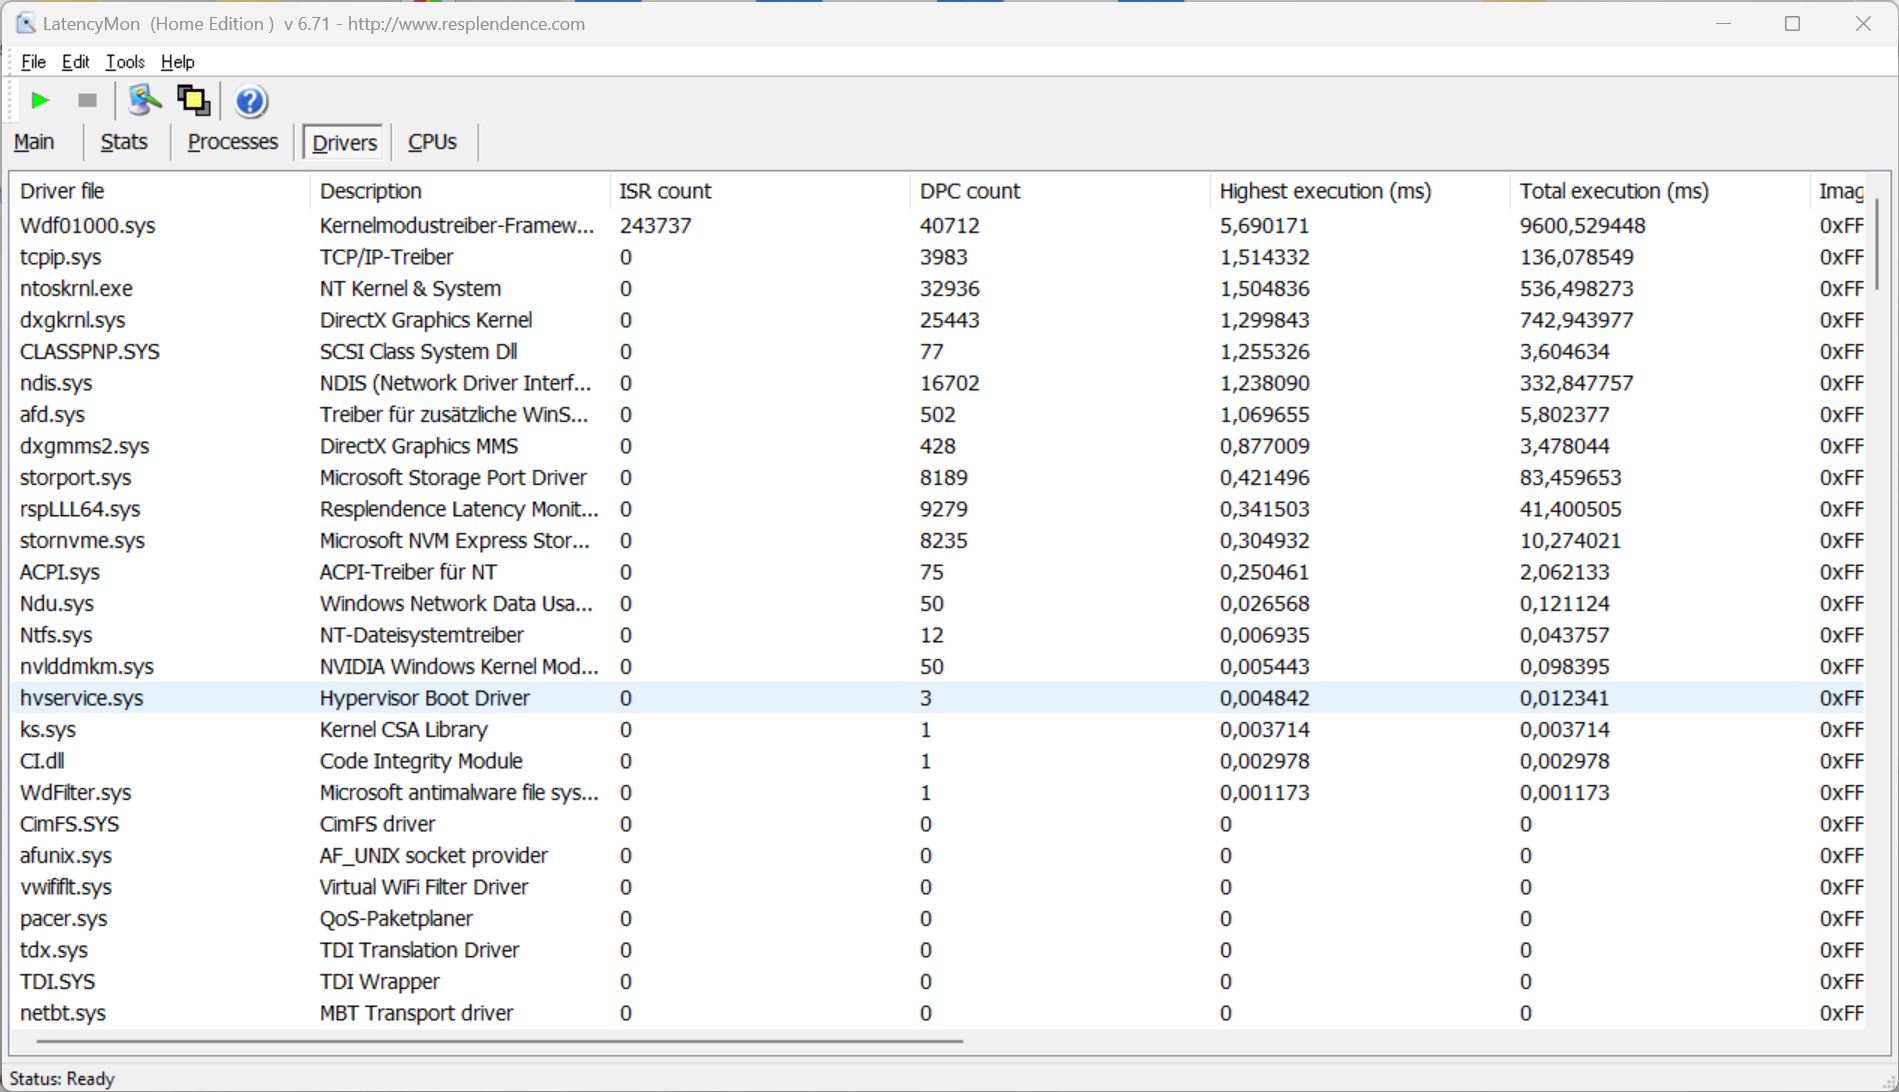
DPC-fördröjningar
I vårt standardiserade latens-test (med surfning på Internet, 4K YouTube-återgivning och CPU-belastning), med den aktuella BIOS-versionen vid tidpunkten för testet, visar vår testenhet några små begränsningar för användning i ljudapplikationer i realtid.
| DPC Latencies / LatencyMon - interrupt to process latency (max), Web, Youtube, Prime95 | |
| MSI Stealth 16 Studio A13VG | |
| Samsung Galaxy Book3 Ultra 16, i9-13900H RTX 4070 | |
| Asus ProArt Studiobook 16 OLED H7604 | |
| Dell XPS 15 9530 RTX 4070 | |
| Schenker VISION 16 Pro (M23) | |
| Schenker Vision 16 Pro RTX 3070 Ti | |
* ... mindre är bättre
Lagringslösning
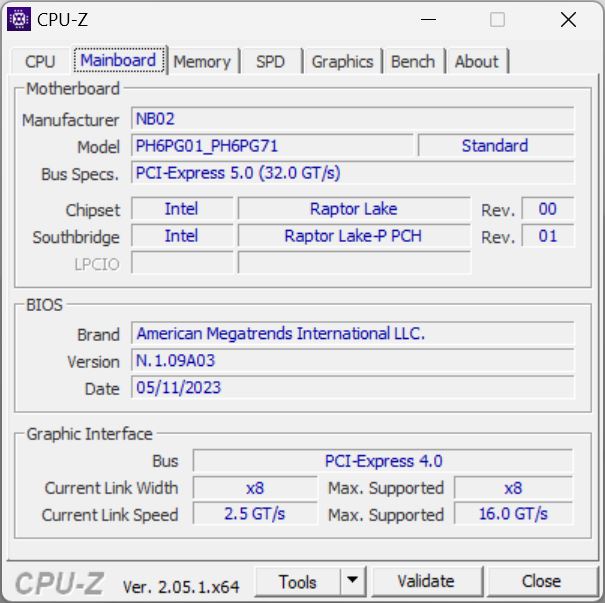
Vision 16 Pro erbjuder två snabba PCIe 4.0-kortplatser för SSD-enheter, där den andra kortplatsen bredvid batteriet endast kan ta en enkelsidig SSD. Vår testenhet använder 1-TB-versionen av Samsung 990 Pro, och efter den första uppstarten är 870 GB lagringsutrymme fortfarande tillgängligt för användaren. Överföringshastigheterna för SSD är mycket höga, och prestandan förblir också helt stabil även efter längre belastningar, vilket inte alls är en given med nuvarande högpresterande SSD-enheter. Du kan hitta ytterligare SSD-riktmärken här.

* ... mindre är bättre
Disk Throttling: DiskSpd Read Loop, Queue Depth 8
Grafikkort - RTX 4070 Laptop
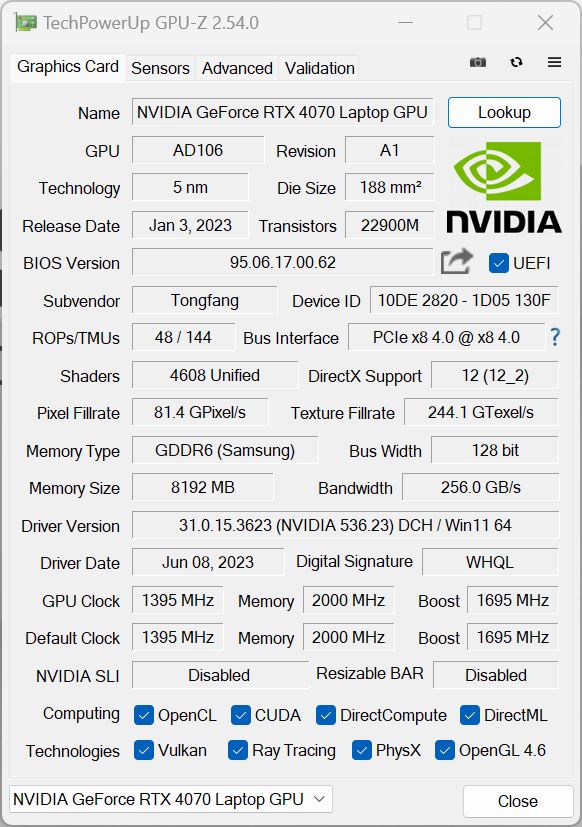
Precis som i förra årets modell används en aktuell Nvidia GPU med en maximal TGP på 95 watt (70W TGP + 25W Dynamic Boost från CPU), men i år är det nya RTX 4070 Laptopanvänds. Men denRTX 4080 bärbar dator, som är den direkta efterföljaren till RTX 3080 i förra årets modell, erbjuds inte längre. Det finns ingen MUX-omkopplare i multimedia-bärbara datorn, så grafikväxling sker regelbundet via Optimus.
Med högst 95 watt är detta en snabb version av RTX 4070 Laptop, eftersom detta är nära det maximala 105 watt som 4070 i allmänhet förbrukar när man spelar. Endast i vissa syntetiska tester som FurMark kan förbrukningen vara högre, men detta spelar ingen roll i praktiken. Du kan också se detta enkelt i 3DMarks, där Schenker Vision 16 Pro praktiskt taget hamnar på samma nivå med ProArt Studiobook 16 som specificerar en TGP på 130 watt för RTX 4070 Laptop. Jämfört med förra årets Vision 16 Promed RTX 3070 Tifinns det en hastighetsökning på cirka 25-30%.
Vår testenhet klarar Time Spy stresstest på 98,2% utan problem, men GPU: s strömförbrukning stryps till 36 watt vid batteridrift. Utan en laddare blir GPU-prestandan därför cirka 40% lägre. Du kan hitta ytterligare GPU-riktmärken här.
| 3DMark 11 Performance | 32729 poäng | |
| 3DMark Fire Strike Score | 24151 poäng | |
| 3DMark Time Spy Score | 11566 poäng | |
Hjälp | ||
| Blender / v3.3 Classroom METAL | |
| Apple MacBook Pro 16 2023 M2 Max | |
| Genomsnitt av klass Multimedia (17.8 - 68, n=5, senaste 2 åren) | |
| Blender / v3.3 Classroom OPTIX/RTX | |
| Genomsnitt av klass Multimedia (12 - 105, n=21, senaste 2 åren) | |
| Dell XPS 15 9530 RTX 4070 | |
| Schenker Vision 16 Pro RTX 3070 Ti | |
| Samsung Galaxy Book3 Ultra 16, i9-13900H RTX 4070 | |
| MSI Stealth 16 Studio A13VG | |
| Schenker VISION 16 Pro (M23) | |
| Asus ProArt Studiobook 16 OLED H7604 | |
| Genomsnitt NVIDIA GeForce RTX 4070 Laptop GPU (18 - 30, n=68) | |
| Blender / v3.3 Classroom CUDA | |
| Genomsnitt av klass Multimedia (20 - 186, n=21, senaste 2 åren) | |
| Dell XPS 15 9530 RTX 4070 | |
| Schenker Vision 16 Pro RTX 3070 Ti | |
| Samsung Galaxy Book3 Ultra 16, i9-13900H RTX 4070 | |
| MSI Stealth 16 Studio A13VG | |
| Asus ProArt Studiobook 16 OLED H7604 | |
| Schenker VISION 16 Pro (M23) | |
| Genomsnitt NVIDIA GeForce RTX 4070 Laptop GPU (32 - 50, n=67) | |
| Blender / v3.3 Classroom CPU | |
| Schenker Vision 16 Pro RTX 3070 Ti | |
| Samsung Galaxy Book3 Ultra 16, i9-13900H RTX 4070 | |
| Genomsnitt av klass Multimedia (134.5 - 1042, n=61, senaste 2 åren) | |
| Schenker VISION 16 Pro (M23) | |
| Dell XPS 15 9530 RTX 4070 | |
| Apple MacBook Pro 16 2023 M2 Max | |
| MSI Stealth 16 Studio A13VG | |
| Genomsnitt NVIDIA GeForce RTX 4070 Laptop GPU (158 - 440, n=67) | |
| Asus ProArt Studiobook 16 OLED H7604 | |
* ... mindre är bättre
Spelprestanda
Den relativt låga CPU-prestandan kan ha en negativ effekt på spelprestanda, eftersom Vision 16 Pro-prestandan ibland sjunker här, jämfört med andra bärbara datorer med RTX 4070 Laptop. Men i grunden är prestandan helt tillräcklig för att även spela moderna spel som Cyberpunk 2077 eller Star Wars: Jedi Survivor smidigt i QHD-upplösning, och den förblir också stabil under längre spelsessioner.
| The Witcher 3 - 1920x1080 Ultra Graphics & Postprocessing (HBAO+) | |
| MSI Stealth 16 Studio A13VG | |
| Asus ProArt Studiobook 16 OLED H7604 | |
| Schenker VISION 16 Pro (M23) | |
| Schenker Vision 16 Pro RTX 3070 Ti | |
| Samsung Galaxy Book3 Ultra 16, i9-13900H RTX 4070 | |
| Dell XPS 15 9530 RTX 4070 | |
| Genomsnitt av klass Multimedia (11 - 107, n=5, senaste 2 åren) | |
The Witcher 3 FPS Chart
| låg | med. | hög | ultra | QHD | |
|---|---|---|---|---|---|
| GTA V (2015) | 170 | 156.9 | 96.5 | 80.6 | |
| The Witcher 3 (2015) | 226 | 105.4 | |||
| Dota 2 Reborn (2015) | 178.4 | 161.3 | 152.4 | 143.8 | |
| Final Fantasy XV Benchmark (2018) | 175.3 | 143.2 | 109 | 81.6 | |
| X-Plane 11.11 (2018) | 154.8 | 138.4 | 109.7 | ||
| Far Cry 5 (2018) | 168 | 134 | 127 | 120 | 108 |
| Strange Brigade (2018) | 362 | 270 | 223 | 196.7 | 131.6 |
| F1 2021 (2021) | 339 | 276 | 234 | 133.1 | 104.3 |
| Cyberpunk 2077 1.6 (2022) | 106 | 102 | 101 | 82 | 52 |
| F1 22 (2022) | 220 | 183 | 72.6 | 47 | |
| Star Wars Jedi Survivor (2023) | 84 | 76 | 72 | 67 | 44 |
Utsläpp - bullriga fläktar vid full effekt
Utsläpp av buller
Du kan konfigurera i BIOS om de två fläktarna ska köras konstant med låg hastighet eller inte, vilket har fördelen att toppbelastningar kan hanteras bättre. Även om det här alternativet var aktiverat i vår testenhet stod fläktarna stilla i många fall, även i det snabbaste prestandaläget. Fläktarna blir bara tydligt hörbara under belastning, när GPU spelar en större roll på grund av den högre strömförbrukningen. Med cirka 53 dB(A) vid spel och i stresstestet blir Vision 16 Pro nu faktiskt ungefär lika högljudd som föregångaren i Turbo-läge. Vi listar mätningarna för de olika lägena i följande tabell:
| Användningsområde | Tyst | Prestanda Balanserad | Prestanda Entusiast |
|---|---|---|---|
| 3DMark 06 | 37,7 dB(A) | 47,2 dB(A) | 47,2 dB(A) |
| Witcher 3 | 37.7 dB(A) | 49,9 dB(A) | 53,1 dB(A) |
| Stresstest | 40,6 dB(A) | 49,9 dB(A) | 53,1 dB(A) |
Särskilt vid daglig användning och även med vissa äldre eller inte lika krävande spel är det värt att byta till tyst läge (antingen via Control Center eller med F3-tangenten), eftersom prestandan fortfarande kommer att vara tillräcklig och fläktarna förblir då betydligt tystare vid cirka 38 till 40 dB (A). Vi noterade inga andra elektroniska ljud i vår testenhet.
Ljudnivå
| Låg belastning |
| 25.9 / 25.9 / 32 dB(A) |
| Hög belastning |
| 47.2 / 53.1 dB(A) |
 | ||
30 dB tyst 40 dB(A) hörbar 50 dB(A) högt ljud |
||
min: | ||
| Schenker VISION 16 Pro (M23) GeForce RTX 4070 Laptop GPU, i7-13700H, Samsung 990 Pro 1 TB | Samsung Galaxy Book3 Ultra 16, i9-13900H RTX 4070 GeForce RTX 4070 Laptop GPU, i9-13900H, Samsung PM9A1 MZVL21T0HCLR | MSI Stealth 16 Studio A13VG GeForce RTX 4070 Laptop GPU, i7-13700H, Micron 3400 2TB MTFDKBA2T0TFH | Dell XPS 15 9530 RTX 4070 GeForce RTX 4070 Laptop GPU, i7-13700H, SK hynix PC801 HFS001TEJ9X101N | Asus ProArt Studiobook 16 OLED H7604 GeForce RTX 4070 Laptop GPU, i9-13980HX, Phison EM2804TBMTCB47 | Apple MacBook Pro 16 2023 M2 Max M2 Max 38-Core GPU, M2 Max, Apple SSD AP2048Z | Schenker Vision 16 Pro RTX 3070 Ti GeForce RTX 3070 Ti Laptop GPU, i7-12700H, Samsung SSD 980 Pro 1TB MZ-V8P1T0BW | |
|---|---|---|---|---|---|---|---|
| Noise | 6% | 13% | 20% | 4% | 18% | 11% | |
| av / miljö * (dB) | 25.9 | 25.2 3% | 24 7% | 23.1 11% | 24.5 5% | 23.9 8% | 22.9 12% |
| Idle Minimum * (dB) | 25.9 | 25.2 3% | 24 7% | 23.1 11% | 24.5 5% | 23.9 8% | 24.3 6% |
| Idle Average * (dB) | 25.9 | 25.2 3% | 24 7% | 23.1 11% | 24.5 5% | 23.9 8% | 24.3 6% |
| Idle Maximum * (dB) | 32 | 31.3 2% | 24 25% | 24.2 24% | 24.5 23% | 23.9 25% | 24.3 24% |
| Load Average * (dB) | 47.2 | 38.8 18% | 34.81 26% | 27.1 43% | 47.6 -1% | 36.6 22% | 38.5 18% |
| Witcher 3 ultra * (dB) | 53.1 | 44.05 17% | 40.1 24% | 55.9 -5% | 35.1 34% | 51 4% | |
| Load Maximum * (dB) | 53.1 | 51.2 4% | 51.57 3% | 44.6 16% | 56.7 -7% | 43.2 19% | 51 4% |
* ... mindre är bättre
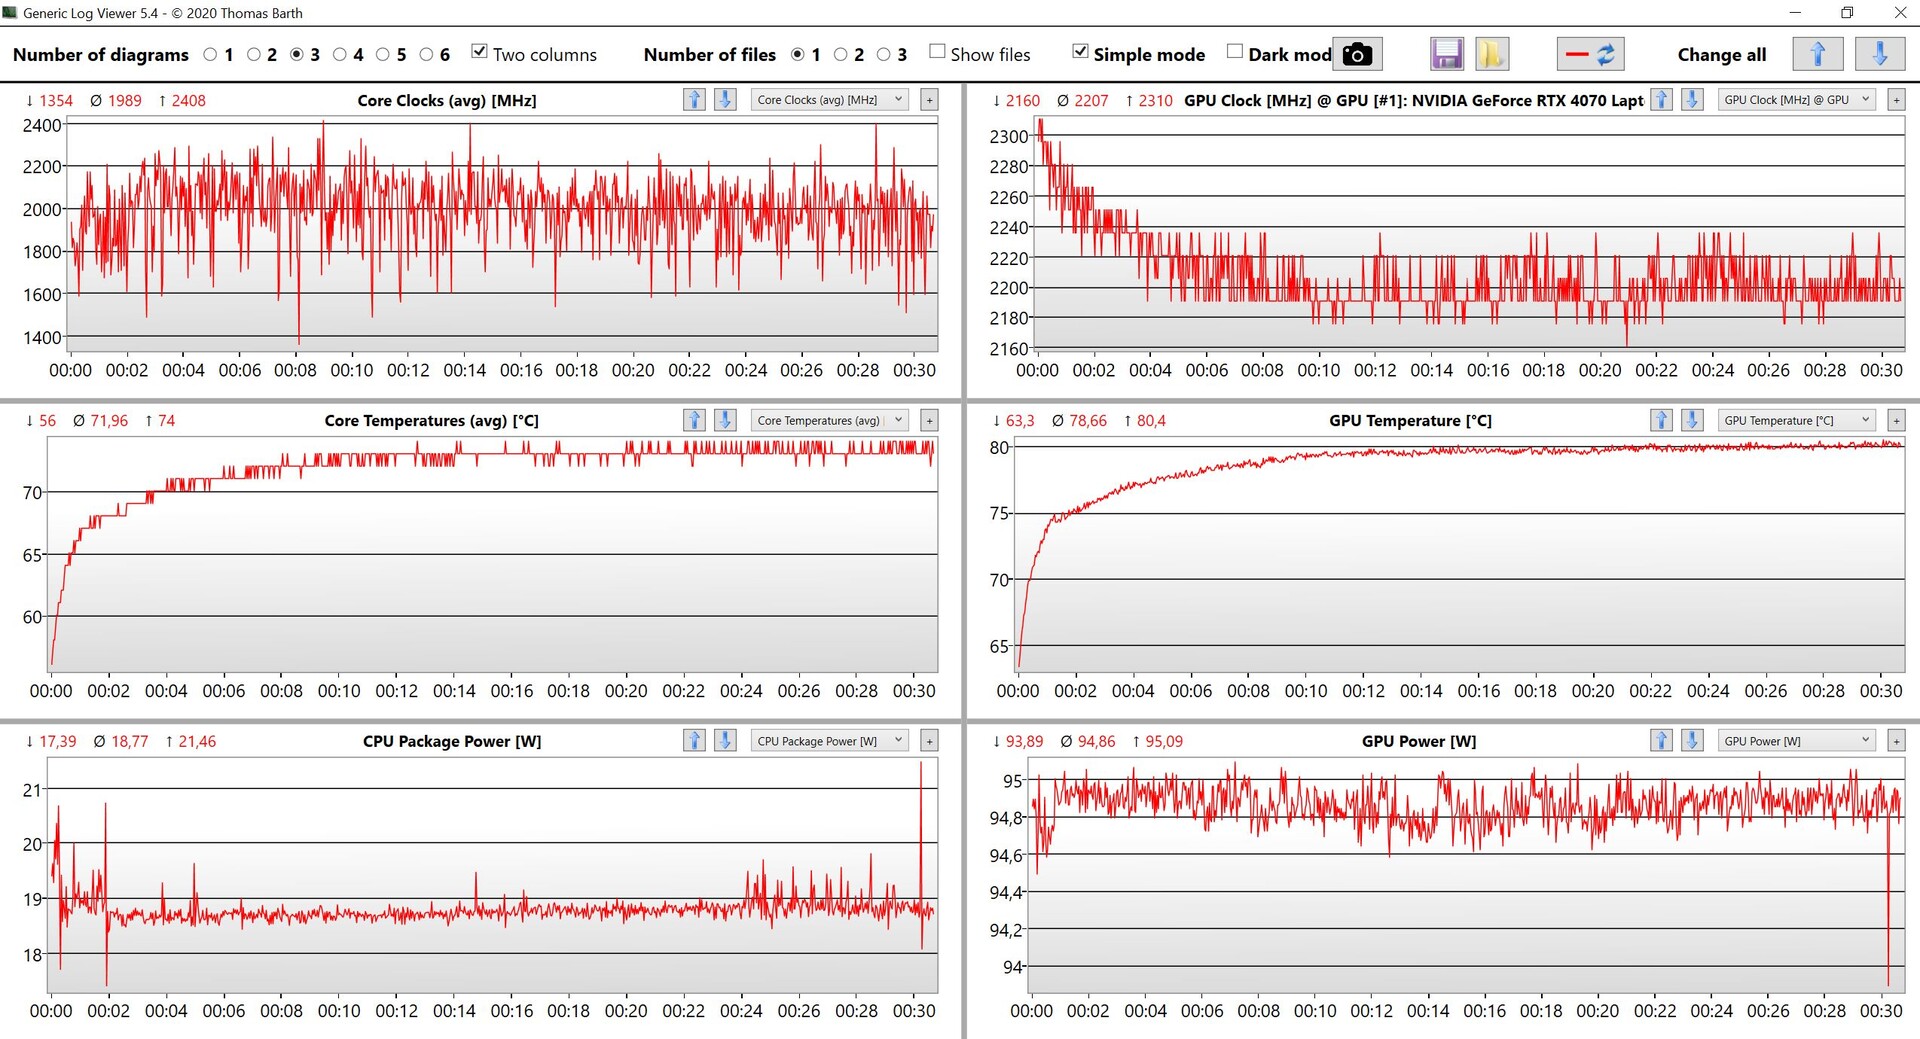
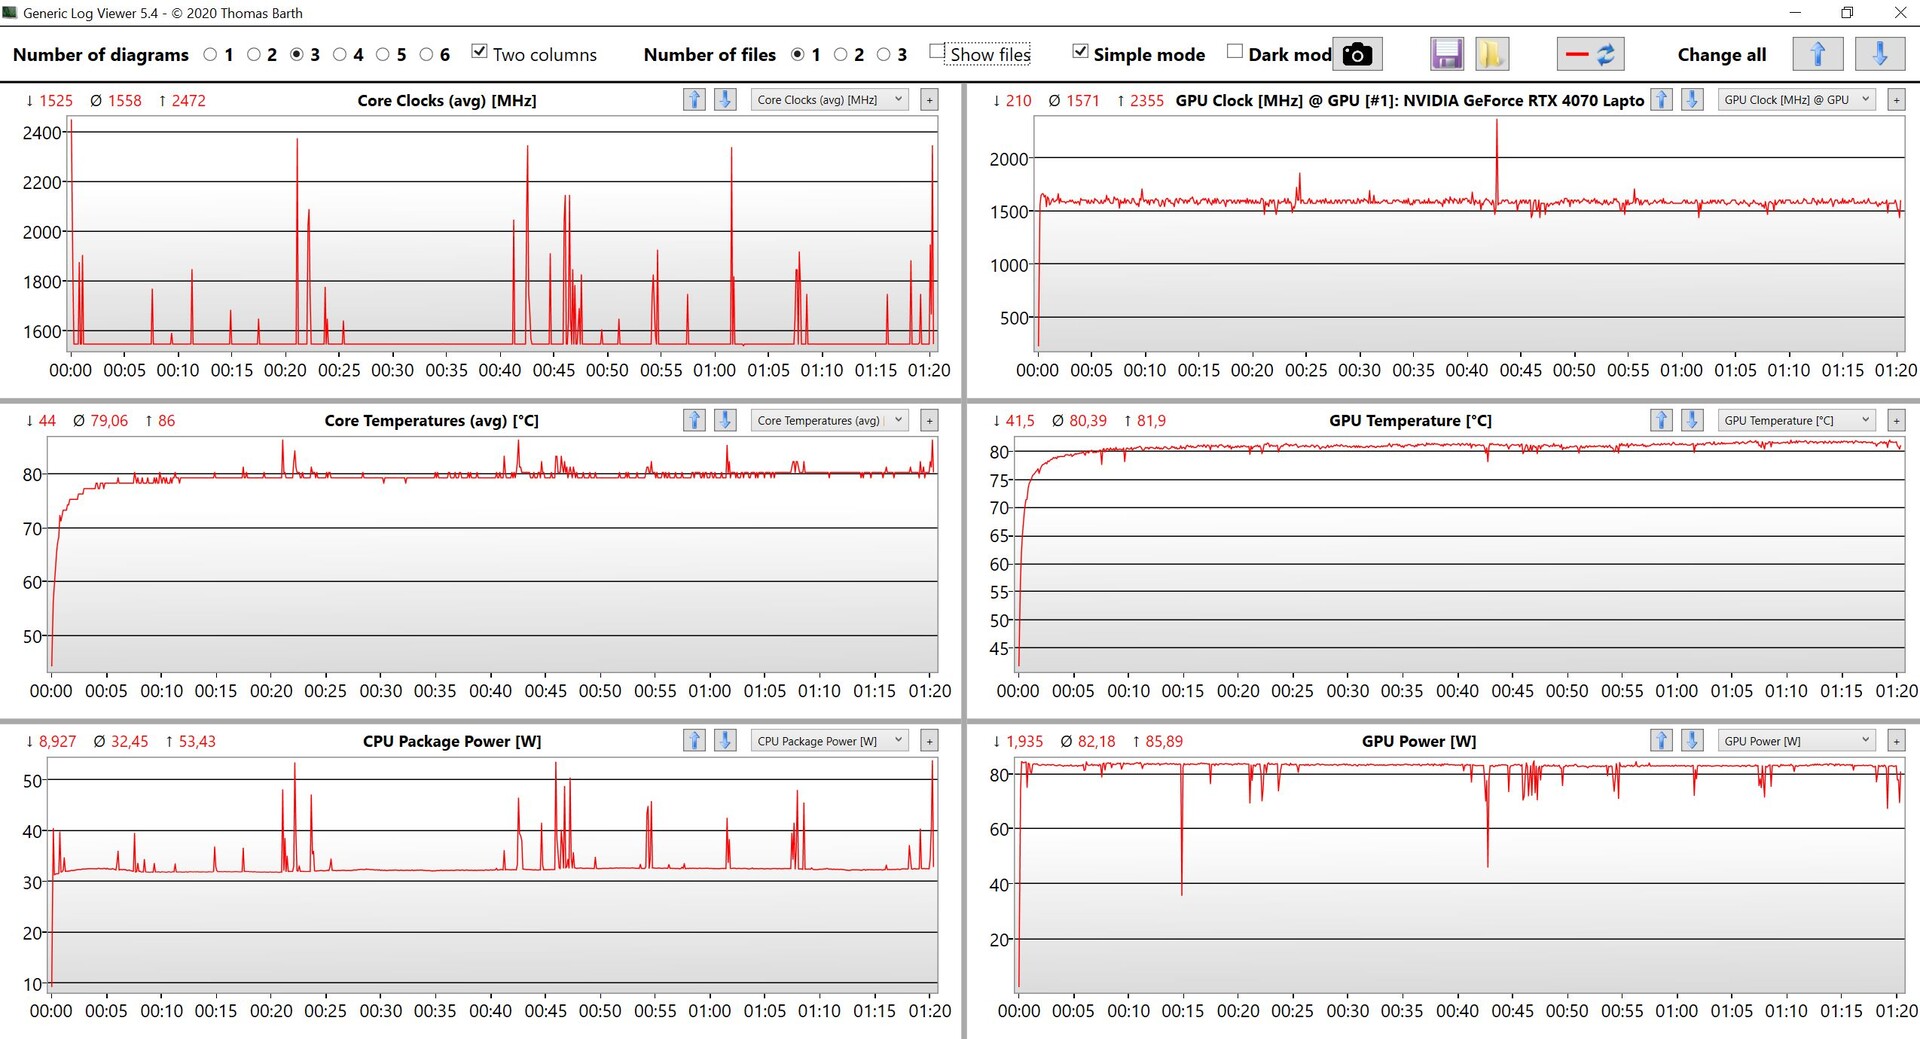
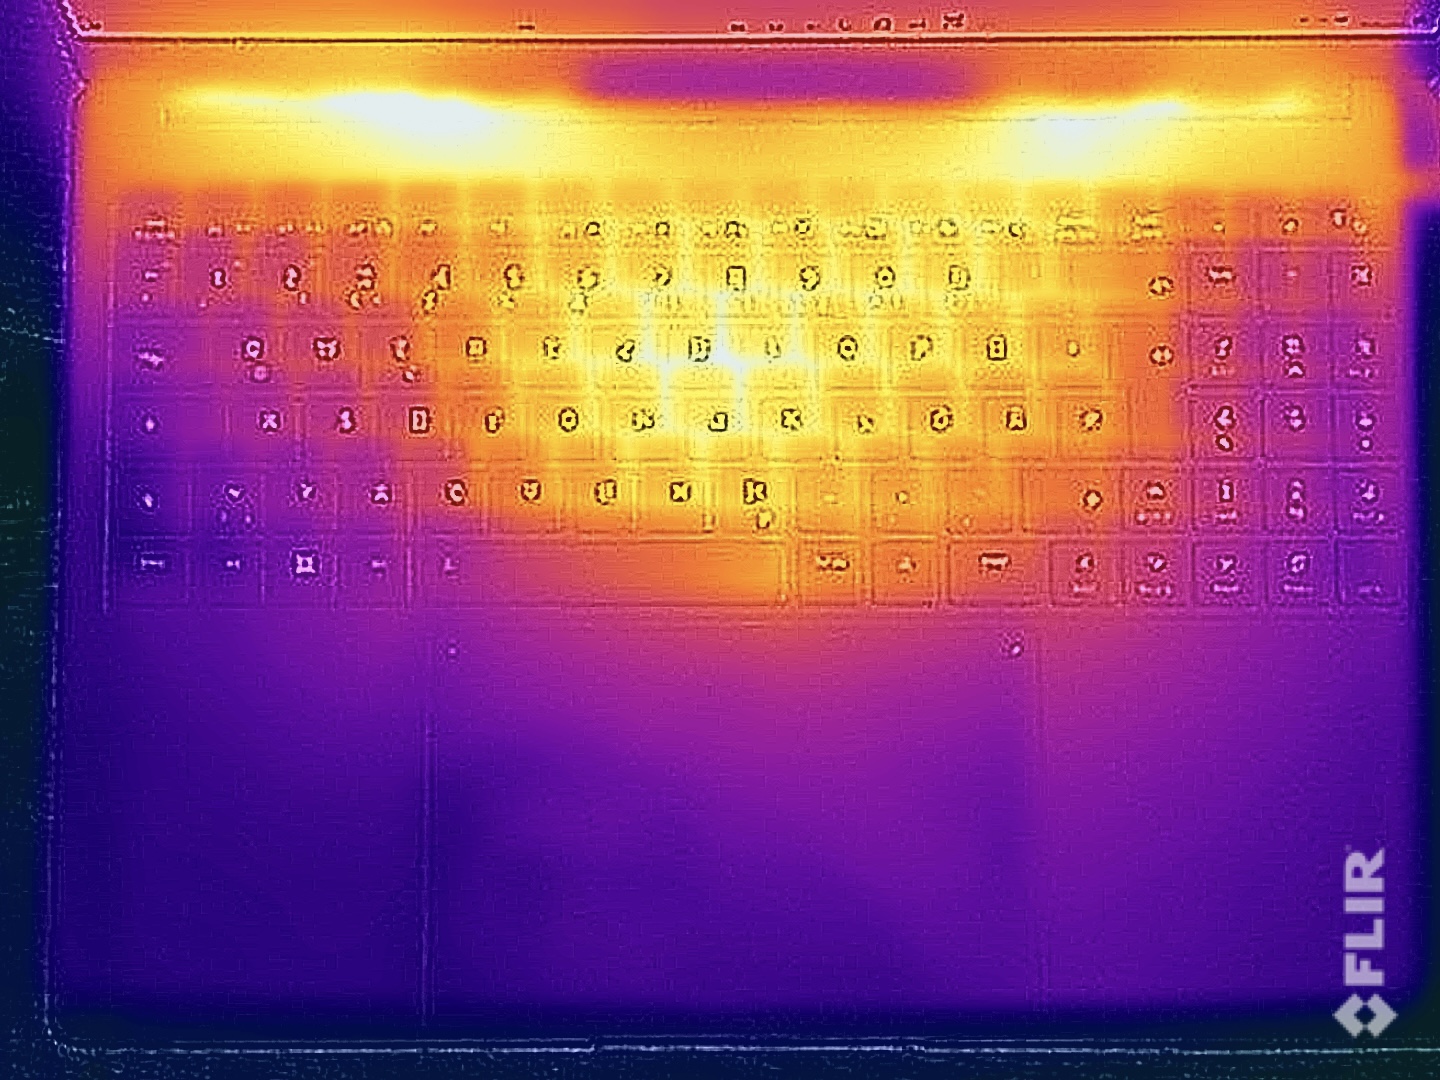
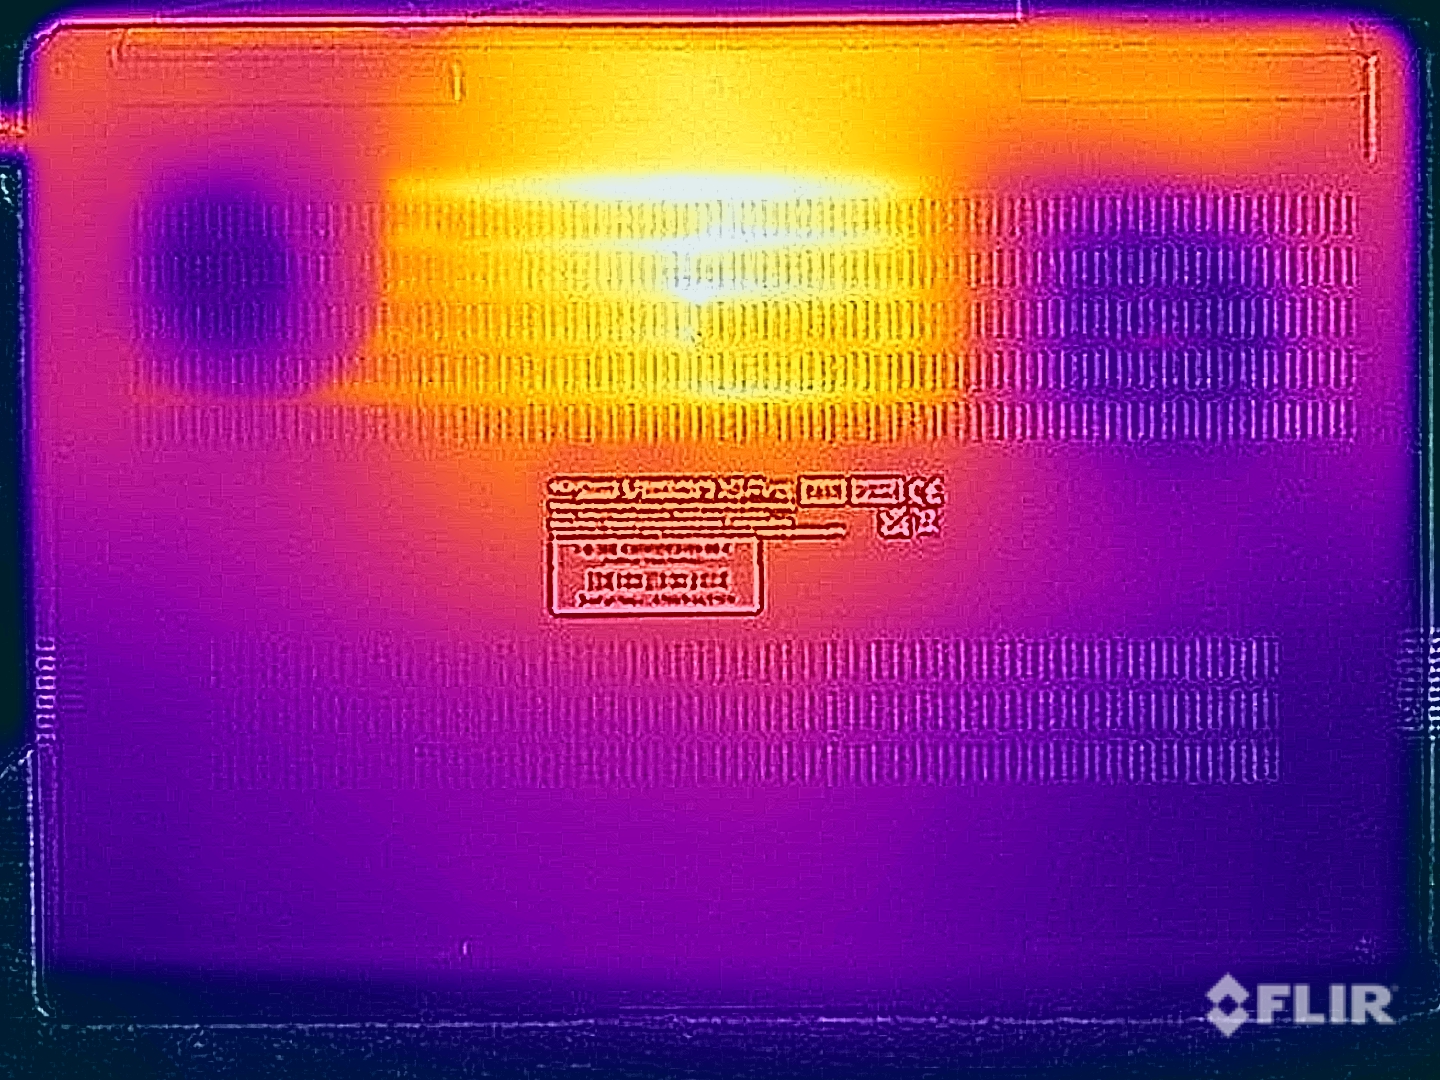
Temperaturer
Även om det inte finns några temperaturproblem vid daglig användning, bör du inte placera enheten i knät när du spelar eller under hög belastning för komponenterna. I extremfallet mäter vi temperaturer på över 50 °C (122 °F) i det centrala området längst ned. Det centrala området på tangentbordet värms också upp till mer än 45 °C (113 °F), vilket märks när du skriver. Men de typiska WASD-tangenterna förblir betydligt svalare, vilket hjälper till under spel. Den betydligt mer kompakta laddaren blir bara marginellt varmare än den gamla modellen, och det är inga problem med en maximal temperatur på 44 °C (111 °F).
Under stresstestet prioriteras grafikkortet eftersom det körs stabilt på cirka 82 watt. Processorn, å andra sidan, planar snabbt ut på cirka ~32 watt. Sammantaget är detta ett hyfsat resultat för en så tunn enhet.
(-) Den maximala temperaturen på ovansidan är 46.7 °C / 116 F, jämfört med genomsnittet av 36.8 °C / 98 F , allt från 21 till 71 °C för klassen Multimedia.
(-) Botten värms upp till maximalt 54.1 °C / 129 F, jämfört med genomsnittet av 39.1 °C / 102 F
(+) Vid tomgångsbruk är medeltemperaturen för ovansidan 24.7 °C / 76 F, jämfört med enhetsgenomsnittet på 31.3 °C / ### class_avg_f### F.
(±) När du spelar The Witcher 3 är medeltemperaturen för ovansidan 37.7 °C / 100 F, jämfört med enhetsgenomsnittet på 31.3 °C / ## #class_avg_f### F.
(+) Handledsstöden och pekplattan är kallare än hudtemperaturen med maximalt 28 °C / 82.4 F och är därför svala att ta på.
(±) Medeltemperaturen för handledsstödsområdet på liknande enheter var 28.7 °C / 83.7 F (+0.7 °C / 1.3 F).
| Schenker VISION 16 Pro (M23) Intel Core i7-13700H, NVIDIA GeForce RTX 4070 Laptop GPU | Samsung Galaxy Book3 Ultra 16, i9-13900H RTX 4070 Intel Core i9-13900H, NVIDIA GeForce RTX 4070 Laptop GPU | MSI Stealth 16 Studio A13VG Intel Core i7-13700H, NVIDIA GeForce RTX 4070 Laptop GPU | Dell XPS 15 9530 RTX 4070 Intel Core i7-13700H, NVIDIA GeForce RTX 4070 Laptop GPU | Asus ProArt Studiobook 16 OLED H7604 Intel Core i9-13980HX, NVIDIA GeForce RTX 4070 Laptop GPU | Apple MacBook Pro 16 2023 M2 Max Apple M2 Max, Apple M2 Max 38-Core GPU | Schenker Vision 16 Pro RTX 3070 Ti Intel Core i7-12700H, NVIDIA GeForce RTX 3070 Ti Laptop GPU | |
|---|---|---|---|---|---|---|---|
| Heat | -10% | -32% | -8% | -9% | 15% | 1% | |
| Maximum Upper Side * (°C) | 46.7 | 45.9 2% | 60 -28% | 45.6 2% | 44.1 6% | 44.2 5% | 50.8 -9% |
| Maximum Bottom * (°C) | 54.1 | 50.9 6% | 61 -13% | 42 22% | 48 11% | 42.9 21% | 46.3 14% |
| Idle Upper Side * (°C) | 26.5 | 31.6 -19% | 38.2 -44% | 34.4 -30% | 32.7 -23% | 22.4 15% | 27.2 -3% |
| Idle Bottom * (°C) | 26.8 | 34.2 -28% | 37.7 -41% | 33.2 -24% | 34.9 -30% | 22.3 17% | 26.6 1% |
* ... mindre är bättre
Högtalare
Inget har förändrats i högtalarsystemet, och särskilt de höga frekvenserna är mycket exakta. Sammantaget är prestandan också anständig här, men Vision 16 Pro kan fortfarande inte nå den utmärkta prestandan hosMacBook Pro 16.
Schenker VISION 16 Pro (M23) ljudanalys
(±) | högtalarljudstyrkan är genomsnittlig men bra (77.6 dB)
Bas 100 - 315 Hz
(±) | reducerad bas - i genomsnitt 14.7% lägre än medianen
(-) | basen är inte linjär (15% delta till föregående frekvens)
Mellan 400 - 2000 Hz
(+) | balanserad mellan - endast 3.1% från medianen
(+) | mids är linjära (4.6% delta till föregående frekvens)
Högsta 2 - 16 kHz
(+) | balanserade toppar - endast 1.3% från medianen
(+) | toppar är linjära (4.1% delta till föregående frekvens)
Totalt 100 - 16 000 Hz
(+) | det totala ljudet är linjärt (13.1% skillnad mot median)
Jämfört med samma klass
» 26% av alla testade enheter i den här klassen var bättre, 5% liknande, 69% sämre
» Den bästa hade ett delta på 5%, genomsnittet var 17%, sämst var 45%
Jämfört med alla testade enheter
» 13% av alla testade enheter var bättre, 3% liknande, 84% sämre
» Den bästa hade ett delta på 4%, genomsnittet var 23%, sämst var 134%
Apple MacBook Pro 16 2023 M2 Max ljudanalys
(+) | högtalare kan spela relativt högt (86.1 dB)
Bas 100 - 315 Hz
(+) | bra bas - bara 3.9% från medianen
(+) | basen är linjär (5.7% delta till föregående frekvens)
Mellan 400 - 2000 Hz
(+) | balanserad mellan - endast 1.2% från medianen
(+) | mids är linjära (1.5% delta till föregående frekvens)
Högsta 2 - 16 kHz
(+) | balanserade toppar - endast 2.5% från medianen
(+) | toppar är linjära (1.7% delta till föregående frekvens)
Totalt 100 - 16 000 Hz
(+) | det totala ljudet är linjärt (4.9% skillnad mot median)
Jämfört med samma klass
» 0% av alla testade enheter i den här klassen var bättre, 0% liknande, 99% sämre
» Den bästa hade ett delta på 5%, genomsnittet var 17%, sämst var 45%
Jämfört med alla testade enheter
» 0% av alla testade enheter var bättre, 0% liknande, 100% sämre
» Den bästa hade ett delta på 4%, genomsnittet var 23%, sämst var 134%
Energihantering - Förbättrad batteritid
Strömförbrukning
I våra mätningar av förbrukningen visar sig den nya 2023-modellen vara något mer effektiv hela tiden, med endast den maximala förbrukningen på 173 watt som är praktiskt taget identisk. Men detta värde sjunker snabbt till cirka 150 watt (även under spel), så den medföljande 180-wattsladdaren är tillräckligt stor. För övrigt är den inte bara betydligt mer kompakt nu, utan också mycket lättare (489 vs. 811 gram, 17,2 vs. 28,6 oz).
| Av/Standby | |
| Låg belastning | |
| Hög belastning |
|
Förklaring:
min: | |
| Schenker VISION 16 Pro (M23) i7-13700H, GeForce RTX 4070 Laptop GPU, Samsung 990 Pro 1 TB, IPS, 2560x1600, 16" | Samsung Galaxy Book3 Ultra 16, i9-13900H RTX 4070 i9-13900H, GeForce RTX 4070 Laptop GPU, Samsung PM9A1 MZVL21T0HCLR, OLED / AMOLED, 2880x1800, 16" | MSI Stealth 16 Studio A13VG i7-13700H, GeForce RTX 4070 Laptop GPU, Micron 3400 2TB MTFDKBA2T0TFH, IPS, 2560x1600, 16" | Dell XPS 15 9530 RTX 4070 i7-13700H, GeForce RTX 4070 Laptop GPU, SK hynix PC801 HFS001TEJ9X101N, OLED, 3456x2160, 15.6" | Asus ProArt Studiobook 16 OLED H7604 i9-13980HX, GeForce RTX 4070 Laptop GPU, Phison EM2804TBMTCB47, OLED, 3200x2000, 16" | Apple MacBook Pro 16 2023 M2 Max M2 Max, M2 Max 38-Core GPU, Apple SSD AP2048Z, Mini-LED, 3456x2234, 16.2" | Schenker Vision 16 Pro RTX 3070 Ti i7-12700H, GeForce RTX 3070 Ti Laptop GPU, Samsung SSD 980 Pro 1TB MZ-V8P1T0BW, IPS, 2560x1600, 16" | Genomsnitt NVIDIA GeForce RTX 4070 Laptop GPU | Genomsnitt av klass Multimedia | |
|---|---|---|---|---|---|---|---|---|---|
| Power Consumption | 28% | -28% | -38% | -53% | -3% | -12% | -50% | 21% | |
| Idle Minimum * (Watt) | 8.6 | 4.3 50% | 11 -28% | 20 -133% | 12.8 -49% | 5.2 40% | 9 -5% | 13.2 ? -53% | 5.62 ? 35% |
| Idle Average * (Watt) | 12 | 4.6 62% | 18 -50% | 20.7 -73% | 19.9 -66% | 16.5 -38% | 13.3 -11% | 18.2 ? -52% | 10.2 ? 15% |
| Idle Maximum * (Watt) | 12.4 | 11.4 8% | 19 -53% | 22.4 -81% | 20.3 -64% | 16.8 -35% | 14.3 -15% | 24.6 ? -98% | 12.5 ? -1% |
| Load Average * (Watt) | 80 | 97 -21% | 91 -14% | 77.1 4% | 131.4 -64% | 113 -41% | 107 -34% | 97 ? -21% | 65 ? 19% |
| Witcher 3 ultra * (Watt) | 147.7 | 100.9 32% | 130 12% | 95.4 35% | 196.5 -33% | 92 38% | 155.2 -5% | ||
| Load Maximum * (Watt) | 173.1 | 107 38% | 228 -32% | 133.4 23% | 246.8 -43% | 145 16% | 172 1% | 221 ? -28% | 111.9 ? 35% |
* ... mindre är bättre
Power Consumption The Witcher 3 / Stress Test
Power Consumption With External Monitor
Batteritid
I enlighet med de något effektivare förbrukningsvärdena visar sig batteritiden också vara något bättre. Vid en justerad ljusstyrka på 150 cd / m² (motsvarande 39% av den maximala ljusstyrkan för vår testenhet) körs vårt WLAN-test i något längre än 7,5 timmar med både 60 eller 240 Hz, vilket gör Vision 16 Pro 2023 betydligt mer konkurrenskraftig. Endast MacBook Pro 16 spelar i en annan liga och varar nästan 15 timmar här. Videotestet vid 150 cd/m² pågår också i nästan 8 timmar.
Vid maximal ljusstyrka gör uppdateringsfrekvensen en skillnad, eftersom WLAN-testet vid 240 Hz körs i knappt 6 timmar, medan det fortfarande är mer än 7 timmar vid 60 Hz. Vi skulle gärna se att Schenker, precis som i den mindre Vision 14, även kunde erbjuda en version av Vision 16 Pro med ett större batteri och utan den sekundära M.2-platsen.
| Schenker VISION 16 Pro (M23) i7-13700H, GeForce RTX 4070 Laptop GPU, 80 Wh | Samsung Galaxy Book3 Ultra 16, i9-13900H RTX 4070 i9-13900H, GeForce RTX 4070 Laptop GPU, 76 Wh | MSI Stealth 16 Studio A13VG i7-13700H, GeForce RTX 4070 Laptop GPU, 99.9 Wh | Dell XPS 15 9530 RTX 4070 i7-13700H, GeForce RTX 4070 Laptop GPU, 86 Wh | Asus ProArt Studiobook 16 OLED H7604 i9-13980HX, GeForce RTX 4070 Laptop GPU, 90 Wh | Apple MacBook Pro 16 2023 M2 Max M2 Max, M2 Max 38-Core GPU, 99.6 Wh | Schenker Vision 16 Pro RTX 3070 Ti i7-12700H, GeForce RTX 3070 Ti Laptop GPU, 80 Wh | Genomsnitt av klass Multimedia | |
|---|---|---|---|---|---|---|---|---|
| Batteridrifttid | -4% | 28% | 9% | -22% | 72% | -15% | 67% | |
| H.264 (h) | 7.8 | 9 15% | 7.7 -1% | 6 -23% | 18.7 140% | 6.1 -22% | 16.8 ? 115% | |
| WiFi v1.3 (h) | 7.8 | 8 3% | 7.8 0% | 8 3% | 5.6 -28% | 14.8 90% | 6 -23% | 12.3 ? 58% |
| Load (h) | 1.3 | 0.9 -31% | 2.4 85% | 1.5 15% | 1.1 -15% | 1.1 -15% | 1.3 0% | 1.645 ? 27% |
För
Emot
Slutsats - Vision 16 Pro fortsätter att vara imponerande lätt och slimmad
Medan den nya 2023-modellen av Vision 16 Pro innehåller de förväntade uppdateringarna med en Intel Raptor Lake-processor och den nya Nvidia GeForce RTX 4070 Laptop, finns det också några ytterligare justeringar i effektprofilerna. Vision 16 Pro är ett av de sällsynta fallen där 45-wattsprocessorn verkligen körs med det värdet utan att den kortsiktiga effektgränsen är absurt hög. Detta innebär att prestandan förblir ganska konstant och temperaturerna inte hoppar upp lika snabbt, men samtidigt är prestandan också något lägre, särskilt i korta riktmärken. Detta spelar dock ingen roll i den dagliga driften. Å andra sidan förstår vi inte riktigt varför Schenker tog bort det manuella eller Turbo-läget som tillät dig att justera CPU: s TDP-värden. I den tidigare modellen tillät detta dig också att ytterligare öka CPU-prestandan märkbart.
Vid samma maximala TGP på 95 watt levererar den nya GeForce RTX 4070 Laptop cirka 25-30% mer prestanda än den gamla RTX 3070 Ti, men det finns ingen direkt efterträdare till den gamla RTX 3080. Utöver detta finns det få anledningar att klaga på prestandan överlag, och överföringshastigheterna för den snabba PCIe 4.0 SSD förblir också konstanta. Vi förstår dock inte varför det nu finns en betydligt långsammare kortläsare.
Schenker Vision 16 Pro erbjuder mycket prestanda i ett mycket smalt och lätt fodral, även i 2023-versionen. Trots det finns det inga kompromisser i anslutningarna eller underhållsalternativen.
Den matta IPS-skärmen med 240 Hz levererar subjektivt en bra bildkvalitet, och med den medföljande kalibrerade profilen från Schenker kan du också åtgärda färgtonen, men den låga färgrymdstäckningen och bristen på HDR-stöd är fortfarande nackdelar. Men åtminstone PWM används inte.
Visningsalternativen är också de största fördelarna med konkurrenterna, som ofta erbjuder OLED- eller MiniLED-paneler. Huruvida detta alltid är bättre (nyckelord: PWM) är tveksamt, men det subjektiva bildintrycket är något bättre och det finns fördelar i färgrymden och HDR. Den rena CPU-prestandan (multi-core) är också ofta bättre med konkurrenterna, men särskilt i grafikprestanda behöver Vision 16 Pro inte gömma sig bakom Asus ProArt Studiobook 16 eller MSI Stealth 16 Studio jämförelseenheter. Särskilt denDell XPS 15med 50-Watt-versionen av RTX 4070 Laptop faller betydligt bakom i detta avseende.
Pris och tillgänglighet
Nya Vision 16 Pro M23 kan konfigureras på Bestware från 2 099 euro (~$2,361). För vår testkonfiguration med uppgraderingar till RTX 4070 bärbar datoroch mer RAM och SSD-lagring, måste du betala cirka 2 600 euro (~ 2 924 USD).
Schenker VISION 16 Pro (M23)
- 07/18/2023 v7 (old)
Andreas Osthoff
Genomskinlighet
Valet av enheter som ska granskas görs av vår redaktion. Testprovet gavs till författaren som ett lån av tillverkaren eller återförsäljaren för denna recension. Långivaren hade inget inflytande på denna recension och inte heller fick tillverkaren en kopia av denna recension innan publiceringen. Det fanns ingen skyldighet att publicera denna recension. Som ett oberoende medieföretag är Notebookcheck inte föremål för auktoritet från tillverkare, återförsäljare eller förlag.
This is how Notebookcheck is testingEvery year, Notebookcheck independently reviews hundreds of laptops and smartphones using standardized procedures to ensure that all results are comparable. We have continuously developed our test methods for around 20 years and set industry standards in the process. In our test labs, high-quality measuring equipment is utilized by experienced technicians and editors. These tests involve a multi-stage validation process. Our complex rating system is based on hundreds of well-founded measurements and benchmarks, which maintains objectivity.
Price comparison

