Recension av Lenovo ThinkPad P1 G4 laptop: BIOS-uppdatering ger mer CPU-prestanda
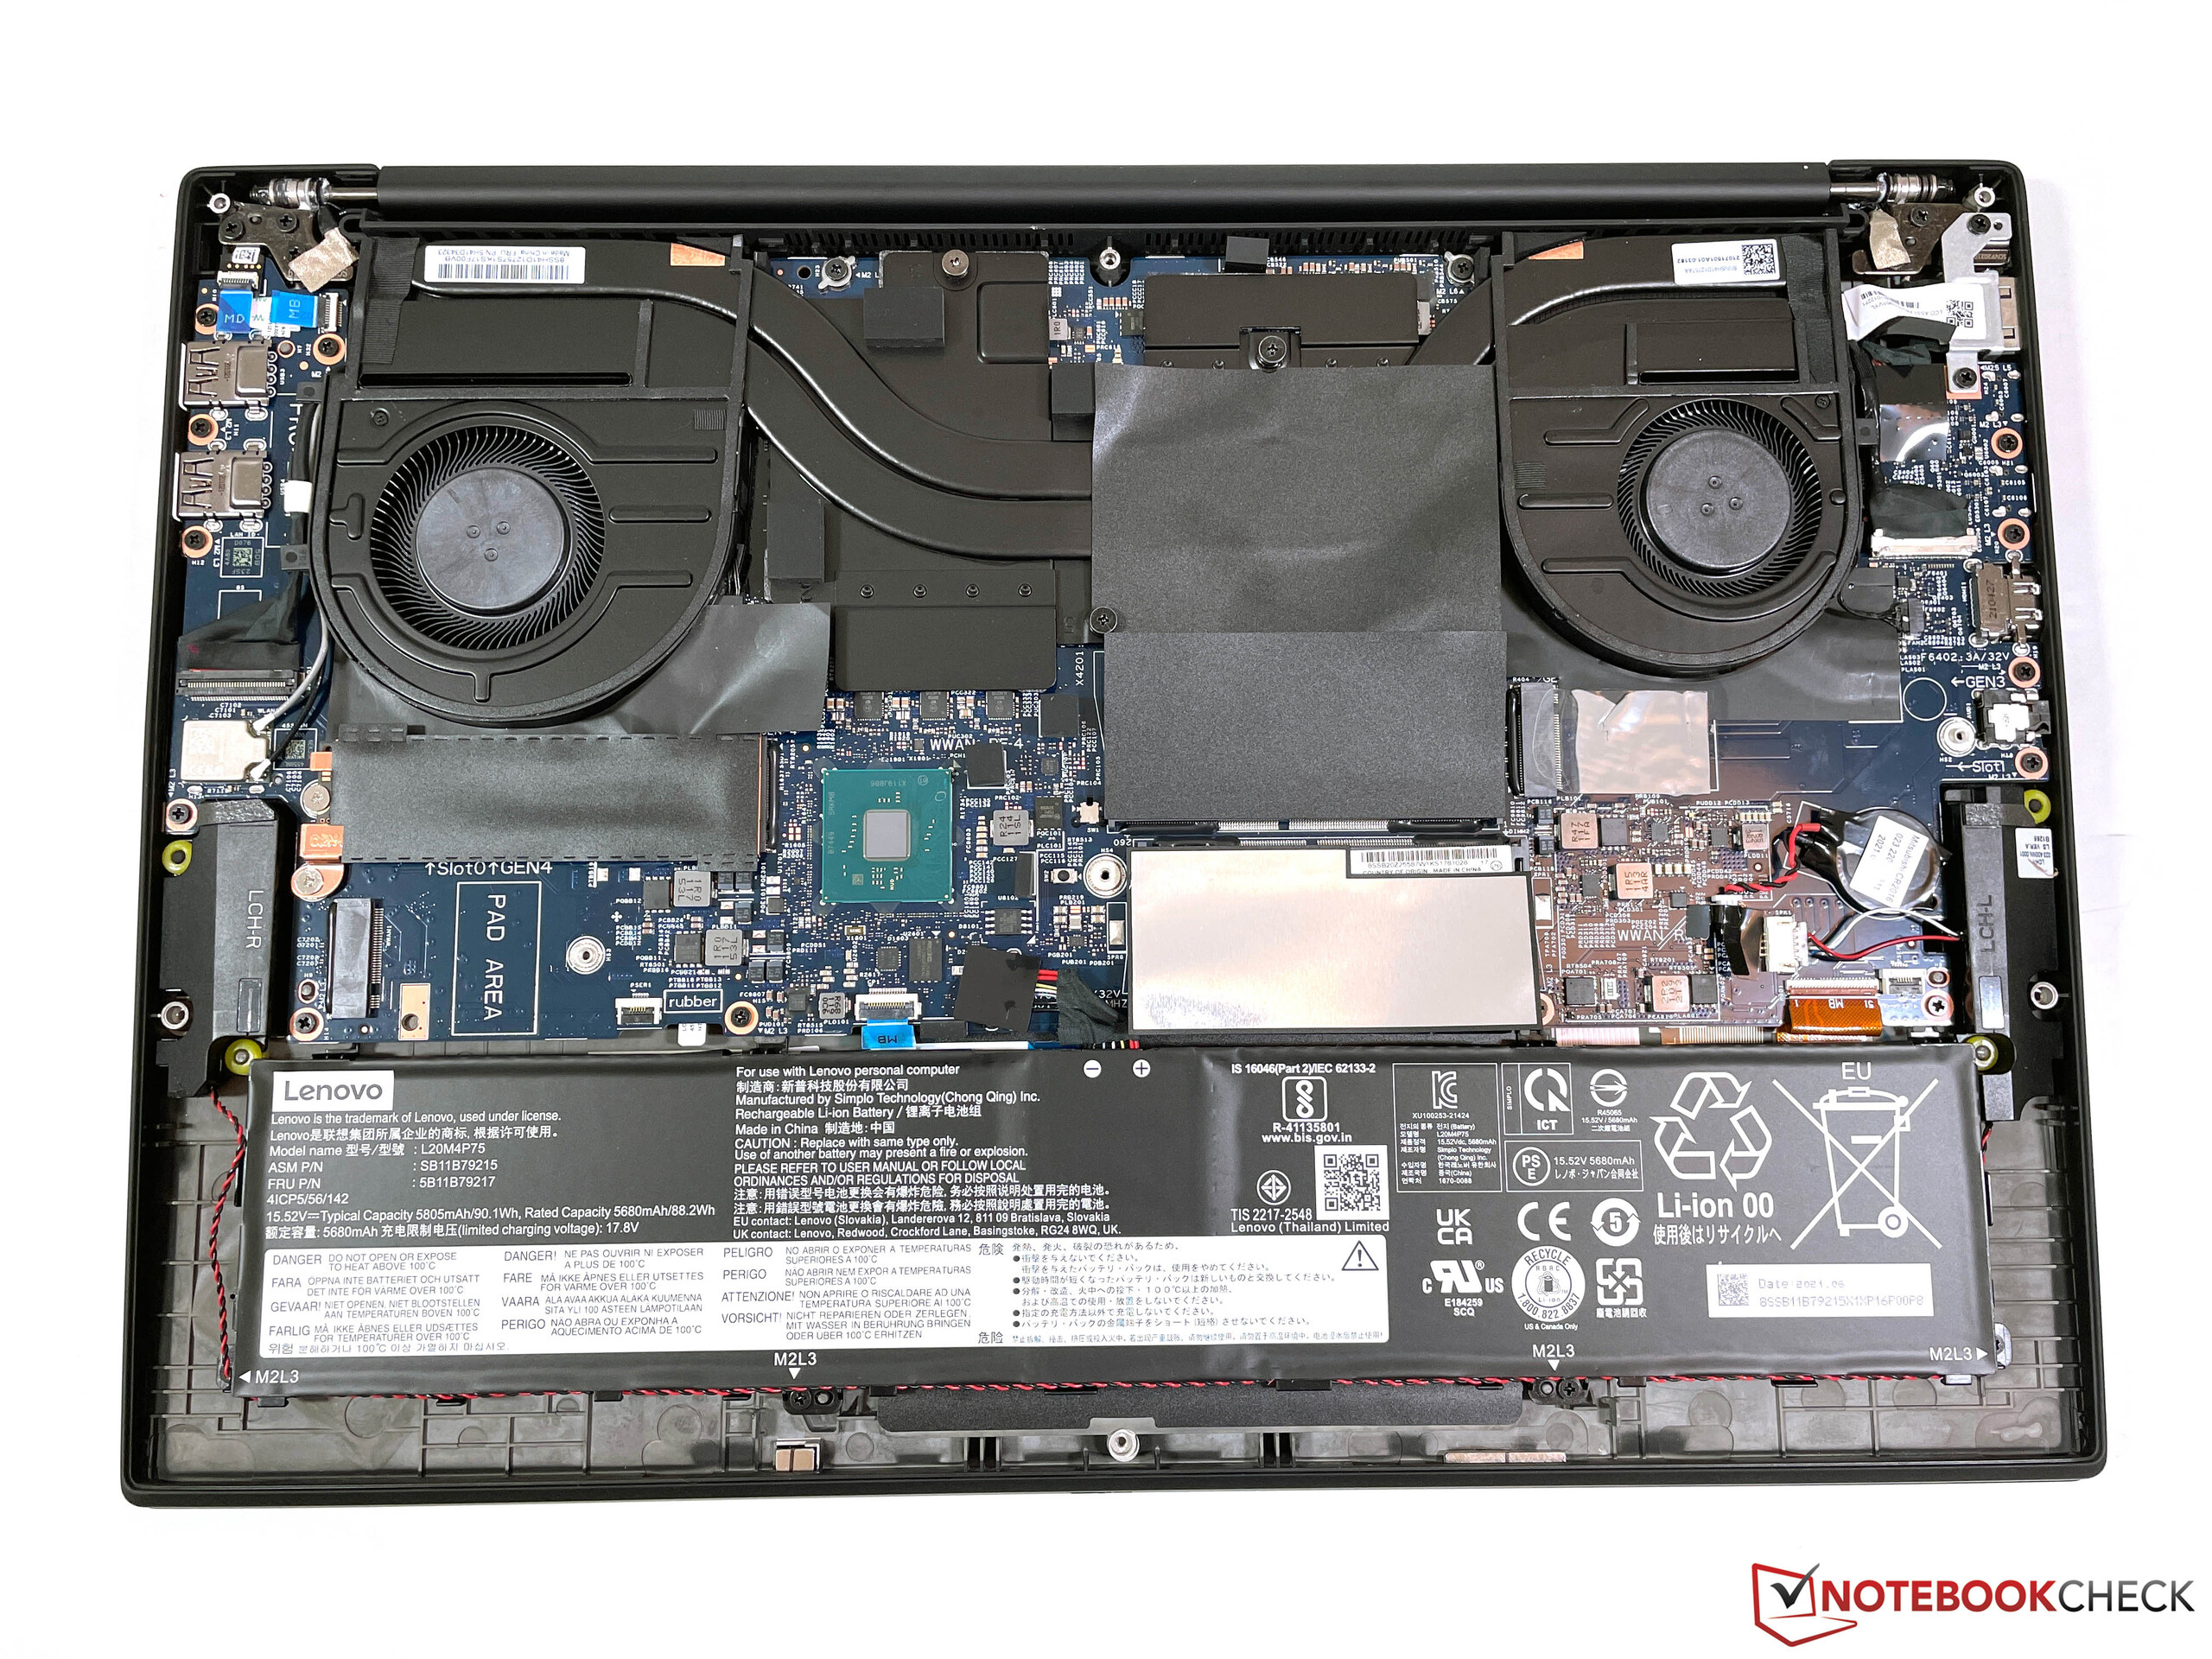
Den nuvarande versionen av ThinkPad P1 G4 och den identiskt byggda ThinkPad X1 Extreme G4 finns med två olika kylningslösningar. Konfigurationer med snabbare grafikkort (från RTX 3060eller motsvarandeRTX A3000) använder en mer kapabel ångkammarkylning.
I vår första granskningsenhet av ThinkPad P1 G4 med konventionell kylning blev vi besvikna på processorns prestanda. Nu har vi samma konfiguration på redaktionen igen och vi ville kontrollera om CPU-prestandan har förbättrats under tiden med den senaste BIOS (version 1.13).
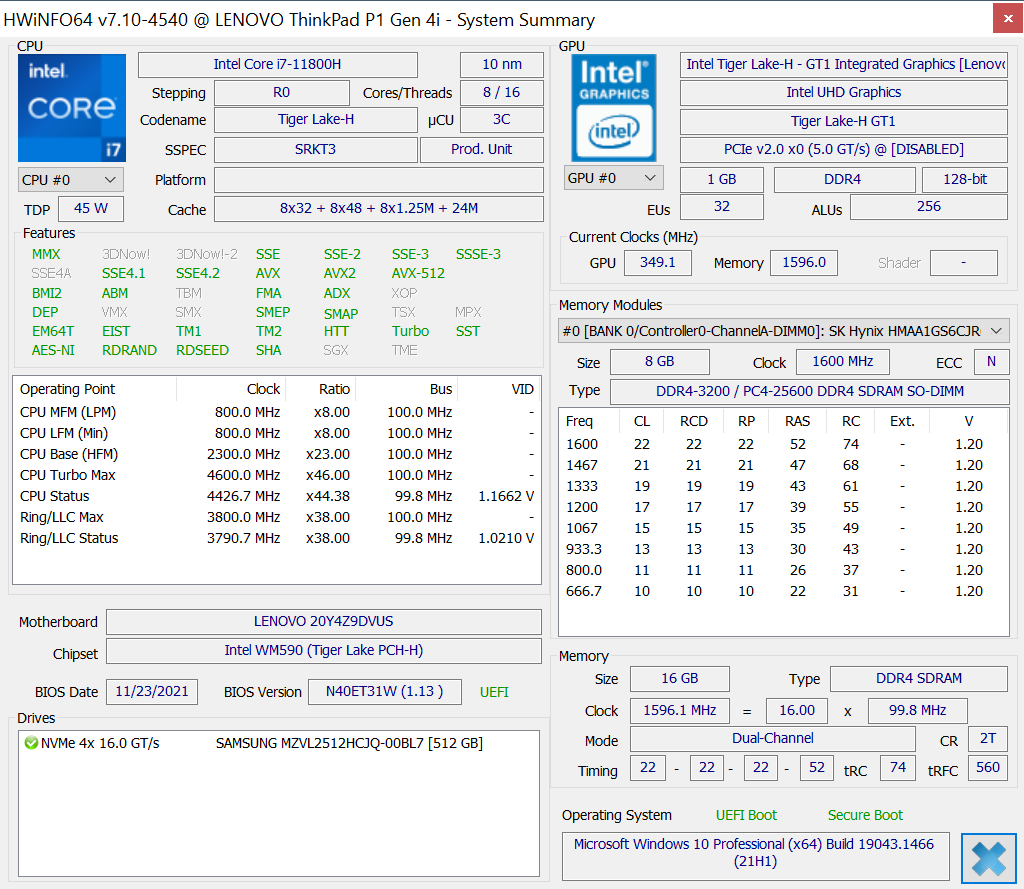
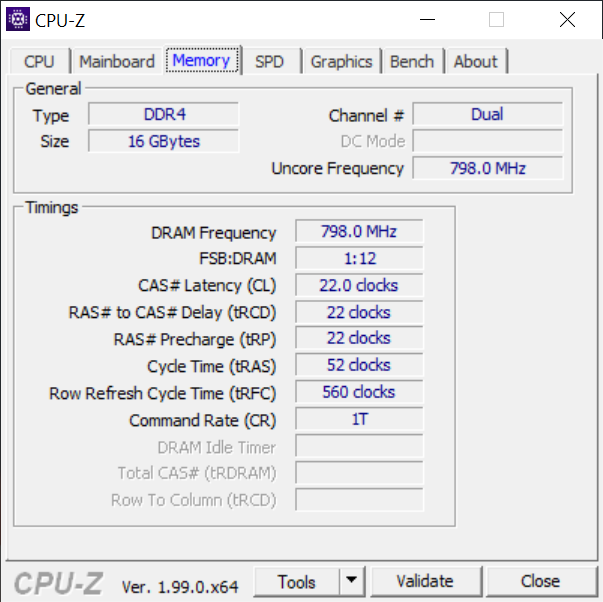
Bortsett från ändringen av arbetsminneskonfigurationen (nu dubbelkanal) skiljer sig inte specifikationerna för dagens testenhet från den första modellen av ThinkPad P1 G4. Därför tittar vi återigen på en kombination avIntel Core i7-11800H och Nvidia T1200. En panel från en annan leverantör används nu för WQHD-skärmen, så vi tittar också på skärmens egenskaper. Huvudfokus ligger dock på processorns prestanda.
För mer information om ThinkPad P1 G4 och den identiskt byggda ThinkPad X1 Extreme G4 hänvisar vi till våra tidigare recensioner
Testgrupp
Gradering | Datum | Modell | Vikt | Höjd | Storlek | Upplösning | Pris |
|---|---|---|---|---|---|---|---|
| 89.3 % v7 (old) | 02/2022 | Lenovo ThinkPad P1 G4-20Y4Z9DVUS i7-11800H, T1200 Laptop GPU | 1.8 kg | 17.7 mm | 16.00" | 2560x1600 | |
| 89.4 % v7 (old) | Lenovo ThinkPad P1 G4-20Y30017GE i7-11800H, T1200 Laptop GPU | 1.8 kg | 17.7 mm | 16.00" | 2560x1600 | ||
| 89.8 % v7 (old) | 11/2021 | Lenovo ThinkPad P1 G4-20Y4S0KS00 i7-11850H, GeForce RTX 3070 Laptop GPU | 2 kg | 17.7 mm | 16.00" | 3840x2400 | |
| 89 % v7 (old) | 11/2021 | Lenovo ThinkPad X1 Extreme G4-20Y5CTO1WW (3050 Ti) i7-11800H, GeForce RTX 3050 Ti Laptop GPU | 2 kg | 18.2 mm | 16.00" | 3840x2400 | |
| 88.3 % v7 (old) | 12/2021 | Lenovo ThinkPad X1 Extreme G4-20Y50040GE i9-11950H, GeForce RTX 3080 Laptop GPU | 1.9 kg | 18.2 mm | 16.00" | 3840x2400 |
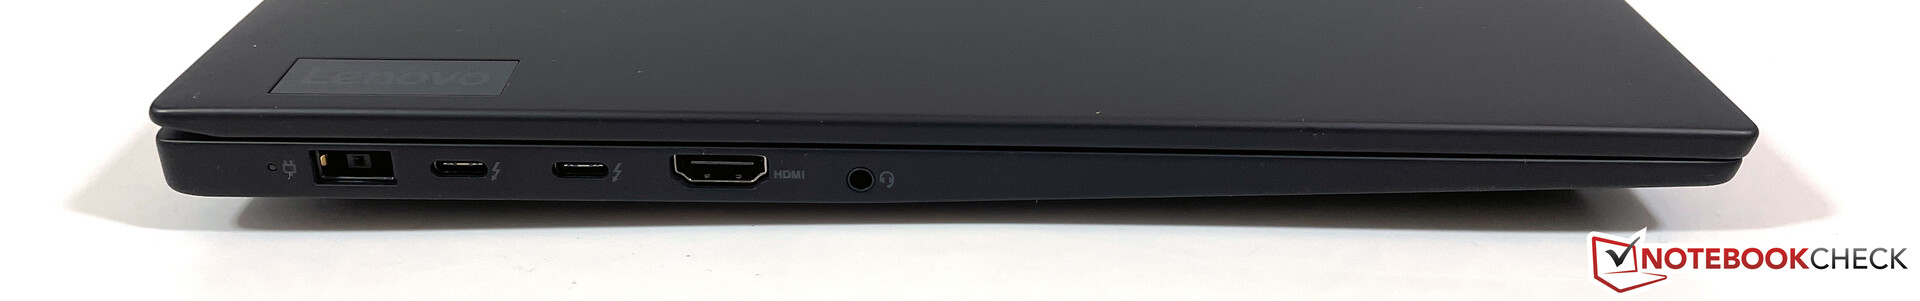
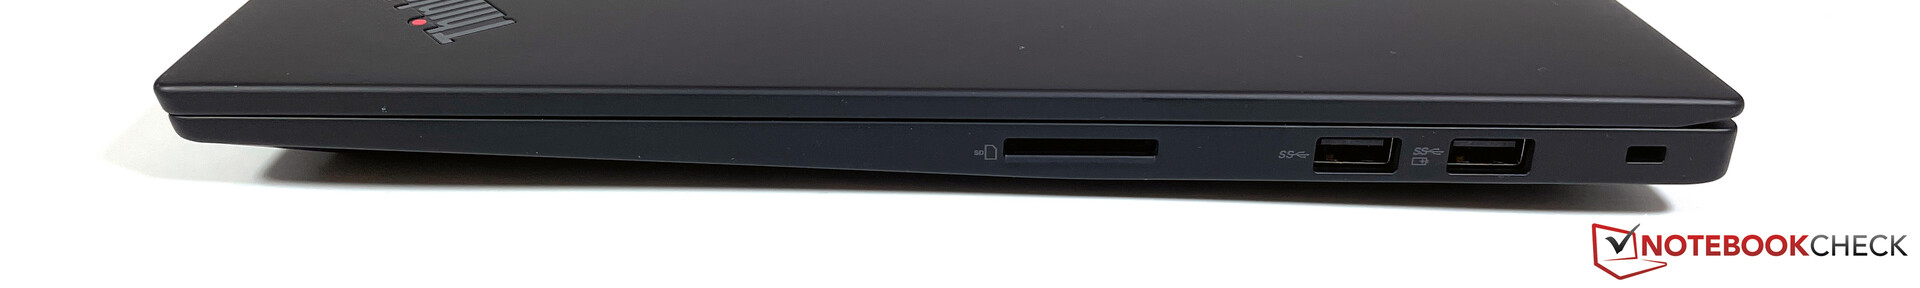
Hölje och utrustning
| SD Card Reader | |
| average JPG Copy Test (av. of 3 runs) | |
| Lenovo ThinkPad P1 G4-20Y4Z9DVUS (Angelbird AV Pro V60) | |
| Lenovo ThinkPad P1 G4-20Y30017GE (AV PRO V60) | |
| Lenovo ThinkPad X1 Extreme G4-20Y5CTO1WW (3050 Ti) (AV Pro V60) | |
| Genomsnitt av klass Workstation (49.6 - 681, n=14, senaste 2 åren) | |
| maximum AS SSD Seq Read Test (1GB) | |
| Genomsnitt av klass Workstation (87.6 - 1455, n=14, senaste 2 åren) | |
| Lenovo ThinkPad P1 G4-20Y30017GE (AV PRO V60) | |
| Lenovo ThinkPad P1 G4-20Y4Z9DVUS (Angelbird AV Pro V60) | |
| Lenovo ThinkPad X1 Extreme G4-20Y5CTO1WW (3050 Ti) (AV Pro V60) | |
| Networking | |
| iperf3 transmit AX12 | |
| Lenovo ThinkPad P1 G4-20Y4Z9DVUS | |
| Lenovo ThinkPad P1 G4-20Y30017GE | |
| Genomsnitt Intel Wi-Fi 6E AX210 (675 - 1602, n=27) | |
| Lenovo ThinkPad X1 Extreme G4-20Y5CTO1WW (3050 Ti) | |
| iperf3 receive AX12 | |
| Lenovo ThinkPad P1 G4-20Y30017GE | |
| Lenovo ThinkPad P1 G4-20Y4Z9DVUS | |
| Lenovo ThinkPad X1 Extreme G4-20Y5CTO1WW (3050 Ti) | |
| Genomsnitt Intel Wi-Fi 6E AX210 (914 - 1716, n=27) | |


Skärm: WQHD-panel från minst två leverantörer
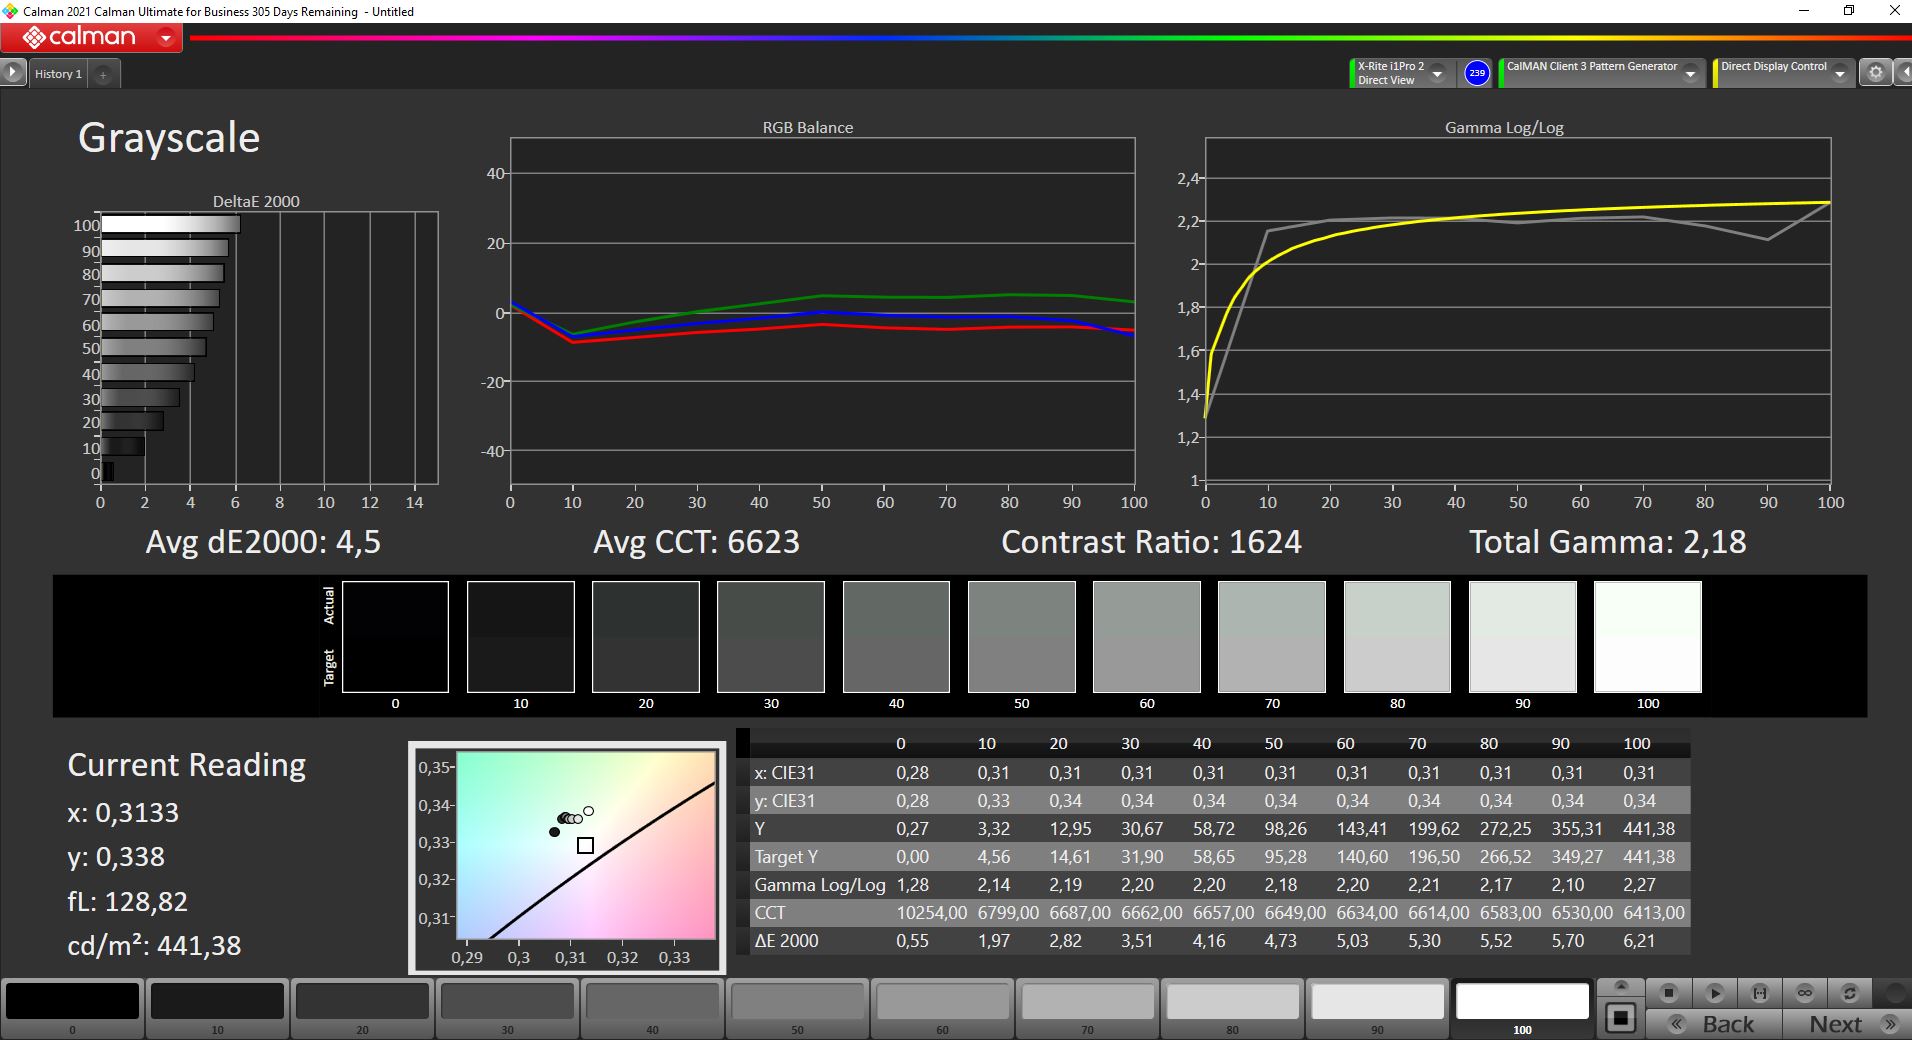
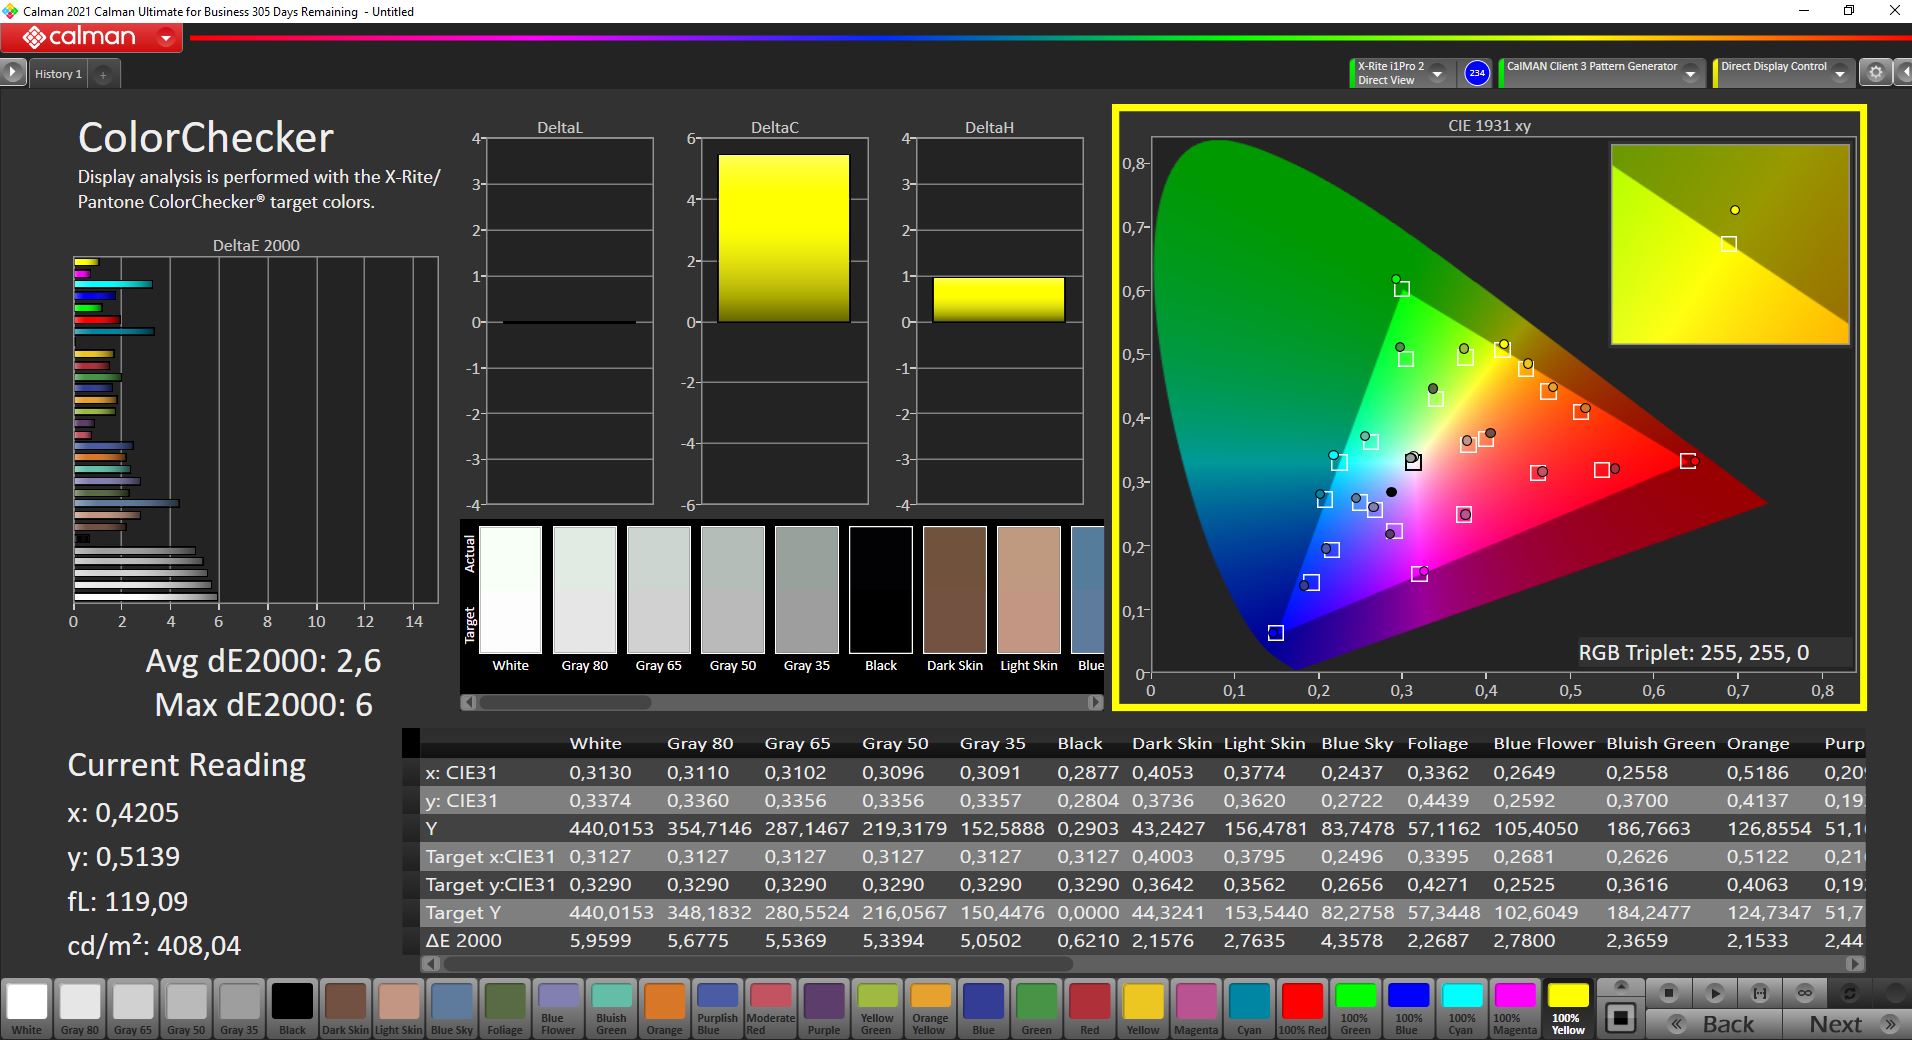
Vårt prov av ThinkPad P1 G4 är återigen utrustad med en standard WQHD-panel (2 560 x 1 600 pixlar, 16:10, matt), men panel-ID:t, och därmed leverantören, skiljer sig åt. Den här BOE-panelen får minimalt bättre resultat i mätningarna (något ljusare, något högre kontrast), men värdena är ganska jämförbara. Båda panelerna erbjuder mycket god bildkvalitet utan PWM-flimmer. Svarstiderna är långsamma, men vi tyckte inte att de var problematiska.
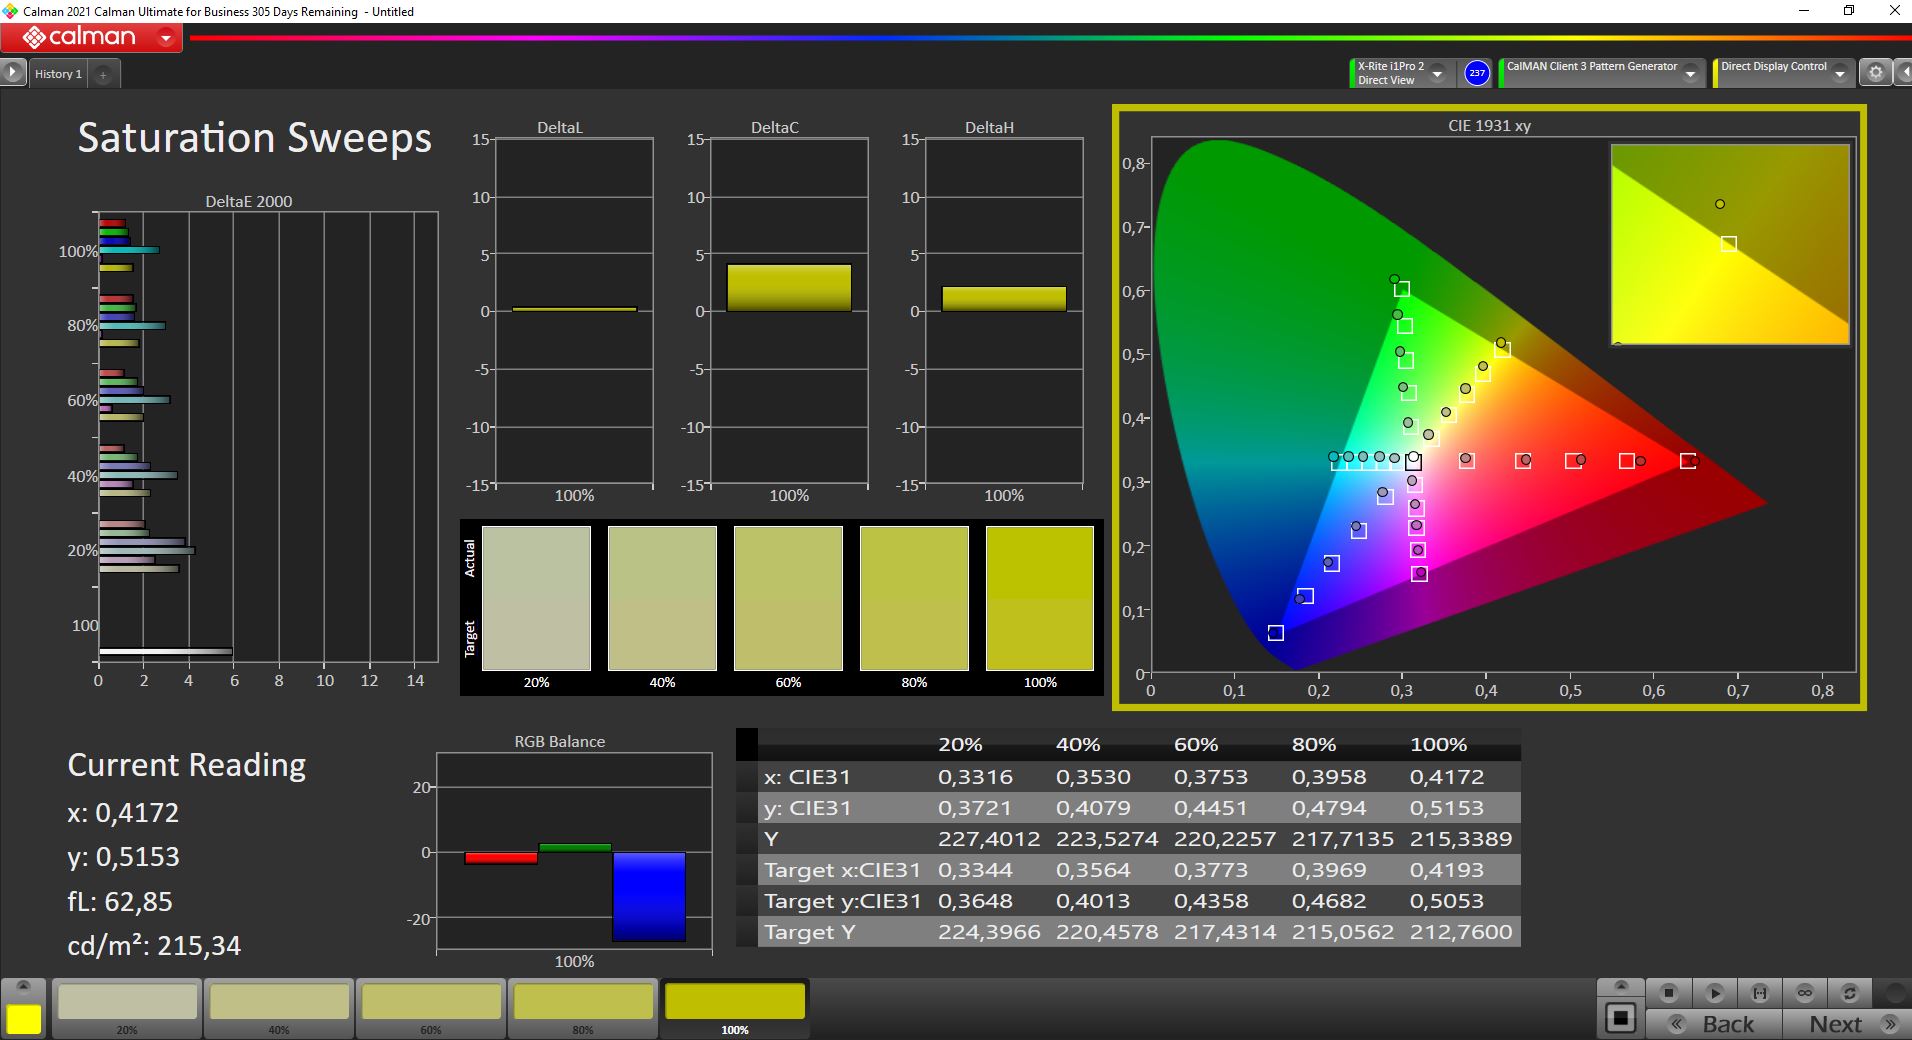
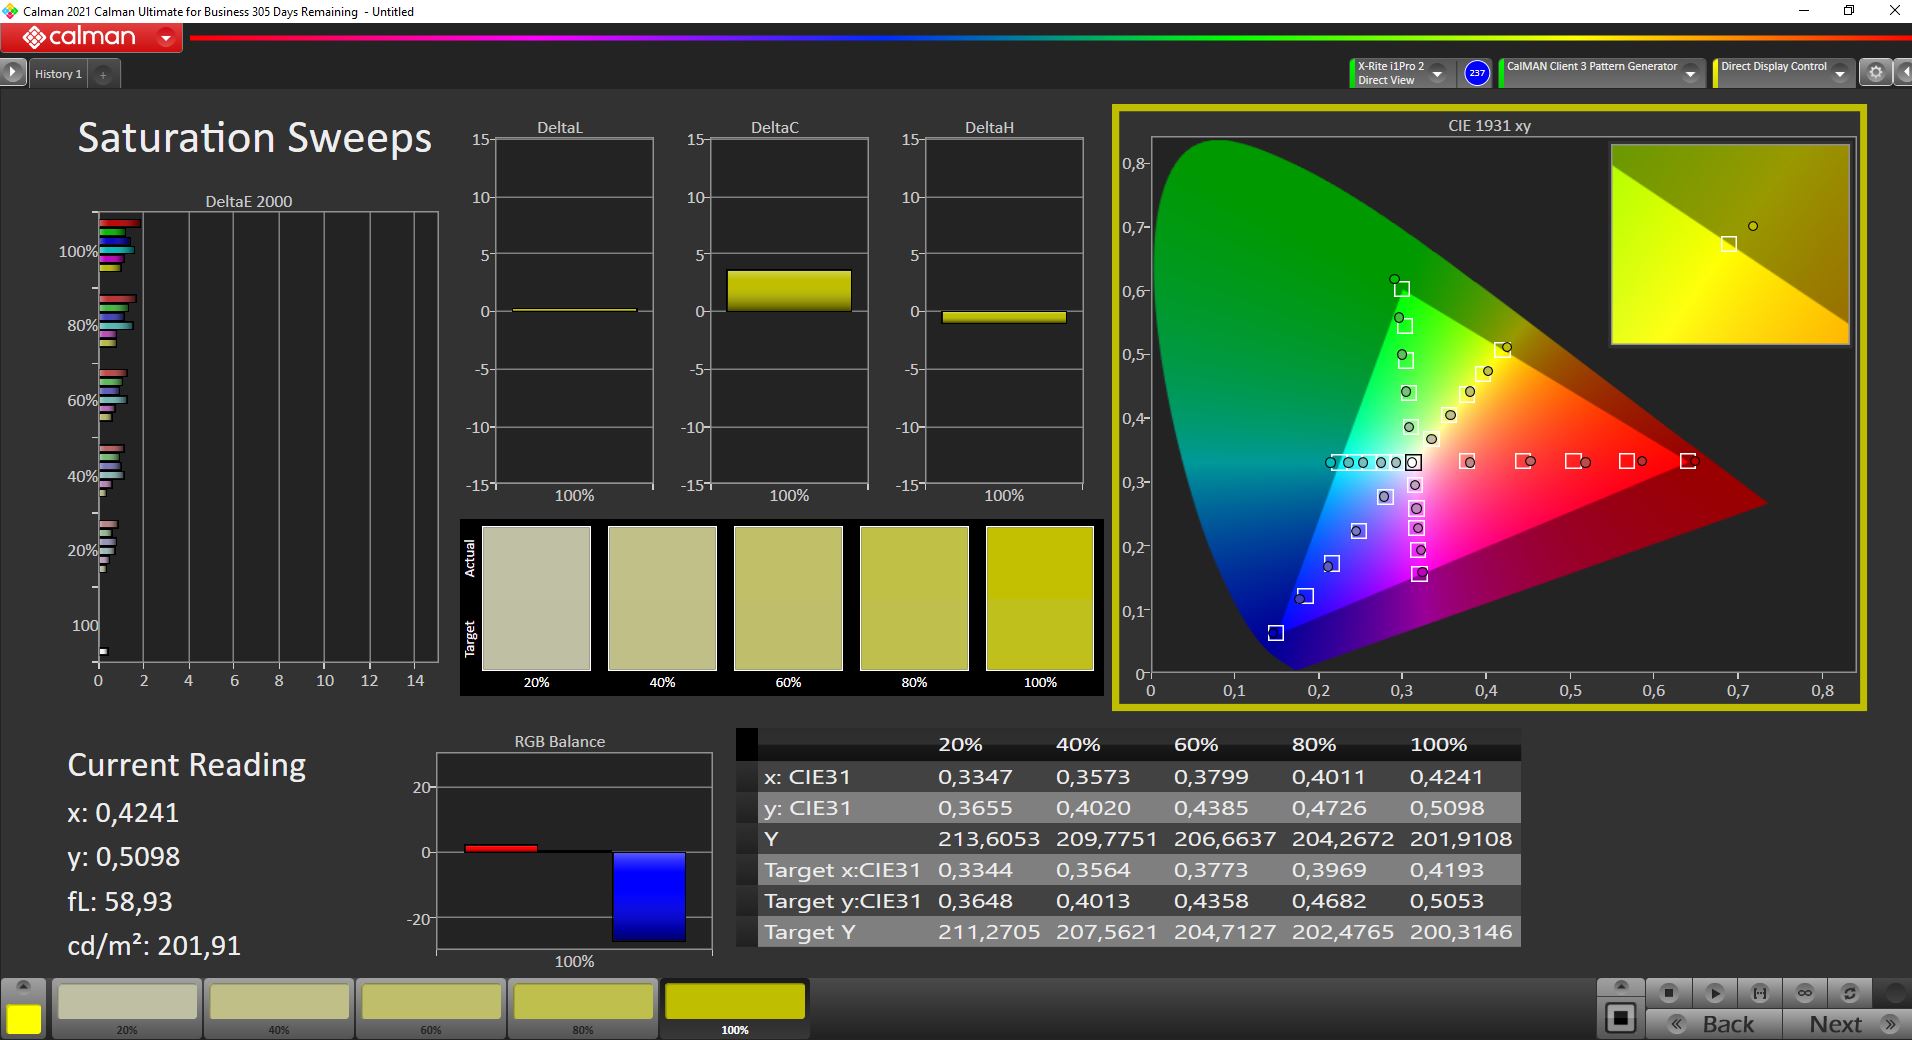
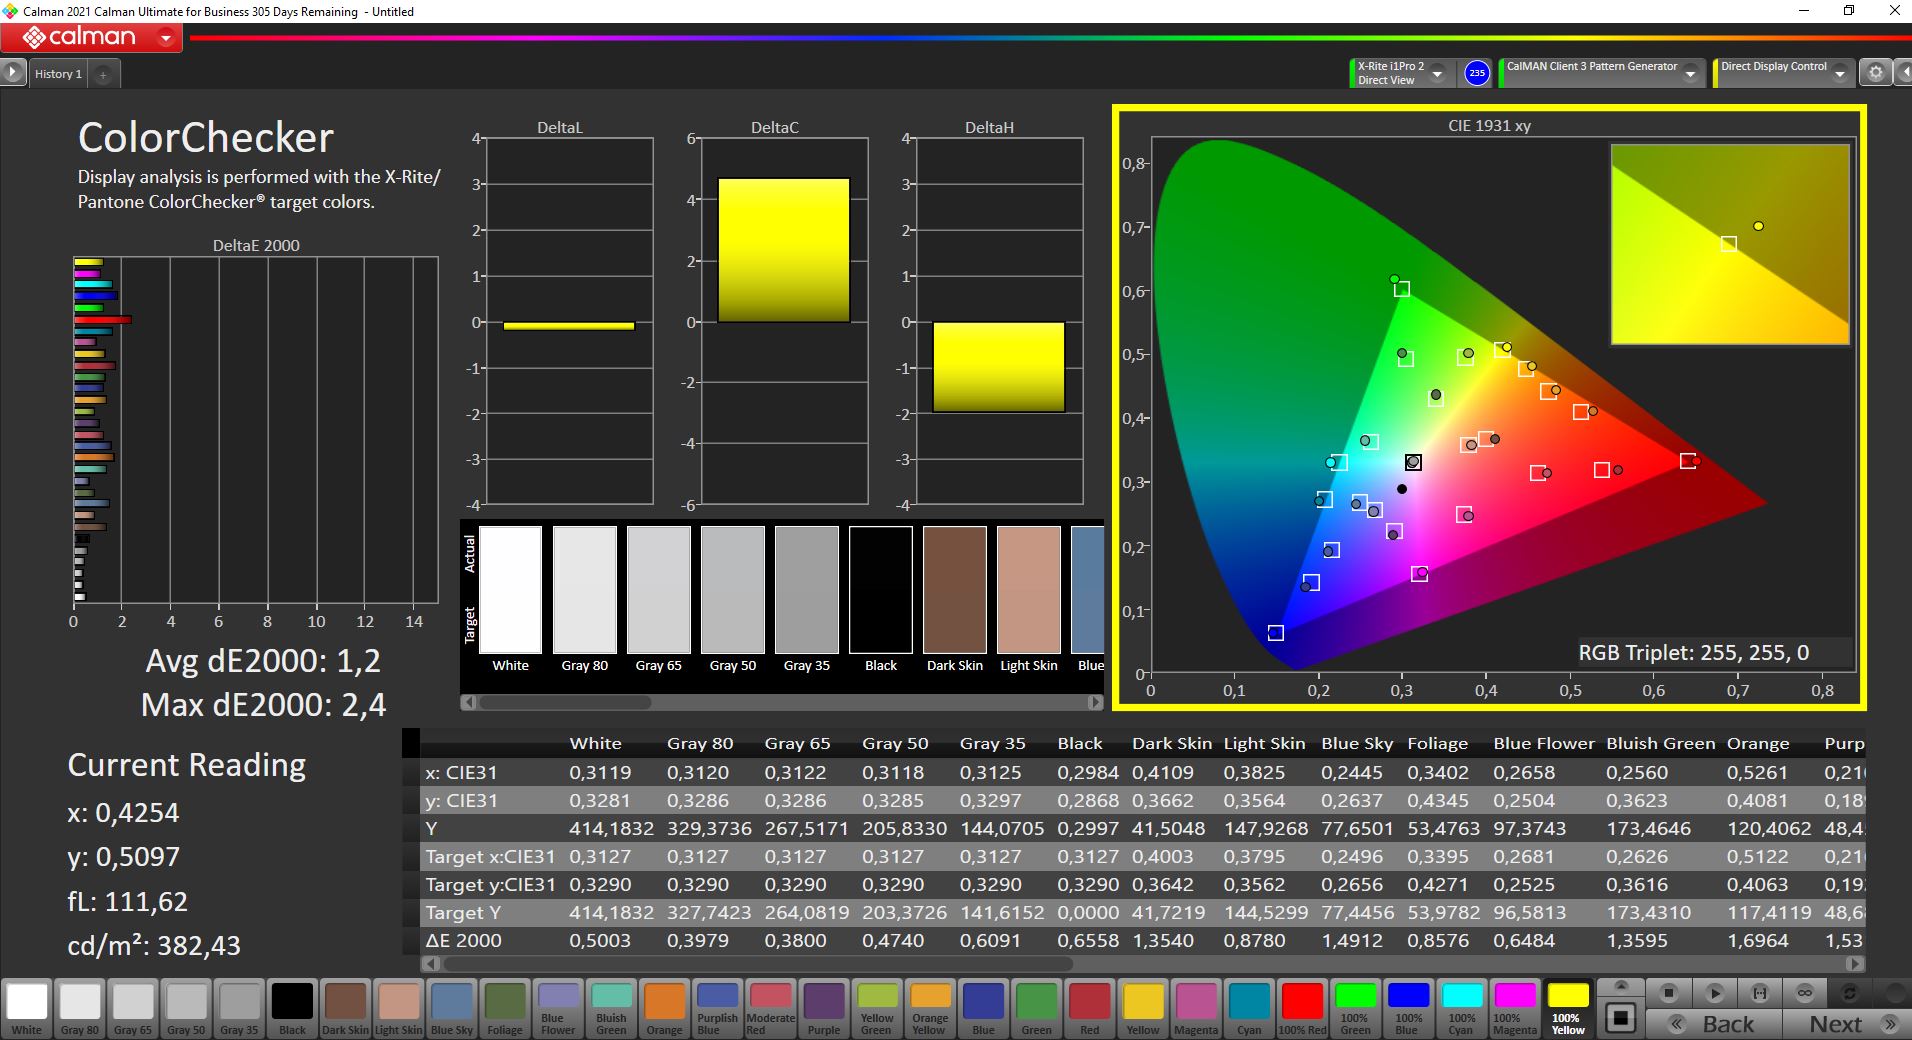
Panelen täcker sRGB-färgrymden helt och hållet, men skärmen bör kalibreras för bästa möjliga bildkvalitet (vår kalibrerade profil finns för gratis nedladdning i rutan nedan). De två valfria 4K-skärmarna erbjuder en större färgrymdstäckning (AdobeRGB), men standardpanelen WQHD är utmärkt för normal användning.
| |||||||||||||||||||||||||
Distribution av ljusstyrkan: 90 %
Mitt på batteriet: 443 cd/m²
Kontrast: 1633:1 (Svärta: 0.27 cd/m²)
ΔE ColorChecker Calman: 2.6 | ∀{0.5-29.43 Ø4.73}
calibrated: 1.2
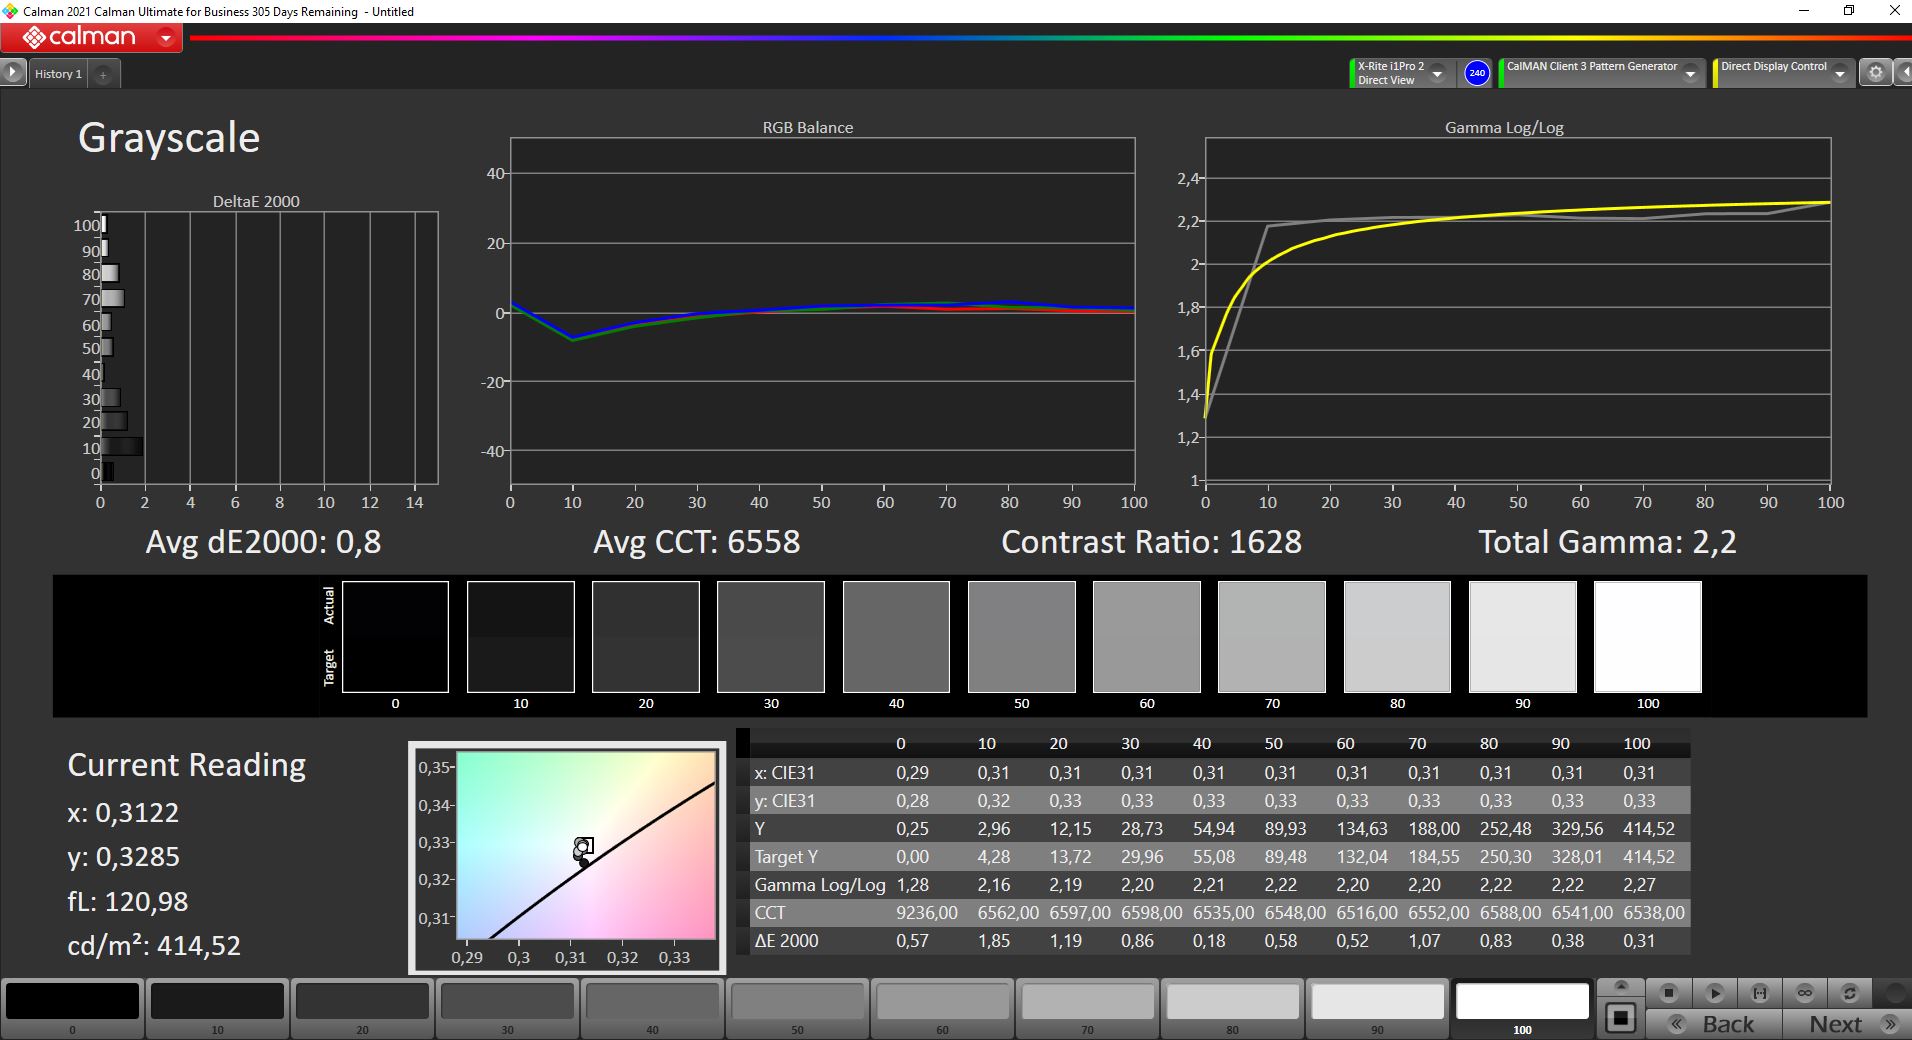
ΔE Greyscale Calman: 4.5 | ∀{0.09-98 Ø4.97}
74.7% AdobeRGB 1998 (Argyll 3D)
99.3% sRGB (Argyll 3D)
72.7% Display P3 (Argyll 3D)
Gamma: 2.18
CCT: 6623 K
| Lenovo ThinkPad P1 G4-20Y4Z9DVUS NE160QDM-N63, IPS, 2560x1600, 16" | Lenovo ThinkPad P1 G4-20Y30017GE B160QAN02.M, IPS, 2560x1600, 16" | Lenovo ThinkPad P1 G4-20Y4S0KS00 LP160UQ1-SPB1, IPS LED, 3840x2400, 16" | Lenovo ThinkPad X1 Extreme G4-20Y5CTO1WW (3050 Ti) LP160UQ1-SPB1, IPS LED, 3840x2400, 16" | |
|---|---|---|---|---|
| Display | 4% | 17% | 15% | |
| Display P3 Coverage (%) | 72.7 | 77.3 6% | 85.7 18% | 84.3 16% |
| sRGB Coverage (%) | 99.3 | 99.9 1% | 99.4 0% | 98.3 -1% |
| AdobeRGB 1998 Coverage (%) | 74.7 | 78.1 5% | 98.9 32% | 97.8 31% |
| Response Times | -14% | -43% | -75% | |
| Response Time Grey 50% / Grey 80% * (ms) | 40.8 | 40.8 ? -0% | 55.2 ? -35% | 60 ? -47% |
| Response Time Black / White * (ms) | 20.8 | 26.4 ? -27% | 31.2 ? -50% | 42 ? -102% |
| PWM Frequency (Hz) | ||||
| Screen | -2% | 14% | 7% | |
| Brightness middle (cd/m²) | 441 | 420 -5% | 630 43% | 639 45% |
| Brightness (cd/m²) | 420 | 401 -5% | 622 48% | 612 46% |
| Brightness Distribution (%) | 90 | 90 0% | 90 0% | 84 -7% |
| Black Level * (cd/m²) | 0.27 | 0.3 -11% | 0.41 -52% | 0.47 -74% |
| Contrast (:1) | 1633 | 1400 -14% | 1537 -6% | 1360 -17% |
| Colorchecker dE 2000 * | 2.6 | 2.5 4% | 2.2 15% | 2.2 15% |
| Colorchecker dE 2000 max. * | 6 | 4.9 18% | 5 17% | 5.3 12% |
| Colorchecker dE 2000 calibrated * | 1.2 | 1.6 -33% | 1 17% | 1.4 -17% |
| Greyscale dE 2000 * | 4.5 | 3.4 24% | 2.7 40% | 1.7 62% |
| Gamma | 2.18 101% | 2.24 98% | 2.26 97% | 2.31 95% |
| CCT | 6623 98% | 6479 100% | 6886 94% | 6390 102% |
| Totalt genomsnitt (program/inställningar) | -4% /
-3% | -4% /
6% | -18% /
-3% |
* ... mindre är bättre
Visa svarstider
| ↔ Svarstid svart till vitt | ||
|---|---|---|
| 20.8 ms ... stiga ↗ och falla ↘ kombinerat | ↗ ms stiga | 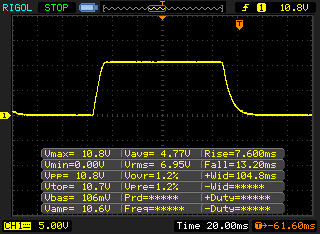 |
| ↘ ms hösten | ||
| Skärmen visar bra svarsfrekvens i våra tester, men kan vara för långsam för konkurrenskraftiga spelare. I jämförelse sträcker sig alla testade enheter från 0.1 (minst) till 240 (maximalt) ms. » 46 % av alla enheter är bättre. Det betyder att den uppmätta svarstiden liknar genomsnittet av alla testade enheter (19.9 ms). | ||
| ↔ Svarstid 50 % grått till 80 % grått | ||
| 40.8 ms ... stiga ↗ och falla ↘ kombinerat | ↗ ms stiga |  |
| ↘ ms hösten | ||
| Skärmen visar långsamma svarsfrekvenser i våra tester och kommer att vara otillfredsställande för spelare. I jämförelse sträcker sig alla testade enheter från 0.165 (minst) till 636 (maximalt) ms. » 64 % av alla enheter är bättre. Detta innebär att den uppmätta svarstiden är sämre än genomsnittet av alla testade enheter (31.1 ms). | ||
Skärmflimmer / PWM (Puls-Width Modulation)
| Skärmflimmer / PWM upptäcktes inte |  | ||
Som jämförelse: 52 % av alla testade enheter använder inte PWM för att dämpa skärmen. Om PWM upptäcktes mättes ett medelvärde av 7791 (minst: 5 - maximum: 343500) Hz. | |||
Prestanda: ThinkPad P1 G4 slutligen utan handbroms
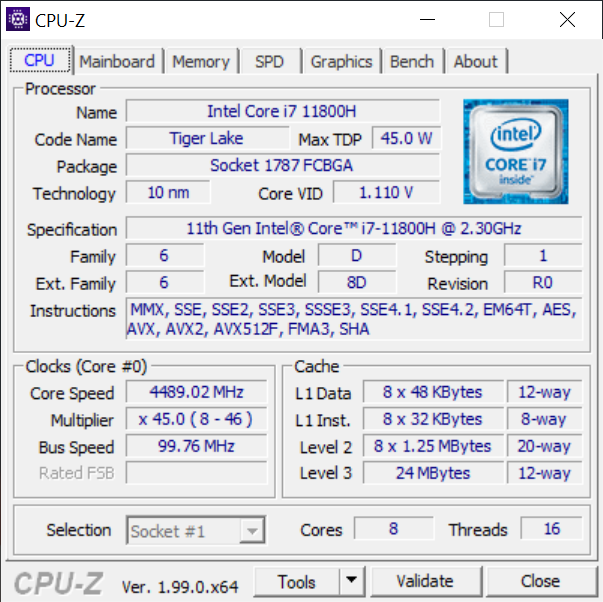
Processor: Core i7-11800H
Vi har nu testat flera versioner av ThinkPad P1 G4 och X1 Extreme G4, och CPU-prestandan har ökat med varje ny BIOS-version. I vårt första test blev vi besvikna eftersom CPU:n satte sig på 40 W efter en kort tid och var därmed betydligt långsammare än en genomsnittlig Core i7-11800H. Med den senaste BIOS-versionen 1.13 hör dessa begränsningar dock till det förflutna och Core i7-11800H presterar mycket bra
CPU-prestandan är nu jämförbar med ångkammarmodellerna och är identisk med den faktiskt snabbare Core i9-11950H. Detta visar att den valfria Core i9-processorn endast ger en minimal prestandafördel jämfört med Core i7-11800H i testerna med en kärna.
I batteriläge begränsas processorns strömförbrukning till 70 W, vilket leder till en liten prestandaförlust på cirka 15 procent. Ytterligare CPU-benchmarks finns i vårjämförelse av mobila processoreravsnittet.
Cinebench R15 Multi Dauertest
Cinebench R23: Multi Core | Single Core
Cinebench R20: CPU (Multi Core) | CPU (Single Core)
Cinebench R15: CPU Multi 64Bit | CPU Single 64Bit
Blender: v2.79 BMW27 CPU
7-Zip 18.03: 7z b 4 | 7z b 4 -mmt1
Geekbench 5.5: Multi-Core | Single-Core
HWBOT x265 Benchmark v2.2: 4k Preset
LibreOffice : 20 Documents To PDF
R Benchmark 2.5: Overall mean
| CPU Performance rating | |
| Genomsnitt av klass Workstation | |
| Lenovo ThinkPad P1 G4-20Y4S0KS00 | |
| Lenovo ThinkPad X1 Extreme G4-20Y50040GE -3! | |
| Lenovo ThinkPad X1 Extreme G4-20Y5CTO1WW (3050 Ti) | |
| Lenovo ThinkPad P1 G4-20Y4Z9DVUS | |
| Genomsnitt Intel Core i7-11800H | |
| Lenovo ThinkPad P1 G4-20Y30017GE | |
| Cinebench R23 / Multi Core | |
| Genomsnitt av klass Workstation (14055 - 38520, n=25, senaste 2 åren) | |
| Lenovo ThinkPad X1 Extreme G4-20Y5CTO1WW (3050 Ti) | |
| Lenovo ThinkPad P1 G4-20Y4Z9DVUS | |
| Lenovo ThinkPad X1 Extreme G4-20Y50040GE | |
| Lenovo ThinkPad P1 G4-20Y4S0KS00 | |
| Genomsnitt Intel Core i7-11800H (6508 - 14088, n=48) | |
| Lenovo ThinkPad P1 G4-20Y30017GE | |
| Cinebench R23 / Single Core | |
| Genomsnitt av klass Workstation (1712 - 2228, n=25, senaste 2 åren) | |
| Lenovo ThinkPad X1 Extreme G4-20Y50040GE | |
| Lenovo ThinkPad P1 G4-20Y4S0KS00 | |
| Lenovo ThinkPad X1 Extreme G4-20Y5CTO1WW (3050 Ti) | |
| Lenovo ThinkPad P1 G4-20Y4Z9DVUS | |
| Genomsnitt Intel Core i7-11800H (1386 - 1522, n=45) | |
| Lenovo ThinkPad P1 G4-20Y30017GE | |
| Cinebench R20 / CPU (Multi Core) | |
| Genomsnitt av klass Workstation (5471 - 15043, n=25, senaste 2 åren) | |
| Lenovo ThinkPad P1 G4-20Y4Z9DVUS | |
| Lenovo ThinkPad X1 Extreme G4-20Y5CTO1WW (3050 Ti) | |
| Lenovo ThinkPad P1 G4-20Y4S0KS00 | |
| Lenovo ThinkPad X1 Extreme G4-20Y50040GE | |
| Genomsnitt Intel Core i7-11800H (2498 - 5408, n=50) | |
| Lenovo ThinkPad P1 G4-20Y30017GE | |
| Cinebench R20 / CPU (Single Core) | |
| Genomsnitt av klass Workstation (671 - 857, n=25, senaste 2 åren) | |
| Lenovo ThinkPad X1 Extreme G4-20Y50040GE | |
| Lenovo ThinkPad P1 G4-20Y4S0KS00 | |
| Lenovo ThinkPad X1 Extreme G4-20Y5CTO1WW (3050 Ti) | |
| Lenovo ThinkPad P1 G4-20Y4Z9DVUS | |
| Genomsnitt Intel Core i7-11800H (520 - 586, n=47) | |
| Lenovo ThinkPad P1 G4-20Y30017GE | |
| Cinebench R15 / CPU Multi 64Bit | |
| Genomsnitt av klass Workstation (2489 - 5810, n=25, senaste 2 åren) | |
| Lenovo ThinkPad P1 G4-20Y4Z9DVUS | |
| Lenovo ThinkPad X1 Extreme G4-20Y50040GE | |
| Lenovo ThinkPad X1 Extreme G4-20Y50040GE | |
| Lenovo ThinkPad X1 Extreme G4-20Y5CTO1WW (3050 Ti) | |
| Lenovo ThinkPad P1 G4-20Y4S0KS00 | |
| Genomsnitt Intel Core i7-11800H (1342 - 2173, n=50) | |
| Lenovo ThinkPad P1 G4-20Y30017GE | |
| Cinebench R15 / CPU Single 64Bit | |
| Genomsnitt av klass Workstation (191.4 - 328, n=25, senaste 2 åren) | |
| Lenovo ThinkPad X1 Extreme G4-20Y50040GE | |
| Lenovo ThinkPad P1 G4-20Y4S0KS00 | |
| Lenovo ThinkPad P1 G4-20Y4Z9DVUS | |
| Lenovo ThinkPad X1 Extreme G4-20Y5CTO1WW (3050 Ti) | |
| Genomsnitt Intel Core i7-11800H (201 - 231, n=46) | |
| Lenovo ThinkPad P1 G4-20Y30017GE | |
| Blender / v2.79 BMW27 CPU | |
| Lenovo ThinkPad P1 G4-20Y30017GE | |
| Genomsnitt Intel Core i7-11800H (217 - 454, n=46) | |
| Lenovo ThinkPad P1 G4-20Y4S0KS00 | |
| Lenovo ThinkPad X1 Extreme G4-20Y5CTO1WW (3050 Ti) | |
| Lenovo ThinkPad P1 G4-20Y4Z9DVUS | |
| Genomsnitt av klass Workstation (91 - 261, n=25, senaste 2 åren) | |
| 7-Zip 18.03 / 7z b 4 | |
| Genomsnitt av klass Workstation (54741 - 116969, n=25, senaste 2 åren) | |
| Lenovo ThinkPad P1 G4-20Y4S0KS00 | |
| Lenovo ThinkPad P1 G4-20Y4Z9DVUS | |
| Lenovo ThinkPad X1 Extreme G4-20Y5CTO1WW (3050 Ti) | |
| Genomsnitt Intel Core i7-11800H (33718 - 56758, n=46) | |
| Lenovo ThinkPad P1 G4-20Y30017GE | |
| 7-Zip 18.03 / 7z b 4 -mmt1 | |
| Genomsnitt av klass Workstation (5126 - 6960, n=25, senaste 2 åren) | |
| Lenovo ThinkPad P1 G4-20Y4S0KS00 | |
| Lenovo ThinkPad X1 Extreme G4-20Y5CTO1WW (3050 Ti) | |
| Lenovo ThinkPad P1 G4-20Y4Z9DVUS | |
| Lenovo ThinkPad P1 G4-20Y30017GE | |
| Genomsnitt Intel Core i7-11800H (5138 - 5732, n=46) | |
| Geekbench 5.5 / Multi-Core | |
| Genomsnitt av klass Workstation (11542 - 25554, n=25, senaste 2 åren) | |
| Lenovo ThinkPad P1 G4-20Y4S0KS00 | |
| Genomsnitt Intel Core i7-11800H (4655 - 9851, n=40) | |
| Lenovo ThinkPad P1 G4-20Y4Z9DVUS | |
| Lenovo ThinkPad X1 Extreme G4-20Y5CTO1WW (3050 Ti) | |
| Lenovo ThinkPad X1 Extreme G4-20Y50040GE | |
| Lenovo ThinkPad P1 G4-20Y30017GE | |
| Geekbench 5.5 / Single-Core | |
| Genomsnitt av klass Workstation (1781 - 2183, n=25, senaste 2 åren) | |
| Lenovo ThinkPad P1 G4-20Y4S0KS00 | |
| Lenovo ThinkPad X1 Extreme G4-20Y50040GE | |
| Lenovo ThinkPad X1 Extreme G4-20Y5CTO1WW (3050 Ti) | |
| Lenovo ThinkPad P1 G4-20Y4Z9DVUS | |
| Genomsnitt Intel Core i7-11800H (1429 - 1625, n=40) | |
| Lenovo ThinkPad P1 G4-20Y30017GE | |
| HWBOT x265 Benchmark v2.2 / 4k Preset | |
| Genomsnitt av klass Workstation (14.4 - 40.5, n=25, senaste 2 åren) | |
| Lenovo ThinkPad P1 G4-20Y4S0KS00 | |
| Lenovo ThinkPad P1 G4-20Y4Z9DVUS | |
| Lenovo ThinkPad X1 Extreme G4-20Y50040GE | |
| Genomsnitt Intel Core i7-11800H (7.38 - 17.4, n=46) | |
| Lenovo ThinkPad X1 Extreme G4-20Y5CTO1WW (3050 Ti) | |
| Lenovo ThinkPad P1 G4-20Y30017GE | |
| LibreOffice / 20 Documents To PDF | |
| Lenovo ThinkPad P1 G4-20Y4Z9DVUS | |
| Lenovo ThinkPad P1 G4-20Y30017GE | |
| Genomsnitt av klass Workstation (37.1 - 74.7, n=25, senaste 2 åren) | |
| Genomsnitt Intel Core i7-11800H (38.6 - 59.9, n=45) | |
| Lenovo ThinkPad P1 G4-20Y4S0KS00 | |
| Lenovo ThinkPad X1 Extreme G4-20Y5CTO1WW (3050 Ti) | |
| Lenovo ThinkPad X1 Extreme G4-20Y50040GE | |
| R Benchmark 2.5 / Overall mean | |
| Lenovo ThinkPad P1 G4-20Y30017GE | |
| Genomsnitt Intel Core i7-11800H (0.548 - 0.615, n=46) | |
| Lenovo ThinkPad P1 G4-20Y4Z9DVUS | |
| Lenovo ThinkPad X1 Extreme G4-20Y5CTO1WW (3050 Ti) | |
| Lenovo ThinkPad X1 Extreme G4-20Y50040GE | |
| Lenovo ThinkPad P1 G4-20Y4S0KS00 | |
| Genomsnitt av klass Workstation (0.3825 - 0.603, n=25, senaste 2 åren) | |
* ... mindre är bättre
AIDA64: FP32 Ray-Trace | FPU Julia | CPU SHA3 | CPU Queen | FPU SinJulia | FPU Mandel | CPU AES | CPU ZLib | FP64 Ray-Trace | CPU PhotoWorxx
| Performance rating | |
| Genomsnitt av klass Workstation | |
| Lenovo ThinkPad X1 Extreme G4-20Y50040GE | |
| Lenovo ThinkPad X1 Extreme G4-20Y5CTO1WW (3050 Ti) | |
| Lenovo ThinkPad P1 G4-20Y4Z9DVUS | |
| Genomsnitt Intel Core i7-11800H | |
| Lenovo ThinkPad P1 G4-20Y30017GE -9! | |
| Lenovo ThinkPad P1 G4-20Y4S0KS00 -9! | |
| AIDA64 / FP32 Ray-Trace | |
| Genomsnitt av klass Workstation (10658 - 61611, n=25, senaste 2 åren) | |
| Lenovo ThinkPad X1 Extreme G4-20Y50040GE | |
| Lenovo ThinkPad P1 G4-20Y4Z9DVUS | |
| Lenovo ThinkPad X1 Extreme G4-20Y5CTO1WW (3050 Ti) | |
| Genomsnitt Intel Core i7-11800H (8772 - 15961, n=20) | |
| AIDA64 / FPU Julia | |
| Genomsnitt av klass Workstation (56664 - 186971, n=25, senaste 2 åren) | |
| Lenovo ThinkPad P1 G4-20Y4Z9DVUS | |
| Lenovo ThinkPad X1 Extreme G4-20Y50040GE | |
| Lenovo ThinkPad X1 Extreme G4-20Y5CTO1WW (3050 Ti) | |
| Genomsnitt Intel Core i7-11800H (39404 - 65636, n=20) | |
| AIDA64 / CPU SHA3 | |
| Genomsnitt av klass Workstation (2608 - 8975, n=25, senaste 2 åren) | |
| Lenovo ThinkPad X1 Extreme G4-20Y50040GE | |
| Lenovo ThinkPad P1 G4-20Y4Z9DVUS | |
| Lenovo ThinkPad X1 Extreme G4-20Y5CTO1WW (3050 Ti) | |
| Genomsnitt Intel Core i7-11800H (2599 - 4439, n=20) | |
| AIDA64 / CPU Queen | |
| Genomsnitt av klass Workstation (60778 - 144411, n=25, senaste 2 åren) | |
| Lenovo ThinkPad X1 Extreme G4-20Y50040GE | |
| Lenovo ThinkPad X1 Extreme G4-20Y5CTO1WW (3050 Ti) | |
| Lenovo ThinkPad P1 G4-20Y4Z9DVUS | |
| Genomsnitt Intel Core i7-11800H (85233 - 91941, n=20) | |
| AIDA64 / FPU SinJulia | |
| Genomsnitt av klass Workstation (8165 - 29343, n=25, senaste 2 åren) | |
| Lenovo ThinkPad X1 Extreme G4-20Y50040GE | |
| Lenovo ThinkPad X1 Extreme G4-20Y5CTO1WW (3050 Ti) | |
| Lenovo ThinkPad P1 G4-20Y4Z9DVUS | |
| Genomsnitt Intel Core i7-11800H (6420 - 9792, n=20) | |
| AIDA64 / FPU Mandel | |
| Genomsnitt av klass Workstation (27301 - 98153, n=25, senaste 2 åren) | |
| Lenovo ThinkPad X1 Extreme G4-20Y50040GE | |
| Lenovo ThinkPad P1 G4-20Y4Z9DVUS | |
| Lenovo ThinkPad X1 Extreme G4-20Y5CTO1WW (3050 Ti) | |
| Genomsnitt Intel Core i7-11800H (23365 - 39464, n=20) | |
| AIDA64 / CPU AES | |
| Lenovo ThinkPad X1 Extreme G4-20Y50040GE | |
| Lenovo ThinkPad X1 Extreme G4-20Y5CTO1WW (3050 Ti) | |
| Genomsnitt Intel Core i7-11800H (74617 - 149388, n=20) | |
| Genomsnitt av klass Workstation (56077 - 187841, n=25, senaste 2 åren) | |
| Lenovo ThinkPad P1 G4-20Y4Z9DVUS | |
| AIDA64 / CPU ZLib | |
| Genomsnitt av klass Workstation (742 - 2148, n=25, senaste 2 åren) | |
| Lenovo ThinkPad X1 Extreme G4-20Y50040GE | |
| Lenovo ThinkPad P1 G4-20Y4Z9DVUS | |
| Lenovo ThinkPad X1 Extreme G4-20Y5CTO1WW (3050 Ti) | |
| Genomsnitt Intel Core i7-11800H (461 - 830, n=43) | |
| Lenovo ThinkPad P1 G4-20Y30017GE | |
| Lenovo ThinkPad P1 G4-20Y4S0KS00 | |
| AIDA64 / FP64 Ray-Trace | |
| Genomsnitt av klass Workstation (5580 - 32891, n=25, senaste 2 åren) | |
| Lenovo ThinkPad X1 Extreme G4-20Y50040GE | |
| Lenovo ThinkPad P1 G4-20Y4Z9DVUS | |
| Lenovo ThinkPad X1 Extreme G4-20Y5CTO1WW (3050 Ti) | |
| Genomsnitt Intel Core i7-11800H (4545 - 8717, n=21) | |
| AIDA64 / CPU PhotoWorxx | |
| Genomsnitt av klass Workstation (37151 - 93684, n=25, senaste 2 åren) | |
| Genomsnitt Intel Core i7-11800H (11898 - 26757, n=21) | |
| Lenovo ThinkPad X1 Extreme G4-20Y5CTO1WW (3050 Ti) | |
| Lenovo ThinkPad P1 G4-20Y4Z9DVUS | |
| Lenovo ThinkPad X1 Extreme G4-20Y50040GE | |
CrossMark: Overall | Productivity | Creativity | Responsiveness
| PCMark 10 / Score | |
| Genomsnitt av klass Workstation (6436 - 10409, n=21, senaste 2 åren) | |
| Lenovo ThinkPad P1 G4-20Y4S0KS00 | |
| Lenovo ThinkPad X1 Extreme G4-20Y50040GE | |
| Lenovo ThinkPad X1 Extreme G4-20Y5CTO1WW (3050 Ti) | |
| Lenovo ThinkPad P1 G4-20Y4Z9DVUS | |
| Genomsnitt Intel Core i7-11800H, NVIDIA T1200 Laptop GPU (5889 - 6147, n=3) | |
| Lenovo ThinkPad P1 G4-20Y30017GE | |
| PCMark 10 / Essentials | |
| Lenovo ThinkPad P1 G4-20Y4S0KS00 | |
| Lenovo ThinkPad X1 Extreme G4-20Y5CTO1WW (3050 Ti) | |
| Lenovo ThinkPad X1 Extreme G4-20Y50040GE | |
| Genomsnitt av klass Workstation (9622 - 11157, n=21, senaste 2 åren) | |
| Lenovo ThinkPad P1 G4-20Y4Z9DVUS | |
| Genomsnitt Intel Core i7-11800H, NVIDIA T1200 Laptop GPU (9776 - 9956, n=3) | |
| Lenovo ThinkPad P1 G4-20Y30017GE | |
| PCMark 10 / Productivity | |
| Genomsnitt av klass Workstation (8789 - 20616, n=21, senaste 2 åren) | |
| Lenovo ThinkPad P1 G4-20Y4S0KS00 | |
| Lenovo ThinkPad X1 Extreme G4-20Y50040GE | |
| Lenovo ThinkPad X1 Extreme G4-20Y5CTO1WW (3050 Ti) | |
| Lenovo ThinkPad P1 G4-20Y30017GE | |
| Genomsnitt Intel Core i7-11800H, NVIDIA T1200 Laptop GPU (8276 - 8445, n=3) | |
| Lenovo ThinkPad P1 G4-20Y4Z9DVUS | |
| PCMark 10 / Digital Content Creation | |
| Genomsnitt av klass Workstation (7744 - 15631, n=21, senaste 2 åren) | |
| Lenovo ThinkPad P1 G4-20Y4S0KS00 | |
| Lenovo ThinkPad X1 Extreme G4-20Y50040GE | |
| Lenovo ThinkPad X1 Extreme G4-20Y5CTO1WW (3050 Ti) | |
| Lenovo ThinkPad P1 G4-20Y4Z9DVUS | |
| Genomsnitt Intel Core i7-11800H, NVIDIA T1200 Laptop GPU (6851 - 7581, n=3) | |
| Lenovo ThinkPad P1 G4-20Y30017GE | |
| CrossMark / Overall | |
| Genomsnitt av klass Workstation (1307 - 2267, n=24, senaste 2 åren) | |
| Lenovo ThinkPad X1 Extreme G4-20Y50040GE | |
| Lenovo ThinkPad P1 G4-20Y4S0KS00 | |
| Lenovo ThinkPad P1 G4-20Y4Z9DVUS | |
| Genomsnitt Intel Core i7-11800H, NVIDIA T1200 Laptop GPU (1367 - 1526, n=2) | |
| CrossMark / Productivity | |
| Genomsnitt av klass Workstation (1130 - 2122, n=24, senaste 2 åren) | |
| Lenovo ThinkPad X1 Extreme G4-20Y50040GE | |
| Lenovo ThinkPad P1 G4-20Y4S0KS00 | |
| Lenovo ThinkPad P1 G4-20Y4Z9DVUS | |
| Genomsnitt Intel Core i7-11800H, NVIDIA T1200 Laptop GPU (1389 - 1521, n=2) | |
| CrossMark / Creativity | |
| Genomsnitt av klass Workstation (1657 - 2725, n=24, senaste 2 åren) | |
| Lenovo ThinkPad P1 G4-20Y4S0KS00 | |
| Lenovo ThinkPad X1 Extreme G4-20Y50040GE | |
| Lenovo ThinkPad P1 G4-20Y4Z9DVUS | |
| Genomsnitt Intel Core i7-11800H, NVIDIA T1200 Laptop GPU (1430 - 1606, n=2) | |
| CrossMark / Responsiveness | |
| Genomsnitt av klass Workstation (993 - 2096, n=24, senaste 2 åren) | |
| Lenovo ThinkPad X1 Extreme G4-20Y50040GE | |
| Lenovo ThinkPad P1 G4-20Y4S0KS00 | |
| Lenovo ThinkPad P1 G4-20Y4Z9DVUS | |
| Genomsnitt Intel Core i7-11800H, NVIDIA T1200 Laptop GPU (1137 - 1323, n=2) | |
| PCMark 10 Score | 6147 poäng | |
Hjälp | ||
| AIDA64 / Memory Copy | |
| Genomsnitt av klass Workstation (56003 - 164795, n=25, senaste 2 åren) | |
| Genomsnitt Intel Core i7-11800H (24508 - 48144, n=21) | |
| Lenovo ThinkPad P1 G4-20Y4Z9DVUS | |
| Lenovo ThinkPad X1 Extreme G4-20Y5CTO1WW (3050 Ti) | |
| Lenovo ThinkPad X1 Extreme G4-20Y50040GE | |
| AIDA64 / Memory Read | |
| Genomsnitt av klass Workstation (55795 - 121563, n=25, senaste 2 åren) | |
| Genomsnitt Intel Core i7-11800H (25882 - 50365, n=20) | |
| Lenovo ThinkPad X1 Extreme G4-20Y5CTO1WW (3050 Ti) | |
| Lenovo ThinkPad P1 G4-20Y4Z9DVUS | |
| Lenovo ThinkPad X1 Extreme G4-20Y50040GE | |
| AIDA64 / Memory Write | |
| Genomsnitt av klass Workstation (55663 - 214520, n=25, senaste 2 åren) | |
| Genomsnitt Intel Core i7-11800H (22240 - 46214, n=20) | |
| Lenovo ThinkPad X1 Extreme G4-20Y5CTO1WW (3050 Ti) | |
| Lenovo ThinkPad P1 G4-20Y4Z9DVUS | |
| Lenovo ThinkPad X1 Extreme G4-20Y50040GE | |
| AIDA64 / Memory Latency | |
| Genomsnitt av klass Workstation (84.5 - 165.2, n=25, senaste 2 åren) | |
| Lenovo ThinkPad X1 Extreme G4-20Y50040GE | |
| Lenovo ThinkPad X1 Extreme G4-20Y5CTO1WW (3050 Ti) | |
| Lenovo ThinkPad P1 G4-20Y4Z9DVUS | |
| Genomsnitt Intel Core i7-11800H (71.9 - 104.1, n=44) | |
| Lenovo ThinkPad P1 G4-20Y30017GE | |
| Lenovo ThinkPad P1 G4-20Y4S0KS00 | |
* ... mindre är bättre
DPC-fördröjningar
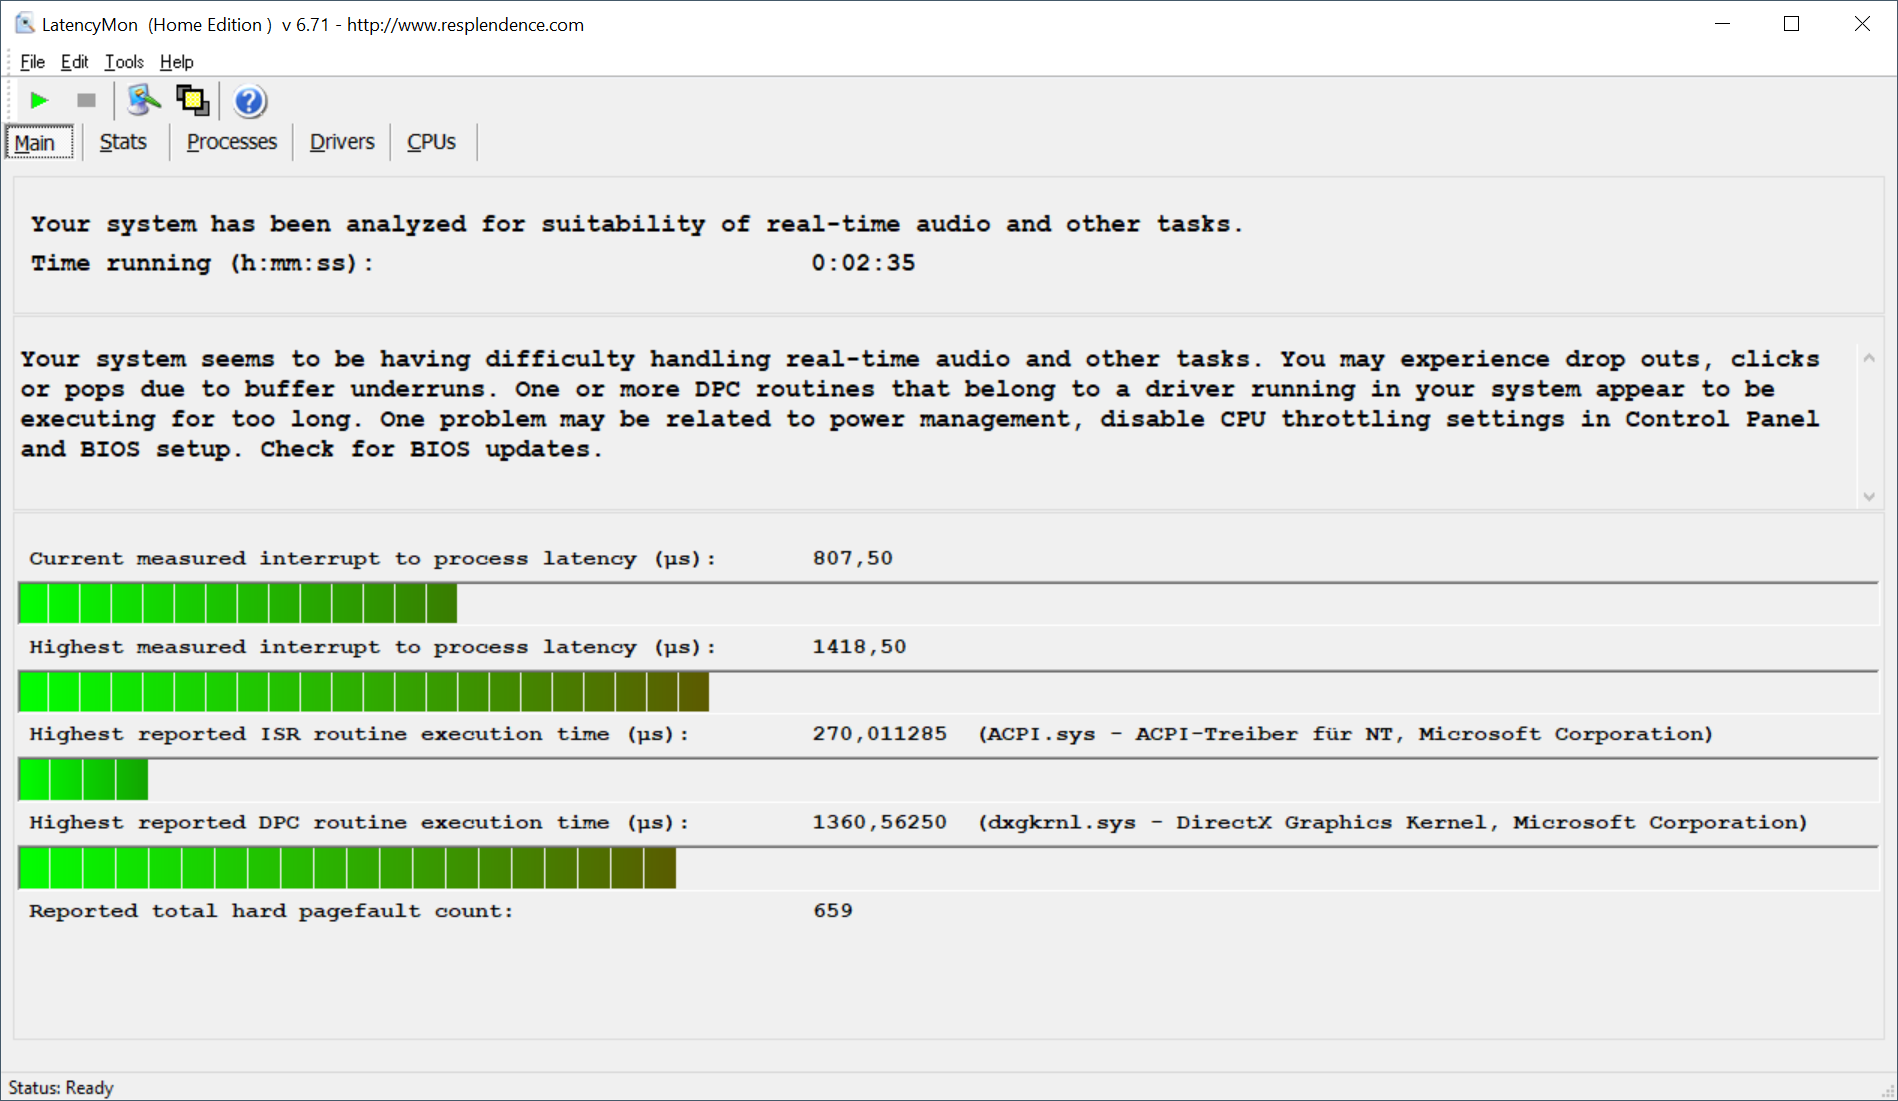
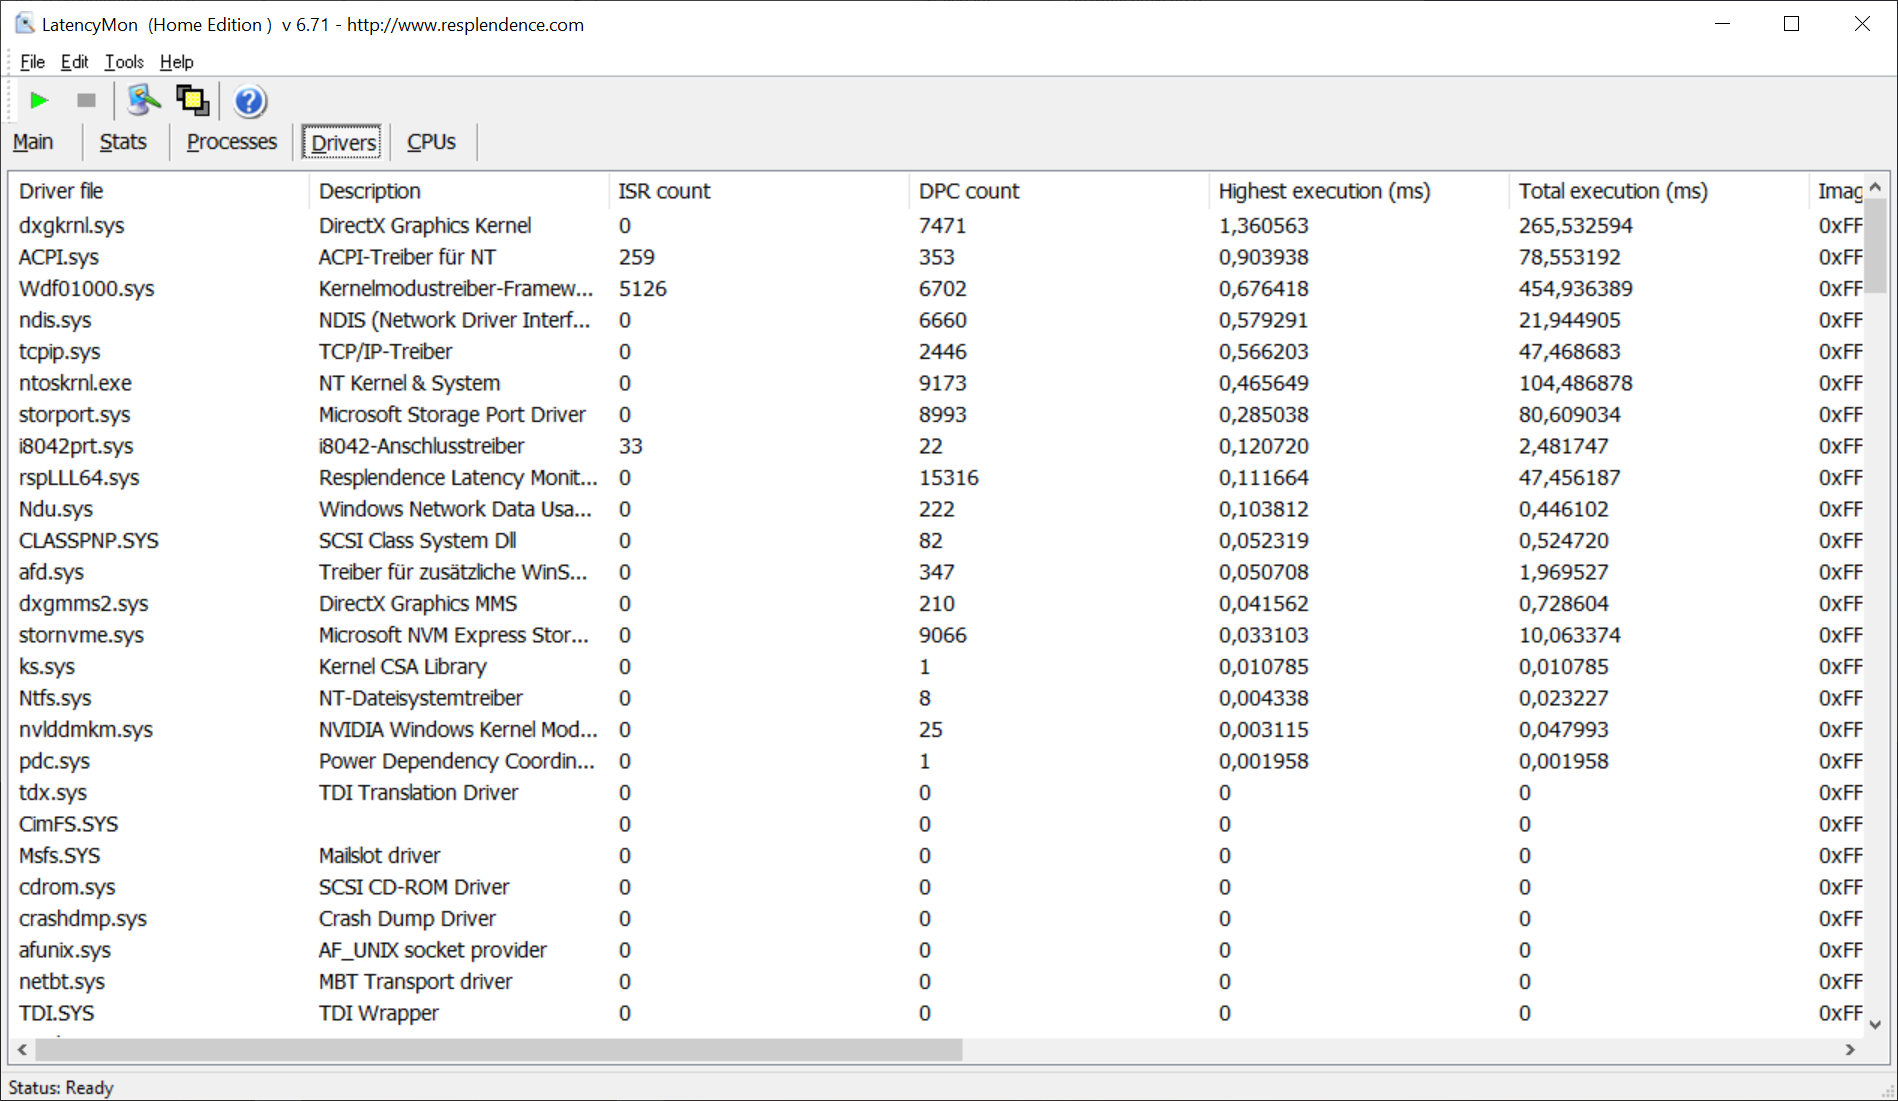
| DPC Latencies / LatencyMon - interrupt to process latency (max), Web, Youtube, Prime95 | |
| Lenovo ThinkPad P1 G4-20Y30017GE | |
| Lenovo ThinkPad X1 Extreme G4-20Y50040GE | |
| Lenovo ThinkPad P1 G4-20Y4Z9DVUS | |
| Lenovo ThinkPad X1 Extreme G4-20Y5CTO1WW (3050 Ti) | |
| Lenovo ThinkPad P1 G4-20Y4S0KS00 | |
* ... mindre är bättre

Grafikkort: Nvidia T1200 med 60 W
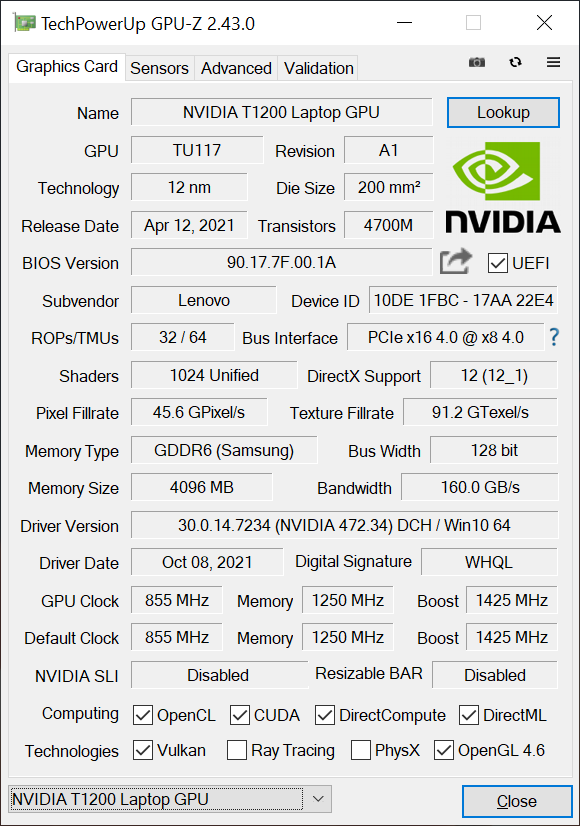
Grafikkortets prestanda har inte förändrats på grund av BIOS-uppdateringarna. Nvidias professionella T1200 GPU (baserad på TU117-chipet i konsumentmodellen GeForce GTX 1650 Ti) får fortfarande förbruka högst 60 W, och resultaten i benchmarks är föga förvånande på samma nivå som tidigare. I professionella riktmärken kan man fortfarande se fördelen med professionella drivrutiner eftersom till och med RTX 3070 kan bli omsprungen i vissa scenarier.
Prestandan förblir stabil även under längre belastningar och det krävande stresstestet Time Spy klaras utan problem med ett resultat på 99,2 %. Detta gäller även vårt spelstrest med The Witcher 3 där prestandan förblir helt stabil. GPU:n får förbruka högst 35 W i batteriläge, vilket är anledningen till att grafikprestandan sjunker med cirka 15 %
Ytterligare GPU-jämförelser finns tillgängligahär.
| 3DMark Performance rating - Percent | |
| Genomsnitt av klass Workstation | |
| Lenovo ThinkPad X1 Extreme G4-20Y50040GE -17! | |
| Lenovo ThinkPad P1 G4-20Y4S0KS00 | |
| Lenovo ThinkPad X1 Extreme G4-20Y5CTO1WW (3050 Ti) -17! | |
| Lenovo ThinkPad P1 G4-20Y30017GE | |
| Lenovo ThinkPad P1 G4-20Y4Z9DVUS | |
| Genomsnitt NVIDIA T1200 Laptop GPU | |
| 3DMark 11 - 1280x720 Performance GPU | |
| Genomsnitt av klass Workstation (10888 - 69594, n=25, senaste 2 åren) | |
| Lenovo ThinkPad X1 Extreme G4-20Y50040GE | |
| Lenovo ThinkPad P1 G4-20Y4S0KS00 | |
| Lenovo ThinkPad X1 Extreme G4-20Y5CTO1WW (3050 Ti) | |
| Lenovo ThinkPad P1 G4-20Y30017GE | |
| Lenovo ThinkPad P1 G4-20Y4Z9DVUS | |
| Genomsnitt NVIDIA T1200 Laptop GPU (12142 - 14614, n=3) | |
| 3DMark | |
| 1920x1080 Fire Strike Graphics | |
| Genomsnitt av klass Workstation (7578 - 52560, n=25, senaste 2 åren) | |
| Lenovo ThinkPad X1 Extreme G4-20Y50040GE | |
| Lenovo ThinkPad P1 G4-20Y4S0KS00 | |
| Lenovo ThinkPad X1 Extreme G4-20Y5CTO1WW (3050 Ti) | |
| Lenovo ThinkPad P1 G4-20Y30017GE | |
| Lenovo ThinkPad P1 G4-20Y4Z9DVUS | |
| Genomsnitt NVIDIA T1200 Laptop GPU (9030 - 10266, n=3) | |
| 2560x1440 Time Spy Graphics | |
| Genomsnitt av klass Workstation (2725 - 24806, n=25, senaste 2 åren) | |
| Lenovo ThinkPad X1 Extreme G4-20Y50040GE | |
| Lenovo ThinkPad P1 G4-20Y4S0KS00 | |
| Lenovo ThinkPad X1 Extreme G4-20Y5CTO1WW (3050 Ti) | |
| Lenovo ThinkPad P1 G4-20Y30017GE | |
| Lenovo ThinkPad P1 G4-20Y4Z9DVUS | |
| Genomsnitt NVIDIA T1200 Laptop GPU (3229 - 3651, n=3) | |
| 3DMark 11 Performance | 14344 poäng | |
| 3DMark Fire Strike Score | 9310 poäng | |
| 3DMark Time Spy Score | 3937 poäng | |
Hjälp | ||
The Witcher 3 FPS chart
| låg | med. | hög | ultra | QHD | |
|---|---|---|---|---|---|
| The Witcher 3 (2015) | 198 | 125 | 71 | 36.7 | |
| Dota 2 Reborn (2015) | 157 | 138 | 128 | 116 | |
| Final Fantasy XV Benchmark (2018) | 102 | 56.5 | 39 | 26.6 | |
| X-Plane 11.11 (2018) | 109 | 94 | 75.6 |
Utsläpp och energi
Bullerutsläpp
Fläktens egenskaper har inte ändrats. De två fläktarna når fortfarande snabbt sitt maximala varvtal under belastning, vilket motsvarar en ljudnivå på ~47 dB(A). Vi kunde inte upptäcka några störande elektroniska ljud eller spolningsvisslingar i den här testenheten.
| Lenovo ThinkPad P1 G4-20Y4Z9DVUS T1200 Laptop GPU, i7-11800H, Samsung PM9A1 MZVL2512HCJQ | Lenovo ThinkPad P1 G4-20Y30017GE T1200 Laptop GPU, i7-11800H, Samsung PM9A1 MZVL2512HCJQ | Lenovo ThinkPad P1 G4-20Y4S0KS00 GeForce RTX 3070 Laptop GPU, i7-11850H, Samsung PM9A1 MZVL21T0HCLR | Lenovo ThinkPad X1 Extreme G4-20Y5CTO1WW (3050 Ti) GeForce RTX 3050 Ti Laptop GPU, i7-11800H, Samsung PM9A1 MZVL21T0HCLR | Lenovo ThinkPad X1 Extreme G4-20Y50040GE GeForce RTX 3080 Laptop GPU, i9-11950H, Kioxia XG7 KXG7AZNV1T02 | |
|---|---|---|---|---|---|
| Noise | 0% | 2% | 1% | -2% | |
| av / miljö * (dB) | 24.3 | 24.3 -0% | 23.8 2% | 23.52 3% | 24.7 -2% |
| Idle Minimum * (dB) | 24.3 | 24.3 -0% | 23.8 2% | 23.52 3% | 24.7 -2% |
| Idle Average * (dB) | 24.3 | 24.3 -0% | 23.8 2% | 23.52 3% | 24.7 -2% |
| Idle Maximum * (dB) | 26.6 | 26.6 -0% | 28.3 -6% | 23.52 12% | 28.1 -6% |
| Load Average * (dB) | 46.8 | 46.8 -0% | 38.6 18% | 42.9 8% | 42.5 9% |
| Witcher 3 ultra * (dB) | 46.8 | 46.8 -0% | 47.4 -1% | 52.5 -12% | 46.4 1% |
| Load Maximum * (dB) | 46.8 | 46.8 -0% | 47.4 -1% | 52.45 -12% | 52.1 -11% |
* ... mindre är bättre
Temperatur
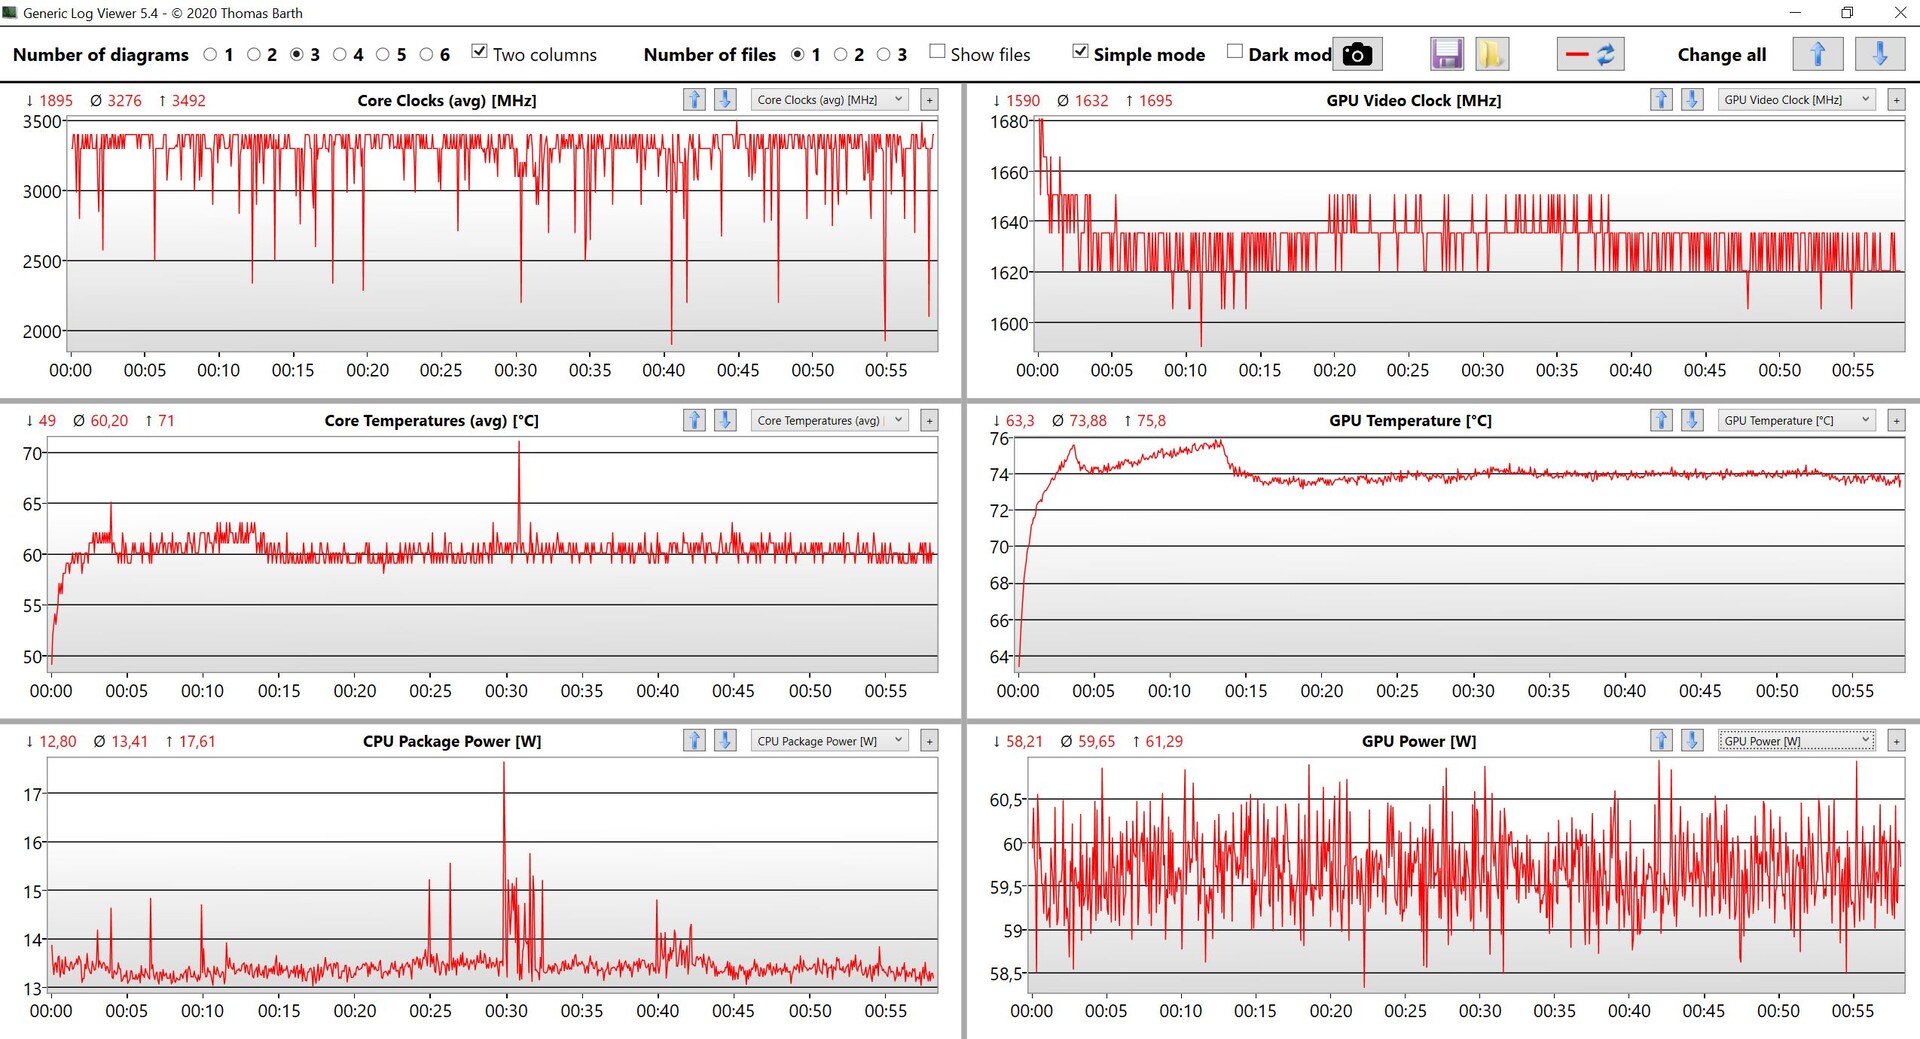
Yttemperaturerna under belastning är nu något högre än tidigare eftersom komponenternas energiförbrukning under kombinerad belastning har förskjutits en aning. Den dedikerade GPU:n prioriterades tydligt i stresstestet i vår förhandsgranskning, och den fortsatte att köra på 60 W, varför processorn drogs ner till bara 20 W. Med det senaste BIOS 1.13 har detta förhållande nu skiftat och processorn lägger sig på 35 W efter några minuter, medan Nvidia T1200 nu körs på 45 W.
(-) Den maximala temperaturen på ovansidan är 49.9 °C / 122 F, jämfört med genomsnittet av 38.2 °C / 101 F , allt från 22.2 till 69.8 °C för klassen Workstation.
(-) Botten värms upp till maximalt 56.7 °C / 134 F, jämfört med genomsnittet av 41.1 °C / 106 F
(+) Vid tomgångsbruk är medeltemperaturen för ovansidan 24.9 °C / 77 F, jämfört med enhetsgenomsnittet på 32 °C / ### class_avg_f### F.
(+) Handledsstöden och pekplattan når maximal hudtemperatur (33.9 °C / 93 F) och är därför inte varma.
(-) Medeltemperaturen för handledsstödsområdet på liknande enheter var 27.8 °C / 82 F (-6.1 °C / -11 F).
| Lenovo ThinkPad P1 G4-20Y4Z9DVUS Intel Core i7-11800H, NVIDIA T1200 Laptop GPU | Lenovo ThinkPad X1 Extreme G4-20Y5CTO1WW (3050 Ti) Intel Core i7-11800H, NVIDIA GeForce RTX 3050 Ti Laptop GPU | Lenovo ThinkPad X1 Extreme G4-20Y50040GE Intel Core i9-11950H, NVIDIA GeForce RTX 3080 Laptop GPU | Lenovo ThinkPad P1 G4-20Y30017GE Intel Core i7-11800H, NVIDIA T1200 Laptop GPU | Lenovo ThinkPad P1 G4-20Y4S0KS00 Intel Core i7-11850H, NVIDIA GeForce RTX 3070 Laptop GPU | |
|---|---|---|---|---|---|
| Heat | -4% | -5% | 2% | -5% | |
| Maximum Upper Side * (°C) | 49.9 | 49 2% | 51.4 -3% | 50.6 -1% | 51 -2% |
| Maximum Bottom * (°C) | 56.7 | 44.4 22% | 55.9 1% | 53.6 5% | 53.5 6% |
| Idle Upper Side * (°C) | 25.5 | 32.1 -26% | 27.2 -7% | 25 2% | 28.8 -13% |
| Idle Bottom * (°C) | 26.2 | 29.8 -14% | 28.8 -10% | 25.7 2% | 29.3 -12% |
* ... mindre är bättre
Högtalare
Lenovo ThinkPad P1 G4-20Y4Z9DVUS ljudanalys
(+) | högtalare kan spela relativt högt (84.3 dB)
Bas 100 - 315 Hz
(±) | reducerad bas - i genomsnitt 12.2% lägre än medianen
(±) | linjäriteten för basen är genomsnittlig (9.8% delta till föregående frekvens)
Mellan 400 - 2000 Hz
(+) | balanserad mellan - endast 3.4% från medianen
(+) | mids är linjära (3.4% delta till föregående frekvens)
Högsta 2 - 16 kHz
(+) | balanserade toppar - endast 2.9% från medianen
(+) | toppar är linjära (5% delta till föregående frekvens)
Totalt 100 - 16 000 Hz
(+) | det totala ljudet är linjärt (11.8% skillnad mot median)
Jämfört med samma klass
» 16% av alla testade enheter i den här klassen var bättre, 3% liknande, 81% sämre
» Den bästa hade ett delta på 7%, genomsnittet var 17%, sämst var 35%
Jämfört med alla testade enheter
» 8% av alla testade enheter var bättre, 3% liknande, 89% sämre
» Den bästa hade ett delta på 4%, genomsnittet var 24%, sämst var 134%
Energiförbrukning
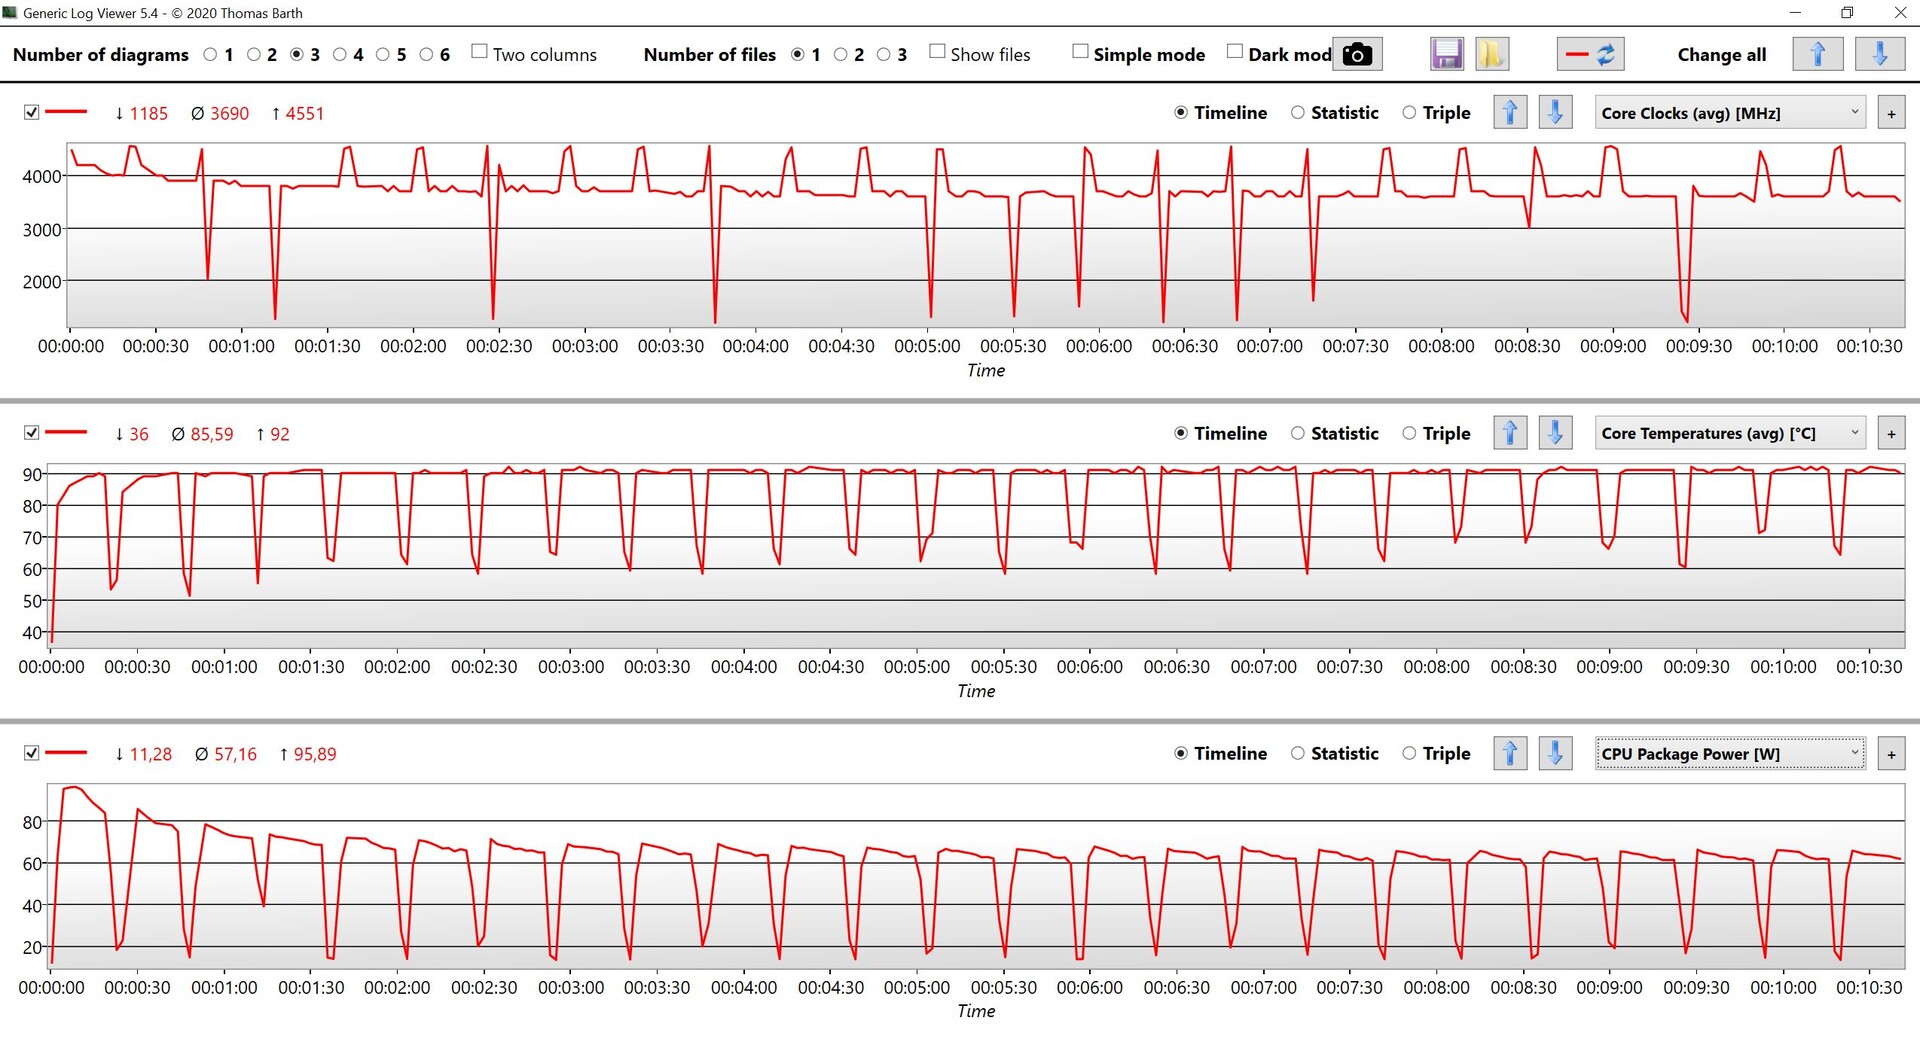
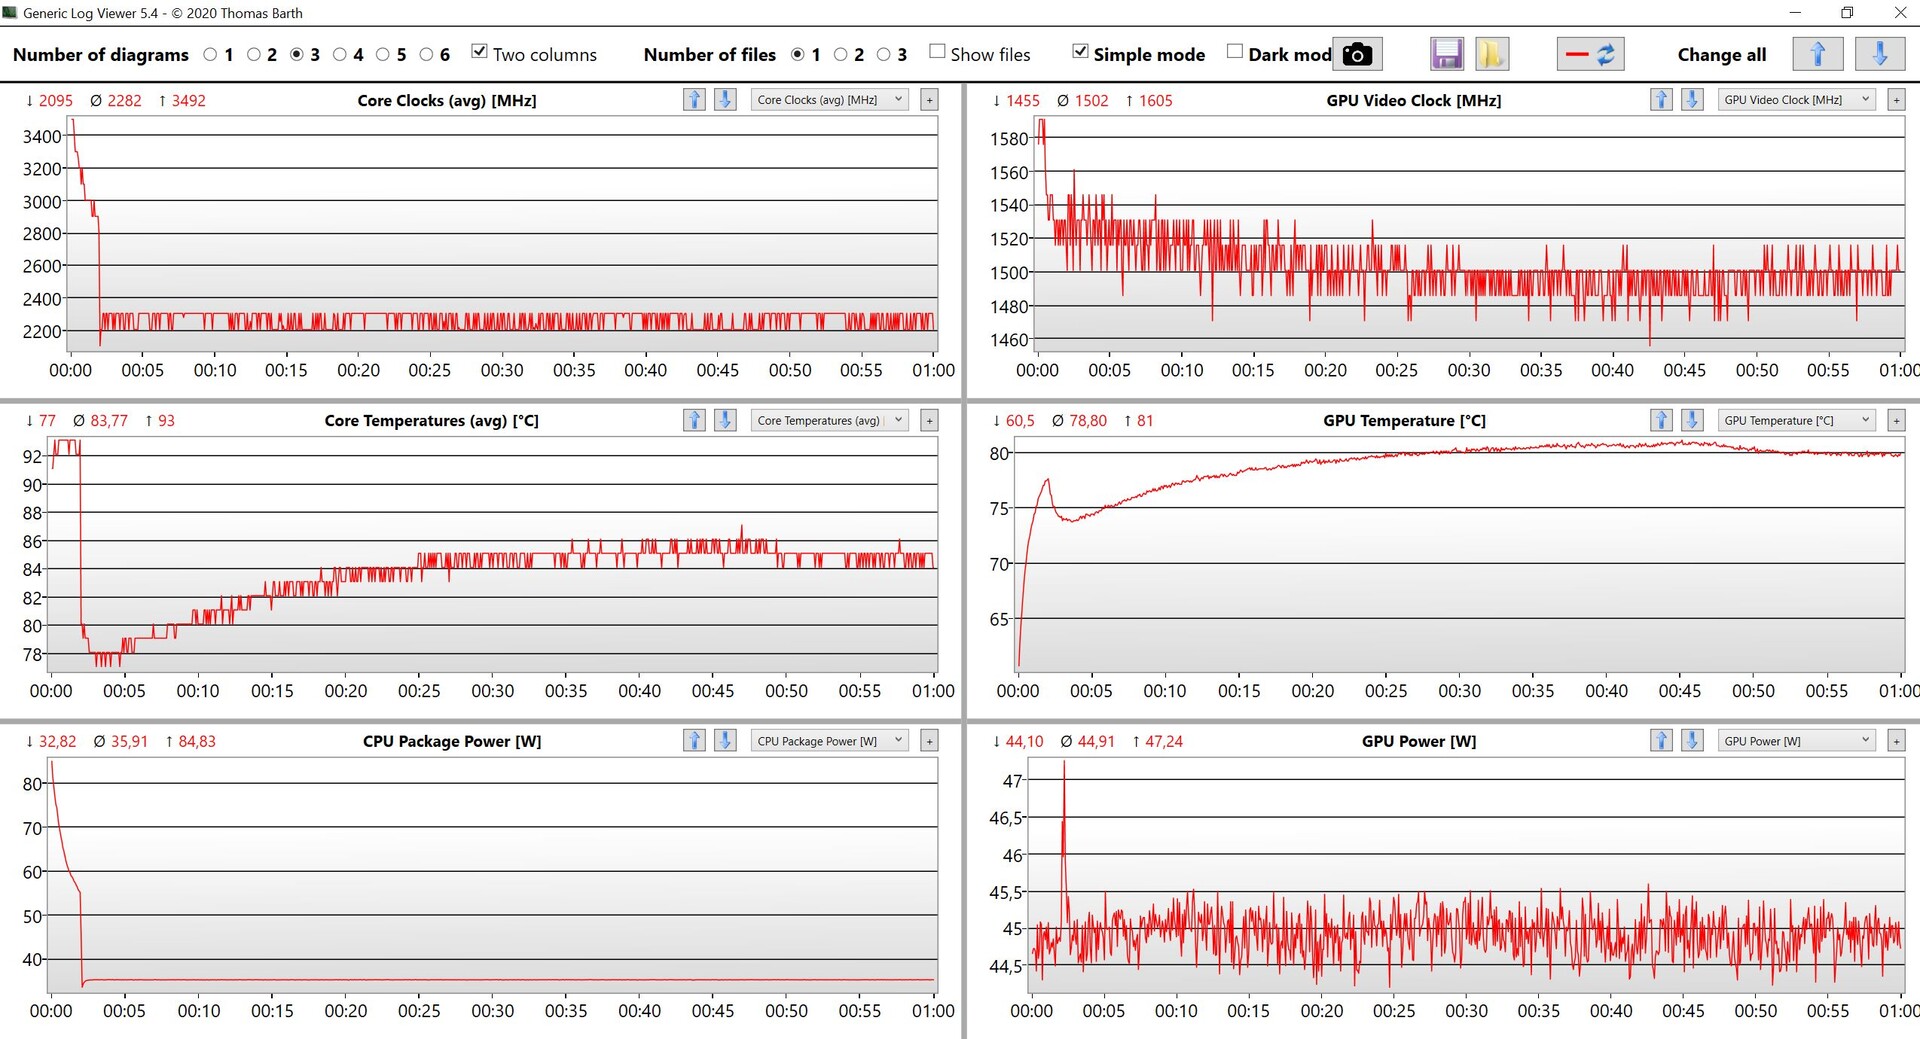
Strömförbrukningen under belastning är nu betydligt högre när processorn utsätts för större påfrestningar. I stresstestet fastställer vi ett maximum på 170,8 W i början av testet, men värdet lägger sig först på 122 W under några minuter och sedan på 111 W, vilket är i linje med processorns sjunkande TDP. Standbyförbrukningen på något norr om 2 W är fortfarande för hög.
| Av/Standby | |
| Låg belastning | |
| Hög belastning |
|
Förklaring:
min: | |
Energiförbrukning: Witcher 3 / Stress-test
Energiförbrukning med extern skärm
Batteriets livslängd
Batteritiderna är praktiskt taget identiska med dem för första recensionsenheten av ThinkPad P1 G4. Vid en ljusstyrka på 150 cd/m² (motsvarar 68 % av maximal ljusstyrka i det här fallet) pågår vårt WLAN-test i knappt 9 timmar och vid maximal ljusstyrka i drygt 6 timmar. Standard WQHD-panelen förblir alltså helt klart det bättre valet än de valbara 4K-panelerna när det gäller uthållighet.
| Battery Runtime | |
| WiFi Websurfing | |
| Lenovo ThinkPad P1 G4-20Y30017GE | |
| Lenovo ThinkPad P1 G4-20Y4Z9DVUS | |
| Genomsnitt av klass Workstation (2.47 - 14.2, n=25, senaste 2 åren) | |
| Lenovo ThinkPad P1 G4-20Y4S0KS00 | |
| Lenovo ThinkPad X1 Extreme G4-20Y50040GE | |
| Lenovo ThinkPad X1 Extreme G4-20Y5CTO1WW (3050 Ti) | |
| WiFi Websurfing max. Brightness | |
| Genomsnitt av klass Workstation (4.55 - 8.98, n=7, senaste 2 åren) | |
| Lenovo ThinkPad P1 G4-20Y30017GE | |
| Lenovo ThinkPad P1 G4-20Y4Z9DVUS | |
| Lenovo ThinkPad P1 G4-20Y4S0KS00 | |
| Lenovo ThinkPad X1 Extreme G4-20Y5CTO1WW (3050 Ti) | |
| Lenovo ThinkPad X1 Extreme G4-20Y50040GE | |
För
Emot
Omdöme - ThinkPad P1 G4 - Nu med mer processorkraft
Lenovo har nu förbättrat CPU-prestandan märkbart med den senaste BIOS-versionen, och det spelar inte längre någon roll om du väljer en konfiguration med konventionell kylning eller en modell med en starkare GPU och ångkammarkylning. Vid kombinerad belastning är grafikkortets prestanda likartad i båda versionerna, medan processorn med konventionell kylning till och med har en liten fördel (35 mot 30 W i stresstestet)
Dessutom visar våra benchmarks också tydligt att de valfria Core i9-processorerna inte ger någon extra prestanda jämfört med standard Core i7-11800H. Den enda anledningen till en uppgradering i våra ögon är det vPro-stöd som de valfria chipen erbjuder.
Med den senaste BIOS-versionen 1.13 spelar det inte längre någon roll om du väljer en konfiguration med konventionell eller ångkammarkylning eftersom CPU-prestandan mer eller mindre ligger på samma nivå.
Det faktum att Lenovo förlitar sig på flera leverantörer för WQHD-standardpanelen är inget stort problem för kunden i det här fallet eftersom prestandan hos de två panelerna är mycket jämförbar, och du kommer inte att märka någon skillnad i praktiken. Du behöver alltså inte oroa dig för ett panellotteri som i vissa äldre ThinkPad-modeller.
Pris och tillgänglighet
Vår testenhet är omedelbart tillgänglig på Campuspoint för 2 419 euro. Återförsäljaren har också tillgång till Lenovos campusprogram, som kan ge dig den här konfigurationen för 2 279 euro.
Lenovo ThinkPad P1 G4-20Y4Z9DVUS
- 02/01/2022 v7 (old)
Andreas Osthoff
Price comparison
