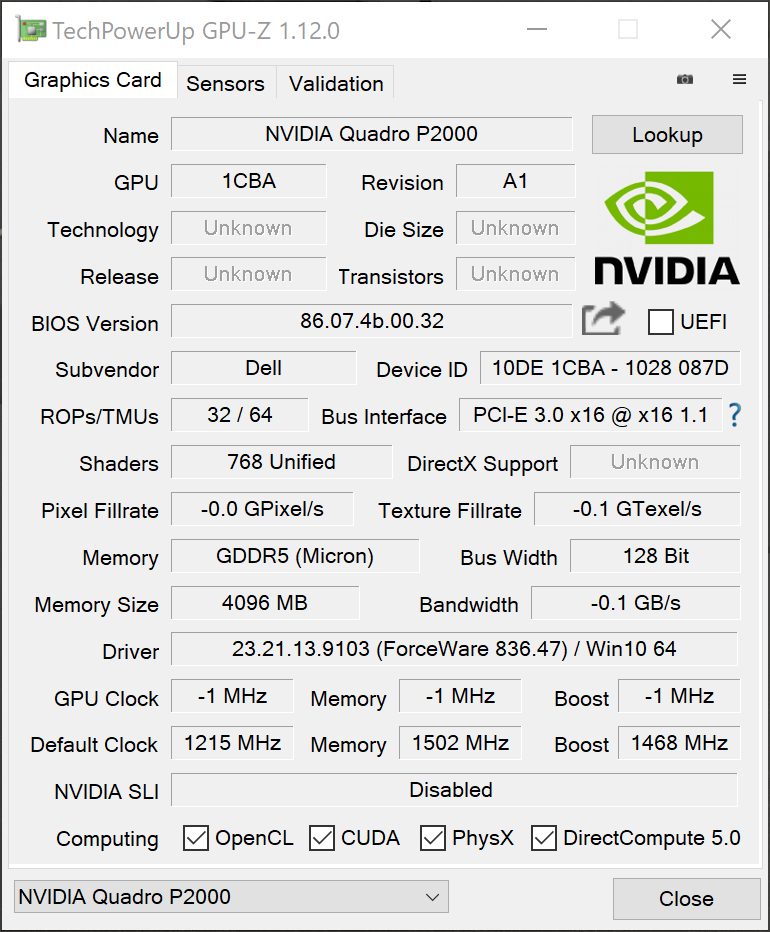
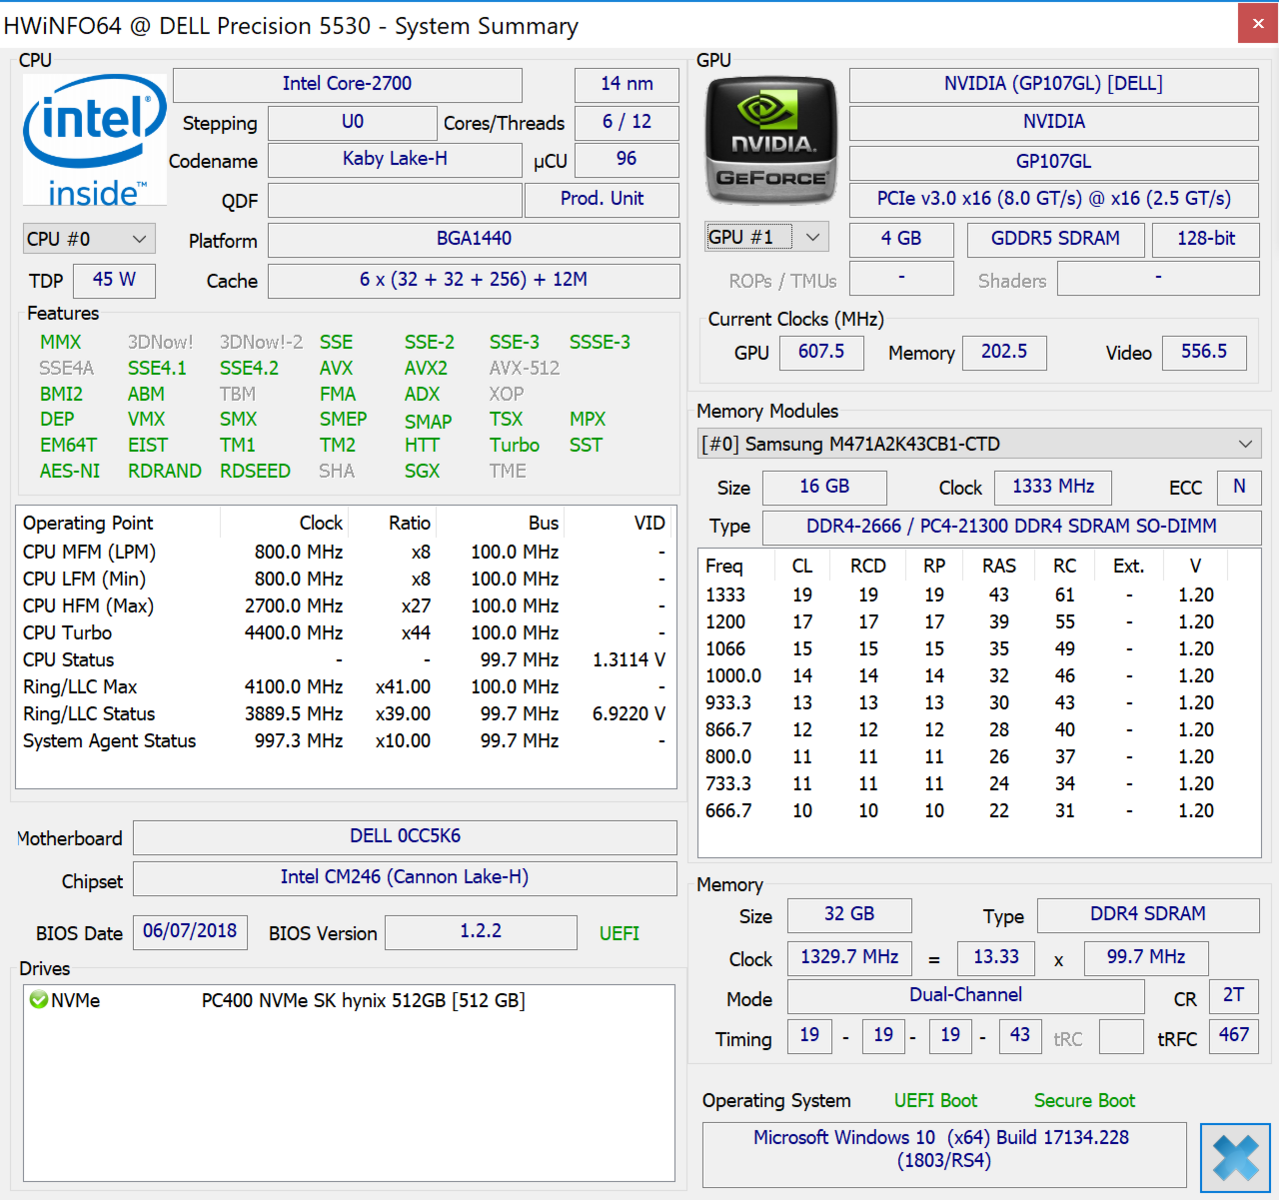
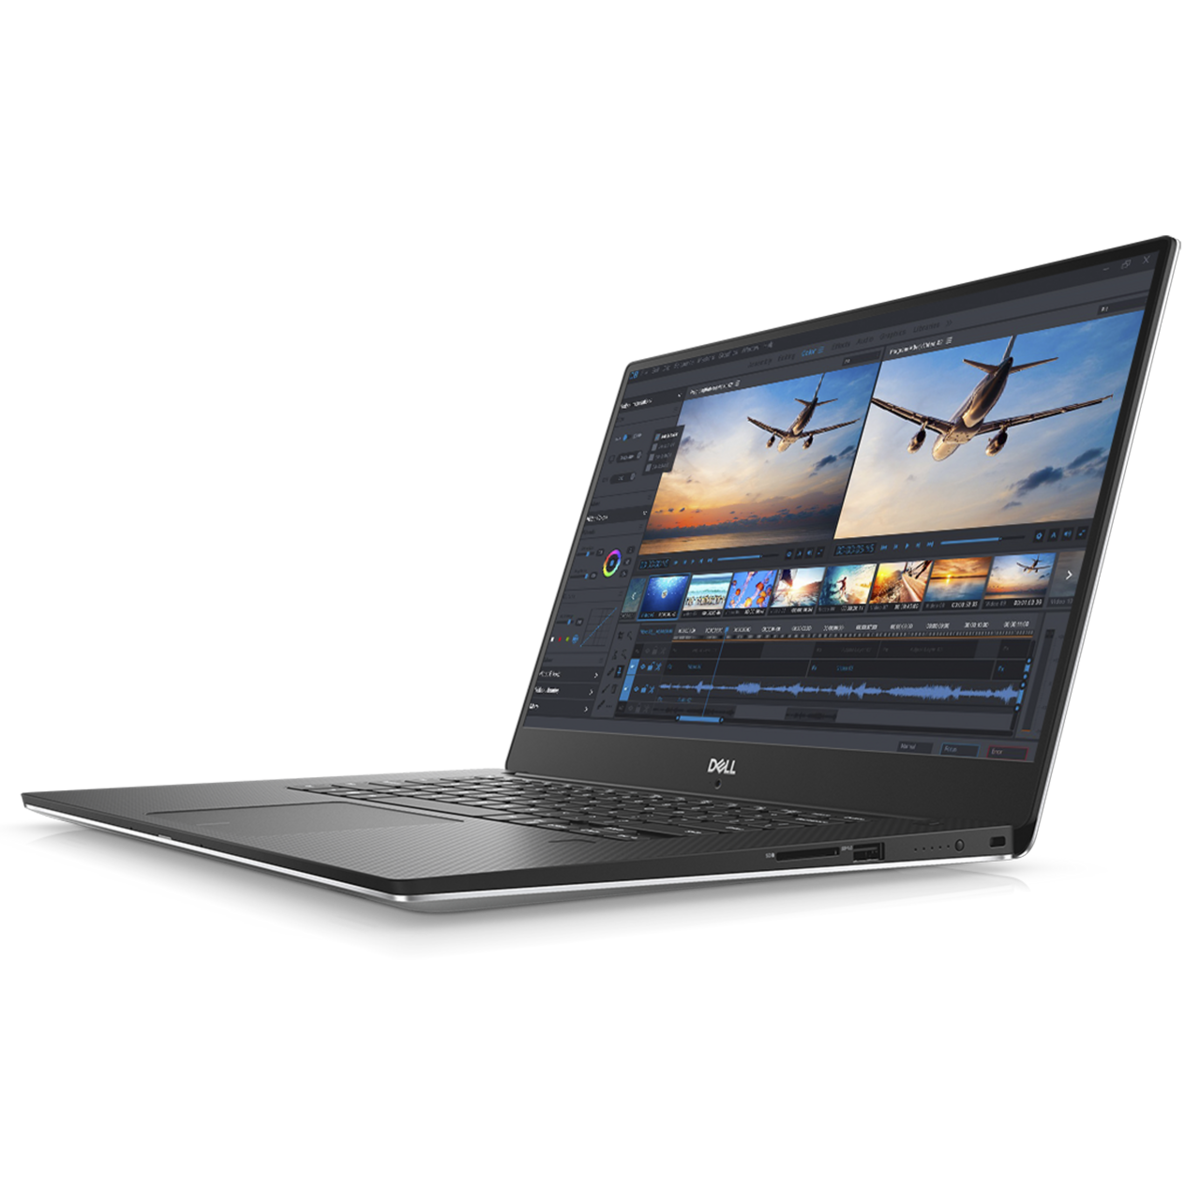
Test: Dell Precision 5530 (Xeon E-2176M, Quadro P2000) Arbetsstation (Sammanfattning)
| SD Card Reader | |
| average JPG Copy Test (av. of 3 runs) | |
| HP ZBook 15 G4-Y4E80AV (Toshiba Exceria Pro SDXC 64 GB UHS-II) | |
| Dell Precision 3530 (Toshiba Exceria Pro SDXC 64 GB UHS-II) | |
| Dell Precision 5530 Xeon E-2176M (Toshiba Exceria Pro SDXC 64 GB UHS-II) | |
| Dell Precision 5520 UHD (Toshiba Exceria Pro SDXC 64 GB UHS-II) | |
| Lenovo ThinkPad P51 20HH0016GE (Toshiba Exceria Pro SDXC 64 GB UHS-II) | |
| MSI WS63VR 7RL-023US | |
| Genomsnitt av klass Workstation (49.6 - 681, n=14, senaste 2 åren) | |
| Lenovo ThinkPad P52S-20LB001FUS (Toshiba Exceria Pro SDXC 64 GB UHS-II) | |
| maximum AS SSD Seq Read Test (1GB) | |
| Dell Precision 5520 UHD (Toshiba Exceria Pro SDXC 64 GB UHS-II) | |
| Genomsnitt av klass Workstation (87.6 - 1455, n=14, senaste 2 åren) | |
| Lenovo ThinkPad P51 20HH0016GE (Toshiba Exceria Pro SDXC 64 GB UHS-II) | |
| MSI WS63VR 7RL-023US | |
| HP ZBook 15 G4-Y4E80AV (Toshiba Exceria Pro SDXC 64 GB UHS-II) | |
| Dell Precision 3530 (Toshiba Exceria Pro SDXC 64 GB UHS-II) | |
| Dell Precision 5530 Xeon E-2176M (Toshiba Exceria Pro SDXC 64 GB UHS-II) | |
| Lenovo ThinkPad P52S-20LB001FUS (Toshiba Exceria Pro SDXC 64 GB UHS-II) | |
| |||||||||||||||||||||||||
Distribution av ljusstyrkan: 90 %
Mitt på batteriet: 451.7 cd/m²
Kontrast: 1129:1 (Svärta: 0.4 cd/m²)
ΔE ColorChecker Calman: 3.11 | ∀{0.5-29.43 Ø4.72}
calibrated: 3.07
ΔE Greyscale Calman: 3.7 | ∀{0.09-98 Ø4.97}
98% sRGB (Argyll 1.6.3 3D)
69% AdobeRGB 1998 (Argyll 1.6.3 3D)
76.4% AdobeRGB 1998 (Argyll 3D)
98.4% sRGB (Argyll 3D)
76.5% Display P3 (Argyll 3D)
Gamma: 2.11
CCT: 6492 K
| Dell Precision 5530 Xeon E-2176M Sharp SHP148D / LQ156D1, IGZO, 15.6", 3840x2160 | Dell Precision 5520 UHD SHP1476, IPS, 15.6", 3840x2160 | Lenovo ThinkPad P52S-20LB001FUS Lenovo LEN40BD, IPS, 15.6", 3840x2160 | Dell Precision 3530 BOE BOE06F1, IPS, 15.6", 1920x1080 | HP ZBook 15 G4-Y4E80AV LG Philips LGD057E, IPS, 15.6", 1920x1080 | Lenovo ThinkPad P51 20HH0016GE LEN40BD, B156ZAN02.1, IPS, 15.6", 3840x2160 | MSI WS63VR 7RL-023US SAMSUNG LƒFL156FL02-101 , IPS, 15.6", 3840x2160 | Apple MacBook Pro 15 2018 (2.6 GHz, 560X) APPA040, IPS, 15.4", 2880x1800 | |
|---|---|---|---|---|---|---|---|---|
| Display | -7% | -12% | -6% | -18% | 15% | -34% | 15% | |
| Display P3 Coverage (%) | 76.5 | 67.4 -12% | 67.3 -12% | 72.8 -5% | 64 -16% | 86.3 13% | 47.43 -38% | 98.7 29% |
| sRGB Coverage (%) | 98.4 | 98.5 0% | 89.4 -9% | 94.6 -4% | 82.7 -16% | 99.5 1% | 71.4 -27% | 99.9 2% |
| AdobeRGB 1998 Coverage (%) | 76.4 | 68.9 -10% | 65.4 -14% | 69.3 -9% | 60.4 -21% | 99.3 30% | 49 -36% | 86.6 13% |
| Response Times | -24% | 28% | 6% | 21% | 20% | 19% | 9% | |
| Response Time Grey 50% / Grey 80% * (ms) | 48 ? | 59.2 ? -23% | 43.2 ? 10% | 40.4 ? 16% | 39.2 ? 18% | 40.8 ? 15% | 36.8 ? 23% | 43.2 ? 10% |
| Response Time Black / White * (ms) | 33.6 ? | 41.6 ? -24% | 18 ? 46% | 34.8 ? -4% | 25.6 ? 24% | 25.2 ? 25% | 28.4 ? 15% | 31.2 ? 7% |
| PWM Frequency (Hz) | 1000 | 980 | 1053 ? | 20830 ? | 1351 ? | 117000 ? | ||
| Screen | -4% | -6% | -23% | -10% | 4% | -33% | 31% | |
| Brightness middle (cd/m²) | 451.7 | 372.4 -18% | 305.5 -32% | 285.7 -37% | 321 -29% | 317 -30% | 259.4 -43% | 520 15% |
| Brightness (cd/m²) | 440 | 368 -16% | 282 -36% | 275 -37% | 320 -27% | 309 -30% | 247 -44% | 492 12% |
| Brightness Distribution (%) | 90 | 90 0% | 78 -13% | 85 -6% | 89 -1% | 89 -1% | 85 -6% | 88 -2% |
| Black Level * (cd/m²) | 0.4 | 0.48 -20% | 0.24 40% | 0.31 23% | 0.29 28% | 0.36 10% | 0.43 -8% | 0.39 2% |
| Contrast (:1) | 1129 | 776 -31% | 1273 13% | 922 -18% | 1107 -2% | 881 -22% | 603 -47% | 1333 18% |
| Colorchecker dE 2000 * | 3.11 | 2.6 16% | 3.51 -13% | 5.84 -88% | 4.5 -45% | 2.7 13% | 5.5 -77% | 1.2 61% |
| Colorchecker dE 2000 max. * | 8.62 | 5.6 35% | 7.28 16% | 8.76 -2% | 9.5 -10% | 4.1 52% | 12.7 -47% | 2.3 73% |
| Colorchecker dE 2000 calibrated * | 3.07 | 3.15 -3% | 3.14 -2% | |||||
| Greyscale dE 2000 * | 3.7 | 3.7 -0% | 4 -8% | 6.5 -76% | 2.9 22% | 3 19% | 3.6 3% | 1.3 65% |
| Gamma | 2.11 104% | 2.14 103% | 2.18 101% | 2.383 92% | 2.27 97% | 2.27 97% | 2.24 98% | 2.18 101% |
| CCT | 6492 100% | 7096 92% | 7291 89% | 7176 91% | 6519 100% | 6077 107% | 7163 91% | 6738 96% |
| Color Space (Percent of AdobeRGB 1998) (%) | 69 | 63 -9% | 58 -16% | 62 -10% | 54.2 -21% | 87.6 27% | 45 -35% | |
| Color Space (Percent of sRGB) (%) | 98 | 99 1% | 89 -9% | 94 -4% | 82.6 -16% | 99.5 2% | 71 -28% | |
| Totalt genomsnitt (program/inställningar) | -12% /
-7% | 3% /
-3% | -8% /
-16% | -2% /
-7% | 13% /
8% | -16% /
-26% | 18% /
23% |
* ... mindre är bättre
Visa svarstider
| ↔ Svarstid svart till vitt | ||
|---|---|---|
| 33.6 ms ... stiga ↗ och falla ↘ kombinerat | ↗ 19.6 ms stiga | 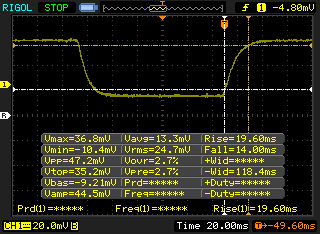 |
| ↘ 14 ms hösten | ||
| Skärmen visar långsamma svarsfrekvenser i våra tester och kommer att vara otillfredsställande för spelare. I jämförelse sträcker sig alla testade enheter från 0.1 (minst) till 240 (maximalt) ms. » 90 % av alla enheter är bättre. Detta innebär att den uppmätta svarstiden är sämre än genomsnittet av alla testade enheter (19.8 ms). | ||
| ↔ Svarstid 50 % grått till 80 % grått | ||
| 48 ms ... stiga ↗ och falla ↘ kombinerat | ↗ 24.4 ms stiga | 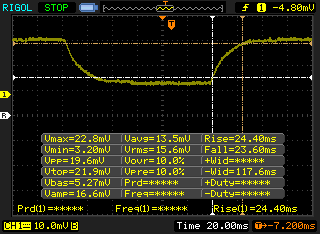 |
| ↘ 23.6 ms hösten | ||
| Skärmen visar långsamma svarsfrekvenser i våra tester och kommer att vara otillfredsställande för spelare. I jämförelse sträcker sig alla testade enheter från 0.165 (minst) till 636 (maximalt) ms. » 82 % av alla enheter är bättre. Detta innebär att den uppmätta svarstiden är sämre än genomsnittet av alla testade enheter (31 ms). | ||
Skärmflimmer / PWM (Puls-Width Modulation)
| Skärmflimmer / PWM upptäckt | 1000 Hz | 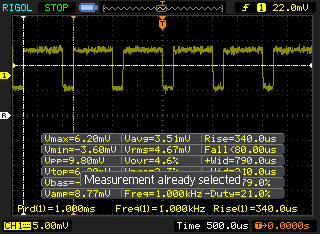 | |
Displayens bakgrundsbelysning flimrar vid 1000 Hz (i värsta fall, t.ex. med PWM) . Frekvensen för 1000 Hz är ganska hög, så de flesta användare som är känsliga för PWM bör inte märka något flimmer. Som jämförelse: 52 % av alla testade enheter använder inte PWM för att dämpa skärmen. Om PWM upptäcktes mättes ett medelvärde av 7778 (minst: 5 - maximum: 343500) Hz. | |||
| wPrime 2.10 - 1024m | |
| Dell Precision 5520 UHD | |
| Eurocom Tornado F5W | |
| Genomsnitt av klass Workstation (n=1senaste 2 åren) | |
| Genomsnitt Intel Xeon E-2176M (147 - 179.6, n=2) | |
| Dell Precision 5530 Xeon E-2176M | |
* ... mindre är bättre
| PCMark 8 Home Score Accelerated v2 | 3831 poäng | |
| PCMark 8 Creative Score Accelerated v2 | 5351 poäng | |
| PCMark 8 Work Score Accelerated v2 | 4666 poäng | |
| PCMark 10 Score | 5072 poäng | |
Hjälp | ||
| Dell Precision 5530 Xeon E-2176M SK hynix PC400 512 GB | Dell Precision 5520 UHD Samsung SM961 MZVKW512HMJP m.2 PCI-e | Lenovo ThinkPad P52S-20LB001FUS Samsung SSD PM981 MZVLB1T0HALR | Dell Precision 3530 SK hynix PC400 512 GB | HP ZBook 15 G4-Y4E80AV Samsung SSD SM961 1TB M.2 MZVKW1T0HMLH | Lenovo ThinkPad P51 20HH0016GE Samsung PM961 NVMe MZVLW512HMJP | MSI WS63VR 7RL-023US Toshiba NVMe THNSN5512GPU7 | Apple MacBook Pro 15 2018 (2.6 GHz, 560X) Apple SSD AP0512 | Genomsnitt SK hynix PC400 512 GB | |
|---|---|---|---|---|---|---|---|---|---|
| AS SSD | 38% | 25% | 0% | 48% | 29% | -17% | -48% | -2% | |
| Copy Game MB/s (MB/s) | 921 | 1050 | 982 | 1140 | 1050 ? | ||||
| Copy Program MB/s (MB/s) | 372.8 | 346.1 | 325.4 | 425.6 | 346 ? | ||||
| Copy ISO MB/s (MB/s) | 1659 | 1701 | 1486 | 1607 | 1701 ? | ||||
| Score Total (Points) | 2922 | 3681 26% | 4038 38% | 3013 3% | 4303 47% | 3424 17% | 1979 -32% | 2119 -27% | 2905 ? -1% |
| Score Write (Points) | 1121 | 1379 23% | 1468 31% | 1138 2% | 1472 31% | 917 -18% | 557 -50% | 347 -69% | 1102 ? -2% |
| Score Read (Points) | 1226 | 1554 27% | 1703 39% | 1288 5% | 1902 55% | 1690 38% | 962 -22% | 1199 -2% | 1228 ? 0% |
| Access Time Write * (ms) | 0.053 | 0.023 57% | 0.04 25% | 0.053 -0% | 0.023 57% | 0.025 53% | 0.033 38% | 0.053 ? -0% | |
| Access Time Read * (ms) | 0.073 | 0.038 48% | 0.04 45% | 0.099 -36% | 0.034 53% | 0.032 56% | 0.128 -75% | 0.225 -208% | 0.082 ? -12% |
| 4K-64 Write (MB/s) | 926 | 1055 14% | 1245 34% | 908 -2% | 1136 23% | 623 -33% | 314 -66% | 163.5 -82% | 899 ? -3% |
| 4K-64 Read (MB/s) | 970 | 1223 26% | 1524 57% | 994 2% | 1578 63% | 1372 41% | 710 -27% | 965 -1% | 973 ? 0% |
| 4K Write (MB/s) | 92.8 | 155.3 67% | 100.5 8% | 102.8 11% | 158 70% | 143.1 54% | 114.6 23% | 18.78 -80% | 95.9 ? 3% |
| 4K Read (MB/s) | 38.43 | 51.5 34% | 44.33 15% | 25.98 -32% | 51.7 35% | 55.6 45% | 40.2 5% | 9.46 -75% | 34.5 ? -10% |
| Seq Write (MB/s) | 1022 | 1694 66% | 1220 19% | 1272 24% | 1777 74% | 1506 47% | 1287 26% | 1644 61% | 1075 ? 5% |
| Seq Read (MB/s) | 2169 | 2799 29% | 1351 -38% | 2682 24% | 2719 25% | 2624 21% | 2133 -2% | 2239 3% | 2198 ? 1% |
* ... mindre är bättre

| 3DMark 11 | |
| 1280x720 Performance GPU | |
| Genomsnitt av klass Workstation (10888 - 69594, n=25, senaste 2 åren) | |
| Eurocom Tornado F5W | |
| MSI WS63VR 7RL-023US | |
| Fujitsu Celsius H970 | |
| MSI WS63 7RF-290US | |
| Genomsnitt NVIDIA Quadro P2000 (8201 - 8573, n=2) | |
| Dell Precision 5530 Xeon E-2176M | |
| Lenovo ThinkPad P52 20MAS03N00 | |
| HP ZBook Studio G4-Y6K17EA | |
| Dell Precision 5520 UHD | |
| Dell Precision 3530 | |
| HP ZBook x2 G4-2ZC12EA | |
| 1280x720 Performance Combined | |
| Genomsnitt av klass Workstation (7847 - 27772, n=25, senaste 2 åren) | |
| Eurocom Tornado F5W | |
| MSI WS63VR 7RL-023US | |
| MSI WS63 7RF-290US | |
| Dell Precision 5530 Xeon E-2176M | |
| Genomsnitt NVIDIA Quadro P2000 (7968 - 8059, n=2) | |
| Fujitsu Celsius H970 | |
| Lenovo ThinkPad P52 20MAS03N00 | |
| Dell Precision 5520 UHD | |
| HP ZBook Studio G4-Y6K17EA | |
| Dell Precision 3530 | |
| HP ZBook x2 G4-2ZC12EA | |
| 3DMark 06 Standard Score | 33795 poäng | |
| 3DMark Vantage P Result | 32964 poäng | |
| 3DMark 11 Performance | 8660 poäng | |
| 3DMark Ice Storm Standard Score | 53148 poäng | |
| 3DMark Cloud Gate Standard Score | 25038 poäng | |
| 3DMark Fire Strike Score | 6116 poäng | |
| 3DMark Fire Strike Extreme Score | 3093 poäng | |
| 3DMark Time Spy Score | 2259 poäng | |
Hjälp | ||
| The Witcher 3 - 1920x1080 High Graphics & Postprocessing (Nvidia HairWorks Off) (sortera efter värde) | |
| Dell Precision 5530 Xeon E-2176M | |
| Dell Precision 5520 UHD | |
| Lenovo ThinkPad P52S-20LB001FUS | |
| Dell Precision 3530 | |
| HP ZBook 15 G4-Y4E80AV | |
| MSI WS63VR 7RL-023US | |
| Apple MacBook Pro 15 2018 (2.6 GHz, 560X) | |
| MSI GS73 Stealth 8RF-011 | |
| Genomsnitt NVIDIA Quadro P2000 (33 - 43.2, n=2) | |
| Genomsnitt av klass Workstation (53.4 - 156.4, n=3, senaste 2 åren) | |
| Final Fantasy XV Benchmark | |
| 1920x1080 Standard Quality (sortera efter värde) | |
| Dell Precision 5530 Xeon E-2176M | |
| Apple MacBook Pro 15 2018 (2.6 GHz, 560X) | |
| Genomsnitt NVIDIA Quadro P2000 (n=1) | |
| Genomsnitt av klass Workstation (38.2 - 232, n=25, senaste 2 åren) | |
| 1920x1080 High Quality (sortera efter värde) | |
| Dell Precision 5530 Xeon E-2176M | |
| Apple MacBook Pro 15 2018 (2.6 GHz, 560X) | |
| MSI GS73 Stealth 8RF-011 | |
| Genomsnitt NVIDIA Quadro P2000 (n=1) | |
| Genomsnitt av klass Workstation (26.4 - 197.6, n=25, senaste 2 åren) | |
| låg | med. | hög | ultra | QHD | 4K | |
|---|---|---|---|---|---|---|
| BioShock Infinite (2013) | 317 | 213 | 184 | 68 | ||
| Thief (2014) | 133 | 99 | 85 | 47 | ||
| The Witcher 3 (2015) | 103 | 71 | 33 | 26 | 13 | |
| Batman: Arkham Knight (2015) | 109 | 95 | 52 | 36 | 17 | |
| Metal Gear Solid V (2015) | 60 | 60 | 60 | 60 | 25 | |
| Fallout 4 (2015) | 98 | 88 | 51 | 38 | 13 | |
| Rise of the Tomb Raider (2016) | 82 | 62 | 38 | 32 | 15 | |
| Hitman 2016 (2016) | 88 | 78 | 37 | 36 | 16 | |
| Ashes of the Singularity (2016) | 70 | 41 | 36 | 16 | ||
| Doom (2016) | 112 | 101 | 60 | 54 | 17 | |
| Deus Ex Mankind Divided (2016) | 87 | 63 | 34 | 17 | 11 | |
| Civilization 6 (2016) | 116 | 89 | 51 | 46 | 30 | |
| Farming Simulator 17 (2016) | 350 | 288 | 162 | 114 | 62 | |
| Resident Evil 7 (2017) | 244 | 119 | 60 | 25 | 17 | |
| Prey (2017) | 125 | 89 | 78 | 62 | 20 | |
| Rocket League (2017) | 249 | 164 | 110 | 39 | ||
| Dirt 4 (2017) | 201 | 105 | 59 | 40 | 19 | |
| Playerunknown's Battlegrounds (PUBG) (2017) | 101 | 53 | 41 | 29 | 7 | |
| F1 2017 (2017) | 169 | 89 | 63 | 38 | 11 | |
| Ark Survival Evolved (2017) | 85 | 30 | 19 | 12 | 3 | |
| Middle-earth: Shadow of War (2017) | 115 | 61 | 41 | 28 | 9 | |
| The Evil Within 2 (2017) | 59 | 32 | 29 | 28 | 3 | |
| Fortnite (2018) | 201 | 144 | 60 | 45 | 24 | 10 |
| Final Fantasy XV Benchmark (2018) | 59 | 35 | 26 | 10 | ||
| Kingdom Come: Deliverance (2018) | 104 | 42 | 33 | 26 | 14 | 7 |
| Far Cry 5 (2018) | 89 | 47 | 41 | 35 | 21 | 9 |
| F1 2018 (2018) | 139 | 77 | 61 | 32 | 22 | 12 |
Ljudnivå
| Låg belastning |
| 28.4 / 28.4 / 28.4 dB(A) |
| Hög belastning |
| 46.5 / 46.5 dB(A) |
 | ||
30 dB tyst 40 dB(A) hörbar 50 dB(A) högt ljud |
||
min: | ||
| Dell Precision 5530 Xeon E-2176M Quadro P2000, E-2176M, SK hynix PC400 512 GB | Dell Precision 5520 UHD Quadro M1200, E3-1505M v6, Samsung SM961 MZVKW512HMJP m.2 PCI-e | Lenovo ThinkPad P52S-20LB001FUS Quadro P500, i7-8650U, Samsung SSD PM981 MZVLB1T0HALR | Dell Precision 3530 Quadro P600, E-2176M, SK hynix PC400 512 GB | HP ZBook 15 G4-Y4E80AV Quadro M2200, E3-1535M v6, Samsung SSD SM961 1TB M.2 MZVKW1T0HMLH | Lenovo ThinkPad P51 20HH0016GE Quadro M2200, E3-1505M v6, Samsung PM961 NVMe MZVLW512HMJP | MSI WS63VR 7RL-023US Quadro P4000 Max-Q, i7-7700HQ, Toshiba NVMe THNSN5512GPU7 | Apple MacBook Pro 15 2018 (2.6 GHz, 560X) Radeon Pro 560X, i7-8850H, Apple SSD AP0512 | |
|---|---|---|---|---|---|---|---|---|
| Noise | -2% | 5% | -1% | 5% | 6% | -2% | -0% | |
| av / miljö * (dB) | 28.4 | 28.7 -1% | 28.3 -0% | 28.1 1% | 29.5 -4% | 29.6 -4% | 28 1% | 29.6 -4% |
| Idle Minimum * (dB) | 28.4 | 28.7 -1% | 28.3 -0% | 28.3 -0% | 29.5 -4% | 29.6 -4% | 33.2 -17% | 30.1 -6% |
| Idle Average * (dB) | 28.4 | 32.1 -13% | 28.3 -0% | 28.3 -0% | 29.5 -4% | 29.6 -4% | 33.2 -17% | 30.1 -6% |
| Idle Maximum * (dB) | 28.4 | 32.1 -13% | 29.8 -5% | 28.4 -0% | 30 -6% | 29.6 -4% | 33.2 -17% | 30.1 -6% |
| Load Average * (dB) | 46.5 | 41.3 11% | 40.6 13% | 46.2 1% | 39.5 15% | 32.2 31% | 41.4 11% | 46.8 -1% |
| Witcher 3 ultra * (dB) | 46.5 | 45.5 2% | 40.6 13% | 39.5 15% | 38.4 17% | 36 23% | ||
| Load Maximum * (dB) | 46.5 | 45.5 2% | 40.6 13% | 48.6 -5% | 36 23% | 36.6 21% | 43.5 6% | 46.8 -1% |
* ... mindre är bättre
(-) Den maximala temperaturen på ovansidan är 50 °C / 122 F, jämfört med genomsnittet av 38.2 °C / 101 F , allt från 22.2 till 69.8 °C för klassen Workstation.
(-) Botten värms upp till maximalt 46.2 °C / 115 F, jämfört med genomsnittet av 41.1 °C / 106 F
(+) Vid tomgångsbruk är medeltemperaturen för ovansidan 29.7 °C / 85 F, jämfört med enhetsgenomsnittet på 32 °C / ### class_avg_f### F.
(±) När du spelar The Witcher 3 är medeltemperaturen för ovansidan 34.2 °C / 94 F, jämfört med enhetsgenomsnittet på 32 °C / ## #class_avg_f### F.
(+) Handledsstöden och pekplattan är kallare än hudtemperaturen med maximalt 29.4 °C / 84.9 F och är därför svala att ta på.
(±) Medeltemperaturen för handledsstödsområdet på liknande enheter var 27.8 °C / 82 F (-1.6 °C / -2.9 F).
Dell Precision 5530 Xeon E-2176M ljudanalys
(±) | högtalarljudstyrkan är genomsnittlig men bra (74.9 dB)
Bas 100 - 315 Hz
(-) | nästan ingen bas - i genomsnitt 17.9% lägre än medianen
(±) | linjäriteten för basen är genomsnittlig (9.1% delta till föregående frekvens)
Mellan 400 - 2000 Hz
(±) | högre mellan - i genomsnitt 6.7% högre än median
(±) | linjäriteten för mids är genomsnittlig (10.2% delta till föregående frekvens)
Högsta 2 - 16 kHz
(+) | balanserade toppar - endast 4% från medianen
(±) | linjäriteten för toppar är genomsnittlig (8.4% delta till föregående frekvens)
Totalt 100 - 16 000 Hz
(±) | linjäriteten för det totala ljudet är genomsnittlig (23% skillnad mot median)
Jämfört med samma klass
» 83% av alla testade enheter i den här klassen var bättre, 3% liknande, 14% sämre
» Den bästa hade ett delta på 7%, genomsnittet var 17%, sämst var 35%
Jämfört med alla testade enheter
» 69% av alla testade enheter var bättre, 5% liknande, 26% sämre
» Den bästa hade ett delta på 4%, genomsnittet var 24%, sämst var 134%
Apple MacBook Pro 15 2018 (2.6 GHz, 560X) ljudanalys
(+) | högtalare kan spela relativt högt (85 dB)
Bas 100 - 315 Hz
(+) | bra bas - bara 4.7% från medianen
(±) | linjäriteten för basen är genomsnittlig (8.3% delta till föregående frekvens)
Mellan 400 - 2000 Hz
(+) | balanserad mellan - endast 1.8% från medianen
(+) | mids är linjära (3.5% delta till föregående frekvens)
Högsta 2 - 16 kHz
(+) | balanserade toppar - endast 2.6% från medianen
(+) | toppar är linjära (5.7% delta till föregående frekvens)
Totalt 100 - 16 000 Hz
(+) | det totala ljudet är linjärt (6.4% skillnad mot median)
Jämfört med samma klass
» 4% av alla testade enheter i den här klassen var bättre, 1% liknande, 95% sämre
» Den bästa hade ett delta på 5%, genomsnittet var 17%, sämst var 45%
Jämfört med alla testade enheter
» 1% av alla testade enheter var bättre, 0% liknande, 99% sämre
» Den bästa hade ett delta på 4%, genomsnittet var 24%, sämst var 134%
| Av/Standby | |
| Låg belastning | |
| Hög belastning |
|
Förklaring:
min: | |
| Dell Precision 5530 Xeon E-2176M E-2176M, Quadro P2000, SK hynix PC400 512 GB, IGZO, 3840x2160, 15.6" | Dell Precision 5520 UHD E3-1505M v6, Quadro M1200, Samsung SM961 MZVKW512HMJP m.2 PCI-e, IPS, 3840x2160, 15.6" | Lenovo ThinkPad P52S-20LB001FUS i7-8650U, Quadro P500, Samsung SSD PM981 MZVLB1T0HALR, IPS, 3840x2160, 15.6" | Dell Precision 3530 E-2176M, Quadro P600, SK hynix PC400 512 GB, IPS, 1920x1080, 15.6" | HP ZBook 15 G4-Y4E80AV E3-1535M v6, Quadro M2200, Samsung SSD SM961 1TB M.2 MZVKW1T0HMLH, IPS, 1920x1080, 15.6" | Lenovo ThinkPad P51 20HH0016GE E3-1505M v6, Quadro M2200, Samsung PM961 NVMe MZVLW512HMJP, IPS, 3840x2160, 15.6" | MSI WS63VR 7RL-023US i7-7700HQ, Quadro P4000 Max-Q, Toshiba NVMe THNSN5512GPU7, IPS, 3840x2160, 15.6" | Apple MacBook Pro 15 2018 (2.6 GHz, 560X) i7-8850H, Radeon Pro 560X, Apple SSD AP0512, IPS, 2880x1800, 15.4" | |
|---|---|---|---|---|---|---|---|---|
| Power Consumption | 1% | 33% | 23% | 12% | -2% | -10% | 31% | |
| Idle Minimum * (Watt) | 9.8 | 8.9 9% | 5.9 40% | 5.3 46% | 5.9 40% | 8.6 12% | 13.3 -36% | 3.4 65% |
| Idle Average * (Watt) | 16.8 | 13.6 19% | 11.7 30% | 10.7 36% | 8.9 47% | 15.9 5% | 17.2 -2% | 11 35% |
| Idle Maximum * (Watt) | 16.9 | 14.1 17% | 15.6 8% | 14.1 17% | 12.7 25% | 22.1 -31% | 17.9 -6% | 14.9 12% |
| Load Average * (Watt) | 102.3 | 100.3 2% | 63 38% | 85.4 17% | 95.2 7% | 84.4 17% | 83.7 18% | 78.9 23% |
| Witcher 3 ultra * (Watt) | 76.5 | 100.2 -31% | 48.4 37% | 75.5 1% | 87.7 -15% | 101.9 -33% | ||
| Load Maximum * (Watt) | 114.5 | 126.3 -10% | 63.1 45% | 91.9 20% | 154 -34% | 130.6 -14% | 114.3 -0% | 91.2 20% |
* ... mindre är bättre
| Dell Precision 5530 Xeon E-2176M E-2176M, Quadro P2000, 97 Wh | Dell Precision 5520 UHD E3-1505M v6, Quadro M1200, 97 Wh | Lenovo ThinkPad P52S-20LB001FUS i7-8650U, Quadro P500, 80 Wh | Dell Precision 3530 E-2176M, Quadro P600, 92 Wh | HP ZBook 15 G4-Y4E80AV E3-1535M v6, Quadro M2200, 90 Wh | Lenovo ThinkPad P51 20HH0016GE E3-1505M v6, Quadro M2200, 90 Wh | MSI WS63VR 7RL-023US i7-7700HQ, Quadro P4000 Max-Q, 48 Wh | Apple MacBook Pro 15 2018 (2.6 GHz, 560X) i7-8850H, Radeon Pro 560X, 83 Wh | |
|---|---|---|---|---|---|---|---|---|
| Batteridrifttid | -40% | 23% | 5% | 8% | -10% | -64% | 21% | |
| Reader / Idle (h) | 16.5 | 12.1 -27% | 17.2 4% | 18.8 14% | 18.3 11% | 16.4 -1% | 3.9 -76% | |
| WiFi v1.3 (h) | 8.4 | 4.2 -50% | 11.1 32% | 9.3 11% | 9.1 8% | 6.9 -18% | 2.9 -65% | 10.2 21% |
| Load (h) | 1.8 | 1 -44% | 2.4 33% | 1.6 -11% | 1.9 6% | 1.6 -11% | 0.9 -50% | |
| Witcher 3 ultra (h) | 1.5 |
För
Emot
Läs den fullständiga versionen av den här recensionen på engelska här.
Så här ska det se ut. Dell har under tre år försök att tillverka en perfekt tunn och lätt arbetsstation och Precision 5530 är det bästa försöket hitills. Det här är maskinen som vi hoppades att Precision 5520 skulle vara och det känns bra att se så mycket finess i ett så litet paket.
Precision 5530 är dock inte utan brister. Värmestrypning är fortfarande ett problem, även om det inte är på samma nivå som på 5520 (eller för den delen andra tunna och lätta arbetsstationer). Krävande syntetisk belastning får enheten att gå på knäna, men inte utan en tapper strid. Men med tanke på att arbetsstationer normalt sett är designade för att köras fullt ut under längre perioder så är den begränsade CPU-prestandan vid belastning samt de höga temperaturerna definitivt en spricka i dess rustning.
Det bör nämnas att Precision 5530 riktar sig mot en väldigt specifik nisch. På grund av sin formfaktor saknar den en hel del funktioner som finns på tjockare arbetsstationer såsom ThinkPad P-serien eller HP:s ZBook-serie. Servicemöjligheterna är begränsade, portutbudet är tunt och avsaknaden av ett alternativ för ECC RAM kan vara avgörande för en del. Den som behöver en fullständig arbetsstationsupplevelse bör ta en titt på Dells Precision 7000-serie eller tidigare nämnda ThinkPad- och ZBook-maskiner.
I övrigt är maskinen så bra att det nästan överskuggar CPU-strypningen. Skärmen är helt fantastisk och är en av de bästa vi har sett utanför Apples MacBook Pro-serie. Skärmen är ljusstark, skarp och levande; bilder står ut och allt ser vackert ut. Chassit fortsätter att vara en höjdpunkt. Konstruktionskvaliteten är utmärkt och designen är påfallande (särskilt "Brushed Onyx"-färgen som vår enhet hade). Det är få bärbara datorer som kan matcha Precision 5530 i fråga om design och det är ännu färre arbetsstationer som är så här vackra.
Precision 5530 är onekligen en av de bästa ultraportabla arbetsstationerna. En del tillverkare fokuserar på kraft men ignorerar design och bärbarhet. Andra fokuserar på att göra enheten så tunn som möjligt och avstår från professionella komponenter. Precision 5530 är den bästa medelvägen mellan dessa två idéer som vi har sett och om Dell kan lösa problemen med värmestrypningen så kan nästa års Precision 5540 kanske bli den perfekta ultraportabla arbetsstationen. Men med ett pris på 35.000 kronor är Precision 5530 inte för den som är vek (eller har en vek plånbok). Bra jobbat, Dell.
Dell Precision 5530 Xeon E-2176M
- 09/02/2018 v6 (old)
Sam Medley
Price comparison
